000004587612/3112/31/20222022FYfalsehttp://www.harsco.com/20221231#DiscontinuedOperationLossOnDisposalOfDiscontinuedOperationNetOfTaxhttp://fasb.org/us-gaap/2022#PropertyPlantAndEquipmentNethttp://fasb.org/us-gaap/2022#PropertyPlantAndEquipmentNethttp://fasb.org/us-gaap/2022#LongTermDebtCurrenthttp://fasb.org/us-gaap/2022#LongTermDebtCurrenthttp://fasb.org/us-gaap/2022#LongTermDebtNoncurrenthttp://fasb.org/us-gaap/2022#LongTermDebtNoncurrent111111111100000458762022-01-012022-12-3100000458762022-06-30iso4217:USD00000458762023-02-28xbrli:shares00000458762022-12-3100000458762021-12-31iso4217:USDxbrli:shares00000458762021-01-012021-12-3100000458762020-01-012020-12-3100000458762020-12-3100000458762019-12-310000045876us-gaap:CommonStockMember2019-12-310000045876us-gaap:TreasuryStockMember2019-12-310000045876us-gaap:AdditionalPaidInCapitalMember2019-12-310000045876us-gaap:RetainedEarningsMember2019-12-310000045876us-gaap:AccumulatedOtherComprehensiveIncomeMember2019-12-310000045876us-gaap:NoncontrollingInterestMember2019-12-310000045876us-gaap:RetainedEarningsMember2020-01-012020-12-310000045876us-gaap:NoncontrollingInterestMember2020-01-012020-12-310000045876us-gaap:AccumulatedOtherComprehensiveIncomeMember2020-01-012020-12-310000045876us-gaap:AdditionalPaidInCapitalMember2020-01-012020-12-310000045876us-gaap:CommonStockMember2020-01-012020-12-310000045876us-gaap:TreasuryStockMember2020-01-012020-12-310000045876us-gaap:CommonStockMember2020-12-310000045876us-gaap:TreasuryStockMember2020-12-310000045876us-gaap:AdditionalPaidInCapitalMember2020-12-310000045876us-gaap:RetainedEarningsMember2020-12-310000045876us-gaap:AccumulatedOtherComprehensiveIncomeMember2020-12-310000045876us-gaap:NoncontrollingInterestMember2020-12-310000045876us-gaap:RetainedEarningsMember2021-01-012021-12-310000045876us-gaap:NoncontrollingInterestMember2021-01-012021-12-310000045876us-gaap:AccumulatedOtherComprehensiveIncomeMember2021-01-012021-12-310000045876us-gaap:CommonStockMember2021-01-012021-12-310000045876us-gaap:TreasuryStockMember2021-01-012021-12-310000045876us-gaap:AdditionalPaidInCapitalMember2021-01-012021-12-310000045876us-gaap:CommonStockMember2021-12-310000045876us-gaap:TreasuryStockMember2021-12-310000045876us-gaap:AdditionalPaidInCapitalMember2021-12-310000045876us-gaap:RetainedEarningsMember2021-12-310000045876us-gaap:AccumulatedOtherComprehensiveIncomeMember2021-12-310000045876us-gaap:NoncontrollingInterestMember2021-12-310000045876us-gaap:RetainedEarningsMember2022-01-012022-12-310000045876us-gaap:NoncontrollingInterestMember2022-01-012022-12-310000045876us-gaap:AccumulatedOtherComprehensiveIncomeMember2022-01-012022-12-310000045876us-gaap:CommonStockMember2022-01-012022-12-310000045876us-gaap:TreasuryStockMember2022-01-012022-12-310000045876us-gaap:AdditionalPaidInCapitalMember2022-01-012022-12-310000045876us-gaap:CommonStockMember2022-12-310000045876us-gaap:TreasuryStockMember2022-12-310000045876us-gaap:AdditionalPaidInCapitalMember2022-12-310000045876us-gaap:RetainedEarningsMember2022-12-310000045876us-gaap:AccumulatedOtherComprehensiveIncomeMember2022-12-310000045876us-gaap:NoncontrollingInterestMember2022-12-310000045876us-gaap:UninsuredRiskMember2022-01-012022-12-310000045876us-gaap:UninsuredRiskMember2021-01-012021-12-310000045876us-gaap:UninsuredRiskMember2020-01-012020-12-310000045876us-gaap:UninsuredRiskMember2022-12-310000045876us-gaap:UninsuredRiskMember2021-12-310000045876srt:MaximumMemberus-gaap:ForeignExchangeForwardMember2022-01-012022-12-310000045876hsc:HarscoRailMemberus-gaap:DiscontinuedOperationsHeldforsaleMember2022-12-310000045876hsc:HarscoRailMemberus-gaap:DiscontinuedOperationsHeldforsaleMember2021-12-310000045876hsc:HarscoRailMemberus-gaap:ServiceMemberus-gaap:DiscontinuedOperationsHeldforsaleMember2022-01-012022-12-310000045876hsc:HarscoRailMemberus-gaap:ServiceMemberus-gaap:DiscontinuedOperationsHeldforsaleMember2021-01-012021-12-310000045876hsc:HarscoRailMemberus-gaap:ServiceMemberus-gaap:DiscontinuedOperationsHeldforsaleMember2020-01-012020-12-310000045876us-gaap:ProductMemberhsc:HarscoRailMemberus-gaap:DiscontinuedOperationsHeldforsaleMember2022-01-012022-12-310000045876us-gaap:ProductMemberhsc:HarscoRailMemberus-gaap:DiscontinuedOperationsHeldforsaleMember2021-01-012021-12-310000045876us-gaap:ProductMemberhsc:HarscoRailMemberus-gaap:DiscontinuedOperationsHeldforsaleMember2020-01-012020-12-310000045876hsc:HarscoRailMemberus-gaap:DiscontinuedOperationsHeldforsaleMember2022-01-012022-12-310000045876hsc:HarscoRailMemberus-gaap:DiscontinuedOperationsHeldforsaleMember2021-01-012021-12-310000045876hsc:HarscoRailMemberus-gaap:DiscontinuedOperationsHeldforsaleMember2020-01-012020-12-310000045876us-gaap:DiscontinuedOperationsHeldforsaleMember2022-01-012022-12-310000045876hsc:NetworkRailMember2022-01-012022-12-310000045876hsc:NetworkRailMember2022-01-012022-03-310000045876hsc:NetworkRailMember2022-04-012022-06-300000045876hsc:NetworkRailMember2022-10-012022-12-310000045876hsc:DeutscheBahnMember2022-01-012022-03-310000045876hsc:DeutscheBahnMember2022-10-012022-12-310000045876hsc:DeutscheBahnMember2022-01-012022-12-310000045876hsc:SBBMember2022-01-012022-12-310000045876hsc:SBBMemberhsc:Contract2Member2022-12-31xbrli:pure0000045876hsc:NetworkRailMemberhsc:Contract2Member2022-12-310000045876hsc:DeutscheBahnMemberhsc:Contract2Member2022-12-310000045876hsc:Greaterthan12monthsMember2022-12-310000045876hsc:PNCMemberMember2022-06-300000045876hsc:PNCMemberMember2022-12-310000045876hsc:ARFacilityMember2022-06-300000045876hsc:ARFacilityMember2022-12-310000045876hsc:HarscoIndustrialIKGMemberus-gaap:DisposalGroupDisposedOfBySaleNotDiscontinuedOperationsMember2020-01-3100000458762020-01-310000045876us-gaap:LandMember2022-12-310000045876us-gaap:LandMember2021-12-310000045876us-gaap:LandImprovementsMembersrt:MinimumMember2022-01-012022-12-310000045876us-gaap:LandImprovementsMembersrt:MaximumMember2022-01-012022-12-310000045876us-gaap:LandImprovementsMember2022-12-310000045876us-gaap:LandImprovementsMember2021-12-310000045876us-gaap:BuildingAndBuildingImprovementsMembersrt:MinimumMember2022-01-012022-12-310000045876srt:MaximumMemberus-gaap:BuildingAndBuildingImprovementsMember2022-01-012022-12-310000045876us-gaap:BuildingAndBuildingImprovementsMember2022-12-310000045876us-gaap:BuildingAndBuildingImprovementsMember2021-12-310000045876us-gaap:MachineryAndEquipmentMembersrt:MinimumMember2022-01-012022-12-310000045876srt:MaximumMemberus-gaap:MachineryAndEquipmentMember2022-01-012022-12-310000045876us-gaap:MachineryAndEquipmentMember2022-12-310000045876us-gaap:MachineryAndEquipmentMember2021-12-310000045876us-gaap:ConstructionInProgressMember2022-12-310000045876us-gaap:ConstructionInProgressMember2021-12-310000045876country:CNhsc:HarscoEnvironmentalSegmentMember2022-12-310000045876hsc:HarscoEnvironmentalSegmentMember2020-12-310000045876hsc:CleanEarthMember2020-12-310000045876hsc:HarscoEnvironmentalSegmentMember2021-01-012021-12-310000045876hsc:CleanEarthMember2021-01-012021-12-310000045876hsc:HarscoEnvironmentalSegmentMember2021-12-310000045876hsc:CleanEarthMember2021-12-310000045876hsc:HarscoEnvironmentalSegmentMember2022-01-012022-12-310000045876hsc:CleanEarthMember2022-01-012022-12-310000045876hsc:HarscoEnvironmentalSegmentMember2022-12-310000045876hsc:CleanEarthMember2022-12-310000045876hsc:CleanEarthMember2022-04-012022-06-300000045876us-gaap:CustomerRelatedIntangibleAssetsMember2022-12-310000045876us-gaap:CustomerRelatedIntangibleAssetsMember2021-12-310000045876hsc:PermitsAndRightsMember2022-12-310000045876hsc:PermitsAndRightsMember2021-12-310000045876us-gaap:UnpatentedTechnologyMember2022-12-310000045876us-gaap:UnpatentedTechnologyMember2021-12-310000045876us-gaap:TradeNamesMember2022-12-310000045876us-gaap:TradeNamesMember2021-12-310000045876hsc:AirRightsMember2022-12-310000045876hsc:AirRightsMember2021-12-310000045876us-gaap:PatentsMember2022-12-310000045876us-gaap:PatentsMember2021-12-310000045876hsc:NonCompeteAgreementMember2022-12-310000045876hsc:NonCompeteAgreementMember2021-12-310000045876us-gaap:OtherIntangibleAssetsMember2022-12-310000045876us-gaap:OtherIntangibleAssetsMember2021-12-310000045876hsc:AltekGroupMember2022-01-012022-12-310000045876hsc:NewTermLoanMember2022-12-310000045876hsc:NewTermLoanMember2021-12-310000045876us-gaap:RevolvingCreditFacilityMember2022-12-310000045876us-gaap:RevolvingCreditFacilityMember2021-12-310000045876us-gaap:SeniorNotesMemberhsc:A575NotesDueJuly2027Member2022-12-310000045876us-gaap:SeniorNotesMemberhsc:A575NotesDueJuly2027Member2021-12-310000045876us-gaap:NotesPayableOtherPayablesMember2022-12-310000045876us-gaap:NotesPayableOtherPayablesMember2021-12-310000045876us-gaap:SeniorNotesMemberus-gaap:RevolvingCreditFacilityMember2022-12-310000045876us-gaap:RevolvingCreditFacilityMember2022-06-300000045876srt:ScenarioForecastMemberus-gaap:RevolvingCreditFacilityMember2023-10-012023-12-310000045876srt:ScenarioForecastMemberus-gaap:RevolvingCreditFacilityMember2023-12-310000045876us-gaap:RevolvingCreditFacilityMember2022-01-012022-12-310000045876srt:MaximumMemberus-gaap:RevolvingCreditFacilityMember2022-12-310000045876us-gaap:RevolvingCreditFacilityMembersrt:MinimumMember2022-12-310000045876us-gaap:SeniorNotesMemberhsc:SeniorUnsecuredNotes5.75Due2027Member2022-06-300000045876us-gaap:SeniorNotesMemberhsc:SeniorUnsecuredNotes5.75Due2027Member2022-06-012022-06-300000045876hsc:AccountReceivableSecuritizationFacilityMember2022-06-300000045876us-gaap:BaseRateMemberhsc:SeniorSecuredCreditFacilityMemberus-gaap:LineOfCreditMemberus-gaap:RevolvingCreditFacilityMembersrt:MinimumMember2022-08-292022-08-290000045876us-gaap:BaseRateMemberhsc:SeniorSecuredCreditFacilityMembersrt:MaximumMemberus-gaap:LineOfCreditMemberus-gaap:RevolvingCreditFacilityMember2022-08-292022-08-290000045876hsc:SeniorSecuredCreditFacilityMemberus-gaap:LondonInterbankOfferedRateLIBORMemberus-gaap:LineOfCreditMemberus-gaap:RevolvingCreditFacilityMembersrt:MinimumMember2022-08-292022-08-290000045876hsc:SeniorSecuredCreditFacilityMembersrt:MaximumMemberus-gaap:LondonInterbankOfferedRateLIBORMemberus-gaap:LineOfCreditMemberus-gaap:RevolvingCreditFacilityMember2022-08-292022-08-290000045876hsc:SeniorSecuredCreditFacilityMemberus-gaap:LineOfCreditMemberus-gaap:RevolvingCreditFacilityMember2022-08-290000045876srt:MaximumMembersrt:ScenarioForecastMemberus-gaap:RevolvingCreditFacilityMember2023-12-310000045876srt:ScenarioForecastMemberus-gaap:RevolvingCreditFacilityMember2024-09-300000045876srt:ScenarioForecastMemberus-gaap:RevolvingCreditFacilityMember2022-07-012024-12-310000045876hsc:SeniorSecuredCreditFacilityMembersrt:ScenarioForecastMemberus-gaap:LineOfCreditMemberus-gaap:RevolvingCreditFacilityMember2025-04-012025-06-300000045876srt:ScenarioForecastMemberus-gaap:RevolvingCreditFacilityMember2025-01-012026-03-100000045876hsc:SeniorSecuredCreditFacilityMemberus-gaap:SecuredOvernightFinancingRateSofrOvernightIndexSwapRateMemberus-gaap:LineOfCreditMemberus-gaap:RevolvingCreditFacilityMember2022-12-012022-12-310000045876hsc:SeniorSecuredCreditFacilityMemberus-gaap:SecuredOvernightFinancingRateSofrOvernightIndexSwapRateMemberus-gaap:LineOfCreditMemberus-gaap:RevolvingCreditFacilityMembersrt:MinimumMember2022-12-012022-12-310000045876hsc:SeniorSecuredCreditFacilityMembersrt:MaximumMemberus-gaap:SecuredOvernightFinancingRateSofrOvernightIndexSwapRateMemberus-gaap:LineOfCreditMemberus-gaap:RevolvingCreditFacilityMember2022-12-012022-12-310000045876hsc:NewTermLoanMemberus-gaap:SecuredOvernightFinancingRateSofrOvernightIndexSwapRateMemberus-gaap:LineOfCreditMemberus-gaap:RevolvingCreditFacilityMember2022-12-012022-12-310000045876hsc:FacilityFeesAndDebtRelatedIncomeExpenseMember2022-01-012022-12-310000045876hsc:FacilityFeesAndDebtRelatedIncomeExpenseMember2021-01-012021-12-310000045876hsc:FacilityFeesAndDebtRelatedIncomeExpenseMember2020-01-012020-12-310000045876us-gaap:BaseRateMemberus-gaap:RevolvingCreditFacilityMembersrt:MinimumMember2022-01-012022-12-310000045876us-gaap:BaseRateMembersrt:MaximumMemberus-gaap:RevolvingCreditFacilityMember2022-01-012022-12-310000045876us-gaap:SecuredOvernightFinancingRateSofrOvernightIndexSwapRateMemberus-gaap:RevolvingCreditFacilityMembersrt:MinimumMember2022-01-012022-12-310000045876srt:MaximumMemberus-gaap:SecuredOvernightFinancingRateSofrOvernightIndexSwapRateMemberus-gaap:RevolvingCreditFacilityMember2022-01-012022-12-310000045876us-gaap:SecuredOvernightFinancingRateSofrOvernightIndexSwapRateMemberus-gaap:RevolvingCreditFacilityMember2022-01-012022-12-310000045876us-gaap:LineOfCreditMember2022-12-310000045876hsc:ESOLMember2020-04-060000045876srt:MaximumMemberus-gaap:PensionPlansDefinedBenefitMembercountry:US2022-01-012022-12-310000045876us-gaap:PensionPlansDefinedBenefitMembercountry:US2020-01-012020-12-310000045876us-gaap:PensionPlansDefinedBenefitMembercountry:US2021-01-012021-12-310000045876us-gaap:PensionPlansDefinedBenefitMembercountry:US2022-01-012022-12-310000045876us-gaap:ForeignPlanMembersrt:MaximumMemberus-gaap:PensionPlansDefinedBenefitMember2022-01-012022-12-310000045876us-gaap:ForeignPlanMemberus-gaap:PensionPlansDefinedBenefitMember2022-01-012022-12-310000045876us-gaap:ForeignPlanMemberus-gaap:PensionPlansDefinedBenefitMember2021-01-012021-12-310000045876us-gaap:ForeignPlanMemberus-gaap:PensionPlansDefinedBenefitMember2020-01-012020-12-310000045876us-gaap:PensionPlansDefinedBenefitMembercountry:US2021-12-310000045876us-gaap:PensionPlansDefinedBenefitMembercountry:US2020-12-310000045876us-gaap:ForeignPlanMemberus-gaap:PensionPlansDefinedBenefitMember2021-12-310000045876us-gaap:ForeignPlanMemberus-gaap:PensionPlansDefinedBenefitMember2020-12-310000045876us-gaap:PensionPlansDefinedBenefitMembercountry:US2022-12-310000045876us-gaap:ForeignPlanMemberus-gaap:PensionPlansDefinedBenefitMember2022-12-310000045876us-gaap:PensionPlansDefinedBenefitMember2022-01-012022-12-310000045876us-gaap:PensionPlansDefinedBenefitMember2021-01-012021-12-310000045876us-gaap:PensionPlansDefinedBenefitMember2020-01-012020-12-310000045876us-gaap:PensionPlansDefinedBenefitMember2022-12-310000045876us-gaap:PensionPlansDefinedBenefitMember2021-12-310000045876hsc:EquitySecuritiesDomesticMemberus-gaap:PensionPlansDefinedBenefitMembercountry:USsrt:MinimumMember2022-12-310000045876hsc:EquitySecuritiesDomesticMembersrt:MaximumMemberus-gaap:PensionPlansDefinedBenefitMembercountry:US2022-12-310000045876hsc:EquitySecuritiesDomesticMemberus-gaap:PensionPlansDefinedBenefitMembercountry:US2022-12-310000045876hsc:EquitySecuritiesDomesticMemberus-gaap:PensionPlansDefinedBenefitMembercountry:US2021-12-310000045876hsc:EquitySecuritiesInternationalMemberus-gaap:PensionPlansDefinedBenefitMembercountry:USsrt:MinimumMember2022-12-310000045876srt:MaximumMemberhsc:EquitySecuritiesInternationalMemberus-gaap:PensionPlansDefinedBenefitMembercountry:US2022-12-310000045876hsc:EquitySecuritiesInternationalMemberus-gaap:PensionPlansDefinedBenefitMembercountry:US2022-12-310000045876hsc:EquitySecuritiesInternationalMemberus-gaap:PensionPlansDefinedBenefitMembercountry:US2021-12-310000045876us-gaap:DebtSecuritiesMemberus-gaap:PensionPlansDefinedBenefitMembercountry:USsrt:MinimumMember2022-12-310000045876us-gaap:DebtSecuritiesMembersrt:MaximumMemberus-gaap:PensionPlansDefinedBenefitMembercountry:US2022-12-310000045876us-gaap:DebtSecuritiesMemberus-gaap:PensionPlansDefinedBenefitMembercountry:US2022-12-310000045876us-gaap:DebtSecuritiesMemberus-gaap:PensionPlansDefinedBenefitMembercountry:US2021-12-310000045876us-gaap:CashAndCashEquivalentsMembersrt:MaximumMemberus-gaap:PensionPlansDefinedBenefitMembercountry:US2022-12-310000045876us-gaap:CashAndCashEquivalentsMemberus-gaap:PensionPlansDefinedBenefitMembercountry:US2022-12-310000045876us-gaap:CashAndCashEquivalentsMemberus-gaap:PensionPlansDefinedBenefitMembercountry:US2021-12-310000045876us-gaap:PensionPlansDefinedBenefitMembercountry:UShsc:OtherAssetCategoryMembersrt:MinimumMember2022-12-310000045876srt:MaximumMemberus-gaap:PensionPlansDefinedBenefitMembercountry:UShsc:OtherAssetCategoryMember2022-12-310000045876us-gaap:PensionPlansDefinedBenefitMembercountry:UShsc:OtherAssetCategoryMember2022-12-310000045876us-gaap:PensionPlansDefinedBenefitMembercountry:UShsc:OtherAssetCategoryMember2021-12-31hsc:market0000045876srt:ScenarioForecastMemberus-gaap:PensionPlansDefinedBenefitMembercountry:US2023-01-012023-12-310000045876us-gaap:PensionPlansDefinedBenefitMembercountry:USus-gaap:DefinedBenefitPlanEquitySecuritiesCommonStockEmployerRelatedPartyMember2022-12-310000045876us-gaap:PensionPlansDefinedBenefitMembercountry:USus-gaap:DefinedBenefitPlanEquitySecuritiesCommonStockEmployerRelatedPartyMember2021-12-310000045876hsc:CompanysOwnCommonStockMemberus-gaap:PensionPlansDefinedBenefitMembercountry:US2022-12-310000045876hsc:CompanysOwnCommonStockMemberus-gaap:PensionPlansDefinedBenefitMembercountry:US2021-12-310000045876us-gaap:ForeignPlanMemberus-gaap:EquitySecuritiesMemberus-gaap:PensionPlansDefinedBenefitMember2022-12-310000045876us-gaap:ForeignPlanMemberus-gaap:EquitySecuritiesMemberus-gaap:PensionPlansDefinedBenefitMember2021-12-310000045876us-gaap:DebtSecuritiesMemberus-gaap:ForeignPlanMemberus-gaap:PensionPlansDefinedBenefitMember2022-12-310000045876us-gaap:DebtSecuritiesMemberus-gaap:ForeignPlanMemberus-gaap:PensionPlansDefinedBenefitMember2021-12-310000045876us-gaap:CashAndCashEquivalentsMemberus-gaap:ForeignPlanMemberus-gaap:PensionPlansDefinedBenefitMember2022-12-310000045876us-gaap:CashAndCashEquivalentsMemberus-gaap:ForeignPlanMemberus-gaap:PensionPlansDefinedBenefitMember2021-12-310000045876us-gaap:ForeignPlanMemberus-gaap:PensionPlansDefinedBenefitMemberhsc:OtherAssetCategoryMember2022-12-310000045876us-gaap:ForeignPlanMemberus-gaap:PensionPlansDefinedBenefitMemberhsc:OtherAssetCategoryMember2021-12-310000045876country:GBus-gaap:PensionPlansDefinedBenefitMember2022-12-310000045876country:GBus-gaap:PensionPlansDefinedBenefitMember2022-01-012022-12-310000045876country:GBus-gaap:PensionPlansDefinedBenefitMember2021-01-012021-12-310000045876hsc:InternationalOtherThanUnitedKingdomMemberus-gaap:PensionPlansDefinedBenefitMember2022-12-310000045876us-gaap:FairValueInputsLevel1Memberhsc:EquitySecuritiesDomesticMemberus-gaap:PensionPlansDefinedBenefitMembercountry:US2022-12-310000045876hsc:EquitySecuritiesDomesticMemberus-gaap:FairValueMeasuredAtNetAssetValuePerShareMemberus-gaap:PensionPlansDefinedBenefitMembercountry:US2022-12-310000045876hsc:EquityFundsDomesticMemberus-gaap:PensionPlansDefinedBenefitMembercountry:US2022-12-310000045876us-gaap:FairValueInputsLevel1Memberhsc:EquityFundsDomesticMemberus-gaap:PensionPlansDefinedBenefitMembercountry:US2022-12-310000045876us-gaap:FairValueMeasuredAtNetAssetValuePerShareMemberhsc:EquityFundsDomesticMemberus-gaap:PensionPlansDefinedBenefitMembercountry:US2022-12-310000045876hsc:EquityFundsInternationalMemberus-gaap:PensionPlansDefinedBenefitMembercountry:US2022-12-310000045876us-gaap:FairValueInputsLevel1Memberhsc:EquityFundsInternationalMemberus-gaap:PensionPlansDefinedBenefitMembercountry:US2022-12-310000045876hsc:EquityFundsInternationalMemberus-gaap:FairValueMeasuredAtNetAssetValuePerShareMemberus-gaap:PensionPlansDefinedBenefitMembercountry:US2022-12-310000045876us-gaap:FixedIncomeFundsMemberus-gaap:PensionPlansDefinedBenefitMembercountry:US2022-12-310000045876us-gaap:FairValueInputsLevel1Memberus-gaap:FixedIncomeFundsMemberus-gaap:PensionPlansDefinedBenefitMembercountry:US2022-12-310000045876us-gaap:FixedIncomeFundsMemberus-gaap:FairValueMeasuredAtNetAssetValuePerShareMemberus-gaap:PensionPlansDefinedBenefitMembercountry:US2022-12-310000045876hsc:OtherAssetCategoriesMutualFundsMemberus-gaap:PensionPlansDefinedBenefitMembercountry:US2022-12-310000045876us-gaap:FairValueInputsLevel1Memberhsc:OtherAssetCategoriesMutualFundsMemberus-gaap:PensionPlansDefinedBenefitMembercountry:US2022-12-310000045876us-gaap:FairValueMeasuredAtNetAssetValuePerShareMemberhsc:OtherAssetCategoriesMutualFundsMemberus-gaap:PensionPlansDefinedBenefitMembercountry:US2022-12-310000045876us-gaap:FairValueInputsLevel1Memberus-gaap:CashAndCashEquivalentsMemberus-gaap:PensionPlansDefinedBenefitMembercountry:US2022-12-310000045876us-gaap:CashAndCashEquivalentsMemberus-gaap:FairValueMeasuredAtNetAssetValuePerShareMemberus-gaap:PensionPlansDefinedBenefitMembercountry:US2022-12-310000045876us-gaap:PensionPlansDefinedBenefitMemberus-gaap:PartnershipMembercountry:US2022-12-310000045876us-gaap:FairValueInputsLevel1Memberus-gaap:PensionPlansDefinedBenefitMemberus-gaap:PartnershipMembercountry:US2022-12-310000045876us-gaap:FairValueMeasuredAtNetAssetValuePerShareMemberus-gaap:PensionPlansDefinedBenefitMemberus-gaap:PartnershipMembercountry:US2022-12-310000045876us-gaap:FairValueInputsLevel1Memberus-gaap:PensionPlansDefinedBenefitMembercountry:US2022-12-310000045876us-gaap:FairValueMeasuredAtNetAssetValuePerShareMemberus-gaap:PensionPlansDefinedBenefitMembercountry:US2022-12-310000045876us-gaap:FairValueInputsLevel1Memberhsc:EquitySecuritiesDomesticMemberus-gaap:PensionPlansDefinedBenefitMembercountry:US2021-12-310000045876hsc:EquitySecuritiesDomesticMemberus-gaap:FairValueMeasuredAtNetAssetValuePerShareMemberus-gaap:PensionPlansDefinedBenefitMembercountry:US2021-12-310000045876hsc:EquityFundsDomesticMemberus-gaap:PensionPlansDefinedBenefitMembercountry:US2021-12-310000045876us-gaap:FairValueInputsLevel1Memberhsc:EquityFundsDomesticMemberus-gaap:PensionPlansDefinedBenefitMembercountry:US2021-12-310000045876us-gaap:FairValueMeasuredAtNetAssetValuePerShareMemberhsc:EquityFundsDomesticMemberus-gaap:PensionPlansDefinedBenefitMembercountry:US2021-12-310000045876hsc:EquityFundsInternationalMemberus-gaap:PensionPlansDefinedBenefitMembercountry:US2021-12-310000045876us-gaap:FairValueInputsLevel1Memberhsc:EquityFundsInternationalMemberus-gaap:PensionPlansDefinedBenefitMembercountry:US2021-12-310000045876hsc:EquityFundsInternationalMemberus-gaap:FairValueMeasuredAtNetAssetValuePerShareMemberus-gaap:PensionPlansDefinedBenefitMembercountry:US2021-12-310000045876us-gaap:FixedIncomeFundsMemberus-gaap:PensionPlansDefinedBenefitMembercountry:US2021-12-310000045876us-gaap:FairValueInputsLevel1Memberus-gaap:FixedIncomeFundsMemberus-gaap:PensionPlansDefinedBenefitMembercountry:US2021-12-310000045876us-gaap:FixedIncomeFundsMemberus-gaap:FairValueMeasuredAtNetAssetValuePerShareMemberus-gaap:PensionPlansDefinedBenefitMembercountry:US2021-12-310000045876hsc:OtherAssetCategoriesMutualFundsMemberus-gaap:PensionPlansDefinedBenefitMembercountry:US2021-12-310000045876us-gaap:FairValueInputsLevel1Memberhsc:OtherAssetCategoriesMutualFundsMemberus-gaap:PensionPlansDefinedBenefitMembercountry:US2021-12-310000045876us-gaap:FairValueMeasuredAtNetAssetValuePerShareMemberhsc:OtherAssetCategoriesMutualFundsMemberus-gaap:PensionPlansDefinedBenefitMembercountry:US2021-12-310000045876us-gaap:FairValueInputsLevel1Memberus-gaap:CashAndCashEquivalentsMemberus-gaap:PensionPlansDefinedBenefitMembercountry:US2021-12-310000045876us-gaap:CashAndCashEquivalentsMemberus-gaap:FairValueMeasuredAtNetAssetValuePerShareMemberus-gaap:PensionPlansDefinedBenefitMembercountry:US2021-12-310000045876us-gaap:PensionPlansDefinedBenefitMemberus-gaap:PartnershipMembercountry:US2021-12-310000045876us-gaap:FairValueInputsLevel1Memberus-gaap:PensionPlansDefinedBenefitMemberus-gaap:PartnershipMembercountry:US2021-12-310000045876us-gaap:FairValueMeasuredAtNetAssetValuePerShareMemberus-gaap:PensionPlansDefinedBenefitMemberus-gaap:PartnershipMembercountry:US2021-12-310000045876us-gaap:FairValueInputsLevel1Memberus-gaap:PensionPlansDefinedBenefitMembercountry:US2021-12-310000045876us-gaap:FairValueMeasuredAtNetAssetValuePerShareMemberus-gaap:PensionPlansDefinedBenefitMembercountry:US2021-12-310000045876us-gaap:ForeignPlanMemberus-gaap:PensionPlansDefinedBenefitMemberus-gaap:EquityFundsMember2022-12-310000045876us-gaap:FairValueInputsLevel1Memberus-gaap:ForeignPlanMemberus-gaap:PensionPlansDefinedBenefitMemberus-gaap:EquityFundsMember2022-12-310000045876us-gaap:ForeignPlanMemberus-gaap:PensionPlansDefinedBenefitMemberus-gaap:FairValueInputsLevel2Memberus-gaap:EquityFundsMember2022-12-310000045876us-gaap:FixedIncomeFundsMemberus-gaap:ForeignPlanMemberus-gaap:PensionPlansDefinedBenefitMember2022-12-310000045876us-gaap:FairValueInputsLevel1Memberus-gaap:FixedIncomeFundsMemberus-gaap:ForeignPlanMemberus-gaap:PensionPlansDefinedBenefitMember2022-12-310000045876us-gaap:FixedIncomeFundsMemberus-gaap:ForeignPlanMemberus-gaap:PensionPlansDefinedBenefitMemberus-gaap:FairValueInputsLevel2Member2022-12-310000045876us-gaap:ForeignPlanMemberus-gaap:PensionPlansDefinedBenefitMemberhsc:InsuranceContractMember2022-12-310000045876us-gaap:FairValueInputsLevel1Memberus-gaap:ForeignPlanMemberus-gaap:PensionPlansDefinedBenefitMemberhsc:InsuranceContractMember2022-12-310000045876us-gaap:ForeignPlanMemberus-gaap:PensionPlansDefinedBenefitMemberus-gaap:FairValueInputsLevel2Memberhsc:InsuranceContractMember2022-12-310000045876us-gaap:ForeignPlanMemberhsc:OtherAssetCategoriesMutualFundsMemberus-gaap:PensionPlansDefinedBenefitMember2022-12-310000045876us-gaap:FairValueInputsLevel1Memberus-gaap:ForeignPlanMemberhsc:OtherAssetCategoriesMutualFundsMemberus-gaap:PensionPlansDefinedBenefitMember2022-12-310000045876us-gaap:ForeignPlanMemberhsc:OtherAssetCategoriesMutualFundsMemberus-gaap:PensionPlansDefinedBenefitMemberus-gaap:FairValueInputsLevel2Member2022-12-310000045876us-gaap:FairValueInputsLevel1Memberus-gaap:CashAndCashEquivalentsMemberus-gaap:ForeignPlanMemberus-gaap:PensionPlansDefinedBenefitMember2022-12-310000045876us-gaap:CashAndCashEquivalentsMemberus-gaap:ForeignPlanMemberus-gaap:PensionPlansDefinedBenefitMemberus-gaap:FairValueInputsLevel2Member2022-12-310000045876us-gaap:FairValueInputsLevel1Memberus-gaap:ForeignPlanMemberus-gaap:PensionPlansDefinedBenefitMember2022-12-310000045876us-gaap:ForeignPlanMemberus-gaap:PensionPlansDefinedBenefitMemberus-gaap:FairValueInputsLevel2Member2022-12-310000045876us-gaap:ForeignPlanMemberus-gaap:PensionPlansDefinedBenefitMemberus-gaap:EquityFundsMember2021-12-310000045876us-gaap:FairValueInputsLevel1Memberus-gaap:ForeignPlanMemberus-gaap:PensionPlansDefinedBenefitMemberus-gaap:EquityFundsMember2021-12-310000045876us-gaap:ForeignPlanMemberus-gaap:PensionPlansDefinedBenefitMemberus-gaap:FairValueInputsLevel2Memberus-gaap:EquityFundsMember2021-12-310000045876us-gaap:FixedIncomeFundsMemberus-gaap:ForeignPlanMemberus-gaap:PensionPlansDefinedBenefitMember2021-12-310000045876us-gaap:FairValueInputsLevel1Memberus-gaap:FixedIncomeFundsMemberus-gaap:ForeignPlanMemberus-gaap:PensionPlansDefinedBenefitMember2021-12-310000045876us-gaap:FixedIncomeFundsMemberus-gaap:ForeignPlanMemberus-gaap:PensionPlansDefinedBenefitMemberus-gaap:FairValueInputsLevel2Member2021-12-310000045876us-gaap:ForeignPlanMemberus-gaap:PensionPlansDefinedBenefitMemberhsc:InsuranceContractMember2021-12-310000045876us-gaap:FairValueInputsLevel1Memberus-gaap:ForeignPlanMemberus-gaap:PensionPlansDefinedBenefitMemberhsc:InsuranceContractMember2021-12-310000045876us-gaap:ForeignPlanMemberus-gaap:PensionPlansDefinedBenefitMemberus-gaap:FairValueInputsLevel2Memberhsc:InsuranceContractMember2021-12-310000045876us-gaap:ForeignPlanMemberhsc:OtherAssetCategoriesMutualFundsMemberus-gaap:PensionPlansDefinedBenefitMember2021-12-310000045876us-gaap:FairValueInputsLevel1Memberus-gaap:ForeignPlanMemberhsc:OtherAssetCategoriesMutualFundsMemberus-gaap:PensionPlansDefinedBenefitMember2021-12-310000045876us-gaap:ForeignPlanMemberhsc:OtherAssetCategoriesMutualFundsMemberus-gaap:PensionPlansDefinedBenefitMemberus-gaap:FairValueInputsLevel2Member2021-12-310000045876us-gaap:FairValueInputsLevel1Memberus-gaap:CashAndCashEquivalentsMemberus-gaap:ForeignPlanMemberus-gaap:PensionPlansDefinedBenefitMember2021-12-310000045876us-gaap:CashAndCashEquivalentsMemberus-gaap:ForeignPlanMemberus-gaap:PensionPlansDefinedBenefitMemberus-gaap:FairValueInputsLevel2Member2021-12-310000045876us-gaap:FairValueInputsLevel1Memberus-gaap:ForeignPlanMemberus-gaap:PensionPlansDefinedBenefitMember2021-12-310000045876us-gaap:ForeignPlanMemberus-gaap:PensionPlansDefinedBenefitMemberus-gaap:FairValueInputsLevel2Member2021-12-310000045876hsc:HarscoEnvironmentalSegmentMembercountry:BR2022-01-012022-12-310000045876country:US2022-01-012022-12-310000045876country:US2021-01-012021-12-310000045876us-gaap:CapitalLossCarryforwardMember2022-12-310000045876us-gaap:ForeignCountryMember2022-12-310000045876us-gaap:StateAndLocalJurisdictionMember2022-12-310000045876hsc:TaxYears2021Through2025Memberus-gaap:StateAndLocalJurisdictionMember2022-12-310000045876us-gaap:StateAndLocalJurisdictionMemberhsc:TaxYears2026Through2030Member2022-12-310000045876hsc:TaxYears2031Through2035Memberus-gaap:StateAndLocalJurisdictionMember2022-12-310000045876hsc:TaxYears2036Through2040Memberus-gaap:StateAndLocalJurisdictionMember2022-12-310000045876us-gaap:DomesticCountryMember2022-12-3100000458762021-11-2300000458762019-03-19iso4217:BRL0000045876hsc:CSNMember2019-03-1900000458762019-11-010000045876hsc:CSNMember2019-11-0100000458762021-10-14iso4217:EUR00000458762022-02-2500000458762022-03-2200000458762022-03-210000045876hsc:ValueAddedTaxAssessmentsJanuary2004ToMay2005Memberhsc:SaoPauloStateRevenueAuthorityMember2022-01-012022-12-310000045876hsc:ValueAddedTaxAssessmentsJanuary2004ToMay2005Memberhsc:SaoPauloStateRevenueAuthorityMember2018-06-042018-06-040000045876hsc:ValueAddedTaxAssessmentsJanuary2002ToDecember2003Memberhsc:SaoPauloStateRevenueAuthorityMember2005-08-012005-08-310000045876hsc:ValueAddedTaxAssessmentsJanuary2002ToDecember2003Memberhsc:SaoPauloStateRevenueAuthorityMember2018-12-062018-12-060000045876country:BR2020-12-300000045876country:BR2022-12-310000045876hsc:ValueAddedTaxAssessmentsJanuary2002ToDecember2003Memberhsc:SaoPauloStateRevenueAuthorityMember2022-01-012022-12-310000045876hsc:OtherIncludingAsbestosRelatedClaimsMember2022-01-012022-12-31hsc:defendant0000045876hsc:OtherIncludingAsbestosRelatedClaimsMember2022-12-31hsc:claim0000045876hsc:OtherIncludingAsbestosRelatedClaimsMemberhsc:NewYorkCountyAsManagedByNewYorkSupremeCourtMember2022-12-31hsc:case0000045876hsc:OtherIncludingAsbestosRelatedClaimsMemberhsc:NewYorkStateSupremeCourtCountiesExcludingNewYorkCountyMember2022-12-310000045876hsc:CourtsLocatedInStatesOtherThanNewYorkMemberhsc:OtherIncludingAsbestosRelatedClaimsMember2022-12-310000045876hsc:OtherIncludingAsbestosRelatedClaimsMembersrt:MinimumMember2022-01-012022-12-310000045876hsc:OtherIncludingAsbestosRelatedClaimsMembersrt:MaximumMember2022-01-012022-12-310000045876hsc:PendingAndFutureLitigationDeferredOrInactiveDocketMemberhsc:OtherIncludingAsbestosRelatedClaimsMemberhsc:NewYorkCountyAsManagedByNewYorkSupremeCourtMember2022-12-310000045876hsc:OtherIncludingAsbestosRelatedClaimsMemberhsc:PendingLitigationActiveOrInExtremisDocketMember2022-12-310000045876us-gaap:TreasuryStockMember2020-01-012020-12-310000045876hsc:CommonStockSharesOutstandingMember2020-01-012020-12-310000045876us-gaap:TreasuryStockMember2021-01-012021-12-310000045876hsc:CommonStockSharesOutstandingMember2021-01-012021-12-310000045876us-gaap:TreasuryStockMember2022-01-012022-12-310000045876hsc:CommonStockSharesOutstandingMember2022-01-012022-12-310000045876us-gaap:RestrictedStockUnitsRSUMember2022-01-012022-12-310000045876us-gaap:RestrictedStockUnitsRSUMember2021-01-012021-12-310000045876us-gaap:RestrictedStockUnitsRSUMember2020-01-012020-12-310000045876us-gaap:StockAppreciationRightsSARSMember2022-01-012022-12-310000045876us-gaap:StockAppreciationRightsSARSMember2021-01-012021-12-310000045876us-gaap:StockAppreciationRightsSARSMember2020-01-012020-12-310000045876us-gaap:PerformanceSharesMember2022-01-012022-12-310000045876us-gaap:PerformanceSharesMember2021-01-012021-12-310000045876us-gaap:PerformanceSharesMember2020-01-012020-12-310000045876hsc:EquityAndIncentiveCompensationPlan2013Member2022-12-310000045876hsc:EquityAndIncentiveCompensationPlan2013Memberhsc:EquityAwardsOtherThanOptionsAndStockAppreciationRightsMember2022-12-310000045876hsc:NonEmployeeDirectorsStockPlan1995Member2022-12-310000045876hsc:OfficersAndKeyEmployeesMemberus-gaap:RestrictedStockUnitsRSUMember2022-01-012022-12-310000045876hsc:NonEmployeeDirectorMemberus-gaap:RestrictedStockUnitsRSUMember2022-01-012022-12-310000045876hsc:NonEmployeeDirectorsStockPlan1995Memberus-gaap:RestrictedStockUnitsRSUMember2019-01-012019-12-310000045876hsc:IssuePeriod2019Memberhsc:NonEmployeeDirectorsStockPlan1995Memberus-gaap:RestrictedStockUnitsRSUMember2022-01-012022-12-310000045876hsc:IssuePeriod2019Memberhsc:NonEmployeeDirectorsStockPlan1995Memberus-gaap:RestrictedStockUnitsRSUMember2021-01-012021-12-310000045876hsc:IssuePeriod2019Memberhsc:NonEmployeeDirectorsStockPlan1995Memberus-gaap:RestrictedStockUnitsRSUMember2020-01-012020-12-310000045876hsc:NonEmployeeDirectorsStockPlan1995Memberus-gaap:RestrictedStockUnitsRSUMember2020-01-012020-12-310000045876hsc:IssuePeriod2020Memberhsc:NonEmployeeDirectorsStockPlan1995Memberus-gaap:RestrictedStockUnitsRSUMember2022-01-012022-12-310000045876hsc:IssuePeriod2020Memberhsc:NonEmployeeDirectorsStockPlan1995Memberus-gaap:RestrictedStockUnitsRSUMember2021-01-012021-12-310000045876hsc:IssuePeriod2020Memberhsc:NonEmployeeDirectorsStockPlan1995Memberus-gaap:RestrictedStockUnitsRSUMember2020-01-012020-12-310000045876hsc:NonEmployeeDirectorsStockPlan1995Memberus-gaap:RestrictedStockUnitsRSUMember2021-01-012021-12-310000045876hsc:IssuePeriod2021Memberhsc:NonEmployeeDirectorsStockPlan1995Memberus-gaap:RestrictedStockUnitsRSUMember2022-01-012022-12-310000045876hsc:IssuePeriod2021Memberhsc:NonEmployeeDirectorsStockPlan1995Memberus-gaap:RestrictedStockUnitsRSUMember2021-01-012021-12-310000045876hsc:IssuePeriod2021Memberhsc:NonEmployeeDirectorsStockPlan1995Memberus-gaap:RestrictedStockUnitsRSUMember2020-01-012020-12-310000045876hsc:NonEmployeeDirectorsStockPlan1995Memberus-gaap:RestrictedStockUnitsRSUMember2022-01-012022-12-310000045876hsc:IssuePeriod2022Memberhsc:NonEmployeeDirectorsStockPlan1995Memberus-gaap:RestrictedStockUnitsRSUMember2022-01-012022-12-310000045876hsc:IssuePeriod2022Memberhsc:NonEmployeeDirectorsStockPlan1995Memberus-gaap:RestrictedStockUnitsRSUMember2021-01-012021-12-310000045876hsc:IssuePeriod2022Memberhsc:NonEmployeeDirectorsStockPlan1995Memberus-gaap:RestrictedStockUnitsRSUMember2020-01-012020-12-310000045876hsc:ExecutiveIncentiveCompensationPlan1995Memberus-gaap:RestrictedStockUnitsRSUMember2017-01-012017-12-310000045876hsc:ExecutiveIncentiveCompensationPlan1995Memberhsc:IssuePeriod2017Memberus-gaap:RestrictedStockUnitsRSUMember2022-01-012022-12-310000045876hsc:ExecutiveIncentiveCompensationPlan1995Memberhsc:IssuePeriod2017Memberus-gaap:RestrictedStockUnitsRSUMember2021-01-012021-12-310000045876hsc:ExecutiveIncentiveCompensationPlan1995Memberhsc:IssuePeriod2017Memberus-gaap:RestrictedStockUnitsRSUMember2020-01-012020-12-310000045876hsc:ExecutiveIncentiveCompensationPlan1995Memberus-gaap:RestrictedStockUnitsRSUMember2018-01-012018-12-310000045876hsc:ExecutiveIncentiveCompensationPlan1995Memberus-gaap:RestrictedStockUnitsRSUMemberhsc:IssuePeriod2018Member2022-01-012022-12-310000045876hsc:ExecutiveIncentiveCompensationPlan1995Memberus-gaap:RestrictedStockUnitsRSUMemberhsc:IssuePeriod2018Member2021-01-012021-12-310000045876hsc:ExecutiveIncentiveCompensationPlan1995Memberus-gaap:RestrictedStockUnitsRSUMemberhsc:IssuePeriod2018Member2020-01-012020-12-310000045876hsc:ExecutiveIncentiveCompensationPlan1995Memberus-gaap:RestrictedStockUnitsRSUMember2019-01-012019-12-310000045876hsc:IssuePeriod2019Memberhsc:ExecutiveIncentiveCompensationPlan1995Memberus-gaap:RestrictedStockUnitsRSUMember2022-01-012022-12-310000045876hsc:IssuePeriod2019Memberhsc:ExecutiveIncentiveCompensationPlan1995Memberus-gaap:RestrictedStockUnitsRSUMember2021-01-012021-12-310000045876hsc:IssuePeriod2019Memberhsc:ExecutiveIncentiveCompensationPlan1995Memberus-gaap:RestrictedStockUnitsRSUMember2020-01-012020-12-310000045876hsc:ExecutiveIncentiveCompensationPlan1995Memberus-gaap:RestrictedStockUnitsRSUMember2020-01-012020-12-310000045876hsc:IssuePeriod2020Memberhsc:ExecutiveIncentiveCompensationPlan1995Memberus-gaap:RestrictedStockUnitsRSUMember2022-01-012022-12-310000045876hsc:IssuePeriod2020Memberhsc:ExecutiveIncentiveCompensationPlan1995Memberus-gaap:RestrictedStockUnitsRSUMember2021-01-012021-12-310000045876hsc:IssuePeriod2020Memberhsc:ExecutiveIncentiveCompensationPlan1995Memberus-gaap:RestrictedStockUnitsRSUMember2020-01-012020-12-310000045876hsc:ExecutiveIncentiveCompensationPlan1995Memberus-gaap:RestrictedStockUnitsRSUMember2021-01-012021-12-310000045876hsc:ExecutiveIncentiveCompensationPlan1995Memberhsc:IssuePeriod2021Memberus-gaap:RestrictedStockUnitsRSUMember2022-01-012022-12-310000045876hsc:ExecutiveIncentiveCompensationPlan1995Memberhsc:IssuePeriod2021Memberus-gaap:RestrictedStockUnitsRSUMember2021-01-012021-12-310000045876hsc:ExecutiveIncentiveCompensationPlan1995Memberhsc:IssuePeriod2021Memberus-gaap:RestrictedStockUnitsRSUMember2020-01-012020-12-310000045876hsc:ExecutiveIncentiveCompensationPlan1995Memberus-gaap:RestrictedStockUnitsRSUMember2022-01-012022-12-310000045876hsc:IssuePeriod2022Memberhsc:ExecutiveIncentiveCompensationPlan1995Memberus-gaap:RestrictedStockUnitsRSUMember2022-01-012022-12-310000045876hsc:IssuePeriod2022Memberhsc:ExecutiveIncentiveCompensationPlan1995Memberus-gaap:RestrictedStockUnitsRSUMember2021-01-012021-12-310000045876hsc:IssuePeriod2022Memberhsc:ExecutiveIncentiveCompensationPlan1995Memberus-gaap:RestrictedStockUnitsRSUMember2020-01-012020-12-310000045876us-gaap:RestrictedStockUnitsRSUMember2022-01-012022-12-310000045876us-gaap:RestrictedStockUnitsRSUMember2021-01-012021-12-310000045876us-gaap:RestrictedStockUnitsRSUMember2020-01-012020-12-310000045876us-gaap:RestrictedStockUnitsRSUMember2021-12-310000045876us-gaap:RestrictedStockUnitsRSUMember2022-12-310000045876us-gaap:StockAppreciationRightsSARSMember2022-01-012022-12-310000045876us-gaap:StockAppreciationRightsSARSMemberhsc:EquityAndIncentiveCompensationPlan2013Member2020-03-012020-03-310000045876us-gaap:StockAppreciationRightsSARSMemberhsc:EquityAndIncentiveCompensationPlan2013Member2020-10-012020-10-310000045876us-gaap:StockAppreciationRightsSARSMemberhsc:EquityAndIncentiveCompensationPlan2013Member2021-03-012021-03-310000045876us-gaap:StockAppreciationRightsSARSMemberhsc:EquityAndIncentiveCompensationPlan2013Member2022-03-012022-03-310000045876us-gaap:StockAppreciationRightsSARSMemberhsc:EquityAndIncentiveCompensationPlan2013Member2022-09-012022-12-310000045876us-gaap:StockAppreciationRightsSARSMember2020-03-012020-03-310000045876us-gaap:StockAppreciationRightsSARSMember2020-03-310000045876us-gaap:StockAppreciationRightsSARSMember2020-10-012020-10-310000045876us-gaap:StockAppreciationRightsSARSMember2020-10-310000045876us-gaap:StockAppreciationRightsSARSMember2021-03-012021-03-310000045876us-gaap:StockAppreciationRightsSARSMember2021-03-310000045876us-gaap:StockAppreciationRightsSARSMember2022-03-012022-03-310000045876us-gaap:StockAppreciationRightsSARSMember2022-03-310000045876us-gaap:StockAppreciationRightsSARSMember2022-09-012022-09-300000045876us-gaap:StockAppreciationRightsSARSMember2022-09-300000045876us-gaap:StockAppreciationRightsSARSMember2022-10-012022-10-310000045876us-gaap:StockAppreciationRightsSARSMember2022-10-310000045876us-gaap:StockAppreciationRightsSARSMember2022-12-012022-12-310000045876us-gaap:StockAppreciationRightsSARSMember2022-12-310000045876us-gaap:StockAppreciationRightsSARSMember2021-12-310000045876us-gaap:StockAppreciationRightsSARSMember2021-01-012021-12-310000045876us-gaap:StockAppreciationRightsSARSMember2020-01-012020-12-310000045876us-gaap:StockAppreciationRightsSARSMemberhsc:ExercisePriceRangeFourMember2022-01-012022-12-310000045876hsc:ExercisePriceRangeFourMember2022-12-310000045876hsc:ExercisePriceRangeFourMember2022-01-012022-12-310000045876hsc:ExercisePriceRangeFiveMemberus-gaap:StockAppreciationRightsSARSMember2022-01-012022-12-310000045876hsc:ExercisePriceRangeFiveMember2022-12-310000045876hsc:ExercisePriceRangeFiveMember2022-01-012022-12-310000045876us-gaap:StockAppreciationRightsSARSMemberhsc:ExercisePriceRangeSixMember2022-01-012022-12-310000045876hsc:ExercisePriceRangeSixMember2022-12-310000045876hsc:ExercisePriceRangeSixMember2022-01-012022-12-310000045876us-gaap:PerformanceSharesMember2022-01-012022-12-310000045876us-gaap:PerformanceSharesMembersrt:MinimumMember2022-01-012022-12-310000045876us-gaap:PerformanceSharesMembersrt:MaximumMember2022-01-012022-12-310000045876us-gaap:PerformanceSharesMember2020-03-012020-03-310000045876us-gaap:PerformanceSharesMember2020-10-012020-10-310000045876us-gaap:PerformanceSharesMember2021-03-012021-03-310000045876us-gaap:PerformanceSharesMember2022-03-012022-03-310000045876us-gaap:PerformanceSharesMember2021-01-012021-12-310000045876us-gaap:PerformanceSharesMember2020-01-012020-12-310000045876us-gaap:PerformanceSharesMember2022-12-310000045876us-gaap:PerformanceSharesMember2021-12-3100000458762022-08-3100000458762022-08-012022-08-310000045876hsc:StandbyLettersOfCreditBondsAndBankGuaranteesMember2022-12-310000045876hsc:StandbyLettersOfCreditBondsAndBankGuaranteesMember2021-12-310000045876hsc:StandbyLettersOfCreditBondsAndBankGuaranteesMember2020-12-310000045876hsc:StandbyLettersOfCreditBondsAndBankGuaranteesMembersrt:MinimumMember2022-01-012022-12-310000045876hsc:StandbyLettersOfCreditBondsAndBankGuaranteesMembersrt:MaximumMember2022-01-012022-12-310000045876hsc:StandbyLettersOfCreditBondsAndBankGuaranteesMember2022-01-012022-12-310000045876srt:MinimumMember2022-01-012022-12-31hsc:country0000045876us-gaap:IndemnificationGuaranteeMember2022-12-310000045876us-gaap:DesignatedAsHedgingInstrumentMemberus-gaap:OtherCurrentAssetsMemberus-gaap:ForeignExchangeForwardMember2022-12-310000045876us-gaap:OtherCurrentAssetsMemberus-gaap:NondesignatedMemberus-gaap:ForeignExchangeForwardMember2022-12-310000045876us-gaap:OtherCurrentAssetsMemberus-gaap:ForeignExchangeForwardMember2022-12-310000045876us-gaap:DesignatedAsHedgingInstrumentMember2022-12-310000045876us-gaap:NondesignatedMember2022-12-310000045876us-gaap:DesignatedAsHedgingInstrumentMemberus-gaap:OtherCurrentLiabilitiesMemberus-gaap:ForeignExchangeForwardMember2022-12-310000045876us-gaap:OtherCurrentLiabilitiesMemberus-gaap:NondesignatedMemberus-gaap:ForeignExchangeForwardMember2022-12-310000045876us-gaap:OtherCurrentLiabilitiesMemberus-gaap:ForeignExchangeForwardMember2022-12-310000045876us-gaap:DesignatedAsHedgingInstrumentMemberus-gaap:OtherCurrentAssetsMemberus-gaap:ForeignExchangeForwardMember2021-12-310000045876us-gaap:OtherCurrentAssetsMemberus-gaap:NondesignatedMemberus-gaap:ForeignExchangeForwardMember2021-12-310000045876us-gaap:OtherCurrentAssetsMemberus-gaap:ForeignExchangeForwardMember2021-12-310000045876us-gaap:DesignatedAsHedgingInstrumentMember2021-12-310000045876us-gaap:NondesignatedMember2021-12-310000045876us-gaap:DesignatedAsHedgingInstrumentMemberus-gaap:OtherCurrentLiabilitiesMemberus-gaap:ForeignExchangeForwardMember2021-12-310000045876us-gaap:OtherCurrentLiabilitiesMemberus-gaap:NondesignatedMemberus-gaap:ForeignExchangeForwardMember2021-12-310000045876us-gaap:OtherCurrentLiabilitiesMemberus-gaap:ForeignExchangeForwardMember2021-12-310000045876us-gaap:DesignatedAsHedgingInstrumentMemberus-gaap:OtherCurrentLiabilitiesMemberus-gaap:InterestRateSwapMember2021-12-310000045876us-gaap:OtherCurrentLiabilitiesMemberus-gaap:InterestRateSwapMemberus-gaap:NondesignatedMember2021-12-310000045876us-gaap:OtherCurrentLiabilitiesMemberus-gaap:InterestRateSwapMember2021-12-310000045876hsc:ForeignExchangeForwardTwoMember2022-01-012022-12-310000045876hsc:ForeignExchangeForwardTwoMember2021-01-012021-12-310000045876hsc:ForeignExchangeForwardTwoMember2020-01-012020-12-310000045876us-gaap:DiscontinuedOperationsHeldForSaleOrDisposedOfBySaleMemberus-gaap:ForeignExchangeForwardMember2022-01-012022-12-310000045876us-gaap:DiscontinuedOperationsHeldForSaleOrDisposedOfBySaleMemberus-gaap:ForeignExchangeForwardMember2021-01-012021-12-310000045876us-gaap:DiscontinuedOperationsHeldForSaleOrDisposedOfBySaleMemberus-gaap:ForeignExchangeForwardMember2020-01-012020-12-310000045876hsc:InterestRateSwapTwoMember2022-01-012022-12-310000045876hsc:InterestRateSwapTwoMember2021-01-012021-12-310000045876hsc:InterestRateSwapTwoMember2020-01-012020-12-310000045876us-gaap:InterestRateSwapMemberus-gaap:InterestExpenseMember2022-01-012022-12-310000045876us-gaap:InterestRateSwapMemberus-gaap:InterestExpenseMember2021-01-012021-12-310000045876us-gaap:InterestRateSwapMemberus-gaap:InterestExpenseMember2020-01-012020-12-310000045876us-gaap:CrossCurrencyInterestRateContractMember2022-01-012022-12-310000045876us-gaap:CrossCurrencyInterestRateContractMember2021-01-012021-12-310000045876us-gaap:CrossCurrencyInterestRateContractMember2020-01-012020-12-310000045876us-gaap:CrossCurrencyInterestRateContractMemberus-gaap:InterestExpenseMember2022-01-012022-12-310000045876us-gaap:CrossCurrencyInterestRateContractMemberus-gaap:InterestExpenseMember2021-01-012021-12-310000045876us-gaap:CrossCurrencyInterestRateContractMemberus-gaap:InterestExpenseMember2020-01-012020-12-310000045876hsc:DiscontinuedOperationGainLossFromDisposalOfDiscontinuedOperationMemberus-gaap:InterestRateSwapMember2022-01-012022-12-310000045876us-gaap:InterestExpenseMemberus-gaap:ForeignExchangeContractMember2022-01-012022-12-310000045876us-gaap:ForeignExchangeContractMemberus-gaap:CostOfGoodsTotalMember2022-01-012022-12-310000045876hsc:DiscontinuedOperationGainLossFromDisposalOfDiscontinuedOperationMemberus-gaap:InterestRateSwapMember2021-01-012021-12-310000045876us-gaap:InterestExpenseMemberus-gaap:ForeignExchangeContractMember2021-01-012021-12-310000045876hsc:DiscontinuedOperationGainLossFromDisposalOfDiscontinuedOperationMemberus-gaap:ForeignExchangeContractMember2021-01-012021-12-310000045876hsc:DiscontinuedOperationGainLossFromDisposalOfDiscontinuedOperationMemberus-gaap:InterestRateSwapMember2020-01-012020-12-310000045876us-gaap:InterestExpenseMemberus-gaap:ForeignExchangeContractMember2020-01-012020-12-310000045876hsc:DiscontinuedOperationGainLossFromDisposalOfDiscontinuedOperationMemberus-gaap:ForeignExchangeContractMember2020-01-012020-12-310000045876us-gaap:CrossCurrencyInterestRateContractMemberhsc:DiscontinuedOperationGainLossFromDisposalOfDiscontinuedOperationMember2020-01-012020-12-310000045876us-gaap:CostOfSalesMemberus-gaap:ForeignExchangeForwardMember2022-01-012022-12-310000045876us-gaap:CostOfSalesMemberus-gaap:ForeignExchangeForwardMember2021-01-012021-12-310000045876us-gaap:CostOfSalesMemberus-gaap:ForeignExchangeForwardMember2020-01-012020-12-310000045876us-gaap:ForeignExchangeForwardMember2022-12-310000045876us-gaap:ForeignExchangeForwardMember2021-12-310000045876hsc:TermLoanMember2022-12-310000045876hsc:TermLoanFacilityFixedRateMemberhsc:TermLoanMemberus-gaap:LondonInterbankOfferedRateLIBORMember2021-01-012021-12-310000045876hsc:TermLoanFacilityFixedRateMemberhsc:TermLoanMemberus-gaap:LondonInterbankOfferedRateLIBORMember2022-01-012022-12-310000045876us-gaap:SubsequentEventMemberhsc:TermLoanMember2023-02-280000045876hsc:TermLoanFacilityFixedRateMemberhsc:TermLoanMemberus-gaap:SecuredOvernightFinancingRateSofrOvernightIndexSwapRateMembersrt:MinimumMember2022-01-012022-12-310000045876hsc:TermLoanFacilityFixedRateMembersrt:MaximumMemberhsc:TermLoanMemberus-gaap:SecuredOvernightFinancingRateSofrOvernightIndexSwapRateMember2022-01-012022-12-31hsc:segment0000045876country:US2020-01-012020-12-310000045876hsc:OtherCountriesMember2022-01-012022-12-310000045876hsc:OtherCountriesMember2021-01-012021-12-310000045876hsc:OtherCountriesMember2020-01-012020-12-310000045876country:US2022-12-310000045876country:US2021-12-310000045876country:CN2022-12-310000045876country:CN2021-12-310000045876hsc:OtherCountriesMember2022-12-310000045876hsc:OtherCountriesMember2021-12-31hsc:Customer0000045876hsc:HarscoEnvironmentalSegmentMember2020-01-012020-12-310000045876hsc:HarscoEnvironmentalSegmentMemberus-gaap:OperatingSegmentsMember2022-01-012022-12-310000045876hsc:HarscoEnvironmentalSegmentMemberus-gaap:OperatingSegmentsMember2021-01-012021-12-310000045876hsc:HarscoEnvironmentalSegmentMemberus-gaap:OperatingSegmentsMember2020-01-012020-12-310000045876hsc:CleanEarthMemberus-gaap:OperatingSegmentsMember2022-01-012022-12-310000045876hsc:CleanEarthMemberus-gaap:OperatingSegmentsMember2021-01-012021-12-310000045876hsc:CleanEarthMemberus-gaap:OperatingSegmentsMember2020-01-012020-12-310000045876hsc:CleanEarthMember2020-01-012020-12-310000045876us-gaap:CorporateNonSegmentMember2022-01-012022-12-310000045876us-gaap:CorporateNonSegmentMember2021-01-012021-12-310000045876us-gaap:CorporateNonSegmentMember2020-01-012020-12-310000045876hsc:HarscoEnvironmentalSegmentMemberus-gaap:OperatingSegmentsMember2022-12-310000045876hsc:HarscoEnvironmentalSegmentMemberus-gaap:OperatingSegmentsMember2021-12-310000045876hsc:HarscoEnvironmentalSegmentMemberus-gaap:OperatingSegmentsMember2020-12-310000045876us-gaap:CorporateNonSegmentMember2022-12-310000045876us-gaap:CorporateNonSegmentMember2021-12-310000045876us-gaap:CorporateNonSegmentMember2020-12-310000045876hsc:HarscoIndustrialMemberus-gaap:OperatingSegmentsMember2022-12-310000045876hsc:HarscoIndustrialMemberus-gaap:OperatingSegmentsMember2021-12-310000045876hsc:HarscoIndustrialMemberus-gaap:OperatingSegmentsMember2020-12-310000045876us-gaap:OperatingSegmentsMember2022-01-012022-12-310000045876us-gaap:OperatingSegmentsMember2021-01-012021-12-310000045876us-gaap:OperatingSegmentsMember2020-01-012020-12-310000045876hsc:HarscoEnvironmentalSegmentMemberus-gaap:OperatingSegmentsMembersrt:NorthAmericaMember2022-01-012022-12-310000045876hsc:CleanEarthMemberus-gaap:OperatingSegmentsMembersrt:NorthAmericaMember2022-01-012022-12-310000045876srt:NorthAmericaMember2022-01-012022-12-310000045876hsc:HarscoEnvironmentalSegmentMemberus-gaap:OperatingSegmentsMemberhsc:WesternEuropeMember2022-01-012022-12-310000045876hsc:CleanEarthMemberus-gaap:OperatingSegmentsMemberhsc:WesternEuropeMember2022-01-012022-12-310000045876hsc:WesternEuropeMember2022-01-012022-12-310000045876hsc:HarscoEnvironmentalSegmentMembersrt:LatinAmericaMemberus-gaap:OperatingSegmentsMember2022-01-012022-12-310000045876srt:LatinAmericaMemberhsc:CleanEarthMemberus-gaap:OperatingSegmentsMember2022-01-012022-12-310000045876srt:LatinAmericaMember2022-01-012022-12-310000045876hsc:HarscoEnvironmentalSegmentMembersrt:AsiaPacificMemberus-gaap:OperatingSegmentsMember2022-01-012022-12-310000045876srt:AsiaPacificMemberhsc:CleanEarthMemberus-gaap:OperatingSegmentsMember2022-01-012022-12-310000045876srt:AsiaPacificMember2022-01-012022-12-310000045876hsc:HarscoEnvironmentalSegmentMemberus-gaap:OperatingSegmentsMemberhsc:MiddleEastAndAfricaMember2022-01-012022-12-310000045876hsc:CleanEarthMemberus-gaap:OperatingSegmentsMemberhsc:MiddleEastAndAfricaMember2022-01-012022-12-310000045876hsc:MiddleEastAndAfricaMember2022-01-012022-12-310000045876hsc:HarscoEnvironmentalSegmentMemberhsc:EasternEuropeMemberus-gaap:OperatingSegmentsMember2022-01-012022-12-310000045876hsc:EasternEuropeMemberhsc:CleanEarthMemberus-gaap:OperatingSegmentsMember2022-01-012022-12-310000045876hsc:EasternEuropeMember2022-01-012022-12-310000045876hsc:HarscoEnvironmentalSegmentMemberhsc:ProductsAndServicesOnsiteServicesAndMaterialLogisticsProductQualityImprovementAndResourceRecoveryMemberus-gaap:OperatingSegmentsMember2022-01-012022-12-310000045876hsc:CleanEarthMemberhsc:ProductsAndServicesOnsiteServicesAndMaterialLogisticsProductQualityImprovementAndResourceRecoveryMemberus-gaap:OperatingSegmentsMember2022-01-012022-12-310000045876hsc:ProductsAndServicesOnsiteServicesAndMaterialLogisticsProductQualityImprovementAndResourceRecoveryMember2022-01-012022-12-310000045876hsc:HarscoEnvironmentalSegmentMemberhsc:AppliedProductsMemberus-gaap:OperatingSegmentsMember2022-01-012022-12-310000045876hsc:CleanEarthMemberhsc:AppliedProductsMemberus-gaap:OperatingSegmentsMember2022-01-012022-12-310000045876hsc:AppliedProductsMember2022-01-012022-12-310000045876hsc:HarscoEnvironmentalSegmentMemberhsc:AluminumDrossAndScrapProcessingSystemsMemberus-gaap:OperatingSegmentsMember2022-01-012022-12-310000045876hsc:AluminumDrossAndScrapProcessingSystemsMemberhsc:CleanEarthMemberus-gaap:OperatingSegmentsMember2022-01-012022-12-310000045876hsc:AluminumDrossAndScrapProcessingSystemsMember2022-01-012022-12-310000045876hsc:HarscoEnvironmentalSegmentMemberhsc:WasteProcessingAndReuseSolutionsMemberus-gaap:OperatingSegmentsMember2022-01-012022-12-310000045876hsc:WasteProcessingAndReuseSolutionsMemberhsc:CleanEarthMemberus-gaap:OperatingSegmentsMember2022-01-012022-12-310000045876hsc:WasteProcessingAndReuseSolutionsMember2022-01-012022-12-310000045876hsc:HarscoEnvironmentalSegmentMemberhsc:SoilAndDredgedMaterialMemberus-gaap:OperatingSegmentsMember2022-01-012022-12-310000045876hsc:SoilAndDredgedMaterialMemberhsc:CleanEarthMemberus-gaap:OperatingSegmentsMember2022-01-012022-12-310000045876hsc:SoilAndDredgedMaterialMember2022-01-012022-12-310000045876hsc:HarscoEnvironmentalSegmentMemberus-gaap:OperatingSegmentsMembersrt:NorthAmericaMember2021-01-012021-12-310000045876hsc:CleanEarthMemberus-gaap:OperatingSegmentsMembersrt:NorthAmericaMember2021-01-012021-12-310000045876srt:NorthAmericaMember2021-01-012021-12-310000045876hsc:HarscoEnvironmentalSegmentMemberus-gaap:OperatingSegmentsMemberhsc:WesternEuropeMember2021-01-012021-12-310000045876hsc:CleanEarthMemberus-gaap:OperatingSegmentsMemberhsc:WesternEuropeMember2021-01-012021-12-310000045876hsc:WesternEuropeMember2021-01-012021-12-310000045876hsc:HarscoEnvironmentalSegmentMembersrt:LatinAmericaMemberus-gaap:OperatingSegmentsMember2021-01-012021-12-310000045876srt:LatinAmericaMemberhsc:CleanEarthMemberus-gaap:OperatingSegmentsMember2021-01-012021-12-310000045876srt:LatinAmericaMember2021-01-012021-12-310000045876hsc:HarscoEnvironmentalSegmentMembersrt:AsiaPacificMemberus-gaap:OperatingSegmentsMember2021-01-012021-12-310000045876srt:AsiaPacificMemberhsc:CleanEarthMemberus-gaap:OperatingSegmentsMember2021-01-012021-12-310000045876srt:AsiaPacificMember2021-01-012021-12-310000045876hsc:HarscoEnvironmentalSegmentMemberus-gaap:OperatingSegmentsMemberhsc:MiddleEastAndAfricaMember2021-01-012021-12-310000045876hsc:CleanEarthMemberus-gaap:OperatingSegmentsMemberhsc:MiddleEastAndAfricaMember2021-01-012021-12-310000045876hsc:MiddleEastAndAfricaMember2021-01-012021-12-310000045876hsc:HarscoEnvironmentalSegmentMemberhsc:EasternEuropeMemberus-gaap:OperatingSegmentsMember2021-01-012021-12-310000045876hsc:EasternEuropeMemberhsc:CleanEarthMemberus-gaap:OperatingSegmentsMember2021-01-012021-12-310000045876hsc:EasternEuropeMember2021-01-012021-12-310000045876hsc:HarscoEnvironmentalSegmentMemberhsc:ProductsAndServicesOnsiteServicesAndMaterialLogisticsProductQualityImprovementAndResourceRecoveryMemberus-gaap:OperatingSegmentsMember2021-01-012021-12-310000045876hsc:CleanEarthMemberhsc:ProductsAndServicesOnsiteServicesAndMaterialLogisticsProductQualityImprovementAndResourceRecoveryMemberus-gaap:OperatingSegmentsMember2021-01-012021-12-310000045876hsc:ProductsAndServicesOnsiteServicesAndMaterialLogisticsProductQualityImprovementAndResourceRecoveryMember2021-01-012021-12-310000045876hsc:HarscoEnvironmentalSegmentMemberhsc:AppliedProductsMemberus-gaap:OperatingSegmentsMember2021-01-012021-12-310000045876hsc:CleanEarthMemberhsc:AppliedProductsMemberus-gaap:OperatingSegmentsMember2021-01-012021-12-310000045876hsc:AppliedProductsMember2021-01-012021-12-310000045876hsc:HarscoEnvironmentalSegmentMemberhsc:AluminumDrossAndScrapProcessingSystemsMemberus-gaap:OperatingSegmentsMember2021-01-012021-12-310000045876hsc:AluminumDrossAndScrapProcessingSystemsMemberhsc:CleanEarthMemberus-gaap:OperatingSegmentsMember2021-01-012021-12-310000045876hsc:AluminumDrossAndScrapProcessingSystemsMember2021-01-012021-12-310000045876hsc:HarscoEnvironmentalSegmentMemberhsc:WasteProcessingAndReuseSolutionsMemberus-gaap:OperatingSegmentsMember2021-01-012021-12-310000045876hsc:WasteProcessingAndReuseSolutionsMemberhsc:CleanEarthMemberus-gaap:OperatingSegmentsMember2021-01-012021-12-310000045876hsc:WasteProcessingAndReuseSolutionsMember2021-01-012021-12-310000045876hsc:HarscoEnvironmentalSegmentMemberhsc:SoilAndDredgedMaterialMemberus-gaap:OperatingSegmentsMember2021-01-012021-12-310000045876hsc:SoilAndDredgedMaterialMemberhsc:CleanEarthMemberus-gaap:OperatingSegmentsMember2021-01-012021-12-310000045876hsc:SoilAndDredgedMaterialMember2021-01-012021-12-310000045876hsc:HarscoEnvironmentalSegmentMemberus-gaap:OperatingSegmentsMembersrt:NorthAmericaMember2020-01-012020-12-310000045876hsc:CleanEarthMemberus-gaap:OperatingSegmentsMembersrt:NorthAmericaMember2020-01-012020-12-310000045876srt:NorthAmericaMember2020-01-012020-12-310000045876hsc:HarscoEnvironmentalSegmentMemberus-gaap:OperatingSegmentsMemberhsc:WesternEuropeMember2020-01-012020-12-310000045876hsc:CleanEarthMemberus-gaap:OperatingSegmentsMemberhsc:WesternEuropeMember2020-01-012020-12-310000045876hsc:WesternEuropeMember2020-01-012020-12-310000045876hsc:HarscoEnvironmentalSegmentMembersrt:LatinAmericaMemberus-gaap:OperatingSegmentsMember2020-01-012020-12-310000045876srt:LatinAmericaMemberhsc:CleanEarthMemberus-gaap:OperatingSegmentsMember2020-01-012020-12-310000045876srt:LatinAmericaMember2020-01-012020-12-310000045876hsc:HarscoEnvironmentalSegmentMembersrt:AsiaPacificMemberus-gaap:OperatingSegmentsMember2020-01-012020-12-310000045876srt:AsiaPacificMemberhsc:CleanEarthMemberus-gaap:OperatingSegmentsMember2020-01-012020-12-310000045876srt:AsiaPacificMember2020-01-012020-12-310000045876hsc:HarscoEnvironmentalSegmentMemberus-gaap:OperatingSegmentsMemberhsc:MiddleEastAndAfricaMember2020-01-012020-12-310000045876hsc:CleanEarthMemberus-gaap:OperatingSegmentsMemberhsc:MiddleEastAndAfricaMember2020-01-012020-12-310000045876hsc:MiddleEastAndAfricaMember2020-01-012020-12-310000045876hsc:HarscoEnvironmentalSegmentMemberhsc:EasternEuropeMemberus-gaap:OperatingSegmentsMember2020-01-012020-12-310000045876hsc:EasternEuropeMemberhsc:CleanEarthMemberus-gaap:OperatingSegmentsMember2020-01-012020-12-310000045876hsc:EasternEuropeMember2020-01-012020-12-310000045876hsc:HarscoEnvironmentalSegmentMemberhsc:ProductsAndServicesOnsiteServicesAndMaterialLogisticsProductQualityImprovementAndResourceRecoveryMemberus-gaap:OperatingSegmentsMember2020-01-012020-12-310000045876hsc:CleanEarthMemberhsc:ProductsAndServicesOnsiteServicesAndMaterialLogisticsProductQualityImprovementAndResourceRecoveryMemberus-gaap:OperatingSegmentsMember2020-01-012020-12-310000045876hsc:ProductsAndServicesOnsiteServicesAndMaterialLogisticsProductQualityImprovementAndResourceRecoveryMember2020-01-012020-12-310000045876hsc:HarscoEnvironmentalSegmentMemberhsc:AppliedProductsMemberus-gaap:OperatingSegmentsMember2020-01-012020-12-310000045876hsc:CleanEarthMemberhsc:AppliedProductsMemberus-gaap:OperatingSegmentsMember2020-01-012020-12-310000045876hsc:AppliedProductsMember2020-01-012020-12-310000045876hsc:HarscoEnvironmentalSegmentMemberhsc:AluminumDrossAndScrapProcessingSystemsMemberus-gaap:OperatingSegmentsMember2020-01-012020-12-310000045876hsc:AluminumDrossAndScrapProcessingSystemsMemberhsc:CleanEarthMemberus-gaap:OperatingSegmentsMember2020-01-012020-12-310000045876hsc:AluminumDrossAndScrapProcessingSystemsMember2020-01-012020-12-310000045876hsc:HarscoEnvironmentalSegmentMemberhsc:WasteProcessingAndReuseSolutionsMemberus-gaap:OperatingSegmentsMember2020-01-012020-12-310000045876hsc:WasteProcessingAndReuseSolutionsMemberhsc:CleanEarthMemberus-gaap:OperatingSegmentsMember2020-01-012020-12-310000045876hsc:WasteProcessingAndReuseSolutionsMember2020-01-012020-12-310000045876hsc:HarscoEnvironmentalSegmentMemberhsc:SoilAndDredgedMaterialMemberus-gaap:OperatingSegmentsMember2020-01-012020-12-310000045876hsc:SoilAndDredgedMaterialMemberhsc:CleanEarthMemberus-gaap:OperatingSegmentsMember2020-01-012020-12-310000045876hsc:SoilAndDredgedMaterialMember2020-01-012020-12-310000045876hsc:HarscoMetalsAndMineralsMember2022-12-310000045876hsc:HarscoMetalsAndMineralsMember2022-01-012022-12-310000045876hsc:HarscoMetalsAndMineralsMember2023-01-012022-12-310000045876hsc:HarscoMetalsAndMineralsMember2024-01-012022-12-310000045876hsc:HarscoMetalsAndMineralsMember2025-01-012022-12-310000045876hsc:HarscoMetalsAndMineralsMember2022-01-012021-12-3100000458762022-01-01hsc:HarscoRailMember2021-12-310000045876hsc:HarscoMetalsAndMineralsMember2023-01-012021-12-310000045876hsc:HarscoRailMember2023-01-012021-12-310000045876hsc:HarscoMetalsAndMineralsMember2024-01-012021-12-3100000458762024-01-01hsc:HarscoRailMember2021-12-310000045876hsc:HarscoMetalsAndMineralsMember2025-01-012021-12-310000045876hsc:HarscoRailMember2025-01-012021-12-310000045876hsc:HarscoMetalsAndMineralsMember2026-01-012021-12-310000045876hsc:HarscoRailMember2026-01-012021-12-310000045876us-gaap:MaterialReconcilingItemsMember2022-01-012022-12-310000045876us-gaap:MaterialReconcilingItemsMember2021-01-012021-12-310000045876us-gaap:MaterialReconcilingItemsMember2020-01-012020-12-310000045876srt:CumulativeEffectPeriodOfAdoptionAdjustedBalanceMemberus-gaap:AccumulatedTranslationAdjustmentMember2020-12-310000045876us-gaap:AccumulatedNetGainLossFromDesignatedOrQualifyingCashFlowHedgesMembersrt:CumulativeEffectPeriodOfAdoptionAdjustedBalanceMember2020-12-310000045876us-gaap:AccumulatedDefinedBenefitPlansAdjustmentMembersrt:CumulativeEffectPeriodOfAdoptionAdjustedBalanceMember2020-12-310000045876us-gaap:AccumulatedNetUnrealizedInvestmentGainLossMembersrt:CumulativeEffectPeriodOfAdoptionAdjustedBalanceMember2020-12-310000045876srt:CumulativeEffectPeriodOfAdoptionAdjustedBalanceMember2020-12-310000045876us-gaap:AccumulatedTranslationAdjustmentMember2021-01-012021-12-310000045876us-gaap:AccumulatedNetGainLossFromDesignatedOrQualifyingCashFlowHedgesMember2021-01-012021-12-310000045876us-gaap:AccumulatedDefinedBenefitPlansAdjustmentMember2021-01-012021-12-310000045876us-gaap:AccumulatedNetUnrealizedInvestmentGainLossMember2021-01-012021-12-310000045876us-gaap:AccumulatedTranslationAdjustmentMember2021-12-310000045876us-gaap:AccumulatedNetGainLossFromDesignatedOrQualifyingCashFlowHedgesMember2021-12-310000045876us-gaap:AccumulatedDefinedBenefitPlansAdjustmentMember2021-12-310000045876us-gaap:AccumulatedNetUnrealizedInvestmentGainLossMember2021-12-310000045876us-gaap:AccumulatedTranslationAdjustmentMember2022-01-012022-12-310000045876us-gaap:AccumulatedNetGainLossFromDesignatedOrQualifyingCashFlowHedgesMember2022-01-012022-12-310000045876us-gaap:AccumulatedDefinedBenefitPlansAdjustmentMember2022-01-012022-12-310000045876us-gaap:AccumulatedNetUnrealizedInvestmentGainLossMember2022-01-012022-12-310000045876us-gaap:AccumulatedTranslationAdjustmentMember2022-12-310000045876us-gaap:AccumulatedNetGainLossFromDesignatedOrQualifyingCashFlowHedgesMember2022-12-310000045876us-gaap:AccumulatedDefinedBenefitPlansAdjustmentMember2022-12-310000045876us-gaap:AccumulatedNetUnrealizedInvestmentGainLossMember2022-12-310000045876us-gaap:ReclassificationOutOfAccumulatedOtherComprehensiveIncomeMemberus-gaap:AccumulatedDefinedBenefitPlansAdjustmentNetUnamortizedGainLossMember2022-01-012022-12-310000045876us-gaap:ReclassificationOutOfAccumulatedOtherComprehensiveIncomeMemberus-gaap:AccumulatedDefinedBenefitPlansAdjustmentNetUnamortizedGainLossMember2021-01-012021-12-310000045876us-gaap:ReclassificationOutOfAccumulatedOtherComprehensiveIncomeMemberus-gaap:AccumulatedDefinedBenefitPlansAdjustmentNetPriorServiceCostCreditMember2022-01-012022-12-310000045876us-gaap:ReclassificationOutOfAccumulatedOtherComprehensiveIncomeMemberus-gaap:AccumulatedDefinedBenefitPlansAdjustmentNetPriorServiceCostCreditMember2021-01-012021-12-310000045876us-gaap:ReclassificationOutOfAccumulatedOtherComprehensiveIncomeMemberus-gaap:SegmentDiscontinuedOperationsMemberhsc:SettlementCurtailmentLossesMember2022-01-012022-12-310000045876us-gaap:ReclassificationOutOfAccumulatedOtherComprehensiveIncomeMemberus-gaap:SegmentDiscontinuedOperationsMemberhsc:SettlementCurtailmentLossesMember2021-01-012021-12-310000045876us-gaap:ReclassificationOutOfAccumulatedOtherComprehensiveIncomeMemberhsc:SettlementCurtailmentLossesMember2022-01-012022-12-310000045876us-gaap:ReclassificationOutOfAccumulatedOtherComprehensiveIncomeMemberhsc:SettlementCurtailmentLossesMember2021-01-012021-12-310000045876us-gaap:ReclassificationOutOfAccumulatedOtherComprehensiveIncomeMemberus-gaap:AccumulatedDefinedBenefitPlansAdjustmentMember2022-01-012022-12-310000045876us-gaap:ReclassificationOutOfAccumulatedOtherComprehensiveIncomeMemberus-gaap:AccumulatedDefinedBenefitPlansAdjustmentMember2021-01-012021-12-310000045876us-gaap:ReclassificationOutOfAccumulatedOtherComprehensiveIncomeMemberus-gaap:AccumulatedNetGainLossFromDesignatedOrQualifyingCashFlowHedgesMemberus-gaap:ForeignExchangeForwardMember2022-01-012022-12-310000045876us-gaap:ReclassificationOutOfAccumulatedOtherComprehensiveIncomeMemberus-gaap:AccumulatedNetGainLossFromDesignatedOrQualifyingCashFlowHedgesMemberus-gaap:ForeignExchangeForwardMember2021-01-012021-12-310000045876us-gaap:ReclassificationOutOfAccumulatedOtherComprehensiveIncomeMemberus-gaap:AccumulatedNetGainLossFromDesignatedOrQualifyingCashFlowHedgesMemberus-gaap:InterestRateSwapMember2022-01-012022-12-310000045876us-gaap:ReclassificationOutOfAccumulatedOtherComprehensiveIncomeMemberus-gaap:AccumulatedNetGainLossFromDesignatedOrQualifyingCashFlowHedgesMemberus-gaap:InterestRateSwapMember2021-01-012021-12-310000045876us-gaap:ReclassificationOutOfAccumulatedOtherComprehensiveIncomeMemberus-gaap:AccumulatedNetGainLossFromDesignatedOrQualifyingCashFlowHedgesMember2022-01-012022-12-310000045876us-gaap:ReclassificationOutOfAccumulatedOtherComprehensiveIncomeMemberus-gaap:AccumulatedNetGainLossFromDesignatedOrQualifyingCashFlowHedgesMember2021-01-012021-12-310000045876us-gaap:AllowanceForCreditLossMember2021-12-310000045876us-gaap:AllowanceForCreditLossMember2022-01-012022-12-310000045876us-gaap:AllowanceForCreditLossMember2022-12-310000045876us-gaap:ValuationAllowanceOfDeferredTaxAssetsMember2021-12-310000045876us-gaap:ValuationAllowanceOfDeferredTaxAssetsMember2022-01-012022-12-310000045876us-gaap:ValuationAllowanceOfDeferredTaxAssetsMember2022-12-310000045876us-gaap:AllowanceForCreditLossMember2020-12-310000045876us-gaap:AllowanceForCreditLossMember2021-01-012021-12-310000045876us-gaap:ValuationAllowanceOfDeferredTaxAssetsMember2020-12-310000045876us-gaap:ValuationAllowanceOfDeferredTaxAssetsMember2021-01-012021-12-310000045876us-gaap:AllowanceForCreditLossMember2019-12-310000045876us-gaap:AllowanceForCreditLossMember2020-01-012020-12-310000045876us-gaap:ValuationAllowanceOfDeferredTaxAssetsMember2019-12-310000045876us-gaap:ValuationAllowanceOfDeferredTaxAssetsMember2020-01-012020-12-310000045876hsc:ValuationAllowanceDeferredTaxAssetPensionAdjustmentsMember2022-01-012022-12-310000045876hsc:TaxRateChangeMember2022-01-012022-12-310000045876us-gaap:ValuationAllowanceTaxCreditCarryforwardMember2021-01-012021-12-310000045876hsc:ValuationAllowanceDeferredTaxAssetPensionAdjustmentsMember2021-01-012021-12-310000045876hsc:TaxRateChangeMember2021-01-012021-12-31
UNITED STATES
SECURITIES AND EXCHANGE COMMISSION
Washington, D.C. 20549
FORM 10-K
| | | | | |
| ☒ | ANNUAL REPORT PURSUANT TO SECTION 13 OR 15(d) OF THE SECURITIES EXCHANGE ACT OF 1934 |
For the fiscal year ended December 31, 2022
| | | | | |
| OR |
| ☐ | TRANSITION REPORT PURSUANT TO SECTION 13 OR 15(d) OF THE SECURITIES EXCHANGE ACT OF 1934 |
Commission File Number 001-03970
HARSCO CORPORATION
(Exact name of registrant as specified in its charter)
| | | | | | | | | | | |
| Delaware | 23-1483991 |
| (State or other jurisdiction of incorporation or organization) | (I.R.S. employer identification number) |
Two Logan Square
100-120 North 18th Street, 17th Floor, | Philadelphia, | Pennsylvania | 19103 |
| (Address of principal executive offices) | (Zip Code) |
Registrant's telephone number, including area code 267-857-8715
Securities registered pursuant to Section 12(b) of the Act:
| | | | | | | | | | | | | | |
| Title of each class | | Trading Symbol(s) | | Name of each exchange on which registered |
| Common stock, par value $1.25 per share | | HSC | | New York Stock Exchange |
Securities registered pursuant to Section 12(g) of the Act: NONE
Indicate by check mark if the registrant is a well-known seasoned issuer, as defined in Rule 405 of the Securities Act. Yes ý No o
Indicate by check mark if the registrant is not required to file reports pursuant to Section 13 or Section 15(d) of the Act. Yes o No ý
Indicate by check mark whether the registrant (1) has filed all reports required to be filed by Section 13 or 15(d) of the Securities Exchange Act of 1934 during the preceding 12 months (or for such shorter period that the registrant was required to file such reports), and (2) has been subject to such filing requirements for the past 90 days. Yes ý No o
Indicate by check mark whether the registrant has submitted electronically every Interactive Data File required to be submitted pursuant to Rule 405 of Regulation S-T (§ 232.405 of this chapter) during the preceding 12 months (or for such shorter period that the registrant was required to submit such files). Yes ý No o
Indicate by check mark whether the registrant is a large accelerated filer, an accelerated filer, a non-accelerated filer, a smaller reporting company, or an emerging growth company. See definitions of "large accelerated filer," "accelerated filer," "smaller reporting company," and "emerging growth company" in Rule 12b-2 of the Exchange Act.
| | | | | | | | | | | |
| Large accelerated filer | ý | Accelerated filer | o |
| Non-accelerated filer | o | Smaller reporting company | ☐ |
| | Emerging growth company | ☐ |
If an emerging growth company, indicate by check mark if the registrant has elected not to use the extended transition period for complying with any new or revised financial accounting standards provided pursuant to Section 13(a) of the Exchange Act. o
Indicate by check mark whether the registrant has filed a report on and attestation to its management's assessment of the effectiveness of its internal control over financial reporting under Section 404(b) of the Sarbanes-Oxley Act (15 U.S.C. 7262(b)) by the registered public accounting firm that prepared or issued its audit report. ☒
If securities are registered pursuant to Section 12(b) of the Act, indicate by check mark whether the financial statements of the registrant included in the filing reflect the correction of an error to previously issued financial statements. o
Indicate by check mark whether any of those error corrections are restatements that required a recovery analysis of incentive-based compensation received by any of the registrant's executive officers during the relevant recovery period pursuant to §240.10D-1(b). o
Indicate by check mark whether the registrant is a shell company (as defined in Rule 12b-2 of the Act). Yes ☐ No ý
The aggregate market value of the Company's voting stock held by non-affiliates of the Company as of June 30, 2022 was $564,759,344
Indicate the number of shares outstanding of each of the registrant's classes of common stock, as of the latest practicable date:
| | | | | | | | |
| Class | | Outstanding at February 28, 2023 |
| Common stock, par value $1.25 per share | | 79,502,316 |
DOCUMENTS INCORPORATED BY REFERENCE
Selected portions of the 2023 Proxy Statement are incorporated by reference into Part III of this Report.
HARSCO CORPORATION
FORM 10-K
INDEX
Glossary of Terms
Unless the context requires otherwise, "Harsco," the "Company," "we," "our," or "us" refers to Harsco Corporation on a consolidated basis. The Company may use other terms in this Annual Report on Form 10-K, including the Consolidated Financial Statements and Notes, which are defined below:
| | | | | | | | | |
| Term | | Description | |
| AOCI | | Accumulated Other Comprehensive Income (Loss) | |
| AR Facility | | Trade receivables securitization facility | |
| Board | | The Board of Directors of Harsco Corporation | |
| CCIRs | | Cross-currency interest rate swaps | |
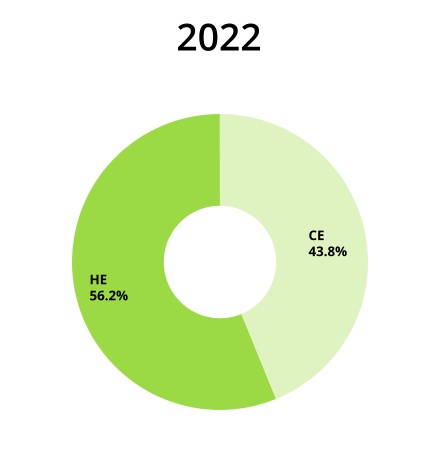
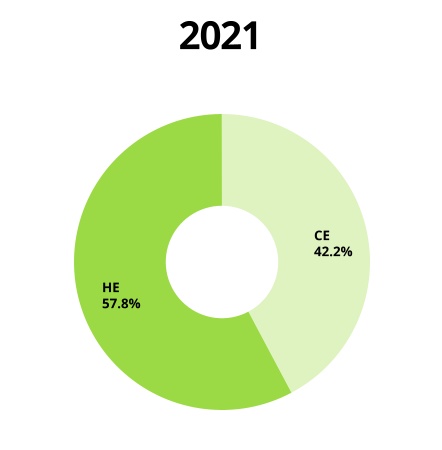
| CE | | Harsco Clean Earth Segment | |
| CERCLA | | Comprehensive Environmental Response, Compensation, and Liability Act of 1980 | |
| Clean Earth | | CEHI Acquisition Corporation and Subsidiaries | |
| Consolidated Adjusted EBITDA | | EBITDA as calculated in accordance with the Company's Credit Agreement | |
| COVID-19 | | The COVID-19 coronavirus pandemic | |
| Credit Agreement | | Credit Agreement governing the Senior Secured Credit Facilities | |
| DEA | | United States Drug Enforcement Administration | |
| Deutsche Bahn | | National railway company in Germany | |
| DTSC | | California Department of Toxic Substances Control | |
| EBITDA | | Earnings before interest, tax, depreciation and amortization | |
| ESOL | | Stericycle Environmental Solutions business | |
| FASB | | Financial Accounting Standards Board | |
| HE | | Harsco Environmental Segment | |
| | | |
| ICMS | | Type of value-added tax in Brazil | |
| IKG | | The former Harsco Industrial IKG business | |
| ISDA | | International Swaps and Derivatives Association | |
| LIBOR | | London Interbank Offered Rates | |
| MEPP | | Multiemployer pension plan | |
| New Term Loan | | $500 million term loan raised in March 2021 under the Senior Secured Credit Facilities, maturing on March 10, 2028 | |
| Network Rail | | Infrastructure manager for most of the railway in the U.K. | |
| NPPC | | Net periodic pension cost (income) | |
| OCI | | Other Comprehensive Income (Loss) | |
| PA DEP | | Pennsylvania Department of Environmental Protection | |
| | | |
| Rail | | The former Harsco Rail Segment | |
| RCRA | | Resource Conservation and Recovery Act | |
| Revolving Credit Facility | | $700 million multi-year revolving credit facility under the Senior Secured Credit Facilities | |
| ROU | | Right-of-use | |
| SBB | | Federal railway system of Switzerland | |
| SCE | | Supreme Council for Environment in Bahrain | |
| SEC | | Securities and Exchange Commission | |
| Senior Notes | | 5.75% notes due July 31, 2027 | |
| Senior Secured Credit Facilities | | Primary source of borrowings comprised of the New Term Loan and the Revolving Credit Facility | |
| SOFR | | Secured Overnight Financing Rate | |
| SPE | | The Company’s wholly-owned bankruptcy-remote special purpose entity, which is used in connection with the AR Facility. | |
| SPRA | | State Revenue Authorities from the State of São Paulo, Brazil | |
| Tax Act | | The U.S. Tax Cuts and Job Act of 2017 | |
| | | |
| | | |
| TSDF | | Treatment, storage, and disposal facilities | |
| U.S. GAAP | | Accounting principles generally accepted in the U.S. | |
PART I
Item 1. Business.
OUR COMPANY - OUR VISION
Harsco Corporation is a market-leading, global provider of environmental solutions for industrial and specialty waste streams. Our two reportable business segments are Harsco Environmental and Harsco Clean Earth and we are a single-thesis environmental solutions company that is a leader in the markets we serve.
We have worked in recent years to both transform our portfolio and strengthen our financial results, and we have invested to achieve these objectives and to grow the Company. These investments include targeted organic investments, as well as mergers and acquisitions, that have accelerated our business transformation. The purchases of Clean Earth and ESOL, along with the sale of our energy-linked business in 2019 and our plan to sell our Rail business, have been significant strategic steps for our Company. As a result, 100% of our revenues from continuing operations in 2022 and 2021 were generated from our two environmentally-focused segments. It also is important to note that these transactions have reduced the Company’s portfolio complexity and business cyclicality.
More broadly, we are committed to viewing every customer need through a sustainability lens. Our customers are increasingly expecting more customizable solutions that address environmental challenges within their industries. The Company is responding to this need by helping our customers build better businesses and, in a larger sense, a better environment. Our go-forward strategy is clear: to continue building a leading, global environmental solutions company.
SEGMENT INFORMATION
The Company’s current operations consist of two reportable business segments: Harsco Environmental and Harsco Clean Earth. Until the fourth quarter of 2021, the Company reported the Harsco Rail Segment. The Company previously announced its plan to sell the Harsco Rail business and the sale process is ongoing. Historical results for Harsco Rail are accounted for as discontinued operations.
The Company reports segment information using the “management approach,” based on the way management organizes and reports the segments within the enterprise for making operating decisions, assessing performance and allocating capital. The Company’s reporting segments are identified based upon differences in products, services, and markets served. Financial information concerning segments and international and domestic operations is included in Note 16, Information by Segment and Geographic Area, in Part II, Item 8, Financial Statements and Supplementary Data.
Our revenues by business segment are as follows, and a further description of the products and services offered through these business segments is presented below.
HARSCO ENVIRONMENTAL
BUSINESS OVERVIEW
Our Harsco Environmental Segment can trace its heritage back to the earliest efforts in industrial recycling and environmental resource management. Where others only saw waste and expense, we saw opportunity and value nearly 100 years ago. HE was founded upon market insights, grounded in respect for the environment, efficient use of resources, and optimism for the future.
Today, HE is a premier, global provider of environmental services and material processing to the global steel and metals industries. HE partners with its global customer base to deliver production-critical on-site operational support and resource recovery services, through management of our customers’ primary waste or byproduct streams. Our services support the metal manufacturing process, generating significant operational and financial efficiencies for our customers and allowing them to focus on their core steelmaking businesses.
HE serves approximately 70 mill services customers at approximately 150 sites in approximately 30 countries. Our diversified customer base includes the largest steel producers in the regions where we operate, serving a mix of mini-mill and integrated operations. In recent years, HE has greatly extended its reach, signing new services contracts in bellwether emerging markets like India, and further strengthening our footprint in the Americas and Europe. As a result, our global portfolio is balanced and diversified, with foreign currency risk partially mitigated by the fact that our operating costs and revenues are regularly denominated in local currencies.
In addition to providing critical services to our customers, we provide zero-waste solutions for relevant waste or byproduct streams - an important component of our value proposition. We repurpose processed material for alternative uses and / or convert this material into viable products to be sold in other markets via our ecoproducts™ offerings and capabilities. Our ecoproductsTM portfolio includes road and roofing materials, abrasives, agriculture products and aggregates. This expertise is increasingly important to our customers as environmental regulations increase and the marketplace grows more averse to landfilling waste.
CUSTOMERS AND SERVICE CONTRACTS
We offer our customers a suite of more than 30 services, and our on-site work is performed under long-term contracts. These contracts typically include fixed fees or minimum billings, which de-risk our investment during periods of economic weakness, and variable fees often linked to the amount of metal produced or waste processed at a site. Our variable fees under contracts are, importantly, not linked to steel prices. Additionally, in recent years, we have strengthened our contract terms and underwriting practices in an effort to earn a sufficient and timely return on our investments, as well as achieve other objectives. These measures, along with various improvement initiatives, have boosted our site portfolio results and driven more consistent performance across our operations.
Our contract renewal rates are high, with many customer relationships that span decades. Our largest customers today include ArcelorMittal, Gerdau, Tata Steel Group, Tisco, and Hebei Iron and Steel Company. We serve most of our major customers at multiple sites, often under multiple contracts. The length of our customer relationships reflects our value proposition. Customers choose the Company to (1) achieve operational and financial efficiencies; (2) concentrate their efforts on metal manufacturing and supporting end-market product demands; (3) gain access to process innovations and technologies developed by the Company; and (4) leverage our downstream product applications and know-how. HE had one customer in each of the past three years that provided more than 10% of this segment's revenues, again under many long-term contracts at multiple sites.
On December 31, 2022, the Company's service contracts had estimated future revenues of $3.3 billion at current production levels, an increase of $0.2 billion from 2021, excluding foreign currency translation impacts, which is driven by new and renewed contracts. These contract values provide the Company with a substantial base of anticipated long-term revenues. Approximately 20% of these revenues are expected to be recognized by December 31, 2023; approximately 41% of these revenues are expected to be recognized between January 1, 2024 and December 31, 2026; approximately 21% of these revenues are expected to be recognized between January 1, 2027 and December 31, 2029; and the remaining revenues are expected to be recognized thereafter. Estimated future revenues are exclusive of anticipated contract renewals, projected volume increases and ad-hoc services, as well as future revenues from roofing granules, abrasives products, roadmaking materials, additives and specialty recovery technology services.
ON-SITE SERVICES
HE provides a broad range of services, most of which address our customers’ environmental challenges. In total, these services reduce both landfill waste and the carbon footprint of our customers’ sites. In 2022, on-site services represented approximately 85% of HE’s revenues. A summary of our most significant services is as follows:
Resource Recovery, Metal Recycling and Slag Optimization
Resource recovery, metal recycling and slag optimization is the core component of our service offerings. We capture liquid steel waste or byproduct (slag) and transport it for cooling, treatment and conditioning. We then recover valuable metal from the waste-stream, which is returned to our customer in a form suitable for recycling through the customers’ manufacturing process. Finally, the residual non-metallic processed material is transformed into environmental products that create new and additional revenue streams.
Scrap Management
We manage customer scrap inventories and upgrade scrap by making it cleaner and denser. Improved scrap characteristics reduce electricity usage which, combined with the usage of recycled material, provides sustainability benefits to our customers.
Materials Handling and Logistics
We transport materials, including semi-finished and finished products, safely and efficiently for our customers. Our tracking technology also provides real-time analysis of material location, quantities and product quality.
Meltshop and Furnace Services
Meltshop and furnace services allow the molten metal production process to run smoothly and efficiently. These services include under-vessel cleaning and the removal of ladle slag (waste) and general melt shop debris.
ECOPRODUCTS™
HE creates value-added downstream products from industrial waste-streams. Our experience in manufacturing these products and successfully penetrating relevant end-markets is an important differentiator for the Company. These zero-waste solutions preserve our natural resources and reduce or eliminate landfill disposal. Ecoproducts in 2022 represented approximately 14% of HE’s revenues, and our major ecoproducts include the following:
Road Surfacing and Materials
Because of its natural shape and interlocking properties, steel slag holds many advantages when used in asphalt roadway surfaces, ranging from high skid resistance to better durability. The Company’s slag-based asphalt product, developed and sold as SteelPhalt™, maintains positive surface characteristics throughout the life of the road, allowing longer replacement intervals and lower maintenance costs. In 2022, SteelPhalt™ launched a carbon-negative asphalt product, using a renewable bio-based substance to bind the asphalt. This is an alternative to bitumen and reduces the product's carbon footprint. The Company also sells a slag aggregate that is a sustainable and cost-effective alternative to natural stone. This aggregate is often used as unbound road base material for secondary roads and sub-base material elsewhere.
Abrasives and Roofing Materials
Our Reed Minerals business is among the largest roofing granule suppliers in the U.S., partnering with the country's leading shingle manufacturers. Nearly 100 years ago, we pioneered a process of recycling coal combustion waste from power plants. Through the Company's proprietary process, we create premium quality roofing granules that are a critical raw material in asphalt roofing shingles.
Reed is also one of the largest U.S. manufacturers of abrasives, using coal, as well as copper and nickel slag, and crushed glass, for the surface preparation market. Our BLACK BEAUTY® and SURE/CUT™ abrasives are well-recognized within the industry and are used as blast material to remove paint, rust, and other coatings from surfaces, prior to applying a new finish.
Metallurgical Additives
The Company’s custom-designed steelmaking additives facilitate fluid slag formation in the steelmaking process, thus improving customer productivity and helping achieve the steel product specifications required for today’s premium applications.
Agriculture and Turf Products
We produce soil conditioners and fertilizers, principally from stainless steel slag that optimize crop yields and turf performance. CrossOver® and AgrowSil® products are our leading silicon, calcium and magnesium-based product brands, sold mainly in the Americas. These products are formulated to address nutrient deficiencies and toxicity issues in soil as well as to help plants withstand outside pressures and disease.
Cement Additives
Steel slag is naturally cementitious and commonly blended with other materials to produce environmentally-friendly, high-performing cement products. Cement made with slag aggregate can achieve permeabilities and other attributes that compare favorably to concrete made with conventional aggregates.
ALTEK GROUP
Altek is a UK-based manufacturer of market-leading products that enable aluminum producers and recyclers to manage and extract value from critical waste streams, reduce waste generation, and improve operating productivity. The cost-efficient recovery of metal and other valuable materials is increasingly important to the aluminum industry. Altek’s products and technologies address this challenge, and its AluSalt® innovation offers customers an innovative technology that converts salt slag waste into valuable products, addressing one of the largest environmental concerns within the aluminum market.
GROWTH STRATEGY
We have identified attractive opportunities that meet our return thresholds to expand our service portfolio, and our pipeline of opportunities remains significant. Additionally, we have initiated efforts to expand our downstream products business and plan to continue investing in innovation to support our business sustainability.
A summary of our key growth initiatives is as follows:
•Further Penetrate Existing Sites. Given our broad services capabilities, we see potential for add-on services contracts at existing sites.
•New Sites. We continue to pursue new services contracts in certain markets, particularly in emerging economies where out-sourcing opportunities are significant because of increased environmental awareness or where steel consumption (production) is set to grow.
•Investment in Downstream Products. We see opportunities to expand certain products businesses, and our investment in new SteelPhalt™ (road materials) plants in Europe is a recent example.
•Innovation. We are at the forefront of innovation in our industry. Our innovation programs are specifically focused on helping our customers solve their most pressing environmental challenges amid ever-increasing regulation. This initiative includes developing new customer or industry solutions, either in-house or externally, and expanding the usage of technologies that already exist within our business.
COMPETITORS
HE competes principally with a small number of privately-held businesses for services outsourced by customers on a global basis. We also compete with numerous smaller, privately-held businesses in each of our regional markets and, to some degree, customers that may decide to perform certain services themselves.
We believe that HE differentiates itself from its competition through innovative technologies that support our service offerings, and through the operating expertise developed by sharing best practices across our global portfolio. Our safety practices and performance also support our business, as do our long-standing relationships and our downstream product solutions.
HARSCO CLEAN EARTH
BUSINESS OVERVIEW
Our Harsco Clean Earth segment provides specialty waste processing, treatment, recycling, and beneficial reuse solutions for customers in the industrial, retail, healthcare, and construction industries across a variety of waste needs, including hazardous, non-hazardous, and contaminated soils and dredged materials. CE currently operates 18 RCRA Part B permitted TSDFs, wastewater treatment facilities and supporting 10-day transfer facilities across the U.S., serving more than 90,000 customer locations, while utilizing a fleet of over 700 vehicles. It also holds a portfolio of more than 500 critically-important permits, and the waste handled by CE is recycled or beneficially reused.
Specialty-waste permits have considerable value, and CE is positioned to take advantage of increasingly stringent regulations on the handling of this waste. These dynamics provide recurring revenues and support attractive underlying growth. CE also operates in a fragmented market where acquisition opportunities are likely to develop. As a result, we see CE as a platform for growth as we continue to expand our focus as an environmental solutions company.
CUSTOMERS
CE provides regulatory-compliant solutions with a high quality of customer service to a diverse set of customers. These customers include waste generators in numerous industries, including chemicals, power, aerospace, medical, retail and metals, as well as integrated waste companies and brokers. CE also services federal, state and local governments as well as developers linked to large infrastructure and redevelopment projects. CE had one customer in 2022 and 2021 that provided more than 10% of this segment's revenues.
LINES OF BUSINESS
Hazardous Waste
CE provides testing, tracking, processing, recycling, and disposal services for hazardous waste and it operates 18 RCRA Part B permitted TSDFs and several wastewater processing permits that enable the Company to process a variety of complex hazardous wastes, consisting of toxic, reactive and flammable materials such as industrial wastewater, manufacturing sludge, oily-mixtures, chemicals, pesticides, asbestos, pharmaceutical waste, and landfill leachate with per- and polyfluoroalkyl substances ("PFAS"). The remaining facilities handle a limited number of other wastes, including electronics, batteries and light bulbs. These operations possess unique and differentiated processing technologies, such as applications for aerosol can, medical waste recycling, fuel blending, household hazardous waste and lead contaminated soils. In 2022, this line of business represented approximately 82% of CE’s revenues.
Soil and Dredged Materials
CE processes approximately 3.2 million tons per year of contaminated soil and 0.4 million cubic yards of dredged material at sixteen locations, which includes fixed-based locations and mobile plants. These soils are contaminated with heavy metals, PCBs, pesticides, PFAS or other chemicals, and the related clean-up work is often the result of infrastructure improvements, private redevelopment, industrial site remediation and/or underground storage tank removal. CE treats and recycles this soil through various processes, after which the material is suitable for beneficial reuse as construction fill material or landfill capping. CE also operates one facility to treat dredged material, the sediment accumulated at the bottom of waterways that is removed for environmental (clean-up) or maintenance (maintain depth) purposes. After treatment, these materials are also beneficially reused as fill material. In 2022, this line of business represented approximately 18% of CE’s revenues.
OPERATIONS AND PERMITS
CE provides a suite of regulation-compliant treatment solutions for hazardous and non-hazardous wastes that can be tailored to
meet customer-specific requirements. The solutions include soil remediation and recycling including thermal desorption, dredged material stabilization and beneficial reuse, hazardous and non-hazardous waste stabilization and solidification, fuel blending, management and recycling, battery and electronic waste recycling, and secure electronic data destruction.
Additionally, CE holds a portfolio of more than 500 process, treatment and operating permits, including the ones mentioned above. This permit portfolio is difficult to duplicate, making these permits valuable and critically-important assets in this heavily-regulated industry. CE’s ability to secure new permits or permit modifications for new waste streams or processes in the future remains an important growth lever for the business.
GROWTH
Favorable underlying market dynamics, driven by increased regulation and a growing list of contaminants and hazardous materials, and investment are anticipated to fuel CE’s growth in the coming years. We also anticipate introducing newer technologies into the market with new treatment solutions and expansion of existing technologies, including permit modifications and applications in new geographic markets. Lastly, CE is well-positioned to benefit from a positive outlook for maintenance and environmental dredging, as well as emerging PFAS markets, and over time, we expect acquisitions to be an important growth lever for CE. CE operates in a very fragmented, regionally-driven market, and as a result, we expect to pursue acquisition opportunities that may provide increased scale and/or new capabilities, along with synergies and attractive financial returns to the Company.
COMPETITION
Given the fragmented nature of the specialty waste industry, CE competes with numerous companies. Our larger peers include Clean Harbors, Republic Services, which acquired U.S. Ecology in 2022, Veolia and Heritage Environmental Services within the hazardous materials line of business and GFL Environmental and Impact Environmental within the soil and dredged materials market. CE differentiates itself from competitors through service reliability and responsiveness, its diverse operating capabilities and regulatory compliant solutions, and the value it provides through providing environmentally superior solutions relative to other disposal alternatives in the regions where it operates.
ENVIRONMENTAL, SOCIAL AND GOVERNANCE ("ESG")
We are committed to building a global, market-leading environmental solutions company that preserves our environment, adheres to ethical and responsible business practices, and supports our customers as they do the same. ESG is central to our business strategy and operations - our employees are inspired to develop innovative products and services that positively impact the environment and support the Company’s growth.
Our ESG focus areas include:
•Innovative Solutions. We help our customers solve their most pressing sustainability challenges by providing services and products that meet their environmental and business objectives. We deliver solutions for treating, recycling and repurposing materials across a wide range of customers, industries, and industrial by-products and specialty and hazardous wastes, including steel, aluminum, soils, water, electronics, fuel, batteries and more.
•Thriving Environment. We strive to reduce or eliminate our global environmental impacts by providing the highest-quality environmental management in our operations and improving our environmental footprint through continuous improvement efforts. Our Corporate Environmental Policy outlines our environmental stewardship commitments. We also expect all third parties that do business with the Company to share our environmental standards.
•Safe Workplaces. Safety is of paramount importance in everything we do - our goal, each and every day, is that our people return home unharmed. We have built a best-in-class safety culture, and our cross-divisional Executive Safety Committee is responsible for implementing best practices with a goal of eliminating all incidents within our business activities.
•Inspired People. We invest in the career development of our employees, knowing that diversity of perspective, backgrounds and talents strengthens our business. We are also committed to building strong, sustainable communities where we live and work.
•Excellence in Corporate Governance. Excellence in corporate governance is fundamental to how we manage and operate the Company, from our everyday business to ESG issues. Our Code of Conduct and our Core Values lie at the center of all we do. Through these policies and guidelines, we have equipped every employee with the tools, training, and guidance to always do the right things, the right way. Oversight of our ESG practices is provided by the Governance Committee of the Company’s Board.
Further details on our ESG initiatives and accomplishments can be found in our latest ESG Report. This report, published in October 2022, is our most comprehensive sustainability report to date and can be found on the Company’s website (www.harsco.com/sustainability) along with other related policies. Unless specifically stated herein, documents and information on the Company's website are not incorporated by reference into this document.
HARSCO BUSINESS SYSTEM ("HBS")
Our HBS is a shared set of processes that reflect and support our corporate strategy. These repeatable and replicable standards and practices are the hallmark of a high-performing company. There is intrinsic value in a common language, and a defined business system does away, in large part, with ambiguity about what constitutes success. The elements of our HBS are:
Environmental, Health & Safety; Continuous Improvement; Talent Development; Strategic Planning; and Acquisitions & Divestitures.
ACQUISITIONS AND DIVESTITURES
Given the Company’s evolution to a single-thesis environmental solutions company, acquisitions and divestitures have been an important element of our business strategy. These actions support the Company’s growth ambitions, while reducing business cyclicality and portfolio complexity.
The Company is in the process of selling the Rail business with a sale expected to occur in 2023. The intention to sell the business was first announced in the fourth quarter of 2021. The sales process was delayed in 2022 due to certain macroeconomic conditions, including rising interest rates. Rail is reclassified as held for sale and reported as discontinued operations for all years presented.
In June 2019, the Company acquired Clean Earth which provided the Company entry into the specialty waste market. In April 2020, the Company acquired ESOL, an established waste transportation, processing and services provider with a comprehensive portfolio of disposal solutions for customers across industrial, retail and healthcare markets. The acquisition of ESOL furthered our transformation into a market-leading, single-thesis environmental solutions platform. Clean Earth and ESOL combined to form Harsco Clean Earth.
SEASONALITY
The Company's businesses can be subject to seasonal fluctuations. Demand for services and solutions provided by HE are subject to seasonal changes related to weather conditions, inventory management through the steel-industry supply chain, and customer operating outages. The timing of these impacts varies by region, however, overall customer demand for HE across its global footprint tend to be strongest in the second quarter and third quarter of each year. CE, meanwhile, provides services that can also fluctuate seasonally with weather, construction activity, industrial production, retail spending and municipal waste collection programs. As a result, demand for CE services tends to be weakest in the first and fourth quarters of each year.
Due to these factors, the Company’s revenues and earnings are usually higher during the second and third quarters of each year relative to the first and fourth quarter of the year. Additionally, the Company’s cash flows are also influenced by seasonality. The Company’s cash flow from operations has historically been higher in the second half of the year, compared with the first half, due to working capital management, receivable collections during the fourth quarter as a result of higher revenues in preceding quarters and the timing of certain cash payments in the first half of the year, including for incentive compensation and pension contributions.
ENVIRONMENTAL COMPLIANCE
The Company is subject to various environmental regulations within its global operations, and the scope of relevant environmental regulation expanded following the Company’s acquisition of Clean Earth and ESOL in 2019 and 2020, respectively. CE operates within an industry that is subject to stringent environmental regulations by federal, state and local authorities, which regulate the treatment and disposal of specialty waste. Facility and operating permits, or approvals from these authorities, are required to maintain operations. The nature of these permits varies by jurisdiction and are based on the activities at a particular site. These permits are generally difficult to obtain. This dynamic, along with increased regulation on the treatment and disposal of specialty waste, is beneficial to our CE business.
The most significant U.S. federal environmental regulation that impacts our business is the RCRA. RCRA created a cradle-to-grave system which governs the transportation, treatment, storage and disposal of hazardous waste. Under RCRA, each hazardous waste processing facility must maintain a RCRA permit and comply with defined operating practices. This legislation is administered by the U.S. Environmental Protection Agency ("EPA"), although its authority may be delegated to a State EPA with similar or more stringent environmental standards.
The Company is also subject to air and water quality control legislation in the U.S. and in foreign countries where the Company operates. The Clean Water Act regulates the discharge of pollutants into waterways and sewers in the U.S, and, where necessary, we obtain and must comply with permits to discharge wastewater from our facilities. Similarly, the Clean Air Act in the U.S. controls emissions of pollutants into the air and requires permits for certain emissions.
The Company regards compliance with all applicable environmental regulations as critical to its business. Historically, the Company has been able to renew and retain all required permits to maintain its operations, and it has not experienced substantial difficulty complying with relevant environmental regulations. The Company also does not anticipate making any material capital expenditures to comply with, or improve, environmental performance in the future. While environmental regulations may increase or expand, we cannot predict the extent of this future environmental regulation, its related costs and the overall effect on the Company’s business.
HUMAN CAPITAL RESOURCES
As of December 31, 2022, we had more than 12,000 employees, excluding contingent workers, in 35 countries. The majority of these employees are represented by labor unions, through almost 100 collective bargaining agreements.
Our business relies on our ability to attract and retain talented employees. To attract and retain talent, we strive to create a diverse, inclusive and supportive workplace while providing opportunities for our employees to grow and develop in their careers.
Corporate Values
Across cultures, time zones and organizational lines, our values are the link that connects us all. As the cornerstone to our shared Company culture, these values reflect our overarching direction and purpose as a business:
•Employee Care - We are committed to safe, appealing work environments, market-competitive benefits programs and investment in personal development. We must treat our people as we would like to be treated ourselves, and we must attract and retain the very best talent throughout our organization.
•Passion for Winning - We are passionate about winning through creating exceptional value for our employees, customers and shareholders. Excellence is not an act, but a habit.
•Satisfy the Customer - We are engaged in the relentless pursuit of customer satisfaction by listening to the customers' needs, and consistently delivering value that exceeds their expectations.
•Inclusion - We strive to create an environment where all people are actively included. Our diverse global workforce is our most valuable asset. We must foster a climate in which every employee is encouraged to engage and dedicate his or her talents and experiences.
•Integrity - We demonstrate an uncompromising commitment to ethical principles. We act ethically and in the interest of the customers we serve. We treat others with dignity and respect, and value honesty above all else.
•Respect - We respect all individuals and their contributions. Harsco will not tolerate discrimination or harassment of any kind. Our employees have a right to a safe, respectful workplace. Our management has a mandate to provide it.
Health, Safety and Wellness
We are committed to the health, safety and wellness of our employees. We are passionate about establishing a culture of ownership and accountability for which all employees are responsible for safety. We evaluate our safety processes, programs and procedures to continuously improve our safety performance. We provide our employees and their families with access to a variety of health and wellness programs globally.
Compensation and Benefits
We provide competitive compensation and benefits programs for our employees. In addition to salaries, these programs, which vary by employee level and by the country where the employees are located, may include, among other items, bonuses, stock awards, retirement programs, health savings and flexible spending accounts, paid-time off, paid parental leave, disability programs, flexible work schedules and employee assistance programs.
Diversity, Equity, Engagement and Inclusion
Diversity, equity, engagement, and inclusion (“DEE&I”) is an integral part of the Company’s values and processes that support recruitment, hiring, training, retention and advancement. In an effort to advance the Company’s commitment to DEE&I, the Company has taken the following initiatives:
•A DEE&I Council was previously established, which is co-chaired by our CEO and Senior Vice President & Chief Human Resources Officer and is comprised of 10 cross-functional leaders from each of our business units. The DEE&I Council is accountable for directly shaping and promoting the Company’s DEE&I strategy and key initiatives, focusing on improving employee retention.
•In 2022, the Company's Employee Resource Group, Women of Harsco, whose mission is to promote the advancement of women across the Company through personal and professional development, mentorship, and empowerment, expanded its reach to India, piloted a mentorship program that ensures effective mentor/mentee pairing, initiated a speaker series to spark discussions around leadership and tips for success and began community outreach efforts to promote career exploration for girls and young women.
•Continued to include DEE&I focused goals in key management's incentive compensation program.
Talent Development and Succession
We believe our development processes ensure continuity of leadership over the long term. Thus, annually we undertake a talent review process to access the organizational capabilities required to execute our strategy, create tailored development plans and understand the depth of our succession preparedness. Our objective is to build the readiness of various talent pools within the organization in order to select and promote key talent. In addition, we continue to invest in our employees through technical training, professional development and skills upgrade throughout the year.
CORPORATE INFORMATION
The Company was incorporated in 1956. The Company’s global headquarters and executive offices are located at Two Logan Square, 100-120 North 18th Street, 17th Floor in Philadelphia, PA, and its main telephone number is 267-857-8715.
The Company’s Annual Reports on Form 10-K, Quarterly Reports on Form 10-Q, Current Reports on Form 8-K and any amendments to such reports filed with or furnished to the SEC under Sections 13(a) or 15(d) of the Securities Exchange Act of 1934, as amended, are available on the Company’s website under "Financial Information" at investors.harsco.com as soon as reasonably practicable after such reports are electronically filed with the SEC. Additionally, the SEC maintains a website that contains reports, proxy and other information regarding issuers that electronically file with the SEC at www.sec.gov.
AVAILABLE INFORMATION
Our website address is www.harsco.com. Copies of our key Corporate governance documents, such as our Code of Business Conduct, as well as our Board's composition and structure can be viewed on our website under the “Corporate Governance” subheading of the “Our Company” page. Additionally, further information on our Corporate Sustainability initiatives also can be accessed through the “Our Company” page. The information posted on the Company’s website is not incorporated into the Company’s SEC filings.
Item 1A. Risk Factors.
Set forth below are risks and uncertainties that could materially and adversely affect the Company's results of operations, financial condition, liquidity and cash flows. The following discussion of risks contains forward-looking statements, and the risks set forth below are not the only risks faced by the Company. The Company's business operations could also be affected by other factors not presently known to the Company or factors that the Company currently does not consider to be material.
STRATEGIC AND OPERATIONAL RISKS
We may be unable to complete a transaction to divest our Rail division on favorable terms or at all and our pursuit of a divestiture could adversely affect our businesses, results of operations and financial condition.
We previously announced that we intend to divest our Rail division. Our announcement, and our conducting, of a divestiture process for our Rail division involves various risks and uncertainties, including changes in economic conditions, the risk that we may be unsuccessful in identifying an acquirer for the division, unable to enter into an agreement for a transaction and any agreement that we may enter into may not be on favorable terms and/or may not be completed due to regulatory or other factors. Moreover, the announcement and conduct of the divestiture process could cause disruptions in, and create uncertainty surrounding, our Rail division, including affecting the Rail division’s relationships with its existing and future customers, suppliers and employees, which could have an adverse effect on the Rail division’s operations and financial condition, potentially making it more difficult to successfully complete a transaction on favorable terms. If we are unable to complete a divestiture of our Rail division or we complete a transaction on unfavorable terms, we may suffer negative publicity, our Rail and other businesses may suffer, our results of operations, financial condition or cash flows may be adversely affected and the market value of our shares may fall. In addition, the divestiture process may require commitments of significant time and resources on the part of management. As a result, the divestiture process may divert management’s attention from overseeing and exploring opportunities that may be beneficial to our other businesses and operations and, as such, adversely affect our other businesses and operations and harm our results of operations, financial condition or cash flows and the market value of our shares.
If the Harsco Clean Earth Segment fails to comply with applicable environmental laws and regulations, its business could be adversely affected.
The regulatory framework governing the Harsco Clean Earth Segment's business is extensive. The Company could be held liable if its operations cause contamination of air, groundwater or soil or expose its employees or the public to contamination. The Company may be held liable for damage caused by conditions that existed before it acquired the assets, business or operations involved. Also, it may be liable if it generates, transports or arranges for the transportation, disposal or treatment of hazardous substances that cause environmental contamination at facilities operated by others, or if a predecessor generated, transported, or made such arrangements and the Company is a successor. Liability for environmental damage could have a material adverse effect on the Company’s financial condition, results of operations and cash flows. The Company may also be held liable for the mishandling of waste streams resulting from the misrepresentations by a customer as to the nature of such waste streams.
Stringent regulations of federal, state and local governments have a substantial impact on the Harsco Clean Earth Segment’s transportation, treatment, storage, disposal and beneficial use activities. Many complex laws, rules, orders and regulatory interpretations govern environmental protection, health, safety, noise, visual impact, odor, land use, zoning, transportation and related matters. The Company also may be subject to laws concerning the protection of certain marine and bird species, their habitats, and wetlands. It may incur substantial costs in order to conduct its operations in compliance with these environmental laws and regulations. Changes in environmental laws or regulations or changes in the enforcement or interpretation of existing laws, regulations or permitted activities may require the Company to make significant capital or other expenditures, to modify existing operating licenses or permits, or obtain additional approvals or limit operations. New environmental laws or regulations that raise compliance standards or require changes in operating practices or technology may impose significant costs and/or limit the Company’s operations.
The Harsco Clean Earth Segment’s revenue is primarily generated as a result of requirements imposed on its customers under federal, state and local laws and regulations to protect public health and the environment. If requirements to comply with laws and regulations governing management of contaminated soils, dredge material, and hazardous wastes were relaxed or less vigorously enforced at the federal, state and local levels, demand for the Harsco Clean Earth Segment’s services could materially decrease and the Company's revenues and earnings could be reduced.
If the Harsco Clean Earth Segment is unable to obtain, renew, or maintain compliance with its operating permits or license agreements with regulatory bodies, its business would be adversely affected.
The Harsco Clean Earth Segment's facilities operate using permits and licenses issued by various regulatory bodies at various local, state and federal government levels. Failure to obtain permits and licenses necessary to operate these facilities on a timely basis or failure to renew or maintain compliance with its permits, licenses and site lease agreements on a timely basis could prevent or restrict the Company's ability to provide certain services, resulting in a material adverse effect on its business. There can be no assurance that the Company will continue to be successful in obtaining timely permit or license applications approval, maintaining compliance with its permits, licenses and lease agreements and obtaining timely license renewals.
The waste management industry, in which the Harsco Clean Earth Segment is a participant, is subject to various economic, business, and regulatory risks.
The future operating results of the Harsco Clean Earth Segment may be affected by such factors as its ability to utilize its facilities and workforce profitably in the face of intense price competition, maintain or increase market share during periods of economic contraction or industry consolidation, realize benefits from cost reduction programs, invest in new technologies for treatment of various waste streams, generate incremental volumes of waste to be handled through the Harsco Clean Earth Segment’s facilities from existing and acquired sales offices and service centers, appropriately contract with end disposal sites for the necessary volumes of waste, obtain sufficient volumes of waste at prices which produce revenue sufficient to offset the operating costs of its facilities and minimize downtime and disruptions of operations.
Outdoor construction, which may be limited due to unfavorable weather, and dredging, which may be limited due to environmental restrictions in certain waterways in the Northeastern United States, can be cyclical in nature. If those cyclical industries slow significantly, the business that the Harsco Clean Earth Segment receives from them would likely decrease.
The seasonality of the Company's business may cause quarterly results to fluctuate.
The majority of the Company's cash flows provided by operations has historically been generated in the second half of the year. This is a result of normally higher income during the second and third quarters of the year, as the Company's business tends to follow seasonal patterns. If the Company is unable to successfully manage the cash flow and other effects of seasonality on the business, its results of operations may suffer.
Customer concentration and related credit and commercial risks, together with the long-term nature of contracts, may adversely impact the Company's results of operations, financial condition and cash flows.
For the year ended December 31, 2022, the Company’s top five customers in the Harsco Environmental Segment accounted for approximately 31% of revenues in that Segment and 17% of the Company’s consolidated revenues. For the year ended December 31, 2022, the Company’s top five customers in the Clean Earth Segment accounted for approximately 29% of the revenues in that Segment and 13% of the Company’s consolidated revenues. The Company routinely enters into contracts with its top customers of varying length and scope. Disagreements between the parties can arise as a result of the scope, nature and varying degree of relationship between the Company and these customers and can result in disagreements between the Company and a customer that could impact multiple regions within the Company’s business.
The Clean Earth Segment may enter into a long-term contract with a customer covering multiple regions in the United States. A dispute with a customer in one region in the United States could impact the Company’s revenues related to that customer in another region. The Harsco Environmental Segment may incur capital expenditures or other costs at the beginning of a long-term contract that it expects to recoup through the life of the contract. Some of these contracts provide for advance payments to assist the Company in covering these costs and expenses. A dispute with a customer during the life of a long-term contract could impact the ability of the Company to receive payments or otherwise recoup incurred costs and expenses.
Finally, both the Harsco Environmental Segment and the Harsco Clean Earth Segment have several large customers and, if a large customer were to experience financial difficulty or file for bankruptcy or receivership protection, it could adversely impact the Company's results of operations, cash flows and asset valuations.
The Company may lose customers or be required to maintain or reduce prices as a result of competition.
The industries in which the Company operates are highly competitive. Some examples are as follows:
•The Harsco Environmental Segment is sustained mainly through contract renewals and new contract signings. The Company may be unable to renew contracts at historical price levels or to obtain additional contracts at historical rates as a result of competition. If the Company is unable to renew its contracts at the historical rates or renewals are made at reduced prices, or if its customers terminate their contracts, revenue and results of operations may decline.
•Like the Harsco Environmental Segment, the Harsco Clean Earth Segment is sustained primarily through contract renewals and new contract signings. The Harsco Clean Earth Segment faces competition from companies with greater resources than the Company, with closer geographic proximity to waste sites, with captive end disposal assets, and who may provide service offerings that we do not provide. In order to compete, the Company may be required to reduce price levels below historical price levels or obtain additional contracts at rates lower than historical rates.
•The Rail business competes with companies that manufacture similar products both internationally and domestically. Certain international competitors export their products into the U.S. and sell them at lower prices, which can be the result of lower labor costs and government subsidies for exports. In addition, certain competitors may from time to time sell their products below their cost of production in an attempt to increase their market share. Such practices may limit the prices the Rail business can charge for its products and services. Unfavorable foreign exchange rates can also adversely impact the Rail business’s ability to match the prices charged by international competitors. If the Rail business is unable to match the prices charged by competitors, it may lose customers.
Higher than expected claims under insurance policies, under which the Company retains a portion of the risk, could adversely impact results of operations and cash flows.
The Company retains a significant portion of the risk for property, workers' compensation, U.K. employers' liability, automobile and general and product liability losses. Reserves have been recorded that reflect the undiscounted estimated liabilities for ultimate losses, including claims incurred but not reported. Inherent in these estimates are assumptions that are based on the Company's history of claims and losses, a detailed analysis of existing claims with respect to potential value, and current legal and legislative trends. If actual claims are higher than those projected by management, an increase to the Company's insurance reserves may be required and would be recorded as a charge to income in the period the need for the change was determined.
The Harsco Clean Earth Segment's insurance policies do not cover all losses, costs, or liabilities that it may experience.
The Harsco Clean Earth Segment maintains insurance coverage, but these policies do not cover all of its potential losses, costs, or liabilities. The Company could suffer losses for uninsurable or uninsured risks or in amounts in excess of its existing insurance coverage, which would significantly affect its financial performance. For example, the Company's pollution legal liability insurance excludes costs related to fines, penalties, or assessments. The Company's insurance policies also have deductibles and self-retention limits that could expose it to significant financial expense. The Company’s ability to obtain and maintain adequate insurance may be affected by conditions in the insurance market over which it has no control. The occurrence of an event that is not fully covered by insurance could have a material adverse effect on the Company’s business, financial condition, and results of operations. In addition, the Harsco Clean Earth Segment’s business requires that it maintain various types of insurance. If such insurance is not available or not available on economically acceptable terms, the Clean Earth Segment’s and our businesses could be materially and adversely affected.
Increases in purchase prices (or decreases in selling prices) or availability of steel or other materials and commodities may affect the Company's profitability.
The profitability of the Company's products and services may be affected by changing purchase prices of raw material, including steel and other materials and commodities, supplier costs or own labor costs. If raw material costs, supplier or labor costs increase and the costs cannot be transferred to the Company's customers, results of operations would be adversely affected. Additionally, decreased availability of steel or other materials or services could affect the Company's ability to provide products and services in a timely manner. If the Company cannot obtain the necessary raw materials, then revenues and cash flows could be adversely affected.
Certain services performed by the Harsco Environmental Segment result in the recovery, processing and sale of recovered metals and minerals and other high-value metal byproducts to its customers. The selling price of the byproducts material is market-based and varies based upon the current fair value of its components. Therefore, the revenue amounts generated from the sale of such byproducts material vary based upon the fair value of the commodity components being sold.
The success of the Company's strategic ventures depends on the satisfactory performance by strategic venture partners of their strategic venture obligations.
The Company enters into various strategic ventures as part of its strategic growth initiatives as well as to comply with local laws. Differences in opinions or views between strategic venture partners can result in delayed decision-making or failure to agree on material issues which could adversely affect the business and operations of the venture. From time to time, in order to establish or preserve a relationship, or to better ensure venture success, the Company may accept risks or responsibilities for the strategic venture that are not necessarily proportionate with the reward it expects to receive. The success of these and other strategic ventures also depends, in large part, on the satisfactory performance by the Company's strategic venture partners of their strategic venture obligations, including their obligation to commit working capital, equity or credit support as required by the strategic venture and to support their indemnification and other contractual obligations.
If the Company's strategic venture partners fail to satisfactorily perform their strategic venture obligations as a result of financial or other difficulties, the strategic venture may be unable to adequately perform or deliver its contracted services. Under these circumstances, the Company may be required to make additional investments and provide additional services to ensure the adequate performance and delivery of the contracted services. These additional obligations could result in reduced profits or, in some cases, increased liabilities or significant losses for the Company with respect to the strategic venture. In addition, although the Company generally performs due diligence with regard to potential strategic partners or ventures, a failure by a strategic venture partner to comply with applicable laws, rules or regulations could negatively impact its business and, in the case of government contracts, could result in fines, penalties, suspension or even debarment. Unexpected strategic venture developments could have a material adverse effect on results of operations, financial condition and cash flows.
If the Company fails to maintain safe worksites, it may be subject to significant operating risks and hazards.
The Company operates at facilities that may be inherently dangerous workplaces. The Harsco Clean Earth Segment operates facilities that accept, process and/or treat materials provided by its customers. The Harsco Environmental Segment has operations at customers' steel producing sites, which often times involve extreme conditions. If serious accidents or fatalities occur or its safety record was to deteriorate, it may be ineligible to bid on certain work, and existing service arrangements could be terminated. Further, regulatory changes implemented by the Occupational Safety and Health Administration, or similar foreign agencies, could impose additional costs on the Company. Adverse experience with hazards and claims could result in liabilities caused by, among other things, injury or death to persons, which could have a negative effect on the Company’s reputation with its existing or potential new customers and its prospects for future business.
The Company maintains a workforce based upon current and anticipated workload. If the Company does not receive future contract awards or if these awards are delayed, significant cost may result that could have a material adverse effect on results of operations, financial condition, liquidity and cash flows.
The Company's estimates of future performance depend on, among other matters, whether and when the Company will receive certain new contract awards, including the extent to which the Company utilizes its workforce. The rate at which the Company utilizes its workforce is impacted by a variety of factors, including:
•the ability to manage attrition;
•the ability to forecast the need for services, which allows the Company to maintain an appropriately sized workforce;
•the ability to transition employees from completed projects to new projects or between segments; and
•the need to devote resources to non-revenue generating activities such as training or business development.
While the Company's estimates are based upon good faith judgment, these estimates can be unreliable and may frequently change based on newly available information. In the case of large-scale domestic and international projects where timing is often uncertain, it is particularly difficult to predict whether and when the Company will receive a contract award. The uncertainty of contract award timing can present difficulties in matching the Company's workforce size with contract needs. If an expected contract award is delayed or not received, the Company could incur cost resulting from reductions in staff or redundancy of facilities or equipment that could have a material adverse effect on results of operations, financial condition, liquidity and cash flows.
Union disputes or other labor matters could adversely affect the Company's operations and financial results.
A significant portion of the Company's employees are represented by labor unions in a number of countries under various collective bargaining agreements with varying durations and expiration dates. There can be no assurance that any current or future issues with the Company's employees will be resolved or that the Company will not encounter future strikes, work stoppages or other types of conflicts with labor unions or the Company's employees. The Company may not be able to satisfactorily renegotiate collective bargaining agreements in the U.S. and other countries when they expire. If the Company fails to renegotiate existing collective bargaining agreements, the Company could encounter strikes or work stoppages or other types of conflicts with labor unions. In addition, existing collective bargaining agreements may not prevent a strike or work stoppage at the Company's facilities in the future. The Company may also be subject to general country strikes or work stoppages unrelated to the Company's business or collective bargaining agreements. A work stoppage or other limitations on production at the Company's facilities for any reason could have an adverse effect on the Company's business, results of operations, financial condition and cash flows. In addition, many of the Company's customers and suppliers have unionized work forces, and may experience a lack of qualified employees. Strikes or work stoppages, as well as labor shortages, experienced by the Company's customers or suppliers could have an adverse effect on the Company's business and supply chain, results of operations and financial condition.
The Company's intellectual property portfolio may not prevent competitors from independently developing similar or duplicative products and services.
The Company's patents and other intellectual property may not prevent competitors from independently developing or selling similar or duplicative products and services, and there can be no assurance that the resources invested by the Company to protect the Company's intellectual property will be sufficient or that the Company's intellectual property portfolio will adequately deter misappropriation or improper use of the Company's technology. The Company could also face competition in some countries where the Company has not protected its intellectual property portfolio. The Company may also face attempts to gain unauthorized access to the Company's information technology systems or products for the purpose of improperly acquiring trade secrets or confidential business information. The theft or unauthorized use or publication of the Company's trade secrets and other confidential business information as a result of such an incident could adversely affect the Company's competitive position and the value of the Company's investment in research and development. The Company may be unable to secure or retain ownership or rights to use data in certain software analytics or services offerings. In addition, the Company may be the target of aggressive and opportunistic enforcement of patents by third parties, including non-practicing entities. Regardless of the merit of such claims, responding to infringement claims can be expensive and time-consuming. If the Company is found to infringe any third-party rights, the Company could be required to pay substantial damages or could be enjoined from offering some of the Company's products and services. Also, there can be no assurances that the Company will be able to obtain or renew from third parties the licenses needed in the future, and there is no assurance that such licenses can be obtained on reasonable terms.
Increased information technology security threats and more sophisticated computer crime pose a risk to the Company's and its vendors, systems, networks, products and services.
The Company relies upon information technology systems and networks in connection with a variety of business activities, some of which are managed by third parties (which we refer to collectively as our “associated third parties”). Additionally, the Company and its associated third parties collect and store data that is of a sensitive nature, which may include names and addresses, bank account information, and other types of personal information or sensitive business information. The secure operation of these information technology systems and networks, and the processing and maintenance of this data is critical to the Company's business operations and strategy.
Threats to our systems and our associated third parties' systems can derive from human error, fraud, or malice on the part of employees or third parties, or may result from accidental technological failure. Globally these types of threats have increased in number and severity and it is expected that these trends will continue. These threats pose a risk to the security of the Company's systems and networks and the confidentiality, availability and integrity of the Company's data. Should an attack on the Company's or our associated third parties’ information technology systems and networks succeed, it could expose the Company and the Company's employees, customers, dealers and suppliers to misuse of information or systems, the compromising of confidential information, manipulation and destruction of data, production downtimes and operations disruptions. In 2021, an associated third party was the target of a cybersecurity attack. The attack did not result in the theft of personally identifiable information of any employees, but it resulted in logistical challenges with respect to internal reporting systems.
The occurrence of any of these events could adversely affect the Company's reputation, competitive position, business, results of operations and cash flows. While we have cybersecurity insurance related to a breach event covering certain expenses, damages and claims arising from such incidents may not be covered, or may exceed the amount of any insurance available.
In addition, various privacy and security laws govern the protection of this information and breaches in security could result in litigation, regulatory action, potential liability and the costs and operational consequences of implementing further data protection measures. For example, the European Union's ("EU") General Data Protection Regulation ("GDPR") extends the scope of the EU data protection laws to all companies processing data of EU residents, regardless of the company’s location. The potential compliance costs with or imposed by new or existing regulations and policies that are applicable to us could have a material impact on our results of operations.
MACROECONOMIC AND INDUSTRY RISKS
Negative economic conditions may adversely impact demand for the Company's products and services, as well as the ability of the Company's customers to meet their obligations to the Company on a timely basis.
Negative economic conditions, including the tightening of credit in financial markets, can lead businesses to postpone spending, which may impact the Company's customers, causing them to cancel, decrease or delay their existing and future orders with the Company. In addition, economic conditions may impact the Company's customers by either causing them to close locations serviced by the Harsco Environmental Segment or causing their financial condition to deteriorate to a point where they are unable to meet their obligations to the Company on a timely basis. One or more of these events could adversely impact the Company's operating results and ability to collect its receivables.
Cyclical industry and economic conditions may adversely affect the Company's businesses.
The Company's businesses are subject to general economic slowdowns and cyclical conditions in each of the industries served. Examples are:
•The Harsco Environmental Segment may be adversely impacted by prolonged slowdowns in steel mill production, excess production capacity, bankruptcy or receivership of steel producers and changes in outsourcing practices;
•The resource recovery and slag optimization technologies business of the Harsco Environmental Segment can also be adversely impacted by prolonged slowdowns in customer production or a reduction in the selling prices of its materials, which are in some cases market-based and vary based upon the current fair value of the components being sold. Therefore, the revenue generated from the sale of such recycled materials varies based upon the fair value of the commodity components being sold;
•The abrasives and roofing materials business of the Harsco Environmental Segment may be adversely impacted by economic conditions that slow the rate of residential roof replacement, or by slowdowns in the industrial and infrastructure refurbishment industries;
•Prolonged slowdowns may result in a decrease in the amount of waste generated, resulting in less hazardous waste collected by the Clean Earth Segment; and
•Capital constraints and increased borrowing costs may also adversely impact the financial position and operations of the Company's customers across all business segments.
Furthermore, utilization of deferred tax assets is ultimately dependent on generating sufficient income in future periods to ensure recovery of those assets. The cyclicality of the Company's end markets and adverse economic conditions may negatively impact the future income levels that are necessary for the utilization of deferred tax assets.
Exchange rate fluctuations may adversely impact the Company's business.
Fluctuations in foreign exchange rates between the U.S. dollar and the approximately 25 other currencies in which the Company currently conducts business may adversely impact the Company's results of operations in any given fiscal period. The Company’s principal foreign currency exposures are in the EU, the U.K., China and Brazil. Given the structure of the Company's operations, an increase in the value of the U.S. dollar relative to the foreign currencies in which the Company earns its revenues generally has a negative impact on the translated amounts of the assets and liabilities, results of operations and cash flows. The Company's foreign currency exposures increase the risk of volatility in its financial position, results of operations and cash flows. If currencies in the below regions change materially in relation to the U.S. dollar, the Company's financial position, results of operations, or cash flows may be materially affected.
Compared with the corresponding full-year period in 2021, the average value of major currencies changed as follows in relation to the U.S. dollar during the full-year 2022, impacting the Company's revenues and income:
•British pound sterling weakened by 11%;
•Euro weakened by 11%;
•Chinese yuan weakened by 5%; and
•Brazilian real strengthened by 5%
Compared with exchange rates at December 31, 2021, the value of major currencies at December 31, 2022 changed as follows:
•British pound sterling weakened by 11%;
•Euro weakened by 6%;
•Chinese yuan weakened by 8%; and
•Brazilian real strengthened by 5%
To illustrate the effect of foreign exchange rate changes in certain key markets of the Company, in 2022 revenues would have been approximately 4% or $70 million higher and operating income would have been 9% or $5 million higher if the average exchange rates for 2021 were utilized. In a similar comparison for 2021, revenues would have been 1% or approximately $21 million lower and operating income would have been less than 1% or less than $1 million higher if the average exchange rates for 2020 were utilized.
Currency changes also result in assets and liabilities denominated in local currencies being translated into U.S. dollars at different amounts than at the prior period end. Generally, if the U.S. dollar weakens in relation to currencies in countries in which the Company does business, the translated amounts of the related assets, liabilities, and therefore stockholders' equity, would increase. Conversely, if the U.S. dollar strengthens in relation to currencies in countries in which the Company does business, the translated amounts of the related assets, liabilities, and therefore stockholders' equity, would decrease.
Although the Company engages in foreign currency exchange forward contracts and other hedging strategies to mitigate foreign exchange transactional risks, hedging strategies may not be successful or may fail to completely offset these risks. In addition, competitive conditions in the Company's manufacturing businesses may limit the Company's ability to increase product prices in the face of adverse currency movement. Sales of products manufactured in the U.S. for the domestic and export markets may be affected by the value of the U.S. dollar relative to other currencies. Any long-term strengthening of the U.S. dollar could depress demand for these products and reduce sales. Conversely, any long-term weakening of the U.S. dollar could improve demand for these products and increase sales.
LEGAL AND REGULATORY RISKS
The Company's global presence subjects it to a variety of risks arising from doing business internationally.
The Company operates in approximately 30 countries, generating 43% of its revenues outside of the U.S. (based on location of the facility generating the revenue) for the year ended December 31, 2022. In addition, as of December 31, 2022, approximately 57% of the Company’s property, plant and equipment is located outside of the U.S. The Company's global footprint exposes it to a variety of risks that may adversely affect the Company's results of operations, financial condition, liquidity and cash flows. These include, but may not be limited to, the following:
•periodic economic downturns in the countries in which the Company does business;
•complexities around changes in the still developing relationship between the U.K. and the EU arising out of the U.K.’s withdrawal from the EU;
•imposition of or increases in currency exchange controls and hard currency shortages;
•customs matters and changes in trade policy or tariff regulations;
•changes in regulatory requirements in the countries in which the Company does business;
•changes in tax regulations, higher tax rates in certain jurisdictions and potentially adverse tax consequences including restrictions on repatriating earnings, adverse tax withholding requirements and "double taxation";
•longer payment cycles and difficulty in collecting accounts receivable;
•complexities in complying with a variety of U.S. and foreign government laws, controls and regulations;
•political, economic and social instability, civil and political unrest, terrorist actions and armed hostilities in the regions or countries in which, or adjacent to which, the Company does business;
•increasingly complex laws and regulations concerning privacy and data security, including the EU's GDPR;
•inflation rates in the countries in which the Company does business;
•complying with complex labor laws in foreign jurisdictions;
•laws in various international jurisdictions that limit the right and ability of subsidiaries to pay dividends and remit earnings to affiliated companies unless specified conditions are met;
•sovereign risk related to international governments, including, but not limited to, governments stopping interest payments or repudiating their debt, nationalizing private businesses or altering foreign exchange regulations;
•uncertainties arising from local business practices, cultural considerations and international political and trade tensions; and
•public health issues or other calamities impacting regions or countries in which the Company operates, including travel to and/or imports or exports to or from such regions or countries.
If the Company is unable to successfully manage the risks associated with its global business, the Company's results of operations, financial condition, liquidity and cash flows may be negatively impacted.
Due to the international nature of the Company's business, the Company could be adversely affected by violations of certain laws.
The U.S. Foreign Corrupt Practices Act (“FCPA”) and similar anti-bribery laws in non-U.S. jurisdictions generally prohibit companies and their intermediaries from making improper payments to officials for the purpose of obtaining or retaining business. The FCPA also imposes accounting standards and requirements on publicly traded U.S. corporations and their foreign affiliates, which, among other things, are intended to prevent the diversion of corporate funds to the payment of bribes and other improper payments, and to prevent the establishment of “off the books” slush funds from which improper payments can be made. The Company may be unsuccessful in its efforts to prevent reckless or criminal acts by employees or agents and may be exposed to liability due to pre-acquisition conduct of employees or agents of businesses or operations the Company may acquire. Violations of these laws, or allegations of such violations, could disrupt the Company’s operations, require significant management involvement and have a material adverse effect on the Company’s results of operations, financial condition and cash flows. If the Company is found to be liable for violations of these laws (either due to its own acts, out of inadvertence or due to the acts or inadvertence of others), the Company could also be subject to severe criminal or civil penalties or other sanctions; disgorgement; further changes or enhancements to its procedures, policies and controls; personnel changes and other remedial actions.
Furthermore, the Company is subject to the export controls and economic embargo rules and regulations of the U.S., including the Export Administration Regulations and trade sanctions against embargoed countries, which are administered by the Office of Foreign Asset Control within the Department of Treasury, as well as other laws and regulations administered by the Department of Commerce. These regulations limit the Company’s ability to market, sell, distribute or otherwise transfer its
products to prohibited countries or persons. Failure to comply with these rules and regulations may result in substantial civil and criminal penalties, including fines and disgorgement of profits, the imposition of a court-appointed monitor, the denial of export privileges and debarment from participation in U.S. Government contracts.
A negative outcome on personal injury claims against the Company may adversely impact results of operations and financial condition.
The Company has been named as one of many defendants (approximately 90 or more in most cases) in legal actions alleging personal injury from exposure to airborne asbestos over the past several decades. In their suits, the plaintiffs have named as defendants, among others, many manufacturers, distributors and installers of numerous types of equipment or products that allegedly contained asbestos. The majority of the asbestos complaints pending against the Company have been filed in New York. Almost all of the New York complaints contain a standard claim for damages of $20 million or $25 million against the approximately 90 defendants, regardless of the individual plaintiff's alleged medical condition and without specifically identifying any of the Company’s products as the source of plaintiff's asbestos exposure. If the Company is found to be liable in any of these actions and the liability exceeds the Company's insurance coverage, results of operations, cash flows and financial condition could be adversely affected.
The Company’s ongoing operations are subject to extensive laws, regulations, rules and ordinances relating to safety, health and environmental matters that impose significant costs and liabilities on the Company, and future laws and governmental standards could increase these costs and liabilities.
The Company is subject to a variety of international, federal, state and local laws and governmental regulations, rules and ordinances regulating the use of certain materials contained in its products and/or used in its manufacturing processes. Many of these laws and governmental standards provide for extensive obligations that require the Company to incur significant compliance costs and impose substantial monetary fines and/or criminal sanctions for violations.
Furthermore, such laws and standards are subject to change and may become more stringent. Although it is not possible to predict changes in laws or other governmental standards, the development, proposal or adoption of more stringent laws or governmental standards may require the Company to change its processes, for example, by reducing or eliminating use of the regulated component or material in its process. The Company may not be able to develop a new process to comply with such legal and regulatory changes without investing significant time and resources, if at all. In addition, such legal and regulatory changes may also affect buying decisions by the users of the Company’s products that contain regulated materials or that involve the use of such materials in the process. If applicable laws and governmental standards become more stringent, the Company’s results of operations, liquidity and financial condition could be materially adversely affected.
The Company is subject to various environmental laws, and the success of existing or future environmental claims against it could adversely impact the Company's results of operations and cash flows.
In addition to the environmental and safety considerations discussed above with respect to the Harsco Clean Earth Segment, the Company's operations generally are subject to various federal, state, local and international laws, regulations and ordinances relating to the protection of health, safety and the environment, including those governing discharges to air and water, handling and disposal practices for solid and hazardous byproducts, the remediation of contaminated sites and the maintenance of a safe workplace. These laws impose penalties, fines and other sanctions for non-compliance and liability for response costs, property damages and personal injury resulting from past and current spills, disposals or other releases of, or exposure to, hazardous materials. The Company could incur substantial costs as a result of non-compliance with or liability for remediation or other costs or damages under these laws. The Company may be subject to more stringent environmental laws in the future, and compliance with more stringent environmental requirements may require the Company to make material expenditures or subject it to liabilities that the Company currently does not anticipate.
The Company is currently involved in a number of environmental remediation investigations and cleanups and, along with other companies, has been identified as a "potentially responsible party" for certain byproduct disposal sites under the federal "Superfund" law. At several sites, the Company is currently conducting environmental remediation, and it is probable that the Company will agree to make payments toward funding certain other of these remediation activities. It also is possible that some of these matters will be decided unfavorably to the Company and that other sites requiring remediation will be identified. Each of these matters is subject to various uncertainties, and financial exposure is dependent upon the following factors:
•the continuing evolution of environmental laws and regulatory requirements;
•the availability and application of technology;
•the allocation of cost among potentially responsible parties;
•the years of remedial activity required; and
•the remediation methods selected.
The nature of the Company’s products creates the possibility of significant product liability and warranty claims, which could harm its business.
The Company’s customers use some of its products in potentially hazardous applications that can cause injury or loss of life and damage to property, equipment or the environment. In addition, the Company’s products are integral to the production process for some end-users and any failure of the Company’s products could result in a suspension of operations, including products historically sold by business units of the Company to the extent that the Company retains liability for such historical products. Accidents may occur at a location where the Company’s equipment and services have been or are being used. Investigations into such accidents, even if the Company and its products are ultimately found not to be the cause of such accidents, require the Company to expend significant time, effort and resources. The Company cannot be certain that its products will be completely free from defects. The Company may be named as a defendant in product liability or other lawsuits asserting potentially large claims. In addition, the Company cannot guarantee that insurance will be available or adequate to cover any or all liabilities incurred. The Company also may not be able to maintain insurance in the future at levels it believes are necessary and at rates it considers reasonable.
FINANCIAL, TAX AND FINANCIAL MARKET RISKS
Restrictions imposed by the Company's Senior Secured Credit Facilities, accounts receivable securitization facility and other financing arrangements may limit the Company's operating and financial flexibility.
The agreements governing the Company's outstanding financing arrangements impose a number of restrictions. Under the Company's Senior Secured Credit Facilities, the Company must comply with certain financial covenants on a quarterly basis. The covenants also place limitations on dividends, acquisitions, investments in joint ventures, unrestricted subsidiaries, indebtedness and the imposition of liens on the Company's assets. In the event of a default, the Company's lenders and the counterparties to the Company's other financing arrangements could terminate their commitments to the Company and declare all amounts borrowed, together with accrued interests and fees, immediately due and payable. If this were to occur, the Company might not be able to pay these amounts, or the Company might be forced to seek an amendment to the Company's financing arrangements which could make the terms of these arrangements more onerous for the Company. In addition, this could also trigger an event of default under the cross-default provisions of the Company's other obligations. As a result, a default under one or more of the existing or future financing arrangements could have significant consequences for the Company.
The Company is exposed to counterparty risk in its derivative financial arrangements.
The Company uses derivative financial instruments, such as interest rate swaps and foreign currency exchange forward contracts, for a variety of purposes. The Company uses interest rate swaps in conjunction with certain debt issuances in order to secure either a fixed or floating interest rate. The Company uses foreign currency exchange forward contracts as part of a worldwide program to minimize foreign currency operating income and balance sheet exposure. In particular, the Company uses foreign currency exchange forward contracts to hedge commitments, such as foreign currency debt, firm purchase commitments and foreign currency cash flows for certain export sales transactions. The unsecured contracts for foreign
currency exchange forward contracts outstanding at December 31, 2022 mature at various times through 2023 and are with major financial institutions. The Company may also enter into derivative contracts to hedge commodity exposures. The failure of one or more counterparties to the Company's derivative financial instruments to fulfill their obligations could adversely affect the Company's results of operations, financial condition, liquidity and cash flows.
The Company’s variable rate indebtedness subjects it to interest rate risk, which could cause the Company's debt service obligations to increase significantly.
The Company's total debt at December 31, 2022 was $1.4 billion. Of this amount, approximately 63% had variable rates of interest and approximately 37% had fixed interest rates. The weighted average interest rate of total debt was approximately 6.5%. At debt levels as of December 31, 2022, a one percentage point increase in variable interest rates would increase interest expense by $8.7 million per year and a one percentage point decrease in variable interest rates would decrease interest expense by $8.7 million. If the Company is unable to successfully manage its exposure to variable interest rates, including through interest rate swaps that the Company has put into place, its debt service obligations may increase even though the amount borrowed remains the same and, in turn, its results of operations and financial condition may be negatively impacted. Separately, a one percentage point change in interest rates also impacts our facility fees from our AR Facility by $1.4 million per year.
The Company is subject to taxes in numerous jurisdictions and could be subject to additional tax liabilities, which could materially adversely affect the Company’s results of operations and cash flows and impact the Company’s ability to compete abroad.
The Company is subject to U.S. federal, U.S. state and international income, payroll, property, sales and use, value-added, fuel and other types of taxes in numerous jurisdictions. Changes in tax rates, enactments of new tax laws, revisions of tax regulations, and claims or litigation with taxing authorities could result in substantially higher taxes, and therefore, could have a significant adverse effect on the Company's results of operations, financial condition and liquidity.
The Company's tax expense and liabilities may also be affected by other factors, such as changes in business operations, acquisitions, investments, entry into new geographies, intercompany transactions, the relative amount of foreign earnings, losses incurred in jurisdictions for which the related tax benefits may not be realized, and changes in deferred tax assets and their valuation. Significant judgment is required in evaluating and estimating the Company's tax expense and liabilities. The ultimate tax determination for many transactions and calculations is uncertain. For example, the Tax Act requires complex computations to be performed that were not historically required, significant judgments to be made in interpretations of the provisions of the Tax Act, estimates in calculations, and the preparation and analysis of information not previously relevant or regularly produced. The U.S. Treasury Department, the IRS, and other standard-setting bodies will continue to interpret or issue guidance on how provisions of the Tax Act will be applied or administered. As future guidance is issued, the Company may need to make adjustments to amounts previously recorded, and those adjustments could materially impact the Company's consolidated financial statements in the period in which the adjustments are made.
The Company's defined benefit NPPC is directly affected by equity and bond markets. A downward trend in those markets could adversely impact the Company's results of operations, financial condition and cash flows.
In addition to the economic issues that directly affect the Company's businesses, changes in the performance of equity and bond markets, particularly in the U.K. and the U.S., impact actuarial assumptions used in determining annual NPPC, pension liabilities and the valuation of the assets in the Company's defined benefit pension plans. Financial market deterioration would most likely have a negative impact on the Company's NPPC and the pension assets and liabilities. This could result in a decrease to stockholders' equity and an increase in the Company's statutory funding requirements.
Item 1B. Unresolved Staff Comments.
None.
Item 2. Properties.
Operations of the Company and its subsidiaries are conducted at both owned and leased properties in domestic and international locations. The Company's executive offices are located at Two Logan Square, 100-120 North 18th Street, 17th Floor, Philadelphia, PA. The following table describes the location and principal use of the Company's more significant properties.
| | | | | | | | | | | | | | |
| Location | | Principal Products/Services | | Interest |
| Harsco Environmental Segment | | | | |
| Taiyuan City, China | | Environmental Services | | Leased |
| Rotherham, U.K. | | Environmental Services | | Owned |
| Drakesboro, Kentucky, U.S. | | Ecoproducts - Roofing Granules/Abrasives | | Owned |
| Sarver, Pennsylvania, U.S. | | Environmental Services | | Owned |
| Chesterfield, U.K. | | Aluminum Dross and Scrap Processing Systems | | Owned |
| Harsco Clean Earth Segment | | | | |
| | | | |
| Middlesex, New Jersey, U.S. | | Soil and Dredged Materials Processing | | Leased |
| Hudson, New Jersey, U.S. | | Hazardous Waste Processing | | Owned/Leased |
| New Castle, Delaware, U.S. | | Soil and Dredged Materials Processing | | Leased |
| Prince Georges, Maryland, U.S. | | Soil and Dredged Materials Processing | | Owned |
| Marshall, Kentucky, U.S. | | Hazardous Waste Processing | | Owned |
| Wayne, Michigan, U.S. | | Hazardous Waste Processing | | Owned |
| Birmingham, Alabama, U. S. | | Hazardous Waste Processing | | Owned |
| Inglewood, California, U.S. | | Hazardous Waste Processing | | Owned |
| Indianapolis, Indiana, U.S. | | Hazardous Waste Processing | | Leased |
| Detroit, Michigan, U.S. | | Hazardous Waste Processing | | Owned |
| Kansas City, Missouri, U.S. | | Hazardous Waste Processing | | Owned |
| Fernley, Nevada, U.S. | | Hazardous Waste Processing | | Owned |
| Hatfield, Pennsylvania, U.S. | | Hazardous Waste Processing | | Owned |
| Providence, Rhode Island, U.S. | | Hazardous Waste Processing | | Owned |
| Avalon, Texas, U.S. | | Hazardous Waste Processing | | Owned |
| Houston, Texas, U.S. | | Hazardous Waste Processing | | Owned |
| Kent, Washington, U.S. | | Hazardous Waste Processing | | Owned |
| Tacoma, Washington, U.S. | | Hazardous Waste Processing | | Owned |
| | | | |
| | | | |
HE principally operates on customer-owned sites and has administrative offices throughout the world, including Pittsburgh, Pennsylvania, U.S. and Leatherhead, U.K. CE has an administrative office in King of Prussia, Pennsylvania. The above table includes the principal properties owned or leased by the Company. The Company also operates from a number of other smaller plants, warehouses and offices in addition to the above. The Company considers all of its properties at which operations are currently performed to be in satisfactory condition and suitable for their intended use.
Item 3. Legal Proceedings.
Information regarding legal proceedings is included in Note 12, Commitments and Contingencies, in Part II, Item 8, "Financial Statements and Supplementary Data."
Item 4. Mine Safety Disclosures.
Not applicable.
PART II
Item 5. Market for Registrant's Common Equity, Related Stockholder Matters and Issuer Purchases of Equity Securities.
Harsco Corporation common stock is listed on the New York Stock Exchange under the trading symbol HSC. At December 31, 2022, there were 79,489,640 shares outstanding. In 2022, the Company's common stock traded in a range of $3.73 to $17.42 and closed at $6.29 at year-end. At December 31, 2022, there were approximately 16,807 stockholders. For additional information regarding the Company's equity compensation plans see Note 14, Stock-Based Compensation, in Part II, Item 8, "Financial Statements and Supplementary Data," Part III, Item 11, "Executive Compensation," and Part III, Item 12 "Security Ownership of Certain Beneficial Owners and Management and Related Stockholder Matters."
Stock Performance Graph
*$100 invested on 12/31/17 in stock or index, including reinvestment of dividends.
Fiscal year ending December 31.
Copyright© 2023 Standard & Poor's, a division of S&P Global. All rights reserved.
Copyright© 2023 S&P Dow Jones Indices LLC, a division of S&P Global. All rights reserved.
Copyright© 2023 Russell Investment Group. All rights reserved.
| | | | | | | | | | | | | | | | | | | | |
| December 2017 | December 2018 | December 2019 | December 2020 | December 2021 | December 2022 |
| Harsco Corporation | 100.00 | | 106.49 | | 123.38 | | 96.41 | | 89.60 | | 33.73 | |
| S&P Smallcap 600 | 100.00 | | 91.52 | | 112.37 | | 125.05 | | 158.59 | | 133.06 | |
| Russell 2000 | 100.00 | | 88.99 | | 111.70 | | 134.00 | | 153.85 | | 122.41 | |
| Dow Jones US Diversified Industrials | 100.00 | | 74.92 | | 95.07 | | 106.89 | | 117.57 | | 108.01 | |
The above graph compares the cumulative total return on Harsco’s common stock over the five-year period ended December 31, 2022 with the cumulative total return for the same period on the Russell 2000 Index, Dow Jones U.S. Diversified Industrials Index and S&P Smallcap 600 Index. Going forward, the Company is replacing the S&P Smallcap 600 with the Russell 2000. The change to the Russell 2000 reflects the Company’s view that the Russell 2000 is appropriate given its broader representation of the overall market and companies of similar size and scope to the Company. The graph assumes that $100 was invested on December 31, 2017 in our common stock and in the shares represented by each of the indices.
Item 6. [Reserved].
Item 7. Management's Discussion and Analysis of Financial Condition and Results of Operations.
The following discussion should be read in conjunction with the Consolidated Financial Statements of Harsco Corporation provided under Part II, Item 8, Financial Statements and Supplementary Data of this Annual Report on Form 10-K.
Amounts included in this Item 7 of this Annual Report on Form 10-K are rounded in millions and all percentages are calculated based on actual amounts. As a result, minor differences may exist due to rounding.
Forward-Looking Statements
The nature of the Company's business, together with the number of countries in which it operates, subject it to changing economic, competitive, regulatory and technological conditions, risks and uncertainties. In accordance with the "safe harbor" provisions of Section 27A of the Securities Act of 1933 and Section 21E of the Securities Exchange Act of 1934, the Company provides the following cautionary remarks regarding important factors that, among others, could cause future results to differ materially from the results contemplated by forward-looking statements, including the expectations and assumptions expressed or implied herein. Forward-looking statements contained herein could include, among other things, statements about management's confidence in and strategies for performance; expectations for new and existing products, technologies and opportunities; and expectations regarding growth, sales, cash flows, and earnings. Forward-looking statements can be identified by the use of such terms as "may," "could," "expect," "anticipate," "intend," "believe," "likely," "estimate," "outlook," "plan" or other comparable terms.
Factors that could cause actual results to differ, perhaps materially, from those implied by forward-looking statements include, but are not limited to: (1) changes in the worldwide business environment in which the Company operates, including changes in general economic conditions or health conditions; (2) changes in currency exchange rates, interest rates, commodity and fuel costs and capital costs; (3) changes in the performance of equity and bond markets that could affect, among other things, the valuation of the assets in the Company's pension plans and the accounting for pension assets, liabilities and expenses; (4) changes in governmental laws and regulations, including environmental, occupational health and safety, tax and import tariff standards and amounts; (5) market and competitive changes, including pricing pressures, market demand and acceptance for new products, services and technologies; (6) the Company's inability or failure to protect its intellectual property rights from infringement in one or more of the many countries in which the Company operates; (7) failure to effectively prevent, detect or recover from breaches in the Company's cybersecurity infrastructure; (8) unforeseen business disruptions in one or more of the many countries in which the Company operates due to political instability, civil disobedience, armed hostilities, public health issues or other calamities; (9) disruptions associated with labor disputes and increased operating costs associated with union organization; (10) the seasonal nature of the Company's business; (11) the Company's ability to successfully enter into new contracts and complete new acquisitions or strategic ventures in the time-frame contemplated, or at all; (12) the Company's ability to negotiate, complete, and integrate strategic transactions; (13) failure to conduct and complete a satisfactory process for the divestiture of the Rail division, as announced on November 2, 2021; (14) potential severe volatility in the capital or commodity markets; (15) failure to retain key management and employees; (16) the outcome of any disputes with customers, contractors and subcontractors; (17) the financial condition of the Company's customers, including the ability of customers (especially those that may be highly leveraged, have inadequate liquidity or whose business has been significantly impacted by COVID-19) to maintain their credit availability; (18) implementation of environmental remediation matters; (19) risk and uncertainty associated with intangible assets and (20) other risk factors listed from time to time in the Company's SEC reports. A further discussion of these, along with other potential risk factors, can be found in Part I, Item 1A, "Risk Factors," of this Annual Report on Form 10-K. The Company cautions that these factors may not be exhaustive and that many of these factors are beyond the Company's ability to control or predict. Accordingly, forward-looking statements should not be relied upon as a prediction of actual results. The Company undertakes no duty to update forward-looking statements except as may be required by law.
Executive Overview
The Company is a market-leading, global provider of environmental solutions for industrial, retail and medical waste streams. The Company's operations consist of two reportable segments: Harsco Environmental and Harsco Clean Earth. The Company is a single-thesis environmental solutions company that is a leader in the markets that we serve. The Harsco Environmental Segment operates primarily under long-term contracts, providing critical environmental services and material processing to the global steel and metals industries, including zero-waste solutions for manufacturing byproducts within the metals industry. The Harsco Clean Earth Segment provides specialty waste processing, treatment, recycling, and beneficial reuse solutions for customers in the industrial, retail, healthcare, and construction industries across a variety of waste needs, including hazardous, non-hazardous, and contaminated soils and dredged materials. The Company has locations in approximately 30 countries, including the U.S. The Company was incorporated in 1956.
The Company is in the process of selling the Rail business with a sale expected to occur in 2023. The intention to sell the business was first announced in the fourth quarter of 2021. The sales process was delayed in 2022 due to certain macroeconomic conditions, including rising interest rates. The carrying value of the assets and liabilities of the former Harsco Rail Segment are classified as Assets held-for-sale and Liabilities of assets held-for-sale on the Consolidated Balance Sheets and the operating results of the former Harsco Rail Segment are reflected in the Consolidated Statements of Operations as discontinued operations for all periods presented.
The Company maintains a positive outlook across its businesses supported by favorable underlying growth characteristics in its businesses and investments by the Company to further supplement growth. The Company's view beyond 2022 is supported by the below factors, which should be considered in the context of other risks, trends and strategies, as referenced in Part I, Item 1A, Risk Factors:
•HE: 2023 results are expected to be modestly above 2022 results as positive impacts from higher service pricing, net of inflation, cost and operational improvement initiatives and higher environmental services and products demand at certain sites, including those linked to growth investments, are expected to be offset by the impacts of foreign exchange translation and a less favorable service mix. The global steel market has experienced a period of volatility in recent quarters due to the Russia-Ukraine conflict and the resulting energy crisis in Europe, as well as inventory management through the steel industry supply-chain and a change to the economic conditions due to rising interest rates. Underlying business conditions are expected to stabilize in early 2023 and these external factors are not anticipated to have a material impact on performance in 2023. Over the longer-term, the Company expects HE to grow as a result of economic growth that supports higher global steel consumption, as well as investments and innovation that support the environmental solutions needs of customers.
•CE: 2023 results are anticipated to improve meaningfully compared to 2022, as a result of higher services pricing, net of inflation, cost and operational improvements and a modest increase in environmental services demand across certain end-markets. These benefits include pricing and operating cost initiatives implemented during the second half of 2022, along with additional improvements to be initiated in 2023. Longer-term, the Company expects this segment to benefit from positive underlying market trends, supported by increased environmental regulation, further growth opportunities and its attractive asset position, as well as from the less cyclical and recurring nature of this business.
Results of Operations
Revenues by Segment
| | | | | | | | | | | | | | | | | | | | | | | | | | |
| | | | | | |
| (Dollars in millions) | | 2022 | | 2021 | | Change | | % |
| Harsco Environmental | | $ | 1,061.2 | | | $ | 1,068.1 | | | $ | (6.8) | | | (0.6) | % |
| Harsco Clean Earth | | 827.8 | | | 780.3 | | | 47.5 | | | 6.1 | |
| | | | | | | | |
| Total Revenues | | $ | 1,889.1 | | | $ | 1,848.4 | | | $ | 40.7 | | | 2.2 | % |
Revenues by Region
| | | | | | | | | | | | | | | | | | | | | | | | | | | |
| | | | | | | |
| (Dollars in millions) | | 2022 | | 2021 | | Change | | % | |
| North America | | $ | 1,125.4 | | | $ | 1,061.4 | | | $ | 63.9 | | | 6.0 | % | |
| Western Europe | | 389.7 | | | 442.3 | | | (52.6) | | | (11.9) | | |
Latin America (a) | | 155.2 | | | 132.3 | | | 22.9 | | | 17.3 | | |
| Asia-Pacific | | 119.4 | | | 110.8 | | | 8.6 | | | 7.8 | | |
| Middle East and Africa | | 79.6 | | | 81.3 | | | (1.8) | | | (2.2) | | |
| Eastern Europe | | 19.8 | | | 20.2 | | | (0.4) | | | (2.2) | | |
| Total Revenues | | $ | 1,889.1 | | | $ | 1,848.4 | | | $ | 40.7 | | | 2.2 | % | |
(a) Includes Mexico.
Operating Income (Loss) and Operating Margins by Segment
| | | | | | | | | | | | | | | | | | | | | | | | | | | |
| | | | | | | |
| (Dollars in millions) | | 2022 | | 2021 | | Change | | % | |
| Harsco Environmental | | $ | 59.6 | | | $ | 103.4 | | | $ | (43.8) | | | (42.4) | % | |
| | | | | | | | | |
| Harsco Clean Earth | | (81.8) | | | 25.6 | | | (107.4) | | | (419.0) | | |
| Corporate | | (35.1) | | | (40.7) | | | 5.5 | | | 13.6 | | |
| Total Operating Income (Loss) | | $ | (57.3) | | | $ | 88.4 | | | $ | (145.7) | | | 164.9 | % | |
| | | | | | | | | | | | | | |
| | |
| | 2022 | | 2021 |
| Harsco Environmental | | 5.6 | % | | 9.7 | % |
| Harsco Clean Earth | | (9.9) | % | | 3.3 | % |
| Consolidated Operating Margin | | (3.0) | % | | 4.8 | % |
Harsco Environmental Segment:
| | | | | | | | |
Significant Effects on Revenues (In millions) | | |
Revenues—2021 | | $ | 1,068.1 | |
| Net effects of price/volume changes, primarily attributable to volume changes | | 74.7 | |
| Foreign currency translation | | (70.2) | |
| Net impact of new contracts and lost contracts | | (10.4) | |
| Other | | (1.0) | |
Revenues—2022 | | $ | 1,061.2 | |
The following factors contributed to the changes in operating income for the year ended December 31, 2022.
Factors Positively Affecting Operating Income:
•Operating income was positively affected by increased revenue under environmental service contracts due, in part, to higher overall service levels at certain sites for the year ended December 31, 2022.
Factors Negatively Impacting Operating Income:
•Impact of cost increases related to raw materials, labor, equipment rental, freight and maintenance due to inflation, including the impact of increased fuel costs of $18.0 million for the year ended December 31, 2022.
•An intangible asset impairment charge of $15.0 million was recorded during the year ended December 31, 2022 related to the Altek Group.
•Lower recovery of Brazil non-income tax expense of $8.2 million during the year ended December 31, 2022, compared to December 31, 2021.
•Asset sale gains were $7.0 million lower during the year ended December 31, 2022, compared to December 31, 2021.
•The effect of foreign currency translation reduced operating income by $5.4 million for the year ended December 31, 2022.
Harsco Clean Earth Segment:
| | | | | | | | |
Significant Effects on Revenues (In millions) | | |
Revenues—2021 | | $ | 780.3 | |
| Net effects of price/volume changes, primarily attributable to pricing changes | | 47.5 | |
| | |
Revenues—2022 | | $ | 827.8 | |
The following factors contributed to the changes in operating income (loss) for the year ended December 31, 2022.
Factors Positively Affecting Operating Income:
•Favorable changes in pricing in the hazardous waste business, partially offset by cost increases mostly due to transportation, labor, disposal, containers and fuel, as well as decreased volume, of $5.9 million for the year ended December 31, 2022.
Factors Negatively Impacting Operating Income:
•A goodwill impairment charge of $104.6 million was recorded during the year ended December 31, 2022.
•A $2.6 million insurance recovery during the year ended December 31, 2021 that did not reoccur during the year ended December 31, 2022.
•Operating income in the soil and dredged material business was reduced by $2.4 million, mostly related to the impact of cost inflation on transportation, partially offset by favorable changes in pricing and volume, during the year ended December 31, 2022.
Consolidated Results
| | | | | | | | | | | | | | | | | | | | |
| (In millions, except per share information and percentages) | | 2022 | | 2021 | | 2020 |
| Revenues | | $ | 1,889.1 | | | $ | 1,848.4 | | | $ | 1,534.0 | |
| Cost of sales | | 1,553.3 | | | 1,490.6 | | | 1,242.3 | |
| Selling, general and administrative expenses | | 268.1 | | | 272.2 | | | 284.4 | |
| Research and development expenses | | 0.7 | | | 1.0 | | | 0.5 | |
| Goodwill and other intangible asset impairment charges | | 119.6 | | | — | | | — | |
| Other (income) expenses, net | | 4.7 | | | (3.7) | | | 10.1 | |
| Operating income (loss) from continuing operations | | (57.3) | | | 88.4 | | | (3.3) | |
| Interest income | | 3.6 | | | 2.2 | | | 2.1 | |
| Interest expense | | (75.2) | | | (63.2) | | | (58.2) | |
| Facility fees and debt-related income (expense) | | (3.0) | | | (5.5) | | | (1.9) | |
| Defined benefit pension income (expense) | | 8.9 | | | 15.6 | | | 7.1 | |
| Income (loss) from continuing operations before income taxes and equity income | | (123.0) | | | 37.5 | | | (54.2) | |
| Income tax benefit (expense) from continuing operations | | (10.4) | | | (9.1) | | | 8.7 | |
| Equity in income (loss) of unconsolidated entities, net | | (0.2) | | | (0.3) | | | 0.2 | |
| Income (loss) from continuing operations | | (133.5) | | | 28.1 | | | (45.4) | |
| Gain on sale of discontinued businesses | | — | | | — | | | 18.3 | |
| Income (loss) from discontinued businesses | | (50.3) | | | (25.9) | | | 20.4 | |
| Income tax benefit (expense) from discontinued businesses | | 7.4 | | | 0.5 | | | (15.2) | |
| Income (loss) from discontinued operations, net of tax | | (42.9) | | | (25.4) | | | 23.4 | |
| Net income (loss) | | (176.4) | | | 2.7 | | | (22.0) | |
| | | | | | |
| | | | | | |
| | | | | | |
| | | | | | |
| | | | | | |
| Total other comprehensive income (loss) | | (11.6) | | | 84.1 | | | (55.3) | |
| Total comprehensive income (loss) | | (188.0) | | | 86.8 | | | (77.3) | |
| | | | | | |
| | | | | | |
| Diluted earnings (loss) per share from continuing operations attributable to Harsco Corporation common stockholders | | $ | (1.73) | | | $ | 0.28 | | | $ | (0.63) | |
| Effective income tax rate from continuing operations | | (8.4) | % | | 24.2 | % | | 16.0 | % |
Comparative Analysis of Consolidated Results
Revenues
Revenues for 2022 increased $40.7 million, or 2%, from 2021. Revenues for 2021 increased $314.4 million, or 20%, from 2020. These increases were attributable to the following significant items:
| | | | | | | | | | | | | | |
| Changes in Revenues (In millions) | | 2022 vs. 2021 | | 2021 vs. 2020 |
| Impact of ESOL acquisition | | $ | — | | | $ | 134.2 | |
| Net effect of price/volume changes in HE, primarily attributable to volume changes | | 74.7 | | | 138.3 | |
| Net effect of price/volume changes in CE, primarily attributable to pricing changes | | 47.5 | | | — | |
| Net effect of price/volume changes in CE, primarily attributable to volume changes | | — | | | 25.6 | |
| Net impact of new contracts and lost contracts (including exited underperforming contracts) in HE | | (10.4) | | | (5.6) | |
| Foreign currency translation | | (70.2) | | | 20.8 | |
| Other | | (1.0) | | | 1.1 | |
| Total change in revenues | | $ | 40.7 | | | $ | 314.4 | |
Cost of Sales
Cost of sales for 2022 increased $62.7 million or 4% from 2021. Cost of sales for 2021 increased $248.3 million or 20% from 2020. These increases were attributable to the following significant items:
| | | | | | | | | | | | | | |
| Change in Cost of Sales (In millions) | | 2022 vs. 2021 | | 2021 vs. 2020 |
| Change in costs due to changes in revenues volume | | $ | 50.3 | | | $ | 116.2 | |
| Changes in costs due to change in prices, including materials, labor, fuel, transportation and maintenance | | 68.4 | | | 2.9 | |
| Foreign currency translation | | (60.3) | | | 19.2 | |
| Other | | 4.3 | | | 6.0 | |
| Impact of ESOL acquisition | | — | | | 104.0 | |
| Total change in cost of sales | | $ | 62.7 | | | $ | 248.3 | |
Selling, General and Administrative Expenses
SG&A expenses for 2022 decreased $4.2 million or 2% from 2021, which is primarily driven by a $5.5 million reduction in professional fees during the year ended December 31, 2022, principally in the CE and Corporate Segments; partially offset by higher rent expense of $1.7 million across all segments.
SG&A expenses for 2021 decreased $12.2 million, or 4%, from 2020. The decrease is primarily due to acquisition and integration costs totaling $49.0 million that were incurred in 2020 related to the acquisition of ESOL that did not repeat in 2021, partially offset by the incremental impact of SG&A expenses associated with the ESOL business of $22.9 million and higher compensation costs in 2021 of $9.3 million, principally in the CE and Corporate Segments.
Goodwill and Other Intangible Asset Impairment Charges
The Company recorded impairment charges of $119.6 million during the year ended December 31, 2022, which includes a $104.6 million charge related to goodwill in CE and a $15.0 million charge related to the intangible assets in HE. There were no such charges incurred during the years ended December 31, 2021 and 2020.
See the Fair Value Estimates for Business Combinations and Goodwill and the Long-lived Asset Impairment (Other than Goodwill) paragraphs under Part II, Item 7 Management's Discussion and Analysis, Application of Critical Accounting Policies and Critical Accounting Estimates for further details.
Other (Income) Expenses, Net
The major components of this Consolidated Statements of Operations caption are detailed below. See Note 18, Other (Income) Expenses, Net, in Part II, Item 8, Financial Statements and Supplementary Data, for additional information. | | | | | | | | | | | | | | | | | | | | |
| | Other (Income) Expenses |
| (In thousands) | | 2022 | | 2021 | | 2020 |
| Employee termination benefits costs | | $ | 6,490 | | | $ | 4,766 | | | $ | 10,249 | |
| Net gains | | (4,013) | | | (8,902) | | | (3,723) | |
| Contingent consideration adjustments | | (827) | | | — | | | 2,386 | |
| | | | | | |
| Impaired asset write-downs | | 641 | | | 1,005 | | | 776 | |
| Other costs to exit activities | | 1,446 | | | 663 | | | 533 | |
| | | | | | |
| | | | | | |
| | | | | | |
| | | | | | |
| | | | | | |
| Other (income) expense | | 1,000 | | | (1,254) | | | (149) | |
| Total other (income) expenses, net | | $ | 4,737 | | | $ | (3,722) | | | $ | 10,072 | |
Interest Expense
Interest expense in 2022 was $75.2 million, an increase of $11.9 million, or 19%, compared with 2021. This increase primarily relates to higher weighted average interest rates, in addition to higher outstanding borrowings during 2022, related to the Senior Secured Credit Facilities.
Interest expense in 2021 was $63.2 million, an increase of $5.0 million, or 9%, compared with 2020. This increase primarily relates to higher outstanding borrowings.
Facility Fees and Debt-Related Income (Expense)
During 2022, the Company recognized $3.0 million of net expense, which included fees related to the amending of the Company's Senior Secured Credit Facilities and fees related to the Company's Account Receivables Securitization Facility. A $2.3 million gain on the repurchase of $25.0 million of Senior Notes recognized during the year ended December 31, 2022 partially offset these fees.
During 2021, the Company recognized $5.5 million of fees and other costs primarily related to the amended Senior Secured Credit Facilities.
During 2020, the Company recognized $1.9 million of fees and expenses related to the amended Senior Secured Credit Facilities.
Defined Benefit Pension Income (Expense)
Defined benefit pension income in 2022 was $8.9 million, compared to defined benefit pension income of $15.6 million in 2021. This decrease is primarily the result of a lower assumed rate of return on plan assets in 2022.
Defined benefit pension income in 2021 was $15.6 million compared to defined benefit pension expense of $7.1 million in 2020. This change is primarily the result of higher plan asset values at December 31, 2021.
Income Tax Benefit (Expense) from Continuing Operations
Income tax expense from continuing operations in 2022 was $10.4 million, compared with $9.1 million income tax expense from continuing operations in 2021. The effective income tax rate relating to continuing operations for 2022 was (8.4)%, versus 24.2% for 2021. The increase in income tax expense was primarily due to increased disallowed interest expense in 2022 as a result of lower taxable income in U.S. and a $6.8 million Brazil tax benefit recorded in 2021 resulting from the recognition of deferred tax assets not recurring in 2022, partially offset by a $3.0 million tax benefit recorded on a $104.6 million goodwill impairment recorded for the Harsco Clean Earth Segment and the change in mix of income in various countries. The decrease in effective tax rate was primarily due to the goodwill impairment recorded for the Harsco Clean Earth Segment, the intangible assets impairment recorded for the Altek business, and the change in mix of income, partially offset by a $6.8 million Brazil tax benefit recorded in 2021 resulting from the recognition of deferred tax assets not recurring in 2022.
Income tax expense from continuing operations in 2021 was $9.1 million, compared with income tax benefit from continuing operations of $8.7 million in 2020. The effective income tax rate relating to continued operations for 2021 was 24.2%, versus 16.0% for 2020. The increase in income tax expense and the effective tax rate was primarily due to the increase in operating income including decreased expenses from corporate strategic spending, disallowed interest expense in 2021 and recognition of net operating loss carrybacks in 2020 not recurring in 2021, offset by a $6.8 million Brazil tax benefit recorded in 2021 resulting from the recognition of deferred tax assets as well as the change in mix of income in various foreign countries.
See Note 11, Income Taxes in Part II, Item 8, Financial Statements and Supplementary Data, for additional information. Gain on Sale of Discontinued Businesses
In January 2020, the Company sold IKG and recognized a gain on sale of $18.3 million pre-tax (or approximately $9 million after-tax).
Income (Loss) from Discontinued Businesses
The operating results of the former Harsco Rail Segment and costs directly attributable to the sale of the business, have been reflected as discontinued operations in the Company's Consolidated Statements of Operations for all periods presented. In addition, this caption includes costs directly attributable to retained contingent liabilities of other previously disposed businesses, which are not significant. The increased loss during the year ended December 31, 2022 was related primarily to the recognition of incremental forward estimated loss provisions of $11.1 million for certain contracts in the Rail business, as well lower business performance due to reduced revenue for railway track maintenance equipment, when compared to the year ended December 31, 2021. It is possible that the Company's overall estimate of liquidated damages, penalties and costs to complete these contracts may increase, which would result in an additional estimated forward loss provision at such time.
The primary driver for the loss in 2021, as compared to 2020, is the recognition of forward loss provisions of $33.4 million for certain contracts in the Rail business.
Total Other Comprehensive Income (Loss)
Total other comprehensive loss was $11.6 million in 2022, compared with total other comprehensive income of $84.1 million in 2021. The primary driver of the loss in the current year is related to the strengthening of the U.S. dollar against certain currencies inclusive of the impact of foreign currency translation of cumulative unrecognized actuarial losses on the Company's pension obligations, reflective of the strengthening of the U.S. dollar during the year ended December 31, 2022. Partially offsetting this was higher discount rates for the U.S. and U.K. pension plans, partially offset by a lower return on plan assets than expected for both plans.
Total other comprehensive income was $84.1 million in 2021, compared with total other comprehensive loss of $55.3 million in 2020. The primary driver of the increase is due to higher discount rates for the U.S. and U.K. pension plans and a higher return on assets than expected for the U.S. pension plan.
Liquidity and Capital Resources
Cash Flow Summary
The Company currently expects to have sufficient financial liquidity and borrowing capacity to support the strategies within each of its businesses. The Company currently expects operational and business needs, in addition to repayment of its current debt maturities, to be met by cash provided by operations, supplemented with borrowings from time to time principally under the Senior Secured Credit Facilities. The Company supplements the cash provided by operations with borrowings from time to time due to historical patterns of seasonal cash flow and the funding of various projects. The Company regularly assesses capital needs in the context of operational trends and strategic initiatives.
The Company's cash flows from operating, investing and financing activities, as reflected on the Consolidated Statements of Cash Flows, are summarized in the following table:
| | | | | | | | | | | | | | | | | | | | |
| (In millions) | | 2022 | | 2021 | | 2020 |
| Net cash provided (used) by: | | | | | | |
| Operating activities | | $ | 150.5 | | | $ | 72.2 | | | $ | 53.8 | |
| Investing activities | | (99.1) | | | (124.4) | | | (520.6) | |
| Financing activities | | (42.8) | | | 60.2 | | | 487.0 | |
| Effect of exchange rate changes on cash | | (10.7) | | | (0.5) | | | (0.2) | |
| Net change in cash and cash equivalents | | $ | (2.0) | | | $ | 7.5 | | | $ | 19.9 | |
Cash provided (used) by operating activities — Net cash provided by operating activities in 2022 was $150.5 million, an increase of $78.3 million from 2021. The primary drivers of this increase were the sale of $145.0 million of the Company's accounts receivable through its AR Facility and other favorable changes in net working capital, principally related to a decrease in contract assets partially offset by timing of accounts receivable collections. These increases were offset by lower cash net income for the year ended December 31, 2022, when compared to prior year.
Also included in the Cash flows from operating activities section of the Consolidated Statements of Cash Flows is the caption, Other assets and liabilities. A summary of the major components of this caption for the periods presented is as follows:
| | | | | | | | | | | | | | | | | | | | |
| (In millions) | | 2022 | | 2021 | | 2020 |
| Net cash provided (used) by: | | | | | | |
| Change in income taxes | | $ | (3.5) | | | $ | 4.8 | | | $ | (1.1) | |
| Change in prepaid expenses | | (5.8) | | | (1.8) | | | (7.4) | |
| | | | | | |
| Change in reserve for contract losses | | 15.1 | | | 13.6 | | | (2.1) | |
Other (a) | | (15.0) | | | 5.0 | | | 9.5 | |
| Total change in Other assets and liabilities | | $ | (9.2) | | | $ | 21.6 | | | $ | (1.1) | |
(a) Other relates primarily to other accruals that are individually not significant.
Cash used by investing activities — Net cash used by investing activities in 2022 was $99.1 million, a decrease of $25.4 million from 2021. The decrease is primarily due to decreased capital expenditures for HE and higher net proceeds received from the settlement of foreign currency forward exchange contracts, partially offset by a decrease in the proceeds from sales of assets.
Cash provided (used) by financing activities — Net cash used by financing activities in 2022 was $42.8 million, a decrease of $103.0 million from 2021. The decrease was primarily due to lower net cash borrowings of $107.7 million, resulting from the use of the AR Facility proceeds to reduce long-term debt.
Cash Requirements
The Company's expected future payments related to contractual obligations and commercial commitments at December 31, 2022 consist of:
•Principal payments related to our short-term borrowings and long-term debt obligations that are included in our Consolidated Balance Sheets. See Note 8, Debt and Credit Agreements in Part II, Item 8 Financial Statements and Supplementary Data for additional information on short-term borrowings and long-term debt. •Projected interest payments on long-term debt are anticipated to be approximately $89.7 million annually based upon borrowings, interest rates and foreign currency exchange rates at December 31, 2022. The interest rates on variable-rate debt and foreign currency exchange rates are subject to changes beyond the Company's control and may result in actual interest expense and payments differing from the projected amounts.
•Projected facility fee payments on the AR Facility are expected to be $7.6 million annually based on the drawn amount and rates at December 31, 2022. The rates are variable, and are subject to changes beyond the Company's control and may result in facility fees differing from the projected amounts.
•Purchase obligations representing legally binding obligations to purchase property, plant and equipment, inventory and other commitments made in the normal course of business to meet operations requirements. At December 31, 2022, the Company has $180.1 million of outstanding purchase commitments, of which $138.5 million will be fulfilled in the next twelve months, which includes commitments of $105.7 million related to the Rail business.
•Operating lease liabilities which are included in our Consolidated Balance Sheets. See Note 9, Leases in Part II, Item 8 Financial Statements and Supplementary Data for additional information. •Expected employer contributions to defined benefit pension plans for the next year. See Note 10, Employee Benefit Plans in Part II, Item 8 Financial Statements and Supplementary Data for additional information. •Expected net cash payable of $2.2 million representing the fair value of the foreign currency exchange contracts outstanding at December 31, 2022. The foreign currency exchange contracts are recorded on the Consolidated Balance Sheets at fair value. See Note 15, Financial Instruments in Part II, Item 8 Financial Statements and Supplementary Data, for additional information. •At December 31, 2022, in addition to the above contractual obligations, the Company had $4.1 million of potential long-term tax liabilities, including interest and penalties, related to uncertain tax positions. Because of the high degree of uncertainty regarding the future cash flows associated with these potential long-term tax liabilities, the Company is unable to estimate the years in which settlement will occur with the respective taxing authorities.
Off-Balance Sheet Arrangements
The following table summarizes the Company's contingent commercial commitments at December 31, 2022. These amounts are not included on the Consolidated Balance Sheets since there are no current circumstances known to management indicating that the Company will be required to make payments on these contingent commercial commitments.
Commercial Commitments at December 31, 2022
| | | | | | | | | | | | | | | | | | | | | | | | | | | | | | | | | | | | | | |
| | | | | Amount of Commercial Commitment Expiration Per Period |
| (In millions) | | Total | | Less than
1 Year | | 1-3
Years | | 3-5
Years | | Over 5
Years | | Indefinite
Expiration |
| Performance bonds | | $ | 303.9 | | | $ | 123.6 | | | $ | 154.9 | | | $ | 21.1 | | | $ | — | | | $ | 4.3 | |
| Standby letters of credit | | 80.5 | | | 60.8 | | | 16.8 | | | — | | | 3.0 | | | — | |
| Guarantees | | 115.9 | | | 0.2 | | | 1.3 | | | 3.6 | | | 106.9 | | | 3.9 | |
| | | | | | | | | | | | |
Total commercial commitments (a) | | $ | 500.3 | | | $ | 184.6 | | | $ | 173.0 | | | $ | 24.7 | | | $ | 109.9 | | | $ | 8.2 | |
(a) Includes total commitments of $377.9 million for the Rail business.
Certain commercial commitments that are of a continuous nature do not have an expiration date and are therefore considered to be indefinite in nature. See Note 15, Financial Instruments in Part II, Item 8, Financial Statements and Supplementary Data for additional information. Sources and Uses of Cash
The Company’s principal sources of liquidity are cash provided by operations and borrowings under the Senior Secured Credit Facilities, augmented by cash proceeds from asset sales. In addition, the Company has other bank credit facilities available throughout the world. The Company expects to continue to utilize all of these sources to meet future cash requirements for operations and growth initiatives.
| | | | | | | | | | | | | | |
Summary of Senior Secured Credit Facilities and Notes: (In millions) | | December 31
2022 | | December 31
2021 |
| By type: | | | | |
| Revolving Credit Facility | | $ | 370.0 | | | $ | 362.0 | |
| New Term Loan | | 492.5 | | | 497.5 | |
| 5.75% Senior Notes | | 475.0 | | | 500.0 | |
| Total | | $ | 1,337.5 | | | $ | 1,359.5 | |
| By classification: | | | | |
| Current | | $ | 5.0 | | | $ | 5.0 | |
| Long-term | | 1,332.5 | | | 1,354.5 | |
| Total | | $ | 1,337.5 | | | $ | 1,359.5 | |
Senior Secured Credit Facilities
In February 2022, the Company amended its Senior Credit Facilities to reset the levels of the net debt to consolidated adjusted EBITDA ratio covenant. As a result of this amendment, the total net debt to Consolidated Adjusted EBITDA ratio covenant was set at 5.50x for the quarter ending June 30, 2022, and decreases quarterly by 0.25x until reaching 4.00x for the quarter ending December 31, 2023 and thereafter. In addition, upon closing on the divestiture of the former Harsco Rail Segment, the total net debt to Consolidated Adjusted EBITDA ratio covenant will decrease by an additional 0.25x, provided, however, it will not go below 4.00x and a minimum Consolidated Adjusted EBITDA to consolidated interest charges ratio covenant, which is not to be less than 3.0x will be maintained.
In connection with entering into its AR Facility in June 2022, the Company amended its Senior Secured Credit Facilities to increase the permitted maximum outstanding amount of a securitization facility to $150.0 million. Certain other covenants and definitions were also modified to facilitate the AR Facility. The terms of the AR Facility are further described below under Other.
In August 2022, the Company amended its Revolving Credit Facility under its Credit Agreement to increase certain levels in the total net leverage covenant, temporarily reduce the ratio under the interest coverage covenant and add a new pricing level applicable to revolving credit loans. Revolving credit loans bear interest at a rate, depending on total net leverage, ranging from 50 to 175 basis points over base rate or 150 to 275 basis points over LIBOR, subject to a zero floor. The Company’s total net leverage is capped at 5.50x of Consolidated Adjusted EBITDA through the end of 2023; the maximum total net leverage ratio decreases quarterly thereafter, reaching 4.00x for the last quarter in 2024 and thereafter. The total net leverage ratio covenant applicable to the third quarter of 2024 and earlier is subject to a 0.50x decrease upon closing of the divestiture of the former Harsco Rail Segment. The Company’s required coverage of consolidated interest charges is set at a minimum of 2.75x of Consolidated Adjusted EBITDA through the end of 2024 (subject to an increase to 3.0x upon closing of the divestiture of the former Harsco Rail Segment), and leveling at 3.0x for the first quarter in 2025 and thereafter. Any principal amount outstanding under the Revolving Credit Facility remains due and payable on its maturity on March 10, 2026.
In December 2022, the Company amended its Senior Secured Credit Facilities to, among other things, change the base rate used in determining loan interest rates from LIBOR to SOFR. This change was in anticipation of the expected cessation of LIBOR in 2023 and in compliance with FASB guidance. In addition, a one-month benchmark adjustment of 11.4 basis points was added to the applicable margins for the Revolving Credit Facility and the New Term Loan, which modified them to 61.4 to 286.4 basis points over term SOFR for the Revolving Credit Facility and 236.4 basis points over term SOFR for the New Term Loan. The change did not have a material effect on the Company's consolidated financial statements.
During the years ended December 31, 2022, 2021 and 2020, the Company recognized $1.7 million, $5.5 million and $1.9 million, respectively, of fees and expenses related to amendments to the Senior Secured Credit Facilities in the caption Facility fees and debt-related income (expense) on the Consolidated Statements of Operations. The year ended December 31, 2021 includes a write-off of $2.7 million of previously recorded deferred financing costs.
The Credit Agreement imposes certain restrictions including, but not limited to, restrictions as to types and amounts of debt or liens that may be incurred by the Company; limitations on increases in dividend payments; limitations on repurchases of the Company's stock and limitations on certain acquisitions by the Company.
With respect to the Senior Secured Credit Facilities, the obligations of the Company are guaranteed by substantially all of the Company’s current and future wholly-owned domestic subsidiaries (“Guarantors”). All obligations under the Senior Credit Facility, and the guarantees of those obligations, are secured, subject to certain exceptions, by substantially all of the Company’s assets and the assets of the Guarantors.
The Credit Agreement requires certain mandatory prepayments for the New Term Loan, subject to certain exceptions, based on net cash proceeds of certain sales or distributions of assets, as well as certain casualty and condemnation events, in some cases subject to reinvestment rights and certain other exceptions; net cash proceeds of any issuance of debt, excluded permitted debt issuances; and a percentage of excess cash flow, as defined by the Credit Agreement, during a fiscal year.
Revolving Credit Facility
Borrowings under the U.S.-based Revolving Credit Facility bear interest at a rate per annum ranging from 50 to 175 basis points over base rate or 161.4 to 286.4 basis points over term SOFR, which includes a one month SOFR adjustment of 11.4 basis points, subject to a 0% floor. Any principal amount outstanding under the Revolving Credit Facility is due and payable on its maturity on March 10, 2026.
The following table shows the amount outstanding under the Revolving Credit Facility and available credit at December 31, 2022.
| | | | | | | | | | | | | | | | | | | | | | | | | | |
| | December 31, 2022 |
| (In thousands) | | Facility
Limit | | Outstanding
Balance | | Outstanding Letters of Credit | | Available
Credit |
| Revolving Credit Facility (a U.S.-based program) | | $ | 700,000 | | | 370,000 | | | 27,318 | | | $ | 302,682 | |
Other
In June 2022, the Company repurchased $25.0 million of its 5.75% Senior Notes on the open market at a discount for $22.4 million. The Company recognized a gain on the extinguishment of debt of $2.3 million, net of the write-off of $0.3 million of previously recorded deferred financing costs, in the caption Facility fees and debt-related income (expense) on the Condensed Consolidated Statements of Operations.
The Company maintains a trade receivables securitization facility to accelerate cash flows from trade receivables under its AR Facility. The Company and its designated subsidiaries continuously sell their trade receivables as they are originated to its SPE. The SPE transfers ownership and control of qualifying receivables to PNC Bank, up to a maximum purchase commitment of $150.0 million. During the year ended December 31, 2022, the Company received proceeds of $145.0 million from the AR Facility. The Company capitalized fees of $1.8 million related to the AR Facility, of which $0.3 million was expensed in the caption Facility fees and debt-related income (expense) on the Company's Consolidated Statements of Operations during the year ended December 31, 2022.
Certainty of Cash Flows
The majority of the Company's cash flows provided by operations has historically been generated in the second half of the year. The certainty of the Company's future cash flows is underpinned by the long-term nature of the Company's HE services contracts and the recurring nature of revenues within the Clean Earth Segment.
The types of products and services that the Company provides are not subject to rapid technological change, which increases the stability of related cash flows. Additionally, the Company believes each business in its portfolio is a leader in the industries and major markets the Company serves. Due to these factors, the Company is confident in the Company's future ability to generate positive cash flows from operations.
Debt Covenants
The Senior Secured Credit Facility contains a consolidated net debt to Consolidated Adjusted EBITDA ratio covenant, which is not to exceed 5.50x at December 31, 2022, and a minimum consolidated adjusted EBITDA to consolidated interest charges ratio covenant, which is not to be less than 2.75x. At December 31, 2022, the Company was in compliance with these covenants, with a net leverage ratio of 5.35x and an interest coverage ratio of 3.14x. Based on balances and covenants in effect at December 31, 2022, the Company could increase net debt by $36.6 million and still be in compliance with these debt covenants. Alternatively, Consolidated Adjusted EBITDA could decrease by $6.7 million or interest expense could increase by $10.9 million and the Company would remain in compliance with these covenants. The Company believes it will continue to maintain compliance with all covenants over the next twelve months based on its current outlook. However, the Company’s estimates of compliance with these covenants could change in the future with a continued deterioration in economic conditions, higher than forecasted interest rate increases, or an inability to successfully execute its plans by quarter to realize increased pricing and to implement cost reduction initiatives that substantially mitigate the impacts of inflation and other factors adversely impacting its realized operating margins.
Cash Management
The Company has various cash management systems throughout the world that centralize cash in various bank accounts where it is economically justifiable and legally permissible to do so. These centralized cash balances are then redeployed to other operations to reduce short-term borrowings and to finance working capital needs or capital expenditures. Due to the transitory nature of cash balances, they are normally invested in bank deposits that can be withdrawn at will or in very liquid short-term bank time deposits and government obligations. The Company's policy is to use the largest banks in the various countries in which the Company operates. The Company monitors the creditworthiness of banks and, when appropriate, will adjust banking operations to reduce or eliminate exposure to less creditworthy banks.
At December 31, 2022, the Company's consolidated cash and cash equivalents included $79.0 million held by non-U.S. subsidiaries. At December 31, 2022, approximately 17.5% of the Company's consolidated cash and cash equivalents had regulatory restrictions that would preclude the transfer of funds with and among subsidiaries. Non-U.S. subsidiaries also held $15.7 million of cash and cash equivalents in consolidated strategic ventures. The strategic venture agreements may require strategic venture partner approval to transfer funds with and among subsidiaries. While the Company's remaining non-U.S. cash and cash equivalents can be transferred with and among subsidiaries, the majority of these non-U.S. cash balances will be used to support the ongoing working capital needs and continued growth of the Company's non-U.S. operations.
Application of Critical Accounting Policies and Critical Accounting Estimates
The Company's discussion and analysis of its financial condition and results of operations are based upon the consolidated financial statements, which have been prepared in accordance with U.S. GAAP. The preparation of these consolidated financial statements requires the Company to make estimates and judgments that affect the reported amounts of assets, liabilities, revenues and expenses. On an ongoing basis, the Company evaluates its critical accounting estimates, including those related to defined benefit pension benefits, notes and accounts receivable, fair value estimates for business combinations and goodwill, long-lived asset impairment, revenue recognition - cost-to-cost method, and income taxes. The impact of changes in these estimates, as necessary, is reflected in the respective segment's results of operations in the period of the change. The Company bases estimates on historical experience and various other assumptions that are believed to be reasonable under the circumstances, the results of which form the basis for making judgments about the carrying values of assets and liabilities that are not readily apparent from other sources. Actual results may differ from these estimates under different outcomes, assumptions or conditions.
The Company believes the following critical accounting policies are affected by the Company's more significant judgments and estimates used in the preparation of the consolidated financial statements. Management has discussed the development and selection of the critical accounting estimates described below with the Audit Committee of the Board and they have reviewed the Company's disclosures relating to these estimates in this Management's Discussion and Analysis of Financial Condition. These items should be read in conjunction with Note 1, Summary of Significant Accounting Policies in Part II, Item 8, Financial Statements and Supplementary Data. Defined Benefit Pension Benefits
The Company has defined benefit pension plans in several countries. The largest of these plans are in the U.K. and the U.S. The Company's funding policy for these plans is to contribute amounts sufficient to meet the minimum funding pursuant to U.K. and U.S. statutory requirements, plus any additional amounts that the Company may determine to be appropriate.
Changes in the discount rate assumption and the actual performance of plan assets, compared with the expected long-term rate of return on plan assets, are the primary drivers in the change in funded status of the Company's defined benefit pension plans. These factors are components of actuarial loss (gain) and impact the amount recognized in OCI, as such actuarial changes are not reflected directly on the Consolidated Statements of Operations but amortized over time in accordance with U.S. GAAP.
Critical Estimate—Defined Benefit Pension Benefits
Accounting for defined benefit pension plans requires the use of actuarial assumptions. The principal assumptions used include the discount rate and the expected long-term rate of return on plan assets. Each assumption is reviewed annually and represents management's best estimate at that time. The assumptions are selected to represent the average expected experience over time and may differ, in any one year, from actual experience due to changes in capital markets and the overall economy. These differences will impact the amount of unfunded benefit obligation and the NPPC recognized.
The discount rates used in calculating the Company's projected benefit obligations at the December 31, 2022 measurement date for the U.K. and U.S. defined benefit pension plans were 5.0% and 5.3%, respectively, and the global weighted-average discount rate was 5.1%. The discount rates selected represent level-equivalent rates using the yield curve spot rates on a year-by-year expected cash flow basis, using yield curves of high-quality corporate bonds. Annual NPPC is determined using the discount rates at the beginning of the year. The discount rates for 2022 NPPC were 1.9% for the U.K. plan, 2.7% for the U.S. plans and 2.1% for the global weighted-average of plans.
The expected long-term rate of return on plan assets is determined by evaluating the asset return expectations with the Company's advisors as well as actual, long-term, historical results of asset returns for the pension plans. Generally, the NPPC increases as the expected long-term rate of return on assets decreases. For 2022 and 2021, the global weighted-average expected long-term rate of return on asset assumption was 4.7% and 5.1%, respectively. This rate was determined based on a model of expected asset returns for an actively managed portfolio.
Changes in NPPC may occur in the future due to changes in actuarial assumptions and due to changes in returns on plan assets resulting from financial market conditions. Holding all other assumptions constant, using December 31, 2022 plan data, a one-quarter percent increase or decrease in the discount rate and the expected long-term rate of return on plan assets would increase or decrease annual 2023 pre-tax defined benefit NPPC (expense) as follows:
| | | | | | | | | | | | | | |
| | Increase (Decrease) to 2023 NPPC |
| (In millions) | | U.S. Plans | | U.K. Plan |
| Discount rate | | | | |
| One-quarter percent increase | | $ | — | | | $ | (0.2) | |
| One-quarter percent decrease | | — | | | 0.2 | |
| Expected long-term rate of return on plan assets | | | | |
| One-quarter percent increase | | $ | (0.4) | | | $ | (1.4) | |
| One-quarter percent decrease | | 0.4 | | | 1.4 | |
Increases or decreases to net pension obligations may be required, should circumstances that affect these estimates change. Additionally, certain events could result in the pension obligation changing at a time other than the annual measurement date. This would occur when a benefit plan is amended or when plan curtailments or settlements occur.
Accounts Receivable
Accounts receivable are stated at net realizable value, which represents the face value of the receivable, less an allowance for expected credit losses. The allowance for expected credit losses is maintained for expected lifetime losses resulting from the inability or unwillingness of customers to make required payments.
The Company’s expected credit loss allowance methodology for accounts receivable is developed using historical collection experience, current and future economic and market conditions and a review of the current status of customers' trade accounts receivables. When required, the Company adjusts the loss-rate methodology to account for current conditions and reasonable and supportable expectations of future economic and market conditions. The Company generally assesses future economic conditions for a period which corresponds with the contractual life of its accounts receivable. Additionally, specific allowance amounts are established to record the appropriate provision for customers that have a higher probability of default.
At December 31, 2022 and 2021, trade accounts receivable of $264.4 million and $377.9 million, respectively, were net of reserves of $8.3 million and $11.7 million, respectively.
Critical Estimate—Notes and Accounts Receivable
A considerable amount of judgment is required to assess the realizability of receivables, including the current creditworthiness of each customer, related aging of past due balances and the facts and circumstances surrounding any non-payment. The Company's provisions for expected credit losses during 2022, 2021 and 2020 were $0.4 million, $0.6 million and $2.0 million, respectively.
On at least a quarterly basis, customer accounts are analyzed for collectability. Reserves are established based upon the expected credit loss allowance methodology noted above. Reserves are based on the facts available to the Company and are re-evaluated and adjusted as additional information becomes available. Specific issues are discussed with corporate management and any significant changes in reserve amounts or the write-off of balances must be approved by specifically designated corporate personnel. All approved items are monitored to ensure they are recorded in the proper period. Additionally, any significant changes in reserve balances are reviewed to ensure the proper corporate approval has occurred.
If the financial condition of the Company's customers were to deteriorate, resulting in their inability to make payments, additional allowances may be required. Conversely, an improvement in a customer's ability to make payments could result in a decrease of the allowance for expected credit losses. Changes in the allowance for expected credit losses related to both of these situations would be recorded through Operating income from continuing operations in the period the change was determined.
See Note 4, Accounts Receivable and Note Receivable in Part II, Item 8, Financial Statements and Supplementary Data for additional information.
Fair Value Estimates for Business Combinations and Goodwill
The Company accounts for business combinations using the acquisition method of accounting, which requires that once control is obtained, all assets acquired and liabilities assumed, including amounts attributable to noncontrolling interests, be recorded at their respective fair values at the date of acquisition.
The Company's goodwill balances were $759.3 million and $883.1 million at December 31, 2022 and 2021, respectively. The Company performs its annual goodwill impairment test as of October 1.
Critical Estimate—Business Combinations and Goodwill
The acquisition method of accounting requires the excess of purchase price over the fair values of identifiable assets and liabilities to be recorded as goodwill. The determination of fair value of assets acquired and liabilities assumed requires numerous estimates and assumptions with respect to the timing and amounts of cash flow projections, revenue growth rates, customer attrition rates, discount rates and useful lives. Such estimates are based upon assumptions believed to be reasonable and, when appropriate, include assistance from independent third-party valuation firms. During the measurement period, which is up to one year from the acquisition date, the Company may record adjustments to the assets acquired and liabilities assumed, with corresponding offsets to goodwill.
In accordance with U.S. GAAP, goodwill is not amortized and is tested for impairment at least annually or more frequently if indicators of impairment exist or if a decision is made to dispose of a business. Goodwill is allocated among and evaluated for impairment at the reporting unit level, which is defined as an operating segment or one level below an operating segment for which discrete financial information is available. A significant amount of judgment is involved in determining if an indicator of impairment has occurred. Such indicators may include declining cash flows or operating losses at the reporting unit level, a significant adverse change in legal factors or in the business climate, an adverse action or assessment by a regulator, unanticipated competition, a loss of key personnel or a more likely than not expectation that a reporting unit or a significant portion of a reporting unit will be sold or otherwise disposed of, among others.
In applying the goodwill impairment test, the Company has the option to perform a qualitative test or a quantitative test. Under the qualitative test, the Company assesses qualitative factors to determine whether it is more likely than not that the fair value of the reporting units is less than its carrying value. Qualitative factors may include, but are not limited to, economic conditions, industry and market considerations, cost factors, overall financial performance of the reporting unit and other entity and reporting unit specific events. If, after assessing these qualitative factors, the Company determines it is “more-likely-than-not” that the fair value of the reporting unit is less than the carrying value, the Company would perform a quantitative test.
The quantitative approach of testing for goodwill impairment involves comparing the current fair value of each reporting unit to the net book value, including goodwill. The Company primarily uses a discounted cash flow model (“DCF model”) to estimate the current fair value of reporting units. The Company will apply the DCF model to the reporting units in its operating segments since the Company believes forecasted operating cash flows are the best indicator of current fair value. A number of significant assumptions and estimates are involved in the preparation of DCF models including future revenues, operating margin growth, the weighted-average cost of capital (“WACC”), tax rates, capital spending, pension funding, the impact of business initiatives and working capital projections. These assumptions and estimates may vary significantly among reporting units. DCF models are based on approved long-range plans for the early years and historical relationships and projections for later years. WACC rates are derived from internal and external factors including, but not limited to, the average market price of the Company's stock, shares outstanding, book value of the Company's debt, the long-term risk-free interest rate, and both market and size-specific risk premiums. Due to the many variables noted above and the relative size of the Company's goodwill, differences in assumptions may have a material impact on the results of the Company's annual goodwill impairment testing. If the net book value of a reporting unit were to exceed the current fair value, then an impairment charge would be recognized as the difference between the fair value and the net book value.
The Company may elect to apply the market approach to estimate the current fair value of reporting units in instances where a reporting unit is in the process of being sold, since current fair value information is readily available.
During the second quarter of 2022, the Company determined that an interim test of goodwill was required. The triggering event was principally due to lower earnings expectations due to the impacts of inflation. As a result of this interim testing, a goodwill impairment charge of $104.6 million was recorded for the Clean Earth reporting unit, which is included in Goodwill and other intangible asset impairment charges on the Consolidated Statements of Operations for the year-ended December 31, 2022.
The performance of the Company's 2022 annual impairment tests did not result in any impairment of the Company's goodwill.
The Harsco Environmental reporting unit's estimated fair value at October 1, 2022 was approximately 13% more than the net book value. The goodwill allocated to the Harsco Environmental reporting unit, which is defined as the Harsco Environmental Segment, is $380.0 million at December 31, 2022. The related DCF model for this reporting unit included several key assumptions related to certain price increases and expected realizable cost savings. Significant assumptions utilized in the DCF model include a WACC of 12.0%, an average annual revenue growth rate of 3% and average annual free cash flow growth rate of 3%. Assuming all other factors remain the same, a 100-basis point increase in the discount rate would decrease the excess of estimated fair value over net book value to 3%; and, a 1% decrease in the average annual free cash flow growth rate would decrease the excess of estimated fair value over net book value to 4%.
The Harsco Clean Earth reporting unit's estimated fair value at October 1, 2022 was approximately 9% more than the net book value. The goodwill allocated to the Harsco Clean Earth reporting unit, which is defined as the Harsco Clean Earth Segment, is $379.3 million at December 31, 2022. The related DCF model for this reporting unit included several key assumptions related to certain price increases and expected realizable cost savings. Significant assumptions utilized in the DCF model include a WACC of 12.5%, an average annual revenue growth rate of 4% and average annual free cash flow growth rate of 7%. Assuming all other factors remain the same, a 100-basis point increase in the discount rate would reduce the estimated fair value to 1% below the net book value; and a 1% decrease in average annual free cash flow growth would reduce the estimated fair value to 1% below the net book value.
Long-lived Asset Impairment (Other than Goodwill)
Long-lived assets (or asset groups) are reviewed for impairment when events and circumstances indicate that the book value of an asset (or asset group) may be impaired. The amounts charged against pre-tax income from continuing operations related to impaired long-lived assets (or asset groups), other than definite-lived intangibles, included in Other (income) expenses, net on the Consolidated Statements of Operations were $0.6 million, $1.0 million and $0.8 million in 2022, 2021 and 2020, respectively. The amounts charged against pre-tax income from continuing operations related to impaired definite-lived intangibles included in Goodwill and other intangible asset impairment charges on the Consolidated Statements of Operations were $15.0 million in 2022. There were no definite-lived intangible impairment charges in 2021 and 2020.
Critical Estimate—Asset Impairment
The determination of a long-lived asset (or asset group) impairment involves significant judgments based upon short-term and long-term projections of future asset (or asset group) performance. If the undiscounted cash flows associated with an asset (or asset group) do not exceed the asset's book value, impairment loss estimates would be based upon the difference between the book value and fair value of the asset (or asset group). The fair value is generally based upon the Company's estimate of the amount that the assets (or asset group) could be bought or sold for in a transaction between willing parties. If quoted market prices for the asset (or asset group) or similar assets are unavailable, the fair value estimate is generally calculated using a DCF model. Should circumstances change that affect these estimates, additional impairment charges may be required and would be recorded through income in the period the change was determined.
There were no significant changes to the Company's methodology for calculating long-lived asset impairments for the years presented. U.S. GAAP requires consideration of all valuation techniques for which market participant inputs can be obtained without undue cost and effort. The use of a DCF model continues to be an appropriate method for determining fair value; however, methodologies such as quoted market prices must also be evaluated.
Based on the current economic conditions, to include inflation and higher energy prices, the Company lowered its long-range projections for the Altek Group of the Harsco Environmental Segment. Due to the lower revenue projections, the Company tested the recoverability of Altek's asset group in the fourth quarter of 2022. The asset group primarily consists of technology and customer-related intangible assets. Undiscounted estimated cash flows of the Altek asset group were lower than the carrying value, therefore, the Company used a DCF model to estimate the current fair value of the Altek asset group (Level 3). A number of significant assumptions and estimates are involved in the preparation of DCF models including future revenues and operating margin growth, the WACC, capital spending, and the impact of business initiatives and working capital projections. The DCF model is based on approved forecasts for the early years and historical relationships and projections for later years. The WACC rate is based on the Company's WACC, adjusted for market participant assumptions. As a result of this testing, an impairment charge of $15.0 million was recorded, which is included in Goodwill and other intangible asset impairment charges on the Consolidated Statements of Operations for the year-ended December 31, 2022. The carrying value of the intangible assets, after the impairment charge, is $15.3 million at December 31, 2022.
See Note 7 Goodwill and Other Intangible Assets and Note 18, Other (Income) Expenses, Net in Part II, Item 8, Financial Statements and Supplementary Data, for additional information.
Revenue Recognition - Cost-to-Cost Method
For certain contracts with customers, which meet specific criteria established in U.S. GAAP, the Company recognizes revenue on an over time basis utilizing an input method based on costs incurred (“cost-to-cost method”) to measure progress, which requires the Company to make estimates regarding the revenues and costs associated with design, manufacturing and delivery of products.
Critical Estimate-Revenue Recognition - Cost-to-Cost Method
The Company uses the cost-to-cost method to measure progress because it is the measure that best depicts the transfer of control to the customer, which occurs as the Company incurs costs under the contracts. Under the cost-to-cost method, the extent of progress towards completion is based on the ratio of costs incurred to total estimated costs at completion which includes both actual costs already incurred and the estimated costs to complete. Accounting for contracts with customers using the cost-to-cost method requires significant judgment relative to assessing risks, estimating contract revenues (including estimates of variable consideration, if applicable, as well as estimating any liquidating damages or penalties related to performance); estimating contract costs (including estimating engineering costs to design the machine and the material, labor and overhead manufacturing costs to build the machine); making assumptions for schedule and technical items; properly executing the engineering and design phases consistent with customer expectations; the availability and costs of labor and material resources; productivity; and evaluating whether a significant financing component is present. Due to the number of years it may take to complete certain contracts and the scope and nature of the work required to be performed on those contracts, primarily in Rail, estimating total revenues and costs at completion is inherently complicated and subject to many variables. Accordingly, estimates are subject to change as experience is gained and as more information is obtained, even though the scope of the work under the contract may not have changed. When adjustments in estimated total contract sales or estimated total costs are required, any changes from prior estimates are recognized in current period earnings for the inception-to-date effect of such changes. When estimates of total costs to be incurred on a contract using the cost-to-cost method exceed estimates of total sales to be earned, a provision for the entire loss on the contract is recorded in current period earnings when the loss is determined. Railway track maintenance equipment revenue of approximately $50.0 million was recognized using the cost-to-cost method in 2022, the net profit or loss of which is included, in Income (loss) from discontinued businesses in the Consolidated Statements of Operations.
Rail is currently manufacturing highly-engineered equipment under large long-term fixed-price contracts with Network Rail, Deutsche Bahn and SBB. As previously disclosed, in the fourth quarter of 2021, the Company recognized an estimated forward loss provision of $33.4 million. In 2022, the Company encountered continued supply chain-related delays and additional costs in building the machines.
For the Network Rail contracts, the Company encountered supply chain delays in the build of the initial machine and there
were further changes to the production schedule based on the manufacturing experience gained from assembling the first unit
during the first quarter of 2022, which had a cascading effect on the delivery schedule of remaining machines. During 2022, the Company recorded additional forward loss provisions of $29.1 million, principally for additional estimated contractual liquidated damages as a reduction of revenue, of which $24.2 million was recorded in the first quarter of 2022, $0.3 million was recorded during the second quarter of 2022 and the remaining $4.6 million recorded in the fourth quarter of 2022. The Company continues to negotiate with Network Rail regarding a reduction to these liquidated damages, which could result in additional favorable or unfavorable adjustments in future periods.
For the Deutsche Bahn contract, in March 2022 a European-based supplier of critical components to the project, indicated it would be significantly late on the delivery of these components to the project, which has the impact of delaying the overall delivery schedule for the project. Additionally, this supplier filed for bankruptcy during the second quarter of 2022, although it continues to operate. Delays impacting the project, along with rising costs, resulted in additional estimated forward loss provision of $7.5 million in the first quarter of 2022 and $4.0 million was recorded during the fourth quarter of 2022 for a total loss provision of $11.5 million in 2022, of which $3.1 million is due to the estimated contractual penalties that would be triggered by the delay and, thus, was recorded as a reduction of revenue. Should this supplier cease operations, the Company may incur further losses if there are additional costs to change suppliers or an inability to recover the value of prepayments made to the supplier, as well as additional penalties and damages under the contract with Deutsche Bahn in the event of further production delays.
For the second SBB contract, the Company recorded an additional $3.5 million forward estimated loss provision during the first quarter of 2022 due to additional supply chain delays and cost overruns.
The estimated forward loss provisions represent the Company's best estimate based on currently available information. It is
possible that the Company's overall estimate of liquidated damages, penalties and costs to complete these contracts may change,
which could result in an additional estimated forward loss provision at such time.
The first contract with SBB is complete, and the second contract with SBB is 83% complete as of December 31, 2022. The contracts with Network Rail and Deutsche Bahn are 50% and 32% complete, respectively, as of December 31, 2022.
Income Taxes
The Company's income tax expense, deferred tax assets and liabilities and reserves for uncertain tax positions reflect management's best estimate of taxes to be paid. The Company is subject to various international, federal, state and local income taxes in jurisdictions where the Company operates. In determining income tax expense, the Company makes its best estimate of the annual effective income tax rate at the end of each quarter and applies that rate to year-to-date income (loss) before income taxes to arrive at the year-to-date income tax provision (exclusive of loss jurisdictions for which no tax benefit is realizable with any discrete tax items recorded separately). At December 31, 2022, 2021 and 2020, the Company's annual effective income tax rate on income from continuing operations was (8.4)%, 24.2% and 16.0%, respectively.
Critical Estimate—Income Taxes
Annual effective income tax rates are estimated by giving recognition to currently enacted tax rates, tax holidays, tax credits, capital losses and tax deductions as well as certain exempt income and non-deductible expenses for all jurisdictions where the Company operates. Quarterly income tax provisions incorporate any change in the year-to-date provision from the previous quarterly periods.
The Company records deferred tax assets to the extent the Company believes these assets will more likely than not be realized. In making such determinations, the Company considers all available evidence, including future reversals of existing deferred tax liabilities, projected future taxable income, feasible and prudent tax planning strategies and recent financial operating results. If the Company determines that it will not be able to realize deferred income tax assets in the future, a valuation allowance is recorded. If sufficient positive evidence arises in the future indicating that all or a portion of the deferred tax assets meet the more likely than not standard for realization, the valuation allowance would be reduced accordingly in the period that such a conclusion is reached.
Valuation allowances of $89.2 million and $92.4 million at December 31, 2022 and 2021, respectively, related principally to deferred tax assets for pension liabilities, NOLs, disallowed interest expense and foreign currency translation that are uncertain as to realizability. At December 31, 2022, the Company recorded a valuation allowance reduction of $7.1 million related to current year pension adjustments recorded through AOCI, a valuation allowance reduction of $6.4 million from the effects of foreign currency translation adjustments and a valuation allowance reduction of $4.3 million related to the tax rate reduction in certain jurisdiction in U.S., partially offset by a $5.2 million valuation allowance increase related to current year losses in certain foreign jurisdictions where the Company determined that it is more likely than not that these assets will not be realized, and a $8.9 million valuation allowance increase related to disallowed interest expense.
An income tax benefit from an uncertain tax position may be recognized when it is more likely than not that the position will be sustained upon examination, including resolutions of any related appeals or litigation processes, based on its technical merits. The unrecognized tax benefits at December 31, 2022 and 2021 were $2.8 million and $3.1 million, respectively, excluding accrued interest and penalties. The unrecognized income tax benefit may decrease as a result of the lapse of statute of limitations or as a result of final settlement and resolution of outstanding tax matters in various state and international jurisdictions.
The Company did not significantly change the methodology for calculating income tax expense, deferred tax assets and liabilities and reserves for uncertain tax positions for the years presented or for quarterly periods. See Note 11, Income Taxes in Part II, Item 8, Financial Statements and Supplementary Data, for additional information.
Recently Adopted and Recently Issued Accounting Standards
Information on recently adopted and recently issued accounting standards is included in Note 2, Recently Adopted and Recently Issued Accounting Standards, in Part II, Item 8, Financial Statements and Supplementary Data.
Item 7A. Quantitative and Qualitative Disclosures About Market Risk.
See the Risk Factors captioned "Exchange rate fluctuations may adversely impact the Company's business," "The Company is exposed to counterparty risk in its derivative financial arrangements" and "The Company's variable rate indebtedness subjects it to interest rate risk, which could cause the Company's debt service obligations to increase significantly" in Part I, Item 1A, Risk Factors, for quantitative and qualitative disclosures about market risk.
Item 8. Financial Statements and Supplementary Data.
Index to Consolidated Financial Statements and Supplementary Data
| | | | | |
| | Page |
| Consolidated Financial Statements of Harsco Corporation: | |
| |
| |
| |
| |
| |
| |
| |
| |
| |
| |
| |
Management's Report on Internal Control Over Financial Reporting
Management of Harsco Corporation, together with its consolidated subsidiaries (the "Company"), is responsible for establishing and maintaining adequate internal control over financial reporting, as defined in Securities Exchange Act of 1934 Rule 13a-15(f) or 15d-15(f). The Company's internal control over financial reporting is a process designed under the supervision of the Company's Chief Executive Officer and Chief Financial Officer to provide reasonable assurance regarding the reliability of financial reporting and the preparation of the Company's consolidated financial statements for external reporting purposes in accordance with accounting principles generally accepted in the United States of America.
The Company's internal control over financial reporting includes policies and procedures that:
•Pertain to the maintenance of records that, in reasonable detail, accurately and fairly reflect transactions and dispositions of assets of the Company;
•Provide reasonable assurance that transactions are recorded as necessary to permit preparation of consolidated financial statements in accordance with accounting principles generally accepted in the United States of America, and that receipts and expenditures of the Company are being made only in accordance with authorizations of management and the directors of the Company; and
•Provide reasonable assurance regarding prevention or timely detection of unauthorized acquisition, use or disposition of the Company's assets that could have a material effect on the Company's consolidated financial statements.
Because of its inherent limitations, internal control over financial reporting may not prevent or detect misstatements. Also, projections of any evaluation of effectiveness to future periods are subject to the risk that controls may become inadequate because of changes in conditions, or that the degree of compliance with the policies and procedures may deteriorate.
Management has assessed the effectiveness of its internal control over financial reporting as of December 31, 2022 based on the framework established in Internal Control—Integrated Framework (2013) issued by the Committee of Sponsoring Organizations of the Treadway Commission (COSO). Based on this assessment, management has determined that the Company's internal control over financial reporting was effective as of December 31, 2022.
The effectiveness of the Company's internal control over financial reporting as of December 31, 2022 has been audited by PricewaterhouseCoopers LLP, an independent registered public accounting firm, as stated in their report appearing in Part II, Item 8 of this Annual Report on Form 10-K.
| | | | | | | | |
| /s/ F. NICHOLAS GRASBERGER III | | /s/ PETER F. MINAN |
F. Nicholas Grasberger III Chairman, President and Chief Executive Officer | | Peter F. Minan Senior Vice President and Chief Financial Officer |
| March 1, 2023 | | March 1, 2023 |
Report of Independent Registered Public Accounting Firm
To the Stockholders and Board of Directors of Harsco Corporation
Opinions on the Financial Statements and Internal Control over Financial Reporting
We have audited the accompanying consolidated balance sheets of Harsco Corporation and its subsidiaries (the “Company”) as of December 31, 2022 and 2021, and the related consolidated statements of operations, of comprehensive income (loss), of changes in equity and of cash flows for each of the three years in the period ended December 31, 2022, including the related notes and financial statement schedule listed in the index appearing under Item 15(a)(2) (collectively referred to as the “consolidated financial statements”). We also have audited the Company's internal control over financial reporting as of December 31, 2022, based on criteria established in Internal Control - Integrated Framework (2013) issued by the Committee of Sponsoring Organizations of the Treadway Commission (COSO).
In our opinion, the consolidated financial statements referred to above present fairly, in all material respects, the financial position of the Company as of December 31, 2022 and 2021, and the results of its operations and its cash flows for each of the three years in the period ended December 31, 2022 in conformity with accounting principles generally accepted in the United States of America. Also in our opinion, the Company maintained, in all material respects, effective internal control over financial reporting as of December 31, 2022, based on criteria established in Internal Control - Integrated Framework (2013) issued by the COSO.
Basis for Opinions
The Company's management is responsible for these consolidated financial statements, for maintaining effective internal control over financial reporting, and for its assessment of the effectiveness of internal control over financial reporting, included in the accompanying Management’s Report on Internal Control Over Financial Reporting. Our responsibility is to express opinions on the Company’s consolidated financial statements and on the Company's internal control over financial reporting based on our audits. We are a public accounting firm registered with the Public Company Accounting Oversight Board (United States) (PCAOB) and are required to be independent with respect to the Company in accordance with the U.S. federal securities laws and the applicable rules and regulations of the Securities and Exchange Commission and the PCAOB.
We conducted our audits in accordance with the standards of the PCAOB. Those standards require that we plan and perform the audits to obtain reasonable assurance about whether the consolidated financial statements are free of material misstatement, whether due to error or fraud, and whether effective internal control over financial reporting was maintained in all material respects.
Our audits of the consolidated financial statements included performing procedures to assess the risks of material misstatement of the consolidated financial statements, whether due to error or fraud, and performing procedures that respond to those risks. Such procedures included examining, on a test basis, evidence regarding the amounts and disclosures in the consolidated financial statements. Our audits also included evaluating the accounting principles used and significant estimates made by management, as well as evaluating the overall presentation of the consolidated financial statements. Our audit of internal control over financial reporting included obtaining an understanding of internal control over financial reporting, assessing the risk that a material weakness exists, and testing and evaluating the design and operating effectiveness of internal control based on the assessed risk. Our audits also included performing such other procedures as we considered necessary in the circumstances. We believe that our audits provide a reasonable basis for our opinions.
Definition and Limitations of Internal Control over Financial Reporting
A company’s internal control over financial reporting is a process designed to provide reasonable assurance regarding the reliability of financial reporting and the preparation of financial statements for external purposes in accordance with generally accepted accounting principles. A company’s internal control over financial reporting includes those policies and procedures that (i) pertain to the maintenance of records that, in reasonable detail, accurately and fairly reflect the transactions and dispositions of the assets of the company; (ii) provide reasonable assurance that transactions are recorded as necessary to permit preparation of financial statements in accordance with generally accepted accounting principles, and that receipts and expenditures of the company are being made only in accordance with authorizations of management and directors of the company; and (iii) provide reasonable assurance regarding prevention or timely detection of unauthorized acquisition, use, or disposition of the company’s assets that could have a material effect on the financial statements.
Because of its inherent limitations, internal control over financial reporting may not prevent or detect misstatements. Also, projections of any evaluation of effectiveness to future periods are subject to the risk that controls may become inadequate because of changes in conditions, or that the degree of compliance with the policies or procedures may deteriorate.
Critical Audit Matters
The critical audit matters communicated below are matters arising from the current period audit of the consolidated financial statements that were communicated or required to be communicated to the audit committee and that (i) relate to accounts or disclosures that are material to the consolidated financial statements and (ii) involved our especially challenging, subjective, or complex judgments. The communication of critical audit matters does not alter in any way our opinion on the consolidated financial statements, taken as a whole, and we are not, by communicating the critical audit matters below, providing separate opinions on the critical audit matters or on the accounts or disclosures to which they relate.
Goodwill Impairment Assessments – Environmental and Clean Earth Reporting Units
As described in Notes 1 and 7 to the consolidated financial statements, the Company’s consolidated goodwill balance was $759 million as of December 31, 2022, and the goodwill associated with the Environmental and Clean Earth reporting units was $380 million and $379 million, respectively. The Company performs the annual goodwill impairment test as of October 1, or more frequently if indicators of impairment exist or if a decision is made to dispose of a business. If after assessing qualitative factors, the Company determines it is “more-likely-than-not” that the fair value of the reporting unit is less than the carrying value, the Company would compare the current fair value of the reporting unit to the carrying value, including goodwill. As of June 30, 2022, the Company determined that an interim test of goodwill was required. The triggering event was principally due to lower earnings expectations due to the impacts of inflation. As a result of this test, the Company recorded a goodwill impairment charge of $104.6 million for the Clean Earth reporting unit in the second quarter of 2022. The performance of the Company's 2022 annual impairment tests did not result in any impairment of the Company's goodwill. The Company used a discounted cash flow model to estimate the current fair value of the reporting units. A number of significant assumptions and estimates are involved in the preparation of the discounted cash flow model, including future revenues, operating margin growth, the weighted-average cost of capital, tax rates, capital spending, pension funding, the impact of business initiatives and working capital projections.
The principal considerations for our determination that performing procedures relating to the goodwill impairment assessments of the Environmental and Clean Earth reporting units is a critical audit matter are (i) the significant judgment by management when developing the fair value estimate of the reporting units; (ii) a high degree of auditor judgment, subjectivity, and effort in performing procedures and evaluating management’s significant assumptions related to future revenues, operating margin growth, and the weighted-average cost of capital; and (iii) the audit effort involved the use of professionals with specialized skill and knowledge.
Addressing the matter involved performing procedures and evaluating audit evidence in connection with forming our overall opinion on the consolidated financial statements. These procedures included testing the effectiveness of controls relating to management’s goodwill impairment assessments, including controls over the valuation of the Environmental and Clean Earth reporting units. These procedures also included, among others (i) testing management’s process for developing the fair value estimate of the reporting units; (ii) evaluating the appropriateness of the discounted cash flow model; (iii) testing the completeness and accuracy of underlying data used in the discounted cash flow model; and (iv) evaluating the reasonableness of the significant assumptions used by management related to future revenues, operating margin growth, and the weighted-average cost of capital. Evaluating management’s assumptions related to future revenues and operating margin growth involved evaluating whether the assumptions used by management were reasonable considering (i) the current and past performance of the reporting units; (ii) the consistency with external market and industry data; and (iii) whether these assumptions were consistent with evidence obtained in other areas of the audit. Professionals with specialized skill and knowledge were used to assist in evaluating the appropriateness of the discounted cash flow model and the reasonableness of the weighted-average cost of capital assumption.
Revenue Recognition using the Cost-to-Cost Method - Harsco Rail
As described in Notes 1 and 3 to the consolidated financial statements, Harsco Rail’s total product revenues were $216 million for the year ended December 31, 2022, which included approximately $50 million related to revenue recognized over time using the cost-to-cost method. The Company uses the cost-to-cost method to measure progress because management believes it is the measure that best depicts the transfer of control to the customer, which occurs as costs are incurred under the contracts. Accounting for contracts with customers using the cost-to-cost method requires significant judgment relative to assessing risks; estimating contract revenues (including estimates of variable consideration, if applicable, as well as estimating any liquidating damages or penalties related to performance); estimating contract costs (including estimating engineering costs to design the machine and the material, labor and overhead manufacturing costs to build the machine); making assumptions for schedule and
technical items; properly executing the engineering and design phases consistent with customer expectations; the availability and costs of labor and material resources; productivity; and evaluating whether a significant financing component is present.
The principal considerations for our determination that performing procedures relating to revenue recognition using the cost-to-cost method for Harsco Rail is a critical audit matter are (i) the significant judgment by management when developing the estimated variable consideration and the costs to complete contracts and (ii) a high degree of auditor judgment, subjectivity, and effort in performing procedures and evaluating management’s significant assumptions related to estimating liquidating damages and estimating the engineering costs to design the machine and the manufacturing costs to build the machine.
Addressing the matter involved performing procedures and evaluating audit evidence in connection with forming our overall opinion on the consolidated financial statements. These procedures included testing the effectiveness of controls relating to the revenue recognition process, including controls over the determination of estimated contract revenues and costs. These procedures also included, among others, testing management’s process for developing the estimated variable consideration and the costs to complete for certain open contracts, which included evaluating the reasonableness of the significant assumptions used by management related to estimating liquidating damages and estimating the engineering costs to design the machine and the manufacturing costs to build the machine. Evaluating the reasonableness of the assumption related to estimating liquidating damages involved assessing the likelihood and amount of relief that will be negotiated with the customer. Evaluating the reasonableness of the assumption related to estimating the engineering and manufacturing costs involved considering (i) the costs to complete a contract, including comparing the actual cost of completed contracts to the estimated cost at completion for similar contracts; (ii) using actual costs to date to assess the reasonableness of the estimate of the remaining costs to complete the contract; and (iii) physically observing the progress of open contracts.
/s/ PricewaterhouseCoopers LLP
Philadelphia, Pennsylvania
March 1, 2023
We have served as the Company’s auditor since at least 1933. We have not been able to determine the specific year we began serving as auditor of the Company.
HARSCO CORPORATION
CONSOLIDATED BALANCE SHEETS
| | | | | | | | | | | | | | |
| (In thousands, except share amounts) | | December 31
2022 | | December 31
2021 |
| ASSETS | | | | |
| Current assets: | | | | |
| Cash and cash equivalents | | $ | 81,332 | | | $ | 82,908 | |
| Restricted cash | | 3,762 | | | 4,220 | |
| Trade accounts receivable, net | | 264,428 | | | 377,881 | |
| | | | |
| Other receivables | | 25,379 | | | 33,059 | |
| Inventories | | 81,375 | | | 70,493 | |
| | | | |
| Prepaid expenses | | 30,583 | | | 31,065 | |
| Current portion of assets held-for-sale | | 266,335 | | | 265,413 | |
| Other current assets | | 14,541 | | | 9,934 | |
| Total current assets | | 767,735 | | | 874,973 | |
| | | | |
| Property, plant and equipment, net | | 656,875 | | | 653,913 | |
| Right-of-use assets, net | | 101,253 | | | 101,576 | |
| Goodwill | | 759,253 | | | 883,109 | |
| Intangible assets, net | | 352,160 | | | 402,801 | |
| | | | |
| Deferred income tax assets | | 17,489 | | | 17,883 | |
| Assets held-for-sale | | 70,105 | | | 71,234 | |
| Other assets | | 65,984 | | | 48,419 | |
| Total assets | | $ | 2,790,854 | | | $ | 3,053,908 | |
| LIABILITIES | | | | |
| Current liabilities: | | | | |
| Short-term borrowings | | $ | 7,751 | | | $ | 7,748 | |
| Current maturities of long-term debt | | 11,994 | | | 10,226 | |
| Accounts payable | | 205,577 | | | 186,126 | |
| Accrued compensation | | 43,595 | | | 48,165 | |
| Income taxes payable | | 3,640 | | | 6,378 | |
| | | | |
| | | | |
| | | | |
| Current portion of operating lease liabilities | | 25,521 | | | 25,590 | |
| Current portion of liabilities of assets held-for-sale | | 159,004 | | | 161,999 | |
| Other current liabilities | | 140,199 | | | 155,159 | |
| Total current liabilities | | 597,281 | | | 601,391 | |
| Long-term debt | | 1,336,995 | | | 1,359,446 | |
| | | | |
| | | | |
| Retirement plan liabilities | | 46,601 | | | 93,693 | |
| | | | |
| | | | |
| | | | |
| Operating lease liabilities | | 75,246 | | | 74,571 | |
| Liabilities of assets held-for-sale | | 9,463 | | | 8,492 | |
| Environmental liabilities | | 26,880 | | | 28,435 | |
| Deferred tax liabilities | | 30,069 | | | 33,826 | |
| Other liabilities | | 45,277 | | | 48,284 | |
| Total liabilities | | 2,167,812 | | | 2,248,138 | |
| COMMITMENTS AND CONTINGENCIES | | | | |
| HARSCO CORPORATION STOCKHOLDERS' EQUITY | | | | |
| | | | |
Common stock, par value $1.25 (issued 116,358,520 and 115,906,393 shares at December 31, 2022 and 2021, respectively) | | 145,448 | | | 144,883 | |
| Additional paid-in capital | | 225,759 | | | 215,528 | |
| Accumulated other comprehensive loss | | (567,636) | | | (560,139) | |
| Retained earnings | | 1,614,441 | | | 1,794,510 | |
Treasury stock, at cost (36,868,880 and 36,690,847 shares at December 31, 2022 and 2021, respectively) | | (848,570) | | | (846,622) | |
| Total Harsco Corporation stockholders' equity | | 569,442 | | | 748,160 | |
| Noncontrolling interests | | 53,600 | | | 57,610 | |
| Total equity | | 623,042 | | | 805,770 | |
| Total liabilities and equity | | $ | 2,790,854 | | | $ | 3,053,908 | |
See accompanying notes to consolidated financial statements.
HARSCO CORPORATION
CONSOLIDATED STATEMENTS OF OPERATIONS
| | | | | | | | | | | | | | | | | | | | | | |
| | | Years ended December 31 | | |
| (In thousands, except per share amounts) | | 2022 | | 2021 | | 2020 | | |
| Revenues from continuing operations: | | | | | | | | |
| | | | | | | | |
| | | | | | | | |
| Revenues | | $ | 1,889,065 | | | $ | 1,848,399 | | | $ | 1,534,033 | | | |
| Costs and expenses from continuing operations: | | | | | | | | |
| | | | | | | | |
| | | | | | | | |
| Cost of sales | | 1,553,335 | | | 1,490,556 | | | 1,242,291 | | | |
| Selling, general and administrative expenses | | 268,066 | | | 272,233 | | | 284,442 | | | |
| Research and development expenses | | 690 | | | 956 | | | 534 | | | |
| Goodwill and other intangible asset impairment charges | | 119,580 | | | — | | | — | | | |
| Other (income) expenses, net | | 4,737 | | | (3,722) | | | 10,072 | | | |
| Total costs and expenses | | 1,946,408 | | | 1,760,023 | | | 1,537,339 | | | |
| Operating income (loss) from continuing operations | | (57,343) | | | 88,376 | | | (3,306) | | | |
| Interest income | | 3,559 | | | 2,231 | | | 2,129 | | | |
| Interest expense | | (75,156) | | | (63,235) | | | (58,196) | | | |
| Facility fees and debt-related income (expense) | | (2,956) | | | (5,506) | | | (1,920) | | | |
| Defined benefit pension income (expense) | | 8,938 | | | 15,640 | | | 7,073 | | | |
| Income (loss) from continuing operations before income taxes and equity income | | (122,958) | | | 37,506 | | | (54,220) | | | |
| Income tax benefit (expense) from continuing operations | | (10,381) | | | (9,089) | | | 8,673 | | | |
| Equity in income (loss) of unconsolidated entities, net | | (178) | | | (302) | | | 186 | | | |
| Income (loss) from continuing operations | | (133,517) | | | 28,115 | | | (45,361) | | | |
| Discontinued operations: | | | | | | | | |
| Gain on sale of discontinued businesses | | — | | | — | | | 18,281 | | | |
| Income (loss) from discontinued businesses | | (50,301) | | | (25,863) | | | 20,350 | | | |
| Income tax benefit (expense) from discontinued businesses | | 7,387 | | | 477 | | | (15,245) | | | |
| Income (loss) from discontinued operations, net of tax | | (42,914) | | | (25,386) | | | 23,386 | | | |
| Net income (loss) | | (176,431) | | | 2,729 | | | (21,975) | | | |
| Less: Net income attributable to noncontrolling interests | | (3,638) | | | (5,978) | | | (4,366) | | | |
| Net income (loss) attributable to Harsco Corporation | | $ | (180,069) | | | $ | (3,249) | | | $ | (26,341) | | | |
| Amounts attributable to Harsco Corporation common stockholders: | | | | | | | | |
| Income (loss) from continuing operations, net of tax | | $ | (137,155) | | | $ | 22,137 | | | $ | (49,727) | | | |
| Income (loss) from discontinued operations, net of tax | | (42,914) | | | (25,386) | | | 23,386 | | | |
| Net income (loss) attributable to Harsco Corporation common stockholders | | $ | (180,069) | | | $ | (3,249) | | | $ | (26,341) | | | |
| | | | | | | | |
| Weighted average shares of common stock outstanding | | 79,493 | | | 79,234 | | | 78,939 | | | |
| Basic earnings (loss) per share attributable to Harsco Corporation common stockholders: |
| Continuing operations | | $ | (1.73) | | | $ | 0.28 | | | $ | (0.63) | | | |
| Discontinued operations | | (0.54) | | | (0.32) | | | 0.30 | | | |
| Basic earnings (loss) per share attributable to Harsco Corporation common stockholders | | $ | (2.27) | | | $ | (0.04) | | | $ | (0.33) | | | |
| | | | | | | | |
| Diluted weighted average shares of common stock outstanding | | 79,493 | | | 80,289 | | | 78,939 | | | |
| Diluted earnings (loss) per share attributable to Harsco Corporation common stockholders: |
| Continuing operations | | $ | (1.73) | | | $ | 0.28 | | | $ | (0.63) | | | |
| Discontinued operations | | (0.54) | | | (0.32) | | | 0.30 | | | |
| Diluted earnings (loss) per share attributable to Harsco Corporation common stockholders | | $ | (2.27) | | | $ | (0.04) | | | $ | (0.33) | | | |
See accompanying notes to consolidated financial statements.
HARSCO CORPORATION
CONSOLIDATED STATEMENTS OF COMPREHENSIVE INCOME (LOSS)
| | | | | | | | | | | | | | | | | | | | |
| | | Years ended December 31 |
| (In thousands) | | 2022 | | 2021 | | 2020 |
| Net income (loss) | | $ | (176,431) | | | $ | 2,729 | | | $ | (21,975) | |
| Other comprehensive income (loss): | | | | | | |
Foreign currency translation adjustments, net of deferred income taxes of $(6,752), $(23) and $1,284 in 2022, 2021 and 2020, respectively | | (82,325) | | | (10,994) | | | 20,760 | |
Net gain (loss) on cash flow hedging instruments, net of deferred income taxes of $(1,284), $(797) and $79 in 2022, 2021 and 2020, respectively | | 3,181 | | | 2,816 | | | (2,123) | |
| | | | | | |
Pension liability adjustments, net of deferred income taxes of $(2,590), $(5,409) and $384 in 2022, 2021 and 2020, respectively | | 67,549 | | | 92,252 | | | (73,938) | |
Unrealized gain (loss) on marketable securities, net of deferred income taxes of $4, $(12) and $2 in 2022, 2021 and 2020, respectively | | (12) | | | 31 | | | (6) | |
| | | | | | |
| Total other comprehensive income (loss) | | (11,607) | | | 84,105 | | | (55,307) | |
| Total comprehensive income (loss) | | (188,038) | | | 86,834 | | | (77,282) | |
| Less: Comprehensive (income) loss attributable to noncontrolling interests | | 472 | | | (4,480) | | | (7,178) | |
| Comprehensive income (loss) attributable to Harsco Corporation | | $ | (187,566) | | | $ | 82,354 | | | $ | (84,460) | |
See accompanying notes to consolidated financial statements.
HARSCO CORPORATION
CONSOLIDATED STATEMENTS OF CASH FLOWS
| | | | | | | | | | | | | | | | | | | | |
| | | Years ended December 31 |
| (In thousands) | | 2022 | | 2021 | | 2020 |
| Cash flows from operating activities: | | | | | | |
| Net income (loss) | | $ | (176,431) | | | $ | 2,729 | | | $ | (21,975) | |
| Adjustments to reconcile net income (loss) to net cash provided (used) by operating activities: |
| Depreciation | | 129,712 | | | 131,449 | | | 125,765 | |
| Amortization | | 34,137 | | | 35,224 | | | 33,937 | |
| | | | | | |
| | | | | | |
| (Gain) loss on early extinguishment of debt | | (2,254) | | | 2,668 | | | — | |
| Deferred income tax expense (benefit) | | (12,029) | | | (16,930) | | | 1,115 | |
| Equity (income) loss of unconsolidated entities, net | | 178 | | | 302 | | | (186) | |
| Dividends from unconsolidated entities | | 526 | | | 269 | | | 216 | |
| Gain on sale from discontinued businesses | | — | | | — | | | (18,281) | |
| Goodwill and other intangible asset impairment charges | | 119,580 | | | — | | | — | |
| | | | | | |
| Other, net | | (427) | | | 2,062 | | | 310 | |
| Changes in assets and liabilities, net of acquisitions and dispositions of businesses: |
| Accounts receivable | | 94,317 | | | (19,781) | | | 34,221 | |
| Income tax refunds receivable from acquisition, reimbursable to seller | | 7,687 | | | 2,870 | | | (11,032) | |
| | | | | | |
| Inventories | | (16,798) | | | (7,783) | | | (12,281) | |
| Contract assets | | 11,543 | | | (43,510) | | | (28,376) | |
| Right-of-use-assets | | 29,171 | | | 28,300 | | | 25,400 | |
| Accounts payable | | 19,264 | | | 14,118 | | | (14,452) | |
| Accrued interest payable | | (643) | | | (411) | | | (2,422) | |
| Accrued compensation | | (3,945) | | | 6,469 | | | 2,921 | |
| Advances on contracts and other customer advances | | (11,347) | | | (14,311) | | | 10,492 | |
| Operating lease liabilities | | (28,374) | | | (27,307) | | | (24,785) | |
| | | | | | |
| Income taxes payable - gain on sale of discontinued businesses | | — | | | — | | | (12,373) | |
| Retirement plan liabilities, net | | (34,136) | | | (45,786) | | | (33,257) | |
| Other assets and liabilities | | (9,204) | | | 21,556 | | | (1,139) | |
| Net cash provided (used) by operating activities | | 150,527 | | | 72,197 | | | 53,818 | |
| Cash flows from investing activities: | | | | | | |
| Purchases of property, plant and equipment | | (137,160) | | | (158,326) | | | (120,224) | |
| Proceeds from sale of businesses | | — | | | — | | | 37,219 | |
| Purchase of businesses, net of cash acquired* | | — | | | — | | | (432,855) | |
| Proceeds from sales of assets | | 10,759 | | | 16,724 | | | 6,204 | |
| Expenditures for intangible assets | | (184) | | | (358) | | | (317) | |
| Proceeds from notes receivable | | 8,605 | | | 6,400 | | | — | |
| | | | | | |
| Payments for settlement of interest rate swaps | | (2,304) | | | — | | | — | |
| Net proceeds (payments) from settlement of foreign currency forward exchange contracts | | 20,950 | | | 10,940 | | | (10,519) | |
| Other investing activities, net | | 273 | | | 171 | | | (152) | |
| Net cash used by investing activities | | (99,061) | | | (124,449) | | | (520,644) | |
| Cash flows from financing activities: | | | | | | |
| Short-term borrowings, net | | 884 | | | 935 | | | 1,612 | |
| Current maturities and long-term debt: | | | | | | |
| Additions | | 224,445 | | | 540,663 | | | 638,717 | |
| Reductions | | (256,310) | | | (464,848) | | | (139,887) | |
| | | | | | |
| Dividends paid to noncontrolling interests | | (4,841) | | | (3,103) | | | (2,978) | |
| Sale (purchase) of noncontrolling interests | | 1,901 | | | — | | | (561) | |
| | | | | | |
| | | | | | |
| Stock-based compensation - Employee taxes paid | | (1,949) | | | (3,392) | | | (4,303) | |
| | | | | | |
| | | | | | |
| | | | | | |
| Payment of contingent consideration | | (6,915) | | | (1,588) | | | (2,342) | |
| Deferred financing costs | | — | | | (7,828) | | | (1,928) | |
| Other financing activities, net | | — | | | (601) | | | (1,372) | |
| Net cash (used) provided by financing activities | | (42,785) | | | 60,238 | | | 486,958 | |
| Effect of exchange rate changes on cash, including restricted cash | | (10,715) | | | (527) | | | (195) | |
| Net increase (decrease) in cash and cash equivalents, including restricted cash | | (2,034) | | | 7,459 | | | 19,937 | |
| Cash and cash equivalents, including restricted cash, at beginning of period | | 87,128 | | | 79,669 | | | 59,732 | |
HARSCO CORPORATION
CONSOLIDATED STATEMENTS OF CASH FLOWS (Continued)
| | | | | | | | | | | | | | | | | | | | |
| | | Years ended December 31 |
| (In thousands) | | 2022 | | 2021 | | 2020 |
| Cash and cash equivalents, including restricted cash, at end of period | | $ | 85,094 | | | $ | 87,128 | | | $ | 79,669 | |
| | | | | | |
| Supplementary cash flow information: | | | | | | |
| Change in accrual for purchases of property, plant and equipment included in accounts payable | | $ | 10,845 | | | $ | 4,253 | | | $ | 3,559 | |
| | | | | | |
| *Purchase of businesses, net of cash acquired | | | | | | |
| Working capital | | $ | — | | | $ | 532 | | | $ | (33,387) | |
| Property, plant and equipment | | — | | | 823 | | | (102,258) | |
| Goodwill | | — | | | (1,232) | | | (153,562) | |
| | | | | | |
| Other noncurrent assets and liabilities, net | | — | | | (123) | | | (143,648) | |
| Net cash used to acquire businesses | | $ | — | | | $ | — | | | $ | (432,855) | |
See accompanying notes to consolidated financial statements.
HARSCO CORPORATION
CONSOLIDATED STATEMENTS OF CHANGES IN EQUITY
| | | | | | | | | | | | | | | | | | | | | | | | | | | | | | | | | | | | | | | | | | | | |
| (In thousands, except share and per share amounts) | | Common Stock | | Additional
Paid-in Capital | | Retained
Earnings | | Accumulated Other
Comprehensive
Income (Loss) | | Noncontrolling
Interests | | |
| Issued | | Treasury | | Total |
| Balances, December 31, 2019 | | $ | 143,400 | | | $ | (838,893) | | | $ | 200,595 | | | $ | 1,824,100 | | | $ | (587,622) | | | $ | 48,079 | | | $ | 789,659 | |
| | | | | | | | | | | | | | |
| Net income (loss) | | | | | | | | (26,341) | | | | | 4,366 | | | (21,975) | |
| Cash dividends declared: | | | | | | | | | | | | | | |
| | | | | | | | | | | | | | |
| Noncontrolling interests | | | | | | | | | | | | (2,978) | | | (2,978) | |
Total other comprehensive income (loss), net of deferred income taxes of $1,749 | | | | | | | | | | (58,119) | | | 2,812 | | | (55,307) | |
| | | | | | | | | | | | | | |
| Purchase of subsidiary shares from noncontrolling interest | | | | | | (4,527) | | | | | | | 3,966 | | | (561) | |
| | | | | | | | | | | | | | |
| | | | | | | | | | | | | | |
Stock appreciation rights exercised, net 6,236 shares | | 11 | | | (24) | | | (11) | | | | | | | | | (24) | |
| | | | | | | | | | | | | | |
| | | | | | | | | | | | | | |
Vesting of restricted stock units and other stock grants, net 138,225 shares | | 288 | | | (1,108) | | | (288) | | | | | | | | | (1,108) | |
Vesting of performance share units, net 265,151 shares | | 589 | | | (3,205) | | | (589) | | | | | | | | | (3,205) | |
| | | | | | | | | | | | | | |
| Amortization of unearned stock-based compensation, net of forfeitures | | | | | | 8,898 | | | | | | | | | 8,898 | |
| Balances, December 31, 2020 | | 144,288 | | | (843,230) | | | 204,078 | | | 1,797,759 | | | (645,741) | | | 56,245 | | | 713,399 | |
| | | | | | | | | | | | | | |
| Net income (loss) | | | | | | | | (3,249) | | | | | 5,978 | | | 2,729 | |
| Cash dividends declared: | | | | | | | | | | | | | | |
| | | | | | | | | | | | | | |
| Noncontrolling interests | | | | | | | | | | | | (3,116) | | | (3,116) | |
Total other comprehensive income (loss), net of deferred income taxes of $(6,241) | | | | | | | | | | 85,602 | | | (1,497) | | | 84,105 | |
| | | | | | | | | | | | | | |
| | | | | | | | | | | | | | |
| | | | | | | | | | | | | | |
| | | | | | | | | | | | | | |
| | | | | | | | | | | | | | |
| | | | | | | | | | | | | | |
Stock appreciation rights exercised, net 28,789 shares | | 58 | | | (376) | | | (58) | | | | | | | | | (376) | |
Vesting of restricted stock units and other stock grants, net 193,260 shares | | 382 | | | (1,983) | | | (382) | | | | | | | | | (1,983) | |
Vesting of performance share units, net 69,127 shares | | 155 | | | (1,033) | | | (155) | | | | | | | | | (1,033) | |
| | | | | | | | | | | | | | |
| Amortization of unearned stock-based compensation, net of forfeitures | | | | | | 12,045 | | | | | | | | | 12,045 | |
| Balances, December 31, 2021 | | 144,883 | | | (846,622) | | | 215,528 | | | 1,794,510 | | | (560,139) | | | 57,610 | | | 805,770 | |
| | | | | | | | | | | | | | |
| Net income (loss) | | | | | | | | (180,069) | | | | | 3,638 | | | (176,431) | |
| Cash dividends declared: | | | | | | | | | | | | | | |
| Noncontrolling interests | | | | | | | | | | | | (4,841) | | | (4,841) | |
Total other comprehensive income (loss), net of deferred income taxes of $(10,622) | | | | | | | | | | (7,497) | | | (4,110) | | | (11,607) | |
| | | | | | | | | | | | | | |
| Contributions from noncontrolling interests | | | | | | | | | | | | 1,901 | | | 1,901 | |
| Strategic venture exit | | | | | | | | | | | | (598) | | | (598) | |
Stock appreciation rights exercised, net 16,671 shares | | 29 | | | (66) | | | (29) | | | | | | | | | (66) | |
Vesting of restricted stock units and other stock grants, net 257,423 shares | | 536 | | | (1,882) | | | (536) | | | | | | | | | (1,882) | |
| | | | | | | | | | | | | | |
| | | | | | | | | | | | | | |
| Amortization of unearned stock-based compensation, net of forfeitures | | | | | | 10,796 | | | | | | | | | 10,796 | |
| Balances, December 31, 2022 | | $ | 145,448 | | | $ | (848,570) | | | $ | 225,759 | | | $ | 1,614,441 | | | $ | (567,636) | | | $ | 53,600 | | | $ | 623,042 | |
See accompanying notes to consolidated financial statements.
HARSCO CORPORATION
NOTES TO CONSOLIDATED FINANCIAL STATEMENTS
1. Summary of Significant Accounting Policies
Consolidation
The consolidated financial statements include all accounts of Harsco Corporation (the "Company"), all entities in which the Company has a controlling voting interest and variable interest entities required to be consolidated in accordance with U.S. GAAP. Intercompany accounts and transactions have been eliminated among consolidated entities. The Company's management has evaluated all activity of the Company and concluded that subsequent events are properly reflected in the Company's consolidated financial statements and the accompanying notes as required by U.S. GAAP.
Liquidity
The Company's cash flow forecasts, combined with existing cash and cash equivalents and borrowings available under the Senior Secured Credit Facilities, indicate sufficient liquidity to fund the Company's operations for at least the next twelve months. As such, the Company's consolidated financial statements have been prepared on the basis that it will continue as a going concern for a period extending beyond twelve months from the date the consolidated financial statements are issued. This assessment includes the expected ability to meet required financial covenants and the continued ability to draw down on the Senior Secured Credit Facilities (see Note 8).
Reclassifications
Certain reclassifications have been made to prior year amounts to conform with current year classifications.
During the year ended December 31, 2022, the Company recognized $2.6 million in revenues as an out-of-period adjustment in the CE Segment. Such adjustment was not considered material to the Company's consolidated financial statements for the year ended December 31, 2022 or any of the financial statements for the previously filed annual periods.
Cash and Cash Equivalents
Cash and cash equivalents include cash on hand, demand deposits and short-term investments that are highly liquid in nature and have an original maturity of three months or less.
Restricted Cash
The Company had restricted cash of $3.8 million and $4.2 million at December 31, 2022 and 2021, respectively, and the restrictions are primarily related to collateral provided for certain guarantees of the Company’s performance.
Accounts Receivable
Accounts receivable are stated at net realizable value, which represents the face value of the receivable, less an allowance for expected credit losses. The allowance for expected credit losses is maintained for expected lifetime losses resulting from the inability or unwillingness of customers to make required payments.
The Company’s expected credit loss allowance methodology for accounts receivable is developed using historical collection experience, current and future economic and market conditions and a review of the current status of customers' trade accounts receivables. When required, the Company adjusts the loss-rate methodology to account for current conditions and reasonable and supportable expectations of future economic and market conditions. The Company generally assesses future economic conditions for a period which corresponds with the contractual life of its accounts receivable. Additionally, specific allowance amounts are established to record the appropriate provision for customers that have a higher probability of default.
Accounts Receivable Securitization Facility
Under the AR Facility, the Company and its subsidiaries continuously sell their trade receivables as they are originated to the Company’s SPE. The Company controls and, therefore, consolidates the SPE in its consolidated financial statements. The SPE transfers ownership and control of qualifying receivables to the banking counterparty to the AR Facility up to the maximum purchase commitment. The Company and its related subsidiaries have no continuing involvement in the transferred accounts receivable, other than collection and administrative responsibilities, and, once sold, the receivables are no longer available to satisfy creditors of the Company or the related subsidiaries. The Company accounts for receivables sold to the banking counterparty as a sale of financial assets and derecognizes the trade receivables from the Company's Consolidated Balance Sheets.
Fees incurred for the AR Facility are deferred and are expensed over the term of the agreement. Unamortized costs are included in Other assets in the Company's Consolidated Balance Sheets and the related recognized expense is recorded in Facility fees and debt-related income (expense) on the Consolidated Statements of Operations.
Inventories
Inventories are accounted for using the average cost, first-in, first-out ("FIFO") or last-in, first-out ("LIFO") method. Inventory accounted for under the average cost and FIFO methods are stated at the lower of cost or net realizable value. Inventory accounted for under the LIFO method is stated at the lower of cost or market. See Note 5, Inventories for additional information.
Depreciation
Property, plant and equipment ("PP&E") is recorded at cost and depreciated over the estimated useful lives of the assets using, principally, the straight-line method. When PP&E is retired from service, the cost of the retirement is charged to the allowance for depreciation to the extent of the accumulated depreciation and the balance is charged to income. Long-lived assets to be disposed of by sale are not depreciated while they are classified as held-for-sale.
Leases
The Company leases certain property and equipment under noncancelable lease agreements. The Company determines if a contract or arrangement contains a lease at inception. All leases are evaluated and classified as either an operating or finance lease. A lease is classified as a finance lease if any of the following criteria are met: (i) ownership of the underlying asset transfers to the Company by the end of the lease term; (ii) the lease contains an option to purchase the underlying asset that the Company is reasonably expected to exercise; (iii) the lease term is for a major part of the remaining economic life of the underlying asset; (iv) the present value of the sum of lease payments and any residual value guaranteed by the Company equals or exceeds substantially all of the fair value of the underlying asset; or (v) the underlying asset is of a specialized nature that it is expected to have no alternative use to the lessor at the end of the lease term. A lease that does not meet any of the finance lease classification criteria is classified as an operating lease.
Operating leases are included as Right-of-use assets, net, Current portion of operating lease liabilities, and Operating lease liabilities on the Consolidated Balance Sheets. ROU assets and operating lease liabilities are recognized based on the present value of the future lease payments over the lease term at the commencement date. As most of the Company’s leases do not provide an implicit rate for use in determining the present value of future payments, the Company uses an incremental borrowing rate. This incremental borrowing rate reflects the creditworthiness of the Company for a lending period commensurate to the term of the lease, the standard lending practices related to such loans in the respective jurisdiction where the underlying assets are located and the local currency in which the lease is denominated. ROU assets also include any lease payments made prior to or at the lease commencement date and initial direct costs incurred, and may be reduced by any lease incentives received by the lessor. Lease terms may include options to extend or terminate the lease when it is reasonably certain that the Company will exercise that option. Lease expense for minimum lease payments is recognized on a straight-line basis over the lease term, including rent abatement periods and rent holidays. Certain of the Company's leases are subject to annual changes in an index or are subject to adjustments for which the amounts are not readily determinable at lease inception. While lease liabilities are not remeasured as a result of changes to these costs, changes are treated as variable lease payments and recognized in the period in which the obligation for those payments were incurred.
Finance leases are included as PP&E, net; Current maturities of long-term debt and Long-term debt on the Consolidated Balance Sheets. Finance lease costs are split between depreciation expense related to the asset and interest expense on the lease liability, using the effective rate charged by the lessor.
The Company has lease agreements with both lease and non-lease components, which the Company has elected to account for as a single lease component. Additionally, the Company has elected not to record short-term leases, those with expected terms of twelve months or less, on the Consolidated Balance Sheets. See Note 8, Debt and Credit Agreements and Note 9, Leases for additional information on leases.
Business Combinations and Goodwill
The Company accounts for business combinations using the acquisition method of accounting, which requires that. once control is obtained, all assets acquired and liabilities assumed, including amounts attributable to noncontrolling interests, be recorded at their respective fair values at the date of acquisition. The excess of the purchase price over the fair values of identifiable assets and liabilities is recorded as goodwill. The determination of fair value of assets acquired and liabilities assumed requires numerous estimates and assumptions with respect to the timing and amounts of cash flow projections, revenue growth rates, customer attrition rates, discount rates and useful lives. Such estimates are based upon assumptions believed to be reasonable, and, when appropriate, include assistance from independent third-party valuation firms. During the measurement period, which is up to one year from the acquisition date, the Company may record adjustments to the assets acquired and liabilities assumed, with corresponding offsets to goodwill.
In accordance with U.S. GAAP, goodwill is not amortized and is tested for impairment at least annually or more frequently if indicators of impairment exist or if a decision is made to dispose of a business. Goodwill is allocated among and evaluated for impairment at the reporting unit level, which is defined as an operating segment or one level below an operating segment for which discrete financial information is available. A significant amount of judgment is involved in determining if an indicator of impairment has occurred. Such indicators may include declining cash flows or operating losses at the reporting unit level, a significant adverse change in legal factors or in the business climate, an adverse action or assessment by a regulator, unanticipated competition, a loss of key personnel or a more likely than not expectation that a reporting unit or a significant portion of a reporting unit will be sold or otherwise disposed of, among others.
In applying the goodwill impairment test, the Company has the option to perform a qualitative test or a quantitative test. Under the qualitative test, the Company assesses qualitative factors to determine whether it is more likely than not that the fair value of the reporting units is less than its carrying value. Qualitative factors may include, but are not limited to, economic conditions, industry and market considerations, cost factors, overall financial performance of the reporting unit and other entity and reporting unit specific events. If after assessing these qualitative factors, the Company determines it is “more-likely-than-not” that the fair value of the reporting unit is less than the carrying value, the Company would perform a quantitative test.
The quantitative approach of testing for goodwill impairment involves comparing the current fair value of each reporting unit to the carrying value, including goodwill. The Company uses a discounted cash flow model (“DCF model”) to estimate the current fair value of reporting units, as the Company's management believes forecasted operating cash flows are the best indicator of current fair value. A number of significant assumptions and estimates are involved in the preparation of DCF models including future revenues and operating margin growth, the weighted-average cost of capital (“WACC”), tax rates, capital spending, pension funding, the impact of business initiatives and working capital projections. These assumptions and estimates may vary significantly among reporting units. DCF models are based on approved long-range plans for the early years and historical relationships and projections for later years. WACC rates are derived from internal and external factors including, but not limited to, the average market price of the Company's stock, shares outstanding, book value of the Company's debt, the long-term risk-free interest rate, and both market and size-specific risk premiums. Due to the many variables noted above and the relative size of the Company's goodwill, differences in assumptions may have a material impact on the results of the Company's annual goodwill impairment testing. If the net book value of a reporting unit were to exceed the Company's determination of the current fair value, then an impairment charge would be recognized as the difference between the fair value and the carrying value. See Note 7, Goodwill and Other Intangible Assets for additional information. Long-Lived Assets Impairments (Other than Goodwill)
Long-lived assets or asset groups are reviewed for impairment when events and circumstances indicate that the carrying amount of an asset or asset group may not be recoverable. Long-lived assets or asset groups are reviewed for impairment when events and circumstances indicate the book value of an asset or asset group may be impaired. The Company's policy is to determine if an impairment loss exists when it is determined that the carrying amount of the asset or asset group exceeds the sum of the expected undiscounted future cash flows resulting from use of the asset or asset group and its eventual disposition. Impairment losses are measured as the amount by which the carrying amount of the asset or asset group exceeds its fair value, normally as determined in either open market transactions or through the use of a DCF model. Long-lived assets or asset groups to be disposed of are reported at the lower of the carrying amount or fair value less cost to sell. See Note 7, Goodwill and Other Intangible Assets and Note 18, Other (Income) Expenses, Net for additional information.
Deferred Financing Costs
The Company has incurred debt issuance costs, which are recognized as a reduction of Long-term debt on the Consolidated Balance Sheets. Debt issuance costs are amortized and recognized over the contractual term of the related indebtedness or shorter period, if appropriate, based upon contractual terms in Interest expense on the Consolidated Statements of Operations. Whenever indebtedness is modified from its original terms, an evaluation is made whether an accounting modification or extinguishment has occurred in order to determine the accounting treatment for debt issuance costs related to the debt modification. If the evaluation results in a gain (loss) on extinguishment of debt, the amount would be included in Facility fees and debt-related income (expense) on the Consolidated Statements of Operations.
Revenue Recognition
The Company recognizes revenues to depict the transfer of promised services and products to customers in an amount that reflects the consideration the Company expects to receive in exchange for those services or products. Revenues from continuing operations include service revenues from the Company's HE and CE Segments and product revenues from the Company's HE Segment. Revenue from the Rail business is included in Income (loss) from discontinued businesses.
Harsco Environmental - This Segment provides on-site services, under long-term contracts, for material logistics; product quality improvement and resource recovery from iron, steel and metals manufacturing; manufactures and sells industrial abrasives and roofing granule products; and manufactures aluminum dross and scrap processing systems.
•Service revenues are recognized over time as the customer simultaneously receives the benefits provided by the Company's performance. The Company utilizes an output method based on work performed (liquid steel tons processed, weight of material handled, etc.) to measure progress, which is deemed to best depict the transfer of value to the customer and revenue earned by the Company. Transaction prices are based on contractual terms, which may include both fixed and variable portions. The fixed portion is recognized as earned (normally monthly) over the contractual period. The variable portion is recognized as services are performed and differs based on the volume of services performed. Given the long-term nature of these arrangements, most contracts permit periodic adjustment of either the variable or both the fixed and variable portions based on the changes in macroeconomic indicators, including changes in commodity prices. Transaction prices, when the standalone selling price is not directly observable, are allocated to performance obligations utilizing an expected cost plus a margin approach. Amounts are typically billed and payable on a monthly basis as services are performed.
•Product revenues are recognized at the point when control transfers to the customer. Control generally transfers at the point of shipment for domestic orders and in accordance with the international commercial terms included in contracts for export sales. Transaction prices are based on contractual terms, which are generally fixed and when the standalone selling price is not directly observable, allocated to performance obligations utilizing an adjusted market assessment approach. Amounts are billed and payable upon completion of each transaction.
•Product revenues in the aluminum dross and scrap process systems business are generally recognized over time as control is transferred to the customer. Control transfers over time because aluminum dross and scrap systems are customized, have no alternate use and the Company has an enforceable right to payment. The Company utilizes an input method based on costs incurred ("cost-to-cost method") to measure progress, which is deemed to best depict the transfer of value to the customer and revenue earned by the Company. Transaction prices are based on contractual terms, which are generally fixed, and when the standalone selling price is not directly observable, allocated to performance obligations utilizing an adjusted market assessment approach. The Company may receive periodic payments associated with key milestones with any remaining consideration billed and payable upon completion of the transaction.
Harsco Clean Earth - This Segment provides specialty waste processing and beneficial reuse solutions for hazardous wastes, and soil and dredged materials.
•Revenues are recognized over time as the customer simultaneously receives the benefits provided by the Company's performance. The Company utilizes an output method based on the amount of materials received for processing to measure progress, which is deemed to best depict the transfer of value to the customer and revenue earned by the Company. Transaction prices are based on contractual terms, which are principally variable based on volume and recognized as services are performed. Transaction prices, when the standalone selling price is not directly observable, are allocated to performance obligations utilizing an expected cost plus a margin approach. Amounts are typically billed and payable on a monthly basis.
Harsco Rail - This business sells railway track maintenance equipment, after-market parts, Protran/safety equipment and provides railway track maintenance services.
•For standard railway track maintenance equipment sales, revenue is recognized at the point when control transfers to the customer. Control generally transfers at the point of shipment for domestic orders and in accordance with the international commercial terms included in contracts for export sales. In certain railway track maintenance equipment sales, revenue is recognized over time because such equipment is highly customized, has no alternate use and the Company has an enforceable right to payment. Rail uses the cost-to-cost method to measure progress because it is the measure that best depicts the transfer of control to the customer, which occurs as costs are incurred under the contracts. Under the cost-to-cost method, the extent of progress towards completion is based on the ratio of costs incurred to total estimated costs at completion, which includes both actual costs already incurred and the estimated costs to complete. Accounting for contracts with customers using the cost-to-cost method requires significant judgment relative to assessing risks; estimating contract revenues (including estimates of variable consideration, if applicable, as well as estimating any liquidating damages or penalties related to performance); estimating contract costs (including estimating engineering costs to design the machine and the material, labor and overhead manufacturing costs to build the machine); making assumptions for schedule and technical items; properly executing the engineering and design phases consistent with customer expectations; the availability and costs of labor and material resources; productivity; and evaluating whether a significant financing component is present. Due to the number of years it may take to complete certain contracts and the scope and nature of the work required to be performed on those contracts, estimating total revenues and costs at completion is inherently complicated and subject to many variables. Transaction prices are based on contracted terms, which are generally fixed, and when the standalone selling price is not directly observable, allocated to performance obligations utilizing either the adjusted market assessment or expected cost plus a margin approach. For certain transactions, the Company receives periodic payments associated with key milestones. In limited instances, those payments are intended to provide financing, with such transactions being treated as including a significant financing component. Any remaining consideration is billed and payable upon completion of the transaction. Railway track maintenance equipment revenue of approximately $$50 million was recognized using the cost-to-cost method in 2022, the net profit or loss of which is included in Income (loss) from discontinued businesses in the Consolidated Statements of Operations.
•For after-market parts sales and Protran/safety equipment, revenue is recognized at the point when control transfers to the customer. Control generally transfers to the customer at the point of shipment for domestic orders and in accordance with the international commercial terms included in contracts for export sales. Transaction prices are based on contracted terms, which are generally fixed, and when the standalone selling price is not directly observable, allocated to performance obligations utilizing an adjusted market assessment approach. Amounts are billed and payable upon completion of each contract.
•For railway track maintenance services, revenue is recognized over time as the customer simultaneously receives the benefits provided by the Company's performance. The Company utilizes an appropriate output method based on work performed (feet, miles, shifts worked, etc.) to measure progress, which is deemed to best depict the transfer of value to the customer and revenue earned by the Company. Transaction prices are based on contracted terms, which are generally variable. The variable portion is recognized as services are performed and differs based on the value of services. Given the long-term nature of these arrangements, most contracts permit periodic adjustment based on the changes in macroeconomic indicators. Transaction prices, when the standalone selling price is not directly observable, are allocated to performance obligations utilizing an expected cost plus a margin approach. Amounts are typically billed and payable on a monthly basis as services are performed.
The Company has elected to utilize the following practical expedients on an ongoing basis:
•The Company has not adjusted the promised amount of consideration for the effects of a significant financing component if the Company expects, at contract inception, that the period between when the Company transfers the promised good or services to the customer and when the customer pays for that good or service would be one year or less; and
•The Company has elected to exclude disclosures related to unsatisfied performance obligations where the related contract has a duration of one year or less; or where the consideration is entirely variable. Accordingly, the Company's disclosure related to unsatisfied performance obligations is limited to the fixed portion of fees related to metals services in HE.
Taxes assessed by governmental authorities that are both imposed on and concurrent with a specific revenue-producing transaction, that are collected by the Company from a customer, are excluded from revenue. Additionally, in certain contracts, the Company facilitates shipping and handling activities after control has transferred to the customer. The Company has elected to record all shipping and handling activities as costs to fulfill a contract. In situations where the shipping and handling costs have not been incurred at the time revenue is recognized, the respective shipping and handling costs are accrued.
Income Taxes
The Company accounts for income taxes under the asset and liability method, which requires the recognition of deferred tax assets and liabilities for the expected future tax consequences of the events that have been included in the consolidated financial statements. Under this method, deferred tax assets and liabilities are determined based on the differences between the consolidated financial statements and tax basis of assets and liabilities using enacted tax rates in effect for the year in which the differences are expected to reverse. The effect of a change in tax rates on deferred tax assets and liabilities is recognized in income in the period that includes the enactment date.
The Company records deferred tax assets to the extent that the Company believes that these assets will more likely than not be realized. In making such determinations, the Company considers all available positive and negative evidence, including future reversals of existing deferred tax liabilities, projected future taxable income, tax planning strategies and recent financial results. If the Company determines that it will not be able to realize deferred income tax assets in the future, a valuation allowance is recorded. If sufficient positive evidence arises in the future indicating that all or a portion of the deferred tax assets meet the more likely than not standard for realization, the valuation allowance would be reduced accordingly in the period that such a conclusion is reached.
The Company prepares and files tax returns based on interpretation of tax laws and regulations and records its provision for income taxes based on these interpretations. Uncertainties may exist in estimating the Company's tax provisions and in filing tax returns in the many jurisdictions in which the Company operates, and as a result these interpretations may give rise to an uncertain tax position. The tax benefit from an uncertain tax position is recognized when it is more likely than not that the position will be sustained upon examination, including resolutions of any related appeals or litigation processes, based on its technical merits. Each subsequent period, the Company determines if existing or new uncertain tax positions meet a more likely than not recognition threshold and adjusts accordingly.
The Company recognizes interest and penalties related to unrecognized tax benefits within Income tax expense in the accompanying Consolidated Statements of Operations. Liabilities for uncertain tax positions are included in Other liabilities on the Consolidated Balance Sheets.
The significant assumptions and estimates described in the preceding paragraphs are important contributors to the effective tax rate each year.
Accrued Insurance and Loss Reserves
The Company retains a significant portion of the risk for certain U.S. workers' compensation, U.K. employers' liability, automobile, general and product liability losses. Insurance reserves have been recorded that reflect the undiscounted estimated liabilities including claims incurred but not reported. When a recognized liability is covered by third-party insurance, the Company records an insurance claim receivable to reflect the covered liability. Changes in the estimates of the reserves are included in net income (loss) in the period determined. During 2022, 2021 and 2020, the Company recorded insurance reserve adjustments that decreased pre-tax insurance expense from continuing operations for self-insured programs by $1.0 million, $0.2 million and $1.3 million, respectively. At December 31, 2022 and 2021, the Company has recorded liabilities of $32.4 million and $28.3 million, respectively, related to both asserted as well as unasserted insurance claims. Included in the balances at December 31, 2022 and 2021 were $4.0 million and $4.1 million, respectively, of recognized liabilities covered by insurance carriers. Amounts estimated to be paid within one year have been included in Other current liabilities, with the remainder included in Other liabilities, on the Consolidated Balance Sheets.
Foreign Currency Translation
The financial statements of the Company's subsidiaries outside the U.S., except for those subsidiaries located in highly inflationary economies and those entities for which the U.S. dollar is the currency of the primary economic environment in which the entity operates, are measured using the local currency as the functional currency. Assets and liabilities of these subsidiaries are translated at the exchange rates at the balance sheet date. Resulting translation adjustments are recorded in the cumulative translation adjustment account, a separate component of AOCI, on the Consolidated Balance Sheets. Income and expense items are translated at average monthly exchange rates. Gains and losses from foreign currency transactions are included in Operating income from continuing operations. For subsidiaries operating in highly inflationary economies, and those entities for which the U.S. dollar is the currency of the primary economic environment in which the entity operates, gains and losses on foreign currency transactions and balance sheet translation adjustments are included in Operating income from continuing operations.
Financial Instruments and Hedging
The Company has operations throughout the world that are exposed to fluctuations in related foreign currencies in the normal course of business. The Company seeks to reduce exposure to foreign currency fluctuations through the use of forward exchange contracts. The Company does not hold or issue financial instruments for trading purposes, and it is the Company's policy to prohibit the use of derivatives for speculative purposes. The Company has a Foreign Currency Risk Management Committee that meets periodically to monitor foreign currency risks.
The Company executes foreign currency exchange forward contracts to hedge transactions for firm purchase commitments, to hedge variable cash flows of forecasted transactions and for export sales denominated in foreign currencies. These contracts are generally for 90 days or less; however, where appropriate, longer-term contracts may be utilized. For those contracts that are designated as qualified cash flow hedges, gains or losses are recorded in AOCI on the Consolidated Balance Sheets.
The Company uses interest rate swaps in conjunction with certain debt issuances in order to secure a fixed interest rate. The interest rate swaps are recorded on the Consolidated Balance Sheets at fair value, with changes in value attributed to the effect of the swaps’ interest spread and changes in the credit worthiness of the counter-parties recorded in AOCI.
Amounts recorded in AOCI on the Consolidated Balance Sheets are reclassified into income in the same period or periods during which the hedged forecasted transaction affects income. The cash flows from these contracts are classified consistent with the cash flows from the transaction being hedged (e.g., the cash flows related to contracts to hedge the purchase of fixed assets are included in cash flows from investing activities, etc.). The Company also enters into certain forward exchange contracts that are not designated as hedges. Gains and losses on these contracts are recognized in operations based on changes in fair market value. For fair value hedges of a firm commitment, the gain or loss on the derivative and the offsetting gain or loss on the hedged firm commitment are recognized currently in operations.
Earnings Per Share
Basic earnings per share are calculated using the weighted-average shares of common stock outstanding, while diluted earnings per share reflect the dilutive effects of stock-based compensation. Dilutive securities are not included in the computation of loss per share when the Company reports a net loss from continuing operations, as the impact would be anti-dilutive. All share and per share amounts are restated for any stock splits and stock dividends that occur prior to the issuance of the financial statements. See Note 13, Capital Stock, for additional information.
Use of Estimates in the Preparation of Financial Statements
The preparation of financial statements in conformity with U.S. GAAP requires management to make estimates and assumptions that affect the reported amounts of assets and liabilities, the disclosure of contingent assets and liabilities at the date of the financial statements, and the reported amounts of revenues and expenses. Actual results could differ from those estimates.
2. Recently Adopted and Recently Issued Accounting Standards
The following accounting standards were adopted in 2022:
On January 1, 2022, the Company adopted changes issued by the FASB which improved the transparency of government assistance received by entities. The adoption of these changes did not have a material impact on the Company's consolidated financial statements.
As of December 31, 2022, the Company adopted changes issued by the FASB which provided companies with optional guidance to ease the potential accounting burden associated with transitioning from reference rates that are expected to be discontinued, particularly the cessation of LIBOR. The adoption of these changes did not have a material impact on the Company's consolidated financial statements.
The following accounting standards have been issued and become effective for the Company at a future date:
In October 2021, the FASB issued changes clarifying that an acquirer of a business should recognize and measure contract assets and contract liabilities in a business combination in accordance with accounting standards governing revenue from contracts with customers. Prior guidance required acquired contract assets and contract liabilities to be measured at fair value on the acquisition date. The changes become effective January 1, 2023. The adoption of these changes does not have an immediate impact on the Company's consolidated financial statements, but will be applied prospectively to any future business combinations.
In September 2022, the FASB issued changes that require a buyer in a supplier finance program, also referred to as reverse factoring, payables finance, or structured payables arrangements, to disclose sufficient information about the program to allow a user of financial statements to understand the program’s nature, activity during the period, changes from period to period, and potential magnitude, by disclosing qualitative and quantitative information about the program. The changes become effective January 1, 2023, generally with retrospective application to each period in which a balance sheet is presented. Other than potential required expanded disclosures, the adoption of these changes will not have a material impact on the Company's consolidated financial statements.
3. Discontinued Operations
Harsco Rail Segment
The Company is in the process of selling the Rail business with a sale expected to occur in 2023. The intention to sell the business was first announced in the fourth quarter of 2021. The sales process was delayed in 2022 due to certain macroeconomic conditions, including rising interest rates. The former Harsco Rail Segment has historically been a separate reportable segment with primary operations in the United States, Europe and Asia Pacific.
The former Harsco Rail Segment's balance sheet positions as of December 31, 2022 and 2021 are presented as Assets held-for-sale and Liabilities of assets held-for-sale in the Consolidated Balance Sheets and are summarized as follows:
| | | | | | | | | | | | | | |
| (in thousands) | | December 31
2022 | | December 31
2021 |
| Trade accounts receivable, net | | $ | 41,049 | | | $ | 33,689 | |
| Other receivables | | 4,037 | | | 4,740 | |
| Inventories | | 105,256 | | | 103,560 | |
| Current portion of contract assets | | 84,848 | | | 94,597 | |
| Other current assets | | 30,950 | | | 25,442 | |
| Property, plant and equipment, net | | 41,004 | | | 39,524 | |
| Right-of-use assets, net | | 5,635 | | | 3,108 | |
| Goodwill | | 13,026 | | | 13,026 | |
| Intangible assets, net | | 2,746 | | | 3,081 | |
| Deferred income tax assets | | 6,887 | | | 6,064 | |
| Other assets | | 807 | | | 6,432 | |
| Total Rail assets included in Assets held-for-sale | | $ | 336,245 | | | $ | 333,263 | |
| | | | |
| Accounts payable | | $ | 49,083 | | | $ | 46,076 | |
| Accrued compensation | | 1,211 | | | 2,171 | |
| Current portion of operating lease liabilities | | 2,635 | | | 1,619 | |
| Current portion of advances on contracts | | 45,037 | | | 62,401 | |
| Other current liabilities | | 61,039 | | | 49,732 | |
| | | | |
| Operating lease liabilities | | 3,121 | | | 1,775 | |
| Deferred tax liabilities | | 5,480 | | | 5,736 | |
| Other liabilities | | 861 | | | 981 | |
| Total Rail liabilities included in Liabilities of assets held-for-sale | | $ | 168,467 | | | $ | 170,491 | |
The results of the former Harsco Rail Segment are presented as discontinued operations and, as such, have been excluded from both continuing operations and segment results for the years ended December 31, 2022, 2021, and 2020. Certain key selected financial information included in Income (loss) from discontinued operations, net of tax, for the former Harsco Rail Segment is as follows:
| | | | | | | | | | | | | | | | | | | | |
| | Years Ended December 31 |
| (In thousands) | | 2022 | | 2021 | | 2020 |
| Amounts directly attributable to the former Harsco Rail Segment: | | |
| Service revenues | | $ | 29,331 | | | $ | 32,425 | | | $ | 31,642 | |
Product revenues (a) | | 215,585 | | | 266,221 | | | 298,189 | |
| Cost of services sold | | 21,034 | | | 17,272 | | | 23,480 | |
| Cost of products sold | | 225,769 | | | 251,897 | | | 235,040 | |
| Income (loss) from discontinued businesses | | (40,898) | | | (19,967) | | | 23,096 | |
| Additional amounts allocated to the former Harsco Rail Segment: | | |
Selling, general and administrative expenses (b) | | $ | 4,039 | | | $ | 178 | | | $ | — | |
| | | | | | |
(a) The decrease in product revenues for 2022, as compared to 2021 and 2020, is due in part to liquidated damages and penalties on certain long-term contracts, as discussed below.
(b) The Company includes costs to sell the Rail business in the caption Income (loss) from discontinued businesses in the Consolidated Statements of Operations.
The Company has retained corporate overhead expenses previously allocated to the former Harsco Rail Segment of $4.2 million for each of the years ended December 31, 2022, 2021, and 2020 as part of Selling, general and administrative expenses on the Consolidated Statements of Operations.
The Company's former Harsco Rail segment is currently manufacturing highly-engineered equipment under large long-term fixed-price contracts with Network Rail, Deutsche Bahn and SBB. As previously disclosed, in the fourth quarter of 2021 the Company recognized an estimated forward loss provision of $33.4 million related to these contracts. In 2022, the Company encountered continued supply chain related delays and additional costs in building the machines.
For the Network Rail contracts, the Company encountered supply chain delays in the build of the initial machine, and there were further changes to the production schedule based on the manufacturing experience gained from assembling the first unit during the first quarter of 2022, which had a cascading effect on the delivery schedule of remaining machines. During 2022, the Company recorded additional forward loss provisions of $29.1 million, principally for additional estimated contractual liquidated damages as a reduction of revenue, of which $24.2 million was recorded in the first quarter of 2022, $0.3 million was recorded in the second quarter of 2022 and $4.6 million was recorded in the fourth quarter of 2022. The Company continues to negotiate with Network Rail regarding a reduction to these liquidated damages, which could result in additional favorable or unfavorable adjustments in future periods.
For the Deutsche Bahn contract, in March 2022 a European-based supplier of critical components to the project, indicated it would be significantly late on the delivery of these components to the project, which has the impact of delaying the overall delivery schedule for the project. Additionally, this supplier filed for bankruptcy during the second quarter of 2022, although it continues to operate. Delays impacting the project, along with rising costs, resulted in an additional estimated forward loss provision of $7.5 million in the first quarter of 2022 and $4.0 million recorded in the fourth quarter of 2022 for a total loss provision of $11.5 million in 2022, of which $3.1 million is due to the estimated contractual penalties that would be triggered by the delay and thus recorded as a reduction of revenue. Should this supplier cease operations, the Company may incur further losses if there are additional costs to change suppliers or if there is an inability to recover the value of prepayments made to the supplier, as well as incur additional penalties and damages under the contract with Deutsche Bahn in the event of further production delays.
For the second SBB contract, the Company recorded an additional $3.5 million forward estimated loss provision in the first quarter of 2022 due to additional supply chain delays and cost overruns.
The estimated forward loss provisions represent the Company's best estimate based on currently available information. It is possible that the Company's overall estimate of liquidated damages, penalties and costs to complete these contracts may change, which could result in an additional estimated forward loss provision at such time.
The first contract with SBB is complete, and the second contract is 83% complete as of December 31, 2022. The contracts with Network Rail and Deutsche Bahn are 50% and 32% complete, respectively, as of December 31, 2022.
The following is selected financial information included on the Consolidated Statements of Cash Flows attributable to the Rail Segment:
| | | | | | | | | | | | | | | | | | | | |
| | Years Ended December 31 |
| (In thousands) | | 2022 | | 2021 | | 2020 |
| Non-cash operating items | | | | | | |
| Depreciation and amortization | | $ | — | | | $ | 4,329 | | | $ | 5,450 | |
| Cash flows from investing activities | | | | | | |
| Purchases of property, plant and equipment | | 1,618 | | | 1,406 | | | 7,962 | |
4. Accounts Receivable and Note Receivable
Accounts receivable consist of the following:
| | | | | | | | | | | | | | |
| | |
| (In thousands) | | December 31
2022 | | December 31 2021 (a) |
| Trade accounts receivable | | $ | 272,775 | | | $ | 389,535 | |
Less: Allowance for expected credit losses (b) | | (8,347) | | | (11,654) | |
| Trade accounts receivable, net | | $ | 264,428 | | | $ | 377,881 | |
Other receivables (c) | | $ | 25,379 | | | $ | 33,059 | |
(a)The December 31, 2021 amounts for trade accounts receivable and allowance for expected credit losses have been revised from the presentation in the Company's 2021 Form 10-K. This revision did not impact trade accounts receivable, net.
(b)The decrease in the allowance for expected credit losses is principally due to the write-off of previously reserved trade accounts receivable balances.
(c)Other receivables include employee receivables, insurance receivable, tax claims and refunds and other miscellaneous receivables not included in Trade accounts receivable, net.
The provision for expected credit losses related to trade accounts receivable was as follows:
| | | | | | | | | | | | | | | | | | | | |
| | | Years Ended December 31 |
| (In thousands) | | 2022 | | 2021 | | 2020 |
| Provision for expected credit losses related to trade accounts receivable | | $ | 403 | | | $ | 589 | | | $ | 1,961 | |
At December 31, 2022, $11.1 million of the Company's trade accounts receivable were past due by twelve months or more, with $3.9 million of this amount reserved. There has been a recent increase in aged receivables for certain international customers within the Harsco Environmental Segment. Collection of the remaining balance is still ultimately expected.
Accounts Receivable Securitization Facility
In June 2022, the Company and its SPE entered into an AR Facility with PNC Bank, National Association ("PNC") to accelerate cash flows from trade accounts receivable. The AR Facility has a three-year term. The maximum purchase commitment by PNC is $150.0 million.
The total outstanding balance of trade receivables that have been sold and derecognized by the SPE is $145.0 million as of December 31, 2022. The SPE owned $69.7 million of trade receivables as of December 31, 2022, which are included in the caption Trade accounts receivable, net, on the Consolidated Balance Sheets.
In 2022, the Company capitalized fees of $1.8 million related to the AR Facility. See Note 8, Debt and Credit Agreements, for facility expenses incurred.
The following table reflects proceeds the Company received from the AR Facility, which are included in cash from operating activities in the Consolidated Statements of Cash Flows:
| | | | | | | | |
| | Year Ended December 31 |
| (In millions) | | 2022 |
| Upon execution in June 2022 | | $ | 120.0 | |
| Additional proceeds | | 25.0 | |
| Total received | | $ | 145.0 | |
Factoring Arrangements
The Company maintains factoring arrangements with a financial institution to sell certain accounts receivable that are also accounted for as a sale of financial assets. The following table reflects balances for net amounts sold and program capacities for the arrangements:
| | | | | | | | | | | | | | |
| (In millions) | | December 31
2022 | | December 31
2021 |
| Net amounts sold under factoring arrangements | | $ | 17.3 | | | $ | 12.9 | |
| Program capacities | | 31.4 | | 16.5 |
Note Receivable
In January 2020, the Company sold IKG for $85.0 million including cash and a note receivable, subject to post-closing adjustments. The note receivable from the buyer has a face value of $40.0 million, bearing interest at 2.50%, that is paid in kind and matures on January 31, 2027. Any unpaid principal, along with any accrued but unpaid interest is payable at maturity. Prepayment is required in case of a change in control or as a percentage of excess cash flow, as defined in the note receivable agreement. Because there are no scheduled payments under the terms of the note receivable, the balance is not classified as current and is included in the caption Other assets on the Consolidated Balance Sheets. The initial fair value of the note receivable was $34.3 million which was calculated using an average of various discounted cash flow scenarios based on anticipated timing of repayments (Fair Value Level 3 asset) and was a non-cash transaction. The note receivable is subsequently measured at amortized cost. Key inputs into the valuation model include: projected timing and amount of cash flows, pro forma debt rating, option-adjusted spread and U.S. Treasury spot rate. The Company received payments of $8.6 million and $6.4 million during 2022 and 2021, respectively, related to excess cash flow.
The following table reflects the note receivable at amortized cost and at fair value:
| | | | | | | | | | | | | | |
| (In millions) | | December 31
2022 | | December 31
2021 |
| Note receivable, at amortized cost | | $ | 23.9 | | | $ | 31.0 | |
| Note receivable, at fair value | | $ | 23.8 | | | $ | 32.3 | |
5. Inventories
Inventories consist of the following: | | | | | | | | | | | | | | |
| | |
| (In thousands) | | December 31
2022 | | December 31
2021 |
| Finished goods | | $ | 11,809 | | | $ | 8,323 | |
| Work-in-process | | 4,241 | | | 5,393 | |
| Raw materials and purchased parts | | 25,735 | | | 21,188 | |
| Stores and supplies | | 39,590 | | | 35,589 | |
| Total inventories | | $ | 81,375 | | | $ | 70,493 | |
| Valued at lower of cost or market: | | | | |
| LIFO basis | | $ | 15,473 | | | $ | 14,133 | |
| FIFO basis | | 8,826 | | | 7,567 | |
| Average cost basis | | 57,076 | | | 48,793 | |
| Total inventories | | $ | 81,375 | | | $ | 70,493 | |
Inventories valued on the LIFO basis at both December 31, 2022 and December 31, 2021 were approximately $14 million less than the amounts of such inventories valued at current costs. There was no significant impact on net income as a result of reducing certain inventory quantities valued on a LIFO basis during 2022, 2021 or 2020.
6. Property, Plant and Equipment
Property, plant and equipment consist of the following:
| | | | | | | | | | | | | | | | | | | | |
| (In thousands) | | Estimated
Useful Lives | | December 31
2022 | | December 31
2021 |
| Land | | — | | $ | 72,020 | | | $ | 73,067 | |
| Land improvements | | 5-20 years | | 16,750 | | | 16,970 | |
Buildings and improvements (a) | | 10-30 years | | 217,926 | | | 221,236 | |
Machinery and equipment (b) | | 3-20 years | | 1,513,238 | | | 1,507,214 | |
| Uncompleted construction | | — | | 84,472 | | | 63,816 | |
| Gross property, plant and equipment | | | | 1,904,406 | | | 1,882,303 | |
| Less: Accumulated depreciation | | | | (1,247,531) | | | (1,228,390) | |
| Property, plant and equipment, net | | | | $ | 656,875 | | | $ | 653,913 | |
(a) Buildings and improvements include leasehold improvements that are amortized over the shorter of their useful lives or the initial term of the lease.(b) Includes information technology hardware and software.
In the third quarter of 2020, a customer of HE in China ceased steel making operations at its steel mill site in order to relocate the operations to a new site, as a result of a government mandate to improve environmental conditions of the area. The Company continues to provide services to the same customer at the new site. The net book value of HE's idled equipment associated with the previous location is approximately $18 million. The customer has entered into an agreement with the government where it will receive compensation for the losses the customer has incurred as a result of the forced shutdown. The Company has continued discussions with the customer regarding compensation, which are expected to be protracted. While the customer has initially indicated that they will not provide compensation, the Company and the customer continue to discuss. In addition, there may be other avenues of pursuing recovery, including seeking relief directly from the local government. At this point, considering the ongoing discussions with the customer, and other avenues, the Company believes it will recover the book value of the equipment and thus does not believe it has an asset impairment as of December 31, 2022. However, the Company will continue to evaluate changes in facts and circumstances and record any impairment charge when and if indicated.
7. Goodwill and Other Intangible Assets
Goodwill by Segment
The following table reflects the changes in carrying amounts of goodwill by segment for the years ended December 31, 2022 and 2021:
| | | | | | | | | | | | | | | | | | | | |
| (In thousands) | | Harsco Environmental
Segment | | Harsco
Clean Earth
Segment | | Consolidated
Totals |
| Balance at December 31, 2020 | | $ | 406,401 | | | $ | 482,647 | | | $ | 889,048 | |
| Changes to goodwill | | — | | | 1,232 | | | 1,232 | |
| | | | | | |
| Foreign currency translation | | (7,171) | | | — | | | (7,171) | |
| Balance at December 31, 2021 | | 399,230 | | | 483,879 | | | 883,109 | |
| | | | | | |
| Goodwill impairment | | — | | | (104,580) | | | (104,580) | |
| Foreign currency translation | | (19,276) | | | — | | | (19,276) | |
| Balance at December 31, 2022 | | $ | 379,954 | | | $ | 379,299 | | | $ | 759,253 | |
The Company's methodology for determining reporting unit fair value is described in Note 1, Summary of Significant Accounting Policies. The Company tests for goodwill impairment annually as of October 1, or more frequently if indicators of impairment exist, or a decision is made to dispose of a business.
As of June 30, 2022, the Company determined that an interim test of goodwill was required. The triggering event was principally due to lower earnings expectations due to the impacts of inflation. The Company used a discounted cash flow model (“DCF model”) to estimate the current fair value of the Clean Earth reporting unit (Level 3), which is defined as the Clean Earth Segment. A number of significant assumptions and estimates are involved in the preparation of DCF models including future revenues, operating margin growth, the weighted-average cost of capital (“WACC”), tax rates, capital spending, pension funding, the impact of business initiatives and working capital projections. The DCF model is based on approved forecasts for the early years and historical relationships and projections for later years. The WACC rate is derived from internal and external factors including, but not limited to, the average market price of the Company's stock, shares outstanding, book value of the Company's debt, the long-term risk-free interest rate, and both market and size-specific risk premiums. As a result of this testing, the Company recorded a goodwill impairment charge of $104.6 million for the Clean Earth reporting unit in the second quarter of 2022, which is included in Goodwill and other intangible asset impairment charges on the Consolidated Statement of Operations for the year-ended December 31, 2022. This charge had no impact on the Company's cash flows or compliance with debt covenants.
The performance of the Company's 2022 annual impairment tests did not result in any impairment of the Company's goodwill.
Intangible Assets
Net intangible assets totaled $352.2 million at December 31, 2022 and $402.8 million at December 31, 2021. The following table reflects these intangible assets by major category:
| | | | | | | | | | | | | | | | | | | | | | | | | | |
| | December 31, 2022 | | December 31, 2021 |
| (In thousands) | | Gross Carrying
Amount | | Accumulated
Amortization | | Gross Carrying
Amount | | Accumulated
Amortization |
| Customer related | | $ | 95,573 | | | $ | 54,482 | | | $ | 104,322 | | | $ | 54,057 | |
| Permits | | 309,177 | | | 50,703 | | | 309,069 | | | 34,822 | |
| Technology related | | 20,800 | | | 15,491 | | | 39,886 | | | 13,415 | |
| Trade names | | 30,212 | | | 9,198 | | | 30,738 | | | 6,842 | |
| Air rights | | 26,139 | | | 2,411 | | | 26,139 | | | 1,675 | |
| Patents | | 189 | | | 155 | | | 179 | | | 138 | |
| Non-compete agreement | | 2,500 | | | 1,718 | | | 2,500 | | | 1,094 | |
| Other | | 3,147 | | | 1,419 | | | 3,407 | | | 1,396 | |
| Total | | $ | 487,737 | | | $ | 135,577 | | | $ | 516,240 | | | $ | 113,439 | |
Based on the current economic conditions, to include inflation and higher energy prices, the Company lowered its long-range projections for the Altek Group of the Harsco Environmental Segment. Due to the lower revenue projections, the Company tested the recoverability of Altek's asset group in the fourth quarter of 2022. The asset group primarily consists of technology and customer-related intangible assets. Undiscounted estimated cash flows of the Altek asset group were lower than the carrying value, therefore, the Company used a DCF model to estimate the current fair value of the Altek asset group (Level 3). A number of significant assumptions and estimates are involved in the preparation of DCF models including future revenues and operating margin growth, the WACC, capital spending, and the impact of business initiatives and working capital projections. The DCF model is based on approved forecasts for the early years and historical relationships and projections for later years. The WACC rate is based on the Company's WACC, adjusted for market participant assumptions. As a result of this testing, an impairment charge of $15.0 million was recorded, which is included in Goodwill and other intangible asset impairment charges on the Consolidated Statements of Operations for the year-ended December 31, 2022. The carrying value of the intangible assets, after the impairment charge, is $15.3 million at December 31, 2022.
Amortization expense for intangible assets was $31.1 million, $32.2 million and $30.6 million for 2022, 2021 and 2020, respectively. The following table shows the estimated amortization expense for the next five fiscal years based on current intangible assets.
| | | | | | | | | | | | | | | | | | | | | | | | | | | | | | | | |
| (In thousands) | | 2023 | | 2024 | | 2025 | | 2026 | | 2027 |
Estimated amortization expense (b) | | $ | 28,200 | | | $ | 27,700 | | | $ | 27,500 | | | $ | 25,700 | | | $ | 24,400 | |
(b) These estimated amortization expense amounts do not reflect the potential effect of future foreign currency exchange rate fluctuations.
8. Debt and Credit Agreements
The Company's long-term debt consists of the following:
| | | | | | | | | | | | | | |
| | |
| (In thousands) | | December 31
2022 | | December 31
2021 |
Senior Secured Credit Facilities (a): | | | | |
New Term Loan with an interest rate of 6.69% and 2.75% at December 31, 2022 and 2021, respectively | | $ | 492,500 | | | $ | 497,500 | |
| | | | |
| | | | |
Revolving Credit Facility with an average interest rate of 7.19% and 2.45% at December 31, 2022 and 2021, respectively | | 370,000 | | | 362,000 | |
5.75% Senior Notes | | 475,000 | | | 500,000 | |
Other financing payable (including capital leases) in varying amounts due principally through 2026 with a weighted-average interest rate of 5.00% and 4.73% at December 31, 2022 and 2021, respectively | | 26,661 | | | 28,389 | |
| Total debt obligations | | 1,364,161 | | | 1,387,889 | |
| Less: deferred financing costs | | (15,172) | | | (18,217) | |
| Total debt obligations, net of deferred financing costs | | 1,348,989 | | | 1,369,672 | |
| Less: current maturities of long-term debt | | (11,994) | | | (10,226) | |
| Long-term debt | | $ | 1,336,995 | | | $ | 1,359,446 | |
(a) The current portion of long-term debt related to the Senior Secured Credit Facilities was $5.0 million with the remainder reflected as Long-term debt at December 31, 2022 and 2021.
The maturities of long-term debt for the four years following December 31, 2023 are as follows:
| | | | | | | | |
| (In thousands) | | |
| 2024 | | $ | 11,293 | |
| 2025 | | 9,635 | |
| 2026 | | 378,542 | |
| 2027 | | 481,983 | |
Cash payments for interest on debt were $73.4 million, $60.9 million and $59.5 million in 2022, 2021 and 2020, respectively.
In February 2022, the Company amended its Credit Agreement to reset the levels of its net debt to Consolidated Adjusted EBITDA ratio covenant. As a result of this amendment, the total net debt to Consolidated Adjusted EBITDA ratio covenant was set at 5.50x for the quarter ending June 30, 2022, and decreases quarterly by 0.25x until reaching 4.00x for the quarter ending December 31, 2023 and thereafter. In addition, upon closing on the divestiture of the former Harsco Rail Segment, the total net debt to Consolidated Adjusted EBITDA ratio covenant will decrease by an additional 0.25x, provided, however, it will not go below 4.00x and a minimum Consolidated Adjusted EBITDA to consolidated interest charges ratio covenant, which is not to be less than 3.0x will be maintained.
In June 2022, the Company repurchased $25.0 million of its 5.75% Senior Notes on the open market at a discount for $22.4 million. The Company recognized a gain on the extinguishment of debt of $2.3 million, net of the write-off of $0.3 million of previously recorded deferred financing costs, in the caption Facility fees and debt-related income (expense) on the Consolidated Statement of Operations.
In connection with entering into its AR Facility in June 2022, the Company amended its Senior Secured Credit Facilities to increase the permitted maximum outstanding amount of a securitization facility to $150 million. Certain other covenants and definitions were also modified to facilitate the AR Facility.
In August 2022, the Company amended its Revolving Credit Facility under its Credit Agreement to increase certain levels in the total net leverage covenant, temporarily reduce the ratio under the interest coverage covenant and add a new pricing level applicable to revolving credit loans. Revolving credit loans bear interest at a rate, depending on total net leverage, ranging from $50 to $175 basis points over base rate or $150 to $275 basis points over LIBOR, subject to a zero floor. The Company’s total net leverage is capped at 5.50x of Consolidated Adjusted EBITDA through the end of 2023; the maximum total net leverage ratio decreases quarterly thereafter, reaching 4.00x for the last quarter in 2024 and thereafter. The total net leverage ratio covenant applicable to the third quarter of 2024 and earlier is subject to a 0.50x decrease upon closing of the divestiture of the former Harsco Rail Segment. The Company’s required coverage of consolidated interest charges is set at a minimum of 2.75x of Consolidated Adjusted EBITDA through the end of 2024 (subject to an increase to 3.0x upon closing of the divestiture of the former Harsco Rail Segment), and leveling at 3.0x for the first quarter in 2025 and thereafter. Any principal amount outstanding under the Revolving Credit Facility remains due and payable on its maturity on March 10, 2026.
In December 2022, the Company amended its Senior Secured Credit Facilities to, among other things, change the base rate used in determining loan interest rates from LIBOR to SOFR. This change was in anticipation of the expected cessation of LIBOR in 2023 and in compliance with FASB guidance. In addition, a one-month benchmark adjustment of 11.4 basis points was added to the applicable margins for the Revolving Credit Facility and the New Term Loan, which modified them to 61.4 to 286.4 basis points over term SOFR for the Revolving Credit Facility and 236.4 basis points over term SOFR for the New Term Loan. The change did not have a material effect on the Company's consolidated financial statements.
At December 31, 2022, the Company was in compliance with all covenants for its Senior Secured Credit Facilities, as amended in August 2022, as the total net debt to Consolidated Adjusted EBITDA ratio was 5.35x and the total interest coverage ratio was 3.14x.
The Company believes it will continue to maintain compliance with all covenants over the next twelve months based on its current outlook. However, the Company’s estimates of compliance with these covenants could change in the future with a continued deterioration in economic conditions, higher than forecasted interest rate increases, or an inability to successfully execute its plans by quarter to realize increased pricing and to implement cost reduction initiatives that substantially mitigate the impacts of inflation and other factors adversely impacting its realized operating margins.
The Company's Credit Agreement imposes certain restrictions including, but not limited to, restrictions as to types and amounts of debt of liens that may be incurred by the Company; limitations on increases in dividend payments; limitations on repurchases of the Company's stock and limitations on certain acquisitions by the Company.
With respect to the Senior Secured Credit Facilities, the obligations of the Company are guaranteed by substantially all of the Company’s current and future wholly-owned domestic subsidiaries (“Guarantors”). All obligations under the Senior Credit Facility, and the guarantees of those obligations, are secured, subject to certain exceptions, by substantially all of the Company’s assets and the assets of the Guarantors.
The Credit Agreement requires certain mandatory prepayments of the New Term Loan, subject to certain exceptions, based on net cash proceeds of certain sales or distributions of assets, as well as certain casualty and condemnation events, in some cases subject to reinvestment rights and certain other exceptions; net cash proceeds of any issuance of debt, excluding permitted debt issuances; and a percentage of excess cash flow, as defined by the Credit Agreement, during a fiscal year.
Facility Fees and Debt-Related Income (Expense)
The components of the Consolidated Statements of Operations caption Facility fees and debt-related income (expense) were as follows:
| | | | | | | | | | | | | | | | | | | | |
| | | Years Ended December 31 |
| (In thousands) | | 2022 | | 2021 | | 2020 |
| Gain (loss) on extinguishment of debt | | $ | 2,254 | | | $ | (2,668) | | | $ | — | |
| Unused debt commitment and amendment fees | | (1,696) | | | (2,838) | | | (1,920) | |
| Securitization and factoring fees | | (3,514) | | | — | | | — | |
| Facility fees and debt-related income (expense) | | $ | (2,956) | | | $ | (5,506) | | | $ | (1,920) | |
Revolving Credit Facility
Borrowings under the U.S.-based Revolving Credit Facility bear interest at a rate per annum ranging from 50 to 175 basis points over base rate or 161.4 to 286.4 basis points over term SOFR, which includes a one-month SOFR adjustment of 11.4 basis points, subject to a 0% floor. Any principal amount outstanding under the Revolving Credit Facility is due and payable on its maturity on March 10, 2026.
The following table shows the amount outstanding under the Revolving Credit Facility and available credit at December 31, 2022.
| | | | | | | | | | | | | | | | | | | | | | | | | | |
| | |
| | December 31, 2022 |
| (In thousands) | | Facility
Limit | | Outstanding
Balance | | Outstanding Letters of Credit | | Available
Credit |
| Revolving Credit Facility | | $ | 700,000 | | | $ | 370,000 | | | $ | 27,318 | | | $ | 302,682 | |
| | | | | | | | |
| | | | | | | | |
Other
Short-term borrowings totaled $7.8 million and $7.7 million at December 31, 2022 and 2021, respectively. At December 31, 2022 and 2021, Short-term borrowings consisted primarily of bank overdrafts and other third-party debt. The weighted-average interest rate for short-term borrowings at December 31, 2022 and 2021 was 4.65% and 3.26%, respectively.
9. Leases
The components of lease expense were as follows:
| | | | | | | | | | | | | | | | | | | | |
| (In thousands) | | 2022 | | 2021 | | 2020 |
| Finance leases: | | | | | | |
| Amortization expense | | $ | 3,938 | | | $ | 2,510 | | | $ | 1,523 | |
| Interest on lease liabilities | | 784 | | | 495 | | | 184 | |
| Operating leases | | 33,773 | | | 32,544 | | | 28,537 | |
| Variable and short-term leases | | 49,811 | | | 47,780 | | | 40,953 | |
| Sublease income | | (6) | | | (53) | | | (202) | |
| Total lease expense from continuing operations | | $ | 88,300 | | | $ | 83,276 | | | $ | 70,995 | |
Supplemental cash flow information related to leases was as follows:
| | | | | | | | | | | | | | | | | | | | |
| (In thousands) | | 2022 | | 2021 | | 2020 |
| Cash paid for amounts included in the measurement of lease liabilities: | | | | | | |
Cash flows used by operating activities - Operating leases (a) | | $ | 34,420 | | | $ | 33,645 | | | $ | 28,057 | |
| Cash flows used by operating activities - Finance leases | | 798 | | | 517 | | | 184 | |
| Cash flows used by financing activities - Finance leases | | 3,975 | | | 2,330 | | | 1,183 | |
| ROU assets obtained in exchange for lease obligations: | | | | | | |
Operating leases (b) | | $ | 32,817 | | | $ | 42,442 | | | $ | 69,044 | |
| Finance leases | | 11,175 | | | 11,495 | | | 6,220 | |
(a) Cash flows include cash paid for operating leases of discontinued operations.
(b) Cash flows include ROU assets of approximately $56 million that were recorded upon the acquisition of ESOL in 2020.
Supplemental balance sheet information related to leases was as follows:
| | | | | | | | | | | | | | | | |
| (In thousands) | | 2022 | | 2021 | | |
| Operating Leases (c): | | | | | | |
| Operating lease ROU assets | | $ | 101,253 | | | $ | 101,576 | | | |
| Current portion of operating lease liabilities | | 25,521 | | | 25,590 | | | |
| Operating lease liabilities | | 75,246 | | | 74,571 | | | |
| | | | | | |
| Finance Leases: | | | | | | |
| | | | | | |
| | | | | | |
| Property, plant and equipment, net | | $ | 23,671 | | | $ | 17,185 | | | |
| Current maturities of long-term debt | | 5,562 | | | 3,756 | | | |
| Long-term debt | | 18,832 | | | 13,736 | | | |
| | | | | | |
(c) The 2021 operating lease ROU assets and operating lease liabilities include a $15 million adjustment to record certain leases for ESOL. These leases have been incorrectly treated as short term leases versus operating leases since ESOL's acquisition on April 6, 2020.
Supplemental additional information related to leases was as follows:
| | | | | | | | | | | | | | |
| | 2022 | | 2021 |
| Other information: | | | | |
| Weighted average remaining lease term - Operating leases (in years) | | 7.42 | | 7.14 |
| Weighted average remaining lease term - Finance leases (in years) | | 5.35 | | 5.88 |
| Weighted average discount rate - Operating leases | | 6.0 | % | | 5.9 | % |
| Weighted average discount rate - Finance leases | | 5.2 | % | | 4.6 | % |
Maturities of lease liabilities were as follows:
| | | | | | | | | | | | | | |
| (In thousands) | | Operating Leases | | Finance
Leases |
| Year Ending December 31: | | | | |
| 2023 | | $ | 30,274 | | | $ | 6,663 | |
| 2024 | | 24,099 | | | 6,284 | |
| 2025 | | 17,928 | | | 5,237 | |
| 2026 | | 13,416 | | | 3,923 | |
| 2027 | | 8,545 | | | 2,240 | |
| After 2027 | | 34,233 | | | 3,868 | |
| Total lease payments | | 128,495 | | | 28,215 | |
| Less: Imputed interest | | (27,728) | | | (3,821) | |
| Total lease liabilities | | $ | 100,767 | | | $ | 24,394 | |
The Company's leases, excluding short-term leases, have remaining terms of less than one year to 28 years, some of which include options to extend for up to 10 years, and some of which include options to terminate within one year. As of December 31, 2022, the Company has additional operating leases for property and equipment that have not yet commenced, with estimated ROU assets and lease liabilities of approximately $11 million to be recognized upon anticipated lease commencements in the first and second quarters of 2023. There are no material residual value guarantees or material restrictive covenants in any of the Company's leases.
10. Employee Benefit Plans
Pension Benefits
The Company has defined benefit pension plans covering a certain number of employees. The defined benefits for salaried employees generally are based on years of service and the employee's level of compensation during specified periods of employment. Defined benefit pension plans covering hourly employees generally provide benefits of stated amounts for each year of service. MEPPs in which the Company participates provide benefits to certain unionized employees. The Company's funding policy for qualified plans is consistent with statutory requirements. Periodic voluntary contributions are made, as recommended, by the Company's Pension Committee.
Accrued service is no longer granted to the U.S. defined benefit pension plans and a majority of international defined benefit pension plans. In place of these plans, the Company has established defined contribution plans providing for the Company to contribute a specified matching amount for participating employees' contributions to the plan. For U.S. employees, this match is made on employee contributions up to 4% of eligible compensation. Additionally, the Company may provide a discretionary contribution for eligible employees. There have been no discretionary contributions provided for the years 2022, 2021 and 2020. For non-U.S. employees, this match is up to 6% of eligible compensation with an additional 2% going towards insurance and administrative costs.
NPPC from continuing operations for U.S. and international plans for 2022, 2021 and 2020 is as follows:
| | | | | | | | | | | | | | | | | | | | | | | | | | | | | | | | | | | | | | |
| | U.S. Plans | | International Plans |
| (In thousands) | | 2022 | | 2021 | | 2020 | | 2022 | | 2021 | | 2020 |
| Net Periodic Pension Cost (Income): | | | | | | | | | | |
| Defined benefit pension plans: | | | | | | | | | | |
| Service cost | | $ | — | | | $ | — | | | $ | — | | | $ | 1,867 | | | $ | 1,805 | | | $ | 1,642 | |
| Interest cost | | 5,716 | | | 4,813 | | | 7,381 | | | 16,500 | | | 12,652 | | | 17,599 | |
| Expected return on plan assets | | (10,795) | | | (12,199) | | | (11,368) | | | (38,891) | | | (45,018) | | | (41,013) | |
| Recognized prior service costs | | — | | | — | | | — | | | 534 | | | 582 | | | 512 | |
| Recognized losses | | 4,732 | | | 5,538 | | | 5,100 | | | 13,060 | | | 18,119 | | | 14,723 | |
| | | | | | | | | | | | |
| Settlement/curtailment loss (gain) | | — | | | — | | | — | | | (33) | | | (6) | | | 18 | |
| Defined benefit pension plan cost (income) | | (347) | | | (1,848) | | | 1,113 | | | (6,963) | | | (11,866) | | | (6,519) | |
| | | | | | | | | | | | | | | | | | | | | | | | | | | | | | | | | | | | | | |
| | U.S. Plans | | International Plans |
| (In thousands) | | 2022 | | 2021 | | 2020 | | 2022 | | 2021 | | 2020 |
| Multiemployer pension plans | | 642 | | | 640 | | | 620 | | | 1,114 | | | 1,035 | | | 969 | |
| Defined contribution plans | | 5,401 | | | 5,660 | | | 4,769 | | | 4,122 | | | 4,196 | | | 3,994 | |
| Net periodic pension cost (income) | | $ | 5,696 | | | $ | 4,452 | | | $ | 6,502 | | | $ | (1,727) | | | $ | (6,635) | | | $ | (1,556) | |
The change in the financial status of the defined benefit pension plans and amounts recognized on the Consolidated Balance Sheets at December 31, 2022 and 2021 are as follows:
| | | | | | | | | | | | | | | | | | | | | | | | | | |
| | U.S. Plans | | International Plans |
| (In thousands) | | 2022 | | 2021 | | 2022 | | 2021 |
| Change in benefit obligation: | | | | | | | | |
| Benefit obligation at beginning of year | | $ | 277,007 | | | $ | 296,660 | | | $ | 1,022,198 | | | $ | 1,119,552 | |
| Service cost | | — | | | — | | | 1,867 | | | 1,805 | |
| Interest cost | | 5,716 | | | 4,813 | | | 16,500 | | | 12,652 | |
| Plan participants' contributions | | — | | | — | | | 14 | | | 15 | |
| | | | | | | | |
| Actuarial (gain) loss | | (57,841) | | | (8,063) | | | (299,841) | | | (58,567) | |
| Settlements/curtailments | | — | | | — | | | (132) | | | (269) | |
| Benefits paid | | (15,700) | | | (16,403) | | | (37,135) | | | (39,831) | |
| Effect of foreign currency | | — | | | — | | | (106,281) | | | (13,159) | |
| | | | | | | | |
| | | | | | | | |
| Benefit obligation at end of year | | $ | 209,182 | | | $ | 277,007 | | | $ | 597,190 | | | $ | 1,022,198 | |
| Change in plan assets: | | | | | | | | |
| Fair value of plan assets at beginning of year | | $ | 232,947 | | | $ | 226,125 | | | $ | 973,252 | | | $ | 957,177 | |
| Actual return on plan assets | | (41,909) | | | 19,005 | | | (250,002) | | | 40,382 | |
| Employer contributions | | 1,706 | | | 4,219 | | | 22,614 | | | 25,077 | |
| Plan participants' contributions | | — | | | — | | | 14 | | | 15 | |
| Settlements/curtailments | | — | | | — | | | (132) | | | (269) | |
| Benefits paid | | (15,700) | | | (16,402) | | | (37,135) | | | (39,220) | |
| Effect of foreign currency | | — | | | — | | | (101,377) | | | (9,910) | |
| | | | | | | | |
| | | | | | | | |
| Fair value of plan assets at end of year | | $ | 177,044 | | | $ | 232,947 | | | $ | 607,234 | | | $ | 973,252 | |
| | | | | | | | |
| Funded status at end of year | | $ | (32,138) | | | $ | (44,060) | | | $ | 10,044 | | | $ | (48,946) | |
Significant items impacting actuarial gains and losses for 2022 for U.S. plans were improvement in the funded position due to an increase in the discount rate used to measure the benefit obligation compared with the prior year, partially offset by a decrease in the funded position due to the actual return on the fair value of plan assets since the prior measurement date being less than assumed, due to market losses.
Similarly, significant items impacting actuarial gains and losses for 2022 for international plans, principally the U.K. plan, were improvement in the funded position due to an increase in the discount rate used to measure the benefit obligation compared with the prior year, partially offset by a decrease in the funded position due to the actual return on the fair value of plan assets since the prior measurement date being less than assumed, due to market losses.
Amounts recognized on the Consolidated Balance Sheets for defined benefit pension plans consist of the following at December 31, 2022 and 2021:
| | | | | | | | | | | | | | | | | | | | | | | | | | |
| | U.S. Plans | | International Plans |
| | December 31 | | December 31 |
| (In thousands) | | 2022 | | 2021 | | 2022 | | 2021 |
| Noncurrent assets | | $ | — | | | $ | — | | | $ | 26,033 | | | $ | 2,046 | |
| Current liabilities | | 1,851 | | | 1,999 | | | 924 | | | 967 | |
| Noncurrent liabilities | | 30,287 | | | 42,061 | | | 15,065 | | | 50,025 | |
| | | | | | | | |
| | | | | | | | |
| AOCI | | 105,005 | | | 114,874 | | | 346,068 | | | 410,114 | |
Amounts recognized in AOCI for defined benefit pension plans consist of the following at December 31, 2022 and 2021:
| | | | | | | | | | | | | | | | | | | | | | | | | | |
| | | U.S. Plans | | International Plans |
| (In thousands) | | 2022 | | 2021 | | 2022 | | 2021 |
| Net actuarial loss | | $ | 105,005 | | | $ | 114,874 | | | $ | 337,849 | | | $ | 400,497 | |
| Prior service cost | | — | | | — | | | 8,219 | | | 9,617 | |
| | | | | | | | |
| Total | | $ | 105,005 | | | $ | 114,874 | | | $ | 346,068 | | | $ | 410,114 | |
The Company's estimate of expected contributions to be paid in 2023 for the U.S. and international defined benefit plans total $1.9 million and $23.3 million, respectively.
Future Benefit Payments
Expected benefit payments for defined benefit pension plans over the next ten years are as follows:
| | | | | | | | | | | | | | | | | | | | | | | | | | | | | | | | | | | | | | |
| (In millions) | | 2023 | | 2024 | | 2025 | | 2026 | | 2027 | | 2028-2032 |
| U.S. Plans | | $ | 26.3 | | | $ | 16.4 | | | $ | 16.4 | | | $ | 16.2 | | | $ | 16.1 | | | $ | 76.6 | |
| International Plans | | 38.1 | | | 38.8 | | | 40.2 | | | 41.3 | | | 42.7 | | | 225.4 | |
Net Periodic Pension Cost and Defined Benefit Pension Obligation Assumptions
The weighted-average actuarial assumptions used to determine the defined benefit pension plan NPPC for 2022, 2021 and 2020 were as follows:
| | | | | | | | | | | | | | | | | | | | | | | | | | | | | | | | | | | | | | | | | | | | | | | | | | | | | | | | |
| | U.S. Plans
December 31 | | International Plans
December 31 | | Global Weighted-Average
December 31 |
| | 2022 | | 2021 | | 2020 | | 2022 | | 2021 | | 2020 | | 2022 | | 2021 | | 2020 |
| Discount rates | | 2.7 | % | | 2.4 | % | | 3.2 | % | | 1.9 | % | | 1.4 | % | | 2.1 | % | | 2.1 | % | | 1.6 | % | | 2.4 | % |
| Expected long-term rates of return on plan assets | | 6.3 | % | | 6.8 | % | | 7.0 | % | | 4.4 | % | | 4.7 | % | | 5.2 | % | | 4.7 | % | | 5.1 | % | | 5.6 | % |
The expected long-term rates of return on defined benefit pension plan assets for the 2023 NPPC are 7.0% for the U.S. plans and 5.1% for the international plans. The expected global long-term rate of return on assets for 2023 is 5.5%.
The weighted-average actuarial assumptions used to determine the defined benefit pension plan obligations at December 31, 2022 and 2021 were as follows:
| | | | | | | | | | | | | | | | | | | | | | | | | | | | | | | | | | | | | | |
| | U.S. Plans | | International Plans | | Global Weighted-Average |
| | December 31 | | December 31 | | December 31 |
| | 2022 | | 2021 | | 2022 | | 2021 | | 2022 | | 2021 |
| Discount rates | | 5.3 | % | | 2.7 | % | | 5.1 | % | | 1.9 | % | | 5.1 | % | | 2.1 | % |
Since accrued service is no longer granted to the U.S. defined benefit plans and the majority of the international defined benefit pension plans, the rate of compensation increase did not have a significant impact on the defined benefit pension obligation at December 31, 2022 and 2021 or the defined benefit pension plan NPPC for the years ended 2022, 2021 and 2020.
The U.S. discount rate was determined using a yield curve that was produced from a universe containing approximately 1,100 U.S. dollar-denominated, AA-graded corporate bonds, all of which were noncallable (or callable with make-whole provisions) and excluding the 10% of the bonds with the highest deviation from the expected yield and the 10% with the lowest deviation from the expected yield within each duration group. The discount rate was then developed as the level-equivalent rate that would produce the same present value as that using spot rates to discount the projected benefit payments. For international plans, the discount rate is aligned to corporate bond yields in the local markets, normally AA-rated corporations. The process and selection seek to approximate the cash inflows with the timing and amounts of the expected benefit payments.
Accumulated Benefit Obligation
The accumulated benefit obligation for all defined benefit pension plans at December 31, 2022 and 2021 was as follows:
| | | | | | | | | | | | | | | | | | | | | | | | | | |
| | U.S. Plans | | International Plans |
| | December 31 | | December 31 |
| (In millions) | | 2022 | | 2021 | | 2022 | | 2021 |
| Accumulated benefit obligation | | $ | 209.2 | | | $ | 277.0 | | | $ | 593.4 | | | $ | 1,016.1 | |
Defined Benefit Pension Plans with Accumulated Benefit Obligation in Excess of Plan Assets
The projected benefit obligation, accumulated benefit obligation and fair value of plan assets for defined benefit pension plans with accumulated benefit obligations in excess of plan assets at December 31, 2022 and 2021 were as follows:
| | | | | | | | | | | | | | | | | | | | | | | | | | |
| | U.S. Plans | | International Plans |
| | December 31 | | December 31 |
| (In millions) | | 2022 | | 2021 | | 2022 | | 2021 |
| Projected benefit obligation | | $ | 209.2 | | | $ | 277.0 | | | $ | 25.3 | | | $ | 988.6 | |
| Accumulated benefit obligation | | 209.2 | | | 277.0 | | | 22.6 | | | 984.7 | |
| Fair value of plan assets | | 177.0 | | | 232.9 | | | 9.4 | | | 939.3 | |
The asset allocations attributable to the Company's U.S. defined benefit pension plans at December 31, 2022 and 2021, and the long-term target allocation of plan assets, by asset category, are as follows:
| | | | | | | | | | | | | | | | | | | | |
| | Target Long-Term
Allocation | | Percentage of Plan Assets
December 31 |
| U.S. Plans Asset Category | | | 2022 | | 2021 |
| Domestic equity securities | | 18%-28% | | 21.0 | % | | 22.8 | % |
| International equity securities | | 17%-27% | | 22.2 | % | | 22.5 | % |
| Fixed income securities | | 41%-51% | | 44.6 | % | | 45.9 | % |
| Cash and cash equivalents | | Less than 5% | | 1.0 | % | | — | % |
Other (a) | | 4%-14% | | 11.2 | % | | 8.8 | % |
(a) Investments within this caption include diversified global asset allocation funds and credit collection funds.
Defined benefit pension plan assets are allocated among various categories of equities, fixed income securities and cash and cash equivalents with professional investment managers whose performance is actively monitored. The primary investment objective is long-term growth of assets in order to meet present and future benefit obligations. The Company periodically conducts an asset/liability modeling study and accordingly adjusts investments among and within asset categories to ensure the long-term investment strategy is aligned with the profile of benefit obligations.
The Company reviews the long-term expected return on asset assumption on a periodic basis considering a variety of factors including historical investment returns achieved over a long-term period, the targeted allocation of plan assets and future expectations based on a model of asset returns for an actively managed portfolio. The model simulates 1,000 different capital market results over 20 years. The expected return-on-asset assumption for U.S. defined benefit pension plans for 2023 and 2022 are 7.0% and 6.3%, respectively.
The U.S. defined benefit pension plans' assets include 310,000 shares at December 31, 2022 and 310,000 shares at December 31, 2021 of the Company's common stock, valued at $2.0 million and $5.2 million, respectively. These shares represented 1.1% and 2.2% of total U.S. plan assets at December 31, 2022 and 2021, respectively.
The asset allocations attributable to the Company's international defined benefit pension plans at December 31, 2022 and 2021 and the long-term target allocation of plan assets, by asset category, are as follows:
| | | | | | | | | | | | | | | | | | | | |
| International Plans Asset Category | | Target Long-Term
Allocation | | Percentage of Plan Assets
December 31 |
| | 2022 | | 2021 |
| Equity securities | | 26.5 | % | | 24.8 | % | | 27.9 | % |
| Fixed income securities | | 65.5 | % | | 65.5 | % | | 63.6 | % |
| Cash and cash equivalents | | — | | | 1.5 | % | | 0.7 | % |
Other (b) | | 8.0 | % | | 8.2 | % | | 7.8 | % |
(b) Investments within this caption include diversified growth funds and real estate funds.
International defined benefit pension plan assets at December 31, 2022 in the U.K. defined benefit pension plan totaled approximately 94% of the international defined benefit pension plan assets. The U.K. plan assets are allocated among various categories of equities, fixed income securities and cash and cash equivalents with professional investment managers whose performance is actively monitored. The primary investment objective is long-term growth of assets in order to meet present and future benefit obligations. The Company periodically conducts asset/liability modeling studies and accordingly adjusts investment amounts within asset categories to ensure the long-term investment strategy is aligned with the profile of benefit obligations.
For the international long-term rate of return assumption, the Company considered the current level of expected returns in risk-free investments (primarily government bonds), the historical level of the risk premium associated with other asset classes in which the portfolio is invested, and the expectations for future returns of each asset class and plan expenses. The expected return for each asset class is then weighted based on the target asset allocation to develop the expected long-term rate of return on assets. The expected return on asset assumption for the U.K. defined benefit pension plan for 2023 and 2022 are 5.0% and 4.3%, respectively. The remaining international defined benefit pension plans, with plan assets representing approximately 6% of the international defined benefit pension plan assets, are under the guidance of professional investment managers and have similar investment objectives.
The fair values of the Company's U.S. defined benefit pension plans' assets at December 31, 2022 by asset class are as follows:
| | | | | | | | | | | | | | | | | | | | | | |
| (In thousands) | | Total | | Level 1 | | | | Investments Valued at Net Asset Value (c) |
| Domestic equities: | | | | | | | | |
| Common stocks | | $ | 1,951 | | | $ | 1,951 | | | | | $ | — | |
| Mutual funds—equities | | 35,177 | | | 35,177 | | | | | — | |
| International equities: | | | | | | | | |
| | | | | | | | |
| Mutual funds—equities | | 39,287 | | | 39,287 | | | | | — | |
| Fixed income investments: | | | | | | | | |
| | | | | | | | |
| | | | | | | | |
| Mutual funds—bonds | | 78,943 | | | 78,943 | | | | | — | |
| Other—mutual funds | | 6,699 | | | 6,699 | | | | | — | |
| Cash and money market accounts | | 1,780 | | | 1,780 | | | | | — | |
| Other—partnerships/joint ventures | | 13,207 | | | — | | | | | 13,207 | |
| Total | | $ | 177,044 | | | $ | 163,837 | | | | | $ | 13,207 | |
(c) Certain investments that are measured at fair value using Net Asset Value per share (or its equivalent) as a practical expedient have not been classified in the fair value hierarchy.
The fair values of the Company's U.S. defined benefit pension plans' assets at December 31, 2021 by asset class are as follows:
| | | | | | | | | | | | | | | | | | | | | | |
| (In thousands) | | Total | | Level 1 | | | | Investments Valued at Net Asset Value |
| Domestic equities: | | | | | | | | |
| Common stocks | | $ | 5,180 | | | $ | 5,180 | | | | | $ | — | |
| Mutual funds—equities | | 48,411 | | | 48,411 | | | | | — | |
| International equities: | | | | | | | | |
| | | | | | | | |
| Mutual funds—equities | | 50,783 | | | 50,783 | | | | | — | |
| Fixed income investments: | | | | | | | | |
| | | | | | | | |
| | | | | | | | |
| Mutual funds—bonds | | 105,114 | | | 105,114 | | | | | — | |
| Other—mutual funds | | 9,371 | | | 9,371 | | | | | — | |
| Cash and money market accounts | | 1,624 | | | 1,624 | | | | | — | |
| Other - partnerships/joint ventures | | 12,464 | | | — | | | | | 12,464 | |
| Total | | $ | 232,947 | | | $ | 220,483 | | | | | $ | 12,464 | |
The fair values of the Company's international defined benefit pension plans' assets at December 31, 2022 by asset class are as follows:
| | | | | | | | | | | | | | | | | | | | | | | | |
| (In thousands) | | Total | | Level 1 | | Level 2 | | | | |
| Equity securities: | | | | | | | | | | |
| Mutual funds—equities | | $ | 150,813 | | | $ | — | | | $ | 150,813 | | | | | |
| Fixed income investments: | | | | | | | | | | |
| Mutual funds—bonds | | 392,960 | | | — | | | 392,960 | | | | | |
| Insurance contracts | | 4,636 | | | — | | | 4,636 | | | | | |
| Other: | | | | | | | | | | |
| | | | | | | | | | |
| Other mutual funds | | 49,805 | | | — | | | 49,805 | | | | | |
| Cash and money market accounts | | 9,020 | | | 9,020 | | | — | | | | | |
| Total | | $ | 607,234 | | | $ | 9,020 | | | $ | 598,214 | | | | | |
The fair values of the Company's international defined benefit pension plans' assets at December 31, 2021 by asset class are as follows:
| | | | | | | | | | | | | | | | | | | | | | | | |
| (In thousands) | | Total | | Level 1 | | Level 2 | | | | |
| Equity securities: | | | | | | | | | | |
| Mutual funds—equities | | $ | 271,811 | | | $ | — | | | $ | 271,811 | | | | | |
| Fixed income investments: | | | | | | | | | | |
| | | | | | | | | | |
| Mutual funds—bonds | | 613,243 | | | — | | | 613,243 | | | | | |
| Insurance contracts | | 5,684 | | | — | | | 5,684 | | | | | |
| Other: | | | | | | | | | | |
| | | | | | | | | | |
| Other mutual funds | | 75,651 | | | — | | | 75,651 | | | | | |
| Cash and money market accounts | | 6,863 | | | 6,863 | | | — | | | | | |
| Total | | $ | 973,252 | | | $ | 6,863 | | | $ | 966,389 | | | | | |
Following is a description of the valuation methodologies used for the defined benefit pension plans' investments measured at fair value:
•Level 1 Fair Value Measurements—Investments in interest-bearing cash are stated at cost, which approximates fair value. The fair values of money market accounts and certain mutual funds are based on quoted net asset values of the shares held by the plan at year-end. The fair values of domestic and international stocks and corporate bonds, notes and convertible debentures are valued at the closing price reported in the active market on which the individual securities are traded.
•Level 2 Fair Value Measurements—The fair values of investments in mutual funds for which quoted net asset values in an active market are not available are valued by the investment advisor based on the current market values of the underlying assets of the mutual fund based on information reported by the investment consistent with audited financial statements of the mutual fund. Further information concerning these mutual funds may be obtained from their separate audited financial statements. Investments in U.S. Treasury notes and collateralized securities are valued based on yields currently available on comparable securities of issuers with similar credit ratings.
Multiemployer Pension Plans
The Company, through the Harsco Environmental Segment, contributes to several MEPPs under the terms of collective-bargaining agreements that cover union-represented employees, many of whom are temporary in nature. The Company's total contributions to MEPPs were $1.9 million, $1.7 million and $1.6 million for the years ended December 31, 2022, 2021 and 2020, respectively.
11. Income Taxes
Current income tax expense or benefit represents the amounts expected to be reported on the Company's income tax returns, and deferred income tax expense or benefit represents the change in net deferred tax assets and liabilities. Deferred tax assets and liabilities are determined based on the difference between the financial statement and tax bases of assets and liabilities as measured by the enacted income tax rates that will be in effect when these differences reverse. Valuation allowances are recorded as appropriate to reduce deferred tax assets to the amount considered more likely than not to be realized.
Income (loss) from continuing operations before income taxes and equity income as reported on the Consolidated Statements of Operations consists of the following:
| | | | | | | | | | | | | | | | | | | | |
| (In thousands) | | 2022 | | 2021 | | 2020 |
| U.S. | | $ | (152,602) | | | $ | (34,462) | | | $ | (87,315) | |
| International | | 29,644 | | | 71,968 | | | 33,095 | |
| Total income (loss) from continuing operations before income taxes and equity income | | $ | (122,958) | | | $ | 37,506 | | | $ | (54,220) | |
Income tax expense (benefit) as reported on the Consolidated Statements of Operations consists of the following:
| | | | | | | | | | | | | | | | | | | | |
| (In thousands) | | 2022 | | 2021 | | 2020 |
| Income tax expense (benefit): | | | | | | |
| Currently payable: | | | | | | |
| U.S. federal | | $ | — | | | $ | — | | | $ | (12,116) | |
| U.S. state | | 1,416 | | | 507 | | | 468 | |
| International | | 14,914 | | | 22,295 | | | 16,518 | |
| Total income taxes currently payable | | 16,330 | | | 22,802 | | | 4,870 | |
| Deferred U.S. federal | | (6,219) | | | (4,594) | | | (10,558) | |
| Deferred U.S. state | | (2,274) | | | (18) | | | (3,078) | |
| Deferred international | | 2,544 | | | (9,101) | | | 93 | |
| Total income tax expense (benefit) from continuing operations | | $ | 10,381 | | | $ | 9,089 | | | $ | (8,673) | |
Cash payments for income taxes were $20.9 million, $21.7 million and $34.9 million for 2022, 2021 and 2020, respectively. The cash payments for 2022 are relatively consistent with the payments for 2021. The decrease in cash payments for 2021 is principally due to payments associated with the gain on the sale of IKG in 2020 not recurring in 2021.
A reconciliation of the normal expected statutory U.S. federal income tax expense (benefit) to the actual Income tax expense (benefit) from continuing operations as reported on the Consolidated Statements of Operations is as follows:
| | | | | | | | | | | | | | | | | | | | |
| (In thousands) | | 2022 | | 2021 | | 2020 |
| U.S. federal income tax expense (benefit), at statutory tax rate of 21% | | $ | (25,821) | | | $ | 7,877 | | | $ | (11,386) | |
| U.S. state income taxes, net of federal income tax benefit | | (929) | | | (310) | | | (2,015) | |
| U.S. other domestic deductions and credits | | (594) | | | (415) | | | (1,312) | |
| Difference in effective tax rates on international earnings and remittances | | 8,929 | | | 4,488 | | | 7,872 | |
| Uncertain tax position contingencies and settlements | | (290) | | | 783 | | | 289 | |
| Changes in realization of deferred tax assets | | 8,263 | | | (5,035) | | | (1,501) | |
| U.S. non-deductible expenses | | 791 | | | 936 | | | 2,300 | |
| | | | | | |
| Nondeductible goodwill impairment | | 19,548 | | | — | | | — | |
| State deferred tax rate changes | | 154 | | | 592 | | | (40) | |
| Foreign derived intangible income deduction | | (938) | | | — | | | — | |
| Share-based compensation | | 1,268 | | | 173 | | | (184) | |
| Net operating loss carryback | | — | | | — | | | (2,696) | |
| Total income tax expense (benefit) from continuing operations | | $ | 10,381 | | | $ | 9,089 | | | $ | (8,673) | |
At December 31, 2022, 2021 and 2020, the Company's annual effective income tax rate on income (loss) from continuing operations was (8.4)%, 24.2% and 16.0%, respectively.
The Company’s international income from continuing operations before income taxes and equity income was $29.6 million and $72.0 million for 2022 and 2021, respectively. In 2021, the Company recorded $6.8 million income tax benefit arising from the recognition of deferred tax assets in HE Brazil. Brazil has 3 years of cumulative income and expects to utilize the deferred tax assets against future income. Also, in 2021, the Company recorded a $7.0 million nontaxable capital gain on the sale of U.K. assets not recurring in 2022. In 2022, the Company recorded a $15.0 million intangible assets impairment for the Altek business with no tax benefit. The Company's total international income tax expense increased from $13.2 million in 2021 to $17.4 million in 2022 primarily due to the Brazil income tax benefit in 2021 not recurring in 2022, partially offset by the change in mix of income.
The Company’s differences in income tax expense for 2022 and 2021 on international earnings and remittances was $10.3 million and $4.5 million, respectively, which included U.S income tax expense on international deemed remittances of $0.1 million and $0.1 million respectively. The increase is primarily due to no tax benefit recorded on the $15.0 million intangible assets impairment recorded for the Altek business and the change in mix of income.
The Company's U.S. loss from continuing operations before income taxes and equity income was $152.6 million and $34.5 million for 2022 and 2021, respectively. The Company's total U.S. income tax benefit increased from $4.1 million in 2021 to $7.1 million in 2022 primarily due to the reduced operational profit and a $3.0 million tax benefit recorded on the deductible portion of the goodwill impairment recorded for the Clean Earth business, offset by partially disallowed interest expense.
The income tax effects of the temporary differences giving rise to the Company's deferred tax assets and liabilities at December 31, 2022 and 2021 are as follows:
| | | | | | | | | | | | | | | | | | | | | | | | | | |
| | 2022 (a) | | 2021 (a) |
| (In thousands) | | Asset | | Liability | | Asset | | Liability |
| Depreciation and amortization | | $ | — | | | $ | 61,145 | | | $ | — | | | $ | 80,278 | |
| Right-of-use assets | | — | | | 24,826 | | | — | | | 25,130 | |
| Operating lease liabilities | | 25,024 | | | — | | | 24,802 | | | — | |
| Expense accruals | | 28,758 | | | — | | | 24,949 | | | — | |
| Inventories | | 4,011 | | | — | | | 3,400 | | | — | |
| Provision for receivables | | 2,781 | | | — | | | 3,997 | | | — | |
| Deferred revenue | | 4,484 | | | — | | | — | | | 2,750 | |
| Operating loss carryforwards | | 54,237 | | | — | | | 67,442 | | | — | |
| Tax credit carryforwards | | 21,443 | | | — | | | 18,608 | | | — | |
| | | | | | | | |
| Pensions | | 5,171 | | | — | | | 23,298 | | | — | |
| Currency adjustments | | — | | | 3,330 | | | 3,701 | | | — | |
| | | | | | | | |
| Section 163(j) disallowed interest expense | | 13,869 | | | — | | | 4,843 | | | — | |
| Research and development | | 2,795 | | | — | | | — | | | — | |
| Stock based compensation | | 6,580 | | | — | | | 7,396 | | | — | |
| Other | | — | | | 3,198 | | | 2,164 | | | — | |
| Subtotal | | 169,153 | | | 92,499 | | | 184,600 | | | 108,158 | |
| Valuation allowance | | (89,234) | | | — | | | (92,385) | | | — | |
| Total deferred income taxes | | $ | 79,919 | | | $ | 92,499 | | | $ | 92,215 | | | $ | 108,158 | |
(a) Does not include approximately $1.0 billion of statutory loss carryforwards within Luxembourg for which the Company considers the utilization of these attributes remote and as such no deferred tax asset or corresponding valuation allowance has been recorded.
At December 31, 2022, the tax-effected amount of NOLs totaled $54.2 million. Tax-effected NOLs from international operations are $40.6 million. Of that amount, $35.5 million can be carried forward indefinitely and $5.1 million will expire at various times between 2023 and 2042. Tax-effected U.S. state NOLs are $12.1 million. Of that amount, $1.8 million expire at various times between 2023 and 2027, $2.5 million expire at various times between 2028 and 2032, $3.6 million expire at various times between 2033 and 2037 and $4.2 million expire at various times between 2038 and 2042. At December 31, 2022, the tax-effected amount of U.S. Federal NOLs totaled $1.5 million. Of that amount, $1.5 million can be carried forward indefinitely.
Valuation allowances of $89.2 million and $92.4 million at December 31, 2022 and 2021, respectively, related principally to deferred tax assets for pension liabilities, NOLs, disallowed interest expense and foreign currency translation that are uncertain as to realizability. In 2022, the Company recorded a valuation allowance reduction of $7.1 million related to current year pension adjustment recorded through AOCI, a valuation allowance reduction of $6.4 million from the effects of foreign currency translation adjustments and a valuation allowance reduction of $4.3 million related to the tax rate reduction in certain jurisdiction in U.S, partially offset by a $5.2 million valuation allowance increase related to current year losses in certain foreign jurisdictions where the Company determined that it is more likely than not that these assets will not be realized, and a $8.9 million valuation allowance increase related to disallowed interest expense.
The Tax Act introduced a transition tax and a territorial tax system, which was effective beginning in 2018. The territorial tax system impacts the Company's overall global capital and legal entity structure, working capital, and repatriation plan on a go-forward basis. The Company asserts that all foreign earnings will be indefinitely reinvested to meet local cash needs. The Company therefore intends to limit distributions to earnings previously taxed in the U.S., or earnings that would qualify for the 100 percent dividends received deduction provided for in the Tax Act, and earnings that would not result in any significant foreign taxes. Therefore, the Company has not recognized a deferred tax liability on its investment in foreign subsidiaries.
The Company recognizes accrued interest and penalty expense related to unrecognized income tax benefits in income tax expense or benefit. The Company recognized an income tax benefit of $0.4 million, an income tax expense of $0.4 million and $0.2 million during 2022, 2021 and 2020, respectively, for interest and penalties. The Company has accrued $1.3 million, $1.7 million and $1.4 million for the payment of interest and penalties at December 31, 2022, 2021 and 2020, respectively.
A reconciliation of the change in the unrecognized income tax benefits balance from January 1, 2020 to December 31, 2022 is as follows:
| | | | | | | | | | | | | | | | | | | | |
| (In thousands) | | Unrecognized
Income Tax
Benefits | | Deferred
Income Tax
Benefits | | Unrecognized
Income Tax
Benefits, Net of
Deferred Income
Tax Benefits |
| Balances, January 1, 2020 | | $ | 3,129 | | | $ | (22) | | | $ | 3,107 | |
| Additions for tax positions related to the current year (includes currency translation adjustment) | | 596 | | | (2) | | | 594 | |
| | | | | | |
| Other reductions for tax positions related to prior years | | (771) | | | — | | | (771) | |
| Statutes of limitation expirations | | (58) | | | 2 | | | (56) | |
| | | | | | |
| Balance at December 31, 2020 | | 2,896 | | | (22) | | | 2,874 | |
| Additions for tax positions related to the current year (includes currency translation adjustment) | | 316 | | | (1) | | | 315 | |
| Additions for tax positions related to prior years (includes currency translation adjustment) | | 500 | | | — | | | 500 | |
| | | | | | |
| Statutes of limitation expirations | | (585) | | | 1 | | | (584) | |
| | | | | | |
| Balance at December 31, 2021 | | 3,127 | | | (22) | | | 3,105 | |
| | | | | | |
| Additions for tax positions related to the current year (includes currency translation adjustment) | | 189 | | | (1) | | | 188 | |
| | | | | | |
| | | | | | |
| Statutes of limitation expirations | | (524) | | | 2 | | | (522) | |
| | | | | | |
| Total unrecognized income tax benefits that, if recognized, would impact the effective income tax rate at December 31, 2022 | | $ | 2,792 | | | $ | (21) | | | $ | 2,771 | |
Within the next twelve months, it is reasonably possible that up to $1.1 million of unrecognized income tax benefits will be recognized upon settlement of income tax examinations and the expiration of various statutes of limitations.
The Company files income tax returns as prescribed by the tax laws of the jurisdictions in which it operates. These tax returns are subject to examinations and possible challenge by the tax authorities. Positions challenged by the tax authorities may be settled or appealed by the Company.
The tax years that remain subject to examination for the Company's major tax jurisdictions as of December 31, 2022 are shown below:
| | | | | | | | |
| Jurisdiction | | Earliest Open Year |
| Brazil | | 2018 |
| China | | 2017 |
| France | | 2020 |
| United States: | | |
| Federal income tax | | 2014 |
| State income tax | | 2016 |
12. Commitments and Contingencies
Environmental
The Company is involved in a number of environmental remediation investigations and cleanups and, along with other companies, has been identified as a “potentially responsible party” for certain byproduct disposal sites. While each of these matters is subject to various uncertainties, it is probable that the Company will agree to make payments toward funding certain of these activities, and it is possible that some of these matters will be decided unfavorably to the Company. The Company has evaluated its potential liability and its financial exposure is dependent upon such factors as the continuing evolution of environmental laws and regulatory requirements, the availability and application of technology, the allocation of cost among potentially responsible parties, the years of remedial activity required and the remediation methods selected.
The Company evaluates its liability for future environmental remediation costs on a quarterly basis. Although actual costs to be incurred at identified sites in future periods may vary from the estimates (given inherent uncertainties in evaluating environmental exposures), the Company does not expect that any costs that are reasonably possible to be incurred by the Company in connection with environmental matters in excess of the amounts accrued would have a material adverse effect on the Company's financial condition, results of operations or cash flows.
The following table summarizes information related to the location and undiscounted amount of the Company's environmental liabilities:
| | | | | | | | | | | | | | |
| (In thousands) | | December 31
2022 | | December 31
2021 |
Current portion of environmental liabilities (a) | | $ | 7,120 | | | $ | 7,338 | |
| Long-term environmental liabilities | | 26,880 | | | 28,435 | |
| Total environmental liabilities | | $ | 34,000 | | | $ | 35,773 | |
(a) The current portion of environmental liabilities is included in the caption Other current liabilities on the Consolidated Balance Sheets.
Legal Proceedings
In the ordinary course of business, the Company is a defendant or party to various claims and lawsuits, including those discussed below.
On March 28, 2018, the United States Environmental Protection Agency (the “EPA”) conducted an inspection of ESOL’s off-site waste management facility in Detroit, MI. On November 23, 2021, the EPA proposed a civil penalty of $390,092 as part of a proposed Administrative Consent Order for alleged improper air emissions at the site. The allegations in the proposed Administrative Consent Order and civil penalty relate exclusively to the period prior the Company’s purchase of the ESOL business. The Company is vigorously contesting the allegations. While it is the Company's position that any loss related to this issue will be recoverable under indemnity rights under the ESOL purchase agreement and representations and warranties insurance policies purchased by the Company, there can be no assurance that the Company's position will ultimately prevail. On August 31, 2022, the parties executed a Tolling Agreement, which excludes the period from March 1, 2022 through December 30, 2022, for the purposes of calculating the statute of limitations and other related defenses.
On January 27, 2020, the U.S. EPA issued a Notice of Potential Liability to the Company, along with several other companies, concerning the Newtown Creek Superfund Site located in Kings and Queens Counties in New York. The Notice alleges certain facilities formerly owned or operated by subsidiaries of the Company may have resulted in the discharge of hazardous substances into Newtown Creek or its Dutch Kills tributary. The site has been subject to CERCLA response activities since approximately 2011. The U.S. EPA expects to propose a sitewide cleanup plan no sooner than 2024 and announced, in July 2021, that it would defer its decision on a potential early action response for the lower two miles of the Creek until the sitewide studies are completed. The Company is one of approximately twenty (20) Potentially Responsible Parties ("PRPs") that have received notices, though it is believed other PRPs may exist. The Company vigorously contests the allegations of the Notice and currently does not believe that this matter will have a material effect on the Company’s financial position or results from operations.
On June 25 and 26, 2018, the DTSC conducted a compliance enforcement inspection of ESOL’s facility in Rancho Cordova, California, which was then owned by Stericycle, Inc. On February 14, 2020, the DTSC filed an action in the Superior Court for the State of California, Sacramento Division, alleging violations of California’s Hazardous Waste Control Law and the facility’s hazardous waste permit arising from the inspection. On August 27, 2020 the DTSC issued a Notice of Denial of Hazardous Waste Facility Permit Application, denying the renewal of the facility's hazardous waste permit. The Company has exhausted its legal challenges to the denial of the Hazardous Waste facility permit, and the hazardous waste facility is in the process of closing. The Company continues to utilize the site for non-hazardous waste and is evaluating additional potential alternate uses for the site. The DTSC investigation and compliance issues leading to the compliance tier assignment were ongoing well before the Company's acquisition of the ESOL business, and the Company was aware of the investigation and many of the issues raised in the investigation at the time of the purchase. Accordingly, the Company is indemnified for certain fines and other costs and expenses associated with this matter by Stericycle, Inc. The Company has not accrued any amounts in respect of these alleged violations and cannot estimate the reasonably possible loss or the range of reasonably possible losses that it may incur.
The Company has had ongoing meetings with the SCE over processing salt cakes, a processing byproduct, stored at the Al Hafeerah site. The Company’s Bahrain operations that produced the salt cakes has ceased operations. An Environmental Impact Assessment and Technical Feasibility Study for facilities to process the salt cakes was approved by the SCE during the first quarter of 2018. Commissioning of the facilities was completed during the third quarter of 2021 and the processing of the salt cakes has commenced. The Company's current reserve of $6.2 million at December 31, 2022 continues to represent the Company's best estimate of the ultimate costs to be incurred to resolve this matter. The Company continues to evaluate this reserve and any future change in estimated costs, which could be material to the Company’s results of operations in any one period.
On July 27, 2018 Brazil’s Federal and Rio de Janeiro State Public Prosecution Offices (MPF and MPE) filed a Civil Public Action against one of the Company's customers (CSN), the Company’s Brazilian subsidiary, the Municipality of Volta Redonda, Brazil, and the Instituto Estadual do Ambiente (local environmental protection agency) seeking the implementation of various measures to limit and reduce the accumulation of customer-owned slag at the site in Brazil. On August 6, 2018 the 3rd Federal Court in Volta Redonda granted the MPF and MPE an injunction against the same parties requiring, among other things, CSN and the Company’s Brazilian subsidiary to limit the volume of slag sent to the site. Because the customer owns the site and the slag located on the site, the Company believes that complying with this injunction is the steel producer’s responsibility. On March 18, 2019 the Court issued an order fining the Company 5,000 Brazilian reais per day (or approximately $1 thousand per day) and CSN 20,000 Brazilian reais per day (or approximately $4 thousand per day) until the requirements of the injunction are met. On November 1, 2019 the Court issued an additional order increasing the fines assessed to the Company to 25,000 Brazilian reais per day (or approximately $5 thousand per day) and raising the fines assessed to CSN to 100,000 Brazilian reais per day (or approximately $19 thousand per day). The Court also assessed an additional fine of 10,000,000 Brazilian reais (or approximately $2 million) against CSN and the Company jointly. The Company is appealing the fines and the underlying injunction. Both the Company and CSN continue to have discussions with the Prosecution Offices and governmental authorities on the injunction and the possible resolution of the underlying case. Beginning on March 25, 2022, the Courts entered a series of orders suspending the litigation proceedings, as well as the accrual of interest and penalties while the parties discuss a possible resolution of the matter. The Company does not believe that a loss relating to this matter is probable or estimable at this point.
On October 19, 2018 local environmental authorities issued an enforcement action against the Company concerning the Company’s operations at a customer site in Ijmuiden, Netherlands. The enforcement action alleged violations of the Company’s environmental permit at the site, which restricts the release of any visible dust emissions. On January 12, 2022, the Administrative Supreme Court upheld the Company’s challenge of these enforcement actions as they relate to the slag tipping area of the site. As a result, all fines asserted against the Company to date have been invalidated and all fines paid to date have been reimbursed. This order is not appealable. On or about October 14, 2021, the Company received a subpoena and two indictments on this matter before the Amsterdam District Court in the Netherlands. The Amsterdam Public Prosecutor’s Office issued the two indictments against the Company, alleging violations in connection with dust releases and/or events alleged to have occurred in 2018 through May 2020 at the site. The action cites provisions which permit fines for the alleged infractions and seeks €100,000 in fines with a smaller amount held in abeyance. On February 2, 2022, the prosecutor announced that they would further investigate residents’ claims related to this matter. On February 25, 2022, the Amsterdam District Court ruled that the Company was liable for only one alleged violation and that this alleged violation was unintentional. The court issued a fine of €5,000, to be held in abeyance. Both the Company and the Public Prosecutor’s Office have appealed this ruling. The Company is vigorously contesting all allegations against it and is also working with its customer to ensure the control of emissions. The Company has contractual indemnity rights from its customer that it believes will substantially cover any fines or penalties.
On November 5, 2020, a worker suffered a fatal injury at a site owned by the Company’s customer, Gerdau Ameristeel US, Inc., in Midlothian, TX. Although the Company was not directly involved in the accident, the worker was employed by a sub-contractor of a sub-contractor of the Company. The worker’s family filed suit in the 125th Judicial District Court of Harris County, TX against multiple parties including the Company. By a letter agreement dated December 1, 2022, the worker's family agreed to settle their claims against the Company and Gerdau. The parties are working to complete a formal settlement agreement. The Company has recorded a liability for its insurance deductible of $5 million and an indemnification receivable from its customer for the recovery of certain losses based upon the contractual indemnity rights. There can be no assurances that the Company's position will ultimately prevail; however, any financial statement impact is not expected to be material.
On March 22, 2022, the U.S. EPA issued a Notice of Intent to File an Administrative Complaint (NOI) alleging violations of the federal Emergency Planning and Community Right-to-Know Act at the Company’s facilities in Tacoma, WA and Kent, WA. The NOI relates exclusively or almost exclusively to the period when Stericycle owned and operated the sites. The NOI proposes a penalty of $3,000,000. The Company is currently reviewing the veracity of the allegations and the corresponding proposed penalty amount and has recorded a liability of $600,000 as its best estimate to resolve this matter. While it is the Company’s position that it has recourse for some or all liabilities, if any, that arise from this matter under the ESOL purchase agreement and representations and warranties insurance policies purchased by the Company, there can be no assurances that the Company’s position will ultimately prevail.
On March 21, 2022, the Company received a draft penalty matrix from the PA DEP concerning alleged reporting, monitoring and related issues at the Company’s Hatfield, PA site prior to the time the Company acquired the site from Stericycle. The draft penalty matrix proposes a penalty of $1,000,000. On June 29, 2022, the PA DEP issued a draft Consent Assessment of Civil Penalty ("CACP") related to the alleged issues at the site. The Company and PA DEP have reached an agreement in principle to settle PA DEP's claims for $239,500, which has been recorded as a liability. The parties are working to draft a final CACP. While it is the Company’s position that it has recourse for some or all liabilities that arise from this matter under the ESOL purchase agreement and representations and warranties insurance policies purchased by the Company, there can be no assurances that the Company’s position will ultimately prevail.
DEA Investigation
Prior to the Company’s acquisition of ESOL, Stericycle, Inc., notified the Company that the DEA had served an administrative subpoena on Stericycle, Inc. and executed a search warrant at a facility in Rancho Cordova, California and an administrative inspection warrant at a facility in Indianapolis, Indiana. The Company has determined that the DEA and the DTSC have launched investigations involving, at least in part, the ESOL business of collecting, transporting, and destroying controlled substances from retail customers that transferred from Stericycle, Inc. to the Company. The Company is cooperating with these inquiries, which relate primarily to the period before the Company owned the ESOL business. Since the acquisition of the ESOL business, the Company has performed a vigorous review of ESOL’s compliance program related to controlled substances and has made material changes to the manner in which controlled substances are transported from retail customers to DEA-registered facilities for destruction. The Company has not accrued any amounts in respect of these investigations and cannot estimate the reasonably possible loss or the range of reasonably possible losses that it may incur, if any. Investigations of this type are, by their nature, uncertain and unpredictable. While it is the Company’s position that it has recourse for some or all liabilities, if any, that arise from these matters under the ESOL purchase agreement and representations and warranties insurance policies purchased by the Company, there can be no assurances that the Company’s position will ultimately prevail.
Brazilian Tax Disputes
The Company is involved in a number of tax disputes with federal, state and municipal tax authorities in Brazil. These disputes are at various stages of the legal process, including the administrative review phase and the collection action phase, and include assessments of fixed amounts of principal and penalties, plus interest charges that increase at statutorily determined amounts per month and are assessed on the aggregate amount of the principal and penalties. In addition, the losing party, at the collection action or court of appeals phase, could be subject to a charge to cover statutorily mandated legal fees, which are generally calculated as a percentage of the total assessed amounts due, inclusive of penalty and interest. Many of the claims relate to ICMS, services and social security tax disputes. The largest proportion of the assessed amounts relate to ICMS claims filed by the SPRA, encompassing the period from January 2002 to May 2005.
In October 2009 the Company received notification of the SPRA’s final administrative decision regarding the levying of ICMS in the State of São Paulo in relation to services provided to a customer in the State between January 2004 and May 2005. As of December 31, 2022, the principal amount of the tax assessment from the SPRA with regard to this case is approximately $1.1 million, with penalty, interest and fees assessed to date increasing such amount by an additional $16.9 million. On June 4, 2018, the Appellate Court of the State of Sao Paulo ruled in favor of the SPRA but ruled that the assessed penalty should be reduced to approximately $1.1 million. After calculating the interest accrued on the penalty, the Company estimates that this ruling reduces the current overall potential liability for this case to approximately $6.9 million. All such amounts include the effect of foreign currency translation. The Company has appealed the ruling in favor of the SPRA to the Superior Court of Justice. Due to multiple court precedents in the Company's favor, as well as the Company's ability to appeal, the Company does not believe a loss is probable.
Another ICMS tax case involving the SPRA refers to the tax period from January 2002 to December 2003. In December 2018, the administrative tribunal hearing the case upheld the Company's liability. The aggregate amount assessed by the tax authorities in August 2005 was $4.8 million (the amounts with regard to this claim are valued as of the date of the assessment since it has not yet reached the collection phase), composed of a principal amount of $1.1 million, with penalty and interest assessed through that date increasing such amount by an additional $3.6 million. On December 6, 2018, the administrative tribunal reduced the applicable penalties to $0.8 million. After calculating the interest accrued on the current penalty, the Company estimates that the current overall liability for this case to be approximately $5.3 million. All such amounts include the effect of foreign currency translation. The Company has appealed to the judicial phase at the Third Trial Court of the District of Cubatão, State of São Paulo. On October 14, 2022, the District Court issued a decision holding that the Company is not liable for the taxes at issue. Due to multiple court precedents in the Company's favor, the Company does not believe a loss is probable.
The Company continues to believe that sufficient coverage for these claims exists as a result of the indemnification obligations of the Company's customer and such customer’s pledge of assets in connection with the October 2009 notice, as required by Brazilian law.
On December 30, 2020, the Company received an assessment from the municipal authority in Ipatinga, Brazil alleging $2.0 million in unpaid service taxes from the period 2015 to 2020. After calculating the interest and penalties accrued, the Company estimates that the current overall potential liability for this case to be approximately $3.4 million. On January 18, 2021, the Company filed a challenge to the assessment. Due to the multiple defenses that are available, the Company does not believe a loss is probable.
The Company intends to continue its practice of vigorously defending itself against these tax claims under various alternatives, including judicial appeal. The Company will continue to evaluate its potential liability with regard to these claims on a quarterly basis; however, it is not possible to predict the ultimate outcome of these tax-related disputes in Brazil. No loss provision has been recorded in the Company's consolidated financial statements for the disputes described above because the loss contingency is not deemed probable, and the Company does not expect that any costs that are reasonably possible to be incurred by the Company in connection with Brazilian tax disputes would have a material adverse effect on the Company's financial condition, results of operations or cash flows.
Other
The Company is named as one of many defendants (approximately 90 or more in most cases) in legal actions in the U.S. alleging personal injury from exposure to airborne asbestos over the past several decades. In their suits, the plaintiffs have named as defendants, among others, many manufacturers, distributors and installers of numerous types of equipment or products that allegedly contained asbestos.
The Company believes that the claims against it are without merit. The Company has never been a producer, manufacturer or processor of asbestos fibers. Any asbestos-containing part of a Company product used in the past was purchased from a supplier and the asbestos encapsulated in other materials such that airborne exposure, if it occurred, was not harmful and is not associated with the types of injuries alleged in the pending actions.
At December 31, 2022, there were 17,224 pending asbestos personal injury actions filed against the Company. Of those actions, 16,588 were filed in the New York Supreme Court (New York County), 115 were filed in other New York State Supreme Court Counties and 521 were filed in courts located in other states.
The complaints in most of those actions generally follow a form that contains a standard damages demand of $20 million or $25 million, regardless of the individual plaintiff's alleged medical condition, and without identifying any specific Company product.
At December 31, 2022, 16,549 of the actions filed in New York Supreme Court (New York County) were on the Deferred/Inactive Docket created by the court in December 2002 for all pending and future asbestos actions filed by persons who cannot demonstrate that they have a malignant condition or discernible physical impairment. The remaining 39 cases in New York County are pending on the Active or In Extremis Docket created for plaintiffs who can demonstrate a malignant condition or physical impairment.
The Company has liability insurance coverage under various primary and excess policies that the Company believes will be available, if necessary, to substantially cover any liability that might ultimately be incurred in the asbestos actions referred to above. The costs and expenses of the asbestos actions are being paid by the Company’s insurers.
In view of the persistence of asbestos litigation in the U.S., the Company expects to continue to receive additional claims in the future. The Company intends to continue its practice of vigorously defending these claims and cases. At December 31, 2022, the Company has obtained dismissal in 28,416 cases by stipulation or summary judgment prior to trial.
It is not possible to predict the ultimate outcome of asbestos-related actions in the U.S. due to the unpredictable nature of this litigation, and no loss provision has been recorded in the Company's consolidated financial statements because a loss contingency is not deemed probable or estimable. Despite this uncertainty, and although results of operations and cash flows for a given period could be adversely affected by asbestos-related actions, the Company does not expect that any costs that are reasonably possible to be incurred by the Company in connection with asbestos litigation would have a material adverse effect on the Company's financial condition, results of operations or cash flows.
The Company is subject to various other claims and legal proceedings covering a wide range of matters that arose in the ordinary course of business. In the opinion of management, all such matters are adequately covered by insurance or by established reserves, and, if not so covered, are without merit or are of such kind, or involve such amounts, as would not have a material adverse effect on the financial position, results of operations or cash flows of the Company.
Insurance liabilities are recorded when it is probable that a liability has been incurred for a particular event and the amount of loss associated with the event can be reasonably estimated. Insurance reserves have been estimated based primarily upon actuarial calculations and reflect the undiscounted estimated liabilities for ultimate losses, including claims incurred but not reported. Inherent in these estimates are assumptions that are based on the Company's history of claims and losses, a detailed analysis of existing claims with respect to potential value, and current legal and legislative trends. If actual claims differ from those projected by management, changes (either increases or decreases) to insurance reserves may be required and would be recorded through income in the period the change was determined. When a recognized liability has been determined to be covered by third-party insurance, the Company records an insurance claim receivable to reflect the covered liability. Insurance claim receivables are included in Other receivables on the Company's Consolidated Balance Sheets. See Note 1, Summary of Significant Accounting Policies for additional information on Accrued insurance and loss reserves.
13. Capital Stock
The authorized capital stock of the Company consists of 150,000,000 shares of common stock and 4,000,000 shares of preferred stock, both having a par value of $1.25 per share. The preferred stock is issuable in series with terms as fixed by the Board. No preferred stock has been issued. The following table summarizes the Company's common stock activity during the period from January 1, 2020 to December 31, 2022:
| | | | | | | | | | | | | | | | | | | | |
| | |
| | | Shares
Issued | | Treasury
Shares (a) | | Outstanding
Shares |
| Outstanding, January 1, 2020 | | 114,720,347 | | | 36,205,589 | | | 78,514,758 | |
| | | | | | |
| Shares issued for vested restricted stock units | | 229,413 | | | 91,188 | | | 138,225 | |
| Shares issued for vested performance stock units | | 471,412 | | | 206,261 | | | 265,151 | |
| Stock appreciation rights exercised | | 8,870 | | | 2,634 | | | 6,236 | |
| | | | | | |
| | | | | | |
| Outstanding, December 31, 2020 | | 115,430,042 | | | 36,505,672 | | | 78,924,370 | |
| | | | | | |
| Shares issued for vested restricted stock units | | 305,535 | | | 112,275 | | | 193,260 | |
| Shares issued for vested performance stock units | | 124,077 | | | 54,950 | | | 69,127 | |
| Stock appreciation rights exercised | | 46,739 | | | 17,950 | | | 28,789 | |
| | | | | | |
| | | | | | |
| Outstanding, December 31, 2021 | | 115,906,393 | | | 36,690,847 | | | 79,215,546 | |
| | | | | | |
| Shares issued for vested restricted stock units | | 341,051 | | | 131,089 | | | 209,962 | |
| | | | | | |
| Shares issued for vested restricted stock awards | | 87,765 | | | 40,304 | | | 47,461 | |
| Stock appreciation rights exercised | | 23,311 | | | 6,640 | | | 16,671 | |
| | | | | | |
| Outstanding, December 31, 2022 | | 116,358,520 | | | 36,868,880 | | | 79,489,640 | |
The following is a reconciliation of the average shares of common stock used to compute basic earnings per common share to the shares used to compute diluted earnings per common share as shown on the Consolidated Statements of Operations:
| | | | | | | | | | | | | | | | | | | | |
| (In thousands, except per share data) | | 2022 | | 2021 | | 2020 |
| Income (loss) from continuing operations attributable to Harsco Corporation common stockholders | | $ | (137,155) | | | $ | 22,137 | | | $ | (49,727) | |
| | | | | | |
| Weighted-average shares outstanding—basic | | 79,493 | | | 79,234 | | | 78,939 | |
| Dilutive effect of stock-based compensation | | — | | | 1,055 | | | — | |
| Weighted-average shares outstanding—diluted | | 79,493 | | | 80,289 | | | 78,939 | |
| Income (loss) from continuing operations per common share, attributable to Harsco Corporation common stockholders: |
| Basic | | $ | (1.73) | | | $ | 0.28 | | | $ | (0.63) | |
| | | | | | |
| Diluted | | $ | (1.73) | | | $ | 0.28 | | | $ | (0.63) | |
The following average outstanding stock-based compensation units were not included in the computation of diluted earnings per share because the effect was antidilutive or the market conditions for the performance share units were not met:
| | | | | | | | | | | | | | | | | | | | |
| (In thousands) | | 2022 | | 2021 | | 2020 |
| Restricted stock units | | 672 | | | — | | | 714 | |
| | | | | | |
| Stock appreciation rights | | 2,092 | | | 826 | | | 2,474 | |
| Performance share units | | 1,040 | | | 865 | | | 887 | |
| | | | | | |
14. Stock-Based Compensation
The 2013 Equity and Incentive Plan as amended (the "2013 Plan") authorizes the issuance of up to 9.9 million shares of the Company's common stock for use in paying incentive compensation awards in the form of stock options or other equity awards such as restricted stock, restricted stock units ("RSUs"), stock appreciation rights ("SARs") or performance share units ("PSUs"). Of the 9.9 million shares authorized, a maximum of 6.5 million shares may be issued for awards other than option rights or SARs, as defined in the 2013 Plan. The 2016 Non-Employee Directors' Long-Term Equity Compensation Plan, as amended (the "2016 Plan") authorizes the issuance of up to 800 thousand shares of the Company's common stock for equity awards. Both plans have been approved by the Company's stockholders. At December 31, 2022, there were 2.2 million shares available for granting equity awards under the 2013 Plan, of which 1.5 million shares were available for awards other than option rights or SARs. At December 31, 2022, there were 302 thousand shares available for granting equity awards under the 2016 Plan.
Restricted Stock Units
The Board approves the granting of performance-based RSUs as the long-term equity component of director, officer and certain key employee compensation. The RSUs require no payment from the recipient and compensation cost is measured based on the market price of the Company's common stock on the grant date and is generally recorded over the vesting period. RSUs granted to officers and certain key employees in 2020, 2021 and 2022 either vest on a pro-rata basis over three years or upon obtainment of specified retirement or years of service criteria. The vesting period for RSUs granted to non-employee directors is one year and each RSU is exchanged for an equal number of shares of the Company's common stock upon vesting for awards issued under the 2016 Plan and following the termination of the participant's service as a director under prior plans. RSUs do not have an option for cash payment.
The following table summarizes RSUs issued and the compensation expense from continuing operations recorded for the years ended December 31, 2022, 2021, and 2020: | | | | | | | | | | | | | | | | | | | | | | | | | | | | | | | | |
| | | RSUs (a) | | Weighted Average Fair Value | | Expense |
| (Dollars in thousands, except per unit) | | | | 2022 | | 2021 | | 2020 |
| Directors: | | | | | | | | | | |
| | | | | | | | | | |
| | | | | | | | | | |
| | | | | | | | | | |
| | | | | | | | | | |
| | | | | | | | | | |
| | | | | | | | | | |
| | | | | | | | | | |
| | | | | | | | | | |
| | | | | | | | | | |
| 2019 | | 14,211 | | | 25.33 | | | $ | — | | | $ | — | | | $ | 120 | |
| 2020 | | 34,986 | | | 10.29 | | | — | | | 120 | | | 240 | |
| 2021 | | 23,224 | | | 21.53 | | | 167 | | | 333 | | | — | |
| 2022 | | 63,696 | | | 7.85 | | | 333 | | | — | | | — | |
| Employees: | | | | | | | | | | |
| | | | | | | | | | |
| | | | | | | | | | |
| | | | | | | | | | |
| | | | | | | | | | |
| | | | | | | | | | |
| | | | | | | | | | |
| | | | | | | | | | |
| | | | | | | | | | |
| | | | | | | | | | |
| 2017 | | 286,251 | | | 13.70 | | | — | | | — | | | 85 | |
| 2018 | | 242,791 | | | 19.93 | | | — | | | 142 | | | 706 | |
| 2019 | | 270,864 | | | 22.25 | | | 314 | | | 1,239 | | | 1,270 | |
| 2020 | | 522,087 | | | 8.22 | | 741 | | | 1,093 | | | 1,244 | |
| 2021 | | 343,125 | | | 18.62 | | 1,294 | | | 1,892 | | | — | |
| 2022 | | 450,915 | | | 12.36 | | 1,486 | | | — | | | — | |
| Total | | | | | | $ | 4,335 | | | $ | 4,819 | | | $ | 3,665 | |
(a) Represents number of awards originally issued.
RSU activity for the year ended December 31, 2022 was as follows:
| | | | | | | | | | | | | | |
| | |
| | Number of Shares | | Weighted Average
Grant-Date
Fair Value |
| | | | |
| | | | |
| | | | |
| | | | |
| | | | |
| | | | |
| | | | |
| | | | |
| Non-vested at December 31, 2021 | | 712,844 | | | $ | 14.68 | |
| Granted | | 514,611 | | | 11.80 |
| Vested | | (342,907) | | | 14.87 |
| Forfeited | | (212,964) | | | 14.28 |
| Non-vested at December 31, 2022 | | 671,584 | | | $ | 12.51 | |
At December 31, 2022, the total unrecognized compensation expense related to non-vested RSUs was $4.5 million, which will be recognized over a weighted-average period of 1.8 years.
The total fair value of RSU's vested in 2022, 2021 and 2020 was $5.1 million, $4.1 million and $4.3 million, respectively.
Stock Appreciation Rights
The Board approves the granting of SARs to officers and certain key employees under the 2013 Plan. The SARs generally vest on a pro-rata three-year basis from the grant date or upon specified retirement or years of service criteria and expire no later than ten years after the grant date. The exercise price of the SARs is equal to the fair value of Harsco common stock on the grant date. Upon exercise, shares of the Company's common stock are issued based on the increase in the fair value of the Company's common stock over the exercise price of the SAR. SARs do not have an option for cash payment.
During 2020, the Company issued SARS covering 785,152 shares in March and 20,526 in October.
During 2021, the Company issued SARS covering 184,641 shares in March.
During 2022, the Company issued SARS covering 312,987 shares in March, and 10,000 each in September, October and December.
The fair value of each SAR grant was estimated on the grant date using a Black-Scholes pricing model with the following assumptions:
| | | | | | | | | | | | | | | | | | | | | | | | | | | | | | | | | | | | | | | | | | |
| | | | | | |
| | Risk-free Interest Rate | | Dividend Yield | | Expected Life (Years) | | Volatility | | SAR Grant Price | | Fair Value of SAR | | | | |
| | | | | | | | | | | | | | | | |
| | | | | | | | | | | | | | | | |
| | | | | | | | | | | | | | | | |
| | | | | | | | | | | | | | | | |
| | | | | | | | | | | | | | | | |
| | | | | | | | | | | | | | | | |
| | | | | | | | | | | | | | | | |
| | | | | | | | | | | | | | | | |
| | | | | | | | | | | | | | | | |
| | | | | | | | | | | | | | | | |
| | | | | | | | | | | | | | | | |
| | | | | | | | | | | | | | | | |
| | | | | | | | | | | | | | | | |
| | | | | | | | | | | | | | | | |
| | | | | | | | | | | | | | | | |
| | | | | | | | | | | | | | | | |
| | | | | | | | | | | | | | | | |
| | | | | | | | | | | | | | | | |
| | | | | | | | | | | | | | | | |
| | | | | | | | | | | | | | | | |
| | | | | | | | | | | | | | | | |
| March 2020 Grant | | 0.76 | % | | — | % | | 6.0 | | 45.2 | % | | $ | 10.29 | | | $ | 3.03 | | | | | |
| October 2020 Grant | | 0.44 | % | | — | % | | 6.0 | | 60.3 | % | | 14.89 | | | 8.12 | | | | | |
| March 2021 Grant | | 0.91 | % | | — | % | | 6.0 | | 61.9 | % | | 18.58 | | | 10.48 | | | | | |
| March 2022 Grant | | 1.67 | % | | — | % | | 6.0 | | 60.3 | % | | 12.65 | | | 7.20 | | | | | |
| September 2022 Grant | | 3.56 | % | | — | % | | 6.0 | | 60.6 | % | | 5.02 | | | 2.97 | | | | | |
| October 2022 Grant | | 4.10 | % | | — | % | | 6.0 | | 61.3 | % | | 5.26 | | | 3.17 | | | | | |
| December 2022 Grant | | 3.75 | % | | — | % | | 6.0 | | 62.4 | % | | 6.15 | | | 3.72 | | | | | |
The March 2020 Grant's fair value was estimated using a Monte Carlo simulation because the exercise price is greater than the fair value of Harsco common stock on the grant date.
SARs activity for the year ended December 31, 2022 was as follows:
| | | | | | | | | | | | | | | | | | | | | | |
| | |
| | Number of Shares | | Weighted Average Exercise Price | | Aggregate Intrinsic Value (in millions) (b) | | |
| | | | | | | | |
| | | | | | | | |
| | | | | | | | |
| | | | | | | | |
| | | | | | | | |
| | | | | | | | |
| | | | | | | | |
| | | | | | | | |
| | | | | | | | |
| | | | | | | | |
| | | | | | | | |
| | | | | | | | |
| Outstanding, December 31, 2021 | | 2,394,055 | | | $ | 14.75 | | | $ | 8.6 | | | |
| Granted | | 342,987 | | | 12.02 | | | | | |
| Exercised | | (118,618) | | | 7.97 | | | | | |
| Forfeited/Expired | | (526,562) | | | 14.78 | | | | | |
| Outstanding, December 31, 2022 | | 2,091,862 | | | $ | 14.68 | | | 0.0 | | |
(b) Intrinsic value is defined as the difference between the current market value and the exercise price, for those SARs where the market price exceeds the exercise price.
The total intrinsic value of SARs exercised in 2022, 2021 and 2020 was $0.0 million, $0.6 million, and $0.5 million, respectively.
The following table summarizes information concerning outstanding and exercisable SARs at December 31, 2022:
| | | | | | | | | | | | | | | | | | | | | | | | | | | | | | | | | | | | | | |
| | SARs Outstanding | | SARs Exercisable |
| Range of Exercisable Prices | | Vested | | Non-vested | | Weighted-Average Exercise Price per Share | | Weighted-Average Remaining Contractual Life in Years | | Number Exercisable | | Weighted-Average Exercise Price per Share |
$5.02 - $13.70 | | 777,700 | | | 383,485 | | | $ | 10.15 | | | 6.18 | | 777,700 | | | $ | 9.67 | |
$16.53 - $22.70 | | 650,634 | | | 86,986 | | | 19.16 | | | 4.23 | | 650,634 | | | 19.24 | |
$23.25 - $26.92 | | 193,057 | | | — | | | 24.79 | | | 1.62 | | 193,057 | | | 24.79 | |
| | 1,621,391 | | | 470,471 | | | $ | 14.68 | | | 5.07 | | 1,621,391 | | | $ | 15.31 | |
Total compensation expense from continuing operations related to SARs was $1.5 million, $1.8 million and $1.7 million for the years ended December 31, 2022, 2021 and 2020, respectively. At December 31, 2022, total unrecognized compensation expense related to non-vested SARs was $1.7 million, which will be recognized over a weighted average period of 1.8 years.
Weighted-average grant date fair value of non-vested SARs for the year ended December 31, 2022 was as follows:
| | | | | | | | | | | | | | |
| | Number of Shares | | Weighted-Average Grant Date Fair Value |
| | | | |
| | | | |
| | | | |
| | | | |
| | | | |
| | | | |
| | | | |
| | | | |
| | | | |
| | | | |
| | | | |
| | | | |
| | | | |
| | | | |
| Non-vested shares, December 31, 2021 | | 664,880 | | | $ | 5.63 | |
| Granted | | 342,987 | | | 6.86 | |
| Vested | | (322,368) | | | 5.54 | |
| Forfeited | | (215,028) | | | 6.57 | |
| Non-vested shares, December 31, 2022 | | 470,471 | | | $ | 6.16 | |
Performance Share Units
The Board approves the granting of PSUs to officers and certain key employees that may be earned based on the Company's total shareholder return over the three-year performance period. PSUs are paid out at the end of each performance period based on the Company’s performance, which is measured by determining the percentile rank of the total shareholder return of the Company's common stock in relation to the total shareholder return of a specific peer group of companies. The peer group of companies utilized is the S&P Smallcap 600 Industrials Index. The payment of PSUs following the performance period will be based in accordance with the scale set forth in the PSU agreements, and may range from 0% to 200% of the initial grant. PSUs do not have an option for cash payment.
During the year ended December 31, 2020, the Company granted 513,995 shares in March and 11,194 shares in October under the 2013 Plan. During the year ended December 31, 2021, the Company granted 316,959 shares in March under the 2013 Plan. During the year ended December 31, 2022, the Company granted 500,624 shares in March under the 2013 Plan. The fair value of PSUs granted was estimated on the grant date using a Monte Carlo pricing model with the following assumptions:
| | | | | | | | | | | | | | | | | | | | | | | | | | | | | | | | |
| | |
| | Risk-free Interest rate | | Dividend Yield | | Expected Life (Years) | | Volatility | | Fair Value of PSU |
| | | | | | | | | | |
| | | | | | | | | | |
| | | | | | | | | | |
| | | | | | | | | | |
| | | | | | | | | | |
| | | | | | | | | | |
| | | | | | | | | | |
| | | | | | | | | | |
| March 2020 Grant | | 0.56 | % | | — | % | | 2.81 | | 36.0 | % | | $ | 4.40 | |
| October 2020 Grant | | 0.17 | % | | — | % | | 2.20 | | 53.7 | % | | 17.01 | |
| March 2021 Grant | | 0.25 | % | | — | % | | 2.83 | | 50.7 | % | | 25.38 | |
| March 2022 Grant | | 1.59 | % | | — | % | | 2.83 | | 50.4 | % | | 16.54 | |
Total compensation expense from continuing operations related to PSUs was $4.2 million, $5.1 million and $3.2 million for the years ended December 31, 2022, 2021 and 2020, respectively. At December 31, 2022, total unrecognized compensation expense related to non-vested PSUs was $6.4 million, which will be recognized over a weighted average period of 1.7 years.
A summary of the Company's non-vested PSU activity during the year ending December 31, 2022 was as follows:
| | | | | | | | | | | | | | |
| | |
| | Number of Shares | | Weighted-Average Grant Date Fair Value |
| | | | |
| | | | |
| | | | |
| | | | |
| | | | |
| | | | |
| | | | |
| | | | |
| | | | |
| | | | |
| | | | |
| | | | |
| | | | |
| | | | |
| | | | |
| | | | |
| | | | |
| | | | |
| | | | |
| | | | |
| | | | |
| | | | |
| Non-vested shares, December 31, 2021 | | 753,793 | | | $ | 13.05 | |
| Granted | | 500,624 | | | 16.54 | |
| | | | |
| | | | |
| Forfeited | | (213,999) | | | 14.51 | |
Vested, not issued (c) | | (378,466) | | | 4.80 | |
| Non-vested shares, December 31, 2022 | | 661,952 | | | $ | 19.94 | |
(c) The measurement period for PSUs issued in 2020 ended on December 31, 2022 and these shares vested but will not be issued until the Board certifies the measurement period results in early 2023. A total of 0 shares are expected to be issued.
Other Stock Grants
In connection with the Company's appointment of its interim Senior Vice President and Chief Financial Officer ("ICFO") in August 2022, a monthly common stock grant equal to $0.1 million determined at the closing price of the Company's common stock on the last trading day of each month is issued as part of the ICFO's compensation. During the year ended December 31, 2022, the Company issued 87,765 shares at a weighted average price of $5.40 per share and total compensation expense of $0.5 million.
15. Financial Instruments
Off-Balance Sheet Risk
As collateral for the Company's performance and to insurers, the Company is contingently liable under standby letters of credit, bonds, bank guarantees and performance guarantees in the amounts of $500.4 million, $519.4 million and $410.6 million at December 31, 2022, 2021 and 2020, respectively. The expiration periods of the standby letters of credit, bonds and bank guarantees range from less than 1 year to over 5 years, but the majority are generally in force for approximately 2 years. Certain issues have no scheduled expiration date. The Company pays fees to various banks and insurance companies that typically range from approximately 0.2% to 3.0% per annum of the instrument's face value. If the Company were required to obtain replacement standby letters of credit, bonds and bank guarantees at December 31, 2022 for those currently outstanding, it is the Company's opinion that the replacement costs would be within the present fee structure.
The Company has currency exposures in approximately 30 countries. The Company's primary foreign currency exposures during 2022 were in the European Union, the U.K., Brazil and China.
Off-Balance Sheet Risk—Third-Party Guarantees
Any liabilities related to the Company's obligation to stand ready to act on third-party guarantees are included in Other current liabilities or Other liabilities (as appropriate) on the Company's Consolidated Balance Sheets. Any recognition of these liabilities did not have a material impact on the Company's financial position or results of operations for 2022, 2021 or 2020.
In the normal course of business, legal indemnifications are provided related primarily to the performance of the Company's products and services and patent and trademark infringement of the products and services sold. These indemnifications generally relate to the performance (regarding function, not price) of the respective products or services and, therefore, no liability is recognized related to the fair value of such guarantees.
Derivative Instruments and Hedging Activities
The Company uses derivative instruments, including foreign currency exchange forward contracts and interest rate swaps and CCIRs, to manage certain foreign currency and interest rate exposures. Derivative instruments are viewed as risk management tools by the Company and are not used for trading or speculative purposes. All derivative instruments are recorded on the Company's Consolidated Balance Sheets at fair value. The accounting for changes in the fair value of derivatives depends on the intended use of the derivative, whether the Company has elected to designate a derivative in a hedging relationship and apply hedge accounting and whether the hedging relationship has satisfied the criteria necessary to apply hedge accounting. Derivatives designated and qualifying as a hedge of the exposure to variability in expected future cash flows, or other types of forecasted transactions, are considered cash flow hedges. Hedge accounting generally provides for the matching of the timing of gain or loss recognition on the hedging instrument with the recognition of the earnings effect of the hedged forecasted transactions in a cash flow hedge. The Company may enter into derivative contracts that are intended to economically hedge certain of its risks, even though hedge accounting does not apply, or the Company elects not to apply hedge accounting.
The Company primarily applies the market approach for recurring fair value measurements and endeavors to utilize the best available information. Accordingly, the Company utilizes valuation techniques that maximize the use of observable inputs, such as forward rates, interest rates, the Company’s credit risk and counterparties’ credit risks, and which minimize the use of unobservable inputs. The Company is able to classify fair value balances based on the ability to observe those inputs. Foreign currency exchange forward contracts, interest rate swaps and CCIRs are based upon pricing models using market-based inputs (Level 2). Model inputs can be verified and valuation techniques do not involve significant management judgment.
Fair value is the price that would be received to sell an asset or paid to transfer a liability in an orderly transaction between market participants at the measurement date (an exit price). The Company utilizes market data or assumptions that the Company believes market participants would use in valuing the asset or liability, including assumptions about risk and the risks inherent in the inputs to the valuation technique.
The fair value hierarchy distinguishes between (1) market participant assumptions developed based on market data obtained from independent sources (observable inputs), and (2) an entity’s own assumptions about market participant assumptions based on the best information available in the circumstances (unobservable inputs). The fair value hierarchy consists of three broad levels, which give the highest priority to unadjusted quoted prices in active markets for identical assets or liabilities (Level 1) and the lowest priority to unobservable inputs (Level 3).
The three levels of the fair value hierarchy are described below:
•Level 1—Unadjusted quoted prices in active markets that are accessible at the measurement date for identical, unrestricted assets or liabilities.
•Level 2—Inputs, other than quoted prices included within Level 1, that are observable for the asset or liability, either directly or indirectly, including quoted prices for similar assets or liabilities in active markets; quoted prices for identical or similar assets or liabilities in markets that are not active; inputs other than quoted prices that are observable for the asset or liability (e.g., interest rates); and inputs that are derived principally from or corroborated by observable market data by correlation or other means.
•Level 3—Inputs that are both significant to the fair value measurement and unobservable.
In instances in which multiple levels of inputs are used to measure fair value, hierarchy classification is based on the lowest level input that is significant to the fair value measurement in its entirety. The Company’s assessment of the significance of a particular input to the fair value measurement in its entirety requires judgment and considers factors specific to the asset or liability.
The fair value of outstanding derivative contracts recorded as assets and liabilities on the Company's Consolidated Balance Sheets was as follows:
| | | | | | | | | | | | | | | | | | | | | | | | | | |
| (In thousands) | | Balance Sheet Location | | Fair Value of Derivatives Designated as Hedging Instruments | | Fair Value of Derivatives Not Designated as Hedging Instruments | | Total Fair Value |
| December 31, 2022 | | | | | | | | |
| Asset derivatives (Level 2): | | | | | | | | |
| Foreign currency exchange forward contracts | | Other current assets | | $ | 1,042 | | | $ | 2,154 | | | $ | 3,196 | |
| | | | | | | | |
| | | | | | | | |
| Total | | | | $ | 1,042 | | | $ | 2,154 | | | $ | 3,196 | |
| Liability derivatives (Level 2): |
| Foreign currency exchange forward contracts | | Other current liabilities | | $ | 577 | | | $ | 4,796 | | | $ | 5,373 | |
| | | | | | | | |
| | | | | | | | |
| Total | | | | $ | 577 | | | $ | 4,796 | | | $ | 5,373 | |
| December 31, 2021 | | | | | | | | |
| Asset derivatives (Level 2): | | | | | | | | |
| Foreign currency exchange forward contracts | | Other current assets | | $ | 719 | | | $ | 1,405 | | | $ | 2,124 | |
| | | | | | | | |
| | | | | | | | |
| | | | | | | | |
| | | | | | | | |
| Total | | | | $ | 719 | | | $ | 1,405 | | | $ | 2,124 | |
| Liability derivatives (Level 2): |
| Foreign currency exchange forward contracts | | Other current liabilities | | $ | 560 | | | $ | 2,905 | | | $ | 3,465 | |
| Interest rate swaps | | Other current liabilities | | 4,157 | | | — | | | 4,157 | |
| | | | | | | | |
| Total | | | | $ | 4,717 | | | $ | 2,905 | | | $ | 7,622 | |
All of the Company's derivatives are recorded on the Consolidated Balance Sheets at gross amounts and not offset. All of the Company's interest rate swaps and certain foreign currency exchange forward contracts are transacted under ISDA documentation. Each ISDA master agreement permits the net settlement of amounts owed in the event of default. The Company's derivative assets and liabilities subject to enforceable master netting arrangements, if offset, would have resulted in a $0.1 million and $0.9 million net liability at December 31, 2022 and 2021, respectively.
The effect of derivative instruments on the Company's Consolidated Statements of Operations and the Consolidated Statements of Comprehensive Income (Loss) was as follows:
Derivatives Designated as Hedging Instruments
| | | | | | | | | | | | | | | | | | | | | | | | | | | | | | | | | | | | | | |
| | Amount Recognized in
OCI on Derivatives | | Amount Reclassified from
AOCI into Income - Effective Portion or Equity |
| (In thousands) | | 2022 | | 2021 | | 2020 | | 2022 | | 2021 | | 2020 |
| | | | | | | | | | | | |
| Foreign currency exchange forward contracts | | $ | 1,966 | | | $ | 309 | | | $ | (930) | | | $ | (1,746) | | | $ | (129) | | | $ | (1,026) | |
| | | | | | | | | | | | |
| Interest rate swaps | | — | | | (42) | | | (3,889) | | | 4,245 | | | 3,474 | | | 2,589 | |
CCIRs(a) | | — | | | — | | | 39 | | | — | | | — | | | 1,015 | |
| | | $ | 1,966 | | | $ | 267 | | | $ | (4,780) | | | $ | 2,499 | | | $ | 3,345 | | | $ | 2,578 | |
(a)Amounts represent changes in foreign currency translation related to balances in AOCI.
The location and amount of gain (loss) recognized on the Consolidated Statements of Operations:
| | | | | | | | | | | | | | | | | | |
| | | | | | 2022 |
| (in thousands) | | | | | | Interest Expense | | Income (Loss) from Discontinued Businesses |
| Total amounts in the Consolidated Statements of Operations in which the effects of cash flow hedges are recorded | | | | | | $ | (75,156) | | | $ | (50,301) | |
| Interest rate swaps: | | | | | | | | |
| Gain or (loss) reclassified from AOCI into income | | | | | | (4,245) | | | — | |
| Amount recognized in earnings due to ineffectiveness | | | | | | 1,862 | | | — | |
| Foreign exchange contracts: | | | | | | |
| Gain or (loss) reclassified from AOCI into income | | | | | | — | | | 1,746 | |
| | | | | | | | |
| | | | | | | | |
| | | | | | |
| | | | | | | | |
| | | | | | | | |
| | | | | | | | | | | | | | | | | | |
| | | | | | 2021 |
| (in thousands) | | | | | | Interest Expense | | Income (Loss) From Discontinued Businesses |
| Total amounts in the Consolidated Statements of Operations in which the effects of cash flow hedges are recorded | | | | | | $ | (63,235) | | | $ | (25,863) | |
| Interest rate swaps: | | | | | | | | |
| Gain or (loss) reclassified from AOCI into income | | | | | | (3,474) | | | — | |
| Amount recognized in earnings due to ineffectiveness | | | | | | 89 | | | — | |
| Foreign exchange contracts: | | | | | | | |
| Gain or (loss) reclassified from AOCI into income | | | | | | — | | | 129 | |
| | | | | | | | |
| | | | | | | | |
| | | | | | | |
| | | | | | | | |
| | | | | | | | | | | | | | | | | | | | |
| | | | | 2020 |
| (in thousands) | | | | | | Interest Expense | | Income (Loss) From Discontinued Businesses |
| Total amounts in the Consolidated Statements of Operations in which the effects of cash flow hedges are recorded | | | | | | $ | (58,196) | | | $ | 20,350 | |
| Interest rate swaps: | | | | | | | | |
| Gain or (loss) reclassified from AOCI into income | | | | | | (2,589) | | | — | |
| | | | | | | | |
| Foreign exchange contracts: | | | | | | | | |
| Gain or (loss) reclassified from AOCI into income | | | | | | — | | | 1,026 | |
| | | | | | | | |
| | | | | | | | |
| CCIRs: | | | | | | | | |
| Gain or (loss) reclassified from AOCI into income | | | | | | (1,015) | | | — | |
| | | | | | | | |
Derivatives Not Designated as Hedging Instruments
| | | | | | | | | | | | | | | | | | | | | | | | | | |
| | Location of Gain (Loss) Recognized in Income on Derivatives | | Amount of Gain (Loss) Recognized in Income on Derivatives for the Twelve Months Ended December 31(a) |
| (In thousands) | | | 2022 | | 2021 | | 2020 |
| Foreign currency exchange forward contracts | | Cost of sales | | $ | 19,808 | | | $ | 10,761 | | | $ | (9,052) | |
(a) These gains (losses) offset amounts recognized in cost of sales sold principally as a result of intercompany or third-party foreign currency exposures.
Foreign Currency Exchange Forward Contracts
The Company conducts business in multiple currencies and, accordingly, is subject to the inherent risks associated with foreign exchange rate movements. Foreign currency-denominated assets and liabilities are translated into U.S. dollars at the exchange rates existing at the respective balance sheet dates, and income and expense items are translated at the average exchange rates during the respective periods.
The Company uses derivative instruments to hedge cash flows related to foreign currency fluctuations. The outstanding foreign currency exchange forward contracts are part of a worldwide program to minimize foreign currency exchange operating income and balance sheet exposure by offsetting foreign currency exposures of certain future payments between the Company and various subsidiaries, suppliers or customers. The unsecured contracts are with major financial institutions. The Company may be exposed to credit loss in the event of non-performance by the contract counterparties. The Company evaluates the creditworthiness of the counterparties and does not expect default by them. Foreign currency exchange forward contracts are used to hedge commitments, such as foreign currency debt, firm purchase commitments and foreign currency cash flows for certain export sales transactions.
Changes in the fair value of derivatives used to hedge foreign currency denominated balance sheet items are reported directly in earnings, along with offsetting transaction gains and losses on the items being hedged. Derivatives used to hedge forecasted cash flows associated with foreign currency commitments may be accounted for as cash flow hedges, as deemed appropriate, if the criteria for hedge accounting are met. Gains and losses on derivatives designated as cash flow hedges are deferred in AOCI, a separate component of equity, and reclassified to earnings in a manner that matches the timing of the earnings impact of the hedged transactions. The ineffective portion of all hedges, if any, is recognized currently in earnings.
The recognized gains and losses offset amounts recognized in cost of sales sold principally as a result of intercompany or third-party foreign currency exposures. At December 31, 2022 and December 31, 2021, the notional amounts of foreign currency exchange forward contracts were $573.8 million and $425.8 million, respectively. These contracts primarily hedge British pounds sterling and Euros against other currencies and mature through December 2023.
In addition to foreign currency exchange forward contracts, the Company designates certain loans as hedges of net investments in international subsidiaries. The Company recorded pre-tax net loss of $2.6 million during 2022 related to hedges of net investments, and pre-tax net gains of $2.7 million and $0.4 million during 2021 and 2020, respectively, in AOCI.
Interest Rate Swaps
The Company uses interest rate swaps in conjunction with certain variable rate debt issuances in order to secure a fixed interest rate. Changes in the fair value attributed to the effect of the swaps’ interest spread and changes in the credit worthiness of the counter-parties are recorded in AOCI.
The Company had a series of interest rate swaps that were in effect through 2022 and matured in December 2022. These swaps had the effect of converting $200.0 million of the New Term Loan from a floating interest rate to a fixed interest rate. The fixed rates provided by the swaps replaced the adjusted LIBOR rate in the interest calculation, ranging from 2.71% for 2021 to 3.12% for 2022. In the fourth quarter of 2021, the interest rate swaps were deemed ineffective and, thus, the subsequent changes in fair value were recorded in earnings in the current period. The amounts previously recorded in AOCI were amortized into earnings over the remaining maturity of the interest rate swap.
In January 2023, the Company entered into a new series of interest rate swaps with a scheduled maturity date of December 2025. The swaps have the effect of converting $300.0 million of the New Term Loan from a floating interest rate to a fixed interest rate. The fixed rates provided by the swaps replace the adjusted SOFR rate in the interest calculation, ranging from 4.16% to 4.21%.
Fair Value of Other Financial Instruments
The carrying amounts of cash and cash equivalents, accounts receivable, accounts payable, accrued liabilities and short-term borrowings approximate fair value due to the short-term maturities of these assets and liabilities. At December 31, 2022 and 2021, the total fair value of long-term debt, including current maturities, was $1,227.6 million and $1,394.2 million, respectively, compared with a carrying value of $1,364.2 million and $1,387.9 million, respectively. Fair values for debt are based upon pricing models using market-based inputs (Level 2) for similar issues or on the current rates offered to the Company for debt of the same remaining maturities.
Concentrations of Credit Risk
Financial instruments that potentially subject the Company to concentrations of credit risk consist principally of cash and cash equivalents and accounts receivable. The Company places cash and cash equivalents with high-quality financial institutions and, by policy, limits the amount of credit exposure to any single institution.
Concentrations of credit risk with respect to accounts receivable exist in HE, which have several large customers throughout the world with significant accounts receivable balances. Consolidation in the global steel could result in an increase in concentration of credit risk for the Company. CE also has significant sales to several U.S. customers.
The Company generally does not require collateral or other security to support customer receivables. If a receivable from one or more of the Company's larger customers becomes uncollectible, it could have a material effect on the Company's results of operations or cash flows.
16. Information by Segment and Geographic Area
The Company reports information about operating segments using the "management approach," which is based on the way management organizes and reports the segments within the enterprise for making operating decisions and assessing performance. The Company's reportable segments are identified based upon differences in products, services and markets served. In 2022, the Company had two reportable segments. These segments and the types of products and services offered include the following:
Harsco Environmental
The Segment provides environmental services and material processing to the global steel and metals industries. The Segment partners with its global customer base to deliver production-critical on-site operational support and resource recovery services, through management of its customers’ primary waste or byproduct streams. The Segment's services support the metal manufacturing process, generating significant operational and financial efficiencies for its customers and allowing them to focus on their core steelmaking businesses. In addition, this Segment creates value-added downstream products from industrial waste streams.
Harsco Clean Earth
The Segment is one of the largest specialty waste processing companies in the U.S., providing processing and beneficial reuse solutions for hazardous wastes, and soil and dredged materials.
Other Information
The measurement basis of segment profit or loss is operating income. There are no significant inter-segment sales. Corporate assets, at December 31, 2022 and 2021, include principally cash, prepaid taxes, fair value of derivative instruments and U.S. deferred income taxes. Countries with revenues from unaffiliated customers or net property, plant and equipment of ten percent or more of the consolidated totals (in at least one period presented) are as follows:
Information by Geographic Area (a)
| | | | | | | | | | | | | | | | | | | | |
| | | Revenues from Unaffiliated Customers |
| | | Years ended December 31 |
| (In thousands) | | 2022 | | 2021 | | 2020 |
| U.S. | | $ | 1,075,355 | | | $ | 1,008,689 | | | $ | 830,699 | |
| | | | | | |
| | | | | | |
| All Other | | 813,710 | | | 839,710 | | | 703,334 | |
| Totals including Corporate | | $ | 1,889,065 | | | $ | 1,848,399 | | | $ | 1,534,033 | |
(a) Revenues are attributed to individual countries based on the location of the facility generating the revenue.
| | | | | | | | | | | | | | |
| | | Property, Plant and Equipment, Net |
| | | December 31 |
| (In thousands) | | 2022 | | 2021 |
| U.S. | | $ | 283,864 | | | $ | 267,174 | |
| China | | 96,095 | | | 108,496 | |
| | | | |
| | | | |
| All Other | | 276,916 | | | 278,243 | |
| Totals including Corporate | | $ | 656,875 | | | $ | 653,913 | |
No customer provided in excess of 10% of the Company's consolidated revenues in 2022, 2021 and 2020.
In 2022, 2021 and 2020, the Harsco Environmental Segment had one customer that provided in excess of 10% of this Segment's revenues under multiple long-term contracts at several mill sites. Should additional consolidations occur involving some of the steel industry's larger companies which are customers of the Company, it would result in an increase in concentration of credit risk for the Company. The loss of any one of the contracts would not have a material adverse effect upon the Company's financial position or cash flows; however, it could have a significant effect on quarterly or annual results of operations.
In 2022, 2021, and 2020, Harsco Clean Earth had one customer that provided in excess of 10% of the Segment's revenue. The loss of this customer would not have a material adverse impact on the Company's financial positions or cash flows; however, it could have a material effect on quarterly or annual results of operations.
Operating Information by Segment:
| | | | | | | | | | | | | | | | | | | | |
| | |
| | | Years ended December 31 |
| (In thousands) | | 2022 | | 2021 | | 2020 |
| Revenues | | | | | | |
| Harsco Environmental | | $ | 1,061,239 | | | $ | 1,068,083 | | | $ | 914,445 | |
| Harsco Clean Earth | | 827,826 | | | 780,316 | | | 619,588 | |
| | | | | | |
| Total Revenues | | $ | 1,889,065 | | | $ | 1,848,399 | | | $ | 1,534,033 | |
| Operating Income (Loss) | | | | | | |
| Harsco Environmental | | $ | 59,559 | | | $ | 103,402 | | | $ | 59,006 | |
| Harsco Clean Earth | | (81,785) | | | 25,639 | | | 16,096 | |
| Corporate | | (35,117) | | | (40,665) | | | (78,408) | |
| Total Operating Income (Loss) | | $ | (57,343) | | | $ | 88,376 | | | $ | (3,306) | |
| Total Assets | | | | | | |
| Harsco Environmental | | $ | 1,416,717 | | | $ | 1,386,087 | | | $ | 1,322,731 | |
| Harsco Clean Earth | | 980,774 | | | 1,278,472 | | | 1,279,387 | |
| Corporate | | 57,118 | | | 56,086 | | | 74,185 | |
| Discontinued Operations | | 336,245 | | | 333,263 | | | 316,984 | |
| Total Assets | | $ | 2,790,854 | | | $ | 3,053,908 | | | $ | 2,993,287 | |
| Depreciation | | | | | | |
Harsco Environmental | | $ | 108,880 | | | $ | 105,830 | | | $ | 100,971 | |
Harsco Clean Earth | | 18,836 | | | 19,672 | | | 17,450 | |
Corporate | | 1,996 | | | 1,900 | | | 2,022 | |
| Total Depreciation | | $ | 129,712 | | | $ | 127,402 | | | $ | 120,443 | |
| Amortization | | | | | | |
Harsco Environmental | | $ | 6,809 | | | $ | 8,052 | | | $ | 7,825 | |
Harsco Clean Earth | | 24,299 | | | 24,180 | | | 22,814 | |
| Corporate (b) | | 3,029 | | | 2,710 | | | 2,961 | |
| Total Amortization | | $ | 34,137 | | | $ | 34,942 | | | $ | 33,600 | |
| Capital Expenditures | | | | | | |
Harsco Environmental | | $ | 109,508 | | | $ | 137,228 | | | $ | 99,056 | |
Harsco Clean Earth | | 21,996 | | | 18,403 | | | 12,612 | |
Corporate | | 4,038 | | | 1,289 | | | 488 | |
| Total Capital Expenditures | | $ | 135,542 | | | $ | 156,920 | | | $ | 112,156 | |
(b) Amortization expense on Corporate relates to the amortization of deferred financing costs.
Reconciliation of Segment Operating Income to Consolidated Income (Loss) From Continuing Operations Before Income Taxes and Equity Income:
| | | | | | | | | | | | | | | | | | | | |
| | |
| | | Years ended December 31 |
| (In thousands) | | 2022 | | 2021 | | 2020 |
| Segment operating income (loss) | | $ | (22,226) | | | $ | 129,041 | | | $ | 75,102 | |
| General Corporate expense | | (35,117) | | | (40,665) | | | (78,408) | |
| Operating income (loss) from continuing operations | | (57,343) | | | 88,376 | | | (3,306) | |
| Interest income | | 3,559 | | | 2,231 | | | 2,129 | |
| Interest expense | | (75,156) | | | (63,235) | | | (58,196) | |
| Defined benefit pension income (expense) | | 8,938 | | | 15,640 | | | 7,073 | |
| Facility fees and debt-related income (expense) | | (2,956) | | | (5,506) | | | (1,920) | |
| Income (loss) from continuing operations before income taxes and equity income | | $ | (122,958) | | | $ | 37,506 | | | $ | (54,220) | |
17. Revenues
The Company recognizes revenues to depict the transfer of promised services and products to customers in an amount that reflects the consideration the Company expects to receive in exchange for those services or products. Revenues from continuing operations includes service revenues from the HE and CE Segments and product revenues from the HE Segment. Revenue from the Rail business is included in Income (loss) from discontinued businesses. See Note 1, Summary of Significant Accounting Policies, Revenue Recognition, for additional information.
A summary of the Company's revenues by primary geographical markets as well as by key product and service groups is as follows:
| | | | | | | | | | | | | | | | | | | | | | |
| | Year Ended December 31, 2022 |
| (In thousands) | | Harsco
Environmental Segment | | Harsco
Clean Earth Segment | | | | Consolidated Totals |
Primary Geographical Markets (a): | | | | | | | | |
| North America | | $ | 297,544 | | | $ | 827,826 | | | | | $ | 1,125,370 | |
| Western Europe | | 389,713 | | | — | | | | | 389,713 | |
Latin America (b) | | 155,235 | | | — | | | | | 155,235 | |
| Asia-Pacific | | 119,433 | | | — | | | | | 119,433 | |
| Middle East and Africa | | 79,562 | | | — | | | | | 79,562 | |
| Eastern Europe | | 19,752 | | | — | | | | | 19,752 | |
| Total Revenues | | $ | 1,061,239 | | | $ | 827,826 | | | | | $ | 1,889,065 | |
| | | | | | | | |
| Key Product and Service Groups: | | | | | | | | |
| Environmental services related to resource recovery for metals manufacturing; and related logistical services | | $ | 900,426 | | | $ | — | | | | | $ | 900,426 | |
| Ecoproducts | | 145,911 | | | — | | | | | 145,911 | |
| Environmental systems for aluminum dross and scrap processing | | 14,902 | | | — | | | | | 14,902 | |
| Hazardous waste processing solutions | | — | | | 681,804 | | | | | 681,804 | |
| Soil and dredged materials processing and reuse solutions | | — | | | 146,022 | | | | | 146,022 | |
| | | | | | | | |
| Total Revenues | | $ | 1,061,239 | | | $ | 827,826 | | | | | $ | 1,889,065 | |
| | | | | | | | | | | | | | | | | | | | | | |
| | Year Ended December 31, 2021 |
| (In thousands) | | Harsco Environmental Segment | | Harsco
Clean Earth Segment | | | | Consolidated Totals |
Primary Geographical Markets (a): | | | | | | | | |
| North America | | $ | 281,125 | | | $ | 780,316 | | | | | $ | 1,061,441 | |
| Western Europe | | 442,286 | | | — | | | | | 442,286 | |
Latin America (b) | | 132,349 | | | — | | | | | 132,349 | |
| Asia-Pacific | | 110,790 | | | — | | | | | 110,790 | |
| Middle East and Africa | | 81,337 | | | — | | | | | 81,337 | |
| Eastern Europe | | 20,196 | | | — | | | | | 20,196 | |
| Total Revenues | | $ | 1,068,083 | | | $ | 780,316 | | | | | $ | 1,848,399 | |
| Key Product and Service Groups: | | | | | | | | |
| Environmental services related to resource recovery for metals manufacturing; and related logistical services | | $ | 920,580 | | | $ | — | | | | | $ | 920,580 | |
| Ecoproducts | | 132,389 | | | — | | | | | 132,389 | |
| Environmental systems for aluminum dross and scrap processing | | 15,114 | | | — | | | | | 15,114 | |
| Hazardous waste processing solutions | | — | | | 639,233 | | | | | 639,233 | |
| Soil and dredged materials processing and reuse solutions | | — | | | 141,083 | | | | | 141,083 | |
| | | | | | | | |
| Total Revenues | | $ | 1,068,083 | | | $ | 780,316 | | | | | $ | 1,848,399 | |
| | | | | | | | | | | | | | | | | | | | | | |
| | Year Ended December 31, 2020 |
| (In thousands) | | Harsco Environmental Segment | | Harsco
Clean Earth Segment | | | | Consolidated Totals |
Primary Geographical Markets (a): | | | | | | | | |
| North America | | $ | 249,904 | | | $ | 619,588 | | | | | $ | 869,492 | |
| Western Europe | | 377,066 | | | — | | | | | 377,066 | |
Latin America (b) | | 119,457 | | | — | | | | | 119,457 | |
| Asia-Pacific | | 87,608 | | | — | | | | | 87,608 | |
| Middle East and Africa | | 63,427 | | | — | | | | | 63,427 | |
| Eastern Europe | | 16,983 | | | — | | | | | 16,983 | |
| Total Revenues | | $ | 914,445 | | | $ | 619,588 | | | | | $ | 1,534,033 | |
| Key Product and Service Groups: | | | | | | | | |
| Environmental services related to resource recovery for metals manufacturing; and related logistical services | | $ | 781,060 | | | $ | — | | | | | $ | 781,060 | |
| Ecoproducts | | 120,432 | | | — | | | | | 120,432 | |
| Environmental systems for aluminum dross and scrap processing | | 12,953 | | | — | | | | | 12,953 | |
| Hazardous waste processing solutions | | — | | | 472,631 | | | | | 472,631 | |
| Soil and dredged materials processing and reuse solutions | | — | | | 146,957 | | | | | 146,957 | |
| | | | | | | | |
| Total Revenues | | $ | 914,445 | | | $ | 619,588 | | | | | $ | 1,534,033 | |
(a) Revenues are attributed to individual countries based on the location of the facility generating the revenue.
(b) Includes Mexico.
The Company may receive payments in advance of earning revenue (advances on contracts), which are included in Other current liabilities and Other liabilities on the Consolidated Balance Sheets. The Company may recognize revenue in advance of being able to contractually invoice the customer (contract assets), which is included in Other current assets on the Consolidated Balance Sheets. Contract assets are transferred to Trade accounts receivable, net, when the right to payment becomes unconditional. Contract assets and advances on contracts are reported as a net position, on a contract-by-contract basis, at the end of each reporting period.
The Company had contract assets totaling $5.3 million at December 31, 2022 and $3.1 million at December 31, 2021. The increase is due principally to additional contract assets recognized in excess of the transfer of contract assets to accounts receivable. The Company had advances on contracts totaling $6.8 million at December 31, 2022 and $4.1 million at December 31, 2021. The increase is due principally to receipts of new advances on contracts in excess of the recognition of revenue on previously received advances on contracts during the period. During the year ended December 31, 2022, the Company recognized approximately $18 million of revenue related to amounts previously included in advances on contracts.
At December 31, 2022, the Harsco Environmental Segment had remaining, fixed, unsatisfied performance obligations, where the expected contract duration exceeds one year totaling $75.7 million. Of this amount, $21.1 million is expected to be fulfilled by December 31, 2023, $20.9 million by December 31, 2024, $18.3 million by December 31, 2025, $7.2 million by December 31, 2026 and the remainder thereafter. These amounts exclude any variable fees, fixed fees subject to indexation and any performance obligations expected to be satisfied within one year.
18. Other (Income) Expenses, Net
The major components of this Consolidated Statements of Operations caption are as follows:
| | | | | | | | | | | | | | | | | | | | |
| | |
| (In thousands) | | 2022 | | 2021 | | 2020 |
| Net gains | | | | | | |
| Harsco Environmental Segment | | $ | (1,869) | | | $ | (8,902) | | | $ | (3,723) | |
| Harsco Clean Earth | | (1,512) | | | — | | | — | |
| Corporate | | (632) | | | — | | | — | |
| Total net gains | | (4,013) | | | (8,902) | | | (3,723) | |
| Employee termination benefit costs | | | | | | |
| Harsco Environmental Segment | | 4,998 | | | 2,852 | | | 9,389 | |
| Harsco Clean Earth Segment | | 1,786 | | | 433 | | | 833 | |
| Corporate | | (294) | | | 1,481 | | | 27 | |
| Total employee termination benefit costs | | 6,490 | | | 4,766 | | | 10,249 | |
| Other costs to exit activities | | | | | | |
| Harsco Environmental Segment | | 39 | | | 640 | | | 504 | |
| Harsco Clean Earth Segment | | — | | | 23 | | | — | |
| Corporate | | 1,407 | | | — | | | 29 | |
| Total other costs to exit activities | | 1,446 | | | 663 | | | 533 | |
| Impaired asset write-downs | | | | | | |
| Harsco Environmental Segment | | 582 | | | 942 | | | 776 | |
| Harsco Clean Earth Segment | | 59 | | | 63 | | | — | |
| | | | | | |
| Total impaired asset write-downs | | 641 | | | 1,005 | | | 776 | |
| Contingent consideration adjustments | | | | | | |
| Harsco Environmental Segment | | — | | | — | | | — | |
| Harsco Clean Earth Segment | | (827) | | | — | | | 112 | |
| Corporate | | — | | | — | | | 2,274 | |
| Total contingent consideration adjustments | | (827) | | | — | | | 2,386 | |
| Other (income) expense | | 1,000 | | | (1,254) | | | (149) | |
| Total other (income) expenses, net | | $ | 4,737 | | | $ | (3,722) | | | $ | 10,072 | |
Net Gains
Net gains result from the sales of redundant properties (primarily land, buildings and related equipment) and non-core assets. In 2022, gains related to assets sold principally in North America. In 2021, gains related to assets sold principally in Western Europe. In 2020, gains related to assets sold principally in Latin America and Western Europe.
Employee Termination Benefit Costs
Costs and the related liabilities associated with involuntary termination benefit costs for one-time benefit arrangements provided as part of an exit or disposal activity are recognized when a formal plan for reorganization is approved at the appropriate level of management and is communicated to the affected employees. Additionally, costs associated with ongoing benefit arrangements, or in certain countries where statutory requirements dictate a minimum required benefit, are recognized when they are probable and estimable. The employee termination benefit costs in 2022 principally related to Harsco Environmental Segment primarily in Western Europe; and Harsco Clean Earth Segment primarily in North America. The employee termination benefit costs in 2021 principally related to the Harsco Environmental Segment primarily in Western Europe and Asia-Pacific; and the Harsco Corporate segment primarily in North America. The employee termination benefits costs in 2020 principally related to the Harsco Environmental Segment primarily in Western Europe, North America, Latin America and Asia-Pacific.
Other Costs to Exit Activities
Costs associated with exit or disposal activities include costs to terminate a contract and other costs associated with exit or disposal activities. Costs to terminate a contract are recognized when an entity terminates the contract or when an entity ceases using the right conveyed by the contract. This includes the costs to terminate the contract before the end of its term or the costs that will continue to be incurred under the contract for its remaining term without economic benefit to the entity. Other costs associated with exit or disposal activities (e.g., costs to consolidate or close facilities and relocate equipment or employees) are recognized and measured at their fair value in the period in which the liability is incurred. In 2022, exit costs were incurred principally in the Harsco Environmental Segment, mostly in Middle East/Africa. In 2021, exit costs were incurred principally in the Harsco Environmental Segment, mostly in North America. In 2020, exit costs were incurred in the Harsco Environmental Segment across several regions.
Impaired Asset Write-downs
Impaired asset write-downs include impairment charges for long-lived assets other than definite-lived intangibles and are measured as the amount by which the carrying amount of assets exceeds their fair value. Fair value is estimated based upon the expected future realizable cash flows including anticipated selling prices. Non-cash impaired asset write-downs, for long-lived assets other than definite-lived intangibles, are included in, Other, net, on the Consolidated Statements of Cash Flows as adjustments to reconcile net income (loss) to net cash provided by operating activities. In all years presented, impaired asset write-downs were incurred primarily in the Harsco Environmental Segment across several regions.
Contingent Consideration Adjustments
The Company acquired Clean Earth in 2019. Included in liabilities acquired was a contingent liability resulting from a prior Clean Earth acquisition. Each quarter until settlement of the related contingencies, the Company assesses the likelihood that the acquired businesses will achieve performance goals and the resulting fair value of the contingent consideration and any future adjustments (increases or decreases) are included in operating results. In 2022, the Harsco Clean Earth Segment recorded an adjustment related to the contingent consideration to release the remaining liability. The Company's acquisition of Clean Earth also included an agreement to reimburse the sellers for any usage of assumed net operating losses in a post-closing period for up to five years. In 2020, Corporate recorded an adjustment related to the expected reimbursement of these net operating losses.
19. Components of Accumulated Other Comprehensive Loss
AOCI is included on the Consolidated Statements of Stockholders' Equity. The components of AOCI, net of the effect of income taxes, and activity for the years ended December 31, 2022 and 2021 are as follows:
| | | | | | | | | | | | | | | | | | | | | | | | | | | | | | | | |
| | Components of AOCI - Net of Tax |
| (In thousands) | | Cumulative Foreign Exchange Translation Adjustments | | Effective Portion of Derivatives Designated as Hedging Instruments | | Cumulative Unrecognized Actuarial Losses on Pension Obligations | | Unrealized Loss on Marketable Securities | | Total |
| | | | | | | | | | |
| | | | | | | | | | |
| Balance at December 31, 2020 | | $ | (125,392) | | | $ | (5,840) | | | $ | (514,500) | | | $ | (9) | | | $ | (645,741) | |
| OCI before reclassifications | | (10,994) | | (a) | 441 | | (b) | 69,517 | | (c) | 31 | | | 58,995 | |
| Amounts reclassified from AOCI, net of tax | | — | | | 2,375 | | | 22,735 | | | — | | | 25,110 | |
| Total OCI | | (10,994) | | | 2,816 | | | 92,252 | | | 31 | | | 84,105 | |
| Less: OCI attributable to noncontrolling interests | | 1,497 | | | — | | | — | | | — | | | 1,497 | |
| OCI attributable to Harsco Corporation | | (9,497) | | | 2,816 | | | 92,252 | | | 31 | | | 85,602 | |
| Balance at December 31, 2021 | | $ | (134,889) | | | $ | (3,024) | | | $ | (422,248) | | | $ | 22 | | | $ | (560,139) | |
| OCI before reclassifications | | (82,325) | | (a) | 1,642 | | (b) | 50,378 | | (c) | (12) | | | (30,317) | |
| Amounts reclassified from AOCI, net of tax | | — | | | 1,539 | | | 17,171 | | | — | | | 18,710 | |
| Total OCI | | (82,325) | | | 3,181 | | | 67,549 | | | (12) | | | $ | (11,607) | |
| Less: OCI attributable to noncontrolling interests | | 4,110 | | | — | | | — | | | — | | | 4,110 | |
| OCI attributable to Harsco Corporation | | (78,215) | | | 3,181 | | | 67,549 | | | (12) | | | (7,497) | |
| Balance at December 31, 2022 | | $ | (213,104) | | | $ | 157 | | | $ | (354,699) | | | $ | 10 | | | $ | (567,636) | |
(a) Principally foreign currency fluctuation.
(b) Principally net change from periodic revaluations.
(c) Principally changes due to annual actuarial remeasurements and foreign currency translation.
Amounts reclassified from AOCI for 2022 and 2021 are as follows:
| | | | | | | | | | | | | | | | | | | | |
| | Year Ended December 31 2022 | | Year Ended December 31 2021 | | Affected Caption on the
Consolidated Statements of Operations |
| (In thousands) | |
Amortization of defined benefit pension items (d): | | | | | | |
Actuarial losses | | $ | 17,792 | | | $ | 23,657 | | | Defined benefit pension income (expense) |
| | | | | | |
Prior-service costs | | 534 | | | 582 | | | Defined benefit pension income (expense) |
| | | | | | |
| Settlement/curtailment loss (gain) | | 96 | | | (72) | | | Income (loss) from discontinued businesses |
| Settlement/curtailment gain | | (33) | | | — | | | Defined benefit pension income (expense) |
| Total before tax | | 18,389 | | | 24,167 | | | |
| Tax benefit | | (1,218) | | | (1,432) | | | |
| Total reclassification of defined benefit pension items, net of tax | | $ | 17,171 | | | $ | 22,735 | | | |
|
| | | | | | |
| | | | | | |
| Amortization of cash flow hedging instruments: |
| Foreign currency exchange forward contracts | | $ | (1,746) | | | $ | (129) | | | Income (loss) from discontinued businesses |
| | | | | | |
| | | | | | |
| Interest rate swaps | | 4,245 | | | 3,474 | | | Interest expense |
| | | | | | |
| Total before tax | | 2,499 | | | 3,345 | | | |
| Tax benefit | | (960) | | | (970) | | | |
| Total reclassification of cash flow hedging instruments | | $ | 1,539 | | | $ | 2,375 | | | |
|
| | | | | | |
| | | | | | |
| | | | | | |
(d) These AOCI components are included in the computation of NPPC. See Note 10, Employee Benefit Plans, for additional information.
Item 9. Changes In and Disagreements With Accountants on Accounting and Financial Disclosure.
None.
Item 9A. Controls and Procedures.
Evaluation of Disclosure Controls and Procedures
As of December 31, 2022, an evaluation was performed, under the supervision and with the participation of the Company's management, including the Company's Chief Executive Officer and Chief Financial Officer, of the effectiveness of the design and operation of the Company's disclosure controls and procedures pursuant to Rule 13a-15 under the Securities Exchange Act of 1934, as amended. Based upon that evaluation, such officers concluded that the Company's disclosure controls and procedures are effective to ensure that information required to be disclosed by the Company in the reports it files or submits under the Securities Exchange Act of 1934, as amended (1) is recorded, processed, summarized, and reported within the time periods specified in the Securities and Exchange Commission's rules and forms and (2) is accumulated and communicated to the Company's management, including the Chief Executive Officer and Chief Financial Officer, as appropriate to allow for timely decisions regarding required disclosure.
Changes in Internal Control Over Financial Reporting
There were no changes in the Company's internal control over financial reporting during the Company's most recent fiscal quarter that have materially affected, or are reasonably likely to materially affect, the Company's internal control over financial reporting.
Management's Report on Internal Control Over Financial Reporting
Management's Report on Internal Control Over Financial Reporting is included in Part II, Item 8, "Financial Statements and Supplementary Data." The effectiveness of the Company's internal control over financial reporting as of December 31, 2022 has been audited by PricewaterhouseCoopers LLP, an independent registered public accounting firm, as stated in their report appearing in Part II, Item 8, "Financial Statements and Supplementary Data."
Item 9B. Other Information.
None.
Item 9C. Disclosure Regarding Foreign Jurisdictions that Prevent Inspections.
None.
PART III
Item 10. Directors, Executive Officers and Corporate Governance.
The information required by this Item is incorporated herein by reference from the disclosures that will be included under the sections entitled "Executive Officers", "Corporate Governance," "Proposal 1: Election of Directors - Nominees for Director," "Meetings and Committees of the Board," and "Report of the Audit Committee" of the Company's Definitive Proxy Statement for its 2023 Annual Meeting of Stockholders (the "2023 Proxy Statement"), which will be filed pursuant to SEC Regulation 14A not later than 120 days after the end of the Company's fiscal year ended December 31, 2022.
The Company's Code of Conduct (the "Code"), which applies to all officers, directors and employees of the Company, may be found on the Company's Internet website, www.harsco.com. The Company intends to disclose on its website any amendments to the Code or any waiver from a provision of the Code granted to an executive officer or director of the Company. The Code is available in print, without charge, to any person who requests it. To request a copy of the Code please contact the Company's Vice President—Corporate Communications at (267) 857-8017.
Item 11. Executive Compensation.
The information regarding compensation of executive officers and directors required by this Item is incorporated herein by reference from the disclosures that will be included under the sections entitled "Compensation Discussion and Analysis," "Discussion and Analysis of 2022 Compensation" and "Non-Employee Director Compensation" of the 2023 Proxy Statement. The other information required by this Item is incorporated herein by reference from the disclosures that will be included under the sections entitled "Compensation Committee Interlocks and Insider Participation" and "Compensation Committee Report" of the 2023 Proxy Statement.
Item 12. Security Ownership of Certain Beneficial Owners and Management and Related Stockholder Matters.
The information regarding security ownership of certain beneficial owners and management required by this Item is incorporated herein by reference from the disclosures that will be included under the section entitled "Share Ownership of Directors, Management and Certain Beneficial Owners" of the 2023 Proxy Statement.
Equity compensation plan information is incorporated herein by reference from the disclosures that will be included under the section entitled "Equity Compensation Plan Information (As of December 31, 2022)" of the 2023 Proxy Statement.
Item 13. Certain Relationships and Related Transactions, and Director Independence.
The information regarding certain relationships and related transactions required by this Item is incorporated herein by reference from the disclosures that will be included under the section entitled "Transactions with Related Persons" of the 2023 Proxy Statement. The information regarding director independence required by this Item is incorporated herein by reference from the disclosures that will be included under the section entitled "Corporate Governance" of the 2023 Proxy Statement.
Item 14. Principal Accountant Fees and Services.
The information regarding principal accounting fees and services required by this Item is incorporated herein by reference from the disclosures that will be included under the section entitled "Fees Billed by the Independent Auditors for Audit and Non-Audit Services" of the 2023 Proxy Statement.
PART IV
Item 15. Exhibit and Financial Statement Schedules.
(a)1. The Index to Consolidated Financial Statements and Supplementary Data is located under Part II, Item 8, "Financial Statements and Supplementary Data."
2. The following financial statement schedule should be read in conjunction with the Consolidated Financial Statements under Part II, Item 8, "Financial Statements and Supplementary Data":
Financial statement schedules other than that listed above are omitted because the required information is not applicable, or because the information required is included in the consolidated financial statements.
SCHEDULE II. VALUATION AND QUALIFYING ACCOUNTS
Continuing Operations
(In thousands)
| | | | | | | | | | | | | | | | | | | | | | | | | | | | | | | | |
| COLUMN A | | COLUMN B | | COLUMN C | | COLUMN D | | COLUMN E |
| | | | | Additions (Deductions) | | Additions (Deductions) | | |
| Description | | Balance at
Beginning of
Period | | Charged to
Cost and
Expenses | | Due to
Currency
Translation
Adjustments | | Other | | Balance at End
of Period |
| For the year 2022: | | | | | | | | | | |
| Allowance for Expected Credit Losses | | $ | 11,654 | | | $ | 403 | | | $ | (110) | | | $ | (3,600) | | (a) | $ | 8,347 | |
| Deferred Tax Assets—Valuation Allowance | | 92,385 | | | 14,126 | | | (6,448) | | | (10,829) | | (b) | 89,234 | |
| For the year 2021: | | | | | | | | | | |
| Allowance for Expected Credit Losses | | $ | 7,488 | | | $ | 589 | | | $ | (206) | | | $ | 3,783 | | (a) | $ | 11,654 | |
| Deferred Tax Assets—Valuation Allowance | | 108,563 | | | (4,252) | | | (3,502) | | | (8,424) | | (b) | 92,385 | |
| For the year 2020: | | | | | | | | | | |
| Allowance for Expected Credit Losses | | $ | 13,265 | | | $ | 1,961 | | | $ | (104) | | | $ | (7,634) | | (a) | $ | 7,488 | |
| Deferred Tax Assets—Valuation Allowance | | 100,245 | | | 6,936 | | | 1,305 | | | 77 | | (b) | 108,563 | |
| | | | | | | | | | |
| | | | | | | | | | |
| | | | | | | | | | |
(a)Includes the write-off of, net of collections on, previously reserved accounts receivable balances and changes in credit memo reserves reflected as adjustments to revenue. 2021 has been revised from the presentation in the Company's 2021 Form 10-K , which revision did not impact trade accounts receivable, net.
(b)2022 includes decreases of $7.1 million related to pension adjustments recorded through AOCI and $4.3 million related to state tax rate reductions in the U.S. 2021 includes a decrease of $19.3 million related to pension adjustments recorded through AOCI and an increase of $14.4 million related to a UK tax rate change. 2020 includes a decrease of $15.5 million related to foreign tax credit carryforwards due to statutory limitation expiration in the U.S., an increase of $13.0 million related to pension adjustments recorded through AOCI and an increase of $3.7 million related to a UK tax rate change.
Listing of Exhibits Filed with Form 10-K
| | | | | | | | |
| | Description of Exhibit |
| 2(a) | | Stock Purchase Agreement, dated as of May 8, 2019, by and between Calrissian Holdings, LLC, CEHI Acquisition Corporation, the holders of stock and options in CEHI Acquisition Corporation, Compass Group Diversified Holdings LLC and, solely for the purposes of Section 9(r) thereof, the Company (incorporated by reference to the Company's Current Report on Form 8-K dated May 13, 2019, Commission File Number 001-03970).* |
| 2(b) | | Asset Purchase Agreement, dated as of May 8, 2019, by and among the Company, E&C FinFan, Inc. and, solely with respect to Section 11.19 thereof, Chart Industries, Inc (incorporated by reference to the Company's Current Report on Form 8-K dated May 13, 2019, Commission File Number 001-03970).* |
| 2(c) | | |
| 2(d) | | |
| 2(e) | | |
| 3(a) | | |
| 3(b) | | |
| 3(c) | | |
| 3(d) | | |
| 4(a) | | |
| 4(b) | | |
| 4(c) | | |
| 4(d) | | |
| * Schedules and similar attachments have been omitted pursuant to Item 601(b)(2) of Regulation S-K. The Company will furnish copies of any such schedules and attachments to the U.S. Securities and Exchange Commission upon request. |
| Material Contracts—Credit and Underwriting Agreements |
| 10(a)(i) | | Amended and Restated Five-Year Credit Agreement, dated March 2, 2012, among Harsco Corporation, the lenders named therein, Citibank, N.A., as administrative agent, RBS Securities Inc., as syndication agent, and the Bank of Tokyo-Mitsubishi UFJ, Ltd., HSBC Bank USA, National Association, ING Bank N.V., Dublin Branch, JPMorgan Chase Bank, N.A. and Lloyds TSB Bank PLC, as documentation agents (incorporated by reference to the Company's Current Report on Form 8-K dated March 7, 2012, Commission File No. 001-03970). |
| 10(a)(ii) | | Amendment No. 1, dated September 12, 2013, to the Amended and Restated Five-Year Credit Agreement, dated March 2, 2012, among Harsco Corporation, the lenders named therein, Citibank, N.A., as administrative agent, RBS Securities Inc., as syndication agent, and the Bank of Tokyo-Mitsubishi UFJ, Ltd., HSBC Bank USA, National Association, ING Bank N.V., Dublin Branch, JPMorgan Chase Bank, N.A. and Lloyds TSB Bank PLC, as documentation agents (incorporated by reference to the Company's Quarterly Report on Form 10-Q for the period ended September 30, 2013, Commission File Number 001-03970). |
| | | | | | | | |
| | Description of Exhibit |
| 10(a)(iii) | | Amendment No. 2, dated December 20, 2013, to the Amended and Restated Five-Year Credit Agreement, dated March 2, 2012, among Harsco Corporation, the lenders named therein, Citibank, N.A., as administrative agent, RBS Securities Inc., as syndication agent, and the Bank of Tokyo-Mitsubishi UFJ, Ltd., HSBC Bank USA, National Association, ING Bank N.V., Dublin Branch, JPMorgan Chase Bank, N.A. and Lloyds TSB Bank PLC, as documentation agents (incorporated by reference to the Company's Annual Report on Form 10-K for the fiscal year ended December 31, 2014, Commission File Number 001-03970). |
| 10(a)(iv) | | Amendment No. 3, dated as of March 27, 2015, to the Amended and Restated Five-Year Credit Agreement among Harsco Corporation, a Delaware corporation, as Borrower, the Lenders party thereto and Citibank, N.A., as Administrative Agent (incorporated by reference to the Company's Current Report on Form 8-K filed April 1, 2015, Commission File Number 001-03970). |
| 10(a)(v) | | Amendment and Restatement Agreement, dated as of December 2, 2015, among Harsco Corporation, the subsidiaries of the Company party thereto, Citibank N.A., as administrative agent, the other agents party thereto and the lenders party thereto including Second Amended and Restated Credit Agreement, dated as of December 2, 2015, among Harsco Corporation, the lenders named therein, Citibank, N.A. and Royal Bank of Canada, as issuing lenders, and Citibank N.A., as administrative agent and as collateral agent (incorporated by reference to the Company's Current Report on Form 8-K dated December 4, 2015, Commission File No. 001-03970). |
| 10(a)(vi) | | |
| 10(a)(vii) | | |
| 10(a)(viii) | | |
| 10(a)(ix) | | |
| 10(a)(x) | | |
| 10(a)(xi) | | |
| 10(a)(xii) | | |
| 10(a)(xiii) | | |
| 10(a)(xiv) | | |
| 10(a)(xv) | | |
| | | | | | | | |
| | Description of Exhibit |
| 10(a)(xvi) | | |
| 10(a)(xvii) | | Receivables Purchase Agreement, dated as of June 24, 2022, by and among Harsco Receivables LLC, Harsco Corporation, the person from time to time party thereto as purchasers, PNC Bank, National Association, as administrative agent, and PNC Capital Markets LLC, as structuring agent (incorporated by reference to the Company’s Current Report on Form 8-K dated June 24, 2022, Commission File Number 001-03970). |
| 10(a)(xviii) | | |
| 10(a)(xix) | | |
| 10(a)(xx) | | |
| 10(a)(xxi) | | |
| Material Contracts—Management Contracts and Compensatory Plans |
| 10(b) | | |
| 10(c) | | Trust Agreement between Harsco Corporation and Dauphin Deposit Bank and Trust Company dated July 1, 1987 relating to the Supplemental Retirement Benefit Plan (incorporated by reference to the Company's Annual Report on Form 10-K for the period ended December 31, 1987, Commission File Number 001-03970). |
| | |
| | |
| | |
| | |
| | |
| | |
| 10(d) | | |
| 10(e) | | |
| 10(f)(i) | | |
| 10(f)(ii) | | |
| 10(g)(i) | | |
| 10(g)(ii) | | |
| 10(h) | | |
| 10(i) | | |
| | |
| | |
| | |
| | |
| | |
| | | | | | | | |
| | Description of Exhibit |
| 10(j) | | |
| | |
| 10(k) | | |
| 10(l) | | |
| | |
| 10(m) | | |
| 10(n) | | |
| 10(o) | | |
| 10(p)(i) | | |
| 10(p)(ii) | | |
| 10(q) | | |
| 10(r) | | |
| 10(s) | | |
| 10(t) | | |
| 10(u) | | |
| 10(v) | | |
| 10(w) | | |
| 10(x) | | |
| 10(y) | | |
| 10(z) | | |
| 10(aa) | | |
| 10(ab) | | |
| | | | | | | | |
| | Description of Exhibit |
| 10(ac) | | |
| 10(ad) | | |
| 10(ae) | | |
| Director Indemnity Agreements |
| 10(bb) | | |
| 10(bc) | | |
| | |
| | |
| | |
| | |
| | |
| | |
| | |
| | |
| | |
| 21 | | |
| 23 | | |
| 31.1 | | |
| 31.2 | | |
| 32 | | |
| 101.Def | | Definition Linkbase Document |
| 101.Pre | | Presentation Linkbase Document |
| 101.Lab | | Labels Linkbase Document |
| 101.Cal | | Calculation Linkbase Document |
| 101.Sch | | Schema Document |
| 101.Ins | | Instance Document - the instance document does not appear in the Interactive Data File because its XBRL tags are embedded within the Inline XBRL document. |
Exhibits other than those listed above are omitted for the reason that they are either not applicable or not material.
Item 16. Form 10-K Summary.
None.
SIGNATURES
Pursuant to the requirements of Section 13 or 15(d) of the Securities Exchange Act of 1934, the registrant has duly caused this report to be signed on its behalf by the undersigned, thereunto duly authorized.
| | | | | | | | | | | |
| | | HARSCO CORPORATION (Registrant)
|
| DATE | March 1, 2023 | | /s/ PETER F. MINAN |
| | | Peter F. Minan Senior Vice President and Chief Financial Officer (Principal Financial Officer) |
| | | | | | | | | | | |
| | | |
| | | |
| DATE | March 1, 2023 | | /s/ SAMUEL C. FENICE |
| | | Samuel C. Fenice Vice President and Corporate Controller (Principal Accounting Officer) |
Pursuant to the requirements of the Securities Exchange Act of 1934, this report has been signed below by the following persons on behalf of the registrant and in the capacities and on the dates indicated.
| | | | | | | | | | | | | | |
| Signature | | Capacity | | Date |
| /s/ F. NICHOLAS GRASBERGER III | | Chairman, President, Chief Executive Officer and Director
(Principal Executive Officer) | | March 1, 2023 |
| F. Nicholas Grasberger III | | | | |
| /s/ PETER F. MINAN | | Senior Vice President and Chief Financial Officer
(Principal Financial Officer) | | March 1, 2023 |
| Peter F. Minan | | | | |
| /s/ DAVID C. EVERITT | | Lead Director | | March 1, 2023 |
| David C. Everitt | | | | |
| /s/ JAMES F. EARL | | Director | | March 1, 2023 |
| James F. Earl | | | | |
| /s/ KATHY G. EDDY | | Director | | March 1, 2023 |
| Kathy G. Eddy | | | | |
| /s/ CAROLANN I. HAZNEDAR | | Director | | March 1, 2023 |
| Carolann I. Haznedar | | | | |
| | Director | | |
| Timothy M. Laurion | | | | |
| /s/ EDGAR M. PURVIS, JR. | | Director | | March 1, 2023 |
| Edgar M. Purvis, Jr. | | | | |
| /s/ JOHN S. QUINN | | Director | | March 1, 2023 |
| John S. Quinn | | | | |
| /s/ PHILLIP C. WIDMAN | | Director | | March 1, 2023 |
| Phillip C. Widman | | | | |