0000045012888,632,7752020FYfalse1010101011111010101111010101011——110112021303140156101120September 2039September 20397.457.45September 2038September 20386.706.70November 2021November 20213.253.25November 2041November 20414.504.50August 2096August 20967.607.60February 2021February 20218.758.75August 2023August 20233.503.50August 2043August 20434.754.75February 2027February 20276.756.75November 2045November 20455.05.0November 2025November 20253.83.8November 2035November 20354.854.853,500,000,000may not be redeemed prior to maturitymay not be redeemed prior to maturity2.253.881.372.291.281.721.352.512.272.841.792.14310.310000000450122020-01-012020-12-31iso4217:USD00000450122020-06-30xbrli:shares00000450122021-01-29iso4217:USDxbrli:shares00000450122019-12-3100000450122020-12-310000045012us-gaap:ServiceMember2020-01-012020-12-310000045012us-gaap:ServiceMember2019-01-012019-12-310000045012us-gaap:ServiceMember2018-01-012018-12-310000045012us-gaap:ProductMember2020-01-012020-12-310000045012us-gaap:ProductMember2019-01-012019-12-310000045012us-gaap:ProductMember2018-01-012018-12-3100000450122019-01-012019-12-3100000450122018-01-012018-12-3100000450122018-12-3100000450122017-12-310000045012us-gaap:CommonStockMember2017-12-310000045012us-gaap:AdditionalPaidInCapitalMember2017-12-310000045012us-gaap:TreasuryStockMember2017-12-310000045012us-gaap:RetainedEarningsMember2017-12-310000045012us-gaap:AccumulatedOtherComprehensiveIncomeMember2017-12-310000045012us-gaap:NoncontrollingInterestMember2017-12-310000045012us-gaap:CommonStockMember2018-01-012018-12-310000045012us-gaap:AdditionalPaidInCapitalMember2018-01-012018-12-310000045012us-gaap:TreasuryStockMember2018-01-012018-12-310000045012us-gaap:RetainedEarningsMember2018-01-012018-12-310000045012us-gaap:AccumulatedOtherComprehensiveIncomeMember2018-01-012018-12-310000045012us-gaap:NoncontrollingInterestMember2018-01-012018-12-310000045012us-gaap:CommonStockMember2018-12-310000045012us-gaap:AdditionalPaidInCapitalMember2018-12-310000045012us-gaap:TreasuryStockMember2018-12-310000045012us-gaap:RetainedEarningsMember2018-12-310000045012us-gaap:AccumulatedOtherComprehensiveIncomeMember2018-12-310000045012us-gaap:NoncontrollingInterestMember2018-12-310000045012us-gaap:CommonStockMember2019-01-012019-12-310000045012us-gaap:AdditionalPaidInCapitalMember2019-01-012019-12-310000045012us-gaap:TreasuryStockMember2019-01-012019-12-310000045012us-gaap:RetainedEarningsMember2019-01-012019-12-310000045012us-gaap:AccumulatedOtherComprehensiveIncomeMember2019-01-012019-12-310000045012us-gaap:NoncontrollingInterestMember2019-01-012019-12-310000045012us-gaap:CommonStockMember2019-12-310000045012us-gaap:AdditionalPaidInCapitalMember2019-12-310000045012us-gaap:TreasuryStockMember2019-12-310000045012us-gaap:RetainedEarningsMember2019-12-310000045012us-gaap:AccumulatedOtherComprehensiveIncomeMember2019-12-310000045012us-gaap:NoncontrollingInterestMember2019-12-310000045012us-gaap:CommonStockMember2020-01-012020-12-310000045012us-gaap:AdditionalPaidInCapitalMember2020-01-012020-12-310000045012us-gaap:TreasuryStockMember2020-01-012020-12-310000045012us-gaap:RetainedEarningsMember2020-01-012020-12-310000045012us-gaap:AccumulatedOtherComprehensiveIncomeMember2020-01-012020-12-310000045012us-gaap:NoncontrollingInterestMember2020-01-012020-12-310000045012us-gaap:CommonStockMember2020-12-310000045012us-gaap:AdditionalPaidInCapitalMember2020-12-310000045012us-gaap:TreasuryStockMember2020-12-310000045012us-gaap:RetainedEarningsMember2020-12-310000045012us-gaap:AccumulatedOtherComprehensiveIncomeMember2020-12-310000045012us-gaap:NoncontrollingInterestMember2020-12-31hal:Division0000045012hal:CompletionAndProductionMember2018-12-310000045012hal:DrillingAndEvaluationMember2018-12-310000045012hal:CompletionAndProductionMember2019-01-012019-12-310000045012hal:DrillingAndEvaluationMember2019-01-012019-12-310000045012hal:CompletionAndProductionMember2019-12-310000045012hal:DrillingAndEvaluationMember2019-12-310000045012hal:CompletionAndProductionMember2020-01-012020-12-310000045012hal:DrillingAndEvaluationMember2020-01-012020-12-310000045012hal:CompletionAndProductionMember2020-12-310000045012hal:DrillingAndEvaluationMember2020-12-310000045012srt:MinimumMember2020-01-012020-12-310000045012srt:MaximumMember2020-01-012020-12-310000045012srt:MaximumMember2020-01-012020-03-310000045012srt:MinimumMember2020-01-012020-03-310000045012srt:MinimumMember2020-10-012020-12-310000045012srt:ArithmeticAverageMember2020-10-012020-12-310000045012srt:ArithmeticAverageMember2020-01-012020-12-31xbrli:pure00000450122020-10-012020-12-3100000450122020-04-012020-06-3000000450122020-07-012020-09-3000000450122020-01-012020-03-310000045012country:VE2020-01-012020-12-310000045012country:VE2019-01-012019-12-310000045012country:VE2018-01-012018-12-310000045012hal:CompletionAndProductionMember2018-01-012018-12-310000045012hal:DrillingAndEvaluationMember2018-01-012018-12-310000045012us-gaap:OperatingSegmentsMember2020-01-012020-12-310000045012us-gaap:OperatingSegmentsMember2019-01-012019-12-310000045012us-gaap:OperatingSegmentsMember2018-01-012018-12-310000045012us-gaap:MaterialReconcilingItemsMember2020-01-012020-12-310000045012us-gaap:MaterialReconcilingItemsMember2019-01-012019-12-310000045012us-gaap:MaterialReconcilingItemsMember2018-01-012018-12-310000045012us-gaap:CorporateAndOtherMember2020-01-012020-12-310000045012us-gaap:IntersegmentEliminationMember2020-12-310000045012us-gaap:IntersegmentEliminationMember2019-12-310000045012country:USus-gaap:SalesRevenueNetMember2020-01-012020-12-310000045012country:USus-gaap:SalesRevenueNetMember2019-01-012019-12-310000045012country:USus-gaap:SalesRevenueNetMember2018-01-012018-12-310000045012us-gaap:PropertyPlantAndEquipmentMembercountry:US2020-01-012020-12-310000045012us-gaap:PropertyPlantAndEquipmentMembercountry:US2019-01-012019-12-310000045012srt:NorthAmericaMember2020-01-012020-12-310000045012srt:NorthAmericaMember2019-01-012019-12-310000045012srt:NorthAmericaMember2018-01-012018-12-310000045012srt:LatinAmericaMember2020-01-012020-12-310000045012srt:LatinAmericaMember2019-01-012019-12-310000045012srt:LatinAmericaMember2018-01-012018-12-310000045012hal:EuropeAfricaCISMember2020-01-012020-12-310000045012hal:EuropeAfricaCISMember2019-01-012019-12-310000045012hal:EuropeAfricaCISMember2018-01-012018-12-310000045012hal:MiddleEastAsiaMember2020-01-012020-12-310000045012hal:MiddleEastAsiaMember2019-01-012019-12-310000045012hal:MiddleEastAsiaMember2018-01-012018-12-310000045012srt:NorthAmericaMember2020-12-310000045012srt:NorthAmericaMember2019-12-310000045012srt:LatinAmericaMember2020-12-310000045012srt:LatinAmericaMember2019-12-310000045012hal:EuropeAfricaCISMember2020-12-310000045012hal:EuropeAfricaCISMember2019-12-310000045012hal:MiddleEastAsiaMember2020-12-310000045012hal:MiddleEastAsiaMember2019-12-31hal:Countries0000045012us-gaap:GeographicConcentrationRiskMembercountry:USus-gaap:AccountsReceivableMember2020-01-012020-12-310000045012us-gaap:GeographicConcentrationRiskMembercountry:USus-gaap:AccountsReceivableMember2019-01-012019-12-31hal:Customers0000045012us-gaap:OtherAssetsMember2020-12-310000045012us-gaap:OtherAssetsMember2019-12-310000045012us-gaap:OtherCurrentLiabilitiesMember2020-12-310000045012us-gaap:OtherCurrentLiabilitiesMember2019-12-310000045012us-gaap:OtherLiabilitiesMember2020-12-310000045012us-gaap:OtherLiabilitiesMember2019-12-310000045012us-gaap:LandMember2020-12-310000045012us-gaap:LandMember2019-12-310000045012us-gaap:BuildingAndBuildingImprovementsMember2020-12-310000045012us-gaap:BuildingAndBuildingImprovementsMember2019-12-310000045012us-gaap:MachineryAndEquipmentMember2020-12-310000045012us-gaap:MachineryAndEquipmentMember2019-12-310000045012hal:YearsDepreciated1Through10YearsMemberus-gaap:BuildingAndBuildingImprovementsMember2020-12-310000045012hal:YearsDepreciated1Through10YearsMemberus-gaap:BuildingAndBuildingImprovementsMember2019-12-310000045012hal:YearsDepreciated11Through20YearsMemberus-gaap:BuildingAndBuildingImprovementsMember2020-12-310000045012hal:YearsDepreciated11Through20YearsMemberus-gaap:BuildingAndBuildingImprovementsMember2019-12-310000045012us-gaap:BuildingAndBuildingImprovementsMemberhal:YearsDepreciated21Through30YearsMember2020-12-310000045012us-gaap:BuildingAndBuildingImprovementsMemberhal:YearsDepreciated21Through30YearsMember2019-12-310000045012hal:YearsDepreciated31Through40YearsMemberus-gaap:BuildingAndBuildingImprovementsMember2020-12-310000045012hal:YearsDepreciated31Through40YearsMemberus-gaap:BuildingAndBuildingImprovementsMember2019-12-310000045012hal:YearsDepreciated1Through5YearsMemberus-gaap:MachineryAndEquipmentMember2020-12-310000045012hal:YearsDepreciated1Through5YearsMemberus-gaap:MachineryAndEquipmentMember2019-12-310000045012hal:YearsDepreciated6Through10YearsMemberus-gaap:MachineryAndEquipmentMember2020-12-310000045012hal:YearsDepreciated6Through10YearsMemberus-gaap:MachineryAndEquipmentMember2019-12-310000045012hal:YearsDepreciated11Through20YearsMemberus-gaap:MachineryAndEquipmentMember2020-12-310000045012hal:YearsDepreciated11Through20YearsMemberus-gaap:MachineryAndEquipmentMember2019-12-310000045012hal:YearsDepreciated1Through10YearsMemberus-gaap:BuildingAndBuildingImprovementsMembersrt:MinimumMember2020-01-012020-12-310000045012hal:YearsDepreciated1Through10YearsMembersrt:MaximumMemberus-gaap:BuildingAndBuildingImprovementsMember2020-01-012020-12-310000045012hal:YearsDepreciated11Through20YearsMemberus-gaap:BuildingAndBuildingImprovementsMembersrt:MinimumMember2020-01-012020-12-310000045012hal:YearsDepreciated11Through20YearsMembersrt:MaximumMemberus-gaap:BuildingAndBuildingImprovementsMember2020-01-012020-12-310000045012us-gaap:BuildingAndBuildingImprovementsMemberhal:YearsDepreciated21Through30YearsMembersrt:MinimumMember2020-01-012020-12-310000045012srt:MaximumMemberus-gaap:BuildingAndBuildingImprovementsMemberhal:YearsDepreciated21Through30YearsMember2020-01-012020-12-310000045012hal:YearsDepreciated31Through40YearsMemberus-gaap:BuildingAndBuildingImprovementsMembersrt:MinimumMember2020-01-012020-12-310000045012srt:MaximumMemberhal:YearsDepreciated31Through40YearsMemberus-gaap:BuildingAndBuildingImprovementsMember2020-01-012020-12-310000045012hal:YearsDepreciated1Through5YearsMemberus-gaap:MachineryAndEquipmentMembersrt:MinimumMember2020-01-012020-12-310000045012hal:YearsDepreciated1Through5YearsMembersrt:MaximumMemberus-gaap:MachineryAndEquipmentMember2020-01-012020-12-310000045012hal:YearsDepreciated6Through10YearsMemberus-gaap:MachineryAndEquipmentMembersrt:MinimumMember2020-01-012020-12-310000045012hal:YearsDepreciated6Through10YearsMembersrt:MaximumMemberus-gaap:MachineryAndEquipmentMember2020-01-012020-12-310000045012hal:YearsDepreciated11Through20YearsMemberus-gaap:MachineryAndEquipmentMembersrt:MinimumMember2020-01-012020-12-310000045012hal:YearsDepreciated11Through20YearsMembersrt:MaximumMemberus-gaap:MachineryAndEquipmentMember2020-01-012020-12-310000045012hal:SeniornotesdueNovember2045Member2020-12-310000045012hal:SeniornotesdueNovember2045Member2019-12-310000045012hal:SeniorNotesdueNovember2025Member2020-12-310000045012hal:SeniorNotesdueNovember2025Member2019-12-310000045012hal:SeniorNotesdueNovember2035Member2020-12-310000045012hal:SeniorNotesdueNovember2035Member2019-12-310000045012hal:SeniornotesdueSeptember2039Member2020-12-310000045012hal:SeniornotesdueSeptember2039Member2019-12-310000045012hal:SeniorNotesDueMarch2030Member2020-12-310000045012hal:SeniorNotesDueMarch2030Member2019-12-310000045012hal:SeniorNotesDueAugust2043Member2020-12-310000045012hal:SeniorNotesDueAugust2043Member2019-12-310000045012hal:SeniorNotesDue2038Member2020-12-310000045012hal:SeniorNotesDue2038Member2019-12-310000045012hal:SeniornotesdueAugust2023Member2020-12-310000045012hal:SeniornotesdueAugust2023Member2019-12-310000045012hal:SeniornotesdueNovember2041Member2020-12-310000045012hal:SeniornotesdueNovember2041Member2019-12-310000045012hal:SeniornotesdueNovember2021Member2020-12-310000045012hal:SeniornotesdueNovember2021Member2019-12-310000045012hal:SeniornotesdueAugust2096Member2020-12-310000045012hal:SeniornotesdueAugust2096Member2019-12-310000045012hal:SeniornotesdueFebruary2021Member2020-12-310000045012hal:SeniornotesdueFebruary2021Member2019-12-310000045012hal:SeniornotesdueFebruary2027MemberDomain2020-12-310000045012hal:SeniornotesdueFebruary2027MemberDomain2019-12-310000045012us-gaap:OtherDebtSecuritiesMember2020-12-310000045012us-gaap:OtherDebtSecuritiesMember2019-12-310000045012hal:TenderOfferOnSeniorNotesDueAugust2023AndNovember2025Member2020-12-310000045012hal:TenderOfferOnSeniorNoteDueAugust2023Member2020-12-310000045012hal:TenderOfferOnSeniorNoteDueNovember2025Member2020-12-310000045012hal:SeniornotesdueAugust2096Member2020-01-012020-12-310000045012hal:SeniornotesdueSeptember2039Member2020-01-012020-12-310000045012hal:SeniornotesdueSeptember2039Member2019-01-012019-12-310000045012hal:SeniorNotesDue2038Member2020-01-012020-12-310000045012hal:SeniorNotesDue2038Member2019-01-012019-12-310000045012hal:SeniornotesdueNovember2021Member2020-01-012020-12-310000045012hal:SeniornotesdueNovember2021Member2019-01-012019-12-310000045012hal:SeniornotesdueNovember2041Member2020-01-012020-12-310000045012hal:SeniornotesdueNovember2041Member2019-01-012019-12-310000045012hal:SeniornotesdueAugust2096Member2019-01-012019-12-310000045012hal:SeniornotesdueFebruary2021Member2020-01-012020-12-310000045012hal:SeniornotesdueFebruary2021Member2019-01-012019-12-310000045012hal:SeniornotesdueAugust2023Member2020-01-012020-12-310000045012hal:SeniornotesdueAugust2023Member2019-01-012019-12-310000045012hal:SeniorNotesDueAugust2043Member2020-01-012020-12-310000045012hal:SeniorNotesDueAugust2043Member2019-01-012019-12-310000045012hal:SeniornotesdueFebruary2027MemberDomain2020-01-012020-12-310000045012hal:SeniornotesdueFebruary2027MemberDomain2019-01-012019-12-310000045012hal:SeniornotesdueNovember2045Member2020-01-012020-12-310000045012hal:SeniornotesdueNovember2045Member2019-01-012019-12-310000045012hal:SeniorNotesdueNovember2025Member2020-01-012020-12-310000045012hal:SeniorNotesdueNovember2025Member2019-01-012019-12-310000045012hal:SeniorNotesdueNovember2035Member2020-01-012020-12-310000045012hal:SeniorNotesdueNovember2035Member2019-01-012019-12-310000045012us-gaap:FinancialGuaranteeMember2020-12-310000045012hal:TaxExpirationPeriodOneMember2020-12-310000045012hal:TaxExpirationPeriodTwoMember2020-12-310000045012hal:TaxExpirationPeriodThreeMember2020-12-310000045012us-gaap:ForeignCountryMemberhal:DeferredtaxassetsMember2020-01-012020-12-310000045012hal:TaxcreditsMemberus-gaap:ForeignCountryMember2020-01-012020-12-310000045012hal:AllOtherCountriesDomain2020-12-310000045012hal:AllOtherCountriesDomain2019-12-310000045012us-gaap:ForeignPlanMember2020-12-310000045012us-gaap:ForeignPlanMember2019-12-310000045012us-gaap:StockCompensationPlanMember2020-01-012020-12-310000045012us-gaap:StockCompensationPlanMember2019-01-012019-12-310000045012us-gaap:StockCompensationPlanMember2018-01-012018-12-310000045012us-gaap:StockCompensationPlanMember2020-12-310000045012us-gaap:EmployeeStockOptionMembersrt:MinimumMember2020-01-012020-12-310000045012us-gaap:EmployeeStockOptionMember2020-01-012020-12-310000045012us-gaap:EmployeeStockOptionMember2019-12-310000045012us-gaap:EmployeeStockOptionMember2020-12-310000045012us-gaap:EmployeeStockOptionMember2019-01-012019-12-310000045012us-gaap:EmployeeStockOptionMember2018-01-012018-12-310000045012hal:ExerciseofstockoptionsMember2020-01-012020-12-310000045012hal:ExerciseofstockoptionsMember2019-01-012019-12-310000045012hal:ExerciseofstockoptionsMember2018-01-012018-12-310000045012us-gaap:RestrictedStockMember2020-01-012020-12-310000045012hal:RestrictedStockAndRestrictedStockUnitsMember2019-12-310000045012hal:RestrictedStockAndRestrictedStockUnitsMember2020-01-012020-12-310000045012hal:RestrictedStockAndRestrictedStockUnitsMember2020-12-310000045012hal:RestrictedStockAndRestrictedStockUnitsMember2019-01-012019-12-310000045012hal:RestrictedStockAndRestrictedStockUnitsMember2018-01-012018-12-310000045012us-gaap:RestrictedStockMember2020-12-310000045012us-gaap:EmployeeStockMember2020-12-31hal:Offering_Period0000045012us-gaap:EmployeeStockMember2020-01-012020-12-310000045012us-gaap:EmployeeStockMember2019-01-012019-12-310000045012us-gaap:EmployeeStockMember2018-01-012018-12-310000045012srt:MaximumMemberus-gaap:EmployeeStockOptionMember2020-01-012020-12-310000045012us-gaap:EmployeeStockOptionMembersrt:MinimumMember2019-01-012019-12-310000045012srt:MaximumMemberus-gaap:EmployeeStockOptionMember2019-01-012019-12-310000045012us-gaap:EmployeeStockOptionMembersrt:MinimumMember2018-01-012018-12-310000045012srt:MaximumMemberus-gaap:EmployeeStockOptionMember2018-01-012018-12-310000045012us-gaap:EmployeeStockOptionMember2020-01-012020-12-310000045012us-gaap:EmployeeStockOptionMember2019-01-012019-12-310000045012us-gaap:EmployeeStockOptionMember2018-01-012018-12-310000045012us-gaap:EstimateOfFairValueFairValueDisclosureMemberus-gaap:FairValueInputsLevel1Member2020-12-310000045012us-gaap:EstimateOfFairValueFairValueDisclosureMemberus-gaap:FairValueInputsLevel2Member2020-12-310000045012us-gaap:EstimateOfFairValueFairValueDisclosureMember2020-12-310000045012us-gaap:CarryingReportedAmountFairValueDisclosureMember2020-12-310000045012us-gaap:EstimateOfFairValueFairValueDisclosureMemberus-gaap:FairValueInputsLevel1Member2019-12-310000045012us-gaap:EstimateOfFairValueFairValueDisclosureMemberus-gaap:FairValueInputsLevel2Member2019-12-310000045012us-gaap:EstimateOfFairValueFairValueDisclosureMember2019-12-310000045012us-gaap:CarryingReportedAmountFairValueDisclosureMember2019-12-310000045012us-gaap:EstimateOfFairValueFairValueDisclosureMemberus-gaap:FairValueInputsLevel3Member2019-12-310000045012us-gaap:EstimateOfFairValueFairValueDisclosureMemberus-gaap:FairValueInputsLevel3Member2020-12-310000045012us-gaap:ForeignExchangeContractMemberus-gaap:OtherCurrentAssetsMemberus-gaap:FairValueInputsLevel2Member2020-12-310000045012us-gaap:ForeignExchangeContractMemberus-gaap:OtherCurrentAssetsMemberus-gaap:FairValueInputsLevel2Member2019-12-310000045012us-gaap:OtherAssetsMemberus-gaap:ForeignExchangeContractMemberus-gaap:FairValueInputsLevel2Member2020-12-310000045012us-gaap:OtherAssetsMemberus-gaap:ForeignExchangeContractMemberus-gaap:FairValueInputsLevel2Member2019-12-310000045012us-gaap:CashAndCashEquivalentsMemberus-gaap:FairValueInputsLevel1Memberus-gaap:ForeignPlanMember2020-12-310000045012us-gaap:CashAndCashEquivalentsMemberus-gaap:FairValueInputsLevel2Memberus-gaap:ForeignPlanMember2020-12-310000045012us-gaap:CashAndCashEquivalentsMemberus-gaap:FairValueInputsLevel3Memberus-gaap:ForeignPlanMember2020-12-310000045012us-gaap:CashAndCashEquivalentsMemberus-gaap:FairValueMeasuredAtNetAssetValuePerShareMemberus-gaap:ForeignPlanMember2020-12-310000045012us-gaap:CashAndCashEquivalentsMemberus-gaap:ForeignPlanMember2020-12-310000045012us-gaap:EquityFundsMemberus-gaap:FairValueInputsLevel1Memberus-gaap:ForeignPlanMember2020-12-310000045012us-gaap:EquityFundsMemberus-gaap:FairValueInputsLevel2Memberus-gaap:ForeignPlanMember2020-12-310000045012us-gaap:FairValueInputsLevel3Memberus-gaap:EquityFundsMemberus-gaap:ForeignPlanMember2020-12-310000045012us-gaap:EquityFundsMemberus-gaap:FairValueMeasuredAtNetAssetValuePerShareMemberus-gaap:ForeignPlanMember2020-12-310000045012us-gaap:EquityFundsMemberus-gaap:ForeignPlanMember2020-12-310000045012us-gaap:FixedIncomeFundsMemberus-gaap:FairValueInputsLevel1Memberus-gaap:ForeignPlanMember2020-12-310000045012us-gaap:FixedIncomeFundsMemberus-gaap:FairValueInputsLevel2Memberus-gaap:ForeignPlanMember2020-12-310000045012us-gaap:FairValueInputsLevel3Memberus-gaap:FixedIncomeFundsMemberus-gaap:ForeignPlanMember2020-12-310000045012us-gaap:FixedIncomeFundsMemberus-gaap:FairValueMeasuredAtNetAssetValuePerShareMemberus-gaap:ForeignPlanMember2020-12-310000045012us-gaap:FixedIncomeFundsMemberus-gaap:ForeignPlanMember2020-12-310000045012hal:AlternativesfundDomainus-gaap:FairValueInputsLevel1Memberus-gaap:ForeignPlanMember2020-12-310000045012hal:AlternativesfundDomainus-gaap:FairValueInputsLevel2Memberus-gaap:ForeignPlanMember2020-12-310000045012us-gaap:FairValueInputsLevel3Memberhal:AlternativesfundDomainus-gaap:ForeignPlanMember2020-12-310000045012hal:AlternativesfundDomainus-gaap:FairValueMeasuredAtNetAssetValuePerShareMemberus-gaap:ForeignPlanMember2020-12-310000045012hal:AlternativesfundDomainus-gaap:ForeignPlanMember2020-12-310000045012us-gaap:FairValueInputsLevel1Memberus-gaap:RealEstateFundsMemberus-gaap:ForeignPlanMember2020-12-310000045012us-gaap:FairValueInputsLevel2Memberus-gaap:RealEstateFundsMemberus-gaap:ForeignPlanMember2020-12-310000045012us-gaap:FairValueInputsLevel3Memberus-gaap:RealEstateFundsMemberus-gaap:ForeignPlanMember2020-12-310000045012us-gaap:FairValueMeasuredAtNetAssetValuePerShareMemberus-gaap:RealEstateFundsMemberus-gaap:ForeignPlanMember2020-12-310000045012us-gaap:RealEstateFundsMemberus-gaap:ForeignPlanMember2020-12-310000045012hal:OtherAssetMemberus-gaap:FairValueInputsLevel1Memberus-gaap:ForeignPlanMember2020-12-310000045012hal:OtherAssetMemberus-gaap:FairValueInputsLevel2Memberus-gaap:ForeignPlanMember2020-12-310000045012us-gaap:FairValueInputsLevel3Memberhal:OtherAssetMemberus-gaap:ForeignPlanMember2020-12-310000045012hal:OtherAssetMemberus-gaap:FairValueMeasuredAtNetAssetValuePerShareMemberus-gaap:ForeignPlanMember2020-12-310000045012hal:OtherAssetMemberus-gaap:ForeignPlanMember2020-12-310000045012us-gaap:FairValueInputsLevel1Memberus-gaap:ForeignPlanMember2020-12-310000045012us-gaap:FairValueInputsLevel2Memberus-gaap:ForeignPlanMember2020-12-310000045012us-gaap:FairValueInputsLevel3Memberus-gaap:ForeignPlanMember2020-12-310000045012us-gaap:FairValueMeasuredAtNetAssetValuePerShareMemberus-gaap:ForeignPlanMember2020-12-310000045012us-gaap:CashAndCashEquivalentsMemberus-gaap:FairValueInputsLevel1Memberus-gaap:ForeignPlanMember2019-12-310000045012us-gaap:CashAndCashEquivalentsMemberus-gaap:FairValueInputsLevel2Memberus-gaap:ForeignPlanMember2019-12-310000045012us-gaap:CashAndCashEquivalentsMemberus-gaap:FairValueInputsLevel3Memberus-gaap:ForeignPlanMember2019-12-310000045012us-gaap:CashAndCashEquivalentsMemberus-gaap:FairValueMeasuredAtNetAssetValuePerShareMemberus-gaap:ForeignPlanMember2019-12-310000045012us-gaap:CashAndCashEquivalentsMemberus-gaap:ForeignPlanMember2019-12-310000045012us-gaap:EquityFundsMemberus-gaap:FairValueInputsLevel1Memberus-gaap:ForeignPlanMember2019-12-310000045012us-gaap:EquityFundsMemberus-gaap:FairValueInputsLevel2Memberus-gaap:ForeignPlanMember2019-12-310000045012us-gaap:FairValueInputsLevel3Memberus-gaap:EquityFundsMemberus-gaap:ForeignPlanMember2019-12-310000045012us-gaap:EquityFundsMemberus-gaap:FairValueMeasuredAtNetAssetValuePerShareMemberus-gaap:ForeignPlanMember2019-12-310000045012us-gaap:EquityFundsMemberus-gaap:ForeignPlanMember2019-12-310000045012us-gaap:FixedIncomeFundsMemberus-gaap:FairValueInputsLevel1Memberus-gaap:ForeignPlanMember2019-12-310000045012us-gaap:FixedIncomeFundsMemberus-gaap:FairValueInputsLevel2Memberus-gaap:ForeignPlanMember2019-12-310000045012us-gaap:FairValueInputsLevel3Memberus-gaap:FixedIncomeFundsMemberus-gaap:ForeignPlanMember2019-12-310000045012us-gaap:FixedIncomeFundsMemberus-gaap:FairValueMeasuredAtNetAssetValuePerShareMemberus-gaap:ForeignPlanMember2019-12-310000045012us-gaap:FixedIncomeFundsMemberus-gaap:ForeignPlanMember2019-12-310000045012hal:AlternativesfundDomainus-gaap:FairValueInputsLevel1Memberus-gaap:ForeignPlanMember2019-12-310000045012hal:AlternativesfundDomainus-gaap:FairValueInputsLevel2Memberus-gaap:ForeignPlanMember2019-12-310000045012us-gaap:FairValueInputsLevel3Memberhal:AlternativesfundDomainus-gaap:ForeignPlanMember2019-12-310000045012hal:AlternativesfundDomainus-gaap:FairValueMeasuredAtNetAssetValuePerShareMemberus-gaap:ForeignPlanMember2019-12-310000045012hal:AlternativesfundDomainus-gaap:ForeignPlanMember2019-12-310000045012us-gaap:FairValueInputsLevel1Memberus-gaap:RealEstateFundsMemberus-gaap:ForeignPlanMember2019-12-310000045012us-gaap:FairValueInputsLevel2Memberus-gaap:RealEstateFundsMemberus-gaap:ForeignPlanMember2019-12-310000045012us-gaap:FairValueInputsLevel3Memberus-gaap:RealEstateFundsMemberus-gaap:ForeignPlanMember2019-12-310000045012us-gaap:FairValueMeasuredAtNetAssetValuePerShareMemberus-gaap:RealEstateFundsMemberus-gaap:ForeignPlanMember2019-12-310000045012us-gaap:RealEstateFundsMemberus-gaap:ForeignPlanMember2019-12-310000045012hal:OtherAssetMemberus-gaap:FairValueInputsLevel1Memberus-gaap:ForeignPlanMember2019-12-310000045012hal:OtherAssetMemberus-gaap:FairValueInputsLevel2Memberus-gaap:ForeignPlanMember2019-12-310000045012us-gaap:FairValueInputsLevel3Memberhal:OtherAssetMemberus-gaap:ForeignPlanMember2019-12-310000045012hal:OtherAssetMemberus-gaap:FairValueMeasuredAtNetAssetValuePerShareMemberus-gaap:ForeignPlanMember2019-12-310000045012hal:OtherAssetMemberus-gaap:ForeignPlanMember2019-12-310000045012us-gaap:FairValueInputsLevel1Memberus-gaap:ForeignPlanMember2019-12-310000045012us-gaap:FairValueInputsLevel2Memberus-gaap:ForeignPlanMember2019-12-310000045012us-gaap:FairValueInputsLevel3Memberus-gaap:ForeignPlanMember2019-12-310000045012us-gaap:FairValueMeasuredAtNetAssetValuePerShareMemberus-gaap:ForeignPlanMember2019-12-310000045012hal:UnitedKingdomPensionPlanMember2020-12-310000045012us-gaap:ForeignPlanMember2020-01-012020-12-310000045012us-gaap:ForeignPlanMember2019-01-012019-12-310000045012us-gaap:ForeignPlanMember2018-01-012018-12-31
UNITED STATES SECURITIES AND EXCHANGE COMMISSION
Washington, D.C. 20549
FORM 10-K
(Mark One)
| | | | | |
| ☒ | Annual Report Pursuant to Section 13 or 15(d) of the Securities Exchange Act of 1934 |
For the fiscal year ended December 31, 2020
OR
| | | | | |
☐ | Transition Report Pursuant to Section 13 or 15(d) of the Securities Exchange Act of 1934
For the transition period from ______ to ______ |
Commission File Number 001-03492
HALLIBURTON COMPANY
(Exact name of registrant as specified in its charter)
| | | | | |
| Delaware | 75-2677995 |
| (State or other jurisdiction of | (I.R.S. Employer |
| incorporation or organization) | Identification No.) |
3000 North Sam Houston Parkway East
Houston, Texas 77032
(Address of Principal Executive Offices)
Telephone Number – Area Code (281) 871-2699
| | | | | | | | |
| Securities registered pursuant to Section 12(b) of the Act: |
| | |
| Title of each class | Trading Symbol | Name of each exchange on which registered |
| Common Stock, par value $2.50 per share | HAL | New York Stock Exchange |
| | |
| Securities registered pursuant to Section 12(g) of the Act: None |
Indicate by check mark if the registrant is a well-known seasoned issuer, as defined in Rule 405 of the Securities Act.
Indicate by check mark if the registrant is not required to file reports pursuant to Section 13 or Section 15(d) of the Act.
Indicate by check mark whether the registrant (1) has filed all reports required to be filed by Section 13 or 15(d) of the Securities Exchange Act of 1934 during the preceding 12 months (or for such shorter period that the registrant was required to file such reports), and (2) has been subject to such filing requirements for the past 90 days.
Indicate by check mark whether the registrant has submitted electronically every Interactive Data File required to be submitted pursuant to Rule 405 of Regulation S-T (§ 232.405 of this chapter) during the preceding 12 months (or for such shorter period that the registrant was required to submit such files).
Indicate by check mark whether the registrant is a large accelerated filer, an accelerated filer, a non-accelerated filer, a smaller reporting company, or an emerging growth company. See the definitions of “large accelerated filer,” “accelerated filer,” “smaller reporting company,” and "emerging growth company" in Rule 12b-2 of the Exchange Act.
| | | | | | | | | | | | | | |
| | Large Accelerated Filer | ☒ | Accelerated Filer | ☐ |
| | Non-accelerated Filer | ☐ | Emerging Growth Company | ☐ |
| Smaller Reporting Company | ☐ | | |
Indicate by check mark whether the registrant has filed a report on and attestation to its management's assessment of the effectiveness of its internal control over financial reporting under Section 404(b) of the Sarbanes-Oxley Act (15 U.S.C. 7262(b)) by the registered public accounting firm that prepared or issued its audit report. ☒
Indicate by check mark whether the registrant is a shell company (as defined in Rule 12b-2 of the Exchange Act).
The aggregate market value of Halliburton Company Common Stock held by non-affiliates on June 30, 2020, determined using the per share closing price on the New York Stock Exchange Composite tape of $12.98 on that date, was approximately $10.1 billion.
As of January 29, 2021, there were 888,632,775 shares of Halliburton Company Common Stock, $2.50 par value per share, outstanding.
Portions of the Halliburton Company Proxy Statement for our 2021 Annual Meeting of Shareholders (File No. 001-03492) are incorporated by reference into Part III of this report.
HALLIBURTON COMPANY
Index to Form 10-K
For the Year Ended December 31, 2020
| | | | | | | | |
| PART I | | PAGE |
| | |
| | |
| | |
| | |
| | |
| | |
| | |
| PART II | | |
| | |
| | |
| | |
| | |
| | |
| | |
| | |
| | |
| | |
| | |
| | |
| | |
| | |
| | |
| | |
| | |
| | |
| | |
| | |
| | |
| | |
| | |
| | |
| | |
| | |
| | |
| | |
| |
| |
| |
| |
| | |
| PART III | | |
| | |
| | |
| | |
| | |
| | |
| | |
| | |
| | |
| | |
| PART IV | | |
| | |
| Item 16. | Form 10-K Summary | |
| | |
| SIGNATURES | | |
PART I
Item 1. Business.
Description of business
Halliburton Company is one of the world's largest providers of products and services to the energy industry. Its predecessor was established in 1919 and incorporated under the laws of the State of Delaware in 1924. Inspired by the past and leading into the future, what started with a single product from a single location is now a global enterprise. We are proud of our over 100 years of operation, innovation, collaboration, and execution. Halliburton has fostered a culture of unparalleled service to the world's major, national, and independent oil and gas producers. With approximately 40,000 employees, representing 130 nationalities in more than 70 countries, we help our customers maximize asset value throughout the lifecycle of the reservoir - from locating hydrocarbons and managing geological data, to drilling and formation evaluation, well construction and completion, and optimizing production throughout the life of the asset.
2020 Highlights
- Safety and service quality: We achieved exceptional safety and service quality performance. We delivered historic bests across our business. Our total recordable incident rate and non-productive time improved by over 20% for the second year in a row. This is a result of our employees’ continued commitment to safety and process execution.
- Financial: We delivered swift and aggressive cost reduction actions in response to a decrease in global demand for our products and services. We systematically rationalized our operations to adjust to market activity levels, including through reducing equipment and personnel, restructuring our real estate holdings, and improving our service delivery platform, which contributed to improved margins by year-end 2020.
- Technology: We continued to innovate, launching several new products and services, and delivered best in class performance across a spectrum of digital technologies.
- Sustainable energy: We launched Halliburton Labs, a collaborative environment where entrepreneurs, academics, investors, and industrial labs come together to advance cleaner, affordable energy. Also, we committed to setting science-based targets to reduce our greenhouse gas emissions.
2021 Focus
- International: We are stronger technically, geographically, and organizationally; we see an unfolding activity recovery and are well positioned to drive profitable growth internationally.
- North America: As operators increase their activity levels to achieve maintenance level production, the operating leverage we have created in North America should allow us to increase our operating profits and cash flows.
- Digital: We are positioned to accelerate the deployment and integration of digitally enabled technologies, both internally and for our customers.
- Capital efficiency: We plan to advance technologies and make strategic choices that lower our capital expenditure profile.
- Sustainable energy: We will play an active role in advancing cleaner, affordable energy solutions.
Operating segments
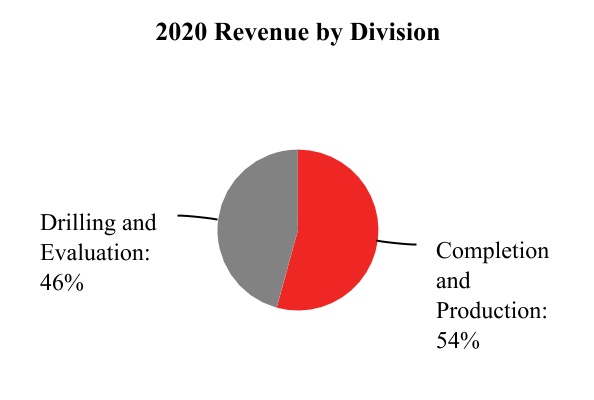
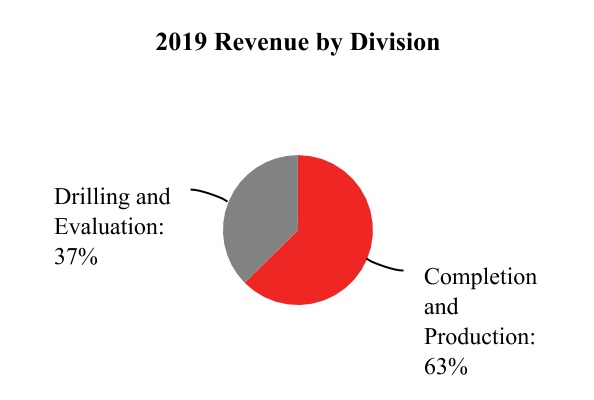
We operate under two divisions, which form the basis for the two operating segments we report, the Completion and Production segment and the Drilling and Evaluation segment.
Completion and Production delivers cementing, stimulation, intervention, pressure control, artificial lift, and completion products and services. The segment consists of the following product service lines:
- Production Enhancement: includes stimulation services and sand control services. Stimulation services optimize oil and natural gas reservoir production through a variety of pressure pumping services, and chemical processes, commonly known as hydraulic fracturing and acidizing. Sand control services include fluid and chemical systems for the prevention of formation sand production.
- Cementing: involves bonding the well and well casing while isolating fluid zones and maximizing wellbore stability. Our cementing product service line also provides casing equipment.
- Completion Tools: provides downhole solutions and services to our customers to complete their wells, including well completion products and services, intelligent well completions, liner hanger systems, sand control systems, multilateral systems, and service tools.
- Production Solutions: provides customized well intervention solutions to increase well performance, which includes coiled tubing, hydraulic workover units, downhole tools, pumping services, and nitrogen services.
- Artificial Lift: provides services to maximize reservoir and wellbore recovery by applying lifting technology, intelligent field management solutions, and related services throughout the life of the well, including electrical submersible pumps.
- Pipeline & Process Services: provides a complete range of pre-commissioning, commissioning, maintenance, and decommissioning services to the onshore and offshore pipeline and process plant construction commissioning and maintenance industries. We have made a strategic decision to market this business for sale.
Drilling and Evaluation provides field and reservoir modeling, drilling, fluids and specialty chemicals, evaluation and precise wellbore placement solutions that enable customers to model, measure, drill, and optimize their well construction activities. The segment consists of the following product service lines:
- Baroid: provides drilling fluid systems, performance additives, completion fluids, solids control, specialized testing equipment, and waste management services for oil and natural gas drilling, completion, and workover operations. It also provides customized specialty oilfield completion, production, and downstream water and process treatment chemicals and services.
- Sperry Drilling: provides drilling systems and services that offer directional control for precise wellbore placement while providing important measurements about the characteristics of the drill string and geological formations while drilling wells. These services include directional and horizontal drilling, measurement-while-drilling, logging-while-drilling, surface data logging, and rig site information systems.
- Wireline and Perforating: provides open-hole logging services that supply information on formation evaluation and reservoir fluid analysis, including formation lithology, rock properties, and reservoir fluid properties. Also offered are cased-hole and slickline services, including perforating, pipe recovery services, through-casing formation evaluation and reservoir monitoring, casing and cement integrity measurements, and well intervention services.
- Drill Bits and Services: provides roller cone rock bits, fixed cutter bits, hole enlargement and related downhole tools and services used in drilling oil and natural gas wells. In addition, coring equipment and services are provided to acquire cores of the formation drilled for evaluation.
- Landmark Software and Services: provides cloud based digital services and artificial intelligence solutions on an open architecture for subsurface insights, integrated well construction, and reservoir and production management for the upstream oil and natural gas industry.
- Testing and Subsea: provides acquisition and analysis of dynamic reservoir information and reservoir optimization solutions to the oil and natural gas industry through a broad portfolio of test tools, data acquisition services, fluid sampling, surface well testing, subsea safety systems, and underbalanced applications.
- Halliburton Project Management: provides integrated solutions to our customers by leveraging the full line of our oilfield services, products, and technologies to solve customer challenges throughout the oilfield lifecycle, including project management and integrated asset management.
The following charts depict the company's revenue split between its two operating segments for the years ended December 31, 2020 and 2019.
See Note 3 to the consolidated financial statements for further financial information related to each of our business segments.
Business strategy
Our value proposition is to collaborate and engineer solutions to maximize asset value for our customers. We strive to achieve strong cash flows and returns for our shareholders by delivering technology and services that improve efficiency, increase recovery, and maximize production for our customers. Our strategic priorities are to:
- deliver profitable growth in our international business;
- drive strategic changes that maximize cash flows in our leaner North America business;
- accelerate the deployment and integration of our digital technologies, both internally and with our customers;
- improve capital efficiency by advancing our technologies and making strategic choices that lower our capital expenditure profile; and
- actively participate in advancing a sustainable energy future.
For further discussion on our business strategies, see "Item 7. Management’s Discussion and Analysis of Financial Condition and Results of Operations – Executive Overview."
Markets and competition
We are one of the world’s largest diversified energy services companies. Our services and products are sold in highly competitive markets throughout the world. Competitive factors impacting sales of our services and products include: price; service delivery; health, safety and environmental standards and practices; service quality; global talent retention; understanding the geological characteristics of the hydrocarbon reservoir; product quality; warranty; and technical proficiency.
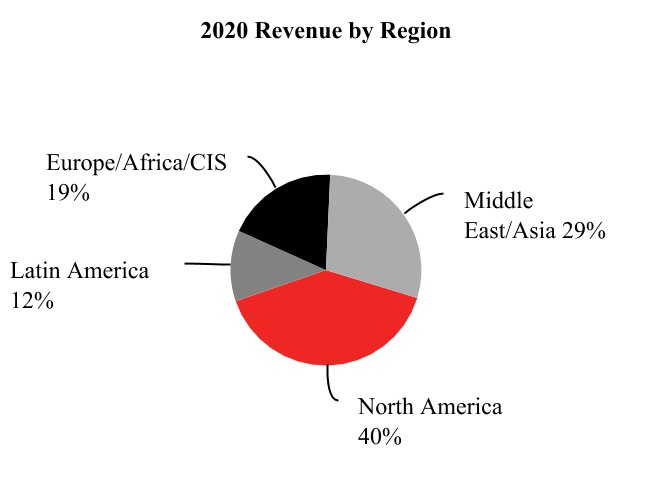
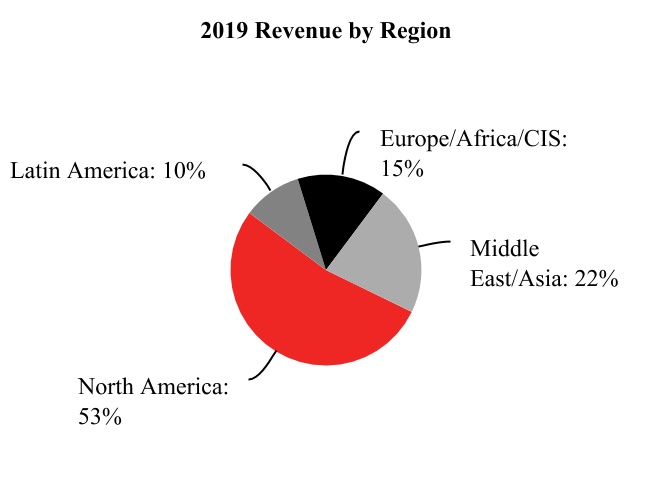
We conduct business worldwide in more than 70 countries. The business operations of our divisions are organized around four primary geographic regions: North America, Latin America, Europe/Africa/CIS, and Middle East/Asia. In 2020, 2019, and 2018, based on the location of services provided and products sold, 38%, 51%, and 58%, respectively, of our consolidated revenue was from the United States. No other country accounted for more than 10% of our consolidated revenue during these periods. See "Item 7. Management’s Discussion and Analysis of Financial Condition and Results of Operations” for additional information about our geographic operations. Because the markets for our services and products are vast and cross numerous geographic lines, it is not practicable to provide a meaningful estimate of the total number of our competitors. The industries we serve are highly competitive, and we have many substantial competitors. Most of our services and products are marketed through our service and sales organizations.
The following charts depict the company's revenue split between its four primary geographic regions for the years ended December 31, 2020 and 2019.
Operations in some countries may be adversely affected by unsettled political conditions, acts of terrorism, civil unrest, force majeure, war or other armed conflict, health or similar issues, sanctions, expropriation or other governmental actions, inflation, changes in foreign currency exchange rates, foreign currency exchange restrictions and highly inflationary currencies, as well as other geopolitical factors. We believe the geographic diversification of our business activities reduces the risk that loss of operations in any one country, other than the United States, would be materially adverse to our business, consolidated results of operations, or consolidated financial condition.
Information regarding our exposure to foreign currency fluctuations, risk concentration and financial instruments used to minimize risk is included in "Item 7. Management’s Discussion and Analysis of Financial Condition and Results of Operations – Financial Instrument Market Risk” and in Note 15 to the consolidated financial statements.
Customers
Our revenue during the past three years was derived from the sale of services and products to the energy industry. No single customer represented more than 10% of our consolidated revenue in any period presented.
Raw materials
Raw materials essential to our business are normally readily available. Market conditions can trigger constraints in the supply of certain raw materials, such as proppants (primarily sand), hydrochloric acid, and gels. We are always seeking ways to ensure the availability of resources and manage raw materials costs. Our procurement department uses our size and buying power to enhance our access to key materials at competitive prices.
Patents
We own a large number of patents and have pending a substantial number of patent applications covering various products and processes. We are also licensed to utilize technology covered by patents owned by others, and we license others to utilize technology covered by our patents. We do not consider any particular patent to be material to our business operations.
Seasonality
Weather and natural phenomena can temporarily affect the performance of our services, but the widespread geographical locations of our operations mitigate those effects. Examples of how weather can impact our business include:
- the severity and duration of the winter in North America can have a significant impact on natural gas storage levels and drilling activity;
- the timing and duration of the spring thaw in Canada directly affects activity levels due to road restrictions;
- typhoons and hurricanes can disrupt coastal and offshore operations; and
- severe weather during the winter normally results in reduced activity levels in the North Sea and Russia.
Additionally, customer spending patterns for completion tools typically result in higher activity in the fourth quarter of the year. Conversely, customer spending patterns and budget constraints in North America may lead to lower demand for various other services and products in the second half of the year.
Our workforce
We collaborate as a team to execute for each other, our customers, and our shareholders. At December 31, 2020, we employed approximately 40,000 people worldwide compared to approximately 55,000 at December 31, 2019. At December 31, 2020, approximately 17% of our employees were subject to collective bargaining agreements. We have operations in over 70 countries. Based upon the geographic diversification of these employees, we do not believe any risk of loss from employee strikes or other collective actions would be material to the conduct of our operations taken as a whole.
Diversity, inclusion and career development
The diversity of our global workforce stimulates creativity and innovation as we use our collective talents to develop unique solutions to address the world's energy challenges. We create a positive work environment by maintaining a strong culture of diversity and inclusion, supported by our Code of Business Conduct and employment practices. We remain one of the most diverse companies in the world with over 130 nationalities represented, with a focus on having a local workforce in the countries in which we do business.
We have made significant progress on increasing our gender diversity in our science, technology, engineering, and mathematics (STEM) focused job roles, which are pipelines for operational leadership. The total population of women in STEM-based roles is 15% today. We have doubled our hiring of women in STEM-based job roles over the last ten years and intend to continue this effort.
We are committed to providing an inclusive workplace and career development opportunities to attract and retain talented employees. An important key to having engaged employees is offering best-in-class training and career development programs to enhance opportunities for professional growth. We manage employee performance and engagement through frequent Check-ins between employees and managers. These discussions focus on status of work, priorities, performance, feedback, and development. All employees are part of the Check-in process, which is the cornerstone of our performance management and career development framework. For employees who have been identified as having top leadership potential, Halliburton offers a four-tiered Business Leadership Development program designed to provide additional skills, knowledge, and experience.
Compensation, benefits and well-being
Halliburton’s compensation programs are integrated with our overall business strategies and management processes to incentivize performance, maximize returns, and build shareholder value. We work with consultants to benchmark our compensation and benefits programs to help us offer competitive remuneration packages to attract and retain high-performing executives. We also offer comprehensive benefits and competitive salaries to attract qualified candidates to meet the dynamic needs of employees and their families, in addition to retirement plans and health and wellness benefits.
Safety
Our safety vision expresses our dedication to setting the highest standards, embracing all challenges, and making no compromises in fulfilling our commitment to our employees to get them home safely at the end of the day. For the years ended December 31, 2020 and December 31, 2019, our recordable incident rate was 0.20% and 0.29%, respectively, and non-productive time was 0.31% and 0.39%, respectively.
Government regulation
We are subject to numerous environmental, legal, and regulatory requirements related to our operations worldwide. For further information related to environmental matters and regulation, see Note 10 to the consolidated financial statements and "Item 1(a). Risk Factors.”
Hydraulic fracturing
Hydraulic fracturing is a process that creates fractures extending from the well bore into the rock formation to enable natural gas or oil to move more easily from the rock pores to a production conduit. A significant portion of our Completion and Production segment provides hydraulic fracturing services to customers developing shale natural gas and shale oil. From time to time, questions arise about the scope of our operations in the shale natural gas and shale oil sectors, and the extent to which these operations may affect human health and the environment.
At the direction of our customer, we design and generally implement a hydraulic fracturing operation to 'stimulate' the well's production, once the well has been drilled, cased, and cemented. Our customer is generally responsible for providing the base fluid (usually water) used in the hydraulic fracturing of a well. We frequently supply the proppant (primarily sand) and at least a portion of the additives used in the overall fracturing fluid mixture. In addition, we mix the additives and proppant with the base fluid and pump the mixture down the wellbore to create the desired fractures in the target formation. The customer is responsible for disposing and/or recycling for further use any materials that are subsequently produced or pumped out of the well, including flowback fluids and produced water.
As part of the process of constructing the well, the customer will take a number of steps designed to protect drinking water resources. In particular, the casing and cementing of the well are designed to provide 'zonal isolation' so that the fluids pumped down the wellbore and the oil and natural gas and other materials that are subsequently pumped out of the well will not come into contact with shallow aquifers or other shallow formations through which those materials could potentially migrate to freshwater aquifers or the surface.
The potential environmental impacts of hydraulic fracturing have been studied by numerous government entities and others. In 2004, the United States Environmental Protection Agency (EPA) conducted an extensive study of hydraulic fracturing practices, focusing on coalbed methane wells, and their potential effect on underground sources of drinking water. The EPA’s study concluded that hydraulic fracturing of coalbed methane wells poses little or no threat to underground sources of drinking water. In December 2016, the EPA released a final report, “Hydraulic Fracturing for Oil and Gas: Impacts from the Hydraulic Fracturing Water Cycle on Drinking Water Resources in the United States” representing the culmination of a six-year study requested by Congress. While the EPA report noted a potential for some impact to drinking water sources caused by hydraulic fracturing, the agency confirmed the overall incidence of impacts is low. Moreover, a number of the areas of potential impact identified in the report involve activities for which we are not generally responsible, such as potential impacts associated with withdrawals of surface water for use as a base fluid and management of wastewater.
We have proactively developed processes to provide our customers with the chemical constituents of our hydraulic fracturing fluids to enable our customers to comply with state laws as well as voluntary standards established by the Chemical Disclosure Registry, www.fracfocus.org. We have invested considerable resources in developing hydraulic fracturing technologies, in both the equipment and chemistry portions of our business, which offer our customers a variety of environment-friendly options related to the use of hydraulic fracturing fluid additives and other aspects of our hydraulic fracturing operations. We created a hydraulic fracturing fluid system comprised of materials sourced entirely from the food industry. In addition, we have engineered a process that uses ultraviolet light to control the growth of bacteria in hydraulic fracturing fluids, allowing customers to minimize the use of chemical biocides. We are committed to the continued development of innovative chemical and mechanical technologies that allow for more economical and environment-friendly development of the world’s oil and natural gas reserves, and that reduce noise while complying with Tier 4 lower emission legislation.
In evaluating any environmental risks that may be associated with our hydraulic fracturing services, it is helpful to understand the role that we play in the development of shale natural gas and shale oil. Our principal task generally is to manage the process of injecting fracturing fluids into the borehole to 'stimulate' the well. Thus, based on the provisions in our contracts and applicable law, the primary environmental risks we face are potential pre-injection spills or releases of stored fracturing fluids and potential spills or releases of fuel or other fluids associated with pumps, blenders, conveyors, or other above-ground equipment used in the hydraulic fracturing process.
Although possible concerns have been raised about hydraulic fracturing, the circumstances described above have helped to mitigate those concerns. To date, we have not been obligated to compensate any indemnified party for any environmental liability arising directly from hydraulic fracturing, although there can be no assurance that such obligations or liabilities will not arise in the future. For further information on risks related to hydraulic fracturing, see "Item 1(a). Risk Factors.”
Working capital
We fund our business operations through a combination of available cash and equivalents, short-term investments, and cash flow generated from operations. In addition, our revolving credit facility is available for additional working capital needs.
Web site access - www.halliburton.com
Our annual reports on Form 10-K, quarterly reports on Form 10-Q, current reports on Form 8-K and amendments to those reports filed or furnished to the Securities and Exchange Commission (SEC) pursuant to Section 13(a) or 15(d) of the Securities Exchange Act of 1934 are available at www.halliburton.com soon thereafter. The SEC website www.sec.gov contains our reports, proxy and information statements and our other SEC filings. Our Code of Business Conduct, which applies to all our employees and Directors and serves as a code of ethics for our principal executive officer, principal financial officer, principal accounting officer, and other persons performing similar functions, can be found at www.halliburton.com. Any amendments to our Code of Business Conduct or any waivers from provisions of our Code of Business Conduct granted to the specified officers above are also disclosed on our web site within four business days after the date of any amendment or waiver pertaining to these officers. There have been no waivers from provisions of our Code of Business Conduct for the years 2020, 2019, or 2018. Except to the extent expressly stated otherwise, information contained on or accessible from our web site or any other web site is not incorporated by reference into this annual report on Form 10-K and should not be considered part of this report.
Executive Officers of the Registrant
The following table indicates the names and ages of the executive officers of Halliburton Company as of February 5, 2021, including all offices and positions held by each in the past five years:
| | | | | | | | |
| Name and Age | Offices Held and Term of Office |
| Anne L. Beaty
(Age 64) | Senior Vice President, Finance of Halliburton Company, since March 2017 |
| Senior Vice President, Internal Assurance Services of Halliburton Company, November 2013 to March 2017 |
| | |
| Van H. Beckwith
(Age 55) | Executive Vice President, Secretary and Chief Legal Officer of Halliburton Company, since December 2020 |
| | Senior Vice President and General Counsel, January 2020 to December 2020 |
| | Partner, Baker Botts L.L.P., January 1999 to December 2019 |
| | | | | | | | |
| Eric J. Carre
(Age 54) | Executive Vice President, Global Business Lines of Halliburton Company, since May 2016 |
| Senior Vice President, Drilling and Evaluation Division of Halliburton Company, June 2011 to April 2016 |
| | |
| Charles E. Geer, Jr.
(Age 50) | Senior Vice President and Chief Accounting Officer of Halliburton Company, since December 2019 |
| Vice President and Corporate Controller of Halliburton Company, January 2015 to December 2019 |
| | |
| Myrtle L. Jones
(Age 61) | Senior Vice President, Tax of Halliburton Company, since March 2013 |
| | |
| Lance Loeffler
(Age 43) | Executive Vice President and Chief Financial Officer of Halliburton Company, since November 2018 |
| Vice President of Investor Relations of Halliburton Company, April 2016 to November 2018 |
| | Vice President of Corporate Development of Halliburton Company, August 2014 to April 2016 |
| | |
| Timothy M. McKeon
(Age 48) | Vice President and Treasurer of Halliburton Company, since January 2014 |
| | |
| Jeffrey A. Miller
(Age 57) | Chairman of the Board, President and Chief Executive Officer of Halliburton Company, since January 2019 |
| Member of the Board of Directors, President and Chief Executive Officer of Halliburton Company, June 2017 to December 2018 |
| | Member of the Board of Directors and President of Halliburton Company, August 2014 to May 2017 |
| | |
| Lawrence J. Pope
(Age 52) | Executive Vice President of Administration and Chief Human Resources Officer of Halliburton Company, since January 2008 |
| | |
| Joe D. Rainey
(Age 64) | President, Eastern Hemisphere of Halliburton Company, since January 2011 |
| | |
| Mark J. Richard
(Age 59) | President, Western Hemisphere of Halliburton Company, since February 2019 |
| Senior Vice President, Northern U.S. Region of Halliburton Company, August 2018 to January 2019 |
| | Senior Vice President, Business Development and Marketing of Halliburton Company, November 2015 to July 2018 |
There are no family relationships between the executive officers of the registrant or between any director and any executive officer of the registrant.
Item 1(a). Risk Factors.
When considering an investment in Halliburton Company, all of the risk factors described below and other information included and incorporated by reference in this annual report should be carefully considered. Any of these risk factors could have a significant or material adverse effect on our business, results of operations, financial condition, or cash flows. Additional risks and uncertainties not currently known to us or that we currently deem immaterial may also adversely affect our business, financial condition, results of operations, or cash flows.
Industry Environment Related
Trends in oil and natural gas prices affect the level of exploration, development, and production activity of our customers and the demand for our services and products, which could have a material adverse effect on our business, consolidated results of operations, and consolidated financial condition.
Demand for our services and products is particularly sensitive to the level of exploration, development and production activity of, and the corresponding capital spending by, oil and natural gas companies. The level of exploration, development, and production activity is directly affected by trends in oil and natural gas prices, which historically have been volatile and are likely to continue to be volatile. Prices for oil and natural gas are subject to large fluctuations in response to relatively minor changes in the supply of and demand for oil and natural gas, market uncertainty, and a variety of other economic factors that are beyond our control. Given the long-term nature of many large-scale development projects, even the perception of longer-term lower oil and natural gas prices by oil and natural gas companies can cause them to reduce or defer major expenditures. Any prolonged reductions of commodity prices or expectations of such reductions could have a material adverse effect on our business, consolidated results of operations, and consolidated financial condition, and could result in asset impairments and severance costs.
Factors affecting the prices of oil and natural gas include:
- the level of supply and demand for oil and natural gas;
- the ability or willingness of the Organization of Petroleum Exporting Countries and the expanded alliance collectively known as OPEC+ to set and maintain oil production levels;
- the level of oil production in the U.S. and by other non-OPEC+ countries;
- oil refining capacity and shifts in end-customer preferences toward fuel efficiency and the use of natural gas;
- the cost of, and constraints associated with, producing and delivering oil and natural gas;
- governmental regulations, including the policies of governments regarding the exploration for and production and development of their oil and natural gas reserves;
- weather conditions, natural disasters, and health or similar issues, such as pandemics or epidemics;
- worldwide political, military, and economic conditions; and
- increased demand for alternative energy and electric vehicles, including government initiatives to promote the use of renewable energy sources and public sentiment around alternatives to oil and gas.
Our business is dependent on capital spending by our customers, and reductions in capital spending could have a material adverse effect on our business, consolidated results of operations, and consolidated financial condition.
Our business is directly affected by changes in capital expenditures by our customers, and reductions in their capital spending could reduce demand for our services and products and have a material adverse effect on our business, consolidated results of operations, and consolidated financial condition. Some of the items that may impact our customer's capital spending include:
- oil and natural gas prices, including volatility of oil and natural gas prices and expectations regarding future prices;
- the inability of our customers to access capital on economically advantageous terms, which may be impacted by, among other things, a decrease of investors' interest in hydrocarbon producers because of environmental and sustainability initiatives;
- changes in customers' capital allocation, leading to less focus on production growth;
- restrictions on our customers' ability to get their produced oil and natural gas to market due to infrastructure limitations;
- the consolidation of our customers;
- customer personnel changes; and
- adverse developments in the business or operations of our customers, including write-downs of oil and natural gas reserves and borrowing base reductions under customers' credit facilities.
Any significant reduction in commodity prices or a change in our customers’ expectations of commodity prices, economic growth or supply and demand for oil and natural gas may result in capital budget reductions in the future. Any substantial and unexpected drop in commodity prices in the future, even if the drop is relatively short-lived, could similarly
affect our customers’ expectations and capital spending, which could result in a material adverse effect on our business, consolidated results of operations, and consolidated financial condition.
Liabilities arising out of our products and services could have a material adverse effect on our business, consolidated results of operations, and consolidated financial condition.
Events can occur at sites where our products and equipment are installed or where we conduct our operations or provide our services, or at chemical blending or manufacturing facilities, including well blowouts and equipment or materials failures, which could result in explosions, fires, personal injuries, property damage (including surface and subsurface damage), pollution, and potential legal responsibility. For example, a well where we provided services in Indonesian waters experienced a well control issue in July 2019, which resulted in hydrocarbons being released into the water surrounding the well site. Generally, we rely on liability insurance coverage and on contractual indemnities, releases and limitations of liability with our customers to protect us from potential liability related to such occurrences, and, although no claim has been asserted against us, we expect to rely on these with respect to the event in Indonesia. However, we do not have these contractual provisions in all contracts, and even where we do, it is possible that the respective customer or insurer could seek to avoid or be financially unable to meet its obligations, or a court may decline to enforce such provisions. Damages that are not indemnified or released could greatly exceed available insurance coverage and could have a material adverse effect on our business, consolidated results of operations, and consolidated financial condition.
Our business could be materially and adversely affected by severe or unseasonable weather where we have operations.
Our business could be materially and adversely affected by severe weather, particularly in Canada, the Gulf of Mexico, Russia and the North Sea. Many experts believe global climate change could increase the frequency and severity of extreme weather conditions. Repercussions of severe or unseasonable weather conditions may include:
- evacuation of personnel and curtailment of services;
- weather-related damage to offshore drilling rigs resulting in suspension of operations;
- weather-related damage to our facilities and project work sites;
- inability to deliver materials to jobsites in accordance with contract schedules;
- decreases in demand for oil and natural gas during unseasonably warm winters; and
- loss of productivity.
Our failure to protect our proprietary information and any successful intellectual property challenges or infringement proceedings against us could materially and adversely affect our competitive position.
We rely on a variety of intellectual property rights that we use in our services and products. We may not be able to successfully preserve these intellectual property rights in the future, and these rights could be invalidated, circumvented, or challenged. In addition, the laws of some foreign countries in which our services and products may be sold do not protect intellectual property rights to the same extent as the laws of the United States. Our failure to protect our proprietary information and any successful intellectual property challenges or infringement proceedings against us could materially and adversely affect our competitive position.
If we are not able to design, develop and produce commercially competitive products and to implement commercially competitive services in a timely manner in response to changes in the market, customer requirements, competitive pressures, and technology trends, our business and consolidated results of operations could be materially and adversely affected, and the value of our intellectual property may be reduced.
The market for our services and products is characterized by continual technological developments to provide better and more reliable performance and services. If we are not able to design, develop, and produce commercially competitive products and to implement commercially competitive services in a timely manner in response to changes in the market, customer requirements, competitive pressures, and technology trends, our business and consolidated results of operations could be materially and adversely affected, and the value of our intellectual property may be reduced. Likewise, if our proprietary technologies, equipment, facilities, or work processes become obsolete, we may no longer be competitive, and our business and consolidated results of operations could be materially and adversely affected.
We sometimes provide integrated project management services in the form of long-term, fixed price contracts that may require us to assume additional risks associated with cost over-runs, operating cost inflation, labor availability and productivity, supplier and contractor pricing and performance, and potential claims for liquidated damages.
We sometimes provide integrated project management services outside our normal discrete business in the form of long-term, fixed price contracts. Some of these contracts are required by our customers, primarily national oil companies (NOCs). These services include acting as project managers as well as service providers and may require us to assume additional risks associated with cost over-runs. These customers may provide us with inaccurate information in relation to their reserves,
which is a subjective process that involves location and volume estimation, that may result in cost over-runs, delays, and project losses. In addition, NOCs often operate in countries with unsettled political conditions, war, civil unrest, or other types of community issues. These issues may also result in cost over-runs, delays, and project losses.
Providing services on an integrated basis may also require us to assume additional risks associated with operating cost inflation, labor availability and productivity, supplier pricing and performance, and potential claims for liquidated damages. We rely on third-party subcontractors and equipment providers to assist us with the completion of these types of contracts. To the extent that we cannot engage subcontractors or acquire equipment or materials in a timely manner and on reasonable terms, our ability to complete a project in accordance with stated deadlines or at a profit may be impaired. If the amount we are required to pay for these goods and services exceeds the amount we have estimated in bidding for fixed-price work, we could experience losses in the performance of these contracts. These delays and additional costs may be substantial, and we may be required to compensate our customers for these delays. This may reduce the profit to be realized or result in a loss on a project.
Constraints in the supply of, prices for and availability of transportation of raw materials can have a material adverse effect on our business and consolidated results of operations.
Raw materials essential to our business, such as proppants (primarily sand), hydrochloric acid, and gels, including guar gum, are normally readily available. Shortage of raw materials as a result of high levels of demand or loss of suppliers during market challenges can trigger constraints in the supply chain of those raw materials, particularly where we have a relationship with a single supplier for a particular resource. Many of the raw materials essential to our business require the use of rail, storage, and trucking services to transport the materials to our jobsites. These services, particularly during times of high demand, may cause delays in the arrival of or otherwise constrain our supply of raw materials. These constraints could have a material adverse effect on our business and consolidated results of operations. In addition, price increases imposed by our vendors for raw materials used in our business and the inability to pass these increases through to our customers could have a material adverse effect on our business and consolidated results of operations.
Our ability to operate and our growth potential could be materially and adversely affected if we cannot attract, employ, and retain technical personnel at a competitive cost.
Many of the services that we provide and the products that we sell are complex and highly engineered and often must perform or be performed in harsh conditions. We believe that our success depends upon our ability to attract, employ, and retain technical personnel with the ability to design, utilize, and enhance these services and products. A significant increase in the wages paid by competing employers could result in a reduction of our skilled labor force, increases in the wage rates that we must pay, or both. If either of these events were to occur, our cost structure could increase, our margins could decrease, and any growth potential could be impaired.
Laws and Regulations Related
Our operations outside the United States require us to comply with a number of United States and international regulations, violations of which could have a material adverse effect on our business, consolidated results of operations, and consolidated financial condition.
Our operations outside the United States require us to comply with a number of United States and international regulations. For example, our operations in countries outside the United States are subject to the United States Foreign Corrupt Practices Act (FCPA), which prohibits United States companies and their agents and employees from providing anything of value to a foreign official for the purposes of influencing any act or decision of these individuals in their official capacity to help obtain or retain business, direct business to any person or corporate entity, or obtain any unfair advantage. Our activities create the risk of unauthorized payments or offers of payments by our employees, agents, or joint venture partners that could be in violation of anti-corruption laws, even though some of these parties are not subject to our control. We have internal control policies and procedures and have implemented training and compliance programs for our employees and agents with respect to the FCPA. However, we cannot assure that our policies, procedures, and programs will always protect us from reckless or criminal acts committed by our employees or agents. We are also subject to the risks that our employees, joint venture partners and agents outside of the United States may fail to comply with other applicable laws. Allegations of violations of applicable anti-corruption laws have resulted and may in the future result in internal, independent, or government investigations. Violations of anti-corruption laws may result in severe criminal or civil sanctions, and we may be subject to other liabilities, which could have a material adverse effect on our business, consolidated results of operations and consolidated financial condition.
In addition, the shipment of goods, services, and technology across international borders subjects us to extensive trade laws and regulations. Our import activities are governed by the unique customs laws and regulations in each of the countries where we operate. Moreover, many countries, including the United States, control the export and re-export of certain goods, services and technology and impose related export recordkeeping and reporting obligations. Governments may also impose economic sanctions against certain countries, persons and entities that may restrict or prohibit transactions involving such countries, persons, and entities, which may limit or prevent our conduct of business in certain jurisdictions. During 2014, the United States and European Union imposed sectoral sanctions directed at Russia’s oil and gas industry. Among other things, these sanctions restrict the provision of U.S. and EU goods, services, and technology in support of exploration or production for deep water, Arctic offshore, or shale projects that have the potential to produce oil in Russia. These sanctions resulted in our winding down and ending work on two projects in Russia in 2014, and have prevented us from pursuing certain other projects in Russia. In 2017 and 2018, the U.S. Government imposed additional sanctions against Russia, Russia’s oil and gas industry, and certain Russian companies. Our ability to engage in certain future projects in Russia or involving certain Russian customers is dependent upon whether or not our involvement in such projects is restricted under U.S. or EU sanctions laws and the extent to which any of our current or prospective operations in Russia or with certain Russian customers may be subject to those laws. Those laws may change from time to time, and any expansion of sanctions against Russia’s oil and gas industry could further hinder our ability to do business in Russia or with certain Russian customers, which could have a material adverse effect on our consolidated results of operations.
The U.S. Government imposed sanctions against Venezuela that have effectively required us to discontinue our operations there. Consequently, in connection with us winding down our operations in Venezuela, we wrote down all of our remaining investment in Venezuela in 2020. As of December 29, 2020, we no longer have any employees in Venezuela, although we continue to maintain our local entity, facilities, and equipment in-country, as permitted under applicable law. We are not currently conducting any other operational activities in Venezuela.
The laws and regulations concerning import activity, export recordkeeping and reporting, export control and economic sanctions are complex and constantly changing. These laws and regulations can cause delays in shipments and unscheduled operational downtime. Moreover, any failure to comply with applicable legal and regulatory trading obligations could result in criminal and civil penalties and sanctions, such as fines, imprisonment, debarment from governmental contracts, seizure of shipments, and loss of import and export privileges. In addition, investigations by governmental authorities and legal, social, economic, and political issues in these countries could have a material adverse effect on our business, consolidated results of operations and consolidated financial condition.
Changes in, compliance with, or our failure to comply with laws in the countries in which we conduct business may negatively impact our ability to provide services in, make sales of equipment to, and transfer personnel or equipment among some of those countries and could have a material adverse effect on our business and consolidated results of operations.
In the countries in which we conduct business, we are subject to multiple and, at times, inconsistent regulatory regimes, including those that govern our use of radioactive materials, explosives, and chemicals in the course of our operations. Various national and international regulatory regimes govern the shipment of these items. Many countries, but not all, impose special controls upon the export and import of radioactive materials, explosives, and chemicals. Our ability to do business is subject to maintaining required licenses and complying with these multiple regulatory requirements applicable to these special products. In addition, the various laws governing import and export of both products and technology apply to a wide range of services and products we offer. In turn, this can affect our employment practices of hiring people of different nationalities because these laws may prohibit or limit access to some products or technology by employees of various nationalities. Changes in, compliance with, or our failure to comply with these laws may negatively impact our ability to provide services in, make sales of equipment to, and transfer personnel or equipment among some of the countries in which we operate and could have a material adverse effect on our business and consolidated results of operations.
The adoption of any future federal, state, or local laws or implementing regulations imposing reporting obligations on, or limiting or banning, the hydraulic fracturing process could make it more difficult to complete natural gas and oil wells and could have a material adverse effect on our business, consolidated results of operations, and consolidated financial condition.
Various federal and state legislative and regulatory initiatives, as well as actions in other countries, have been or could be undertaken that could result in additional requirements or restrictions being imposed on hydraulic fracturing operations. For example, the new United States presidential administration may seek to adopt federal regulations or urge federal laws that would impose additional regulatory requirements on or even prohibit hydraulic fracturing in some areas. Legislation and/or regulations have been adopted in many U.S. states that require additional disclosure regarding chemicals used in the hydraulic fracturing process but that generally include protections for proprietary information. Legislation, regulations, and/or policies have also been adopted at the state level that impose other types of requirements on hydraulic fracturing operations (such as limits on operations in the event of certain levels of seismic activity). Additional legislation and/or regulations have been
adopted or are being considered at the state and local level that could impose further chemical disclosure or other regulatory requirements (such as prohibitions on hydraulic fracturing operations in certain areas) that could affect our operations. Four states (New York, Maryland, Vermont, and Washington) have banned the use of high volume hydraulic fracturing, Oregon has adopted a five-year moratorium, and Colorado has enacted legislation providing local governments with regulatory authority over hydraulic fracturing operations. Local jurisdictions in some states have adopted ordinances that restrict or in certain cases prohibit the use of hydraulic fracturing, although many of these ordinances have been challenged and some have been overturned. In addition, governmental authorities in various foreign countries where we have provided or may provide hydraulic fracturing services have imposed or are considering imposing various restrictions or conditions that may affect hydraulic fracturing operations. The adoption of any future federal, state, local, or foreign laws or regulations imposing reporting obligations on, or limiting or banning, the hydraulic fracturing process could make it more difficult to complete natural gas and oil wells and could have a material adverse effect on our business, consolidated results of operations, and consolidated financial condition.
Liability for cleanup costs, natural resource damages and other damages arising as a result of environmental laws and regulations could be substantial and could have a material adverse effect on our business, consolidated results of operations, and consolidated financial condition.
We are subject to numerous environmental laws and regulations in the United States and the other countries where we do business. We evaluate and address the environmental impact of our operations by assessing and remediating contaminated properties in order to avoid future liabilities and comply with legal and regulatory requirements. From time to time, claims have been made against us under environmental laws and regulations. In the United States, environmental laws and regulations typically impose strict liability. Strict liability means that in some situations we could be exposed to liability for cleanup costs, natural resource damages, and other damages as a result of our conduct that was lawful at the time it occurred or the conduct of prior operators or other third parties. We are periodically notified of potential liabilities at federal and state superfund sites. These potential liabilities may arise from both historical Halliburton operations and the historical operations of companies that we have acquired. Our exposure at these sites may be materially impacted by unforeseen adverse developments both in the final remediation costs and with respect to the final allocation among the various parties involved at the sites. The relevant regulatory agency may bring suit against us for amounts in excess of what we have accrued and what we believe is our proportionate share of remediation costs at any superfund site. We also could be subject to third-party claims, including punitive damages, with respect to environmental matters for which we have been named as a potentially responsible party. Liability for damages arising as a result of environmental laws or related third-party claims could be substantial and could have a material adverse effect on our business, consolidated results of operations, and consolidated financial condition.
Failure on our part to comply with, and the costs of compliance with, applicable health, safety, and environmental requirements could have a material adverse effect on our business, consolidated results of operations, and consolidated financial condition.
In addition to the numerous environmental laws and regulations that apply to our operations, we are subject to a variety of laws and regulations in the United States and other countries relating to health and safety. Among those laws and regulations are those covering hazardous materials and requiring emission performance standards for facilities. For example, our well service operations routinely involve the handling of significant amounts of waste materials, some of which are classified as hazardous substances. We also store, transport, and use radioactive and explosive materials in certain of our operations. Applicable regulatory requirements include those concerning:
- the containment and disposal of hazardous substances, oilfield waste, and other waste materials;
- the importation and use of radioactive materials;
- the use of underground storage tanks;
- the use of underground injection wells; and
- the protection of worker safety both onshore and offshore.
These and other requirements generally are becoming increasingly strict. The failure to comply with the requirements, many of which may be applied retroactively, may result in:
- administrative, civil, and criminal penalties;
- revocation of permits to conduct business; and
- corrective action orders, including orders to investigate and/or clean up contamination.
Failure on our part to comply with applicable health, safety, and environmental laws and regulations or costs arising from regulatory compliance, including compliance with changes in or expansion of applicable regulatory requirements, could have a material adverse effect on our business, consolidated results of operations, and consolidated financial condition.
Existing or future laws, regulations, treaties or international agreements related to greenhouse gases, climate change, and alternative energy sources could have a negative impact on our business and may result in additional
compliance obligations that could have a material adverse effect on our business, consolidated results of operations, and consolidated financial condition.
Changes in environmental requirements related to greenhouse gases, climate change, and alternative energy sources may negatively impact demand for our services and products. For example, oil and natural gas exploration and production may decline as a result of environmental requirements, including land use policies responsive to environmental concerns. State, national, and international governments and agencies in areas in which we conduct business continue to evaluate, and in some instances adopt, climate-related legislation and other regulatory initiatives that would restrict emissions of greenhouse gases. The new United States presidential administration has issued Executive Orders seeking to adopt new regulations and policies to address climate change and to suspend, revise, or rescind prior agency actions that are identified as conflicting with the administration's climate policies. These include Executive Orders requiring a review of current federal lands leasing and permitting practices, as well as a temporary halt of new leasing of federal lands and offshore waters available for oil and gas exploration. The new presidential administration also announced that in February 2021, the United States will formally re-join the Paris Agreement. The Paris Agreement requires countries to review and “represent a progression” in their intended nationally determined contributions, which set greenhouse gases emission reduction goals, every five years. Though we are closely following developments in this area and changes in the regulatory landscape in the United States, we cannot predict how or when those challenges may ultimately impact our business. Because our business depends on the level of activity in the oil and natural gas industry, existing or future laws, regulations, treaties, or international agreements related to greenhouse gases and climate change, including incentives to conserve energy or use alternative energy sources, may reduce demand for oil and natural gas and could have a negative impact on our business. Likewise, such restrictions may result in additional compliance obligations with respect to the release, capture, sequestration, and use of carbon dioxide. The efforts we have taken, and may undertake in the future, to respond to these evolving or new regulations and to environmental initiatives of customers, investors, and others may increase our costs. These and other environmental requirements could have a material adverse effect on our business, consolidated results of operations, and consolidated financial condition.
The Company could be subject to changes in its tax rates, the adoption of new tax legislation, tax audits, or exposure to additional tax liabilities that could have a material adverse effect on our business, consolidated results of operations, and consolidated financial condition.
We are subject to taxes in the U.S. and numerous jurisdictions where we operate and our subsidiaries are organized. Due to economic and political conditions, tax rates in the U.S. and other jurisdictions may be subject to significant change. In addition, our tax returns are subject to examination by the U.S. and other tax authorities and governmental bodies. We regularly assess the likelihood of an adverse outcome resulting from these examinations to determine the adequacy of our provision for taxes. There can be no assurance as to the outcome of the examinations. An increase in tax rates, particularly in the U.S., changes in our ability to realize our deferred tax assets, or adverse outcomes resulting from examinations of our tax returns could have a material adverse effect on our business, consolidated results of operations, and consolidated financial condition.
Our operations are subject to political and economic instability and risk of government actions that could have a material adverse effect on our business, consolidated results of operations, and consolidated financial condition.
We are exposed to risks inherent in doing business in each of the countries in which we operate. Our operations are subject to various risks unique to each country that could have a material adverse effect on our business, consolidated results of operations, and consolidated financial condition. With respect to any particular country, these risks may include:
- political and economic instability, including:
•civil unrest, acts of terrorism, war, and other armed conflict;
•inflation; and
•currency fluctuations, devaluations and conversion restrictions; and
- governmental actions that may:
•result in expropriation and nationalization of our assets in that country;
•result in confiscatory taxation or other adverse tax policies;
•limit or disrupt markets or our customers and our operations, restrict payments, or limit the movement of funds;
•impose sanctions on our ability to conduct business with certain customers or persons;
•result in the deprivation of contract rights; and
•result in the inability to obtain or retain licenses required for operation.
For example, due to the unsettled political conditions in many oil-producing countries, our operations, revenue, and profits are subject to the adverse consequences of war, terrorism, civil unrest, strikes, currency controls, and governmental actions. These, and other risks described above, could result in the loss of our personnel or assets, cause us to evacuate our personnel from certain countries, cause us to increase spending on security worldwide, cause us to cease operating in certain countries, disrupt financial and commercial markets, including the supply of and pricing for oil and natural gas, and generate
greater political and economic instability in some of the geographic areas in which we operate. Areas where we operate that have significant risk include, but are not limited to: the Middle East, North Africa, Angola, Argentina, Azerbaijan, Brazil, Indonesia, Kazakhstan, Mexico, Mozambique, Nigeria, Papa New Guinea, and Russia. In addition, any possible reprisals as a consequence of military or other action, such as acts of terrorism in the United States or elsewhere, could have a material adverse effect on our business, consolidated results of operations, and consolidated financial condition.
General Risk Factors
The COVID-19 pandemic and related economic repercussions have had a material adverse effect on our business, liquidity, consolidated results of operations, and consolidated financial condition, which effect could worsen.
The COVID-19 pandemic and related economic repercussions have created significant volatility, uncertainty, and turmoil in the oil and gas industry. These events have directly affected our business and have exacerbated the potential negative impact from many of the risks our business is subject to, including those relating to our customers’ capital spending and trends in oil and natural gas prices. In addition, we are facing logistical challenges including border closures, travel restrictions, and an inability to commute to certain facilities and job sites, as we provide services and products to our customers. We are also experiencing inefficiencies surrounding stay-at-home orders and remote work arrangements. These logistical challenges and inefficiencies could increase if the pandemic worsens or persists.
In the midst of the ongoing COVID-19 pandemic, in the first quarter of 2020 OPEC+ was initially unable to reach an agreement to continue to impose limits on the production of crude oil. Oil demand has significantly deteriorated as a result of the virus and corresponding preventative measures taken around the world to mitigate the spread of the virus. The convergence of these events created the unprecedented dual impact of a global oil demand decline coupled with the risk of a substantial increase in supply. While OPEC+ agreed in April 2020 to cut production, there is no assurance that the agreement, or any subsequent agreements, will continue or be observed by its parties, and downward pressure on commodity prices could continue for the foreseeable future.
Given the nature and significance of the events described above, we are not able to enumerate all potential risks to our business; however, we believe that in addition to the impacts described above, other current and potential impacts of these recent events include, but are not limited to:
•disruption to our supply chain for raw materials essential to our business, including restrictions on importing and exporting products;
•notices from customers, suppliers, and other third parties arguing that their non-performance under our contracts with them is permitted as a result of force majeure or other reasons;
•liquidity challenges, including impacts related to delayed customer payments and payment defaults associated with customer liquidity issues and bankruptcies;
•a credit rating downgrade of our corporate debt and potentially higher borrowing costs in the future;
•a need to preserve liquidity, which could result in a further reduction or suspension of our quarterly dividend or a delay or change in our capital investment plan;
•cybersecurity issues, as digital technologies may become more vulnerable and experience a higher rate of cyberattacks in the current environment of remote connectivity;
•litigation risk and possible loss contingencies related to COVID-19 and its impact, including with respect to commercial contracts, employee matters and insurance arrangements;
•a further reduction of our global workforce to adjust to market conditions, including severance payments, retention issues, and an inability to hire employees when market conditions improve;
•additional costs associated with rationalization of our portfolio of real estate facilities, including possible exit of leases and facility closures to align with expected activity and workforce capacity;
•additional asset impairments, including an impairment of the carrying value of our goodwill, along with other accounting charges;
•infections and quarantining of our employees and the personnel of our customers, suppliers, and other third parties in areas in which we operate;
•changes in the regulation of the production of hydrocarbons, such as the imposition of limitations on the production of oil and gas by states or other jurisdictions, that may result in additional limits on demand for our products and services;
•actions undertaken by national, regional, and local governments and health officials to contain COVID-19 or treat its effects; and
•a structural shift in the global economy and its demand for oil and natural gas as a result of changes in the way people work, travel, and interact, or in connection with a global recession or depression.
Given the dynamic nature of these events, we cannot reasonably estimate the period of time that the COVID-19 pandemic and related market conditions will persist or their severity, the full extent of the impact they will have on our business, financial condition, results of operations or cash flows or the pace or extent of any subsequent recovery.
The events described above have had a significant adverse impact on the oil and gas industry and a material adverse effect on our business, liquidity, consolidated results of operations, and consolidated financial condition, all of which could worsen. For more information, see “Management’s Discussion and Analysis of Financial Condition and Results of Operations - Executive Overview.”
Our operations are subject to cyberattacks that could have a material adverse effect on our business, consolidated results of operations, and consolidated financial condition.
We are increasingly dependent on digital technologies and services to conduct our business. We use these technologies for internal purposes, including data storage, processing, and transmissions, as well as in our interactions with our business associates, such as customers and suppliers. Examples of these digital technologies include analytics, automation, and cloud services. Our digital technologies and services, and those of our business associates, are subject to the risk of cyberattacks and, given the nature of such attacks, some incidents can remain undetected for a period of time despite efforts to detect and respond to them in a timely manner. We routinely monitor our systems for cyber threats and have processes in place to detect and remediate vulnerabilities. Nevertheless, we have experienced occasional cyberattacks and attempted breaches over the past year, including attacks resulting from phishing emails and ransomware infections. We detected and remediated all of these incidents. Even if we successfully defend our own digital technologies and services, we also rely on our business associates, with whom we may share data and services, to defend their digital technologies and services against attack. No known leakage of material financial, technical or customer data occurred as a result of cyberattacks against us and none of the incidents mentioned above had a material adverse effect on our business, operations, reputation, or consolidated results of operations or consolidated financial condition.
If our systems, or our business associates' systems, for protecting against cybersecurity risks prove not to be sufficient, we could be adversely affected by, among other things: loss of or damage to intellectual property, proprietary, or confidential information, or customer, supplier, or employee data; interruption of our business operations; and increased costs required to prevent, respond to, or mitigate cybersecurity attacks. These risks could harm our reputation and our relationships with our business associates, employees, and other third parties, and may result in claims against us. These risks could have a material adverse effect on our business, consolidated results of operations and consolidated financial condition.
We are subject to foreign currency exchange risks and limitations on our ability to reinvest earnings from operations in one country to fund the capital needs of our operations in other countries or to repatriate assets from some countries.
A sizable portion of our consolidated revenue and consolidated operating expenses is in foreign currencies. As a result, we are subject to significant risks, including:
- foreign currency exchange risks resulting from changes in foreign currency exchange rates and the implementation of exchange controls; and
- limitations on our ability to reinvest earnings from operations in one country to fund the capital needs of our operations in other countries.
As an example, we conduct business in countries that have restricted or limited trading markets for their local currencies and restrict or limit cash repatriation. We may accumulate cash in those geographies, but we may be limited in our ability to convert our profits into United States dollars or to repatriate the profits from those countries.
If we lose one or more of our significant customers or if our customers delay paying or fail to pay a significant amount of our outstanding receivables, it could have a material adverse effect on our business, consolidated results of operations, and consolidated financial condition.
We depend on a limited number of significant customers. While no single customer represented more than 10% of consolidated revenue in any period presented, the loss of one or more significant customers could have a material adverse effect on our business and our consolidated results of operations.
In most cases, we bill our customers for our services in arrears and are, therefore, subject to our customers delaying or failing to pay our invoices. In weak economic or commodity price environments, we may experience increased delays and failures due to, among other reasons, a reduction in our customers’ cash flow from operations and their access to the credit markets. If our customers delay paying or fail to pay us a significant amount of our outstanding receivables, it could have a material adverse effect on our business, consolidated results of operations and consolidated financial condition.
Our acquisitions, dispositions and investments may not result in anticipated benefits and may present risks not originally contemplated, which may have a material adverse effect on our business, consolidated results of operations, and consolidated financial condition.
We continually seek opportunities to maximize efficiency and value through various transactions, including purchases or sales of assets, businesses, investments, or joint venture interests. These transactions are intended to (but may not) result in the realization of savings, the creation of efficiencies, the offering of new products or services, the generation of cash or income, or the reduction of risk. Acquisition transactions may use cash on hand or be financed by additional borrowings or by the issuance of our common stock. These transactions may also affect our business, consolidated results of operations, and consolidated financial condition.
These transactions also involve risks, and we cannot ensure that:
- any acquisitions we attempt will be completed on the terms announced, or at all;
- any acquisitions would result in an increase in income or provide an adequate return of capital or other anticipated benefits;
- any acquisitions would be successfully integrated into our operations and internal controls;
- the due diligence conducted prior to an acquisition would uncover situations that could result in financial or legal exposure, including under the FCPA, or that we will appropriately quantify the exposure from known risks;
- any disposition would not result in decreased earnings, revenue, or cash flow;
- use of cash for acquisitions would not adversely affect our cash available for capital expenditures and other uses; or
- any dispositions, investments, or acquisitions, including integration efforts, would not divert management resources.
Actions of and disputes with our joint venture partners could have a material adverse effect on the business and results of operations of our joint ventures and, in turn, our business and consolidated results of operations.
We conduct some operations through joint ventures in which unaffiliated third parties may control the operations of the joint venture or we may share control. As with any joint venture arrangement, differences in views among the joint venture participants may result in delayed decisions, the joint venture operating in a manner that is contrary to our preference or in failures to agree on major issues. We also cannot control the actions of our joint venture partners, including any nonperformance, default, or bankruptcy of our joint venture partners. These factors could have a material adverse effect on the business and results of operations of our joint ventures and, in turn, our business and consolidated results of operations.
The loss or unavailability of any of our executive officers or other key employees could have a material adverse effect on our business.
We depend greatly on the efforts of our executive officers and other key employees to manage our operations. The loss or unavailability of any of our executive officers or other key employees could have a material adverse effect on our business.
| | | | | | | | |
| | Item 1(b) | Unresolved Staff Comments |
Item 1(b). Unresolved Staff Comments.
None.
Item 2. Properties.
We own or lease numerous properties in domestic and foreign locations. Our principal properties include manufacturing facilities, research and development laboratories, technology centers, and corporate offices. We also have numerous small facilities that include sales, project and support offices, and bulk storage facilities throughout the world. Our owned properties have no material encumbrances. We believe all properties that we currently occupy are suitable for their intended use.
The following locations represent our major facilities by segment:
–Completion and Production: Arbroath, United Kingdom; Duncan, Oklahoma; Johor Bahru, Malaysia; Lafayette, Louisiana; and Rio de Janeiro, Brazil
–Drilling and Evaluation: Alvarado, Texas and The Woodlands, Texas
–Shared/corporate facilities: Bangalore, India; Carrollton, Texas; Dhahran, Saudi Arabia; Dubai, United Arab Emirates; Houston, Texas (corporate executive offices); Kuala Lumpur, Malaysia; London, England; Moscow, Russia; Panama City, Panama; Pune, India; Singapore; and Tananger, Norway
Item 3. Legal Proceedings.
Information related to Item 3. Legal Proceedings is included in Note 10 to the consolidated financial statements.
Item 4. Mine Safety Disclosures.
Our barite and bentonite mining operations, in support of our fluid services business, are subject to regulation by the federal Mine Safety and Health Administration under the Federal Mine Safety and Health Act of 1977. Information concerning mine safety violations or other regulatory matters required by section 1503(a) of the Dodd-Frank Wall Street Reform and Consumer Protection Act and Item 104 of Regulation S-K (17 CFR 229.104) is included in Exhibit 95 to this annual report.
| | | | | | | | |
| Item 5 | Market for Registrant's Common Equity, Related Stockholder Matters and Issuer Purchases of Equity Securities |
PART II
Item 5. Market for Registrant’s Common Equity, Related Stockholder Matters and Issuer Purchases of Equity Securities.
Halliburton Company’s common stock is traded on the New York Stock Exchange under the symbol "HAL." Information related to quarterly dividend payments is included under the caption “Quarterly Financial Data” in the consolidated financial statements. The declaration and payment of future dividends will be at the discretion of the Board of Directors and will depend on, among other things, future earnings, general financial condition and liquidity, success in business activities, capital requirements, and general business conditions.
The following graph and table compare total shareholder return on our common stock for the five-year period ended December 31, 2020, with the Philadelphia Oil Service Index (OSX) and the Standard & Poor’s 500 ® Index over the same period. This comparison assumes the investment of $100 on December 31, 2015 and the reinvestment of all dividends. The shareholder return set forth is not necessarily indicative of future performance. The following graph and related information shall not be deemed “soliciting material” or to be “filed” with the SEC, nor shall such information be incorporated by reference into any future filing under the Securities Act of 1933 or the Securities Exchange Act of 1934, except to the extent that Halliburton specifically incorporates it by reference into such filing.
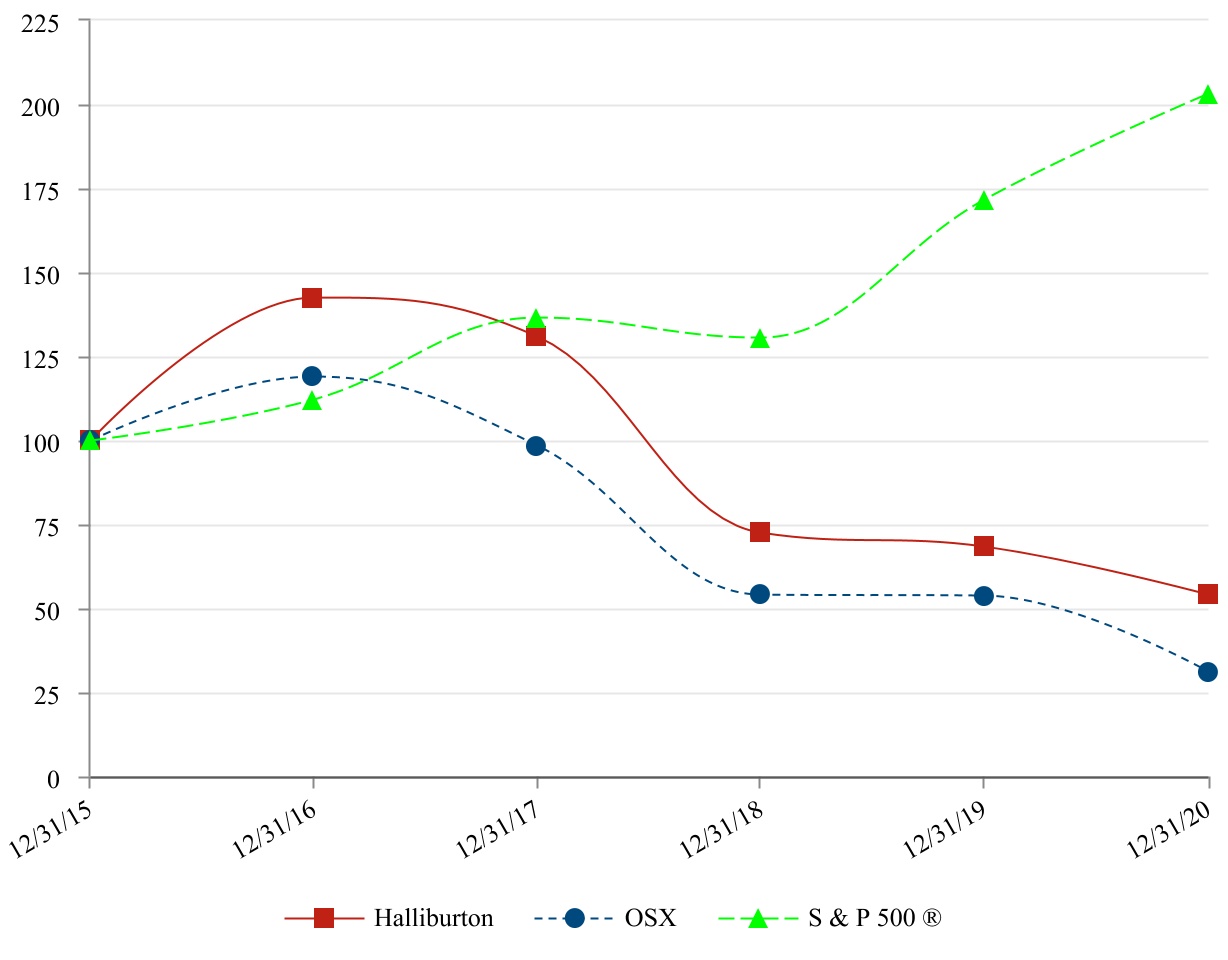
| | | | | | | | | | | | | | | | | | | | |
| December 31 |
| 2015 | 2016 | 2017 | 2018 | 2019 | 2020 |
| Halliburton | $ | 100.00 | | $ | 142.39 | | $ | 130.67 | | $ | 72.43 | | $ | 68.30 | | $ | 54.03 | |
| Philadelphia Oil Service Index (OSX) | 100.00 | | 118.98 | | 98.51 | | 53.97 | | 53.67 | | 31.09 | |
| Standard & Poor’s 500 ® Index | 100.00 | | 111.96 | | 136.40 | | 130.42 | | 171.49 | | 203.04 | |
| | | | | | | | |
| Item 5 | Market for Registrant's Common Equity, Related Stockholder Matters and Issuer Purchases of Equity Securities |
At January 29, 2021, we had 11,050 shareholders of record. In calculating the number of shareholders, we consider clearing agencies and security position listings as one shareholder for each agency or listing.
The following table is a summary of repurchases of our common stock during the three-month period ended December 31, 2020.
| | | | | | | | | | | | | | |
| Period | Total Number
of Shares Purchased (a) | Average
Price Paid per Share | Total Number
of Shares
Purchased as
Part of Publicly
Announced Plans or Programs (b) | Maximum
Number (or
Approximate
Dollar Value) of
Shares that may yet
be Purchased Under the Program (b) |
| October 1 - 31 | 15,301 | $11.26 | — | $5,100,008,081 |
| November 1 - 30 | 20,895 | $11.96 | — | $5,100,008,081 |
| December 1 - 31 | 134,775 | $19.01 | — | $5,100,008,081 |
| Total | 170,971 | $17.46 | — | |
(a) All of the 170,971 shares purchased during the three-month period ended December 31, 2020 were acquired from employees in connection with the settlement of income tax and related benefit withholding obligations arising from vesting in restricted stock grants. These shares were not part of a publicly announced program to purchase common stock.
(b) Our Board of Directors has authorized a plan to repurchase a specified dollar amount of our common stock from time to time. Approximately $5.1 billion remained authorized for repurchases as of December 31, 2020. From the inception of this program in February 2006 through December 31, 2020, we repurchased approximately 224 million shares of our common stock for a total cost of approximately $9.0 billion.
Item 6. Selected Financial Data.
The Selected Financial Data should be read in conjunction with "Item 7. Management's Discussion and Analysis of Financial Condition and Results of Operations" and "Item 8. Financial Statements and Supplementary Data," both contained herein.
| | | | | | | | | | | | | | | | | |
HALLIBURTON COMPANY Selected Financial Data (Unaudited) |
| Year ended December 31 |
| Millions of dollars except per share data | 2020 | 2019 | 2018 | 2017 | 2016 |
| Revenue | $ | 14,445 | | $ | 22,408 | | $ | 23,995 | | $ | 20,620 | | $ | 15,887 | |
| Operating income (loss) | (2,436) | | (448) | | 2,467 | | 1,374 | | (6,770) | |
| Net Income (loss) | (2,942) | | (1,129) | | 1,657 | | (449) | | (5,767) | |
| Basic and diluted income (loss) per share attributable to company shareholders | (3.34) | | (1.29) | | 1.89 | | (0.51) | | (6.69) | |
| | | | | |
| Cash dividends per share | 0.315 | | 0.72 | | 0.72 | | 0.72 | | 0.72 | |
| Net working capital | 5,054 | | 6,334 | | 6,349 | | 5,915 | | 7,654 | |
| Total assets | 20,680 | | 25,377 | | 25,982 | | 25,085 | | 27,000 | |
| Long-term debt | 9,132 | | 10,316 | | 10,312 | | 10,430 | | 12,214 | |
| Total debt | 9,827 | | 10,327 | | 10,344 | | 10,942 | | 12,384 | |
| Total shareholders’ equity | 4,983 | 8,025 | | 9,544 | | 8,349 | | 9,448 | |
| Cash flows from operating activities | 1,881 | | 2,445 | | 3,157 | | 2,468 | | (1,703) | |
| Capital expenditures | 728 | | 1,530 | | 2,026 | | 1,373 | | 798 | |
| | | | | | | | |
| | Item 7 | Executive Overview |
Item 7. Management’s Discussion and Analysis of Financial Condition and Results of Operations.
Management's Discussion and Analysis of Financial Condition and Results of Operations (MD&A) should be read in conjunction with the consolidated and combined financial statements included in "Item 8. Financial Statements and Supplementary Data" contained herein.
EXECUTIVE OVERVIEW
Financial results
We experienced challenging market dynamics in 2020 as we faced a global pandemic, record oil demand destruction, and an unprecedented downturn in the energy industry. Despite these difficulties, we demonstrated resilience and a strong commitment to our execution culture. We delivered historic results across our key safety and service quality metrics and demonstrated our ability to generate competitive cash flow in different business environments. The following graph illustrates our revenue and operating margins for each operating segment over the past three years.
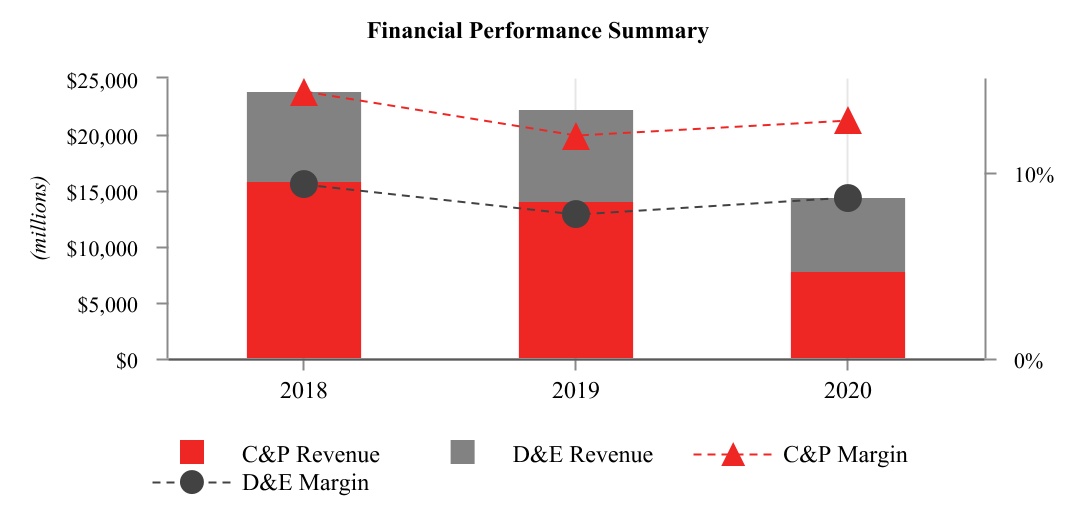
During 2020, we generated total company revenue of $14.4 billion, a 36% decrease from the $22.4 billion of revenue generated in 2019, with our Completion and Production (C&P) segment declining by 44% and our Drilling and Evaluation (D&E) segment declining by 21%. We reported a total company operating loss of approximately $2.4 billion in 2020 driven by $3.8 billion of impairments and other charges. This compares to operating loss of $448 million in 2019 that was driven by $2.5 billion of impairments and other charges. A significant decline in pressure pumping services in North America land during 2020 negatively impacted operating results.
Our North America revenue declined 52% in 2020 compared to 2019, resulting from lower activity and pricing in North America land, primarily associated with reduced stimulation and well construction activity. While the U.S. land rig count recovered from its August 2020 low, it is still 60% below pre-pandemic levels. Even without improved pricing, we took advantage of the recovery in completions and drilling activity in the fourth quarter of 2020 and delivered margin improvement, demonstrating the operating leverage from our cost reductions and service delivery improvements in North America.
Internationally, revenue declined 17% in 2020 compared to 2019 primarily driven by reduced activity for drilling and completions related services across all international regions. Internationally, rig counts and customer spending declined more than 20%. Despite this tough backdrop, we improved our overall international margin in 2020.
Business outlook
Oil prices have returned to pre-pandemic levels. As oil demand recovers, we anticipate favorable market dynamics, with international short-cycle producers leading the activity recovery. Our strategic priorities should continue to drive our success as markets around the world stabilize and begin to grow.
Internationally, we expect activity recovery to vary widely across the regions, with both a cyclical and seasonal bottoming of activity expected in the first quarter. While the pace of recovery depends on demand improvement, the second half of 2021 could see an increase in international activity as compared to the second half of 2020. We have a strong presence in mature fields completions and interventions work, a number of resilient integrated contracts around the world, leverage to unconventional developments in Latin America and the Middle East, and opportunities in key active offshore areas. Our new drilling technologies are penetrating the market and gaining customer confidence, and we have growth opportunities as we expand our production related businesses internationally. Also, we have adopted digital solutions which help our customers
reduce cost per barrel, improve economics, and increase efficiencies. Our digital and other technology advances, geographic expansion of our products and services, along with continued discipline in cost management and cost efficiency, should achieve profitable returns-driven growth in international markets.
In North America, our focused approach to building a leaner and more profitable business allowed us to improve our operating margins and cash flows in 2020. Activity has rebounded from its lows in 2020. Completions activity in North America is expected to continue improving in the first half of 2021, as commodity prices remain supportive and customers complete their back log of drilled, but uncompleted wells. For the full year of 2021, provided that the impact of the pandemic moderates, economic activity continues to increase, and commodity prices remain strong, we believe that our customers will sustain activity in order to hold their production flat to 2020 exit levels, with completions spend expected to outpace drilling.
In 2021, we will focus on executing our key strategic priorities to deliver industry-leading returns and strong free cash flow. Our service delivery improvements, structural cost reductions, deployment of digital and other technologies, and lower capital intensity are expected to deliver on both customers' expectations and shareholder objectives.
Our operating performance and business outlook are described in more detail in “Business Environment and Results of Operations.”
Capital expenditures
During 2020, our capital expenditures were approximately $728 million, a decrease of 52% from 2019, and were predominantly made in our Sperry Drilling, Production Enhancement, Baroid, Artificial Lift, and Wireline and Perforating product service lines. We intend for our capital expenditures in 2021 to remain relatively flat at $750 million. Our lower capital intensity, aided by technological innovation, should contribute to ongoing cash flow generation. We believe this level of spend will equip us to take advantage of an anticipated recovery in the market as 2021 unfolds.
Financial markets, liquidity and capital resources
We believe we have invested our cash balances conservatively and secured sufficient financing to help mitigate any near-term negative impact on our operations from adverse market conditions. As of December 31, 2020, we had $2.6 billion of cash and equivalents and $3.5 billion of available committed bank credit under our revolving credit facility which expires in 2024. We believe this provides us with sufficient liquidity to address the challenges and opportunities of the current market. For additional information on market conditions, see “Liquidity and Capital Resources” and “Business Environment and Results of Operations.”
| | | | | | | | |
| | Item 7 | Liquidity and Capital Resources |
LIQUIDITY AND CAPITAL RESOURCES
As of December 31, 2020, we had $2.6 billion of cash and equivalents, compared to $2.3 billion of cash and equivalents at December 31, 2019.
Significant sources and uses of cash in 2020
Sources of cash:
•Cash flows from operating activities were $1.9 billion. This included a positive impact from the primary components of our working capital (receivables, inventories, and accounts payable) of a net $800 million, primarily associated with lower customer receivables, partially offset by approximately $350 million of severance payments.
Uses of cash:
•In March 2020, we executed two transactions resulting in a reduction of gross debt by $500 million. We issued $1.0 billion aggregate principal amount of senior notes and used the net proceeds from issuance along with cash on hand to repurchase $1.5 billion aggregate principal amount of senior notes. Inclusive of the tender premium and fees, these transactions resulted in a net payment of approximately $654 million.
•Capital expenditures were $728 million.
•We paid $278 million of dividends to our shareholders.
•We repurchased approximately 7.4 million shares of our common stock in early March, largely before the significant decline in oil prices, under our share repurchase program, at a total cost of approximately $100 million.
Future sources and uses of cash
We manufacture most of our own equipment, which provides us with some flexibility to increase or decrease our capital expenditures based on market conditions. Capital spending for 2021 is currently expected to be approximately $750 million. We believe this level of spend will allow us to invest in our key strategic areas. We will continue to maintain capital discipline, monitor the rapidly changing market dynamics, and adjust our capital spend accordingly. For additional information on capital expenditures, see "Executive Overview."
We have debt payments of $185 million and $500 million due in the first quarter of 2021 and the fourth quarter of 2021, respectively.
Based on our market outlook, we reduced our quarterly dividend rate in the second quarter of 2020 from $0.18 per common share to $0.045 per common share and remained at this amount for the rest of 2020, reducing cash outflows by approximately $360 million in 2020. We will continue to maintain our focus on liquidity and review our quarterly dividend considering our priorities of future debt reduction and, as market conditions evolve, reinvesting in our business.
Our Board of Directors has authorized a program to repurchase our common stock from time to time. Approximately $5.1 billion remained authorized for repurchases as of December 31, 2020 and may be used for open market and other share purchases.
| | | | | | | | |
| | Item 7 | Liquidity and Capital Resources |
Contractual obligations
The following table summarizes our significant contractual obligations and other long-term liabilities as of December 31, 2020:
| | | | | | | | | | | | | | | | | | | | | | | |
| Payments Due | | |
| Millions of dollars | 2021 | 2022 | 2023 | 2024 | 2025 | Thereafter | Total |
| Long-term debt (a) | $ | 695 | | $ | 9 | | $ | 602 | | $ | — | | $ | 1,000 | | $ | 7,604 | | $ | 9,910 | |
| Interest on debt (b) | 484 | | 460 | | 460 | | 439 | | 439 | | 7,129 | | 9,411 | |
| Operating leases | 287 | | 233 | | 146 | | 94 | | 70 | | 428 | | 1,258 | |
| Finance leases | 63 | | 63 | | 62 | | 49 | | 38 | | 55 | | 330 | |
| Purchase obligations (c) | 385 | | 72 | | 17 | | 6 | | 192 | | 1 | | 673 | |
| Other long-term liabilities (d) | 26 | | — | | — | | — | | — | | — | | 26 | |
| Total | $ | 1,940 | | $ | 837 | | $ | 1,287 | | $ | 588 | | $ | 1,739 | | $ | 15,217 | | $ | 21,608 | |
(a) Represents principal amounts of long-term debt, including current maturities of debt, which excludes any unamortized debt issuance costs and discounts.
(b) Interest on debt includes 76 years of interest on $300 million of debentures at 7.6% interest that become due in 2096.
(c) Amounts in 2021 primarily represent certain purchase orders for goods and services utilized in the ordinary course of our business.
(d) Includes pension funding obligations. Amounts for pension funding obligations, which include international plans and are based on assumptions that are subject to change, are only included for 2021 as we are currently not able to reasonably estimate our contributions for years after 2021.
Due to the uncertainty with respect to the timing of potential future cash outflows associated with our uncertain tax positions, we are not able to reasonably estimate the period of cash settlement with the respective taxing authorities. Therefore, gross unrecognized tax benefits have been excluded from the contractual obligations table above. We had $355 million of gross unrecognized tax benefits, excluding penalties and interest, at December 31, 2020, of which we estimate $211 million may require a cash payment by us. We estimate that $193 million of the cash payment will not be settled within the next 12 months.
Other factors affecting liquidity
Financial position in current market. As of December 31, 2020, we had $2.6 billion of cash and equivalents and $3.5 billion of available committed bank credit under our revolving credit facility. Furthermore, we have no financial covenants or material adverse change provisions in our bank agreements, and our debt maturities extend over a long period of time. We believe our cash on hand, cash flows generated from operations, and our available credit facility will provide sufficient liquidity to address the challenges and opportunities of the current market and our global cash needs, including capital expenditures, working capital investments, dividends, if any, debt repayment, and contingent liabilities.
Guarantee agreements. In the normal course of business, we have agreements with financial institutions under which approximately $1.9 billion of letters of credit, bank guarantees, or surety bonds were outstanding as of December 31, 2020. Some of the outstanding letters of credit have triggering events that would entitle a bank to require cash collateralization, however, none of these triggering events have occurred.
Credit ratings. Our credit ratings with Standard & Poor’s (S&P) remain BBB+ for our long-term debt and A-2 for our short-term debt, with a negative outlook. Our credit ratings with Moody’s Investors Service (Moody's) remain Baa1 for our long-term debt and P-2 for our short-term debt, with a negative outlook.
Customer receivables. In line with industry practice, we bill our customers for our services in arrears and are, therefore, subject to our customers delaying or failing to pay our invoices. In weak economic environments, we may experience increased delays and failures to pay our invoices due to, among other reasons, a reduction in our customers’ cash flow from operations and their access to the credit markets, as well as unsettled political conditions. Given the nature and significance of the pandemic and disruption in the oil and gas industry, we have experienced delayed customer payments and payment defaults associated with customer liquidity issues and bankruptcies. If our customers delay paying or fail to pay us a significant amount of our outstanding receivables, it could have a material adverse effect on our liquidity, consolidated results of operations, and consolidated financial condition. See Note 5 to the consolidated financial statements for further discussion.
| | | | | | | | |
| Item 7 | Business Environment and Results of Operations |
BUSINESS ENVIRONMENT AND RESULTS OF OPERATIONS
We operate in more than 70 countries throughout the world to provide a comprehensive range of services and products to the energy industry. Our revenue is generated from the sale of services and products to major, national, and independent oil and natural gas companies worldwide. The industry we serve is highly competitive with many substantial competitors in each segment of our business. In 2020, 2019, and 2018, based on the location of services provided and products sold, 38%, 51%, and 58%, respectively, of our consolidated revenue was from the United States. No other country accounted for more than 10% of our revenue.
Operations in some countries may be adversely affected by unsettled political conditions, acts of terrorism, civil unrest, force majeure, war or other armed conflict, sanctions, expropriation or other governmental actions, inflation, changes in foreign currency exchange rates, foreign currency exchange restrictions and highly inflationary currencies, as well as other geopolitical factors. We believe the geographic diversification of our business activities reduces the risk that an interruption of operations in any one country, other than the United States, would be materially adverse to our consolidated results of operations.
Activity within our business segments is significantly impacted by spending on upstream exploration, development and production programs by our customers. Also impacting our activity is the status of the global economy, which impacts oil and natural gas consumption. The COVID-19 pandemic and efforts to mitigate its effect have had a substantial negative impact on the global economy and demand for oil.
Some of the more significant determinants of current and future spending levels of our customers are oil and natural gas prices and our customers' expectations about future prices, global oil supply and demand, completions intensity, the world economy, the availability of capital, government regulation, and global stability, which together drive worldwide drilling and completions activity. Additionally, many of our customers in North America have shifted their strategy from production growth to operating within cash flow and generating returns. Lower oil and natural gas prices usually translate into lower exploration and production budgets and lower rig count, while the opposite is usually true for higher oil and natural gas prices. Our financial performance is therefore significantly affected by oil and natural gas prices and worldwide rig activity, which are summarized in the tables below.
The table below shows the average oil and natural gas prices for WTI, United Kingdom Brent crude oil, and Henry Hub natural gas.
| | | | | | | | | | | |
| 2020 | 2019 | 2018 |
Oil price - WTI (1) | $ | 39.23 | | $ | 56.98 | | $ | 64.94 | |
Oil price - Brent (1) | 41.76 | | 64.36 | | 71.08 | |
Natural gas price - Henry Hub (2) | 2.04 | | 2.54 | | 3.17 | |
(1) Oil price measured in dollars per barrel. (2) Natural gas price measured in dollars per million British thermal units (Btu), or MMBtu. |
The historical average rig counts based on the weekly Baker Hughes rig count data were as follows:
| | | | | | | | | | | |
| 2020 | 2019 | 2018 |
| U.S. Land | 418 | | 920 | | 1,013 | |
| U.S. Offshore | 15 | | 23 | | 19 | |
| Canada | 89 | | 134 | | 191 | |
| North America | 522 | | 1,077 | | 1,223 | |
| International | 825 | | 1,098 | | 988 | |
| Worldwide total | 1,347 | | 2,175 | | 2,211 | |
| | | | | | | | |
| Item 7 | Business Environment and Results of Operations |
The oil and gas industry experienced an unprecedented disruption during 2020 as a result of a combination of factors, including the substantial decline in global demand for oil caused by the COVID-19 pandemic and subsequent mitigation efforts. This disruption created a substantial surplus of oil and a decline in oil prices. West Texas Intermediate (WTI) oil spot prices decreased during the first quarter of 2020 from a high of $63 per barrel in early January of 2020 to approximately $21 per barrel by the end of the first quarter of 2020. Although oil prices recovered moderately to approximately $48 per barrel by the end of December 2020, WTI oil spot prices averaged approximately $43 per barrel during the fourth quarter of 2020 and $39 per barrel during the year 2020, which was approximately 25% and 31%, respectively, less than the average price per barrel during the same periods in 2019. As a result, oil and gas activity declined significantly during 2020, with the global rig count sinking to the lowest level since 1973. The U.S. and international average rig counts dropped 54% and 25%, respectively, during 2020, contributing to a global rig count decline of 38% since 2019.
Crude oil prices traded within a wide range during 2020. After averaging $63 a barrel in January 2020, Brent prices fell to an average of $18 a barrel in April, the lowest monthly average price since February 1999. The low prices were the result of significant declines in oil consumption that caused a sharp rise in global oil inventories. However, Brent prices increased through much of the rest of 2020 as rising oil demand and reduced production caused global oil inventories to fall. Prices rose to a monthly average of $50 a barrel in December due to expectations of future economic recovery based on the roll out of multiple COVID-19 vaccines. In the early part of January 2021, Brent prices reached their highest levels in 10 months after Saudi Arabia announced a one-month unilateral cut in its crude oil production for February and March that is in addition to its OPEC+ commitments. Oil prices are back to pre-pandemic levels, driven by global vaccine distribution, an unfolding demand recovery, OPEC+ agreement on production volume, and a declining production base. However, the surge in COVID-19 infections globally and the expected gradual return of spare production capacity make us cautious about near term recovery.
In the United States Energy Information Administration (EIA) January 2021 "Short Term Energy Outlook," the EIA projected Brent prices to average $53 per barrel in 2021, while WTI prices were projected to average approximately $3.00 less per barrel than Brent prices. The International Energy Agency's (IEA) January 2021 "Oil Market Report" forecasts 2021 global demand to average approximately 96.6 million barrels per day, an increase of 6% from 2020.
The recent widespread escalation of COVID-19 cases remains a significant factor impacting oil demand. Vaccination campaigns are underway; however, several regions, including areas of the United States, are dealing with a rebound in the pandemic resulting in tighter mobility constraints and less travel. There is also concern about whether vaccines will be effective against different strains of the virus that have developed and may develop in the future.
The Henry Hub natural gas spot price in the United States averaged $2.04 per MMBtu in 2020, a decrease of $0.50 per MMBtu, or 20%, from 2019. The EIA expects Henry Hub natural gas prices to rise to annual average of $3.01 per MMBtu in 2021 and forecasts prices will rise to an average of $3.27 per MMBtu in 2022.
North America operations
The average North America rig count decreased 52% for the full year 2020 as compared to 2019. The decline in activity was rapid, but both rig count and completions activity have started to recover off their 2020 lows. We responded swiftly and aggressively to the market conditions, and as business conditions improve, our actions resulted in margin improvements through the second half of 2020. In the first quarter of 2021, we expect positive activity momentum to continue, with completions activity increasing more than drilling. The EIA estimates that annual U.S. crude oil production averaged 11.3 million barrels per day as of the year ended 2020, down 1.0 million barrels per day compared to the year ended 2019 as a result of well curtailment and a drop in drilling activity related to low oil prices. The EIA expects production to again decline in 2021, averaging 11.1 million barrels per day, and to increase to an annual average of 11.5 million barrels per day in 2022, as prices and drilling conditions become more favorable. We continue to focus on driving strategic changes, building on the operating leverage we have created in the business, and maximizing our cash flow generation in North America.
International operations
Full year international revenue for 2020 declined 17%, while rig counts and customer spending were down more than 20% as compared to 2019. The pace of recovery depends on the trajectory of demand improvement, and in the second half of 2021, we expect to see an increase in international activity compared to the second half of 2020. We are well positioned to benefit from this increase. We have a strong presence in mature fields completions and interventions work, resilient integrated contracts around the world, leverage to unconventional developments in Latin America and the Middle East, and a leading position in key active offshore areas. The EIA expects the recent rise in COVID-19 infections, the re-imposition of some restrictions, and ongoing changes to consumer behaviors due to the pandemic will continue to adversely affect global oil demand in the first half of 2021. Despite the uncertainty, the EIA forecasts economic activity to return to pre-pandemic levels in 2021 based partly on assumptions regarding the effect of recent vaccine rollouts and reopening efforts. As in the United States,
| | | | | | | | |
| Item 7 | Business Environment and Results of Operations |
the pace of oil consumption growth internationally may, to a significant extent, depend on the manufacture and distribution of effective vaccines on a global scale.
Venezuela. The U.S. Government imposed sanctions against Venezuela have effectively required us to discontinue our operations there. Consequently, in connection with us winding down our operations in Venezuela, we wrote down all of our remaining investment in Venezuela in 2020. As of December 29, 2020 we no longer have any employees in Venezuela, although we continue to maintain our local entity, facilities, and equipment in-country, as permitted under applicable law. We are not currently conducting any other operational activities in Venezuela.
| | | | | | | | |
| Item 7 | Results of Operations in 2020 Compared to 2019 |
RESULTS OF OPERATIONS IN 2020 COMPARED TO 2019
| | | | | | | | | | | | | | |
| Revenue: | | | Favorable | Percentage |
| Millions of dollars | 2020 | 2019 | (Unfavorable) | Change |
| Completion and Production | $ | 7,839 | | $ | 14,031 | | $ | (6,192) | | (44) | % |
| Drilling and Evaluation | 6,606 | | 8,377 | | (1,771) | | (21) | |
| Total revenue | $ | 14,445 | | $ | 22,408 | | $ | (7,963) | | (36) | % |
| By geographic region: | | | | |
| North America | $ | 5,731 | | $ | 11,884 | | $ | (6,153) | | (52) | % |
| Latin America | 1,668 | | 2,364 | | (696) | | (29) | |
| Europe/Africa/CIS | 2,813 | | 3,285 | | (472) | | (14) | |
| Middle East/Asia | 4,233 | | 4,875 | | (642) | | (13) | |
| Total | $ | 14,445 | | $ | 22,408 | | $ | (7,963) | | (36) | % |
| | | | | | | | | | | | | | |
| Operating loss: | | | Favorable | Percentage |
| Millions of dollars | 2020 | 2019 | (Unfavorable) | Change |
| Completion and Production | $ | 995 | | $ | 1,671 | | $ | (676) | | (40) | % |
| Drilling and Evaluation | 569 | | 642 | | (73) | | (11) | |
| Total | 1,564 | | 2,313 | | (749) | | (32) | |
| Corporate and other | (201) | | (255) | | 54 | | 21 | |
| Impairments and other charges | (3,799) | | (2,506) | | (1,293) | | (52) | |
| Total operating loss | $ | (2,436) | | $ | (448) | | $ | (1,988) | | n/m |
| n/m = not meaningful | | | | |
| | | | |
Consolidated revenue in 2020 was $14.4 billion, a decrease of $8.0 billion, or 36%, compared to 2019, mainly due to lower activity and pricing in North America land, primarily associated with stimulation services and well construction. Revenue from North America was 40% of consolidated revenue in 2020 and 53% of consolidated revenue in 2019.
We reported a consolidated operating loss of $2.4 billion in 2020 driven in part by $3.8 billion of impairments and other charges. This compares to an operating loss of $448 million in 2019, driven by $2.5 billion of impairments and other charges. A significant decline in stimulation activity and pricing in North America land during 2020 negatively impacted operating results, partially offset by increase in stimulation activity and completion tool sales in the Middle East/Asia. See Note 2 to the consolidated financial statements for further discussion on impairments and other charges.
OPERATING SEGMENTS
Completion and Production
Completion and Production revenue was $7.8 billion in 2020, a decrease of $6.2 billion, or 44%, compared to 2019. Operating income was $1.0 billion in 2020, a 40% decrease from $1.7 billion in 2019. These results were primarily driven by reduced activity and pricing for pressure pumping services, lower completion tool sales, and reduced artificial lift activity in North America land. Partially offsetting these results were higher completion tool sales in the Eastern Hemisphere.
Drilling and Evaluation
Drilling and Evaluation revenue was $6.6 billion in 2020, a decrease of $1.8 billion, or 21%, from 2019. These results were primarily driven by lower activity for drilling-related services in North America land, lower project management activity in the Middle East/Asia, and a global decrease in wireline activity.
Operating income was $569 million in 2020, a decrease of $73 million, or 11%, compared to 2019. These results were primarily driven by a decline in drilling activity in North America land, coupled with lower project management activity in the
| | | | | | | | |
| Item 7 | Results of Operations in 2020 Compared to 2019 |
Middle East/Asia. Partially offsetting these results were improvements in wireline profitability in the Middle East/Asia and the North Sea, as well as drilling-related services in the North Sea.
GEOGRAPHIC REGIONS
North America
North America revenue was $5.7 billion in 2020, a 52% decrease compared to 2019, resulting from lower activity and pricing in North America land, primarily associated with reduced stimulation, well construction, artificial lift, and wireline activity. This decline was partially offset by increased stimulation activity in the Gulf of Mexico and project management in North America land.
Latin America
Latin America revenue was $1.7 billion in 2020, a 29% decrease compared to 2019, resulting primarily from decreased activity in multiple product service lines in Argentina, Colombia, Ecuador, and Brazil, partially offset by increased project management activity in Mexico and drilling-related services in Guyana.
Europe/Africa/CIS
Europe/Africa/CIS revenue was $2.8 billion in 2020, a 14% decrease compared to 2019. The decrease was due to lower activity for multiple product service lines throughout the region, primarily in Nigeria, Egypt, and United Kingdom, partially offset by increased completion tool sales in the North Sea, Algeria, and Azerbaijan, and drilling-related activity in the North Sea.
Middle East/Asia
Middle East/Asia revenue was $4.2 billion in 2020, a 13% decrease compared to 2019. The decrease was due to lower activity throughout the region, primarily related to project management, stimulation in Saudi Arabia, and well construction activity, partially offset by increased completion tool sales and pipeline services in the Middle East/Asia.
OTHER OPERATING ITEMS
Impairments and other charges were $3.8 billion in 2020, consisting of asset and real estate impairments, primarily associated with pressure pumping and drilling equipment, as well as severance and other costs incurred as we continued to adjust our cost structure during the year. This compares to $2.5 billion of impairments and other charges recorded in 2019, consisting of asset impairments, primarily associated with pressure pumping and drilling equipment, as well as severance and other costs incurred as we adjusted our cost structure during the year. See Note 2 to the consolidated financial statements for further discussion on these charges.
NONOPERATING ITEMS
Loss on early extinguishment of debt. During the year ended December 31, 2020, we recorded a $168 million loss on the early extinguishment of debt, which included a tender premium, unamortized discounts and costs on the retired notes, and tender fees. See Note 9 to the consolidated financial statements for further information.
Income tax (provision) benefit. Our tax (provisions) benefits are sensitive to the geographic mix of earnings and our ability to use our deferred tax assets. During 2020, we recorded a total income tax benefit of $278 million on a pre-tax loss of $3.2 billion, resulting in an effective tax rate of 8.6%. During 2019, we recorded a total income tax provision of $7 million on a pre-tax loss of $1.1 billion, resulting in an effective tax rate of -0.6%. See Note 11 to the consolidated financial statements for significant drivers of these tax (provisions) benefits.
| | | | | | | | |
| Item 7 | Results of Operations in 2019 Compared to 2018 |
RESULTS OF OPERATIONS IN 2019 COMPARED TO 2018
Information related to the comparison of our operating results between the years 2019 and 2018 is included in "Item 7. Management's Discussion and Analysis of Financial Condition and Results of Operations" of our 2019 Form 10-K filed with the SEC and is incorporated by reference into this annual report on Form 10-K.
| | | | | | | | |
| | Item 7 | Critical Accounting Estimates |
CRITICAL ACCOUNTING ESTIMATES
The preparation of financial statements requires the use of judgments and estimates. Our critical accounting policies are described below to provide a better understanding of how we develop our assumptions and judgments about future events and related estimates and how they can impact our financial statements. A critical accounting estimate is one that requires our most difficult, subjective, or complex judgments and assessments and is fundamental to our results of operations. We identified our most critical accounting estimates to be:
- forecasting our income tax (provision) benefit, including our future ability to utilize foreign tax credits and the realizability of deferred tax assets (including net operating loss carryforwards), and providing for uncertain tax positions;
- legal and investigation matters;
- valuations of long-lived assets, including intangible assets and goodwill; and
- allowance for credit losses.
We base our estimates on historical experience and on various other assumptions we believe to be reasonable according to the current facts and circumstances, the results of which form the basis for making judgments about the carrying values of assets and liabilities that are not readily apparent from other sources. We believe the following are the critical accounting policies used in the preparation of our consolidated financial statements, as well as the significant estimates and judgments affecting the application of these policies. This discussion and analysis should be read in conjunction with our consolidated financial statements and related notes included in this report.
Income tax accounting
We recognize the amount of taxes payable or refundable for the current year and use an asset and liability approach in recognizing the amount of deferred tax liabilities and assets for the future tax consequences of events that have been recognized in our financial statements or tax returns. We apply the following basic principles in accounting for our income taxes:
- a current tax liability or asset is recognized for the estimated taxes payable or refundable on tax returns for the current year;
- a deferred tax liability or asset is recognized for the estimated future tax effects attributable to temporary differences and carryforwards;
- the measurement of current and deferred tax liabilities and assets is based on provisions of the enacted tax law, and the effects of potential future changes in tax laws or rates are not considered; and
- the value of deferred tax assets is reduced, if necessary, by the amount of any tax benefits that, based on available evidence, are not expected to be realized.
We determine deferred taxes separately for each tax-paying component (an entity or a group of entities that is consolidated for tax purposes) in each tax jurisdiction. That determination includes the following procedures:
- identifying the types and amounts of existing temporary differences;
- measuring the total deferred tax liability for taxable temporary differences using the applicable tax rate;
- measuring the total deferred tax asset for deductible temporary differences and operating loss carryforwards using the applicable tax rate;
- measuring the deferred tax assets for each type of tax credit carryforward; and
- reducing the deferred tax assets by a valuation allowance if, based on available evidence, it is more likely than not that some portion or all of the deferred tax assets will not be realized.
Our methodology for recording income taxes requires a significant amount of judgment and the use of assumptions and estimates. Additionally, we use forecasts of certain tax elements, such as taxable income and foreign tax credit utilization, as well as evaluate the feasibility of implementing tax planning strategies. Given the inherent uncertainty involved with the use of such variables, there can be significant variation between anticipated and actual results that could have a material impact on our income tax accounts related to continuing operations.
| | | | | | | | |
| | Item 7 | Critical Accounting Estimates |
We have operations in more than 70 countries. Consequently, we are subject to the jurisdiction of a significant number of taxing authorities. The income earned in these various jurisdictions is taxed on differing bases, including net income actually earned, net income deemed earned, and revenue-based tax withholding. Our tax filings are routinely examined in the normal course of business by tax authorities. The final determination of our income tax liabilities involves the interpretation of local tax laws, tax treaties and related authorities in each jurisdiction, as well as the significant use of estimates and assumptions regarding the scope of future operations and results achieved, the timing and nature of income earned and expenditures incurred. The final determination of tax audits or changes in the operating environment, including changes in tax law and currency/repatriation controls, could impact the determination of our income tax liabilities for a tax year and have an adverse effect on our financial statements.
Tax filings of our subsidiaries, unconsolidated affiliates and related entities are routinely examined in the normal course of business by tax authorities. These examinations may result in assessments of additional taxes, which we work to resolve with the tax authorities and through the judicial process. Predicting the outcome of disputed assessments involves some uncertainty. Factors such as the availability of settlement procedures, willingness of tax authorities to negotiate, and the operation and impartiality of judicial systems vary across the different tax jurisdictions and may significantly influence the ultimate outcome. We review the facts for each assessment, and then utilize assumptions and estimates to determine the most likely outcome and provide taxes, interest and penalties, as needed based on this outcome. We provide for uncertain tax positions pursuant to current accounting standards, which prescribe a minimum recognition threshold and measurement methodology that a tax position taken or expected to be taken in a tax return is required to meet before being recognized in the financial statements. The standards also provide guidance for derecognition classification, interest and penalties, accounting in interim periods, disclosure, and transition.
Legal and investigation matters
As discussed in Note 10 of our consolidated financial statements, we are subject to various legal and investigation matters arising in the ordinary course of business. As of December 31, 2020, we have accrued an estimate of the probable and estimable costs for the resolution of some of our legal and investigation matters, which is not material to our consolidated financial statements. For other matters for which the liability is not probable and reasonably estimable, we have not accrued any amounts. Attorneys in our legal department monitor and manage all claims filed against us and review all pending investigations. Generally, the estimate of probable costs related to these matters is developed in consultation with internal and outside legal counsel representing us. Our estimates are based upon an analysis of potential results, assuming a combination of litigation and settlement strategies. The accuracy of these estimates is impacted by, among other things, the complexity of the issues and the amount of due diligence we have been able to perform. We attempt to resolve these matters through settlements, mediation, and arbitration proceedings when possible. If the actual settlement costs, final judgments or fines, after appeals, differ from our estimates, there may be a material adverse effect on our future financial results. We have in the past recorded significant adjustments to our initial estimates of these types of contingencies.
Value of long-lived assets, including intangible assets and goodwill
We carry a variety of long-lived assets on our balance sheet including property, plant and equipment, goodwill, and other intangibles. Impairment is the condition that exists when the carrying amount of a long-lived asset exceeds its fair value, and any impairment charge that we record reduces our operating income. Goodwill is the excess of the cost of an acquired entity over the net of the amounts assigned to assets acquired and liabilities assumed. We conduct impairment tests on goodwill annually, during the third quarter, or more frequently whenever events or changes in circumstances indicate an impairment may exist. We conduct impairment tests on long-lived assets, other than goodwill, whenever events or changes in circumstances indicate that the carrying value may not be recoverable.
When conducting an impairment test on long-lived assets, other than goodwill, we first group individual assets based on the lowest level for which identifiable cash flows are largely independent of the cash flows from other assets. This requires some judgment. We then compare estimated future undiscounted cash flows expected to result from the use and eventual disposition of the asset group to its carrying amount. If the undiscounted cash flows are less than the asset group’s carrying amount, we then determine the asset group's fair value by using a discounted cash flow analysis. This analysis is based on estimates such as management’s short-term and long-term forecast of operating performance, including revenue growth rates and expected profitability margins, estimates of the remaining useful life and service potential of the assets within the asset group, and a discount rate based on our weighted average cost of capital. An impairment loss is measured and recorded as the amount by which the asset group's carrying amount exceeds its fair value. See Note 2 to the consolidated financial statements for impairments and other charges recorded during the year ended December 31, 2020.
| | | | | | | | |
| | Item 7 | Critical Accounting Estimates |
We perform our goodwill impairment assessment for each reporting unit, which is the same as our reportable segments, the Completion and Production division and the Drilling and Evaluation division, comparing the estimated fair value of each reporting unit to the reporting unit’s carrying value, including goodwill. We estimate the fair value for each reporting unit using a discounted cash flow analysis based on management’s short-term and long-term forecast of operating performance. This analysis includes significant assumptions regarding discount rates, revenue growth rates, expected profitability margins, forecasted capital expenditures and the timing of expected future cash flows based on market conditions. If the estimated fair value of a reporting unit exceeds its carrying amount, goodwill of the reporting unit is not considered impaired. If the carrying amount of a reporting unit exceeds its estimated fair value, an impairment loss is measured and recorded.
The impairment assessments discussed above incorporate inherent uncertainties, including projected commodity pricing, supply and demand for our services and future market conditions, which are difficult to predict in volatile economic environments and could result in impairment charges in future periods if actual results materially differ from the estimated assumptions utilized in our forecasts. If market conditions further deteriorate, including crude oil prices significantly declining and remaining at low levels for a sustained period of time, we could be required to record additional impairments of the carrying value of our long-lived assets in the future which could have a material adverse impact on our operating results. See Note 1 to the consolidated financial statements for our accounting policies related to long-lived assets.
Allowance for credit losses
We evaluate our global accounts receivable through a continuous process of assessing our portfolio on an individual customer and overall basis. This process consists of a thorough review of historical collection experience, current aging status of the customer accounts, financial condition of our customers, and whether the receivables involve retainages. We also consider the economic environment of our customers, both from a marketplace and geographic perspective, in evaluating the need for an allowance. Based on our review of these factors, we establish or adjust allowances for specific customers. This process involves judgment and estimation, and frequently involves significant dollar amounts. Accordingly, our results of operations can be affected by adjustments to the allowance due to actual write-offs that differ from estimated amounts.
At December 31, 2020, our allowance for credit losses totaled $824 million, or 22.5% of notes and accounts receivable before the allowance. At December 31, 2019, our allowance for credit losses totaled $776 million, or 15.4% of notes and accounts receivable before the allowance. The allowance for credit losses in both years is primarily comprised of accounts receivable with our primary customer in Venezuela. A hypothetical 100 basis point change in our estimate of the collectability of our notes and accounts receivable balance as of December 31, 2020 would have resulted in a $37 million adjustment to 2020 total operating costs and expenses. See Note 5 to the consolidated financial statements for further information.
OFF BALANCE SHEET ARRANGEMENTS
At December 31, 2020, we had no material off balance sheet arrangements. In the normal course of business, we have agreements with financial institutions under which approximately $1.9 billion of letters of credit, bank guarantees or surety bonds were outstanding as of December 31, 2020. Some of the outstanding letters of credit have triggering events that would entitle a bank to require cash collateralization, however, none of these triggering events have occurred.
FINANCIAL INSTRUMENT MARKET RISK
We are exposed to market risk from changes in foreign currency exchange rates and interest rates. We selectively manage these exposures through the use of derivative instruments, including forward foreign exchange contracts, foreign exchange options, and interest rate swaps. The objective of our risk management strategy is to minimize the volatility from fluctuations in foreign currency and interest rates. We do not use derivative instruments for trading purposes. The counterparties to our forward contracts, options, and interest rate swaps are global commercial and investment banks.
We use a sensitivity analysis model to measure the impact of potential adverse movements in foreign currency exchange rates and interest rates. With respect to foreign exchange sensitivity, after consideration of the impact from our foreign forward contracts and options, a hypothetical 10% adverse change in the value of all our foreign currency positions relative to the United States dollar as of December 31, 2020 would result in a $83 million, pre-tax, loss for our net monetary assets denominated in currencies other than United States dollars. With respect to interest rates sensitivity, after consideration of the impact from our interest rate swap, a hypothetical 100 basis point increase in the LIBOR rate would result in approximately an additional $1 million of interest charges for the year ended December 31, 2020.
| | | | | | | | |
| Item 7 | Financial Instrument Market Risk |
There are certain limitations inherent in the sensitivity analysis presented, primarily due to the assumption that exchange rates and interest rates change instantaneously in an equally adverse fashion. In addition, the analysis are unable to reflect the complex market reactions that normally would arise from the market shifts modeled. While this is our best estimate of the impact of the various scenarios, these estimates should not be viewed as forecasts.
For further information regarding foreign currency exchange risk, interest rate risk, and credit risk, see Note 15 to the consolidated financial statements.
ENVIRONMENTAL MATTERS
We are subject to numerous environmental, legal, and regulatory requirements related to our operations worldwide. For information related to environmental matters, see Note 10 to the consolidated financial statements and "Part I, Item 1(a). “Risk Factors.”
FORWARD-LOOKING INFORMATION
The Private Securities Litigation Reform Act of 1995 provides safe harbor provisions for forward-looking information. Forward-looking information is based on projections and estimates, not historical information. Some statements in this Form 10-K are forward-looking and use words like “may,” “may not,” “believe,” “do not believe,” “plan,” “estimate,” “intend,” “expect,” “do not expect,” “anticipate,” “do not anticipate,” “should,” “likely,” and other expressions. We may also provide oral or written forward-looking information in other materials we release to the public. Forward-looking information involves risk and uncertainties and reflects our best judgment based on current information. Our results of operations can be affected by inaccurate assumptions we make or by known or unknown risks and uncertainties. In addition, other factors may affect the accuracy of our forward-looking information. As a result, no forward-looking information can be guaranteed. Actual events and the results of our operations may vary materially.
We do not assume any responsibility to publicly update any of our forward-looking statements regardless of whether factors change as a result of new information, future events or for any other reason. You should review any additional disclosures we make in our press releases and Forms 10-K, 10-Q, and 8-K filed with or furnished to the SEC. We also suggest that you listen to our quarterly earnings release conference calls with financial analysts.
| | | | | | | | |
| Item 7(a) | Quantitative and Qualitative Disclosures About Market Risk |
Item 7(a). Quantitative and Qualitative Disclosures About Market Risk.
Information related to market risk is included in "Item 7. Management’s Discussion and Analysis of Financial Condition and Results of Operations – Financial Instrument Market Risk” and Note 15 to the consolidated financial statements.
Item 8. Financial Statements and Supplementary Data.
| | | | | |
| PAGE |
| Financial Statements | |
| |
| |
| |
| |
| |
| |
| |
| |
| Notes to Consolidated Financial Statements | |
| |
| |
| |
| |
| |
| |
| |
| |
| |
| |
| |
| |
| |
| |
| |
| |
| |
| |
MANAGEMENT’S REPORT ON INTERNAL CONTROL OVER FINANCIAL REPORTING
The management of Halliburton Company is responsible for establishing and maintaining adequate internal control over financial reporting as defined in the Securities Exchange Act Rule 13a-15(f).
Internal control over financial reporting, no matter how well designed, has inherent limitations. Therefore, even those systems determined to be effective can provide only reasonable assurance with respect to financial statement preparation and presentation. Further, because of changes in conditions, the effectiveness of internal control over financial reporting may vary over time.
Under the supervision and with the participation of our management, including our chief executive officer and chief financial officer, we conducted an evaluation to assess the effectiveness of our internal control over financial reporting as of December 31, 2020 based upon criteria set forth in the Internal Control - Integrated Framework (2013) issued by the Committee of Sponsoring Organizations of the Treadway Commission.
Based on our assessment, we believe that, as of December 31, 2020, our internal control over financial reporting is effective. The effectiveness of Halliburton’s internal control over financial reporting as of December 31, 2020 has been audited by KPMG LLP, an independent registered public accounting firm, as stated in their report that is included herein.
HALLIBURTON COMPANY
by
| | | | | | | | |
| /s/ Jeffrey A. Miller | | /s/ Lance Loeffler |
| Jeffrey A. Miller | | Lance Loeffler |
| Chairman of the Board, President and | | Executive Vice President and |
| Chief Executive Officer | | Chief Financial Officer |
Report of Independent Registered Public Accounting Firm
To the Shareholders and Board of Directors
Halliburton Company:
Opinion on the Consolidated Financial Statements
We have audited the accompanying consolidated balance sheets of Halliburton Company and subsidiaries (the Company) as of December 31, 2020 and 2019, the related consolidated statements of operations, comprehensive income (loss), shareholders’ equity, and cash flows for each of the years in the three-year period ended December 31, 2020, and the related notes (collectively, the consolidated financial statements). In our opinion, the consolidated financial statements present fairly, in all material respects, the financial position of the Company as of December 31, 2020 and 2019, and the results of its operations and its cash flows for each of the years in the three-year period ended December 31, 2020, in conformity with U.S. generally accepted accounting principles.
We also have audited, in accordance with the standards of the Public Company Accounting Oversight Board (United States) (PCAOB), the Company’s internal control over financial reporting as of December 31, 2020, based on criteria established in Internal Control - Integrated Framework (2013) issued by the Committee of Sponsoring Organizations of the Treadway Commission, and our report dated February 5, 2021 expressed an unqualified opinion on the effectiveness of the Company’s internal control over financial reporting.
Change in Accounting Principle
As discussed in Note 6 to the consolidated financial statements, the Company has changed its method of accounting for leases as of January 1, 2019 due to the adoption of Accounting Standards Codification Topic 842, Leases.
Basis for Opinion
These consolidated financial statements are the responsibility of the Company’s management. Our responsibility is to express an opinion on these consolidated financial statements based on our audits. We are a public accounting firm registered with the PCAOB and are required to be independent with respect to the Company in accordance with the U.S. federal securities laws and the applicable rules and regulations of the Securities and Exchange Commission and the PCAOB.
We conducted our audits in accordance with the standards of the PCAOB. Those standards require that we plan and perform the audit to obtain reasonable assurance about whether the consolidated financial statements are free of material misstatement, whether due to error or fraud. Our audits included performing procedures to assess the risks of material misstatement of the consolidated financial statements, whether due to error or fraud, and performing procedures that respond to those risks. Such procedures included examining, on a test basis, evidence regarding the amounts and disclosures in the consolidated financial statements. Our audits also included evaluating the accounting principles used and significant estimates made by management, as well as evaluating the overall presentation of the consolidated financial statements. We believe that our audits provide a reasonable basis for our opinion.
Critical Audit Matters
The critical audit matters communicated below are matters arising from the current period audit of the consolidated financial statements that were communicated or required to be communicated to the audit committee and that: (1) relate to accounts or disclosures that are material to the consolidated financial statements and (2) involved our especially challenging, subjective, or complex judgments. The communication of critical audit matters does not alter in any way our opinion on the consolidated financial statements, taken as a whole, and we are not, by communicating the critical audit matters below, providing separate opinions on the critical audit matters or on the accounts or disclosures to which they relate.
Evaluation of the Realizability of Deferred Tax Assets
As discussed in Notes 1 and 11 to the consolidated financial statements, the Company recognizes deferred tax assets and liabilities for the expected future tax consequences of events that have been recognized in the financial statements. A valuation allowance is provided for deferred tax assets if it is more likely than not that these items will not be realized, which is dependent upon the generation of the future taxable income. As of December 31, 2020, the Company had gross deferred tax assets of $3.8 billion and a related valuation allowance of $1.4 billion.
We identified the evaluation of the realizability of domestic deferred tax assets as a critical audit matter. The evaluation of the realizability of domestic deferred tax assets, specifically related to domestic net operating loss
carryforwards and foreign tax credits, required subjective auditor judgment to assess the forecasts of future taxable income over the periods in which those temporary differences become deductible. Changes in assumptions regarding forecasted taxable income, specifically revenue growth rates, could have an impact on the Company’s evaluation of the realizability of the domestic deferred tax assets.
The following are the primary procedures we performed to address this critical audit matter. We evaluated the design and tested the operating effectiveness of certain internal controls related to the critical audit matter. This included controls related to the development of forecasts of future taxable income. We evaluated the assumptions used in the development of forecasts of future taxable income, specifically revenue growth rates, by comparing to historical actuals while considering current and anticipated future commodity prices or market events. We also evaluated the Company’s history of realizing domestic deferred tax assets by evaluating the expiration of domestic net operating loss carryforwards and foreign tax credits.
Assessment of the Fair Value of Property, Plant and Equipment
As discussed in Notes 1, 2, and 8 to the consolidated financial statements, the gross amount of property, plant and equipment as of December 31, 2020 was $15.4 billion and related accumulated depreciation was $11.0 billion. When events or changes in circumstances indicate that long-lived assets may be impaired, an evaluation is performed. The Company compares estimated future undiscounted cash flows expected to result from the use and eventual disposition of the asset group to its carrying amount. If the asset group's undiscounted cash flows are less than their carrying amount, then they determine the asset group's fair value. The fair value of an asset group is determined by using a discounted cash flow analysis, and an impairment is recognized in the event the fair value is less than the carrying value. The Company recognized an impairment charge of $2.3 billion for the year ended December 31, 2020.
We identified the assessment of the Company’s estimate of the fair value of property, plant and equipment as a critical audit matter for certain asset groups. There was a high degree of subjectivity in evaluating the significant assumptions used in determining the discounted cash flows used to estimate the fair value of certain asset groups, specifically the revenue growth rates, expected profitability margin and the discount rate used.
The following are the primary procedures we performed to address this critical audit matter. We evaluated the design and tested the operating effectiveness of certain internal controls over the Company’s process to estimate the discounted cash flows of certain asset groups, including controls related to the significant assumptions. We evaluated the Company’s development of the revenue growth rates and expected profitability margin assumptions by identifying and assessing the sources of data that management used in their assessment. We evaluated the revenue growth rates and expected profitability margin for consistency with relevant historical data, changes in the business, and external industry data, as applicable. In addition, we involved valuation professionals with specialized skills and knowledge to assist with evaluating the selected discount rate by comparing it against a discount rate range that was independently developed using publicly available market data for comparable companies.
/s/ KPMG LLP
We have served as the Company’s auditor since 2002.
Houston, Texas
February 5, 2021
Report of Independent Registered Public Accounting Firm
To the Shareholders and Board of Directors
Halliburton Company:
Opinion on Internal Control Over Financial Reporting
We have audited Halliburton Company's and subsidiaries' (the Company) internal control over financial reporting as of December 31, 2020, based on criteria established in Internal Control - Integrated Framework (2013) issued by the Committee of Sponsoring Organizations of the Treadway Commission. In our opinion, the Company maintained, in all material respects, effective internal control over financial reporting as of December 31, 2020, based on criteria established in Internal Control - Integrated Framework (2013) issued by the Committee of Sponsoring Organizations of the Treadway Commission.
We also have audited, in accordance with the standards of the Public Company Accounting Oversight Board (United States) (PCAOB), the consolidated balance sheets of the Company as of December 31, 2020 and 2019, the related consolidated statements of operations, comprehensive income (loss), shareholders' equity, and cash flows for each of the years in the three-year period ended December 31, 2020, and the related notes (collectively, the consolidated financial statements), and our report dated February 5, 2021 expressed an unqualified opinion on those consolidated financial statements.
Basis for Opinion
The Company's management is responsible for maintaining effective internal control over financial reporting and for its assessment of the effectiveness of internal control over financial reporting, included in the accompanying Management's Report on Internal Control over Financial Reporting. Our responsibility is to express an opinion on the Company's internal control over financial reporting based on our audit. We are a public accounting firm registered with the PCAOB and are required to be independent with respect to the Company in accordance with the U.S. federal securities laws and the applicable rules and regulations of the Securities and Exchange Commission and the PCAOB.
We conducted our audit in accordance with the standards of the PCAOB. Those standards require that we plan and perform the audit to obtain reasonable assurance about whether effective internal control over financial reporting was maintained in all material respects. Our audit of internal control over financial reporting included obtaining an understanding of internal control over financial reporting, assessing the risk that a material weakness exists, and testing and evaluating the design and operating effectiveness of internal control based on the assessed risk. Our audit also included performing such other procedures as we considered necessary in the circumstances. We believe that our audit provides a reasonable basis for our opinion.
Definition and Limitations of Internal Control Over Financial Reporting
A company's internal control over financial reporting is a process designed to provide reasonable assurance regarding the reliability of financial reporting and the preparation of financial statements for external purposes in accordance with generally accepted accounting principles. A company's internal control over financial reporting includes those policies and procedures that (1) pertain to the maintenance of records that, in reasonable detail, accurately and fairly reflect the transactions and dispositions of the assets of the company; (2) provide reasonable assurance that transactions are recorded as necessary to permit preparation of financial statements in accordance with generally accepted accounting principles, and that receipts and expenditures of the company are being made only in accordance with authorizations of management and directors of the company; and (3) provide reasonable assurance regarding prevention or timely detection of unauthorized acquisition, use, or disposition of the company's assets that could have a material effect on the financial statements.
Because of its inherent limitations, internal control over financial reporting may not prevent or detect misstatements. Also, projections of any evaluation of effectiveness to future periods are subject to the risk that controls may become inadequate because of changes in conditions, or that the degree of compliance with the policies or procedures may deteriorate.
/s/ KPMG LLP
Houston, Texas
February 5, 2021
| | | | | | | | | | | |
HALLIBURTON COMPANY
Consolidated Statements of Operations |
| Year Ended December 31 |
| Millions of dollars and shares except per share data | 2020 | 2019 | 2018 |
| Revenue: | | | |
| Services | $ | 10,203 | | $ | 16,884 | | $ | 18,444 | |
| Product sales | 4,242 | | 5,524 | | 5,551 | |
| Total revenue | 14,445 | | 22,408 | | 23,995 | |
| Operating costs and expenses: | | | |
| Cost of services | 9,458 | | 15,684 | | 16,591 | |
| Cost of sales | 3,442 | | 4,439 | | 4,418 | |
| | | |
| Impairments and other charges | 3,799 | | 2,506 | | 265 | |
| General and administrative | 182 | | 227 | | 254 | |
| | | |
| Total operating costs and expenses | 16,881 | | 22,856 | | 21,528 | |
| Operating income (loss) | (2,436) | | (448) | | 2,467 | |
Interest expense, net of interest income of $38, $23, and $44 | (505) | | (569) | | (554) | |
| Loss on early extinguishment of debt | (168) | | — | | — | |
| Other, net | (111) | | (105) | | (99) | |
| Income (loss) before income taxes | (3,220) | | (1,122) | | 1,814 | |
| Income tax benefit (provision) | 278 | | (7) | | (157) | |
| | | |
| | | |
| Net income (loss) | $ | (2,942) | | $ | (1,129) | | $ | 1,657 | |
| Net income attributable to noncontrolling interest | (3) | | (2) | | (1) | |
| Net income (loss) attributable to company | $ | (2,945) | | $ | (1,131) | | $ | 1,656 | |
| | | |
| | | |
| | | |
| | | |
| | | |
| | | |
| | | |
| | | |
| Basic and diluted income (loss) per share attributable to company shareholders: | | | |
| | | |
| | | |
| Net income (loss) per share | $ | (3.34) | | $ | (1.29) | | $ | 1.89 | |
| | | |
| | | |
| Basic weighted average common shares outstanding | 881 | | 875 | | 875 | |
| Diluted weighted average common shares outstanding | 881 | | 875 | | 877 | |
| See notes to consolidated financial statements. | | | |
| | | | | | | | | | | |
HALLIBURTON COMPANY
Consolidated Statements of Comprehensive Income (Loss) |
| Year Ended December 31 |
| Millions of dollars | 2020 | 2019 | 2018 |
| Net income (loss) | $ | (2,942) | | $ | (1,129) | | $ | 1,657 | |
| Other comprehensive income (loss), net of income taxes: | | | |
| Defined benefit and other post retirement plans adjustment | (24) | | (11) | | 131 | |
| | | |
| Other | 24 | | 3 | | (17) | |
| Other comprehensive income (loss), net of income taxes | — | | (8) | | 114 | |
| Comprehensive income (loss) | $ | (2,942) | | $ | (1,137) | | $ | 1,771 | |
| Comprehensive income attributable to noncontrolling interest | (3) | | (2) | | (1) | |
| Comprehensive income (loss) attributable to company shareholders | $ | (2,945) | | $ | (1,139) | | $ | 1,770 | |
| See notes to consolidated financial statements. | | | |
| | | | | | | | |
HALLIBURTON COMPANY
Consolidated Balance Sheets |
| December 31 |
| Millions of dollars and shares except per share data | 2020 | 2019 |
| Assets |
| Current assets: | | |
| Cash and equivalents | $ | 2,563 | | $ | 2,268 | |
Receivables (net of allowances for credit losses of $824 and $776) | 3,071 | | 4,577 | |
| Inventories | 2,349 | | 3,139 | |
| | |
| Assets held for resale | 550 | | 180 | |
| Other current assets | 942 | | 1,048 | |
| Total current assets | 9,475 | | 11,212 | |
Property, plant and equipment (net of accumulated depreciation of $11,039 and $12,630) | 4,325 | | 7,310 | |
| Goodwill | 2,804 | | 2,812 | |
| Deferred income taxes | 2,166 | | 1,683 | |
| Operating lease right-of-use assets | 786 | | 931 | |
| Other assets | 1,124 | | 1,429 | |
| Total assets | $ | 20,680 | | $ | 25,377 | |
| Liabilities and Shareholders’ Equity |
| Current liabilities: | | |
| Accounts payable | $ | 1,573 | | $ | 2,432 | |
| Current maturities of long-term debt | 695 | | 11 | |
| Accrued employee compensation and benefits | 517 | | 604 | |
| Taxes other than income | 292 | | 310 | |
| Current portion of operating lease liabilities | 251 | | 208 | |
| | |
| Other current liabilities | 1,093 | | 1,313 | |
| Total current liabilities | 4,421 | | 4,878 | |
| Long-term debt | 9,132 | | 10,316 | |
| Operating lease liabilities | 758 | | 825 | |
| Employee compensation and benefits | 562 | | 525 | |
| Other liabilities | 824 | | 808 | |
| Total liabilities | 15,697 | | 17,352 | |
| Shareholders’ equity: | | |
Common stock, par value $2.50 per share (authorized 2,000 shares, issued 1,066 and 1,068 shares) | 2,666 | | 2,669 | |
| Paid-in capital in excess of par value | — | | 143 | |
| Accumulated other comprehensive loss | (362) | | (362) | |
| Retained earnings | 8,691 | | 11,989 | |
Treasury stock, at cost (181 and 190 shares) | (6,021) | | (6,427) | |
| Company shareholders’ equity | 4,974 | | 8,012 | |
| Noncontrolling interest in consolidated subsidiaries | 9 | | 13 | |
| Total shareholders’ equity | 4,983 | | 8,025 | |
| Total liabilities and shareholders’ equity | $ | 20,680 | | $ | 25,377 | |
| See notes to consolidated financial statements. | | |
| | | | | | | | | | | |
HALLIBURTON COMPANY
Consolidated Statements of Cash Flows |
| Year Ended December 31 |
| Millions of dollars | 2020 | 2019 | 2018 |
| Cash flows from operating activities: | | | |
| Net income (loss) | $ | (2,942) | | $ | (1,129) | | $ | 1,657 | |
| Adjustments to reconcile net income (loss) to cash flows from operating activities | | | |
| Impairments and other charges | 3,799 | | 2,506 | | 265 | |
| Cash impact of impairments and other charges - severance payments | (350) | | (144) | | — | |
| Depreciation, depletion, and amortization | 1,058 | | 1,625 | | 1,606 | |
| Deferred income tax benefit | (444) | | (396) | | (267) | |
| Accrued employee benefits | (160) | | (38) | | (69) | |
| Changes in assets and liabilities: | | | |
| Receivables | 1,394 | | 636 | | (186) | |
| Accounts payable | (934) | | (595) | | 483 | |
| Inventories | 340 | | (202) | | (681) | |
| Other operating activities | 120 | | 182 | | 349 | |
| Total cash flows provided by operating activities | 1,881 | | 2,445 | | 3,157 | |
| Cash flows from investing activities: | | | |
| Capital expenditures | (728) | | (1,530) | | (2,026) | |
| Proceeds from sales of property, plant and equipment | 286 | | 190 | | 218 | |
| Payments to acquire businesses, net of cash acquired | — | | — | | (187) | |
| | | |
| | | |
| Other investing activities | (44) | | (105) | | 2 | |
| Total cash flows used in investing activities | (486) | | (1,445) | | (1,993) | |
| Cash flows from financing activities: | | | |
| Payments on long-term borrowings | (1,654) | | (13) | | (445) | |
| Proceeds from issuance of long-term debt, net | 994 | | — | | — | |
| Dividends to shareholders | (278) | | (630) | | (630) | |
| Stock repurchase program | (100) | | (100) | | (400) | |
| Proceeds from issuance of common stock | 87 | | 118 | | 195 | |
| Other financing activities | (56) | | (70) | | (139) | |
| Total cash flows used in financing activities | (1,007) | | (695) | | (1,419) | |
| Effect of exchange rate changes on cash | (93) | | (45) | | (74) | |
| Increase (decrease) in cash and equivalents | 295 | | 260 | | (329) | |
| Cash and equivalents at beginning of year | 2,268 | | 2,008 | | 2,337 | |
| Cash and equivalents at end of year | $ | 2,563 | | $ | 2,268 | | $ | 2,008 | |
| Supplemental disclosure of cash flow information: | | | |
| Cash payments during the period for: | | | |
| Interest | $ | 509 | | $ | 534 | | $ | 556 | |
| Income taxes | $ | 300 | | $ | 363 | | $ | 178 | |
| See notes to consolidated financial statements. | | | |
| | | | | | | | | | | | | | | | | | | | | | | |
HALLIBURTON COMPANY
Consolidated Statements of Shareholders' Equity |
| Company Shareholders’ Equity | | |
| Millions of dollars | Common Stock | Paid-in Capital in Excess of Par Value | Treasury Stock | Retained Earnings | Accumulated Other Comprehensive Income (Loss) | Noncontrolling Interest in Consolidated Subsidiaries | Total |
| Balance at December 31, 2017 | $ | 2,673 | | $ | 207 | | $ | (6,757) | | $ | 12,668 | | $ | (469) | | $ | 27 | | $ | 8,349 | |
| Comprehensive income (loss): | | | | | | | |
| Net income | — | | — | | — | | 1,656 | | — | | 1 | | 1,657 | |
| Other comprehensive income | — | | — | | — | | — | | 114 | | — | | 114 | |
Cash dividends ($0.72 per share) | — | | — | | — | | (630) | | — | | — | | (630) | |
| Stock plans | (2) | | 4 | | 413 | | — | | — | | — | | 415 | |
| Stock repurchase program | — | | — | | (400) | | — | | — | | — | | (400) | |
| Other | — | | — | | — | | 45 | | — | | (6) | | 39 | |
| Balance at December 31, 2018 | $ | 2,671 | | $ | 211 | | $ | (6,744) | | $ | 13,739 | | $ | (355) | | $ | 22 | | $ | 9,544 | |
| Comprehensive income (loss): | | | | | | | |
| Net income (loss) | — | | — | | — | | (1,131) | | — | | 2 | | (1,129) | |
| Other comprehensive loss | — | | — | | — | | — | | (8) | | — | | (8) | |
Cash dividends ($0.72 per share) | — | | — | | — | | (630) | | — | | — | | (630) | |
| Stock plans | (2) | | (67) | | 417 | | — | | — | | — | | 348 | |
| Stock repurchase program | — | | — | | (100) | | — | | — | | — | | (100) | |
| Other | — | | (1) | | — | | 11 | | 1 | | (11) | | — | |
| Balance at December 31, 2019 | $ | 2,669 | | $ | 143 | | $ | (6,427) | | $ | 11,989 | | $ | (362) | | $ | 13 | | $ | 8,025 | |
| Comprehensive income (loss): | | | | | | | |
| Net income (loss) | — | | — | | — | | (2,945) | | — | | 3 | | (2,942) | |
| | | | | | | |
Cash dividends ($0.315 per share) | — | | — | | — | | (278) | | — | | — | | (278) | |
| Stock plans | (3) | | (143) | | 506 | | (75) | | — | | — | | 285 | |
| Stock repurchase program | — | | — | | (100) | | — | | — | | — | | (100) | |
| Other | — | | — | | — | | — | | — | | (7) | | (7) | |
| Balance at December 31, 2020 | $ | 2,666 | | $ | — | | $ | (6,021) | | $ | 8,691 | | $ | (362) | | $ | 9 | | $ | 4,983 | |
| See notes to consolidated financial statements. | | | | | | | |
| | | | | | | | |
| Item 8 | Notes to Consolidated Financial Statements |
HALLIBURTON COMPANY
Notes to Consolidated Financial Statements
Note 1. Description of Company and Significant Accounting Policies
Description of Company
Halliburton Company is one of the world's largest providers of products and services to the energy industry. Its predecessor was established in 1919 and incorporated under the laws of the State of Delaware in 1924. We help our customers maximize asset value throughout the lifecycle of the reservoir - from locating hydrocarbons and managing geological data, to drilling and formation evaluation, well construction and completion, and optimizing production throughout the life of the asset. We serve major, national, and independent oil and natural gas companies throughout the world and operate under two divisions, which form the basis for the two operating segments we report, the Completion and Production segment and the Drilling and Evaluation segment.
Use of estimates
Our financial statements are prepared in conformity with United States generally accepted accounting principles, requiring us to make estimates and assumptions that affect:
- the reported amounts of assets and liabilities and disclosure of contingent assets and liabilities at the date of the financial statements; and
- the reported amounts of revenue and expenses during the reporting period.
We believe the most significant estimates and assumptions are associated with the forecasting of our income tax (provision) benefit and the valuation of deferred taxes, legal reserves, long-lived asset valuations, and allowance for credit losses. Ultimate results could differ from our estimates.
Basis of presentation
The consolidated financial statements include the accounts of our company and all of our subsidiaries that we control or variable interest entities for which we have determined that we are the primary beneficiary. All material intercompany accounts and transactions are eliminated. Investments in companies in which we do not have a controlling interest, but over which we do exercise significant influence, are accounted for using the equity method of accounting. If we do not have significant influence, we use the cost method of accounting. In addition, certain reclassifications of prior period balances have been made to conform to the current period presentation.
Revenue recognition
Our services and products are generally sold based upon purchase orders or contracts with our customers that include fixed or determinable prices but do not include right of return provisions or other significant post-delivery obligations. The vast majority of our service and product contracts are short-term in nature. We recognize revenue based on the transfer of control or our customers' ability to benefit from our services and products in an amount that reflects the consideration we expect to receive in exchange for those services and products. We also assess our customers' ability and intention to pay, which is based on a variety of factors, including our historical payment experience with, and the financial condition of our customers. Rates for services are typically priced on a per day, per meter, per man-hour, or similar basis. See Note 4 for further information on revenue recognition.
Research and development
We maintain an active research and development program. The program improves products, processes, and engineering standards and practices that serve the changing needs of our customers, such as those related to high pressure and high temperature environments, and also develops new products and processes. Research and development costs are expensed as incurred and were $309 million in 2020, $404 million in 2019, and $390 million in 2018.
Cash equivalents
We consider all highly liquid investments with an original maturity of three months or less to be cash equivalents.
Inventories
Inventories are stated at the lower of cost and net realizable value. Cost represents invoice or production cost for new items and original cost. Production cost includes material, labor, and manufacturing overhead. Our inventory is recorded on the weighted average cost method. We regularly review inventory quantities on hand and record provisions for excess or obsolete inventory based primarily on historical usage, estimated product demand, and technological developments.
| | | | | | | | |
| Item 8 | Notes to Consolidated Financial Statements |
Allowance for credit losses
We establish an allowance for credit losses through a review of several factors, including historical collection experience, current aging status of the customer accounts, and current financial condition of our customers. Losses are charged against the allowance when the customer accounts are determined to be uncollectible.
Property, plant and equipment
Other than those assets that have been written down to their fair values due to impairment, property, plant, and equipment are reported at cost less accumulated depreciation, which is generally provided on the straight-line method over the estimated useful lives of the assets. Accelerated depreciation methods are often used for tax purposes, when permitted. Upon sale or retirement of an asset, the related costs and accumulated depreciation are removed from the accounts and any gain or loss is recognized. Planned major maintenance costs are generally expensed as incurred. Expenditures for additions, modifications, and conversions are capitalized when they increase the value or extend the useful life of the asset.
Goodwill and other intangible assets
We record as goodwill the excess purchase price over the fair value of the tangible and identifiable intangible assets acquired in a business acquisition. Changes in the carrying amount of goodwill are detailed below by reportable segment.
| | | | | | | | | | | |
| Millions of dollars | Completion and Production | Drilling and Evaluation | Total |
| Balance at December 31, 2018: | $ | 2,055 | | $ | 770 | | $ | 2,825 | |
| Current year acquisitions | 6 | | 5 | | 11 | |
| Purchase price adjustments for previous acquisitions | (1) | | (1) | | (2) | |
| Other | (21) | | (1) | | (22) | |
| Balance at December 31, 2019: | $ | 2,039 | | $ | 773 | | $ | 2,812 | |
| | | |
| | | |
| Other | (66) | | 58 | | (8) | |
| Balance at December 31, 2020: | $ | 1,973 | | $ | 831 | | $ | 2,804 | |
The reported amounts of goodwill for each reporting unit are reviewed for impairment on an annual basis, during the third quarter, and more frequently when circumstances indicate an impairment may exist. As a result of our goodwill impairment assessments performed in the years ended December 31, 2020, 2019, and 2018, we determined that the fair value of each reporting unit exceeded its net book value and, therefore, no goodwill impairments were deemed necessary. For further information on our goodwill impairment assessments, see "Item 7. Management’s Discussion and Analysis of Financial Condition and Results of Operations – Critical Accounting Estimates.”
We amortize other identifiable intangible assets with a finite life on a straight-line basis over the period which the asset is expected to contribute to our future cash flows, ranging from one year to twenty-eight years. The components of these other intangible assets generally consist of patents, license agreements, non-compete agreements, trademarks, and customer lists and contracts.
Evaluating impairment of long-lived assets
When events or changes in circumstances indicate that long-lived assets other than goodwill may be impaired, an evaluation is performed. For assets classified as held for use, we first group individual assets based on the lowest level for which identifiable cash flows are largely independent of the cash flows from other assets. We then compare estimated future undiscounted cash flows expected to result from the use and eventual disposition of the asset group to its carrying amount. If the asset group's undiscounted cash flows are less than its carrying amount, we then determine the asset group's fair value by using a discounted cash flow analysis and recognize any resulting impairment. When an asset is classified as held for sale, the asset’s book value is evaluated and adjusted to the lower of its carrying amount or fair value less cost to sell. In addition, depreciation and amortization is ceased while it is classified as held for sale. See Note 2 for further information on impairments and other charges recorded in 2020.
Income taxes
We recognize the amount of taxes payable or refundable for the year. In addition, deferred tax assets and liabilities are recognized for the expected future tax consequences of events that have been recognized in the financial statements or tax returns. A valuation allowance is provided for deferred tax assets if it is more likely than not that these items will not be realized.
| | | | | | | | |
| Item 8 | Notes to Consolidated Financial Statements |
In assessing the realizability of deferred tax assets, management considers whether it is more likely than not that some portion or all of the deferred tax assets will not be realized. The ultimate realization of deferred tax assets is dependent upon the generation of future taxable income during the periods in which those temporary differences become deductible. Management considers the scheduled reversal of deferred tax liabilities, projected future taxable income, and tax planning strategies in making this assessment. Based upon the level of historical taxable income and projections for future taxable income over the periods in which the deferred tax assets are deductible, management believes it is more likely than not that we will realize the benefits of these deductible differences, net of the existing valuation allowances.
We recognize interest and penalties related to unrecognized tax benefits within the provision for income taxes on continuing operations in our consolidated statements of operations.
Derivative instruments
At times, we enter into derivative financial transactions to hedge existing or projected exposures to changing foreign currency exchange rates and interest rates. We do not enter into derivative transactions for speculative or trading purposes. We recognize all derivatives on the balance sheet at fair value. Derivatives that are not hedges are adjusted to fair value and reflected through the results of operations. If the derivative is designated as a hedge, depending on the nature of the hedge, changes in the fair value of derivatives are either offset against:
- the change in fair value of the hedged assets, liabilities or firm commitments through earnings; or
- recognized in other comprehensive income until the hedged item is recognized in earnings.
The ineffective portion of a derivative’s change in fair value is recognized in earnings. Recognized gains or losses on derivatives entered into to manage foreign currency exchange risk are included in “Other, net” on the consolidated statements of operations. Gains or losses on interest rate derivatives are included in “Interest expense, net.”
Foreign currency translation
Foreign entities whose functional currency is the United States dollar translate monetary assets and liabilities at year-end exchange rates, and nonmonetary items are translated at historical rates. Revenue and expense transactions are translated at the average rates in effect during the year, except for those expenses associated with nonmonetary balance sheet accounts, which are translated at historical rates. Gains or losses from remeasurement of monetary assets and liabilities due to changes in exchange rates are recognized in our consolidated statements of operations in “Other, net” in the year of occurrence.
Stock-based compensation
Stock-based compensation cost is measured at the date of grant, based on the calculated fair value of the award and is recognized as expense over the employee’s service period, which is generally the vesting period of the equity grant. Additionally, compensation cost is recognized based on awards ultimately expected to vest, therefore, we have reduced the cost for estimated forfeitures based on historical forfeiture rates. Forfeitures are estimated at the time of grant and revised in subsequent periods to reflect actual forfeitures. See Note 13 for additional information related to stock-based compensation.
| | | | | | | | |
| Item 8 | Notes to Consolidated Financial Statements |
Note 2. Impairments and Other Charges
The oil and gas industry experienced an unprecedented disruption during 2020 as a result of a combination of factors, including the substantial decline in global demand for oil caused by the COVID-19 pandemic and subsequent mitigation efforts. This disruption created a substantial surplus of oil and a decline in oil prices. West Texas Intermediate (WTI) oil spot prices decreased during the first quarter of 2020 from a high of $63 per barrel in early January of 2020 to approximately $21 per barrel by the end of the first quarter of 2020. Although oil prices recovered moderately to approximately $48 per barrel by the end of December 2020, WTI oil spot prices averaged approximately $43 per barrel during the fourth quarter of 2020 and $39 per barrel during the year 2020, which was approximately 25% and 31%, respectively, less than the average price per barrel during the same periods in 2019. As a result, oil and gas activity declined significantly during 2020, with the global rig count sinking to the lowest level since 1973. The U.S. and international average rig counts dropped 54% and 25%, respectively, during 2020, contributing to a global rig count decline of 38% since December 31, 2019. In the first and second quarters of 2020, we determined these events constituted triggering events that required us to review the recoverability of our long-lived assets and perform an interim goodwill impairment assessment as of March 31, 2020 and May 1, 2020.
We determined the fair value of our long-lived assets based on a discounted cash flow analysis, with the exception of real estate facilities which are classified as held for sale for which fair value was based on third party sales price estimates. We determined the fair value for each reporting unit in our goodwill impairment assessment using both a discounted cash flow analysis and a multiples-based market approach for comparable companies. Given the current volatile market environment, we utilized third-party valuation advisors to assist us with these valuations. These analyses included significant judgment, including management’s short-term and long-term forecast of operating performance, discount rates based on our weighted average cost of capital, revenue growth rates, profitability margins, capital expenditures, the timing of future cash flows based on an eventual recovery of the oil and gas industry, and in the case of long-lived assets, the remaining useful life and service potential of the asset. These impairment assessments incorporate inherent uncertainties, including projected commodity pricing, supply and demand for our services and future market conditions, which are difficult to predict in volatile economic environments and could result in impairment charges in future periods if actual results materially differ from the estimated assumptions utilized in our forecasts. Based upon our impairment assessments, we determined the carrying amount of some of our long-lived assets exceeded their respective fair values. As a result of our goodwill impairment assessments, we determined that the fair value of each reporting unit exceeded its net book value and, therefore, no goodwill impairments were deemed necessary.
As a result of the events described above, we recorded impairments and other charges of approximately $3.8 billion during the year ended December 31, 2020. The following table presents various pre-tax charges we recorded during the years ended December 31, 2020, 2019, and 2018 which are reflected within "Impairments and other charges" on our consolidated statements of operations.
| | | | | | | | | | | |
| Year Ended December 31 |
| Millions of dollars | 2020 | 2019 | 2018 |
| Long-lived asset impairments | $ | 2,629 | | $ | 1,603 | | $ | — | |
| Inventory costs and write-downs | 505 | | 458 | | — | |
| Severance | 384 | | 172 | | — | |
| Joint ventures | — | | 154 | | — | |
| Venezuela investment write-down | — | | — | | 265 | |
| Other | 281 | | 119 | | — | |
| Total impairments and other charges | $ | 3,799 | | $ | 2,506 | | $ | 265 | |
Of the $3.8 billion of impairments and other charges recorded during the year ended December 31, 2020, approximately $2.4 billion was attributable to our Completion and Production segment and approximately $1.4 billion was attributable to our Drilling and Evaluation segment. Long-lived asset impairments include impairments of property, plant, and equipment, intangible assets, and real estate facilities. The $2.6 billion of long-lived asset impairments during 2020 consisted of the following: $1.0 billion attributable to hydraulic fracturing equipment, the majority of which was located in North America; $297 million related to drilling-related services equipment; $191 million related to right-of-use assets, primarily operating leases; $131 million related to intangible assets; and $394 million associated with other fixed asset impairments. Also included in Long-lived asset impairments is $616 million related to real estate properties, primarily related to a fair value adjustment for a contemplated structured transaction for most of our remaining North America real estate owned assets classified as held for sale, and to approximately 50% of North American facilities being closed, sold, consolidated, or reduced in size during 2020.
| | | | | | | | |
| Item 8 | Notes to Consolidated Financial Statements |
For the year ended December 31, 2019, the $1.6 billion of long-lived asset impairments consisted of the following: $759 million attributable to hydraulic fracturing equipment, the majority of which was located in North America; $243 million related to legacy drilling equipment; $215 million related to real estate owned and classified as held for sale; $139 million related to right-of-use assets associated with operating leases; $98 million related to intangible assets; and $148 million of other fixed asset impairments. We also rationalized our portfolio of existing joint ventures and recorded resulting charges within "Joint ventures" in the table above.
Inventory costs and write-downs in the table above primarily represent disposal of excess inventory, including drilling fluids and other chemicals, and write-downs in which some of our inventory cost exceeded its market value.
For the year ended December 31, 2018, the $265 million impairment related to a write-down of all of our remaining investment in Venezuela.
Given the dynamic nature of the COVID-19 pandemic and related market conditions, we cannot reasonably estimate the period that these events will persist or the full extent of the impact they will have on our business. If market conditions continue to deteriorate, including crude oil prices further declining or remaining at low levels for a sustained period, we may record further asset impairments, which may include an impairment of the carrying value of our goodwill.
Note 3. Business Segment and Geographic Information
We operate under two divisions, which form the basis for the two operating segments we report: the Completion and Production segment and the Drilling and Evaluation segment. Our equity in earnings and losses of unconsolidated affiliates that are accounted for using the equity method of accounting are included within cost of services and cost of sales on our statements of operations, which is part of operating income of the applicable segment.
| | | | | | | | |
| Item 8 | Notes to Consolidated Financial Statements |
Operations by business segment
The following tables present financial information on our business segments.
| | | | | | | | | | | |
| | | |
| Year Ended December 31 |
| Millions of dollars | 2020 | 2019 | 2018 |
| Revenue: | | | |
| Completion and Production | $ | 7,839 | | $ | 14,031 | | $ | 15,973 | |
| Drilling and Evaluation | 6,606 | | 8,377 | | 8,022 | |
| Total revenue | $ | 14,445 | | $ | 22,408 | | $ | 23,995 | |
| Operating income: | | | |
| Completion and Production | $ | 995 | | $ | 1,671 | | $ | 2,278 | |
| Drilling and Evaluation | 569 | | 642 | | 745 | |
| Total operations | 1,564 | | 2,313 | | 3,023 | |
| Corporate and other (a) | (201) | | (255) | | (291) | |
| Impairments and other charges (b) | (3,799) | | (2,506) | | (265) | |
| Total operating income (loss) | $ | (2,436) | | $ | (448) | | $ | 2,467 | |
| Interest expense, net of interest income | $ | (505) | | $ | (569) | | $ | (554) | |
| Loss on early extinguishment of debt | (168) | | — | | — | |
| Other, net | (111) | | (105) | | (99) | |
| Income (loss) before income taxes | $ | (3,220) | | $ | (1,122) | | $ | 1,814 | |
| Capital expenditures: | | | |
| Completion and Production | $ | 314 | | $ | 800 | | $ | 1,364 | |
| Drilling and Evaluation | 410 | | 728 | | 657 | |
| Corporate and other | 4 | | 2 | | 5 | |
| Total | $ | 728 | | $ | 1,530 | | $ | 2,026 | |
| Depreciation, depletion and amortization: | | | |
| Completion and Production | $ | 615 | | $ | 1,049 | | $ | 1,058 | |
| Drilling and Evaluation | 430 | | 552 | | 512 | |
| Corporate and other | 13 | | 24 | | 36 | |
| Total | $ | 1,058 | | $ | 1,625 | | $ | 1,606 | |
(a) Includes certain expenses not attributable to a business segment, such as costs related to support functions and corporate executives, operating lease assets, and also includes amortization expense associated with intangible assets recorded as a result of acquisitions.
(b) Impairments and other charges are as follows:
-For the year ended December 31, 2020, amount includes approximately $2.4 billion attributable to Completion and Production, $1.4 billion attributable to Drilling and Evaluation, and $62 million attributable to Corporate and other.
-For the year ended December 31, 2019, amount includes approximately $1.6 billion attributable to Completion and Production, $849 million attributable to Drilling and Evaluation, and $56 million attributable to Corporate and other.
-For the years ended December 31, 2018, we recorded aggregate charges of $265 million to write-down our investment in Venezuela.
| | | | | | | | |
| December 31 |
| Millions of dollars | 2020 | 2019 |
| Total assets: | | |
| Completion and Production (a) | $ | 7,924 | | $ | 11,894 | |
| Drilling and Evaluation (a) | 6,371 | | 8,059 | |
| Corporate and other (b) | 6,385 | | 5,424 | |
| Total | $ | 20,680 | | $ | 25,377 | |
(a) Assets associated with specific segments primarily include receivables, inventories, property, plant, and equipment, operating lease right-of-use assets, equity in and advances to related companies, and goodwill.
(b) Corporate and other primarily include cash and equivalents and deferred tax assets.
Operations by geographic region
The following tables present information by geographic area. In 2020, 2019, and 2018, based on the location of services provided and products sold, 38%, 51%, and 58%, respectively, of our consolidated revenue was from the United States. No other country accounted for more than 10% of our revenue or property, plant, and equipment during the periods presented. As of December 31, 2020 and December 31, 2019, 49% and 59% of our property, plant, and equipment was located in the United States.
| | | | | | | | | | | |
| |
| Year Ended December 31 |
| Millions of dollars | 2020 | 2019 | 2018 |
| Revenue: | | | |
| North America | $ | 5,731 | | $ | 11,884 | | $ | 14,431 | |
| Latin America | 1,668 | | 2,364 | | 2,065 | |
| Europe/Africa/CIS | 2,813 | | 3,285 | | 2,945 | |
| Middle East/Asia | 4,233 | | 4,875 | | 4,554 | |
| Total | $ | 14,445 | | $ | 22,408 | | $ | 23,995 | |
| | | | | | | | |
| December 31 |
| Millions of dollars | 2020 | 2019 |
| Net property, plant and equipment: | | |
| North America | $ | 2,211 | | $ | 4,666 | |
| Latin America | 544 | | 754 | |
| Europe/Africa/CIS | 602 | | 772 | |
| Middle East/Asia | 968 | | 1,118 | |
| Total | $ | 4,325 | | $ | 7,310 | |
Note 4. Revenue
Revenue is recognized based on the transfer of control or our customers' ability to benefit from our services and products in an amount that reflects the consideration we expect to receive in exchange for those services and products. The vast majority of our service and product contracts are short-term in nature. In recognizing revenue for our services and products, we determine the transaction price of purchase orders or contracts with our customers, which may consist of fixed and variable consideration. We also assess our customers' ability and intention to pay, which is based on a variety of factors, including our historical payment experience with, and the financial condition of our customers. Payment terms and conditions vary by contract type, although terms generally include a requirement of payment within 20 to 60 days. Other judgments involved in recognizing revenue include an assessment of progress towards completion of performance obligations for certain long-term contracts, which involve estimating total costs to determine our progress towards contract completion, and calculating the corresponding amount of revenue to recognize.
Disaggregation of revenue
We disaggregate revenue from contracts with customers into types of services or products, consistent with our two reportable segments, in addition to geographical area. Based on the location of services provided and products sold, 38%, 51%, and 58% of our consolidated revenue was from the United States for the years ended December 31, 2020, 2019, and 2018, respectively. No other country accounted for more than 10% of our revenue. The following table presents information on our disaggregated revenue.
| | | | | | | | |
| Item 8 | Notes to Consolidated Financial Statements |
| | | | | | | | | | | |
| Year Ended December 31 |
| Millions of dollars | 2020 | 2019 | 2018 |
| Revenue by segment: | | | |
| Completion and Production | $ | 7,839 | | $ | 14,031 | | $ | 15,973 | |
| Drilling and Evaluation | 6,606 | | 8,377 | | 8,022 | |
| Total revenue | $ | 14,445 | | $ | 22,408 | | $ | 23,995 | |
| Revenue by geographic region: | | | |
| North America | $ | 5,731 | | $ | 11,884 | | $ | 14,431 | |
| Latin America | 1,668 | | 2,364 | | 2,065 | |
| Europe/Africa/CIS | 2,813 | | 3,285 | | 2,945 | |
| Middle East/Asia | 4,233 | | 4,875 | | 4,554 | |
| Total revenue | $ | 14,445 | | $ | 22,408 | | $ | 23,995 | |
Contract balances
We perform our obligations under contracts with our customers by transferring services and products in exchange for consideration. The timing of our performance often differs from the timing of our customer’s payment, which results in the recognition of receivables and deferred revenue. Deferred revenue represents advance consideration received from customers for contracts where revenue is recognized on future performance of service. Deferred revenue, as well as revenue recognized during the period relating to amounts included as deferred revenue at the beginning of the period, was not material to our consolidated financial statements.
Transaction price allocated to remaining performance obligations
Remaining performance obligations represent firm contracts for which work has not been performed and future revenue recognition is expected. We have elected the practical expedient permitting the exclusion of disclosing remaining performance obligations for contracts that have an original expected duration of one year or less. We have some long-term contracts related to software and integrated project management services such as lump sum turnkey contracts. For software contracts, revenue is generally recognized over time throughout the license period when the software is considered to be a right to access our intellectual property. For lump sum turnkey projects, we recognize revenue over time using an input method, which requires us to exercise judgment. Revenue allocated to remaining performance obligations for these long-term contracts is not material.
Note 5. Receivables
As of December 31, 2020, 32% of our net trade receivables were from customers in the United States. As of December 31, 2019, 36% of our net trade receivables were from customers in the United States. No other country or single customer accounted for more than 10% of our net trade receivables at these dates.
We routinely monitor the financial stability of our customers and employ an extensive process to evaluate the collectability of outstanding receivables. This process, which involves judgment utilizing significant assumptions, includes analysis of our customers’ historical time to pay, financial condition and various financial metrics, debt structure, credit agency ratings, and production profile, as well as political and economic factors in countries of operations and other customer-specific factors.
The table below presents a rollforward of our global allowance for credit losses for 2018, 2019 and 2020.
| | | | | | | | | | | | | | |
| Millions of dollars | Balance at Beginning of Period | Provision (a) |
Other (b) | Balance at End of Period (c) |
| Year ended December 31, 2018 | $ | 725 | | $ | 57 | | $ | (44) | | $ | 738 | |
| Year ended December 31, 2019 | 738 | 50 | (12) | | 776 |
| Year ended December 31, 2020 | 776 | 58 | (10) | | 824 |
(a) Represents increases to allowance for credit losses charged to costs and expenses, net of recoveries.
(b) Includes write-offs, balance sheet reclassifications, and other activity.
(c) The allowance for credit losses in all years is primarily comprised of a full reserve against accounts receivable with our primary customer in Venezuela.
| | | | | | | | |
| Item 8 | Notes to Consolidated Financial Statements |
Note 6. Leases
We adopted a comprehensive new lease accounting standard effective January 1, 2019. The details of the significant changes to our accounting policies resulting from the adoption of the new standard are set out below. We adopted the standard using the optional modified retrospective transition method; accordingly, the comparative information as of December 31, 2018 and for the year ended December 31, 2018 has not been adjusted and continues to be reported under the previous lease standard. Under the new lease standard, assets and liabilities that arise from all leases are required to be recognized on the balance sheet for lessees. Previously, only capital leases, which are now referred to as finance leases, were recorded on the balance sheet. The adoption of this standard resulted in the recognition of approximately $1.0 billion of operating lease right-of-use assets and operating lease liabilities on our consolidated balance sheet as of January 1, 2019. The adoption of this standard did not materially impact our consolidated results of operations for the year ended December 31, 2019.
Beginning January 1, 2019, for all leases with a term in excess of 12 months, we recognized a lease liability equal to the present value of the lease payments and a right-of-use asset representing our right to use the underlying asset for the lease term. For operating leases, lease expense for lease payments is recognized on a straight-line basis over the lease term and accretion of the lease liability, while finance leases include both an operating expense and an interest expense component. For all leases with a term of 12 months or less, we elected the practical expedient to not recognize lease assets and liabilities. We recognize lease expense for these short-term leases on a straight-line basis over the lease term.
We are a lessee for numerous operating leases, primarily related to real estate, transportation, and equipment. The vast majority of our operating leases have remaining lease terms of 10 years or less, some of which include options to extend the leases, and some of which include options to terminate the leases. We generally do not include renewal or termination options in our assessment of the leases unless extension or termination for certain assets is deemed to be reasonably certain. The accounting for some of our leases may require judgment, which includes determining whether a contract contains a lease, determining the incremental borrowing rates to utilize in our net present value calculation of lease payments for lease agreements which do not provide an implicit rate, and assessing the likelihood of renewal or termination options. We also have some lease agreements with lease and non-lease components, which are generally accounted for as a single lease component. For certain equipment leases, such as offshore vessels and drilling rigs, we account for the lease and non-lease components separately.
The following tables illustrate the financial impact of our leases as of and for the years ended December 31, 2020 and December 31, 2019, along with other supplemental information about our existing leases:
| | | | | | | | |
| Item 8 | Notes to Consolidated Financial Statements |
| | | | | | | | |
| Year Ended December 31 |
| Millions of dollars | 2020 | 2019 |
| Components of lease expense: | | |
| Finance lease cost: | | |
| Amortization of right-of-use assets | $ | 19 | | $ | 19 | |
| Interest on lease liabilities | 32 | | 51 | |
| Operating lease cost | 296 | | 355 | |
| Short-term lease cost | 31 | | 110 | |
| Sublease income | (4) | | (5) | |
| Total lease cost | $ | 374 | | $ | 530 | |
For the year ended December 31, 2018, total rentals on our operating leases under the previous lease standard, net of sublease rentals, was $680 million.
| | | | | | | | |
| As of December 31 |
| Millions of dollars | 2020 | 2019 |
| Components of balance sheet: | | |
| Operating leases: | | |
| Operating lease right-of-use assets (non-current) | $ | 786 | | $ | 931 | |
| Current portion of operating lease liabilities | 251 | | 208 | |
| Operating lease liabilities (non-current) | 758 | | 825 | |
| Finance leases: | | |
| Other assets (non-current) | $ | 113 | | $ | 123 | |
| Other current liabilities | 24 | | 19 | |
| Other liabilities (non-current) | 118 | | 124 | |
During the years ended December 31, 2020 and December 31, 2019, impairment charges were recorded related to operating and finance lease right-of-use assets totaling $191 million and $139 million, respectively. See Note 2 to the consolidated financial statements for further discussion on impairments and other charges.
| | | | | | | | |
| Year Ended December 31 |
| Millions of dollars except years and percentages | 2020 | 2019 |
| Other supplemental information: | | |
| Cash paid for amounts included in the measurement of lease liabilities: | | |
| Operating cash flows from operating leases | $ | 299 | | $ | 316 | |
| Operating cash flows from finance leases | 32 | | 51 | |
| Financing cash flows from finance leases | 21 | | 24 | |
| Right-of-use assets obtained in exchange for lease obligations: | | |
| Operating leases (a) | $ | 447 | | $ | 1,362 | |
| Finance leases | 39 | | 74 | |
| Weighted-average remaining lease term: | | |
| Operating leases | 8.6 years | 9.5 years |
| Finance leases | 6.4 years | 5.4 years |
| Weighted-average discount rate for operating leases | 4.1 | % | 4.4 | % |
(a) The 2019 balance primarily consists of operating lease right-of-use assets exchanged for lease obligations upon implementation of the new lease accounting standard on January 1, 2019.
| | | | | | | | |
| Item 8 | Notes to Consolidated Financial Statements |
The following table summarizes the maturity of our operating and finance leases as of December 31, 2020:
| | | | | | | | |
| Millions of dollars | Operating Leases | Finance Leases |
| 2021 | $ | 287 | | $ | 63 | |
| 2022 | 233 | | 63 | |
| 2023 | 146 | | 62 | |
| 2024 | 94 | | 49 | |
| 2025 | 70 | | 38 | |
| Thereafter | 428 | | 55 | |
| Total lease payments | 1,258 | | 330 | |
| Less imputed interest | (249) | | (188) | |
| Total | $ | 1,009 | | $ | 142 | |
Note 7. Inventories
Inventories consisted of the following:
| | | | | | | | |
| December 31 |
| Millions of dollars | 2020 | 2019 |
| Finished products and parts | $ | 1,330 | | $ | 1,865 | |
| Raw materials and supplies | 952 | | 1,147 | |
| Work in process | 67 | | 127 | |
| Total | $ | 2,349 | | $ | 3,139 | |
All amounts in the table above are reported net of obsolescence reserves of $150 million at December 31, 2020 and $149 million at December 31, 2019.
During the year ended December 31, 2020, we recorded $505 million of impairment charges related to inventory. These charges primarily consisted of the disposal of excess inventory, including drilling fluids and other chemicals, and write-downs in which some of our inventory cost exceeded its market value.
Note 8. Property, Plant, and Equipment
Property, plant, and equipment were composed of the following:
| | | | | | | | |
| December 31 |
| Millions of dollars | 2020 | 2019 |
| Land | $ | 120 | | $ | 202 | |
| Buildings and property improvements | 1,652 | | 3,167 | |
| Machinery, equipment, and other | 13,592 | | 16,571 | |
| Total | 15,364 | | 19,940 | |
| Less accumulated depreciation | 11,039 | | 12,630 | |
| Net property, plant, and equipment | $ | 4,325 | | $ | 7,310 | |
During the year ended December 31, 2020, a $2.3 billion impairment charge was recorded related to property, plant, and equipment. See Note 2 to the consolidated financial statements for further discussion on impairments and other charges.
| | | | | | | | |
| Item 8 | Notes to Consolidated Financial Statements |
Classes of assets are depreciated over the following useful lives:
| | | | | | | | |
| Buildings and Property
Improvements |
| 2020 | 2019 |
| 1 - 10 years | 13% | 12% |
| 11 - 20 years | 41% | 41% |
| 21 - 30 years | 21% | 22% |
| 31 - 40 years | 25% | 25% |
| | | | | | | | |
| Machinery, Equipment,
and Other |
| 2020 | 2019 |
| 1 - 5 years | 49% | 43% |
| 6 - 10 years | 41% | 47% |
| 11 - 20 years | 10% | 10% |
Note 9. Debt
Our total debt, including short-term borrowings and current maturities of long-term debt, consisted of the following:
| | | | | | | | |
| December 31 |
| Millions of dollars | 2020 | 2019 |
| 5.0% senior notes due November 2045 | $ | 2,000 | | $ | 2,000 | |
| 3.8% senior notes due November 2025 | 1,000 | | 2,000 | |
| 4.85% senior notes due November 2035 | 1,000 | | 1,000 | |
| 7.45% senior notes due September 2039 | 1,000 | | 1,000 | |
| 2.92% senior notes due March 2030 | 1,000 | | — | |
| 4.75% senior notes due August 2043 | 900 | | 900 | |
| 6.7% senior notes due September 2038 | 800 | | 800 | |
| 3.5% senior notes due August 2023 | 600 | | 1,100 | |
| 4.5% senior notes due November 2041 | 500 | | 500 | |
| 3.25% senior notes due November 2021 | 500 | | 500 | |
| 7.6% senior debentures due August 2096 | 300 | | 300 | |
| 8.75% senior debentures due February 2021 | 185 | | 185 | |
| 6.75% notes due February 2027 | 104 | | 104 | |
| Other | 20 | | 28 | |
| Unamortized debt issuance costs and discounts | (82) | | (90) | |
| Total | 9,827 | | 10,327 | |
| Short-term borrowings and current maturities of long-term debt | (695) | | (11) | |
| Total long-term debt | $ | 9,132 | | $ | 10,316 | |
| | | | | | | | |
| Item 8 | Notes to Consolidated Financial Statements |
$1.0 billion issuance
On March 3, 2020, we issued $1.0 billion aggregate principal amount of 2.92% senior notes due March 2030. Subsequently, on March 5, 2020, we completed a tender offer to purchase $1.5 billion aggregate principal amount of senior notes using proceeds from the debt issuance and cash on hand. In the tender offer, we purchased $500 million aggregate principal amount of our 3.50% senior notes due August 2023 and $1.0 billion aggregate principal amount of our 3.80% senior notes due November 2025. This early debt repurchase resulted in a $168 million loss on extinguishment, which included a tender premium, unamortized discounts and costs on the retired notes, and other tender fees. These costs are included in "Loss on early extinguishment of debt" on our consolidated statements of operations for the year ended December 31, 2020.
Senior debt
The $1.0 billion of senior notes issued in March rank equally with our existing and future senior unsecured indebtedness, have semiannual interest payments and have no sinking fund requirements. We may redeem all of our senior notes from time to time or all of the notes of each series at any time at the applicable redemption prices, plus accrued and unpaid interest. Our 6.75% notes due February 2027, 7.6% senior debentures due August 2096 and 8.75% senior debentures due February 2021 may not be redeemed prior to maturity.
Revolving credit facilities
We have a revolving credit facility with a capacity of $3.5 billion, which expires in March 2024. The facility is for working capital or general corporate purposes. The full amount of the revolving credit facility was available as of December 31, 2020.
Debt maturities
Our long-term debt matures as follows: $695 million in 2021, $9 million in 2022, $602 million in 2023, no amounts in 2024, $1.0 billion in 2025, and the remainder thereafter.
Note 10. Commitments and Contingencies
The Company is subject to various legal or governmental proceedings, claims or investigations, including personal injury, property damage, environmental, and tax-related matters, arising in the ordinary course of business, the resolution of which, in the opinion of management, will not have a material adverse effect on our consolidated results of operations or consolidated financial position. There is inherent risk in any litigation, claim or investigation and no assurance can be given as to the outcome of these proceedings.
Guarantee arrangements
In the normal course of business, we have agreements with financial institutions under which approximately $1.9 billion of letters of credit, bank guarantees, or surety bonds were outstanding as of December 31, 2020. Some of the outstanding letters of credit have triggering events that would entitle a bank to require cash collateralization. None of these off balance sheet arrangements either has, or is likely to have, a material effect on our consolidated financial statements.
Note 11. Income Taxes
The components of the (provision) benefit for income taxes on continuing operations were:
| | | | | | | | | | | |
| Year Ended December 31 |
| Millions of dollars | 2020 | 2019 | 2018 |
| Current income taxes: | | | |
| Federal | $ | 1 | | $ | 32 | | $ | 19 | |
| Foreign | (167) | | (426) | | (428) | |
| State | — | | (9) | | (15) | |
| Total current | (166) | | (403) | | (424) | |
| Deferred income taxes: | | | |
| Federal | 372 | | 383 | | 286 | |
| Foreign | 2 | | (36) | | 9 | |
| State | 70 | | 49 | | (28) | |
| Total deferred | 444 | | 396 | | 267 | |
| Income tax (provision) benefit | $ | 278 | | $ | (7) | | $ | (157) | |
| | | | | | | | |
| Item 8 | Notes to Consolidated Financial Statements |
The United States and foreign components of income (loss) from continuing operations before income taxes were as follows:
| | | | | | | | | | | |
| Year Ended December 31 |
| Millions of dollars | 2020 | 2019 | 2018 |
| United States | $ | (3,031) | | $ | (1,517) | | $ | 1,097 | |
| Foreign | (189) | | 395 | | 717 | |
| Total | $ | (3,220) | | $ | (1,122) | | $ | 1,814 | |
Reconciliations between the actual (provision) benefit for income taxes on continuing operations and that computed by applying the United States statutory rate to income (loss) from continuing operations before income taxes were as follows:
| | | | | | | | | | | |
| Year Ended December 31 |
| 2020 | 2019 | 2018 |
| United States statutory rate | 21.0 | % | 21.0 | % | 21.0 | % |
| Impact of impairments and other charges | (12.3) | | (20.9) | | — | |
| Impact of foreign income taxed at different rates | (1.1) | | 0.8 | | (3.0) | |
| Valuation allowance against tax assets | 0.9 | | (10.7) | | (16.2) | |
| Adjustments of prior year taxes | 0.7 | | 13.0 | | 2.0 | |
| State income taxes | — | | (1.3) | | 1.9 | |
| Venezuela adjustment | — | | — | | 5.7 | |
| Impact of U.S. tax reform | — | | — | | (2.6) | |
| | | |
| | | |
| | | |
| Other items, net | (0.6) | | (2.5) | | (0.1) | |
| Total effective tax rate on continuing operations | 8.6 | % | (0.6) | % | 8.7 | % |
During the year ended December 31, 2020, we recorded a total income tax benefit of $278 million on a pre-tax loss of $3.2 billion, resulting in an effective tax rate of 8.6%. The effective tax rate for 2020 was primarily impacted by our geographic mix of earnings, tax adjustments related to the reassessment of prior year tax accruals and valuation allowances on some of our deferred tax assets. The increase in our valuation allowances results from our decreased forecasted ability to generate sufficient taxable income before the expiration of foreign tax credits and net operating losses as a direct result of deteriorated market conditions that led to impairment charges of $3.8 billion in 2020 and $2.5 billion in 2019. See Note 2 for further information.
The primary components of our deferred tax assets and liabilities were as follows:
| | | | | | | | |
| December 31 |
| Millions of dollars | 2020 | 2019 |
| Gross deferred tax assets: | | |
| Net operating loss carryforwards | $ | 1,691 | | $ | 1,301 | |
| Foreign tax credit carryforwards | 945 | | 877 | |
| Research and development tax credit carryforwards | 196 | | 198 | |
| Employee compensation and benefits | 237 | | 215 | |
| Accrued liabilities | 263 | | 316 | |
| Other | 469 | | 382 | |
| Total gross deferred tax assets | 3,801 | | 3,289 | |
| Gross deferred tax liabilities: | | |
| Depreciation and amortization | 7 | | 373 | |
| Operating lease right-of-use assets | 86 | | 109 | |
| | |
| Other | 155 | | 58 | |
| Total gross deferred tax liabilities | 248 | | 540 | |
| Valuation allowances | 1,394 | | 1,082 | |
| Net deferred income tax asset | $ | 2,159 | | $ | 1,667 | |
At December 31, 2020, we had $1.8 billion of domestic and foreign tax-effected net operating loss carryforwards, with approximately $133 million estimated to be utilized against our unrecognized tax benefits. The ultimate realization of these
| | | | | | | | |
| Item 8 | Notes to Consolidated Financial Statements |
deferred tax assets depends on our ability to generate sufficient taxable income in the appropriate taxing jurisdiction. Our deferred tax assets from net operating losses, foreign tax credits, and research and development credits will expire as follows:
| | | | | | | | | | | | | | | | | |
| Millions of dollars | U.S. Net Operating Loss | Foreign Net Operating Loss | Foreign Tax Credits | Research and Development Credit | Total |
| 2021-2025 | $ | 2 | | $ | 186 | | $ | 533 | | $ | — | | $ | 721 | |
| 2026-2030 | 7 | | 125 | | 557 | | — | | 689 | |
| 2031-2041 | 665 | | 92 | | — | | 196 | | 953 | |
| Non-Expiring | 312 | | 435 | | — | | — | | 747 | |
| $ | 986 | | $ | 838 | | $ | 1,090 | | $ | 196 | | $ | 3,110 | |
During the year ended December 31, 2020, we increased our valuation allowance on deferred tax assets by $312 million related to $16 million associated with foreign deferred tax assets and $296 million associated with foreign tax credits.
In accordance with the Tax Cuts and Jobs Act of 2017, a company’s foreign earnings accumulated under the legacy tax laws are deemed to be repatriated into the United States. We have provided federal and state income tax related to this deemed repatriation. We have not provided incremental United States income taxes and foreign withholding taxes on undistributed earnings of foreign subsidiaries as of December 31, 2020. The Company generally does not provide for taxes related to its undistributed earnings because such earnings either would not be taxable when remitted or they are considered to be indefinitely reinvested.
The following table presents a rollforward of our unrecognized tax benefits and associated interest and penalties.
| | | | | | | | | | | |
| Millions of dollars | Unrecognized Tax Benefits | | Interest
and Penalties |
| Balance at January 1, 2018 | $ | 333 | | | $ | 60 | |
| Change in prior year tax positions | 32 | | | 11 | |
| Change in current year tax positions | 63 | | | — | |
| Cash settlements with taxing authorities | (7) | | | (2) | |
| Lapse of statute of limitations | (4) | | | (2) | |
| Balance at December 31, 2018 | $ | 417 | | | $ | 67 | |
| Change in prior year tax positions | 25 | | | 11 | |
| Change in current year tax positions | 29 | | | — | |
| Cash settlements with taxing authorities | (4) | | | — | |
| Lapse of statute of limitations | (42) | | | (8) | |
| Balance at December 31, 2019 | $ | 425 | | (a) | $ | 70 | |
| Change in prior year tax positions | (66) | | | 6 | |
| Change in current year tax positions | 16 | | | — | |
| Cash settlements with taxing authorities | (3) | | | — | |
| Lapse of statute of limitations | (17) | | | (5) | |
| Balance at December 31, 2020 | $ | 355 | | (a)(b) | $ | 71 | |
(a) Includes $18 million as of December 31, 2020 and $25 million as of December 31, 2019 in foreign unrecognized tax benefits that would give rise to a United States tax credit. As of December 31, 2020 and December 31, 2019, a net $224 million and $271 million without a net operating loss carryforward offset, respectively, of unrecognized tax benefits would positively impact the effective tax rate and be recognized as additional tax benefits in our statement of operations if resolved in our favor.
(b) Includes $17 million that could be resolved within the next 12 months.
Our tax returns are subject to review by the taxing authorities in the jurisdictions where we file tax returns. In most cases we are no longer subject to examination by tax authorities for years before 2009. The only significant operating jurisdiction that has tax filings under review or subject to examination by the tax authorities is the United States. The United States federal income tax filings for tax years 2016 through 2019 are currently under review or remain open for review by the U.S. Internal Revenue Service.
| | | | | | | | |
| Item 8 | Notes to Consolidated Financial Statements |
Note 12. Shareholders’ Equity
Shares of common stock
The following table summarizes total shares of common stock outstanding:
| | | | | | | | |
| December 31 |
| Millions of shares | 2020 | 2019 |
| Issued | 1,066 | | 1,068 | |
| In treasury | (181) | | (190) | |
| Total shares of common stock outstanding | 885 | | 878 | |
Our Board of Directors has authorized a program to repurchase a specified dollar amount of our common stock from time to time. The program does not require a specific number of shares to be purchased and the program may be effected through solicited or unsolicited transactions in the market or in privately negotiated transactions. The program may be terminated or suspended at any time. During the year ended December 31, 2020 we repurchased approximately 7.4 million shares of our common stock for a total cost of $100 million. There were 4.5 million repurchases made under the program during the year ended December 31, 2019. Approximately $5.1 billion remained authorized for repurchases as of December 31, 2020. From the inception of this program in February 2006 through December 31, 2020, we repurchased approximately 224 million shares of our common stock for a total cost of approximately $9.0 billion.
Paid-in Capital in Excess of Par Value
During 2020, we issued common stock from treasury shares under our employee stock purchase plan awards and for restricted stock grants. As a result, additional paid in capital was reduced below zero, which resulted in a reduction of retained earnings by $75 million. Additional issuances from treasury shares could similarly impact additional paid in capital and retained earnings.
Preferred stock
Our preferred stock consists of five million total authorized shares at December 31, 2020, of which none are issued.
Accumulated other comprehensive loss
Accumulated other comprehensive loss consisted of the following:
| | | | | | | | |
| December 31 |
| Millions of dollars | 2020 | 2019 |
| Defined benefit and other postretirement liability adjustments (a) | $ | (226) | | $ | (214) | |
| Cumulative translation adjustment | (83) | | (82) | |
| | |
| Other | (53) | | (66) | |
| Total accumulated other comprehensive loss | $ | (362) | | $ | (362) | |
(a) Included net actuarial losses for our international pension plans of $212 million at December 31, 2020 and $189 million at December 31, 2019.
Note 13. Stock-based Compensation
The following table summarizes stock-based compensation costs for the years ended December 31, 2020, 2019 and 2018.
| | | | | | | | | | | |
| Year Ended December 31 |
| Millions of dollars | 2020 | 2019 | 2018 |
| Stock-based compensation cost | $ | 218 | | $ | 257 | | $ | 274 | |
| Tax benefit | (35) | | (48) | | (51) | |
| Stock-based compensation cost, net of tax | $ | 183 | | $ | 209 | | $ | 223 | |
| | | | | | | | |
| Item 8 | Notes to Consolidated Financial Statements |
Our Stock and Incentive Plan, as amended (Stock Plan), provides for the grant of any or all of the following types of stock-based awards:
- stock options, including incentive stock options and nonqualified stock options;
- restricted stock awards;
- restricted stock unit awards;
- stock appreciation rights; and
- stock value equivalent awards.
There are currently no stock appreciation rights, stock value equivalent awards, or incentive stock options outstanding. Under the terms of the Stock Plan, approximately 247 million shares of common stock have been reserved for issuance to employees and non-employee directors. At December 31, 2020, approximately 23 million shares were available for future grants under the Stock Plan. The stock to be offered pursuant to the grant of an award under the Stock Plan may be authorized but unissued common shares or treasury shares.
In addition to the provisions of the Stock Plan, we also have stock-based compensation provisions under the Restricted Stock Plan for Non-Employee Directors and the Employee Stock Purchase Plan (ESPP).
Each of the active stock-based compensation arrangements is discussed below.
Stock options
The majority of our options are generally issued during the second quarter of the year. All stock options under the Stock Plan are granted at the fair market value of our common stock at the grant date. Employee stock options generally vest ratably over a period of three years and expire 10 years from the grant date. Compensation expense for stock options is generally recognized on a straight line basis over the entire vesting period.
The following table represents our stock options activity during 2020.
| | | | | | | | | | | | | | |
| Number
of Shares
(in millions) | Weighted
Average
Exercise
Price
per Share | Weighted
Average
Remaining
Contractual Term (years) | Aggregate
Intrinsic
Value
(in millions) |
| Outstanding at January 1, 2020 | 25.3 | | $ | 41.58 | | | |
| Granted | 2.2 | | 24.59 | | | |
| | | | |
| Forfeited/expired | (1.6) | | 37.87 | | | |
| Outstanding at December 31, 2020 | 25.9 | | $ | 40.36 | | 5.4 | $ | — | |
| Exercisable at December 31, 2020 | 19.7 | | $ | 44.29 | | 4.5 | $ | — | |
The total intrinsic value of options exercised was $7 million in 2020, $2 million in 2019 and $25 million in 2018. As of December 31, 2020, there was $20 million of unrecognized compensation cost, net of estimated forfeitures, related to nonvested stock options, which is expected to be recognized over a weighted average period of approximately two years.
Cash received from issuance of common stock was $87 million of which none related to proceeds from exercises of stock option during 2020. Cash received from issuance of common stock was $118 million during 2019 and $195 million during 2018, of which $6 million and $88 million related to proceeds from exercises of stock options in 2019 and 2018, respectively. The remainder relates to cash proceeds from the issuance of shares related to our employee stock purchase plan.
| | | | | | | | |
| Item 8 | Notes to Consolidated Financial Statements |
The fair value of options at the date of grant was estimated using the Black-Scholes option pricing model. The expected volatility of options granted was a blended rate based upon implied volatility calculated on actively traded options on our common stock and upon the historical volatility of our common stock. The expected term of options granted was based upon historical observation of actual time elapsed between date of grant and exercise of options for all employees. The assumptions and resulting fair values of options granted were as follows:
| | | | | | | | | | | |
| Year Ended December 31 |
| 2020 | 2019 | 2018 |
| Expected term (in years) | 5.39 | 5.31 | 5.27 |
| Expected volatility | 33% | 31% | 28% |
| Expected dividend yield | 2.92 - 3.23% | 2.25 - 3.88% | 1.37 - 2.29% |
| Risk-free interest rate | 1.43 - 1.69% | 1.35 - 2.51% | 2.27 - 2.84% |
| Weighted average grant-date fair value of option | $5.41 | $5.91 | $11.56 |
Restricted stock
Restricted shares issued under the Stock Plan are restricted as to sale or disposition. These restrictions lapse periodically generally over a period of five years. Restrictions may also lapse for early retirement and other conditions in accordance with our established policies. Upon termination of employment, shares on which restrictions have not lapsed must be returned to us, resulting in restricted stock forfeitures. The fair market value of the stock on the date of grant is amortized and charged to income on a straight-line basis over the requisite service period for the entire award.
In 2020, we also granted performance based restricted stock units, with the actual number of shares earned to be determined at the end of a three year performance period based on our achievement of certain predefined targets. These targets are based upon our average return on capital employed as compared to certain competitors and a modifier based upon stock performance compared to the Oilfield Services Index (OSX). A Monte Carlo simulation that uses a probabilistic approach was performed by an actuary to measure grant date fair value. The fair value of these performance based restricted stock units is recognized on a straight-line basis over the three year performance cycle.
The following table represents our restricted stock awards and restricted stock units granted, vested, and forfeited during 2020.
| | | | | | | | |
| Number of Shares
(in millions) | Weighted Average
Grant-Date Fair
Value per Share |
| Nonvested shares at January 1, 2020 | 18.1 | | $ | 34.72 | |
| Granted | 8.2 | | 16.53 | |
| Vested | (5.4) | | 36.97 | |
| Forfeited | (1.9) | | 33.66 | |
| Nonvested shares at December 31, 2020 | 19.0 | | $ | 26.26 | |
The weighted average grant-date fair value of shares granted was $16.53 during 2020, $24.75 during 2019, and $47.43 during 2018. The total fair value of shares vested was $79 million during 2020, $107 million during 2019, and $219 million during 2018. As of December 31, 2020, there was $330 million of unrecognized compensation cost, net of estimated forfeitures, related to nonvested restricted stock, which is expected to be recognized over a weighted average period of three years.
Employee Stock Purchase Plan
Under the ESPP, eligible employees may have up to 10% of their earnings withheld, subject to some limitations, to be used to purchase shares of our common stock. The ESPP contains four three-month offering periods commencing on January 1, April 1, July 1 and October 1 of each year. The price at which common stock may be purchased under the ESPP is equal to 90% (85% for 2019 and 2018) of the lower of the fair market value of the common stock on the commencement date or last trading day of each offering period. Under the ESPP, 74 million shares of common stock have been reserved for issuance, of which 65 million shares have been sold through the ESPP since the inception of the plan through December 31, 2020 and 9 million shares are available for future issuance. The stock to be offered may be authorized but unissued common shares or treasury shares.
| | | | | | | | |
| Item 8 | Notes to Consolidated Financial Statements |
The fair value of ESPP shares was estimated using the Black-Scholes option pricing model. The expected volatility was a one-year historical volatility of our common stock. The assumptions and resulting fair values were as follows:
| | | | | | | | | | | |
| Year Ended December 31 |
| 2020 | 2019 | 2018 |
| Expected volatility | 68 | % | 34 | % | 25 | % |
| Expected dividend yield | 4.89 | % | 3.06 | % | 1.62 | % |
| Risk-free interest rate | 0.65 | % | 2.20 | % | 1.92 | % |
| Weighted average grant-date fair value per share | $ | 3.18 | | $ | 5.22 | | $ | 8.86 | |
Note 14. Income per Share
Basic income or loss per share is based on the weighted average number of common shares outstanding during the period. Diluted income per share includes additional common shares that would have been outstanding if potential common shares with a dilutive effect had been issued. Antidilutive securities represent potentially dilutive securities which are excluded from the computation of diluted income or loss per share as their impact was antidilutive.
A reconciliation of the number of shares used for the basic and diluted income per share computations is as follows:
| | | | | | | | | | | |
| Year Ended December 31 |
| Millions of shares | 2020 | 2019 | 2018 |
| Basic weighted average common shares outstanding | 881 | | 875 | | 875 | |
| Dilutive effect of awards granted under our stock incentive plans | — | | — | | 2 | |
| Diluted weighted average common shares outstanding | 881 | | 875 | | 877 | |
| Antidilutive shares: | | | |
| Options with exercise price greater than the average market price | 27 | | 24 | | 14 | |
| Options which are antidilutive due to net loss position | 1 | | 1 | | — | |
| Total antidilutive shares | 28 | | 25 | | 14 | |
Note 15. Financial Instruments and Risk Management
The carrying amount of cash and equivalents, receivables and accounts payable, as reflected in the consolidated balance sheets, approximates fair value due to the short maturities of these instruments.
The carrying amount and fair value of our total debt, including short-term borrowings and current maturities of long term debt, is as follows:
| | | | | | | | | | | | | | | | | | | | | | | | | | | | | |
| December 31, 2020 | | December 31, 2019 |
| Millions of dollars | Level 1 | Level 2 | Total fair value | Carrying value | | Level 1 | Level 2 | Total fair value | Carrying value |
| Total debt | $ | 10,856 | | $ | 700 | | $ | 11,556 | | $ | 9,827 | | | $ | 11,093 | | $ | 868 | | $ | 11,961 | | $ | 10,327 | |
The total fair value of our debt decreased during 2020, primarily due to the early repurchase of senior notes partially offset by lower average yields. See Note 9 for further information.
Our debt categorized within level 1 on the fair value hierarchy is calculated using quoted prices in active markets for identical liabilities with transactions occurring on the last two days of period-end. Our debt categorized within level 2 on the fair value hierarchy is calculated using significant observable inputs for similar liabilities where estimated values are determined from observable data points on our other bonds and on other similarly rated corporate debt or from observable data points of transactions occurring prior to two days from period-end and adjusting for changes in market conditions. Differences between the periods presented in our level 1 and level 2 classification of our long-term debt relate to the timing of when transactions are executed. We have no debt categorized within level 3 on the fair value hierarchy based on unobservable inputs.
| | | | | | | | |
| Item 8 | Notes to Consolidated Financial Statements |
We are exposed to market risk from changes in foreign currency exchange rates and interest rates. We selectively manage these exposures through the use of derivative instruments, including forward foreign exchange contracts, foreign exchange options and interest rate swaps. The objective of our risk management strategy is to minimize the volatility from fluctuations in foreign currency and interest rates. We do not use derivative instruments for trading purposes. The fair value of our forward contracts, options and interest rate swaps was not material as of December 31, 2020 or December 31, 2019. The counterparties to our derivatives are primarily global commercial and investment banks.
Foreign currency exchange risk
We have operations in many international locations and are involved in transactions denominated in currencies other than the United States dollar, our functional currency, which exposes us to foreign currency exchange rate risk. Techniques in managing foreign currency exchange risk include, but are not limited to, foreign currency borrowing and investing, and the use of currency exchange instruments. We attempt to selectively manage significant exposures to potential foreign currency exchange losses based on current market conditions, future operating activities, and the associated cost in relation to the perceived risk of loss. The purpose of our foreign currency risk management activities is to minimize the risk that our cash flows from the purchase and sale of products and services in foreign currencies will be adversely affected by changes in exchange rates.
We use forward contracts and options to manage our exposure to fluctuations in the currencies of certain countries in which we do business internationally. These instruments are not treated as hedges for accounting purposes, generally have an expiration date of one year or less, and are not exchange traded. While these instruments are subject to fluctuations in value, the fluctuations are generally offset by the value of the underlying exposures being managed. The use of some of these instruments may limit our ability to benefit from favorable fluctuations in foreign currency exchange rates.
Derivatives are not utilized to manage exposures in some currencies due primarily to the lack of available markets or cost considerations (non-traded currencies). We attempt to manage our working capital position to minimize foreign currency exposure in non-traded currencies and recognize that pricing for the services and products offered in these countries should account for the cost of exchange rate devaluations. We have historically incurred transaction losses in non-traded currencies.
The notional amounts of open foreign exchange derivatives were $817 million at December 31, 2020 and $513 million at December 31, 2019. The notional amounts of these instruments do not generally represent amounts exchanged by the parties, and thus are not a measure of our exposure or of the cash requirements related to these contracts. The fair value of our foreign exchange derivatives as of December 31, 2020 and December 31, 2019 is included in “Other current assets” in our consolidated balance sheets and was immaterial. The fair value of these instruments is categorized within level 2 on the fair value hierarchy and was determined using a market approach with certain inputs, such as notional amounts hedged, exchange rates, and other terms of the contracts that are observable in the market or can be derived from or corroborated by observable data.
Interest rate risk
We are subject to interest rate risk on our existing long-term debt. Our short-term borrowings do not give rise to significant interest rate risk due to their short-term nature. We had fixed rate long-term debt totaling $9.8 billion at December 31, 2020 and $10.3 billion at December 31, 2019. We maintain an interest rate management strategy that is intended to mitigate the exposure to changes in interest rates in the aggregate for our debt portfolio. We use interest rate swaps to effectively convert a portion of our fixed rate debt to floating LIBOR-based rates. Our interest rate swaps, which expire when the underlying debt matures, are designated as fair value hedges of the underlying debt and are determined to be highly effective. These derivative instruments are marked to market with gains and losses recognized currently in interest expense to offset the respective gains and losses recognized on changes in the fair value of the hedged debt.
As of December 31, 2020, we had an interest rate swap relating to one of our debt instruments with a total notional amount of $100 million. The fair value of this interest rate swap as of December 31, 2020 and December 31, 2019 is included in “Other assets” in our consolidated balance sheets and was immaterial. The fair value of this interest rate swap is categorized within level 2 on the fair value hierarchy and was determined using a market approach with inputs, such as the notional amount, LIBOR rate spread, and settlement terms that are observable in the market or can be derived from or corroborated by observable data.
| | | | | | | | |
| Item 8 | Notes to Consolidated Financial Statements |
Credit risk
Financial instruments that potentially subject us to concentrations of credit risk are primarily cash equivalents and trade receivables. It is our practice to place our cash equivalents in high quality investments with various institutions. Our trade receivables are from a broad and diverse group of customers and are generally not collateralized. As of December 31, 2020, 32% of our net trade receivables were from customers in the United States. As of December 31, 2019, 36% of our net trade receivables were from customers in the United States. We maintain an allowance for credit losses based upon several factors, including historical collection experience, current aging status of the customer accounts and financial condition of our customers. See Note 5 for further information.
We do not have any significant concentrations of credit risk with any individual counterparty to our derivative contracts. We select counterparties to those contracts based on our belief that each counterparty’s profitability, balance sheet, and capacity for timely payment of financial commitments is unlikely to be materially adversely affected by foreseeable events.
Note 16. Retirement Plans
Our company and subsidiaries have various plans that cover a significant number of our employees. These plans include defined contribution plans, defined benefit plans, and other postretirement plans:
- our defined contribution plans provide retirement benefits in return for services rendered. These plans provide an individual account for each participant and have terms that specify how contributions to the participant’s account are to be determined rather than the amount of pension benefits the participant is to receive. Contributions to these plans are based on a percentage of pre-tax income, after-tax income, or discretionary amounts determined on an annual basis. Our expense for the defined contribution plans totaled $100 million in 2020, $206 million in 2019, and $193 million in 2018. The decrease in expense from 2019 to 2020 was due to significant headcount reductions during the year ended December 31, 2020, coupled with the suspension of discretionary contributions in 2020.
- our defined benefit plans, which include both funded and unfunded pension plans, define an amount of pension benefit to be provided, usually as a function of age, years of service and/or compensation. The unfunded obligations and net periodic benefit cost of our United States defined benefit plans were not material for the periods presented; and
- our postretirement plans other than pensions are offered to specific eligible employees. The accumulated benefit obligations and net periodic benefit cost for these plans were not material for the periods presented.
Funded status
For our international pension plans, at December 31, 2020, the projected benefit obligation was $1.2 billion and the fair value of plan assets was $1.1 billion, which resulted in an unfunded obligation of $152 million. At December 31, 2019, the projected benefit obligation was $1.1 billion and the fair value of plan assets was $1.0 billion, which resulted in an unfunded obligation of $111 million. The accumulated benefit obligation for our international plans was $1.1 billion at December 31, 2020 and $1.0 billion at December 31, 2019.
The following table presents additional information about our international pension plans.
| | | | | | | | |
| December 31 |
| Millions of dollars | 2020 | 2019 |
| Amounts recognized on the Consolidated Balance Sheets | | |
| Other Assets | $ | 45 | | $ | 85 | |
| Accrued employee compensation and benefits | 8 | | 7 | |
| Employee compensation and benefits | 189 | | 189 | |
Pension plans in which projected benefit obligation exceeded plan assets | | |
| Projected benefit obligation | $ | 228 | | $ | 214 | |
| Fair value of plan assets | 31 | | 18 | |
Pension plans in which accumulated benefit obligation exceeded plan assets | | |
| Accumulated benefit obligation | $ | 126 | | $ | 121 | |
| Fair value of plan assets | 25 | | 18 | |
| | |
|
Fair value measurements of plan assets
The fair value of our plan assets categorized within level 1 on the fair value hierarchy is based on quoted prices in active markets for identical assets. The fair value of our plan assets categorized within level 2 on the fair value hierarchy is
| | | | | | | | |
| Item 8 | Notes to Consolidated Financial Statements |
based on significant observable inputs for similar assets. The fair value of our plan assets categorized within level 3 on the fair value hierarchy is based on significant unobservable inputs.
The following table sets forth the fair values of assets held by our international pension plans by level within the fair value hierarchy.
| | | | | | | | | | | | | | | | | |
| Millions of dollars | Level 1 | Level 2 | Level 3 | Net Asset Value (a) | Total |
| Cash and equivalents | $ | — | | $ | 136 | | $ | — | | $ | — | | $ | 136 | |
| Equity funds (b) | — | | 170 | | — | | — | | 170 | |
| Bond funds (c) | — | | 319 | | — | | 149 | | 468 | |
| Alternatives funds (d) | — | | 4 | | — | | 163 | | 167 | |
| Real estate funds (e) | — | | 68 | | — | | 28 | | 96 | |
| Other investments (f) | 5 | | 21 | | 14 | | — | | 40 | |
| Fair value of plan assets at December 31, 2020 | $ | 5 | | $ | 718 | | $ | 14 | | $ | 340 | | $ | 1,077 | |
| Cash and equivalents | $ | — | | $ | 151 | | $ | — | | $ | — | | $ | 151 | |
| Equity funds (b) | — | | 118 | | — | | — | | 118 | |
| Bond funds (c) | — | | 292 | | — | | 99 | | 391 | |
| Alternatives funds (d) | — | | — | | — | | 197 | | 197 | |
| Real estate funds (e) | — | | 74 | | — | | 29 | | 103 | |
| Other investments (f) | 6 | | 21 | | 15 | | — | | 42 | |
| Fair value of plan assets at December 31, 2019 | $ | 6 | | $ | 656 | | $ | 15 | | $ | 325 | | $ | 1,002 | |
(a) Represents investments measured at fair value using the Net Asset Value (NAV) per share practical expedient and thus has not been categorized in the fair value hierarchy. The fair value amounts presented in this table are intended to permit reconciliation of the fair value hierarchy to the total value of our international pension plans assets.
(b) Strategy of equity funds is to invest in diversified funds of global common stocks.
(c) Strategy of bond funds is to invest in diversified funds of fixed income securities of varying geographies and credit quality.
(d) Strategy of alternative funds is to invest in a fund of diversifying investments, including but not limited to reinsurance, commodities, and currencies.
(e) Strategy of real estate funds is to invest in diversified funds of real estate investment trusts and private real estate.
(f) Other investments primarily include investments in insurance contracts, balanced funds, and government bonds.
Risk management practices for these plans include diversification by issuer, industry and geography, as well as the use of multiple asset classes and investment managers within each asset class. Our investment strategy for our United Kingdom pension plan, which constituted 81% of our international pension plans’ projected benefit obligation at December 31, 2020 and is no longer accruing service benefits, aims to achieve full funding of the benefit obligation, with the plan's assets increasingly composed of investments whose cash flows match the projected liabilities of the plan.
Net periodic benefit cost
Net periodic benefit cost for our international pension plans was $30 million in 2020, $23 million in 2019, and $32 million in 2018.
Actuarial assumptions
Certain weighted-average actuarial assumptions used to determine benefit obligations of our international pension plans at December 31 were as follows:
| | | | | | | | |
| 2020 | 2019 |
| Discount rate | 1.8% | 2.5% |
| Rate of compensation increase | 5.9% | 6.0% |
Certain weighted-average actuarial assumptions used to determine net periodic benefit cost of our international pension plans for the years ended December 31 were as follows:
| | | | | | | | | | | |
| 2020 | 2019 | 2018 |
| Discount rate | 2.5% | 3.3% | 2.8% |
| Expected long-term return on plan assets | 3.5% | 4.4% | 4.1% |
| Rate of compensation increase | 6.0% | 5.8% | 5.5% |
| | | | | | | | |
| Item 8 | Notes to Consolidated Financial Statements |
Assumed long-term rates of return on plan assets, discount rates for estimating benefit obligations, and rates of compensation increases vary by plan according to local economic conditions. Where possible, discount rates were determined based on the prevailing market rates of a portfolio of high-quality debt instruments with maturities matching the expected timing of the payment of the benefit obligations. Expected long-term rates of return on plan assets were determined based upon an evaluation of our plan assets and historical trends and experience, taking into account current and expected market conditions.
Other information
Contributions. Funding requirements for each plan are determined based on the local laws of the country where such plan resides. In certain countries the funding requirements are mandatory, while in other countries they are discretionary. We currently expect to contribute $17 million to our international pension plans in 2021.
Benefit payments. Expected benefit payments over the next 10 years for our international pension plans are as follows: $46 million in 2021, $44 million in 2022, $45 million in 2023, $45 million in 2024, $47 million in 2025, and an aggregate $266 million in years 2026 through 2030.
| | | | | | | | |
| | Item 8 | Quarterly Financial Data |
| | | | | | | | | | | | | | | | | |
HALLIBURTON COMPANY Quarterly Financial Data (Unaudited) |
| Quarter | |
| Millions of dollars except per share data | First | Second | Third | Fourth | Year |
| 2020 | | | | | |
| Revenue | $ | 5,037 | | $ | 3,196 | | $ | 2,975 | | $ | 3,237 | | $ | 14,445 | |
| Operating income (loss) | (571) | | (1,911) | | 142 | | (96) | | (2,436) | |
| Net loss | (1,015) | | (1,681) | | (19) | | (227) | | (2,942) | |
| | | | | |
| | | | | |
| Net loss attributable to company | (1,017) | | (1,676) | | (17) | | (235) | | (2,945) | |
| | | | | |
| | | | | |
| Basic and diluted net loss per share | (1.16) | | (1.91) | | (0.02) | | (0.27) | | (3.34) | |
| | | | | |
| | | | | |
| | | | | |
| | | | | |
| Cash dividends paid per share | 0.18 | | 0.045 | | 0.045 | | 0.045 | | 0.315 | |
| 2019 | | | | | |
| Revenue | $ | 5,737 | | $ | 5,930 | | $ | 5,550 | | $ | 5,191 | | $ | 22,408 | |
| Operating income (loss) | 365 | | 303 | | 536 | | (1,652) | | (448) | |
| Net income (loss) | 152 | | 77 | | 296 | | (1,654) | | (1,129) | |
| | | | | |
| | | | | |
| | | | | |
| Net income (loss) attributable to company | 152 | | 75 | | 295 | | (1,653) | | (1,131) | |
| | | | | |
| | | | | |
| | | | | |
| Basic and diluted net income (loss) per share | 0.17 | | 0.09 | | 0.34 | | (1.88) | | (1.29) | |
| | | | | |
| | | | | |
| | | | | |
| | | | | |
| Cash dividends paid per share | 0.18 | | 0.18 | | 0.18 | | 0.18 | | 0.72 | |
Note: Results for 2020 and 2019 include charges related to asset impairments and other charges. See Note 2 to the consolidated financial statements for further information. |
| | | | | | | | |
| Item 9 | Changes in and Disagreements with Accountants on Accounting and Financial Disclosure |
Item 9. Changes in and Disagreements with Accountants on Accounting and Financial Disclosure.
None.
Item 9(a). Controls and Procedures.
In accordance with the Securities Exchange Act of 1934 Rules 13a-15 and 15d-15, we carried out an evaluation, under the supervision and with the participation of management, including our Chief Executive Officer and Chief Financial Officer, of the effectiveness of our disclosure controls and procedures as of the end of the period covered by this report. Based on that evaluation, our Chief Executive Officer and Chief Financial Officer concluded that our disclosure controls and procedures were effective as of December 31, 2020 to provide reasonable assurance that information required to be disclosed in our reports filed or submitted under the Exchange Act is recorded, processed, summarized, and reported within the time periods specified in the Securities and Exchange Commission’s rules and forms. Our disclosure controls and procedures include controls and procedures designed to ensure that information required to be disclosed in reports filed or submitted under the Exchange Act is accumulated and communicated to our management, including our Chief Executive Officer and Chief Financial Officer, as appropriate, to allow timely decisions regarding required disclosure.
There has been no change in our internal control over financial reporting that occurred during the three months ended December 31, 2020 that has materially affected, or is reasonably likely to materially affect, our internal control over financial reporting.
See page 36 for Management’s Report on Internal Control Over Financial Reporting and page 39 for Report of Independent Registered Public Accounting Firm on its assessment of our internal control over financial reporting.
Item 9(b). Other Information.
None.
| | | | | | | | |
| Item 10 | Directors, Executive Officers and Corporate Governance |
PART III
Item 10. Directors, Executive Officers, and Corporate Governance.
The information required for the directors of the Registrant is incorporated by reference to the Halliburton Company Proxy Statement for our 2021 Annual Meeting of Shareholders (File No. 001-03492) under the captions “Election of Directors” and “Involvement in Certain Legal Proceedings.” The information required for the executive officers of the Registrant is included under Part I on pages 6 through 7 of this annual report. The information required for a delinquent form required under Section 16(a) of the Securities Exchange Act of 1934 is incorporated by reference to the Halliburton Company Proxy Statement for our 2021 Annual Meeting of Shareholders (File No. 001-03492) under the caption “Delinquent Section 16(a) Reports,” to the extent any disclosure is required. The information for our code of ethics is incorporated by reference to the Halliburton Company Proxy Statement for our 2021 Annual Meeting of Shareholders (File No. 001-03492) under the caption “Corporate Governance.” The information regarding our Audit Committee and the independence of its members, along with information about the audit committee financial expert(s) serving on the Audit Committee, is incorporated by reference to the Halliburton Company Proxy Statement for our 2021 Annual Meeting of Shareholders (File No. 001-03492) under the caption “The Board of Directors and Standing Committees of Directors.”
Item 11. Executive Compensation.
This information is incorporated by reference to the Halliburton Company Proxy Statement for our 2021 Annual Meeting of Shareholders (File No. 001-03492) under the captions “Compensation Discussion and Analysis,” “Compensation Committee Report,” “Summary Compensation Table,” “Grants of Plan-Based Awards in Fiscal 2020,” “Outstanding Equity Awards at Fiscal Year End 2020,” “2020 Option Exercises and Stock Vested,” “2020 Nonqualified Deferred Compensation,” “Employment Contracts and Change-in-Control Arrangements,” “Post-Termination or Change-in-Control Payments,” “Equity Compensation Plan Information,” and “Directors’ Compensation.”
Item 12(a). Security Ownership of Certain Beneficial Owners.
This information is incorporated by reference to the Halliburton Company Proxy Statement for our 2021 Annual Meeting of Shareholders (File No. 001-03492) under the caption “Stock Ownership of Certain Beneficial Owners and Management.”
Item 12(b). Security Ownership of Management.
This information is incorporated by reference to the Halliburton Company Proxy Statement for our 2021 Annual Meeting of Shareholders (File No. 001-03492) under the caption “Stock Ownership of Certain Beneficial Owners and Management.”
Item 12(c). Changes in Control.
Not applicable.
Item 12(d). Securities Authorized for Issuance Under Equity Compensation Plans.
This information is incorporated by reference to the Halliburton Company Proxy Statement for our 2021 Annual Meeting of Shareholders (File No. 001-03492) under the caption “Equity Compensation Plan Information.”
Item 13. Certain Relationships and Related Transactions, and Director Independence.
This information is incorporated by reference to the Halliburton Company Proxy Statement for our 2021 Annual Meeting of Shareholders (File No. 001-03492) under the caption “Corporate Governance” to the extent any disclosure is required, and under the caption “The Board of Directors and Standing Committees of Directors.”
Item 14. Principal Accounting Fees and Services.
This information is incorporated by reference to the Halliburton Company Proxy Statement for our 2021 Annual Meeting of Shareholders (File No. 001-03492) under the caption “Fees Paid to KPMG LLP.”
PART IV
Item 15. Exhibits.
| | | | | | | | |
| 1. | Financial Statements: |
| | The reports of the Independent Registered Public Accounting Firm and the financial statements of Halliburton Company are included within Part II, Item 8 of this Annual Report on Form 10-K. |
| | |
| 2. | Financial Statement Schedules: |
| | The schedules listed in Rule 5-04 of Regulation S-X (17 CFR 210.5-04) have been omitted because they are not applicable or the required information is shown in the consolidated financial statements or notes thereto. |
| | |
| 3. | Exhibits: |
| | | | | | | | |
| Exhibit | |
| Number | Exhibits |
| | |
| 3.1 | |
| | |
| 3.2 | |
| | |
| 4.1 | Form of debt security of 8.75% Debentures due February 12, 2021 (incorporated by reference to Exhibit 4(a) to the Form 8-K of Halliburton Company, now known as Halliburton Energy Services, Inc. (the Predecessor), dated as of February 20, 1991, File No. 001-03492). |
| | |
| 4.2 | |
| | |
| 4.3 | Resolutions of the Predecessor’s Board of Directors adopted at a meeting held on February 11, 1991 and of the special pricing committee of the Board of Directors of the Predecessor adopted at a meeting held on February 11, 1991 and the special pricing committee’s consent in lieu of meeting dated February 12, 1991 (incorporated by reference to Exhibit 4(c) to the Predecessor’s Form 8-K dated as of February 20, 1991, File No. 001-03492). |
| | |
| 4.4 | |
| | |
| 4.5 | |
| | |
| | | | | | | | |
| 4.6 | |
| | |
| 4.7 | |
| | |
| 4.8 | |
| | |
| 4.9 | Copies of instruments that define the rights of holders of miscellaneous long-term notes of Halliburton Company and its subsidiaries have not been filed with the Commission. Halliburton Company agrees to furnish copies of these instruments upon request. |
| | |
| 4.10 | Form of Indenture dated as of April 18, 1996 between Dresser and The Bank of New York Trust Company, N.A. (as successor to Texas Commerce Bank National Association), as Trustee (incorporated by reference to Exhibit 4 to Dresser’s Registration Statement on Form S-3/A filed on April 19, 1996, Registration No. 333-01303), as supplemented and amended by Form of First Supplemental Indenture dated as of August 6, 1996 between Dresser and The Bank of New York Trust Company, N.A. (as successor to Texas Commerce Bank National Association), Trustee, for 7.60% Debentures due 2096 (incorporated by reference to Exhibit 4.1 to Dresser’s Form 8-K filed on August 9, 1996, File No. 1-4003). |
| | |
| 4.11 | |
| | |
| 4.12 | Third Supplemental Indenture dated as of December 12, 2003 among DII Industries, LLC, Halliburton Company and The Bank of New York Trust Company, N.A. (as successor to JPMorgan Chase Bank), as Trustee, to the Indenture dated as of April 18, 1996, (incorporated by reference to Exhibit 4.16 to Halliburton’s Form 10-K for the year ended December 31, 2003, File No. 001-03492). |
| | |
| 4.13 | |
| | |
| 4.14 | |
| | |
| 4.15 | |
| | |
| 4.16 | |
| | |
| 4.17 | |
| | |
| 4.18 | |
| | |
| | | | | | | | |
| 4.19 | |
| | |
| 4.20 | |
| | |
| 4.21 | |
| | |
| 4.22 | |
| | |
| 4.23 | |
| | |
| 4.24 | |
| | |
| 4.25 | |
| | |
| 4.26 | |
| | |
| 4.27 | |
| | |
| 4.28 | |
| | |
| 4.29 | |
| | |
| * | 4.30 | |
| | |
| 4.31 | |
| | |
| 4.32 | |
| | |
| † | 10.1 | Halliburton Company Restricted Stock Plan for Non-Employee Directors (incorporated by reference to Appendix B of the Predecessor’s proxy statement dated March 23, 1993, File No. 001-03492). |
| | |
| † | 10.2 | |
| | |
| † | 10.3 | |
| | |
| 10.4 | |
| | | | | | | | |
| | |
| 10.5 | |
| | |
| 10.6 | |
| | |
| 10.7 | |
| | |
| † | 10.8 | |
| | |
| † | 10.9 | |
| | |
| † | 10.10 | |
| | |
| † | 10.11 | |
| | |
| † | 10.12 | |
| | |
| † | 10.13 | |
| | |
| † | 10.14 | |
| | |
| † | 10.15 | |
| | |
| † | 10.16 | |
| | |
| † | 10.17 | |
| | |
| † | 10.18 | |
| | |
| † | 10.19 | |
| | |
| | | | | | | | |
| † | 10.20 | |
| | |
| † | 10.21 | |
| | |
| † | 10.22 | |
| | |
| † | 10.23 | |
| | |
| † | 10.24 | |
| | |
| † | 10.25 | |
| | |
| † | 10.26 | |
| | |
| † | 10.27 | |
| | |
| † | 10.28 | |
| | |
| † | 10.29 | |
| | |
| † | 10.30 | |
| | |
| † | 10.31 | |
| | |
| † | 10.32 | |
| | |
| † | 10.33 | |
| | |
| † | 10.34 | |
| | |
| † | 10.35 | |
| | |
| | | | | | | | |
| 10.36 | U.S. $3,500,000,000 Five Year Revolving Credit Agreement among Halliburton, as Borrower, the Banks party thereto, and Citibank, N.A., as Agent (incorporated by reference to Exhibit 10.1 to Halliburton’s Form 8-K filed March 7, 2019, File No. 001-03492). |
| | |
| † | 10.37 | |
| | |
| † | 10.38 | |
| | |
| † | 10.39 | |
| | |
| † | 10.40 | |
| | |
| 10.41 | |
| | |
| *† | 10.42 | |
| | |
| *† | 10.43 | |
| | |
| * | 21.1 | |
| | |
| * | 23.1 | |
| | |
| * | 24.1 | |
| | |
| | Abdulaziz F. Al Khayyal |
| | William E. Albrecht |
| | M. Katherine Banks |
| | Alan M. Bennett |
| | Milton Carroll |
| | Nance K. Dicciani |
| | Murry S. Gerber |
| | Patricia Hemingway Hall |
| | Robert A. Malone |
| | |
| * | 31.1 | |
| | |
| * | 31.2 | |
| | |
| ** | 32.1 | |
| | |
| ** | 32.2 | |
| | | | | | | | |
| | |
| * | 95 | |
| | |
| * | 101.INS | XBRL Instance Document - the instance document does not appear in the Interactive Data File because its XBRL tags are embedded within the Inline XBRL document |
| | |
| * | 101.SCH | XBRL Taxonomy Extension Schema Document |
| | |
| * | 101.CAL | XBRL Taxonomy Extension Calculation Linkbase Document |
| | |
| * | 101.LAB | XBRL Taxonomy Extension Label Linkbase Document |
| | |
| * | 101.PRE | XBRL Taxonomy Extension Presentation Linkbase Document |
| | |
| * | 101.DEF | XBRL Taxonomy Extension Definition Linkbase Document |
| | |
| * | 104 | Cover Page Interactive Data File - the cover page interactive data file does not appear in the Interactive Data File because its XBRL tags are embedded within the Inline XBRL document |
| | |
| * Filed with this Form 10-K. |
| ** Furnished with this Form 10-K. |
| † Management contracts or compensatory plans or arrangements. |
Item 16. Form 10-K Summary.
None.
SIGNATURES
As required by Section 13 or 15(d) of the Securities Exchange Act of 1934, the registrant has authorized this report to be signed on its behalf by the undersigned authorized individuals on this 5th day of February, 2021.
| | | | | |
| |
| HALLIBURTON COMPANY |
| |
| |
| |
| |
| By | /s/ Jeffrey A. Miller |
| Jeffrey A. Miller |
| Chairman of the Board, President and Chief Executive Officer |
As required by the Securities Exchange Act of 1934, this report has been signed below by the following persons in the capacities indicated on this 5th day of February, 2021.
| | | | | |
| Signature | Title |
| |
| |
| |
| |
| /s/ Jeffrey A. Miller | Chairman of the Board, Director, President and |
| Jeffrey A. Miller | Chief Executive Officer |
| |
| |
| |
| |
| /s/ Lance Loeffler | Executive Vice President and |
| Lance Loeffler | Chief Financial Officer |
| |
| |
| |
| |
| /s/ Charles E. Geer, Jr. | Senior Vice President and |
| Charles E. Geer, Jr. | Chief Accounting Officer |
| | | | | |
| Signature | Title |
| |
| * Abdulaziz F. Al Khayyal | Director |
| Abdulaziz F. Al Khayyal | |
| |
| * William E. Albrecht | Director |
| William E. Albrecht | |
| |
| * M. Katherine Banks | Director |
| M. Katherine Banks | |
| |
| * Alan M. Bennett | Director |
| Alan M. Bennett | |
| |
| * Milton Carroll | Director |
| Milton Carroll | |
| |
| * Nance K. Dicciani | Director |
| Nance K. Dicciani | |
| |
| * Murry S. Gerber | Director |
| Murry S. Gerber | |
| |
| * Patricia Hemingway Hall | Director |
| Patricia Hemingway Hall | |
| |
| * Robert A. Malone | Director |
| Robert A. Malone | |
| |
| |
| |
| |
| /s/ Van H. Beckwith | |
| *By Van H. Beckwith, Attorney-in-fact | |