
UNITED STATES SECURITIES AND EXCHANGE COMMISSION
Washington, D.C. 20549
FORM 10-K
(Mark One)
[☒ ] ANNUAL REPORT PURSUANT TO SECTION 13 OR 15(d) OF THE SECURITIES EXCHANGE ACT OF 1934
For the fiscal year ended December 31, 2019
OR
[☐ ] TRANSITION REPORT PURSUANT TO SECTION 13 OR 15(d) OF THE SECURITIES EXCHANGE ACT OF 1934
For the transition period from _______ to _______
Commission File Number 1-3671
(Exact name of registrant as specified in its charter)
State or other jurisdiction of incorporation or organization | IRS Employer Identification No. | |||
Address of principal executive offices | Zip code | |||
Registrant’s telephone number, including area code:
Securities registered pursuant to Section 12(b) of the Act:
Title of each class | Trading Symbol(s) | Name of each exchange on which registered |
Securities registered pursuant to Section 12(g) of the Act:
None |
Indicate by check mark if the registrant is a well-known seasoned issuer, as defined in Rule 405 of the Securities Act. Yes ü No ___
Indicate by check mark if the registrant is not required to file reports pursuant to Section 13 or Section 15(d) of the Act. Yes ___ No ü
Indicate by check mark whether the registrant (1) has filed all reports required to be filed by Section 13 or 15(d) of the Securities Exchange Act of 1934 during the preceding 12 months (or for such shorter period that the registrant was required to file such reports), and (2) has been subject to such filing requirements for the past 90 days. Yes ü No ___
Indicate by check mark whether the registrant has submitted electronically every Interactive Data File required to be submitted pursuant to Rule 405 of Regulation S-T (§232.405 of this chapter) during the preceding 12 months (or for such shorter period that the registrant was required to submit such files). Yes ü No ___
Indicate by check mark whether the registrant is a large accelerated filer, an accelerated filer, a non-accelerated filer, a smaller reporting company, or an emerging growth company. See the definitions of “large accelerated filer,” “accelerated filer,” “smaller reporting company,” and “emerging growth company” in Rule 12b-2 of the Exchange Act.
If an emerging growth company, indicate by check mark if the registrant has elected not to use the extended transition period for complying with any new or revised financial accounting standards provided pursuant to Section 13(a) of the Exchange Act. __
Indicate by check mark whether the registrant is a shell company (as defined in Rule 12b-2 of the Exchange Act). Yes ☐ No ü
The aggregate market value of the voting common equity held by non-affiliates of the registrant was $48,851,568,997 as of June 30, 2019 (based on the closing price of the shares on the New York Stock Exchange).
DOCUMENTS INCORPORATED BY REFERENCE:
Part III incorporates by reference information from certain portions of the registrant’s definitive proxy statement for the 2020 annual meeting of shareholders to be filed with the Securities and Exchange Commission within 120 days after the close of the fiscal year.
1
INDEX
PART I | PAGE | |
Item 1. | ||
Item 1A. | ||
Item 1B. | ||
Item 2. | ||
Item 3. | ||
Item 4. | ||
PART II | ||
Item 5. | ||
Item 6. | ||
Item 7. | ||
Item 7A. | ||
Item 8. | ||
Item 9. | ||
Item 9A. | ||
Item 9B. | ||
PART III | ||
Item 10. | ||
Item 11. | ||
Item 12. | ||
Item 13. | ||
Item 14. | Principal Accountant Fees and Services | |
PART IV | ||
Item 15. | ||
Item 16. | ||
2
PART I
ITEM 1. BUSINESS
(Dollars in millions, except per-share amounts or unless otherwise noted)
BUSINESS OVERVIEW
General Dynamics is a global aerospace and defense company that offers a broad portfolio of products and services in business aviation; combat vehicles, weapons systems and munitions; information technology (IT) services; command, control, communications, computers, intelligence, surveillance and reconnaissance (C4ISR) solutions; and shipbuilding and ship repair.
General Dynamics was incorporated in Delaware in 1952. We took actions beginning in the mid-1990s that laid the foundation for modern-day General Dynamics, including acquiring Gulfstream Aerospace Corporation, combat-vehicle businesses, IT services and C4ISR solutions companies, and additional shipyards. In 2018, we continued to position our company for future growth and superior profitability through the acquisition of CSRA, our largest acquisition to date.
Our company consists of 10 business units, which are organized into five operating segments: Aerospace, Combat Systems, Information Technology, Mission Systems and Marine Systems. We refer to the latter four segments collectively as our defense segments. We have a balanced business model which gives each business unit the flexibility to stay agile and maintain an intimate understanding of customer requirements. Each business unit is responsible for the execution of its strategy and operational performance. Our corporate leaders set the overall strategy and governance for the company and are responsible for allocating and deploying capital. Our ethos — based on honesty, transparency, trust and alignment — undergirds our culture, our business model and our decision-making. This unique model keeps us focused on our priorities: exceeding customer expectations; executing on backlog; managing costs; implementing continuous improvement; and maximizing earnings, cash and return on invested capital.
Following is additional information on each of our operating segments.
AEROSPACE
Our Aerospace segment is at the forefront of the business-jet industry. The segment consists of our Gulfstream and Jet Aviation business units. We offer a family of Gulfstream aircraft and provide a full range of services for business aircraft produced by Gulfstream and other original equipment manufacturers. We have earned our reputation through:
• | superior aircraft design, quality, performance, safety and reliability; |
• | technologically advanced flight deck and cabin systems; and |
• | industry-leading customer support. |
Gulfstream designs, manufactures and supports the world’s most technologically advanced business-jet aircraft. Our product line encompasses aircraft across a variety of price and performance options from mid- to ultra-large-cabin business jets. The many combinations of range, speed, size and cabin customization generate aircraft best suited for each customer’s unique requirements.
Our disciplined and consistent approach to new product development allows us to repeatedly introduce first-to-market capabilities that set industry standards for safety, performance, quality, speed and comfort.
3
Our continual investment in research and development (R&D) leads to new aircraft that consistently broaden customer offerings while raising the bar for safety and performance. Product enhancement and development efforts include initiatives in advanced avionics, composites, flight-control and vision systems, acoustics, and cabin technologies. As part of its sustainability strategy, Gulfstream, in 2019, made its first customer sales of sustainable aviation fuel.
In 2019, the all-new G600 earned both its type and production certificates from the U.S. Federal Aviation Administration (FAA), and we delivered the first aircraft to customers. The G600 has a range of 6,500 nautical miles at a cruise speed of Mach 0.85 and a maximum operating speed of Mach 0.925. The aircraft has earned 11 city-pair speed records and has low cabin altitude air pressure to reduce travel fatigue. The G600 joins the G500, which achieved its certifications and first customer deliveries in 2018. Both aircraft reflect our consistent, long-term investment in R&D, and both have seen strong customer interest. The G500 and G600 received Aviation Week’s 2020 Platform Laureate Award for extraordinary achievement in business aviation.
The ultra-long-range, ultra-large-cabin G650 and G650ER continue to generate significant customer interest, with more than 400 aircraft of this family currently operating in 40 countries. Since the first G650 entered service in 2012, its capabilities and reliability have led to significant sales and installed base around the globe. In 2019, the G650ER continued to demonstrate superior speed and range capabilities, conducting a record-setting flight from Singapore to Tucson, Arizona, over a distance of 8,379 nautical miles at an average speed of 597 miles per hour (Mach 0.85).
In October, we announced the launch of the ultra-long-range G700, which we expect will enter service in 2022. The G700 is designed to blend our most spacious cabin with the advanced Symmetry flight deck and superior high-speed performance to enable a range of 7,500 nautical miles at Mach 0.85 or 6,400 nautical miles at Mach 0.90. There is already significant customer interest in this new product in both the domestic and international markets.
Gulfstream designs, develops and manufactures aircraft in Savannah, Georgia, including manufacturing of all large-cabin models. The mid-cabin G280 is assembled by a non-U.S. partner. All models are outfitted in Gulfstream’s U.S. facilities. In support of Gulfstream’s growing aircraft portfolio and customer base, we continue to invest in our facilities. At our Savannah campus, we have added new purpose-built manufacturing facilities, increased aircraft service capacity, and opened a customer-support distribution center and a dedicated R&D center.
We offer comprehensive support for the more than 2,800 Gulfstream aircraft in service around the world and operate the largest factory-owned service network in the industry. We operate a 24/7 year-round Customer Support Center and offer on-call Gulfstream aircraft technicians ready to deploy around the world for customer service requirements.
In 2019, we opened a new maintenance, repair and overhaul (MRO) facility in Savannah to accommodate fleet growth, giving Gulfstream more than one-million square feet of dedicated MRO hangar, office and shop space in Savannah. We also significantly expanded our MRO service center in Appleton, Wisconsin, which now has more than 100,000 square feet of hangar space, enough to accommodate 12 G650ER aircraft.
In 2019, Gulfstream and Jet Aviation opened a new 10,000-square-foot terminal and 43,000-square-foot hangar at Van Nuys, the primary business-aviation airport servicing the Los Angeles area. Gulfstream utilizes the space as an MRO service center, its second in the area complementing its Long Beach facility. Van Nuys will serve as the operating base for Gulfstream’s local Field and Airborne Support Team (FAST), a rapid-response unit that specializes in troubleshooting grounded aircraft. Jet Aviation uses the space as a fixed-base operator (FBO) facility and became the first FBO at Van Nuys to offer sustainable aviation fuel.
4
Jet Aviation has been a global leader in business-aviation services for over 50 years, providing comprehensive services and an extensive network of locations for aircraft owners and operators. With approximately 50 airport sites throughout North America, Europe, the Middle East and Asia Pacific, our offerings include maintenance, FBO, aircraft management, charter, staffing and government fleet services. In 2019, we continued to grow our global footprint, conducting acquisitions, expansions or significant renovations in key business-aviation markets including Teterboro, New Jersey; Dallas, Texas; Scottsdale, Arizona; San Juan, Puerto Rico; West Palm Beach, Florida; and the Middle East. With its relentless devotion to customer service, Jet Aviation was named Fixed Base Operator of the Year at the 2019 Aviation Business Awards.
In addition to these capabilities, Jet Aviation manages nearly 300 business aircraft globally on behalf of individual and corporate owners. Jet Aviation also offers custom completions for narrow- and wide-body aircraft. We increased the capacity of Jet Aviation’s wide-body hangar in Basel, Switzerland, to 94,000 square feet, to fulfill the demand for completions and refurbishments.
As a market leader in the business-aviation industry, the Aerospace segment is focused on developing innovative first-to-market technologies and products; providing exemplary service to customers globally; and driving efficiencies in aircraft production, completions and services.
Revenue for the Aerospace segment was 25% of our consolidated revenue in 2019, 23% in 2018 and 26% in 2017. Revenue by major products and services was as follows:
Year Ended December 31 | 2019 | 2018 | 2017 | ||||||||
Aircraft manufacturing and completions | $ | 7,355 | $ | 6,226 | $ | 6,320 | |||||
Aircraft services | 2,154 | 2,096 | 1,743 | ||||||||
Pre-owned aircraft | 292 | 133 | 66 | ||||||||
Total Aerospace | $ | 9,801 | $ | 8,455 | $ | 8,129 | |||||
COMBAT SYSTEMS
Our Combat Systems segment offers combat vehicles, weapons systems and munitions for the U.S. government and its non-U.S. partners. We are a platform solutions provider, offering market-leading design, development, production, modernization and sustainment services. With extensive and proven product lines, we deliver tailored solutions for diverse customer-mission needs. Our Combat Systems segment is well-positioned to serve the growing needs of its largest customer, the U.S. Army, as it increases the readiness of its current force and modernizes for the future, while at the same time meeting the growing international demand driven by the global threat environment. We work closely with the U.S. Army Futures Command to meet its critical modernization objectives, currently participating in five of its cross-functional teams. Our large installed base of wheeled and tracked vehicles around the world and expertise gained from innovative research, engineering and production programs position us well for modernization programs, support and sustainment services, and future development programs.
Our Combat Systems segment consists of three business units: European Land Systems, Land Systems, and Ordnance and Tactical Systems. The segment’s product lines include:
• | wheeled combat and tactical vehicles; |
• | main battle tanks and tracked combat vehicles; |
• | weapons systems, armament and munitions; and |
• | maintenance, logistics support and sustainment services. |
5
Wheeled combat and tactical vehicles: The segment provides a full range of vehicles to a global customer base, which includes vehicles in over 20 countries.
The Stryker is an eight-wheeled, medium-weight combat vehicle that combines mobility and survivability. Over 3,300 Strykers have been fielded to date. Strykers come in 11 different variants, with approximately 70% commonality across the fleet. We continue to innovate and demonstrate ways the Stryker can be modified to address the Army’s evolving operational needs.
In 2018, the Army made the decision to upgrade all nine Stryker brigades to the Stryker A1 configuration. We are currently under contract for two of the brigades, with estimated completion in 2021. The Stryker A1 builds upon the combat-proven double-V-hull (DVH) configuration, providing significantly higher rates of survivability against mines and improvised explosive devices. In addition to the DVH survivability, the Stryker A1 provides a 50% power upgrade with a 450-horsepower engine, 60,000-pound suspension to improve cross-country mobility, 910-amp alternator for power and growth margin, and an improved digital, in-vehicle network. It is among the most versatile, mobile and safe personnel carriers in the Army inventory.
The Stryker Maneuver Short-Range Air Defense vehicle (M-SHORAD) program integrates an air defense mission package onto a reconfigured Stryker A1 vehicle. The M-SHORAD vehicle is another variation we quickly developed to address the Army’s requirement to counter closer-in air and missile defense threats. We also produce the Stryker Infantry Carrier Vehicle Dragoon (ICVD), which delivers greater firepower via a 30mm weapon system. First delivered in 2017, the Army announced in 2019 that it would outfit three brigades with the medium caliber weapons system. We continue to work on high-energy laser and mobile command post options. We expect the Stryker platform to continue to demonstrate its versatility well into the future.
In 2019, the Royal Thai Army took delivery of the first set of Stryker fighting vehicles purchased through a foreign military sale contract for $175 that includes 60 Stryker vehicles with equipment and support. Thailand is the first country to receive Stryker vehicles under export.
We also have a market-leading position in light armored vehicles (LAVs) with more than 13,000 vehicles in service around the world. Our LAVs combine advanced technologies and combat-proven survivability. We are upgrading the Canadian Army’s fleet of LAVs to increase mobility, survivability and lethality, as well as enhance the vehicle’s surveillance suite. Additionally, in 2019 we were awarded a contract from Canada for 360 combat support LAVs in eight variants for $1.3 billion. We also provide, under a contract with the Canadian government, wheeled armored vehicles for export and associated logistics through 2024.
We deliver high-mobility, versatile Pandur and Piranha armored vehicles to non-U.S. customers. The Pandur family of vehicles serves as a common platform for various armament and equipment configurations. The Piranha is a multi-role vehicle well-suited for a variety of combat operations. We are producing Piranha vehicles for Denmark, Romania and Switzerland, and upgrading Piranha vehicles for Ireland. We continue to work closely with the Spanish government to achieve a contract award to produce 348 8x8 vehicles based on the Piranha 5 vehicle in six variants and provide associated logistical support. There are over 3,000 Pandurs and 11,000 Piranhas in service worldwide.
Outside the United States, the Duro and Eagle vehicles offer a range of options and weight classes. We are upgrading Duro tactical vehicles for the Swiss Army and producing Eagle 5 armored wheeled vehicles for the Royal Danish Army. Additionally, we provide a portfolio of mobile bridge systems with payloads ranging from 100 kilograms to 100 tons, which can be deployed within minutes to enable heavy vehicles, including Abrams tanks, to cross various sizes of water barriers.
Main battle tanks and tracked combat vehicles: The segment’s powerful tracked vehicles provide key combat capabilities to customers around the world. The Abrams main battle tank offers a proven, decisive
6
edge in combat. We are maximizing the effectiveness and lethality of the U.S. Army’s M1A2 Abrams tank fleet with the System Enhancement Package Version 3 (SEPv3), which provides technological advancements in communications, power generation, fuel efficiency and armor. In 2019, we were awarded a contract for $714 from the Army to upgrade 174 M1A1 Abrams main battle tanks to the state-of-the-art M1A2 SEPv3 configuration. This brings the total number of M1A2 SEPv3 tanks ordered by the Army since 2018 to 274, or more than three brigades of tanks. We are currently under contract to develop further upgrades for the SEPv4 configuration. Additionally, we are upgrading Abrams tanks for several non-U.S. partners.
We are delivering 12 medium-weight, large-caliber prototype vehicles for the Army’s Mobile Protected Firepower program, providing a new opportunity to field vehicles in Infantry Brigade Combat Team (IBCT) formations using our newest combat-proven capabilities suite. The vehicles are highly lethal, survivable and mobile.
We are producing the British Army’s AJAX armored fighting vehicle, a next-generation, medium-weight tracked combat vehicle. The segment will also provide in-service support for the AJAX vehicle fleet. With six variants, the AJAX family of vehicles offers advanced electronic architecture and proven technology for an unparalleled balance of survivability, lethality and mobility, along with high reliability for a vehicle in its weight class. Work on the AJAX program is transitioning from engineering to test and then to full production. We expect to be in steady-state production through 2024.
Weapons systems, armament and munitions: Complementing these military-vehicle offerings, the segment designs, develops and produces a comprehensive array of sophisticated weapons systems. For ground forces, we manufacture M2/M2-A1 heavy machine guns and MK19/MK47 grenade launchers. The segment also produces legacy and next-generation weapons systems for shipboard applications. For airborne platforms, we produce weapons such as high-speed Gatling guns for all U.S. fighter aircraft, including the Joint Strike Fighter.
Our munitions portfolio covers the full breadth of naval, air and ground forces applications across all calibers and weapons platforms for the U.S. government and its non-U.S. partners. In North America, the segment maintains a market-leading position in the supply of Hydra-70 rockets, large-caliber tank ammunition, medium-caliber ammunition, mortar and artillery projectiles, tactical missile aerostructures, high-performance warheads, military propellants, and conventional bombs and bomb cases.
The Combat Systems segment emphasizes operational excellence and continuous improvement in a dynamic threat environment with ever-evolving customer needs. We are focused on innovation, affordability and speed to market to deliver increased survivability, performance and lethality on the battlefield.
Revenue for the Combat Systems segment was 18% of our consolidated revenue in 2019, 17% in 2018 and 19% in 2017. Revenue by major products and services was as follows:
Year Ended December 31 | 2019 | 2018 | 2017 | ||||||||
Military vehicles | $ | 4,620 | $ | 4,027 | $ | 3,731 | |||||
Weapons systems, armament and munitions | 1,906 | 1,798 | 1,633 | ||||||||
Engineering and other services | 481 | 416 | 585 | ||||||||
Total Combat Systems | $ | 7,007 | $ | 6,241 | $ | 5,949 | |||||
7
INFORMATION TECHNOLOGY
Our Information Technology segment provides a wide spectrum of services and capabilities, including artificial intelligence, cloud computing, cyber, software development, systems engineering, IT modernization and data analytics. We put these technologies to work across thousands of projects, combining in-depth technical expertise with deep mission knowledge for a broad spectrum of customers in the defense, intelligence and federal civilian markets.
With a network of more than 90 global partners, we develop solutions that keep our customers at the leading edge of technology in support of their missions. Our highly skilled workforce is central to our diverse portfolio of services and comprises over 30,000 employees, including technologists, mission experts and cleared personnel. This portfolio aligns to three broad capability categories:
• | IT services; |
• | IT infrastructure modernization; and |
• | professional services. |
IT services: We manage global IT enterprise operations for our customers, including in the classified domain. We provide technology consulting, solution design, system integration, operations and maintenance, cloud services, applications development, and cyber defense for enterprise systems.
At the Pentagon, we provide cybersecurity services that include end-point security, network security and incident handling. For the Centers for Medicare & Medicaid Services (CMS), we provide IT hosting and operating services and maintenance in support of claims processing for more than 49 million Medicare beneficiaries.
In 2019, we received several key contracts to provide intelligence services to classified customers. We were also awarded a contract for $325 by the U.S. Department of Homeland Security (DHS) to provide priority telecommunications services to the Cybersecurity and Infrastructure Security Agency’s Emergency Communications Division to maintain continuity of government operations during emergencies. We provide telecommunication expertise and priority voice, data, video and information services during natural disasters, acts of terrorism and war. These critical services maintain real-time emergency communications for thousands of users across the federal government, facilitating the continuity of operations and emergency response.
IT infrastructure modernization: We provide IT infrastructure modernization services for our defense and national security customers, including designing, building and operating global enterprise IT infrastructures; system design and engineering; data center consolidation; and cloud strategy, migration and operation.
We are working with the Department of Defense (DoD) to migrate its applications to the cloud. This program — milCloud 2.0 — provides a hybrid cloud solution designed specifically for the warfighter that offers ease of use, improved performance, enhanced security and greater affordability. Additionally, we provide engineering and technical services in support of our national security customers, protecting mission-critical systems and information from domestic and foreign adversaries with advanced cybersecurity capabilities.
In 2019, we were selected by the Department of Health and Human Services (HHS) to provide advanced technologies to support increased efficiencies in its workforce. This will include artificial intelligence, machine learning, natural language processing and robotic process automation. We also support DHS with migration and consolidation of data center operations while introducing new technologies to improve security and mission performance.
8
Professional services: Our portfolio of professional services includes logistics and supply chain management; training and simulation; and life sciences, medical research and specialized mission support services.
In 2019, we won a $2 billion contract to continue managing the U.S. State Department’s global supply chain that ensures the secure transportation and delivery of millions of assets to worldwide posts including those in high-threat environments. Through this contract, we also secure U.S. posts abroad and help the government respond to natural disasters with logistics and transportation services. In our defense portfolio, we provide turnkey training and simulation services for the U.S. Army’s Aviation Center of Excellence in Fort Rucker, Alabama, the largest helicopter flight training program in the world.
In 2019, we won a contract for $44 to continue conducting research on traumatic brain injury, symptom diagnostics, treatment, rehabilitation methods and the effect of repetitive exposure to sub-concussive blasts from weapons. We have supported this contract through a network of 21 sites since 2014. These include military treatment facilities, major trauma rehabilitation sites within the Department of Veterans Affairs, U.S. Special Operations Command and the Defense Health Agency headquarters in Fairfax, Virginia.
Revenue for the Information Technology segment was $8.4 billion in 2019, $8.3 billion in 2018 and $4.4 billion in 2017, which represented 21%, 23% and 14% of our consolidated revenue in each of the respective years.
MISSION SYSTEMS
Our Mission Systems segment is a global provider of mission-critical products and systems. We offer solutions across all domains and produce a unique combination of products and capabilities that are purpose-built for essential C4ISR and cybersecurity applications. Our technology and products are often built into platforms and integrated systems on which our customers rely. The Mission Systems segment has more than 100 locations worldwide and employs more than 13,000 engineering and technical professionals dedicated to solving the toughest security and technology challenges facing the United States and its partners. The segment’s portfolio includes prime contract programs in which we deliver innovative defense-electronics hardware and integrated systems as well as subcontract efforts in support of large-scale land, air, sea and space platforms. Additionally, our Mission Systems and Information Technology segments are often partners, building on complementary skills to pursue business opportunities in the defense and intelligence markets. This ability to offer an integrated solution can provide a more economical outcome for the customer than separate procurements from varied vendors.
The Mission Systems segment is organized into three core capabilities:
• | ground systems and products; |
• | space, intelligence and cyber systems; and |
• | naval, air and electronic systems. |
Ground systems and products: Our Mission Systems segment is a leading manufacturer and integrator of tactical, secure communications systems for a diverse customer base, both U.S. and non-U.S. We design, build, deploy and support mission command applications; assured position, navigation and timing components; and other communications equipment and networking solutions for the U.S. defense community and non-U.S. partners. We also provide communications equipment, sensors and software for public-safety applications and to the federal government. Additionally, we provide data collection and processing products, command and control applications, and computing and communications equipment.
9
We are the prime contractor for the U.S. Army’s mobile communications backbone, which provides secure voice, video and data capabilities to soldiers on-the-move, and the ability to rapidly insert new technologies into the system.
We continue to work closely with our Army customer to evolve its capabilities to meet the threats of the future. In 2019, we were awarded an indefinite delivery, indefinite quantity (IDIQ) contract to provide electronic and cyber warfare capabilities by leading a nationwide team of cyber technology companies to integrate technologies from multiple domains to achieve desired cyber effects.
In 2019, we partnered with the Army to field a new and improved Global Positioning System (GPS) capability, known as Mounted Assured Positioning, Navigation and Timing System (MAPS) Gen 1, onto Strykers based in Germany. MAPS Gen 1 allows U.S. forces to operate in an environment where GPS signals are degraded or denied, and could eventually extend to thousands of vehicles across Europe.
With a 50-year legacy in radio frequency communications and networks, we offer a range of radio products and systems for military, government and commercial customers, as well as long-term evolution broadband communications networks for first responders. We provide CM-300/350 V2 digital radios to the FAA, used by air traffic control centers, commercial airports, military air stations and range installations for reliable ground-to-air communications. In 2019, Mission Systems introduced the URC-300 radio. The URC-300 is built with a software-based architecture, enabling customization and future enhancements as new technology becomes available.
We also provide many capabilities to non-U.S. agencies and commercial customers. We developed, deployed, and continue to modernize and support fully integrated, secure combat voice and data networks for the armies of Canada and the United Kingdom. These efforts, which we have supported for almost 30 years, are ongoing through the Morpheus program, which aims to modernize the United Kingdom’s communications and command-and-control systems across three armed services by evolving the Bowman network into a more open, agile architecture.
Space, intelligence and cyber systems: Mission Systems engineers space payloads for advanced missions, builds and manages spaceborne and ground-based communications systems, and provides mission-data tracking equipment and processing capabilities for our customers. Additionally, we design and develop high-performance sensors to gather intelligence data from across the land, air, sea, space and cyber domains, and provide geospatial intelligence products and services to meet the needs of our customers in the global defense, civilian and commercial markets.
In 2019, the U.S. Navy’s Mobile User Objective System (MUOS), completed the Multiservice Operational Test and Evaluation (MOT&E) making it ready for operational use. Under a Navy contract with a maximum potential contract value of $732 awarded in 2019, we will sustain the integrated ground systems for this next-generation narrowband satellite communications system.
We also offer a variety of cyber products and software, including our family of encryption products, to protect and defend our customers’ critical information. We continually evolve our TACLANE family of network encryptors, the most widely deployed National Security Agency (NSA)-certified Type 1 in-line network encryptors, and our ProtecD@R family of data-at-rest encryptors. In 2019, our TACLANE-Nano compact Type 1 encryptor for mobile users was certified by the NSA to protect information classified up to the top secret/sensitive compartmented information (TS/SCI) level. In addition, we offer trusted multi-level and cross-domain technologies that our customers use to securely access information at various levels of security with speed and efficiency.
With an eye toward developing next-generation, emerging technologies, we acquired a company in 2019 with extensive expertise in AI that specializes in deploying deep learning algorithms on small, power-
10
efficient appliances and mobile devices. This new investment brings a wealth of artificial intelligence and machine learning knowledge, experience and capabilities to our customers across all domains.
Naval, air and electronic systems: We provide platform integration services for maritime and aviation platforms and for strategic weapons systems and advanced electronic systems, including computing systems, displays and data management, for both U.S. and non-U.S. customers.
We have a 50-year legacy of providing advanced fire-control systems for all of the Navy’s submarine programs, both attack and ballistic missile. We are developing and integrating commercial off-the-shelf software and hardware upgrades to improve the tactical control capabilities for several submarine classes.
The segment’s combat and seaframe control systems serve as the technology backbone for the Navy’s Independence-variant Littoral Combat Ship (LCS) and the Expeditionary Fast Transport (EPF) ships. In 2019, we completed the integration of a new over-the-horizon missile capability onto the USS Gabrielle Giffords (LCS 10). As the Independence-variant LCS systems integrator, we are responsible for the design, integration and testing of the navigation, command, control, computing, communication, seaframe control and combat management systems on each ship.
We also design and manufacture unmanned underwater vehicles (UUVs) for U.S. and non-U.S. military and commercial customers. We have integrated more than 100 sensors across our family of Bluefin Robotics UUVs and continue to develop new capabilities for unmanned operations throughout constrained waterways and the open ocean. In 2019, our Knifefish surface mine countermeasure UUV received approval to enter low-rate initial production, paving the way for the Navy to procure five systems (10 total Knifefish UUVs). In 2019, we extended the Bluefin product line with the release of the Bluefin-12 UUV. This advanced, mission-ready UUV offers embedded intelligence and increased mission modularity to complete users’ evolving, long-endurance and high-consequence missions.
Our Digital Modular Radio (DMR) is the first software-defined radio to become a communications system standard for the Navy. The DMR is a four-channel radio that serves as the Navy’s communications hub for surface ships, submarines and shore-site communications. As a multi-channel radio, it simultaneously communicates with a wide spectrum of tactical radios and can communicate information at different security levels.
For airborne platforms, we offer high-assurance mission and display systems, signal and sensor processing, and command-and-control solutions. Our mission computers provide pilots with advanced situational awareness and combat systems control. Our avionics, radomes, or encrypted communication systems are present on nearly every U.S. military aircraft in service today, including the F-35, F-16, F/A-18, F-22, P-3, P-8 and AV-8B.
Revenue for the Mission Systems segment was $4.9 billion in 2019, $4.7 billion in 2018 and $4.5 billion in 2017, which represented 13% of our consolidated revenue in 2019 and 2018 and 15% in 2017.
MARINE SYSTEMS
Our Marine Systems segment is a market-leading designer and builder of nuclear-powered submarines, surface combatants, and auxiliary and combat-logistics ships for the U.S. Navy, and Jones Act ships for commercial customers. We also provide repair services for nearly all classes of Navy ships. With shipyards on both U.S. coasts, our Marine Systems segment consists of three business units: Bath Iron Works, Electric Boat and NASSCO. The segment’s platforms and capabilities include:
• | nuclear-powered submarines; |
• | surface combatants; |
11
• | auxiliary and combat-logistics ships; |
• | commercial product carriers and containerships; |
• | design and engineering support services; and |
• | maintenance, modernization and lifecycle support services. |
We have a long history as one of the Navy’s primary shipbuilders, constructing and maintaining the ships of today’s fleet while designing and developing next-generation platforms. More than 90% of our segment’s revenue is for Navy engineering, construction and lifecycle support awarded under large, multi-year contracts. We maintain the most sophisticated marine engineering center in the world, designing and testing concepts to support future capabilities. Our ability to design, build and maintain our nation’s most technologically sophisticated warships is a critical element of the U.S. defense industrial base.
The largest business unit in our Marine Systems segment is Electric Boat, the lead shipyard on all Navy nuclear-powered submarine programs, including both the Virginia-class attack submarine and the future Columbia-class ballistic-missile submarine. Designed to meet diverse global mission requirements, these submarines operate with highly advanced capabilities and stealth in both littoral and open-ocean environments.
The Navy procures Virginia-class submarines in multi-boat blocks, currently at a two-per-year rate, through a teaming arrangement between Electric Boat and an industry partner. We have delivered 18 Virginia-class submarines from the first three blocks. There are 10 boats from Block IV currently under contract and scheduled for delivery through 2024. Over the life of the Virginia-class submarine program, we have driven delivery timelines from 88 months in Block I to a current average rate of 68 months, while doubling the build rate of construction to two ships per year and consistently increasing ship capability.
In 2019, the Navy awarded Electric Boat a $22.2 billion contract, the largest shipbuilding contract in the Navy’s history, for construction of the fifth block of Virginia-class submarines. Electric Boat will serve as the prime contractor for construction of nine submarines, including eight with the Virginia Payload Module (VPM), and an option for a tenth submarine with the VPM that, if exercised, will bring the total contract value to $24.1 billion. In addition to significant upgrades in performance, the VPM included in this block is an 84-foot hull section that adds four additional payload tubes, more than tripling the strike capacity of these submarines and providing unique capabilities to support special missions. With the Block V contract, there are now 19 Virginia-class submarines in our backlog scheduled for delivery through 2029.
Electric Boat is the designer and builder of the Navy’s Columbia-class ballistic-missile submarine, a 12-boat program that the Navy considers its top priority. These submarines will provide strategic deterrent capabilities for decades and are scheduled to come online when the current Ohio-class ballistic-missile submarine fleet reaches the end of its service life beginning in 2027. We are slated to begin construction of the lead boat in the fourth quarter of 2020 and deliver it to the Navy in support of the Ohio-class retirements. In 2019, we broke ground on a 200,000-square-foot assembly building in Groton, Connecticut, that is the centerpiece of a $1.7 billion expansion to support Columbia- and Virginia-class construction.
We have developed a comprehensive resource master plan to ensure that we will have a fully trained workforce in place to support the increased demand for skilled trades for both the Columbia- and Virginia-class programs. We continue to invest in our facilities, optimizing the timing between investments and returns, while coordinating closely with the Navy. We are also working with our network of more than 3,000 suppliers — mostly small businesses — to provide for concurrent production of the Virginia- and Columbia-class submarine programs.
Bath Iron Works builds the Arleigh Burke-class (DDG-51) guided-missile destroyers and manages modernization and lifecycle support for the class. The Navy restarted the program in 2010 after a four-year
12
break in construction. Bath Iron Works delivered the first ship in the restart program to the Navy in 2017. We have a total of 11 ships in backlog scheduled for delivery through 2026. In 2019, the Navy awarded Bath Iron Works a contract to continue providing planning yard services for DDG-51s, to include design, material kitting, logistics, planning and execution.
Bath Iron Works is the hull, mechanical and electrical (HME) prime contractor for the Navy’s Zumwalt-class (DDG-1000) guided-missile destroyer program. We delivered the first ship in 2016 and the second ship in 2018. We expect to deliver our work on the third and final ship of this class in 2020.
NASSCO is building Expeditionary Sea Base (ESB) auxiliary support ships, a variant of the Expeditionary Transfer Dock (ESD) ships, for the Navy. ESBs serve as afloat forward-staging bases, providing a persistent platform for mine warfare, special operations warfare or Marine Corps missions. Equipped with a 52,000-square-foot flight deck and accommodations for up to 250 personnel, these ships can support diverse missions, including airborne mine countermeasures, maritime security operations, non-combatant evacuation operations and humanitarian assistance/disaster relief missions. The Navy awarded NASSCO the first design and build contract for the ESD/ESB in 2011. In 2019, we delivered the fifth vessel of the program to the Navy and were awarded a contract for the construction of the sixth and seventh ships, as well as an option for an eighth. Work on the two new ships will continue into 2023.
NASSCO was competitively awarded an exclusive design and construction contract in 2016 for the lead ship in the Navy’s new class of fleet replenishment oilers, the John Lewis-class (T-AO-205), along with options for five additional ships. Designed to transfer fuel to Navy surface ships operating at sea, the oilers can carry 162,000 barrels of fuel and also offer significant dry cargo capacity and aviation capabilities. We expect to deliver the first ship of this class, the future USNS John Lewis, in 2021. Three options have been fully exercised to date, as well as funding for engineering and long-lead materials for the fourth option, with deliveries planned into 2024.
In addition to our new construction work for the Navy, the Marine Systems segment has extensive experience in all phases of commercial ship construction. We have designed and built crude oil and product tankers and container and cargo ships for commercial customers since the 1960s. These ships satisfy our commercial customers’ Jones Act requirement that ships carrying cargo between U.S. ports be built in U.S. shipyards. NASSCO is the only major Jones Act shipyard on the West Coast of the United States. NASSCO pioneered green ship technology, designing and delivering the world’s first liquefied natural gas (LNG)-powered containerships starting in 2015 to decrease emissions and increase fuel efficiency.
In 2019, we delivered an 870-foot-long, 51,400-deadweight-metric-ton, combination containership/roll-on, roll-off (ConRo) vessel — the largest ConRo vessel ever built in the United States — to a commercial customer. The LNG-ready ship is the first of a two-ship contract.
Our Marine Systems segment provides comprehensive ship and submarine maintenance, modernization and lifecycle support services to extend the service life of these ships. NASSCO conducts full-service maintenance and surface-ship repair operations in Navy fleet concentration areas in San Diego, California; Norfolk, Virginia; Mayport, Florida; and Bremerton, Washington. Electric Boat provides submarine maintenance and modernization services in a variety of U.S. locations, and Bath Iron Works provides lifecycle support services for Navy surface ships in both U.S. and overseas ports. In support of allied navies, we offer program management, planning, engineering and design support for submarine and surface-ship construction programs.
To promote operating efficiency, innovation and affordability for our customers, we make strategic investments in our business, often in cooperation with the Navy. We leverage our design and engineering expertise across shipyards to improve program execution and generate cost savings. This knowledge sharing
13
enables us to use resources more efficiently and drive process improvements. Through robust and disciplined planning, we are positioned to support our customers well into the future.
Revenue for the Marine Systems segment was 23% of our consolidated revenue in 2019, 24% in 2018 and 26% in 2017. Revenue by major products and services was as follows:
Year Ended December 31 | 2019 | 2018 | 2017 | ||||||||
Nuclear-powered submarines | $ | 6,254 | $ | 5,712 | $ | 5,175 | |||||
Surface ships | 1,912 | 1,872 | 1,607 | ||||||||
Repair and other services | 1,017 | 918 | 1,222 | ||||||||
Total Marine Systems | $ | 9,183 | $ | 8,502 | $ | 8,004 | |||||
CUSTOMERS
In 2019, 66% of our consolidated revenue was from the U.S. government, 16% was from U.S. commercial customers, 9% was from non-U.S. commercial customers and the remaining 9% was from non-U.S. government customers.
U.S. GOVERNMENT
Our primary customer is the U.S. Department of Defense (DoD). We also contract with other U.S. government customers, including the intelligence community and the Departments of Homeland Security and Health and Human Services. Our revenue from the U.S. government was as follows:
Year Ended December 31 | 2019 | 2018 | 2017 | ||||||||
DoD | $ | 19,864 | $ | 17,674 | $ | 15,441 | |||||
Non-DoD | 5,254 | 5,306 | 2,904 | ||||||||
Foreign Military Sales (FMS)* | 689 | 626 | 676 | ||||||||
Total U.S. government | $ | 25,807 | $ | 23,606 | $ | 19,021 | |||||
% of total revenue | 66 | % | 65 | % | 61 | % | |||||
* In addition to our direct non-U.S. sales, we sell to non-U.S. governments through the FMS program. Under the FMS program, we contract with and are paid by the U.S. government, and the U.S. government assumes the risk of collection from the non-U.S. government customer.
Our U.S. government revenue is derived from fixed-price, cost-reimbursement and time-and-materials contracts. Our production contracts are primarily fixed-price. Under these contracts, we agree to perform a specific scope of work for a fixed amount. Contracts for research, engineering, repair and maintenance, and other services are typically cost-reimbursement or time-and-materials. Under cost-reimbursement contracts, the customer reimburses contract costs incurred and pays a fixed, incentive or award-based fee. These fees are determined by our ability to achieve targets set in the contract, such as cost, quality, schedule and performance. Under time-and-materials contracts, the customer pays a fixed hourly rate for direct labor and generally reimburses us for the cost of materials.
Of our U.S. government revenue, fixed-price contracts accounted for 59% in 2019, 56% in 2018 and 54% in 2017; cost-reimbursement contracts accounted for 35% in 2019, 38% in 2018 and 42% in 2017; and time-and-materials contracts accounted for 6% in 2019 and 2018 and 4% in 2017.
For information on the advantages and disadvantages of each of these contract types, see Note C to the Consolidated Financial Statements in Item 8.
14
U.S. COMMERCIAL
Our U.S. commercial revenue was $6.2 billion in 2019, $5 billion in 2018 and $4.5 billion in 2017, which represented 16%, 14% and 15% of our consolidated revenue in each of the respective years. The majority of this revenue is for business-jet aircraft and related services where our customer base consists of individuals and public and privately held companies across a wide range of industries.
NON-U.S.
Our revenue from non-U.S. government and commercial customers was $7.4 billion in 2019, $7.6 billion in 2018 and $7.5 billion in 2017, which represented 18%, 21% and 24% of our consolidated revenue in each of the respective years.
We conduct business with customers around the world. Our non-U.S. defense subsidiaries maintain long-term relationships with their customers and have established themselves as principal regional suppliers and employers, providing a broad portfolio of products and services.
Our non-U.S. commercial revenue consists primarily of business-jet aircraft exports and worldwide aircraft services. While the installed base of aircraft is concentrated in North America, orders from customers outside North America represent a significant portion of our aircraft business with approximately 50% of the Aerospace segment’s total backlog on December 31, 2019.
COMPETITION
Several factors determine our ability to compete successfully in the defense and business-aviation markets. While customers’ evaluation criteria vary, the principal competitive elements include:
• | the technical excellence, reliability, safety and cost competitiveness of our products and services; |
• | our ability to innovate and develop new products and technologies that improve mission performance and adapt to dynamic threats; |
• | successful program execution and on-time delivery of complex, integrated systems; |
• | our global footprint and accessibility to customers; |
• | the reputation and customer confidence derived from past performance; and |
• | the successful management of customer relationships. |
DEFENSE MARKET COMPETITION
The U.S. government contracts with numerous domestic and non-U.S. companies for products and services. We compete against other contractors as well as smaller companies that specialize in a particular technology or capability. Outside the United States, we compete with global defense contractors’ exports and the offerings of private and state-owned defense manufacturers. Our Combat Systems segment competes with a large number of U.S. and non-U.S. businesses. Our Information Technology and Mission Systems segments compete with many companies, from large government contracting and commercial technology companies to small niche competitors with specialized technologies or expertise. Our Marine Systems segment has one primary competitor with which it also partners on the Virginia-class and Columbia-class submarine programs. The operating cycle of many of our major programs can result in sustained periods of program continuity when we perform successfully.
We are involved in teaming and subcontracting relationships with some of our competitors. Competitions for major defense and other government contracting programs often require companies to form teams to bring together a spectrum of capabilities to meet the customer’s requirements. Opportunities associated with
15
these programs include roles as the program’s integrator, overseeing and coordinating the efforts of all participants on a team, or as a provider of a specific component or subsystem.
BUSINESS-JET AIRCRAFT MARKET COMPETITION
The Aerospace segment has several competitors for each of its Gulfstream products. Key competitive factors include aircraft safety, reliability and performance; comfort and in-flight productivity; service quality, global footprint and responsiveness; technological and new-product innovation; and price. We believe that Gulfstream competes effectively in all of these areas.
The Aerospace segment competes worldwide in the business-jet aircraft services market primarily on the basis of quality, price and timeliness. While competition for each type of service varies somewhat, the segment faces a number of competitors of varying sizes for each of its offerings.
BACKLOG
Our total backlog represents the estimated remaining value of work to be performed under firm contracts and includes funded and unfunded portions. For additional discussion of backlog, see Management’s Discussion and Analysis of Financial Condition and Results of Operations in Item 7.
Summary backlog information for each of our segments follows:
2019 Total Backlog Not Expected to Be Completed in 2020 | |||||||||||||||||||||||||||
December 31 | 2019 | 2018 | |||||||||||||||||||||||||
Funded | Unfunded | Total | Funded | Unfunded | Total | ||||||||||||||||||||||
Aerospace | $ | 13,168 | $ | 181 | $ | 13,349 | $ | 11,208 | $ | 167 | $ | 11,375 | $ | 7,800 | |||||||||||||
Combat Systems | 14,474 | 439 | 14,913 | 16,174 | 424 | 16,598 | 8,617 | ||||||||||||||||||||
Information Technology | 4,839 | 4,294 | 9,133 | 4,717 | 3,248 | 7,965 | 2,795 | ||||||||||||||||||||
Mission Systems | 5,037 | 326 | 5,363 | 4,890 | 445 | 5,335 | 1,899 | ||||||||||||||||||||
Marine Systems | 20,012 | 24,175 | 44,187 | 18,837 | 7,761 | 26,598 | 34,690 | ||||||||||||||||||||
Total backlog | $ | 57,530 | $ | 29,415 | $ | 86,945 | $ | 55,826 | $ | 12,045 | $ | 67,871 | $ | 55,801 | |||||||||||||
RESEARCH AND DEVELOPMENT
To foster innovative product development and evolution, we conduct sustained R&D activities as part of our normal business operations. Most of our Aerospace segment’s R&D activities support Gulfstream’s product enhancement and development programs. In our U.S. defense operations, we conduct customer-sponsored R&D activities under government contracts and company-sponsored R&D activities, investing in technologies and capabilities that provide innovative solutions for our customers. In accordance with government regulations, we recover a portion of company-sponsored R&D expenditures through overhead charges to U.S. government contracts. For more information on our company-sponsored R&D activities, including our expenditures for the past three years, see Note A to the Consolidated Financial Statements in Item 8.
16
INTELLECTUAL PROPERTY
We develop technology, manufacturing processes and systems-integration practices. In addition to owning a large portfolio of proprietary intellectual property, we license some intellectual property rights to and from others. The U.S. government holds licenses to many of our patents developed in the performance of U.S. government contracts, and it may use or authorize others to use the inventions covered by these patents. Although these intellectual property rights are important to the operation of our business, no existing patent, license or other intellectual property right is of such importance that its loss or termination would have a material impact on our business.
EMPLOYEES
On December 31, 2019, our subsidiaries had 102,900 employees, approximately one-fifth of whom work under collective agreements with various labor unions and worker representatives. Agreements covering approximately 10% of total employees are due to expire in 2020. Historically, we have renegotiated these labor agreements without any significant disruption to operating activities.
RAW MATERIALS, SUPPLIERS AND SEASONALITY
We depend on suppliers and subcontractors for raw materials, components and subsystems. Our U.S. government customer is a supplier on some of our programs. These supply networks can experience price fluctuations and capacity constraints, which can put pressure on our costs. Effective management and oversight of suppliers and subcontractors is an important element of our successful performance. We sometimes rely on only one or two sources of supply that, if disrupted, could impact our ability to meet our customer commitments. We attempt to mitigate risks with our suppliers by entering into long-term agreements and leveraging company-wide agreements to achieve economies of scale and by negotiating flexible pricing terms in our customer contracts. We have not experienced, and do not foresee, significant difficulties in obtaining the materials, components or supplies necessary for our business operations.
Our business is not seasonal in nature. The receipt of contract awards, the availability of funding from the customer, the incurrence of contract costs and unit deliveries are all factors that influence the timing of our revenue. In the United States, these factors are influenced by the federal government’s budget cycle based on its October-to-September fiscal year.
REGULATORY MATTERS
U.S. GOVERNMENT CONTRACTS
U.S. government contracts are subject to procurement laws and regulations. The Federal Acquisition Regulation (FAR) and the Cost Accounting Standards (CAS) govern the majority of our contracts. The FAR mandates uniform policies and procedures for U.S. government acquisitions and purchased services. Also, individual agencies can have acquisition regulations that provide implementing language for the FAR or that supplement the FAR. For example, the DoD implements the FAR through the Defense Federal Acquisition Regulation Supplement (DFARS). For all federal government entities, the FAR regulates the phases of any product or service acquisition, including:
• | acquisition planning; |
• | competition requirements; |
• | contractor qualifications; |
17
• | protection of source selection and vendor information; and |
• | acquisition procedures. |
In addition, the FAR addresses the allowability of our costs, while the CAS addresses the allocation of those costs to contracts. The FAR and CAS subject us to audits and other government reviews covering issues such as cost, performance, internal controls and accounting practices relating to our contracts.
NON-U.S. REGULATORY
Our non-U.S. operations are subject to the applicable government regulations and procurement policies and practices, as well as U.S. policies and regulations. We are also subject to regulations governing investments, exchange controls, repatriation of earnings and import-export control.
BUSINESS-JET AIRCRAFT
The Aerospace segment is subject to FAA regulation in the United States and other similar aviation regulatory authorities internationally, including the Civil Aviation Administration of Israel (CAAI), the European Aviation Safety Agency (EASA) and the Civil Aviation Administration of China (CAAC). For an aircraft to be manufactured and sold, the model must receive a type certificate from the appropriate aviation authority, and each aircraft must receive a certificate of airworthiness. Aircraft outfitting and completions also require approval by the appropriate aviation authority, which is often accomplished through a supplemental type certificate. Aviation authorities can require changes to a specific aircraft or model type before granting approval. Maintenance facilities and charter operations must be licensed by aviation authorities as well.
ENVIRONMENTAL
We are subject to a variety of federal, state, local and foreign environmental laws and regulations. These laws and regulations cover the discharge, treatment, storage, disposal, investigation and remediation of materials, substances and wastes identified in the laws and regulations. We are directly or indirectly involved in environmental investigations or remediation at some of our current and former facilities and at third-party sites that we do not own but where we have been designated a potentially responsible party (PRP) by the U.S. Environmental Protection Agency or a state environmental agency. As a PRP, we are potentially liable to the government or third parties for the cost of remediating contamination. In cases where we have been designated a PRP, we generally seek to mitigate these environmental liabilities through available insurance coverage and by pursuing appropriate cost-recovery actions. In the unlikely event that we are required to fully fund the remediation of a site, the current statutory framework would allow us to pursue contributions from other PRPs. We regularly assess our compliance status and management of environmental matters.
Operating and maintenance costs associated with environmental compliance and management of contaminated sites are a normal, recurring part of our operations. Historically, these costs have not been material. Environmental costs are often recoverable under our contracts with the U.S. government. Based on information currently available and current U.S. government policies relating to cost recovery, we do not expect continued compliance with environmental regulations to have a material impact on our results of operations, financial condition or cash flows. For additional information relating to the impact of environmental matters, see Note O to the Consolidated Financial Statements in Item 8.
AVAILABLE INFORMATION
We file reports and other information with the Securities and Exchange Commission (SEC) pursuant to Section 13(a) or 15(d) of the Securities Exchange Act of 1934, as amended. These reports and information include an annual report on Form 10-K, quarterly reports on Form 10-Q, current reports on Form 8-K and
18
proxy statements. Free copies of these items are made available on our website (www.gd.com) as soon as practicable. The SEC maintains a website (www.sec.gov) that contains reports, proxy and information statements, and other information.
In addition to the information contained in this Form 10-K, information about the company can be found on our website and our Investor Relations website (investorrelations.gd.com). Our Investor Relations website contains a significant amount of information about the company, including financial information, our corporate governance principles and practices, and other information for investors. We encourage investors to visit our website, as we frequently update and post new information about our company, and it is possible that this information could be deemed to be material information.
References to our website and the SEC’s website in this Form 10-K do not constitute, and should not be viewed as, incorporation by reference of the information contained on, or available through, the websites. The information should not be considered a part of this Form 10-K, unless otherwise expressly incorporated by reference.
ITEM 1A. RISK FACTORS
An investment in our common stock or debt securities is subject to risks and uncertainties. Investors should consider the following factors, in addition to the other information contained in this Annual Report on Form 10-K, before deciding whether to purchase our securities.
Investment risks can be market-wide as well as unique to a specific industry or company. The market risks faced by an investor in our stock are similar to the uncertainties faced by investors in a broad range of industries. There are some risks that apply more specifically to our business.
Our revenue is concentrated with the U.S. government. This customer relationship involves some specific risks. In addition, our sales to non-U.S. customers expose us to different financial and legal risks. Despite the varying nature of our government and commercial operations and the markets they serve, each segment shares some common risks, such as the ongoing development of high-technology products and the price, availability and quality of commodities and subsystems.
The U.S. government provides a significant portion of our revenue. In 2019, approximately 65% of our consolidated revenue was from the U.S. government. Levels of U.S. defense spending are driven by threats to national security. Competing demands for federal funds can pressure various areas of spending. Decreases in U.S. government defense and other spending or changes in spending allocation or priorities could result in one or more of our programs being reduced, delayed or terminated, which could impact our financial performance.
For additional information relating to U.S. budget matters, see the Business Environment section of Management’s Discussion and Analysis of Financial Condition and Results of Operations in Item 7.
U.S. government contracts are not always fully funded at inception, and any funding is subject to disruption or delay. Our U.S. government revenue is funded by agency budgets that operate on an October-to-September fiscal year. Early each calendar year, the President of the United States presents to the Congress the budget for the upcoming fiscal year. This budget proposes funding levels for every federal agency and is the result of months of policy and program reviews throughout the executive branch. For the remainder of the year, the Appropriations and Authorization Committees of the Congress review the President’s budget proposals and establish the funding levels for the upcoming fiscal year. Once these levels are enacted into law, the Executive Office of the President administers the funds to the agencies.
19
There are two primary risks associated with the U.S. government budget cycle. First, the annual process may be delayed or disrupted. If the annual budget is not approved by the beginning of the government fiscal year, portions of the U.S. government can shut down or operate under a continuing resolution that maintains spending at prior-year levels, which can impact funding for our programs and timing of new awards. Second, the Congress typically appropriates funds on a fiscal-year basis, even though contract performance may extend over many years. Future revenue under existing multi-year contracts is conditioned on the continuing availability of congressional appropriations. Changes in appropriations in subsequent years may impact the funding available for these programs. Delays or changes in funding can impact the timing of available funds or lead to changes in program content.
Our U.S. government contracts are subject to termination rights by the customer. U.S. government contracts generally permit the government to terminate a contract, in whole or in part, for convenience. If a contract is terminated for convenience, a contractor usually is entitled to receive payments for its allowable costs incurred and the proportionate share of fees or earnings for the work performed. The government may also terminate a contract for default in the event of a breach by the contractor. If a contract is terminated for default, the government in most cases pays only for the work it has accepted. The termination of multiple or large programs could have a material adverse effect on our future revenue and earnings.
Government contractors operate in a highly regulated environment and are subject to audit by the U.S. government. Numerous U.S. government agencies routinely audit and review government contractors. These agencies review a contractor’s performance under its contracts and compliance with applicable laws, regulations and standards. The U.S. government also reviews the adequacy of, and compliance with, internal control systems and policies, including the contractor’s purchasing, property, estimating, material, earned value management and accounting systems. In some cases, audits may result in delayed payments or contractor costs not being reimbursed or subject to repayment. If an audit or investigation were to result in allegations against a contractor of improper or illegal activities, civil or criminal penalties and administrative sanctions could result, including termination of contracts, forfeiture of profits, suspension of payments, fines and suspension or prohibition from doing business with the U.S. government. In addition, reputational harm could result if allegations of impropriety were made. In some cases, audits may result in disputes with the respective government agency that can result in negotiated settlements, arbitration or litigation. Moreover, new laws, regulations or standards, or changes to existing ones, can increase our performance and compliance costs and reduce our profitability.
Our Aerospace segment is subject to changing customer demand for business aircraft. The business-jet market is driven by the demand for business-aviation products and services by corporate, individual and government customers in the United States and around the world. The Aerospace segment’s results also depend on other factors, including general economic conditions, the availability of credit, pricing pressures and trends in capital goods markets. In addition, if customers default on existing contracts and the contracts are not replaced, the segment’s anticipated revenue and profitability could be reduced materially.
Earnings and margin depend on our ability to perform on our contracts. When agreeing to contractual terms, our management team makes assumptions and projections about future conditions and events. The accounting for our contracts and programs requires assumptions and estimates about these conditions and events. These projections and estimates assess:
• | the productivity and availability of labor; |
• | the complexity of the work to be performed; |
• | the cost and availability of materials and components; and |
• | schedule requirements. |
20
If there is a significant change in one or more of these circumstances, estimates or assumptions, or if the risks under our contracts are not managed adequately, the profitability of contracts could be adversely affected. This could affect earnings and margin materially.
Earnings and margin depend in part on subcontractor and vendor performance. We rely on other companies to provide materials, components and subsystems for our products. Subcontractors also perform some of the services that we provide to our customers. We depend on these subcontractors and vendors to meet our contractual obligations in full compliance with customer requirements and applicable law. Misconduct by subcontractors, such as a failure to comply with procurement regulations or engaging in unauthorized activities, may harm our future revenue and earnings. We manage our supplier base carefully to avoid or minimize customer issues. We sometimes rely on only one or two sources of supply that, if disrupted, could have an adverse effect on our ability to meet our customer commitments. Our ability to perform our obligations may be materially adversely affected if one or more of these suppliers is unable to provide the agreed-upon materials, perform the agreed-upon services in a timely and cost-effective manner, or engages in misconduct or other improper activities.
Sales and operations outside the United States are subject to different risks that may be associated with doing business in foreign countries. In some countries there is increased chance for economic, legal or political changes, and procurement procedures may be less robust or mature, which may complicate the contracting process. Our non-U.S. operations may be sensitive to and impacted by changes in a foreign government’s national policies and priorities, political leadership and budgets, which may be influenced by changes in threat environments, geopolitical uncertainties, volatility in economic conditions and other economic and political factors. Changes and developments in any of these matters or factors may occur suddenly and could impact funding for programs or delay purchasing decisions or customer payments. Non-U.S. transactions can involve increased financial and legal risks arising from foreign exchange rate variability and differing legal systems. Our non-U.S. operations are subject to U.S. and foreign laws and regulations, including laws and regulations relating to import-export controls, technology transfers, the Foreign Corrupt Practices Act (FCPA) and other anti-corruption laws, and the International Traffic in Arms Regulations (ITAR). An unfavorable event or trend in any one or more of these factors or a failure to comply with U.S. or foreign laws could result in administrative, civil or criminal liabilities, including suspension or debarment from government contracts or suspension of our export privileges, and could materially adversely affect revenue and earnings associated with our non-U.S. operations.
In addition, some non-U.S. government customers require contractors to enter into letters of credit, performance or surety bonds, bank guarantees and other similar financial arrangements. We may also be required to agree to specific in-country purchases, manufacturing agreements or financial support arrangements, known as offsets, that require us to satisfy investment or other requirements or face penalties. Offset requirements may extend over several years and could require us to team with local companies to fulfill these requirements. If we do not satisfy these financial or offset requirements, our future revenue and earnings may be materially adversely affected.
Our future success depends in part on our ability to develop new products and technologies and maintain a qualified workforce to meet the needs of our customers. Many of the products and services we provide involve sophisticated technologies and engineering, with related complex manufacturing and system-integration processes. Our customers’ requirements change and evolve regularly. Accordingly, our future performance depends in part on our ability to continue to develop, manufacture and provide innovative products and services and bring those offerings to market quickly at cost-effective prices. Some new products, particularly in our Aerospace segment, must meet extensive and time-consuming regulatory requirements that are often outside our control and may result in unanticipated delays. Additionally, due
21
to the highly specialized nature of our business, we must hire and retain the skilled and qualified personnel necessary to perform the services required by our customers. To the extent that the demand for skilled personnel exceeds supply, we could experience higher labor, recruiting or training costs in order to attract and retain such employees. If we were unable to develop new products that meet customers’ changing needs and satisfy regulatory requirements in a timely manner or successfully attract and retain qualified personnel, our future revenue and earnings may be materially adversely affected.
We have made and expect to continue to make investments, including acquisitions and joint ventures, that involve risks and uncertainties. When evaluating potential acquisitions and joint ventures, we make judgments regarding the value of business opportunities, technologies, and other assets and the risks and costs of potential liabilities based on information available to us at the time of the transaction. Whether we realize the anticipated benefits from these transactions depends on multiple factors, including our integration of the businesses involved; the performance of the underlying products, capabilities or technologies; market conditions following the acquisition; and acquired liabilities, including some that may not have been identified prior to the acquisition. These factors could materially adversely affect our financial results.
Changes in business conditions may cause goodwill and other intangible assets to become impaired. Goodwill represents the purchase price paid in excess of the fair value of net tangible and intangible assets acquired in a business combination. Goodwill is not amortized and remains on our balance sheet indefinitely unless there is an impairment or a sale of a portion of the business. Goodwill is subject to an impairment test on an annual basis or when circumstances indicate that the likelihood of an impairment is greater than 50%. Such circumstances include a significant adverse change in the business climate for one of our reporting units or a decision to dispose of a reporting unit or a significant portion of a reporting unit. We face some uncertainty in our business environment due to a variety of challenges, including changes in government spending. We may experience unforeseen circumstances that adversely affect the value of our goodwill or intangible assets and trigger an evaluation of the amount of the recorded goodwill and intangible assets. Future write-offs of goodwill or other intangible assets as a result of an impairment in the business could materially adversely affect our results of operations and financial condition.
Our business could be negatively impacted by cybersecurity events and other disruptions. We face various cybersecurity threats, including threats to our information technology (IT) infrastructure and attempts to gain access to our proprietary or classified information, denial-of-service attacks, as well as threats to the physical security of our facilities and employees, and threats from terrorist acts. We also design and manage IT systems and products that contain IT systems for various customers. We generally face the same security threats for these systems as for our own internal systems. In addition, we face cyber threats from entities that may seek to target us through our customers, vendors, subcontractors and other third parties with whom we do business. Accordingly, we maintain information security staff, policies and procedures for managing risk to our information systems, and conduct employee training on cybersecurity to mitigate persistent and continuously evolving cybersecurity threats. However, there can be no assurance that any such actions will be sufficient to prevent cybersecurity breaches, disruptions, unauthorized release of sensitive information or corruption of data.
We have experienced cybersecurity threats such as viruses and attacks targeting our IT systems. Such prior events have not had a material impact on our financial condition, results of operations or liquidity. However, future threats could, among other things, cause harm to our business and our reputation; disrupt our operations; expose us to potential liability, regulatory actions and loss of business; challenge our eligibility for future work on sensitive or classified systems for government customers; and impact our results of operations materially. Due to the evolving nature of these security threats, the potential impact
22
of any future incident cannot be predicted. Our insurance coverage may not be adequate to cover all the costs related to cybersecurity attacks or disruptions resulting from such events.
FORWARD-LOOKING STATEMENTS
This Annual Report on Form 10-K contains forward-looking statements that are based on management’s expectations, estimates, projections and assumptions. Words such as “expects,” “anticipates,” “plans,” “believes,” “scheduled,” “outlook,” “estimates,” “should” and variations of these words and similar expressions are intended to identify forward-looking statements. Examples include projections of revenue, earnings, operating margin, segment performance, cash flows, contract awards, aircraft production, deliveries and backlog. In making these statements we rely on assumptions and analyses based on our experience and perception of historical trends, current conditions and expected future developments as well as other factors we consider appropriate under the circumstances. We believe our estimates and judgments are reasonable based on information available to us at the time. Forward-looking statements are made pursuant to the safe harbor provisions of the Private Securities Litigation Reform Act of 1995, as amended. These statements are not guarantees of future performance and involve risks and uncertainties that are difficult to predict. Therefore, actual future results and trends may differ materially from what is forecast in forward-looking statements due to a variety of factors, including, without limitation, the risk factors discussed in this Form 10-K.
All forward-looking statements speak only as of the date of this report or, in the case of any document incorporated by reference, the date of that document. All subsequent written and oral forward-looking statements attributable to General Dynamics or any person acting on our behalf are qualified by the cautionary statements in this section. We do not undertake any obligation to update or publicly release any revisions to forward-looking statements to reflect events, circumstances or changes in expectations after the date of this report. These factors may be revised or supplemented in subsequent reports on SEC Forms 10-Q and 8-K.
ITEM 1B. UNRESOLVED STAFF COMMENTS
None.
ITEM 2. PROPERTIES
We operate in a number of offices, manufacturing plants, laboratories, warehouses and other facilities in the United States and abroad. We believe our facilities are adequate for our present needs and, given planned improvements and construction, expect them to remain adequate for the foreseeable future.
On December 31, 2019, our segments had primary operations at the following locations:
• | Aerospace – Scottsdale, Arizona; Burbank, Lincoln, Long Beach and Van Nuys, California; West Palm Beach, Florida; Brunswick, Pooler and Savannah, Georgia; Cahokia, Illinois; Bedford and Westfield, Massachusetts; Las Vegas, Nevada; Teterboro, New Jersey; New York, New York; Tulsa, Oklahoma; San Juan, Puerto Rico; Dallas and Houston, Texas; Dulles, Virginia; Appleton, Wisconsin; Brisbane, Cairns, Darwin, Perth and Sydney, Australia; Vienna, Austria; Beijing, Hong Kong and Shanghai, China; Berlin, Dusseldorf and Munich, Germany; Jakarta, Indonesia; Kuala Lumpur, Malaysia; Valetta, Malta; Mexicali, Mexico; Amsterdam and Rotterdam, the Netherlands; Manila, Philippines; Singapore; Basel, |
23
Geneva and Zurich, Switzerland; Bangkok, Thailand; Dubai and Fujairah, United Arab Emirates; Farnborough and Luton, United Kingdom.
• | Combat Systems – Anniston, Alabama; East Camden and Hampton, Arkansas; Crawfordsville, St. Petersburg and Tallahassee, Florida; Marion, Illinois; Saco, Maine; Sterling Heights, Michigan; Joplin, Missouri; Lincoln, Nebraska; Lima, Ohio; Eynon, Red Lion and Scranton, Pennsylvania; Ladson, South Carolina; Garland, Texas; Williston, Vermont; Auburn and Sumner, Washington; Vienna, Austria; La Gardeur, London, St. Augustin and Valleyfield, Canada; Berlin, Kaiserslautern, Neubrandenburg and Woldegk, Germany; Granada, Madrid, Sevilla and Trubia, Spain; Kreuzlingen and Tägerwilen, Switzerland; Merthyr Tydfil and Oakdale, United Kingdom. |
• | Information Technology – Daleville, Alabama; Pawcatuck, Connecticut; Bossier City, Louisiana; Annapolis Junction and Columbia, Maryland; Westwood, Massachusetts; Rensselaer, New York; Fayetteville, North Carolina; Arlington, Chesapeake, Sterling and several locations in Fairfax County, Virginia. |
• | Mission Systems – Cullman, Alabama; Scottsdale, Arizona; San Jose, California; Orlando, Florida; Annapolis Junction, Maryland; Dedham, Pittsfield and Taunton, Massachusetts; Bloomington, Minnesota; Florham Park, New Jersey; Catawba, Conover and Greensboro, North Carolina; Kilgore, Plano and Wortham, Texas; Fairfax and Marion, Virginia; Calgary, Halifax and Ottawa, Canada; Tallinn, Estonia; Oakdale and St. Leonards, United Kingdom. |
• | Marine Systems – San Diego, California; Groton, New London and Stonington, Connecticut; Jacksonville, Florida; Bath and Brunswick, Maine; North Kingstown, Rhode Island; Norfolk and Portsmouth, Virginia; Bremerton, Washington; Mexicali, Mexico. |
A summary of floor space by segment on December 31, 2019, follows:
(Square feet in millions) | Company-owned Facilities | Leased Facilities | Government-owned Facilities | Total | |||||||
Aerospace | 6.3 | 8.9 | — | 15.2 | |||||||
Combat Systems | 6.1 | 4.3 | 5.5 | 15.9 | |||||||
Information Technology | 0.2 | 4.7 | — | 4.9 | |||||||
Mission Systems | 3.5 | 3.7 | 0.9 | 8.1 | |||||||
Marine Systems | 8.2 | 3.8 | — | 12.0 | |||||||
Total square feet | 24.3 | 25.4 | 6.4 | 56.1 | |||||||
ITEM 3. LEGAL PROCEEDINGS
For information relating to legal proceedings, see Note O to the Consolidated Financial Statements in Item 8.
ITEM 4. MINE SAFETY DISCLOSURES
Not applicable.
INFORMATION ABOUT OUR EXECUTIVE OFFICERS
All of our executive officers are appointed annually. None of our executive officers were selected pursuant to any arrangement or understanding between the officer and any other person. The name, age, offices and positions of our executives held for at least the past five years as of February 10, 2020, were as follows (references are to positions with General Dynamics Corporation, unless otherwise noted):
Name, Position and Office | Age |
Jason W. Aiken - Senior Vice President and Chief Financial Officer since January 2014; Vice President of the company and Chief Financial Officer of Gulfstream Aerospace Corporation, September 2011 - December 2013; Vice President and Controller, April 2010 - August 2011; Staff Vice President, Accounting, July 2006 - March 2010 | 47 |
Christopher J. Brady - Vice President of the company and President of General Dynamics Mission Systems since January 2019; Vice President, Engineering of General Dynamics Mission Systems, January 2015 - December 2018; Vice President, Engineering of General Dynamics C4 Systems, May 2013 - December 2014; Vice President, Assured Communications Systems of General Dynamics C4 Systems, August 2004 - May 2013 | 57 |
Mark L. Burns - Vice President of the company and President of Gulfstream Aerospace Corporation since July 2015; Vice President of the company since February 2014; President, Product Support of Gulfstream Aerospace Corporation, June 2008 - June 2015 | 60 |
Gregory S. Gallopoulos - Senior Vice President, General Counsel and Secretary since January 2010; Vice President and Deputy General Counsel, July 2008 - January 2010; Managing Partner of Jenner & Block LLP, January 2005 - June 2008 | 60 |
24
M. Amy Gilliland - Senior Vice President of the company since April 2015; President of General Dynamics Information Technology since September 2017; Deputy for Operations of General Dynamics Information Technology, April 2017 - September 2017; Senior Vice President, Human Resources and Administration, April 2015 - March 2017; Vice President, Human Resources, February 2014 - March 2015; Staff Vice President, Strategic Planning, January 2013 - February 2014; Staff Vice President, Investor Relations, June 2008 - January 2013 | 45 |
Kevin M. Graney - Vice President of the company and President of Electric Boat Corporation since October 2019; Vice President of the company and President of NASSCO, January 2017 - October 2019; Vice President and General Manager of NASSCO, November 2013 - January 2017 | 55 |
Kimberly A. Kuryea - Senior Vice President, Human Resources and Administration since April 2017; Vice President and Controller, September 2011 - March 2017; Chief Financial Officer of General Dynamics Advanced Information Systems, November 2007 - August 2011; Staff Vice President, Internal Audit, March 2004 - October 2007 | 52 |
Christopher Marzilli - Executive Vice President, Information Technology and Mission Systems since January 2019; Vice President of the company and President of General Dynamics Mission Systems, January 2015 - December 2018; Vice President of the company and President of General Dynamics C4 Systems, January 2006 - December 2014; Senior Vice President and Deputy General Manager of General Dynamics C4 Systems, November 2003 - January 2006 | 60 |
William A. Moss - Vice President and Controller since April 2017; Staff Vice President, Internal Audit, May 2015 - March 2017; Staff Vice President, Accounting, August 2010 - May 2015 | 56 |
Phebe N. Novakovic - Chairman and Chief Executive Officer since January 2013; President and Chief Operating Officer, May 2012 - December 2012; Executive Vice President, Marine Systems, May 2010 - May 2012; Senior Vice President, Planning and Development, July 2005 - May 2010; Vice President, Strategic Planning, October 2002 - July 2005 | 62 |
Mark C. Roualet - Executive Vice President, Combat Systems, since March 2013; Vice President of the company and President of General Dynamics Land Systems, October 2008 - March 2013; Senior Vice President and Chief Operating Officer of General Dynamics Land Systems, July 2007 - October 2008 | 61 |
Robert E. Smith - Executive Vice President, Marine Systems, since July 2019; Vice President of the company and President of Jet Aviation, January 2014 - July 2019; Vice President and Chief Financial Officer of Jet Aviation, July 2012 - January 2014 | 52 |
Gary L. Whited - Vice President of the company and President of General Dynamics Land Systems since March 2013; Senior Vice President of General Dynamics Land Systems, September 2011 - March 2013; Vice President and Chief Financial Officer of General Dynamics Land Systems, June 2006 - September 2011 | 59 |
PART II
ITEM 5. MARKET FOR THE COMPANY’S COMMON EQUITY, RELATED STOCKHOLDER MATTERS AND ISSUER PURCHASES OF EQUITY SECURITIES
Our common stock is listed on the New York Stock Exchange under the trading symbol “GD.”
On January 26, 2020, there were approximately 10,000 holders of record of our common stock.
For information regarding securities authorized for issuance under our equity compensation plans, see Note Q to the Consolidated Financial Statements contained in Item 8.
25
We did not make any unregistered sales of equity securities in 2019.
The following table provides information about our fourth-quarter purchases of equity securities that are registered pursuant to Section 12 of the Securities Exchange Act of 1934, as amended:
Period | Total Number of Shares | Average Price per Share | |||||
Shares Delivered or Withheld Pursuant to Restricted Stock Vesting* | |||||||
9/30/19-10/27/19 | 36 | $ | 184.36 | ||||
10/28/19-11/24/19 | 412 | 183.36 | |||||
11/25/19-12/31/19 | — | — | |||||
448 | $ | 183.44 | |||||
* Represents shares withheld by, or delivered to, us pursuant to provisions in agreements with recipients of restricted stock granted under our equity compensation plans that allow us to withhold, or the recipient to deliver to us, the number of shares with a fair value equal to the statutory tax withholding due upon vesting of the restricted shares.
On December 5, 2018, the board of directors authorized management to repurchase up to 10 million additional shares of the company’s outstanding common stock on the open market. We did not repurchase any shares in the fourth quarter of 2019. On December 31, 2019, 6.4 million shares remained authorized by our board of directors for repurchase.
For additional information relating to our purchases of common stock during the past three years, see Note M to the Consolidated Financial Statements in Item 8.
The following performance graph compares the cumulative total return to shareholders on our common stock, assuming reinvestment of dividends, with similar returns for the Standard & Poor’s® 500 Index and the Standard & Poor’s® Aerospace & Defense Index, both of which include General Dynamics.
Cumulative Total Return
Based on Investments of $100 Beginning December 31, 2014
(Assumes Reinvestment of Dividends)
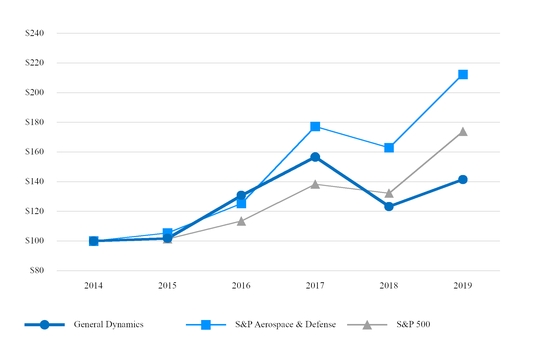
26
ITEM 6. SELECTED FINANCIAL DATA
The following table presents selected historical financial data derived from the Consolidated Financial Statements and other company information for each of the five years presented. This information should be read in conjunction with Management’s Discussion and Analysis of Financial Condition and Results of Operations in Item 7 and the Consolidated Financial Statements and the Notes thereto in Item 8.
(Dollars and shares in millions, except per-share and employee amounts) | ||||||||||||||||||||
2019 | 2018 | 2017 | 2016 | 2015 | ||||||||||||||||
Summary of Operations | ||||||||||||||||||||
Revenue | $ | 39,350 | $ | 36,193 | $ | 30,973 | $ | 30,561 | $ | 31,781 | ||||||||||
Operating earnings | 4,648 | 4,457 | 4,236 | 3,744 | 4,494 | |||||||||||||||
Operating margin | 11.8 | % | 12.3 | % | 13.7 | % | 12.3 | % | 14.1 | % | ||||||||||
Interest, net | (460 | ) | (356 | ) | (103 | ) | (91 | ) | (83 | ) | ||||||||||
Provision for income tax, net | (718 | ) | (727 | ) | (1,165 | ) | (977 | ) | (1,183 | ) | ||||||||||
Earnings from continuing operations | 3,484 | 3,358 | 2,912 | 2,679 | 3,036 | |||||||||||||||
Return on sales (a) | 8.9 | % | 9.3 | % | 9.4 | % | 8.8 | % | 9.6 | % | ||||||||||
Discontinued operations, net of tax | — | (13 | ) | — | (107 | ) | — | |||||||||||||
Net earnings | 3,484 | 3,345 | 2,912 | 2,572 | 3,036 | |||||||||||||||
Diluted earnings per share: | ||||||||||||||||||||
Continuing operations | 11.98 | 11.22 | 9.56 | 8.64 | 9.29 | |||||||||||||||
Net earnings | 11.98 | 11.18 | 9.56 | 8.29 | 9.29 | |||||||||||||||
Cash Flows | ||||||||||||||||||||
Net cash provided by operating activities | $ | 2,981 | $ | 3,148 | $ | 3,876 | $ | 2,163 | $ | 2,607 | ||||||||||
Net cash (used) provided by investing activities | (994 | ) | (10,234 | ) | (788 | ) | (391 | ) | 200 | |||||||||||
Net cash (used) provided by financing activities | (1,997 | ) | 5,086 | (2,399 | ) | (2,169 | ) | (4,367 | ) | |||||||||||
Net cash used by discontinued operations | (51 | ) | (20 | ) | (40 | ) | (54 | ) | (43 | ) | ||||||||||
Cash dividends declared per common share | 4.08 | 3.72 | 3.36 | 3.04 | 2.76 | |||||||||||||||
Financial Position | ||||||||||||||||||||
Cash and equivalents | $ | 902 | $ | 963 | $ | 2,983 | $ | 2,334 | $ | 2,785 | ||||||||||
Total assets | 48,841 | 45,408 | 35,046 | 33,172 | 32,538 | |||||||||||||||
Short- and long-term debt | 11,930 | 12,417 | 3,982 | 3,888 | 3,399 | |||||||||||||||
Shareholders’ equity | 13,577 | 11,732 | 11,435 | 10,301 | 10,440 | |||||||||||||||
Debt-to-equity (b) | 87.9 | % | 105.8 | % | 34.8 | % | 37.7 | % | 32.6 | % | ||||||||||
Debt-to-capital (c) | 46.8 | % | 51.4 | % | 25.8 | % | 27.4 | % | 24.6 | % | ||||||||||
Book value per share (d) | 46.88 | 40.64 | 38.52 | 34.06 | 33.36 | |||||||||||||||
Other Information | ||||||||||||||||||||
Free cash flow from operations (e) | $ | 1,994 | $ | 2,458 | $ | 3,448 | $ | 1,771 | $ | 2,038 | ||||||||||
Return on equity (f) | 27.2 | % | 28.1 | % | 26.6 | % | 25.6 | % | 27.7 | % | ||||||||||
Return on invested capital (e) | 14.0 | % | 15.4 | % | 16.8 | % | 16.3 | % | 18.1 | % | ||||||||||
Funded backlog | 57,530 | 55,826 | 52,031 | 51,783 | 53,449 | |||||||||||||||
Total backlog | 86,945 | 67,871 | 63,175 | 62,206 | 67,786 | |||||||||||||||
Shares outstanding | 289.6 | 288.7 | 296.9 | 302.4 | 313.0 | |||||||||||||||
Weighted average shares outstanding: | ||||||||||||||||||||
Basic | 288.3 | 295.3 | 299.2 | 304.7 | 321.3 | |||||||||||||||
Diluted | 290.8 | 299.2 | 304.6 | 310.4 | 326.7 | |||||||||||||||
Employees | 102,900 | 105,600 | 98,600 | 98,800 | 99,900 | |||||||||||||||
(a) | Return on sales is calculated as earnings from continuing operations divided by revenue. |
(b) | Debt-to-equity ratio is calculated as total debt divided by total equity as of year end. |
(c) | Debt-to-capital ratio is calculated as total debt divided by the sum of total debt plus total equity as of year end. |
(d) | Book value per share is calculated as total equity divided by total outstanding shares as of year end. |
(e) | See Item 7, Management’s Discussion and Analysis of Financial Condition and Results of Operations, for a reconciliation of net cash provided by operating activities to free cash flow from operations and the calculation of return on invested capital (ROIC), both of which are non-GAAP management metrics. |
(f) | Return on equity is calculated by dividing earnings from continuing operations by our average equity during the year. |
27
ITEM 7. MANAGEMENT’S DISCUSSION AND ANALYSIS OF FINANCIAL CONDITION AND RESULTS OF OPERATIONS
(Dollars in millions, except per-share amounts or unless otherwise noted)
A discussion regarding our financial condition and results of operations for 2019 compared with 2018 is presented below. A discussion regarding our financial condition and results of operations for 2018 compared with 2017 can be found in Item 7 of our Annual Report on Form 10-K for the year ended December 31, 2018.
For an overview of our operating segments, including a discussion of our major products and services, see the Business discussion contained in Item 1. The following discussion should be read in conjunction with our Consolidated Financial Statements included in Item 8.
BUSINESS ENVIRONMENT
With approximately 65% of our revenue from the U.S. government, government spending levels, particularly defense spending, influence our financial performance. Over the past several years, U.S. defense spending has been mandated by the Budget Control Act of 2011 (BCA). The BCA establishes spending caps over a 10-year period through 2021, including a sequester mechanism that would impose additional defense cuts if an annual defense appropriations bill is enacted above the spending cap.
On August 2, 2019, the Bipartisan Budget Act of 2019 (BBA) was signed into law, which raised discretionary spending limits established by the BCA for fiscal year (FY) 2020 and FY 2021. On December 20, 2019, the FY 2020 defense appropriations bill was signed into law. It totaled $691 billion and included $619 billion in the base budget in compliance with the BBA spending caps and $72 billion for overseas contingency operations, representing an increase of approximately 3% over the total FY 2019 spending level.
The long-term outlook for our U.S. defense business is influenced by the U.S. military’s funding priorities, the diversity of our programs and customers, our insight into customer requirements stemming from our incumbency on core programs, our ability to evolve our products to address a fast-changing threat environment and our proven track record of successful contract execution.
International demand for military equipment and information technologies presents opportunities for our non-U.S. operations and exports from our North American businesses. While the revenue potential can be significant, there are risks to doing business in foreign countries, including changing budget priorities and overall spending pressures unique to each country.
In our Aerospace segment, we continue to experience strong demand across our product portfolio. We expect our investment in the development of new aircraft products and technologies to support the Aerospace segment’s long-term growth. Similarly, we believe the aircraft services business will be a source of steady revenue growth as the global business-jet fleet continues to grow.
28
RESULTS OF OPERATIONS
INTRODUCTION
An understanding of our accounting practices is necessary in the evaluation of our financial statements and operating results. The following paragraphs explain how we recognize revenue and operating costs in our operating segments and the terminology we use to describe our operating results.
In the Aerospace segment, we record revenue on contracts for new aircraft when the customer obtains control of the asset, which is generally upon delivery and acceptance by the customer of the fully outfitted aircraft. Revenue associated with the segment’s custom completions of narrow-body and wide-body aircraft and the segment’s services businesses is recognized as work progresses or upon delivery of services. Fluctuations in revenue from period to period result from the number and mix of new aircraft deliveries, progress on aircraft completions, and the level and type of aircraft services performed during the period.
The majority of the Aerospace segment’s operating costs relates to new aircraft production on firm orders and consists of labor, material, subcontractor and overhead costs. The costs are accumulated in production lots, recorded in inventory and recognized as operating costs at aircraft delivery based on the estimated average unit cost in a production lot. While changes in the estimated average unit cost for a production lot impact the level of operating costs, the amount of operating costs reported in a given period is based largely on the number and type of aircraft delivered. Operating costs in the Aerospace segment’s completions and services businesses are recognized generally as incurred.
For new aircraft, operating earnings and margin are a function of the prices of our aircraft, our operational efficiency in manufacturing and outfitting the aircraft, and the mix of ultra-large-cabin, large-cabin and mid-cabin aircraft deliveries. Aircraft mix can also refer to the stage of program maturity for our aircraft models. A new aircraft model typically has lower margins in its initial production lots, and then margins generally increase as we realize efficiencies in the production process. Additional factors affecting the segment’s earnings and margin include the volume, mix and profitability of completions and services work performed, the volume of and market for pre-owned aircraft, and the level of general and administrative (G&A) and net research and development (R&D) costs incurred by the segment.
In the defense segments, revenue on long-term government contracts is recognized generally over time as the work progresses, either as products are produced or as services are rendered. Typically, revenue is recognized over time using costs incurred to date relative to total estimated costs at completion to measure progress toward satisfying our performance obligations. Incurred cost represents work performed, which corresponds with, and thereby best depicts, the transfer of control to the customer. Contract costs include labor, material, overhead and, when appropriate, G&A expenses. Variances in costs recognized from period to period reflect primarily increases and decreases in production or activity levels on individual contracts. Because costs are used as a measure of progress, year-over-year variances in cost result in corresponding variances in revenue, which we generally refer to as volume.
Operating earnings and margin in the defense segments are driven by changes in volume, performance or contract mix. Performance refers to changes in profitability based on adjustments to estimates at completion on individual contracts. These adjustments result from increases or decreases to the estimated value of the contract, the estimated costs to complete the contract or both. Therefore, changes in costs incurred in the period compared with prior periods do not necessarily impact profitability. It is only when total estimated costs at completion on a given contract change without a corresponding change in the contract value (or vice versa) that the profitability of that contract may be impacted. Contract mix refers to changes in the volume of higher- versus lower-margin work. Higher or lower margins can result from a
29
number of factors, including contract type (e.g., fixed-price/cost-reimbursable) and type of work (e.g., development/production). Contract mix can also refer to the stage of program maturity for our long-term production contracts. New long-term production contracts typically have lower margins initially, and then margins generally increase as we achieve learning curve improvements or realize other cost reductions.
CONSOLIDATED OVERVIEW
2019 IN REVIEW
• | Record-high operating performance: |
◦ | Revenue of $39.4 billion with growth in all of our segments. |
◦ | Operating earnings of $4.6 billion, an increase of 4.3% from 2018. |
◦ | Earnings from continuing operations per diluted share of $11.98, an increase of 6.8% from 2018. |
• | Record-high backlog of $86.9 billion increased $19.1 billion, or 28.1%, from 2018, supporting our long-term growth expectations: |
◦ | Net orders for Gulfstream aircraft increased over 57% from 2018 and reflected significant demand for the new G700 aircraft. |
◦ | Several significant contract awards received in 2019 in our defense segments, including $22.2 billion for Block V of the Virginia-class submarine program in our Marine Systems segment, the largest shipbuilding contract in the U.S. Navy’s history. |
Year Ended December 31 | 2019 | 2018 | Variance | |||||||||||
Revenue | $ | 39,350 | $ | 36,193 | $ | 3,157 | 8.7 | % | ||||||
Operating costs and expenses | (34,702 | ) | (31,736 | ) | (2,966 | ) | 9.3 | % | ||||||
Operating earnings | 4,648 | 4,457 | 191 | 4.3 | % | |||||||||
Operating margin | 11.8 | % | 12.3 | % | ||||||||||
Our consolidated revenue increased 8.7% in 2019 driven by deliveries of the new G500 and G600 aircraft in our Aerospace segment and new contracts from the U.S. government for military vehicles in our Combat Systems segment and submarines in our Marine Systems segment.
Operating margin decreased in 2019 due primarily to the transition from mature products and contracts to newer ones, which typically have lower initial margins.
REVIEW OF OPERATING SEGMENTS
Following is a discussion of operating results and outlook for each of our operating segments. For the Aerospace segment, results are analyzed by specific types of products and services, consistent with how the segment is managed. For the defense segments, the discussion is based on markets and the lines of products and services offered with a supplemental discussion of specific contracts and programs when significant to the results. Additional information regarding our segments can be found in Note S to the Consolidated Financial Statements in Item 8.
30
AEROSPACE
Year Ended December 31 | 2019 | 2018 | Variance | |||||||||||
Revenue | $ | 9,801 | $ | 8,455 | $ | 1,346 | 15.9 | % | ||||||
Operating earnings | 1,532 | 1,490 | 42 | 2.8 | % | |||||||||
Operating margin | 15.6 | % | 17.6 | % | ||||||||||
Gulfstream aircraft deliveries (in units) | 147 | 121 | 26 | 21.5 | % | |||||||||
Operating Results
The increase in the Aerospace segment’s revenue in 2019 consisted of the following:
Aircraft manufacturing | $ | 1,120 | |
Aircraft services and completions | 67 | ||
Pre-owned aircraft | 159 | ||
Total increase | $ | 1,346 | |
Aircraft manufacturing revenue increased primarily from the initial deliveries of the new large-cabin G600 aircraft, which entered into service in the third quarter of 2019, and additional deliveries of the large-cabin G500 aircraft, which entered into service in the third quarter of 2018. The increase in aircraft services and completions revenue was driven by higher demand for maintenance work and the acquisition in the second quarter of 2018 of Hawker Pacific, a leading provider of aircraft services across the Asia-Pacific region and the Middle East. Additionally, we had fifteen pre-owned aircraft sales in 2019 compared with seven in 2018.
The increase in the segment’s operating earnings in 2019 consisted of the following:
Aircraft manufacturing | $ | 50 | |
Aircraft services and completions | 38 | ||
Pre-owned aircraft | (13 | ) | |
G&A/other expenses | (33 | ) | |
Total increase | $ | 42 | |
Aircraft manufacturing operating earnings were up due to additional deliveries in 2019, driven by the introduction into service of the G600 and increased production of the G500. The growth in revenue outpaced the earnings growth due to lower margins associated with the G500, which are typical of a new aircraft model. We expect the operating margins associated with both the G500 and G600 to increase over time as manufacturing learning curve improvements are achieved.
Net G&A/other expenses were up in 2019 due to nonrecurring costs associated with a reduction in our employee workforce in the fourth quarter of 2019 related primarily to streamlining support and administrative functions. This increase was offset partially by lower R&D expense in 2019, which has been trending downward with the completion of the G500 and G600 aircraft test programs, offset partially by increased activities associated with the development of the new G700 aircraft model. In total, the Aerospace segment’s operating margin decreased 200 basis points to 15.6%.
31
2020 Outlook
We expect the Aerospace segment’s 2020 revenue to be around $10 billion with operating margin in the 15.7% to 15.8% range.
COMBAT SYSTEMS
Year Ended December 31 | 2019 | 2018 | Variance | |||||||||||
Revenue | $ | 7,007 | $ | 6,241 | $ | 766 | 12.3 | % | ||||||
Operating earnings | 996 | 962 | 34 | 3.5 | % | |||||||||
Operating margin | 14.2 | % | 15.4 | % | ||||||||||
Operating Results
The increase in the Combat Systems segment’s revenue in 2019 consisted of the following:
U.S. military vehicles | $ | 480 | |
Weapons systems and munitions | 228 | ||
International military vehicles | 58 | ||
Total increase | $ | 766 | |
Revenue was up across the Combat Systems segment in 2019. Revenue from U.S. military vehicles increased due primarily to higher volume on the Army’s Abrams M1A2 System Enhancement Package Version 3 (SEPv3) tank and new Mobile Protected Firepower (MPF) vehicle programs. Weapons systems and munitions revenue was up from increased volume on several products, including Hydra-70 rockets and other artillery for the Army and missile subcomponents. Revenue from international military vehicles increased on higher tank program volume.
The Combat Systems segment’s operating margin decreased 120 basis points compared with 2018 driven by new contracts with initially lower margins in our U.S. military vehicles business and an unfavorable settlement in the first quarter of 2019 relating to a lease at a former operating site outside the United States.
2020 Outlook
We expect the Combat Systems segment’s 2020 revenue to be about $7.3 billion with operating margin of approximately 14.3%.
INFORMATION TECHNOLOGY
Year Ended December 31 | 2019 | 2018 | Variance | |||||||||||
Revenue | $ | 8,422 | $ | 8,269 | $ | 153 | 1.9 | % | ||||||
Operating earnings | 628 | 608 | 20 | 3.3 | % | |||||||||
Operating margin | 7.5 | % | 7.4 | % | ||||||||||
32
Operating Results
The increase in the Information Technology segment’s revenue in 2019 consisted of the following:
Defense | $ | 311 | |
Federal civilian | (97 | ) | |
Intelligence and homeland security | (61 | ) | |
Total increase | $ | 153 | |
Revenue increased due to an additional quarter of CSRA volume as the business was acquired in the second quarter of 2018. This increase was offset partially by lower revenue in our federal civilian business as a result of the sale of the segment’s public-facing contact-center business in the fourth quarter of 2018 and other portfolio shaping following the CSRA acquisition. Revenue in our intelligence and homeland security business was lower due to the timing of completion of several legacy programs in 2018 versus the start-up of new programs. Operating margin increased 10 basis points compared with 2018 due largely to acquisition-related synergies.
2020 Outlook
We expect the Information Technology segment’s 2020 revenue to be between $8.4 and $8.5 billion with operating margin of approximately 7.6%.
MISSION SYSTEMS
Year Ended December 31 | 2019 | 2018 | Variance | |||||||||||
Revenue | $ | 4,937 | $ | 4,726 | $ | 211 | 4.5 | % | ||||||
Operating earnings | 683 | 659 | 24 | 3.6 | % | |||||||||
Operating margin | 13.8 | % | 13.9 | % | ||||||||||
Operating Results
The increase in the Mission Systems segment’s revenue in 2019 consisted of the following:
Naval, air and electronic systems | $ | 137 | |
Ground systems and products | 58 | ||
Space, intelligence and cyber systems | 16 | ||
Total increase | $ | 211 | |
Revenue was up across the Mission Systems segment in 2019. Increased volume on combat and seaframe control systems for the U.S. Navy’s Independence-variant Littoral Combat Ships (LCSs) and fire-control systems for the Navy’s submarine programs drove the increase in the naval, air and electronic systems business. Ground systems and products revenue was up due to higher demand for computing and communications equipment. The Mission Systems segment’s operating margin decreased slightly in 2019 due primarily to mix.
2020 Outlook
We expect the Mission Systems segment’s 2020 revenue to be between $5 and $5.1 billion with operating margin of approximately 14.1%.
33
MARINE SYSTEMS
Year Ended December 31 | 2019 | 2018 | Variance | |||||||||||
Revenue | $ | 9,183 | $ | 8,502 | $ | 681 | 8.0 | % | ||||||
Operating earnings | 785 | 761 | 24 | 3.2 | % | |||||||||
Operating margin | 8.5 | % | 9.0 | % | ||||||||||
Operating Results
The increase in the Marine Systems segment’s revenue in 2019 consisted of the following:
U.S. Navy ship construction | $ | 717 | |
U.S. Navy ship engineering, repair and other services | 68 | ||
Commercial ship construction | (104 | ) | |
Total increase | $ | 681 | |
Revenue from U.S. Navy ship construction was up due to higher volume on Block V of the Virginia-class submarine program, the Columbia-class submarine program and the Arleigh Burke-class (DDG-51) destroyer program, offset somewhat by lower Virginia-class Block III volume. Revenue from U.S. Navy ship engineering, repair and other services increased driven by a higher volume of surface ship repair work. These increases were offset partially by lower commercial ship construction volume at our NASSCO shipyard.
The Marine Systems segment’s operating margin decreased 50 basis points in 2019 due primarily to mix shift in our submarine and auxiliary ship workloads to newer contracts with lower initial margins.
2020 Outlook
We expect the Marine Systems segment’s 2020 revenue to be approximately $9.8 billion with operating margin of around 8.6%.
CORPORATE
Corporate operating results consisted of the following:
Year Ended December 31 | 2019 | 2018 | |||||
Operating income (expense) | $ | 24 | $ | (23 | ) | ||
Corporate operating results in 2018 included one-time transaction-related charges of approximately $45 associated with the costs to complete the CSRA acquisition. Excluding these charges, Corporate operating results have two primary components: pension and other post-retirement benefit income, and stock option expense.
We are required to report the non-service cost components of pension and other post-retirement benefit cost (e.g., interest cost) in other income (expense) in the Consolidated Statement of Earnings. In our defense segments, pension and other post-retirement benefit costs are recoverable contract costs. Therefore, the non-service cost components are included in the operating results of these segments, but an offset is reported in Corporate. This amount exceeded our stock option expense in 2019 and 2018.
34
OTHER INFORMATION
PRODUCT AND SERVICE REVENUE AND OPERATING COSTS
Year Ended December 31 | 2019 | 2018 | Variance | |||||||||||
Revenue: | ||||||||||||||
Products | $ | 23,130 | $ | 20,149 | $ | 2,981 | 14.8 | % | ||||||
Services | 16,220 | 16,044 | 176 | 1.1 | % | |||||||||
Operating Costs: | ||||||||||||||
Products | $ | (18,569 | ) | $ | (15,894 | ) | $ | (2,675 | ) | 16.8 | % | |||
Services | (13,722 | ) | (13,584 | ) | (138 | ) | 1.0 | % | ||||||
The increase in product revenue in 2019 consisted of the following:
Aircraft manufacturing | $ | 1,120 | |
Ship construction | 609 | ||
Military vehicle production | 473 | ||
C4ISR products* | 327 | ||
Weapons systems and munitions | 228 | ||
Other, net | 224 | ||
Total increase | $ | 2,981 | |
* C4ISR (command, control, communications, computers, intelligence, surveillance and reconnaissance) solutions in our Mission Systems segment
Aircraft manufacturing revenue increased due primarily to the initial deliveries of the new large-cabin G600 aircraft and additional deliveries of the large-cabin G500 aircraft. Ship construction revenue increased due to higher volume on Block V of the Virginia-class submarine program, the Columbia-class submarine program and the DDG-51 destroyer program, offset a bit by lower commercial ship construction volume. Military vehicle production revenue increased due primarily to higher volume on the U.S. Army’s Abrams SEPv3 tank and new MPF vehicle programs. C4ISR products revenue was up due primarily to increased volume on combat and seaframe control systems for U.S. Navy surface ships and computing and communications equipment. Product operating costs increased at a higher rate than revenue due primarily to mix changes from mature programs to new production programs.
The increase in service revenue in 2019 consisted of the following:
IT services | $ | 153 | |
Other, net | 23 | ||
Total increase | $ | 176 | |
IT services revenue increased due to the CSRA acquisition in the second quarter of 2018, offset partially by the sale of a public-facing contact-center business in our Information Technology segment in the fourth quarter of 2018. Service operating costs increased consistent with the change in volume described above.
G&A EXPENSES
As a percentage of revenue, G&A expenses were 6.1% in 2019 and 6.2% in 2018. We expect G&A expenses as a percentage of revenue in 2020 to be generally consistent with 2019.
35
INTEREST, NET
Net interest expense was $460 in 2019 and $356 in 2018. The increase was due primarily to the impact of financing the CSRA acquisition, including the issuance of $7.5 billion of fixed- and floating-rate notes in the second quarter of 2018. See Note K to the Consolidated Financial Statements in Item 8 for additional information regarding our debt obligations, including interest rates. We expect 2020 net interest expense to be approximately $410, reflecting our next scheduled debt maturity of $2.5 billion in the second quarter of 2020.
OTHER, NET
Net other income was $14 in 2019 compared with expense of $16 in 2018. The 2018 expense included approximately $30 of transaction costs associated with the CSRA acquisition. Excluding these transaction costs, other represents primarily the non-service cost components of pension and other post-retirement benefits, which were net income items in both periods.
PROVISION FOR INCOME TAX, NET
Our effective tax rate was 17.1% in 2019 and 17.8% in 2018. The decrease in our effective tax rate in 2019 is due primarily to increased R&D tax credits and favorable 2019 regulatory developments associated with implementing the Tax Cuts and Jobs Act (tax reform), which was enacted on December 22, 2017, and was generally effective in 2018. For further discussion, including a reconciliation of our effective tax rate from the statutory federal rate, see Note F to the Consolidated Financial Statements in Item 8. For 2020, we anticipate a full-year effective tax rate of approximately 17.5%.
BACKLOG AND ESTIMATED POTENTIAL CONTRACT VALUE

Our total backlog, including funded and unfunded portions, was $86.9 billion on December 31, 2019, up 28.1% from $67.9 billion at the end of 2018. Our total backlog is equal to our remaining performance obligations under contracts with customers as discussed in Note C to the Consolidated Financial Statements in Item 8. Our total estimated contract value, which combines total backlog with estimated potential contract value, was $126.2 billion on December 31, 2019, up 22.1% from $103.4 billion at the end of 2018.
36
AEROSPACE

Aerospace funded backlog represents new aircraft and custom completion orders for which we have definitive purchase contracts and deposits from customers. Unfunded backlog consists of agreements to provide future aircraft maintenance and support services. The Aerospace segment ended 2019 with backlog of $13.3 billion compared with $11.4 billion at year-end 2018.
Orders in 2019 reflected strong demand across our product and services portfolio. We received orders for all models of Gulfstream aircraft, including additional orders for the G500, G600 and G650 aircraft and strong order activity for the new G700 aircraft, which is scheduled to enter service in 2022. The segment’s book-to-bill ratio (orders divided by revenue) was 1.23-to-1 in 2019.
Beyond total backlog, estimated potential contract value represents primarily options and other agreements with existing customers to purchase new aircraft and long-term aircraft services agreements. On December 31, 2019, estimated potential contract value in the Aerospace segment was $3 billion compared with $3.1 billion at year-end 2018.
Demand for Gulfstream aircraft remains strong across customer types and geographic regions, generating orders from public and privately held companies, individuals, and governments around the world. Geographically, U.S. customers represented more than 50% of the segment’s orders in 2019 and approximately 45% of the segment’s backlog on December 31, 2019, demonstrating continued strong domestic demand.
DEFENSE SEGMENTS
Our total estimated contract value in our defense segments is comprised of the following components:
• | Total backlog represents the estimated remaining sales value of work to be performed under firm contracts. |
◦ | The funded portion of total backlog includes items that have been authorized and appropriated by the U.S. Congress and funded by customers, as well as commitments by international customers that are approved and funded similarly by their governments. |
37
◦ | The unfunded portion of total backlog includes the amounts that we believe are likely to be funded, but there is no guarantee that future budgets and appropriations will provide the same funding level currently anticipated for a given program. |
• | Estimated potential contract value includes unexercised options associated with existing firm contracts and unfunded work on indefinite delivery, indefinite quantity (IDIQ) contracts. Contract options represent agreements to perform additional work under existing contracts at the election of the customer. We recognize options in backlog when the customer exercises the option and establishes a firm order. For IDIQ contracts, we evaluate the amount of funding we expect to receive and include this amount in our estimated potential contract value. This amount is often less than the total IDIQ contract value, particularly when the contract has multiple awardees. The actual amount of funding received in the future may be higher or lower than our estimate of potential contract value. |
Total backlog in our defense segments was $73.6 billion on December 31, 2019, up 30.3% from $56.5 billion at the end of 2018 driven by the award of Block V of the Virginia-class submarine program from the U.S. Navy for the construction of nine submarines. Estimated potential contract value in our defense segments was $36.3 billion on December 31, 2019, up 12% from $32.4 billion at year-end 2018.
COMBAT SYSTEMS

The Combat Systems segment’s total backlog was $14.9 billion at the end of 2019, compared with $16.6 billion at year-end 2018 as the segment continued to perform on many long-term contracts awarded in prior years. The segment’s backlog includes the work remaining on two significant multi-year contracts awarded in 2014:
• | $3.5 billion to provide wheeled armored vehicles and logistics support to an international customer through 2024. |
• | $2.6 billion from the U.K Ministry of Defence to produce AJAX armored fighting vehicles scheduled for delivery to the British Army through 2024 and related in-service support. |
38
The segment has a variety of additional international military vehicle production programs in backlog, notably:
• | $1.3 billion from the Canadian government to produce armored combat support vehicles (ACSVs) and provide associated support services. |
• | $525 to produce Piranha armored vehicles for several non-U.S. customers, including $215 to produce more than 300 armored personnel carriers for the Danish Defense Acquisition and Logistics Organization. |
• | $310 for LAVs for several non-U.S. customers, including $155 for the upgrade and modernization of LAV III combat vehicles for the Canadian Army. |
• | $195 to upgrade Duro tactical vehicles for the Swiss government. |
One of the U.S. Army’s top priorities is readiness of its platform products through critical modernization efforts, including upgrades for both the Abrams main battle tank and Stryker wheeled combat-vehicle programs. These initiatives generated significant order activity for the segment in 2019.
The segment received $875 of orders for Abrams main battle tank modernization, upgrade and sustainment programs for the U.S. Army and U.S. partners in 2019, ending the year with backlog of $2.3 billion. For the Army, backlog included $1.4 billion to produce M1A2 SEPv3 tanks, deliver M1A2 SEP components, and provide associated program support, and $260 to design and develop SEPv4 prototypes with upgraded sensors. Backlog included $475 to modernize Abrams main battle tanks for U.S. partners. An additional $250 for Abrams tank programs is included in our estimated potential contract value at year end.
The Army’s Stryker wheeled combat-vehicle program represented $525 of the segment’s backlog on December 31, 2019, with vehicles scheduled for delivery through 2021. The segment received $400 of Stryker orders in 2019, including awards to upgrade vehicles with integrated short-range air defense capabilities and provide support and engineering services.
The backlog at year end also included $185 to develop and deliver 12 prototype vehicles for the Mobile Protected Firepower (MPF) program, which will increase the firepower for the Army’s Infantry Brigade Combat Teams (IBCTs).
The Combat Systems segment’s backlog on December 31, 2019, also included $2.7 billion for weapons systems and munitions programs, including $210 to produce Hydra-70 rockets for the Army.
The segment’s estimated potential contract value was $4.3 billion on December 31, 2019, up slightly from $4.2 billion at year-end 2018.
39
INFORMATION TECHNOLOGY

The Information Technology segment’s backlog consists of thousands of contracts and task orders, and approximately 15-20% of its portfolio is recompeted each year. The segment’s total backlog was $9.1 billion at the end of 2019, up 14.7% from $8 billion at year-end 2018. This amount does not include $19 billion of estimated potential contract value associated with its anticipated share of IDIQ contracts and unexercised options on December 31, 2019, an increase of 11.4% from year-end 2018. Funding from IDIQ contracts and exercised options added $5.7 billion to the segment’s backlog in 2019, approximately 60% of the segment’s orders.
In 2019, the segment achieved a book-to-bill ratio of 1-to-1 or higher for the fifth consecutive year driven by several significant contract awards during the year, including the following:
• | $1 billion from the U.S. Department of State to provide global security engineering and supply chain management services. The program has a maximum potential contract value of over $2 billion. |
• | $330 to provide operations and maintenance support services for a Department of Homeland Security (DHS) data center. |
• | $230 from the National Geospatial-Intelligence Agency (NGA) for network storage and data center services. |
• | $215 from the U.S. Department of State to provide business process support services for the Bureau of Consular Affairs’ Global Support Strategy (GSS) program for visa services. |
• | $170 from the U.S. Air Force for the Battlefield Information Collection and Exploitation System (BICES) program to provide information sharing support to coalition operations. |
The segment’s backlog at year-end 2019 also included the following key programs:
• | $1.1 billion to support the operations and enhancement of several state health insurance programs, along with an additional $420 of estimated potential contract value. The segment received $885 of orders for these programs during the year. |
40
• | $830 to provide classified IT infrastructure services to an agency of the Department of Defense (DoD) with an additional $1.1 billion of estimated potential contract value remaining. |
• | $130 to provide turnkey training and simulation services for the U.S. Army’s Aviation Center of Excellence in Fort Rucker, Alabama. An additional $370 of estimated potential contract value remains under the contract. |
MISSION SYSTEMS
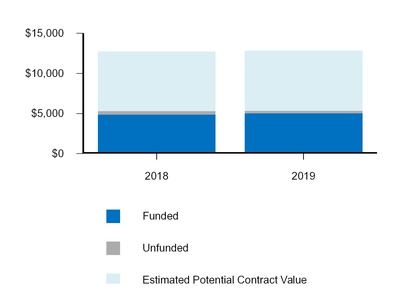
The Mission Systems segment’s backlog consists of thousands of contracts and task orders. The segment’s total backlog was $5.4 billion at the end of 2019, up slightly from $5.3 billion at year-end 2018. This amount does not include $7.5 billion of estimated potential contract value associated with its anticipated share of IDIQ contracts and unexercised options on December 31, 2019. Funding of IDIQ contracts and exercised options added $2.3 billion to the segment’s backlog in 2019, over 45% of the segment’s orders.
In 2019, the segment achieved a book-to-bill ratio of 1-to-1 or higher for the fifth consecutive year driven by several significant contract awards during the year, including the following:
• | $530 from the U.S. Army for computing and communications equipment under the CHS-5 program. $1.7 billion of estimated potential contract value remains under this IDIQ contract. |
• | $185 from the Army for its mobile communications network. |
• | $150 for design and logistics services to sustain the United Kingdom’s legacy Bowman tactical communication and information system. |
The segment’s backlog at year-end 2019 also included the following key programs:
• | $735 for the Canadian Maritime Helicopter Project (MHP) to provide integrated mission systems, training and support for Canadian marine helicopters. |
• | $495 for combat and seaframe control systems for the U.S. Navy’s Independence-variant LCSs. |
• | $250 to provide fire-control system modifications for ballistic-missile (SSBN) submarines. |
• | $155 to design and develop the next-generation tactical communication and information system in the initial phase of the United Kingdom’s Morpheus program. |
41
MARINE SYSTEMS
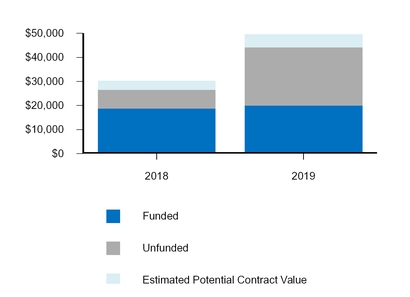
The Marine Systems segment’s backlog consists of very long-term submarine and surface ship construction programs, as well as numerous engineering and repair contracts. The segment’s book-to-bill ratio was 2.9-to-1 in 2019, resulting in backlog growth of 66.1% from $26.6 billion at year-end 2018 to $44.2 billion at the end of 2019. Estimated potential contract value was $5.5 billion on December 31, 2019, up 47.3% from $3.7 billion at year-end 2018. The increases in backlog and estimated potential contract value are due primarily to the award of Block V of the Virginia-class submarine program.
The Virginia-class submarine program was the company’s largest defense program in 2019 and the largest program in the company’s backlog. Backlog for the Virginia-class submarine program increased $18.1 billion from year-end 2018 driven by a $22.2 billion contract from the Navy in the fourth quarter of 2019 for the construction of nine submarines in Block V of the program and spare materials. The contract includes $3.2 billion of previously-awarded orders for advance materials, resulting in a net increase to backlog of $19 billion. The contract includes an option for a tenth submarine that if exercised would bring the total contract value to $24.1 billion.
For the Columbia-class ballistic-missile submarine, we are the designer and builder. The Navy considers this its top-priority program. Backlog on December 31, 2019, included $5 billion for design and prototype development, advance construction, and long-lead materials procurement. Construction of the lead boat is scheduled to begin in the fourth quarter of 2020.
The Marine Systems segment’s backlog on December 31, 2019, included construction of ESB auxiliary support ships. The segment has delivered five ships in the program, and construction is underway on the sixth ship. In 2019, the segment received a $1.1 billion award from the Navy for the design and construction of the sixth and seventh ships and an option totaling approximately $550 for an additional ship.
42
On December 31, 2019, the Marine Systems segment’s backlog included the following major ship construction programs:
Program | Backlog (in Billions) | Number of Ships | Delivery Date of Final Ship in Backlog | ||||
Virginia-class submarine | $ | 26.9 | 19 | 2029 | |||
DDG-51 destroyer | 7.0 | 11 | 2026 | ||||
T-AO-205 fleet replenishment oiler | 1.4 | 5 | 2024 | ||||
ESB auxiliary support ship | 1.0 | 2 | 2023 | ||||
Complementing these ship construction programs, ship and submarine maintenance, repair and other services represented approximately $1.5 billion of the Marine Systems segment’s backlog on December 31, 2019, including $1.2 billion for surface-ship repair operations.
FINANCIAL CONDITION, LIQUIDITY AND CAPITAL RESOURCES
We place a strong emphasis on cash flow generation. This focus gives us the flexibility for capital deployment while preserving a strong balance sheet to position us for future opportunities. Cash generated by operating activities in 2019 and 2018 was deployed to pay dividends, fund capital expenditures and business acquisitions, and repurchase our common stock.
Year Ended December 31 | 2019 | 2018 | |||||
Net cash provided by operating activities | $ | 2,981 | $ | 3,148 | |||
Net cash used by investing activities | (994 | ) | (10,234 | ) | |||
Net cash (used) provided by financing activities | (1,997 | ) | 5,086 | ||||
Net cash used by discontinued operations | (51 | ) | (20 | ) | |||
Net decrease in cash and equivalents | (61 | ) | (2,020 | ) | |||
Cash and equivalents at beginning of year | 963 | 2,983 | |||||
Cash and equivalents at end of year | 902 | 963 | |||||
Short- and long-term debt | (11,930 | ) | (12,417 | ) | |||
Net debt | $ | (11,028 | ) | $ | (11,454 | ) | |
Debt-to-equity (a) | 87.9 | % | 105.8 | % | |||
Debt-to-capital (b) | 46.8 | % | 51.4 | % | |||
(a) | Debt-to-equity ratio is calculated as total debt divided by total equity as of year end. |
(b) | Debt-to-capital ratio is calculated as total debt divided by the sum of total debt plus total equity as of year end. |
We expect to continue to generate funds in excess of our short- and long-term liquidity needs. We believe we have adequate funds on hand and sufficient borrowing capacity to execute our financial and operating strategy. The following is a discussion of our major operating, investing and financing activities in 2019 and 2018, as classified on the Consolidated Statement of Cash Flows in Item 8.
43
OPERATING ACTIVITIES
We generated cash from operating activities of $3 billion in 2019 and $3.1 billion in 2018. The primary driver of cash inflows in both years was net earnings. However, cash flows in both years were affected negatively by growth in operating working capital (OWC), particularly the timing of payments on a large international wheeled armored vehicle contract in our Combat Systems segment. For additional information about the growth in our unbilled receivables balance, see Note H to the Consolidated Financial Statements in Item 8. Cash flows in 2019 were also affected negatively by net OWC growth in our Aerospace segment driven by our position in the development, production and cash collection cycles of our Gulfstream aircraft models. Additionally, cash flows in 2018 reflected a discretionary pension plan contribution of $255.
INVESTING ACTIVITIES
Cash used for investing activities was $994 in 2019 and $10.2 billion in 2018. Our investing activities include cash paid for capital expenditures and business acquisitions; proceeds from asset sales; and purchases, sales and maturities of marketable securities.
Capital Expenditures. The primary use of cash for investing activities in 2019 was capital expenditures. Capital expenditures were $987 in 2019 and $690 in 2018. The increase reflects ongoing investments to support growth at our shipyards. We expect capital expenditures to be approximately 2.5% of revenue in 2020.
Business Acquisitions. In 2019, we acquired three businesses for an aggregate of approximately $20. In 2018, we acquired six businesses for an aggregate of $10.1 billion, including $9.7 billion for CSRA.
Other, Net. Investing activities also include proceeds from asset sales. In 2019, we completed the sale of a business in our Information Technology segment that was classified as held for sale on the Consolidated Balance Sheet on December 31, 2018. In 2018, we completed the sale of three businesses in our Information Technology segment: a commercial health products business, CSRA operations that we were required by a government customer to dispose of to address an organizational conflict of interest with respect to services provided to the customer, and a public-facing contact-center business.
FINANCING ACTIVITIES
Cash used by financing activities was $2 billion in 2019 compared with cash provided by financing activities of $5.1 billion in 2018. Our financing activities include payment of dividends, repurchases of common stock, and debt and commercial paper repayments. Net cash from financing activities also includes proceeds received from debt and commercial paper issuances and employee stock options exercises.
Dividends. On March 6, 2019, our board of directors declared an increased quarterly dividend of $1.02 per share, the 22nd consecutive annual increase. Previously, the board had increased the quarterly dividend to $0.93 per share in March 2018. Cash dividends paid were $1.2 billion in 2019 and $1.1 billion in 2018.
Share Repurchases. Our board of directors from time to time authorizes management’s repurchase of outstanding shares of our common stock on the open market. We repurchased 1.1 million of our outstanding shares for $184 in 2019 and 10.1 million shares for $1.8 billion in 2018. On December 31, 2019, 6.4 million shares remained authorized by our board of directors for repurchase, approximately 2% of our total shares outstanding.
44
Debt and Commercial Paper Issuances and Repayments. In 2019, we repaid $850 of commercial paper, resulting in no commercial paper outstanding on December 31, 2019, but we maintain the ability to access the commercial paper market in the future. In 2018, we issued $7.5 billion of fixed- and floating-rate notes to finance the acquisition of CSRA. Additionally, in 2018, we paid $450 to satisfy obligations under CSRA’s accounts receivable purchase agreement.
Fixed- and floating-rate notes totaling $2.5 billion mature in May 2020. We currently plan to repay these notes using a combination of cash on hand and the issuance of commercial paper. For additional information regarding our debt obligations, including scheduled debt maturities and interest rates, and our credit facilities, see Note K to the Consolidated Financial Statements in Item 8.
We have $5 billion in committed bank credit facilities for general corporate purposes and working capital needs and to support our commercial paper issuances. These credit facilities include a $2 billion 364-day facility expiring in March 2020, a $1 billion multi-year facility expiring in November 2020 and a $2 billion multi-year facility expiring in March 2023. We may renew or replace these credit facilities in whole or in part at or prior to their expiration dates. Our credit facilities are guaranteed by several of our 100%-owned subsidiaries. We also have an effective shelf registration on file with the Securities and Exchange Commission that allows us to access the debt markets.
NON-GAAP FINANCIAL MEASURES
We emphasize the efficient conversion of net earnings into cash and the deployment of that cash to maximize shareholder returns. As described below, we use free cash flow from operations and return on invested capital (ROIC) to measure our performance in these areas. While we believe these metrics provide useful information, they are not defined operating measures under U.S. generally accepted accounting principles (GAAP), and there are limitations associated with their use. Our calculation of these metrics may not be completely comparable to similarly titled measures of other companies due to potential differences in the method of calculation. As a result, the use of these metrics should not be considered in isolation from, or as a substitute for, other GAAP measures.
Free Cash Flow. We define free cash flow from operations as net cash provided by operating activities less capital expenditures. We believe free cash flow from operations is a useful measure for investors because it portrays our ability to generate cash from our businesses for purposes such as repaying maturing debt, funding business acquisitions, repurchasing our common stock and paying dividends. We use free cash flow from operations to assess the quality of our earnings and as a key performance measure in evaluating management. The following table reconciles the free cash flow from operations with net cash provided by operating activities, as classified on the Consolidated Statement of Cash Flows in Item 8:
Year Ended December 31 | 2019 | 2018 | 2017 | 2016 | 2015 | ||||||||||||||
Net cash provided by operating activities | $ | 2,981 | $ | 3,148 | $ | 3,876 | $ | 2,163 | $ | 2,607 | |||||||||
Capital expenditures | (987 | ) | (690 | ) | (428 | ) | (392 | ) | (569 | ) | |||||||||
Free cash flow from operations | $ | 1,994 | $ | 2,458 | $ | 3,448 | $ | 1,771 | $ | 2,038 | |||||||||
Cash flows as a percentage of earnings from continuing operations: | |||||||||||||||||||
Net cash provided by operating activities | 86 | % | 94 | % | 133 | % | 81 | % | 86 | % | |||||||||
Free cash flow from operations | 57 | % | 73 | % | 118 | % | 66 | % | 67 | % | |||||||||
45
Return on Invested Capital. We believe ROIC is a useful measure for investors because it reflects our ability to generate returns from the capital we have deployed in our operations. We use ROIC to evaluate investment decisions and as a performance measure in evaluating management. We define ROIC as net operating profit after taxes divided by average invested capital. Net operating profit after taxes is defined as earnings from continuing operations plus after-tax interest and amortization expense, calculated using the statutory federal income tax rate. Average invested capital is defined as the sum of the average debt and shareholders’ equity excluding accumulated other comprehensive loss. ROIC excludes goodwill impairments and non-economic accounting changes as they are not reflective of company performance.
ROIC is calculated as follows:
Year Ended December 31 | 2019 | 2018 | 2017 | 2016 | 2015 | ||||||||||||||
Earnings from continuing operations | $ | 3,484 | $ | 3,358 | $ | 2,912 | $ | 2,679 | $ | 3,036 | |||||||||
After-tax interest expense | 373 | 295 | 76 | 64 | 64 | ||||||||||||||
After-tax amortization expense | 287 | 258 | 51 | 57 | 75 | ||||||||||||||
Net operating profit after taxes | $ | 4,144 | $ | 3,911 | $ | 3,039 | $ | 2,800 | $ | 3,175 | |||||||||
Average invested capital | $ | 29,620 | $ | 25,367 | $ | 18,099 | $ | 17,168 | $ | 17,579 | |||||||||
Return on invested capital | 14.0 | % | 15.4 | % | 16.8 | % | 16.3 | % | 18.1 | % | |||||||||
ADDITIONAL FINANCIAL INFORMATION
OFF-BALANCE SHEET ARRANGEMENTS
On December 31, 2019, we had no material off-balance sheet arrangements.
CONTRACTUAL OBLIGATIONS AND COMMERCIAL COMMITMENTS
The following tables present information about our contractual obligations and commercial commitments on December 31, 2019:
Payments Due by Period | |||||||||||||||||||
Contractual Obligations | Total Amount Committed | Less Than 1 Year | 1-3 Years | 4-5 Years | More Than 5 Years | ||||||||||||||
Debt (a) | $ | 13,504 | $ | 3,229 | $ | 4,424 | $ | 2,017 | $ | 3,834 | |||||||||
Operating leases | 1,864 | 302 | 473 | 299 | 790 | ||||||||||||||
Finance leases | 443 | 91 | 166 | 55 | 131 | ||||||||||||||
Purchase obligations (b) | 43,187 | 19,598 | 16,610 | 5,183 | 1,796 | ||||||||||||||
Other long-term liabilities (c) | 26,019 | 5,167 | 3,053 | 2,608 | 15,191 | ||||||||||||||
$ | 85,017 | $ | 28,387 | $ | 24,726 | $ | 10,162 | $ | 21,742 | ||||||||||
(a)Includes scheduled interest payments. See Note K to the Consolidated Financial Statements in Item 8 for a discussion of long-term debt.
(b)Includes amounts committed under legally enforceable agreements for goods and services with defined terms as to quantity, price and timing of delivery. This amount includes $34.8 billion of purchase obligations for products and services to be delivered under firm government contracts under which we would expect full recourse under normal contract termination clauses.
(c)Represents other long-term liabilities on our Consolidated Balance Sheet, including the current portion of these liabilities. The projected timing of cash flows associated with these obligations is based on management’s estimates, which are based largely on historical experience. This amount also includes all liabilities under our defined-benefit retirement plans. See Note R to the Consolidated Financial Statements in Item 8 for information regarding these liabilities and the plan assets available to satisfy them.
46
Amount of Commitment Expiration by Period | |||||||||||||||||||
Commercial Commitments | Total Amount Committed | Less Than 1 Year | 1-3 Years | 4-5 Years | More Than 5 Years | ||||||||||||||
Letters of credit and guarantees* | $ | 1,463 | $ | 861 | $ | 249 | $ | 324 | $ | 29 | |||||||||
Aircraft trade-in options* | 380 | 65 | 148 | 167 | — | ||||||||||||||
$ | 1,843 | $ | 926 | $ | 397 | $ | 491 | $ | 29 | ||||||||||
* See Note O to the Consolidated Financial Statements in Item 8 for a discussion of letters of credit and aircraft trade-in options.
APPLICATION OF CRITICAL ACCOUNTING POLICIES
Management’s Discussion and Analysis of Financial Condition and Results of Operations is based on our Consolidated Financial Statements, which have been prepared in accordance with GAAP. The preparation of financial statements in accordance with GAAP requires that we make estimates and assumptions that affect the reported amounts of assets and liabilities and the disclosure of contingent assets and liabilities at the date of the financial statements, as well as the reported amounts of revenue and expenses during the reporting period. On an ongoing basis, we evaluate our estimates including most pervasively those related to various assumptions and projections for our long-term contracts and programs. Other significant estimates include those related to goodwill and intangible assets, income taxes, pension and other post-retirement benefits, workers’ compensation, warranty obligations and litigation contingencies. We employ judgment in making our estimates, but they are based on historical experience, currently available information and various other assumptions that we believe to be reasonable under the circumstances. These estimates form the basis for making judgments about the carrying values of assets and liabilities that are not readily available from other sources. Actual results may differ from these estimates. We believe our judgment is applied consistently and produces financial information that fairly depicts the results of operations for all periods presented.
In our opinion, the following policies are critical and require the use of significant judgment in their application:
Revenue. A performance obligation is a promise in a contract to transfer a distinct good or service to the customer, and is the unit of account for revenue. A contract’s transaction price is allocated to each distinct performance obligation within that contract and recognized as revenue when, or as, the performance obligation is satisfied. Our performance obligations are satisfied over time as work progresses or at a point in time.
Substantially all of our revenue in the defense segments is recognized over time, because control is transferred continuously to our customers. Typically, revenue is recognized over time using costs incurred to date relative to total estimated costs at completion to measure progress toward satisfying our performance obligations. Incurred cost represents work performed, which corresponds with, and thereby best depicts, the transfer of control to the customer. Contract costs include labor, material, overhead and, when appropriate, G&A expenses.
The majority of our revenue recognized at a point in time is for the manufacture of business-jet aircraft in our Aerospace segment. Revenue on these contracts is recognized when the customer obtains control of the asset, which is generally upon delivery and acceptance by the customer of the fully outfitted aircraft.
The majority of our revenue is derived from long-term contracts and programs that can span several years. Accounting for long-term contracts and programs involves the use of various techniques to estimate total contract revenue and costs. For long-term contracts, we estimate the profit on a contract as the difference
47
between the total estimated revenue and expected costs to complete a contract and recognize that profit over the life of the contract.
Contract estimates are based on various assumptions to project the outcome of future events that often span several years. These assumptions include labor productivity and availability; the complexity of the work to be performed; the cost and availability of materials; the performance of subcontractors; and the availability and timing of funding from the customer.
The nature of our contracts gives rise to several types of variable consideration, including claims and award and incentive fees. We include in our contract estimates additional revenue for submitted contract modifications or claims against the customer when we believe we have an enforceable right to the modification or claim, the amount can be estimated reliably and its realization is probable. In evaluating these criteria, we consider the contractual/legal basis for the claim, the cause of any additional costs incurred, the reasonableness of those costs and the objective evidence available to support the claim. We include award or incentive fees in the estimated transaction price when there is a basis to reasonably estimate the amount of the fee. These estimates are based on historical award experience, anticipated performance and our best judgment at the time. Because of our certainty in estimating these amounts, they are included in the transaction price of our contracts and the associated remaining performance obligations.
As a significant change in one or more of these estimates could affect the profitability of our contracts, we review and update our contract-related estimates regularly. We recognize adjustments in estimated profit on contracts under the cumulative catch-up method. Under this method, the impact of the adjustment on profit recorded to date on a contract is recognized in the period the adjustment is identified. Revenue and profit in future periods of contract performance are recognized using the adjusted estimate. The aggregate impact of adjustments in contract estimates increased our operating earnings (and diluted earnings per share) by $271 ($0.74) in 2019 and $345 ($0.91) in 2018. No adjustment on any one contract was material to our Consolidated Financial Statements in 2019 or 2018.
Consistent with industry practice, we classify assets and liabilities related to long-term contracts as current, even though some of these amounts may not be realized within one year. The timing of revenue recognition, billings and cash collections results in billed accounts receivable, unbilled receivables (contract assets), and customer advances and deposits (contract liabilities) on the Consolidated Balance Sheet. These assets and liabilities are reported on the Consolidated Balance Sheet on a contract-by-contract basis at the end of each reporting period.
Long-lived Assets and Goodwill. We review long-lived assets, including intangible assets subject to amortization, for impairment whenever events or changes in circumstances indicate that the carrying value of the asset may not be recoverable. We assess the recoverability of the carrying value of assets held for use based on a review of undiscounted projected cash flows. Impairment losses, where identified, are measured as the excess of the carrying value of the long-lived asset over its estimated fair value as determined by discounted projected cash flows.
Goodwill represents the purchase price paid in excess of the fair value of net tangible and intangible assets acquired in a business combination. We review goodwill for impairment annually at each of our reporting units or when circumstances indicate that the likelihood of an impairment is greater than 50%. Such circumstances include a significant adverse change in the business climate for one of our reporting units or a decision to dispose of a reporting unit or a significant portion of a reporting unit. Our reporting units are consistent with our operating segments in Note S to the Consolidated Financial Statements in Item 8. We use both qualitative and quantitative approaches when testing goodwill for impairment. When determining the approach to be used, we consider the current facts and circumstances of each reporting
48
unit as well as the excess of each reporting unit’s estimated fair value over its carrying value based on our most recent quantitative assessments. Our qualitative approach evaluates the business environment and various events impacting the reporting unit including, but not limited to, macroeconomic conditions, changes in the business environment and reporting unit-specific events. If, based on the qualitative assessment, we determine that it is more likely than not that the fair value of a reporting unit is greater than its carrying value, then a quantitative assessment is not necessary. However, if a quantitative assessment is determined to be necessary, we use a two-step process to first identify potential goodwill impairment for a reporting unit by comparing its fair value to its carrying value and then, if necessary, measure the amount of the impairment loss.
Our estimate of fair value is based primarily on the discounted projected cash flows of the underlying operations and requires the use of judgment by management. The process requires numerous assumptions, including the timing of work embedded in our backlog, our performance and profitability under our contracts, our success in securing future business, the appropriate risk-adjusted interest rate used to discount the projected cash flows, and terminal value growth rates applied to the final year of projected cash flows. Due to the variables inherent in our estimates of fair value, differences in assumptions may have a material effect on the result of our impairment analysis. To assess the reasonableness of our discounted projected cash flows, we compare the sum of our reporting units’ fair value to our market capitalization and calculate an implied control premium (the excess of the market capitalization over the sum of the reporting units’ fair values). Additionally, we evaluate the reasonableness of each reporting unit’s fair value by comparing the fair value to comparable peer companies and recent comparable market transactions.
As of December 31, 2019, we completed qualitative assessments for our Aerospace, Combat Systems, Mission Systems and Marine Systems reporting units as the estimated fair values of each of these reporting units significantly exceeded the respective carrying values based on our most recent quantitative assessments, which were performed as of December 31, 2018. Our qualitative assessments did not present indicators of impairment for these reporting units as of December 31, 2019.
As of December 31, 2019, we completed a quantitative assessment for our Information Technology reporting unit, and the results indicated that no impairment existed. The Information Technology reporting unit’s estimated fair value exceeded its carrying value by approximately 25%, reflecting the size of the CSRA acquisition relative to the Information Technology reporting unit and its recent acquisition date. Given that the net book value of this business was recorded at its fair value at the acquisition date in 2018, the reporting unit’s carrying value, by default, continues to closely approximate its fair value as of December 31, 2019. As the carrying value and fair value of the Information Technology reporting unit are closely aligned, a material change in the fair value or carrying value could put the reporting unit at risk of goodwill impairment. For example, if the synergies from the acquisition or funding in the U.S. government budget for our contracts fall significantly below our projections, the fair value of the reporting unit would be negatively impacted. Similarly, an increase in interest rates would lower our discounted cash flows and negatively impact the fair value of the reporting unit. We believe the projections and assumptions we used in estimating fair value are reasonable, but it is possible actual experience could differ, impacting our fair value estimate.
Commitments and Contingencies. We are subject to litigation and other legal proceedings arising either from the normal course of business or under provisions relating to the protection of the environment. Estimating liabilities and costs associated with these matters requires the use of judgment. We record a charge against earnings when a liability associated with claims or pending or threatened litigation is probable and when our exposure is reasonably estimable. The ultimate resolution of our exposure related to these matters may change as further facts and circumstances become known.
49
Other Contract Costs. Other contract costs represent amounts that are not currently allocable to government contracts, such as a portion of our estimated workers’ compensation obligations, other insurance-related assessments, pension and other post-retirement benefits, and environmental expenses. These costs will become allocable to contracts generally after they are paid. We have elected to defer these costs in other current assets on the Consolidated Balance Sheet until they can be allocated to contracts. We expect to recover these costs through ongoing business, including existing backlog and probable follow-on contracts. We regularly assess the probability of recovery of these costs. This assessment requires that we make assumptions about future contract costs, the extent of cost recovery under our contracts and the amount of future contract activity. These estimates are based on our best judgment. If the backlog in the future does not support the continued deferral of these costs, the profitability of our remaining contracts could be adversely affected.
Retirement Plans. Our defined-benefit pension and other post-retirement benefit costs and obligations depend on several assumptions and estimates. The key assumptions include interest rates used to discount estimated future liabilities and projected long-term rates of return on plan assets. We base the discount rates on a current yield curve developed from a portfolio of high-quality, fixed-income investments with maturities consistent with the projected benefit payout period. We use the spot rate approach to identify individual spot rates along the yield curve that correspond with the timing of each projected service cost and discounted benefit obligation payment.
We determine the long-term rates of return on assets based on consideration of historical and forward-looking returns and the current and expected asset allocation strategy. For 2019, we decreased the expected long-term rates of return on assets in our primary U.S. other post-retirement benefit plans by 100 basis points, following an assessment of the historical and expected long-term returns of our various asset classes.
These retirement plan assumptions are based on our best judgment, including consideration of current and future market conditions. In the event any of the assumptions change, pension and other post-retirement benefit cost could increase or decrease. For further discussion about our retirement plan assumptions, see Note R to the Consolidated Financial Statements in Item 8.
As discussed under Other Contract Costs, our contractual arrangements with the U.S. government provide for the recovery of benefit costs for our government retirement plans. We have elected to defer recognition of the benefit costs until such costs can be allocated to contracts. Therefore, the impact of annual changes in financial reporting assumptions on the retirement benefit cost for these plans does not immediately affect our operating results.
Accounting Standards Updates. See Note A to the Consolidated Financial Statements in Item 8 for information regarding accounting standards we adopted in 2019 and other new accounting standards that have been issued by the Financial Accounting Standards Board (FASB) but are not effective until after December 31, 2019.
ITEM 7A. QUANTITATIVE AND QUALITATIVE DISCLOSURES ABOUT MARKET RISK
We are exposed to market risk, primarily from foreign currency exchange rates, interest rates, commodity prices and investments. See Note N to the Consolidated Financial Statements in Item 8 for a discussion of these risks. The following quantifies the market risk exposure arising from hypothetical changes in foreign currency exchange rates and interest rates.
50
We had notional forward exchange and interest rate swap contracts outstanding of $5 billion and $5.8 billion on December 31, 2019 and 2018, respectively. A 10% unfavorable rate movement in our portfolio of forward exchange and interest rate swap contracts would have resulted in the following hypothetical, incremental pretax gains (losses):
(Dollars in millions) | 2019 | 2018 | |||||
Recognized | $ | 60 | $ | 61 | |||
Unrecognized | (161 | ) | (135 | ) | |||
Foreign Currency Risk. Our exchange-rate sensitivity relates primarily to changes in the Canadian dollar, euro, Swiss franc and British pound exchange rates. These losses and gains would be offset by corresponding gains and losses in the remeasurement of the underlying transactions being hedged. We believe these foreign currency forward exchange contracts and the offsetting underlying commitments, when taken together, do not create material market risk.
Interest Rate Risk. Our financial instruments subject to interest rate risk include variable-rate commercial paper and fixed- and floating-rate long-term debt obligations. On December 31, 2019, we had $10.5 billion par value of fixed-rate debt and $1 billion of floating-rate notes. Our fixed-rate debt obligations are not putable, and we do not trade these securities in the market. A 10% unfavorable interest rate movement would not have a material impact on the fair value of our fixed-rate debt. As described in Note K to the Consolidated Financial Statements in Item 8, we entered into derivative financial instruments, specifically interest rate swap contracts, to eliminate our floating-rate interest risk.
Investment Risk. Our investment policy allows for purchases of fixed-income securities with an investment-grade rating and a maximum maturity of up to five years. On December 31, 2019, we held $902 in cash and equivalents, but held no marketable securities other than those held in trust to meet some of our obligations under workers’ compensation and non-qualified supplemental executive retirement plans. On December 31, 2019, these marketable securities totaled $207 and were reflected at fair value on the Consolidated Balance Sheet in other current and noncurrent assets.
51
ITEM 8. FINANCIAL STATEMENTS AND SUPPLEMENTARY DATA
CONSOLIDATED STATEMENT OF EARNINGS
Year Ended December 31 | |||||||||||
(Dollars in millions, except per-share amounts) | 2019 | 2018 | 2017 | ||||||||
Revenue: | |||||||||||
Products | $ | $ | $ | ||||||||
Services | |||||||||||
Operating costs and expenses: | |||||||||||
Products | ( | ) | ( | ) | ( | ) | |||||
Services | ( | ) | ( | ) | ( | ) | |||||
General and administrative (G&A) | ( | ) | ( | ) | ( | ) | |||||
( | ) | ( | ) | ( | ) | ||||||
Operating earnings | |||||||||||
Interest, net | ( | ) | ( | ) | ( | ) | |||||
Other, net | ( | ) | ( | ) | |||||||
Earnings from continuing operations before income tax | |||||||||||
Provision for income tax, net | ( | ) | ( | ) | ( | ) | |||||
Earnings from continuing operations | |||||||||||
Discontinued operations, net of tax provision of $13 in 2018 | ( | ) | |||||||||
Net earnings | $ | $ | $ | ||||||||
Earnings per share | |||||||||||
Basic: | |||||||||||
Continuing operations | $ | $ | $ | ||||||||
Discontinued operations | ( | ) | |||||||||
Net earnings | $ | $ | $ | ||||||||
Diluted: | |||||||||||
Continuing operations | $ | $ | $ | ||||||||
Discontinued operations | ( | ) | |||||||||
Net earnings | $ | $ | $ | ||||||||
The accompanying Notes to Consolidated Financial Statements are an integral part of these financial statements.
52
CONSOLIDATED STATEMENT OF COMPREHENSIVE INCOME
Year Ended December 31 | ||||||||||||
(Dollars in millions) | 2019 | 2018 | 2017 | |||||||||
Net earnings | $ | $ | $ | |||||||||
Gains on cash flow hedges | ||||||||||||
Unrealized gains on marketable securities | ||||||||||||
Foreign currency translation adjustments | ( | ) | ||||||||||
Change in retirement plans’ funded status | ( | ) | ( | ) | ||||||||
Other comprehensive (loss) income, pretax | ( | ) | ( | ) | ||||||||
Benefit (provision) for income tax, net | ( | ) | ||||||||||
Other comprehensive (loss) income, net of tax | ( | ) | ( | ) | ||||||||
Comprehensive income | $ | $ | $ | |||||||||
The accompanying Notes to Consolidated Financial Statements are an integral part of these financial statements.
53
CONSOLIDATED BALANCE SHEET
December 31 | |||||||
(Dollars in millions) | 2019 | 2018 | |||||
ASSETS | |||||||
Current assets: | |||||||
Cash and equivalents | $ | $ | |||||
Accounts receivable | |||||||
Unbilled receivables | |||||||
Inventories | |||||||
Other current assets | |||||||
Total current assets | |||||||
Noncurrent assets: | |||||||
Property, plant and equipment, net | |||||||
Intangible assets, net | |||||||
Goodwill | |||||||
Other assets | |||||||
Total noncurrent assets | |||||||
Total assets | $ | $ | |||||
LIABILITIES AND SHAREHOLDERS’ EQUITY | |||||||
Current liabilities: | |||||||
Short-term debt and current portion of long-term debt | $ | $ | |||||
Accounts payable | |||||||
Customer advances and deposits | |||||||
Other current liabilities | |||||||
Total current liabilities | |||||||
Noncurrent liabilities: | |||||||
Long-term debt | |||||||
Other liabilities | |||||||
Commitments and contingencies (see Note O) | |||||||
Total noncurrent liabilities | |||||||
Shareholders’ equity: | |||||||
Common stock | |||||||
Surplus | |||||||
Retained earnings | |||||||
Treasury stock | ( | ) | ( | ) | |||
Accumulated other comprehensive loss | ( | ) | ( | ) | |||
Total shareholders’ equity | |||||||
Total liabilities and shareholders’ equity | $ | $ | |||||
54
CONSOLIDATED STATEMENT OF CASH FLOWS
Year Ended December 31 | |||||||||||
(Dollars in millions) | 2019 | 2018 | 2017 | ||||||||
Cash flows from operating activities - continuing operations: | |||||||||||
Net earnings | $ | $ | $ | ||||||||
Adjustments to reconcile net earnings to net cash from operating activities: | |||||||||||
Depreciation of property, plant and equipment | |||||||||||
Amortization of intangible and finance lease right-of-use assets | |||||||||||
Equity-based compensation expense | |||||||||||
Deferred income tax (benefit) provision | ( | ) | |||||||||
Discontinued operations, net of tax | |||||||||||
(Increase) decrease in assets, net of effects of business acquisitions: | |||||||||||
Accounts receivable | ( | ) | |||||||||
Unbilled receivables | ( | ) | ( | ) | ( | ) | |||||
Inventories | ( | ) | ( | ) | ( | ) | |||||
Other current assets | |||||||||||
Increase (decrease) in liabilities, net of effects of business acquisitions: | |||||||||||
Accounts payable | ( | ) | |||||||||
Customer advances and deposits | ( | ) | |||||||||
Other, net | ( | ) | |||||||||
Net cash provided by operating activities | |||||||||||
Cash flows from investing activities: | |||||||||||
Capital expenditures | ( | ) | ( | ) | ( | ) | |||||
Business acquisitions, net of cash acquired | ( | ) | ( | ) | ( | ) | |||||
Proceeds from sales of assets | |||||||||||
Other, net | ( | ) | ( | ) | ( | ) | |||||
Net cash used by investing activities | ( | ) | ( | ) | ( | ) | |||||
Cash flows from financing activities: | |||||||||||
Dividends paid | ( | ) | ( | ) | ( | ) | |||||
(Repayments of) proceeds from commercial paper, net | ( | ) | |||||||||
Purchases of common stock | ( | ) | ( | ) | ( | ) | |||||
Proceeds from fixed-rate notes | |||||||||||
Proceeds from floating-rate notes | |||||||||||
Repayment of CSRA accounts receivable purchase agreement | ( | ) | |||||||||
Repayment of fixed-rate notes | ( | ) | |||||||||
Other, net | |||||||||||
Net cash (used) provided by financing activities | ( | ) | ( | ) | |||||||
Net cash used by discontinued operations | ( | ) | ( | ) | ( | ) | |||||
Net (decrease) increase in cash and equivalents | ( | ) | ( | ) | |||||||
Cash and equivalents at beginning of year | |||||||||||
Cash and equivalents at end of year | $ | $ | $ | ||||||||
The accompanying Notes to Consolidated Financial Statements are an integral part of these financial statements.
55
CONSOLIDATED STATEMENT OF SHAREHOLDERS’ EQUITY
Common Stock | Retained | Treasury | Accumulated Other Comprehensive | Total Shareholders’ | |||||||||||||||||||
(Dollars in millions) | Par | Surplus | Earnings | Stock | Loss | Equity | |||||||||||||||||
December 31, 2016 | $ | $ | $ | $ | ( | ) | $ | ( | ) | $ | |||||||||||||
Cumulative-effect adjustment (a) | — | — | ( | ) | — | — | ( | ) | |||||||||||||||
Net earnings | — | — | — | — | |||||||||||||||||||
Cash dividends declared | — | — | ( | ) | — | — | ( | ) | |||||||||||||||
Equity-based awards | — | — | — | ||||||||||||||||||||
Shares purchased | — | — | — | ( | ) | — | ( | ) | |||||||||||||||
Other comprehensive income | — | — | — | — | |||||||||||||||||||
December 31, 2017 | ( | ) | ( | ) | |||||||||||||||||||
Cumulative-effect adjustments (b) | — | — | — | ( | ) | ||||||||||||||||||
Net earnings | — | — | — | — | |||||||||||||||||||
Cash dividends declared | — | — | ( | ) | — | — | ( | ) | |||||||||||||||
Equity-based awards | — | — | — | ||||||||||||||||||||
Shares purchased | — | — | — | ( | ) | — | ( | ) | |||||||||||||||
Other comprehensive loss | — | — | — | — | ( | ) | ( | ) | |||||||||||||||
December 31, 2018 | ( | ) | ( | ) | |||||||||||||||||||
Net earnings | — | — | — | — | |||||||||||||||||||
Cash dividends declared | — | — | ( | ) | — | — | ( | ) | |||||||||||||||
Equity-based awards | — | — | — | ||||||||||||||||||||
Shares purchased | — | — | — | ( | ) | — | ( | ) | |||||||||||||||
Other comprehensive loss | — | — | — | — | ( | ) | ( | ) | |||||||||||||||
December 31, 2019 | $ | $ | $ | $ | ( | ) | $ | ( | ) | $ | |||||||||||||
The accompanying Notes to Consolidated Financial Statements are an integral part of these financial statements.
(a) Reflects the cumulative effect of Accounting Standards Update (ASU) 2016-16, Income Taxes (Topic 740): Intra-Entity Transfers of Assets Other Than Inventory, which we adopted on January 1, 2017.
(b) Reflects the cumulative effects of ASU 2016-01, Financial Instruments - Overall (Subtopic 825-10): Recognition and Measurement of Financial Assets and Financial Liabilities, and ASU 2018-02, Income Statement - Reporting Comprehensive Income (Topic 220): Reclassification of Certain Tax Effects from Accumulated Other Comprehensive Income, which we adopted on January 1, 2018.
56
NOTES TO CONSOLIDATED FINANCIAL STATEMENTS
(Dollars in millions, except per-share amounts or unless otherwise noted)
A. SUMMARY OF SIGNIFICANT ACCOUNTING POLICIES
Organization. General Dynamics is a global aerospace and defense company that offers a broad portfolio of products and services in business aviation; combat vehicles, weapons systems and munitions; information technology (IT) services; command, control, communications, computers, intelligence, surveillance and reconnaissance (C4ISR) solutions; and shipbuilding and ship repair.
Basis of Consolidation and Classification. The Consolidated Financial Statements include the accounts of General Dynamics Corporation and our wholly owned and majority-owned subsidiaries. We eliminate all inter-company balances and transactions in the Consolidated Financial Statements. Some prior-year amounts have been reclassified among financial statement accounts or disclosures to conform to the current-year presentation.
Consistent with industry practice, we classify assets and liabilities related to long-term contracts as current, even though some of these amounts may not be realized within one year.
Further discussion of our significant accounting policies is contained in the other notes to these financial statements.
Use of Estimates. The nature of our business requires that we make estimates and assumptions in accordance with U.S. generally accepted accounting principles (GAAP). These estimates and assumptions affect the reported amounts of assets and liabilities and the disclosure of contingent assets and liabilities at the date of the financial statements, as well as the reported amounts of revenue and expenses during the reporting period. We base our estimates on historical experience, currently available information and various other assumptions that we believe are reasonable under the circumstances. Actual results could differ from these estimates.
Discontinued Operations, Net of Tax. On April 3, 2018, we completed our acquisition of CSRA Inc. (CSRA). See Note B for further discussion of the acquisition. In the third quarter of 2018, we disposed of CSRA operations to address an organizational conflict of interest with respect to services provided to a government customer. In accordance with GAAP, the sale did not result in a gain for financial reporting purposes. However, the sale generated a taxable gain, resulting in tax expense of $13 .
Research and Development Expenses. Company-sponsored research and development (R&D) expenses, including Aerospace product-development costs, were $466 in 2019, $502 in 2018 and $521 in 2017. R&D expenses have trended downward over the three-year period with the completion of the G500 and G600 aircraft test programs, offset partially by increased activities associated with the development of the new G700 aircraft model. R&D expenses are included in operating costs and expenses in the Consolidated Statement of Earnings in the period in which they are incurred. Customer-sponsored R&D expenses are charged directly to the related contracts.
The Aerospace segment has cost-sharing arrangements with some of its suppliers that enhance the segment’s internal development capabilities and offset a portion of the financial cost associated with the segment’s product development efforts. These arrangements explicitly state that supplier contributions are for reimbursement of costs we incur in the development of new aircraft models and technologies, and we retain substantial rights in the products developed under these arrangements. We record amounts received from these cost-sharing arrangements as a reduction of R&D expenses. We have no obligation to refund
57
any amounts received under the agreements regardless of the outcome of the development efforts. Under the typical terms of an agreement, payments received from suppliers for their share of the costs are based on milestones and are recognized as received. Our policy is to defer payments in excess of the costs we have incurred.
Interest, Net. Net interest expense consisted of the following:
Year Ended December 31 | 2019 | 2018 | 2017 | ||||||||
Interest expense | $ | $ | $ | ||||||||
Interest income | ( | ) | ( | ) | ( | ) | |||||
Interest expense, net | $ | $ | $ | ||||||||
The increase in 2018 and 2019 is due primarily to the impact of financing the CSRA acquisition, including the issuance of $7.5 billion of fixed- and floating-rate notes in the second quarter of 2018. See Note K for additional information regarding our debt obligations, including interest rates.
Long-lived Assets and Goodwill. We review long-lived assets, including intangible assets subject to amortization, for impairment whenever events or changes in circumstances indicate that the carrying value of the asset may not be recoverable. We assess the recoverability of the carrying value of assets held for use based on a review of undiscounted projected cash flows. Impairment losses, where identified, are measured as the excess of the carrying value of the long-lived asset over its estimated fair value as determined by discounted projected cash flows.
Goodwill represents the purchase price paid in excess of the fair value of net tangible and intangible assets acquired in a business combination. We review goodwill for impairment annually at each of our reporting units or when circumstances indicate that the likelihood of an impairment is greater than 50%. Our reporting units are consistent with our operating segments in Note S. We use both qualitative and quantitative approaches when testing goodwill for impairment. When determining the approach to be used, we consider the current facts and circumstances of each reporting unit as well as the excess of each reporting unit’s estimated fair value over its carrying value based on our most recent quantitative assessments. Our qualitative approach evaluates the business environment and various events impacting the reporting unit including, but not limited to, macroeconomic conditions, changes in the business environment and reporting unit-specific events. If, based on the qualitative assessment, we determine that it is more likely than not that
58
the fair value of a reporting unit is greater than its carrying value, then a quantitative assessment is not necessary. However, if a quantitative assessment is determined to be necessary, we use a two-step process to first identify potential goodwill impairment for a reporting unit by comparing its fair value to its carrying value and then, if necessary, measure the amount of the impairment loss. Our estimate of fair value is based primarily on the discounted projected cash flows of the underlying operations.
As of December 31, 2019, we completed qualitative assessments for our Aerospace, Combat Systems, Mission Systems and Marine Systems reporting units as the estimated fair values of each of these reporting units significantly exceeded the respective carrying values based on our most recent quantitative assessments, which were performed as of December 31, 2018. Our qualitative assessments did not present indicators of impairment for these reporting units as of December 31, 2019.
As of December 31, 2019, we completed a quantitative assessment for our Information Technology reporting unit, and the results indicated that no impairment existed. The Information Technology reporting unit’s estimated fair value exceeded its carrying value by approximately 25%, reflecting the size of the CSRA acquisition relative to the Information Technology reporting unit and its recent acquisition date. Given that the net book value of this business was recorded at its fair value at the acquisition date in 2018, the reporting unit’s carrying value, by default, continues to closely approximate its fair value as of December 31, 2019. As the carrying value and fair value of the Information Technology reporting unit are closely aligned, a material change in the fair value or carrying value could put the reporting unit at risk of goodwill impairment. For example, if the synergies from the acquisition or funding in the U.S. government budget for our contracts fall significantly below our projections, the fair value of the reporting unit would be negatively impacted. Similarly, an increase in interest rates would lower our discounted cash flows and negatively impact the fair value of the reporting unit. We believe the projections and assumptions we used in estimating fair value are reasonable, but it is possible actual experience could differ, impacting our fair value estimate.
For a summary of our goodwill by reporting unit, see Note B.
Accounting Standards Updates. On January 1, 2019, we adopted the following accounting standards issued by the Financial Accounting Standards Board (FASB):
• | Accounting Standards Codification (ASC) Topic 842, Leases. ASC Topic 842 requires the recognition of lease rights and obligations as assets and liabilities on the balance sheet. Previously, lessees were not required to recognize on the balance sheet assets and liabilities arising from operating leases. As we elected the cumulative-effect adoption method, prior-period information has not been restated. |
The standard provided several optional practical expedients for use in transition. We elected to use what the FASB has deemed the “package of practical expedients,” which allowed us not to reassess our previous conclusions about lease identification, lease classification and the accounting treatment for initial direct costs. We did not elect the practical expedient pertaining to the use of hindsight.
The most significant effects of the standard on our Consolidated Financial Statements are (1) the recognition of new right-of-use assets and lease liabilities on our Consolidated Balance Sheet for our operating leases, and (2) significant new disclosures about our leasing activities (see Note P). We adopted the standard on January 1, 2019, and recognized operating lease liabilities and right-of-use assets of $1.4 billion based on the present value of the remaining lease payments over the lease term. The adoption did not result in a cumulative-effect adjustment to retained earnings. The new standard did not have a material impact on our results of operations, financial condition or cash flows.
• | ASU 2018-14, Compensation - Retirement Benefits - Defined Benefit Plans - General (Subtopic 715-20): Disclosure Framework - Changes to the Disclosure Requirements for Defined Benefit Plans. ASU |
59
2018-14 adds, removes and clarifies disclosure requirements for defined-benefit pension and other post-retirement benefit plans. The standard is effective retrospectively on January 1, 2020, with early adoption permitted. We adopted the standard in 2019, and the adoption did not have a material effect on our disclosures.
There are several other accounting standards that have been issued by the FASB but are not yet effective, including ASU 2016-13, Financial Instruments - Credit Losses (Topic 326): Measurement of Credit Losses on Financial Instruments. ASU 2016-13 significantly changes how entities account for credit losses for financial assets and certain other instruments, including trade receivables and contract assets, that are not measured at fair value through net income. The ASU requires a number of changes to the assessment of credit losses, including the utilization of an expected credit loss model, which requires consideration of a broader range of information to estimate expected credit losses over the entire lifetime of the asset, including losses where probability is considered remote. Additionally, the standard requires the estimation of lifetime expected losses for trade receivables and contract assets that are classified as current. We adopted the standard on January 1, 2020. The adoption of the ASU did not have a material effect on our results of operations, financial condition or cash flows.
B. ACQUISITIONS AND DIVESTITURES, GOODWILL, AND INTANGIBLE ASSETS
CSRA Acquisition
On April 3, 2018, we acquired 100 % of the outstanding shares of CSRA for $41.25 per share in cash plus the assumption of outstanding net debt. CSRA is a provider of IT solutions to the defense, intelligence and federal civilian markets and is included in our Information Technology segment.
Fair Value of Net Assets Acquired. The following table summarizes the allocation of the $9.7 billion cash purchase price to the estimated fair values of the assets acquired and liabilities assumed on the acquisition date, with the excess recorded as goodwill:
Cash and equivalents | $ | ||
Accounts receivable | |||
Unbilled receivables | |||
Other current assets | |||
Property, plant and equipment, net | |||
Intangible assets, net | |||
Goodwill | |||
Other noncurrent assets | |||
Total assets | $ | ||
Accounts payable | $ | ( | ) |
Customer advances and deposits | ( | ) | |
Current lease obligation | ( | ) | |
Other current liabilities | ( | ) | |
Noncurrent lease obligation | ( | ) | |
Noncurrent deferred tax liability | ( | ) | |
Other noncurrent liabilities | ( | ) | |
Total liabilities | $ | ( | ) |
Net assets acquired | $ | ||
60
Pro Forma Information (Unaudited). The following pro forma information presents our consolidated revenue and earnings from continuing operations as if the acquisition of CSRA and the related financing transactions had occurred on January 1, 2017:
Year Ended December 31 | 2018 | 2017 | |||||
Revenue | $ | $ | |||||
Earnings from continuing operations | |||||||
Diluted earnings per share from continuing operations | $ | $ | |||||
• | The impact of acquisition financing. |
• | The removal of CSRA operations that we were required by a government customer to dispose of to address an organizational conflict of interest with respect to services provided to the customer. We completed the sale of these operations in 2018. |
• | The removal of CSRA’s historical pre-acquisition intangible asset amortization expense and debt-related interest expense. |
• | The impact of intangible asset amortization expense assuming our estimate of fair value was applied on January 1, 2017. |
• | The payment of acquisition-related costs assuming they were incurred on January 1, 2017. |
The pro forma information does not reflect the realization of expected cost savings or synergies from the acquisition, and does not reflect what our combined results of operations would have been had the acquisition occurred on January 1, 2017.
Other Acquisitions and Divestitures
In 2019, we acquired two businesses in our Aerospace segment and a business in our Mission Systems segment for an aggregate of approximately $20 .
In 2018, in addition to the acquisition of CSRA, we acquired five businesses for an aggregate of approximately $400 :
• | Hawker Pacific, a leading provider of aircraft services across Asia Pacific and the Middle East, and |
• | a maintenance and service provider for the German Army and other international customers in our Combat Systems segment; and |
• | a provider of specialized transmitters and receivers in our Mission Systems segment. |
In 2017, we acquired four businesses for an aggregate of approximately $400 :
• | an FBO in our Aerospace segment; |
• | a provider of mission-critical support services in our Information Technology segment; and |
• | a manufacturer of electronics and communications products and a manufacturer of signal distribution products in our Mission Systems segment. |
The operating results of these acquisitions have been included with our reported results since the respective closing dates. The purchase prices of the acquisitions have been allocated to the estimated fair value of net tangible and intangible assets acquired, with any excess purchase price recorded as goodwill.
61
In 2019, we completed the sale of a business in our Information Technology segment that was classified as held for sale on the Consolidated Balance Sheet on December 31, 2018. In 2018, we completed the sale of three businesses in our Information Technology segment: a commercial health products business, CSRA operations that we were required by a government customer to dispose of to address an organizational conflict of interest with respect to services provided to the customer and a public-facing contact-center business.
Goodwill
The changes in the carrying amount of goodwill by reporting unit were as follows:
Aerospace | Combat Systems | Information Systems and Technology | Information Technology | Mission Systems | Marine Systems | Total Goodwill | |||||||||||||||||||||
December 31, 2017 (a) | $ | $ | $ | $ | $ | $ | $ | ||||||||||||||||||||
Acquisitions/ divestitures (b) | |||||||||||||||||||||||||||
Other (c) | ( | ) | ( | ) | |||||||||||||||||||||||
April 1, 2018 (a) | |||||||||||||||||||||||||||
Change in reporting unit composition (d) | ( | ) | |||||||||||||||||||||||||
Acquisitions/ divestitures (b) | |||||||||||||||||||||||||||
Other (c) | ( | ) | ( | ) | ( | ) | ( | ) | ( | ) | |||||||||||||||||
December 31, 2018 (e) | |||||||||||||||||||||||||||
Acquisitions/ divestitures (b) | |||||||||||||||||||||||||||
Other (c) | ( | ) | ( | ) | |||||||||||||||||||||||
December 31, 2019 (e) | $ | $ | $ | $ | $ | $ | $ | ||||||||||||||||||||
(a)Goodwill in the Information Systems and Technology reporting unit is net of $1.9 billion of accumulated impairment losses.
(c)Consists primarily of adjustments for foreign currency translation. Activity in the nine-month period ended December 31, 2018, also includes an allocation of goodwill in our Information Technology reporting unit associated with certain operations classified as held for sale on the Consolidated Balance Sheet on December 31, 2018. Activity in 2019 also includes an allocation of goodwill in our Mission Systems reporting unit associated with a non-core operation classified as held for sale on the Consolidated Balance Sheet on December 31, 2019.
(d)Concurrent with the acquisition of CSRA, we reorganized our Information Systems and Technology operating segment, in accordance with the nature of the segment’s products and services, into the Information Technology and Mission Systems segments. This reorganization similarly changed the composition of our reporting units. Accordingly, goodwill of the Information Systems and Technology reporting unit was reassigned to the Information Technology and Mission Systems reporting units using a relative fair value allocation approach as of the date of the reorganization .
(e)Goodwill in the Information Technology and Mission Systems reporting units is net of $536 and $1.3 billion of accumulated impairment losses, respectively.
62
Intangible Assets
Intangible assets consisted of the following:
Gross Carrying Amount (a) | Accumulated Amortization | Net Carrying Amount | Gross Carrying Amount (a) | Accumulated Amortization | Net Carrying Amount | ||||||||||||||
December 31 | 2019 | 2018 | |||||||||||||||||
Contract and program intangible assets (b) | $ | $ | ( | ) | $ | $ | $ | ( | ) | $ | |||||||||
Trade names and trademarks | ( | ) | ( | ) | |||||||||||||||
Technology and software | ( | ) | ( | ) | |||||||||||||||
Other intangible assets | ( | ) | ( | ) | |||||||||||||||
Total intangible assets | $ | $ | ( | ) | $ | $ | $ | ( | ) | $ | |||||||||
(a)Change in gross carrying amounts consists primarily of adjustments for acquired intangible assets and foreign currency translation.
(b)Consists of acquired backlog and probable follow-on work and associated customer relationships.
We did not recognize any impairments of our intangible assets in 2019, 2018 or 2017. The amortization lives (in years) of our intangible assets on December 31, 2019, were as follows:
Intangible Asset | Range of Amortization Life | |
Contract and program intangible assets | 7-30 | |
Trade names and trademarks | ||
Technology and software | 5-15 | |
Other intangible assets | 7 | |
Amortization expense is included in operating costs and expenses in the Consolidated Statement of Earnings. Amortization expense was $277 in 2019, $270 in 2018 and $79 in 2017. We expect to record annual amortization expense over the next five years as follows:
Year Ended December 31 | Amortization Expense | ||
2020 | $ | ||
2021 | |||
2022 | |||
2023 | |||
2024 | |||
C. REVENUE
Performance Obligations. A performance obligation is a promise in a contract to transfer a distinct good or service to the customer, and is the unit of account for revenue. A contract’s transaction price is allocated to each distinct performance obligation within that contract and recognized as revenue when, or as, the performance obligation is satisfied. The majority of our contracts have a single performance obligation as the promise to transfer the individual goods or services is not separately identifiable from other promises in the contracts and is, therefore, not distinct. Some of our contracts have multiple performance obligations, most commonly due to the contract covering multiple phases of the product lifecycle (development, production, maintenance and support). For contracts with multiple performance obligations, we allocate the contract’s transaction price to each performance obligation using our best estimate of the standalone
63
selling price of each distinct good or service in the contract. The primary method used to estimate standalone selling price is the expected cost plus a margin approach, under which we forecast our expected costs of satisfying a performance obligation and then add an appropriate margin for that distinct good or service.
Contract modifications are routine in the performance of our contracts. Contracts are often modified to account for changes in contract specifications or requirements. In most instances, contract modifications are for goods or services that are not distinct and, therefore, are accounted for as part of the existing contract.
Our performance obligations are satisfied over time as work progresses or at a point in time. Revenue from products and services transferred to customers over time accounted for 73 % of our revenue in 2019, 74 % in 2018 and 71 % in 2017. Substantially all of our revenue in the defense segments is recognized over time, because control is transferred continuously to our customers. Typically, revenue is recognized over time using costs incurred to date relative to total estimated costs at completion to measure progress toward satisfying our performance obligations. Incurred cost represents work performed, which corresponds with, and thereby best depicts, the transfer of control to the customer. Contract costs include labor, material, overhead and, when appropriate, G&A expenses.
Revenue from goods and services transferred to customers at a point in time accounted for 27 % of our revenue in 2019, 26 % in 2018 and 29 % in 2017. The majority of our revenue recognized at a point in time is for the manufacture of business-jet aircraft in our Aerospace segment. Revenue on these contracts is recognized when the customer obtains control of the asset, which is generally upon delivery and acceptance by the customer of the fully outfitted aircraft.
On December 31, 2019, we had $86.9 billion of remaining performance obligations, which we also refer to as total backlog. We expect to recognize approximately 35 % of our remaining performance obligations as revenue in 2020, an additional 35 % by 2022 and the balance thereafter.
Contract Estimates. The majority of our revenue is derived from long-term contracts and programs that can span several years. Accounting for long-term contracts and programs involves the use of various techniques to estimate total contract revenue and costs. For long-term contracts, we estimate the profit on a contract as the difference between the total estimated revenue and expected costs to complete a contract and recognize that profit over the life of the contract.
Contract estimates are based on various assumptions to project the outcome of future events that often span several years. These assumptions include labor productivity and availability; the complexity of the work to be performed; the cost and availability of materials; the performance of subcontractors; and the availability and timing of funding from the customer.
The nature of our contracts gives rise to several types of variable consideration, including claims and award and incentive fees. We include in our contract estimates additional revenue for submitted contract modifications or claims against the customer when we believe we have an enforceable right to the modification or claim, the amount can be estimated reliably and its realization is probable. In evaluating these criteria, we consider the contractual/legal basis for the claim, the cause of any additional costs incurred, the reasonableness of those costs and the objective evidence available to support the claim. We include award or incentive fees in the estimated transaction price when there is a basis to reasonably estimate the amount of the fee. These estimates are based on historical award experience, anticipated performance and our best judgment at the time. Because of our certainty in estimating these amounts, they are included in the transaction price of our contracts and the associated remaining performance obligations.
As a significant change in one or more of these estimates could affect the profitability of our contracts, we review and update our contract-related estimates regularly. We recognize adjustments in estimated profit
64
on contracts under the cumulative catch-up method. Under this method, the impact of the adjustment on profit recorded to date on a contract is recognized in the period the adjustment is identified. Revenue and profit in future periods of contract performance are recognized using the adjusted estimate. If at any time the estimate of contract profitability indicates an anticipated loss on the contract, we recognize the total loss in the period it is identified.
Year Ended December 31 | 2019 | 2018 | 2017 | ||||||||
Revenue | $ | $ | $ | ||||||||
Operating earnings | |||||||||||
Diluted earnings per share | $ | $ | $ | ||||||||
No adjustment on any one contract was material to our Consolidated Financial Statements in 2019, 2018 or 2017.
Revenue by Category. Our portfolio of products and services consists of approximately 11,000 active contracts. The following series of tables presents our revenue disaggregated by several categories.
Revenue by major products and services was as follows:
Year Ended December 31 | 2019 | 2018 | 2017 | ||||||||
Aircraft manufacturing and completions | $ | $ | $ | ||||||||
Aircraft services | |||||||||||
Pre-owned aircraft | |||||||||||
Total Aerospace | |||||||||||
Military vehicles | |||||||||||
Weapons systems, armament and munitions | |||||||||||
Engineering and other services | |||||||||||
Total Combat Systems | |||||||||||
IT services | |||||||||||
Total Information Technology | |||||||||||
C4ISR solutions | |||||||||||
Total Mission Systems | |||||||||||
Nuclear-powered submarines | |||||||||||
Surface ships | |||||||||||
Repair and other services | |||||||||||
Total Marine Systems | |||||||||||
Total revenue | $ | $ | $ | ||||||||
65
Revenue by contract type was as follows:
Year Ended December 31, 2019 | Aerospace | Combat Systems | Information Technology | Mission Systems | Marine Systems | Total Revenue | |||||||||||||||||
Fixed-price | $ | $ | $ | $ | $ | $ | |||||||||||||||||
Cost-reimbursement | |||||||||||||||||||||||
Time-and-materials | |||||||||||||||||||||||
Total revenue | $ | $ | $ | $ | $ | $ | |||||||||||||||||
Year Ended December 31, 2018 | |||||||||||||||||||||||
Fixed-price | $ | $ | $ | $ | $ | $ | |||||||||||||||||
Cost-reimbursement | |||||||||||||||||||||||
Time-and-materials | |||||||||||||||||||||||
Total revenue | $ | $ | $ | $ | $ | $ | |||||||||||||||||
Year Ended December 31, 2017 | |||||||||||||||||||||||
Fixed-price | $ | $ | $ | $ | $ | $ | |||||||||||||||||
Cost-reimbursement | |||||||||||||||||||||||
Time-and-materials | |||||||||||||||||||||||
Total revenue | $ | $ | $ | $ | $ | $ | |||||||||||||||||
Our segments operate under fixed-price, cost-reimbursement and time-and-materials contracts. Our production contracts are primarily fixed-price. Under these contracts, we agree to perform a specific scope of work for a fixed amount. Contracts for research, engineering, repair and maintenance, and other services are typically cost-reimbursement or time-and-materials. Under cost-reimbursement contracts, the customer reimburses contract costs incurred and pays a fixed, incentive or award-based fee. These fees are determined by our ability to achieve targets set in the contract, such as cost, quality, schedule and performance. Under time-and-materials contracts, the customer pays a fixed hourly rate for direct labor and generally reimburses us for the cost of materials.
Each of these contract types presents advantages and disadvantages. Typically, we assume more risk with fixed-price contracts. However, these types of contracts offer additional profits when we complete the work for less than originally estimated. Cost-reimbursement contracts generally subject us to lower risk. Accordingly, the associated base fees are usually lower than fees earned on fixed-price contracts. Under time-and-materials contracts, our profit may vary if actual labor-hour rates vary significantly from the negotiated rates. Also, because these contracts can provide little or no fee for managing material costs, the content mix can impact profitability.
66
Revenue by customer was as follows:
Year Ended December 31, 2019 | Aerospace | Combat Systems | Information Technology | Mission Systems | Marine Systems | Total Revenue | |||||||||||||||||
U.S. government: | |||||||||||||||||||||||
Department of Defense (DoD) | $ | $ | $ | $ | $ | $ | |||||||||||||||||
Non-DoD | |||||||||||||||||||||||
Foreign Military Sales (FMS) | |||||||||||||||||||||||
Total U.S. government | |||||||||||||||||||||||
U.S. commercial | |||||||||||||||||||||||
Non-U.S. government | |||||||||||||||||||||||
Non-U.S. commercial | |||||||||||||||||||||||
Total revenue | $ | $ | $ | $ | $ | $ | |||||||||||||||||
Year Ended December 31, 2018 | |||||||||||||||||||||||
U.S. government: | |||||||||||||||||||||||
DoD | $ | $ | $ | $ | $ | $ | |||||||||||||||||
Non-DoD | |||||||||||||||||||||||
FMS | |||||||||||||||||||||||
Total U.S. government | |||||||||||||||||||||||
U.S. commercial | |||||||||||||||||||||||
Non-U.S. government | |||||||||||||||||||||||
Non-U.S. commercial | |||||||||||||||||||||||
Total revenue | $ | $ | $ | $ | $ | $ | |||||||||||||||||
Year Ended December 31, 2017 | |||||||||||||||||||||||
U.S. government: | |||||||||||||||||||||||
DoD | $ | $ | $ | $ | $ | $ | |||||||||||||||||
Non-DoD | |||||||||||||||||||||||
FMS | |||||||||||||||||||||||
Total U.S. government | |||||||||||||||||||||||
U.S. commercial | |||||||||||||||||||||||
Non-U.S. government | |||||||||||||||||||||||
Non-U.S. commercial | |||||||||||||||||||||||
Total revenue | $ | $ | $ | $ | $ | $ | |||||||||||||||||
67
payment on an international wheeled armored vehicle contract in our Combat Systems segment, which contributed to growth in contract assets as further discussed in Note H.
Revenue recognized in 2019, 2018 and 2017 that was included in the contract liability balance at the beginning of each year was $4.5 billion, $4.3 billion and $4.3 billion, respectively. This revenue represented primarily the sale of business-jet aircraft.
D. EARNINGS PER SHARE
Basic and diluted weighted average shares outstanding were as follows (in thousands):
Year Ended December 31 | 2019 | 2018 | 2017 | |||
Basic weighted average shares outstanding | ||||||
Dilutive effect of stock options and restricted stock/RSUs* | ||||||
Diluted weighted average shares outstanding | ||||||
* Excludes outstanding options to purchase shares of common stock that had exercise prices in excess of the average market price of our common stock during the year and, therefore, the effect of including these options would be antidilutive. These options totaled 4,985 in 2019, 3,143 in 2018 and 1,547 in 2017.
E. FAIR VALUE
Fair value is defined as the price that would be received to sell an asset or paid to transfer a liability in the principal or most advantageous market in an orderly transaction between marketplace participants. Various valuation approaches can be used to determine fair value, each requiring different valuation inputs. The following hierarchy classifies the inputs used to determine fair value into three levels:
• | Level 1 - quoted prices in active markets for identical assets or liabilities; |
• | Level 2 - inputs, other than quoted prices, observable by a marketplace participant either directly or indirectly; and |
• | Level 3 - unobservable inputs significant to the fair value measurement. |
We did not have any significant non-financial assets or liabilities measured at fair value on December 31, 2019 or 2018.
68
Carrying Value | Fair Value | Quoted Prices in Active Markets for Identical Assets (Level 1) | Significant Other Observable Inputs (Level 2) | Significant Unobservable Inputs (Level 3) | |||||||||||||||
Financial Assets (Liabilities) | December 31, 2019 | ||||||||||||||||||
Measured at fair value: | |||||||||||||||||||
Marketable securities held in trust: | |||||||||||||||||||
Cash and equivalents | $ | $ | $ | $ | $ | ||||||||||||||
Available-for-sale debt securities | |||||||||||||||||||
Equity securities | |||||||||||||||||||
Other investments | |||||||||||||||||||
Cash flow hedges | |||||||||||||||||||
Measured at amortized cost: | |||||||||||||||||||
Short- and long-term debt principal | ( | ) | ( | ) | ( | ) | |||||||||||||
December 31, 2018 | |||||||||||||||||||
Measured at fair value: | |||||||||||||||||||
Marketable securities held in trust: | |||||||||||||||||||
Cash and equivalents | $ | $ | $ | $ | $ | ||||||||||||||
Available-for-sale debt securities | |||||||||||||||||||
Equity securities | |||||||||||||||||||
Other investments | |||||||||||||||||||
Cash flow hedges | ( | ) | ( | ) | ( | ) | |||||||||||||
Measured at amortized cost: | |||||||||||||||||||
Short- and long-term debt principal | ( | ) | ( | ) | ( | ) | |||||||||||||
Our Level 1 assets include investments in publicly traded equity securities valued using quoted prices from the market exchanges. The fair value of our Level 2 assets and liabilities is determined under a market approach using valuation models that incorporate observable inputs such as interest rates, bond yields and quoted prices for similar assets. Our Level 3 assets include direct private equity investments that are measured using inputs unobservable to a marketplace participant.
F. INCOME TAXES
The provision for income taxes and effective tax rate in 2017 included a $119 unfavorable impact from the change in tax law. The impact was due primarily to the remeasurement of our U.S. federal deferred tax assets and liabilities at the tax rate expected to apply when the temporary differences are realized/settled (remeasured at a rate of 21% versus 35% for the majority of our deferred tax assets and liabilities).
The U.S. Treasury Department and the Internal Revenue Service (IRS) are expected to issue further guidance related to tax reform that could impact our provision for income taxes in future periods. As a result, we believe it is reasonably possible there may be changes to provisional interpretations and
69
assumptions we made in our application of tax reform provisions. We do not expect the impact of any changes to have a material impact on our results of operations, financial condition or cash flows.
The following is a summary of our net provision for income taxes for continuing operations:
Year Ended December 31 | 2019 | 2018 | 2017 | ||||||||
Current: | |||||||||||
U.S. federal | $ | $ | $ | ||||||||
State | |||||||||||
International | |||||||||||
Total current | |||||||||||
Deferred: | |||||||||||
U.S. federal | ( | ) | |||||||||
State | |||||||||||
International | |||||||||||
Adjustment for enacted change in U.S. tax law | |||||||||||
Total deferred | ( | ) | |||||||||
Provision for income taxes, net | $ | $ | $ | ||||||||
Net income tax payments | $ | $ | $ | ||||||||
The reconciliation from the statutory federal income tax rate to our effective income tax rate follows:
Year Ended December 31 | 2019 | 2018 | 2017 | |||||
Statutory federal income tax rate | % | % | % | |||||
State tax on commercial operations, net of federal benefits | ||||||||
Impact of international operations | ( | ) | ||||||
Domestic production deduction | ( | ) | ||||||
Foreign derived intangible income | ( | ) | ( | ) | ||||
Equity-based compensation | ( | ) | ( | ) | ( | ) | ||
Domestic tax credits | ( | ) | ( | ) | ( | ) | ||
Contract close-outs | ( | ) | ||||||
Adoption impact of enacted change in U.S. tax law | ||||||||
Other, net | ( | ) | ( | ) | ( | ) | ||
Effective income tax rate | % | % | % | |||||
70
Net Deferred Tax Liability. The tax effects of temporary differences between reported earnings and taxable income consisted of the following:
December 31 | 2019 | 2018 | |||||
Retirement benefits | $ | $ | |||||
Lease assets | |||||||
Tax loss and credit carryforwards | |||||||
Salaries and wages | |||||||
Workers’ compensation | |||||||
Other | |||||||
Deferred assets | |||||||
Valuation allowances | ( | ) | ( | ) | |||
Net deferred assets | $ | $ | |||||
Intangible assets | $ | ( | ) | $ | ( | ) | |
Lease liabilities | ( | ) | |||||
Contract accounting methods | ( | ) | ( | ) | |||
Property, plant and equipment | ( | ) | ( | ) | |||
Capital Construction Fund qualified ships | ( | ) | ( | ) | |||
Other | ( | ) | ( | ) | |||
Deferred liabilities | $ | ( | ) | $ | ( | ) | |
Net deferred tax liability | $ | ( | ) | $ | ( | ) | |
Our deferred tax assets and liabilities are included in other noncurrent assets and liabilities on the Consolidated Balance Sheet. Our net deferred tax liability consisted of the following:
December 31 | 2019 | 2018 | |||||
Deferred tax asset | $ | $ | |||||
Deferred tax liability | ( | ) | ( | ) | |||
Net deferred tax liability | $ | ( | ) | $ | ( | ) | |
We believe it is more likely than not that we will generate sufficient taxable income in future periods to realize our deferred tax assets, subject to the valuation allowances recognized.
Our deferred tax balance associated with our retirement benefits includes a deferred tax asset of $1.2 billion on December 31, 2019 and $1 billion on December 31, 2018, related to the amounts recorded in accumulated other comprehensive loss (AOCL) to recognize the funded status of our retirement plans. See Notes M and R for additional details.
One of our deferred tax liabilities results from our participation in the Capital Construction Fund (CCF), a program established by the U.S. government and administered by the Maritime Administration that supports the acquisition, construction, reconstruction or operation of U.S. flag merchant marine vessels. The program allows us to defer federal and state income taxes on earnings derived from eligible programs as long as the proceeds are deposited in the fund and withdrawals are used for qualified activities. We had U.S. government accounts receivable pledged (and thereby deposited) to the CCF of $340 and $483 on December 31, 2019 and 2018, respectively.
71
On December 31, 2019, we had net operating loss carryforwards of $989 , substantially all of which are associated with jurisdictions that have an indefinite carryforward period. We had tax credit carryforwards of $68 that began to expire in 2020. Most of these carryforwards are subject to valuation allowances.
Tax Uncertainties. We participate in the IRS Compliance Assurance Process (CAP), a real-time audit of our consolidated federal corporate income tax return. The IRS has examined our consolidated federal income tax returns through 2017 and is currently reviewing our 2018 tax year.
For all periods open to examination by tax authorities, we periodically assess our liabilities and contingencies based on the latest available information. Where we believe there is more than a 50 % chance that our tax position will not be sustained, we record our best estimate of the resulting tax liability, including interest, in the Consolidated Financial Statements. We include any interest or penalties incurred in connection with income taxes as part of income tax expense.
Based on all known facts and circumstances and current tax law, we believe the total amount of any unrecognized tax benefits on December 31, 2019, was not material to our results of operations, financial condition or cash flows. In addition, there are no tax positions for which it is reasonably possible that the unrecognized tax benefits will vary significantly over the next 12 months, producing, individually or in the aggregate, a material effect on our results of operations, financial condition or cash flows.
G. ACCOUNTS RECEIVABLE
December 31 | 2019 | 2018 | |||||
Non-U.S. government | $ | $ | |||||
U.S. government | |||||||
Commercial | |||||||
Total accounts receivable | $ | $ | |||||
Receivables from non-U.S. government customers included amounts related to long-term production programs for the Spanish Ministry of Defence of $1.7 billion and $1.9 billion on December 31, 2019 and 2018, respectively. A different ministry, the Spanish Ministry of Industry, has funded work on these programs in advance of costs incurred by the company. The cash advances are reported on the Consolidated Balance Sheet in current customer advances and deposits and will be repaid to the Ministry of Industry as we collect on the outstanding receivables from the Ministry of Defence. The net amounts for these programs on December 31, 2019 and 2018, were advance payments of $295 and $338 , respectively. With respect to our other receivables, we expect to collect substantially all of the year-end 2019 balance during 2020.
H. UNBILLED RECEIVABLES
72
December 31 | 2019 | 2018 | |||||
Unbilled revenue | $ | $ | |||||
Advances and progress billings | ( | ) | ( | ) | |||
Net unbilled receivables | $ | $ | |||||
The increase in net unbilled receivables in 2019 was due primarily to a large international wheeled armored vehicle contract in our Combat Systems segment. At December 31, 2019, the net unbilled receivable related to this contract was $2.9 billion. Our contract is through the Canadian government to the international customer. We have experienced delays in payment under the contract. We continue to meet our obligations under the contract and are entitled to payment for work performed. In January 2020, we received a $500 progress payment in connection with the outstanding balance. We expect to collect the full amount currently outstanding. Other than the balance related to the large international vehicle contract, we expect to bill substantially all of the remaining year-end 2019 net unbilled receivables balance during 2020. The amount not expected to be billed in 2020 results primarily from the agreed-upon contractual billing terms.
G&A costs in unbilled revenue on December 31, 2019 and 2018, were $441 and $381 , respectively. Contract costs also may include estimated contract recoveries for matters such as contract changes and claims for unanticipated contract costs. We record revenue associated with these matters only when the amount of recovery can be estimated reliably and realization is probable.
I. INVENTORIES
The majority of our inventories are for business-jet aircraft. Our inventories are stated at the lower of cost or net realizable value. Work in process represents largely labor, material and overhead costs associated with aircraft in the manufacturing process and is based primarily on the estimated average unit cost in a production lot. Raw materials are valued primarily on the first-in, first-out method. We record pre-owned aircraft acquired in connection with the sale of new aircraft at the lower of the trade-in value or the estimated net realizable value.
Inventories consisted of the following:
December 31 | 2019 | 2018 | |||||
Work in process | $ | $ | |||||
Raw materials | |||||||
Finished goods | |||||||
Pre-owned aircraft | |||||||
Total inventories | $ | $ | |||||
The increase in total inventories was due primarily to the ramp-up in production of the new G600 aircraft in our Aerospace segment. Customer deposits associated with these aircraft, which are reflected in customer advances and deposits and other noncurrent liabilities on the Consolidated Balance Sheet, have also increased.
We received both type and production certification from the U.S. Federal Aviation Administration (FAA) for the G600 aircraft in June 2019 and delivered the first G600 aircraft in the third quarter of 2019. The increase in total inventories was also driven by production of initial units of the newly announced G700 aircraft.
73
J. PROPERTY, PLANT AND EQUIPMENT, NET
December 31 | 2019 | 2018 | |||||
Machinery and equipment | $ | $ | |||||
Buildings and improvements | |||||||
Land and improvements | |||||||
Construction in process | |||||||
Total PP&E | |||||||
Accumulated depreciation | ( | ) | ( | ) | |||
PP&E, net | $ | $ | |||||
74
K. DEBT
Debt consisted of the following:
December 31 | 2019 | 2018 | ||||||
Fixed-rate notes due: | Interest rate: | |||||||
May 2020 | $ | $ | ||||||
May 2021 | ||||||||
July 2021 | ||||||||
November 2022 | ||||||||
May 2023 | ||||||||
August 2023 | ||||||||
November 2024 | ||||||||
May 2025 | ||||||||
August 2026 | ||||||||
November 2027 | ||||||||
May 2028 | ||||||||
November 2042 | ||||||||
Floating-rate notes due: | ||||||||
May 2020 | 3-month LIBOR + 0.29% | |||||||
May 2021 | 3-month LIBOR + 0.38% | |||||||
Commercial paper | 2.568% at December 31, 2018 | |||||||
Other | ||||||||
Total debt principal | ||||||||
Less unamortized debt issuance costs and discounts | ||||||||
Total debt | ||||||||
Less current portion | ||||||||
Long-term debt | $ | $ | ||||||
Interest payments associated with our debt were $434 in 2019, $312 in 2018 and $93 in 2017.
Our fixed- and floating-rate notes are fully and unconditionally guaranteed by several of our 100 %-owned subsidiaries. See Note T for condensed consolidating financial statements. We have the option to redeem the fixed-rate notes prior to their maturity in whole or in part for the principal plus any accrued but unpaid interest and applicable make-whole amounts.
The aggregate amounts of scheduled principal maturities of our debt are as follows:
Year Ended December 31 | Debt Principal | ||
2020 | $ | ||
2021 | |||
2022 | |||
2023 | |||
2024 | |||
Thereafter | |||
Total debt principal | $ | ||
75
On December 31, 2019, we had no commercial paper outstanding, but we maintain the ability to access the commercial paper market in the future. We have $5 billion in committed bank credit facilities for general corporate purposes and working capital needs and to support our commercial paper issuances. These credit facilities include a $2 billion 364 -day facility expiring in March 2020, a $1 billion multi-year facility expiring in November 2020 and a $2 billion multi-year facility expiring in March 2023. We may renew or replace these credit facilities in whole or in part at or prior to their expiration dates. Our credit facilities are guaranteed by several of our 100 %-owned subsidiaries. We also have an effective shelf registration on file with the Securities and Exchange Commission that allows us to access the debt markets.
Our financing arrangements contain a number of customary covenants and restrictions. We were in compliance with all covenants and restrictions on December 31, 2019.
L. OTHER LIABILITIES
A summary of significant other liabilities by balance sheet caption follows:
December 31 | 2019 | 2018 | |||||
Salaries and wages | $ | $ | |||||
Workers’ compensation | |||||||
Retirement benefits | |||||||
Operating lease liabilities | |||||||
Fair value of cash flow hedges | |||||||
Other (a) | |||||||
Total other current liabilities | $ | $ | |||||
Retirement benefits | $ | $ | |||||
Operating lease liabilities | |||||||
Customer deposits on commercial contracts | |||||||
Deferred income taxes | |||||||
Other (b) | |||||||
Total other liabilities | $ | $ | |||||
(a)Consists primarily of dividends payable, taxes payable, environmental remediation reserves, warranty reserves, deferred revenue and supplier contributions in the Aerospace segment, liabilities of discontinued operations, finance lease liabilities and insurance-related costs.
(b)Consists primarily of warranty reserves, workers’ compensation liabilities, finance lease liabilities and liabilities of discontinued operations.
M. SHAREHOLDERS’ EQUITY
Authorized Stock. Our authorized capital stock consists of 500 million shares of $1 per share par value common stock and 50 million shares of $1 per share par value preferred stock. The preferred stock is issuable in series, with the rights, preferences and limitations of each series to be determined by our board of directors.
Shares Issued and Outstanding. On December 31, 2019, we had 481,880,634 shares of common stock issued and 289,610,336 shares of common stock outstanding, including unvested restricted stock of 657,692 shares. On December 31, 2018, we had 481,880,634 shares of common stock issued and 288,698,149 shares of common stock outstanding. No shares of our preferred stock were outstanding on either date. The only changes in our shares outstanding during 2019 and 2018 resulted from shares repurchased in the open market and share activity under our equity compensation plans. See Note Q for additional details.
76
Share Repurchases. Our board of directors from time to time authorizes management’s repurchase of outstanding shares of our common stock on the open market. On December 5, 2018, the board of directors authorized management to repurchase up to 10 million additional shares of the company’s outstanding stock. In 2019, we repurchased 1.1 million of our outstanding shares for $184 . On December 31, 2019, 6.4 million shares remained authorized by our board of directors for repurchase, approximately 2 % of our total shares outstanding. We repurchased 10.1 million shares for $1.8 billion in 2018 and 7.8 million shares for $1.5 billion in 2017.
Dividends per Share. Our board of directors declared dividends per share of $4.08 in 2019, $3.72 in 2018 and $3.36 in 2017. We paid cash dividends of $1.2 billion in 2019, $1.1 billion in 2018 and $986 in 2017.
Accumulated Other Comprehensive Loss. The changes, pretax and net of tax, in each component of AOCL consisted of the following:
Losses on Cash Flow Hedges | Unrealized Gains on Marketable Securities | Foreign Currency Translation Adjustments | Changes in Retirement Plans’ Funded Status | AOCL | |||||||||||
December 31, 2016 | $ | ( | ) | $ | $ | $ | ( | ) | $ | ( | ) | ||||
Other comprehensive income, pretax | |||||||||||||||
Provision for income tax, net | ( | ) | ( | ) | ( | ) | ( | ) | ( | ) | |||||
Other comprehensive income, net of tax | ( | ) | |||||||||||||
December 31, 2017 | ( | ) | ( | ) | ( | ) | |||||||||
Cumulative-effect adjustments* | ( | ) | ( | ) | ( | ) | ( | ) | |||||||
Other comprehensive loss, pretax | ( | ) | ( | ) | ( | ) | |||||||||
Benefit from income tax, net | ( | ) | |||||||||||||
Other comprehensive loss, net of tax | ( | ) | ( | ) | ( | ) | |||||||||
December 31, 2018 | ( | ) | ( | ) | ( | ) | |||||||||
Other comprehensive loss, pretax | ( | ) | ( | ) | |||||||||||
Benefit from income tax, net | ( | ) | |||||||||||||
Other comprehensive loss, net of tax | ( | ) | ( | ) | |||||||||||
December 31, 2019 | $ | $ | $ | $ | ( | ) | $ | ( | ) | ||||||
Current-period amounts reclassified out of AOCL related primarily to changes in our retirement plans’ funded status and consisted of pretax recognized net actuarial losses of $318 in 2019, $355 in 2018 and $358 in 2017. This was offset partially by pretax amortization of prior service credit of $22 in 2019, $50 in 2018 and $69 in 2017. These AOCL components are included in our net periodic pension and other post-retirement benefit cost. See Note R for additional details.
N. DERIVATIVE FINANCIAL INSTRUMENTS AND HEDGING ACTIVITIES
We are exposed to market risk, primarily from foreign currency exchange rates, interest rates, commodity prices and investments. We may use derivative financial instruments to hedge some of these risks as described below. We do not use derivative financial instruments for trading or speculative purposes.
77
Foreign Currency Risk. Our foreign currency exchange rate risk relates to receipts from customers, payments to suppliers and inter-company transactions denominated in foreign currencies. To the extent possible, we include terms in our contracts that are designed to protect us from this risk. Otherwise, we enter into derivative financial instruments, principally foreign currency forward purchase and sale contracts, designed to offset and minimize our risk. The dollar-weighted one-year average maturity of these instruments generally matches the duration of the activities that are at risk.
Interest Rate Risk. Our financial instruments subject to interest rate risk include fixed- and floating-rate long-term debt obligations. We entered into derivative financial instruments, specifically interest rate swap contracts, to eliminate our floating-rate interest risk. The interest rate risk associated with our financial instruments is not material.
Commodity Price Risk. We are subject to rising labor and commodity price risk, primarily on long-term, fixed-price contracts. To the extent possible, we include terms in our contracts that are designed to protect us from these risks. Some of the protective terms included in our contracts are considered derivative financial instruments but are not accounted for separately, because they are clearly and closely related to the host contract. We have not entered into any material commodity hedging contracts but may do so as circumstances warrant. We do not believe that changes in labor or commodity prices will have a material impact on our results of operations or cash flows.
Investment Risk. Our investment policy allows for purchases of fixed-income securities with an investment-grade rating and a maximum maturity of up to five years . On December 31, 2019, we held $902 in cash and equivalents, but held no marketable securities other than those held in trust to meet some of our obligations under workers’ compensation and non-qualified supplemental executive retirement plans. On December 31, 2019, these marketable securities totaled $207 and were reflected at fair value on the Consolidated Balance Sheet in other current and noncurrent assets. See Note E for additional details.
Hedging Activities. We had notional forward exchange and interest rate swap contracts outstanding of $5 billion and $5.8 billion on December 31, 2019 and 2018, respectively. These derivative financial instruments are cash flow hedges, and are reflected at fair value on the Consolidated Balance Sheet in other current assets and liabilities. See Note E for additional details.
Changes in fair value (gains and losses) related to derivative financial instruments that qualify as cash flow hedges are deferred in AOCL until the underlying transaction is reflected in earnings. Alternatively, gains and losses on derivative financial instruments that do not qualify for hedge accounting are recorded each period in earnings. All gains and losses from derivative financial instruments recognized in the Consolidated Statement of Earnings are presented in the same line item as the underlying transaction, either operating costs and expenses or interest expense.
Net gains and losses recognized in earnings on derivative financial instruments that do not qualify for hedge accounting were not material to our results of operations in any of the past three years. Net gains and losses reclassified to earnings from AOCL related to qualified hedges were also not material to our results of operations in any of the past three years, and we do not expect the amount of these gains and losses that will be reclassified to earnings during the next 12 months to be material.
We had no material derivative financial instruments designated as fair value or net investment hedges on December 31, 2019 or 2018.
Foreign Currency Financial Statement Translation. We translate foreign currency balance sheets from our international businesses’ functional currency (generally the respective local currency) to U.S.
78
dollars at the end-of-period exchange rates, and statements of earnings at the average exchange rates for each period. The resulting foreign currency translation adjustments are a component of AOCL.
We do not hedge the fluctuation in reported revenue and earnings resulting from the translation of these international operations’ results into U.S. dollars. The impact of translating our non-U.S. operations’ revenue into U.S. dollars was not material to our results of operations in any of the past three years. In addition, the effect of changes in foreign exchange rates on non-U.S. cash balances was not material in any of the past three years.
O. COMMITMENTS AND CONTINGENCIES
Litigation
In 2015, Electric Boat Corporation, a subsidiary of General Dynamics Corporation, received a Civil Investigative Demand from the U.S. Department of Justice regarding an investigation of potential False Claims Act violations relating to alleged failures of Electric Boat’s quality system with respect to allegedly non-conforming parts purchased from a supplier. In 2016, Electric Boat was made aware that it is a defendant in a lawsuit related to this matter which had been filed under seal in U.S. district court. Also in 2016, the Suspending and Debarring Official for the U.S. Department of the Navy issued a Show Cause Letter to Electric Boat requesting that Electric Boat respond to the official’s concerns regarding Electric Boat’s oversight and management with respect to its quality assurance systems for subcontractors and suppliers. Electric Boat responded to the Show Cause Letter and engaged in discussions with the U.S. government.
In the third quarter of 2019, the Department of Justice declined to intervene in the qui tam action, noting that its investigation continues, and the court unsealed the relator’s complaint. In the first quarter of 2020, the relator filed an amended complaint. Given the current status of these matters, we are unable to express a view regarding the ultimate outcome or, if the outcome is adverse, to estimate an amount or range of reasonably possible loss. Depending on the outcome of these matters, there could be a material impact on our results of operations, financial condition and cash flows.
Additionally, various other claims and legal proceedings incidental to the normal course of business are pending or threatened against us. These other matters relate to such issues as government investigations and claims, the protection of the environment, asbestos-related claims and employee-related matters. The nature of litigation is such that we cannot predict the outcome of these other matters. However, based on information currently available, we believe any potential liabilities in these other proceedings, individually or in the aggregate, will not have a material impact on our results of operations, financial condition or cash flows.
Environmental
We are subject to and affected by a variety of federal, state, local and foreign environmental laws and regulations. We are directly or indirectly involved in environmental investigations or remediation at some of our current and former facilities and third-party sites that we do not own but where we have been designated a Potentially Responsible Party (PRP) by the U.S. Environmental Protection Agency or a state environmental agency. Based on historical experience, we expect that a significant percentage of the total remediation and compliance costs associated with these facilities will continue to be allowable contract costs and, therefore, recoverable under U.S. government contracts.
As required, we provide financial assurance for certain sites undergoing or subject to investigation or remediation. We accrue environmental costs when it is probable that a liability has been incurred and the amount can be reasonably estimated. Where applicable, we seek insurance recovery for costs related to
79
environmental liabilities. We do not record insurance recoveries before collection is considered probable. Based on all known facts and analyses, we do not believe that our liability at any individual site, or in the aggregate, arising from such environmental conditions will be material to our results of operations, financial condition or cash flows. We also do not believe that the range of reasonably possible additional loss beyond what has been recorded would be material to our results of operations, financial condition or cash flows.
Other
Government Contracts. As a government contractor, we are subject to U.S. government audits and investigations relating to our operations, including claims for fines, penalties, and compensatory and treble damages. We believe the outcome of such ongoing government audits and investigations will not have a material impact on our results of operations, financial condition or cash flows.
In the performance of our contracts, we routinely request contract modifications that require additional funding from the customer. Most often, these requests are due to customer-directed changes in the scope of work. While we are entitled to recovery of these costs under our contracts, the administrative process with our customer may be protracted. Based on the circumstances, we periodically file requests for equitable adjustment (REAs) that are sometimes converted into claims. In some cases, these requests are disputed by our customer. We believe our outstanding modifications, REAs and other claims will be resolved without material impact to our results of operations, financial condition or cash flows.
Labor Agreements. On December 31, 2019, approximately one-fifth of the employees of our subsidiaries were working under collectively bargained terms and conditions, including 60 collective agreements that we have negotiated directly with unions and works councils. A number of these agreements expire within any given year. Historically, we have been successful at renegotiating these labor agreements without any material disruption of operating activities. In 2020, we expect to negotiate the terms of 28 agreements covering approximately 10,000 employees. We do not expect the renegotiations will, either individually or in the aggregate, have a material impact on our results of operations, financial condition or cash flows.
Product Warranties. We provide warranties to our customers associated with certain product sales. We record estimated warranty costs in the period in which the related products are delivered. The warranty liability recorded at each balance sheet date is based generally on the number of months of warranty coverage remaining for the products delivered and the average historical monthly warranty payments. Warranty
80
obligations incurred in connection with long-term production contracts are accounted for within the contract estimates at completion. Our other warranty obligations, primarily for business-jet aircraft, are included in other current and noncurrent liabilities on the Consolidated Balance Sheet.
The changes in the carrying amount of warranty liabilities for each of the past three years were as follows:
Year Ended December 31 | 2019 | 2018 | 2017 | ||||||||
Beginning balance | $ | $ | $ | ||||||||
Warranty expense | |||||||||||
Payments | ( | ) | ( | ) | ( | ) | |||||
Adjustments | ( | ) | ( | ) | ( | ) | |||||
Ending balance | $ | $ | $ | ||||||||
P. LEASES
We determine at its inception whether an arrangement that provides us control over the use of an asset is a lease. We recognize at lease commencement a right-of-use (ROU) asset and lease liability based on the present value of the future lease payments over the lease term. We have elected not to recognize an ROU asset and lease liability for leases with terms of 12 months or less. Some of our leases include options to extend the term of the lease for up to 30 years or to terminate the lease within 1 year. When it is reasonably certain that we will exercise the option, we include the impact of the option in the lease term for purposes of determining total future lease payments. As most of our lease agreements do not explicitly state the discount rate implicit in the lease, we use our incremental borrowing rate on the commencement date to calculate the present value of future payments.
Our leases commonly include payments that are based on the Consumer Price Index (CPI) or other similar indices. These variable lease payments are included in the calculation of the ROU asset and lease liability. Other variable lease payments, such as usage-based amounts, are excluded from the ROU asset and lease liability, and are expensed as incurred. In addition to the present value of the future lease payments, the calculation of the ROU asset also includes any deferred rent, lease pre-payments and initial direct costs of obtaining the lease, such as commissions.
In addition to the base rent, real estate leases typically contain provisions for common-area maintenance and other similar services, which are considered non-lease components for accounting purposes. For our real estate leases, we apply a practical expedient to include these non-lease components in calculating the ROU asset and lease liability. For all other types of leases, non-lease components are excluded from our ROU assets and lease liabilities and expensed as incurred.
Our leases are for office space, manufacturing facilities, and machinery and equipment. Real estate represents over 75 % of our lease obligations.
81
The components of lease costs were as follows:
Year Ended December 31 | 2019 | ||
Finance lease cost: | |||
Amortization of right-of-use assets | $ | ||
Interest on lease liabilities | |||
Operating lease cost | |||
Short-term lease cost | |||
Variable lease cost | |||
Sublease income | ( | ) | |
Total lease costs, net | $ | ||
As we have not restated prior-year information for our adoption of ASC Topic 842, total operating lease expense under ASC Topic 840 was $380 in 2018 and $309 in 2017.
Additional information related to leases was as follows:
Year Ended December 31 | 2019 | ||
Cash paid for amounts included in the measurement of lease liabilities: | |||
Operating cash flows from operating leases | $ | ||
Operating cash flows from finance leases | |||
Financing cash flows from finance leases | |||
Right-of-use assets obtained in exchange for lease liabilities: | |||
Operating leases | |||
Finance leases | |||
Additional quantitative lease information was as follows:
December 31 | 2019 | |
Weighted-average remaining lease term: | ||
Operating leases | ||
Finance leases | ||
Weighted-average discount rate: | ||
Operating leases | % | |
Finance leases | % | |
82
The following is a reconciliation of future undiscounted cash flows to the operating and finance lease liabilities, and the related ROU assets, presented on the Consolidated Balance Sheet on December 31, 2019:
Year Ended December 31 | Operating Leases | Finance Leases | |||||
2020 | $ | $ | |||||
2021 | |||||||
2022 | |||||||
2023 | |||||||
2024 | |||||||
Thereafter | |||||||
Total future lease payments | |||||||
Less imputed interest | |||||||
Present value of future lease payments | |||||||
Less current portion of lease liabilities | |||||||
Long-term lease liabilities | $ | $ | |||||
ROU assets | $ | $ | |||||
Lease liabilities are included on the Consolidated Balance Sheet in current and noncurrent other liabilities, while ROU assets are included in noncurrent other assets.
As we have not restated prior-year information for our adoption of ASC Topic 842, the gross amount of assets recorded under capital leases under ASC Topic 840 was $485 with accumulated amortization of $61 as of December 31, 2018.
On December 31, 2019, we had additional future payments on leases that had not yet commenced of $116 . These leases will commence in 2020, and have lease terms of 1 to 20 years.
As we have not restated prior-year information for our adoption of ASC Topic 842, the following presents our future minimum lease payments for operating leases and capital leases under ASC Topic 840 on December 31, 2018:
Year Ended December 31 | Operating Leases | Capital Leases | ||||
2019 | $ | $ | ||||
2020 | ||||||
2021 | ||||||
2022 | ||||||
2023 | ||||||
Thereafter | ||||||
Total future minimum lease payments | $ | |||||
Less amount representing interest | * | |||||
Less amount representing executory costs | * | |||||
Present value of net minimum lease payments | * | |||||
Less current maturities of capital lease liabilities | * | |||||
Noncurrent capital lease liabilities | * | $ | ||||
* Not applicable for operating leases.
83
Q. EQUITY COMPENSATION PLANS
Equity Compensation Overview. We have equity compensation plans for employees, as well as for non-employee members of our board of directors. The equity compensation plans seek to provide an effective means of attracting and retaining directors, officers and key employees, and to provide them with incentives to enhance our growth and profitability. Under the equity compensation plans, awards may be granted to officers, employees or non-employee directors in common stock, options to purchase common stock, restricted shares of common stock, participation units or any combination of these.
Year Ended December 31 | 2019 | 2018 | 2017 | ||||||||
Stock options | $ | $ | $ | ||||||||
Restricted stock/RSUs | |||||||||||
Total equity-based compensation expense, net of tax | $ | $ | $ | ||||||||
Stock Options. Stock options granted under our equity compensation plans are issued with an exercise price at the fair value of our common stock determined by the average of the high and low stock prices as listed on the New York Stock Exchange (NYSE) on the date of grant. The majority of our outstanding stock options vest over three years , with 50 % of the options vesting after two years and the remaining 50 % vesting the following year, and expire 10 years after the grant date.
Year Ended December 31 | 2019 | 2018 | 2017 | |||||
Expected volatility | 19.7-20.0% | 17.6-18.2% | 17.3-19.4% | |||||
Weighted average expected volatility | % | % | % | |||||
Expected term (in months) | ||||||||
Risk-free interest rate | 1.7-2.6% | 2.6-2.9% | 2.0-2.2% | |||||
Expected dividend yield | % | % | % | |||||
We determine the above assumptions based on the following:
• | Expected volatility is based on the historical volatility of our common stock over a period equal to the expected term of the option. |
• | Expected term is based on assumptions used by a set of comparable peer companies. |
84
• | Risk-free interest rate is the yield on a U.S. Treasury zero-coupon issue with a remaining term equal to the expected term of the option at the grant date. |
• | Expected dividend yield is based on our historical dividend yield. |
The resulting weighted average fair value per stock option granted (in dollars) was $29.06 in 2019, $37.42 in 2018 and $33.09 in 2017. Stock option expense reduced pretax operating earnings (and on a diluted per-share basis) by $55 ($0.15 ) in 2019, $57 ($0.15 ) in 2018 and $53 ($0.11 ) in 2017. Compensation expense for stock options is reported as a Corporate expense for segment reporting purposes (see Note S). On December 31, 2019, we had $70 of unrecognized compensation cost related to stock options, which is expected to be recognized over a weighted average period of 1.8 years.
A summary of stock option activity during 2019 follows:
In Shares and Dollars | Shares Under Option | Weighted Average Exercise Price Per Share | ||||
Outstanding on December 31, 2018 | $ | |||||
Granted | ||||||
Exercised | ( | ) | ||||
Forfeited/canceled | ( | ) | ||||
Outstanding on December 31, 2019 | $ | |||||
Vested and expected to vest on December 31, 2019 | $ | |||||
Exercisable on December 31, 2019 | $ | |||||
Summary information with respect to our stock options’ intrinsic value and remaining contractual term on December 31, 2019, follows:
Weighted Average Remaining Contractual Term (in years) | Aggregate Intrinsic Value | ||||
Outstanding | $ | ||||
Vested and expected to vest | |||||
Exercisable | |||||
In the table above, intrinsic value is calculated as the excess, if any, of the market price of our stock on the last trading day of the year over the exercise price of the options. For stock options exercised, intrinsic value is calculated as the difference between the market price on the date of exercise and the exercise price. The total intrinsic value of stock options exercised was $244 in 2019, $147 in 2018 and $215 in 2017.
Restricted Stock/RSUs. The fair value of restricted stock and RSUs equals the average of the high and low market prices of our common stock as listed on the NYSE on the date of grant. Grants of restricted stock are awards of shares of common stock. Participation units represent obligations that have a value derived from or related to the value of our common stock. These include stock appreciation rights, phantom stock units and RSUs, and are payable in cash or common stock.
Restricted stock and RSUs generally vest over a three-year restriction period after the grant date, during which recipients may not sell, transfer, pledge, assign or otherwise convey their restricted shares to another party. During this period, restricted stock recipients receive cash dividends on their restricted shares and are entitled to vote those shares, while RSU recipients receive dividend-equivalent units instead of cash dividends and are not entitled to vote their RSUs or dividend-equivalent units.
85
We grant RSUs with one or more performance measures determined by the compensation committee of the board of directors as described in our proxy statement. Depending on the company’s performance, the number of RSUs earned may be less than, equal to or greater than the original number of RSUs awarded subject to a payout range.
A summary of restricted stock and RSU activity during 2019 follows:
In Shares and Dollars | Shares/ Share-Equivalent Units | Weighted Average Grant-Date Fair Value Per Share | ||||
Nonvested at December 31, 2018 | $ | |||||
Granted | ||||||
Vested | ( | ) | ||||
Forfeited | ( | ) | ||||
Nonvested at December 31, 2019 | $ | |||||
The total fair value of vesting shares was $88 in 2019, $242 in 2018 and $200 in 2017.
R. RETIREMENT PLANS
We provide defined-contribution benefits to eligible employees, as well as some remaining defined-benefit pension and other post-retirement benefits. Substantially all of our plans use a December 31 measurement date consistent with our fiscal year.
Retirement Plan Summary Information
Pension Benefits. We have twelve noncontributory and five contributory trusteed, qualified defined-benefit pension plans covering eligible government business employees, and two noncontributory and four contributory plans covering eligible commercial business employees, including some employees of our international operations. The primary factors affecting the benefits earned by participants in our pension plans are employees’ years of service and compensation levels. Our primary government pension plans, which comprise the majority of our unfunded obligation, were closed to new salaried participants on January 1, 2007. Additionally, we made changes to these plans for certain participants effective in 2014 that limit or cease the benefits that accrue for future service. We made similar changes to our primary
86
commercial pension plan in 2015. We made additional changes to some of our pension plans effective in 2019 that further limit or cease the benefits that accrue for future service.
We also sponsor one funded and several unfunded non-qualified supplemental executive retirement plans, which provide participants with additional benefits, including excess benefits over limits imposed on qualified plans by federal tax law.
Other Post-retirement Benefits. We maintain plans that provide post-retirement healthcare and life insurance coverage for certain employees and retirees. These benefits vary by employment status, age, service and salary level at retirement. The coverage provided and the extent to which the retirees share in the cost of the program vary throughout the company. The plans provide health and life insurance benefits only to those employees who retire directly from our service and not to those who terminate service prior to eligibility for retirement.
Contributions and Benefit Payments
We expect the following benefits to be paid from our retirement plans over the next 10 years:
Pension Benefits | Other Post-retirement Benefits | ||||||
2020 | $ | $ | |||||
2021 | |||||||
2022 | |||||||
2023 | |||||||
2024 | |||||||
2025-2029 | |||||||
Government Contract Considerations
Our contractual arrangements with the U.S. government provide for the recovery of contributions to our pension and other post-retirement benefit plans covering employees working in our defense segments. For non-funded plans, our government contracts allow us to recover claims paid. Following payment, these recoverable amounts are allocated to contracts and billed to the customer in accordance with the Cost Accounting Standards (CAS) and specific contractual terms. For some of these plans, the cumulative pension and other post-retirement benefit cost exceeds the amount currently allocable to contracts. To the extent we consider recovery of the cost to be probable based on our backlog and probable follow-on contracts, we defer the excess in other contract costs in other current assets on the Consolidated Balance Sheet until the cost is allocable to contracts. See Note A for a discussion of our other contract costs. For other plans, the amount allocated to contracts and included in revenue has exceeded the plans’ cumulative benefit cost. We have similarly deferred recognition of these excess earnings on the Consolidated Balance Sheet.
87
Defined-benefit Retirement Plan Summary Financial Information
Estimating retirement plan assets, liabilities and costs requires the extensive use of actuarial assumptions. These include the long-term rate of return on plan assets, the interest rates used to discount projected benefit payments, healthcare cost trend rates and future salary increases. Given the long-term nature of the assumptions being made, actual outcomes can and often do differ from these estimates.
Our annual benefit cost consists of four primary elements: the cost of benefits earned by employees for services rendered during the year, an interest charge on our plan liabilities, an assumed return on our plan assets for the year, and other gains and losses, which result from changes in actuarial assumptions, differences between the actual and assumed long-term rate of return on assets, and changes we make to plan benefit terms. These gains and losses are initially deferred in AOCL and then amortized over future years as a component of our annual benefit cost. We amortize actuarial differences under qualified plans on a straight-line basis over the average remaining service period of eligible employees. If all or almost all of a plan’s participants are inactive or are not accruing additional benefits, we amortize these differences over the average remaining life expectancy of the plan participants. We recognize the difference between the actual and expected return on plan assets for qualified plans over five years . The deferral of these differences reduces the volatility of our annual benefit cost that can result either from year-to-year changes in the assumptions or from actual results that are not necessarily representative of the long-term financial position of these plans. We recognize differences under nonqualified plans immediately.
Net annual defined-benefit pension and other post-retirement benefit cost (credit) consisted of the following:
Pension Benefits | |||||||||||
Year Ended December 31 | 2019 | 2018 | 2017 | ||||||||
Service cost | $ | $ | $ | ||||||||
Interest cost | |||||||||||
Expected return on plan assets | ( | ) | ( | ) | ( | ) | |||||
Recognized net actuarial loss | |||||||||||
Amortization of prior service credit | ( | ) | ( | ) | ( | ) | |||||
Net annual benefit cost | $ | $ | $ | ||||||||
Other Post-retirement Benefits | |||||||||||
Year Ended December 31 | 2019 | 2018 | 2017 | ||||||||
Service cost | $ | $ | $ | ||||||||
Interest cost | |||||||||||
Expected return on plan assets | ( | ) | ( | ) | ( | ) | |||||
Recognized net actuarial gain | ( | ) | ( | ) | ( | ) | |||||
Amortization of prior service credit | ( | ) | ( | ) | ( | ) | |||||
Net annual benefit credit | $ | ( | ) | $ | ( | ) | $ | ( | ) | ||
The service cost component of net annual benefit cost (credit) is reported separately from the other components of net annual benefit cost (credit) in accordance with ASU 2017-07.
We recognize an asset or liability on the Consolidated Balance Sheet equal to the funded status of each of our defined-benefit retirement plans. The funded status is the difference between the fair value of the plan’s assets and its benefit obligation. The following is a reconciliation of the benefit obligations and plan/trust assets, and the resulting funded status, of our defined-benefit retirement plans:
88
Pension Benefits | Other Post-retirement Benefits | ||||||||||||||
Year Ended December 31 | 2019 | 2018 | 2019 | 2018 | |||||||||||
Change in Benefit Obligation | |||||||||||||||
Benefit obligation at beginning of year | $ | ( | ) | $ | ( | ) | $ | ( | ) | $ | ( | ) | |||
Service cost | ( | ) | ( | ) | ( | ) | ( | ) | |||||||
Interest cost | ( | ) | ( | ) | ( | ) | ( | ) | |||||||
Acquisitions | ( | ) | ( | ) | |||||||||||
Amendments | ( | ) | ( | ) | |||||||||||
Actuarial (loss) gain | ( | ) | ( | ) | |||||||||||
Settlement/curtailment/other | ( | ) | ( | ) | |||||||||||
Benefits paid | |||||||||||||||
Benefit obligation at end of year | $ | ( | ) | $ | ( | ) | $ | ( | ) | $ | ( | ) | |||
Change in Plan/Trust Assets | |||||||||||||||
Fair value of assets at beginning of year | $ | $ | $ | $ | |||||||||||
Actual return on plan assets | ( | ) | ( | ) | |||||||||||
Acquisitions | |||||||||||||||
Employer contributions | |||||||||||||||
Settlement/curtailment/other | ( | ) | |||||||||||||
Benefits paid | ( | ) | ( | ) | ( | ) | ( | ) | |||||||
Fair value of assets at end of year | $ | $ | $ | $ | |||||||||||
Funded status at end of year | $ | ( | ) | $ | ( | ) | $ | ( | ) | $ | ( | ) | |||
The overall increase in our pension benefit obligation for the year ended December 31, 2019, was due primarily to actuarial losses created by the change in the weighted-average discount rate, which decreased from 4.28 % at December 31, 2018, to 3.19 % at December 31, 2019.
The overall increases in our pension benefit obligation and assets for the year ended December 31, 2018, were due primarily to the acquisition of CSRA retirement plans. The increase in the obligation due to acquired plans was offset partially by actuarial gains created by the change in the weighted-average discount rate, which increased from 3.69 % at December 31, 2017, to 4.28 % at December 31, 2018.
Amounts recognized on the Consolidated Balance Sheet consisted of the following:
Pension Benefits | Other Post-retirement Benefits | ||||||||||||||
December 31 | 2019 | 2018 | 2019 | 2018 | |||||||||||
Noncurrent assets | $ | $ | $ | $ | |||||||||||
Current liabilities | ( | ) | ( | ) | ( | ) | ( | ) | |||||||
Noncurrent liabilities | ( | ) | ( | ) | ( | ) | ( | ) | |||||||
Net liability recognized | $ | ( | ) | $ | ( | ) | $ | ( | ) | $ | ( | ) | |||
Amounts deferred in AOCL for our retirement plans consisted of the following:
Pension Benefits | Other Post-retirement Benefits | ||||||||||||||
December 31 | 2019 | 2018 | 2019 | 2018 | |||||||||||
Net actuarial loss (gain) | $ | $ | $ | ( | ) | $ | ( | ) | |||||||
Prior service (credit) cost | ( | ) | ( | ) | |||||||||||
Total amount recognized in AOCL, pretax | $ | $ | $ | $ | ( | ) | |||||||||
89
The following is a reconciliation of the change in AOCL for our retirement plans:
Pension Benefits | Other Post-retirement Benefits | ||||||||||||||
Year Ended December 31 | 2019 | 2018 | 2019 | 2018 | |||||||||||
Net actuarial loss (gain) | $ | $ | $ | $ | ( | ) | |||||||||
Prior service credit (cost) | ( | ) | |||||||||||||
Amortization of: | |||||||||||||||
Net actuarial (loss) gain from prior years | ( | ) | ( | ) | |||||||||||
Prior service credit | |||||||||||||||
Other* | ( | ) | ( | ) | |||||||||||
Change in AOCL, pretax | $ | $ | $ | $ | ( | ) | |||||||||
* Includes foreign exchange translation, curtailment and other adjustments.
A pension plan’s funded status is the difference between the plan’s assets and its projected benefit obligation (PBO). The PBO is the present value of future benefits attributed to employee services rendered to date, including assumptions about future compensation levels. On December 31, 2019 and 2018, most of our pension plans had a PBO that exceeded the plans’ assets. Summary information for those plans follows:
December 31 | 2019 | 2018 | |||||
PBO | $ | ( | ) | $ | ( | ) | |
Fair value of plan assets | |||||||
A retirement plan’s accumulated benefit obligation (ABO) is the present value of future benefits attributed to employee services rendered to date, excluding assumptions about future compensation levels for pension plans. The ABO for all defined-benefit pension plans was $17.8 billion and $15.5 billion on December 31, 2019 and 2018, respectively. The ABO for all other post-retirement plans was $1 billion and $935 on December 31, 2019 and 2018, respectively. On December 31, 2019 and 2018, most of our retirement plans had an ABO that exceeded the plans’ assets. Summary information for those plans follows:
Pension Benefits | Other Post-retirement Benefits | ||||||||||||||
December 31 | 2019 | 2018 | 2019 | 2018 | |||||||||||
ABO | $ | ( | ) | $ | ( | ) | $ | ( | ) | $ | ( | ) | |||
Fair value of plan assets | |||||||||||||||
Retirement Plan Assumptions
We calculate the plan assets and liabilities for a given year and the net annual benefit cost for the subsequent year using assumptions determined as of December 31 of the year in question.
90
The following table summarizes the weighted average assumptions used to determine our benefit obligations:
Assumptions on December 31 | 2019 | 2018 | |||
Pension Benefits | |||||
Benefit obligation discount rate | % | % | |||
Rate of increase in compensation levels | % | % | |||
Other Post-retirement Benefits | |||||
Benefit obligation discount rate | % | % | |||
Healthcare cost trend rate: | |||||
Trend rate for next year | % | % | |||
Ultimate trend rate | % | % | |||
Year rate reaches ultimate trend rate | |||||
The following table summarizes the weighted average assumptions used to determine our net annual benefit cost:
Assumptions for Year Ended December 31 | 2019 | 2018 | 2017 | |||||
Pension Benefits | ||||||||
Discount rates: | ||||||||
Benefit obligation | % | % | % | |||||
Service cost | % | % | % | |||||
Interest cost | % | % | % | |||||
Expected long-term rate of return on assets | % | % | % | |||||
Rate of increase in compensation levels | % | % | % | |||||
Other Post-retirement Benefits | ||||||||
Discount rates: | ||||||||
Benefit obligation | % | % | % | |||||
Service cost | % | % | % | |||||
Interest cost | % | % | % | |||||
Expected long-term rate of return on assets | % | % | % | |||||
We base the discount rates on a current yield curve developed from a portfolio of high-quality, fixed-income investments with maturities consistent with the projected benefit payout period. We use the spot rate approach to identify individual spot rates along the yield curve that correspond with the timing of each projected service cost and discounted benefit obligation payment.
We determine the long-term rates of return on assets based on consideration of historical and forward-looking returns and the current and expected asset allocation strategy. We decreased the expected long-term rate of return on assets in our primary U.S. government and commercial pension plans by 75 basis points beginning in 2017, and we decreased the expected long-term rates of return on assets in our primary U.S. other post-retirement benefit plans by 100 basis points beginning in 2019, both following an assessment of the historical and expected long-term returns of our various asset classes.
Retirement plan assumptions are based on our best judgment, including consideration of current and future market conditions. Changes in these estimates impact future pension and other post-retirement benefit cost. As discussed above, we defer recognition of the cumulative benefit cost for our government plans in
91
Plan Assets
A committee of our board of directors is responsible for the strategic oversight of our defined-benefit retirement plan assets held in trust. Management develops investment policies and provides oversight of a third-party investment manager who reports to the committee on a regular basis. The outsourced third-party investment manager develops investment strategies and makes all day-to-day investment decisions related to defined-benefit retirement plan assets in accordance with our investment policy and target allocation percentages.
Equities | 48-68% |
Fixed income | 20-48% |
Cash | 0-5% |
Other asset classes | 0-16% |
More than 90 % of our pension plan assets are held in a single trust for our primary U.S. government and commercial pension plans. On December 31, 2019, the trust was invested largely in publicly traded equities, fixed-income securities and commingled funds comprised of equity securities. The trust also invests in other asset classes consistent with our investment policy. Our investment policy allows the use of derivative instruments when appropriate to reduce anticipated asset volatility, to gain exposure to an asset class or to adjust the duration of fixed-income assets.
We hold assets in VEBA trusts for some of our other post-retirement benefit plans. These assets are managed by a third-party investment manager with oversight by management and are generally invested in publicly traded equities, fixed-income securities and commingled funds comprised of equity and fixed-income securities. Our asset allocation strategy for the VEBA trusts considers potential fluctuations in our other post-retirement benefit obligation, the taxable nature of certain VEBA trusts, tax deduction limits on contributions and the regulatory environment.
Our retirement plan assets are reported at fair value. See Note E for a discussion of the hierarchy for determining fair value. Our Level 1 assets include investments in publicly traded equity securities. These securities are actively traded and valued using quoted prices for identical securities from the market exchanges. Our Level 2 assets consist of fixed-income securities and commingled funds whose underlying investments are valued using observable marketplace inputs. The fair value of plan assets invested in fixed-income securities is generally determined under a market approach using valuation models that incorporate observable inputs such as interest rates, bond yields and quoted prices for similar assets. Our plan assets that are invested in commingled funds are valued using a unit price or net asset value (NAV) that is based on the underlying investments of the fund. Our Level 3 assets include real estate funds, insurance deposit contracts, retirement annuity contracts and direct private equity investments.
Certain investments valued using NAV as a practical expedient are excluded from the fair value hierarchy. These investments are redeemable at NAV on a monthly or quarterly basis and have redemption
92
The fair value of our pension plan assets by investment category and the corresponding level within the fair value hierarchy were as follows:
Fair Value | Quoted Prices in Active Markets for Identical Assets (Level 1) | Significant Other Observable Inputs (Level 2) | Significant Unobservable Inputs (Level 3) | ||||||||||||
Asset Category | December 31, 2019 | ||||||||||||||
Cash and equivalents | $ | $ | $ | $ | |||||||||||
Equity securities (a): | |||||||||||||||
U.S. companies | |||||||||||||||
Non-U.S. companies | |||||||||||||||
Private equity investments | |||||||||||||||
Fixed-income securities: | |||||||||||||||
Corporate bonds (b) | |||||||||||||||
Treasury securities | |||||||||||||||
Commingled funds: | |||||||||||||||
Equity funds | |||||||||||||||
Fixed-income funds | |||||||||||||||
Real estate funds | |||||||||||||||
Other investments: | |||||||||||||||
Insurance deposit contracts | |||||||||||||||
Retirement annuity contracts | |||||||||||||||
Total plan assets in fair value hierarchy | $ | $ | $ | $ | |||||||||||
Plan assets measured using NAV as a practical expedient (c): | |||||||||||||||
Real estate funds | |||||||||||||||
Hedge funds | |||||||||||||||
Equity funds | |||||||||||||||
Total pension plan assets | $ | ||||||||||||||
(a)No single equity holding amounted to more than 1 % of the total fair value.
(b)Our corporate bond investments had an average rating of A.
(c)Investments measured at fair value using NAV as a practical expedient are not classified in the fair value hierarchy. The fair value amounts presented in this table for these investments are included to permit reconciliation of the fair value hierarchy to the total plan assets.
93
Fair Value | Quoted Prices in Active Markets for Identical Assets (Level 1) | Significant Other Observable Inputs (Level 2) | Significant Unobservable Inputs (Level 3) | ||||||||||||
Asset Category | December 31, 2018 | ||||||||||||||
Cash and equivalents | $ | $ | $ | $ | |||||||||||
Equity securities (a): | |||||||||||||||
U.S. companies | |||||||||||||||
Non-U.S. companies | |||||||||||||||
Private equity investments | |||||||||||||||
Fixed-income securities: | |||||||||||||||
Corporate bonds (b) | |||||||||||||||
Treasury securities | |||||||||||||||
Commingled funds: | |||||||||||||||
Equity funds | |||||||||||||||
Fixed-income funds | |||||||||||||||
Real estate funds | |||||||||||||||
Other investments: | |||||||||||||||
Insurance deposit contracts | |||||||||||||||
Total plan assets in fair value hierarchy | $ | $ | $ | $ | |||||||||||
Plan assets measured using NAV as a practical expedient (c): | |||||||||||||||
Hedge funds | |||||||||||||||
Real estate funds | |||||||||||||||
Fixed-income funds | |||||||||||||||
Equity funds | |||||||||||||||
Total pension plan assets | $ | ||||||||||||||
(a)No single equity holding amounted to more than 1 % of the total fair value.
(b)Our corporate bond investments had an average rating of A+.
(c)Investments measured at fair value using NAV as a practical expedient are not classified in the fair value hierarchy. The fair value amounts presented in this table for these investments are included to permit reconciliation of the fair value hierarchy to the total plan assets.
94
The fair value of our other post-retirement benefit plan assets by category and the corresponding level within the fair value hierarchy were as follows:
Fair Value | Quoted Prices in Active Markets for Identical Assets (Level 1) | Significant Other Observable Inputs (Level 2) | |||||||||
Asset Category (a) | December 31, 2019 | ||||||||||
Cash and equivalents | $ | $ | $ | ||||||||
Equity securities | |||||||||||
Fixed-income securities | |||||||||||
Commingled funds: | |||||||||||
Equity funds | |||||||||||
Fixed-income funds | |||||||||||
Real estate funds | |||||||||||
Total plan assets in fair value hierarchy | $ | $ | $ | ||||||||
Plan assets measured using NAV as a practical expedient (b): | |||||||||||
Real estate funds | |||||||||||
Hedge funds | |||||||||||
Total other post-retirement benefit plan assets | $ | ||||||||||
(b) Investments measured at fair value using NAV as a practical expedient are not classified in the fair value hierarchy. The fair value amounts presented in this table for these investments are included to permit reconciliation of the fair value hierarchy to the total plan assets.
Fair Value | Quoted Prices in Active Markets for Identical Assets (Level 1) | Significant Other Observable Inputs (Level 2) | |||||||||
Asset Category (a) | December 31, 2018 | ||||||||||
Cash and equivalents | $ | $ | $ | ||||||||
Equity securities | |||||||||||
Fixed-income securities | |||||||||||
Commingled funds: | |||||||||||
Equity funds | |||||||||||
Fixed-income funds | |||||||||||
Real estate funds | |||||||||||
Total plan assets in fair value hierarchy | $ | $ | $ | ||||||||
Plan assets measured using NAV as a practical expedient (b): | |||||||||||
Hedge funds | |||||||||||
Equity funds | |||||||||||
Fixed-income funds | |||||||||||
Real estate funds | |||||||||||
Total other post-retirement benefit plan assets | $ | ||||||||||
(a) We had no Level 3 investments on December 31, 2018.
(b) Investments measured at fair value using NAV as a practical expedient are not classified in the fair value hierarchy. The fair value amounts presented in this table for these investments are included to permit reconciliation of the fair value hierarchy to the total plan assets.
95
Private Equity Investments | Real Estate Funds | Insurance Deposits Contracts | Retirement Annuity Contracts | Total Level 3 Assets | |||||||||||||||
December 31, 2017 | $ | $ | $ | $ | $ | ||||||||||||||
Actual return on plan assets: | |||||||||||||||||||
Unrealized losses, net | ( | ) | ( | ) | |||||||||||||||
Realized gains, net | |||||||||||||||||||
Purchases, sales and settlements, net | |||||||||||||||||||
December 31, 2018 | |||||||||||||||||||
Actual return on plan assets: | |||||||||||||||||||
Unrealized gains, net | |||||||||||||||||||
Purchases, sales and settlements, net | |||||||||||||||||||
December 31, 2019 | $ | $ | $ | $ | $ | ||||||||||||||
S. SEGMENT INFORMATION
We have five operating segments: Aerospace, Combat Systems, Information Technology, Mission Systems and Marine Systems. We organize our segments in accordance with the nature of products and services offered. We measure each segment’s profitability based on operating earnings. As a result, we do not allocate net interest, other income and expense items, and income taxes to our segments.
Summary financial information for each of our segments follows:
Revenue | Operating Earnings | Revenue from U.S. Government | |||||||||||||||||||||||||||
Year Ended December 31 | 2019 | 2018 | 2017 | 2019 | 2018 | 2017 | 2019 | 2018 | 2017 | ||||||||||||||||||||
Aerospace | $ | $ | $ | $ | $ | $ | $ | $ | $ | ||||||||||||||||||||
Combat Systems | |||||||||||||||||||||||||||||
Information Technology | |||||||||||||||||||||||||||||
Mission Systems | |||||||||||||||||||||||||||||
Marine Systems | |||||||||||||||||||||||||||||
Corporate | ( | ) | |||||||||||||||||||||||||||
Total | $ | $ | $ | $ | $ | $ | $ | $ | $ | ||||||||||||||||||||
Corporate operating results have two primary components: pension and other post-retirement benefit income, and stock option expense. We are required to report the non-service cost components of pension and other post-retirement benefit cost (e.g., interest cost) in other income (expense) in the Consolidated Statement of Earnings. As described in Note R, in our defense segments, pension and other post-retirement benefit costs are recoverable contract costs. Therefore, the non-service cost components are included in the operating results of these segments, but an offset is reported in Corporate. Corporate operating results in 2018 also included one-time charges of approximately $45 associated with the costs to complete the CSRA acquisition.
96
The following is additional summary financial information for each of our segments:
Identifiable Assets | Capital Expenditures | Depreciation and Amortization | |||||||||||||||||||||||||||
Year Ended December 31 | 2019 | 2018 | 2017 | 2019 | 2018 | 2017 | 2019 | 2018 | 2017 | ||||||||||||||||||||
Aerospace | $ | $ | $ | $ | $ | $ | $ | $ | $ | ||||||||||||||||||||
Combat Systems | |||||||||||||||||||||||||||||
Information Technology | |||||||||||||||||||||||||||||
Mission Systems | |||||||||||||||||||||||||||||
Marine Systems | |||||||||||||||||||||||||||||
Corporate* | |||||||||||||||||||||||||||||
Total | $ | $ | $ | $ | $ | $ | $ | $ | $ | ||||||||||||||||||||
* Corporate identifiable assets are primarily cash and equivalents.
See Note C for additional revenue information by segment.
The following table presents our revenue by geographic area based on the location of our customers:
Year Ended December 31 | 2019 | 2018 | 2017 | ||||||||
North America: | |||||||||||
United States | $ | $ | $ | ||||||||
Other | |||||||||||
Total North America | |||||||||||
Europe | |||||||||||
Asia/Pacific | |||||||||||
Africa/Middle East | |||||||||||
South America | |||||||||||
Total revenue | $ | $ | $ | ||||||||
Our revenue from non-U.S. operations was $4.4 billion in 2019, $4.2 billion in 2018 and $3.7 billion in 2017, and earnings from continuing operations before income taxes from non-U.S. operations were $600 in 2019, $578 in 2018 and $550 in 2017. The long-lived assets associated with these operations were 4 % of our total long-lived assets on December 31, 2019, 3 % on December 31, 2018, and 5 % on December 31, 2017.
T. CONDENSED CONSOLIDATING FINANCIAL STATEMENTS
The fixed- and floating-rate notes described in Note K are fully and unconditionally guaranteed on an unsecured, joint and several basis by several of our 100 %-owned subsidiaries (the guarantors). The following condensed consolidating financial statements illustrate the composition of the parent, the guarantors on a combined basis (each guarantor together with its majority-owned subsidiaries) and all other subsidiaries on a combined basis.
97
CONDENSED CONSOLIDATING STATEMENT OF EARNINGS
Year Ended December 31, 2019 | Parent | Guarantors on a Combined Basis | Other Subsidiaries on a Combined Basis | Consolidating Adjustments | Total Consolidated | ||||||||||
Revenue | $ | $ | $ | $ | $ | ||||||||||
Cost of sales | ( | ) | ( | ) | ( | ) | |||||||||
G&A | ( | ) | ( | ) | ( | ) | ( | ) | |||||||
Operating earnings | |||||||||||||||
Interest, net | ( | ) | ( | ) | ( | ) | |||||||||
Other, net | ( | ) | |||||||||||||
Earnings before income tax | ( | ) | |||||||||||||
Provision for income tax, net | ( | ) | ( | ) | ( | ) | |||||||||
Equity in net earnings of subsidiaries | ( | ) | |||||||||||||
Net earnings | $ | $ | $ | $ | ( | ) | $ | ||||||||
Comprehensive income | $ | $ | $ | $ | ( | ) | $ | ||||||||
Year Ended December 31, 2018 | |||||||||||||||
Revenue | $ | $ | $ | $ | $ | ||||||||||
Cost of sales | ( | ) | ( | ) | ( | ) | |||||||||
G&A | ( | ) | ( | ) | ( | ) | ( | ) | |||||||
Operating earnings | ( | ) | |||||||||||||
Interest, net | ( | ) | ( | ) | ( | ) | |||||||||
Other, net | ( | ) | ( | ) | |||||||||||
Earnings before income tax | ( | ) | |||||||||||||
Provision for income tax, net | ( | ) | ( | ) | ( | ) | |||||||||
Discontinued operations, net of tax | ( | ) | ( | ) | |||||||||||
Equity in net earnings of subsidiaries | ( | ) | |||||||||||||
Net earnings | $ | $ | $ | $ | ( | ) | $ | ||||||||
Comprehensive income | $ | $ | $ | $ | ( | ) | $ | ||||||||
Year Ended December 31, 2017 | |||||||||||||||
Revenue | $ | $ | $ | $ | $ | ||||||||||
Cost of sales | ( | ) | ( | ) | ( | ) | |||||||||
G&A | ( | ) | ( | ) | ( | ) | ( | ) | |||||||
Operating earnings | |||||||||||||||
Interest, net | ( | ) | ( | ) | ( | ) | |||||||||
Other, net | ( | ) | ( | ) | |||||||||||
Earnings before income tax | ( | ) | |||||||||||||
Provision for income tax, net | ( | ) | ( | ) | ( | ) | |||||||||
Equity in net earnings of subsidiaries | ( | ) | |||||||||||||
Net earnings | $ | $ | $ | $ | ( | ) | $ | ||||||||
Comprehensive income | $ | $ | $ | $ | ( | ) | $ | ||||||||
98
CONDENSED CONSOLIDATING BALANCE SHEET
December 31, 2019 | Parent* | Guarantors on a Combined Basis | Other Subsidiaries on a Combined Basis | Consolidating Adjustments | Total Consolidated | ||||||||||
ASSETS | |||||||||||||||
Current assets: | |||||||||||||||
Cash and equivalents | $ | $ | $ | $ | $ | ||||||||||
Accounts receivable | |||||||||||||||
Unbilled receivables | |||||||||||||||
Inventories | |||||||||||||||
Other current assets | ( | ) | |||||||||||||
Total current assets | |||||||||||||||
Noncurrent assets: | |||||||||||||||
PP&E | |||||||||||||||
Accumulated depreciation of PP&E | ( | ) | ( | ) | ( | ) | ( | ) | |||||||
Intangible assets, net | |||||||||||||||
Goodwill | |||||||||||||||
Other assets | |||||||||||||||
Net investment in subsidiaries | ( | ) | |||||||||||||
Total noncurrent assets | ( | ) | |||||||||||||
Total assets | $ | $ | $ | $ | ( | ) | $ | ||||||||
LIABILITIES AND SHAREHOLDERS’ EQUITY | |||||||||||||||
Current liabilities: | |||||||||||||||
Short-term debt and current portion of long-term debt | $ | $ | $ | $ | $ | ||||||||||
Customer advances and deposits | |||||||||||||||
Other current liabilities | |||||||||||||||
Total current liabilities | |||||||||||||||
Noncurrent liabilities: | |||||||||||||||
Long-term debt | |||||||||||||||
Other liabilities | |||||||||||||||
Total noncurrent liabilities | |||||||||||||||
Total shareholders’ equity | ( | ) | |||||||||||||
Total liabilities and shareholders’ equity | $ | $ | $ | $ | ( | ) | $ | ||||||||
* | Includes the funded status of the company’s primary domestic qualified defined-benefit pension plans as the Parent has the ultimate obligation for the plans. |
99
CONDENSED CONSOLIDATING BALANCE SHEET
December 31, 2018 | Parent* | Guarantors on a Combined Basis | Other Subsidiaries on a Combined Basis | Consolidating Adjustments | Total Consolidated | ||||||||||
ASSETS | |||||||||||||||
Current assets: | |||||||||||||||
Cash and equivalents | $ | $ | $ | $ | $ | ||||||||||
Accounts receivable | |||||||||||||||
Unbilled receivables | |||||||||||||||
Inventories | |||||||||||||||
Other current assets | ( | ) | |||||||||||||
Total current assets | |||||||||||||||
Noncurrent assets: | |||||||||||||||
PP&E | |||||||||||||||
Accumulated depreciation of PP&E | ( | ) | ( | ) | ( | ) | ( | ) | |||||||
Intangible assets, net | |||||||||||||||
Goodwill | |||||||||||||||
Other assets | |||||||||||||||
Net investment in subsidiaries | ( | ) | |||||||||||||
Total noncurrent assets | ( | ) | |||||||||||||
Total assets | $ | $ | $ | $ | ( | ) | $ | ||||||||
LIABILITIES AND SHAREHOLDERS’ EQUITY | |||||||||||||||
Current liabilities: | |||||||||||||||
Short-term debt and current portion of long-term debt | $ | $ | $ | $ | $ | ||||||||||
Customer advances and deposits | |||||||||||||||
Other current liabilities | |||||||||||||||
Total current liabilities | |||||||||||||||
Noncurrent liabilities: | |||||||||||||||
Long-term debt | |||||||||||||||
Other liabilities | |||||||||||||||
Total noncurrent liabilities | |||||||||||||||
Total shareholders’ equity | ( | ) | |||||||||||||
Total liabilities and shareholders’ equity | $ | $ | $ | $ | ( | ) | $ | ||||||||
* | Includes the funded status of the company’s primary domestic qualified defined-benefit pension plans as the Parent has the ultimate obligation for the plans. |
100
CONDENSED CONSOLIDATING STATEMENT OF CASH FLOWS
Year Ended December 31, 2019 | Parent | Guarantors on a Combined Basis | Other Subsidiaries on a Combined Basis | Consolidating Adjustments | Total Consolidated | ||||||||||
Net cash provided by operating activities* | $ | ( | ) | $ | $ | $ | $ | ||||||||
Cash flows from investing activities: | |||||||||||||||
Capital expenditures | ( | ) | ( | ) | ( | ) | ( | ) | |||||||
Other, net | ( | ) | ( | ) | |||||||||||
Net cash used by investing activities | ( | ) | ( | ) | ( | ) | ( | ) | |||||||
Cash flows from financing activities: | |||||||||||||||
Dividends paid | ( | ) | ( | ) | |||||||||||
Repayments of commercial paper, net | ( | ) | ( | ) | |||||||||||
Purchases of common stock | ( | ) | ( | ) | |||||||||||
Other, net | ( | ) | |||||||||||||
Net cash used by financing activities | ( | ) | ( | ) | ( | ) | |||||||||
Net cash used by discontinued operations | ( | ) | ( | ) | |||||||||||
Cash sweep/funding by parent | ( | ) | ( | ) | |||||||||||
Net decrease in cash and equivalents | ( | ) | ( | ) | |||||||||||
Cash and equivalents at beginning of year | |||||||||||||||
Cash and equivalents at end of year | $ | $ | $ | $ | $ | ||||||||||
Year Ended December 31, 2018 | |||||||||||||||
Net cash provided by operating activities* | $ | ( | ) | $ | $ | $ | $ | ||||||||
Cash flows from investing activities: | |||||||||||||||
Business acquisitions, net of cash acquired | ( | ) | ( | ) | ( | ) | ( | ) | |||||||
Capital expenditures | ( | ) | ( | ) | ( | ) | ( | ) | |||||||
Proceeds from sales of assets | |||||||||||||||
Other, net | ( | ) | ( | ) | |||||||||||
Net cash used by investing activities | ( | ) | ( | ) | ( | ) | ( | ) | |||||||
Cash flows from financing activities: | |||||||||||||||
Proceeds from fixed-rate notes | |||||||||||||||
Purchases of common stock | ( | ) | ( | ) | |||||||||||
Dividends paid | ( | ) | ( | ) | |||||||||||
Proceeds from floating-rate notes | |||||||||||||||
Proceeds from commercial paper, net | |||||||||||||||
Repayment of CSRA accounts receivable purchase agreement | ( | ) | ( | ) | |||||||||||
Other, net | |||||||||||||||
Net cash provided by financing activities | ( | ) | |||||||||||||
Net cash used by discontinued operations | ( | ) | ( | ) | |||||||||||
Cash sweep/funding by parent | ( | ) | ( | ) | |||||||||||
Net decrease in cash and equivalents | ( | ) | ( | ) | ( | ) | |||||||||
Cash and equivalents at beginning of year | |||||||||||||||
Cash and equivalents at end of year | $ | $ | $ | $ | $ | ||||||||||
* Continuing operations only.
101
CONDENSED CONSOLIDATING STATEMENT OF CASH FLOWS
Year Ended December 31, 2017 | Parent | Guarantors on a Combined Basis | Other Subsidiaries on a Combined Basis | Consolidating Adjustments | Total Consolidated | ||||||||||
Net cash provided by operating activities* | $ | $ | $ | $ | $ | ||||||||||
Cash flows from investing activities: | |||||||||||||||
Capital expenditures | ( | ) | ( | ) | ( | ) | ( | ) | |||||||
Business acquisitions, net of cash acquired | ( | ) | ( | ) | ( | ) | |||||||||
Other, net | ( | ) | |||||||||||||
Net cash used by investing activities | ( | ) | ( | ) | ( | ) | ( | ) | |||||||
Cash flows from financing activities: | |||||||||||||||
Purchases of common stock | ( | ) | ( | ) | |||||||||||
Dividends paid | ( | ) | ( | ) | |||||||||||
Proceeds from fixed-rate notes | |||||||||||||||
Repayment of fixed-rate notes | ( | ) | ( | ) | |||||||||||
Other, net | ( | ) | |||||||||||||
Net cash used by financing activities | ( | ) | ( | ) | ( | ) | |||||||||
Net cash used by discontinued operations | ( | ) | ( | ) | |||||||||||
Cash sweep/funding by parent | ( | ) | ( | ) | |||||||||||
Net increase in cash and equivalents | ( | ) | |||||||||||||
Cash and equivalents at beginning of year | |||||||||||||||
Cash and equivalents at end of year | $ | $ | $ | $ | $ | ||||||||||
* Continuing operations only.
102
REPORT OF INDEPENDENT REGISTERED PUBLIC ACCOUNTING FIRM
To the Board of Directors and Shareholders of General Dynamics Corporation:
Opinion on the Consolidated Financial Statements
We have audited the accompanying Consolidated Balance Sheet of General Dynamics Corporation and subsidiaries (the Company) as of December 31, 2019 and 2018, the related Consolidated Statements of Earnings, Comprehensive Income, Cash Flows, and Shareholders’ Equity for each of the years in the three-year period ended December 31, 2019, and the related notes (collectively, the Consolidated Financial Statements). In our opinion, the Consolidated Financial Statements present fairly, in all material respects, the financial position of the Company as of December 31, 2019 and 2018, and the results of its operations and its cash flows for each of the years in the three-year period ended December 31, 2019, in conformity with U.S. generally accepted accounting principles.
We also have audited, in accordance with the standards of the Public Company Accounting Oversight Board (United States) (PCAOB), the Company’s internal control over financial reporting as of December 31, 2019, based on criteria established in Internal Control - Integrated Framework (2013) issued by the Committee of Sponsoring Organizations of the Treadway Commission, and our report dated February 10, 2020, expressed an unqualified opinion on the effectiveness of the Company’s internal control over financial reporting.
Change in Accounting Principle
As discussed in Note A to the Consolidated Financial Statements, the Company has changed its method of accounting for leases as of January 1, 2019, in accordance with the adoption of Accounting Standards Codification (ASC) Topic 842, Leases.
Basis for Opinion
These Consolidated Financial Statements are the responsibility of the Company’s management. Our responsibility is to express an opinion on these Consolidated Financial Statements based on our audits. We are a public accounting firm registered with the PCAOB and are required to be independent with respect to the Company in accordance with the U.S. federal securities laws and the applicable rules and regulations of the Securities and Exchange Commission and the PCAOB.
We conducted our audits in accordance with the standards of the PCAOB. Those standards require that we plan and perform the audit to obtain reasonable assurance about whether the Consolidated Financial Statements are free of material misstatement, whether due to error or fraud. Our audits included performing procedures to assess the risks of material misstatement of the Consolidated Financial Statements, whether due to error or fraud, and performing procedures that respond to those risks. Such procedures included examining, on a test basis, evidence regarding the amounts and disclosures in the Consolidated Financial Statements. Our audits also included evaluating the accounting principles used and significant estimates made by management, as well as evaluating the overall presentation of the Consolidated Financial Statements. We believe that our audits provide a reasonable basis for our opinion.
Critical Audit Matters
The critical audit matters communicated below are matters arising from the current period audit of the Consolidated Financial Statements that were communicated or required to be communicated to the audit committee and that: (1) relate to accounts or disclosures that are material to the Consolidated Financial Statements and (2) involved our especially challenging, subjective, or complex judgments. The
103
communication of critical audit matters does not alter in any way our opinion on the Consolidated Financial Statements, taken as a whole, and we are not, by communicating the critical audit matters below, providing separate opinions on the critical audit matters or on the accounts or disclosures to which they relate.
Evaluation over the Estimation of Costs to Complete on Select Long-term Contracts in the Defense Segments
As discussed in Note C to the Consolidated Financial Statements, accounting for long-term contracts involves estimation of the costs to complete a contract in order to accurately recognize the associated revenue and profit. The estimated cost to complete each contract is required to assess the proportion of revenues to recognize based upon the costs incurred-to-date in comparison to the total estimate of costs to complete the contract. The estimated cost to complete each contract incorporates assumptions of labor productivity and availability based on the complexity of the work to be performed, the cost of materials, and the performance of subcontractors.
We identified the evaluation over the estimation of costs to complete a select group of long-term contracts in the defense segments as a critical audit matter. The assumptions, included above, may have been used in estimating the costs to complete and required a high-level of subjectivity. Specifically, changes to those assumptions may have a significant impact on the estimated revenue and profit recorded during the period under audit.
The primary procedures we performed to address this critical audit matter included the following. We tested certain internal controls over the Company’s cost accumulation and estimation processes. This included transactional controls over the accumulation of costs incurred, and contract level controls over the estimated cost assumptions. We compared the Company’s historical estimates of costs to actual costs incurred to assess the Company’s ability to estimate accurately. We inquired of financial and operational personnel of the Company to identify factors that should be considered within the cost to complete estimates or indications of management bias. We evaluated the assumptions within the Company’s estimation of costs to complete by:
– | reading the underlying contract and related amendments to obtain an understanding of the contractual requirements and related performance obligations, |
– | considering costs incurred to-date and considering the relative progress towards completion of the contract, |
– | considering, if relevant, the estimated costs to complete on similar or predecessor programs, |
– | inspecting correspondence, if any, between the Company and the customer regarding actual to date and expected performance, and |
– | focusing on the Company’s assessment of contract performance risks included within the estimated costs to complete. |
Evaluation over the Measurement of the Pension Projected Benefit Obligation
As discussed in Note R to the Consolidated Financial Statements, the Company’s estimated pension projected benefit obligation and the associated plan assets were $18.1 billion and $13.2 billion, respectively, on December 31, 2019. These balances resulted in a net liability of $4.9 billion. The pension projected benefit obligation is the present value of future pension benefits attributed to employee services rendered to date, including assumptions about future compensation levels.
104
We identified the evaluation over the measurement of the pension projected benefit obligation to be a critical audit matter. This is due to the specialized skills required to assess the Company’s actuarial models and the key assumptions, including the interest rates used to discount estimated future liabilities, salary increases, and retirement and mortality rates. In addition, the actuarial models were sensitive to changes in the key assumptions.
The primary procedures we performed to address this critical audit matter included the following. We tested certain internal controls over the Company’s pension projected benefit obligation estimation process, including controls related to the determination and use of the actuarial models and the key assumptions. We involved an actuarial professional with specialized skills and knowledge, who assisted in the assessment of certain actuarial models used by the Company for consistency with generally accepted actuarial standards. In addition, the actuarial professional assisted in the evaluation of the Company’s analysis of the key assumptions. This was done by comparing the key assumptions to amounts independently developed using publicly available market data and historical experience.
We have served as the Company’s auditor since 2002.
 | ||
McLean, Virginia
February 10, 2020
105
SUPPLEMENTARY DATA (UNAUDITED)
(Dollars in millions, except per-share amounts) | 2018 | 2019 | |||||||||||||||||||||||||||||
1Q | 2Q | 3Q | 4Q | 1Q | 2Q | 3Q | 4Q | ||||||||||||||||||||||||
Revenue | $ | 7,535 | $ | 9,186 | $ | 9,094 | $ | 10,378 | $ | 9,261 | $ | 9,555 | $ | 9,761 | $ | 10,773 | |||||||||||||||
Operating earnings | 1,008 | 1,088 | 1,135 | 1,226 | 1,014 | 1,090 | 1,216 | 1,328 | |||||||||||||||||||||||
Earnings from continuing operations | 799 | 786 | 864 | 909 | 745 | 806 | 913 | 1,020 | |||||||||||||||||||||||
Discontinued operations, net of tax | — | — | (13 | ) | — | — | — | — | — | ||||||||||||||||||||||
Net earnings | $ | 799 | $ | 786 | $ | 851 | $ | 909 | $ | 745 | $ | 806 | $ | 913 | $ | 1,020 | |||||||||||||||
Earnings per share - basic*: | |||||||||||||||||||||||||||||||
Continuing operations | $ | 2.70 | $ | 2.65 | $ | 2.92 | $ | 3.10 | $ | 2.59 | $ | 2.80 | $ | 3.17 | $ | 3.53 | |||||||||||||||
Discontinued operations | — | — | (0.04 | ) | — | — | — | — | — | ||||||||||||||||||||||
Net earnings | $ | 2.70 | $ | 2.65 | $ | 2.88 | $ | 3.10 | $ | 2.59 | $ | 2.80 | $ | 3.17 | $ | 3.53 | |||||||||||||||
Earnings per share - diluted*: | |||||||||||||||||||||||||||||||
Continuing operations | $ | 2.65 | $ | 2.62 | $ | 2.89 | $ | 3.07 | $ | 2.56 | $ | 2.77 | $ | 3.14 | $ | 3.51 | |||||||||||||||
Discontinued operations | — | — | (0.04 | ) | — | — | — | — | — | ||||||||||||||||||||||
Net earnings | $ | 2.65 | $ | 2.62 | $ | 2.85 | $ | 3.07 | $ | 2.56 | $ | 2.77 | $ | 3.14 | $ | 3.51 | |||||||||||||||
Quarterly data are based on a 13-week period. Because our fiscal year ends on December 31, the number of days in our first and fourth quarters varies slightly from year to year.
* The sum of the basic and diluted earnings per share for the four quarters of the year may differ from the annual basic and diluted earnings per share due to the required method of computing the weighted average number of shares in interim periods.
ITEM 9. CHANGES IN AND DISAGREEMENTS WITH ACCOUNTANTS ON ACCOUNTING AND FINANCIAL DISCLOSURE
None.
ITEM 9A. CONTROLS AND PROCEDURES
EVALUATION OF DISCLOSURE CONTROLS AND PROCEDURES
Our management, under the supervision and with the participation of the Chief Executive Officer and the Chief Financial Officer, evaluated the effectiveness of our disclosure controls and procedures as of December 31, 2019, (as defined in Rule 13a-15(e) and Rule 15d-15(e) under the Securities Exchange Act of 1934, as amended). Based on this evaluation, the Chief Executive Officer and Chief Financial Officer concluded that, on December 31, 2019, our disclosure controls and procedures were effective.
The certifications of the company’s Chief Executive Officer and Chief Financial Officer required under Section 302 of the Sarbanes-Oxley Act have been filed as Exhibits 31.1 and 31.2 to this report.
106
MANAGEMENT’S REPORT ON INTERNAL CONTROL OVER FINANCIAL REPORTING
To the Shareholders of General Dynamics Corporation:
The management of General Dynamics Corporation is responsible for establishing and maintaining adequate internal control over financial reporting and for its assessment of the effectiveness of internal control over financial reporting as defined in Rules 13a-15(f) and 15d-15(f) under the Exchange Act. Our internal control system was designed to provide reasonable assurance to our management and board of directors regarding the preparation and fair presentation of published financial statements.
Because of its inherent limitations, internal control over financial reporting may not prevent or detect misstatements. Also, projections of any evaluation of effectiveness to future periods are subject to the risk that controls may become inadequate because of changes in conditions, or that the degree of compliance with the policies or procedures may deteriorate.
Our management evaluated the effectiveness of our internal control over financial reporting as of December 31, 2019. In making this evaluation, we used the criteria set forth by the Committee of Sponsoring Organizations of the Treadway Commission in Internal Control – Integrated Framework (2013). Based on our evaluation we believe that, as of December 31, 2019, our internal control over financial reporting is effective based on those criteria.
KPMG LLP has issued an audit report on the effectiveness of our internal control over financial reporting. The KPMG report immediately follows this report.
 |  | |||
Phebe N. Novakovic | Jason W. Aiken | |||
Chairman and Chief Executive Officer | Senior Vice President and Chief Financial Officer | |||
107
REPORT OF INDEPENDENT REGISTERED PUBLIC ACCOUNTING FIRM
To the Board of Directors and Shareholders of General Dynamics Corporation:
Opinion on Internal Control Over Financial Reporting
We have audited General Dynamics Corporation and subsidiaries’ (the Company) internal control over financial reporting as of December 31, 2019, based on criteria established in Internal Control – Integrated Framework (2013) issued by the Committee of Sponsoring Organizations of the Treadway Commission. In our opinion, the Company maintained, in all material respects, effective internal control over financial reporting as of December 31, 2019, based on criteria established in Internal Control – Integrated Framework (2013) issued by the Committee of Sponsoring Organizations of the Treadway Commission.
We also have audited, in accordance with the standards of the Public Company Accounting Oversight Board (United States) (PCAOB), the Consolidated Balance Sheet of the Company as of December 31, 2019 and 2018, the related Consolidated Statements of Earnings, Comprehensive Income, Cash Flows, and Shareholders’ Equity for each of the years in the three-year period ended December 31, 2019, and the related notes (collectively, the Consolidated Financial Statements), and our report dated February 10, 2020, expressed an unqualified opinion on those Consolidated Financial Statements.
Basis for Opinion
The Company’s management is responsible for maintaining effective internal control over financial reporting and for its assessment of the effectiveness of internal control over financial reporting, included in the accompanying Management’s Report on Internal Control over Financial Reporting. Our responsibility is to express an opinion on the Company’s internal control over financial reporting based on our audit. We are a public accounting firm registered with the PCAOB and are required to be independent with respect to the Company in accordance with the U.S. federal securities laws and the applicable rules and regulations of the Securities and Exchange Commission and the PCAOB.
We conducted our audit in accordance with the standards of the PCAOB. Those standards require that we plan and perform the audit to obtain reasonable assurance about whether effective internal control over financial reporting was maintained in all material respects. Our audit of internal control over financial reporting included obtaining an understanding of internal control over financial reporting, assessing the risk that a material weakness exists, and testing and evaluating the design and operating effectiveness of internal control based on the assessed risk. Our audit also included performing such other procedures as we considered necessary in the circumstances. We believe that our audit provides a reasonable basis for our opinion.
Definition and Limitations of Internal Control Over Financial Reporting
A company’s internal control over financial reporting is a process designed to provide reasonable assurance regarding the reliability of financial reporting and the preparation of financial statements for external purposes in accordance with generally accepted accounting principles. A company’s internal control over financial reporting includes those policies and procedures that (1) pertain to the maintenance of records that, in reasonable detail, accurately and fairly reflect the transactions and dispositions of the assets of the company; (2) provide reasonable assurance that transactions are recorded as necessary to permit preparation of financial statements in accordance with generally accepted accounting principles, and that receipts and expenditures of the company are being made only in accordance with authorizations of management and directors of the company; and (3) provide reasonable assurance regarding prevention or timely detection
108
of unauthorized acquisition, use, or disposition of the company’s assets that could have a material effect on the financial statements.
Because of its inherent limitations, internal control over financial reporting may not prevent or detect misstatements. Also, projections of any evaluation of effectiveness to future periods are subject to the risk that controls may become inadequate because of changes in conditions, or that the degree of compliance with the policies or procedures may deteriorate.
| ||
McLean, Virginia | ||
February 10, 2020 | ||
CHANGES IN INTERNAL CONTROL OVER FINANCIAL REPORTING
There were no changes in our internal control over financial reporting that occurred during the quarter ended December 31, 2019, that have materially affected, or are reasonably likely to materially affect, our internal control over financial reporting.
ITEM 9B. OTHER INFORMATION
None.
PART III
ITEM 10. DIRECTORS, EXECUTIVE OFFICERS AND CORPORATE GOVERNANCE
The information required to be set forth herein, except for the information included under Information About Our Executive Officers in Part I, is included in the sections entitled “Election of the Board of Directors of the Company,” “Governance of the Company – Our Culture of Ethics,” “Audit Committee Report” and, if included, “Other Information – Delinquent Section 16(a) Reports” in our definitive proxy statement for our 2020 annual shareholders meeting (the Proxy Statement), which sections are incorporated herein by reference.
ITEM 11. EXECUTIVE COMPENSATION
The information required to be set forth herein is included in the sections entitled “Governance of the Company – Director Compensation,” “Compensation Discussion and Analysis,” “Executive Compensation” and “Compensation Committee Report” in our Proxy Statement, which sections are incorporated herein by reference.
ITEM 12. SECURITY OWNERSHIP OF CERTAIN BENEFICIAL OWNERS AND MANAGEMENT AND RELATED STOCKHOLDER MATTERS
The information required to be set forth herein is included in the sections entitled “Security Ownership of Management” and “Security Ownership of Certain Beneficial Owners” in our Proxy Statement, which sections are incorporated herein by reference.
109
The information required to be set forth herein with respect to securities authorized for issuance under our equity compensation plans is included in the section entitled “Equity Compensation Plan Information” in our Proxy Statement, which section is incorporated herein by reference.
ITEM 13. CERTAIN RELATIONSHIPS AND RELATED TRANSACTIONS, AND DIRECTOR INDEPENDENCE
The information required to be set forth herein is included in the sections entitled “Governance of the Company – Related Person Transactions Policy” and “Governance of the Company – Director Independence” in our Proxy Statement, which sections are incorporated herein by reference.
ITEM 14. PRINCIPAL ACCOUNTANT FEES AND SERVICES
The information required to be set forth herein is included in the section entitled “Selection of Independent Auditors – Audit and Non-Audit Fees” in our Proxy Statement, which section is incorporated herein by reference.
PART IV
ITEM 15. EXHIBITS
1. | Consolidated Financial Statements |
Consolidated Statement of Earnings |
Consolidated Statement of Comprehensive Income |
Consolidated Balance Sheet |
Consolidated Statement of Cash Flows |
Consolidated Statement of Shareholders’ Equity |
Notes to Consolidated Financial Statements (A to T) |
2. | Index to Exhibits - General Dynamics Corporation |
Commission File No. 1-3671
Exhibits listed below, which have been filed with the Commission pursuant to the Securities Act of 1933, as amended, or the Securities Exchange Act of 1934, as amended, and which were filed as noted below, are hereby incorporated by reference and made a part of this report with the same effect as if filed herewith.
110
3.2 | |
4.1 | |
4.2 | |
4.3 | |
4.4 | |
4.5 | |
4.6 | |
4.7 | |
4.8 | |
4.9 | |
10.1* | |
10.2* | |
10.3* | |
111
10.4* | |
10.5* | |
10.6* | |
10.7* | |
10.8* | |
10.9* | |
10.10* | |
10.11* | |
112
10.12* | |
10.13* | |
10.14* | |
10.15* | |
10.16* | |
10.17* | |
10.18* | |
10.19* | |
10.20* | |
10.21* | |
21 | |
23 | |
24 | |
31.1 | |
31.2 | |
32.1 | |
113
32.2 | |
101.INS | Inline eXtensible Business Reporting Language (XBRL) Instance Document – the instance document does not appear in the Interactive Data File because its XBRL tags are embedded within the Inline XBRL document. |
101.SCH | Inline XBRL Taxonomy Extension Schema Document** |
101.CAL | Inline XBRL Taxonomy Extension Calculation Linkbase Document** |
101.DEF | Inline XBRL Taxonomy Extension Definition Linkbase Document** |
101.LAB | Inline XBRL Taxonomy Extension Label Linkbase Document** |
101.PRE | Inline XBRL Taxonomy Extension Presentation Linkbase Document** |
104 | Cover Page Interactive Data File (embedded within the Inline XBRL document and contained in Exhibit 101) |
* Indicates a management contract or compensatory plan or arrangement required to be filed pursuant to Item 15(b) of Form 10-K.
** Filed or furnished herewith.
In accordance with Item 601(b)(4)(iii)(A) of Regulation S-K, copies of certain instruments defining the rights of holders of long-term debt of the company are not filed herewith. Pursuant to this regulation, we hereby agree to furnish a copy of any such instrument to the SEC upon request.
ITEM 16. FORM 10-K SUMMARY
None.
114
SIGNATURES
Pursuant to the requirements of the Securities Exchange Act of 1934, the Registrant has duly caused this report to be signed on its behalf by the undersigned thereunto duly authorized.
GENERAL DYNAMICS CORPORATION | ||
by |  | |
William A. Moss | ||
Vice President and Controller | ||
Dated: February 10, 2020 | ||
Pursuant to the requirements of the Securities Exchange Act of 1934, this report has been signed below on February 10, 2020, by the following persons on behalf of the Registrant and in the capacities indicated, including a majority of the directors.
115
| Chairman, Chief Executive Officer and Director |
Phebe N. Novakovic | (Principal Executive Officer) |
| Senior Vice President and Chief Financial Officer |
Jason W. Aiken | (Principal Financial Officer) |
| Vice President and Controller |
William A. Moss | (Principal Accounting Officer) |
* | |
James S. Crown | Director |
* | |
Rudy F. deLeon | Director |
* | |
Cecil D. Haney | Director |
* | |
Lester L. Lyles | Director |
* | |
Mark M. Malcolm | Director |
* | |
James N. Mattis | Director |
* | |
C. Howard Nye | Director |
* | |
William A. Osborn | Director |
* | |
Catherine B. Reynolds | Director |
* | |
Laura J. Schumacher | Director |
* | |
John G. Stratton | Director |
* | |
Peter A. Wall | Director |
* By Gregory S. Gallopoulos pursuant to a Power of Attorney executed by the directors listed above, which Power of Attorney has been filed as an exhibit hereto and incorporated herein by reference thereto.
 | |||
Gregory S. Gallopoulos | |||
Senior Vice President, General Counsel and Secretary | |||
116