Exhibit 99.1

News Release
Independent Bank Corporation
4200 East Beltline
Grand Rapids, MI 49525
616.527.5820
|
For Release:
|
Immediately
|
|
Contact:
|
William B. Kessel, President and CEO, 616.447.3933
|
Gavin A. Mohr, Chief Financial Officer, 616.447.3929
INDEPENDENT BANK CORPORATION REPORTS
2021 SECOND QUARTER RESULTS
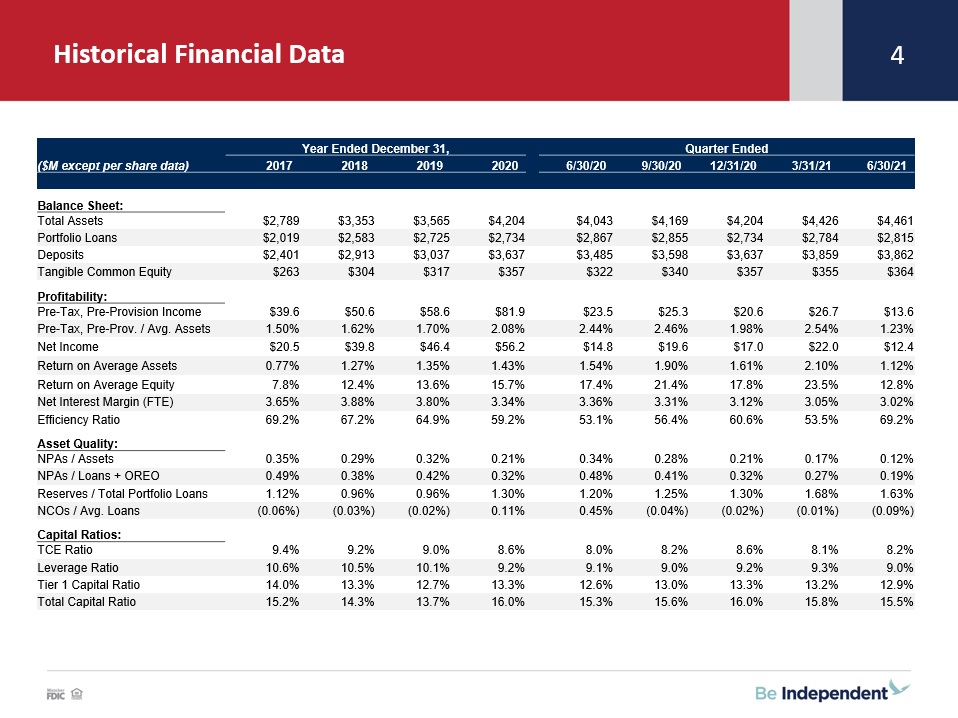
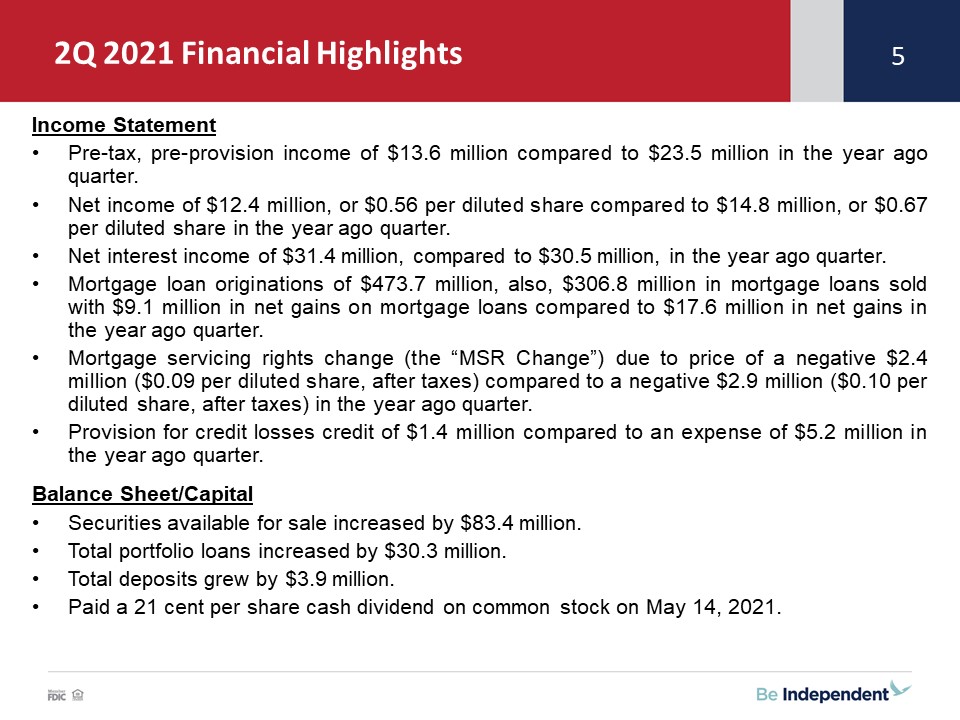
GRAND RAPIDS, Mich., July 29, 2021 - Independent Bank Corporation (NASDAQ: IBCP) reported second quarter 2021 net income of $12.4 million, or $0.56 per diluted share, versus net income of $14.8 million, or $0.67 per
diluted share, in the prior-year period. For the six months ended June 30, 2021, the Company reported net income of $34.4 million, or $1.56 per diluted share, compared to net income of $19.6 million, or $0.88 per diluted share, in the prior-year
period. The decline in second quarter 2021 earnings as compared to 2020 primarily reflects a decrease in non-interest income and an increase in non-interest expense that were partially offset by an increase in net interest income and decreases in
the provision for credit losses and income tax expense. The increase in year-to-date 2021 earnings as compared to 2020 primarily reflects increases in net interest income and non-interest income and a decrease in the provision for credit losses
that were partially offset by increases in non-interest expense and income tax expense.
Highlights for the second quarter of 2021 include:
| • |
Annualized return on average assets and on average equity of 1.12% and 12.78%, respectively;
|
| • |
An increase in net interest income of 3.1% over the second quarter of 2020;
|
| • |
Net gains on mortgage loans of $9.1 million and total mortgage loan origination volume of $473.7 million;
|
| • |
Net growth in portfolio loans of $30.3 million (or 4.4% annualized);
|
| • |
Continued strong asset quality metrics as evidenced by net loan recoveries during the quarter as well as a low level of non-performing loans and non-performing assets; and
|
| • |
The payment of a 21 cent per share dividend on common stock on May 14, 2021.
|
Highlights for the first six months of 2021 include:
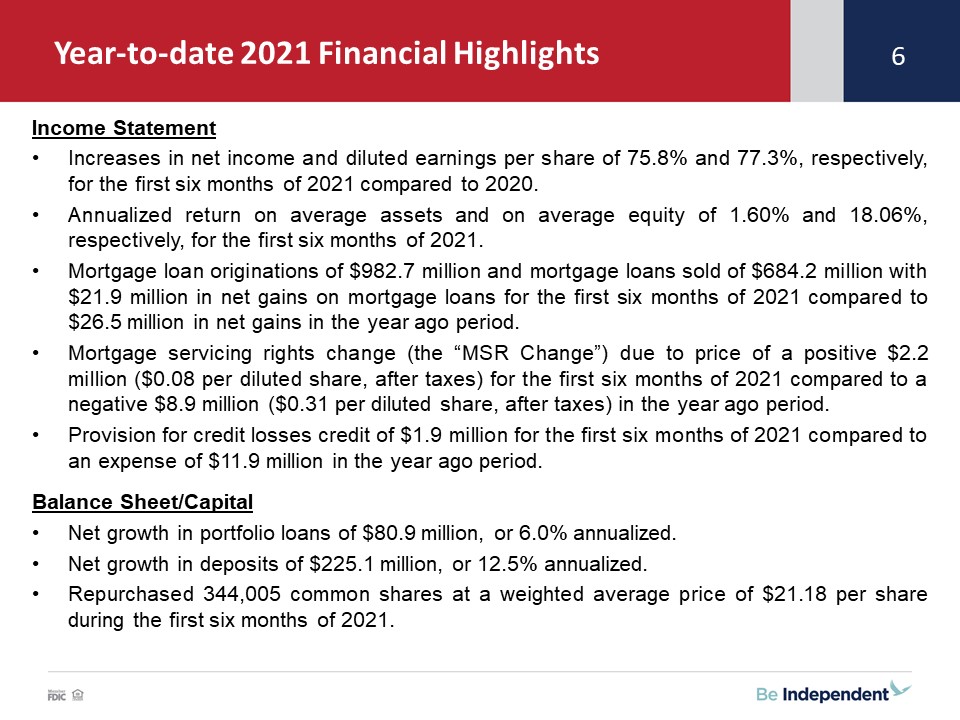
| • |
Increases in net income and diluted earnings per share of 75.8% and 77.3%, respectively;
|
| • |
Annualized return on average assets and on average equity of 1.60% and 18.06%, respectively;
|
| • |
Net gains on mortgage loans of $21.9 million and total mortgage loan origination volume of $982.7 million;
|
| • |
Net growth in portfolio loans of $80.9 million (or 6.0% annualized);
|
| • |
Net growth in deposits of $225.1 million (or 12.5% annualized).
|
1
Significant items impacting comparable quarterly and year to date 2021 and 2020 results include the following:
| • |
Changes in the fair value due to price of capitalized mortgage loan servicing rights (the “MSR Changes”) of a negative $2.4 million ($0.09 per diluted share, after taxes) and a
positive $2.2 million ($0.08 per diluted share, after taxes) for the three- and six-months ended June 30, 2021, respectively, as compared to a negative $2.9 million ($0.10 per diluted share, after taxes) and a negative $8.9 million ($0.31 per
diluted share, after taxes) for the three- and six-months ended June 30, 2020, respectively.
|
William B. (“Brad”) Kessel, the President and Chief Executive Officer of Independent Bank Corporation, commented: “We are pleased to report a solid
financial performance for the second quarter and first six months of 2021. Economic activity and business conditions have improved in our markets. Earning asset growth, including portfolio loans, has resulted in an increase in net interest income
in 2021 compared to the year ago period. Mortgage loan origination activity continues to be strong. Asset quality metrics have been exceptional in 2021. Our ratio of non-performing assets to total assets declined to 0.12% at June 30, 2021, and COVID
related loan forbearance balances decreased by 40.5% during the first six months of 2021, which represents only 0.5% of our total loans at June 30, 2021.”
Kessel added: “During the second quarter of 2021, we also completed our conversion to a new modern core platform with flexible application processing interfaces (APIs).
This change now allows faster integration with new technology, real-time processing capabilities, and better access to our data and decision management using that data. Initial feedback from our customer base includes much excitement about ONE
Wallet, our new mobile and online platform for consumer and business clients. This platform provides customers with the ability to open new accounts and apply for loans online, along with enhanced transfer, bill pay, and self-service capabilities.
In addition, ONE Wallet+ enables our customers to monitor all of their finances in one location and provides budgeting and spending analytical tools. ONE Wallet+ has experienced a very strong adoption rate.”
Kessel concluded: “As we look
ahead to the balance of 2021 and beyond, we are mindful that although economic conditions have improved, challenges from the pandemic remain. However, we are confident of our continued ability to effectively respond to these challenges and remain
optimistic about our future.”
Operating Results
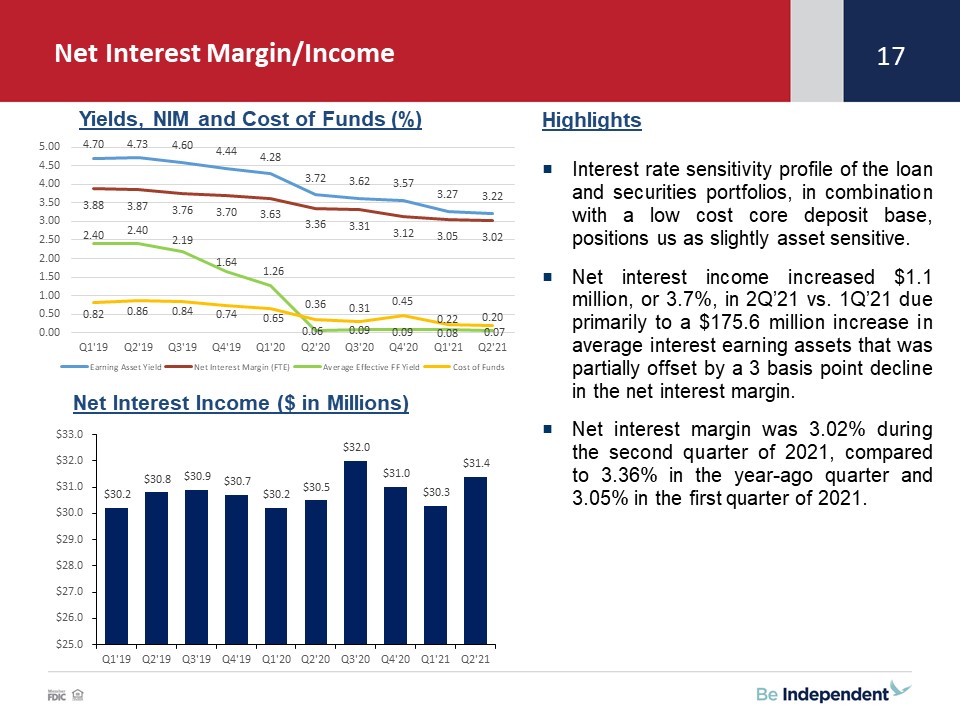
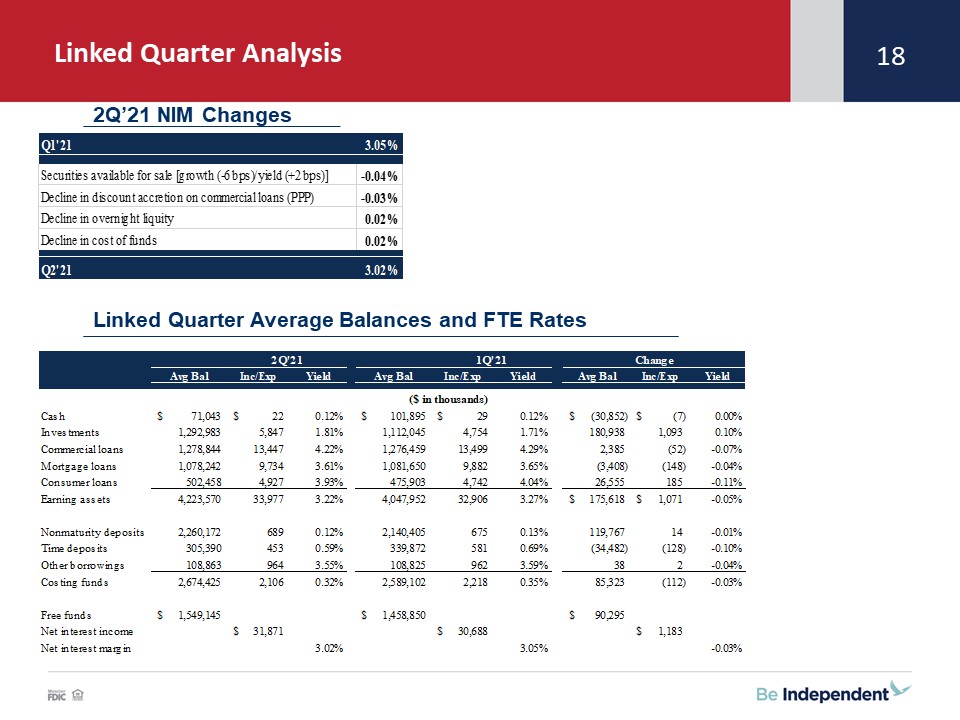
The Company’s net interest income totaled $31.4 million during the second quarter of 2021, an increase of $0.9 million, or 3.1% from the year-ago period, and up $1.1
million, or 3.7%, from the first quarter of 2021. The Company’s tax equivalent net interest income as a percent of average interest-earning assets (the “net interest margin”) was 3.02% during the second quarter of 2021, compared to 3.36% in the
year-ago period, and 3.05% in the first quarter of 2021. The year-over-year quarterly increase in net interest income was due to an increase in average interest-earning assets that was partially offset by a decline in the net interest margin.
Average interest-earning assets were $4.22 billion in the second quarter of 2021, compared to $3.66 billion in the year ago quarter and $4.05 billion in the first quarter of 2021.
For the first six months of 2021, net interest income totaled $61.7 million, an increase of $1.0 million, or 1.7% from the first half of 2020. The Company’s net
interest margin for the first six months of 2021 was 3.04% compared to 3.49% in 2020. The increase in net interest income for the first six months of 2021 compared to 2020 was also due to an increase in average interest-earning assets that was
partially offset by a decline in the net interest margin.
Due principally to the economic impact of COVID-19, the Federal Reserve has taken a variety of actions to stimulate the economy, including significantly lowering
short-term interest rates. These lower interest rates combined with a higher allocation to lower yielding securities available for sale has placed continued pressure on the Company’s net interest margin.
2
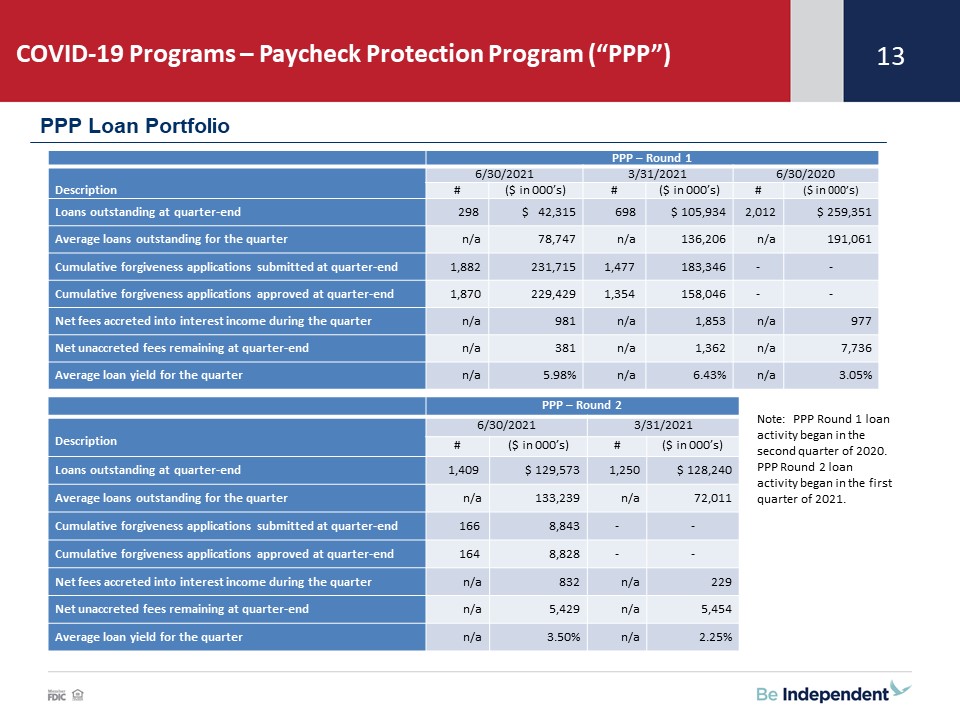
In addition, commercial loan balances, interest income and yields have been impacted by Paycheck Protection Program (“PPP”) lending activity. PPP lending activity is
summarized in the following tables:
|
PPP – Round 1
|
||||||||||||||||||||||||
|
At or for the three months ended
|
6/30/2021
|
3/31/2021
|
6/30/2020
|
|||||||||||||||||||||
|
#
|
(000’s)
|
|
#
|
(000’s)
|
#
|
(000’s)
|
||||||||||||||||||
|
Loans outstanding at period end
|
298
|
$
|
42,315
|
698
|
$
|
105,934
|
2,012
|
$
|
259,351
|
|||||||||||||||
|
Average loans outstanding
|
-
|
78,747
|
-
|
136,206
|
-
|
191,061
|
||||||||||||||||||
|
Cumulative forgiveness applications submitted
|
1,882
|
231,715
|
1,477
|
183,346
|
-
|
-
|
||||||||||||||||||
|
Cumulative forgiveness applications approved
|
1,870
|
229,429
|
1,354
|
158,046
|
-
|
-
|
||||||||||||||||||
|
Net fees accreted into interest income
|
-
|
981
|
-
|
1,853
|
-
|
977
|
||||||||||||||||||
|
Net unaccreted fees at period end
|
-
|
381
|
-
|
1,362
|
-
|
7,736
|
||||||||||||||||||
|
Average loan yield
|
-
|
5.98
|
%
|
-
|
6.43
|
%
|
-
|
3.05
|
%
|
|||||||||||||||
Note: PPP – Round 1 loan activity began in the second quarter of 2020.
|
PPP – Round 2
|
||||||||||||||||
|
At or for the three months ended
|
6/30/2021
|
3/31/2021
|
||||||||||||||
|
#
|
(000’s)
|
#
|
(000’s)
|
|
||||||||||||
|
Loans outstanding at period end
|
1,409
|
$
|
129,573
|
1,250
|
$
|
128,240
|
||||||||||
|
Average loans outstanding
|
-
|
133,239
|
-
|
72,011
|
||||||||||||
|
Cumulative forgiveness applications submitted
|
166
|
8,843
|
-
|
-
|
||||||||||||
|
Cumulative forgiveness applications approved
|
164
|
8,828
|
-
|
-
|
||||||||||||
|
Net fees accreted into interest income
|
-
|
832
|
-
|
229
|
||||||||||||
|
Net unaccreted fees at period end
|
-
|
5,429
|
-
|
5,454
|
||||||||||||
|
Average loan yield
|
-
|
3.50
|
%
|
-
|
2.25
|
%
|
||||||||||
Note: PPP – Round 2 loan activity began in the first quarter of 2021.
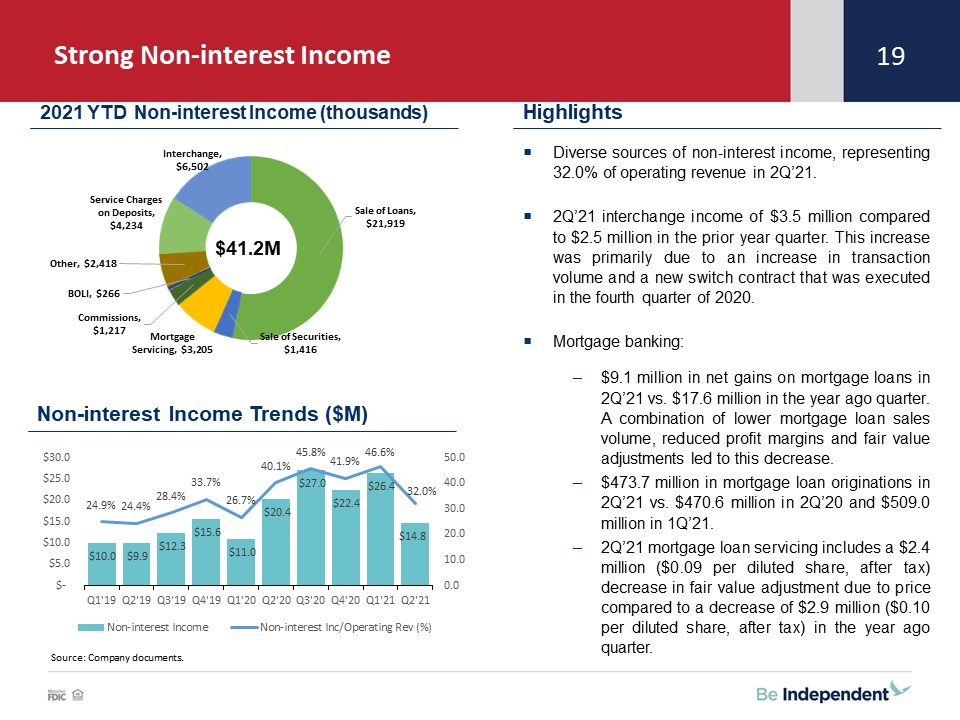
Non-interest income totaled $14.8 million and $41.2 million, respectively, for the second quarter and first six months of 2021, compared to $20.4 million and $31.4
million in the respective comparable year ago periods. These changes were primarily due to variances in mortgage banking related revenues (net gains on mortgage loans and mortgage loan servicing, net).
Net gains on mortgage loans in the second quarters of 2021 and 2020, were approximately $9.1 million and $17.6 million, respectively. For the first six months of 2021,
net gains on mortgage loans totaled $21.9 million compared to $26.5 million in 2020. The decrease in net gains on mortgage loans was primarily due to a decline in mortgage loan sales volume in 2021, lower profit margins on mortgage loan sales, and
fair value adjustments on the mortgage loan pipeline.
Mortgage loan servicing, net, generated a loss of $2.0 million and a loss of $3.0 million in the second quarters of 2021 and 2020, respectively. For the first six months
of 2021 and 2020, mortgage loan servicing, net, generated income of $3.2 million and a loss of $8.3 million, respectively. The significant variances in mortgage loan servicing, net are primarily due to changes in the fair value of capitalized
mortgage loan servicing rights associated with changes in mortgage loan interest rates and expected future prepayment levels. Mortgage loan servicing, net activity is summarized in the following table:
|
Three Months Ended
|
Six Months Ended
|
|||||||||||||||
|
6/30/2021
|
6/30/2020
|
6/30/2021
|
6/30/2020
|
|||||||||||||
|
Mortgage loan servicing, net:
|
(Dollars in thousands)
|
|||||||||||||||
|
Revenue, net
|
$
|
1,876
|
$
|
1,646
|
$
|
3,786
|
$
|
3,319
|
||||||||
|
Fair value change due to price
|
(2,426
|
)
|
(2,921
|
)
|
2,214
|
(8,852
|
)
|
|||||||||
|
Fair value change due to pay-downs
|
(1,412
|
)
|
(1,747
|
)
|
(2,795
|
)
|
(2,789
|
)
|
||||||||
|
Total
|
$
|
(1,962
|
)
|
$
|
(3,022
|
)
|
$
|
3,205
|
$
|
(8,322
|
)
|
|||||
Net gain on securities available for sale totaled zero and $1.4 million in second quarter and first six months of 2021, respectively, compared to zero and $0.3 million
in the prior year second quarter and first six months, respectively. The increased gain that occurred in the first quarter of 2021 was related to the divestiture of a group of mortgage backed securities.
3
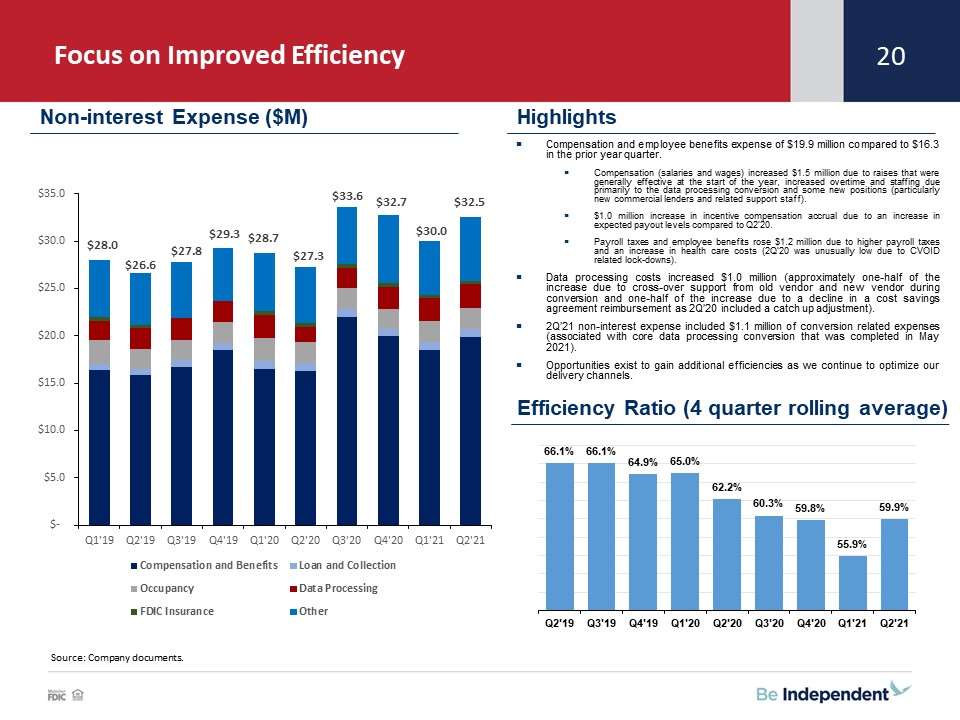
Non-interest expenses totaled $32.5 million in the second quarter of 2021, compared to $27.3 million in the year-ago period. For the first six months of 2021,
non-interest expenses totaled $62.6 million versus $56.1 million in 2020. These year-over-year increases in non-interest expense are primarily due to increases in compensation and employee benefits, data processing, interchange and conversion
related expenses. The increase in compensation and employee benefits in 2021 is due to several factors, including, wage increases that were generally effective at the start of the year, increased overtime primarily associated with a data processing
conversion, a higher accrual for incentive compensation (due to expected actual performance compared to targets), higher payroll taxes due to the increase in compensation and higher health care insurance costs (these costs during the first six months
of 2020 were unusually low due to the various COVID related lock-downs). In addition, the second quarter and first six months of 2021 included $1.1 million and $1.4 million, respectively, of expenses related to the Company’s core data processing
conversion (this conversion was completed in May 2021) compared to $0.3 million and $0.4 million, respectively, in the comparable periods in 2020. The second quarter and first six months of 2020 also included $0.4 million of expenses (primarily
write-downs of fixed assets and leases) related to the closures of six bank branch offices that were completed in the third quarter of 2020.
The Company recorded an income tax expense of $2.7 million and $7.8 million in the second quarter and first six months of 2021, respectively. This compares to an income
tax expense of $3.5 million and $4.5 million in the second quarter and first six months of 2020, respectively. The changes in income tax expense principally reflect changes in pre-tax earnings in 2021 relative to 2020.
Asset Quality
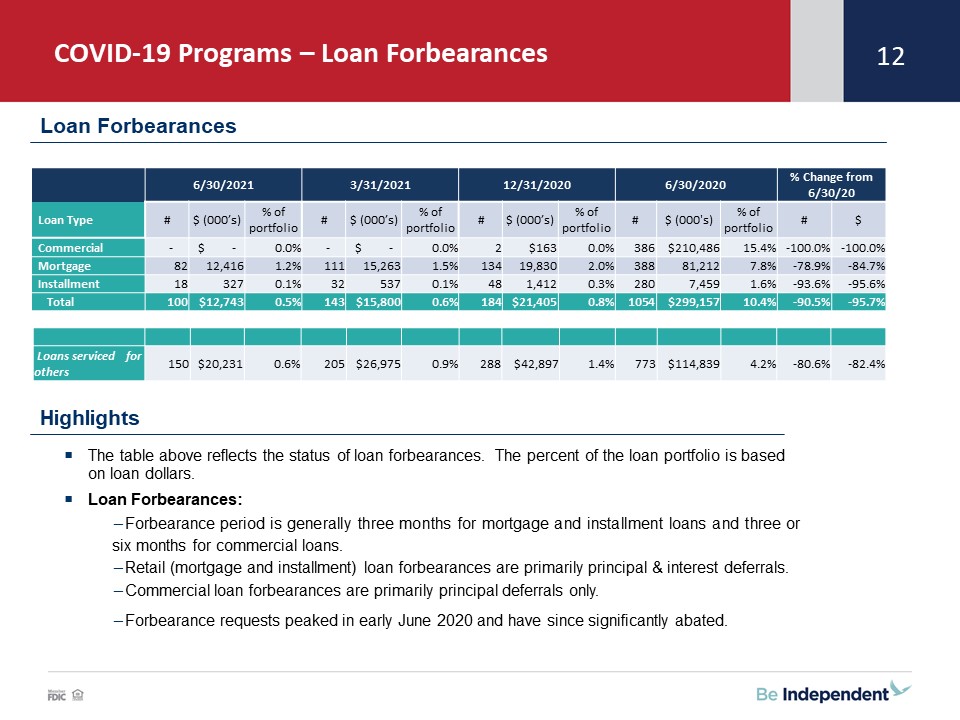
A breakdown of loan forbearance totals by loan type is as follows:
|
6/30/2021
|
3/31/2021
|
% change vs. prior quarter
|
||||||||||||||||||||||||||||||
|
Loan Type
|
#
|
$ (000’s)
|
% of
portfolio
|
#
|
$ (000’s)
|
% of
portfolio
|
#
|
$ | ||||||||||||||||||||||||
|
Commercial
|
-
|
$
|
-
|
0.0
|
%
|
-
|
$
|
-
|
0.0
|
%
|
none
|
none
|
||||||||||||||||||||
|
Mortgage
|
82
|
12,416
|
1.2
|
%
|
111
|
15,263
|
1.5
|
%
|
(26.1
|
)%
|
(18.7
|
)%
|
||||||||||||||||||||
|
Installment
|
18
|
327
|
0.1
|
%
|
32
|
537
|
0.1
|
%
|
(43.8
|
)%
|
(39.1
|
)%
|
||||||||||||||||||||
|
Total
|
100
|
$
|
12,743
|
0.5
|
%
|
143
|
$
|
15,800
|
0.6
|
%
|
(30.1
|
)%
|
(19.3
|
)%
|
||||||||||||||||||
|
Loans serviced for others
|
150
|
$
|
20,231
|
0.6
|
%
|
205
|
$
|
26,975
|
0.9
|
%
|
(26.8
|
)%
|
(25.0
|
)%
|
||||||||||||||||||
Note: The % of portfolio is based on the dollar amount of forbearances to the total for the loan portfolio segment.
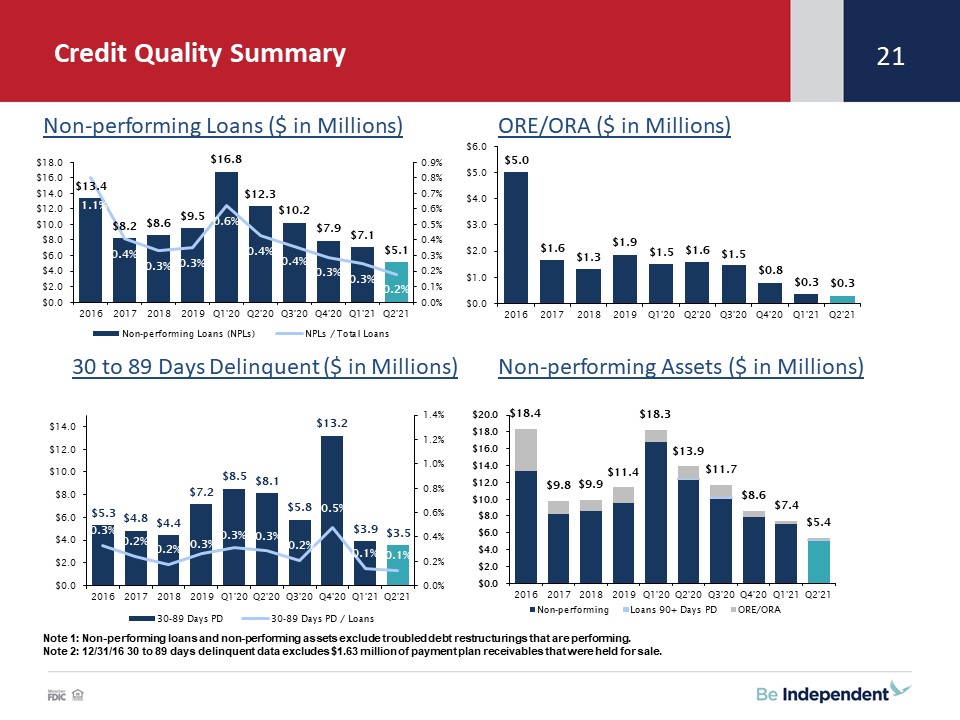
A breakdown of non-performing loans(1) by loan type is as follows:
|
Loan Type
|
6/30/2021
|
12/31/2020
|
6/30/2020
|
|||||||||
|
(Dollars in thousands)
|
||||||||||||
|
Commercial
|
$
|
242
|
$
|
1,440
|
$
|
4,886
|
||||||
|
Mortgage
|
4,941
|
6,353
|
7,455
|
|||||||||
|
Installment
|
362
|
519
|
602
|
|||||||||
|
Subtotal
|
5,545
|
8,312
|
12,943
|
|||||||||
|
Less – government guaranteed loans
|
427
|
439
|
604
|
|||||||||
|
Total non-performing loans
|
$
|
5,118
|
$
|
7,873
|
$
|
12,339
|
||||||
|
Ratio of non-performing loans to total portfolio loans
|
0.18
|
%
|
0.29
|
%
|
0.43
|
%
|
||||||
|
Ratio of non-performing assets to total assets
|
0.12
|
%
|
0.21
|
%
|
0.34
|
%
|
||||||
|
Ratio of the allowance for credit losses to non-performing loans
|
897.34
|
%
|
450.01
|
%
|
279.60
|
%
|
||||||
| (1) |
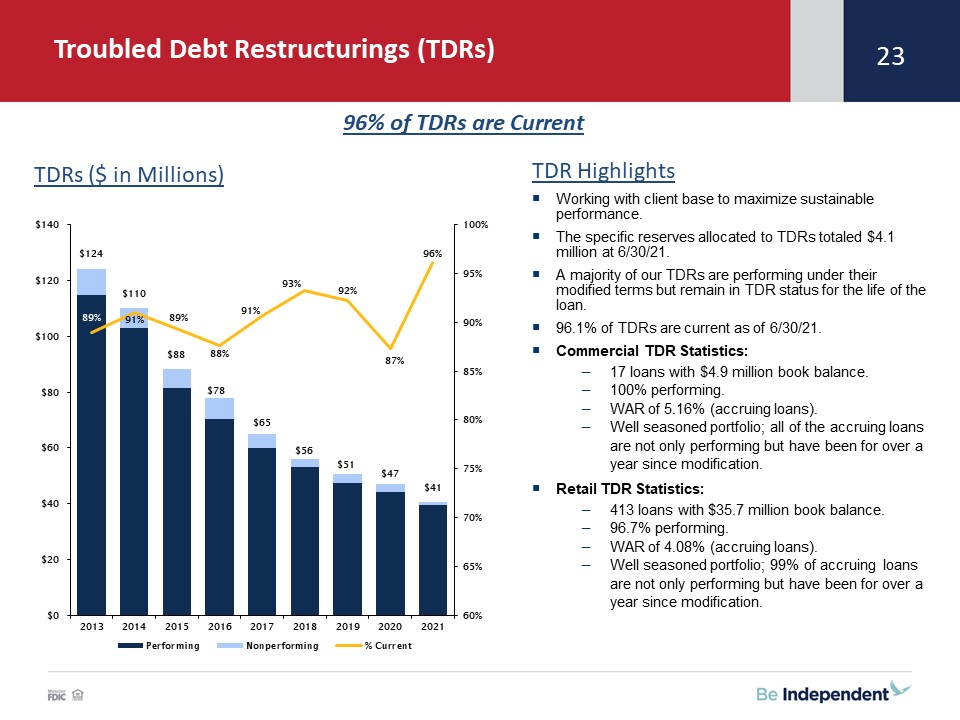
Excludes loans that are classified as “troubled debt restructured” that are still performing.
|
Non-performing loans decreased $2.8 million from December 31, 2020, as all loan categories have declined, reflecting improving economic conditions and the Company’s
collection efforts.
4
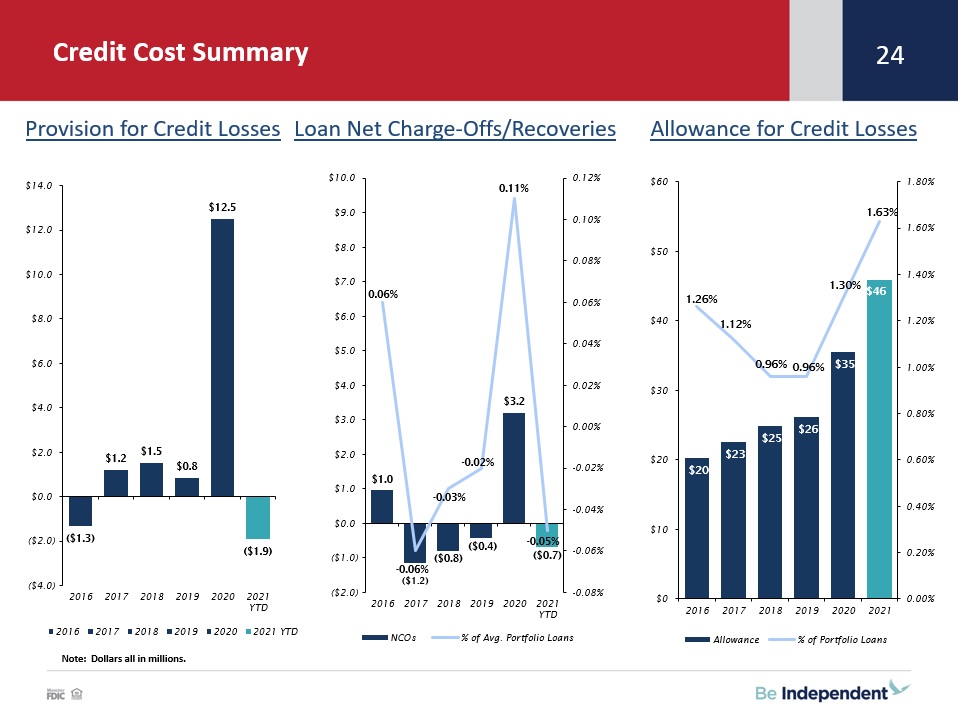
The provision for credit losses was a credit of $1.4 million and an expense of $5.2 million in the second quarters of 2021 and 2020, respectively. The provision for
credit losses was a credit of $1.9 million and an expense of $11.9 million in the first six months of 2021 and 2020, respectively. The quarterly and year-to-date decreases in the provision for credit losses in 2021 compared to 2020, were primarily
the result of a decline in the balance of loans individually evaluated in the allowance for credit losses, slightly lower reserve allocations (reflecting an improvement in economic forecasts, particularly for lower unemployment levels) for pooled
loans evaluated in the allowance for credit losses and a decrease in the adjustment to allocations based on subjective factors. In particular, the higher year-to-date provision for credit losses in 2020 included an $8.7 million (or 98.2%) increase
in the qualitative/subjective portion of the allowance for credit losses. That increase in 2020 principally reflected the unique challenges and prevailing economic uncertainty resulting from the COVID-19 pandemic and the potential impact on the loan
portfolio.
The Company recorded loan net recoveries of $0.6 million and loan net charge-offs of $3.2 million in the second quarters of 2021 and 2020, respectively. For the first
six months of 2021 and 2020, the Company recorded loan net recoveries of $0.7 million and loan net charge-offs of $3.6 million, respectively.
The allowance for credit losses totaled $45.9 million at June 30, 2021 compared to $35.4 million at December 31, 2020. The increase from December 31, 2020 is attributed
to the adoption of Financial Accounting Standards Board Accounting Standards Update 2016-13, Financial Instruments — Credit Losses (Topic 326), Measurement of Credit Losses on Financial Instruments (“CECL”) on January 1, 2021. The impact of the
adoption of CECL was an increase in the allowance for credit losses of $11.7 million. At June 30, 2021, the allowance for credit losses equaled 1.63% of total portfolio loans (1.73% when excluding PPP loans) under CECL, compared to 1.30% of total
portfolio loans (1.38% when excluding PPP loans) at December 31, 2020, under the probable incurred loss methodology.
Balance Sheet, Liquidity and Capital
Total assets were $4.46 billion at June 30, 2021, an increase of $257.3 million from December 31, 2020. Loans, excluding loans held for sale, were $2.81 billion at June
30, 2021, compared to $2.73 billion at December 31, 2020. Deposits totaled $3.86 billion at June 30, 2021, an increase of $225.1 million from December 31, 2020. This increase is primarily due to growth in non-interest bearing, savings and
interest-bearing checking and reciprocal deposit account balances.
Cash and cash equivalents totaled $69.3 million at June 30, 2021, compared to $118.7 million at December 31, 2020. Securities available for sale totaled $1.33 billion at
June 30, 2021, compared to $1.07 billion at December 31, 2020. The significant increase in securities available for sale is due to the deployment of funds generated from the growth in deposits.
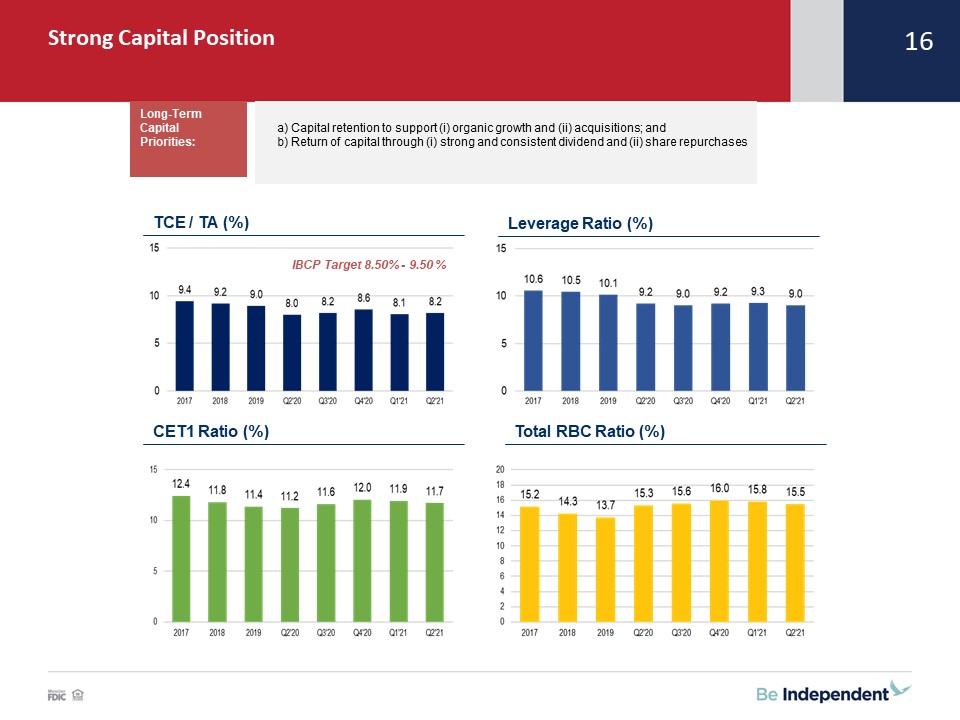
Total shareholders’ equity was $396.0 million at June 30, 2021, or 8.88% of total assets. Tangible common equity totaled $363.9 million at June 30, 2021, or $16.82 per
share. The Company’s wholly owned subsidiary, Independent Bank, remains significantly above “well capitalized” for regulatory purposes with the following ratios:
|
Regulatory Capital Ratios
|
6/30/2021
|
12/31/2020
|
Well
Capitalized
Minimum
|
|||||||||
|
Tier 1 capital to average total assets
|
8.69
|
%
|
8.81
|
%
|
5.00
|
%
|
||||||
|
Tier 1 common equity to risk-weighted assets
|
12.46
|
%
|
12.81
|
%
|
6.50
|
%
|
||||||
|
Tier 1 capital to risk-weighted assets
|
12.46
|
%
|
12.81
|
%
|
8.00
|
%
|
||||||
|
Total capital to risk-weighted assets
|
13.71
|
%
|
14.06
|
%
|
10.00
|
%
|
||||||
Share Repurchase Plan
On December 18, 2020, the Board of Directors of the Company authorized the 2021 share repurchase plan. Under the terms of the 2021 share repurchase plan, the Company is
authorized to purchase up to 1,100,000 shares, or approximately 5% of its outstanding common stock. The repurchase plan is authorized to last through December 31, 2021. For the first six months of 2021, the Company has
repurchased 344,005 shares at a weighted average price of $21.18 per share.
Earnings Conference Call
Brad Kessel, President and CEO and Gavin A. Mohr, CFO will review the quarterly results in a conference call for investors and analysts beginning
at 12:00 pm ET on Thursday, July 29, 2021.
To participate in the live conference call, please dial 1-866-200-8394. Also the conference call will be
accessible through an audio webcast with user-controlled slides via the following site/URL: https://services.choruscall.com/links/ibcp210729.html.
A playback of the call can be accessed by dialing 1-877-344-7529 (Conference ID # 10158604). The replay will be available through August 5, 2021.
5
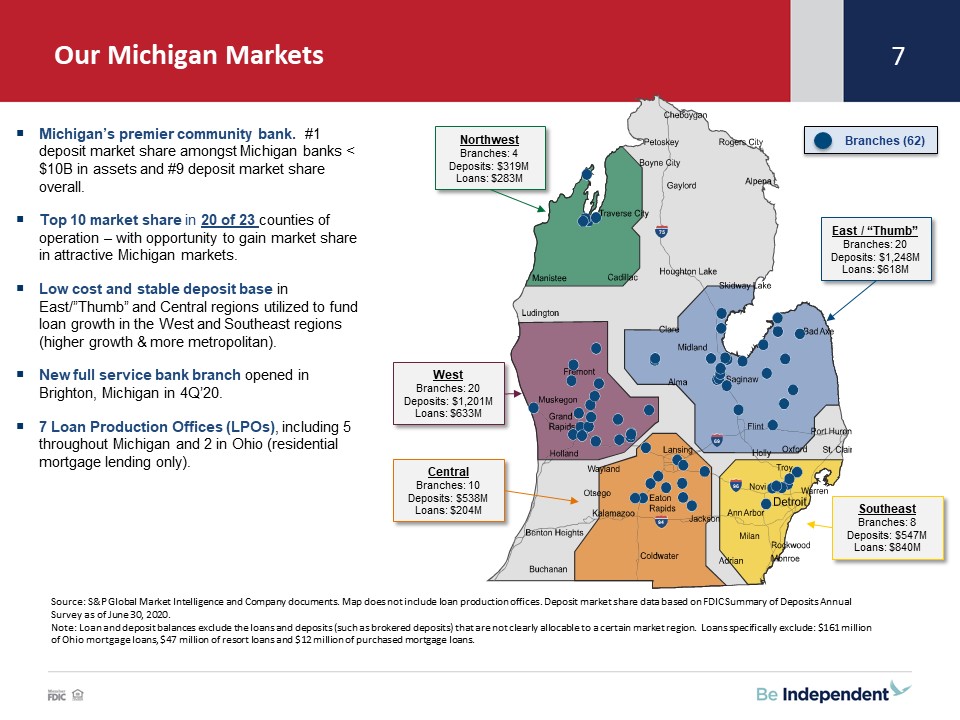
About Independent Bank Corporation
Independent Bank Corporation (NASDAQ: IBCP) is a Michigan-based bank holding company with total assets of approximately $4.5 billion. Founded as First National Bank of
Ionia in 1864, Independent Bank Corporation operates a branch network across Michigan’s Lower Peninsula through one state-chartered bank subsidiary. This subsidiary (Independent Bank) provides a full range of financial services, including commercial
banking, mortgage lending, investments and insurance. Independent Bank Corporation is committed to providing exceptional personal service and value to its customers, stockholders and the communities it serves.
For more information, please visit our Web site at: IndependentBank.com.
Forward-Looking Statements
This press release contains forward-looking statements about Independent Bank Corporation. Statements that are not historical or current facts,
including statements about beliefs and expectations, are forward-looking statements and are based on the information available to, and assumptions and estimates made by, management as of the date hereof. These forward-looking statements cover, among
other things, anticipated future revenue and expenses and the future plans and prospects of Independent Bank Corporation. Forward-looking statements involve inherent risks and uncertainties, and important factors could cause actual results to differ
materially from those anticipated. The COVID-19 pandemic is adversely affecting Independent Bank Corporation, its customers, counterparties, employees, and third-party service providers, and the ultimate extent of the impacts on its business,
financial position, results of operations, liquidity, and prospects is uncertain. Continued deterioration in general business and economic conditions or turbulence in domestic or global financial markets could adversely affect Independent Bank
Corporation’s revenues and the values of its assets and liabilities, reduce the availability of funding from certain financial institutions, lead to a tightening of credit, and increase stock price volatility. In addition, changes to statutes,
regulations, or regulatory policies or practices could affect Independent Bank Corporation in substantial and unpredictable ways. Independent Bank Corporation’s results could also be adversely affected by changes in interest rates; further increases
in unemployment rates; deterioration in the credit quality of its loan portfolios or in the value of the collateral securing those loans; deterioration in the value of its investment securities; legal and regulatory developments; litigation;
increased competition from both banks and non-banks; changes in the level of tariffs and other trade policies of the United States and its global trading partners; changes in customer behavior and preferences; breaches in data security; failures to
safeguard personal information; effects of mergers and acquisitions and related integration; effects of critical accounting policies and judgments; and management’s ability to effectively manage credit risk, market risk, operational risk, compliance
risk, strategic risk, interest rate risk, liquidity risk and reputation risk.
Certain risks and important factors that could affect Independent Bank Corporation’s future results are identified in its Annual
Report on Form 10-K for the year ended December 31, 2020 and other reports filed with the SEC, including among other things under the heading “Risk Factors” in such Annual Report on Form 10-K. Any forward-looking statement speaks only as of the date
on which it is made, and Independent Bank Corporation undertakes no obligation to update any forward-looking statement, whether to reflect events or circumstances, after the date on which the statement is made, to reflect new information or the
occurrence of unanticipated events, or otherwise.
6
INDEPENDENT BANK CORPORATION AND SUBSIDIARIES
Consolidated Statements of Financial Condition
|
June 30,
2021
|
December 31,
2020
|
|||||||
|
(unaudited)
|
||||||||
|
(In thousands, except share
|
||||||||
|
amounts)
|
||||||||
|
Assets
|
||||||||
|
Cash and due from banks
|
$
|
46,242
|
$
|
56,006
|
||||
|
Interest bearing deposits
|
23,012
|
62,699
|
||||||
|
Cash and Cash Equivalents
|
69,254
|
118,705
|
||||||
|
Securities available for sale
|
1,330,660
|
1,072,159
|
||||||
|
Federal Home Loan Bank and Federal Reserve Bank stock, at cost
|
18,427
|
18,427
|
||||||
|
Loans held for sale, carried at fair value
|
59,752
|
92,434
|
||||||
|
Loans
|
||||||||
|
Commercial
|
1,244,547
|
1,242,415
|
||||||
|
Mortgage
|
1,045,108
|
1,015,926
|
||||||
|
Installment
|
524,904
|
475,337
|
||||||
|
Total Loans
|
2,814,559
|
2,733,678
|
||||||
|
Allowance for credit losses (1)
|
(45,926
|
)
|
(35,429
|
)
|
||||
|
Net Loans
|
2,768,633
|
2,698,249
|
||||||
|
Other real estate and repossessed assets
|
296
|
766
|
||||||
|
Property and equipment, net
|
36,507
|
36,127
|
||||||
|
Bank-owned life insurance
|
55,446
|
55,180
|
||||||
|
Capitalized mortgage loan servicing rights, carried at fair value
|
22,431
|
16,904
|
||||||
|
Other intangibles
|
3,821
|
4,306
|
||||||
|
Goodwill
|
28,300
|
28,300
|
||||||
|
Accrued income and other assets
|
67,745
|
62,456
|
||||||
|
Total Assets
|
$
|
4,461,272
|
$
|
4,204,013
|
||||
|
Liabilities and Shareholders’ Equity
|
||||||||
|
Deposits
|
||||||||
|
Non-interest bearing
|
$
|
1,298,282
|
$
|
1,153,473
|
||||
|
Savings and interest-bearing checking
|
1,699,463
|
1,526,465
|
||||||
|
Reciprocal
|
589,493
|
556,185
|
||||||
|
Time
|
272,305
|
287,402
|
||||||
|
Brokered time
|
2,923
|
113,830
|
||||||
|
Total Deposits
|
3,862,466
|
3,637,355
|
||||||
|
Other borrowings
|
30,005
|
30,012
|
||||||
|
Subordinated debt
|
39,319
|
39,281
|
||||||
|
Subordinated debentures
|
39,558
|
39,524
|
||||||
|
Accrued expenses and other liabilities
|
93,950
|
68,319
|
||||||
|
Total Liabilities
|
4,065,298
|
3,814,491
|
||||||
|
Shareholders’ Equity
|
||||||||
|
Preferred stock, no par value, 200,000 shares authorized; none issued or outstanding
|
-
|
-
|
||||||
|
Common stock, no par value, 500,000,000 shares authorized; issued and outstanding: 21,632,912 shares at June 30, 2021 and 21,853,800 shares at December
31, 2020
|
332,457
|
339,353
|
||||||
|
Retained earnings
|
55,101
|
40,145
|
||||||
|
Accumulated other comprehensive income
|
8,416
|
10,024
|
||||||
|
Total Shareholders’ Equity
|
395,974
|
389,522
|
||||||
|
Total Liabilities and Shareholders’ Equity
|
$
|
4,461,272
|
$
|
4,204,013
|
||||
|
(1)
|
Beginning January 1, 2021, calculation is based on CECL methodology. Prior to January 1, 2021, calculation was based on the probable incurred loss methodology.
|
7
INDEPENDENT BANK CORPORATION AND SUBSIDIARIES
Consolidated Statements of Operations
|
Three Months Ended
|
Six Months Ended
|
|||||||||||||||||||
|
June 30,
|
March 31,
|
June 30,
|
June 30,
|
|||||||||||||||||
|
2021
|
2021
|
2020
|
2021
|
2020
|
||||||||||||||||
|
(unaudited)
|
||||||||||||||||||||
|
Interest Income
|
(In thousands, except per share amounts)
|
|||||||||||||||||||
|
Interest and fees on loans
|
$
|
28,091
|
$
|
28,105
|
$
|
29,863
|
$
|
56,196
|
$
|
61,627
|
||||||||||
|
Interest on securities available for sale
|
||||||||||||||||||||
|
Taxable
|
3,656
|
2,796
|
2,847
|
6,452
|
5,906
|
|||||||||||||||
|
Tax-exempt
|
1,544
|
1,384
|
793
|
2,928
|
1,183
|
|||||||||||||||
|
Other investments
|
208
|
217
|
251
|
425
|
617
|
|||||||||||||||
|
Total Interest Income
|
33,499
|
32,502
|
33,754
|
66,001
|
69,333
|
|||||||||||||||
|
Interest Expense
|
||||||||||||||||||||
|
Deposits
|
1,142
|
1,256
|
2,388
|
2,398
|
7,088
|
|||||||||||||||
|
Other borrowings and subordinated debt and debentures
|
964
|
962
|
904
|
1,926
|
1,592
|
|||||||||||||||
|
Total Interest Expense
|
2,106
|
2,218
|
3,292
|
4,324
|
8,680
|
|||||||||||||||
|
Net Interest Income
|
31,393
|
30,284
|
30,462
|
61,677
|
60,653
|
|||||||||||||||
|
Provision for credit losses (1)
|
(1,425
|
)
|
(474
|
)
|
5,188
|
(1,899
|
)
|
11,909
|
||||||||||||
|
Net Interest Income After Provision for Credit Losses
|
32,818
|
30,758
|
25,274
|
63,576
|
48,744
|
|||||||||||||||
|
Non-interest Income
|
||||||||||||||||||||
|
Interchange income
|
3,453
|
3,049
|
2,526
|
6,502
|
4,983
|
|||||||||||||||
|
Service charges on deposit accounts
|
2,318
|
1,916
|
1,623
|
4,234
|
4,214
|
|||||||||||||||
|
Net gains on assets
|
||||||||||||||||||||
|
Mortgage loans
|
9,091
|
12,828
|
17,642
|
21,919
|
26,482
|
|||||||||||||||
|
Securities available for sale
|
-
|
1,416
|
-
|
1,416
|
253
|
|||||||||||||||
|
Mortgage loan servicing, net
|
(1,962
|
)
|
5,167
|
(3,022
|
)
|
3,205
|
(8,322
|
)
|
||||||||||||
|
Other
|
1,871
|
2,030
|
1,598
|
3,901
|
3,761
|
|||||||||||||||
|
Total Non-interest Income
|
14,771
|
26,406
|
20,367
|
41,177
|
31,371
|
|||||||||||||||
|
Non-interest Expense
|
||||||||||||||||||||
|
Compensation and employee benefits
|
19,883
|
18,522
|
16,279
|
38,405
|
32,788
|
|||||||||||||||
|
Data processing
|
2,576
|
2,374
|
1,590
|
4,950
|
3,945
|
|||||||||||||||
|
Occupancy, net
|
2,153
|
2,343
|
2,159
|
4,496
|
4,619
|
|||||||||||||||
|
Interchange expense
|
1,201
|
948
|
726
|
2,149
|
1,585
|
|||||||||||||||
|
Furniture, fixtures and equipment
|
1,034
|
1,003
|
1,090
|
2,037
|
2,126
|
|||||||||||||||
|
Communications
|
777
|
881
|
800
|
1,658
|
1,603
|
|||||||||||||||
|
Loan and collection
|
859
|
759
|
756
|
1,618
|
1,561
|
|||||||||||||||
|
Conversion related expenses
|
1,143
|
218
|
346
|
1,361
|
402
|
|||||||||||||||
|
Legal and professional
|
522
|
499
|
468
|
1,021
|
861
|
|||||||||||||||
|
Advertising
|
164
|
489
|
364
|
653
|
1,047
|
|||||||||||||||
|
FDIC deposit insurance
|
307
|
330
|
430
|
637
|
800
|
|||||||||||||||
|
Correspondent bank service fees
|
115
|
100
|
94
|
215
|
193
|
|||||||||||||||
|
Branch closure costs
|
-
|
-
|
417
|
-
|
417
|
|||||||||||||||
|
Net (gains) losses on other real estate and repossessed assets
|
6
|
(180
|
)
|
(9
|
)
|
(174
|
)
|
100
|
||||||||||||
|
Other
|
1,796
|
1,735
|
1,836
|
3,531
|
4,018
|
|||||||||||||||
|
Total Non-interest Expense
|
32,536
|
30,021
|
27,346
|
62,557
|
56,065
|
|||||||||||||||
|
Income Before Income Tax
|
15,053
|
27,143
|
18,295
|
42,196
|
24,050
|
|||||||||||||||
|
Income tax expense
|
2,665
|
5,106
|
3,523
|
7,771
|
4,468
|
|||||||||||||||
|
Net Income
|
$
|
12,388
|
$
|
22,037
|
$
|
14,772
|
$
|
34,425
|
$
|
19,582
|
||||||||||
|
Net Income Per Common Share
|
||||||||||||||||||||
|
Basic
|
$
|
0.57
|
$
|
1.01
|
$
|
0.67
|
$
|
1.58
|
$
|
0.89
|
||||||||||
|
Diluted
|
$
|
0.56
|
$
|
1.00
|
$
|
0.67
|
$
|
1.56
|
$
|
0.88
|
||||||||||
|
(1)
|
Beginning January 1, 2021, calculation is based on CECL methodology. Prior to January 1, 2021, calculation was based on the probable incurred loss methodology.
|
8
INDEPENDENT BANK CORPORATION AND SUBSIDIARIES
Selected Financial Data
|
June 30,
2021
|
March 31,
2021
|
December 31,
2020
|
September 30,
2020
|
June 30,
2020
|
||||||||||||||||
|
(unaudited)
|
||||||||||||||||||||
|
(Dollars in thousands except per share data)
|
||||||||||||||||||||
|
Three Months Ended
|
||||||||||||||||||||
|
Net interest income
|
$
|
31,393
|
$
|
30,284
|
$
|
30,993
|
$
|
31,966
|
$
|
30,462
|
||||||||||
|
Provision for credit losses (1)
|
(1,425
|
)
|
(474
|
)
|
(421
|
)
|
975
|
5,188
|
||||||||||||
|
Non-interest income
|
14,771
|
26,406
|
22,363
|
27,011
|
20,367
|
|||||||||||||||
|
Non-interest expense
|
32,536
|
30,021
|
32,707
|
33,641
|
27,346
|
|||||||||||||||
|
Income before income tax
|
15,053
|
27,143
|
21,070
|
24,361
|
18,295
|
|||||||||||||||
|
Income tax expense
|
2,665
|
5,106
|
4,084
|
4,777
|
3,523
|
|||||||||||||||
|
Net income
|
$
|
12,388
|
$
|
22,037
|
$
|
16,986
|
$
|
19,584
|
$
|
14,772
|
||||||||||
|
Basic earnings per share
|
$
|
0.57
|
$
|
1.01
|
$
|
0.78
|
$
|
0.90
|
$
|
0.67
|
||||||||||
|
Diluted earnings per share
|
0.56
|
1.00
|
0.77
|
0.89
|
0.67
|
|||||||||||||||
|
Cash dividend per share
|
0.21
|
0.21
|
0.20
|
0.20
|
0.20
|
|||||||||||||||
|
Average shares outstanding
|
21,749,654
|
21,825,937
|
21,866,326
|
21,881,562
|
21,890,761
|
|||||||||||||||
|
Average diluted shares outstanding
|
21,966,829
|
22,058,503
|
22,112,829
|
22,114,692
|
22,113,187
|
|||||||||||||||
|
Performance Ratios
|
||||||||||||||||||||
|
Return on average assets
|
1.12
|
%
|
2.10
|
%
|
1.61
|
%
|
1.90
|
%
|
1.54
|
%
|
||||||||||
|
Return on average equity
|
12.78
|
23.51
|
17.82
|
21.36
|
17.39
|
|||||||||||||||
|
Efficiency ratio (2)
|
69.24
|
53.48
|
60.59
|
56.36
|
53.07
|
|||||||||||||||
|
As a Percent of Average Interest-Earning Assets (2)
|
||||||||||||||||||||
|
Interest income
|
3.22
|
%
|
3.27
|
%
|
3.57
|
%
|
3.62
|
%
|
3.72
|
%
|
||||||||||
|
Interest expense
|
0.20
|
0.22
|
0.45
|
0.31
|
0.36
|
|||||||||||||||
|
Net interest income
|
3.02
|
3.05
|
3.12
|
3.31
|
3.36
|
|||||||||||||||
|
Average Balances
|
||||||||||||||||||||
|
Loans
|
$
|
2,859,544
|
$
|
2,834,012
|
$
|
2,876,795
|
$
|
2,925,872
|
$
|
2,913,857
|
||||||||||
|
Securities available for sale
|
1,274,556
|
1,093,618
|
1,009,578
|
891,975
|
660,126
|
|||||||||||||||
|
Total earning assets
|
4,223,570
|
4,047,952
|
3,984,080
|
3,887,455
|
3,659,614
|
|||||||||||||||
|
Total assets
|
4,434,760
|
4,254,294
|
4,195,546
|
4,102,318
|
3,868,408
|
|||||||||||||||
|
Deposits
|
3,879,715
|
3,698,811
|
3,632,758
|
3,559,070
|
3,303,302
|
|||||||||||||||
|
Interest bearing liabilities
|
2,674,425
|
2,589,102
|
2,574,306
|
2,532,481
|
2,402,361
|
|||||||||||||||
|
Shareholders’ equity
|
388,780
|
380,111
|
379,232
|
364,714
|
341,606
|
|||||||||||||||
|
End of Period
|
||||||||||||||||||||
|
Capital
|
||||||||||||||||||||
|
Tangible common equity ratio
|
8.21
|
%
|
8.08
|
%
|
8.56
|
%
|
8.23
|
%
|
8.03
|
%
|
||||||||||
|
Average equity to average assets
|
8.77
|
8.93
|
9.04
|
8.89
|
8.83
|
|||||||||||||||
|
Common shareholders’ equity per share of common stock
|
$
|
18.30
|
$
|
17.79
|
$
|
17.82
|
$
|
17.05
|
$
|
16.23
|
||||||||||
|
Tangible common equity per share of common stock
|
16.82
|
16.30
|
16.33
|
15.55
|
14.72
|
|||||||||||||||
|
Total shares outstanding
|
21,632,912
|
21,773,734
|
21,853,800
|
21,885,368
|
21,880,183
|
|||||||||||||||
|
Selected Balances
|
||||||||||||||||||||
|
Loans
|
$
|
2,814,559
|
$
|
2,784,224
|
$
|
2,733,678
|
$
|
2,855,479
|
$
|
2,866,663
|
||||||||||
|
Securities available for sale
|
1,330,660
|
1,247,280
|
1,072,159
|
985,050
|
856,280
|
|||||||||||||||
|
Total earning assets
|
4,246,410
|
4,209,017
|
3,979,397
|
3,962,824
|
3,833,523
|
|||||||||||||||
|
Total assets
|
4,461,272
|
4,426,440
|
4,204,013
|
4,168,944
|
4,043,315
|
|||||||||||||||
|
Deposits
|
3,862,466
|
3,858,575
|
3,637,355
|
3,597,745
|
3,485,125
|
|||||||||||||||
|
Interest bearing liabilities
|
2,633,747
|
2,626,280
|
2,553,418
|
2,515,185
|
2,456,193
|
|||||||||||||||
|
Shareholders’ equity
|
395,974
|
387,329
|
389,522
|
373,092
|
355,123
|
|||||||||||||||
|
(1)
|
Beginning January 1, 2021, calculation is based on CECL methodology. Prior to January 1, 2021, calculation was based on the probable incurred loss methodology.
|
|
(2)
|
Presented on a fully tax equivalent basis assuming a marginal tax rate of 21%.
|
9
Reconciliation of Non-GAAP Financial Measures
Independent Bank Corporation
Independent Bank Corporation believes non-GAAP measures are meaningful because they reflect adjustments commonly made by management, investors, regulators and analysts
to evaluate the adequacy of common equity and performance trends. Tangible common equity is used by the Company to measure the quality of capital.
Reconciliation of Non-GAAP Financial Measures
|
Three Months Ended
June 30,
|
Six Months Ended
June 30,
|
|||||||||||||||
|
2021
|
2020
|
2021
|
2020
|
|||||||||||||
|
(Dollars in thousands)
|
||||||||||||||||
|
Net Interest Margin, Fully Taxable Equivalent (“FTE”)
|
||||||||||||||||
|
Net interest income
|
$
|
31,393
|
$
|
30,462
|
$
|
61,677
|
$
|
60,653
|
||||||||
|
Add: taxable equivalent adjustment
|
478
|
223
|
882
|
344
|
||||||||||||
|
Net interest income - taxable equivalent
|
$
|
31,871
|
$
|
30,685
|
$
|
62,559
|
$
|
60,997
|
||||||||
|
Net interest margin (GAAP) (1)
|
2.98
|
%
|
3.34
|
%
|
3.00
|
%
|
3.47
|
%
|
||||||||
|
Net interest margin (FTE) (1)
|
3.02
|
%
|
3.36
|
%
|
3.04
|
%
|
3.49
|
%
|
||||||||
|
(1)
|
Annualized.
|
Tangible Common Equity Ratio
|
June 30,
2021
|
March 31,
2021
|
December 31,
2020
|
September 30,
2020
|
June 30,
2020
|
||||||||||||||||
|
(Dollars in thousands)
|
||||||||||||||||||||
|
Common shareholders’ equity
|
$
|
395,974
|
$
|
387,329
|
$
|
389,522
|
$
|
373,092
|
$
|
355,123
|
||||||||||
|
Less:
|
||||||||||||||||||||
|
Goodwill
|
28,300
|
28,300
|
28,300
|
28,300
|
28,300
|
|||||||||||||||
|
Other intangibles
|
3,821
|
4,063
|
4,306
|
4,561
|
4,816
|
|||||||||||||||
|
Tangible common equity
|
$
|
363,853
|
$
|
354,966
|
$
|
356,916
|
$
|
340,231
|
$
|
322,007
|
||||||||||
|
Total assets
|
$
|
4,461,272
|
$
|
4,426,440
|
$
|
4,204,013
|
$
|
4,168,944
|
$
|
4,043,315
|
||||||||||
|
Less:
|
||||||||||||||||||||
|
Goodwill
|
28,300
|
28,300
|
28,300
|
28,300
|
28,300
|
|||||||||||||||
|
Other intangibles
|
3,821
|
4,063
|
4,306
|
4,561
|
4,816
|
|||||||||||||||
|
Tangible assets
|
$
|
4,429,151
|
$
|
4,394,077
|
$
|
4,171,407
|
$
|
4,136,083
|
$
|
4,010,199
|
||||||||||
|
Common equity ratio
|
8.88
|
%
|
8.75
|
%
|
9.27
|
%
|
8.95
|
%
|
8.78
|
%
|
||||||||||
|
Tangible common equity ratio
|
8.21
|
%
|
8.08
|
%
|
8.56
|
%
|
8.23
|
%
|
8.03
|
%
|
||||||||||
|
Tangible Common Equity per Share of Common Stock:
|
||||||||||||||||||||
|
Common shareholders’ equity
|
$
|
395,974
|
$
|
387,329
|
$
|
389,522
|
$
|
373,092
|
$
|
355,123
|
||||||||||
|
Tangible common equity
|
$
|
363,853
|
$
|
354,966
|
$
|
356,916
|
$
|
340,231
|
$
|
322,007
|
||||||||||
|
Shares of common stock outstanding (in thousands)
|
21,633
|
21,774
|
21,854
|
21,885
|
21,880
|
|||||||||||||||
|
Common shareholders’ equity per share of common stock
|
$
|
18.30
|
$
|
17.79
|
$
|
17.82
|
$
|
17.05
|
$
|
16.23
|
||||||||||
|
Tangible common equity per share of common stock
|
$
|
16.82
|
$
|
16.30
|
$
|
16.33
|
$
|
15.55
|
$
|
14.72
|
||||||||||
The tangible common equity ratio removes the effect of goodwill and other intangible assets from capital and total assets. Tangible common equity per share of common
stock removes the effect of goodwill and other intangible assets from common shareholders’ equity per share of common stock.
10