Exhibit 99.1

News Release
Independent Bank Corporation
4200 East Beltline
Grand Rapids, MI 49525
616.527.5820
|
For Release:
|
Immediately
|
|
Contact:
|
William B. Kessel, President and CEO, 616.447.3933
|
|
Gavin A. Mohr, Chief Financial Officer, 616.447.3929
|
INDEPENDENT BANK CORPORATION REPORTS
2020 FOURTH QUARTER AND FULL YEAR RESULTS
GRAND RAPIDS, Mich., Jan. 28, 2021 - Independent Bank Corporation (NASDAQ:
IBCP) reported fourth quarter 2020 net income of $17.0 million, or $0.77 per diluted share, versus net income of $13.9 million, or $0.61 per diluted share, in the
prior-year period. For the year ended December 31, 2020, the Company reported net income of $56.2 million, or $2.53 per diluted share, compared to net income of $46.4 million, or $2.00 per diluted share, in 2019. The increase in 2020 fourth quarter
and full-year 2020 earnings as compared to 2019 primarily reflects increases in non-interest income that were partially offset by a decrease in interest income and an increase in non-interest expense and income tax expense.
Fourth quarter 2020 highlights include:
| • |
Increases in net income and diluted earnings per share of 22.4% and 26.2%, respectively, compared to 2019;
|
| • |
Return on average assets and return on average equity of 1.61% and 17.82%, respectively, compared to 1.56% and 15.92%, respectively, in 2019;
|
| • |
Net gains on mortgage loans of $15.9 million (up 148.5% over 2019) and total mortgage loan origination volume of $502.5 million;
|
| • |
Deposit net growth of $39.6 million (or 1.1%);
|
| • |
Continued strong asset quality metrics as evidenced by net loan recoveries during the quarter, a low level of non-performing loans and non-performing assets;
|
| • |
COVID related forbearances declined to 0.83% of total loans; and
|
| • |
The payment of a 20 cent per share dividend on common stock on November 16, 2020.
|
Full year 2020 highlights include:
| • |
Increases in net income and diluted earnings per share of 20.9% and 26.3%, respectively, compared to 2019;
|
| • |
Return on average assets and return on average equity of 1.43% and 15.68 %, respectively, compared to 1.35% and 13.63%, respectively, in 2019;
|
| • |
Net gains on mortgage loans of $62.6 million (up 213.1% over 2019) and total mortgage loan origination volume of $1.8 billion;
|
| • |
Deposit net growth of $600.6 million (or 19.8 %); and
|
| • |
Tangible common equity per share increased by 16% to $16.33 from $14.08.
|
1
Significant items impacting comparable quarterly and year to date 2020 and 2019 results include the following:
| • |
As a result of hedge de-designation the company realized an increase in interest expense of $1.6 million ($0.06 per diluted share, after tax) due to accelerated amortization of
deferred losses on certain derivative instruments. As cash flow hedges these losses were previously recorded in accumulated other comprehensive income (loss).
|
| • |
Changes in the fair value due to price of capitalized mortgage loan servicing rights (the “MSR Changes”) of a negative $0.9 million ($0.03 per diluted share, after taxes) and a
negative $10.8 million ($0.39 per diluted share, after taxes) for the three-months and full-year ended December 31, 2020, respectively, as compared to a positive $0.6 million ($0.02 per diluted share, after taxes) and a negative $6.4 million
($0.22 per diluted share, after taxes) for the three-months and full year ended December 31, 2019, respectively.
|
| • |
Approximately $1.54 million ($0.06 per diluted share, after taxes) and $3.0 million ($0.11 per diluted share, after taxes) of expenses related to the ongoing data processing
conversion and the completed bank branch closures (as described further below under “Operating Results”) for the three-months and full-year ended December 31, 2020, respectively.
|
William B. (“Brad”) Kessel, the President and Chief Executive Officer of Independent Bank
Corporation, commented: “We are pleased to report very strong financial performance in the fourth quarter and for the full-year 2020 as we continue to navigate the many challenges brought on by the COVID-19 pandemic. Our associates continued their
amazing efforts during this quarter! We closed over one-half billion dollars of mortgage loans, helping our customers buy new homes or refinance existing mortgage loans. We assisted our customers in completing and submitting PPP forgiveness
applications to the SBA, with over 38% of outstanding balances submitted. We continued to effectively operate our Business Continuity Plan to safely serve our customers and protect our employees. Finally, we maintained solid asset quality metrics
during the fourth quarter of 2020. COVID-19 related loan forbearance balances decreased by 62.7% during the fourth quarter of 2020. As we look ahead to 2021 and beyond, we are mindful of the ongoing challenges from the COVID-19 pandemic,
however, we are confident of our continued ability to effectively respond to these challenges and remain optimistic about our future.”
COVID-19 Pandemic Update
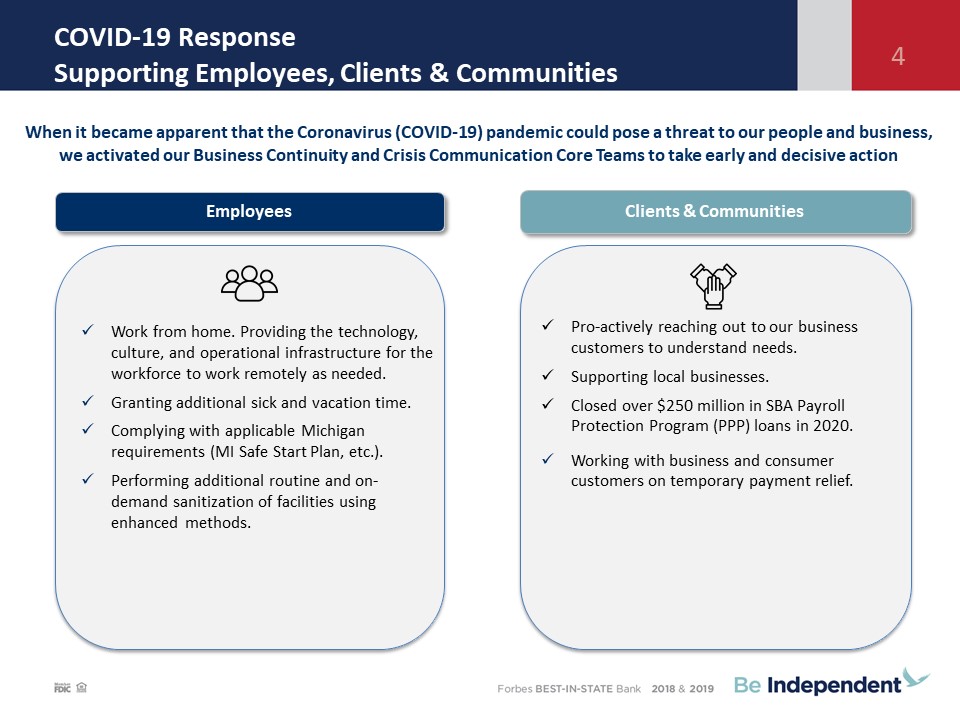
The Company continues to respond to the challenges arising from the COVID-19
pandemic. Our response was initially formulated during the month of February 2020 as we prepared our infrastructure to allow the majority of our associates to work remotely. In March 2020 we activated our Business Continuity Plan to protect our
customers, employees and business. We will continue to take the necessary steps to serve our communities while doing our part to minimize the spread of COVID-19. The following is a brief description of our current initiatives:
| • |
Customer Safety and Service Levels – From mid-March 2020 to mid-June 2020 we limited our branch lobbies to appointment only and kept drive-through windows open. In mid-June 2020 our
bank branch lobbies fully reopened. On November 13, 2020 we again limited our branch lobbies to appointment only in response to increasing COVID-19 cases in the State of Michigan. Branch lobbies were reopened January 4, 2021. With the
ability to use drive through service, ATMs or our electronic banking solutions there was minimal disruption to our customers.
|
| • |
Employee Safety – For employees that are in our bank branches servicing our customers, we have expanded sick and vacation time. All non-branch employees either have the option or
are required to work remotely. We currently have approximately 38% of our total staff working remotely every day. We have installed “customer friendly” shields throughout our delivery network and have implemented a variety of other
protective processes to promote the safety of our employees and put both customers and staff at ease.
|
| • |
Loan Forbearances – We have forbearance programs in place to proactively work with our customers who have experienced financial difficulty due to the COVID-19 pandemic. Totals for
these programs by loan type are presented in the table below under the caption “Asset Quality”. The level of these loans is down significantly after peaking in mid-June 2020, as many customers’ economic situations have improved, allowing them
to pay their loans current or return to their original payment terms.
|
| • |
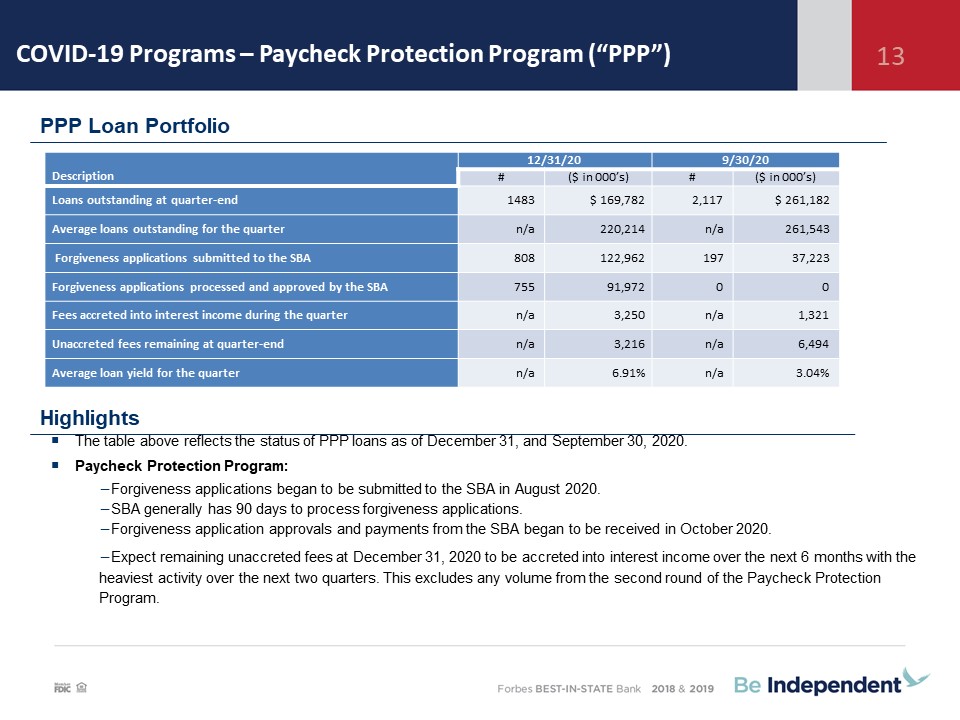
U.S. Small Business Administration (“SBA”) Paycheck Protection Program (“PPP”) – We built an effective process to manage the high volume of applications that we received. Customer
demand for this program was extraordinary. As of December 31, 2020, we had 1,483 PPP loans outstanding with a total balance of $169.8 million. The average balance of PPP loans in the fourth quarter of 2020 was $220.2 million with an average
yield of 6.91% (including the accretion of approximately $3.3 million of net of fees). At December 31, 2020, there was $3.2 million remaining unaccreted net fees related to PPP loans. These net fees are expected to be accreted into interest
income over the next 6 months, and the pace of such accretion will depend on payment activity (including loan forgiveness) within the PPP loan portfolio. As of December 31, 2020, 808 forgiveness applications (totaling $123.0 million) have
been submitted to the SBA with 751 (totaling $92.0 million) applications approved. We are currently taking applications for the second round of the Paycheck Protection Program.
|
2
Operating Results
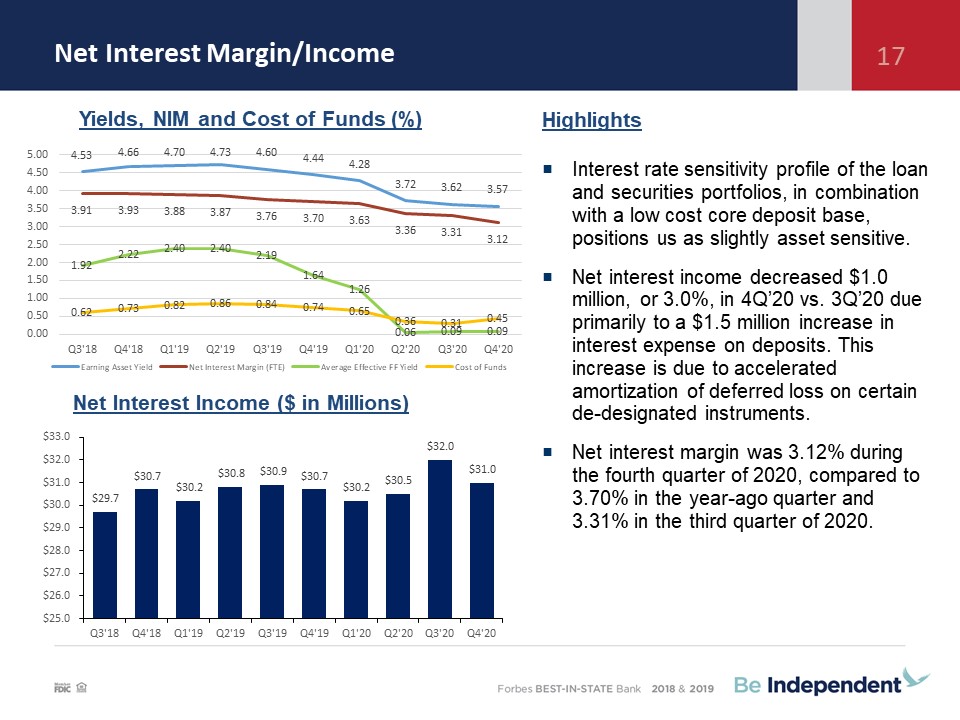
The Company’s net interest income totaled $31.0 million during the fourth quarter of 2020, an increase of $0.3 million, or 0.9% from the year-ago period, and down $1.0
million, or 3.0%, from the third quarter of 2020. The Company realized an increase in interest expense of $1.6 million due to accelerated amortization of deferred loss on certain derivative instruments that have been de-designated. The Company’s tax
equivalent net interest income as a percent of average interest-earning assets (the “net interest margin”) was 3.12% during the fourth quarter of 2020, compared to 3.70% in the year-ago period, and 3.31% in the third quarter of 2020. The
year-over-year quarterly increase in net interest income is due to an increase in average interest-earning assets that was partially offset by a decline in the net interest margin. Average interest-earning assets were $3.98 billion in the fourth
quarter of 2020, compared to $3.32 billion in the year ago quarter and $3.89 billion in the third quarter of 2020.
For the full year 2020, net interest income totaled $123.6 million, an increase of $1.0 million, or 0.8% from 2019. The Company’s net interest margin for the full year
of 2020 was 3.34% compared to 3.80% in 2019. The increase in net interest income for the full year of 2020 compared to 2019 is also due to an increase in average interest-earning assets that was largely offset by a decline in the net interest
margin.
Due to the economic impact of COVID-19, the Federal Reserve has taken a variety of actions to stimulate the economy, including significantly lowering short-term interest
rates. These actions have placed continued pressure on the Company’s net interest margin.
Non-interest income totaled $22.4 million and $80.7 million, respectively, for the fourth quarter and full year 2020, compared to $15.6 million and $47.7 million in the
respective comparable year ago periods. These changes were primarily due to variances in mortgage banking related revenues (net gains on mortgage loans and mortgage loan servicing, net).
Net gains on mortgage loans in the fourth quarters of 2020 and 2019, were approximately $15.9 million and $6.4 million, respectively. For full year 2020, net gains on
mortgage loans totaled $62.6 million compared to $20.0 million in 2019. The increase in net gains on mortgage loans in 2020 was primarily due to a significant increase in mortgage loan sales volume (principally reflecting the rise in mortgage loan
refinance levels), as well as improved profit margins on mortgage loan sales and fair value adjustments on the mortgage loan pipeline.
Mortgage loan servicing, net, generated a loss of $0.4 million and a gain of $1.3 million in the fourth quarters of 2020 and 2019, respectively. For full year 2020 and
2019, mortgage loan servicing, net, generated a loss of $9.4 million and $3.3 million, respectively. The significant variances in mortgage loan servicing, net are primarily due to changes in the fair value of capitalized mortgage loan servicing
rights associated with changes in mortgage loan interest rates and expected future prepayment levels. Mortgage loan servicing, net activity is summarized in the following table:
|
Three Months Ended
|
Twelve Months Ended
|
|||||||||||||||
|
12/31/2020
|
12/31/2019
|
12/31/2020
|
12/31/2019
|
|||||||||||||
|
Mortgage loan servicing, net:
|
(Dollars in thousands)
|
|||||||||||||||
|
Revenue, net
|
$
|
1,812
|
$
|
1,622
|
$
|
6,874
|
$
|
6,196
|
||||||||
|
Fair value change due to price
|
(892
|
)
|
628
|
(10,833
|
)
|
(6,408
|
)
|
|||||||||
|
Fair value change due to pay-downs
|
(1,304
|
)
|
(902
|
)
|
(5,391
|
)
|
(3,124
|
)
|
||||||||
|
Total
|
$
|
(384
|
)
|
$
|
1,348
|
$
|
(9,350
|
)
|
$
|
(3,336
|
)
|
|||||
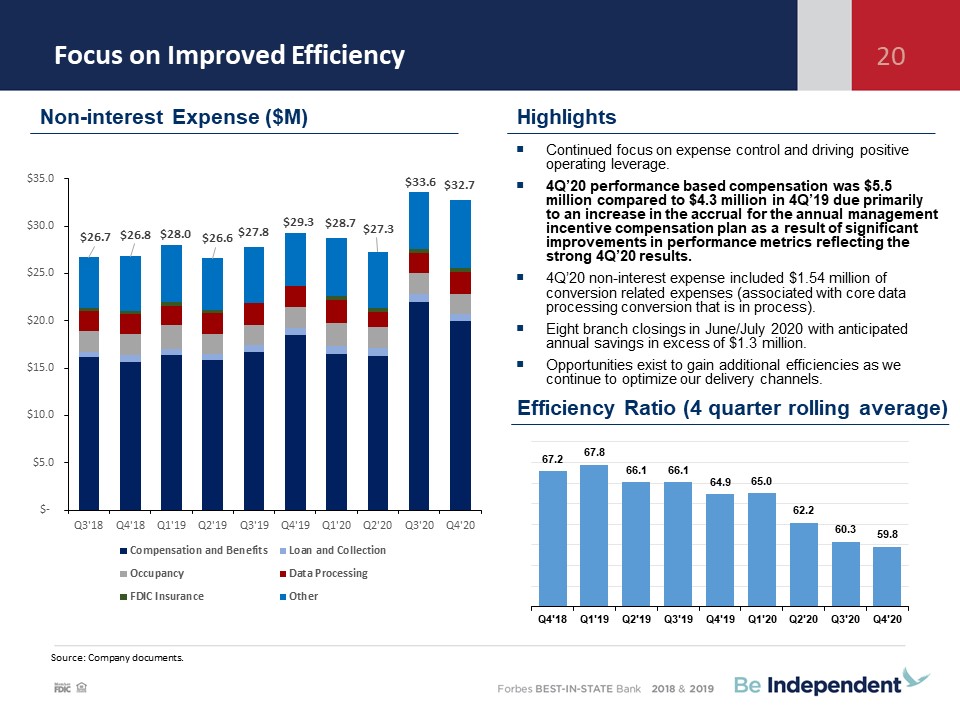
Non-interest expenses totaled $32.7 million in the fourth quarter of 2020, compared to $29.3 million in the year-ago period. For full year 2020, non-interest expenses
totaled $122.4 million versus $111.7 million in 2019. These year-over-year increases in non-interest expense are primarily due to increases in compensation and employee benefits, FDIC deposit insurance and data processing conversion related
expenses. Full year 2020 performance based compensation expense increased $7.7 million primarily as a result of actual performance relative to established management incentive plan targets. The fourth quarter and full year 2020 includes $1.5 million
and $2.6 million, respectively, of expenses related to the Company’s core data processing conversion that is in process (this conversion is expected to be completed in April 2021). The full-year 2020 non-interest expense also includes $0.4 million of
expenses (primarily write-downs of fixed assets and leases) related to the closures of eight bank branch offices that occurred in June and July 2020.
The Company recorded an income tax expense of $4.1 million and $13.3 million in the fourth quarter and full-year 2020, respectively. This compares to an income tax
expense of $3.3 million and $11.3 million in the fourth quarter and full-year 2019, respectively. The changes in income tax expense primarily reflect changes in pre-tax earnings in 2020 relative to 2019.
3
Asset Quality
A breakdown of loan forbearance totals by loan type is as follows:
|
12/31/20
|
9/30/20
|
% change vs. prior quarter
|
||||||||||||||||||||||||||||||
|
Loan Type
|
#
|
|
$(000’s)
|
|
% of portfolio
|
#
|
$ (000's)
|
% of portfolio
|
#
|
|
$ |
|||||||||||||||||||||
|
Loans serviced for others
|
288
|
$
|
42,897
|
1.4
|
%
|
416
|
$
|
66,279
|
2.3
|
%
|
(30.8
|
)%
|
(35.3
|
)%
|
||||||||||||||||||
|
Commercial
|
2
|
$
|
163
|
0.0
|
%
|
17
|
$
|
25,105
|
1.9
|
%
|
(88.2
|
%)
|
(99.4
|
%)
|
||||||||||||||||||
|
Mortgage
|
134
|
19,830
|
2.0
|
%
|
197
|
32,091
|
3.1
|
%
|
(32.0
|
)%
|
(38.2
|
)%
|
||||||||||||||||||||
|
Installment
|
48
|
1,412
|
0.3
|
%
|
97
|
2,631
|
0.5
|
%
|
(50.5
|
)%
|
(46.3
|
)%
|
||||||||||||||||||||
|
Total
|
184
|
$
|
21,405
|
0.8
|
%
|
311
|
$
|
59,827
|
2.1
|
%
|
(40.8
|
)%
|
(64.2
|
)%
|
||||||||||||||||||
Note: The % of portfolio is based on the dollar amount of forbearances to the total for the loan portfolio segment.
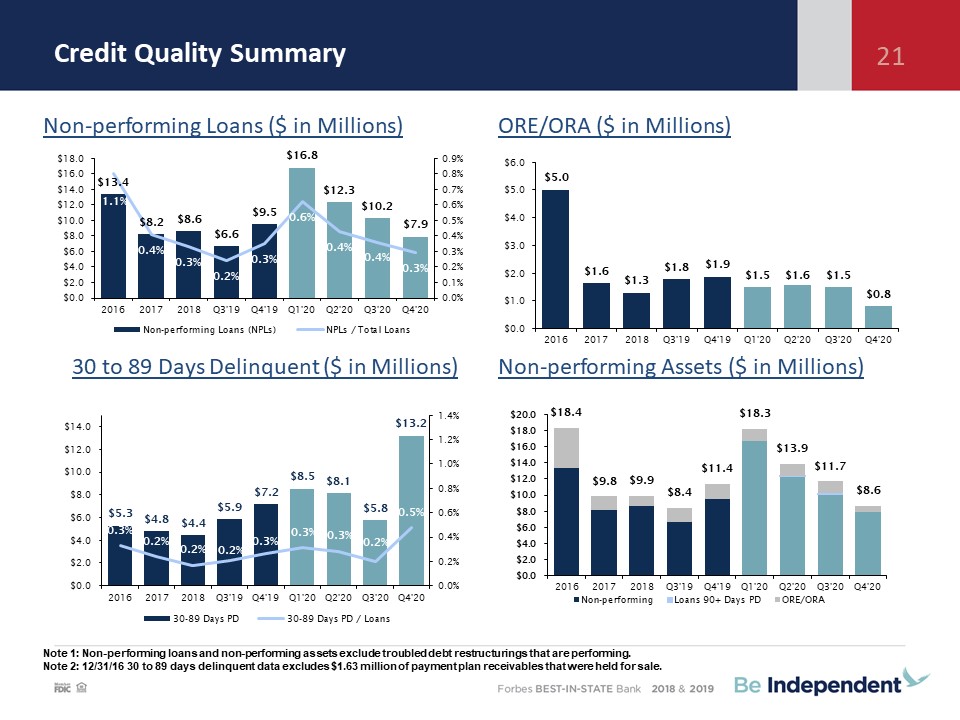
A breakdown of non-performing loans(1) by loan type is as follows:
|
Loan Type
|
12/31/2020
|
12/31/2019
|
12/31/2018
|
|||||||||
|
(Dollars in thousands)
|
||||||||||||
|
Commercial
|
$
|
1,440
|
$
|
1,377
|
$
|
2,220
|
||||||
|
Mortgage
|
6,353
|
7,996
|
6,033
|
|||||||||
|
Installment
|
519
|
805
|
781
|
|||||||||
|
Subtotal
|
8,312
|
10,178
|
9,034
|
|||||||||
|
Less – government guaranteed loans
|
439
|
646
|
460
|
|||||||||
|
Total non-performing loans
|
$
|
7,873
|
$
|
9,532
|
$
|
8,574
|
||||||
|
Ratio of non-performing loans to total portfolio loans
|
0.29
|
%
|
0.35
|
%
|
0.33
|
%
|
||||||
|
Ratio of non-performing assets to total assets
|
0.21
|
%
|
0.32
|
%
|
0.29
|
%
|
||||||
|
Ratio of the allowance for loan losses to non-performing loans
|
450.01
|
%
|
274.32
|
%
|
290.27
|
%
|
||||||
| (1) |
Excludes loans that are classified as “troubled debt restructured” that are still performing.
|
Non-performing loans have decreased $1.7 million from December 31, 2019, due primarily to a decrease in non-performing mortgage loans.
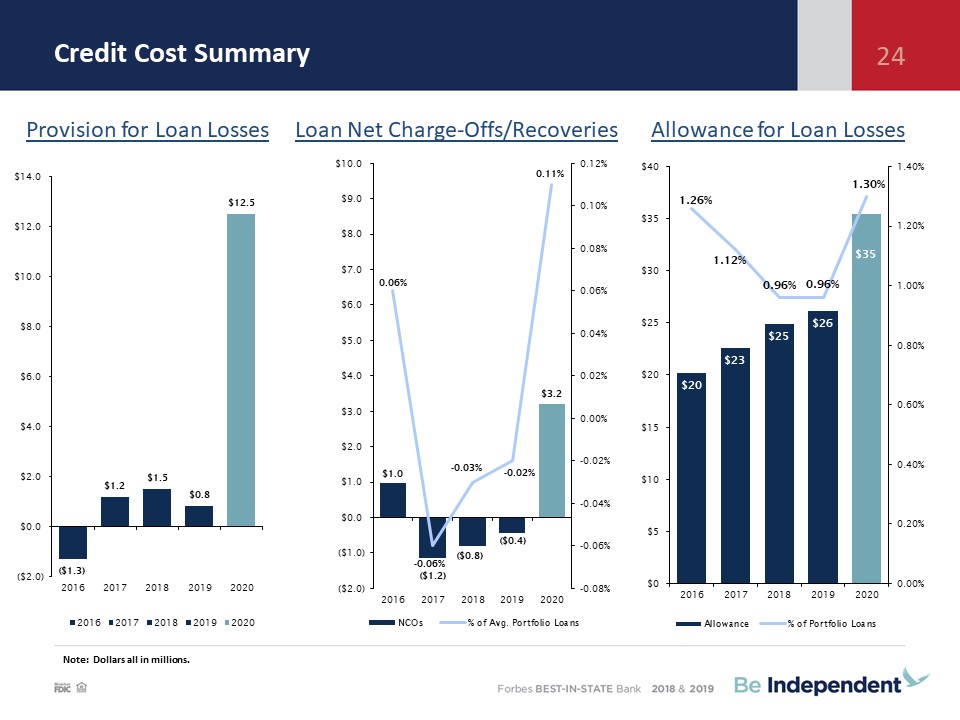
The provision for loan losses was a credit of $0.4 million and $0.2 million in the fourth quarters of 2020 and 2019, respectively. The provision for loan losses was an
expense of $12.5 million and 0.8 million for the full-year 2020 and 2019, respectively. The level of the provision for loan losses in each period reflects the Company’s overall assessment of the allowance for loan losses, taking into consideration
factors such as loan growth, loan mix, levels of non-performing and classified loans, loan forbearances and loan net charge-offs. In addition, the higher 2020 full-year provision for loan losses includes an $11.2 million (or 128.3%) increase in the
qualitative/subjective portion of the allowance for loan losses. This increase principally reflects the unique challenges and economic uncertainty resulting from the COVID-19 pandemic and the potential impact on the loan portfolio that is not
otherwise captured elsewhere within the allowance for loan losses. The Company recorded loan net recoveries of $0.1 million and loan net charge offs of $3.2 million in the fourth quarter and full-year 2020, respectively. This compares to loan net
recoveries of $0.2 million and $0.4 million, in the fourth quarter and full-year 2019, respectively. At December 31, 2020, the allowance for loan losses totaled $35.4 million, or 1.30% of total portfolio loans, compared to $26.1 million, or 0.96% of
total portfolio loans, at December 31, 2019. Excluding PPP loans and the remaining Traverse City State Bank acquired loan balances, the allowance for loan losses was equal to 1.43% of portfolio loans at December 31, 2020.
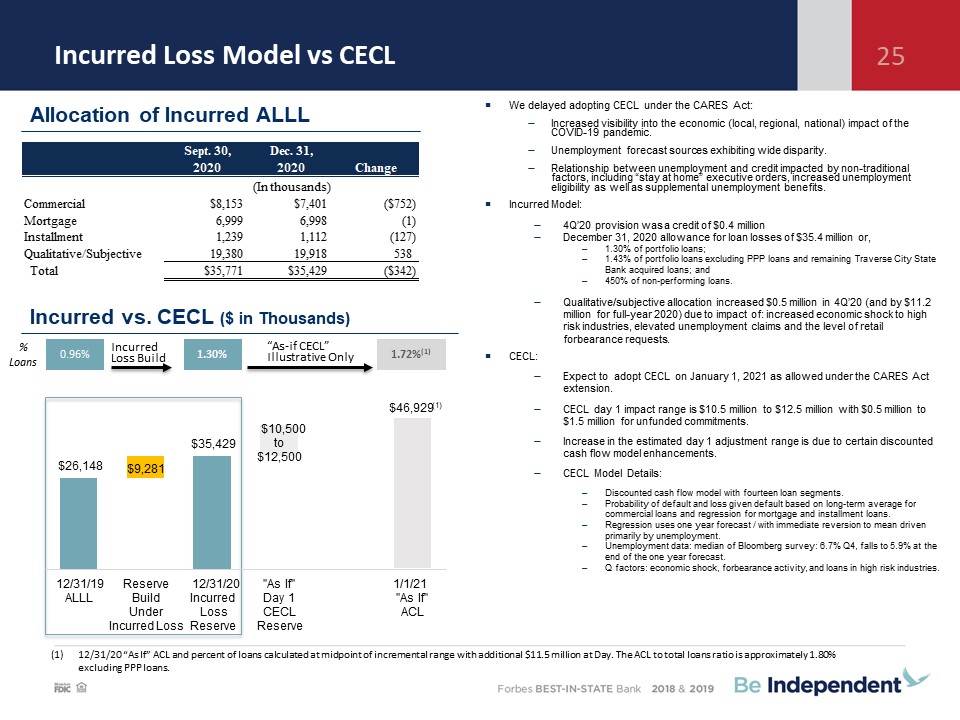
The provision for the loan loss was calculated utilizing the incurred model for the full year 2020. The adoption of CECL was delayed following the updated guidance
included in the second COVID-19 relief bill passed in December 2020. The Company is expecting to adopt CECL on January 1, 2021 as allowed under the CARES Act extension. We expect to recognize an cumulative effect adjustment through retained earnings
increasing the allowance for loan losses. We are estimating this increase to the allowance for loan losses to be in the range of $10.5 million to $12.5 million.
4
Balance Sheet, Liquidity and Capital
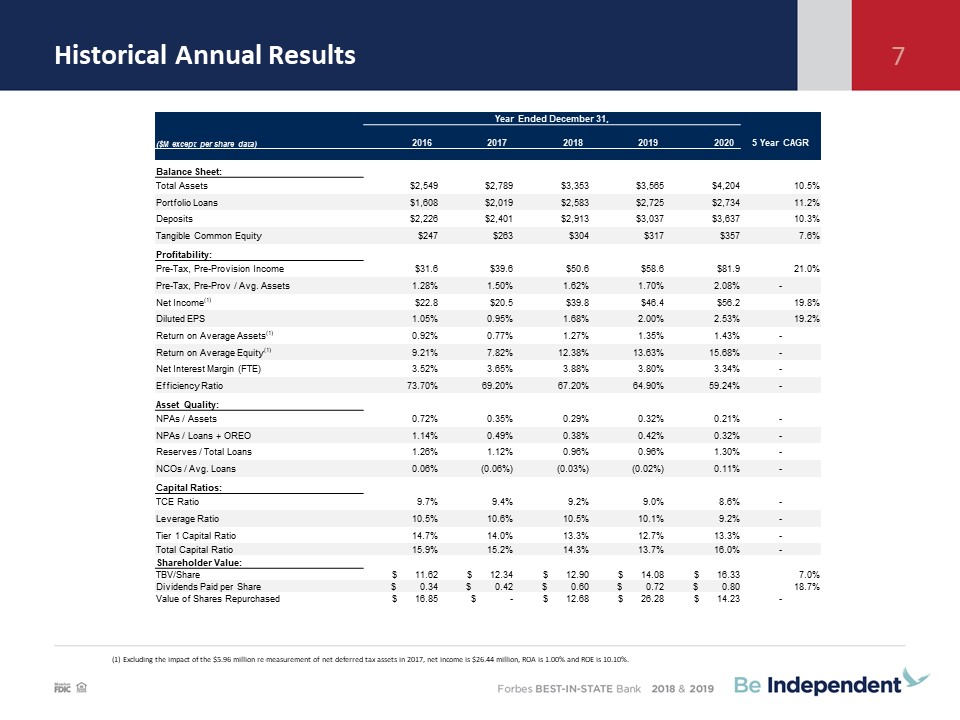
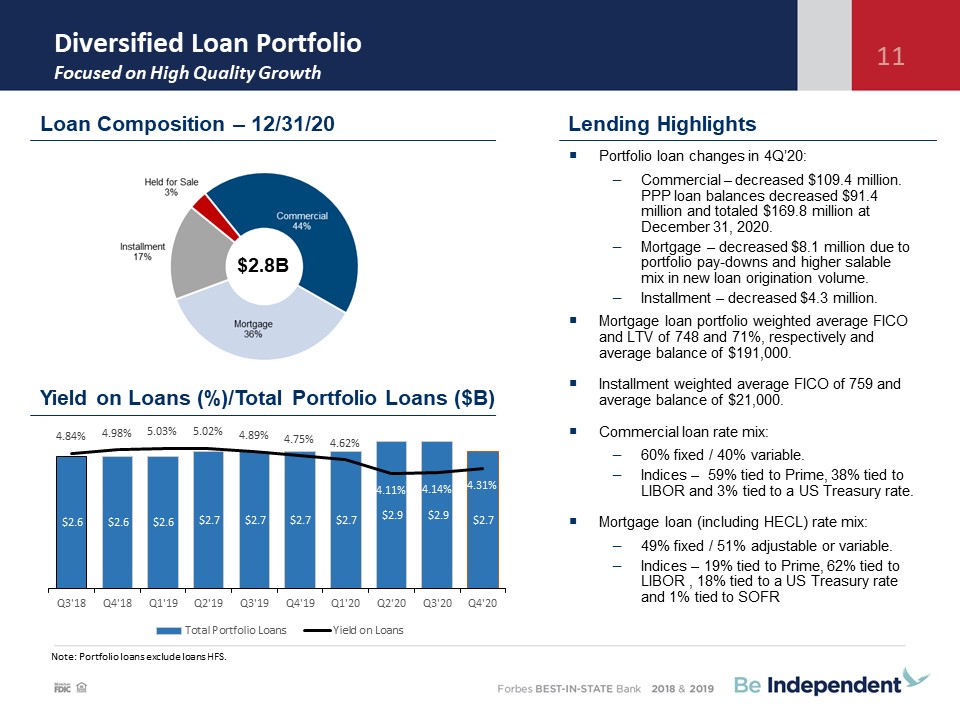
Total assets were $4.2 billion at December 31, 2020, an increase of $639.3 million from December 31, 2019. Loans, excluding loans held for sale, were $2.73 billion at
December 31, 2020, compared to $2.73 billion at December 31, 2019. Deposits totaled $3.64 billion at December 31, 2020, an increase of $600.6 million from December 31, 2019. This increase is primarily due to growth in non-interest bearing, savings
and interest-bearing checking and reciprocal deposit account balances.
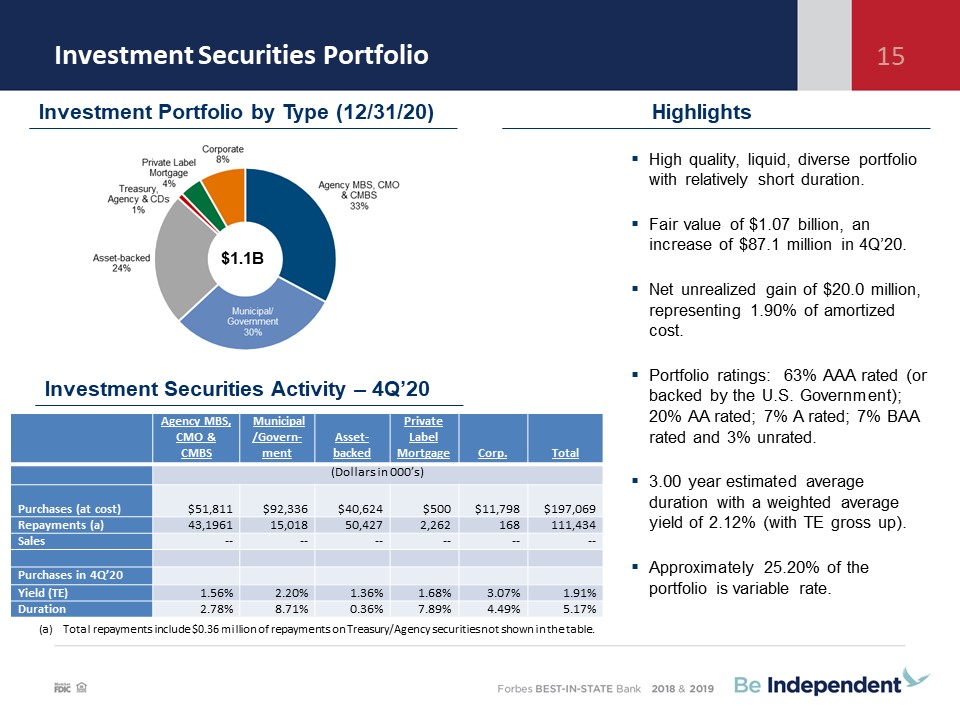
Cash and cash equivalents totaled $118.7 million at December 31, 2020, versus $65.3 million at December 31, 2019. Securities available for sale totaled $1.1 billion at
December 31, 2020, versus $518.4 million at December 31, 2019. The significant increase in securities available for sale is due to the deployment of funds generated from the growth in deposits.
In May 2020, the Company issued $40.0 million of subordinated notes with a ten year maturity, a five year call option and an initial coupon interest rate (fixed for the
first five years) of 5.95%.
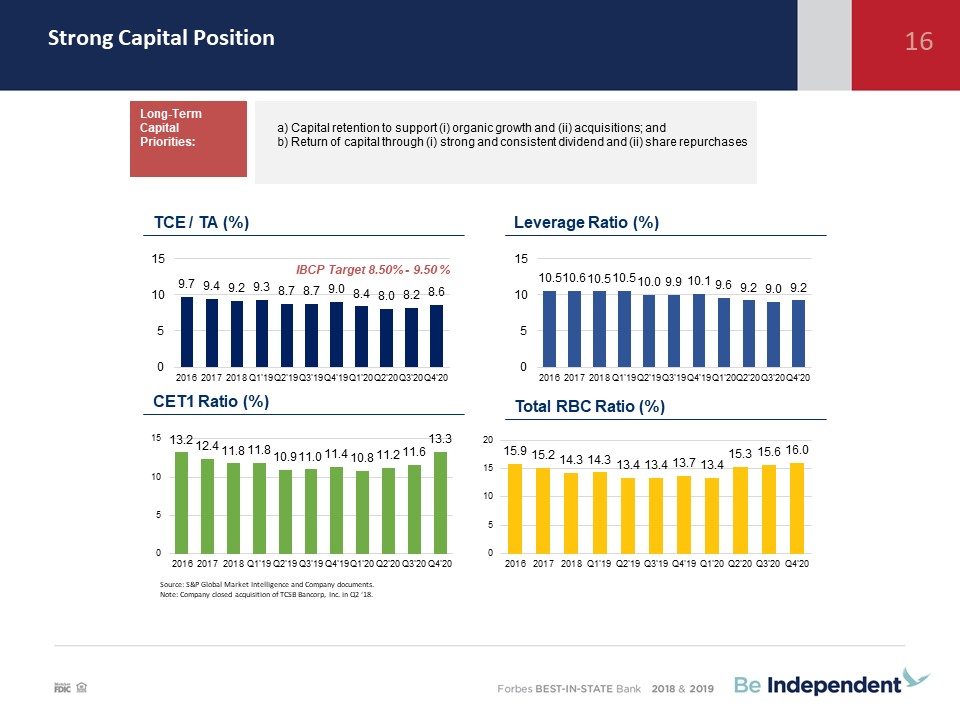
Total shareholders’ equity was $389.5 million at December 31, 2020, or 9.27% of total assets. Tangible common equity totaled $356.9 million at December 31, 2020, or
$16.33 per share. The Company’s wholly owned subsidiary, Independent Bank, remains significantly above “well capitalized” for regulatory purposes with the following ratios:
|
Regulatory Capital Ratios
|
12/31/2020
|
12/31/2019
|
Well
Capitalized Minimum
|
|||||||||
|
Tier 1 capital to average total assets
|
8.81
|
%
|
9.49
|
%
|
5.00
|
%
|
||||||
|
Tier 1 common equity to risk-weighted assets
|
12.81
|
%
|
11.96
|
%
|
6.50
|
%
|
||||||
|
Tier 1 capital to risk-weighted assets
|
12.81
|
%
|
11.96
|
%
|
8.00
|
%
|
||||||
|
Total capital to risk-weighted assets
|
14.06
|
%
|
12.96
|
%
|
10.00
|
%
|
||||||
Share Repurchase Plan
On December 18, 2020, the Board of Directors of the Company authorized the 2021 share repurchase plan. Under the terms of the 2021 share repurchase plan, the Company is
authorized to purchase up to 1,100,000 shares, or approximately 5% of its outstanding common stock. The repurchase plan is authorized to last through December 31, 2021.
Due primarily to the economic uncertainty brought on by the COVID-19 pandemic, the Company suspended its share repurchase plan in March 2020. However, as a result of the
Company’s strong financial performance and improved economic conditions, the Company reactivated the share repurchased plan in the fourth quarter of 2020 and acquired 30,027 shares at a weighted average price of $14.90. For the full-year 2020 the
Company repurchased 708,956 shares at a weighted average price of $20.07.
Earnings Conference Call
Brad Kessel, President and CEO and Gavin A. Mohr, CFO will review the quarterly results in a conference call for investors and analysts beginning at
11:00 am ET on Thursday, January 28, 2021.
To participate in the live conference call, please dial 1-866-200-8394. Also the
conference call will be accessible through an audio webcast with user-controlled slides via the following site/URL: https://services.choruscall.com/links/ibcp210128.html.
A playback of the call can be accessed by dialing 1-877-344-7529 (Conference ID # 10150378). The replay will be available through February 4, 2021.
About Independent Bank Corporation
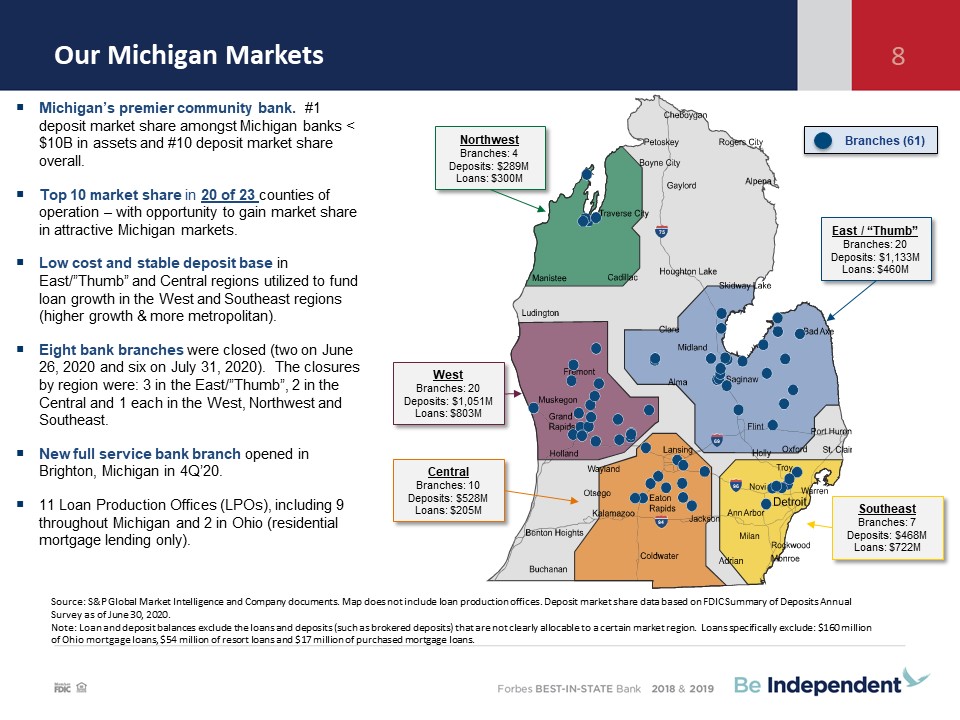
Independent Bank Corporation (NASDAQ: IBCP) is a Michigan-based bank holding company with total assets of approximately $4.2 billion. Founded as First National Bank of
Ionia in 1864, Independent Bank Corporation operates a branch network across Michigan's Lower Peninsula through one state-chartered bank subsidiary. This subsidiary (Independent Bank) provides a full range of financial services, including commercial
banking, mortgage lending, investments and insurance. Independent Bank Corporation is committed to providing exceptional personal service and value to its customers, stockholders and the communities it serves.
For more information, please visit our Web site at: IndependentBank.com.
5
Forward-Looking Statements
This press release contains forward-looking statements about Independent Bank Corporation. Statements that are not historical or current facts,
including statements about beliefs and expectations, are forward-looking statements and are based on the information available to, and assumptions and estimates made by, management as of the date hereof. These forward-looking statements cover, among
other things, anticipated future revenue and expenses and the future plans and prospects of Independent Bank Corporation. Forward-looking statements involve inherent risks and uncertainties, and important factors could cause actual results to differ
materially from those anticipated. The COVID-19 pandemic is adversely affecting Independent Bank Corporation, its customers, counterparties, employees, and third-party service providers, and the ultimate extent of the impacts on its business,
financial position, results of operations, liquidity, and prospects is uncertain. Continued deterioration in general business and economic conditions or turbulence in domestic or global financial markets could adversely affect Independent Bank
Corporation’s revenues and the values of its assets and liabilities, reduce the availability of funding from certain financial institutions, lead to a tightening of credit, and increase stock price volatility. In addition, changes to statutes,
regulations, or regulatory policies or practices could affect Independent Bank Corporation in substantial and unpredictable ways. Independent Bank Corporation’s results could also be adversely affected by changes in interest rates; further increases
in unemployment rates; deterioration in the credit quality of its loan portfolios or in the value of the collateral securing those loans; deterioration in the value of its investment securities; legal and regulatory developments; litigation;
increased competition from both banks and non-banks; changes in the level of tariffs and other trade policies of the United States and its global trading partners; changes in customer behavior and preferences; breaches in data security; failures to
safeguard personal information; effects of mergers and acquisitions and related integration; effects of critical accounting policies and judgments; and management’s ability to effectively manage credit risk, market risk, operational risk, compliance
risk, strategic risk, interest rate risk, liquidity risk and reputation risk.
Certain risks and important factors that could affect Independent Bank Corporation's future results are identified in its Annual
Report on Form 10-K for the year ended December 31, 2019 and other reports filed with the SEC, including among other things under the heading “Risk Factors” in such Annual Report on Form 10-K. Any forward-looking statement speaks only as of the date
on which it is made, and Independent Bank Corporation undertakes no obligation to update any forward-looking statement, whether to reflect events or circumstances, after the date on which the statement is made, to reflect new information or the
occurrence of unanticipated events, or otherwise.
6
INDEPENDENT BANK CORPORATION AND SUBSIDIARIES
Consolidated Statements of Financial Condition
|
December 31,
|
||||||||
|
2020
|
2019
|
|||||||
|
(unaudited)
|
||||||||
|
(In thousands, except share
|
||||||||
|
amounts)
|
||||||||
|
Assets
|
||||||||
|
Cash and due from banks
|
$
|
56,006
|
$
|
53,295
|
||||
|
Interest bearing deposits
|
62,699
|
12,009
|
||||||
|
Cash and Cash Equivalents
|
118,705
|
65,304
|
||||||
|
Interest bearing deposits - time
|
-
|
350
|
||||||
|
Securities available for sale
|
1,072,159
|
518,400
|
||||||
|
Federal Home Loan Bank and Federal Reserve Bank stock, at cost
|
18,427
|
18,359
|
||||||
|
Loans held for sale, carried at fair value
|
92,434
|
69,800
|
||||||
|
Loans
|
||||||||
|
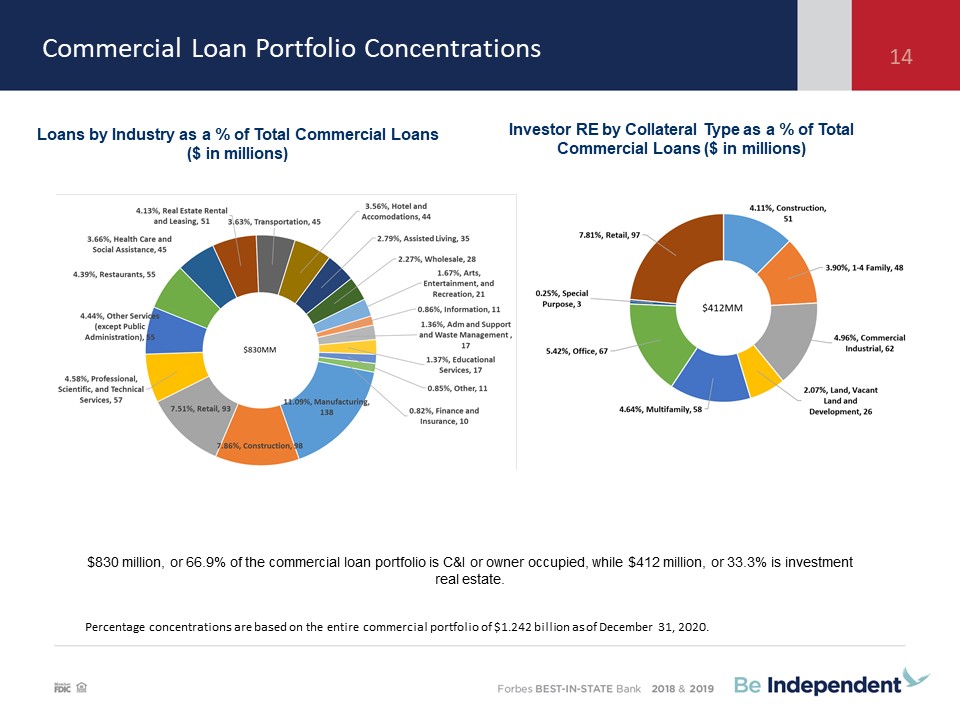
Commercial
|
1,242,415
|
1,166,695
|
||||||
|
Mortgage
|
1,015,926
|
1,098,911
|
||||||
|
Installment
|
475,337
|
459,417
|
||||||
|
Total Loans
|
2,733,678
|
2,725,023
|
||||||
|
Allowance for loan losses
|
(35,429
|
)
|
(26,148
|
)
|
||||
|
Net Loans
|
2,698,249
|
2,698,875
|
||||||
|
Other real estate and repossessed assets
|
766
|
1,865
|
||||||
|
Property and equipment, net
|
36,127
|
38,411
|
||||||
|
Bank-owned life insurance
|
55,180
|
55,710
|
||||||
|
Capitalized mortgage loan servicing rights
|
16,904
|
19,171
|
||||||
|
Other intangibles
|
4,306
|
5,326
|
||||||
|
Goodwill
|
28,300
|
28,300
|
||||||
|
Accrued income and other assets
|
62,456
|
44,823
|
||||||
|
Total Assets
|
$
|
4,204,013
|
$
|
3,564,694
|
||||
|
Liabilities and Shareholders' Equity
|
||||||||
|
Deposits
|
||||||||
|
Non-interest bearing
|
$
|
1,153,473
|
$
|
852,076
|
||||
|
Savings and interest-bearing checking
|
1,526,465
|
1,186,745
|
||||||
|
Reciprocal
|
556,185
|
431,027
|
||||||
|
Time
|
287,402
|
376,877
|
||||||
|
Brokered time
|
113,830
|
190,002
|
||||||
|
Total Deposits
|
3,637,355
|
3,036,727
|
||||||
|
Other borrowings
|
30,012
|
88,646
|
||||||
|
Subordinated debt
|
39,281
|
-
|
||||||
|
Subordinated debentures
|
39,524
|
39,456
|
||||||
|
Accrued expenses and other liabilities
|
68,319
|
49,696
|
||||||
|
Total Liabilities
|
3,814,491
|
3,214,525
|
||||||
|
Shareholders’ Equity
|
||||||||
|
Preferred stock, no par value, 200,000 shares authorized; none issued or outstanding
|
-
|
-
|
||||||
|
Common stock, no par value, 500,000,000 shares authorized; issued and outstanding: 21,853,800 shares at December 31, 2020
and 22,481,643 shares at December 31, 2019
|
339,353
|
352,344
|
||||||
|
Retained earnings
|
40,145
|
1,611
|
||||||
|
Accumulated other comprehensive income (loss)
|
10,024
|
(3,786
|
)
|
|||||
|
Total Shareholders’ Equity
|
389,522
|
350,169
|
||||||
|
Total Liabilities and Shareholders’ Equity
|
$
|
4,204,013
|
$
|
3,564,694
|
||||
7
INDEPENDENT BANK CORPORATION AND SUBSIDIARIES
Consolidated Statements of Operations
|
Three Months Ended
|
Twelve Months Ended
|
|||||||||||||||||||
|
December 31,
|
September 30,
|
December 31,
|
December 31,
|
|||||||||||||||||
|
2020
|
2020
|
2019
|
2020
|
2019
|
||||||||||||||||
|
(unaudited)
|
||||||||||||||||||||
|
Interest Income
|
(In thousands, except per share amounts)
|
|||||||||||||||||||
|
Interest and fees on loans
|
$
|
31,139
|
$
|
30,393
|
$
|
33,140
|
$
|
123,159
|
$
|
133,883
|
||||||||||
|
Interest on securities available for sale
|
||||||||||||||||||||
|
Taxable
|
3,299
|
3,450
|
3,031
|
12,655
|
11,842
|
|||||||||||||||
|
Tax-exempt
|
789
|
954
|
325
|
2,926
|
1,342
|
|||||||||||||||
|
Other investments
|
235
|
237
|
412
|
1,089
|
1,861
|
|||||||||||||||
|
Total Interest Income
|
35,462
|
35,034
|
36,908
|
139,829
|
148,928
|
|||||||||||||||
|
Interest Expense
|
||||||||||||||||||||
|
Deposits
|
3,516
|
2,062
|
5,487
|
12,666
|
23,425
|
|||||||||||||||
|
Other borrowings and subordinated debt and debentures
|
953
|
1,006
|
711
|
3,551
|
2,922
|
|||||||||||||||
|
Total Interest Expense
|
4,469
|
3,068
|
6,198
|
16,217
|
26,347
|
|||||||||||||||
|
Net Interest Income
|
30,993
|
31,966
|
30,710
|
123,612
|
122,581
|
|||||||||||||||
|
Provision for loan losses
|
(421
|
)
|
975
|
(221
|
)
|
12,463
|
824
|
|||||||||||||
|
Net Interest Income After Provision for Loan Losses
|
31,414
|
30,991
|
30,931
|
111,149
|
121,757
|
|||||||||||||||
|
Non-interest Income
|
||||||||||||||||||||
|
Service charges on deposit accounts
|
2,218
|
2,085
|
2,885
|
8,517
|
11,208
|
|||||||||||||||
|
Interchange income
|
2,819
|
3,428
|
2,553
|
11,230
|
10,297
|
|||||||||||||||
|
Net gains on assets
|
||||||||||||||||||||
|
Mortgage loans
|
15,873
|
20,205
|
6,388
|
62,560
|
19,978
|
|||||||||||||||
|
Securities available for sale
|
14
|
-
|
3
|
267
|
307
|
|||||||||||||||
|
Mortgage loan servicing, net
|
(384
|
)
|
(644
|
)
|
1,348
|
(9,350
|
)
|
(3,336
|
)
|
|||||||||||
|
Other
|
1,823
|
1,937
|
2,420
|
7,521
|
9,282
|
|||||||||||||||
|
Total Non-interest Income
|
22,363
|
27,011
|
15,597
|
80,745
|
47,736
|
|||||||||||||||
|
Non-interest Expense
|
||||||||||||||||||||
|
Compensation and employee benefits
|
20,039
|
21,954
|
18,546
|
74,781
|
67,501
|
|||||||||||||||
|
Occupancy, net
|
2,120
|
2,199
|
2,216
|
8,938
|
9,013
|
|||||||||||||||
|
Data processing
|
2,374
|
2,215
|
2,308
|
8,534
|
8,905
|
|||||||||||||||
|
Furniture, fixtures and equipment
|
964
|
999
|
1,055
|
4,089
|
4,113
|
|||||||||||||||
|
Interchange expense
|
926
|
831
|
883
|
3,342
|
3,215
|
|||||||||||||||
|
Communications
|
785
|
806
|
728
|
3,194
|
2,947
|
|||||||||||||||
|
Loan and collection
|
708
|
768
|
709
|
3,037
|
2,685
|
|||||||||||||||
|
Conversion related expenses
|
1,541
|
643
|
-
|
2,586
|
-
|
|||||||||||||||
|
Advertising
|
594
|
589
|
515
|
2,230
|
2,450
|
|||||||||||||||
|
Legal and professional
|
600
|
566
|
533
|
2,027
|
1,814
|
|||||||||||||||
|
FDIC deposit insurance
|
385
|
411
|
(38
|
)
|
1,596
|
685
|
||||||||||||||
|
Branch closure costs
|
-
|
-
|
417
|
-
|
||||||||||||||||
|
Correspondent bank service fees
|
101
|
101
|
111
|
395
|
411
|
|||||||||||||||
|
Net (gains) losses on other real estate and repossessed assets
|
(82
|
)
|
46
|
(63
|
)
|
64
|
(90
|
)
|
||||||||||||
|
Other
|
1,652
|
1,513
|
1,800
|
7,183
|
8,084
|
|||||||||||||||
|
Total Non-interest Expense
|
32,707
|
33,641
|
29,303
|
122,413
|
111,733
|
|||||||||||||||
|
Income Before Income Tax
|
21,070
|
24,361
|
17,225
|
69,481
|
57,760
|
|||||||||||||||
|
Income tax expense
|
4,084
|
4,777
|
3,346
|
13,329
|
11,325
|
|||||||||||||||
|
Net Income
|
$
|
16,986
|
$
|
19,584
|
$
|
13,879
|
$
|
56,152
|
$
|
46,435
|
||||||||||
|
Net Income Per Common Share
|
||||||||||||||||||||
|
Basic
|
$
|
0.78
|
$
|
0.90
|
$
|
0.62
|
$
|
2.56
|
$
|
2.03
|
||||||||||
|
Diluted
|
$
|
0.77
|
$
|
0.89
|
$
|
0.61
|
$
|
2.53
|
$
|
2.00
|
||||||||||
8
INDEPENDENT BANK CORPORATION AND SUBSIDIARIES
Selected Financial Data
|
December 31,
2020
|
September 30,
2020
|
June 30,
2020
|
March 31,
2020
|
December 31,
2019
|
||||||||||||||||
|
(unaudited)
|
||||||||||||||||||||
|
(Dollars in thousands except per share data)
|
||||||||||||||||||||
|
Three Months Ended
|
||||||||||||||||||||
|
Net interest income
|
$
|
30,993
|
$
|
31,966
|
$
|
30,462
|
$
|
30,191
|
$
|
30,710
|
||||||||||
|
Provision for loan losses
|
(421
|
)
|
975
|
5,188
|
6,721
|
(221
|
)
|
|||||||||||||
|
Non-interest income
|
22,363
|
27,011
|
20,367
|
11,004
|
15,597
|
|||||||||||||||
|
Non-interest expense
|
32,707
|
33,641
|
27,346
|
28,719
|
29,303
|
|||||||||||||||
|
Income before income tax
|
21,070
|
24,361
|
18,295
|
5,755
|
17,225
|
|||||||||||||||
|
Income tax expense
|
4,084
|
4,777
|
3,523
|
945
|
3,346
|
|||||||||||||||
|
Net income
|
$
|
16,986
|
$
|
19,584
|
$
|
14,772
|
$
|
4,810
|
$
|
13,879
|
||||||||||
|
Basic earnings per share
|
$
|
0.78
|
$
|
0.90
|
$
|
0.67
|
$
|
0.22
|
$
|
0.62
|
||||||||||
|
Diluted earnings per share
|
0.77
|
0.89
|
0.67
|
0.21
|
0.61
|
|||||||||||||||
|
Cash dividend per share
|
0.20
|
0.20
|
0.20
|
0.20
|
0.18
|
|||||||||||||||
|
Average shares outstanding
|
21,866,326
|
21,881,562
|
21,890,761
|
22,271,412
|
22,481,551
|
|||||||||||||||
|
Average diluted shares outstanding
|
22,112,829
|
22,114,692
|
22,113,187
|
22,529,370
|
22,776,908
|
|||||||||||||||
|
Performance Ratios
|
||||||||||||||||||||
|
Return on average assets
|
1.61
|
%
|
1.90
|
%
|
1.54
|
%
|
0.54
|
%
|
1.56
|
%
|
||||||||||
|
Return on average equity
|
17.82
|
21.36
|
17.39
|
5.54
|
15.92
|
|||||||||||||||
|
Efficiency ratio (1)
|
60.59
|
56.36
|
53.07
|
69.32
|
62.56
|
|||||||||||||||
|
As a Percent of Average Interest-Earning Assets (1)
|
||||||||||||||||||||
|
Interest income
|
3.57
|
%
|
3.62
|
%
|
3.72
|
%
|
4.28
|
%
|
4.44
|
%
|
||||||||||
|
Interest expense
|
0.45
|
0.31
|
0.36
|
0.65
|
0.74
|
|||||||||||||||
|
Net interest income
|
3.12
|
3.31
|
3.36
|
3.63
|
3.70
|
|||||||||||||||
|
Average Balances
|
||||||||||||||||||||
|
Loans
|
$
|
2,876,795
|
$
|
2,925,872
|
$
|
2,913,857
|
$
|
2,766,770
|
$
|
2,776,037
|
||||||||||
|
Securities available for sale
|
1,009,578
|
891,975
|
660,126
|
527,395
|
488,016
|
|||||||||||||||
|
Total earning assets
|
3,984,080
|
3,887,455
|
3,659,614
|
3,350,948
|
3,320,828
|
|||||||||||||||
|
Total assets
|
4,195,546
|
4,102,318
|
3,868,408
|
3,565,829
|
3,529,744
|
|||||||||||||||
|
Deposits
|
3,632,758
|
3,559,070
|
3,303,302
|
3,066,298
|
3,040,099
|
|||||||||||||||
|
Interest bearing liabilities
|
2,574,306
|
2,532,481
|
2,402,361
|
2,309,995
|
2,251,928
|
|||||||||||||||
|
Shareholders' equity
|
379,232
|
364,714
|
341,606
|
348,963
|
345,910
|
|||||||||||||||
|
End of Period
|
||||||||||||||||||||
|
Capital
|
||||||||||||||||||||
|
Tangible common equity ratio
|
8.56
|
%
|
8.23
|
%
|
8.03
|
%
|
8.40
|
%
|
8.96
|
%
|
||||||||||
|
Average equity to average assets
|
9.04
|
8.89
|
8.83
|
9.79
|
9.80
|
|||||||||||||||
|
Common shareholders' equity per share of common stock
|
$
|
17.82
|
$
|
17.05
|
$
|
16.23
|
$
|
15.33
|
$
|
15.58
|
||||||||||
|
Tangible common equity per share of common stock
|
16.33
|
15.55
|
14.72
|
13.81
|
14.08
|
|||||||||||||||
|
Total shares outstanding
|
21,853,800
|
21,885,368
|
21,880,183
|
21,892,001
|
22,481,643
|
|||||||||||||||
|
Selected Balances
|
||||||||||||||||||||
|
Loans
|
$
|
2,733,678
|
$
|
2,855,479
|
$
|
2,866,663
|
$
|
2,718,115
|
$
|
2,725,023
|
||||||||||
|
Securities available for sale
|
1,072,159
|
985,050
|
856,280
|
594,284
|
518,400
|
|||||||||||||||
|
Total earning assets
|
3,979,397
|
3,962,824
|
3,833,523
|
3,416,845
|
3,343,941
|
|||||||||||||||
|
Total assets
|
4,204,013
|
4,168,944
|
4,043,315
|
3,632,387
|
3,564,694
|
|||||||||||||||
|
Deposits
|
3,637,355
|
3,597,745
|
3,485,125
|
3,083,564
|
3,036,727
|
|||||||||||||||
|
Interest bearing liabilities
|
2,553,418
|
2,515,185
|
2,456,193
|
2,350,056
|
2,312,753
|
|||||||||||||||
|
Shareholders' equity
|
389,522
|
373,092
|
355,123
|
335,618
|
350,169
|
|||||||||||||||
|
(1)
|
Presented on a fully tax equivalent basis assuming a marginal tax rate of 21%.
|
9
Reconciliation of Non-GAAP Financial Measures
Independent Bank Corporation
Independent Bank Corporation believes non-GAAP measures are meaningful because they reflect adjustments commonly made by management, investors, regulators and analysts
to evaluate the adequacy of common equity and performance trends. Tangible common equity is used by the Company to measure the quality of capital.
Reconciliation of Non-GAAP Financial Measures
|
Three Months Ended
December 31,
|
Twelve Months Ended
December 31,
|
|||||||||||||||
|
2020
|
2019
|
2020
|
2019
|
|||||||||||||
|
(Dollars in thousands)
|
||||||||||||||||
|
Net Interest Margin, Fully Taxable Equivalent ("FTE")
|
||||||||||||||||
|
Net interest income
|
$
|
30,993
|
$
|
30,710
|
$
|
123,612
|
$
|
122,581
|
||||||||
|
Add: taxable equivalent adjustment
|
221
|
104
|
823
|
423
|
||||||||||||
|
Net interest income - taxable equivalent
|
$
|
31,214
|
$
|
30,814
|
$
|
124,435
|
$
|
123,004
|
||||||||
|
Net interest margin (GAAP) (1)
|
3.10
|
%
|
3.68
|
%
|
3.32
|
%
|
3.79
|
%
|
||||||||
|
Net interest margin (FTE) (1)
|
3.12
|
%
|
3.70
|
%
|
3.34
|
%
|
3.80
|
%
|
||||||||
|
(1)
|
Annualized for three months ended December 31, 2020 and 2019.
|
Tangible Common Equity Ratio
|
December 31,
2020
|
September 30,
2020
|
June 30,
2020
|
March 31,
2020
|
December 31,
2019
|
||||||||||||||||
|
(Dollars in thousands)
|
||||||||||||||||||||
|
Common shareholders' equity
|
$
|
389,522
|
$
|
373,092
|
$
|
355,123
|
$
|
335,618
|
$
|
350,169
|
||||||||||
|
Less:
|
||||||||||||||||||||
|
Goodwill
|
28,300
|
28,300
|
28,300
|
28,300
|
28,300
|
|||||||||||||||
|
Other intangibles
|
4,306
|
4,561
|
4,816
|
5,071
|
5,326
|
|||||||||||||||
|
Tangible common equity
|
$
|
356,916
|
$
|
340,231
|
$
|
322,007
|
$
|
302,247
|
$
|
316,543
|
||||||||||
|
Total assets
|
$
|
4,204,013
|
$
|
4,168,944
|
$
|
4,043,315
|
$
|
3,632,387
|
$
|
3,564,694
|
||||||||||
|
Less:
|
||||||||||||||||||||
|
Goodwill
|
28,300
|
28,300
|
28,300
|
28,300
|
28,300
|
|||||||||||||||
|
Other intangibles
|
4,306
|
4,561
|
4,816
|
5,071
|
5,326
|
|||||||||||||||
|
Tangible assets
|
$
|
4,171,407
|
$
|
4,136,083
|
$
|
4,010,199
|
$
|
3,599,016
|
$
|
3,531,068
|
||||||||||
|
Common equity ratio
|
9.27
|
%
|
8.95
|
%
|
8.78
|
%
|
9.24
|
%
|
9.82
|
%
|
||||||||||
|
Tangible common equity ratio
|
8.56
|
%
|
8.23
|
%
|
8.03
|
%
|
8.40
|
%
|
8.96
|
%
|
||||||||||
|
Tangible Common Equity per Share of Common Stock:
|
||||||||||||||||||||
|
Common shareholders' equity
|
$
|
389,522
|
$
|
373,092
|
$
|
355,123
|
$
|
335,618
|
$
|
350,169
|
||||||||||
|
Tangible common equity
|
$
|
356,916
|
$
|
340,231
|
$
|
322,007
|
$
|
302,247
|
$
|
316,543
|
||||||||||
|
Shares of common stock outstanding (in thousands)
|
21,854
|
21,885
|
21,880
|
21,892
|
22,482
|
|||||||||||||||
|
Common shareholders' equity per share of common stock
|
$
|
17.82
|
$
|
17.05
|
$
|
16.23
|
$
|
15.33
|
$
|
15.58
|
||||||||||
|
Tangible common equity per share of common stock
|
$
|
16.33
|
$
|
15.55
|
$
|
14.72
|
$
|
13.81
|
$
|
14.08
|
||||||||||
The tangible common equity ratio removes the effect of goodwill and other intangible assets from capital and total assets. Tangible common equity per share of common stock removes the effect of goodwill and other intangible assets from common shareholders’ equity per share of common stock.
10