Exhibit 99.1

News Release
Independent Bank Corporation
4200 East Beltline
Grand Rapids, MI 49525
616.527.5820
| For Release: |
Immediately
|
| Contact: |
William B. Kessel, President and CEO, 616.447.3933
|
Robert N. Shuster, Chief Financial Officer, 616.522.1765
INDEPENDENT BANK CORPORATION REPORTS
2018 THIRD QUARTER RESULTS
GRAND RAPIDS, Mich., Oct. 25, 2018 - Independent Bank
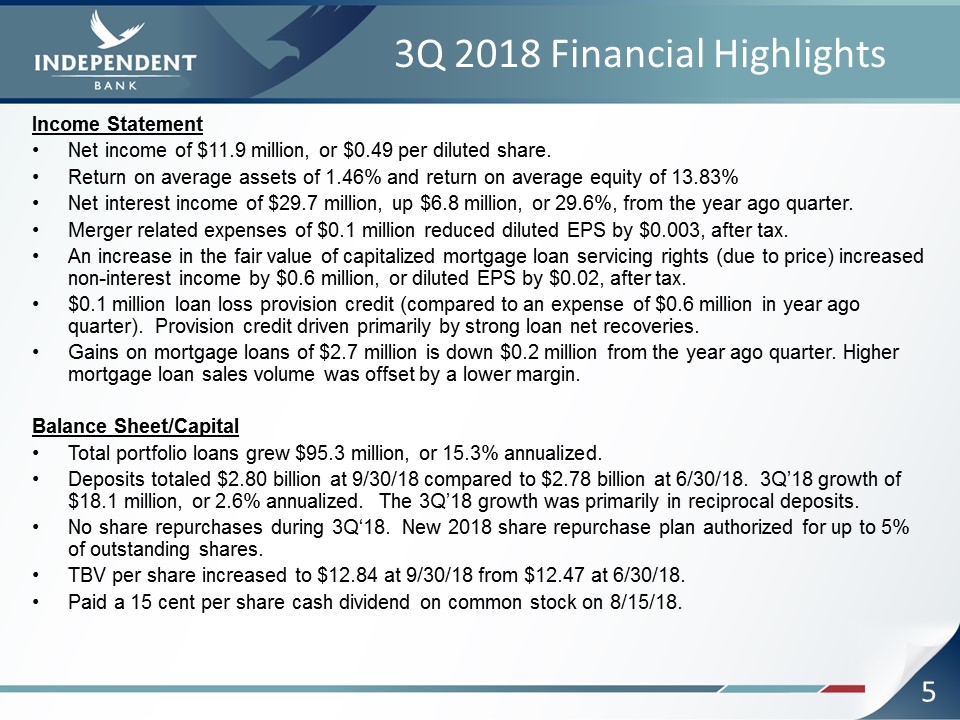
Corporation (NASDAQ: IBCP) reported third quarter 2018 net income of $11.9 million, or $0.49 per diluted share, versus net income of $6.9 million, or $0.32 per diluted share,
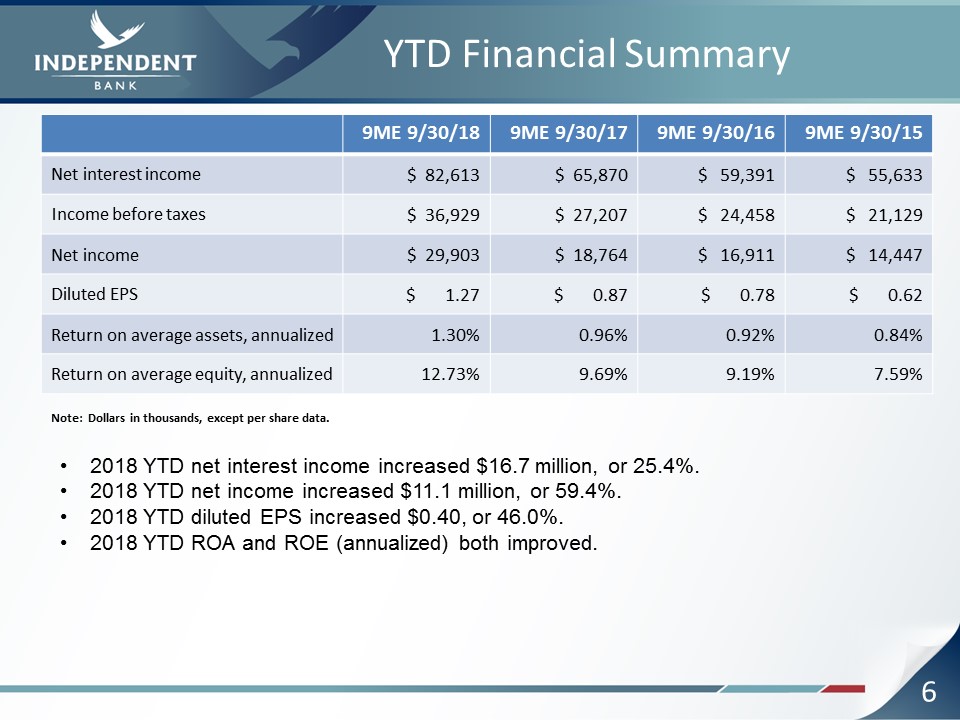
in the prior-year period. For the nine months ended Sept. 30, 2018, the Company reported net income of $29.9 million, or $1.27 per diluted share, compared to net income of $18.8 million, or $0.87 per diluted share, in the prior-year period. The
increases in third quarter and year to date 2018 earnings as compared to 2017 primarily reflect increases in net interest income and in non-interest income and a decrease in income tax expense that were partially offset by an increase in
non-interest expense.
Significant items impacting comparable quarterly and year to date 2018 and 2017 results include the following:
| · |
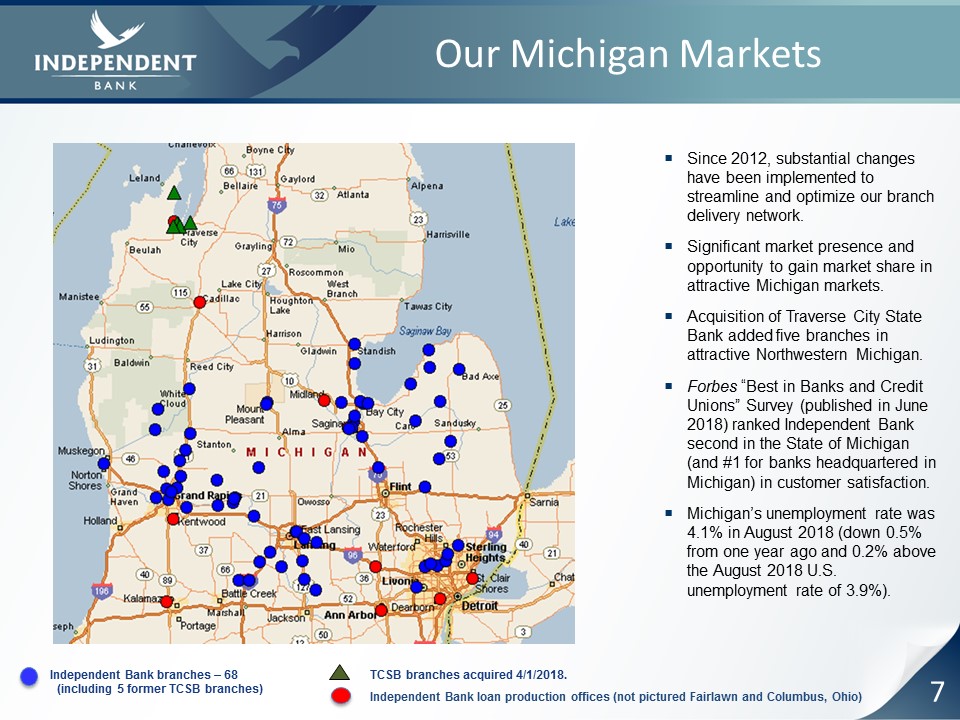
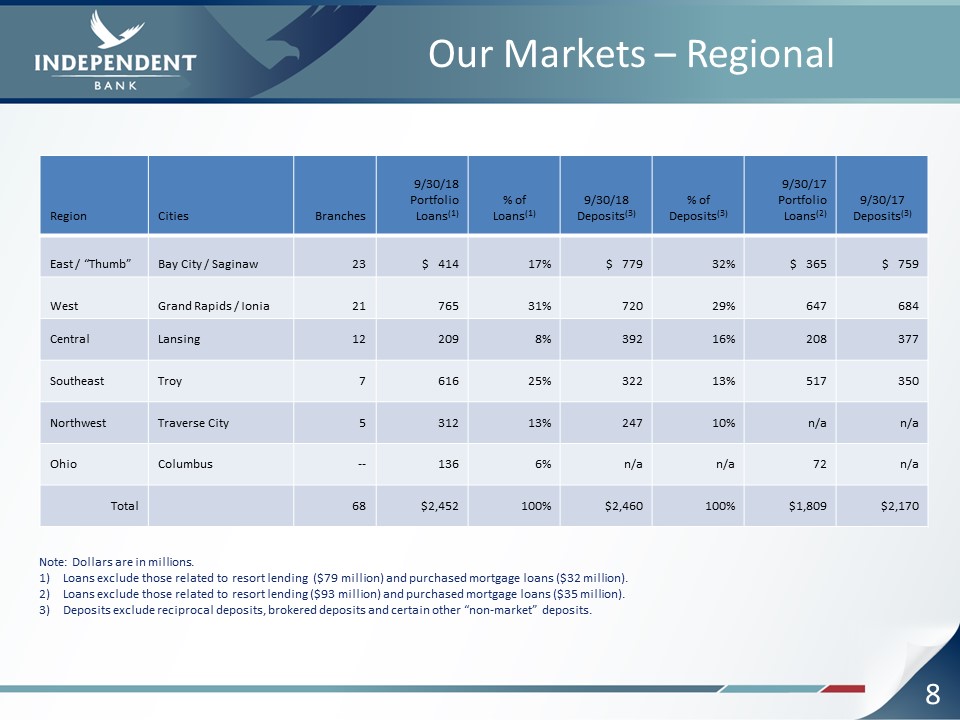
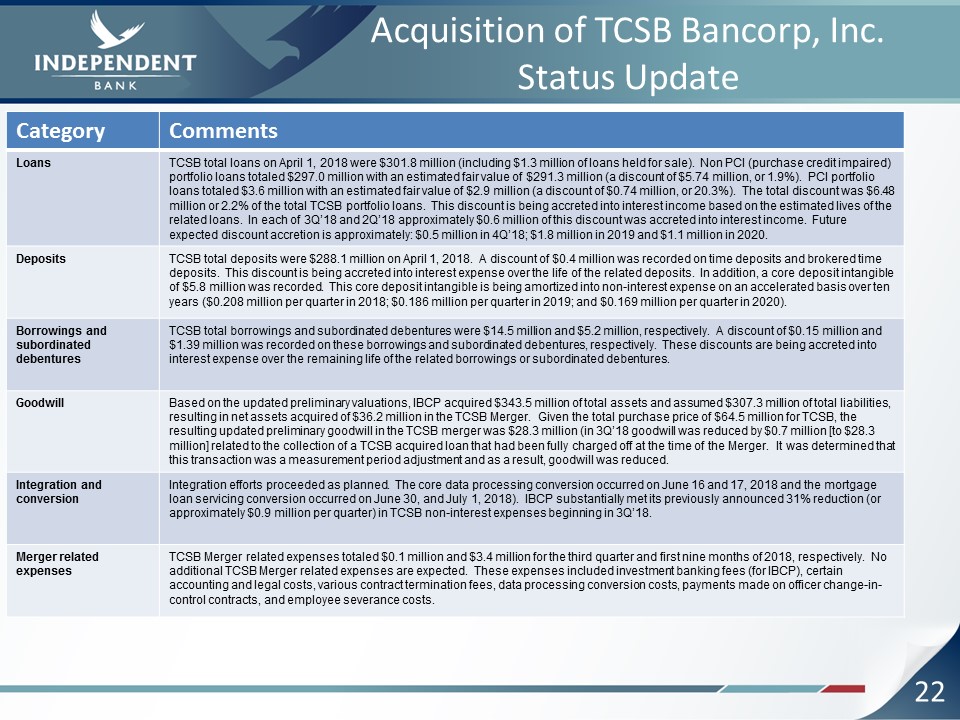
The acquisition of TCSB Bancorp, Inc. (“TCSB”), and its subsidiary, Traverse City State Bank, on Apr. 1, 2018 (referred to as the “Merger” or “TCSB Acquisition”) and the
associated data processing systems conversions in June 2018. The total assets, loans and deposits acquired in the Merger were approximately $343.5 million, $295.8 million (including $1.3 million of loans held for sale) and $287.7
million, respectively.
|
| · |
Merger related expenses of $0.1 million ($0.003 per diluted share, after taxes) and $3.4 million ($0.11 per diluted share, after taxes) for the three- and nine-months
ended Sept. 30, 2018, respectively.
|
| · |
Positive changes in the fair value due to price of capitalized mortgage loan servicing rights of $0.6 million ($0.02 per diluted share, after taxes) and $2.6 million
($0.09 per diluted share, after taxes) for the three- and nine-months ended Sept. 30, 2018, respectively, as compared to negative changes of $0.6 million ($0.02 per diluted share, after taxes) and $1.1 million ($0.03 per diluted
share, after taxes) for the three- and nine-months ended Sept. 30, 2017, respectively.
|
| · |
The passage of the "Tax Cuts and Jobs Act" which, among other things, reduced the federal corporate income
tax rate to 21% (from 35%) effective January 1, 2018.
|
Third quarter 2018 highlights include:
| · |
Year-over-year increases in net income and diluted earnings per share of 73.9% and 53.1%, respectively;
|
| · |
A year-over-year increase in quarterly net interest income of $6.8 million, or 29.6%;
|
| · |
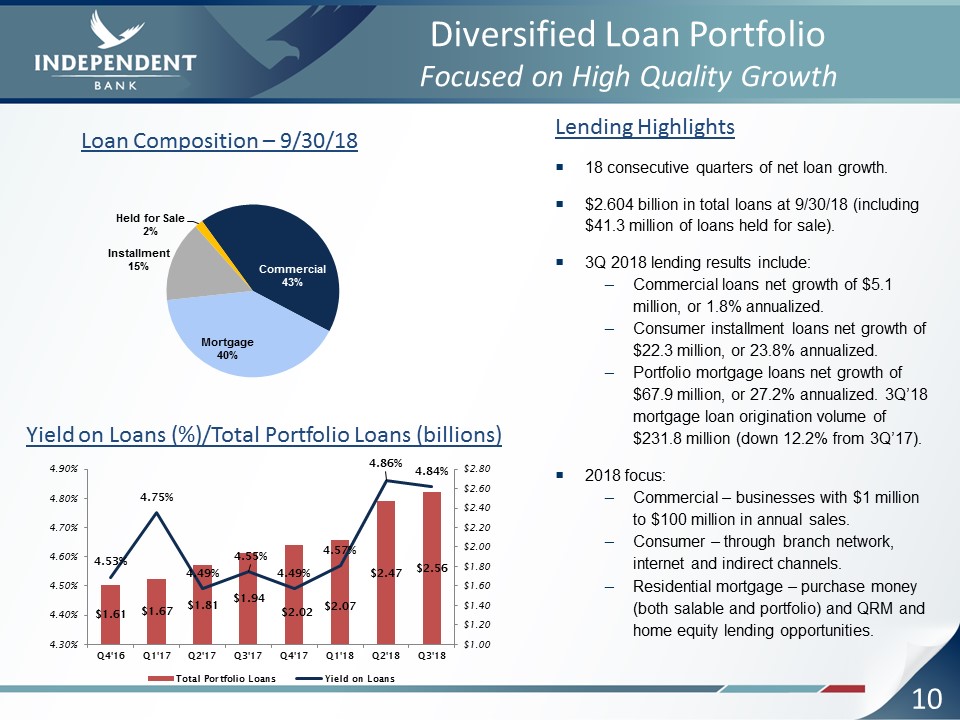
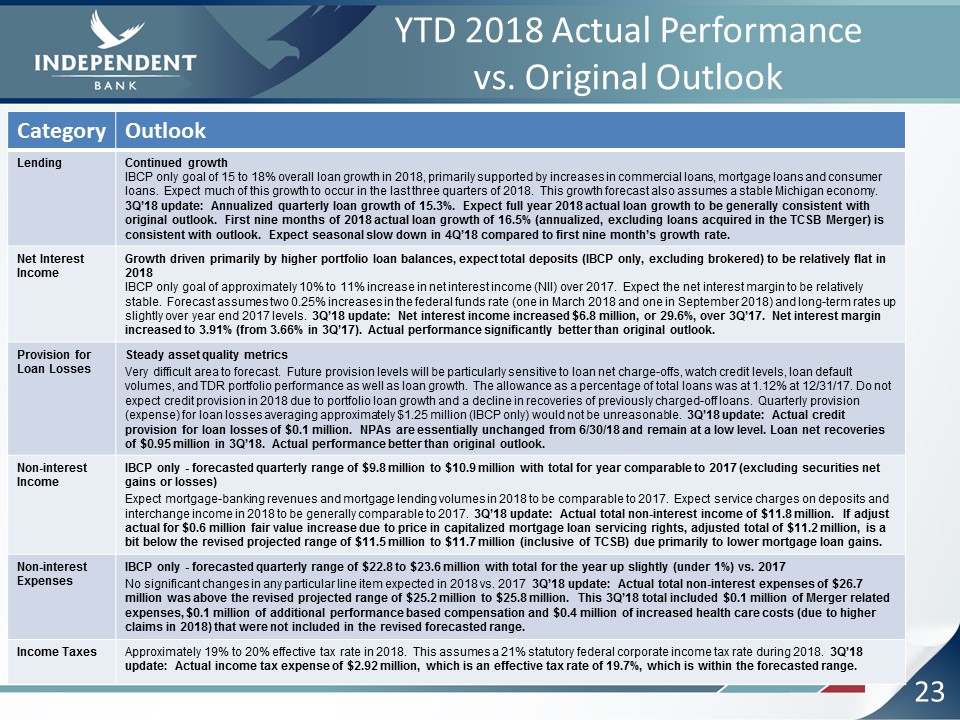
Total portfolio loan net growth of $95.3 million, or 15.3% annualized;
|
| · |
Continued strong asset quality metrics; and
|
| · |
The payment of a 15 cent per share dividend on common stock on Aug. 15, 2018.
|
William B. (“Brad”) Kessel, the President and Chief Executive Officer of Independent Bank
Corporation, commented: “We are pleased to report another quarter of solid financial performance. The favorable impact of the TCSB Acquisition combined with strong loan origination activity led to meaningful loan growth and increased
net interest income. Net income and diluted earnings per share have increased significantly in 2018 as we gained greater operating leverage and efficiency as well as benefitting from a reduced corporate income tax rate. As we look ahead to the
remainder of 2018 and beyond, we are focused on building on the momentum generated in the first nine months of 2018.”
1
Operating Results
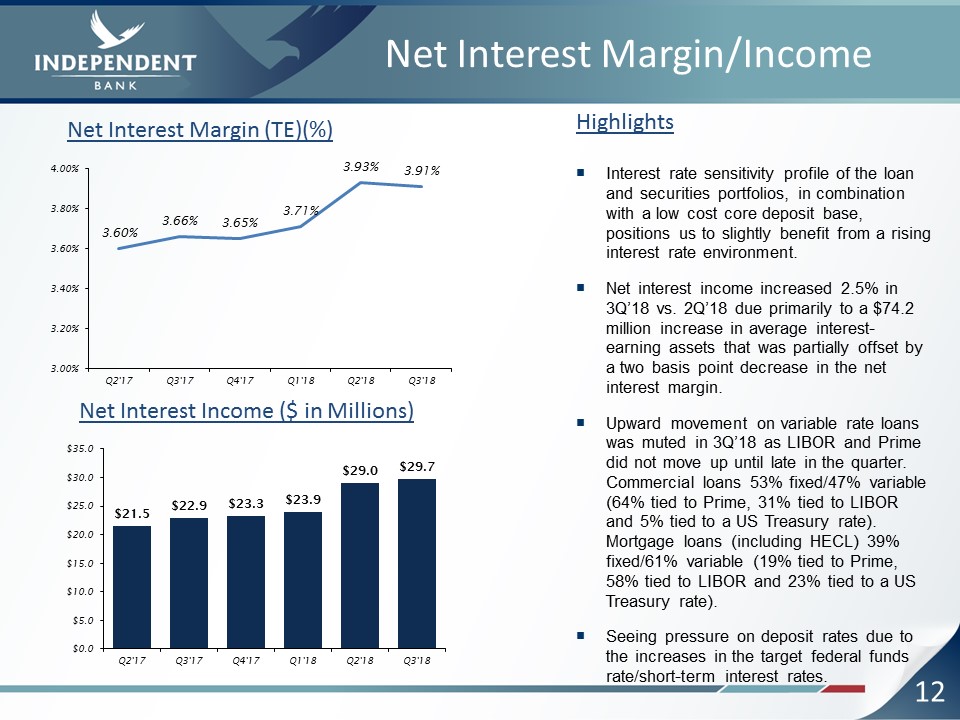
The Company’s net interest income totaled $29.7 million during the third quarter of 2018, an increase of $6.8 million, or 29.6% from the year-ago period,
and up $0.7 million, or 2.5%, from the second quarter of 2018. The Company’s tax equivalent net interest income as a percent of average interest-earning assets (the “net interest margin”) was 3.91% during the third quarter of 2018, compared to
3.66% in the year-ago period, and 3.93% in the second quarter of 2018. The year-over-year quarterly increase in net interest income is due to increases in both average interest-earning assets and in the net interest margin. Average
interest-earning assets were $3.04 billion in the third quarter of 2018, compared to $2.52 billion in the year ago quarter and $2.96 billion in the second quarter of 2018. Third quarter 2018 interest income on loans includes $0.6 million of
accretion of the discount recorded on the TCSB loans acquired in the Merger. The total discount initially recorded on the TCSB loans acquired in the Merger was $6.5 million (or approximately 2.2% of the total TCSB loans acquired in the Merger).
For the first nine months of 2018, net interest income totaled $82.6 million, an increase of $16.7 million, or 25.4% from the first nine months of 2017.
The Company’s net interest margin for the first nine months of 2018 was 3.86% compared to 3.65% in 2017. Year-to-date 2018 interest income on loans includes $1.2 million of accretion of the discount recorded on the TCSB loans acquired in the
Merger. The increase in net interest income for the first nine months of 2018 is due to increases in both average interest-earning assets and in the net interest margin.
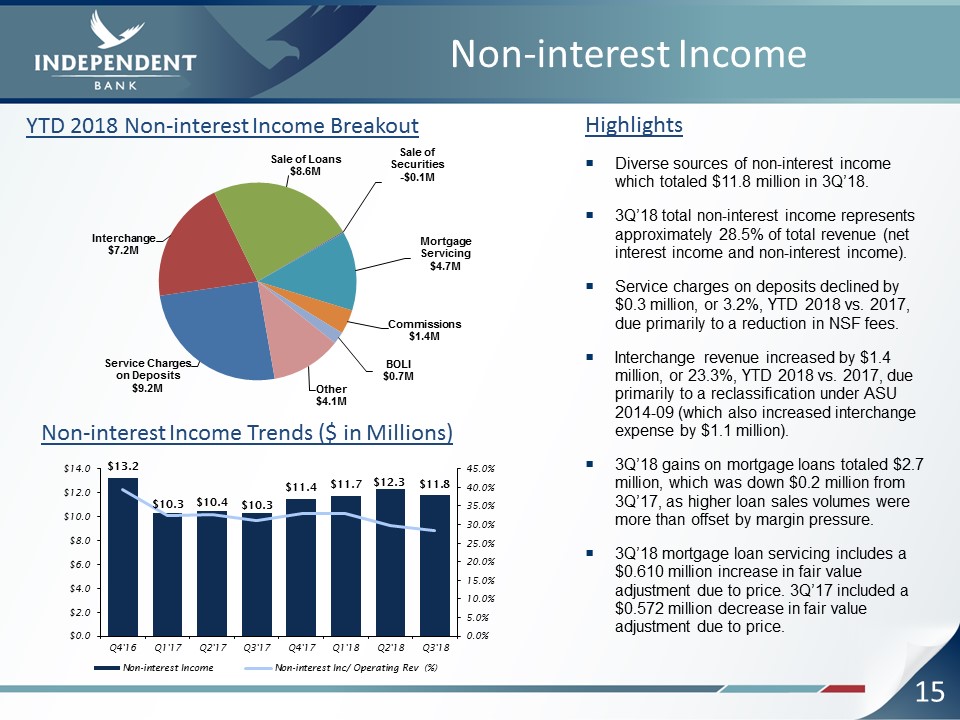
Non-interest income totaled $11.8 million and $35.9 million, respectively, for the third quarter and first nine months of 2018, compared to $10.3 million
and $31.1 million in the respective comparable year ago periods. These increases were primarily due to growth in interchange income and mortgage loan servicing, net, as described below.
The Company adopted Financial Accounting Standards Board Accounting Standards Update 2014-09 “Revenue from Contracts with Customers (Topic 606)” (“ASU
2014-09”) on Jan. 1, 2018, using the modified retrospective approach. Although ASU 2014-09 did not have any impact on Jan. 1, 2018 shareholders’ equity or 2018 net income, it did result in some classification changes in non-interest income and
non-interest expense as compared to the prior year period. Specifically, in the third quarter and first nine months of 2018, interchange income and interchange expense each increased by $0.4 million and $1.1 million, respectively, due to
classification changes under ASU 2014-09.
Net gains on mortgage loans were $2.7 million and $3.0 million in the third quarters of 2018 and 2017, respectively. For the first nine months of 2018,
net gains on mortgage loans totaled $8.6 million compared to $8.9 million in 2017. An increase in mortgage loan sales volume in 2018 was offset by margin compression due principally to competitive factors.
Mortgage loan servicing, net, generated income of $1.2 million and $0.001 million in the third quarters of 2018 and 2017, respectively. For the first
nine months of 2018, mortgage loan servicing, net, generated income of $4.7 million as compared to income of $0.7 million in 2017. This activity is summarized in the following table:
|
Three Months Ended
|
Nine Months Ended
|
|||||||||||||||
|
9/30/2018
|
9/30/2017
|
9/30/2018
|
9/30/2017
|
|||||||||||||
|
Mortgage loan servicing, net:
|
(Dollars in thousands)
|
|||||||||||||||
|
Revenue, net
|
$
|
1,410
|
$
|
1,091
|
$
|
3,974
|
$
|
3,253
|
||||||||
|
Fair value change due to price
|
610
|
(572
|
)
|
2,586
|
(1,075
|
)
|
||||||||||
|
Fair value change due to pay-downs
|
(808
|
)
|
(518
|
)
|
(1,892
|
)
|
(1,510
|
)
|
||||||||
|
Total
|
$
|
1,212
|
$
|
1
|
$
|
4,668
|
$
|
668
|
||||||||
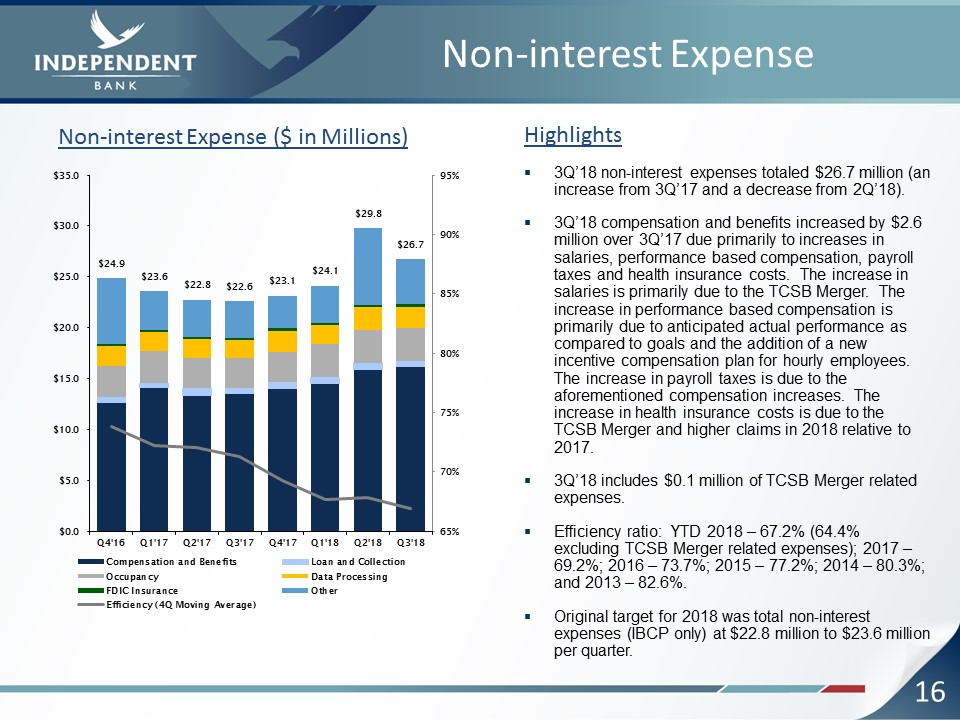
Non-interest expenses totaled $26.7 million in the third quarter of 2018, compared to $22.6 million in the year-ago period. For the first nine months of
2018, non-interest expenses totaled $80.6 million compared to $68.9 million in 2017. These year-over-year increases in non-interest expense are primarily due to the TCSB Acquisition (including the aforementioned Merger related expenses) as well
as higher performance based compensation and health insurance costs.
The Company recorded an income tax expense of $2.9 million and $7.0 million in the third quarter and first nine months of 2018, respectively. This
compares to an income tax expense of $3.2 million and $8.4 million in the third quarter and first nine months of 2017, respectively. The decline in income tax expense is primarily due to a reduction in the statutory federal corporate income tax
rate to 21% (from 35%) that became effective on Jan. 1, 2018, which was partially offset by an increase in income before income tax.
2
Asset Quality
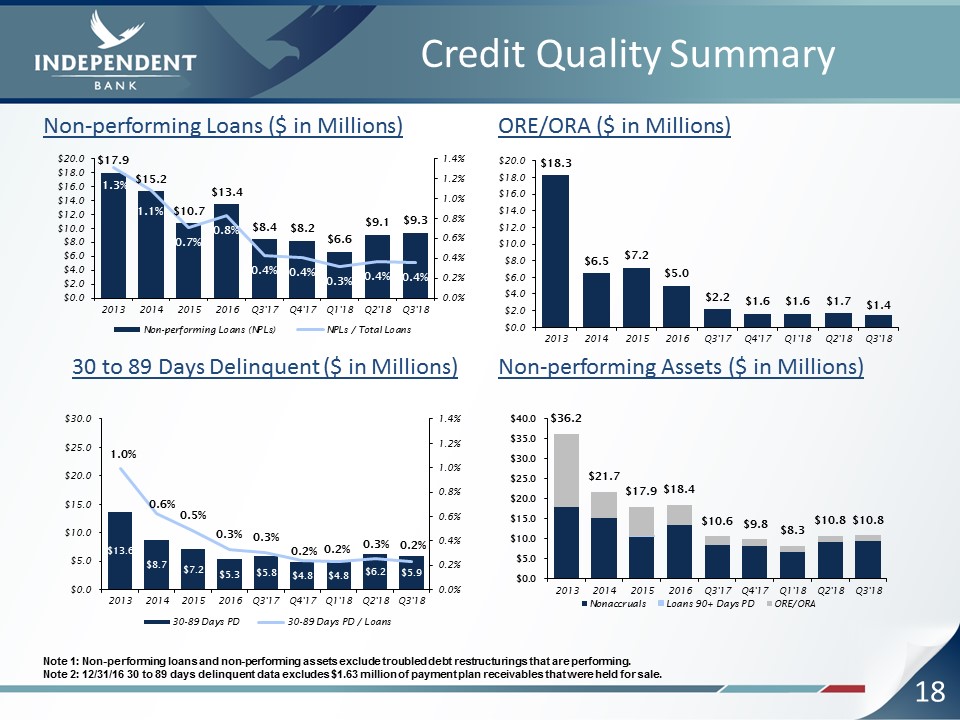
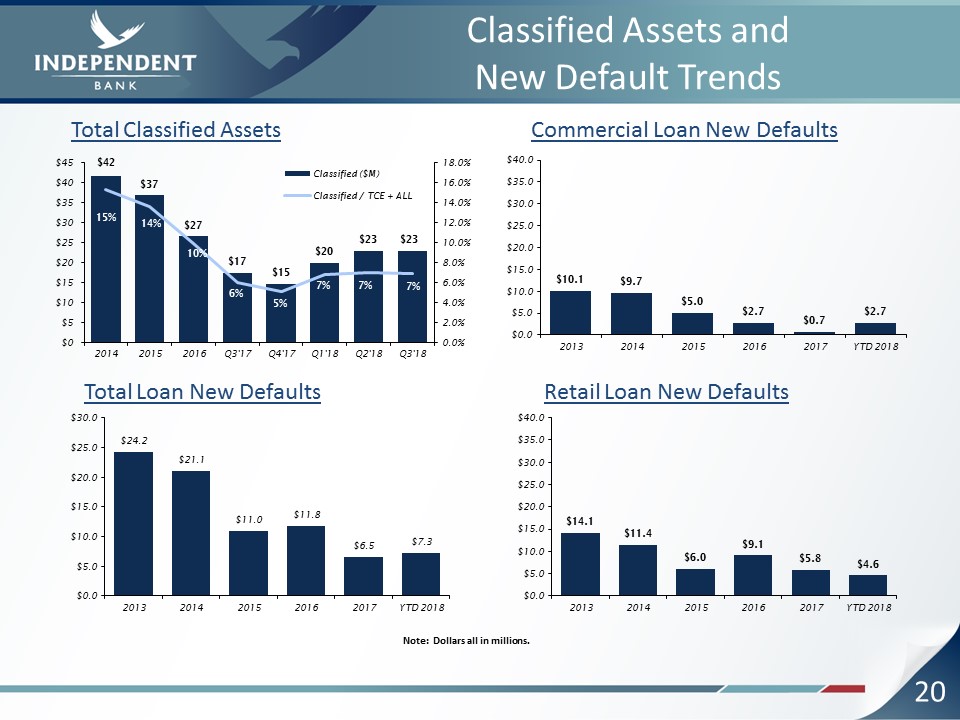
Commenting on asset quality, President and CEO Kessel added: “Non-performing loans and assets as well as loan net charge-offs remain at low levels. In
addition, thirty- to eighty-nine day delinquency rates at Sept. 30, 2018 were 0.08% for commercial loans and 0.34% for mortgage and consumer loans. These early stage delinquency rates continue to be well-managed.”
A breakdown of non-performing loans(1) by loan type is as follows:
|
Loan Type
|
9/30/2018
|
12/31/2017
|
9/30/2017
|
|||||||||
|
(Dollars in thousands)
|
||||||||||||
|
Commercial
|
$
|
2,782
|
$
|
646
|
$
|
788
|
||||||
|
Consumer/installment
|
756
|
543
|
525
|
|||||||||
|
Mortgage
|
5,805
|
6,995
|
7,097
|
|||||||||
|
Total
|
$
|
9,343
|
$
|
8,184
|
$
|
8,410
|
||||||
|
Ratio of non-performing loans to total portfolio loans
|
0.36
|
%
|
0.41
|
%
|
0.43
|
%
|
||||||
|
Ratio of non-performing assets to total assets
|
0.33
|
%
|
0.35
|
%
|
0.38
|
%
|
||||||
|
Ratio of the allowance for loan losses to non-performing loans
|
261.17
|
%
|
275.99
|
%
|
255.39
|
%
|
||||||
| (1) |
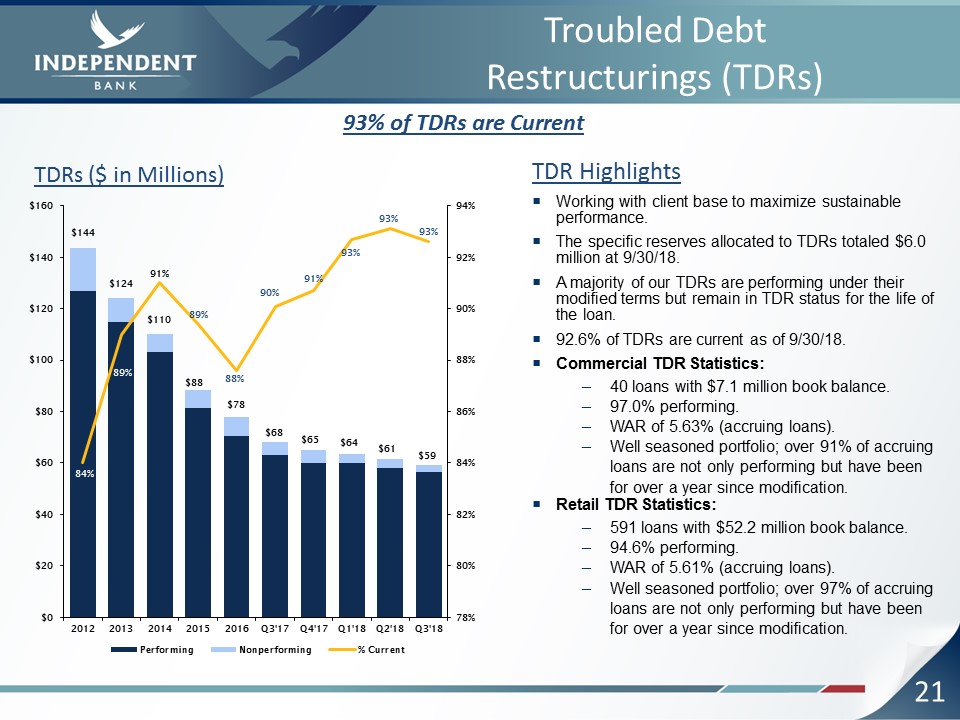
Excludes loans that are classified as “troubled debt restructured” that are still performing.
|
Non-performing loans increased $1.2 million from Dec. 31, 2017. This increase primarily reflects a rise in non-performing commercial loans. ORE and
repossessed assets totaled $1.4 million at Sept. 30, 2018, compared to $1.6 million at Dec. 31, 2017.
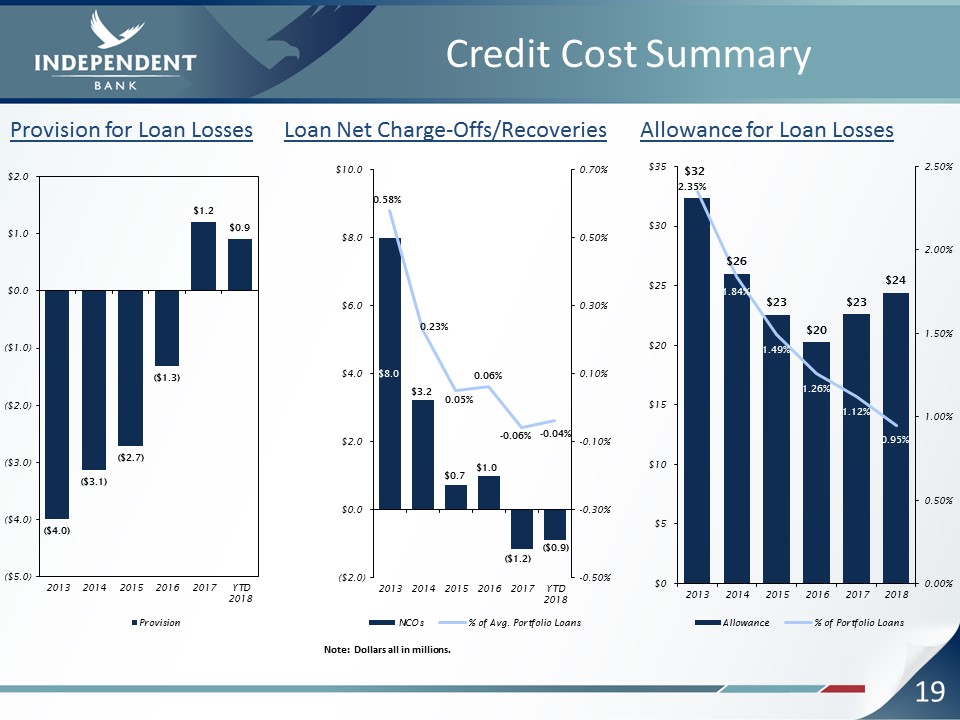
The provision for loan losses was a credit of $0.1 million compared to an expense of $0.6 million in the third quarters of 2018 and 2017, respectively.
The provision for loan losses was an expense of $0.9 million and $0.8 million in the first nine months of 2018 and 2017, respectively. The level of the provision for loan losses in each period reflects the Company’s overall assessment of the
allowance for loan losses, taking into consideration factors such as loan growth, loan mix, levels of non-performing and classified loans and loan net charge-offs. The Company recorded loan net recoveries of $1.0 million and $0.3 million in the
third quarters of 2018 and 2017, respectively. For the first nine months of 2018 and 2017, the Company recorded loan net recoveries of $0.9 million and $0.4 million, respectively. At Sept. 30, 2018, the allowance for loan losses totaled $24.4
million, or 0.95% of total portfolio loans (1.06% when excluding the TCSB acquired loan balances), compared to $22.6 million, or 1.12% of total portfolio loans, at Dec. 31, 2017.
Balance Sheet, Liquidity and Capital
Total assets were $3.30 billion at Sept. 30, 2018, an increase of $507.8 million from Dec. 31, 2017, primarily reflecting the impact of the TCSB
Acquisition as well as loan growth. Loans, excluding loans held for sale, were $2.56 billion at Sept. 30, 2018, compared to $2.02 billion at Dec. 31, 2017.
Deposits totaled $2.80 billion at Sept. 30, 2018, an increase of $398.1 million from Dec. 31, 2017. The increase in deposits is primarily due to the TCSB
Acquisition and growth in reciprocal deposits and brokered time deposits.
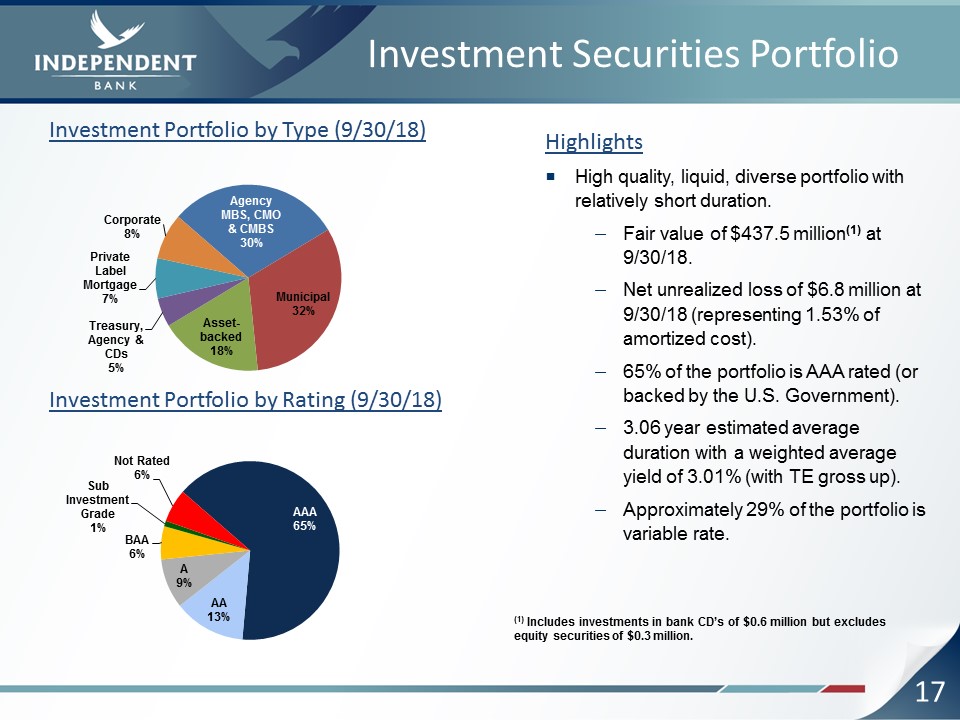
Cash and cash equivalents totaled $53.2 million at Sept. 30, 2018, versus $54.7 million at Dec. 31, 2017. Securities available for sale totaled $437.0
million at Sept. 30, 2018, compared to $522.9 million at Dec. 31, 2017.
In the second quarter of 2018, the Company recorded $29.0 million of goodwill, a core deposit intangible (“CDI”) of $5.8 million and discounts of $6.5
million, $0.4 million and $1.5 million on loans, time deposits and borrowings (including subordinated debentures), respectively, related to the Merger. These adjustments reflected the preliminary valuation of the assets acquired and liabilities
assumed in the Merger. In the third quarter of 2018, goodwill was reduced by $0.7 million (to $28.3 million) related to the collection of a TCSB acquired loan that had been charged off in full prior to the Merger. Because of the status of the
collection activities related to this loan at the time of the Merger, the Company determined that this transaction was a measurement period adjustment and reduced goodwill accordingly. The goodwill is being periodically tested for impairment, and
the CDI is being amortized over a ten year period ($0.2 million and $0.4 million of amortization for this CDI was recorded in the third quarter and first nine months of 2018, respectively). The discounts will be accreted based on the lives of the
related assets or liabilities.
3
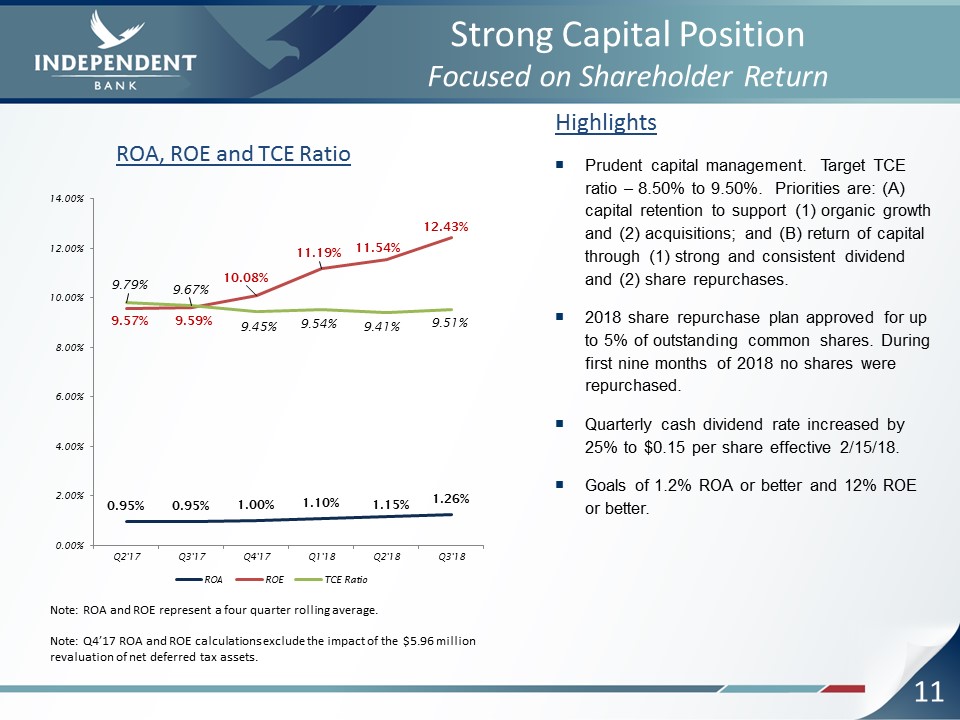
Total shareholders’ equity was $345.2 million at Sept. 30, 2018, or 10.47% of total assets. Tangible common equity totaled $310.2 million at Sept. 30,
2018, or $12.84 per share. The Company’s wholly owned subsidiary, Independent Bank, remains significantly above “well capitalized” for regulatory purposes with the following ratios:
|
Regulatory Capital Ratios
|
9/30/2018
|
12/31/2017
|
Well
Capitalized
Minimum
|
|||||||||
|
Tier 1 capital to average total assets
|
9.73
|
%
|
9.78
|
%
|
5.00
|
%
|
||||||
|
Tier 1 common equity to risk-weighted assets
|
12.19
|
%
|
12.95
|
%
|
6.50
|
%
|
||||||
|
Tier 1 capital to risk-weighted assets
|
12.19
|
%
|
12.95
|
%
|
8.00
|
%
|
||||||
|
Total capital to risk-weighted assets
|
13.18
|
%
|
14.10
|
%
|
10.00
|
%
|
||||||
Share Repurchase Plan
As previously announced, on Jan. 22, 2018, the Board of Directors of the Company authorized a share repurchase plan. Under the terms of the 2018 share
repurchase plan, the Company is authorized to buy back up to 5% of its outstanding common stock. The repurchase plan is authorized to last through Dec. 31,
2018. Thus far in 2018, the Company has not repurchased any shares.
Earnings Conference Call
Brad Kessel, President and CEO, and Rob Shuster, CFO, will review the quarterly results in a conference call for investors and analysts beginning at
11:00 am ET on Thursday, Oct. 25, 2018.
To participate in the live conference call, please dial 1-866-200-8394. Also the
conference call will be accessible through an audio webcast with user-controlled slides via the following site/URL: https://services.choruscall.com/links/ibcp181025.html.
A playback of the call can be accessed by dialing 1-877-344-7529 (Conference ID # 10124591). The replay will be available through Nov. 1, 2018.
About Independent Bank Corporation
Independent Bank Corporation (NASDAQ: IBCP) is a Michigan-based bank holding company with total assets of approximately $3.3 billion. Founded as First
National Bank of Ionia in 1864, Independent Bank Corporation operates a branch network across Michigan's Lower Peninsula through one state-chartered bank subsidiary. This subsidiary (Independent Bank) provides a full range of financial services,
including commercial banking, mortgage lending, investments and insurance. Independent Bank Corporation is committed to providing exceptional personal service and value to its customers, stockholders and the communities it serves.
For more information, please visit our Web site at: IndependentBank.com.
Forward-Looking Statements
This release may contain “forward-looking statements” within the
meaning of the U.S. Private Securities Litigation Reform Act of 1995. Any statements that are not historical facts, including statements about our expectations, beliefs, plans, strategies, predictions, forecasts, objectives, or assumptions of
future events or performance, may be forward-looking. These statements are often, but not always, made through the use of words or phrases such as “anticipates,” “believes,” “expects,” “can,” “could,” “may,” “predicts,” “potential,”
“opportunity,” “should,” “will,” “estimate,” “plans,” “projects,” “continuing,” “ongoing,” “expects,” “seeks,” “intends” and similar words or phrases. Accordingly, these statements involve estimates, known and unknown risks, assumptions, and
uncertainties that could cause actual strategies, actions, or results to differ materially from those expressed in them, and are not guarantees of timing, future results, events, or performance. Because forward-looking statements are
necessarily only estimates of future strategies, actions, or results, based on management’s current expectations, assumptions, and estimates on the date hereof, there can be no assurance that actual strategies, actions or results will not
differ materially from expectations. Therefore, readers are cautioned not to place undue reliance on such statements. Factors that could cause or contribute to such differences are changes in general economic, political or industry
conditions; changes in monetary and fiscal policies, including the interest rate policies of the Federal Reserve Board; volatility and disruptions in capital and credit markets; the interdependence of financial service companies; changes in
regulation or oversight; unfavorable developments concerning credit quality; any future acquisitions or divestitures; the effects of more stringent capital or liquidity requirements; declines or other changes in the businesses or industries of
Independent Bank Corporation's customers; the implementation of Independent Bank Corporation's strategies and business models; Independent Bank Corporation's ability to utilize technology to efficiently and effectively develop, market and
deliver new products and services; operational difficulties, failure of technology infrastructure or information security incidents; changes in the financial markets, including fluctuations in interest rates and their impact on deposit pricing;
competitive product and pricing pressures among financial institutions within Independent Bank Corporation's markets; changes in customer behavior; management's ability to maintain and expand customer relationships; management's ability to
retain key officers and employees; the impact of legal and regulatory proceedings or determinations; the effectiveness of methods of reducing risk exposures; the effects of terrorist activities and other hostilities; the effects of catastrophic
events; changes in accounting standards and the critical nature of Independent Bank Corporation's accounting policies.
4
In addition, factors that may cause actual results to differ from expectations regarding the April 1, 2018 acquisition of TCSB
Bancorp, Inc. include, but are not limited to, the reaction to the transaction of the companies’ customers, employees and counterparties; customer disintermediation; inflation; expected synergies, cost savings and other financial benefits of
the transaction might not be realized within the expected timeframes or might be less than projected; credit and interest rate risks associated with the parties' respective businesses, customers, borrowings, repayment, investment, and deposit
practices; general economic conditions, either nationally or in the market areas in which the parties operate or anticipate doing business, are less favorable than expected; new regulatory or legal requirements or obligations; and other risks.
Certain risks and important factors that could affect Independent Bank Corporation's future results are identified in its Annual
Report on Form 10-K for the year ended December 31, 2017 and other reports filed with the SEC, including among other things under the heading “Risk Factors” in such Annual Report on Form 10-K. Any forward-looking statement speaks only as of the
date on which it is made, and Independent Bank Corporation undertakes no obligation to update any forward-looking statement, whether to reflect events or circumstances, after the date on which the statement is made, to reflect new information
or the occurrence of unanticipated events, or otherwise.
5
INDEPENDENT BANK CORPORATION AND SUBSIDIARIES
Consolidated Statements of Financial Condition
|
September 30,
|
December 31,
|
|||||||
|
2018
|
2017
|
|||||||
|
(unaudited)
|
||||||||
|
(In thousands, except share
|
||||||||
|
amounts)
|
||||||||
|
Assets
|
||||||||
|
Cash and due from banks
|
$
|
35,180
|
$
|
36,994
|
||||
|
Interest bearing deposits
|
17,990
|
17,744
|
||||||
|
Cash and Cash Equivalents
|
53,170
|
54,738
|
||||||
|
Interest bearing deposits - time
|
593
|
2,739
|
||||||
|
Equity securities at fair value
|
285
|
-
|
||||||
|
Trading securities
|
-
|
455
|
||||||
|
Securities available for sale
|
436,957
|
522,925
|
||||||
|
Federal Home Loan Bank and Federal Reserve Bank stock, at cost
|
18,355
|
15,543
|
||||||
|
Loans held for sale, carried at fair value
|
41,325
|
39,436
|
||||||
|
Loans
|
||||||||
|
Commercial
|
1,112,101
|
853,260
|
||||||
|
Mortgage
|
1,056,482
|
849,530
|
||||||
|
Installment
|
393,995
|
316,027
|
||||||
|
Total Loans
|
2,562,578
|
2,018,817
|
||||||
|
Allowance for loan losses
|
(24,401
|
)
|
(22,587
|
)
|
||||
|
Net Loans
|
2,538,177
|
1,996,230
|
||||||
|
Other real estate and repossessed assets
|
1,445
|
1,643
|
||||||
|
Property and equipment, net
|
39,012
|
39,149
|
||||||
|
Bank-owned life insurance
|
54,811
|
54,572
|
||||||
|
Deferred tax assets, net
|
8,449
|
15,089
|
||||||
|
Capitalized mortgage loan servicing rights
|
23,151
|
15,699
|
||||||
|
Goodwill
|
28,300
|
-
|
||||||
|
Other intangibles
|
6,709
|
1,586
|
||||||
|
Accrued income and other assets
|
46,385
|
29,551
|
||||||
|
Total Assets
|
$
|
3,297,124
|
$
|
2,789,355
|
||||
|
Liabilities and Shareholders' Equity
|
||||||||
|
Deposits
|
||||||||
|
Non-interest bearing
|
$
|
880,932
|
$
|
768,333
|
||||
|
Savings and interest-bearing checking
|
1,217,939
|
1,064,391
|
||||||
|
Reciprocal
|
92,635
|
50,979
|
||||||
|
Time
|
399,110
|
374,872
|
||||||
|
Brokered time
|
208,027
|
141,959
|
||||||
|
Total Deposits
|
2,798,643
|
2,400,534
|
||||||
|
Other borrowings
|
79,688
|
54,600
|
||||||
|
Subordinated debentures
|
39,371
|
35,569
|
||||||
|
Accrued expenses and other liabilities
|
34,218
|
33,719
|
||||||
|
Total Liabilities
|
2,951,920
|
2,524,422
|
||||||
|
Shareholders’ Equity
|
||||||||
|
Preferred stock, no par value, 200,000 shares authorized; none issued or outstanding
|
-
|
-
|
||||||
|
Common stock, no par value, 500,000,000 shares authorized; issued and outstanding: 24,150,341 shares at
September 30, 2018 and 21,333,869 shares at December 31, 2017
|
389,689
|
324,986
|
||||||
|
Accumulated deficit
|
(34,596
|
)
|
(54,054
|
)
|
||||
|
Accumulated other comprehensive loss
|
(9,889
|
)
|
(5,999
|
)
|
||||
|
Total Shareholders’ Equity
|
345,204
|
264,933
|
||||||
|
Total Liabilities and Shareholders’ Equity
|
$
|
3,297,124
|
$
|
2,789,355
|
||||
6
INDEPENDENT BANK CORPORATION AND SUBSIDIARIES
Consolidated Statements of Operations
|
Three Months Ended
|
Nine Months Ended
|
|||||||||||||||||||
|
September 30,
|
June 30,
|
September 30,
|
September 30,
|
|||||||||||||||||
|
2018
|
2018
|
2017
|
2018
|
2017
|
||||||||||||||||
|
(unaudited)
|
||||||||||||||||||||
|
Interest Income
|
(In thousands, except per share amounts)
|
|||||||||||||||||||
|
Interest and fees on loans
|
$
|
31,000
|
$
|
29,674
|
$
|
21,831
|
$
|
84,027
|
$
|
61,638
|
||||||||||
|
Interest on securities
|
||||||||||||||||||||
|
Taxable
|
2,737
|
2,720
|
2,765
|
8,092
|
8,300
|
|||||||||||||||
|
Tax-exempt
|
412
|
444
|
512
|
1,335
|
1,478
|
|||||||||||||||
|
Other investments
|
303
|
265
|
263
|
898
|
867
|
|||||||||||||||
|
Total Interest Income
|
34,452
|
33,103
|
25,371
|
94,352
|
72,283
|
|||||||||||||||
|
Interest Expense
|
||||||||||||||||||||
|
Deposits
|
3,976
|
3,209
|
1,833
|
9,472
|
4,754
|
|||||||||||||||
|
Other borrowings and subordinated debentures
|
779
|
914
|
626
|
2,267
|
1,659
|
|||||||||||||||
|
Total Interest Expense
|
4,755
|
4,123
|
2,459
|
11,739
|
6,413
|
|||||||||||||||
|
Net Interest Income
|
29,697
|
28,980
|
22,912
|
82,613
|
65,870
|
|||||||||||||||
|
Provision for loan losses
|
(53
|
)
|
650
|
582
|
912
|
806
|
||||||||||||||
|
Net Interest Income After Provision for Loan Losses
|
29,750
|
28,330
|
22,330
|
81,701
|
65,064
|
|||||||||||||||
|
Non-interest Income
|
||||||||||||||||||||
|
Service charges on deposit accounts
|
3,166
|
3,095
|
3,281
|
9,166
|
9,465
|
|||||||||||||||
|
Interchange income
|
2,486
|
2,504
|
1,942
|
7,236
|
5,869
|
|||||||||||||||
|
Net gains (losses) on assets
|
||||||||||||||||||||
|
Mortgage loans
|
2,745
|
3,255
|
2,971
|
8,571
|
8,886
|
|||||||||||||||
|
Securities
|
93
|
9
|
69
|
(71
|
)
|
62
|
||||||||||||||
|
Mortgage loan servicing, net
|
1,212
|
1,235
|
1
|
4,668
|
668
|
|||||||||||||||
|
Other
|
2,134
|
2,217
|
2,040
|
6,294
|
6,139
|
|||||||||||||||
|
Total Non-interest Income
|
11,836
|
12,315
|
10,304
|
35,864
|
31,089
|
|||||||||||||||
|
Non-interest Expense
|
||||||||||||||||||||
|
Compensation and employee benefits
|
16,169
|
15,869
|
13,577
|
46,506
|
41,104
|
|||||||||||||||
|
Occupancy, net
|
2,233
|
2,170
|
1,970
|
6,667
|
6,032
|
|||||||||||||||
|
Data processing
|
2,051
|
2,251
|
1,796
|
6,180
|
5,670
|
|||||||||||||||
|
Merger related expenses
|
98
|
3,082
|
10
|
3,354
|
10
|
|||||||||||||||
|
Furniture, fixtures and equipment
|
1,043
|
1,019
|
961
|
3,029
|
2,943
|
|||||||||||||||
|
Communications
|
727
|
704
|
685
|
2,111
|
2,046
|
|||||||||||||||
|
Interchange expense
|
715
|
661
|
294
|
1,974
|
869
|
|||||||||||||||
|
Loan and collection
|
531
|
692
|
481
|
1,900
|
1,564
|
|||||||||||||||
|
Advertising
|
594
|
543
|
526
|
1,578
|
1,551
|
|||||||||||||||
|
Legal and professional
|
477
|
456
|
540
|
1,311
|
1,366
|
|||||||||||||||
|
FDIC deposit insurance
|
270
|
250
|
208
|
750
|
608
|
|||||||||||||||
|
Credit card and bank service fees
|
108
|
106
|
105
|
310
|
432
|
|||||||||||||||
|
Net (gains) losses on other real estate and repossessed assets
|
(325
|
)
|
(4
|
)
|
30
|
(619
|
)
|
132
|
||||||||||||
|
Other
|
2,049
|
1,962
|
1,433
|
5,585
|
4,619
|
|||||||||||||||
|
Total Non-interest Expense
|
26,740
|
29,761
|
22,616
|
80,636
|
68,946
|
|||||||||||||||
|
Income Before Income Tax
|
14,846
|
10,884
|
10,018
|
36,929
|
27,207
|
|||||||||||||||
|
Income tax expense
|
2,921
|
2,067
|
3,159
|
7,026
|
8,443
|
|||||||||||||||
|
Net Income
|
$
|
11,925
|
$
|
8,817
|
$
|
6,859
|
$
|
29,903
|
$
|
18,764
|
||||||||||
|
Net Income Per Common Share
|
||||||||||||||||||||
|
Basic
|
$
|
0.49
|
$
|
0.37
|
$
|
0.32
|
$
|
1.29
|
$
|
0.88
|
||||||||||
|
Diluted
|
$
|
0.49
|
$
|
0.36
|
$
|
0.32
|
$
|
1.27
|
$
|
0.87
|
||||||||||
7
INDEPENDENT BANK CORPORATION AND SUBSIDIARIES
Selected Financial Data
|
September 30,
|
June 30,
|
March 31,
|
December 31,
|
September 30,
|
||||||||||||||||
|
2018
|
2018
|
2018
|
2017
|
2017
|
||||||||||||||||
|
(unaudited)
|
||||||||||||||||||||
|
(Dollars in thousands except per share data)
|
||||||||||||||||||||
|
Three Months Ended
|
||||||||||||||||||||
|
Net interest income
|
$
|
29,697
|
$
|
28,980
|
$
|
23,936
|
$
|
23,316
|
$
|
22,912
|
||||||||||
|
Provision for loan losses
|
(53
|
)
|
650
|
315
|
393
|
582
|
||||||||||||||
|
Non-interest income
|
11,836
|
12,315
|
11,713
|
11,444
|
10,304
|
|||||||||||||||
|
Non-interest expense
|
26,740
|
29,761
|
24,135
|
23,136
|
22,616
|
|||||||||||||||
|
Income before income tax
|
14,846
|
10,884
|
11,199
|
11,231
|
10,018
|
|||||||||||||||
|
Income tax expense
|
2,921
|
2,067
|
2,038
|
9,520
|
3,159
|
|||||||||||||||
|
Net income
|
$
|
11,925
|
$
|
8,817
|
$
|
9,161
|
$
|
1,711
|
$
|
6,859
|
||||||||||
|
Basic earnings per share
|
$
|
0.49
|
$
|
0.37
|
$
|
0.43
|
$
|
0.08
|
$
|
0.32
|
||||||||||
|
Diluted earnings per share
|
0.49
|
0.36
|
0.42
|
0.08
|
0.32
|
|||||||||||||||
|
Cash dividend per share
|
0.15
|
0.15
|
0.15
|
0.12
|
0.10
|
|||||||||||||||
|
Average shares outstanding
|
24,148,768
|
24,109,322
|
21,364,708
|
21,332,053
|
21,334,247
|
|||||||||||||||
|
Average diluted shares outstanding
|
24,514,814
|
24,509,963
|
21,674,375
|
21,661,133
|
21,651,963
|
|||||||||||||||
|
Performance Ratios
|
||||||||||||||||||||
|
Return on average assets
|
1.46
|
%
|
1.12
|
%
|
1.34
|
%
|
0.25
|
%
|
1.01
|
%
|
||||||||||
|
Return on average common equity
|
13.83
|
10.57
|
14.04
|
2.51
|
10.27
|
|||||||||||||||
|
Efficiency ratio (1)
|
63.63
|
71.14
|
66.72
|
66.14
|
67.38
|
|||||||||||||||
|
As a Percent of Average Interest-Earning Assets (1)
|
||||||||||||||||||||
|
Interest income
|
4.53
|
%
|
4.49
|
%
|
4.15
|
%
|
4.07
|
%
|
4.05
|
%
|
||||||||||
|
Interest expense
|
0.62
|
0.56
|
0.44
|
0.42
|
0.39
|
|||||||||||||||
|
Net interest income
|
3.91
|
3.93
|
3.71
|
3.65
|
3.66
|
|||||||||||||||
|
Average Balances
|
||||||||||||||||||||
|
Loans
|
$
|
2,550,302
|
$
|
2,449,056
|
$
|
2,062,847
|
$
|
2,006,207
|
$
|
1,911,635
|
||||||||||
|
Securities available for sale
|
442,949
|
470,427
|
500,599
|
532,202
|
565,546
|
|||||||||||||||
|
Total earning assets
|
3,038,221
|
2,963,982
|
2,611,890
|
2,574,779
|
2,522,060
|
|||||||||||||||
|
Total assets
|
3,247,603
|
3,168,196
|
2,776,986
|
2,742,761
|
2,697,362
|
|||||||||||||||
|
Deposits
|
2,789,969
|
2,701,362
|
2,417,906
|
2,340,593
|
2,315,806
|
|||||||||||||||
|
Interest bearing liabilities
|
1,986,905
|
1,946,287
|
1,724,153
|
1,680,917
|
1,664,734
|
|||||||||||||||
|
Shareholders' equity
|
341,998
|
334,626
|
264,584
|
270,099
|
265,074
|
|||||||||||||||
|
End of Period
|
||||||||||||||||||||
|
Capital
|
||||||||||||||||||||
|
Tangible common equity ratio
|
9.51
|
%
|
9.41
|
%
|
9.54
|
%
|
9.45
|
%
|
9.67
|
%
|
||||||||||
|
Average equity to average assets
|
10.53
|
10.56
|
9.53
|
9.85
|
9.83
|
|||||||||||||||
|
Tangible common equity per share of common stock
|
$
|
12.84
|
$
|
12.47
|
$
|
12.46
|
$
|
12.34
|
$
|
12.47
|
||||||||||
|
Total shares outstanding
|
24,150,341
|
24,143,044
|
21,374,816
|
21,333,869
|
21,332,317
|
|||||||||||||||
|
Selected Balances
|
||||||||||||||||||||
|
Loans
|
$
|
2,562,578
|
$
|
2,467,317
|
$
|
2,071,435
|
$
|
2,018,817
|
$
|
1,937,094
|
||||||||||
|
Securities available for sale
|
436,957
|
450,593
|
489,119
|
522,925
|
548,865
|
|||||||||||||||
|
Total earning assets
|
3,078,083
|
3,023,454
|
2,625,534
|
2,617,204
|
2,568,554
|
|||||||||||||||
|
Total assets
|
3,297,124
|
3,234,522
|
2,793,119
|
2,789,355
|
2,753,446
|
|||||||||||||||
|
Deposits
|
2,798,643
|
2,780,516
|
2,430,401
|
2,400,534
|
2,343,761
|
|||||||||||||||
|
Interest bearing liabilities
|
2,036,770
|
1,988,495
|
1,719,771
|
1,722,370
|
1,701,624
|
|||||||||||||||
|
Shareholders' equity
|
345,204
|
337,083
|
267,917
|
264,933
|
267,710
|
|||||||||||||||
(1) Presented on a fully tax equivalent basis assuming a marginal tax rate of 21% in 2018 and 35% in 2017.
8
Reconciliation of Non-GAAP Financial Measures
Independent Bank Corporation
Independent Bank Corporation believes non-GAAP measures are meaningful because they reflect adjustments commonly made by management, investors,
regulators and analysts to evaluate the adequacy of common equity and performance trends. Tangible common equity is used by the Company to measure the quality of capital.
Reconciliation of Non-GAAP Financial Measures
|
Three Months Ended
|
Nine Months Ended
|
|||||||||||||||
|
September 30,
|
September 30,
|
|||||||||||||||
|
2018
|
2017
|
2018
|
2017
|
|||||||||||||
|
(Dollars in thousands)
|
||||||||||||||||
|
Net Interest Margin, Fully Taxable
|
||||||||||||||||
|
Equivalent ("FTE")
|
||||||||||||||||
|
Net interest income
|
$
|
29,697
|
$
|
22,912
|
$
|
82,613
|
$
|
65,870
|
||||||||
|
Add: taxable equivalent adjustment
|
123
|
288
|
384
|
837
|
||||||||||||
|
Net interest income - taxable equivalent
|
$
|
29,820
|
$
|
23,200
|
$
|
82,997
|
$
|
66,707
|
||||||||
|
Net interest margin (GAAP) (1)
|
3.88
|
%
|
3.60
|
%
|
3.84
|
%
|
3.61
|
%
|
||||||||
|
Net interest margin (FTE) (1)
|
3.91
|
%
|
3.66
|
%
|
3.86
|
%
|
3.65
|
%
|
||||||||
(1) Annualized
Tangible Common Equity Ratio
|
September 30,
|
June 30,
|
March 31,
|
December 31,
|
September 30,
|
||||||||||||||||
|
2018
|
2018
|
2017
|
2017
|
2017
|
||||||||||||||||
|
(Dollars in thousands)
|
||||||||||||||||||||
|
Common shareholders' equity
|
$
|
345,204
|
$
|
337,083
|
$
|
267,917
|
$
|
264,933
|
$
|
267,710
|
||||||||||
|
Less:
|
||||||||||||||||||||
|
Goodwill
|
28,300
|
29,012
|
-
|
-
|
-
|
|||||||||||||||
|
Other intangibles
|
6,709
|
7,004
|
1,500
|
1,586
|
1,673
|
|||||||||||||||
|
Tangible common equity
|
$
|
310,195
|
$
|
301,067
|
$
|
266,417
|
$
|
263,347
|
$
|
266,037
|
||||||||||
|
Total assets
|
$
|
3,297,124
|
$
|
3,234,522
|
$
|
2,793,119
|
$
|
2,789,355
|
$
|
2,753,446
|
||||||||||
|
Less:
|
||||||||||||||||||||
|
Goodwill
|
28,300
|
29,012
|
-
|
-
|
-
|
|||||||||||||||
|
Other intangibles
|
6,709
|
7,004
|
1,500
|
1,586
|
1,673
|
|||||||||||||||
|
Tangible assets
|
$
|
3,262,115
|
$
|
3,198,506
|
$
|
2,791,619
|
$
|
2,787,769
|
$
|
2,751,773
|
||||||||||
|
Common equity ratio
|
10.47
|
%
|
10.42
|
%
|
9.59
|
%
|
9.50
|
%
|
9.72
|
%
|
||||||||||
|
Tangible common equity ratio
|
9.51
|
%
|
9.41
|
%
|
9.54
|
%
|
9.45
|
%
|
9.67
|
%
|
||||||||||
|
Tangible Common Equity per Share of Common Stock:
|
||||||||||||||||||||
|
Common shareholders' equity
|
$
|
345,204
|
$
|
337,083
|
$
|
267,917
|
$
|
264,933
|
$
|
267,710
|
||||||||||
|
Tangible common equity
|
$
|
310,195
|
$
|
301,067
|
$
|
266,417
|
$
|
263,347
|
$
|
266,037
|
||||||||||
|
Shares of common stock outstanding (in thousands)
|
24,150
|
24,143
|
21,375
|
21,334
|
21,332
|
|||||||||||||||
|
Common shareholders' equity per share of common stock
|
$
|
14.29
|
$
|
13.96
|
$
|
12.53
|
$
|
12.42
|
$
|
12.55
|
||||||||||
|
Tangible common equity per share of common stock
|
$
|
12.84
|
$
|
12.47
|
$
|
12.46
|
$
|
12.34
|
$
|
12.47
|
||||||||||
The tangible common equity ratio removes the effect of intangible assets from capital and total assets. Tangible common equity per share of common stock
removes the effect of intangible assets from common shareholders’ equity per share of common stock.
9