UNITED STATES SECURITIES AND EXCHANGE COMMISSION
Washington, D.C. 20549
FORM 10-K
ý Annual Report Pursuant to Section 13 or 15(d) of the Securities Exchange Act of 1934
For the fiscal year ended: December 31, 2017
Or
¨ Transition Report Pursuant to Section 13 or 15(d) of the Securities Exchange Act of 1934
For the transition period from to
Commission file number: 001-13221
CULLEN/FROST BANKERS, INC.
(Exact name of registrant as specified in its charter)
Texas | 74-1751768 |
(State or other jurisdiction of incorporation or organization) | (I.R.S. Employer Identification No.) |
100 W. Houston Street, San Antonio, Texas | 78205 |
(Address of principal executive offices) | (Zip code) |
(210) 220-4011
(Registrant’s telephone number, including area code)
Securities registered pursuant to Section 12(b) of the Act:
Common Stock, $.01 Par Value | The New York Stock Exchange, Inc. |
5.375% Non-Cumulative Perpetual Preferred Stock, Series A | The New York Stock Exchange, Inc. |
(Title of each class) | (Name of each exchange on which registered) |
Securities registered pursuant to Section 12(g) of the Act: None
Indicate by check mark if the registrant is a well-known seasoned issuer, as defined in Rule 405 of the Securities Act. Yes ý No ¨
Indicate by check mark if the registrant is not required to file reports pursuant to Section 13 or Section 15(d) of the Act. Yes ¨ No ý
Indicate by check mark whether the registrant (1) has filed all reports required to be filed by Section 13 or 15(d) of the Securities Exchange Act of 1934 during the preceding 12 months (or for such shorter period that the registrant was required to file such reports), and (2) has been subject to such filing requirements for the past 90 days. Yes ý No ¨
Indicate by check mark whether the registrant has submitted electronically and posted on its corporate Website, if any, every Interactive Data File required to be submitted and posted pursuant to Rule 405 of Regulation S-T (§232.405 of this chapter) during the preceding 12 months (or for such shorter period that the registrant was required to submit and post such files). Yes ý No ¨
Indicate by check mark if disclosure of delinquent filers pursuant to Item 405 of Regulation S-K is not contained herein, and will not be contained, to the best of the registrant’s knowledge, in definitive proxy or information statements incorporated by reference in Part III of this Form 10-K or any amendment to this Form 10-K. ý
Indicate by check mark whether the registrant is a large accelerated filer, an accelerated filer, or a non-accelerated filer. See definition of “accelerated filer and large accelerated filer” in Rule 12b-2 of the Exchange Act.
Large accelerated filer | ý | Accelerated filer | ¨ |
Non-accelerated filer | ¨ (Do not check if a smaller reporting company) | Smaller reporting company | ¨ |
Emerging growth company | ¨ | ||
If an emerging growth company, indicate by check mark if the registrant has elected not to use the extended transition period for complying with any new or revised financial accounting standards provided pursuant to Section 13(a) of the Exchange Act. ¨
Indicate by check mark whether the registrant is a shell company (as defined in Rule 12b-2 of the Act.) Yes ¨ No ý
As of June 30, 2017, the last business day of the registrant’s most recently completed second fiscal quarter, the aggregate market value of the shares of common stock held by non-affiliates, based upon the closing price per share of the registrant’s common stock as reported on The New York Stock Exchange, Inc., was approximately $5.8 billion.
As of January 30, 2018, there were 63,682,137 shares of the registrant’s common stock, $.01 par value, outstanding.
DOCUMENTS INCORPORATED BY REFERENCE
Portions of the Proxy Statement for the 2018 Annual Meeting of Shareholders of Cullen/Frost Bankers, Inc. to be held on April 25, 2018 are incorporated by reference in this Form 10-K in response to Part III, Items 10, 11, 12, 13 and 14.
CULLEN/FROST BANKERS, INC.
ANNUAL REPORT ON FORM 10-K
TABLE OF CONTENTS
Page | ||
PART I | ||
Item 1. | ||
Item 1A. | ||
Item 1B. | ||
Item 2. | ||
Item 3. | ||
Item 4. | ||
PART II | ||
Item 5. | ||
Item 6. | ||
Item 7. | ||
Item 7A. | ||
Item 8. | ||
Item 9. | ||
Item 9A. | ||
Item 9B. | ||
PART III | ||
Item 10. | ||
Item 11. | ||
Item 12. | ||
Item 13. | ||
Item 14. | ||
PART IV | ||
Item 15. | ||
Item 16. | ||
SIGNATURES | ||
3
PART I
ITEM 1. BUSINESS
The disclosures set forth in this item are qualified by Item 1A. Risk Factors and the section captioned “Forward-Looking Statements and Factors that Could Affect Future Results” in Item 7. Management’s Discussion and Analysis of Financial Condition and Results of Operations of this report and other cautionary statements set forth elsewhere in this report.
The Corporation
Cullen/Frost Bankers, Inc., a Texas business corporation incorporated in 1977, is a financial holding company and a bank holding company headquartered in San Antonio, Texas that provides, through its subsidiaries, a broad array of products and services throughout numerous Texas markets. The terms “Cullen/Frost,” “the Corporation,” “we,” “us” and “our” mean Cullen/Frost Bankers, Inc. and its subsidiaries, when appropriate. We offer commercial and consumer banking services, as well as trust and investment management, insurance, brokerage, mutual funds, leasing, treasury management, capital markets advisory and item processing services. At December 31, 2017, Cullen/Frost had consolidated total assets of $31.7 billion and was one of the largest independent bank holding companies headquartered in the State of Texas.
Our philosophy is to grow and prosper, building long-term relationships based on top quality service, high ethical standards, and safe, sound assets. We operate as a locally-oriented, community-based financial services organization, augmented by experienced, centralized support in select critical areas. Our local market orientation is reflected in our regional management and regional advisory boards, which are comprised of local business persons, professionals and other community representatives that assist our regional management in responding to local banking needs. Despite this local market, community-based focus, we offer many of the products available at much larger money-center financial institutions.
We serve a wide variety of industries including, among others, energy, manufacturing, services, construction, retail, telecommunications, healthcare, military and transportation. Our customer base is similarly diverse. While our loan portfolio has a significant concentration of energy-related loans totaling approximately 11.4% of total loans at December 31, 2017, we are not dependent upon any single industry or customer.
Our operating objectives include expansion, diversification within our markets, growth of our fee-based income, and growth internally and through acquisitions of financial institutions, branches and financial services businesses. We generally seek merger or acquisition partners that are culturally similar and have experienced management and possess either significant market presence or have potential for improved profitability through financial management, economies of scale and expanded services. We regularly evaluate merger and acquisition opportunities and conduct due diligence activities related to possible transactions with other financial institutions and financial services companies. As a result, merger or acquisition discussions and, in some cases, negotiations may take place and future mergers or acquisitions involving cash, debt or equity securities may occur. Acquisitions typically involve the payment of a premium over book and market values, and, therefore, some dilution of our tangible book value and net income per common share may occur in connection with any future transaction. Our ability to engage in certain merger or acquisition transactions, whether or not any regulatory approval is required, will be dependent upon our bank regulators’ views at the time as to the capital levels, quality of management and our overall condition and their assessment of a variety of other factors. Certain merger or acquisition transactions, including those involving the acquisition of a depository institution or the assumption of the deposits of any depository institution, require formal approval from various bank regulatory authorities, which will be subject to a variety of factors and considerations.
Although Cullen/Frost is a corporate entity, legally separate and distinct from its affiliates, bank holding companies such as Cullen/Frost are required to act as a source of financial strength for their subsidiary banks. The principal source of Cullen/Frost’s income is dividends from its subsidiaries. There are certain regulatory restrictions on the extent to which these subsidiaries can pay dividends or otherwise supply funds to Cullen/Frost. See the section captioned “Supervision and Regulation” included elsewhere in this item for further discussion of these matters.
Cullen/Frost’s executive offices are located at 100 W. Houston Street, San Antonio, Texas 78205, and its telephone number is (210) 220-4011.
4
Subsidiaries of Cullen/Frost
Frost Bank
Frost Bank, the principal operating subsidiary and sole banking subsidiary of Cullen/Frost, is a Texas-chartered bank primarily engaged in the business of commercial and consumer banking through approximately 134 financial centers across Texas in the Austin, Corpus Christi, Dallas, Fort Worth, Houston, Permian Basin, Rio Grande Valley and San Antonio regions. Frost Bank also operates over 1,300 automated-teller machines (“ATMs”) throughout the State of Texas, approximately half of which are operated in connection with a branding arrangement to be the exclusive cash-machine provider for Corner Store in Texas. Frost Bank was originally chartered as a national banking association in 1899, but its origin can be traced to a mercantile partnership organized in 1868. At December 31, 2017, Frost Bank had consolidated total assets of $31.8 billion and total deposits of $26.9 billion and was one of the largest commercial banks headquartered in the State of Texas.
Significant services offered by Frost Bank include:
• | Commercial Banking. Frost Bank provides commercial banking services to corporations and other business clients. Loans are made for a wide variety of general corporate purposes, including financing for industrial and commercial properties and to a lesser extent, financing for interim construction related to industrial and commercial properties, financing for equipment, inventories and accounts receivable, and acquisition financing. We also originate commercial leases and offer treasury management services. |
• | Consumer Services. Frost Bank provides a full range of consumer banking services, including checking accounts, savings programs, ATMs, overdraft facilities, installment and real estate loans, home equity loans and lines of credit, drive-in and night deposit services, safe deposit facilities and brokerage services. |
• | International Banking. Frost Bank provides international banking services to customers residing in or dealing with businesses located in Mexico. These services consist of accepting deposits (generally only in U.S. dollars), making loans (generally only in U.S. dollars), issuing letters of credit, handling foreign collections, transmitting funds, and to a limited extent, dealing in foreign exchange. |
• | Correspondent Banking. Frost Bank acts as correspondent for approximately 203 financial institutions, which are primarily banks in Texas. These banks maintain deposits with Frost Bank, which offers them a full range of services including check clearing, transfer of funds, fixed income security services, and securities custody and clearance services. |
• | Trust Services. Frost Bank provides a wide range of trust, investment, agency and custodial services for individual and corporate clients. These services include the administration of estates and personal trusts, as well as the management of investment accounts for individuals, employee benefit plans and charitable foundations. At December 31, 2017, the estimated fair value of trust assets was $32.8 billion, including managed assets of $14.1 billion and custody assets of $18.7 billion. |
• | Capital Markets - Fixed-Income Services. Frost Bank’s Capital Markets Division supports the transaction needs of fixed-income institutional investors. Services include sales and trading, new issue underwriting, money market trading, advisory services and securities safekeeping and clearance. |
• | Global Trade Services. Frost Bank's Global Trade Services Division supports international business activities including foreign exchange, international letters of credit and export-import financing, among other things. |
Frost Insurance Agency, Inc.
Frost Insurance Agency, Inc. is a wholly-owned subsidiary of Frost Bank that provides insurance brokerage services to individuals and businesses covering corporate and personal property and casualty insurance products, as well as group health and life insurance products.
Frost Brokerage Services, Inc.
Frost Brokerage Services, Inc. (“FBS”) is a wholly-owned subsidiary of Frost Bank that provides brokerage services and performs other transactions or operations related to the sale and purchase of securities of all types. FBS is registered as a fully disclosed introducing broker-dealer under the Securities Exchange Act of 1934 and, as such, does not hold any customer accounts.
5
Frost Investment Advisors, LLC
Frost Investment Advisors, LLC is a registered investment advisor and a wholly-owned subsidiary of Frost Bank that provides investment management services to Frost-managed mutual funds, institutions and individuals.
Frost Investment Services, LLC
Frost Investment Services, LLC is a registered investment advisor and a wholly-owned subsidiary of Frost Bank that provides investment management services to individuals.
Tri–Frost Corporation
Tri-Frost Corporation is a wholly-owned subsidiary of Frost Bank that primarily holds securities for investment purposes and the receipt of cash flows related to principal and interest on the securities until such time that the securities mature.
Main Plaza Corporation
Main Plaza Corporation is a wholly-owned subsidiary of Cullen/Frost that occasionally makes loans to qualified borrowers. Loans are funded with current cash or borrowings against internal credit lines. Main Plaza also holds severed mineral interests on certain oil producing properties. We receive royalties on these interests based upon production.
Cullen/Frost Capital Trust II and WNB Capital Trust I
Cullen/Frost Capital Trust II (“Trust II”) is a Delaware statutory business trust formed in 2004 for the purpose of issuing $120.0 million in trust preferred securities and lending the proceeds to Cullen/Frost. Cullen/Frost guarantees, on a limited basis, payments of distributions on the trust preferred securities and payments on redemption of the trust preferred securities.
WNB Capital Trust I (“WNB Trust”) is a Delaware statutory business trust formed in 2004 for the purpose of issuing $13.0 million in trust preferred securities and lending the proceeds to WNB Bancshares (“WNB”). Cullen/Frost, as WNB's successor, guarantees, on a limited basis, payments of distributions on the trust preferred securities and payments on redemption of the trust preferred securities.
Trust II and WNB Trust are variable interest entities for which we are not the primary beneficiary. As such, the accounts of Trust II and WNB Trust are not included in our consolidated financial statements. See our accounting policy related to consolidation in Note 1 - Summary of Significant Accounting Policies in the notes to consolidated financial statements included in Item 8. Financial Statements and Supplementary Data, which is located elsewhere in this report.
Although the accounts of Trust II and WNB Trust are not included in our consolidated financial statements, the $120.0 million in trust preferred securities issued by Trust II and the $13.0 million in trust preferred securities issued by WNB Trust were included in the regulatory capital of Cullen/Frost during the reported periods. See the section captioned “Supervision and Regulation - Capital Requirements” for a discussion of the regulatory capital treatment of our trust preferred securities.
Other Subsidiaries
Cullen/Frost has various other subsidiaries that are not significant to the consolidated entity.
Operating Segments
Our operations are managed along two reportable operating segments consisting of Banking and Frost Wealth Advisors. See the sections captioned “Results of Segment Operations” in Item 7. Management’s Discussion and Analysis of Financial Condition and Results of Operations and Note 18 - Operating Segments in the notes to consolidated financial statements included in Item 8. Financial Statements and Supplementary Data, which are located elsewhere in this report.
6
Competition
There is significant competition among commercial banks in our market areas. In addition, we also compete with other providers of financial services, such as savings and loan associations, credit unions, consumer finance companies, securities firms, insurance companies, insurance agencies, commercial finance and leasing companies, full service brokerage firms and discount brokerage firms. Some of our competitors have greater resources and, as such, may have higher lending limits and may offer other services that are not provided by us. We generally compete on the basis of customer service and responsiveness to customer needs, available loan and deposit products, the rates of interest charged on loans, the rates of interest paid for funds, and the availability and pricing of trust, brokerage and insurance services.
Supervision and Regulation
Cullen/Frost, Frost Bank and most of its non-banking subsidiaries are subject to extensive regulation under federal and state laws. The regulatory framework is intended primarily for the protection of depositors, federal deposit insurance funds and the banking system as a whole and not for the protection of shareholders and creditors.
Significant elements of the laws and regulations applicable to Cullen/Frost and its subsidiaries are described below. The description is qualified in its entirety by reference to the full text of the statutes, regulations and policies that are described. Also, such statutes, regulations and policies are continually under review by Congress and state legislatures and federal and state regulatory agencies. A change in statutes, regulations or regulatory policies applicable to Cullen/Frost and its subsidiaries could have a material effect on our business, financial condition or our results of operations. Recent political developments, including the change in administration in the United States, have added additional uncertainty to the implementation, scope and timing of regulatory reforms.
On February 3, 2017, the President of the United States issued an executive order identifying “core principles” for the administration’s financial services regulatory policy and directing the Secretary of the Treasury, in consultation with the heads of other financial regulatory agencies, to evaluate how the current regulatory framework promotes or inhibits the principles and what actions have been, and are being, taken to promote the principles. In response to the executive order, on June 12, 2017, October 6, 2017 and October 26, 2017, respectively, the U.S. Department of the Treasury issued the first three of four reports recommending a number of comprehensive changes in the current regulatory system for U.S. depository institutions, the U.S. capital markets and the U.S. asset management and insurance industries.
Regulatory Agencies
Cullen/Frost is a legal entity separate and distinct from Frost Bank and its other subsidiaries. As a financial holding company and a bank holding company, Cullen/Frost is regulated under the Bank Holding Company Act of 1956, as amended (“BHC Act”), and it and its subsidiaries are subject to inspection, examination and supervision by the Federal Reserve Board. The BHC Act provides generally for “umbrella” regulation of financial holding companies such as Cullen/Frost by the Federal Reserve Board, and for functional regulation of banking activities by bank regulators, securities activities by securities regulators, and insurance activities by insurance regulators. Cullen/Frost is also under the jurisdiction of the Securities and Exchange Commission (“SEC”) and is subject to the disclosure and regulatory requirements of the Securities Act of 1933, as amended, and the Securities Exchange Act of 1934, as amended, as administered by the SEC. Cullen/Frost’s common stock is listed on the New York Stock Exchange (“NYSE”) under the trading symbol “CFR” and our 5.375% Non-Cumulative Perpetual Preferred Stock, Series A, is listed on the NYSE under the trading symbol “CFRpA.” Accordingly, Cullen/Frost is also subject to the rules of the NYSE for listed companies.
Frost Bank is a Texas state chartered bank and a member of the Federal Reserve System. Accordingly, the Texas Department of Banking and the Federal Reserve Board are the primary regulators of Frost Bank. Deposits at Frost Bank are insured by the Federal Deposit Insurance Corporation (“FDIC”) up to applicable limits.
All member banks of the Federal Reserve System, including Frost Bank, are required to hold stock in the Federal Reserve System's Reserve Banks in an amount equal to six percent of their capital stock and surplus (half paid to acquire the stock with the remainder held as a cash reserve). Member banks do not have any control over the Federal Reserve System as a result of owning the stock and the stock cannot be sold or traded. Prior to the enactment of the Fixing America's Surface Transportation Act (“FAST Act”) in December 2015, member banks received a fixed, six percent dividend annually on their stock. Under the FAST Act, the annual dividend rate for member banks with total assets in excess of $10 billion, including Frost Bank, changed from a fixed, six percent dividend rate to a floating dividend rate tied to 10-year U.S. Treasuries with the maximum dividend rate capped at six percent. The total amount of stock
7
dividends that Frost Bank received from the Federal Reserve totaled $807 thousand in 2017, $735 thousand in 2016 and $2.1 million in 2015. The decrease in 2016 resulted from the implementation of the aforementioned FAST Act, as the 10-year U.S. Treasury yields used to determine the annual stock dividend rate for 2016 were significantly lower than the fixed, six percent dividend rate used to determine the annual stock dividend rate in 2015.
Most of our non-bank subsidiaries also are subject to regulation by the Federal Reserve Board and other federal and state agencies. Frost Brokerage Services, Inc. is regulated by the SEC, the Financial Industry Regulatory Authority (“FINRA”) and state securities regulators. Frost Investment Advisors, LLC and Frost Investment Services, LLC are subject to the disclosure and regulatory requirements of the Investment Advisors Act of 1940, as administered by the SEC. Our insurance subsidiary is subject to regulation by applicable state insurance regulatory agencies. Other non-bank subsidiaries are subject to both federal and state laws and regulations. Frost Bank and its affiliates are also subject to supervision, regulation, examination and enforcement by the Consumer Financial Protection Bureau (“CFPB”) with respect to consumer protection laws and regulations.
Bank Holding Company Activities
In general, the BHC Act limits the business of bank holding companies to banking, managing or controlling banks and other activities that the Federal Reserve Board has determined to be so closely related to banking as to be a proper incident thereto. In addition, bank holding companies that qualify and elect to be financial holding companies may engage in any activity, or acquire and retain the shares of a company engaged in any activity, that is either (i) financial in nature or incidental to such financial activity (as determined by the Federal Reserve Board in consultation with the Secretary of the Treasury) or (ii) complementary to a financial activity and does not pose a substantial risk to the safety and soundness of depository institutions or the financial system generally (as solely determined by the Federal Reserve Board), without prior approval of the Federal Reserve Board. Activities that are financial in nature include securities underwriting and dealing, insurance underwriting and making merchant banking investments.
To maintain financial holding company status, a financial holding company and all of its depository institution subsidiaries must be “well capitalized” and “well managed.” A depository institution subsidiary is considered to be “well capitalized” if it satisfies the requirements for this status discussed in the section captioned “Capital Adequacy and Prompt Corrective Action,” included elsewhere in this item. A depository institution subsidiary is considered “well managed” if it received a composite rating and management rating of at least “satisfactory” in its most recent examination. A financial holding company’s status will also depend upon it maintaining its status as “well capitalized” and “well managed’ under applicable Federal Reserve Board regulations. If a financial holding company ceases to meet these capital and management requirements, the Federal Reserve Board’s regulations provide that the financial holding company must enter into an agreement with the Federal Reserve Board to comply with all applicable capital and management requirements. Until the financial holding company returns to compliance, the Federal Reserve Board may impose limitations or conditions on the conduct of its activities, and the company may not commence any of the broader financial activities permissible for financial holding companies or acquire a company engaged in such financial activities without prior approval of the Federal Reserve Board. If the company does not return to compliance within 180 days, the Federal Reserve Board may require divestiture of the holding company’s depository institutions. Bank holding companies and banks must also be both well capitalized and well managed in order to acquire banks located outside their home state.
In order for a financial holding company to commence any new activity permitted by the BHC Act or to acquire a company engaged in any new activity permitted by the BHC Act, each insured depository institution subsidiary of the financial holding company must have received a rating of at least “satisfactory” in its most recent examination under the Community Reinvestment Act. See the section captioned “Community Reinvestment Act” included elsewhere in this item.
The Federal Reserve Board has the power to order any bank holding company or its subsidiaries to terminate any activity or to terminate its ownership or control of any subsidiary when the Federal Reserve Board has reasonable grounds to believe that continuation of such activity or such ownership or control constitutes a serious risk to the financial soundness, safety or stability of any bank subsidiary of the bank holding company.
The BHC Act, the Bank Merger Act, the Texas Banking Code and other federal and state statutes regulate acquisitions of commercial banks and their parent holding companies. The BHC Act requires the prior approval of the Federal Reserve Board for the direct or indirect acquisition by a bank holding company of more than 5.0% of the voting shares of a commercial bank or its parent holding company. Under the Bank Merger Act, the prior approval of the Federal Reserve Board or other appropriate bank regulatory authority is required for a member bank to merge with another
8
bank or purchase substantially all of the assets or assume any deposits of another bank. In reviewing applications seeking approval of merger and acquisition transactions, the bank regulatory authorities will consider, among other things, the competitive effect and public benefits of the transactions, the applicant's managerial and financial resources, the capital position of the combined organization, the risks to the stability of the U.S. banking or financial system, the applicant’s performance record under the Community Reinvestment Act (see the section captioned “Community Reinvestment Act” included elsewhere in this item) and its compliance with fair housing and other consumer protection laws and the effectiveness of the subject organizations in combating money laundering activities.
Dividends and Stock Repurchases
The principal source of Cullen/Frost’s liquidity is dividends from Frost Bank. The prior approval of the Federal Reserve Board is required if the total of all dividends declared by a state-chartered member bank in any calendar year would exceed the sum of the bank’s net profits for that year and its retained net profits for the preceding two calendar years, less any required transfers to surplus or to fund the retirement of preferred stock. Federal law also prohibits a state-chartered, member bank from paying dividends that would be greater than the bank’s undivided profits. Frost Bank is also subject to limitations under Texas state law regarding the level of dividends that may be paid. Under the foregoing dividend restrictions, and while maintaining its “well capitalized” status, Frost Bank could pay aggregate dividends of approximately $544.8 million to Cullen/Frost, without obtaining affirmative governmental approvals, at December 31, 2017. This amount is not necessarily indicative of amounts that may be paid or available to be paid in future periods.
In addition, Cullen/Frost and Frost Bank are subject to other regulatory policies and requirements relating to the payment of dividends, including requirements to maintain adequate capital above regulatory minimums. The appropriate federal regulatory authority is authorized to determine under certain circumstances relating to the financial condition of a bank holding company or a bank that the payment of dividends would be an unsafe or unsound practice and to prohibit payment thereof. The appropriate federal regulatory authorities have stated that paying dividends that deplete a bank’s capital base to an inadequate level would be an unsafe and unsound banking practice and that banking organizations should generally pay dividends only out of current operating earnings. In addition, in the current financial and economic environment, the Federal Reserve Board has indicated that bank holding companies should carefully review their dividend policy and has discouraged payment ratios that are at maximum allowable levels unless both asset quality and capital are very strong.
Under the Dodd-Frank Wall Street Reform and Consumer Protection Act (the “Dodd-Frank Act” or “Dodd-Frank”), institutions, such as Cullen/Frost and Frost Bank, with average total consolidated assets greater than $10 billion are required to conduct an annual company-run stress test of capital, consolidated earnings and losses under one base and at least two stress scenarios provided by the federal bank regulators. The company-run stress tests are conducted using data as of December 31st of the preceding calendar year and scenarios released by the agencies. Stress test results must be reported to the agencies by July 31st with public disclosure of summary stress test results under the severely adverse scenario between October 15th and October 31st. Our capital ratios reflected in the stress test calculations are an important factor considered by the Federal Reserve Board in evaluating the capital adequacy of Cullen/Frost and Frost Bank and whether the appropriateness of any proposed payments of dividends or stock repurchases may be an unsafe or unsound practice.
Transactions with Affiliates
Transactions between Frost Bank and its subsidiaries, on the one hand, and Cullen/Frost or any other subsidiary, on the other hand, are regulated under federal banking law. The Federal Reserve Act imposes quantitative and qualitative requirements and collateral requirements on covered transactions by Frost Bank with, or for the benefit of, its affiliates, and generally requires those transactions to be on terms at least as favorable to Frost Bank as if the transaction were conducted with an unaffiliated third party. Covered transactions are defined by statute to include a loan or extension of credit, as well as a purchase of securities issued by an affiliate, a purchase of assets (unless otherwise exempted by the Federal Reserve Board) from the affiliate, certain derivative transactions that create a credit exposure to an affiliate, the acceptance of securities issued by the affiliate as collateral for a loan, and the issuance of a guarantee, acceptance or letter of credit on behalf of an affiliate. In general, any such transaction by Frost Bank or its subsidiaries must be limited to certain thresholds on an individual and aggregate basis and, for credit transactions with any affiliate, must be secured by designated amounts of specified collateral.
9
Federal law also limits a bank’s authority to extend credit to its directors, executive officers and 10% stockholders, as well as to entities controlled by such persons. Among other things, extensions of credit to insiders are required to be made on terms that are substantially the same as, and follow credit underwriting procedures that are not less stringent than, those prevailing for comparable transactions with unaffiliated persons. Also, the terms of such extensions of credit may not involve more than the normal risk of non-repayment or present other unfavorable features and may not exceed certain limitations on the amount of credit extended to such persons individually and in the aggregate.
Source of Strength Doctrine
Federal Reserve Board policy and federal law require bank holding companies to act as a source of financial and managerial strength to their subsidiary banks. Under this requirement, Cullen/Frost is expected to commit resources to support Frost Bank, including at times when Cullen/Frost may not be in a financial position to provide such resources. Any capital loans by a bank holding company to any of its subsidiary banks are subordinate in right of payment to depositors and to certain other indebtedness of such subsidiary banks. In the event of a bank holding company’s bankruptcy, any commitment by the bank holding company to a federal bank regulatory agency to maintain the capital of a subsidiary bank will be assumed by the bankruptcy trustee and entitled to priority of payment.
Capital Requirements
Cullen/Frost and Frost Bank are each required to comply with applicable capital adequacy standards established by the Federal Reserve Board. The current risk-based capital standards applicable to Cullen/Frost and Frost Bank, parts of which are currently in the process of being phased-in, are based on the December 2010 final capital framework for strengthening international capital standards, known as Basel III, of the Basel Committee on Banking Supervision (the “Basel Committee”). In July 2013, the federal bank regulators approved final rules (the “Basel III Capital Rules”) implementing the Basel III framework as well as certain provisions of the Dodd-Frank Act. The Basel III Capital Rules became effective for Cullen/Frost and Frost Bank on January 1, 2015 (subject to a phase-in period for certain provisions).
The Basel III Capital Rules, among other things, (i) include a new capital measure called “Common Equity Tier 1” (“CET1”), (ii) specify that Tier 1 capital consists of CET1 and “Additional Tier 1 capital” instruments meeting certain revised requirements, (iii) define CET1 narrowly by requiring that most deductions/adjustments to regulatory capital measures be made to CET1 and not to the other components of capital, and (iv) expand the scope of the deductions/adjustments to capital as compared to existing regulations.
Under the Basel III Capital Rules, the minimum capital ratios effective as of January 1, 2015 are:
• | 4.5% CET1 to risk-weighted assets; |
• | 6.0% Tier 1 capital (that is, CET1 plus Additional Tier 1 capital) to risk-weighted assets; |
• | 8.0% Total capital (that is, Tier 1 capital plus Tier 2 capital) to risk-weighted assets; and |
• | 4.0% Tier 1 capital to average consolidated assets as reported on consolidated financial statements (known as the “leverage ratio”). |
The Basel III Capital Rules also require a “capital conservation buffer”, composed entirely of CET1, on top of these minimum risk-weighted asset ratios. The implementation of the capital conservation buffer began on January 1, 2016 at the 0.625% level and will increase by 0.625% on each subsequent January 1, until it reaches 2.5% on January 1, 2019. The Basel III Capital Rules also provide for a “countercyclical capital buffer” that is only applicable to certain covered institutions and does not have any current applicability to Cullen/Frost or Frost Bank. The capital conservation buffer is designed to absorb losses during periods of economic stress and effectively increases the minimum required risk-weighted capital ratios. Banking institutions with a ratio of CET1 to risk-weighted assets below the effective minimum (4.5% plus the capital conservation buffer and, if applicable, the countercyclical capital buffer) will face constraints on dividends, equity repurchases and compensation based on the amount of the shortfall.
When fully phased in on January 1, 2019, the Basel III Capital Rules will require Cullen/Frost and Frost Bank to maintain an additional capital conservation buffer of 2.5% of CET1, effectively resulting in minimum ratios of (i) CET1 to risk-weighted assets of at least 7%, (ii) Tier 1 capital to risk-weighted assets of at least 8.5%, (iii) a minimum ratio of Total capital to risk-weighted assets of at least 10.5%; and (iv) a minimum leverage ratio of 4%.
10
The Basel III Capital Rules also provide for a number of deductions from and adjustments to CET1. These include, for example, the requirement that certain deferred tax assets and significant investments in non-consolidated financial entities be deducted from CET1 to the extent that any one such category exceeds 10% of CET1 or all such items, in the aggregate, exceed 15% of CET1. Implementation of the deductions and other adjustments to CET1 began on January 1, 2015 and will be phased-in over a 4-year period (beginning at 40% on January 1, 2015 and an additional 20% per year thereafter).
In addition, under the general risk-based capital rules, the effects of accumulated other comprehensive income items included in capital were excluded for the purposes of determining regulatory capital ratios. Under the Basel III Capital Rules, the effects of certain accumulated other comprehensive income items are not excluded; however, non-advanced approaches banking organizations, including Cullen/Frost and Frost Bank, were able to make a one-time permanent election to continue to exclude these items. Both Cullen/Frost and Frost Bank made this election in order to avoid significant variations in the level of capital depending upon the impact of interest rate fluctuations on the fair value of their available-for-sale securities portfolio. Under the Basel III Capital Rules, trust preferred securities no longer included in our Tier 1 capital may nonetheless be included as a component of Tier 2 capital on a permanent basis without phase-out.
The Basel III Capital Rules prescribe a standardized approach for risk weightings that expanded the risk-weighting categories from the general risk-based capital rules to a much larger and more risk-sensitive number of categories, depending on the nature of the assets, generally ranging from 0% for U.S. government and agency securities, to 600% for certain equity exposures, and resulting in higher risk weights for a variety of asset categories.
With respect to Frost Bank, the Basel III Capital Rules also revise the “prompt corrective action” regulations pursuant to Section 38 of the Federal Deposit Insurance Act, as discussed below under “Prompt Corrective Action.”
Management believes that, as of December 31, 2017, Cullen/Frost and Frost Bank would meet all capital adequacy requirements under the Basel III Capital Rules on a fully phased-in basis as if such requirements had been in effect.
In September 2017, the federal bank regulators proposed to revise and simplify the capital treatment for certain deferred tax assets, mortgage servicing assets, investments in non-consolidated financial entities and minority interests for banking organizations, such as Cullen/Frost and Frost Bank, that are not subject to the advanced approaches requirements. In November 2017, the federal banking regulators revised the Basel III Capital Rules to extend the current transitional treatment of these items for non-advanced approaches banking organizations until the September 2017 proposal is finalized. The September 2017 proposal would also change the capital treatment of certain commercial real estate loans under the standardized approach, which we use to calculate our capital ratios.
In December 2017, the Basel Committee published standards that it described as the finalization of the Basel III post-crisis regulatory reforms (the standards are commonly referred to as “Basel IV”). Among other things, these standards revise the Basel Committee's standardized approach for credit risk (including by recalibrating risk weights and introducing new capital requirements for certain “unconditionally cancellable commitments,” such as unused credit card lines of credit) and provides a new standardized approach for operational risk capital. Under the Basel framework, these standards will generally be effective on January 1, 2022, with an aggregate output floor phasing in through January 1, 2027. Under the current U.S. capital rules, operational risk capital requirements and a capital floor apply only to advanced approaches institutions, and not to Cullen/Frost or Frost Bank. The impact of Basel IV on us will depend on the manner in which it is implemented by the federal bank regulators.
Liquidity Requirements
Historically, the regulation and monitoring of bank and bank holding company liquidity has been addressed as a supervisory matter, without required formulaic measures. Liquidity risk management has become increasingly important since the financial crisis. The Basel III liquidity framework requires banks and bank holding companies to measure their liquidity against specific liquidity tests that, although similar in some respects to liquidity measures historically applied by banks and regulators for management and supervisory purposes, going forward would be required by regulation. One test, referred to as the liquidity coverage ratio (“LCR”), is designed to ensure that the banking entity maintains an adequate level of unencumbered high-quality liquid assets equal to the entity’s expected net cash outflow for a 30-day time horizon (or, if greater, 25% of its expected total cash outflow) under an acute liquidity stress scenario. The other test, referred to as the net stable funding ratio (“NSFR”), is designed to promote more medium- and long-term funding of the assets and activities of banking entities over a one-year time horizon.
11
In September 2014, the federal bank regulators approved final rules implementing the LCR for advanced approaches banking organizations (i.e., banking organizations with $250 billion or more in total consolidated assets or $10 billion or more in total on-balance sheet foreign exposure) and a modified version of the LCR for bank holding companies with at least $50 billion in total consolidated assets that are not advanced approach banking organizations, neither of which would apply to Cullen/Frost or Frost Bank. In the second quarter of 2016, the federal banking regulators issued a proposed rule that would implement the NSFR for certain U.S. banking organizations to ensure they have access to stable funding over a one-year time horizon. The proposed rule would not apply to U.S. banking organizations with less than $50 billion in total consolidated assets such as Cullen/Frost and Frost Bank.
Prompt Corrective Action
The Federal Deposit Insurance Act, as amended (“FDIA”), requires among other things, the federal banking agencies to take “prompt corrective action” in respect of depository institutions that do not meet minimum capital requirements. The FDIA includes the following five capital tiers: “well capitalized,” “adequately capitalized,” “undercapitalized,” “significantly undercapitalized” and “critically undercapitalized.” A depository institution’s capital tier will depend upon how its capital levels compare with various relevant capital measures and certain other factors, as established by regulation. The relevant capital measures, which reflect changes under the Basel III Capital Rules that became effective on January 1, 2015, are the total capital ratio, the CET1 capital ratio, the Tier 1 capital ratio and the leverage ratio.
A bank will be (i) “well capitalized” if the institution has a total risk-based capital ratio of 10.0% or greater, a CET1 capital ratio of 6.5% or greater, a Tier 1 risk-based capital ratio of 8.0% or greater, and a leverage ratio of 5.0% or greater, and is not subject to any order or written directive by any such regulatory authority to meet and maintain a specific capital level for any capital measure; (ii) “adequately capitalized” if the institution has a total risk-based capital ratio of 8.0% or greater, a CET1 capital ratio of 4.5% or greater, a Tier 1 risk-based capital ratio of 6.0% or greater, and a leverage ratio of 4.0% or greater and is not “well capitalized”; (iii) “undercapitalized” if the institution has a total risk-based capital ratio that is less than 8.0%, a CET1 capital ratio less than 4.5%, a Tier 1 risk-based capital ratio of less than 6.0% or a leverage ratio of less than 4.0%; (iv) “significantly undercapitalized” if the institution has a total risk-based capital ratio of less than 6.0%, a CET1 capital ratio less than 3.0%, a Tier 1 risk-based capital ratio of less than 4.0% or a leverage ratio of less than 3.0%; and (v) “critically undercapitalized” if the institution’s tangible equity is equal to or less than 2.0% of average quarterly tangible assets. An institution may be downgraded to, or deemed to be in, a capital category that is lower than indicated by its capital ratios if it is determined to be in an unsafe or unsound condition or if it receives an unsatisfactory examination rating with respect to certain matters. A bank’s capital category is determined solely for the purpose of applying prompt corrective action regulations, and the capital category may not constitute an accurate representation of the bank’s overall financial condition or prospects for other purposes.
In addition, the FDIA prohibits an insured depository institution from accepting brokered deposits or offering interest rates on any deposits significantly higher than the prevailing rate in the bank’s normal market area or nationally (depending upon where the deposits are solicited), unless it is well capitalized or is adequately capitalized and receives a waiver from the FDIC. A depository institution that is adequately capitalized and accepts brokered deposits under a waiver from the FDIC may not pay an interest rate on any deposit in excess of 75 basis points over certain prevailing market rates.
The FDIA generally prohibits a depository institution from making any capital distributions (including payment of a dividend) or paying any management fee to its parent holding company if the depository institution would thereafter be “undercapitalized.” “Undercapitalized” institutions are subject to growth limitations and are required to submit a capital restoration plan. The agencies may not accept such a plan without determining, among other things, that the plan is based on realistic assumptions and is likely to succeed in restoring the depository institution’s capital. In addition, for a capital restoration plan to be acceptable, the depository institution’s parent holding company must guarantee that the institution will comply with such capital restoration plan. The bank holding company must also provide appropriate assurances of performance. The aggregate liability of the parent holding company is limited to the lesser of (i) an amount equal to 5.0% of the depository institution’s total assets at the time it became undercapitalized and (ii) the amount which is necessary (or would have been necessary) to bring the institution into compliance with all capital standards applicable with respect to such institution as of the time it fails to comply with the plan. If a depository institution fails to submit an acceptable plan, it is treated as if it is “significantly undercapitalized.”
12
“Significantly undercapitalized” depository institutions may be subject to a number of requirements and restrictions, including orders to sell sufficient voting stock to become “adequately capitalized,” requirements to reduce total assets, and cessation of receipt of deposits from correspondent banks. “Critically undercapitalized” institutions are subject to the appointment of a receiver or conservator.
The appropriate federal banking agency may, under certain circumstances, reclassify a well capitalized insured depository institution as adequately capitalized. The FDIA provides that an institution may be reclassified if the appropriate federal banking agency determines (after notice and opportunity for hearing) that the institution is in an unsafe or unsound condition or deems the institution to be engaging in an unsafe or unsound practice.
The appropriate agency is also permitted to require an adequately capitalized or undercapitalized institution to comply with the supervisory provisions as if the institution were in the next lower category (but not treat a significantly undercapitalized institution as critically undercapitalized) based on supervisory information other than the capital levels of the institution.
Cullen/Frost believes that, as of December 31, 2017, its bank subsidiary, Frost Bank, was “well capitalized” based on the aforementioned ratios. For further information regarding the capital ratios and leverage ratio of Cullen/Frost and Frost Bank see the discussion under the section captioned “Capital and Liquidity” included in Item 7. Management’s Discussion and Analysis of Financial Condition and Results of Operations and Note 9 - Capital and Regulatory Matters in the notes to consolidated financial statements included in Item 8. Financial Statements and Supplementary Data, elsewhere in this report.
Safety and Soundness Standards
The FDIA requires the federal bank regulatory agencies to prescribe standards, by regulations or guidelines, relating to internal controls, information systems and internal audit systems, loan documentation, credit underwriting, interest rate risk exposure, asset growth, asset quality, earnings, stock valuation and compensation, fees and benefits, and such other operational and managerial standards as the agencies deem appropriate. Guidelines adopted by the federal bank regulatory agencies establish general standards relating to internal controls and information systems, internal audit systems, loan documentation, credit underwriting, interest rate exposure, asset growth and compensation, fees and benefits. In general, the guidelines require, among other things, appropriate systems and practices to identify and manage the risk and exposures specified in the guidelines. The guidelines prohibit excessive compensation as an unsafe and unsound practice and describe compensation as excessive when the amounts paid are unreasonable or disproportionate to the services performed by an executive officer, employee, director or principal stockholder. In addition, the agencies adopted regulations that authorize, but do not require, an agency to order an institution that has been given notice by an agency that it is not satisfying any of such safety and soundness standards to submit a compliance plan. If, after being so notified, an institution fails to submit an acceptable compliance plan or fails in any material respect to implement an acceptable compliance plan, the agency must issue an order directing action to correct the deficiency and may issue an order directing other actions of the types to which an undercapitalized institution is subject under the “prompt corrective action” provisions of the FDIA. See “Prompt Corrective Action” above. If an institution fails to comply with such an order, the agency may seek to enforce such order in judicial proceedings and to impose civil money penalties.
Deposit Insurance
Substantially all of the deposits of Frost Bank are insured up to applicable limits by the Deposit Insurance Fund (“DIF”) of the FDIC and Frost Bank is subject to deposit insurance assessments to maintain the DIF. Deposit insurance assessments are based on average total assets minus average tangible equity. For larger institutions, such as Frost Bank, the FDIC uses a performance score and a loss-severity score that are used to calculate an initial assessment rate. In calculating these scores, the FDIC uses a bank’s capital level and supervisory ratings (its “CAMELS ratings”) and certain financial measures to assess an institution’s ability to withstand asset-related stress and funding-related stress. The FDIC has the ability to make discretionary adjustments to the total score based upon significant risk factors that are not adequately captured in the calculations.
In October 2010, the FDIC adopted a new DIF restoration plan to ensure that the fund reserve ratio reaches 1.35% by September 30, 2020, as required by the Dodd-Frank Act. In August 2016, the FDIC announced that the DIF reserve ratio had surpassed 1.15% as of June 30, 2016. As a result, beginning in the third quarter of 2016, the range of initial assessment ranges for all institutions were adjusted downward such that the initial base deposit insurance assessment rate ranges from 3 to 30 basis points on an annualized basis. After the effect of potential base-rate adjustments, the total base assessment rate could range from 1.5 to 40 basis points on an annualized basis. In March 2016, the FDIC adopted
13
a final rule increasing the reserve ratio for the DIF to 1.35% of total insured deposits. The rule imposes a surcharge on the assessments of depository institutions with $10 billion or more in assets, including Frost Bank, beginning in the third quarter of 2016 and continuing through the earlier of the quarter that the reserve ratio first reaches or exceeds 1.35% and December 31, 2018. This surcharge resulted in increased costs for Frost Bank in 2016 and 2017. Under the rule, if the reserve ratio does not reach 1.35% by December 31, 2018, the FDIC will impose a shortfall assessment on larger depository institutions, including Frost Bank.
FDIC deposit insurance expense totaled $20.1 million, $17.4 million and $14.5 million in 2017, 2016 and 2015, respectively. FDIC deposit insurance expense includes deposit insurance assessments and Financing Corporation (“FICO”) assessments related to outstanding FICO bonds. The FICO is a mixed-ownership government corporation established by the Competitive Equality Banking Act of 1987 whose sole purpose was to function as a financing vehicle for the now defunct Federal Savings & Loan Insurance Corporation.
Under the FDIA, the FDIC may terminate deposit insurance upon a finding that the institution has engaged in unsafe and unsound practices, is in an unsafe or unsound condition to continue operations, or has violated any applicable law, regulation, rule, order or condition imposed by the FDIC.
Enhanced Prudential Standards
The Dodd-Frank Act directed the Federal Reserve Board to monitor emerging risks to financial stability and enact enhanced supervision and prudential standards applicable to bank holding companies with total consolidated assets of $50 billion or more and non-bank covered companies designated as systemically important by the Financial Stability Oversight Council (often referred to as systemically important financial institutions). The Dodd-Frank Act mandates that certain regulatory requirements applicable to systemically important financial institutions be more stringent than those applicable to other financial institutions.
In February 2014, the Federal Reserve adopted rules to implement certain of these enhanced prudential standards. Beginning in 2015, the rules require publicly traded bank holding companies with $10 billion or more in total consolidated assets to establish risk committees and require bank holding companies with $50 billion or more in total consolidated assets to comply with enhanced liquidity and overall risk management standards. Cullen/Frost has established a risk committee and is in compliance with this requirement.
We are monitoring developments with respect to the enhanced prudential standards because of their application to us if our total consolidated assets reach $50 billion or more.
The Volcker Rule
The so-called Volcker Rule under the Dodd-Frank Act prohibits banks and their affiliates from engaging in proprietary trading and investing in and sponsoring hedge funds and private equity funds. The Volcker Rule, which became effective in July 2015, does not significantly impact the operations of Cullen/Frost and its subsidiaries, as we do not have any significant engagement in the businesses prohibited by the Volcker Rule.
Depositor Preference
The FDIA provides that, in the event of the “liquidation or other resolution” of an insured depository institution, the claims of depositors of the institution, including the claims of the FDIC as subrogee of insured depositors, and certain claims for administrative expenses of the FDIC as a receiver, will have priority over other general unsecured claims against the institution. If an insured depository institution fails, insured and uninsured depositors, along with the FDIC, will have priority in payment ahead of unsecured, non-deposit creditors, including depositors whose deposits are payable only outside of the United States and the parent bank holding company, with respect to any extensions of credit they have made to such insured depository institution.
Interchange Fees
Under the Durbin Amendment to the Dodd-Frank Act, the Federal Reserve adopted rules establishing standards for assessing whether the interchange fees that may be charged with respect to certain electronic debit transactions are “reasonable and proportional” to the costs incurred by issuers for processing such transactions.
Interchange fees, or “swipe” fees, are charges that merchants pay to us and other card-issuing banks for processing electronic payment transactions. Federal Reserve Board rules applicable to financial institutions that have assets of
14
$10 billion or more provide that the maximum permissible interchange fee for an electronic debit transaction is the sum of 21 cents per transaction and 5 basis points multiplied by the value of the transaction. An upward adjustment of no more than 1 cent to an issuer's debit card interchange fee is allowed if the card issuer develops and implements policies and procedures reasonably designed to achieve certain fraud-prevention standards. The Federal Reserve Board also has rules governing routing and exclusivity that require issuers to offer two unaffiliated networks for routing transactions on each debit or prepaid product.
Consumer Financial Protection
We are subject to a number of federal and state consumer protection laws that extensively govern our relationship with our customers. These laws include the Equal Credit Opportunity Act, the Fair Credit Reporting Act, the Truth in Lending Act, the Truth in Savings Act, the Electronic Fund Transfer Act, the Expedited Funds Availability Act, the Home Mortgage Disclosure Act, the Fair Housing Act, the Real Estate Settlement Procedures Act, the Fair Debt Collection Practices Act, the Service Members Civil Relief Act and these laws’ respective state-law counterparts, as well as state usury laws and laws regarding unfair and deceptive acts and practices. These and other federal laws, among other things, require disclosures of the cost of credit and terms of deposit accounts, provide substantive consumer rights, prohibit discrimination in credit transactions, regulate the use of credit report information, provide financial privacy protections, prohibit unfair, deceptive and abusive practices, restrict our ability to raise interest rates and subject us to substantial regulatory oversight. Violations of applicable consumer protection laws can result in significant potential liability from litigation brought by customers, including actual damages, restitution and attorneys’ fees. Federal bank regulators, state attorneys general and state and local consumer protection agencies may also seek to enforce consumer protection requirements and obtain these and other remedies, including regulatory sanctions, customer rescission rights, action by the state and local attorneys general in each jurisdiction in which we operate and civil money penalties. Failure to comply with consumer protection requirements may also result in our failure to obtain any required bank regulatory approval for merger or acquisition transactions we may wish to pursue or our prohibition from engaging in such transactions even if approval is not required.
The Consumer Financial Protection Bureau (“CFPB”) is a federal agency responsible for implementing, examining and enforcing compliance with federal consumer protection laws. The CFPB has broad rulemaking authority for a wide range of consumer financial laws that apply to all banks, including, among other things, the authority to prohibit “unfair, deceptive or abusive” acts and practices. Abusive acts or practices are defined as those that materially interfere with a consumer’s ability to understand a term or condition of a consumer financial product or service or take unreasonable advantage of a consumer’s (i) lack of financial savvy, (ii) inability to protect himself in the selection or use of consumer financial products or services, or (iii) reasonable reliance on a covered entity to act in the consumer’s interests. The CFPB can issue cease-and-desist orders against banks and other entities that violate consumer financial laws. The CFPB may also institute a civil action against an entity in violation of federal consumer financial law in order to impose a civil penalty or injunction. The CFPB has examination and enforcement authority over all banks with more than $10 billion in assets, as well as their affiliates.
Banking regulators take into account compliance with consumer protection laws when considering approval of a proposed transaction.
Community Reinvestment Act
The Community Reinvestment Act of 1977 (“CRA”) requires depository institutions to assist in meeting the credit needs of their market areas consistent with safe and sound banking practice. Under the CRA, each depository institution is required to help meet the credit needs of its market areas by, among other things, providing credit to low- and moderate-income individuals and communities. Depository institutions are periodically examined for compliance with the CRA and are assigned ratings. In order for a financial holding company to commence any new activity permitted by the BHC Act, or to acquire any company engaged in any new activity permitted by the BHC Act, each insured depository institution subsidiary of the financial holding company must have received a rating of at least “satisfactory” in its most recent examination under the CRA. Furthermore, banking regulators take into account CRA ratings when considering a request for an approval of a proposed transaction. Frost Bank received a rating of “satisfactory” in its most recent CRA examination in 2015.
15
Financial Privacy
The federal banking regulators adopted rules that limit the ability of banks and other financial institutions to disclose non-public information about consumers to nonaffiliated third parties. These limitations require disclosure of privacy policies to consumers and, in some circumstances, allow consumers to prevent disclosure of certain personal information to a nonaffiliated third party. These regulations affect how consumer information is transmitted through diversified financial companies and conveyed to outside vendors.
Anti-Money Laundering and the USA Patriot Act
A major focus of governmental policy on financial institutions in recent years has been aimed at combating money laundering and terrorist financing. The USA PATRIOT Act of 2001, or the USA Patriot Act, substantially broadened the scope of United States anti-money laundering laws and regulations by imposing significant new compliance and due diligence obligations, creating new crimes and penalties and expanding the extra-territorial jurisdiction of the United States. Financial institutions are also prohibited from entering into specified financial transactions and account relationships and must use enhanced due diligence procedures in their dealings with certain types of high-risk customers and implement a written customer identification program. Financial institutions must take certain steps to assist government agencies in detecting and preventing money laundering and report certain types of suspicious transactions. Regulatory authorities routinely examine financial institutions for compliance with these obligations, and failure of a financial institution to maintain and implement adequate programs to combat money laundering and terrorist financing, or to comply with all of the relevant laws or regulations, could have serious legal and reputational consequences for the institution, including causing applicable bank regulatory authorities not to approve merger or acquisition transactions when regulatory approval is required or to prohibit such transactions even if approval is not required. Regulatory authorities have imposed cease and desist orders and civil money penalties against institutions found to be violating these obligations.
Office of Foreign Assets Control Regulation
The U.S. Treasury Department’s Office of Foreign Assets Control, or OFAC, administers and enforces economic and trade sanctions against targeted foreign countries and regimes, under authority of various laws, including designated foreign countries, nationals and others. OFAC publishes lists of specially designated targets and countries. We are responsible for, among other things, blocking accounts of, and transactions with, such targets and countries, prohibiting unlicensed trade and financial transactions with them and reporting blocked transactions after their occurrence. Failure to comply with these sanctions could have serious legal and reputational consequences, including causing applicable bank regulatory authorities not to approve merger or acquisition transactions when regulatory approval is required or to prohibit such transactions even if approval is not required. Regulatory authorities have imposed cease and desist orders and civil money penalties against institutions found to be violating these obligations.
Incentive Compensation
The Federal Reserve Board reviews, as part of its regular, risk-focused examination process, the incentive compensation arrangements of banking organizations, such as Cullen/Frost, that are not “large, complex banking organizations.” These reviews are tailored to each organization based on the scope and complexity of the organization’s activities and the prevalence of incentive compensation arrangements. The findings of this supervisory initiative will be included in reports of examination. Deficiencies will be incorporated into the organization’s supervisory ratings, which can affect the organization’s ability to make acquisitions and take other actions. Enforcement actions may be taken against a banking organization if its incentive compensation arrangements, or related risk-management control or governance processes, pose a risk to the organization’s safety and soundness and the organization is not taking prompt and effective measures to correct the deficiencies.
In June 2010, the Federal Reserve Board, OCC and FDIC issued comprehensive final guidance on incentive compensation policies intended to ensure that the incentive compensation policies of banking organizations do not undermine the safety and soundness of such organizations by encouraging excessive risk-taking. The guidance, which covers all employees that have the ability to materially affect the risk profile of an organization, either individually or as part of a group, is based upon the key principles that a banking organization’s incentive compensation arrangements should (i) provide incentives that do not encourage risk-taking beyond the organization’s ability to effectively identify and manage risks, (ii) be compatible with effective internal controls and risk management, and (iii) be supported by strong corporate governance, including active and effective oversight by the organization’s board of directors.
16
During the second quarter of 2016, the U.S. financial regulators, including the Federal Reserve Board and the SEC, proposed revised rules on incentive-based payment arrangements at specified regulated entities having at least $1 billion in total assets (including Cullen/Frost and Frost Bank). The proposed revised rules would establish general qualitative requirements applicable to all covered entities, which would include (i) prohibiting incentive arrangements that encourage inappropriate risks by providing excessive compensation; (ii) prohibiting incentive arrangements that encourage inappropriate risks that could lead to a material financial loss; (iii) establishing requirements for performance measures to appropriately balance risk and reward; (iv) requiring board of director oversight of incentive arrangements; and (v) mandating appropriate record-keeping. Under the proposed rule, larger financial institutions with total consolidated assets of at least $50 billion would also be subject to additional requirements applicable to such institutions’ “senior executive officers” and “significant risk-takers.” These additional requirements would not be applicable to Cullen/Frost or Frost Bank, each of which currently have less than $50 billion in total consolidated assets.
Cybersecurity
In March 2015, federal regulators issued two related statements regarding cybersecurity. One statement indicates that financial institutions should design multiple layers of security controls to establish lines of defense and to ensure that their risk management processes also address the risk posed by compromised customer credentials, including security measures to reliably authenticate customers accessing internet-based services of the financial institution. The other statement indicates that a financial institution’s management is expected to maintain sufficient business continuity planning processes to ensure the rapid recovery, resumption and maintenance of the institution’s operations after a cyber-attack involving destructive malware. A financial institution is also expected to develop appropriate processes to enable recovery of data and business operations and address rebuilding network capabilities and restoring data if the institution or its critical service providers fall victim to this type of cyber-attack. If we fail to observe the regulatory guidance, we could be subject to various regulatory sanctions, including financial penalties.
In the ordinary course of business, we rely on electronic communications and information systems to conduct our operations and to store sensitive data. We employ an in-depth, layered, defensive approach that leverages people, processes and technology to manage and maintain cybersecurity controls. We employ a variety of preventative and detective tools to monitor, block, and provide alerts regarding suspicious activity, as well as to report on any suspected advanced persistent threats. Notwithstanding the strength of our defensive measures, the threat from cyber attacks is severe, attacks are sophisticated and increasing in volume, and attackers respond rapidly to changes in defensive measures. While to date, we have not detected a significant compromise, significant data loss or any material financial losses related to cybersecurity attacks, our systems and those of our customers and third-party service providers are under constant threat and it is possible that we could experience a significant event in the future. Risks and exposures related to cybersecurity attacks are expected to remain high for the foreseeable future due to the rapidly evolving nature and sophistication of these threats, as well as due to the expanding use of Internet banking, mobile banking and other technology-based products and services by us and our customers. See Item 1A. Risk Factors for a further discussion of risks related to cybersecurity.
Future Legislation and Regulation
Congress may enact legislation from time to time that affects the regulation of the financial services industry, and state legislatures may enact legislation from time to time affecting the regulation of financial institutions chartered by or operating in those states. Federal and state regulatory agencies also periodically propose and adopt changes to their regulations or change the manner in which existing regulations are applied. The substance or impact of pending or future legislation or regulation, or the application thereof, cannot be predicted, although any change could impact the regulatory structure under which we or our competitors operate and may significantly increase costs, impede the efficiency of internal business processes, require an increase in regulatory capital, require modifications to our business strategy, and limit our ability to pursue business opportunities in an efficient manner. It could also affect our competitors differently than us, including in a manner that would make them more competitive. A change in statutes, regulations or regulatory policies applicable to Cullen/Frost or any of its subsidiaries could have a material, adverse effect on our business, financial condition and results of operations.
Employees
At December 31, 2017, we employed 4,270 full-time equivalent employees. None of our employees are represented by collective bargaining agreements. We believe our employee relations to be good.
17
Executive Officers of the Registrant
The names, ages as of December 31, 2017, recent business experience and positions or offices held by each of the executive officers of Cullen/Frost are as follows:
Name and Position Held | Age | Recent Business Experience |
Phillip D. Green Chairman of the Board, Chief Executive Officer and Director of Cullen/Frost | 63 | Officer of Frost Bank since July 1980. Group Executive Vice President, Chief Financial Officer of Cullen/Frost from October 1995 to January 2015. President of Cullen/Frost from January 2015 to March 2016. Chairman of the Board and Chief Executive Officer of Cullen/Frost from April 2016 to present. |
Patrick B. Frost Director of Cullen/Frost, President of Frost Bank, Group Executive Vice President, Frost Wealth Advisors of Frost Bank and President of Frost Insurance | 57 | Officer of Frost Bank since 1985. President of Frost Bank from August 1993 to present. Director of Cullen/Frost from May 1997 to present. Group Executive Vice President, Frost Wealth Advisors of Frost Bank from April 2016 to present. President of Frost Insurance from October 2014 to present. |
Jerry Salinas Group Executive Vice President, Chief Financial Officer of Cullen/Frost | 59 | Officer of Frost Bank since March 1986. Senior Executive Vice President, Treasurer of Cullen/Frost from 1997 to January 2015. Group Executive Vice President, Chief Financial Officer of Cullen/Frost from January 2015 to present. |
Annette Alonzo Group Executive Vice President, Chief Human Resources Officer of Frost Bank | 49 | Officer of Frost Bank since 1993. Executive Vice President, Human Resources of Frost Bank from July 2006 to January 2015. Senior Executive Vice President, Human Resources of Frost Bank from January 2015 to July 2015. Group Executive Vice President, Human Resources of Frost Bank from July 2015 to March 2016. Group Executive Vice President, Chief Human Resources Officer of Frost Bank from April 2016 to present. |
Robert A. Berman Group Executive Vice President, Research and Strategy of Frost Bank | 55 | Officer of Frost Bank since January 1989. Group Executive Vice President, Research and Strategy of Frost Bank from May 2001 to present. |
Paul H. Bracher President of Cullen/Frost and Group Executive Vice President, Chief Banking Officer of Frost Bank | 61 | Officer of Frost Bank since January 1982. President, State Regions of Frost Bank from February 2001 to January 2015. Group Executive Vice President, Chief Banking Officer of Frost Bank from January 2015 to present. President of Cullen/Frost from April 2016 to present. |
Gary McKnight Group Executive Vice President, Technology and Operations of Frost Bank | 64 | Officer of Frost Bank since 1981. Senior Executive Vice President, Technology and Operations of Frost Bank from January 2005 to July 2015. Group Executive Vice President, Technology and Operations of Frost Bank from July 2015 to present. |
William L. Perotti Group Executive Vice President, Chief Risk Officer of Frost Bank | 60 | Officer of Frost Bank since December 1982. Group Executive Vice President, Chief Credit Officer of Frost Bank from May 2001 to January 2015. Group Executive Vice President, Chief Risk Officer of Frost Bank from April 2005 to present. |
Mike Russell Group Executive Vice President, Chief Operations Officer | 61 | Officer of Frost Bank since December 2017. Group Executive Vice President, Chief Operations Officer since January 2018. Prior to joining Frost, Mr. Russell was a management consultant and former corporate technology executive. |
Jimmy Stead Group Executive Vice President, Executive Officer - Consumer Banking of Frost Bank | 42 | Officer of Frost Bank since July 2001. Senior Vice President Electronic Commerce Operations of Frost Bank from October 2007 to December 2015, Executive Vice President, Electronic Commerce Operations of Frost Bank from January 2016 to January 2017. Group Executive Vice President, Chief Consumer Banking Officer of Frost Bank from January 2017 to present. |
Candace Wolfshohl Group Executive Vice President, Culture and People Development of Frost Bank | 57 | Officer of Frost Bank since 1989. Executive Vice President, Staff Development of Frost Bank from January 2008 to January 2015. Senior Executive Vice President, Staff Development of Frost Bank from January 2015 to July 2015. Group Executive Vice President, Culture and People Development of Frost Bank from July 2015 to present. |
There are no arrangements or understandings between any executive officer of Cullen/Frost and any other person pursuant to which such executive officer was or is to be selected as an officer.
18
Available Information
Under the Securities Exchange Act of 1934, we are required to file annual, quarterly and current reports, proxy statements and other information with the Securities and Exchange Commission (“SEC”). You may read and copy any document we file with the SEC at the SEC’s Public Reference Room at 100 F Street, N.E., Washington, D.C. 20549. Please call the SEC at 1-800-SEC-0330 for further information about the public reference room. The SEC maintains a website at http://www.sec.gov that contains reports, proxy and information statements, and other information regarding issuers that file electronically with the SEC. We file electronically with the SEC.
We make available, free of charge through our website, our reports on Forms 10-K, 10-Q and 8-K, and amendments to those reports, as soon as reasonably practicable after such reports are filed with or furnished to the SEC. Additionally, we have adopted and posted on our website a code of ethics that applies to our principal executive officer, principal financial officer and principal accounting officer. Our website also includes our corporate governance guidelines and the charters for our audit committee, our compensation and benefits committee, our risk committee, and our corporate governance and nominating committee. The address for our website is http://www.frostbank.com. We will provide a printed copy of any of the aforementioned documents to any requesting shareholder.
ITEM 1A. RISK FACTORS
An investment in our common stock is subject to risks inherent to our business. The material risks and uncertainties that management believes affect us are described below. Before making an investment decision, you should carefully consider the risks and uncertainties described below together with all of the other information included or incorporated by reference in this report. The risks and uncertainties described below are not the only ones facing us. Additional risks and uncertainties that management is not aware of or focused on or that management currently deems immaterial may also impair our business operations. This report is qualified in its entirety by these risk factors.
If any of the following risks actually occur, our business, financial condition and results of operations could be materially and adversely affected. If this were to happen, the market price of our common stock could decline significantly, and you could lose all or part of your investment.
Risks Related To Our Business
Our Business May Be Adversely Affected By Conditions In The Financial Markets and Economic and Political Conditions Generally
Our success depends, to a certain extent, upon local, national and global economic and political conditions, as well as governmental monetary policies. Our financial performance generally, and in particular the ability of borrowers to pay interest on and repay principal of outstanding loans and the value of collateral securing those loans, as well as demand for loans and other products and services we offer, is highly dependent upon the business environment in the markets where we operate, in the State of Texas and in the United States as a whole. A favorable business environment is generally characterized by, among other factors, economic growth, efficient capital markets, low inflation, low unemployment, high business and investor confidence, and strong business earnings. Unfavorable or uncertain economic and market conditions can be caused by declines in economic growth, business activity or investor or business confidence; limitations on the availability or increases in the cost of credit and capital; increases in inflation or interest rates; high unemployment, natural disasters; or a combination of these or other factors. In recent years, economic growth and business activity across a wide range of industries and regions in the U.S. has been slow and uneven. In addition, oil price volatility, the level of U.S. debt and global economic conditions have had a destabilizing effect on financial markets. While economic conditions in the State of Texas, the United States and worldwide have improved, there can be no assurance that this improvement will continue. Economic pressure on consumers and uncertainty regarding continuing economic improvement may result in changes in consumer and business spending, borrowing and savings habits. Such conditions, as well as further oil price volatility, could have a material adverse effect on the credit quality of our loans and our business, financial condition and results of operations.
19
We Are Subject To Lending Risk and Lending Concentration Risk
There are inherent risks associated with our lending activities. These risks include, among other things, the impact of changes in interest rates and changes in the economic conditions in the markets where we operate as well as those across the State of Texas and the United States. Increases in interest rates and/or weakening economic conditions could adversely impact the ability of borrowers to repay outstanding loans or the value of the collateral securing these loans. We are also subject to various laws and regulations that affect our lending activities. Failure to comply with applicable laws and regulations could subject us to regulatory enforcement action that could result in the assessment of significant civil money penalties against us.
As of December 31, 2017, approximately 88.1% of our loan portfolio consisted of commercial and industrial, energy, construction and commercial real estate mortgage loans. These types of loans are generally viewed as having more risk of default and are typically larger than residential real estate loans or consumer loans. Because our loan portfolio contains a significant number of commercial and industrial, energy, construction and commercial real estate loans with relatively large balances, the deterioration of one or a few of these loans could cause a significant increase in non-performing loans. An increase in non-performing loans could result in a net loss of earnings from these loans, an increase in the provision for loan losses and an increase in loan charge-offs, all of which could have a material adverse effect on our business, financial condition and results of operations.
See the section captioned “Loans” in Item 7. Management’s Discussion and Analysis of Financial Condition and Results of Operations located elsewhere in this report for further discussion related to commercial and industrial, energy, construction and commercial real estate loans.
We Are Subject To Interest Rate Risk
Our earnings and cash flows are largely dependent upon our net interest income. Net interest income is the difference between interest income earned on interest-earning assets such as loans and securities and interest expense paid on interest-bearing liabilities such as deposits and borrowed funds. Interest rates are highly sensitive to many factors that are beyond our control, including general economic conditions and policies of various governmental and regulatory agencies and, in particular, the Federal Open Market Committee. Changes in monetary policy, including changes in interest rates, could influence not only the interest we receive on loans and securities and the amount of interest we pay on deposits and borrowings, but such changes could also affect (i) our ability to originate loans and obtain deposits, (ii) the fair value of our financial assets and liabilities, and (iii) the average duration of our mortgage-backed securities portfolio. If the interest rates paid on deposits and other borrowings increase at a faster rate than the interest rates received on loans and other investments, our net interest income, and therefore earnings, could be adversely affected. Earnings could also be adversely affected if the interest rates received on loans and other investments fall more quickly than the interest rates paid on deposits and other borrowings. Any substantial, unexpected, prolonged change in market interest rates could have a material adverse effect on our business, financial condition and results of operations.
See Item 7. Management’s Discussion and Analysis of Financial Condition and Results of Operations under the section captioned “Net Interest Income” and Item 7A. Quantitative and Qualitative Disclosures About Market Risk located elsewhere in this report for further discussion related to interest rate sensitivity and our management of interest rate risk.
Our Allowance For Loan Losses May Be Insufficient
We maintain an allowance for loan losses, which is a reserve established through a provision for loan losses charged to expense, which represents management’s best estimate of inherent losses that have been incurred within the existing portfolio of loans. The allowance, in the judgment of management, is necessary to reserve for estimated loan losses and risks inherent in the loan portfolio. The level of the allowance reflects management’s continuing evaluation of industry concentrations; specific credit risks; loan loss experience; current loan portfolio quality; present economic, political and regulatory conditions and unidentified losses inherent in the current loan portfolio. The determination of the appropriate level of the allowance for loan losses inherently involves a high degree of subjectivity and requires us to make significant estimates of current credit risks and future trends, all of which may undergo material changes. Continuing deterioration in economic conditions affecting borrowers, new information regarding existing loans, identification of additional problem loans and other factors, both within and outside of our control, may require an increase in the allowance for loan losses. In addition, bank regulatory agencies periodically review our allowance for loan losses and may require an increase in the provision for loan losses or the recognition of further loan charge-offs, based on judgments different than those of management. Furthermore, if charge-offs in future periods exceed the
20
allowance for loan losses, we will need additional provisions to increase the allowance for loan losses. Any increases in the allowance for loan losses will result in a decrease in net income and, possibly, capital, and may have a material adverse effect on our business, financial condition and results of operations.
See the section captioned “Allowance for Loan Losses” in Item 7. Management’s Discussion and Analysis of Financial Condition and Results of Operations located elsewhere in this report for further discussion related to our process for determining the appropriate level of the allowance for loan losses.
Our Profitability Depends Significantly On Economic Conditions In The State Of Texas
Our success depends primarily on the general economic conditions of the State of Texas and the specific local markets in which we operate. Unlike larger national or other regional banks that are more geographically diversified, we provide banking and financial services to customers across Texas through financial centers in the Austin, Corpus Christi, Dallas, Fort Worth, Houston, Permian Basin, Rio Grande Valley and San Antonio regions. The local economic conditions in these areas have a significant impact on the demand for our products and services as well as the ability of our customers to repay loans, the value of the collateral securing loans and the stability of our deposit funding sources. Moreover, approximately 98.2% of the securities in our municipal bond portfolio were issued by political subdivisions or agencies within the State of Texas. A significant decline in general economic conditions in Texas, whether caused by recession, inflation, unemployment, changes in oil prices, changes in securities markets, acts of terrorism, outbreak of hostilities or other international or domestic occurrences or other factors could impact these local economic conditions and, in turn, have a material adverse effect on our business, financial condition and results of operations.
We May Be Adversely Affected By Volatility in Crude Oil Prices
As of December 31, 2017, energy loans comprised approximately 11.4% of our loan portfolio. Furthermore, energy production and related industries represent a large part of the economies in some of our primary markets. In recent years, actions by certain members of the Organization of Petroleum Exporting Countries (“OPEC”) impacting crude oil production levels have led to increased global oil supplies which has resulted in significant declines in market oil prices. Decreased market oil prices compressed margins for many U.S. and Texas-based oil producers, particularly those that utilize higher-cost production technologies such as hydraulic fracking and horizontal drilling, as well as oilfield service providers, energy equipment manufacturers and transportation suppliers, among others. The price per barrel of crude oil was approximately $60 at December 31, 2017 up from $54 at December 31, 2016. We have experienced increased losses within our energy portfolio in recent years as a result of oil price volatility, relative to our historical experience. Though oil prices have recovered from recent low-levels, future oil price volatility could have a negative impact on the U.S. economy and, in particular, the economies of energy-dominant states such as Texas and, accordingly, could have a material adverse effect on our business, financial condition and results of operations.
We May Be Adversely Affected By The Soundness Of Other Financial Institutions
Financial services institutions are interrelated as a result of trading, clearing, counterparty, or other relationships. We have exposure to many different industries and counterparties, and routinely execute transactions with counterparties in the financial services industry, including commercial banks, brokers and dealers, investment banks, and other institutional clients. Many of these transactions expose us to credit risk in the event of a default by a counterparty or client. In addition, our credit risk may be exacerbated when the collateral held by us cannot be realized upon or is liquidated at prices not sufficient to recover the full amount of the credit or derivative exposure due to us. Any such losses could have a material adverse effect on our business, financial condition and results of operations.
We Operate In A Highly Competitive Industry and Market Area
We face substantial competition in all areas of our operations from a variety of different competitors, many of which are larger and may have more financial resources. Such competitors primarily include national, regional, and community banks within the various markets where we operate. We also face competition from many other types of financial institutions, including, without limitation, savings and loans, credit unions, finance companies, brokerage firms, insurance companies and other financial intermediaries. The financial services industry could become even more competitive as a result of legislative, regulatory and technological changes and continued consolidation. Also, technology and other changes have lowered barriers to entry and made it possible for non-banks to offer products and services traditionally provided by banks. For example, consumers can maintain funds that would have historically been held as bank deposits in brokerage accounts or mutual funds. Consumers can also complete transactions such as paying bills and/or transferring funds directly without the assistance of banks. The process of eliminating banks as
21
intermediaries, known as “disintermediation,” could result in the loss of fee income, as well as the loss of customer deposits and the related income generated from those deposits. Further, many of our competitors have fewer regulatory constraints and may have lower cost structures. Additionally, due to their size, many competitors may be able to achieve economies of scale and, as a result, may offer a broader range of products and services as well as better pricing for those products and services than we can.
Our ability to compete successfully depends on a number of factors, including, among other things:
• | The ability to develop, maintain and build long-term customer relationships based on top quality service, high ethical standards and safe, sound assets. |
• | The ability to expand our market position. |
• | The scope, relevance and pricing of products and services offered to meet customer needs and demands. |
• | The rate at which we introduce new products and services relative to our competitors. |
• | Customer satisfaction with our level of service. |
• | Industry and general economic trends. |
Failure to perform in any of these areas could significantly weaken our competitive position, which could adversely affect our growth and profitability, which, in turn, could have a material adverse effect on our business, financial condition and results of operations.
We Are Subject To Extensive Government Regulation and Supervision and Possible Enforcement and Other Legal Actions
We, primarily through Cullen/Frost, Frost Bank and certain non-bank subsidiaries, are subject to extensive federal and state regulation and supervision, which vests a significant amount of discretion in the various regulatory authorities. Banking regulations are primarily intended to protect depositors’ funds, federal deposit insurance funds and the banking system as a whole, not security holders. These regulations and supervisory guidance affect our lending practices, capital structure, investment practices, dividend policy and growth, among other things. Congress and federal regulatory agencies continually review banking laws, regulations and policies for possible changes. The Dodd-Frank Act, enacted in July 2010, instituted major changes to the banking and financial institutions regulatory regimes. Other changes to statutes, regulations or regulatory policies or supervisory guidance, including changes in interpretation or implementation of statutes, regulations, policies or supervisory guidance, could affect us in substantial and unpredictable ways. Such changes could subject us to additional costs, limit the types of financial services and products we may offer and/or increase the ability of non-banks to offer competing financial services and products, among other things. Failure to comply with laws, regulations, policies or supervisory guidance could result in enforcement and other legal actions by Federal or state authorities, including criminal and civil penalties, the loss of FDIC insurance, the revocation of a banking charter, other sanctions by regulatory agencies, civil money penalties and/or reputational damage. In this regard, government authorities, including the bank regulatory agencies, are pursuing aggressive enforcement actions with respect to compliance and other legal matters involving financial activities, which heightens the risks associated with actual and perceived compliance failures. Any of the foregoing could have a material adverse effect on our business, financial condition and results of operations.
See the sections captioned “Supervision and Regulation” included in Item 1. Business and Note 9 - Capital and Regulatory Matters in the notes to consolidated financial statements included in Item 8. Financial Statements and Supplementary Data, which are located elsewhere in this report.
Our Accounting Estimates and Risk Management Processes Rely On Analytical and Forecasting Models
The processes we use to estimate our inherent loan losses and to measure the fair value of financial instruments, as well as the processes used to estimate the effects of changing interest rates and other market measures on our financial condition and results of operations, depends upon the use of analytical and forecasting models. These models reflect assumptions that may not be accurate, particularly in times of market stress or other unforeseen circumstances. Even if these assumptions are adequate, the models may prove to be inadequate or inaccurate because of other flaws in their design or their implementation. If the models we use for interest rate risk and asset-liability management are inadequate, we may incur increased or unexpected losses upon changes in market interest rates or other market measures. If the models we use for determining our probable loan losses are inadequate, the allowance for loan losses may not be sufficient to support future charge-offs. If the models we use to measure the fair value of financial instruments are inadequate, the fair value of such financial instruments may fluctuate unexpectedly or may not accurately reflect what
22
we could realize upon sale or settlement of such financial instruments. Any such failure in our analytical or forecasting models could have a material adverse effect on our business, financial condition and results of operations.
Changes In Accounting Standards Could Materially Impact Our Financial Statements
From time to time accounting standards setters change the financial accounting and reporting standards that govern the preparation of our financial statements. These changes can be difficult to predict and can materially impact how we record and report our financial condition and results of operations. In some cases, we could be required to apply a new or revised standard retroactively, resulting in changes to previously reported financial results or a cumulative charge to retained earnings.
The Repeal Of Federal Prohibitions On Payment Of Interest On Demand Deposits Could Increase Our Interest Expense
All federal prohibitions on the ability of financial institutions to pay interest on demand deposit accounts were repealed as part of the Dodd-Frank Act beginning on July 21, 2011. As a result, some financial institutions have commenced offering interest on demand deposits to compete for customers. We do not yet know what interest rates other institutions may offer as market interest rates increase. Our interest expense will increase and our net interest margin will decrease if we begin offering interest on demand deposits to attract additional customers or maintain current customers, which could have a material adverse effect on our business, financial condition and results of operations.
We May Need To Raise Additional Capital In The Future, and Such Capital May Not Be Available When Needed Or At All
We may need to raise additional capital in the future to provide us with sufficient capital resources and liquidity to meet our commitments and business needs, particularly if our asset quality or earnings were to deteriorate significantly. Our ability to raise additional capital, if needed, will depend on, among other things, conditions in the capital markets at that time, which are outside of our control, and our financial condition. Economic conditions and the loss of confidence in financial institutions may increase our cost of funding and limit access to certain customary sources of capital, including inter-bank borrowings, repurchase agreements and borrowings from the discount window of the Federal Reserve.
We cannot assure that such capital will be available on acceptable terms or at all. Any occurrence that may limit our access to the capital markets, such as a decline in the confidence of debt purchasers, depositors of Frost Bank or counterparties participating in the capital markets, or a downgrade of Cullen/Frost’s or Frost Bank’s debt ratings, may adversely affect our capital costs and our ability to raise capital and, in turn, our liquidity. Moreover, if we need to raise capital in the future, we may have to do so when many other financial institutions are also seeking to raise capital and would have to compete with those institutions for investors. An inability to raise additional capital on acceptable terms when needed could have a materially adverse effect on our business, financial condition and results of operations.
The Value Of Our Goodwill and Other Intangible Assets May Decline In The Future
As of December 31, 2017, we had $660.0 million of goodwill and other intangible assets. A significant decline in our expected future cash flows, a significant adverse change in the business climate, slower growth rates or a significant and sustained decline in the price of Cullen/Frost’s common stock may necessitate taking charges in the future related to the impairment of our goodwill and other intangible assets. If we were to conclude that a future write-down of goodwill and other intangible assets is necessary, we would record the appropriate charge, which could have a material adverse effect on our business, financial condition and results of operations.
Our Controls and Procedures May Fail or Be Circumvented
Our internal controls, disclosure controls and procedures, and corporate governance policies and procedures are based in part on certain assumptions and can provide only reasonable, not absolute, assurances that the objectives of the system are met. Any failure or circumvention of our controls and procedures or failure to comply with regulations related to controls and procedures could have a material adverse effect on our business, financial condition and results of operations.
23
New Lines Of Business Or New Products and Services May Subject Us To Additional Risks
From time to time, we may implement new lines of business or offer new products and services within existing lines of business. There are substantial risks and uncertainties associated with these efforts, particularly in instances where the markets are not fully developed. In developing and marketing new lines of business and/or new products and services we may invest significant time and resources. Initial timetables for the introduction and development of new lines of business and/or new products or services may not be achieved and price and profitability targets may not prove feasible. External factors, such as compliance with regulations, competitive alternatives, and shifting market preferences, may also impact the successful implementation of a new line of business or a new product or service. Furthermore, any new line of business and/or new product or service could have a significant impact on the effectiveness of our system of internal controls. Failure to successfully manage these risks in the development and implementation of new lines of business or new products or services could have a material adverse effect on our business, financial condition and results of operations.
Negative Publicity Could Damage Our Reputation And Our Business
Reputation risk, or the risk to our earnings and capital from negative public opinion, is inherent in our business. Negative public opinion could adversely affect our ability to keep and attract customers and expose us to adverse legal and regulatory consequences. Negative public opinion could result from our actual or alleged conduct in any number of activities, including lending practices, corporate governance, regulatory compliance, mergers and acquisitions, and disclosure, sharing or inadequate protection of customer information, and from actions taken by government regulators and community organizations in response to that conduct. Negative public opinion could also result from adverse news or publicity that impairs the reputation of the financial services industry generally. Because we conduct most of our business under the “Frost” brand, negative public opinion about one business could affect our other businesses.
Cullen/Frost Relies On Dividends From Its Subsidiaries For Most Of Its Revenue
Cullen/Frost is a separate and distinct legal entity from its subsidiaries. It receives substantially all of its revenue from dividends from its subsidiaries. These dividends are the principal source of funds to pay dividends on Cullen/Frost’s common stock and preferred stock and interest and principal on Cullen/Frost’s debt. Various federal and state laws and regulations limit the amount of dividends that Frost Bank and certain non-bank subsidiaries may pay to Cullen/Frost. Also, Cullen/Frost’s right to participate in a distribution of assets upon a subsidiary’s liquidation or reorganization is subject to the prior claims of the subsidiary’s creditors. In the event Frost Bank is unable to pay dividends to Cullen/Frost, Cullen/Frost may not be able to service debt, pay obligations or pay dividends on our common stock or our preferred stock. The inability to receive dividends from Frost Bank could have a material adverse effect on our business, financial condition and results of operations.
See the section captioned “Supervision and Regulation” in Item 1. Business and Note 9 - Capital and Regulatory Matters in the notes to consolidated financial statements included in Item 8. Financial Statements and Supplementary Data, which are located elsewhere in this report.
Potential Acquisitions May Disrupt Our Business and Dilute Stockholder Value
We generally seek merger or acquisition partners that are culturally similar and have experienced management and possess either significant market presence or have potential for improved profitability through financial management, economies of scale or expanded services. Acquiring other banks, businesses, or branches involves various risks commonly associated with acquisitions, including, among other things:
• | Potential exposure to unknown or contingent liabilities of the target company. |
• | Exposure to potential asset quality issues of the target company. |
• | Potential disruption to our business. |
• | Potential diversion of our management’s time and attention. |
• | The possible loss of key employees and customers of the target company. |
• | Difficulty in estimating the value of the target company. |
• | Potential changes in banking or tax laws or regulations that may affect the target company. |
Acquisitions typically involve the payment of a premium over book and market values, and, therefore, some dilution of our tangible book value and net income per common share may occur in connection with any future transaction.
24
Furthermore, failure to realize the expected revenue increases, cost savings, increases in geographic or product presence, and/or other projected benefits from an acquisition could have a material adverse effect on our business, financial condition and results of operations.
Acquisitions May Be Delayed, Impeded, Or Prohibited Due To Regulatory Issues
Acquisitions by financial institutions, including us, are subject to approval by a variety of federal and state regulatory agencies (collectively, “regulatory approvals”). The process for obtaining these required regulatory approvals has become substantially more difficult in recent years. Regulatory approvals could be delayed, impeded, restrictively conditioned or denied due to existing or new regulatory issues we have, or may have, with regulatory agencies, including, without limitation, issues related to Bank Secrecy Act compliance, Community Reinvestment Act issues, fair lending laws, fair housing laws, consumer protection laws, unfair, deceptive, or abusive acts or practices regulations and other similar laws and regulations. We may fail to pursue, evaluate or complete strategic and competitively significant acquisition opportunities as a result of our inability, or perceived or anticipated inability, to obtain regulatory approvals in a timely manner, under reasonable conditions or at all. Difficulties associated with potential acquisitions that may result from these factors could have a material adverse effect on our business, financial condition and results of operations.
We Are Subject To Liquidity Risk
We require liquidity to meet our deposit and debt obligations as they come due. Our access to funding sources in amounts adequate to finance our activities or on terms that are acceptable to us could be impaired by factors that affect us specifically or the financial services industry or economy generally. Factors that could reduce our access to liquidity sources include a downturn in the Texas economy, difficult credit markets or adverse regulatory actions against us. Our access to deposits may also be affected by the liquidity needs of our depositors. In particular, a substantial majority of our liabilities are demand, savings, interest checking and money market deposits, which are payable on demand or upon several days’ notice, while by comparison, a substantial portion of our assets are loans, which cannot be called or sold in the same time frame. We may not be able to replace maturing deposits and advances as necessary in the future, especially if a large number of our depositors sought to withdraw their accounts, regardless of the reason. A failure to maintain adequate liquidity could have a material adverse effect on our business, financial condition and results of operations.
We May Not Be Able To Attract and Retain Skilled People
Our success depends, in large part, on our ability to attract and retain key people. Competition for the best people in most activities engaged in by us can be intense and we may not be able to hire people or to retain them. We do not currently have employment agreements or non-competition agreements with any of our senior officers. The unexpected loss of services of key personnel could have a material adverse impact on our business, financial condition and results of operations because of their skills, knowledge of our market, years of industry experience and the difficulty of promptly finding qualified replacement personnel. In addition, the scope and content of U.S. banking regulators' policies on incentive compensation, as well as changes to these policies, could adversely affect our ability to hire, retain and motivate our key employees.
Our Information Systems May Experience Failure, Interruption Or Breach In Security
In the ordinary course of business, we rely on electronic communications and information systems to conduct our operations and to store sensitive data. Any failure, interruption or breach in security of these systems could result in significant disruption to our operations. Information security breaches and cybersecurity-related incidents may include, but are not limited to, attempts to access information, including customer and company information, malicious code, computer viruses and denial of service attacks that could result in unauthorized access, misuse, loss or destruction of data (including confidential customer information), account takeovers, unavailability of service or other events. These types of threats may derive from human error, fraud or malice on the part of external or internal parties, or may result from accidental technological failure. Further, to access our products and services our customers may use computers and mobile devices that are beyond our security control systems. Our technologies, systems, networks and software, and those of other financial institutions have been, and are likely to continue to be, the target of cybersecurity threats and attacks, which may range from uncoordinated individual attempts to sophisticated and targeted measures directed at us. The risk of a security breach or disruption, particularly through cyber attack or cyber intrusion, has increased as the number, intensity and sophistication of attempted attacks and intrusions from around the world have increased.
25
Our business requires the collection and retention of large volumes of customer data, including personally identifiable information in various information systems that we maintain and in those maintained by third parties with whom we contract to provide data services. We also maintain important internal company data such as personally identifiable information about our employees and information relating to our operations. The integrity and protection of that customer and company data is important to us. Our collection of such customer and company data is subject to extensive regulation and oversight.
Our customers and employees have been, and will continue to be, targeted by parties using fraudulent e-mails and other communications in attempts to misappropriate passwords, bank account information or other personal information or to introduce viruses or other malware through “Trojan horse” programs to our information systems and/or our customers' computers. Though we endeavor to mitigate these threats through product improvements, use of encryption and authentication technology and customer and employee education, such cyber attacks against us or our merchants and our third party service providers remain a serious issue. The pervasiveness of cybersecurity incidents in general and the risks of cyber crime are complex and continue to evolve. More generally, publicized information concerning security and cyber-related problems could inhibit the use or growth of electronic or web-based applications or solutions as a means of conducting commercial transactions.
Although we make significant efforts to maintain the security and integrity of our information systems and have implemented various measures to manage the risk of a security breach or disruption, there can be no assurance that our security efforts and measures will be effective or that attempted security breaches or disruptions would not be successful or damaging. Even the most well protected information, networks, systems and facilities remain potentially vulnerable because attempted security breaches, particularly cyber attacks and intrusions, or disruptions will occur in the future, and because the techniques used in such attempts are constantly evolving and generally are not recognized until launched against a target, and in some cases are designed not to be detected and, in fact, may not be detected. Accordingly, we may be unable to anticipate these techniques or to implement adequate security barriers or other preventative measures, and thus it is virtually impossible for us to entirely mitigate this risk. While we maintain specific “cyber” insurance coverage, which would apply in the event of various breach scenarios, the amount of coverage may not be adequate in any particular case. Furthermore, because cyber threat scenarios are inherently difficult to predict and can take many forms, some breaches may not be covered under our cyber insurance coverage. A security breach or other significant disruption of our information systems or those related to our customers, merchants and our third party vendors, including as a result of cyber attacks, could (i) disrupt the proper functioning of our networks and systems and therefore our operations and/or those of certain of our customers; (ii) result in the unauthorized access to, and destruction, loss, theft, misappropriation or release of confidential, sensitive or otherwise valuable information of ours or our customers; (iii) result in a violation of applicable privacy, data breach and other laws, subjecting us to additional regulatory scrutiny and expose the us to civil litigation, governmental fines and possible financial liability; (iv) require significant management attention and resources to remedy the damages that result; or (v) harm our reputation or cause a decrease in the number of customers that choose to do business with us. The occurrence of any of the foregoing could have a material adverse effect on our business, financial condition and results of operations.
We Continually Encounter Technological Change
The financial services industry is continually undergoing rapid technological change with frequent introductions of new technology-driven products and services. The effective use of technology increases efficiency and enables financial institutions to better serve customers and to reduce costs. Our future success depends, in part, upon our ability to address the needs of our customers by using technology to provide products and services that will satisfy customer demands, as well as to create additional efficiencies in our operations. Many of our competitors have substantially greater resources to invest in technological improvements. We may not be able to effectively implement new technology-driven products and services or be successful in marketing these products and services to our customers. Failure to successfully keep pace with technological change affecting the financial services industry could have a material adverse effect on our business, financial condition and results of operations.
26
We Are Subject To Claims and Litigation Pertaining To Fiduciary Responsibility
From time to time, customers make claims and take legal action pertaining to our performance of our fiduciary responsibilities. Whether customer claims and legal action related to our performance of our fiduciary responsibilities are founded or unfounded, if such claims and legal actions are not resolved in a manner favorable to us they may result in significant financial liability and/or adversely affect the market perception of us and our products and services as well as impact customer demand for those products and services. Any financial liability or reputational damage could have a material adverse effect on our business, financial condition and results of operations.
Our Operations Rely On Certain External Vendors
We rely on certain external vendors to provide products and services necessary to maintain our day-to-day operations. These third party vendors are sources of operational and informational security risk to us, including risks associated with operational errors, information system interruptions or breaches and unauthorized disclosures of sensitive or confidential client or customer information. If these vendors encounter any of these issues, or if we have difficulty communicating with them, we could be exposed to disruption of operations, loss of service or connectivity to customers, reputational damage, and litigation risk that could have a material adverse effect on our business and, in turn, our financial condition and results of operations.
In addition, our operations are exposed to risk that these vendors will not perform in accordance with the contracted arrangements under service level agreements. While we have selected these external vendors carefully, we do not control their actions. The failure of an external vendor to perform in accordance with the contracted arrangements under service level agreements, because of changes in the vendor’s organizational structure, financial condition, support for existing products and services or strategic focus or for any other reason, could be disruptive to our operations, which could have a material adverse effect on our business and, in turn, our financial condition and results of operations. Replacing these external vendors could also entail significant delay and expense.
We Are Subject to Claims and Litigation Pertaining to Intellectual Property
Banking and other financial services companies, including us, rely on technology companies to provide information technology products and services necessary to support day-to-day operations. Technology companies frequently enter into litigation based on allegations of patent infringement or other violations of intellectual property rights. In addition, patent holding companies seek to monetize patents they have purchased or otherwise obtained. Competitors of our vendors, or other individuals or companies, have from time to time claimed to hold intellectual property sold to us by our vendors. Such claims may increase in the future as the financial services sector becomes more reliant on information technology vendors. The plaintiffs in these actions frequently seek injunctions and substantial damages.
Regardless of the scope or validity of such patents or other intellectual property rights, or the merits of any claims by potential or actual litigants, we may have to engage in protracted litigation. Such litigation is often expensive, time-consuming, disruptive to our operations and distracting to management. If we are found to infringe upon one or more patents or other intellectual property rights, we may be required to pay substantial damages or royalties to a third-party. In certain cases, we may consider entering into licensing agreements for disputed intellectual property, although no assurance can be given that such licenses can be obtained on acceptable terms or that litigation will not occur. These licenses may also significantly increase our operating expenses. If legal matters related to intellectual property claims were resolved against us or settled, we could be required to make payments in amounts that could have a material adverse effect on our business, financial condition and results of operations.
We Are Subject To Environmental Liability Risk Associated With Lending Activities
A significant portion of our loan portfolio is secured by real property. During the ordinary course of business, we may foreclose on and take title to properties securing certain loans. In doing so, there is a risk that hazardous or toxic substances could be found on these properties. If hazardous or toxic substances are found, we may be liable for remediation costs, as well as for personal injury and property damage. Environmental laws may require us to incur substantial expenses and may materially reduce the affected property’s value or limit our ability to use or sell the affected property. In addition, future laws or more stringent interpretations or enforcement policies with respect to existing laws may increase our exposure to environmental liability. Environmental reviews of real property before initiating foreclosure actions may not be sufficient to detect all potential environmental hazards. The remediation costs and any other financial liabilities associated with an environmental hazard could have a material adverse effect on our business, financial condition and results of operations.
27
Severe Weather, Natural Disasters, Acts Of War Or Terrorism and Other External Events Could Significantly Impact Our Business
Severe weather, natural disasters, acts of war or terrorism and other adverse external events could have a significant impact on our ability to conduct business. In addition, such events could affect the stability of our deposit base, impair the ability of borrowers to repay outstanding loans, impair the value of collateral securing loans, cause significant property damage, result in loss of revenue and/or cause us to incur additional expenses. The occurrence of any such event in the future could have a material adverse effect on our business, which, in turn, could have a material adverse effect on our business, financial condition and results of operations.
Financial Services Companies Depend On The Accuracy and Completeness Of Information About Customers and Counterparties
In deciding whether to extend credit or enter into other transactions, we may rely on information furnished by or on behalf of customers and counterparties, including financial statements, credit reports and other financial information. We may also rely on representations of those customers, counterparties or other third parties, such as independent auditors, as to the accuracy and completeness of that information. Reliance on inaccurate or misleading financial statements, credit reports or other financial information could have a material adverse impact on our business, financial condition and results of operations.
Risks Associated With Our Common Stock
Our Stock Price Can Be Volatile
Stock price volatility may make it more difficult for you to resell your common stock when you want and at prices you find attractive. Our stock price can fluctuate significantly in response to a variety of factors including, among other things:
• | Actual or anticipated variations in quarterly results of operations. |
• | Recommendations by securities analysts. |
• | Operating and stock price performance of other companies that investors deem comparable to us. |
• | News reports relating to trends, concerns and other issues in the financial services industry. |
• | Perceptions in the marketplace regarding us and/or our competitors. |
• | New technology used, or services offered, by competitors. |
• | Significant acquisitions or business combinations, strategic partnerships, joint ventures or capital commitments by or involving us or our competitors. |
• | Failure to integrate acquisitions or realize anticipated benefits from acquisitions. |
• | Changes in government regulations. |
• | Geopolitical conditions such as acts or threats of terrorism or military conflicts. |
General market fluctuations, including real or anticipated changes in the strength of the Texas economy; industry factors and general economic and political conditions and events, such as economic slowdowns or recessions; interest rate changes, oil price volatility or credit loss trends could also cause our stock price to decrease regardless of operating results.
The Trading Volume In Our Common Stock Is Less Than That Of Other Larger Financial Services Companies
Although our common stock is listed for trading on the New York Stock Exchange (NYSE), the trading volume in our common stock is less than that of other, larger financial services companies. A public trading market having the desired characteristics of depth, liquidity and orderliness depends on the presence in the marketplace of willing buyers and sellers of our common stock at any given time. This presence depends on the individual decisions of investors and general economic and market conditions over which we have no control. Given the lower trading volume of our common stock, significant sales of our common stock, or the expectation of these sales, could cause our stock price to fall.
28
Cullen/Frost May Not Continue To Pay Dividends On Its Common Stock In The Future
Holders of Cullen/Frost common stock are only entitled to receive such dividends as its board of directors may declare out of funds legally available for such payments. Although Cullen/Frost has historically declared cash dividends on its common stock, it is not required to do so and may reduce or eliminate its common stock dividend in the future. This could adversely affect the market price of Cullen/Frost’s common stock. Also, Cullen/Frost is a bank holding company, and its ability to declare and pay dividends is dependent on certain federal regulatory considerations, including the guidelines of the Federal Reserve Board regarding capital adequacy and dividends.
As more fully discussed in Note 9 - Capital and Regulatory Matters in the notes to consolidated financial statements included in Item 8. Financial Statements and Supplementary Data, which are located elsewhere in this report, our ability to declare or pay dividends on our common stock may also be subject to certain restrictions in the event that we elect to defer the payment of interest on our junior subordinated deferrable interest debentures or do not declare and pay dividends on our Series A Preferred Stock.
An Investment In Our Common Stock Is Not An Insured Deposit
Our common stock is not a bank deposit and, therefore, is not insured against loss by the Federal Deposit Insurance Corporation (FDIC), any other deposit insurance fund or by any other public or private entity. Investment in our common stock is inherently risky for the reasons described in this “Risk Factors” section and elsewhere in this report and is subject to the same market forces that affect the price of common stock in any company. As a result, if you acquire our common stock, you could lose some or all of your investment.
Certain Banking Laws May Have An Anti-Takeover Effect
Provisions of federal banking laws, including regulatory approval requirements, could make it more difficult for a third party to acquire us, even if doing so would be perceived to be beneficial to our shareholders. These provisions effectively inhibit a non-negotiated merger or other business combination, which, in turn, could adversely affect the market price of our common stock.
ITEM 1B. UNRESOLVED STAFF COMMENTS
None
ITEM 2. PROPERTIES
Our headquarters is located in downtown San Antonio, Texas. These facilities, which we lease, house our executive and primary administrative offices, as well as the principal banking headquarters of Frost Bank. We also own or lease other facilities within our primary market areas in the regions of Austin, Corpus Christi, Dallas, Fort Worth, Houston, Permian Basin, Rio Grande Valley and San Antonio. We consider our properties to be suitable and adequate for our present needs.
ITEM 3. LEGAL PROCEEDINGS
We are subject to various claims and legal actions that have arisen in the course of conducting business. Management does not expect the ultimate disposition of these matters to have a material adverse effect on our business, financial condition and results of operations.
ITEM 4. MINE SAFETY DISCLOSURES
None
29
PART II
ITEM 5. MARKET FOR REGISTRANT’S COMMON EQUITY, RELATED STOCKHOLDER MATTERS AND ISSUER PURCHASES OF EQUITY SECURITIES
Common Stock Market Prices and Dividends
Our common stock is traded on the New York Stock Exchange, Inc. (“NYSE”) under the symbol “CFR”. The tables below set forth for each quarter of 2017 and 2016 the high and low intra-day sales prices per share of Cullen/Frost’s common stock and the cash dividends declared per share.
2017 | 2016 | ||||||||||||||
Sales Price Per Share | High | Low | High | Low | |||||||||||
First quarter | $ | 96.62 | $ | 82.08 | $ | 59.59 | $ | 42.41 | |||||||
Second quarter | 99.20 | 85.53 | 67.72 | 51.43 | |||||||||||
Third quarter | 98.70 | 81.09 | 73.80 | 59.00 | |||||||||||
Fourth quarter | 103.37 | 92.03 | 88.98 | 69.86 | |||||||||||
Cash Dividends Per Share | 2017 | 2016 | |||||
First quarter | $ | 0.54 | $ | 0.53 | |||
Second quarter | 0.57 | 0.54 | |||||
Third quarter | 0.57 | 0.54 | |||||
Fourth quarter | 0.57 | 0.54 | |||||
Total | $ | 2.25 | $ | 2.15 | |||
As of December 31, 2017, there were 63,475,586 shares of our common stock outstanding held by 1,220 holders of record. The closing price per share of common stock on December 29, 2017, the last trading day of our fiscal year, was $94.65.
Our management is currently committed to continuing to pay regular cash dividends; however, there can be no assurance as to future dividends because they are dependent on our future earnings, capital requirements and financial condition. See the section captioned “Supervision and Regulation” included in Item 1. Business, the section captioned “Capital and Liquidity” included in Item 7. Management’s Discussion and Analysis of Financial Condition and Results of Operations and Note 9 - Capital and Regulatory Matters in the notes to consolidated financial statements included in Item 8. Financial Statements and Supplementary Data, all of which are included elsewhere in this report.
Stock-Based Compensation Plans
Information regarding stock-based compensation awards outstanding and available for future grants as of December 31, 2017, segregated between stock-based compensation plans approved by shareholders and stock-based compensation plans not approved by shareholders, is presented in the table below. Additional information regarding stock-based compensation plans is presented in Note 11 - Employee Benefit Plans in the notes to consolidated financial statements included in Item 8. Financial Statements and Supplementary Data located elsewhere in this report.
Plan Category | Number of Shares to be Issued Upon Exercise of Outstanding Awards | Weighted-Average Exercise Price of Outstanding Awards | Number of Shares Available for Future Grants | ||||||
Plans approved by shareholders | 3,339,499 | (1) | $ | 63.34 | (2) | 1,367,750 | |||
Plans not approved by shareholders | — | — | — | ||||||
Total | 3,339,499 | 63.34 | 1,367,750 | ||||||
(1) | Includes 2,917,142 shares related to stock options, 289,246 shares related to non-vested stock units, 53,008 shares related to director deferred stock units and 80,103 shares related to performance stock units (assuming attainment of the maximum payout rate as set forth by the performance criteria). |
(2) | Excludes outstanding stock units which are exercised for no consideration. |
30
Stock Repurchase Plans
From time to time, our board of directors has authorized stock repurchase plans. In general, stock repurchase plans allow us to proactively manage our capital position and return excess capital to shareholders. Shares purchased under such plans also provide us with shares of common stock necessary to satisfy obligations related to stock compensation awards. On October 24, 2017, our board of directors authorized a $150.0 million stock repurchase program, allowing us to repurchase shares of our common stock over a two-year period from time to time at various prices in the open market or through private transactions. No shares were repurchased under this plan during 2017. Under prior plans, we repurchased 1,134,966 shares at a total cost of $100.0 million during 2017 and 1,485,493 shares at a total cost of $100.0 million during 2015.
The following table provides information with respect to purchases made by or on behalf of us or any “affiliated purchaser” (as defined in Rule 10b-18(a)(3) under the Securities Exchange Act of 1934), of our common stock during the fourth quarter of 2017.
Period | Total Number of Shares Purchased | Average Price Paid Per Share | Total Number of Shares Purchased as Part of Publicly Announced Plans | Maximum Number (or Approximate Dollar Value) of Shares That May Yet Be Purchased Under the Plans at the End of the Period | ||||||||||
October 1, 2017 to October 31, 2017 | 14,120 | (1) | $ | 101.40 | — | $ | 150,000 | |||||||
November 1, 2017 to November 30, 2017 | — | — | — | 150,000 | ||||||||||
December 1, 2017 to December 31, 2017 | — | — | — | 150,000 | ||||||||||
Total | 14,120 | $ | — | — | ||||||||||
(1) | All of these repurchases were made in connection with the vesting of certain share awards. |
31
Performance Graph
The performance graph below compares the cumulative total shareholder return on Cullen/Frost Common Stock with the cumulative total return on the equity securities of companies included in the Standard & Poor’s 500 Stock Index and the Standard and Poor’s 500 Bank Index, measured at the last trading day of each year shown. The graph assumes an investment of $100 on December 31, 2012 and reinvestment of dividends on the date of payment without commissions. The performance graph represents past performance and should not be considered to be an indication of future performance.
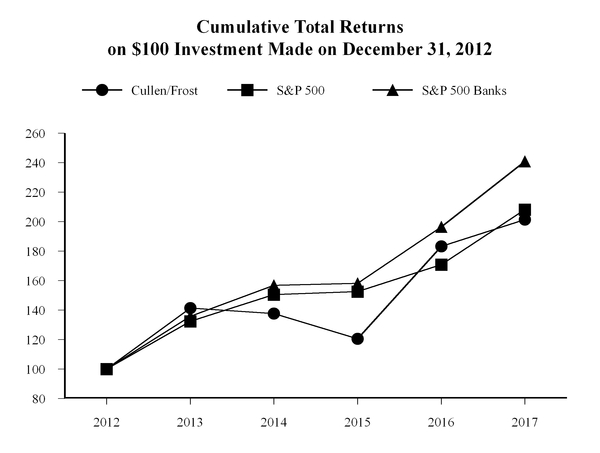
2012 | 2013 | 2014 | 2015 | 2016 | 2017 | ||||||||||||||||||
Cullen/Frost | $ | 100.00 | $ | 141.26 | $ | 137.67 | $ | 120.55 | $ | 183.24 | $ | 201.43 | |||||||||||
S&P 500 | 100.00 | 132.39 | 150.51 | 152.59 | 170.84 | 208.14 | |||||||||||||||||
S&P 500 Banks | 100.00 | 135.72 | 156.78 | 158.10 | 196.54 | 240.87 | |||||||||||||||||
32
ITEM 6. SELECTED FINANCIAL DATA
The following consolidated selected financial data is derived from our audited financial statements as of and for the five years ended December 31, 2017. The following consolidated financial data should be read in conjunction with Management’s Discussion and Analysis of Financial Condition and Results of Operations and the Consolidated Financial Statements and related notes included elsewhere in this report. The operating results of companies acquired during the periods presented are included with our results of operations since their respective dates of acquisition. Dollar amounts, except per share data, and common shares outstanding are in thousands.
Year Ended December 31, | |||||||||||||||||||
2017 | 2016 | 2015 | 2014 | 2013 | |||||||||||||||
Consolidated Statements of Income | |||||||||||||||||||
Interest income: | |||||||||||||||||||
Loans, including fees | $ | 534,804 | $ | 458,094 | $ | 433,872 | $ | 440,958 | $ | 415,230 | |||||||||
Securities | 315,599 | 313,943 | 307,394 | 249,705 | 219,904 | ||||||||||||||
Interest-bearing deposits | 41,608 | 16,103 | 8,123 | 10,725 | 7,284 | ||||||||||||||
Federal funds sold and resell agreements | 936 | 272 | 107 | 83 | 82 | ||||||||||||||
Total interest income | 892,947 | 788,412 | 749,496 | 701,471 | 642,500 | ||||||||||||||
Interest expense: | |||||||||||||||||||
Deposits | 17,188 | 7,248 | 9,024 | 11,022 | 14,459 | ||||||||||||||
Federal funds purchased and repurchase agreements | 1,522 | 204 | 167 | 134 | 121 | ||||||||||||||
Junior subordinated deferrable interest debentures | 3,955 | 3,281 | 2,725 | 2,488 | 6,426 | ||||||||||||||
Subordinated notes payable and other borrowings | 3,860 | 1,343 | 948 | 893 | 939 | ||||||||||||||
Total interest expense | 26,525 | 12,076 | 12,864 | 14,537 | 21,945 | ||||||||||||||
Net interest income | 866,422 | 776,336 | 736,632 | 686,934 | 620,555 | ||||||||||||||
Provision for loan losses | 35,460 | 51,673 | 51,845 | 16,314 | 20,582 | ||||||||||||||
Net interest income after provision for loan losses | 830,962 | 724,663 | 684,787 | 670,620 | 599,973 | ||||||||||||||
Non-interest income: | |||||||||||||||||||
Trust and investment management fees | 110,675 | 104,240 | 105,512 | 106,237 | 91,375 | ||||||||||||||
Service charges on deposit accounts | 84,182 | 81,203 | 81,350 | 81,946 | 81,432 | ||||||||||||||
Insurance commissions and fees | 46,169 | 47,154 | 48,926 | 45,115 | 43,140 | ||||||||||||||
Interchange and debit card transaction fees | 23,232 | 21,369 | 19,666 | 18,372 | 16,979 | ||||||||||||||
Other charges, commissions and fees | 39,931 | 39,623 | 37,551 | 36,180 | 34,185 | ||||||||||||||
Net gain (loss) on securities transactions | (4,941 | ) | 14,975 | 69 | 38 | 1,176 | |||||||||||||
Other | 37,222 | 41,144 | 35,656 | 32,256 | 34,531 | ||||||||||||||
Total non-interest income | 336,470 | 349,708 | 328,730 | 320,144 | 302,818 | ||||||||||||||
Non-interest expense: | |||||||||||||||||||
Salaries and wages | 337,068 | 318,665 | 310,504 | 292,349 | 273,692 | ||||||||||||||
Employee benefits | 74,575 | 72,615 | 69,746 | 60,151 | 62,407 | ||||||||||||||
Net occupancy | 75,971 | 71,627 | 65,690 | 55,745 | 50,468 | ||||||||||||||
Technology, furniture and equipment | 74,335 | 71,208 | 64,373 | 62,087 | 58,443 | ||||||||||||||
Deposit insurance | 20,128 | 17,428 | 14,519 | 13,232 | 11,682 | ||||||||||||||
Intangible amortization | 1,703 | 2,429 | 3,325 | 3,520 | 3,141 | ||||||||||||||
Other | 175,289 | 178,988 | 165,561 | 167,656 | 152,077 | ||||||||||||||
Total non-interest expense | 759,069 | 732,960 | 693,718 | 654,740 | 611,910 | ||||||||||||||
Income before income taxes | 408,363 | 341,411 | 319,799 | 336,024 | 290,881 | ||||||||||||||
Income taxes | 44,214 | 37,150 | 40,471 | 58,047 | 53,015 | ||||||||||||||
Net income | 364,149 | 304,261 | 279,328 | 277,977 | 237,866 | ||||||||||||||
Preferred stock dividends | 8,063 | 8,063 | 8,063 | 8,063 | 6,719 | ||||||||||||||
Net income available to common shareholders | $ | 356,086 | $ | 296,198 | $ | 271,265 | $ | 269,914 | $ | 231,147 | |||||||||
33
As of or for the Year Ended December 31, | |||||||||||||||||||
2017 | 2016 | 2015 | 2014 | 2013 | |||||||||||||||
Per Common Share Data | |||||||||||||||||||
Net income - basic | $ | 5.56 | $ | 4.73 | $ | 4.31 | $ | 4.32 | $ | 3.82 | |||||||||
Net income - diluted | 5.51 | 4.70 | 4.28 | 4.29 | 3.80 | ||||||||||||||
Cash dividends declared and paid | 2.25 | 2.15 | 2.10 | 2.03 | 1.98 | ||||||||||||||
Book value | 49.68 | 45.03 | 44.30 | 42.87 | 39.13 | ||||||||||||||
Common Shares Outstanding | |||||||||||||||||||
Period-end | 63,476 | 63,474 | 61,982 | 63,149 | 60,566 | ||||||||||||||
Weighted-average shares - basic | 63,694 | 62,376 | 62,758 | 62,072 | 60,350 | ||||||||||||||
Dilutive effect of stock compensation | 968 | 593 | 715 | 902 | 766 | ||||||||||||||
Weighted - average shares - diluted | 64,662 | 62,969 | 63,473 | 62,974 | 61,116 | ||||||||||||||
Performance Ratios | |||||||||||||||||||
Return on average assets | 1.17 | % | 1.03 | % | 0.97 | % | 1.05 | % | 1.02 | % | |||||||||
Return on average common equity | 11.76 | 10.16 | 9.86 | 10.51 | 9.93 | ||||||||||||||
Net interest income to average earning assets | 3.69 | 3.56 | 3.45 | 3.41 | 3.41 | ||||||||||||||
Dividend pay-out ratio | 40.49 | 45.54 | 48.72 | 47.12 | 51.75 | ||||||||||||||
Balance Sheet Data | |||||||||||||||||||
Period-end: | |||||||||||||||||||
Loans | $ | 13,145,665 | $ | 11,975,392 | $ | 11,486,531 | $ | 10,987,535 | $ | 9,515,700 | |||||||||
Earning assets | 29,595,375 | 28,025,439 | 26,431,176 | 26,052,339 | 22,238,286 | ||||||||||||||
Total assets | 31,747,880 | 30,196,319 | 28,565,942 | 28,276,421 | 24,311,408 | ||||||||||||||
Non-interest-bearing demand deposits | 11,197,093 | 10,513,369 | 10,270,233 | 10,149,061 | 8,311,149 | ||||||||||||||
Interest-bearing deposits | 15,675,296 | 15,298,206 | 14,073,362 | 13,986,869 | 12,377,637 | ||||||||||||||
Total deposits | 26,872,389 | 25,811,575 | 24,343,595 | 24,135,930 | 20,688,786 | ||||||||||||||
Long-term debt and other borrowings | 234,736 | 236,117 | 235,939 | 235,761 | 222,181 | ||||||||||||||
Shareholders’ equity | 3,297,863 | 3,002,528 | 2,890,343 | 2,851,403 | 2,514,161 | ||||||||||||||
Average: | |||||||||||||||||||
Loans | $ | 12,460,148 | $ | 11,554,823 | $ | 11,267,402 | $ | 10,299,025 | $ | 9,229,574 | |||||||||
Earning assets | 28,359,131 | 26,717,013 | 25,954,510 | 23,877,476 | 20,991,221 | ||||||||||||||
Total assets | 30,450,207 | 28,832,093 | 28,060,626 | 25,766,301 | 22,750,422 | ||||||||||||||
Non-interest-bearing demand deposits | 10,819,426 | 10,034,319 | 10,179,810 | 9,125,030 | 7,657,774 | ||||||||||||||
Interest-bearing deposits | 15,085,492 | 14,477,525 | 13,860,948 | 12,927,729 | 11,610,320 | ||||||||||||||
Total deposits | 25,904,918 | 24,511,844 | 24,040,758 | 22,052,759 | 19,268,094 | ||||||||||||||
Long-term debt and other borrowings | 226,194 | 236,033 | 235,856 | 230,170 | 222,098 | ||||||||||||||
Shareholders’ equity | 3,173,264 | 3,058,896 | 2,895,192 | 2,712,226 | 2,455,041 | ||||||||||||||
Asset Quality | |||||||||||||||||||
Allowance for loan losses | $ | 155,364 | $ | 153,045 | $ | 135,859 | $ | 99,542 | $ | 92,438 | |||||||||
Allowance for losses to year-end loans | 1.18 | % | 1.28 | % | 1.18 | % | 0.91 | % | 0.97 | % | |||||||||
Net loan charge-offs | $ | 33,141 | $ | 34,487 | $ | 15,528 | $ | 9,210 | $ | 32,597 | |||||||||
Net loan charge-offs to average loans | 0.27 | % | 0.30 | % | 0.14 | % | 0.09 | % | 0.35 | % | |||||||||
Non-performing assets | $ | 157,292 | $ | 102,591 | $ | 85,722 | $ | 65,176 | $ | 69,773 | |||||||||
Non-performing assets to: | |||||||||||||||||||
Total loans plus foreclosed assets | 1.20 | % | 0.86 | % | 0.75 | % | 0.59 | % | 0.73 | % | |||||||||
Total assets | 0.50 | 0.34 | 0.30 | 0.23 | 0.29 | ||||||||||||||
Consolidated Capital Ratios | |||||||||||||||||||
Common equity tier 1 risk-based ratio | 12.42 | % | 12.52 | % | 11.37 | % | N/A | N/A | |||||||||||
Tier 1 risk-based ratio | 13.16 | 13.33 | 12.38 | 13.68 | % | 14.39 | % | ||||||||||||
Total risk-based ratio | 15.15 | 14.93 | 13.85 | 14.55 | 15.52 | ||||||||||||||
Leverage ratio | 8.46 | 8.14 | 7.79 | 8.16 | 8.49 | ||||||||||||||
Average shareholders’ equity to average total assets | 10.42 | 10.61 | 10.32 | 10.53 | 10.79 | ||||||||||||||
34
The following tables set forth unaudited consolidated selected quarterly statement of operations data for the years ended December 31, 2017 and 2016. Dollar amounts are in thousands, except per share data.
Year Ended December 31, 2017 | |||||||||||||||
4th Quarter | 3rd Quarter | 2nd Quarter | 1st Quarter | ||||||||||||
Interest income | $ | 234,295 | $ | 227,586 | $ | 219,274 | $ | 211,792 | |||||||
Interest expense | 10,381 | 8,375 | 4,486 | 3,283 | |||||||||||
Net interest income | 223,914 | 219,211 | 214,788 | 208,509 | |||||||||||
Provision for loan losses | 8,102 | 10,980 | 8,426 | 7,952 | |||||||||||
Non-interest income(1) | 90,075 | 81,615 | 81,080 | 83,700 | |||||||||||
Non-interest expense | 196,280 | 186,823 | 188,051 | 187,915 | |||||||||||
Income before income taxes | 109,607 | 103,023 | 99,391 | 96,342 | |||||||||||
Income taxes | 9,083 | 9,892 | 13,838 | 11,401 | |||||||||||
Net income | 100,524 | 93,131 | 85,553 | 84,941 | |||||||||||
Preferred stock dividends | 2,016 | 2,016 | 2,015 | 2,016 | |||||||||||
Net income available to common shareholders | $ | 98,508 | $ | 91,115 | $ | 83,538 | $ | 82,925 | |||||||
Net income per common share: | |||||||||||||||
Basic | $ | 1.54 | $ | 1.43 | $ | 1.30 | $ | 1.29 | |||||||
Diluted | 1.53 | 1.41 | 1.29 | 1.28 | |||||||||||
Year Ended December 31, 2016 | |||||||||||||||
4th Quarter | 3rd Quarter | 2nd Quarter | 1st Quarter | ||||||||||||
Interest income | $ | 204,868 | $ | 197,489 | $ | 193,451 | $ | 192,604 | |||||||
Interest expense | 3,265 | 2,982 | 2,949 | 2,880 | |||||||||||
Net interest income | 201,603 | 194,507 | 190,502 | 189,724 | |||||||||||
Provision for loan losses | 8,939 | 5,045 | 9,189 | 28,500 | |||||||||||
Non-interest income(2) | 93,434 | 82,114 | 78,017 | 96,143 | |||||||||||
Non-interest expense | 193,851 | 180,505 | 179,445 | 179,159 | |||||||||||
Income before income taxes | 92,247 | 91,071 | 79,885 | 78,208 | |||||||||||
Income taxes | 8,528 | 10,852 | 8,378 | 9,392 | |||||||||||
Net income | 83,719 | 80,219 | 71,507 | 68,816 | |||||||||||
Preferred stock dividends | 2,016 | 2,016 | 2,015 | 2,016 | |||||||||||
Net income available to common shareholders | $ | 81,703 | $ | 78,203 | $ | 69,492 | $ | 66,800 | |||||||
Net income per common share: | |||||||||||||||
Basic | $ | 1.29 | $ | 1.24 | $ | 1.12 | $ | 1.07 | |||||||
Diluted | 1.28 | 1.24 | 1.11 | 1.07 | |||||||||||
(1) | Includes net losses on securities transactions of $50 thousand, $4.9 million and $24 thousand during the second, third and fourth quarters of 2017, respectively. |
(2) | Includes net gains on securities transactions of $14.9 million and $109 thousand during the first and fourth quarters of 2016, respectively, and a net loss on securities transactions of $37 thousand during the third quarter of 2016. |
35
ITEM 7. MANAGEMENT’S DISCUSSION AND ANALYSIS OF FINANCIAL CONDITION AND RESULTS OF OPERATIONS
Forward-Looking Statements and Factors that Could Affect Future Results
Certain statements contained in this Annual Report on Form 10-K that are not statements of historical fact constitute forward-looking statements within the meaning of the Private Securities Litigation Reform Act of 1995 (the “Act”), notwithstanding that such statements are not specifically identified as such. In addition, certain statements may be contained in our future filings with the SEC, in press releases, and in oral and written statements made by us or with our approval that are not statements of historical fact and constitute forward-looking statements within the meaning of the Act. Examples of forward-looking statements include, but are not limited to: (i) projections of revenues, expenses, income or loss, earnings or loss per share, the payment or nonpayment of dividends, capital structure and other financial items; (ii) statements of plans, objectives and expectations of Cullen/Frost or its management or Board of Directors, including those relating to products or services; (iii) statements of future economic performance; and (iv) statements of assumptions underlying such statements. Words such as “believes”, “anticipates”, “expects”, “intends”, “targeted”, “continue”, “remain”, “will”, “should”, “may” and other similar expressions are intended to identify forward-looking statements but are not the exclusive means of identifying such statements.
Forward-looking statements involve risks and uncertainties that may cause actual results to differ materially from those in such statements. Factors that could cause actual results to differ from those discussed in the forward-looking statements include, but are not limited to:
• | Local, regional, national and international economic conditions and the impact they may have on us and our customers and our assessment of that impact. |
• | Volatility and disruption in national and international financial and commodity markets. |
• | Government intervention in the U.S. financial system. |
• | Changes in the mix of loan geographies, sectors and types or the level of non-performing assets and charge-offs. |
• | Changes in estimates of future reserve requirements based upon the periodic review thereof under relevant regulatory and accounting requirements. |
• | The effects of and changes in trade and monetary and fiscal policies and laws, including the interest rate policies of the Federal Reserve Board. |
• | Inflation, interest rate, securities market and monetary fluctuations. |
• | The effect of changes in laws and regulations (including laws and regulations concerning taxes, banking, securities and insurance) with which we and our subsidiaries must comply. |
• | The soundness of other financial institutions. |
• | Political instability. |
• | Impairment of our goodwill or other intangible assets. |
• | Acts of God or of war or terrorism. |
• | The timely development and acceptance of new products and services and perceived overall value of these products and services by users. |
• | Changes in consumer spending, borrowings and savings habits. |
• | Changes in the financial performance and/or condition of our borrowers. |
• | Technological changes. |
• | Acquisitions and integration of acquired businesses. |
• | Our ability to increase market share and control expenses. |
• | Our ability to attract and retain qualified employees. |
• | Changes in the competitive environment in our markets and among banking organizations and other financial service providers. |
• | The effect of changes in accounting policies and practices, as may be adopted by the regulatory agencies, as well as the Public Company Accounting Oversight Board, the Financial Accounting Standards Board and other accounting standard setters. |
• | Changes in the reliability of our vendors, internal control systems or information systems. |
• | Changes in our liquidity position. |
• | Changes in our organization, compensation and benefit plans. |
• | The costs and effects of legal and regulatory developments, the resolution of legal proceedings or regulatory or other governmental inquiries, the results of regulatory examinations or reviews and the ability to obtain required regulatory approvals. |
36
• | Greater than expected costs or difficulties related to the integration of new products and lines of business. |
• | Our success at managing the risks involved in the foregoing items. |
Forward-looking statements speak only as of the date on which such statements are made. We do not undertake any obligation to update any forward-looking statement to reflect events or circumstances after the date on which such statement is made, or to reflect the occurrence of unanticipated events.
Application of Critical Accounting Policies and Accounting Estimates
We follow accounting and reporting policies that conform, in all material respects, to accounting principles generally accepted in the United States and to general practices within the financial services industry. The preparation of financial statements in conformity with accounting principles generally accepted in the United States requires management to make estimates and assumptions that affect the amounts reported in the financial statements and accompanying notes. While we base estimates on historical experience, current information and other factors deemed to be relevant, actual results could differ from those estimates.
We consider accounting estimates to be critical to reported financial results if (i) the accounting estimate requires management to make assumptions about matters that are highly uncertain and (ii) different estimates that management reasonably could have used for the accounting estimate in the current period, or changes in the accounting estimate that are reasonably likely to occur from period to period, could have a material impact on our financial statements.
Accounting policies related to the allowance for loan losses are considered to be critical, as these policies involve considerable subjective judgment and estimation by management. The allowance for loan losses is a reserve established through a provision for loan losses charged to expense, which represents management’s best estimate of probable losses that have been incurred within the existing portfolio of loans. The allowance, in the judgment of management, is necessary to reserve for estimated loan losses and risks inherent in the loan portfolio. Our allowance for loan loss methodology includes allowance allocations calculated in accordance with Accounting Standards Codification (ASC) Topic 310, “Receivables” and allowance allocations calculated in accordance with ASC Topic 450, “Contingencies.” The level of the allowance reflects management’s continuing evaluation of industry concentrations, specific credit risks, loan loss experience, current loan portfolio quality, present economic, political and regulatory conditions and unidentified losses inherent in the current loan portfolio, as well as trends in the foregoing. Portions of the allowance may be allocated for specific credits; however, the entire allowance is available for any credit that, in management’s judgment, should be charged off. While management utilizes its best judgment and information available, the ultimate adequacy of the allowance is dependent upon a variety of factors beyond our control, including the performance of our loan portfolio, the economy, changes in interest rates and the view of the regulatory authorities toward loan classifications. See the section captioned “Allowance for Loan Losses” elsewhere in this discussion and Note 3 - Loans in the notes to consolidated financial statements included in Item 8. Financial Statements and Supplementary Data elsewhere in this report for further details of the risk factors considered by management in estimating the necessary level of the allowance for loan losses.
Overview
The following discussion and analysis presents the more significant factors that affected our financial condition as of December 31, 2017 and 2016 and results of operations for each of the years in the three-year period ended December 31, 2017. This discussion and analysis should be read in conjunction with our consolidated financial statements, notes thereto and other financial information appearing elsewhere in this report. During 2014, we acquired WNB Bancshares, Inc., a privately-held bank holding company headquartered in Odessa, Texas (“WNB”). From time to time, we have also acquired various small businesses through our insurance subsidiary. All of our acquisitions during the reported periods were accounted for using the acquisition method, and as such, their related results of operations are included from the date of acquisition, though none of these acquisitions had a significant impact on our financial statements during their respective reporting periods.
Taxable-equivalent adjustments are the result of increasing income from tax-free loans and investments by an amount equal to the taxes that would be paid if the income were fully taxable based on a 35% federal tax rate, thus making tax-exempt yields comparable to taxable asset yields. The Tax Cuts and Jobs Act was enacted on December 22, 2017. Among other things, the new law establishes a new, flat corporate federal statutory income tax rate of 21% beginning in 2018.
Dollar amounts in tables are stated in thousands, except for per share amounts.
37
Results of Operations
Net income available to common shareholders totaled $356.1 million, or $5.51 diluted per common share, in 2017 compared to $296.2 million, or $4.70 diluted per common share, in 2016 and $271.3 million, or $4.28 diluted per common share, in 2015. The operating results of acquired entities are included with our results of operations since their dates of acquisition.
Selected income statement data, returns on average assets and average equity and dividends per share for the comparable periods were as follows:
2017 | 2016 | 2015 | |||||||||
Taxable-equivalent net interest income | $ | 1,043,431 | $ | 939,958 | $ | 888,035 | |||||
Taxable-equivalent adjustment | 177,009 | 163,622 | 151,403 | ||||||||
Net interest income | 866,422 | 776,336 | 736,632 | ||||||||
Provision for loan losses | 35,460 | 51,673 | 51,845 | ||||||||
Non-interest income | 336,470 | 349,708 | 328,730 | ||||||||
Non-interest expense | 759,069 | 732,960 | 693,718 | ||||||||
Income before income taxes | 408,363 | 341,411 | 319,799 | ||||||||
Income taxes | 44,214 | 37,150 | 40,471 | ||||||||
Net income | 364,149 | 304,261 | 279,328 | ||||||||
Preferred stock dividends | 8,063 | 8,063 | 8,063 | ||||||||
Net income available to common shareholders | $ | 356,086 | $ | 296,198 | $ | 271,265 | |||||
Earnings per common share - basic | $ | 5.56 | $ | 4.73 | $ | 4.31 | |||||
Earnings per common share - diluted | 5.51 | 4.70 | 4.28 | ||||||||
Dividends per common share | 2.25 | 2.15 | 2.10 | ||||||||
Return on average assets | 1.17 | % | 1.03 | % | 0.97 | % | |||||
Return on average common equity | 11.76 | 10.16 | 9.86 | ||||||||
Average shareholders' equity to average assets | 10.42 | 10.61 | 10.32 | ||||||||
Net income available to common shareholders increased $59.9 million for 2017 compared to 2016. The increase was primarily the result of a $90.1 million increase in net interest income and a $16.2 million decrease in the provision for loan losses partly offset by a $26.1 million increase in non-interest expense, a $13.2 million decrease in non-interest income and a $7.1 million increase in income tax expense. Income tax expense for 2017 was impacted by the enactment of the Tax Cuts and Jobs Act on December 22, 2017, as further discussed below. Net income available to common shareholders increased $24.9 million for 2016 compared to 2015. The increase was primarily the result of a $39.7 million increase in net interest income, a $21.0 million increase in non-interest income and a $3.3 million decrease in income tax expense partly offset by a $39.2 million increase in non-interest expense.
Details of the changes in the various components of net income are further discussed below.
Net Interest Income
Net interest income is the difference between interest income on earning assets, such as loans and securities, and interest expense on liabilities, such as deposits and borrowings, which are used to fund those assets. Net interest income is our largest source of revenue, representing 72.0% of total revenue during 2017. Net interest margin is the ratio of taxable-equivalent net interest income to average earning assets for the period. The level of interest rates and the volume and mix of earning assets and interest-bearing liabilities impact net interest income and net interest margin.
The Federal Reserve influences the general market rates of interest, including the deposit and loan rates offered by many financial institutions. Our loan portfolio is significantly affected by changes in the prime interest rate. The prime interest rate, which is the rate offered on loans to borrowers with strong credit, remained at 3.25% during most of 2015. In December 2015, the prime rate increased 25 basis points to 3.50% and remained at that level through most of 2016. In December 2016, the prime rate increased 25 basis points to end the year at 3.75%. During 2017, the prime rate increased 75 basis points (25 basis points in each of March, June and December) to end the year at to 4.50%. Our loan portfolio is also significantly impacted, by changes in the London Interbank Offered Rate (LIBOR). At December 31, 2017, the one-month and three-month U.S. dollar LIBOR rates were 1.56% and 1.69%, respectively, while at December 31, 2016, the one-month and three-month U.S. dollar LIBOR rates were 0.77% and 1.00%, respectively.
38
The effective federal funds rate, which is the cost of immediately available overnight funds, remained at zero to 0.25% during most of 2015. In December 2015, the effective federal funds rate increased 25 basis points to 0.50% and remained at that level through most of 2016. In December 2016, the effective federal funds rate increased 25 basis points to end the year at 0.75%. During 2017, the effective federal funds rate increased 75 basis points (25 basis points in each of March, June and December) to end the year at 1.50%.
We are primarily funded by core deposits, with non-interest-bearing demand deposits historically being a significant source of funds. This lower-cost funding base is expected to have a positive impact on our net interest income and net interest margin in a rising interest rate environment. Federal prohibitions on the payment of interest on demand deposits were repealed in 2011. Nonetheless, we have not experienced any significant additional costs as a result. See Item 7A. Quantitative and Qualitative Disclosures About Market Risk elsewhere in this report for information about our sensitivity to interest rates. Further analysis of the components of our net interest margin is presented below.
The following table presents the changes in taxable-equivalent net interest income and identifies the changes due to differences in the average volume of earning assets and interest-bearing liabilities and the changes due to changes in the average interest rate on those assets and liabilities. The changes in net interest income due to changes in both average volume and average interest rate have been allocated to the average volume change or the average interest rate change in proportion to the absolute amounts of the change in each. The comparison between the periods includes an additional change factor that shows the effect of the difference in the number of days in each period for assets and liabilities that accrue interest based upon the actual number of days in the period, as further discussed below. Our consolidated average balance sheets along with an analysis of taxable-equivalent net interest income are presented in Item 8. Financial Statements and Supplementary Data of this report.
2017 vs. 2016 | 2016 vs. 2015 | ||||||||||||||||||||||||||||||
Increase (Decrease) Due to Change in | Increase (Decrease) Due to Change in | ||||||||||||||||||||||||||||||
Rate | Volume | Number of Days | Total | Rate | Volume | Number of Days | Total | ||||||||||||||||||||||||
Interest-bearing deposits | $ | 22,369 | $ | 3,180 | $ | (44 | ) | $ | 25,505 | $ | 7,896 | $ | 40 | $ | 44 | $ | 7,980 | ||||||||||||||
Federal funds sold and resell agreements | 385 | 280 | (1 | ) | 664 | 67 | 97 | 1 | 165 | ||||||||||||||||||||||
Securities: | |||||||||||||||||||||||||||||||
Taxable | (4,482 | ) | (5,358 | ) | (206 | ) | (10,046 | ) | (5,340 | ) | (4,442 | ) | 206 | (9,576 | ) | ||||||||||||||||
Tax-exempt | (8,741 | ) | 31,136 | — | 22,395 | (1,231 | ) | 30,149 | — | 28,918 | |||||||||||||||||||||
Loans, net of unearned discounts | 42,509 | 38,161 | (1,266 | ) | 79,404 | 11,753 | 10,629 | 1,266 | 23,648 | ||||||||||||||||||||||
Total earning assets | 52,040 | 67,399 | (1,517 | ) | 117,922 | 13,145 | 36,473 | 1,517 | 51,135 | ||||||||||||||||||||||
Savings and interest checking | — | 252 | (3 | ) | 249 | — | 55 | 3 | 58 | ||||||||||||||||||||||
Money market deposit accounts | 8,040 | 21 | (13 | ) | 8,048 | (1,557 | ) | (201 | ) | 13 | (1,745 | ) | |||||||||||||||||||
Time accounts | 475 | (38 | ) | (4 | ) | 433 | (65 | ) | (81 | ) | 4 | (142 | ) | ||||||||||||||||||
Public funds | 1,216 | (5 | ) | (1 | ) | 1,210 | 47 | 5 | 1 | 53 | |||||||||||||||||||||
Federal funds purchased and repurchase agreements | 1,241 | 78 | (1 | ) | 1,318 | — | 36 | 1 | 37 | ||||||||||||||||||||||
Junior subordinated deferrable interest debentures | 673 | 1 | — | 674 | 555 | 1 | — | 556 | |||||||||||||||||||||||
Subordinated notes payable and other notes | 2,599 | (82 | ) | — | 2,517 | 394 | 1 | — | 395 | ||||||||||||||||||||||
Total interest-bearing liabilities | 14,244 | 227 | (22 | ) | 14,449 | (626 | ) | (184 | ) | 22 | (788 | ) | |||||||||||||||||||
Net change | $ | 37,796 | $ | 67,172 | $ | (1,495 | ) | $ | 103,473 | $ | 13,771 | $ | 36,657 | $ | 1,495 | $ | 51,923 | ||||||||||||||
Taxable-equivalent net interest income for 2017 increased $103.5 million, or 11.0%, compared to 2016. Taxable-equivalent net interest income for 2017 included 365 days compared to 366 days for the same period in 2016 as a result of the leap year. The additional day added approximately $1.5 million to taxable-equivalent net interest income during 2016. Excluding the impact of the additional day results in an effective increase in taxable-equivalent net interest income of approximately $105.0 million during 2017. The increase in taxable-equivalent net interest income during 2017, excluding the effect of the aforementioned additional day, was primarily related to the impact of increases in the average volume of loans, tax-exempt securities and interest-bearing deposits as well as increases in the average yields on loans and interest-bearing deposits partly offset by the impact of decreases in the average yields on tax-exempt and taxable securities, a decrease in the average volume of taxable securities and the impact of an increase in the average rate paid on interest-bearing liabilities. The average volume of interest-earning assets for 2017 increased $1.6 billion, or 6.1%,
39
compared to 2016. The increase in earning assets included a $905.3 million increase in average loans, a $548.3 million increase in average federal funds sold, resell agreements and interest-bearing deposits and a $546.8 million increase in average tax-exempt securities, partly offset by a $358.4 million decrease in average taxable securities.
Taxable-equivalent net interest income for 2016 increased $51.9 million, or 5.8%, compared to 2015. Taxable-equivalent net interest income for 2016 included 366 days compared to 365 days for the same period in 2015 as a result of the leap year. The additional day added approximately $1.5 million to taxable-equivalent net interest income during 2016. Excluding the impact of the additional day results in an effective increase in taxable-equivalent net interest income of approximately $50.4 million during 2016. The increase in taxable-equivalent net interest income during 2016, excluding the effect of the aforementioned additional day, was primarily related to the impact of increases in the average volume of tax-exempt securities and loans as well as increases in the average yield on loans and interest-bearing deposits partly offset by the impact of decreases in the average yield and volume of taxable securities. Taxable-equivalent net interest income during 2016 was also positively impacted by a decrease in the average rate paid on money market deposit accounts. The average volume of interest-earning assets for 2016 increased $762.5 million or 2.9% compared to 2015. The increase in earning assets included a $442.7 million increase in average securities, a $287.4 million increase in average loans and a $32.3 million increase in average federal funds sold, resell agreements and interest-bearing deposits.
The net interest margin increased 13 basis points from 3.56% during 2016 to 3.69% during 2017. The increase was primarily due to an increase in the average yield on interest earning assets partly offset by an increase in the average rate paid on interest-bearing liabilities. The average yield on interest-earning assets increased 19 basis points to 3.79% during 2017 from 3.60% during 2016 while the average rate paid on interest-bearing liabilities increased 8 basis points from 0.08% during 2016 to 0.16% during 2017. The increase in the average yield on interest earning assets during 2017 was mostly due to increases in the average yields on loans and interest-bearing deposits while the increase in the average rate paid on interest-bearing liabilities was primarily due to increases in the rates paid on various deposit products and long-term debt. The average yield on interest-earning assets and the average rate paid on interest-bearing liabilities are primarily impacted by changes in market interest rates as well as changes in the volume and relative mix of the underlying assets and liabilities. Taxable-equivalent yields and the net interest margin during the comparable periods are presented based upon a tax rate of 35%. Beginning January 1, 2018, taxable-equivalent-yields and the net interest margin will be based upon a tax rate of 21%. See the section captioned “Income Taxes” elsewhere in this discussion for information regarding the Tax Cuts and Jobs Act enacted on December 22, 2017. Assuming a tax rate of 21%, the net interest margin and the average yield on interest-earning assets on a taxable-equivalent basis for 2017 would have been 3.37% and 3.47%, respectively.
The net interest margin increased 11 basis points from 3.45% during 2015 to 3.56% during 2016. The increase was primarily due to increases in the average yield on interest earning assets. The average yield on interest-earning assets increased 10 basis points to 3.60% during 2016 from 3.50% during 2015 while the average rate paid on interest-bearing liabilities decreased 1 basis point from 0.09% during 2015 to 0.08% during 2016. The increase in the average yield on interest earning assets during 2016 was due to increases in the average yields on interest-bearing deposits, federal funds sold and resell agreements, loans and total securities.
The average yield on loans was 4.36% during 2017 compared to 4.01% during 2016 and 3.90% during 2015, increasing 35 basis points during 2017 compared to 2016 and 11 basis points during 2016 compared to 2015. These increases were positively impacted by increases in market interest rates during the comparable periods, as discussed above. The average volume of loans increased $905.3 million, or 7.8%, in 2017 compared to 2016 and increased $287.4 million, or 2.6%, in 2016 compared to 2015. Loans made up approximately 43.9% of average interest-earning assets during 2017 compared to 43.2% during 2016 and 43.4% in 2015.
The average yield on securities was 3.99% in 2017 compared to 4.02% in 2016 and 3.97% in 2015. The average yield on taxable securities was 1.92% in 2017 compared to 2.01% in 2016 and 2.11% in 2015 while the average yield on tax exempt securities was 5.37% in 2017 compared to 5.57% in 2016 and 5.59% in 2015. Despite the fact that the average yield on taxable and tax-exempt securities decreased 9 and 20 basis points, respectively, during 2017 compared to 2016, the overall average yield on securities in 2017 only decreased 3 basis points compared to 2016 because a larger proportion of average securities was invested in higher yielding tax-exempt securities during 2017 compared to 2016. Similarly, the overall average yield on securities during 2016 increased 5 basis points compared to 2015 despite 10 and 2 basis point decreases in the average yield on taxable and tax-exempt securities, respectively, as a result of a higher average proportion of tax-exempt securities. Tax exempt securities made up approximately 60.0% of total average securities during 2017, compared to 56.4% during 2016 and 53.2% during 2015. The average volume of securities
40
increased $188.5 million, or 1.6%, during 2017 compared to 2016 and increased $442.7 million, or 3.8%, during 2016 compared to 2015. These increases were primarily related to the investment of excess liquidity from deposit growth. Securities made up approximately 43.2% of average interest-earning assets in 2017 compared to 45.1% in 2016 and 44.8% in 2015.
Average federal funds sold, resell agreements and interest-bearing deposits during 2017 increased $548.3 million, or 17.7%, compared to 2016 and increased $32.3 million, or 1.1%, in 2016 compared to 2015. The increases in average federal funds sold, resell agreements and interest-bearing deposits during the comparable periods were primarily related to growth in average deposits. Federal funds sold, resell agreements and interest-bearing deposits made up approximately 12.9% of average interest-earning assets during 2017 compared to approximately 11.6% in 2016 and 11.8% in 2015. The combined average yield on federal funds sold, resell agreements and interest-bearing deposits was 1.16% during 2017, 0.53% during 2016, and 0.27% during 2015. As discussed above, since December 2015, there have been five separate 25 basis point increases in the expected federal funds rate.
Average deposits increased $1.4 billion, or 5.7%, in 2017 compared to 2016 and $471.1 million, or 2.0%, in 2016 compared to 2015. Average interest-bearing deposits increased $608.0 million in 2017 compared to 2016 and increased $616.6 million in 2016 compared to 2015, while average non-interest-bearing deposits increased $785.1 million in 2017 compared to 2016 and decreased $145.5 million in 2016 compared to 2015. The ratio of average interest-bearing deposits to total average deposits was 58.2% in 2017 compared to 59.1% in 2016 and 57.7% in 2015. The average cost of deposits is primarily impacted by changes in market interest rates as well as changes in the volume and relative mix of interest-bearing deposits. The average rate paid on interest-bearing deposits and total deposits was 0.11% and 0.07% in 2017 compared to 0.05% and 0.03% in 2016 and 0.07% and 0.04% in 2015. The increase in the average cost of deposits during 2017 was related to the aforementioned increases in interest rates paid on most of our interest-bearing deposit products during the third quarter. The decrease in the average raid paid on interest-bearing deposits during 2016 compared to 2015 was primarily the result of decreases in interest rates offered on certain deposit products due to decreases in average market interest rates and decreases in renewal interest rates on maturing certificates of deposit given the prevailing low interest rate environment. The relative proportion of higher-cost certificates of deposit to total average interest-bearing deposits decreased to 5.1% in 2017 from 5.6% in 2016 and 6.3% in 2015.
Our net interest spread, which represents the difference between the average rate earned on earning assets and the average rate paid on interest-bearing liabilities, was 3.63% in 2017 compared to 3.52% in 2016 and 3.41% in 2015. The net interest spread, as well as the net interest margin, will be impacted by future changes in short-term and long-term interest rate levels, as well as the impact from the competitive environment. A discussion of the effects of changing interest rates on net interest income is set forth in Item 7A. Quantitative and Qualitative Disclosures About Market Risk included elsewhere in this report.
Our hedging policies permit the use of various derivative financial instruments, including interest rate swaps, swaptions, caps and floors, to manage exposure to changes in interest rates. Details of our derivatives and hedging activities are set forth in Note 15 - Derivative Financial Instruments in the accompanying notes to consolidated financial statements included elsewhere in this report. Information regarding the impact of fluctuations in interest rates on our derivative financial instruments is set forth in Item 7A. Quantitative and Qualitative Disclosures About Market Risk included elsewhere in this report.
Provision for Loan Losses
The provision for loan losses is determined by management as the amount to be added to the allowance for loan losses after net charge-offs have been deducted to bring the allowance to a level which, in management’s best estimate, is necessary to absorb inherent losses within the existing loan portfolio. The provision for loan losses totaled $35.5 million in 2017 compared to $51.7 million in 2016 and $51.8 million in 2015. See the section captioned “Allowance for Loan Losses” elsewhere in this discussion for further analysis of the provision for loan losses.
41
Non-Interest Income
The components of non-interest income were as follows:
2017 | 2016 | 2015 | |||||||||
Trust and investment management fees | $ | 110,675 | $ | 104,240 | $ | 105,512 | |||||
Service charges on deposit accounts | 84,182 | 81,203 | 81,350 | ||||||||
Insurance commissions and fees | 46,169 | 47,154 | 48,926 | ||||||||
Interchange and debit card transaction fees | 23,232 | 21,369 | 19,666 | ||||||||
Other charges, commissions and fees | 39,931 | 39,623 | 37,551 | ||||||||
Net gain (loss) on securities transactions | (4,941 | ) | 14,975 | 69 | |||||||
Other | 37,222 | 41,144 | 35,656 | ||||||||
Total | $ | 336,470 | $ | 349,708 | $ | 328,730 | |||||
Total non-interest income for 2017 decreased $13.2 million, or 3.8%, compared to 2016 while total non-interest income for 2016 increased $21.0 million, or 6.4%, compared to 2015. Changes in the various components of non-interest income are discussed in more detail below.
Trust and Investment Management Fees. Trust and investment management fee income for 2017 increased $6.4 million, or 6.2%, compared to 2016 while trust and investment management fee income for 2016 decreased $1.3 million, or 1.2%, compared to 2015. Investment fees are the most significant component of trust and investment management fees, making up approximately 84%, 82% and 79% of total trust and investment management fees in 2017, 2016 and 2015, respectively. Investment and other custodial account fees are generally based on the market value of assets within a trust account. Volatility in the equity and bond markets impacts the market value of trust assets and the related investment fees.
The increase in trust and investment management fees during 2017 compared to the same period in 2016 was primarily the result of an increase in trust investment fees (up $6.8 million). The increase in trust investment fees during 2017 was due to higher average equity valuations on managed accounts. Trust and investment management fees during 2017 also included an increase in real estate fees (up $225 thousand) and a decrease in estate fees (down $618 thousand) compared to 2016. The decrease in estate fees during 2017 was related to a decrease in the aggregate value of estates settled compared to 2016.
The decrease in trust and investment management fees during 2016 compared to 2015 was primarily the result of decreases in oil and gas fees (down $1.2 million), estate fees (down $970 thousand), securities lending income (down $741 thousand) and custody fees (down $168 thousand). These decreases were partly offset by an increase in trust investment fees (up $1.8 million). The decrease in oil and gas fees during 2016 was partly due to lower energy prices and decreased production. The decrease in estate fees during 2016 was related to a decrease in the aggregate value of estates settled compared to 2015. The decrease in securities lending income during 2016 was due to the termination of our securities lending operations during the first quarter of 2015 in part due to the negative impact securities lending transactions would have had on our regulatory capital ratios under Basel III capital rules. See Note 9 - Capital and Regulatory Matters in the accompanying notes to consolidated financial statements included elsewhere in this report. The increase in trust investment fees during 2016 was due to higher average equity valuations on managed accounts and an increase in the number of accounts.
At December 31, 2017, trust assets, including both managed assets and custody assets, were primarily composed of equity securities (50.3% of trust assets), fixed income securities (37.3% of trust assets) and cash equivalents (7.9% of trust assets). The estimated fair value of trust assets was $32.8 billion (including managed assets of $14.1 billion and custody assets of $18.7 billion) at December 31, 2017 compared to $29.3 billion (including managed assets of $13.4 billion and custody assets of $15.9 billion) at December 31, 2016.
Service Charges on Deposit Accounts. Service charges on deposit accounts for 2017 increased $3.0 million, or 3.7%, compared to 2016. The increase was primarily due to an increase in overdraft/insufficient funds charges on consumer and commercial accounts (up $1.9 million and $511 thousand, respectively) and consumer service charges (up $1.0 million) partly offset by a decrease in commercial service charges (down $428 thousand). Service charges on deposit accounts for 2016 decreased $147 thousand, or 0.2%, compared to 2015 The decrease was primarily due to a decrease in service charges on consumer accounts (down $945 thousand) partly offset by increases in service charges on commercial accounts (up $384 thousand), overdraft/insufficient funds charges on consumer accounts (up
42
$260 thousand) and overdraft/insufficient funds charges on commercial accounts (up $192 thousand). Overdraft/insufficient funds charges totaled $34.9 million during 2017 compared to $32.5 million during 2016 and $32.0 million in 2015. Overdraft/insufficient funds charges included $27.0 million, $25.0 million and $24.8 million related to consumer accounts during 2017, 2016 and 2015, respectively, and $8.0 million, $7.5 million and $7.3 million related to commercial accounts during 2017, 2016 and 2015, respectively.
Insurance Commissions and Fees. Insurance commissions and fees for 2017 decreased $985 thousand, or 2.1%, compared to 2016. The decrease was related to a decrease in contingent income (down $2.9 million) partly offset by an increase in commission income (up $1.9 million), which was primarily related to an increase in benefit plan commissions due to increased business volumes partly offset by a decrease in commissions on property and casualty policies. Insurance commissions and fees for 2016 decreased $1.8 million, or 3.6%, compared to 2015. The decrease was related to a decrease in commission income (down $2.8 million) partly offset by an increase in contingent commissions (up $1.1 million). The decrease in commission income during 2016 was primarily related to declines in employee benefit plan commissions and consulting fees due to lower business volumes and decreases in commercial lines property and casualty commissions.
Insurance commissions and fees include contingent commissions which totaled $3.6 million in 2017, $6.5 million in 2016 and $5.5 million 2015. Contingent commissions primarily consist of amounts received from various property and casualty insurance carriers related to the loss performance of insurance policies previously placed. Such commissions are seasonal in nature and are mostly received during the first quarter of each year. These commissions totaled $2.1 million in 2017, $4.9 million in 2016 and $3.8 million in 2015. The decrease in performance related contingent income during 2017 was related to a lack of growth within the portfolio and a deterioration in the loss performance of insurance policies during 2016. Contingent commissions also include amounts received from various benefit plan insurance companies related to the volume of business generated and/or the subsequent retention of such business. These commissions totaled $1.5 million in 2017, $1.7 million in 2016 and $1.7 million in 2015.
Interchange and Debit Card Transaction Fees. Interchange fees, or “swipe” fees, are charges that merchants pay to us and other card-issuing banks for processing electronic payment transactions. Interchange and debit card transaction fees consist of income from check card usage, point of sale income from PIN-based debit card transactions and ATM service fees. Interchange and debit card transaction fees for 2017 increased $1.9 million, or 8.7% compared to 2016 and increased $1.7 million, or 8.7%, in 2016 compared to 2015. Income from debit card transactions totaled approximately $19.4 million in 2017 compared to $17.9 million in 2016 and $17.0 million in 2015. ATM service fees totaled approximately $3.8 million in 2017 compared to $3.5 million in 2016 and $2.7 million in 2015. The increases in income from debit card transactions during the comparable periods were primarily related to increased transaction volume. The increases in ATM service fees during the comparable period were related to increased transaction volume and a change in the fee schedule during the first quarter of 2016.
Federal Reserve Board rules applicable to financial institutions that have assets of $10 billion or more provide that the maximum permissible interchange fee for an electronic debit transaction is the sum of 21 cents per transaction and 5 basis points multiplied by the value of the transaction. An upward adjustment of no more than 1 cent to an issuer's debit card interchange fee is allowed if the card issuer develops and implements policies and procedures reasonably designed to achieve certain fraud-prevention standards. The Federal Reserve Board also has rules governing routing and exclusivity that require issuers to offer two unaffiliated networks for routing transactions on each debit or prepaid product.
Other Charges, Commissions and Fees. Other charges, commissions and fees for 2017 increased $308 thousand, or 0.8%, compared to 2016. The increase included increases in income related to the sale of mutual funds (up $1.2 million) and wire transfer fees (up $317 thousand), among other things. These items were partly offset by decreases in human resources consulting fee income (down $650 thousand) and income from corporate finance and capital market advisory services (down $605 thousand), among other things. Human resources consulting fee income decreased as we no longer provide these services. Changes in the other aforementioned categories of other charges, commissions and fees were due to fluctuations in business volumes.
Other charges, commissions and fees for 2016 increased $2.1 million or 5.5%, compared to 2015. The increase included increases in income related to the sale of money market accounts (up $815 thousand), loan processing fees (up $627 thousand), origination fees collected on loans that did not fund (up $464 thousand), agent income from the sale of federal funds (up $397 thousand), wire transfer fees (up $309 thousand), lease processing fees (up $227 thousand) and income from corporate finance and capital market advisory services (up $213 thousand), among other things. These
43
increases were partly offset by decreases in income related to the sale of annuities (down $802 thousand), unused balance fees on loan commitments (down $405 thousand) and income related to the sale of mutual funds (down $264 thousand). Fluctuations in the aforementioned items were due to fluctuations in business volumes.
Net Gain/Loss on Securities Transactions. During 2017, we sold certain available-for-sale U.S Treasury securities with an amortized cost totaling $11.2 billion and realized a net loss of $74 thousand on those sales. The sales were primarily related to securities purchased during 2017 and subsequently sold in connection with our tax planning strategies related to the Texas franchise tax. The gross proceeds from the sales of these securities outside of Texas are included in total revenues/receipts from all sources reported for Texas franchise tax purposes, which results in a reduction in the overall percentage of revenues/receipts apportioned to Texas and subjected to taxation under the Texas franchise tax. We also sold certain other available-for-sale U.S. Treasury securities with an amortized cost totaling $751.4 million and realized a net loss of $4.9 million on those sales. These securities were sold with the intent to reinvest the sales proceeds in higher yielding debt securities and other investments.
During 2016, we sold available-for-sale securities with an amortized cost totaling $14.8 billion and realized a net gain of $11.2 million on those sales. We also sold held-to-maturity securities with an amortized cost totaling $132.9 million and realized a net gain of $3.7 million on those sales. As more fully discussed in Note 2 - Securities in the accompanying notes to consolidated financial statements included elsewhere in this report, a portion of the available-for-sale securities and all of the held-to maturity securities that were sold during 2016 were sold as a result of a significant deterioration in the creditworthiness of the issuers. In aggregate, the securities sold as a result of credit deterioration had an amortized cost totaling $528.6 million and we realized a net gain of $11.9 million on those sales. We sold U.S Treasury securities with an amortized cost totaling $13.7 billion and realized a net loss of $57 thousand on those sales. The sales were primarily related to securities purchased during 2016 and subsequently sold in connection with our aforementioned tax planning strategies related to the Texas franchise tax. Other securities sold during 2016 included available-for-sale U.S. Treasury securities with an amortized cost totaling $764.5 million and we realized a net gain of $3.3 million on those sales. Most of these securities were due to mature during 2016 and most of the proceeds from the sale of these securities were reinvested into U.S. Treasury securities having comparable yields, but longer-terms.
During 2015, we sold available-for-sale securities with an amortized cost totaling $12.7 billion and realized a net gain of $69 thousand on those sales. We sold an available-for-sale U.S. Treasury security with an amortized cost totaling $223.8 million and realized a gain of $228 thousand on the sale. The security sold had a short term and low yield. The proceeds from the sale of this security were reinvested into longer-term, higher-yielding securities. The remaining sales were primarily related to securities purchased during 2015 and subsequently sold in connection with our aforementioned tax planning strategies related to the Texas franchise tax.
Other Non-Interest Income. Other non-interest income for 2017 decreased $3.9 million, or 9.5%, compared to 2016. The decrease was primarily related to decreases in gains on the sale of foreclosed and other assets (down $6.3 million), lease rental income (down $482 thousand) and earnings on the cash surrender value of life insurance policies (down $409 thousand), among other things, partly offset by increases in sundry and other miscellaneous income (up $1.4 million), income from customer derivative and trading activities (up $815 thousand) and income from customer foreign currency transactions (up $760 thousand), among other things. During 2016, gains on the sale of foreclosed and other assets included a $10.3 million net gain on the sale of our headquarters building and other adjacent properties in connection with a comprehensive development agreement with the City of San Antonio and a third party controlled by one of our directors, among other things. See Note 4 -Premises and Equipment in the accompanying notes to consolidated financial statements included elsewhere in this report. During 2017, gains on the sale of foreclosed and other assets included $2.9 million related to amortization of the deferred portion of the gain on our headquarters building sold in 2016 and $2.0 million related to the sale of a motor-bank location. Sundry income during 2017 included $1.9 million in VISA check card incentives related to business volumes, $1.2 million related to the collection of amounts charged-off by Western National Bank prior to our acquisition, $864 thousand related to the settlement of a non-solicitation agreement and $541 thousand related to recoveries of prior write-offs, among other things, while sundry and other miscellaneous income during 2016 included $1.8 million in VISA check card incentives related to business volumes and $1.4 million related to recoveries of prior write-offs, among other things. The fluctuations in income from customer derivative and trading activities and income from customer foreign currency transactions were primarily related to changes in business volumes.
Other non-interest income for 2016 increased $5.5 million, or 15.4%, compared to 2015. The increase was primarily related to increases in gains on the sale of foreclosed and other assets (up $7.3 million), income from customer foreign currency transactions (up $592 thousand) and income from customer derivative and trading activities (up $491 thousand)
44
partly offset by decreases in mineral interest income (down $1.9 million) and sundry and other miscellaneous income (down $1.2 million). The increase in gains on the sale of foreclosed and other assets was primarily related to the realization of a $10.3 million net gain on the sale of our headquarters building and other adjacent properties in connection with a comprehensive development agreement with the City of San Antonio and a third party controlled by one of our directors. During 2016, sundry and other miscellaneous income included, among other things, $1.8 million in VISA check card incentives related to business volumes and $1.4 million related to recoveries of prior write-offs, while sundry and other miscellaneous income during 2015 included, among other things, $1.2 million related to distributions received on a small business investment company ("SBIC") investment, $1.7 million related to recoveries of prior write-offs, $1.7 million in VISA check card incentives related to business volumes and $324 thousand related to an insurance settlement. Mineral interest income is primarily related to oil and gas royalties received from severed mineral interests owned by our wholly-owned non-banking subsidiary Main Plaza Corporation. The decrease in mineral interest income was partly related to lower energy prices and a decrease in production. The fluctuations in public finance underwriting fees, income from customer foreign currency transactions and income from customer derivative and trading activities were primarily related to changes in business volumes.
Non-Interest Expense
The components of non-interest expense were as follows:
2017 | 2016 | 2015 | |||||||||
Salaries and wages | $ | 337,068 | $ | 318,665 | $ | 310,504 | |||||
Employee benefits | 74,575 | 72,615 | 69,746 | ||||||||
Net occupancy | 75,971 | 71,627 | 65,690 | ||||||||
Technology, furniture and equipment | 74,335 | 71,208 | 64,373 | ||||||||
Deposit insurance | 20,128 | 17,428 | 14,519 | ||||||||
Intangible amortization | 1,703 | 2,429 | 3,325 | ||||||||
Other | 175,289 | 178,988 | 165,561 | ||||||||
Total | $ | 759,069 | $ | 732,960 | $ | 693,718 | |||||
Total non-interest expense for 2017 increased $26.1 million, or 3.6%, compared to 2016 while total non-interest expense for 2016 increased $39.2 million, or 5.7%, compared to 2015. Changes in the various components of non-interest expense are discussed below.
Salaries and Wages. Salaries and wages increased $18.4 million, or 5.8%, in 2017 compared to 2016 and increased $8.2 million, or 2.6%, in 2016 compared to 2015. The increase during 2017 compared to 2016 was primarily related to an increase in salaries due to normal annual merit and market increases, an increase in the number of employees, an increase in incentive compensation, due to improved operating performance, and an increase in stock-based compensation. Salaries and wages during 2017 also included approximately $2.5 million in severance expense primarily related to the closure of certain branch locations and the elimination of certain job positions. The increase during 2016 compared to 2015 was primarily related to an increase in salaries due to normal annual merit and market increases, an increase in the number of employees and an increase in incentive compensation partly offset by a decrease in stock-based compensation.
Employee Benefits. Employee benefits expense for 2017 increased $2.0 million, or 2.7%, compared to 2016. The increase was primarily due to increases in expenses related to our 401(k) and profit sharing plans (up $1.7 million), payroll taxes (up $1.3 million), other employee benefits (up $826 thousand) and medical insurance expense (up $487 thousand) partly offset by a decrease in expenses related to our defined benefit retirement plans (down $2.2 million).
Employee benefits expense for 2016 increased $2.9 million, or 4.1%, compared to 2015. The increase was primarily due to increases in medical insurance expense (up $1.8 million), payroll taxes (up $898 thousand) and profit sharing plan expense (up $620 thousand), among other things, partly offset by a decrease in expenses related to our defined benefit retirement plans (down $599 thousand).
Our defined benefit retirement and restoration plans were frozen in 2001 and were replaced by the profit sharing plan. Management believes these actions help reduce the volatility in retirement plan expense. However, we still have funding obligations related to the defined benefit and restoration plans and could recognize retirement expense related to these plans in future years, which would be dependent on the return earned on plan assets, the level of interest rates
45
and employee turnover. We recognized a combined net periodic pension expense of $501 thousand related to our defined benefit retirement and restoration plans in 2017 compared to a combined net periodic pension expense of $2.7 million in 2016 and $3.3 million in 2015. Net periodic pension expense during 2016 included $1.0 million in supplemental executive retirement plan (“SERP”) settlement costs related to the retirement of a former executive officer. Despite the impact of these settlement costs, net periodic pension expense decreased during the comparable years in part due to a change in the method we use to estimate the interest cost component of net periodic benefit cost for our defined benefit pension and other post-retirement benefit plans. Future expense/benefits related to these plans is dependent upon a variety of factors, including the actual return on plan assets. For additional information related to our employee benefit plans, see Note 11 - Employee Benefit Plans in the accompanying notes to consolidated financial statements included elsewhere in this report.
Net Occupancy. Net occupancy expense for 2017 increased $4.3 million, or 6.1%, compared to 2016. The increase during 2017 was primarily related to increases in lease expense (up $3.2 million), repairs and maintenance/service contracts expense (up $1.3 million), depreciation on leasehold improvements (up $658 thousand) and utilities expense (up $375 thousand) partly offset by a decrease in building depreciation (down $1.3 million). The increases in lease expense and the decreases in building depreciation during the reported periods were primarily related to the sale and lease back of our headquarters building in December 2016. See Note 4 - Premises and Equipment in the accompanying notes to consolidated financial statements included elsewhere in this report.
Net occupancy expense for 2016 increased $5.9 million, or 9.0%, compared to 2015. The increase was primarily related to increases in building depreciation (up $2.7 million), property taxes (up $1.4 million), repairs and maintenance/service contracts expense (up $1.3 million) and depreciation on leasehold improvements (up $764 thousand). The net increase in occupancy expense was partly related to a new operations and support center, a portion of which was placed into service during 2015 with the remainder placed into service in 2016, and new financial center locations.
Technology, Furniture and Equipment. Technology, furniture and equipment expense for 2017 increased $3.1 million, or 4.4%, compared to 2016. The increase was primarily related to increases in software maintenance (up $3.9 million) and depreciation on furniture and equipment (up $988 thousand) partly offset by a decrease in equipment rental expense (down $1.6 million), and a decrease in service contracts (down $436 thousand), among other things. The increase in software maintenance was primarily due to new and renewed software applications and an increase in volume-based service payments.
Technology, furniture and equipment expense for 2016 increased $6.8 million, or 10.6%, compared to 2015. The increase was primarily related to increases in depreciation on furniture and equipment (up $4.1 million) and software maintenance (up $3.5 million) partly offset by decreases in software amortization (down $593 thousand) and equipment rental expense (down $306 thousand). The net increase in technology, furniture and equipment expense was partly related to a new operations and support center, a portion of which was placed into service during 2015 with the remainder placed into service in 2016, and new financial center locations.
Deposit Insurance. Deposit insurance expense totaled $20.1 million in 2017 compared to $17.4 million in 2016 and $14.5 million in 2015. The increase during the comparable periods was primarily related to an increase in the assessment rate and an increase in assets. The increase in the assessment rate was partly related to a new surcharge that became applicable during the third quarter of 2016. In August 2016, the Federal Deposit Insurance Corporation (“FDIC”) announced that the Deposit Insurance Fund (“DIF”) reserve ratio had surpassed 1.15% as of June 30, 2016. As a result, beginning in the third quarter of 2016, the range of initial assessment rates for all institutions was adjusted downward and institutions with $10 billion or more in assets were assessed a quarterly surcharge. The quarterly surcharge will continue to be assessed until such time as the reserve ratio reaches the statutory minimum of 1.35% required by the Dodd-Frank Act.
Intangible Amortization. Intangible amortization is primarily related to core deposit intangibles and, to a lesser extent, intangibles related to customer relationships and non-compete agreements. Intangible amortization totaled $1.7 million in 2017 compared to $2.4 million in 2016 and $3.3 million in 2015. The decrease during the comparable periods primarily related to the completion of amortization of certain previously recognized intangible assets as well as a reduction in the annual amortization rate of certain previously recognized intangible assets as we use an accelerated amortization approach which results in higher amortization rates during the earlier years of the useful lives of intangible assets. See Note 5 - Goodwill and Other Intangible Assets in the accompanying notes to consolidated financial statements included elsewhere in this report.
46
Other Non-Interest Expense. Other non-interest expense for 2017 decreased $3.7 million, or 2.1%, compared to 2016. The decrease included decreases in donations expense (down $4.5 million), sundry and other miscellaneous expense (down $3.2 million) and check card expense (down $3.1 million), among other things. These items were partly offset by increases in advertising/promotions expense (up $1.7 million), guard services expense (up $1.4 million), professional services expense (up $1.3 million), outside computer services expense (up $1.3 million) and fraud losses (up $1.0 million), among other things. Donations expense in 2016 included a $4.4 million contribution to our charitable foundation. Sundry and other miscellaneous expense during 2016 included $6.7 million related to the write-down of certain assets while sundry and other miscellaneous expense during 2017 included $3.2 million related to the write-down of certain assets and $1.9 million related to settlements. Check card expense was elevated during 2016 due to the issuance of new ATM cards with embedded processing chips. Guard services expense during 2017 was impacted by the effects of hurricane Harvey during the third quarter. The increase in fraud losses was primarily related to check cards, ATMs and checks.
Other non-interest expense for 2016 increased $13.4 million, or 8.1%, compared to 2015. The increase was primarily related to increases in sundry and other miscellaneous expense (up $6.1 million), donations expense (up $4.4 million), check card expense (up $2.6 million), guard service expense (up $1.4 million), business development expense (up $842 thousand) and outside computer services expense (up $520 thousand), among other things, partly offset by decreases in advertising/promotions expense (down $1.2 million) and travel/meals and entertainment expense (down $953 thousand) and refund expenses associated with customer use of non-Frost ATMs (down $456 thousand), among other things. Sundry and other miscellaneous expense during 2016 included $6.7 million related to the write-down of certain assets that were disposed of in 2016 or that we intended to dispose of in 2017. The increase in donations expense was primarily related to a $4.4 million contribution to our charitable foundation. The increase in check card expense during 2016 was primarily related the issuance of new ATM cards with embedded processing chips.
Results of Segment Operations
Our operations are managed along two primary operating segments: Banking and Frost Wealth Advisors. A description of each business and the methodologies used to measure financial performance is described in Note 18 - Operating Segments in the accompanying notes to consolidated financial statements included elsewhere in this report. Net income (loss) by operating segment is presented below:
2017 | 2016 | 2015 | |||||||||
Banking | $ | 347,034 | $ | 289,665 | $ | 262,038 | |||||
Frost Wealth Advisors | 24,395 | 19,093 | 19,968 | ||||||||
Non-Banks | (7,280 | ) | (4,497 | ) | (2,678 | ) | |||||
Consolidated net income | $ | 364,149 | $ | 304,261 | $ | 279,328 | |||||
Banking
Net income for 2017 increased $57.4 million, or 19.8%, compared to 2016. The increase was primarily the result of an $87.0 million increase in net interest income and a $16.2 million decrease in the provision for loan losses partly offset by a $22.0 million decrease in non-interest income, a $19.7 million increase in non-interest expense and a $4.2 million increase in income tax expense. Net income for 2016 increased $27.6 million, or 10.5%, compared to 2015. The increase was primarily the result of a $37.0 million increase in net interest income, a $24.2 million increase in non-interest income and a $1.3 million decrease in income tax expense partly offset by a $35.0 million increase in non-interest expense.
Net interest income for 2017 increased $87.0 million, or 11.3%, compared to 2016 while net interest income for 2016 increased $37.0 million, or 5.0%, compared to 2015. Taxable-equivalent net interest income for 2017 included 365 days compared to 366 days for the same period in 2016 as a result of the leap year. The additional day added approximately $1.5 million to taxable-equivalent net interest income during 2016. Despite the effect of this additional day during 2016, net interest income increased during 2017 compared to 2016 due to the impact of increases in the average volume of loans, tax-exempt securities and interest-bearing deposits as well as increases in the average yields on loans and interest-bearing deposits partly offset by the impact of decreases in the average yields on tax-exempt and taxable securities, a decrease in the average volume of taxable securities and the impact of an increase in the average rate paid on interest-bearing liabilities. Notwithstanding the effect of the additional day, taxable-equivalent net interest income increased during 2016 compared to 2015 due to the impact of increases in the average volume of tax-exempt securities and loans as well as increases in the average yield on loans and interest-bearing deposits partly offset by the
47
impact of decreases in the average yield and volume of taxable securities. Taxable-equivalent net interest income during 2016 was also positively impacted by a decrease in the average rate paid on money market deposit accounts. See the analysis of net interest income included in the section captioned “Net Interest Income” included elsewhere in this discussion.
The provision for loan losses for 2017 totaled $35.5 million compared to $51.7 million in 2016 and $51.8 million in 2015. See the analysis of the provision for loan losses included in the section captioned “Allowance for Loan Losses” included elsewhere in this discussion.
Non-interest income for 2017 decreased $22.0 million, or 9.6%, compared to 2016. Non-interest income during 2017 included a net loss on securities transactions of $4.9 million while non-interest income during 2016 included a net gain on securities transactions of $14.9 million. See the analysis of these net gains and losses included in the section captioned “Net Gain/Loss on Securities Transactions” included elsewhere in this discussion. Excluding the impact of the net gains or losses on securities transactions, total non-interest income for 2017 effectively decreased $2.1 million, or 1.0%, compared to 2016 primarily due to decreases in other non-interest income, other charges, commissions and fees and insurance commissions and fees partly offset by increases in service charges on deposit accounts and interchange and debit card transactions fees. The decrease in other non-interest income was primarily related to decreases in gains on the sale of foreclosed and other assets, lease rental income and earnings on the cash surrender value of life insurance policies, among other things, partly offset by increases in sundry and other miscellaneous income, income from customer derivative and trading activities and income from customer foreign currency transactions, among other things. During 2016, gains on the sale of foreclosed and other assets included a $10.3 million net gain on the sale of our headquarters building and other adjacent properties in connection with a comprehensive development agreement, among other things, while during 2017, gains on the sale of foreclosed and other assets included $2.9 million related to amortization of the deferred portion of the gain on the sale of our headquarters building which we sold in 2016 and $2.0 million related to the sale of a motor-bank location. See Note 4 -Premises and Equipment in the accompanying notes to consolidated financial statements included elsewhere in this report. The decrease in other charges, commissions and fees was primarily due to a decrease in human resources consulting fee income and income from corporate finance and capital market advisory services, among other things, partly offset by increases in wire transfer fees, among other things. The decrease in insurance commissions and fees was related to a decrease in contingent income partly offset by an increase in commission income. The decrease in contingent income was primarily related to a lack of growth within the portfolio and a deterioration in the loss performance of insurance policies previously placed. The increase in commission income was primarily related to an increase in benefit plan commissions due to increased business volumes partly offset by a decrease in commissions on property and casualty policies. The increase in service charges on deposit accounts was primarily due to an increase in overdraft/insufficient funds charges on consumer and commercial accounts and consumer service charges partly offset by a decrease in commercial service charges. The increase in interchange and debit card transactions fees was primarily due to increases in income from debit card transactions and ATM service fees. See the analysis of these categories of non-interest income included in the section captioned “Non-Interest Income” included elsewhere in this discussion.
Non-interest income for 2016 increased $24.2 million, or 11.8%, compared to 2015. The increase was primarily related to increases in the net gain on securities transactions; other non-interest income; other charges, commissions and fees and interchange; and debit card transaction fees partly offset by decreases in insurance commissions and fees and service charges on deposit accounts. The increase in the net gain on securities transactions was primarily related to the sale of certain municipal securities as a result of a significant deterioration in the creditworthiness of the issuers. The increase in other non-interest income was primarily related to increases in gains on the sale of foreclosed and other assets, income from customer foreign currency transactions and income from customer derivative and trading activities partly offset by decreases in sundry and other miscellaneous income. The increase in gains on the sale of foreclosed and other assets was primarily related to the aforementioned sale of our headquarters building and various adjacent properties. The increase in other charges, commissions and fees was due to increases in loan processing fees, origination fees collected on loans that did not fund, agent income from the sale of federal funds, wire transfer fees, lease processing fees and income from corporate finance and capital market advisory services, among other things, partly offset by a decrease in unused balance fees on loan commitments. The decrease in insurance commissions and fees was related to a decrease in commission income partly offset by an increase in contingent commissions. The decrease in commission income during 2016 was primarily related to decreases in employee benefit plan commissions and consulting fees and commercial lines property and casualty commissions due to lower business volumes. The decrease in service charges on deposit accounts was primarily due to a decrease in service charges on consumer accounts partly offset by increases in service charges on commercial accounts and overdraft/insufficient funds charges on both consumer and commercial
48
accounts. See the analysis of these categories of non-interest income included in the section captioned “Non-Interest Income” included elsewhere in this discussion.
Non-interest expense for 2017 increased $19.7 million, or 3.2%, compared to 2016. The increase was primarily related to increases in salaries and wages; technology, furniture and equipment expense; deposit insurance expense; and employee benefits partly offset by a decrease in net occupancy expense, other non-interest expense and intangible amortization. The increase in salaries were primarily due to an increase in the number of employees and normal annual merit and market increases, as well as increases in incentive compensation, due to improved operating performance, and stock-based compensation. The increase in technology, furniture and equipment expense was primarily related to increases in software maintenance and depreciation on furniture and equipment partly offset by decreases in equipment rental expense and service contracts expense, among other things. The increase in deposit insurance expense was related to an increase in the assessment rate due to a new quarterly surcharge which began in the third quarter of 2016 and an increase in assets. The increase in employee benefits was primarily due to increases in expenses related to our 401(k) and profit sharing plans, medical insurance expense and payroll taxes, among other things, partly offset by a decrease in expenses related to our defined benefit retirement plans. The decrease in net occupancy expense was partly related to a change in the way we allocate occupancy expenses among our operating segments. The decrease in other non-interest expense was primarily related to decreases in donations expense, sundry and other miscellaneous expense and check card expense, among other things. These items were partly offset by increases in advertising/promotions expense, guard services expense, professional services expense, outside computer services expense and fraud losses, among other things. The decrease in intangible amortization expense was primarily related to the completion of amortization of certain previously recognized intangible assets as well as a reduction in the annual amortization rate of certain previously recognized intangible assets as we use an accelerated amortization approach which results in higher amortization rates during the earlier years of the useful lives of intangible assets. See the analysis of these categories of non-interest expense included in the section captioned “Non-Interest Expense” included elsewhere in this discussion.
Non-interest expense for 2016 increased $35.0 million, or 5.9%, compared to 2015. The increase was primarily related to increases in other non-interest expense; salaries and wages; technology, furniture and equipment expense; net occupancy; deposit insurance; and employee benefits expense partly offset by a decrease in intangible amortization expense. The increase in other non-interest expense was primarily related to increases in sundry and other miscellaneous expense, donations expense, check card expense, guard service expense, business development expense and outside computer services expense, among other things, partly offset by decreases in advertising/promotions expense and travel/meals and entertainment expense and refund expenses associated with customer use of non-Frost ATMs, among other things. Sundry and other miscellaneous expense included the write-down of certain assets. The increase in salaries and wages was primarily related to an increase in salaries due to an increase in the number of employees, normal annual merit and market increases and an increase in incentive compensation partly offset by a decrease in stock-based compensation. The increase in technology, furniture and equipment expense was primarily related to an increase in depreciation on furniture and equipment and software maintenance partly offset by decreases in software amortization and equipment rental expense. The increase in net occupancy expense was primarily related to increases in building depreciation, property taxes, repairs and maintenance/service contracts expense and depreciation on leasehold improvements. The increases in technology, furniture and equipment expense and net occupancy expense were partly related to a new operations and support center, a portion of which was placed into service during 2015 with the remainder placed into service in 2016, and new financial center locations. The increase in deposit insurance expense was primarily related to an increase in the assessment rate, in part due to a new surcharge that became applicable during 2016, and an increase in assets. The increase in employee benefits expense was primarily due to increases in medical insurance expense, payroll taxes and profit sharing plan expense, among other things, partly offset by a decrease in expenses related to our defined benefit retirement plans. The decrease in intangible amortization expense was primarily related to the completion of amortization of certain previously recognized intangible assets as well as a reduction in the annual amortization rate of certain previously recognized intangible assets as we use an accelerated amortization approach which results in higher amortization rates during the earlier years of the useful lives of intangible assets. This decrease was partly offset by the additional amortization related to the intangible assets recorded in 2016. See the analysis of these items included in the section captioned “Non-Interest Expense” included elsewhere in this discussion.
Income tax expense for 2017 increased $4.2 million, or 12.3%, compared to 2016 while income tax expense for 2016 decreased $1.3 million, or 3.8%, compared to 2015. See the section captioned “Income Taxes” included elsewhere in this discussion.
49
Frost Insurance Agency, which is included in the Banking operating segment, had gross commission revenues of $46.8 million during 2017 compared to $47.8 million during 2016 and $49.6 million in 2015. The decrease during 2017 compared to 2016 was primarily related to a decrease in contingent income partly offset by an increase in benefit plan commissions. The decrease during 2016 compared to 2015 was primarily related to a decrease in commission income partly offset by an increase in contingent income. See the analysis of insurance commissions and fees included in the section captioned “Non-Interest Income” included elsewhere in this discussion.
Frost Wealth Advisors
Net income for 2017 increased $5.3 million, or 27.8%, compared to 2016. The increase was primarily due to an $8.7 million increase in non-interest income and a $6.3 million increase in net interest income partly offset by a $6.9 million increase in non-interest expense and a $2.9 million increase in income tax expense. Net income for 2016 decreased $875 thousand, or 4.4%, compared to 2015. The decrease was primarily due to a $3.7 million increase in non-interest expense and a $1.4 million decrease in non-interest income partly offset by a $3.7 million increase in net interest income and a $472 thousand decrease in income tax expense.
Net interest income for 2017 increased $6.3 million, or 55.7%, compared to 2016 while net interest income for 2016 increased $3.7 million, or 48.5%, compared to 2015. The increases during 2017 and 2016 were primarily due to an increase in the funds transfer price received for funds provided related to Frost Wealth Advisors' repurchase agreements and, for 2017, an increase in the average volume of funds provided.
Non-interest income for 2017 increased $8.7 million, or 7.3%, compared to 2016. The increase was primarily related to increases in trust and investment management fees and other charges, commissions and fees. Trust and investment management fee income is the most significant income component for Frost Wealth Advisors. Investment fees are the most significant component of trust and investment management fees, making up approximately 84%, 82% and 79% of total trust and investment management fees in 2017, 2016 and 2015, respectively. Investment and other custodial account fees are generally based on the market value of assets within a trust account. Volatility in the equity and bond markets impacts the market value of trust assets and the related investment fees. The increase in trust and investment management fees during 2017 compared to 2016 was primarily the result of an increase in trust investment fees. The increase in trust investment fees was due to higher average equity valuations on managed accounts. Trust and investment management fees during 2017 also included an increase in real estate fees and a decrease in estate fees compared to 2016. See the analysis of trust and investment management fees included in the section captioned “Non-Interest Income” included elsewhere in this discussion.
Non-interest income for 2016 decreased $1.4 million, or 1.1%, compared to 2015. The decrease was primarily related to a decrease in trust and investment management fees. The decrease in trust and investment management fees was primarily the result of decreases in oil and gas fees, estate fees, securities lending income and custody fees. These decreases were partly offset by an increase in trust investment fees. The decrease in oil and gas fees was partly due to lower energy prices and a decrease in production. The decrease in estate fees was related to a decrease in the aggregate value of estates settled compared to 2015. The decrease in securities lending income was due to the termination of our securities lending operations during the first quarter of 2015. The increase in trust investment fees during 2016 was due to higher average equity valuations on managed accounts and an increase in the number of accounts. See the analysis of trust and investment management fees included in the section captioned “Non-Interest Income” included elsewhere in this discussion.
Non-interest expense for 2017 increased $6.9 million, or 6.7%, compared to 2016. The increase was primarily related to increases in net occupancy expense, salaries and wages and employee benefits partly offset by a decrease in other non-interest expense. The increase in net occupancy expense and decrease in other non-interest expense were related to a change in the way we allocate occupancy expenses among our operating segments. Beginning in 2017, operating segments receive a direct charge for occupancy expense based upon cost centers within the segment. Such amounts are now reported as occupancy expense. Previously, these costs were included within the allocated overhead and reported as a component of other non-interest expense. The increase in salaries and wages was primarily related to an increase in the number of employees and normal annual merit and market increases. The increase in employee benefits expense was primarily related to increases in expenses related to our defined benefit retirement plans, payroll taxes and medical insurance expense.
Non-interest expense for 2016 increased $3.7 million, or 3.7%, compared to 2015. The increase was primarily due to increases in other non-interest expense, employee benefits and salaries and wages. The increase in other non-interest expense was primarily due to increases in sundry and other miscellaneous expense, expenses related to professional
50
services and outside computer services, among other things, partly offset by a decrease in mutual fund sub-advisor expense, among other things. The increase in employee benefits expense was due, in part, to increases in expense related to our profit sharing plan, medical insurance expense and payroll taxes, among other things, partly offset by a decrease in expense related to our defined benefit retirement plans. The increase in salaries and wages was primarily related to an increase in the number of employees and normal annual merit and market increases partly offset by a decrease in incentive compensation.
Non-Banks
The Non-Banks operating segment had a net loss of $7.3 million for 2017 compared to a net loss of $4.5 million in 2016. The increase in net loss was primarily due to a $3.2 million increase in net interest expense partly offset by a $436 thousand decrease in non-interest expense. The increase in net interest expense was primarily due to increases in the interest rates paid on our long-term borrowings. The decrease in non-interest expense was primarily related to decreases in employee benefits expense and salaries and wages.
The Non-Banks operating segment had a net loss of $4.5 million for 2016 compared to a net loss of $2.7 million in 2015. The increase in net loss was primarily due to a $1.8 million decrease in other non-interest income, a $951 thousand increase in net-interest expense and a $583 thousand increase in other non-interest expense partly offset by a $1.5 million increase in income tax benefit. The decrease in non-interest income was primarily related to a decrease in mineral interest income. Mineral interest income is related to bonus, rental and shut-in payments and oil and gas royalties received from severed mineral interests on property owned by our wholly-owned non-banking subsidiary Main Plaza Corporation. The decrease in mineral interest income was partly related to lower energy prices and a decrease in production. The increase in net interest expense was primarily related to increases in the interest rates paid on our long-term borrowings. The increase in non-interest expense was primarily related to increases in employee benefits expense, other non-interest expense and salaries and wages.
Income Taxes
We recognized income tax expense of $44.2 million, for an effective tax rate of 10.8%, in 2017 compared to $37.2 million, for an effective tax rate of 10.9%, in 2016 and $40.5 million, for an effective rate of 12.7%, in 2015. The effective income tax rates differed from the U.S. statutory federal income tax rate of 35% during the comparable periods primarily due to the effect of tax-exempt income from loans, securities and life insurance policies and discrete items including the income tax effects associated with stock-based compensation, changes in enacted tax rates and corrections.
The effective tax rate for 2017 was impacted by the adjustment of our deferred tax assets and liabilities related to the reduction in the U.S. federal statutory income tax rate to 21% under the Tax Cuts and Jobs Act enacted on December 22, 2017, as more fully discussed below. Under ASC 740, Income Taxes, the effect of income tax law changes on deferred taxes should be recognized as a component of income tax expense related to continuing operations in the period in which the law is enacted. This requirement applies not only to items initially recognized in continuing operations, but also to items initially recognized in other comprehensive income. As a result of the reduction in the U.S. federal statutory income tax rate, we recognized a provisional net income tax benefit totaling $4.0 million, determined as follows:
Tax Benefit/(Expense) | |||
Deferred taxes related to items recognized in continuing operations | $ | (5,488 | ) |
Deferred taxes related to items recognized in other comprehensive income: | |||
Deferred taxes on net actuarial loss on defined benefit post-retirement benefit plans | (8,022 | ) | |
Deferred taxes on net unrealized gain on securities available for sale | 15,939 | ||
Deferred taxes on net unrealized gain on securities transferred to held to maturity | 1,618 | ||
Net provisional adjustment to deferred taxes recognized as an income tax benefit | $ | 4,047 | |
Because ASC 740 requires the effect of income tax law changes on deferred taxes to be recognized as a component of income tax expense related to continuing operations rather than merely backward tracing the adjustment through the accumulated other comprehensive income component of shareholders' equity, the net adjustment to deferred taxes detailed above included a net benefit totaling $9.5 million related to items recognized in other comprehensive income. The amounts included in the table above will continue to be reported as separate components of accumulated other comprehensive income until such time as the underlying transactions from which such amounts arose are settled through continuing operations. At such time, the reclassification from accumulated other comprehensive income will be
51
recognized as either a tax benefit or expense. Notwithstanding the foregoing, in January 2018, the Financial Accounting Standards Board issued a proposed Accounting Standards Update that would require that the tax effects stranded in accumulated other comprehensive income be reclassified to retained earnings rather than income tax benefit or expense.
The effective tax rate for 2017 was also impacted by the correction of an over-accrual of taxes that resulted from incorrectly classifying certain tax-exempt loans as taxable for federal income tax purposes since 2013. As a result, we recognized tax benefits totaling $2.9 million related to the 2013 through 2016 tax years.
Excluding the effects of the change in the U.S. federal statutory income tax rate and the correction of the over-accrual, our effective tax rate would have been 12.5% during 2017. This increase in income tax expense and the effective tax rate during 2017 compared to 2016 was primarily related to an increase in total income with a higher proportion of taxable income relative to tax-exempt income, partly offset by an increase in tax benefits associated with stock-based compensation. During 2016, we adopted a new accounting standard that requires the income tax effects associated with stock-based compensation to be recognized as a component of income tax expense. We recognized net tax benefits related to stock-based compensation totaling $9.1 million in 2017 and $5.1 million in 2016. The decrease in the effective tax rate during 2016 compared to 2015 was partly related to an increase in the relative proportion of tax-exempt income from higher volumes of tax-exempt municipal securities. The decrease was also partly related to the aforementioned adoption of a new accounting standard which impacted how the income tax effects associated with stock-based compensation are recognized.
Tax Cuts and Jobs Act. The Tax Cuts and Jobs Act was enacted on December 22, 2017. Among other things, the new law (i) establishes a new, flat corporate federal statutory income tax rate of 21%, (ii) eliminates the corporate alternative minimum tax and allows the use of any such carryforwards to offset regular tax liability for any taxable year, (iii) limits the deduction for net interest expense incurred by U.S. corporations, (iv) allows businesses to immediately expense, for tax purposes, the cost of new investments in certain qualified depreciable assets, (v) eliminates or reduces certain deductions related to meals and entertainment expenses, (vi) modifies the limitation on excessive employee remuneration to eliminate the exception for performance-based compensation and clarifies the definition of a covered employee and (vii) limits the deductibility of deposit insurance premiums. The Tax Cuts and Jobs Act also significantly changes U.S. tax law related to foreign operations, however, such changes do not currently impact us. Based upon our current 2018 projections, we expect that our effective tax rate for 2018 will be approximately 600 basis points lower under the new tax law than would have been the case prior to enactment; however, there can be no assurance as to the actual amount of any reduction because it will be dependent upon the nature and amount of future income and expenses as well as transactions with discrete tax effects.
Sources and Uses of Funds
The following table illustrates, during the years presented, the mix of our funding sources and the assets in which those funds are invested as a percentage of our average total assets for the period indicated. Average assets totaled $30.5 billion in 2017 compared to $28.8 billion in 2016 and $28.1 billion in 2015.
2017 | 2016 | 2015 | ||||||
Sources of Funds: | ||||||||
Deposits: | ||||||||
Non-interest-bearing | 35.5 | % | 34.8 | % | 36.3 | % | ||
Interest-bearing | 49.6 | 50.2 | 49.4 | |||||
Federal funds purchased and repurchase agreements | 3.2 | 2.7 | 2.3 | |||||
Long-term debt and other borrowings | 0.8 | 0.8 | 0.8 | |||||
Other non-interest-bearing liabilities | 0.5 | 0.9 | 0.9 | |||||
Equity capital | 10.4 | 10.6 | 10.3 | |||||
Total | 100.0 | % | 100.0 | % | 100.0 | % | ||
Uses of Funds: | ||||||||
Loans | 40.9 | % | 40.1 | % | 40.2 | % | ||
Securities | 40.2 | 41.8 | 41.4 | |||||
Federal funds sold, resell agreements and interest-bearing deposits | 12.0 | 10.8 | 10.9 | |||||
Other non-interest-earning assets | 6.9 | 7.3 | 7.5 | |||||
Total | 100.0 | % | 100.0 | % | 100.0 | % | ||
52
Deposits continue to be our primary source of funding. Average deposits increased $1.4 billion, or 5.7%, in 2017 compared to 2016 and increased $471.1 million, or 2.0% in 2016 compared to 2015. Non-interest-bearing deposits remain a significant source of funding, which has been a key factor in maintaining our relatively low cost of funds. Average non-interest-bearing deposits totaled 41.8% of total average deposits in 2017 compared to 40.9% in 2016, and 42.3% in 2015. The Dodd-Frank Act repealed the federal prohibitions on the payment of interest on demand deposits, thereby permitting depository institutions to pay interest on business transaction and other accounts beginning July 21, 2011. To date, we have not experienced any significant additional interest costs as a result of the repeal. However, in light of the aforementioned increases in market interest rates, in late July 2017, we increased the interest rates we pay on most of our interest-bearing deposit products. This may lead to a decrease in the relative proportion of non-interest-bearing deposits to total deposits.
We primarily invest funds in loans and securities. Average loans increased $905.3 million, or 7.8%, in 2017 compared to 2016 and increased $287.4 million, or 2.6% in 2016 compared to 2015. Average securities increased $188.5 million, or 1.6%, in 2017 compared to 2016 and increased $442.7 million, or 3.8%, in 2016 compared to 2015. Average federal funds sold, resell agreements and interest-bearing deposits increased $548.3 million, or 17.7%, in 2017 compared to 2016 and increased $32.3 million, or 1.1%, in 2016 compared to 2015.
Loans
Year-end loans, including leases net of unearned discounts, consisted of the following:
2017 | Percentage of Total | 2016 | 2015 | 2014 | 2013 | |||||||||||||||||
Commercial and industrial | $ | 4,792,388 | 36.4 | % | $ | 4,344,000 | $ | 4,120,522 | $ | 4,055,225 | $ | 3,766,635 | ||||||||||
Energy: | ||||||||||||||||||||||
Production | 1,182,326 | 9.0 | 971,767 | 1,249,678 | 1,160,404 | 616,893 | ||||||||||||||||
Service | 171,795 | 1.3 | 221,213 | 272,934 | 319,618 | 236,766 | ||||||||||||||||
Other | 144,972 | 1.1 | 193,081 | 235,583 | 293,923 | 261,750 | ||||||||||||||||
Total energy | 1,499,093 | 11.4 | 1,386,061 | 1,758,195 | 1,773,945 | 1,115,409 | ||||||||||||||||
Commercial real estate: | ||||||||||||||||||||||
Commercial mortgages | 3,887,742 | 29.6 | 3,481,157 | 3,285,041 | 2,999,082 | 2,800,760 | ||||||||||||||||
Construction | 1,066,696 | 8.1 | 1,043,261 | 720,695 | 624,888 | 426,639 | ||||||||||||||||
Land | 331,986 | 2.5 | 311,030 | 286,991 | 291,907 | 239,937 | ||||||||||||||||
Total commercial real estate | 5,286,424 | 40.2 | 4,835,448 | 4,292,727 | 3,915,877 | 3,467,336 | ||||||||||||||||
Consumer real estate: | ||||||||||||||||||||||
Home equity loans | 355,342 | 2.7 | 345,130 | 340,528 | 342,725 | 329,853 | ||||||||||||||||
Home equity lines of credit | 291,950 | 2.2 | 264,862 | 233,525 | 220,128 | 195,132 | ||||||||||||||||
Other | 376,002 | 2.9 | 326,793 | 306,696 | 286,198 | 283,219 | ||||||||||||||||
Total consumer real estate | 1,023,294 | 7.8 | 936,785 | 880,749 | 849,051 | 808,204 | ||||||||||||||||
Total real estate | 6,309,718 | 48.0 | 5,772,233 | 5,173,476 | 4,764,928 | 4,275,540 | ||||||||||||||||
Consumer and other | 544,466 | 4.2 | 473,098 | 434,338 | 393,437 | 358,116 | ||||||||||||||||
Total loans | $ | 13,145,665 | 100.0 | % | $ | 11,975,392 | $ | 11,486,531 | $ | 10,987,535 | $ | 9,515,700 | ||||||||||
Overview. Year-end total loans increased $1.2 billion, or 9.8%, during 2017 compared to 2016, increased $488.9 million, or 4.3% during 2016 compared to 2015, increased $499.0 million, or 4.5% during 2015 compared to 2014 and increased $1.5 billion, or 15.5% during 2014 compared to 2013. We acquired $670.6 million of loans in connection with the acquisition of WNB during the second quarter of 2014.
The majority of our loan portfolio is comprised of commercial and industrial loans, energy loans and real estate loans. Commercial and industrial loans made up 36.4% and 36.3% of total loans at December 31, 2017 and 2016 while energy loans made up 11.4% and 11.6% of total loans at December 31, 2017 and 2016 and real estate loans made up 48.0% and 48.2% of total loans at December 31, 2017 and 2016. Energy loans include commercial and industrial loans, leases and real estate loans to borrowers in the energy industry. Real estate loans include both commercial and consumer balances.
53
Loan Origination/Risk Management. We have certain lending policies and procedures in place that are designed to maximize loan income within an acceptable level of risk. Management reviews and approves these policies and procedures on a regular basis. A reporting system supplements the review process by providing management with frequent reports related to loan production, loan quality, concentrations of credit, loan delinquencies and non-performing and potential problem loans. Diversification in the loan portfolio is a means of managing risk associated with fluctuations in economic conditions.
Commercial and industrial loans are underwritten after evaluating and understanding the borrower’s ability to operate profitably and prudently expand its business. Underwriting standards are designed to promote relationship banking rather than transactional banking. Once it is determined that the borrower’s management possesses sound ethics and solid business acumen, our management examines current and projected cash flows to determine the ability of the borrower to repay their obligations as agreed. Commercial and industrial loans are primarily made based on the identified cash flows of the borrower and secondarily on the underlying collateral provided by the borrower. The cash flows of borrowers, however, may not be as expected and the collateral securing these loans may fluctuate in value. Most commercial and industrial loans are secured by the assets being financed or other business assets such as accounts receivable or inventory and may incorporate a personal guarantee; however, some short-term loans may be made on an unsecured basis. In the case of loans secured by accounts receivable, the availability of funds for the repayment of these loans may be substantially dependent on the ability of the borrower to collect amounts due from its customers.
Our energy loan portfolio includes loans for production, energy services and other energy loans, which includes private clients, transportation and equipment providers, manufacturers, refiners and traders. The origination process for energy loans is similar to that of commercial and industrial loans. Because, however, of the average loan size, the significance of the portfolio and the specialized nature of the energy industry, our energy lending requires a highly prescriptive underwriting policy. Production loans are secured by proven, developed and producing reserves. Loan proceeds are used for the development and drilling of additional wells, the acquisition of additional production, and/or the acquisition of additional properties to be developed and drilled. Our customers in this sector are generally large, independent, private owner-producers or large corporate producers. These borrowers typically have large capital requirements for drilling and acquisitions, and as such, loans in this portfolio are generally greater than $10 million. Production loans are collateralized by the oil and gas interests of the borrower. Collateral values are determined by the risk-adjusted and limited discounted future net revenue of the reserves. Collateral is calculated at least semi-annually using third party engineer-prepared reserve studies. These reserve studies are conducted using a discount factor and base case assumptions for the current and future value of oil and gas. To qualify as collateral, typically reserves must be proven, developed and producing. For our strongest borrowers, collateral may include up to 20% proven, non-producing reserves. Loan commitments are limited to 65% of estimated reserve value. Cash flows must be sufficient to amortize the loan commitment within 120% of the half-life of the underlying reserves. Loan commitments generally must also be 100% covered by the risk-adjusted and limited discounted future net revenue of the reserves when stressed at 75% of our base case price assumptions. In addition, the ratio of the borrower's debt to earnings before interest, taxes, depreciation and amortization ("EBITDA") should generally not exceed 350%.
Oil and gas service, transportation, and equipment providers are economically aligned due to their reliance on drilling and active oil and gas development. Income for these borrowers is highly dependent on the level of drilling activity and rig utilization, both of which are driven by the current and future outlook for the price of oil and gas. We mitigate the credit risk in this sector through conservative concentration limits and guidelines on the profile of eligible borrowers. Guidelines require that the companies have extensive experience through several industry cycles, and that they be supported by financially competent and committed guarantors who provide a significant secondary source of repayment. Borrowers in this sector are typically privately-owned, middle-market companies with annual sales of less than $100 million. The services provided by companies in this sector are highly diversified, and include down-hole testing and maintenance, providing and threading drilling pipe, hydraulic fracturing services or equipment, seismic testing and equipment and other direct or indirect providers to the oil and gas production sector.
Our private client portfolio primarily consists of loans to wealthy individuals and their related oil and gas exploration and production entities, where the oil and gas producing reserves are not considered to be the primary source of repayment. These borrowers and guarantors typically have significant sources of wealth including significant liquid assets and/or cash flow from other investments which can fully repay the loans. The credit structures of these loans are generally similar to those of energy production loans, described above, with respect to the valuation of the reserves taken as collateral and the repayment structures.
54
We have a small portfolio of loans to refiners where our credit involvement with these customers is through purchases of shared national credit syndications. These borrowers refine crude oil into gasoline, diesel, jet fuel, asphalt and other petrochemicals and are not dependent on drilling or development. All of the borrowers in this portfolio are very large public companies that are important employers in several of our major markets. These borrowers, for the most part, have been long-term customers and we have a strong relationship with these companies and their executive management. There is no new customer origination process for this segment, as growth is expected to only reflect additional needs of these existing relationships.
We also have a small portfolio of loans to energy trading companies that serve as intermediaries that buy and sell oil, gas, other petrochemicals, and ethanol. These companies are not dependent on drilling or development. As a general policy, we do not lend to energy traders; however, we have made an exception to this policy for certain customers based upon their underlying business models which minimize risk as commodities are bought only to fill existing orders (back-to-back trading). As such, the commodity price risk and sale risk are eliminated. There is no new customer origination process for this segment, as growth is expected to only reflect additional needs of these existing relationships.
Commercial real estate loans are subject to underwriting standards and processes similar to commercial and industrial loans, in addition to those of real estate loans. These loans are viewed primarily as cash flow loans and secondarily as loans secured by real estate. Commercial real estate lending typically involves higher loan principal amounts and the repayment of these loans is generally largely dependent on the successful operation of the property securing the loan or the business conducted on the property securing the loan. Commercial real estate loans may be more adversely affected by conditions in the real estate markets or in the general economy. The properties securing our commercial real estate portfolio are diverse in terms of type and geographic location within Texas. This diversity helps reduce our exposure to adverse economic events that affect any single market or industry. Management monitors and evaluates commercial real estate loans based on collateral, geography and risk grade criteria. As a general rule, we avoid financing single-purpose projects unless other underwriting factors are present to help mitigate risk. We also utilize third-party experts to provide insight and guidance about economic conditions and trends affecting market areas we serve. In addition, management tracks the level of owner-occupied commercial real estate loans versus non-owner occupied loans. At December 31, 2017, approximately 51.2% of the outstanding principal balance of our commercial real estate loans were secured by owner-occupied properties.
With respect to loans to developers and builders that are secured by non-owner occupied properties that we may originate from time to time, we generally require the borrower to have had an existing relationship with us and have a proven record of success. Construction loans are underwritten utilizing feasibility studies, independent appraisal reviews, sensitivity analysis of absorption and lease rates and financial analysis of the developers and property owners. Construction loans are generally based upon estimates of costs and value associated with the completed project. These estimates may be inaccurate. Construction loans often involve the disbursement of substantial funds with repayment substantially dependent on the success of the ultimate project. Sources of repayment for these types of loans may be pre-committed permanent loans from approved long-term lenders, sales of developed property or an interim loan commitment from us until permanent financing is obtained. These loans are closely monitored by on-site inspections and are considered to have higher risks than other real estate loans due to their ultimate repayment being sensitive to interest rate changes, governmental regulation of real property, general economic conditions and the availability of long-term financing.
We originate consumer loans utilizing a computer-based credit scoring analysis to supplement the underwriting process. To monitor and manage consumer loan risk, policies and procedures are developed and modified, as needed, jointly by line and staff personnel. This activity, coupled with relatively small loan amounts that are spread across many individual borrowers, minimizes risk. Additionally, trend and outlook reports are reviewed by management on a regular basis. Underwriting standards for home equity loans are heavily influenced by statutory requirements, which include, but are not limited to, a maximum loan-to-value percentage of 80%, collection remedies, the number of such loans a borrower can have at one time and documentation requirements.
We maintain an independent loan review department that reviews and validates the credit risk program on a periodic basis. Results of these reviews are presented to management and the appropriate committees of our board of directors. The loan review process complements and reinforces the risk identification and assessment decisions made by lenders and credit personnel, as well as our policies and procedures.
Commercial and Industrial. Commercial and industrial loans increased $448.4 million, or 10.3%, during 2017 compared to 2016 and increased $223.5 million, or 5.4%, in 2016 compared to 2015. Our commercial and industrial loans are a diverse group of loans to small, medium and large businesses. The purpose of these loans varies from supporting seasonal working capital needs to term financing of equipment. While some short-term loans may be made
55
on an unsecured basis, most are secured by the assets being financed with collateral margins that are consistent with our loan policy guidelines. The commercial and industrial loan portfolio also includes the commercial lease and purchased shared national credits.
Energy. Energy loans include loans to entities and individuals that are engaged in various energy-related activities including (i) the development and production of oil or natural gas, (ii) providing oil and gas field servicing, (iii) providing energy-related transportation services (iv) providing equipment to support oil and gas drilling (v) refining petrochemicals, or (vi) trading oil, gas and related commodities. Energy loans increased $113.0 million, or 8.2%, during 2017 compared to 2016 and decreased $372.1 million, or 21.2%, in 2016 compared to 2015. We acquired approximately $319.1 million of energy loans in connection with the acquisition of WNB during 2014, which contributed to the higher concentration of such loans. The average loan size, the significance of the portfolio and the specialized nature of the energy industry requires a highly prescriptive underwriting policy. Exceptions to this policy are rarely granted. Due to the large borrowing requirements of this customer base, the energy loan portfolio includes participations and purchased shared national credits.
Industry Concentrations. As of December 31, 2017 and 2016, other than energy loans, there were no concentrations of loans within any single industry in excess of 10% of total loans, as segregated by Standard Industrial Classification code (“SIC code”). The SIC code system is a federally designed standard industrial numbering system used by us to categorize loans by the borrower’s type of business. The following table summarizes the industry concentrations of our loan portfolio, as segregated by SIC code. Industry concentrations, stated as a percentage of year-end total loans as of December 31, 2017 and 2016, are presented below:
2017 | 2016 | ||||
Industry concentrations: | |||||
Energy | 11.4 | % | 11.6 | % | |
Public finance | 6.1 | 5.1 | |||
Medical services | 3.6 | 4.6 | |||
General and specific trade contractors | 3.6 | 3.6 | |||
Building materials and contractors | 3.2 | 3.1 | |||
Manufacturing, other | 3.1 | 3.7 | |||
Automobile dealers | 3.0 | 3.1 | |||
Religion | 2.6 | 2.5 | |||
Services | 2.5 | 2.6 | |||
Financial services, consumer credit | 2.2 | 1.5 | |||
Investor | 1.7 | 2.2 | |||
Transportation | 1.7 | 2.0 | |||
All other | 55.3 | 54.4 | |||
Total loans | 100.0 | % | 100.0 | % | |
Large Credit Relationships. The market areas served by us include three of the top ten most populated cities in the United States. These market areas are also home to a significant number of Fortune 500 companies. As a result, we originate and maintain large credit relationships with numerous commercial customers in the ordinary course of business. We consider large credit relationships to be those with commitments equal to or in excess of $10.0 million, excluding treasury management lines exposure, prior to any portion being sold. Large relationships also include loan participations purchased if the credit relationship with the agent is equal to or in excess of $10.0 million. In addition to our normal policies and procedures related to the origination of large credits, our Central Credit Committee ("CCC") must approve all new credit facilities which are part of large credit relationships and renewals of such credit facilities that exceed $20.0 million or are graded as "watch" (risk grade 9) or higher. The CCC meets regularly and reviews large credit relationship activity and discusses the current pipeline, among other things.
56
The following table provides additional information on our large credit relationships outstanding at year-end.
2017 | 2016 | ||||||||||||||||||
Number of Relationships | Period-End Balances | Number of Relationships | Period-End Balances | ||||||||||||||||
Committed | Outstanding | Committed | Outstanding | ||||||||||||||||
Committed amount: | |||||||||||||||||||
$20.0 million and greater | 224 | $ | 9,765,770 | $ | 5,446,315 | 208 | $ | 8,491,785 | $ | 4,658,742 | |||||||||
$10.0 million to $19.9 million | 162 | 2,250,279 | 1,319,667 | 174 | 2,373,209 | 1,482,969 | |||||||||||||
The average commitment per large credit relationship in excess of $20.0 million totaled $43.6 million at December 31, 2017 and $40.8 million at December 31, 2016. The average outstanding balance per large credit relationship with a commitment in excess of $20.0 million totaled $24.3 million at December 31, 2017 and $22.4 million at December 31, 2016. The average commitment per large credit relationship between $10.0 million and $19.9 million totaled $13.9 million at December 31, 2017 and $13.6 million at December 31, 2016. The average outstanding balance per large credit relationship with a commitment between $10 million and $19.9 million totaled $8.1 million at December 31, 2017 and $8.5 million at December 31, 2016.
Purchased Shared National Credits (“SNCs”). Purchased SNCs are participations purchased from upstream financial organizations and tend to be larger in size than our originated portfolio. Our purchased SNC portfolio totaled $835.0 million at December 31, 2017 increasing $62.8 million, or 8.1%, from $772.2 million at December 31, 2016. At December 31, 2017, 55.8% of outstanding purchased SNCs were related to the energy industry and 14.0% of outstanding purchased SNCs were related to the construction industry. The remaining purchased SNCs were diversified throughout various other industries, with no other single industry exceeding 10% of the total purchased SNC portfolio. Additionally, almost all of the outstanding balance of purchased SNCs was included in the energy and commercial and industrial portfolios, with the remainder included in the real estate categories. SNC participations are originated in the normal course of business to meet the needs of our customers. As a matter of policy, we generally only participate in SNCs for companies headquartered in or which have significant operations within our market areas. In addition, we must have direct access to the company’s management, an existing banking relationship or the expectation of broadening the relationship with other banking products and services within the following 12 to 24 months. SNCs are reviewed at least quarterly for credit quality and business development successes. The following table provides additional information about certain credits within our purchased SNCs portfolio as of year-end.
2017 | 2016 | ||||||||||||||||||
Number of Relationships | Period-End Balances | Number of Relationships | Period-End Balances | ||||||||||||||||
Committed | Outstanding | Committed | Outstanding | ||||||||||||||||
Purchased shared national credits: | |||||||||||||||||||
$20.0 million and greater | 41 | $ | 1,502,958 | $ | 585,509 | 41 | $ | 1,456,331 | $ | 522,137 | |||||||||
$10.0 million to $19.9 million | 27 | 389,243 | 222,661 | 28 | 416,422 | 233,633 | |||||||||||||
Real Estate Loans. Real estate loans increased $537.5 million, or 9.3%, during 2017 compared to 2016 and increased $598.8 million, or 11.6%, in 2016 compared to 2015. Real estate loans include both commercial and consumer balances. Commercial real estate loans totaled $5.3 billion, or 83.8% of total real estate loans, at December 31, 2017 and $4.8 billion, or 83.8% of total real estate loans, at December 31, 2016. The majority of this portfolio consists of commercial real estate mortgages, which includes both permanent and intermediate term loans. Our primary focus for the commercial real estate portfolio has been growth in loans secured by owner-occupied properties. These loans are viewed primarily as cash flow loans and secondarily as loans secured by real estate. Consequently, these loans must undergo the analysis and underwriting process of a commercial and industrial loan, as well as that of a real estate loan.
57
The following tables summarize our commercial real estate loan portfolio, including commercial real estate loans reported as a component of our energy loan portfolio segment, as segregated by (i) the type of property securing the credit and (ii) the geographic region in which the loans were originated. Property type concentrations are stated as a percentage of year-end total commercial real estate loans as of December 31, 2017 and 2016:
2017 | 2016 | ||||
Property type: | |||||
Office building | 19.8 | % | 18.2 | % | |
Office/warehouse | 16.6 | 16.5 | |||
Retail | 8.2 | 7.4 | |||
Multifamily | 6.7 | 7.9 | |||
Non-farm/non-residential | 6.5 | 7.4 | |||
1-4 Family | 5.4 | 5.5 | |||
Strip centers | 5.1 | 4.7 | |||
Religious | 4.8 | 5.0 | |||
Medical offices and services | 4.7 | 5.8 | |||
All other | 22.2 | 21.6 | |||
Total commercial real estate loans | 100.0 | % | 100.0 | % | |
2017 | 2016 | ||||
Geographic region: | |||||
San Antonio | 26.6 | % | 25.3 | % | |
Houston | 22.3 | 23.1 | |||
Fort Worth | 17.3 | 18.1 | |||
Dallas | 14.0 | 14.6 | |||
Austin | 10.1 | 9.3 | |||
Rio Grande Valley | 4.7 | 4.1 | |||
Permian Basin | 3.0 | 3.2 | |||
Corpus Christi | 2.0 | 2.3 | |||
Total commercial real estate loans | 100.0 | % | 100.0 | % | |
Consumer Loans. The consumer loan portfolio at December 31, 2017 increased $157.9 million, or 11.2%, from December 31, 2016. As the following table illustrates, the consumer loan portfolio has two distinct segments, including consumer real estate and consumer and other.
2017 | 2016 | ||||||
Consumer real estate: | |||||||
Home equity loans | $ | 355,342 | $ | 345,130 | |||
Home equity lines of credit | 291,950 | 264,862 | |||||
Other | 376,002 | 326,793 | |||||
Total consumer real estate | 1,023,294 | 936,785 | |||||
Consumer and other | 544,466 | 473,098 | |||||
Total consumer loans | $ | 1,567,760 | $ | 1,409,883 | |||
Consumer real estate loans at December 31, 2017 increased $86.5 million, or 9.2%, from December 31, 2016. Combined, home equity loans and lines of credit made up 63.3% and 65.1% of the consumer real estate loan total at December 31, 2017 and 2016, respectively. We offer home equity loans up to 80% of the estimated value of the personal residence of the borrower, less the value of existing mortgages and home improvement loans. In general, we do not originate 1-4 family mortgage loans; however, from time to time, we may invest in such loans to meet the needs of our customers. Under the Tax Cuts and Jobs Act enacted on December 22, 2017, interest on home equity loans and lines of credit is no longer deductible. This change could adversely impact the level of originations and outstanding volumes of home equity loans and lines of credit in the future. The consumer and other loan portfolio at December 31, 2017 increased $71.4 million, or 15.1%, from December 31, 2016. This portfolio primarily consists of automobile loans,
58
unsecured revolving credit products, personal loans secured by cash and cash equivalents, and other similar types of credit facilities.
Foreign Loans. We make U.S. dollar-denominated loans and commitments to borrowers in Mexico. The outstanding balance of these loans and the unfunded amounts available under these commitments were not significant at December 31, 2017 or 2016.
Maturities and Sensitivities of Loans to Changes in Interest Rates. The following table presents the maturity distribution of our commercial and industrial loans, energy loans, real estate construction loans and commercial real estate loans, excluding leases, at December 31, 2017. The table also presents the portion of loans that have fixed interest rates or variable interest rates that fluctuate over the life of the loans in accordance with changes in an interest rate index such as the prime rate or LIBOR.
Due in One Year or Less | After One, but Within Five Years | After Five Years | Total | ||||||||||||
Commercial and industrial | $ | 1,845,717 | $ | 1,913,606 | $ | 728,834 | $ | 4,488,157 | |||||||
Energy | 1,007,125 | 433,897 | 42,788 | 1,483,810 | |||||||||||
Real estate construction | 633,156 | 1,946,593 | 1,639,979 | 4,219,728 | |||||||||||
Commercial real estate | 356,218 | 487,966 | 222,512 | 1,066,696 | |||||||||||
Total | $ | 3,842,216 | $ | 4,782,062 | $ | 2,634,113 | $ | 11,258,391 | |||||||
Loans with fixed interest rates | $ | 1,144,414 | $ | 1,477,032 | $ | 1,261,985 | $ | 3,883,431 | |||||||
Loans with floating interest rates | 2,697,802 | 3,305,030 | 1,372,128 | 7,374,960 | |||||||||||
Total | $ | 3,842,216 | $ | 4,782,062 | $ | 2,634,113 | $ | 11,258,391 | |||||||
We generally structure commercial loans with shorter-term maturities in order to match our funding sources and to enable us to effectively manage the loan portfolio by providing the flexibility to respond to liquidity needs, changes in interest rates and changes in underwriting standards and loan structures, among other things. Due to the shorter-term nature of such loans, from time to time and in the ordinary course of business, we will renew/extend maturing lines of credit or refinance existing loans at their maturity dates. Some loans may renew multiple times in a given year as a result of general customer practice and need. These renewals, extensions and refinancings are made in the ordinary course of business for customers that meet our normal level of credit standards. Such borrowers typically request renewals to support their on-going working capital needs to finance their operations. Such borrowers are not experiencing financial difficulties and generally could obtain similar financing from another financial institution. In connection with each renewal, extension or refinancing, we may require a principal reduction, adjust the rate of interest and/or modify the structure and other terms to reflect the current market pricing/structuring for such loans or to maintain competitiveness with other financial institutions. In such cases, we do not generally grant concessions, and, except for those reported in Note 3 - Loans, any such renewals, extensions or refinancings that occurred during the reported periods were not deemed to be troubled debt restructurings pursuant to applicable accounting guidance. Loans exceeding $1.0 million undergo a complete underwriting process at each renewal.
59
Non-Performing Assets and Potential Problem Loans
Non-Performing Assets. Year-end non-performing assets and accruing past due loans were as follows:
2017 | 2016 | 2015 | 2014 | 2013 | |||||||||||||||
Non-accrual loans: | |||||||||||||||||||
Commercial and industrial | $ | 46,186 | $ | 31,475 | $ | 25,111 | $ | 34,108 | $ | 26,143 | |||||||||
Energy | 94,302 | 57,571 | 21,180 | 636 | 590 | ||||||||||||||
Commercial real estate | 7,589 | 8,550 | 35,088 | 22,431 | 27,035 | ||||||||||||||
Consumer real estate | 2,109 | 2,130 | 1,862 | 2,212 | 2,207 | ||||||||||||||
Consumer and other | 128 | 425 | 226 | 538 | 745 | ||||||||||||||
Total non-accrual loans | 150,314 | 100,151 | 83,467 | 59,925 | 56,720 | ||||||||||||||
Restructured loans | 4,862 | — | — | — | 1,137 | ||||||||||||||
Foreclosed assets: | |||||||||||||||||||
Real estate | 2,116 | 2,440 | 2,255 | 5,251 | 11,916 | ||||||||||||||
Other | — | — | — | — | — | ||||||||||||||
Total foreclosed assets | 2,116 | 2,440 | 2,255 | 5,251 | 11,916 | ||||||||||||||
Total non-performing assets | $ | 157,292 | $ | 102,591 | $ | 85,722 | $ | 65,176 | $ | 69,773 | |||||||||
Ratio of non-performing assets to: | |||||||||||||||||||
Total loans and foreclosed assets | 1.20 | % | 0.86 | % | 0.75 | % | 0.59 | % | 0.73 | % | |||||||||
Total assets | 0.50 | 0.34 | 0.30 | 0.23 | 0.29 | ||||||||||||||
Accruing past due loans: | |||||||||||||||||||
30 to 89 days past due | $ | 93,428 | $ | 55,456 | $ | 59,480 | $ | 42,881 | $ | 31,297 | |||||||||
90 or more days past due | 14,432 | 24,864 | 8,108 | 20,941 | 7,635 | ||||||||||||||
Total accruing past due loans | $ | 107,860 | $ | 80,320 | $ | 67,588 | $ | 63,822 | $ | 38,932 | |||||||||
Ratio of accruing past due loans to total loans: | |||||||||||||||||||
30 to 89 days past due | 0.71 | % | 0.46 | % | 0.52 | % | 0.39 | % | 0.33 | % | |||||||||
90 or more days past due | 0.11 | 0.21 | 0.07 | 0.19 | 0.08 | ||||||||||||||
Total accruing past due loans | 0.82 | % | 0.67 | % | 0.59 | % | 0.58 | % | 0.41 | % | |||||||||
Non-performing assets include non-accrual loans, restructured loans and foreclosed assets. Non-performing assets at December 31, 2017 increased $54.7 million compared to December 31, 2016 while non-performing assets at December 31, 2016 increased $16.9 million compared to December 31, 2015.
Non-accrual commercial and industrial loans included two credit relationships in excess of $5 million totaling $34.2 million at December 31, 2017. One of these credit relationships was placed on non-accrual status during the third quarter of 2017 and was previously classified as “substandard - accrual” (risk grade 11) at June 30, 2017. The other credit relationship was placed on non-accrual status during the fourth quarter of 2017 and was previously classified as “special mention” (risk grade 10) at September 30, 2017. Neither of these credit relationships were reported as a potential problem prior to being place on non-accrual status. Non-accrual commercial and industrial loans included one credit relationship in excess of $5 million totaling $9.8 million at December 31, 2016. Of this amount, we charged-off $7.7 million during 2017. The outstanding balance of this credit relationship totaled $1.9 million at December 31, 2017 and is included in non-accrual commercial and industrial loans in the table above. Non-accrual commercial and industrial loans included one credit relationship in excess of $5 million totaling $15.0 million at December 31, 2015, one such credit relationship totaling $15.5 million at December 31, 2014 and one such credit relationship totaling $6.3 million at December 31, 2013.
Non-accrual energy loans included four credit relationships in excess of $5 million totaling $83.5million at December 31, 2017. Of this amount, $27.9 million related to two credit relationships that were previously reported as non-accrual at December 31, 2016 and $55.6 million related to two credit relationships that were placed on non-accrual status during the third quarter of 2017, one of which was a $43.1 million credit relationship that was previously reported as a potential problem loan at June 30, 2017. Non-accrual energy loans included four credit relationships in excess of $5 million totaling $52.1 million at December 31, 2016. Of this amount, we charged-off a total of $10.0 million related to two credit relationships during the first and second quarters of 2017. The outstanding balance of these two credit relationships was $20.5 million at December 31, 2016. Subsequent to the charge-off, the remaining balance of one of these credit relationships was paid-off. The outstanding balance of the other credit relationship totaled $4.9 million at
60
December 31, 2017 and is included in non-accrual energy loans in the table above. Non-accrual energy loans included one credit relationship in excess of $5 million totaling $12.5 million at December 31, 2015. We did not have any significant energy loans on non-accrual status during the reported periods prior to 2015. The increasing trend in non-accrual energy loans since 2015 is related to disruption within the energy industry resulting from oil price volatility in recent years, as more fully discussed in the section captioned “Allowance for Loan Losses” below.
Non-accrual real estate loans primarily consist of land development, 1-4 family residential construction credit relationships and loans secured by office buildings and religious facilities. There were no non-accrual commercial real estate loan credit relationships in excess of $5 million at December 31, 2017 or December 31, 2016 while there was one such credit relationship totaling $22.6 million at December 31, 2015, one such credit relationship totaling $5.6 million at December 31, 2014 and one such credit relationship totaling $7.3 million at December 31, 2013. One credit relationship totaling $5.6 million at December 31, 2014 and $7.9 million at December 31, 2013 was included in both non-accrual commercial and industrial loans ($2.7 million at December 31, 2014 and $4.7 million at December 31, 2013) and non-accrual commercial real estate loans ($2.9 million at December 31, 2014 and $3.2 million at December 31, 2013).
Generally, loans are placed on non-accrual status if principal or interest payments become 90 days past due and/or management deems the collectibility of the principal and/or interest to be in question, as well as when required by regulatory requirements. Once interest accruals are discontinued, accrued but uncollected interest is charged to current year operations. Subsequent receipts on non-accrual loans are recorded as a reduction of principal, and interest income is recorded only after principal recovery is reasonably assured. Classification of a loan as non-accrual does not preclude the ultimate collection of loan principal or interest.
Foreclosed assets represent property acquired as the result of borrower defaults on loans. Foreclosed assets are recorded at estimated fair value, less estimated selling costs, at the time of foreclosure. Write-downs occurring at foreclosure are charged against the allowance for loan losses. Regulatory guidelines require us to reevaluate the fair value of foreclosed assets on at least an annual basis. Our policy is to comply with the regulatory guidelines. Write-downs are provided for subsequent declines in value and are included in other non-interest expense along with other expenses related to maintaining the properties. Write-downs of foreclosed assets totaled $16 thousand, $217 thousand and $36 thousand during 2017, 2016 and 2015 respectively. There were no significant concentrations of any properties, to which the aforementioned write-downs relate, in any single geographic region.
Accruing past due loans at December 31, 2017 increased $27.5 million compared to December 31, 2016. The increase was primarily due to increases in past due energy and commercial real estate loans (up $14.4 million and $11.2 million, respectively). Accruing past due loans at December 31, 2016 increased $12.7 million compared to December 31, 2015. The increase was primarily due to an increase in past due commercial and industrial loans (up $28.3 million), past due construction loans (up $4.3 million) and past due consumer loans (up $3.3 million) partly offset by a decrease in past due energy loans (down $23.9 million).
Potential problem loans consist of loans that are performing in accordance with contractual terms but for which management has concerns about the ability of an obligor to continue to comply with repayment terms because of the obligor’s potential operating or financial difficulties. Management monitors these loans closely and reviews their performance on a regular basis. At December 31, 2017 and 2016, we had $61.4 million and $62.7 million in loans of this type which are not included in any one of the non-accrual, restructured or 90 days past due loan categories. At December 31, 2017, potential problem loans consisted of seven credit relationships. Of the total outstanding balance at December 31, 2017, was 37.7% related to the energy industry, 35.2 % was related to the manufacturing industry and 14.3% was related to the restaurant industry. Weakness in these organizations’ operating performance, financial condition and borrowing base deficits for certain energy credits, among other factors, have caused us to heighten the attention given to these credits. As such, all of the loans identified as potential problem loans at December 31, 2017 were graded as “substandard - accrual” (risk grade 11). Potential problem loans impact the allocation of our allowance for loan losses as a result of our risk grade based allocation methodology. See Note 3 - Loans in the accompanying consolidated financial statements for details regarding our allowance allocation methodology.
61
Allowance For Loan Losses
The allowance for loan losses is a reserve established through a provision for loan losses charged to expense, which represents management’s best estimate of inherent losses that have been incurred within the existing portfolio of loans. The allowance, in the judgment of management, is necessary to reserve for estimated loan losses and risks inherent in the loan portfolio. Our allowance for loan loss methodology includes allowance allocations calculated in accordance with ASC Topic 310, “Receivables” and allowance allocations calculated in accordance with ASC Topic 450, “Contingencies.” Accordingly, the methodology is based on historical loss experience by type of credit and internal risk grade, specific homogeneous risk pools and specific loss allocations, with adjustments for current events and conditions. Our process for determining the appropriate level of the allowance for loan losses is designed to account for credit deterioration as it occurs. The provision for loan losses reflects loan quality trends, including the levels of and trends related to non-accrual loans, past due loans, potential problem loans, classified and criticized loans and net charge-offs or recoveries, among other factors. The provision for loan losses also reflects the totality of actions taken on all loans for a particular period. In other words, the amount of the provision reflects not only the necessary increases in the allowance for loan losses related to newly identified criticized loans, but it also reflects actions taken related to other loans including, among other things, any necessary increases or decreases in required allowances for specific loans or loan pools. See Note 3 - Loans in the accompanying notes to consolidated financial statements included elsewhere in this report for further details regarding our methodology for estimating the appropriate level of the allowance for loan losses.
The table below provides an allocation of the year-end allowance for loan losses by loan type; however, allocation of a portion of the allowance to one category of loans does not preclude its availability to absorb losses in other categories. Certain general valuation allowances were not allocated to specific loan portfolio segments and were included in unallocated allowances in years prior to 2014. See Note 3 - Loans for details of amounts allocated to specific portfolio segments.
2017 | 2016 | 2015 | 2014 | 2013 | ||||||||||||||||||||||||||||||
Allowance for Loan Losses | Percentage of Loans in each Category to Total Loans | Allowance for Loan Losses | Percentage of Loans in each Category to Total Loans | Allowance for Loan Losses | Percentage of Loans in each Category to Total Loans | Allowance for Loan Losses | Percentage of Loans in each Category to Total Loans | Allowance for Loan Losses | Percentage of Loans in each Category to Total Loans | |||||||||||||||||||||||||
Commercial and industrial | $ | 59,614 | 36.4 | % | $ | 52,915 | 36.3 | % | $ | 42,993 | 35.9 | % | $ | 44,273 | 36.9 | % | $ | 46,700 | 39.6 | % | ||||||||||||||
Energy | 51,528 | 11.4 | 60,653 | 11.6 | 54,696 | 15.3 | 14,919 | 16.1 | 6,090 | 11.7 | ||||||||||||||||||||||||
Commercial real estate | 30,948 | 40.2 | 30,213 | 40.4 | 24,313 | 37.4 | 27,163 | 35.7 | 22,590 | 36.4 | ||||||||||||||||||||||||
Consumer real estate | 5,657 | 7.8 | 4,238 | 7.8 | 4,659 | 7.6 | 5,178 | 7.7 | 5,230 | 8.5 | ||||||||||||||||||||||||
Consumer and other | 7,617 | 4.2 | 5,026 | 3.9 | 9,198 | 3.8 | 8,009 | 3.6 | 5,010 | 3.8 | ||||||||||||||||||||||||
Unallocated | — | — | — | — | — | — | — | — | 6,818 | — | ||||||||||||||||||||||||
Total | $ | 155,364 | 100.0 | % | $ | 153,045 | 100.0 | % | $ | 135,859 | 100.0 | % | $ | 99,542 | 100.0 | % | $ | 92,438 | 100.0 | % | ||||||||||||||
Allocation of the Allowance for Loan Losses at December 31, 2017 vs. December 31, 2016
The reserve allocated to commercial and industrial loans at December 31, 2017 increased $6.7 million compared to December 31, 2016. The increase was due to increases in macroeconomic valuation allowances, general valuation allowances and specific valuation allowances partly offset by a decrease in historical valuation allowances. Macroeconomic valuation allowances for commercial and industrial loans increased $9.0 million from $7.5 million at December 31, 2016 to $16.5 million at December 31, 2017. The increase was primarily related to an increase in the general macroeconomic allocation (up $9.6 million) partly offset by a decrease in the environmental risk adjustment (down $916 thousand). The general macroeconomic risk allocation at December 31, 2017 was impacted by the increasing trends in classified commercial and industrial loans, as well as the weighted-average risk grade and charge-offs related to commercial and industrial loans. General valuation allowances for commercial and industrial loans increased $2.4 million from $6.7 million at December 31, 2016 to $9.1 million at December 31, 2017. The increase was primarily related to increases in the allocations for highly leveraged credit relationships (up $2.8 million), large credit relationships (up $582 thousand) and loans not reviewed by concurrence (up $356 thousand) combined with a
62
decrease in the adjustment for recoveries (down $485 thousand). These items were partly offset by a decrease in the allocation for excessive industry concentrations (down $2.0 million). The increase in the allocation for highly leveraged transactions was partly related to a change in the criteria for determining whether a loan is considered to be highly leveraged. Specific valuation allowances increased $2.1 million from $5.4 million at December 31, 2016 to $7.6 million at December 31, 2017. Of the total specific valuations allowances at December 31, 2017, $5.9 million related to one credit relationship totaling $12.9 million. Charge-offs in 2017 included $5.7 million related to six credit relationships that, as of December 31, 2016, had associated specific valuation allowances totaling $4.4 million. Charge-offs in 2017 also included $10.4 million related to two credit relationships for which we had no specific allocation as of December 31, 2016, or at the time of charge-off. Historical valuation allowances decreased $6.9 million from $33.3 million at December 31, 2016 to $26.4 million at December 31, 2017. The decrease was primarily related to decreases in the historical loss allocation factors for non-classified loans graded as “watch” (risk grade 9) and “special mention” (risk grade 10) and classified commercial and industrial loans partly offset by increases in the volume of certain categories of both non-classified and classified loans. Classified loans consist of loans having a risk grade of 11, 12 or 13. Classified commercial and industrial loans totaled $144.0 million at December 31, 2017 compared to $131.9 million at December 31, 2016. The weighted-average risk grade of commercial and industrial loans was 6.41 at December 31, 2017 compared to 6.35 at December 31, 2016. Commercial and industrial loan net charge-offs totaled $17.5 million during 2017 compared to $12.3 million during 2016.
The reserve allocated to energy loans at December 31, 2017 decreased $9.1 million compared to December 31, 2016. As a result, reserves allocated to energy loans as a percentage of total energy loans totaled 3.44% at December 31, 2017 compared to 4.38% at December 31, 2016. This decrease was primarily related to decreases in historical valuation allowances and macroeconomic valuation allowances partly offset by increases in specific valuation allowances and general valuation allowances. Historical valuation allowances decreased $12.6 million from $34.6 million at December 31, 2016 to $22.1 million at December 31, 2017. The decrease was primarily related to decreases in the volume of classified energy loans and higher risk categories of non-classified energy loans partly offset by increases in the historical loss allocation factors for both non-classified and classified energy loans. Classified energy loans totaled $185.2 million at December 31, 2017 compared to $302.0 million at December 31, 2016, decreasing $116.8 million. Non-classified energy loans graded as “watch” and “special mention” (risk grades 9 and 10) totaled $114.7 million at December 31, 2017 compared to $229.4 million at December 31, 2016, decreasing $114.7 million while "pass" grade energy loans increased $344.5 million from $854.7 million at December 31, 2016 to $1.2 billion at December 31, 2017. As a result of these changes, the weighted-average risk grade of energy loans decreased to 6.97 at December 31, 2017 compared to 7.95 at December 31, 2016. Macroeconomic valuation allowances related to energy loans decreased $10.3 million from $18.5 million at December 31, 2016 to $8.2 million at December 31, 2017, in part due to improving trends in the weighted-average risk grade of the energy loan portfolio and decreased oil price volatility. The price per barrel of crude oil was approximately $54 at December 31, 2016 and $60 at December 31, 2017. Specific valuation allowances for energy loans increased $9.5 million from $3.8 million at December 31, 2016 to $13.3 million at December 31, 2017. Specific valuation allowances at December 31, 2017 were related to two credit relationships totaling $61.2 million while specific valuation allowances at December 31, 2016 were related to three credit relationships totaling $29.8 million. Energy loan net charge-offs totaled $10.0 million during 2017 compared to net charge-offs of $18.6 million during 2016. The charge-offs in 2017 included $10.0 million related to two credit relationships that, as of December 31, 2016, had associated specific valuation allowances totaling $3.4 million. The charge-offs in 2016 were primarily related to three large credit relationships for which, at the time we recognized the charged-offs, we had associated specific valuation allowances totaling $27.5 million. General valuation allowances increased $4.2 million during 2017 compared to 2016 primarily due to an increase in the allocation for highly leveraged transactions (up $3.3 million) and excessive industry concentrations (up $1.0 million) partly offset by an increase in the adjustment for recoveries (up $530 thousand). The increase in the allocation for highly leveraged transactions was partly related to a change in the criteria for determining whether a loan is considered to be highly leveraged.
The reserve allocated to commercial real estate loans at December 31, 2017 increased $735 thousand compared to December 31, 2016. The increase was primarily related to an increase in historical valuation allowances partly offset by decreases in general valuation allowances and macroeconomic valuation allowances. Historical valuation allowances increased $2.0 million primarily due to an increase in the volume of non-classified commercial real estate loans. Non-classified commercial real estate loans increased $451.5 million from December 31, 2016 to December 31, 2017 primarily due to an increase in commercial real estate loans graded as “pass.” Classified commercial real estate loans decreased $478 thousand from $76.3 million at December 31, 2016 to $75.8 million at December 31, 2017. The weighted-average risk grade of commercial real estate loans was 7.05 at December 31, 2017 compared to 6.96 at December 31, 2016. Macroeconomic valuation allowances decreased $381 thousand from $8.2 million at December 31,
63
2016 to $7.9 million at December 31, 2017. The decrease was primarily related to decreases in the general macroeconomic allocation (down $814 thousand) and the distressed industries allocation (down $156 thousand) partly offset by an increase in the environmental risk adjustment (up $589 thousand).
The reserve allocated to consumer real estate loans at December 31, 2017 increased $1.4 million compared to December 31, 2016. This increase was mostly due to a $627 thousand increase in general valuation allowances, which was primarily related to an increase in allowances allocated for loans not reviewed by concurrence and a decrease in the reduction for recoveries, and a $544 thousand increase in macroeconomic valuation allowances.
The reserve allocated to consumer and other loans at December 31, 2017 increased $2.6 million compared to December 31, 2016. The increase was primarily related to increases in macroeconomic valuation allowances (up $1.5 million) and historical valuation allowances (up $1.0 million). The increase in macroeconomic valuation allowances was related to a $1.4 million increase in the general macroeconomic allocation, which was primarily related to growth in unsecured personal lines of credit. The increase in historical valuation allowances was primarily due to an increase in the volume of non-classified consumer and other loans.
Allocation of the Allowance for Loan Losses at December 31, 2016 vs. December 31, 2015
The reserve allocated to commercial and industrial loans at December 31, 2016 increased $9.9 million compared to December 31, 2015. The increase was due to an increase in historical and specific valuation allowances partly offset by decreases in general valuation allowances and macroeconomic valuation allowances. Historical valuation allowances increased $7.8 million from $25.4 million at December 31, 2015 to $33.3 million at December 31, 2016. The increase was primarily related to increases in the volume of classified loans graded as "substandard - accrual" (risk grade 11) and non-classified loans graded as “watch” (risk grade 9) and “special mention” (risk grade 10) combined with an increase in the historical loss allocation factor applied to non-classified commercial and industrial loans graded as “watch.” Classified commercial and industrial loans totaled $131.9 million at December 31, 2016 compared to $74.6 million at December 31, 2015. The weighted-average risk grade of commercial and industrial loans was 6.35 at December 31, 2016 compared to 6.13 at December 31, 2015. Commercial and industrial loan net charge-offs totaled $12.3 million during 2016 compared to $6.5 million during 2015. Specific valuation allowances increased $3.1 million from $2.4 million at December 31, 2015 to $5.4 million at December 31, 2016. General valuation allowances for commercial and industrial loans decreased $631 thousand from $7.3 million at December 31, 2015 to $6.7 million at December 31, 2016. The decrease was primarily related to an increase in the adjustment for recoveries (up $343 thousand) and decreases in allocations for loans not reviewed by concurrence (down $310 thousand), policy exceptions (down $220 thousand), highly leveraged credit relationships (down $213 thousand) and large credit relationships (down $168 thousand) partly offset by an increase in allocations for excessive industry concentrations (up $623 thousand). The increase in allocations for excessive industry concentration was due to increased risk concentrations related to credits within the nursing/assisted living, chemicals and financial services industries offset by decreased risk concentrations within the food manufacturing and contractors industries and within our shared national credits. Macroeconomic valuation allowances for commercial and industrial loans decreased $328 thousand from $7.8 million at December 31, 2015 to $7.5 million at December 31, 2016. The decrease was primarily related to a decrease in the distressed industries allocation (down $1.2 million) partly offset by an increase in the environmental risk adjustment (up $856 thousand). The decrease in the distressed industries allocation was primarily related to improvements in the weighted-average risk grades of certain segments of the contractors industry relative to the weighted-average risk grade for all pass-grade loans within the overall loan portfolio segment. The increase in the environmental risk adjustment was primarily related to the aforementioned increase in the base historical valuation allowances to which the environmental risk adjustment factor is applied.
The reserve allocated to energy loans at December 31, 2016 increased $6.0 million compared to December 31, 2015. As a result, reserves allocated to energy loans as a percentage of total energy loans totaled 4.38% at December 31, 2016 compared to 3.11% at December 31, 2015. This increase was primarily related to increases in historical valuation allowances and specific valuation allowances partly offset by decreases in macroeconomic valuation allowances and general valuation allowances. Historical valuation allowances increased $13.4 million from $21.2 million at December 31, 2015 to $34.6 million at December 31, 2016. The increase in historical valuation allowances was partly due to increases in the volume of classified energy loans, particularly those graded as “substandard - accrual” (risk grade 11), and non-classified energy loans graded as “special mention” (risk grade 10). These increases were partly offset by the impact of decreases in the volume of non-classified energy loans graded as “pass” and “watch” and decreases in the historical loss allocation factor applied to non-classified energy loans graded as “pass” and “special mention” and classified energy loans graded as “substandard” (risk grades 11 and 12). Classified energy loans totaled
64
$302.0 million at December 31, 2016 compared to $98.0 million at December 31, 2015. Non-classified energy loans graded as “watch” and “special mention” (risk grades 9 and 10) totaled $229.4 million at December 31, 2016 compared to $274.4 million at December 31, 2015, decreasing $45.0 million while "pass" grade energy loans decreased $531.1 million from $1.4 billion at December 31, 2015 to $854.7 million at December 31, 2016. The overall decrease in non-classified energy loans reflects the migration of energy loans into higher risk grade categories as well as an overall decrease in the size of our energy loan portfolio, particularly within the production and service sectors of the energy industry. The weighted-average risk grade of energy loans was 7.95 at December 31, 2016 compared to 6.89 at December 31, 2015. This upward migration in the weighted-average risk grade for energy loans was influenced by regulatory guidance related to energy loan classifications. Specific valuation allowances for energy loans increased $1.8 million from $2.0 million at December 31, 2015 to $3.8 million at December 31, 2016. At such dates, the majority of the specific valuation allowances were related to the same credit relationship which had an outstanding balance of $12.5 million at December 31, 2015 and $7.2 million at December 31, 2016, with the decrease mostly resulting from a partial charge-off. Energy loan net charge-offs totaled $18.6 million during 2016 compared to $6.0 million during 2015. The charge-offs in 2016 were primarily related to three large credit relationships for which, at the time we recognized the charged-offs, had associated specific valuation allowances totaling $27.5 million. Macroeconomic valuation allowances related to energy loans totaled $18.5 million at December 31, 2016 compared to $26.0 million at December 31, 2015. As further discussed below, during 2015, as a result of a sensitivity stress test, we recognized an additional $22.0 million provision for loan losses to allocate additional reserves for the added inherent risk resulting from continued oil price volatility and the ongoing downturn in the energy industry. The price per barrel of crude oil was approximately $37 at December 31, 2015, decreasing sharply to a low-point of approximately $26 in February 2016 and rebounding to approximately $54 at December 31, 2016. The decrease in the reserve allocated for general macroeconomic risk resulted as oil prices have rebounded and the level of volatility has decreased. General valuation allowances decreased $1.8 million during 2016 compared to 2015 primarily due to a decrease in allocations for excessive industry concentrations (down $1.1 million), due to decreased risk concentrations related to energy service, energy equipment manufacturing and energy production credits, and, to a lesser extent, decreases in allocations for large credit relationships (down $236 thousand) and highly leveraged credit relationships (down $180 thousand).
The reserve allocated to commercial real estate loans at December 31, 2016 increased $5.9 million compared to December 31, 2015. The increase was primarily related to an increase in macroeconomic valuation allowances and, to a lesser extent, increases in historical and general valuation allowances. Macroeconomic valuation allowances increased $4.1 million from $4.2 million at December 31, 2015 to $8.2 million at December 31, 2016. The increase was primarily related to current economic trends impacting our Houston market area as on-going weakness in the energy sector has impacted the market's commercial real estate sector resulting in decreased construction, more rent concessions and higher vacancy rates. Historical valuation allowances increased $1.4 million primarily due to increases in the volume of non-classified commercial real estate loans and classified commercial real estate loans graded as “substandard - accrual” (risk grade 11), partly offset by decreases in the historical loss allocation factors for all grades of commercial real estate loans. Non-classified commercial real estate loans increased $553.2 million from December 31, 2015 to December 31, 2016 primarily due to an increase in commercial real estate loans graded as “pass.” Classified commercial real estate loans decreased $10.5 million from $86.8 million at December 31, 2015 to $76.3 million at December 31, 2016 as a $26.5 million decrease in commercial real estate loans classified as “substandard - non-accrual” (risk grade 12) was partly offset by a $16.1 million increase in commercial real estate loans classified as “substandard - accrual” (risk grade 11). The weighted-average risk grade of commercial real estate loans was 6.96 at December 31, 2016 compared to 6.88 at December 31, 2015. General valuation allowances increased $385 thousand during 2016 compared to 2015 primarily due to an increase in the allocation for highly leveraged credit relationships (up $1.3 million), primarily due to an increase in the volume of such credit relationships, partly offset by decreases in allocations for loans not reviewed by concurrence (down $578 thousand), policy exceptions (down $177 thousand) and excessive concentrations (down $152 thousand), among other things. There were no specific valuation allowances related to commercial real estate loans at December 31, 2016 or 2015.
The reserve allocated to consumer real estate loans at December 31, 2016 decreased $421 thousand compared to December 31, 2015. This decrease was mostly due to a decrease in general valuation allowances allocated for loans not reviewed by concurrence (down $475 thousand) and an increase in the reduction for recoveries (up $71 thousand) partly offset by an increase in historical valuation allowances (up $116 thousand).
The reserve allocated to consumer and other loans at December 31, 2016 decreased $4.2 million compared to December 31, 2015. The decrease was primarily related to decreases in historical valuation allowances (down $8.2 million) and macroeconomic valuation allowances (down $2.7 million) partly offset by an increase in general valuation allowances (up $6.8 million). The decrease in historical valuation allowances was primarily due to a decrease
65
in the historical loss allocation factor applied to consumer and other loans, which was related to a change in the way we estimate valuation allowances for consumer and other loans and, now separately, for overdrafts (See Note 3 - Loans). The decrease in macroeconomic valuation allowances was related to a decrease in the environmental risk adjustment due to a decrease in the environmental risk adjustment factor and decreases in the historical valuation allowances to which the environmental adjustment factor is applied. The increase in general valuation allowances was primarily related to a decrease in the adjustment for recoveries, which was primarily related to the aforementioned change in the way we estimate valuation allowances for consumer and other loans and, now separately, for overdrafts.
Allocation of the Allowance for Loan Losses at December 31, 2015 vs. December 31, 2014
The reserve allocated to commercial and industrial loans at December 31, 2015 decreased $1.3 million compared to December 31, 2014. This decrease was primarily related to decreases in macroeconomic valuation allowances and general valuation allowances related to credit and collateral exceptions and highly leveraged credit relationships partly offset by a decrease in the adjustment for recoveries and increases in general valuation allowances related to excessive industry concentrations and specific valuation allowances. Macroeconomic valuation allowances for commercial and industrial loans totaled $7.8 million at December 31, 2015 compared to $12.1 million at December 31, 2014. The decrease was partly related to a decrease in classified loans (loans having a risk grade of 11, 12 or 13) from $88.9 million at December 31, 2014 to $74.6 million at December 31, 2015 and the continued positive trends in the weighted-average risk grade of commercial and industrial loans and the level of gross charge-offs. The weighted-average risk grade of commercial and industrial loans was 6.13 at December 31, 2015 compared to 6.16 at December 31, 2014 and 6.27 at December 31, 2013. Gross commercial loan charge-offs totaled $11.1 million in 2015 compared to $12.1 million in 2014 and $32.0 million in 2013. The decrease in the macroeconomic valuation allowance was also partly related to a decrease in the distressed industries allocation for commercial and industrial loans (down $640 thousand). The decrease in the distressed industries allocation was primarily related to improvements in the weighted-average risk grades of certain segments of the contractors industry relative to the weighted-average risk grade for all pass-grade loans within the overall loan portfolio segment. In 2015, we began including the impact of credit and collateral exceptions within our loan risk grade matrix and thus as a component of our historical valuation allowances. Prior to 2015, we had separate general valuation allowance allocations for credit and collateral exceptions. Allocations for credit and collateral exceptions totaled $1.2 million at December 31, 2014. General valuation allowances related to highly leveraged credit relationships decreased $978 thousand during 2015 compared to 2014 primarily due to a decrease in the volume of such credit relationships. The adjustment for recoveries decreased $2.4 million during 2015 compared to 2014 primarily due to the lower level of adjusted recoveries experienced in 2015 relative to 2014. General valuation allowances related to excessive industry concentrations increased $2.1 million during 2015 compared to 2014 primarily due to increased risk concentrations related to credits within the food manufacturing, lodging, financial services and chemicals industries as well as increased risk concentrations within shared national credits. Specific valuation allowances for commercial and industrial loans increased $765 thousand during 2015 compared to 2014.
The reserve allocated to energy loans at December 31, 2015 increased $39.8 million compared to December 31, 2014. This increase was primarily related to increases in macroeconomic valuation allowances, historical valuation allowances, general valuation allowances related to excessive industry concentrations and specific valuation allowances. Macroeconomic valuation allowances related to energy loans totaled $26.0 million at December 31, 2015 compared to $5.5 million at December 31, 2014. The increase in macroeconomic valuation allowances was reflective of continued oil price volatility and the ongoing downturn in the energy industry. The price per barrel of crude oil was approximately $53 as of December 31, 2014 decreasing to approximately $37 as of December 31, 2015. The impact of this decline was reflected in the upward migration of the weighted average risk-grade of our energy loan portfolio to 6.89 at December 31, 2015 from 5.45 at December 31, 2014. We performed a sensitivity stress test on individual loans within our energy loan portfolio as of December 31, 2015. In connection with this analysis, we assumed a reduction of oil prices to $28.13, or 75% of the 2016 oil price deck of $37.50. We also assessed the financial strength of individual borrowers, the quality of collateral, the relative experience of the individual borrowers and their ability to withstand an economic downturn. This review encompassed approximately 83% of our outstanding energy loans, including approximately 90% of production-related loans. As a result of our analysis, we recognized an additional $22.0 million provision for loan losses during the fourth quarter of 2015 to allocate additional reserves for the added inherent risk within our energy loan portfolio resulting from the continued oil price volatility and the ongoing downturn in the energy industry. Macroeconomic valuation allowances for energy loans were also impacted by the environmental risk adjustment which increased $2.1 million during 2015 compared to 2014. Historical valuation allowances increased $14.0 million. The increase in historical valuation allowances was due to an increase in the volume of classified energy loans, particularly those graded as “substandard - accrual” (risk grade 11) and an increase in the volume of non-classified energy loans graded as “watch” (risk grade 9) and “special mention” (risk grade 10). Classified energy loans (loans
66
having a risk grade of 11, 12 or 13) totaled $98.0 million at December 31, 2015 compared to $6.0 million at December 31, 2014. Non-classified energy loans graded as “watch” and “special mention” (risk grades 9 and 10) totaled $274.4 million at December 31, 2015 compared to $27.5 million at December 31, 2014. Historical valuation allowances were also partly impacted by the aforementioned change in our allocation methodology related to credit and collateral exceptions. As discussed above, general valuation allowances related to credit and collateral exceptions are now captured within our loan risk grade matrix and are a component of our historical valuation allowances. The impact of the aforementioned volume increases and methodology change in 2015 was partly offset by decreases in the historical loss allocation factors applied to certain categories of non-classified and classified energy loans. The reserve allocated for excessive industry concentrations increased $2.1 million during 2015 compared to 2014 primarily due to increased risk concentrations related to energy service, energy production and energy equipment manufacturing credits. Specific valuation allowances for energy loans totaled $2.0 million at December 31, 2015 while there were no specific valuation allowances for energy loans at December 31, 2014.
The reserve allocated to commercial real estate loans at December 31, 2015 decreased $2.9 million compared to December 31, 2014. The decrease was primarily related to decreases in macroeconomic valuation allowances and general valuation allowances related to credit and collateral exceptions and highly leveraged credit relationships partly offset by a decrease in the adjustment for recoveries combined with increases in historical valuation allowances and general valuation allowances related to large credit relationships. Macroeconomic valuation allowances for commercial real estate loans totaled $4.2 million at December 31, 2015 compared to $7.1 million at December 31, 2014. Despite increases in classified commercial real estate loans and the weighted-average risk grade of commercial real estate loans, the decrease in macroeconomic valuation allowances for commercial real estate loans primarily reflected the relatively low level of net charge-offs experienced in recent years. We had net recoveries related to commercial real estate loans totaling $332 thousand in 2015 compared to net charge-offs of $2.0 million in 2014 and $125 thousand in 2013. As mentioned above, in 2015 we began including the impact of credit and collateral exceptions within our loan risk grade matrix and thus as a component of our historical valuation allowances. Prior to 2015, we had separate general valuation allowance allocations for credit and collateral exceptions. Allocations for credit and collateral exceptions totaled$681 thousand at December 31, 2014. General valuation allowances related to highly leveraged credit relationships decreased $594 thousand during 2015 compared to 2014 primarily due to a decrease in the volume of such credit relationships. The adjustment for recoveries decreased $811 thousand during 2015 compared to 2014 primarily due to the lower level of recoveries experienced in 2015 relative to 2014. Historical valuation allowances increased $860 thousand from $14.7 million at December 31, 2014 to $15.5 million at December 31, 2015. The increase in historical valuation allowances was due to an increase in the volume of non-classified commercial real estate loans particularly those graded as “pass” and “watch” (risk grade 9) and, to a lesser extent, classified commercial real estate loans. Non-classified commercial real estate loans increased $355.9 million from December 31, 2014 to December 31, 2015. This increase included a $296.7 million increase in commercial real estate loans graded as “pass” and a $73.1 million increase in commercial real estate loans graded as “watch” (risk grade 9) partly offset by a $13.9 million decrease in commercial real estate loans graded as “special mention” (risk grade 10). Classified commercial real estate loans (loans having a risk grade of 11, 12 or 13) increased $20.9 million from $65.8 million at December 31, 2014 to $86.8 million at December 31, 2015. The weighted-average risk grade of commercial real estate loans was 6.88 at December 31, 2015 compared to 6.79 at December 31, 2014. Historical valuation allowances were also partly impacted by a change in our allocation methodology related to credit and collateral exceptions, as discussed above. General valuation allowances related to large credit relationships increased $206 thousand during 2015 compared to 2014 primarily due to increases in the volumes of such credit relationships.
The reserve allocated to consumer real estate loans at December 31, 2015 decreased $519 thousand compared to December 31, 2014. This decrease was primarily due to a decrease in the macroeconomic valuation allowances combined with an increase in the adjustment for recoveries partly offset by increases in general valuation allowances for loans not reviewed by concurrence and historical valuation allowances.
The reserve allocated to consumer and other loans at December 31, 2015 increased $1.2 million compared to December 31, 2014. The increase was primarily related to an increase in the historical valuation allowances due to an increase in the historical loss allocation factor applied to consumer and other loans and an increase in the volume of such loans. This increase was partly offset by an increase in the adjustment for recoveries combined with a decrease in macroeconomic valuation allowances.
67
Allocation of the Allowance for Loan Losses at December 31, 2014 vs. December 31, 2013
The reserve allocated to commercial and industrial loans at December 31, 2014 decreased $2.4 million compared to December 31, 2013. At December 31, 2014, the reserve allocated to commercial and industrial loans included general valuation allowances related to policy exceptions ($1.5 million) and credit and collateral exceptions ($1.2 million) and certain macroeconomic valuation allowances ($3.9 million) which were previously reported as components of unallocated reserves at December 31, 2013. Excluding the effect of these items, the reserve allocated to commercial and industrial loans at December 31, 2014 decreased $8.9 million compared to December 31, 2013. This decrease was primarily related to decreases in macroeconomic valuation allowances related to distressed industries, allocations for specific loans and general valuation allowances related to highly leveraged credit relationships and an increase in the adjustment for recoveries. The macroeconomic valuation allowance related to distressed industries within our commercial and industrial loan portfolio segment decreased $4.7 million from $7.8 million at December 31, 2013 to $3.1 million at December 31, 2014. The decrease was primarily related to improvements in the weighted-average risk grades of certain segments of the contractors industry to a level below that of the weighted-average risk grade for all pass-grade loans within the overall loan portfolio segment. As a result, additional distressed industry allocations were no longer necessary for these segments of the contractors industry. Allocations for specific loans decreased $2.5 million from $4.1 million at December 31, 2013 to $1.6 million at December 31, 2014. General valuation allowances related to highly leveraged credit relationships decreased $1.0 million during 2014 compared to 2013 due to a decrease in the volume of such credit relationships. The adjustment for recoveries increased $2.1 million during 2014 compared to 2013 primarily due to the higher level of recoveries.
The reserve allocated to energy loans at December 31, 2014 increased $8.8 million compared to December 31, 2013. At December 31, 2014, the reserve allocated to energy loans included general valuation allowances related to policy exceptions ($410 thousand) and credit and collateral exceptions ($319 thousand) and certain macroeconomic valuation allowances ($3.9 million) which were previously reported as components of unallocated reserves at December 31, 2013. Excluding the effect of these items, the reserve allocated to energy loans at December 31, 2014 increased $4.2 million compared to December 31, 2013. This increase was primarily related to increases in historical valuation allowances, macroeconomic valuation allowances related to the environmental risk adjustment and general valuation allowances related to highly leveraged credit relationships partly offset by an increase in the adjustment for recoveries. Historical valuation allowances increased $3.0 million from $4.1 million at December 31, 2013 to $7.2 million at December 31, 2014. The increase in historical valuation allowances was primarily due to an increase in the volume of non-classified energy loans and increases in the historical loss allocation factors applied to certain categories of non-classified and classified energy loans. Macroeconomic valuation allowances related to the environmental risk adjustment increased $560 thousand during 2014 compared to 2013. General valuation allowances related to highly leveraged credit relationships increased $449 thousand during 2014 compared to 2013 due to an increase the in the volume of such credit relationships. The adjustment for recoveries increased $499 thousand during 2014 compared to 2013 primarily due to the higher level of recoveries.
The reserve allocated to commercial real estate loans at December 31, 2014 increased $4.6 million compared to December 31, 2013. At December 31, 2014, the reserve allocated to commercial real estate loans included general valuation allowances related to policy exceptions ($875 thousand) and credit and collateral exceptions ($681 thousand) and certain macroeconomic valuation allowances ($3.5 million) which were previously reported as components of unallocated reserves at December 31, 2013. Excluding the effect of these items, the reserve allocated to commercial real estate loans at December 31, 2014 decreased $521 thousand compared to December 31, 2013. This decrease was primarily related to a decrease in allocations for specific loans, an increase in the adjustment for recoveries and a decrease in macroeconomic valuation allowances related to distressed industries mostly offset by increases in historical valuation allowances and general valuation allowances related to highly leveraged credit relationships and large credit relationships. Allocations for specific loans decreased $2.7 million from $2.8 million at December 31, 2013 to $67 thousand at December 31, 2014. The adjustment for recoveries increased $596 thousand during 2014 compared to 2013 primarily due to the higher level of recoveries. Macroeconomic valuation allowances related to distressed industries within our commercial real estate loan portfolio segment decreased $381 thousand. As mentioned above, the decrease was primarily related to improvements in the weighted-average risk grades of certain segments of the contractors industry. Historical valuation allowances increased $1.6 million from $13.0 million at December 31, 2013 to $14.6 million at December 31, 2014 primarily due to an increase in the volume of pass grade commercial real estate loans. General valuation allowances related to highly leveraged credit relationships and large credit relationships increased $728 thousand and $478 thousand, respectively, during 2014 compared to 2013 primarily due to increases in the volumes of such credit relationships.
68
The reserve allocated to consumer real estate loans at December 31, 2014 decreased $52 thousand compared to December 31, 2013. At December 31, 2014, the reserve allocated to consumer real estate loans included certain macroeconomic valuation allowances ($715 thousand) which were previously reported as a component of unallocated reserves at December 31, 2013. Excluding the effect of these allocations, the reserve allocated to consumer real estate loans at December 31, 2014 decreased $767 thousand compared to December 31, 2013. This decrease was primarily due to a decrease in historical valuation allowances which decreased $627 thousand from $2.6 million at December 31, 2013 to $2.0 million at December 31, 2014.
The reserve allocated to consumer and other loans at December 31, 2014 increased $3.0 million compared to December 31, 2013. At December 31, 2014, the reserve allocated to consumer and other loans included certain macroeconomic valuation allowances ($1.1 million) which were previously reported as a component of unallocated reserves at December 31, 2013. Excluding the effect of these allocations, the reserve allocated to consumer and other loans at December 31, 2014 increased $1.9 million compared to December 31, 2013. The increase was primarily related to an increase in the historical valuation allowances due to an increase in the historical loss allocation factor applied to consumer and other loans.
There was no unallocated portion of the allowance for loan losses at December 31, 2014. At December 31, 2013, the unallocated portion of the allowance for loan losses totaled $6.8 million. As discussed above, as of December 31, 2014, general valuation allowances related to loans originated with policy, credit and/or collateral exceptions that exceed specified risk grades and certain macroeconomic valuation allowances were allocated to specific loan portfolio segments, rather than left unallocated. The aggregate general valuation allowance allocated to specific loan portfolio segments related to policy exceptions totaled $2.8 million at December 31, 2014 compared to $2.5 million in general valuation allowances related to policy exceptions reported as a part of the unallocated portion of the allowance for loan losses at December 31, 2013. The aggregate general valuation allowance allocated to specific loan portfolio segments for credit and collateral exceptions totaled $2.2 million at December 31, 2014 compared to $1.4 million in general valuation allowances for credit and collateral exceptions reported as a part of the unallocated portion of the allowance for loan losses at December 31, 2013. The aggregate amount of certain macroeconomic valuation allowances allocated to specific loan portfolio segments totaled $13.1 million at December 31, 2014 compared to $2.9 million in such valuation allowances reported as a part of the unallocated portion of the allowance for loan losses at December 31, 2013. The overall increase in macroeconomic valuation allowances in 2014 compared to 2013 was reflective of loan growth that was occurring in a positively trending but uncertain economic environment as reflected in the prevailing market volatility and decreasing oil prices. We had also experienced an increase in past due loans, though the overall combined level of classified commercial and industrial, energy and commercial real estate loans had decreased $40.1 million since December 31, 2013 while the weighted-average risk grade of these portfolios was 6.29% at December 31, 2014 compared to 6.40% at December 31, 2013.
69
Activity in the allowance for loan losses is presented in the following table.
2017 | 2016 | 2015 | 2014 | 2013 | |||||||||||||||
Balance of allowance for loan losses at beginning of year | $ | 153,045 | $ | 135,859 | $ | 99,542 | $ | 92,438 | $ | 104,453 | |||||||||
Provision for loan losses | 35,460 | 51,673 | 51,845 | 16,314 | 20,582 | ||||||||||||||
Charge-offs: | |||||||||||||||||||
Commercial and industrial | (20,619 | ) | (15,910 | ) | (11,092 | ) | (12,073 | ) | (32,008 | ) | |||||||||
Energy | (10,595 | ) | (18,644 | ) | (6,000 | ) | (1,747 | ) | (924 | ) | |||||||||
Commercial real estate | (86 | ) | (82 | ) | (657 | ) | (3,800 | ) | (1,329 | ) | |||||||||
Consumer real estate | (925 | ) | (814 | ) | (577 | ) | (1,097 | ) | (1,047 | ) | |||||||||
Consumer and other | (15,579 | ) | (12,878 | ) | (11,246 | ) | (9,768 | ) | (9,489 | ) | |||||||||
Total charge-offs | (47,804 | ) | (48,328 | ) | (29,572 | ) | (28,485 | ) | (44,797 | ) | |||||||||
Recoveries: | |||||||||||||||||||
Commercial and industrial | 3,166 | 3,651 | 4,557 | 9,162 | 3,577 | ||||||||||||||
Energy | 586 | 56 | 3 | 510 | 11 | ||||||||||||||
Commercial real estate | 832 | 918 | 989 | 1,800 | 1,204 | ||||||||||||||
Consumer real estate | 419 | 557 | 486 | 364 | 328 | ||||||||||||||
Consumer and other | 9,660 | 8,659 | 8,009 | 7,439 | 7,080 | ||||||||||||||
Total recoveries | 14,663 | 13,841 | 14,044 | 19,275 | 12,200 | ||||||||||||||
Net charge-offs | (33,141 | ) | (34,487 | ) | (15,528 | ) | (9,210 | ) | (32,597 | ) | |||||||||
Balance at end of year | $ | 155,364 | $ | 153,045 | $ | 135,859 | $ | 99,542 | $ | 92,438 | |||||||||
Net loan charge-offs to average loans | 0.27 | % | 0.30 | % | 0.14 | % | 0.09 | % | 0.35 | % | |||||||||
Allowance for loan losses to year-end loans | 1.18 | 1.28 | 1.18 | 0.91 | 0.97 | ||||||||||||||
Allowance for loan losses to year-end non-accrual loans | 103.36 | 152.81 | 162.77 | 166.11 | 162.97 | ||||||||||||||
Average loans | $ | 12,460,148 | $ | 11,554,823 | $ | 11,267,402 | $ | 10,299,025 | $ | 9,229,574 | |||||||||
Year-end loans | 13,145,665 | 11,975,392 | 11,486,531 | 10,987,535 | 9,515,700 | ||||||||||||||
Year-end non-accrual loans | 150,314 | 100,151 | 83,467 | 59,925 | 56,720 | ||||||||||||||
The provision for loan losses decreased $16.2 million, or 31.4%, in 2017 compared to 2016. The level of the provision for loan losses in 2016 was reflective of a significant increase in the volume of classified energy loans, specific valuation allowances taken on certain classified energy loans and increases in the weighted-average risk grades of our energy, commercial and industrial and commercial real estate loan portfolios. Classified energy, commercial and industrial and commercial real estate loans totaled $405.0 million at December 31, 2017 compared to $510.1 million at December 31, 2016. Specific valuation allowances related to energy, commercial and industrial and commercial real estate loans totaled $20.8 million at December 31, 2017 compared to $9.2 million at December 31, 2016. The overall weighted-average risk grade of our energy, commercial and industrial and commercial real estate loan portfolios was 6.77 at December 31, 2017 compared to 6.84 at December 31, 2016. The level of the provision for loan losses during 2017 was mostly reflective of the level of net charge-offs during 2017, which totaled $33.1 million, approximately $25.9 million of which related to eight credit relationships. The level of the provision was also partly influenced by improvement in the Texas Leading Index. The Texas Leading Index totaled 128.7 at December 31, 2017 compared to 123.1 at December 31, 2016. A higher Texas Leading Index value implies more favorable economic conditions. The ratio of the allowance for loan losses to total loans was 1.18% at December 31, 2017 compared to 1.28% at December 31, 2016. Management believes the recorded amount of the allowance for loan losses is appropriate based upon management’s best estimate of probable losses that have been incurred within the existing portfolio of loans. Should any of the factors considered by management in evaluating the appropriate level of the allowance for loan losses change, our estimate of probable loan losses could also change, which could affect the level of future provisions for loan losses.
The provision for loan losses decreased $172.0 thousand, or 0.3%, in 2016 compared to 2015. The provision for loan losses in 2015 included a special $22.0 million provision to allocate additional reserves for the added inherent risk within our energy loan portfolio resulting from oil price volatility and the prevailing economic conditions in the energy industry. The level of the provision for loan losses during 2016 was mostly related to an increase in the volume of classified energy and commercial and industrial loans; deterioration in the Texas Leading Index; a significant increase
70
in net charge-offs, particularly related to energy; higher levels of specific valuation allowances; and increases in the weighted-average risk grades of our energy, commercial and industrial and commercial real estate loan portfolios. Classified energy and commercial and industrial loans totaled $433.8 million at December 31, 2016 compared to $172.7 million at December 31, 2015. The Texas Leading Index totaled 121.9 at November 30, 2016 (most recent date available at the time) compared to 123.0 at December 31, 2015. Net charge-offs during 2016 totaled $34.5 million compared to $15.5 million during 2015, with the majority of this increase related to energy loans. Specific valuation allowances related to energy and commercial and industrial loans totaled $9.2 million at December 31, 2016 compared to $4.4 million at December 31, 2015. The overall weighted-average risk grades of our energy, commercial and industrial and commercial real estate loan portfolios was 6.84 at December 31, 2016 compared to 6.58 at December 31, 2015. The ratio of the allowance for loan losses to total loans was 1.28% at December 31, 2016 compared to 1.18% at December 31, 2015 while the ratio of the allowance for loan losses allocated to energy loans to total energy loans totaled 4.38% at December 31, 2016 compared to 3.11% at December 31, 2015.
The provision for loan losses increased $35.5 million, or 217.8%, in 2015 compared to 2014. The level of the provision for loan losses increased during 2015 primarily due to an increase in the weighted-average risk grade of our energy loan portfolio and the general macroeconomic uncertainty surrounding the continued oil price volatility and the ongoing downturn in the energy industry. The increase was also partly related to an increase in the level of net charge-offs and increases in the volumes of both non-classified and classified loans. The overall weighted-average risk grade of our energy loan portfolio was 6.89 at December 31, 2015 compared to 5.45 at December 31, 2014. The upward migration of risk grades within our energy loan portfolio resulted in higher historical valuation allowances and increases in the various categories of general valuation allowances that are based upon our loan risk-grade matrix, particularly those allocated for excessive industry concentrations. The continued oil price volatility resulted in further economic uncertainty as reflected in the downward movement of the Texas Leading Index which totaled 124.1 at November 30, 2015 (most recent date available at the time) and 129.3 at December 31, 2014. As a result of this economic uncertainty and the sensitivity stress test analysis described above, we recognized an additional $22.0 million provision for loan losses during the fourth quarter of 2015 to allocate additional reserves for the added inherent risk within our energy loan portfolio resulting from the continued oil price volatility and the ongoing downturn in the energy industry. The ratio of the allowance for loan losses to total loans was 1.18% at December 31, 2015 compared to 0.91% at December 31, 2014, while the ratio of the allowance for loan losses allocated to energy loans to total energy loans totaled 3.11% at December 31, 2015 compared to 0.84% at December 31, 2014.
The provision for loan losses decreased $4.3 million, or 20.7%, in 2014 compared to 2013. The decrease was primarily due to a $23.4 million decrease in net charge-offs and a decrease in the level of classified loans partly offset by the impact of an increase in the overall volume of loans. Net charge-offs to average loans totaled 0.09% during 2014 decreasing 26 basis points compared to 0.35% during 2013. Net charge-offs during 2014 were impacted by a higher level of commercial and industrial loan recoveries which included a $3.4 million recovery related to a single commercial and industrial loan relationship. Net charge-offs and the level of the provision for loan losses in 2013, were impacted by charge-offs totaling $18.8 million related to a single commercial and industrial loan relationship. The loan was not past due or previously considered to be a non-performing, impaired or potential problem loan prior to the initial charge-off in the first quarter of 2013; however, in April 2013, the borrower entered into bankruptcy proceedings. The ratio of the allowance for loan losses to total loans was 0.91% at December 31, 2014 compared to 0.97% at December 31, 2013. The acquisition of WNB during the second quarter of 2014 did not significantly impact management's determination of the allowance for loan losses in 2014.
71
Securities
Year-end securities were as follows:
2017 | 2016 | 2015 | ||||||||||||||||||
Amount | Percentage of Total | Amount | Percentage of Total | Amount | Percentage of Total | |||||||||||||||
Held to maturity: | ||||||||||||||||||||
U.S. Treasury | $ | — | — | % | $ | 249,889 | 2.0 | % | $ | 249,441 | 2.1 | % | ||||||||
Residential mortgage-backed securities | 3,610 | — | 4,511 | 0.1 | 6,456 | 0.1 | ||||||||||||||
States and political subdivisions | 1,428,488 | 12.0 | 1,994,710 | 16.0 | 2,405,762 | 20.2 | ||||||||||||||
Other | — | — | 1,350 | — | 1,350 | — | ||||||||||||||
Total | 1,432,098 | 12.0 | 2,250,460 | 18.1 | 2,663,009 | 22.4 | ||||||||||||||
Available for sale: | ||||||||||||||||||||
U.S. Treasury | 3,445,153 | 28.8 | 4,019,731 | 32.2 | 3,994,520 | 33.6 | ||||||||||||||
Residential mortgage-backed securities | 665,086 | 5.6 | 785,167 | 6.3 | 1,041,432 | 8.8 | ||||||||||||||
States and political subdivisions | 6,336,209 | 53.1 | 5,355,885 | 43.0 | 4,127,959 | 34.7 | ||||||||||||||
Other | 42,561 | 0.3 | 42,494 | 0.3 | 42,447 | 0.4 | ||||||||||||||
Total | 10,489,009 | 87.8 | 10,203,277 | 81.8 | 9,206,358 | 77.5 | ||||||||||||||
Trading: | ||||||||||||||||||||
U.S. Treasury | 19,210 | 0.2 | 16,594 | 0.1 | 16,443 | 0.1 | ||||||||||||||
States and political subdivisions | 1,888 | — | 109 | — | 136 | — | ||||||||||||||
Total | 21,098 | 0.2 | 16,703 | 0.1 | 16,579 | 0.1 | ||||||||||||||
Total securities | $ | 11,942,205 | 100.0 | % | $ | 12,470,440 | 100.0 | % | $ | 11,885,946 | 100.0 | % | ||||||||
The following tables summarize the maturity distribution schedule with corresponding weighted-average yields of securities held to maturity and securities available for sale as of December 31, 2017. Weighted-average yields have been computed on a fully taxable-equivalent basis using a tax rate of 35%. Mortgage-backed securities are included in maturity categories based on their stated maturity date. Expected maturities may differ from contractual maturities because issuers may have the right to call or prepay obligations. Other securities classified as available for sale include stock in the Federal Reserve Bank and the Federal Home Loan Bank, which have no maturity date. These securities have been included in the total column only.
Within 1 Year | 1-5 Years | 5-10 Years | After 10 Years | Total | ||||||||||||||||||||||||||||||
Amount | Weighted Average Yield | Amount | Weighted Average Yield | Amount | Weighted Average Yield | Amount | Weighted Average Yield | Amount | Weighted Average Yield | |||||||||||||||||||||||||
Held to maturity: | ||||||||||||||||||||||||||||||||||
Residential mortgage- backed securities | $ | — | — | % | $ | 878 | 2.59 | % | $ | — | — | % | $ | 2,732 | 2.64 | % | $ | 3,610 | 2.63 | % | ||||||||||||||
States and political subdivisions | 264,587 | 7.44 | 159,765 | 5.04 | 386,711 | 3.92 | 617,425 | 4.40 | 1,428,488 | 4.90 | ||||||||||||||||||||||||
Other | — | — | — | — | — | — | — | — | — | — | ||||||||||||||||||||||||
Total | $ | 264,587 | 7.44 | $ | 160,643 | 5.02 | $ | 386,711 | 3.92 | $ | 620,157 | 4.39 | $ | 1,432,098 | 4.90 | |||||||||||||||||||
Available for sale: | ||||||||||||||||||||||||||||||||||
U.S. Treasury | $ | — | — | % | $ | 3,152,672 | 1.69 | % | $ | 292,481 | 2.66 | % | $ | — | — | % | $ | 3,445,153 | 1.77 | % | ||||||||||||||
Residential mortgage- backed securities | 3,865 | 4.41 | 147,571 | 1.80 | 81,034 | 3.46 | 432,616 | 3.59 | 665,086 | 3.18 | ||||||||||||||||||||||||
States and political subdivisions | 58,057 | 6.72 | 903,836 | 3.22 | 146,527 | 4.83 | 5,227,789 | 4.66 | 6,336,209 | 4.48 | ||||||||||||||||||||||||
Other | — | — | — | — | — | — | — | — | 42,561 | — | ||||||||||||||||||||||||
Total | $ | 61,922 | 6.58 | $ | 4,204,079 | 2.02 | $ | 520,042 | 3.40 | $ | 5,660,405 | 4.58 | $ | 10,489,009 | 3.49 | |||||||||||||||||||
As previously stated, weighted-average yields in the above table have been computed on a fully taxable-equivalent basis using a tax rate of 35%. Beginning January 1, 2018, taxable-equivalent-yields will be based upon a tax rate of 21%. See the section captioned “Income Taxes” elsewhere in this discussion for information regarding the Tax Cuts and Jobs Act enacted on December 22, 2017. Assuming a tax rate of 21%, the total weighted-average taxable-equivalent
72
yields of the held to maturity and available for sale portfolios of securities issued by States and political subdivisions would be 4.03% and 3.69%, respectively.
Securities are classified as held to maturity and carried at amortized cost when management has the positive intent and ability to hold them to maturity. Securities are classified as available for sale when they might be sold before maturity. Securities available for sale are carried at fair value, with unrealized holding gains and losses reported in other comprehensive income, net of tax. The remaining securities are classified as trading. Trading securities are held primarily for sale in the near term and are carried at their fair values, with unrealized gains and losses included immediately in other income. Management determines the appropriate classification of securities at the time of purchase. Securities with limited marketability, such as stock in the Federal Reserve Bank and the Federal Home Loan Bank, are carried at cost.
All mortgage-backed securities included in the above tables were issued by U.S. government agencies and corporations. At December 31, 2017, approximately 98.2% of the securities in our municipal bond portfolio were issued by political subdivisions or agencies within the State of Texas, of which approximately 67.8% are either guaranteed by the Texas Permanent School Fund, which has a “triple-A” insurer financial strength rating, or secured by U.S. Treasury securities via defeasance of the debt by the issuers. At December 31, 2017, we held general obligation bonds issued by the State of Texas with an aggregate amortized cost of $1.0 billion and an aggregate fair value of $1.1 billion. Such amounts were in excess of 10% of our shareholders’ equity at December 31, 2017. At such date, all of these securities carried a “triple-A” rating. At December 31, 2017, there were no other holdings of any one issuer, other than the U.S. government and its agencies, in an amount greater than 10% of our shareholders’ equity.
The average taxable-equivalent yield on the securities portfolio was 3.99% in 2017 compared to 4.02% in 2016 and 3.97% in 2015. Tax-exempt municipal securities totaled 60.0% of average securities in 2017 compared to 56.4% in 2016 and 53.2% in 2015. The average yield on taxable securities was 1.92% in 2017 compared to 2.01% in 2016 and 2.11% in 2015, while the average taxable-equivalent yield on tax-exempt securities was 5.37% in 2017 compared to 5.57% in 2016 and 5.59% in 2015. See the section captioned “Net Interest Income” included elsewhere in this discussion. The overall growth in the securities portfolio since 2015 was primarily funded by deposit growth.
Deposits
The table below presents the daily average balances of deposits by type and weighted-average rates paid thereon during the years presented:
2017 | 2016 | 2015 | ||||||||||||||||||
Average Balance | Average Rate Paid | Average Balance | Average Rate Paid | Average Balance | Average Rate Paid | |||||||||||||||
Non-interest-bearing demand deposits: | ||||||||||||||||||||
Commercial and individual | $ | 10,155,502 | $ | 9,215,962 | $ | 9,334,604 | ||||||||||||||
Correspondent banks | 245,759 | 310,445 | 353,766 | |||||||||||||||||
Public funds | 418,165 | 507,912 | 491,440 | |||||||||||||||||
Total | 10,819,426 | 10,034,319 | 10,179,810 | |||||||||||||||||
Interest-bearing deposits: | ||||||||||||||||||||
Private accounts: | ||||||||||||||||||||
Savings and interest checking | 6,376,855 | 0.02 | % | 5,745,385 | 0.02 | % | 4,831,927 | 0.02 | % | |||||||||||
Money market accounts | 7,502,494 | 0.17 | 7,466,252 | 0.06 | 7,715,890 | 0.08 | ||||||||||||||
Time accounts of $100,000 or more | 446,695 | 0.26 | 461,138 | 0.20 | 451,603 | 0.22 | ||||||||||||||
Time accounts under $100,000 | 329,245 | 0.18 | 349,964 | 0.12 | 422,765 | 0.12 | ||||||||||||||
Public funds | 430,203 | 0.33 | 454,786 | 0.04 | 438,763 | 0.03 | ||||||||||||||
Total | 15,085,492 | 0.11 | 14,477,525 | 0.05 | 13,860,948 | 0.07 | ||||||||||||||
Total deposits | $ | 25,904,918 | 0.07 | $ | 24,511,844 | 0.03 | $ | 24,040,758 | 0.04 | |||||||||||
Average deposits increased $1.4 billion, or 5.7%, in 2017 compared to 2016 and increased $471.1 million, or 2.0%, in 2016 compared to 2015. The most significant volume growth during 2017 compared to 2016 was in non-interest bearing commercial and individual accounts and savings and interest checking accounts. This growth was partly offset by volume decreases in public fund accounts, both non-interest bearing and interest-bearing, and correspondent bank accounts. The most significant volume growth during 2016 compared to 2015 was in savings and interest checking accounts partly offset by volume decreases in money market accounts and non-interest bearing commercial and
73
individual accounts. Deposit growth during the reported periods was driven by new customer relationships as well as increased balances from existing customers. The ratio of average interest-bearing deposits to total average deposits was 58.2% in 2017 compared to 59.1% in 2016 and 57.7% in 2015. The average cost of interest-bearing deposits and total deposits was 0.11% and 0.07% during 2017 compared to 0.05% and 0.03% during 2016 and 0.07% and 0.04% during 2015. The increase in the average cost of interest-bearing deposits in 2017 as compared to 2016 was related to the aforementioned increases in interest rates paid on most of our interest-bearing deposit products during the third quarter of 2017. The decrease in the average cost of interest-bearing deposits in 2016 as compared to 2015 was primarily the result of decreases in interest rates offered on certain deposit products due to decreases in average market interest rates and decreases in renewal interest rates on maturing certificates of deposit given the low interest rate environment in 2016. Additionally, the relative proportion of higher-cost time accounts to total average interest-bearing deposits decreased from 6.3% in 2015 to 5.6% in 2016 and 5.1% in 2017.
The following table presents the proportion of each component of average non-interest-bearing deposits to the total of such non-interest-bearing deposits during the years presented:
2017 | 2016 | 2015 | ||||||
Commercial and individual | 93.8 | % | 91.8 | % | 91.7 | % | ||
Correspondent banks | 2.3 | 3.1 | 3.5 | |||||
Public funds | 3.9 | 5.1 | 4.8 | |||||
Total | 100.0 | % | 100.0 | % | 100.0 | % | ||
Average non-interest-bearing deposits increased $785.1 million, or 7.8%, in 2017 compared to 2016 while average non-interest-bearing deposits decreased $145.5 million, or 1.4% in 2016 compared to 2015. The increase in 2017 compared to 2016 was primarily due to a $939.5 million, or 10.2%, increase in average commercial and individual deposits. The decrease in 2016 compared to 2015 was primarily due to a $118.6 million, or 1.3%, decrease in average commercial and individual deposits.
The following table presents the proportion of each component of average interest-bearing deposits to the total of such interest-bearing deposits during the years presented:
2017 | 2016 | 2015 | ||||||
Private accounts: | ||||||||
Savings and interest checking | 42.3 | % | 39.7 | % | 34.9 | % | ||
Money market accounts | 49.7 | 51.6 | 55.6 | |||||
Time accounts of $100,000 or more | 2.9 | 3.2 | 3.3 | |||||
Time accounts under $100,000 | 2.2 | 2.4 | 3.0 | |||||
Public funds | 2.9 | 3.1 | 3.2 | |||||
Total | 100.0 | % | 100.0 | % | 100.0 | % | ||
Total average interest-bearing deposits increased $608.0 million, or 4.2%, in 2017 compared to 2016 and increased $616.6 million, or 4.4%, in 2016 compared to 2015. The relative proportion of money market accounts and time accounts to total average interest-bearing deposits decreased in favor of savings and interest checking accounts.
From time to time, we have obtained interest-bearing deposits through brokered transactions including participation in the Certificate of Deposit Account Registry Service (“CDARS”) and the Promontory Interfinancial Network Insured Cash Sweep Service (“Promontory Cash Sweep deposits”). The Promontory Cash Sweep deposits were initially acquired in connection with our acquisition of WNB in 2014. We had no brokered deposits of any kind during 2017. Average CDARS deposits totaled $293 thousand in 2016 and $10.2 million in 2015, while average Promontory Cash Sweep deposits totaled $857 thousand in 2016 and $55.8 million in 2015.
74
Geographic Concentrations. The following table summarizes our average total deposit portfolio, as segregated by the geographic region from which the deposit accounts were originated. Certain accounts, such as correspondent bank deposits and deposits allocated to certain statewide operational units, are recorded at the statewide level.
Percent | Percent | Percent | ||||||||||||||||||
2017 | of Total | 2016 | of Total | 2015 | of Total | |||||||||||||||
San Antonio | $ | 7,890,139 | 30.5 | % | $ | 7,354,061 | 30.0 | % | $ | 7,250,381 | 30.2 | % | ||||||||
Fort Worth | 4,784,241 | 18.5 | 4,466,086 | 18.2 | 4,165,748 | 17.3 | ||||||||||||||
Houston | 4,544,448 | 17.5 | 4,196,530 | 17.1 | 4,163,581 | 17.3 | ||||||||||||||
Austin | 3,089,645 | 11.9 | 2,928,448 | 11.9 | 2,721,616 | 11.3 | ||||||||||||||
Dallas | 2,048,712 | 7.9 | 1,958,646 | 8.0 | 1,883,866 | 7.8 | ||||||||||||||
Corpus Christi | 1,458,044 | 5.6 | 1,493,792 | 6.1 | 1,526,817 | 6.4 | ||||||||||||||
Permian Basin | 1,218,402 | 4.7 | 1,042,955 | 4.3 | 1,150,031 | 4.8 | ||||||||||||||
Rio Grande Valley | 775,646 | 3.0 | 787,431 | 3.2 | 778,407 | 3.2 | ||||||||||||||
Statewide | 95,641 | 0.4 | 283,895 | 1.2 | 400,311 | 1.7 | ||||||||||||||
Total | $ | 25,904,918 | 100.0 | % | $ | 24,511,844 | 100.0 | % | $ | 24,040,758 | 100.0 | % | ||||||||
Foreign Deposits. Mexico has historically been considered a part of the natural trade territory of our banking offices. Accordingly, U.S. dollar-denominated foreign deposits from sources within Mexico have traditionally been a significant source of funding. Average deposits from foreign sources, primarily Mexico, totaled $745.7 million in 2017, $766.8 million in 2016 and $755.2 million in 2015.
Short-Term Borrowings
Our primary source of short-term borrowings is federal funds purchased from correspondent banks and repurchase agreements in our natural trade territory, as well as from upstream banks. Federal funds purchased and repurchase agreements totaled $1.1 billion, $977.0 million and $893.5 million at December 31, 2017, 2016 and 2015. The maximum amount of these borrowings outstanding at any month-end was $1.1 billion in 2017, $977.0 million in 2016 and $893.5 million in 2015. The weighted-average interest rate on federal funds purchased and repurchase agreements was 0.23% at December 31, 2017, and 0.02% at both December 31, 2016 and December 31, 2015.
The following table presents our average net funding position during the years indicated:
2017 | 2016 | 2015 | ||||||||||||||||||
Average Balance | Average Rate | Average Balance | Average Rate | Average Balance | Average Rate | |||||||||||||||
Federal funds sold and resell agreements | $ | 73,140 | 1.28 | % | $ | 42,361 | 0.64 | % | $ | 24,695 | 0.43 | % | ||||||||
Federal funds purchased and repurchase agreements | (978,571 | ) | 0.16 | (770,942 | ) | 0.03 | (648,851 | ) | 0.03 | |||||||||||
Net funds position | $ | (905,431 | ) | $ | (728,581 | ) | $ | (624,156 | ) | |||||||||||
The net funds purchased position increased $176.9 million in 2017 compared to 2016 and increased $104.4 million in 2016 compared to 2015. Average interest-bearing deposits totaled $3.6 billion in 2017 compared to $3.1 billion in 2016 and $3.0 billion in 2015. During the reported periods, we have maintained excess liquid funds in interest-bearing deposits with the Federal Reserve rather than federal funds sold in order to capitalize on higher available yields.
75
Off Balance Sheet Arrangements, Commitments, Guarantees, and Contractual Obligations
The following table summarizes our contractual obligations and other commitments to make future payments as of December 31, 2017. Payments for borrowings do not include interest. Payments related to leases are based on actual payments specified in the underlying contracts. Loan commitments and standby letters of credit are presented at contractual amounts; however, since many of these commitments are expected to expire unused or only partially used, the total amounts of these commitments do not necessarily reflect future cash requirements.
Payments Due by Period | |||||||||||||||||||
1 Year or Less | More than 1 Year but Less than 3 Years | 3 Years or More but Less than 5 Years | 5 Years or More | Total | |||||||||||||||
Contractual obligations: | |||||||||||||||||||
Subordinated notes payable | $ | — | $ | — | $ | — | $ | 100,000 | $ | 100,000 | |||||||||
Junior subordinated deferrable interest debentures | — | — | — | 137,115 | 137,115 | ||||||||||||||
Operating leases | 27,990 | 60,697 | 59,494 | 347,187 | 495,368 | ||||||||||||||
Deposits with stated maturity dates | 643,058 | 149,853 | — | — | 792,911 | ||||||||||||||
671,048 | 210,550 | 59,494 | 584,302 | 1,525,394 | |||||||||||||||
Other commitments: | |||||||||||||||||||
Commitments to extend credit | 3,304,513 | 2,737,741 | 1,214,342 | 692,804 | 7,949,400 | ||||||||||||||
Standby letters of credit | 217,855 | 15,280 | 2,414 | 1,046 | 236,595 | ||||||||||||||
3,522,368 | 2,753,021 | 1,216,756 | 693,850 | 8,185,995 | |||||||||||||||
Total contractual obligations and other commitments | $ | 4,193,416 | $ | 2,963,571 | $ | 1,276,250 | $ | 1,278,152 | $ | 9,711,389 | |||||||||
Financial Instruments with Off-Balance-Sheet Risk. In the normal course of business, we enter into various transactions, which, in accordance with accounting principles generally accepted in the United States, are not included in our consolidated balance sheets. We enter into these transactions to meet the financing needs of our customers. These transactions include commitments to extend credit and standby letters of credit, which involve, to varying degrees, elements of credit risk and interest rate risk in excess of the amounts recognized in the consolidated balance sheets. We minimize our exposure to loss under these commitments by subjecting them to credit approval and monitoring procedures. We also hold certain assets which are not included in our consolidated balance sheets including assets held in fiduciary or custodial capacity on behalf of our trust customers.
Commitments to Extend Credit. We enter into contractual commitments to extend credit, normally with fixed expiration dates or termination clauses, at specified rates and for specific purposes. Substantially all of our commitments to extend credit are contingent upon customers maintaining specific credit standards at the time of loan funding. Commitments to extend credit outstanding at December 31, 2017 are included in the table above.
Standby Letters of Credit. Standby letters of credit are written conditional commitments issued by us to guarantee the performance of a customer to a third party. In the event the customer does not perform in accordance with the terms of the agreement with the third party, we would be required to fund the commitment. The maximum potential amount of future payments we could be required to make is represented by the contractual amount of the commitment. If the commitment is funded, we would be entitled to seek recovery from the customer. Our policies generally require that standby letter of credit arrangements contain security and debt covenants similar to those contained in loan agreements. Standby letters of credit outstanding at December 31, 2017 are included in the table above.
Trust Accounts. We also hold certain assets in fiduciary or custodial capacity on behalf of our trust customers. The estimated fair value of trust assets was approximately $32.8 billion (including managed assets of $14.1 billion and custody assets of $18.7 billion) at December 31, 2017. These assets were primarily composed of equity securities (50.3% of trust assets), fixed income securities (37.3% of trust assets) and cash equivalents (7.9% of trust assets).
76
Capital and Liquidity
Capital. Shareholders’ equity totaled $3.3 billion at December 31, 2017 and $3.0 billion at December 31, 2016. In addition to net income of $364.1 million, other sources of capital during 2017 included other comprehensive income, net of tax, of $104.1 million, $67.7 million in proceeds from stock option exercises and $13.0 million related to stock-based compensation. Uses of capital during 2017 included $152.2 million of dividends paid on preferred and common stock and $101.5 million of treasury stock purchases.
The accumulated other comprehensive income/loss component of shareholders’ equity totaled a net, after-tax, unrealized gain of $79.5 million at December 31, 2017 compared to a net, after-tax, unrealized loss of $24.6 million at December 31, 2016. The increase was primarily due to a $101.1 million net after-tax increase in the net unrealized gain on securities available for sale and securities transferred to held to maturity partly offset by a $3.1 million net after-tax decrease in the net actuarial loss on our defined benefit post-retirement benefit plans. Accumulated other comprehensive income at December 31, 2017 included $9.5 million related to stranded amounts resulting from the remeasurement of deferred tax assets and liabilities in connection with the enactment of the Tax Cuts and Jobs Act on December 22, 2017. A proposed Accounting Standards Update issued in January 2018 would require that the tax effects stranded in accumulated other comprehensive income be reclassified to retained earnings rather than income tax benefit or expense. See the section captioned “Income Taxes” elsewhere in this discussion.
The Basel III Capital Rules became effective for Cullen/Frost and Frost Bank on January 1, 2015 (subject to a phase-in period for certain provisions). In connection with the adoption of the Basel III Capital Rules, we elected to opt-out of the requirement to include most components of accumulated other comprehensive income in regulatory capital. Accordingly, amounts reported as accumulated other comprehensive income/loss related to securities available for sale, effective cash flow hedges and defined benefit post-retirement benefit plans do not increase or reduce regulatory capital and are not included in the calculation of risk-based capital and leverage ratios. Regulatory agencies for banks and bank holding companies utilize capital guidelines designed to measure capital and take into consideration the risk inherent in both on-balance sheet and off-balance sheet items. See Note 9 - Capital and Regulatory Matters in the accompanying notes to consolidated financial statements included elsewhere in this report.
We paid quarterly dividends of $0.54, $0.57, $0.57 and $0.57 per common share during the first, second, third and fourth quarters of 2017, respectively, and quarterly dividends of $0.53, $0.54, $0.54 and $0.54 per common share during the first, second, third and fourth quarters of 2016, respectively. This equates to a dividend payout ratio of 40.5% in 2017 and 45.5% in 2016. Under the terms of the junior subordinated deferrable interest debentures that Cullen/Frost has issued to Cullen/Frost Capital Trust II and WNB Capital Trust I, we have the right at any time during the term of the debentures to defer the payment of interest any time or from time to time for an extension period not exceeding 20 consecutive quarterly periods with respect to each extension period. Our ability to declare or pay dividends on, or purchase, redeem or otherwise acquire, shares of our capital stock is subject to certain restrictions during any such extension period. Under the terms of the Series A Preferred Stock, our ability to declare or pay dividends on, or purchase, redeem or otherwise acquire, shares of our common stock or any of our securities that rank junior to the Series A Preferred Stock is subject to certain restrictions in the event that we do not declare and pay dividends on the Series A Preferred Stock for the most recent dividend period.
Stock Repurchase Plans. From time to time, our board of directors has authorized stock repurchase plans. In general, stock repurchase plans allow us to proactively manage our capital position and return excess capital to shareholders. Shares purchased under such plans also provide us with shares of common stock necessary to satisfy obligations related to stock compensation awards. On October 24, 2017, our board of directors authorized a $150.0 million stock repurchase program, allowing us to repurchase shares of our common stock over a two-year period from time to time at various prices in the open market or through private transactions. No shares were repurchased under this plan during 2017. Under prior plans, we repurchased 1,134,966 shares at a total cost of $100.0 million during 2017 and 1,485,493 shares at a total cost of $100.0 million during 2015. See Part II, Item 5 - Market for Registrant’s Common Equity, Related Stockholder Matters and Issuer Purchases of Equity Securities, included elsewhere in this report.
77
Liquidity. Liquidity measures the ability to meet current and future cash flow needs as they become due. The liquidity of a financial institution reflects its ability to meet loan requests, to accommodate possible outflows in deposits and to take advantage of interest rate market opportunities. The ability of a financial institution to meet its current financial obligations is a function of its balance sheet structure, its ability to liquidate assets and its access to alternative sources of funds. The objective of our liquidity management is to manage cash flow and liquidity reserves so that they are adequate to fund our operations and to meet obligations and other commitments on a timely basis and at a reasonable cost. We seek to achieve this objective and ensure that funding needs are met by maintaining an appropriate level of liquid funds through asset/liability management, which includes managing the mix and time to maturity of financial assets and financial liabilities on our balance sheet. Our liquidity position is enhanced by our ability to raise additional funds as needed in the wholesale markets.
Asset liquidity is provided by liquid assets which are readily marketable or pledgeable or which will mature in the near future. Liquid assets include cash, interest-bearing deposits in banks, securities available for sale, maturities and cash flow from securities held to maturity, and federal funds sold and resell agreements.
Liability liquidity is provided by access to funding sources which include core deposits and correspondent banks in our natural trade area that maintain accounts with and sell federal funds to Frost Bank, as well as federal funds purchased and repurchase agreements from upstream banks and deposits obtained through financial intermediaries.
Our liquidity position is continuously monitored and adjustments are made to the balance between sources and uses of funds as deemed appropriate. Liquidity risk management is an important element in our asset/liability management process. We regularly model liquidity stress scenarios to assess potential liquidity outflows or funding problems resulting from economic disruptions, volatility in the financial markets, unexpected credit events or other significant occurrences deemed problematic by management. These scenarios are incorporated into our contingency funding plan, which provides the basis for the identification of our liquidity needs. As of December 31, 2017, management is not aware of any events that are reasonably likely to have a material adverse effect on our liquidity, capital resources or operations. In addition, management is not aware of any regulatory recommendations regarding liquidity that would have a material adverse effect on us.
Since Cullen/Frost is a holding company and does not conduct operations, its primary sources of liquidity are dividends upstreamed from Frost Bank and borrowings from outside sources. Banking regulations may limit the amount of dividends that may be paid by Frost Bank. See Note 9 - Capital and Regulatory Matters in the accompanying notes to consolidated financial statements included elsewhere in this report regarding such dividends. At December 31, 2017, Cullen/Frost had liquid assets, including cash and resell agreements, totaling $265.3 million.
Impact of Inflation and Changing Prices
Our financial statements included herein have been prepared in accordance with accounting principles generally accepted in the United States (“GAAP”). GAAP presently requires us to measure financial position and operating results primarily in terms of historic dollars. Changes in the relative value of money due to inflation or recession are generally not considered. The primary effect of inflation on our operations is reflected in increased operating costs. In management’s opinion, changes in interest rates affect the financial condition of a financial institution to a far greater degree than changes in the inflation rate. While interest rates are greatly influenced by changes in the inflation rate, they do not necessarily change at the same rate or in the same magnitude as the inflation rate. Interest rates are highly sensitive to many factors that are beyond our control, including changes in the expected rate of inflation, the influence of general and local economic conditions and the monetary and fiscal policies of the United States government, its agencies and various other governmental regulatory authorities, among other things, as further discussed in the next section.
78
Regulatory and Economic Policies
Our business and earnings are affected by general and local economic conditions and by the monetary and fiscal policies of the United States government, its agencies and various other governmental regulatory authorities, among other things. The Federal Reserve Board regulates the supply of money in order to influence general economic conditions. Among the instruments of monetary policy historically available to the Federal Reserve Board are (i) conducting open market operations in United States government obligations, (ii) changing the discount rate on financial institution borrowings, (iii) imposing or changing reserve requirements against financial institution deposits, and (iv) restricting certain borrowings and imposing or changing reserve requirements against certain borrowings by financial institutions and their affiliates. In addition, the Federal Reserve Board has taken a variety of extraordinary actions during the current economic climate that have had a material expansionary effect on the money supply. These methods are used in varying degrees and combinations to affect directly the availability of bank loans and deposits, as well as the interest rates charged on loans and paid on deposits. For that reason alone, the policies of the Federal Reserve Board have a material effect on our earnings.
Governmental policies have had a significant effect on the operating results of commercial banks in the past and are expected to continue to do so in the future; however, we cannot accurately predict the nature, timing or extent of any effect such policies may have on its future business and earnings.
Accounting Standards Updates
See Note 20 - Accounting Standards Updates in the accompanying notes to consolidated financial statements included elsewhere in this report for details of recently issued accounting pronouncements and their expected impact on our financial statements.
79
ITEM 7A. QUANTITATIVE AND QUALITATIVE DISCLOSURES ABOUT MARKET RISK
The disclosures set forth in this item are qualified by Item 1A. Risk Factors and the section captioned “Forward-Looking Statements and Factors that Could Affect Future Results” included in Item 7. Management’s Discussion and Analysis of Financial Condition and Results of Operations, of this report, and other cautionary statements set forth elsewhere in this report.
Market risk refers to the risk of loss arising from adverse changes in interest rates, foreign currency exchange rates, commodity prices, and other relevant market rates and prices, such as equity prices. The risk of loss can be assessed from the perspective of adverse changes in fair values, cash flows, and future earnings. Due to the nature of our operations, we are primarily exposed to interest rate risk and, to a lesser extent, liquidity risk.
Interest rate risk on our balance sheets consists of reprice, option, and basis risks. Reprice risk results from differences in the maturity, or repricing, of asset and liability portfolios. Option risk arises from “embedded options” present in many financial instruments such as loan prepayment options, deposit early withdrawal options and interest rate options. These options allow customers opportunities to benefit when market interest rates change, which typically results in higher costs or lower revenue for us. Basis risk refers to the potential for changes in the underlying relationship between market rates and indices, which subsequently result in a narrowing of the profit spread on an earning asset or liability. Basis risk is also present in administered rate liabilities, such as savings accounts, negotiable order of withdrawal accounts, and money market accounts where historical pricing relationships to market rates may change due to the level or directional change in market interest rates.
We seek to avoid fluctuations in our net interest margin and to maximize net interest income within acceptable levels of risk through periods of changing interest rates. Accordingly, our interest rate sensitivity and liquidity are monitored on an ongoing basis by our Asset and Liability Committee (“ALCO”), which oversees market risk management and establishes risk measures, limits and policy guidelines for managing the amount of interest rate risk and its effect on net interest income and capital. A variety of measures are used to provide for a comprehensive view of the magnitude of interest rate risk, the distribution of risk, the level of risk over time and the exposure to changes in certain interest rate relationships.
We utilize an earnings simulation model as the primary quantitative tool in measuring the amount of interest rate risk associated with changing market rates. The model quantifies the effects of various interest rate scenarios on projected net interest income and net income over the next 12 months. The model measures the impact on net interest income relative to a flat-rate case scenario of hypothetical fluctuations in interest rates over the next 12 months. These simulations incorporate assumptions regarding balance sheet growth and mix, pricing and the repricing and maturity characteristics of the existing and projected balance sheet. The impact of interest rate derivatives, such as interest rate swaps, caps and floors, is also included in the model. Other interest rate-related risks such as prepayment, basis and option risk are also considered.
ALCO continuously monitors and manages the balance between interest rate-sensitive assets and liabilities. The objective is to manage the impact of fluctuating market rates on net interest income within acceptable levels. In order to meet this objective, management may lengthen or shorten the duration of assets or liabilities or enter into derivative contracts to mitigate potential market risk.
For modeling purposes, as of December 31, 2017, the model simulations projected that 100 and 200 basis point ratable increases in interest rates would result in positive variances in net interest income of 1.1% and 3.1%, respectively, relative to the flat-rate case over the next 12 months, while 100 and 150 basis point ratable decreases in interest rates would result in negative variances in net interest income of 4.6% and 10.5%, respectively, relative to the flat-rate case over the next 12 months. The December 31, 2017 model simulations were impacted by the assumption, for modeling purposes, that we will begin to pay interest on commercial demand deposits (those not already receiving an earnings credit rate) in the first quarter of 2018, as further discussed below. As of December 31, 2016, the model simulations projected that 100 and 200 basis point ratable increases in interest rates would result in positive variances in net interest income of 1.0% and 2.1%, respectively, relative to the flat-rate case over the next 12 months, while a 75 basis point ratable decrease in interest rates would result in a negative variance in net interest income of 7.8% relative to the flat-rate case over the next 12 months. The December 31, 2016 model simulations were impacted by the assumption, for modeling purposes, that we would begin to pay interest on commercial demand deposits (those not already receiving an earnings credit rate) in the first quarter of 2017, as further discussed below. The likelihood of a decrease in interest rates beyond 150 basis points as of December 31, 2017 and 75 basis points as of December 31, 2016 was considered to be remote given prevailing interest rate levels.
80
The model simulations as of December 31, 2017 indicate that our balance sheet is more asset sensitive in comparison to our balance sheet as of December 31, 2016. The shift to a more asset sensitive position was primarily due to an increase in the relative proportion of federal funds sold to projected average interest-earning assets. Federal funds sold are more immediately impacted by changes in interest rates in comparison to other categories of earning assets.
We do not currently pay interest on a significant portion of our commercial demand deposits. If we began to pay interest on commercial demand deposits (those not already receiving an earnings credit rate), our balance sheet would likely become less asset sensitive. Any interest rate that would ultimately be paid on these commercial demand deposits would likely depend upon a variety of factors, some of which are beyond our control. For modeling purposes, we have assumed an aggressive pricing structure with interest payments for commercial demand deposits (those not already receiving an earnings credit) beginning in the first quarters of 2017 and 2018, respectively, for each simulation. Should the actual interest rate paid on commercial demand deposits be less than the rate assumed in the model simulations, or should the interest rate paid for commercial demand deposits become an administered rate with less direct correlation to movements in general market interest rates, our balance sheet could be more asset sensitive than the model simulations might otherwise indicate.
As of December 31, 2017, the effects of a 200 basis point increase and a 150 basis point decrease in interest rates on our derivative holdings would not result in a significant variance in our net interest income.
The effects of hypothetical fluctuations in interest rates on our securities classified as “trading” under ASC Topic 320, “Investments - Debt and Equity Securities” are not significant, and, as such, separate quantitative disclosure is not presented.
81
ITEM 8. FINANCIAL STATEMENTS AND SUPPLEMENTARY DATA
Report of Independent Registered Public Accounting Firm
To the Shareholders and the Board of Directors of
Cullen/Frost Bankers, Inc.
Opinion on the Financial Statements
We have audited the accompanying consolidated balance sheets of Cullen/Frost Bankers, Inc. (the Company) as of December 31, 2017 and 2016, and the related consolidated statements of income, comprehensive income, changes in shareholders’ equity and cash flows for each of the three years in the period ended December 31, 2017, and the related notes (collectively referred to as the financial statements). In our opinion, the financial statements present fairly, in all material respects, the consolidated financial position of the Company at December 31, 2017 and 2016, and the consolidated results of its operations and its cash flows for each of the three years in the period ended December 31, 2017, in conformity with U.S. generally accepted accounting principles.
We also have audited, in accordance with the standards of the Public Company Accounting Oversight Board (United States) (PCAOB), the Company’s internal control over financial reporting as of December 31, 2017, based on criteria established in Internal Control-Integrated Framework issued by the Committee of Sponsoring Organizations of the Treadway Commission (2013 framework) and our report dated February 7, 2018 expressed an unqualified opinion thereon.
Basis for Opinion
These financial statements are the responsibility of the Company’s management. Our responsibility is to express an opinion on the Company’s financial statements based on our audits. We are a public accounting firm registered with the PCAOB and are required to be independent with respect to the Company in accordance with the U.S. federal securities laws and applicable rules and regulations of the Securities and Exchange Commission and the PCAOB.
We conducted our audits in accordance with the standards of the PCAOB. Those standards require that we plan and perform the audit to obtain reasonable assurance about whether the financial statements are free of material misstatement, whether due to error or fraud. Our audits included performing procedures to assess the risks of material misstatement of the financial statements, whether due to error or fraud, and performing procedures that respond to those risks. Such procedures included examining, on a test basis, evidence regarding the amounts and disclosures in the financial statements. Our audits also included evaluating the accounting principles used and significant estimates made by management, as well as evaluating the overall presentation of the financial statements. We believe that our audits provide a reasonable basis for our opinion.

We have served as the Company’s auditor since 1969.
San Antonio, Texas
February 7, 2018
82
Cullen/Frost Bankers, Inc.
Consolidated Balance Sheets
(Dollars in thousands, except per share amounts)
December 31, | |||||||
2017 | 2016 | ||||||
Assets: | |||||||
Cash and due from banks | $ | 545,542 | $ | 561,838 | |||
Interest-bearing deposits | 4,347,538 | 3,560,865 | |||||
Federal funds sold and resell agreements | 159,967 | 18,742 | |||||
Total cash and cash equivalents | 5,053,047 | 4,141,445 | |||||
Securities held to maturity, at amortized cost | 1,432,098 | 2,250,460 | |||||
Securities available for sale, at estimated fair value | 10,489,009 | 10,203,277 | |||||
Trading account securities | 21,098 | 16,703 | |||||
Loans, net of unearned discounts | 13,145,665 | 11,975,392 | |||||
Less: Allowance for loan losses | (155,364 | ) | (153,045 | ) | |||
Net loans | 12,990,301 | 11,822,347 | |||||
Premises and equipment, net | 520,958 | 525,821 | |||||
Goodwill | 654,952 | 654,952 | |||||
Other intangible assets, net | 5,073 | 6,776 | |||||
Cash surrender value of life insurance policies | 180,477 | 177,884 | |||||
Accrued interest receivable and other assets | 400,867 | 396,654 | |||||
Total assets | $ | 31,747,880 | $ | 30,196,319 | |||
Liabilities: | |||||||
Deposits: | |||||||
Non-interest-bearing demand deposits | $ | 11,197,093 | $ | 10,513,369 | |||
Interest-bearing deposits | 15,675,296 | 15,298,206 | |||||
Total deposits | 26,872,389 | 25,811,575 | |||||
Federal funds purchased and repurchase agreements | 1,147,824 | 976,992 | |||||
Junior subordinated deferrable interest debentures, net of unamortized issuance costs | 136,184 | 136,127 | |||||
Subordinated notes, net of unamortized issuance costs | 98,552 | 99,990 | |||||
Accrued interest payable and other liabilities | 195,068 | 169,107 | |||||
Total liabilities | 28,450,017 | 27,193,791 | |||||
Shareholders’ Equity: | |||||||
Preferred stock, par value $0.01 per share; 10,000,000 shares authorized; 6,000,000 Series A shares ($25 liquidation preference) issued in both 2017 and 2016 | 144,486 | 144,486 | |||||
Common stock, par value $0.01 per share; 210,000,000 shares authorized; 64,236,306 shares issued at December 31, 2017 and 63,632,464 shares issued at December 31, 2016 | 642 | 637 | |||||
Additional paid-in capital | 953,361 | 906,732 | |||||
Retained earnings | 2,187,069 | 1,985,569 | |||||
Accumulated other comprehensive income, net of tax | 79,512 | (24,623 | ) | ||||
Treasury stock, at cost; 760,720 shares in 2017 and 158,243 in 2016. | (67,207 | ) | (10,273 | ) | |||
Total shareholders’ equity | 3,297,863 | 3,002,528 | |||||
Total liabilities and shareholders’ equity | $ | 31,747,880 | $ | 30,196,319 | |||
See accompanying Notes to Consolidated Financial Statements.
83
Cullen/Frost Bankers, Inc.
Consolidated Statements of Income
(Dollars in thousands, except per share amounts)
Year Ended December 31, | |||||||||||
2017 | 2016 | 2015 | |||||||||
Interest income: | |||||||||||
Loans, including fees | $ | 534,804 | $ | 458,094 | $ | 433,872 | |||||
Securities: | |||||||||||
Taxable | 92,979 | 103,025 | 112,601 | ||||||||
Tax-exempt | 222,620 | 210,918 | 194,793 | ||||||||
Interest-bearing deposits | 41,608 | 16,103 | 8,123 | ||||||||
Federal funds sold and resell agreements | 936 | 272 | 107 | ||||||||
Total interest income | 892,947 | 788,412 | 749,496 | ||||||||
Interest expense: | |||||||||||
Deposits | 17,188 | 7,248 | 9,024 | ||||||||
Federal funds purchased and repurchase agreements | 1,522 | 204 | 167 | ||||||||
Junior subordinated deferrable interest debentures | 3,955 | 3,281 | 2,725 | ||||||||
Other long-term borrowings | 3,860 | 1,343 | 948 | ||||||||
Total interest expense | 26,525 | 12,076 | 12,864 | ||||||||
Net interest income | 866,422 | 776,336 | 736,632 | ||||||||
Provision for loan losses | 35,460 | 51,673 | 51,845 | ||||||||
Net interest income after provision for loan losses | 830,962 | 724,663 | 684,787 | ||||||||
Non-interest income: | |||||||||||
Trust and investment management fees | 110,675 | 104,240 | 105,512 | ||||||||
Service charges on deposit accounts | 84,182 | 81,203 | 81,350 | ||||||||
Insurance commissions and fees | 46,169 | 47,154 | 48,926 | ||||||||
Interchange and debit card transaction fees | 23,232 | 21,369 | 19,666 | ||||||||
Other charges, commissions and fees | 39,931 | 39,623 | 37,551 | ||||||||
Net gain (loss) on securities transactions | (4,941 | ) | 14,975 | 69 | |||||||
Other | 37,222 | 41,144 | 35,656 | ||||||||
Total non-interest income | 336,470 | 349,708 | 328,730 | ||||||||
Non-interest expense: | |||||||||||
Salaries and wages | 337,068 | 318,665 | 310,504 | ||||||||
Employee benefits | 74,575 | 72,615 | 69,746 | ||||||||
Net occupancy | 75,971 | 71,627 | 65,690 | ||||||||
Technology, furniture and equipment | 74,335 | 71,208 | 64,373 | ||||||||
Deposit insurance | 20,128 | 17,428 | 14,519 | ||||||||
Intangible amortization | 1,703 | 2,429 | 3,325 | ||||||||
Other | 175,289 | 178,988 | 165,561 | ||||||||
Total non-interest expense | 759,069 | 732,960 | 693,718 | ||||||||
Income before income taxes | 408,363 | 341,411 | 319,799 | ||||||||
Income taxes | 44,214 | 37,150 | 40,471 | ||||||||
Net income | 364,149 | 304,261 | 279,328 | ||||||||
Preferred stock dividends | 8,063 | 8,063 | 8,063 | ||||||||
Net income available to common shareholders | $ | 356,086 | $ | 296,198 | $ | 271,265 | |||||
Earnings per common share: | |||||||||||
Basic | $ | 5.56 | $ | 4.73 | $ | 4.31 | |||||
Diluted | 5.51 | 4.70 | 4.28 | ||||||||
See accompanying Notes to Consolidated Financial Statements.
84
Cullen/Frost Bankers, Inc.
Consolidated Statements of Comprehensive Income
(Dollars in thousands)
Year Ended December 31, | |||||||||||
2017 | 2016 | 2015 | |||||||||
Net income | $ | 364,149 | $ | 304,261 | $ | 279,328 | |||||
Other comprehensive income (loss), before tax: | |||||||||||
Securities available for sale and transferred securities: | |||||||||||
Change in net unrealized gain/loss during the period | 157,016 | (175,061 | ) | (12,450 | ) | ||||||
Change in net unrealized gain on securities transferred to held to maturity | (16,193 | ) | (32,207 | ) | (33,601 | ) | |||||
Reclassification adjustment for net (gains) losses included in net income | 4,941 | (14,975 | ) | (69 | ) | ||||||
Total securities available for sale and transferred securities | 145,764 | (222,243 | ) | (46,120 | ) | ||||||
Defined-benefit post-retirement benefit plans: | |||||||||||
Change in the net actuarial gain/loss | (597 | ) | 1,914 | (3,877 | ) | ||||||
Reclassification adjustment for net amortization of actuarial gain/loss included in net income as a component of net periodic cost (benefit) | 5,429 | 7,274 | 6,995 | ||||||||
Total defined-benefit post-retirement benefit plans | 4,832 | 9,188 | 3,118 | ||||||||
Other comprehensive income (loss), before tax | 150,596 | (213,055 | ) | (43,002 | ) | ||||||
Deferred tax expense (benefit) | 46,461 | (74,569 | ) | (15,051 | ) | ||||||
Other comprehensive income (loss), net of tax | 104,135 | (138,486 | ) | (27,951 | ) | ||||||
Comprehensive income | $ | 468,284 | $ | 165,775 | $ | 251,377 | |||||
See accompanying Notes to Consolidated Financial Statements.
85
Cullen/Frost Bankers, Inc.
Consolidated Statement of Changes in Shareholders’ Equity
(Dollars in thousands, except per share amounts)
Preferred Stock | Common Stock | Additional Paid-In Capital | Retained Earnings | Accumulated Other Comprehensive Income (Loss), Net of Tax | Treasury Stock | Total | |||||||||||||||||||||
Balance at January 1, 2015 | $ | 144,486 | $ | 637 | $ | 886,476 | $ | 1,710,324 | $ | 141,814 | $ | (32,334 | ) | $ | 2,851,403 | ||||||||||||
Net income | — | — | — | 279,328 | — | — | 279,328 | ||||||||||||||||||||
Other comprehensive loss, net of tax | — | — | — | — | (27,951 | ) | — | (27,951 | ) | ||||||||||||||||||
Stock option exercises/stock unit conversions (321,266 shares) | — | — | (2,248 | ) | (4,240 | ) | — | 21,341 | 14,853 | ||||||||||||||||||
Tax benefits from stock-based compensation | — | — | 1,434 | — | — | — | 1,434 | ||||||||||||||||||||
Stock-based compensation expense recognized in earnings | — | — | 12,737 | — | — | — | 12,737 | ||||||||||||||||||||
Non-vested stock awards (15,790 shares) | — | — | (1,049 | ) | — | — | 1,049 | — | |||||||||||||||||||
Purchase of treasury stock (1,504,146 shares) | — | — | — | — | — | (101,237 | ) | (101,237 | ) | ||||||||||||||||||
Cash dividends - preferred stock (approximately $1.34 per share) | — | — | — | (8,063 | ) | — | — | (8,063 | ) | ||||||||||||||||||
Cash dividends - common stock ($2.10 per share) | — | — | — | (132,161 | ) | — | — | (132,161 | ) | ||||||||||||||||||
Balance at December 31, 2015 | 144,486 | 637 | 897,350 | 1,845,188 | 113,863 | (111,181 | ) | 2,890,343 | |||||||||||||||||||
Net income | — | — | — | 304,261 | — | — | 304,261 | ||||||||||||||||||||
Other comprehensive income, net of tax | — | — | — | — | (138,486 | ) | — | (138,486 | ) | ||||||||||||||||||
Stock option exercises/stock unit conversions (1,509,121 shares) | — | — | (2,417 | ) | (20,915 | ) | — | 102,198 | 78,866 | ||||||||||||||||||
Stock-based compensation expense recognized in earnings | — | — | 11,799 | — | — | — | 11,799 | ||||||||||||||||||||
Purchase of treasury stock (17,233 shares) | — | — | — | — | — | (1,290 | ) | (1,290 | ) | ||||||||||||||||||
Cash dividends – preferred stock (approximately $1.34 per share) | — | — | — | (8,063 | ) | — | — | (8,063 | ) | ||||||||||||||||||
Cash dividends – common stock ($2.15 per share) | — | — | — | (134,902 | ) | — | — | (134,902 | ) | ||||||||||||||||||
Balance at December 31, 2016 | 144,486 | 637 | 906,732 | 1,985,569 | (24,623 | ) | (10,273 | ) | 3,002,528 | ||||||||||||||||||
Net income | — | — | — | 364,149 | — | — | 364,149 | ||||||||||||||||||||
Other comprehensive loss, net of tax | — | — | — | — | 104,135 | — | 104,135 | ||||||||||||||||||||
Stock option exercises/stock unit conversions (1,150,920 shares) | — | 5 | 33,616 | (10,414 | ) | — | 44,539 | 67,746 | |||||||||||||||||||
Stock-based compensation expense recognized in earnings | — | — | 13,013 | — | — | — | 13,013 | ||||||||||||||||||||
Purchase of treasury stock (1,149,555 shares) | — | — | — | — | — | (101,473 | ) | (101,473 | ) | ||||||||||||||||||
Cash dividends – preferred stock (approximately $1.34 per share) | — | — | — | (8,063 | ) | — | — | (8,063 | ) | ||||||||||||||||||
Cash dividends – common stock ($2.25 per share) | — | — | — | (144,172 | ) | — | — | (144,172 | ) | ||||||||||||||||||
Balance at December 31, 2017 | $ | 144,486 | $ | 642 | $ | 953,361 | $ | 2,187,069 | $ | 79,512 | $ | (67,207 | ) | $ | 3,297,863 | ||||||||||||
See accompanying Notes to Consolidated Financial Statements
86
Cullen/Frost Bankers, Inc.
Consolidated Statements of Cash Flows
(Dollars in thousands)
Year Ended December 31, | |||||||||||
2017 | 2016 | 2015 | |||||||||
Operating Activities: | |||||||||||
Net income | $ | 364,149 | $ | 304,261 | $ | 279,328 | |||||
Adjustments to reconcile net income to net cash from operating activities: | |||||||||||
Provision for loan losses | 35,460 | 51,673 | 51,845 | ||||||||
Deferred tax expense (benefit) | (14,493 | ) | (11,598 | ) | (19,059 | ) | |||||
Accretion of loan discounts | (16,062 | ) | (15,582 | ) | (14,447 | ) | |||||
Securities premium amortization (discount accretion), net | 89,933 | 79,705 | 73,785 | ||||||||
Net (gain) loss on securities transactions | 4,941 | (14,975 | ) | (69 | ) | ||||||
Depreciation and amortization | 47,812 | 48,177 | 42,138 | ||||||||
Net (gain) loss on sale/write-down of assets/foreclosed assets | (4,697 | ) | (3,618 | ) | (1,765 | ) | |||||
Stock-based compensation | 13,013 | 11,799 | 12,737 | ||||||||
Net tax benefit from stock-based compensation | 9,062 | 5,063 | 1,434 | ||||||||
Earnings on life insurance policies | (3,190 | ) | (3,599 | ) | (3,585 | ) | |||||
Net change in: | |||||||||||
Trading account securities | (3,842 | ) | (124 | ) | (1,153 | ) | |||||
Accrued interest receivable and other assets | (55,179 | ) | (7,395 | ) | (13,038 | ) | |||||
Accrued interest payable and other liabilities | 71,172 | (5,945 | ) | (13,291 | ) | ||||||
Net cash from operating activities | 538,079 | 437,842 | 394,860 | ||||||||
Investing Activities: | |||||||||||
Securities held to maturity: | |||||||||||
Purchases | — | — | (1,350 | ) | |||||||
Sales | — | 136,719 | — | ||||||||
Maturities, calls and principal repayments | 783,176 | 228,641 | 209,425 | ||||||||
Securities available for sale: | |||||||||||
Purchases | (13,529,192 | ) | (16,419,833 | ) | (14,147,908 | ) | |||||
Sales | 11,963,359 | 14,847,380 | 12,683,169 | ||||||||
Maturities, calls and principal repayments | 1,328,143 | 335,750 | 658,199 | ||||||||
Proceeds from sale of loans | — | 30,470 | — | ||||||||
Net change in loans | (1,187,631 | ) | (538,989 | ) | (500,990 | ) | |||||
Net cash (paid) received in acquisitions | — | (492 | ) | — | |||||||
Benefits received on life insurance policies | 597 | 906 | 444 | ||||||||
Proceeds from sales of premises and equipment | 4,525 | 58,774 | 2,538 | ||||||||
Purchases of premises and equipment | (34,089 | ) | (53,648 | ) | (147,129 | ) | |||||
Proceeds from sales of repossessed properties | 517 | 341 | 4,682 | ||||||||
Net cash from investing activities | (670,595 | ) | (1,373,981 | ) | (1,238,920 | ) | |||||
Financing Activities: | |||||||||||
Net change in deposits | 1,060,814 | 1,467,980 | 207,665 | ||||||||
Net change in short-term borrowings | 170,832 | 83,470 | 90,403 | ||||||||
Proceeds from issuance of subordinated notes | 98,434 | — | — | ||||||||
Principal payments on subordinated notes | (100,000 | ) | — | — | |||||||
Proceeds from stock option exercises | 67,746 | 78,866 | 14,853 | ||||||||
Purchase of treasury stock | (101,473 | ) | (1,290 | ) | (101,237 | ) | |||||
Cash dividends paid on preferred stock | (8,063 | ) | (8,063 | ) | (8,063 | ) | |||||
Cash dividends paid on common stock | (144,172 | ) | (134,902 | ) | (132,161 | ) | |||||
Net cash from financing activities | 1,044,118 | 1,486,061 | 71,460 | ||||||||
Net change in cash and cash equivalents | 911,602 | 549,922 | (772,600 | ) | |||||||
Cash and cash equivalents at beginning of year | 4,141,445 | 3,591,523 | 4,364,123 | ||||||||
Cash and cash equivalents at end of year | $ | 5,053,047 | $ | 4,141,445 | $ | 3,591,523 | |||||
See accompanying Notes to Consolidated Financial Statements.
87
Cullen/Frost Bankers, Inc.
Notes To Consolidated Financial Statements
(Table amounts in thousands, except share and per share amounts)
Note 1 - Summary of Significant Accounting Policies
Nature of Operations. Cullen/Frost Bankers, Inc. (“Cullen/Frost”) is a financial holding company and a bank holding company headquartered in San Antonio, Texas that provides, through its subsidiaries, a broad array of products and services throughout numerous Texas markets. The terms “Cullen/Frost,” “the Corporation,” “we,” “us” and “our” mean Cullen/Frost Bankers, Inc. and its subsidiaries, when appropriate. In addition to general commercial and consumer banking, other products and services offered include trust and investment management, insurance, brokerage, mutual funds, leasing, treasury management, capital markets advisory and item processing.
Basis of Presentation. The consolidated financial statements include the accounts of Cullen/Frost and all other entities in which Cullen/Frost has a controlling financial interest. All significant intercompany balances and transactions have been eliminated in consolidation. The accounting and financial reporting policies we follow conform, in all material respects, to accounting principles generally accepted in the United States and to general practices within the financial services industry.
We determine whether we have a controlling financial interest in an entity by first evaluating whether the entity is a voting interest entity or a variable interest entity (“VIE”) under accounting principles generally accepted in the United States. Voting interest entities are entities in which the total equity investment at risk is sufficient to enable the entity to finance itself independently and provides the equity holders with the obligation to absorb losses, the right to receive residual returns and the right to make decisions about the entity’s activities. We consolidate voting interest entities in which we have all, or at least a majority of, the voting interest. As defined in applicable accounting standards, VIEs are entities that lack one or more of the characteristics of a voting interest entity. A controlling financial interest in a VIE is present when an enterprise has both the power to direct the activities of the VIE that most significantly impact the VIE’s economic performance and an obligation to absorb losses or the right to receive benefits that could potentially be significant to the VIE. The enterprise with a controlling financial interest, known as the primary beneficiary, consolidates the VIE. Our wholly owned subsidiaries Cullen/Frost Capital Trust II and WNB Capital Trust I are VIEs for which we are not the primary beneficiary. Accordingly, the accounts of these trusts are not included in our consolidated financial statements.
We have evaluated subsequent events for potential recognition and/or disclosure through the date these consolidated financial statements were issued. All acquisitions during the reported periods were accounted for using the purchase method. Accordingly, the operating results of the acquired companies are included with our results of operations since their respective dates of acquisition.
Use of Estimates. The preparation of financial statements in conformity with accounting principles generally accepted in the United States requires management to make estimates and assumptions that affect the reported amounts of assets and liabilities and disclosure of contingent assets and liabilities at the date of the financial statements. Actual results could differ from those estimates. The allowance for loan losses and the fair values of financial instruments and the status of contingencies are particularly subject to change.
Concentrations and Restrictions on Cash and Cash Equivalents. We maintain deposits with other financial institutions in amounts that exceed federal deposit insurance coverage. Furthermore, federal funds sold are essentially uncollateralized loans to other financial institutions. Management regularly evaluates the credit risk associated with the counterparties to these transactions and believes that we are not exposed to any significant credit risks on cash and cash equivalents.
We were required to have $179.6 million and $176.6 million of cash on hand or on deposit with the Federal Reserve Bank to meet regulatory reserve and clearing requirements at December 31, 2017 and 2016. These deposits with the Federal Reserve Bank do not earn interest. Additionally, as of December 31, 2017 and 2016, we had $19.6 million and $14.7 million in cash collateral on deposit with other financial institution counterparties to interest rate swap transactions.
88
Cash Flow Reporting. Cash and cash equivalents include cash, deposits with other financial institutions that have an initial maturity of less than 90 days when acquired by us, federal funds sold and resell agreements. Net cash flows are reported for loans, deposit transactions and short-term borrowings. Additional cash flow information was as follows:
Year Ended December 31, | |||||||||||
2017 | 2016 | 2015 | |||||||||
Cash paid for interest | $ | 24,371 | $ | 11,886 | $ | 12,982 | |||||
Cash paid for income tax | 56,359 | 50,427 | 57,086 | ||||||||
Significant non-cash transactions: | |||||||||||
Deferred gain on sale of building and parking garage | — | 7,099 | — | ||||||||
Unsettled purchases/sales of securities | 37,481 | — | 2,998 | ||||||||
Loans foreclosed and transferred to other real estate owned and foreclosed assets | 279 | — | 933 | ||||||||
Loans to facilitate the sale of other real estate owned | — | 753 | 20 | ||||||||
Repurchase/Resell Agreements. We purchase certain securities under agreements to resell. The amounts advanced under these agreements represent short-term loans and are reflected as assets in the accompanying consolidated balance sheets. The securities underlying these agreements are book-entry securities. We also sell certain securities under agreements to repurchase. The agreements are treated as collateralized financing transactions and the obligations to repurchase securities sold are reflected as a liability in the accompanying consolidated balance sheets. The dollar amount of the securities underlying the agreements remain in the asset accounts.
Securities. Securities are classified as held to maturity and carried at amortized cost when management has the positive intent and ability to hold them until maturity. Securities to be held for indefinite periods of time are classified as available for sale and carried at fair value, with the unrealized holding gains and losses reported as a component of other comprehensive income, net of tax. Securities held for resale in anticipation of short-term market movements are classified as trading and are carried at fair value, with changes in unrealized holding gains and losses included in income. Management determines the appropriate classification of securities at the time of purchase. Securities with limited marketability, such as stock in the Federal Reserve Bank and the Federal Home Loan Bank, are carried at cost.
Purchase premiums and discounts on securities are amortized or accreted to interest income over the expected lives of the securities using the interest method with a constant effective yield. Expectations related to prepayments are considered in the calculation of the constant effective yield necessary to apply the interest method for mortgage-backed securities and certain pools of municipal securities. Premium amortization and discount accretion for mortgage-backed securities and pools of municipal securities is adjusted for changes in prepayment estimates, as applicable.
Realized gains and losses are derived from the amortized cost of the security sold. Declines in the fair value of held-to-maturity and available-for-sale securities below their cost that are deemed to be other than temporary are reflected in earnings as realized losses. In estimating other-than-temporary impairment losses, management considers, among other things, (i) the length of time and the extent to which the fair value has been less than cost, (ii) the financial condition and near-term prospects of the issuer and (iii) the intent and our ability to retain our investment in the issuer for a period of time sufficient to allow for any anticipated recovery in fair value.
Loans. Loans are reported at the principal balance outstanding net of unearned discounts. Interest income on loans is reported on the level-yield method and includes amortization of deferred loan fees and costs over the loan term. Net loan commitment fees or costs for commitment periods greater than one year are deferred and amortized into fee income or other expense on a straight-line basis over the commitment period. Income on direct financing leases is recognized on a basis that achieves a constant periodic rate of return on the outstanding investment. Further information regarding our accounting policies related to past due loans, non-accrual loans, impaired loans and troubled-debt restructurings is presented in Note 3 - Loans.
Loans Acquired Through Transfer. Loans acquired through the completion of a transfer, including loans acquired in a business combination, are initially recorded at fair value.
Acquired loans that have evidence of deterioration of credit quality since origination and for which it is probable, at acquisition, that we will be unable to collect all contractually required payments receivable are considered to be purchased credit-impaired. For purchased credit-impaired loans, the difference between the undiscounted cash flows expected at acquisition and the recorded fair value of the loan, or the “accretable yield,” is recognized as interest income
89
on a level-yield method over the life of the loan. Contractually required payments for interest and principal that exceed the undiscounted cash flows expected at acquisition, or the “nonaccretable difference,” are not recognized as a yield adjustment or as a loss accrual or a valuation allowance. Increases in expected cash flows subsequent to the initial investment are recognized prospectively through adjustment of the yield on the loan over its remaining life. Decreases in expected cash flows are recognized as impairment. Valuation allowances on these impaired loans reflect only losses incurred after the acquisition (meaning the present value of all cash flows expected at acquisition that ultimately are not to be received).
For acquired loans that are not deemed to be purchased credit-impaired at acquisition, the difference between the initial fair value and the unpaid principal balance is recognized as interest income on a level-yield basis over the lives of the related loans. Subsequent to acquisition, any valuation allowance on these loans reflects only the portion of probable losses that exceeds any unaccreted purchase discounts on these loans as of the measurement date.
Allowance for Loan Losses. The allowance for loan losses is a reserve established through a provision for loan losses charged to expense, which represents management’s best estimate of inherent losses that have been incurred within the existing portfolio of loans. The allowance, in the judgment of management, is necessary to reserve for estimated loan losses inherent in the loan portfolio. The allowance for loan losses includes allowance allocations calculated in accordance with Financial Accounting Standards Board (“FASB”) Accounting Standards Codification (“ASC”) Topic 310, “Receivables” and allowance allocations calculated in accordance with ASC Topic 450, “Contingencies.” Further information regarding our policies and methodology used to estimate the allowance for loan losses is presented in Note 3 - Loans.
Premises and Equipment. Land is carried at cost. Building and improvements, and furniture and equipment are carried at cost, less accumulated depreciation, computed principally by the straight-line method based on the estimated useful lives of the related property. Leasehold improvements are generally depreciated over the lesser of the term of the respective leases or the estimated useful lives of the improvements.
Foreclosed Assets. Assets acquired through or instead of loan foreclosure are held for sale and are initially recorded at fair value less estimated selling costs when acquired, establishing a new cost basis. Costs after acquisition are generally expensed. If the fair value of the asset declines, a write-down is recorded through expense. The valuation of foreclosed assets is subjective in nature and may be adjusted in the future because of changes in economic conditions. Foreclosed assets are included in other assets in the accompanying consolidated balance sheets and totaled $2.1 million and $2.4 million at December 31, 2017 and 2016.
Goodwill. Goodwill represents the excess of the cost of businesses acquired over the fair value of the net assets acquired. Goodwill is assigned to reporting units and tested for impairment at least annually on October 1st, or on an interim basis if an event occurs or circumstances change that would more likely than not reduce the fair value of the reporting unit below its carrying value. See Note 5 - Goodwill and Other Intangible Assets.
Intangibles and Other Long-Lived Assets. Intangible assets are acquired assets that lack physical substance but can be distinguished from goodwill because of contractual or other legal rights or because the asset is capable of being sold or exchanged either on its own or in combination with a related contract, asset, or liability. Our intangible assets relate to core deposits, non-compete agreements and customer relationships. Intangible assets with definite useful lives are amortized on an accelerated basis over their estimated life. Intangible assets with indefinite useful lives are not amortized until their lives are determined to be definite. Intangible assets, premises and equipment and other long-lived assets are tested for impairment whenever events or changes in circumstances indicate the carrying amount of the assets may not be recoverable from future undiscounted cash flows. If impaired, the assets are recorded at fair value. See Note 5 - Goodwill and Other Intangible Assets.
Insurance Commissions and Fees. Commission revenue is recognized as of the effective date of the insurance policy. We also receive contingent commissions from insurance companies as additional incentive for achieving specified premium volume goals and/or the loss experience of the insurance placed by us. Contingent commissions from insurance companies are recognized when determinable, which is generally when such commissions are received or when we receive data from the insurance companies that allows the reasonable estimation of these amounts.
Share-Based Payments. Compensation expense for stock options, non-vested stock awards/stock units and deferred stock units is based on the fair value of the award on the measurement date, which, for us, is the date of the grant and is recognized ratably over the service period of the award. Compensation expense for performance stock units is based on the fair value of the award on the measurement date, which, for us, is the date of the grant and is recognized over
90
the service period of the award based upon the probable number of units expected to vest. The fair value of stock options is estimated using a binomial lattice-based valuation model. The fair value of non-vested stock awards/stock units and deferred stock units is generally the market price of our stock on the date of grant. The fair value of performance stock units is generally the market price of our stock on the date of grant discounted by the present value of the dividends expected to be paid on our common stock during the service period of the award because dividend equivalent payments on performance stock units are deferred until such time that the units vest and shares are issued. The impact of forfeitures of share-based payment awards on compensation expense is recognized as forfeitures occur.
Advertising Costs. Advertising costs are expensed as incurred.
Income Taxes. Income tax expense is the total of the current year income tax due or refundable and the change in deferred tax assets and liabilities (excluding deferred tax assets and liabilities related to business combinations or components of other comprehensive income). Deferred tax assets and liabilities are the expected future tax amounts for the temporary differences between carrying amounts and tax bases of assets and liabilities, computed using enacted tax rates. A valuation allowance, if needed, reduces deferred tax assets to the expected amount most likely to be realized. Realization of deferred tax assets is dependent upon the generation of a sufficient level of future taxable income and recoverable taxes paid in prior years. Although realization is not assured, management believes it is more likely than not that all of the deferred tax assets will be realized. Interest and/or penalties related to income taxes are reported as a component of income tax expense. The income tax effects related to settlements of share-based payment awards are reported in earnings as an increase (or decrease) to income tax expense (see Note 13 - Income Taxes). Prior to 2016, income tax benefits at settlement of an award were reported as an increase (or decrease) to additional paid-in capital to the extent that those benefits were greater than (or less than) the income tax benefits recognized in earnings during the award's vesting period.
We file a consolidated income tax return with our subsidiaries. Federal income tax expense or benefit has been allocated to subsidiaries on a separate return basis.
Basic and Diluted Earnings Per Common Share. Earnings per common share is computed using the two-class method prescribed under ASC Topic 260, “Earnings Per Share.” ASC Topic 260 provides that unvested share-based payment awards that contain nonforfeitable rights to dividends or dividend equivalents (whether paid or unpaid) are participating securities and shall be included in the computation of earnings per share pursuant to the two-class method. We have determined that our outstanding non-vested stock awards/stock units and deferred stock units are participating securities.
Under the two-class method, basic earnings per common share is computed by dividing net earnings allocated to common stock by the weighted-average number of common shares outstanding during the applicable period, excluding outstanding participating securities. Diluted earnings per common share is computed using the weighted-average number of shares determined for the basic earnings per common share computation plus the dilutive effect of stock compensation using the treasury stock method. A reconciliation of the weighted-average shares used in calculating basic earnings per common share and the weighted average common shares used in calculating diluted earnings per common share for the reported periods is provided in Note 10 - Earnings Per Common Share.
Comprehensive Income. Comprehensive income includes all changes in shareholders’ equity during a period, except those resulting from transactions with shareholders. Besides net income, other components of our comprehensive income include the after tax effect of changes in the net unrealized gain/loss on securities available for sale, changes in the net unrealized gain on securities transferred to held to maturity and changes in the net actuarial gain/loss on defined benefit post-retirement benefit plans. See Note 14 - Other Comprehensive Income (Loss).
Derivative Financial Instruments. Our hedging policies permit the use of various derivative financial instruments to manage interest rate risk or to hedge specified assets and liabilities. All derivatives are recorded at fair value on our balance sheet. Derivatives executed with the same counterparty are generally subject to master netting arrangements, however, fair value amounts recognized for derivatives and fair value amounts recognized for the right/obligation to reclaim/return cash collateral are not offset for financial reporting purposes. We may be required to recognize certain contracts and commitments as derivatives when the characteristics of those contracts and commitments meet the definition of a derivative.
To qualify for hedge accounting, derivatives must be highly effective at reducing the risk associated with the exposure being hedged and must be designated as a hedge at the inception of the derivative contract. We consider a hedge to be highly effective if the change in fair value of the derivative hedging instrument is within 80% to 125% of the opposite change in the fair value of the hedged item attributable to the hedged risk. If derivative instruments are designated as
91
hedges of fair values, and such hedges are highly effective, both the change in the fair value of the hedge and the hedged item are included in current earnings. Fair value adjustments related to cash flow hedges are recorded in other comprehensive income and are reclassified to earnings when the hedged transaction is reflected in earnings. Ineffective portions of hedges are reflected in earnings as they occur. Actual cash receipts and/or payments and related accruals on derivatives related to hedges are recorded as adjustments to the interest income or interest expense associated with the hedged item. During the life of the hedge, we formally assess whether derivatives designated as hedging instruments continue to be highly effective in offsetting changes in the fair value or cash flows of hedged items. If it is determined that a hedge has ceased to be highly effective, we will discontinue hedge accounting prospectively. At such time, previous adjustments to the carrying value of the hedged item are reversed into current earnings and the derivative instrument is reclassified to a trading position recorded at fair value.
Fair Value Measurements. In general, fair values of financial instruments are based upon quoted market prices, where available. If such quoted market prices are not available, fair value is based upon internally developed models that primarily use, as inputs, observable market-based parameters. Valuation adjustments may be made to ensure that financial instruments are recorded at fair value. These adjustments may include amounts to reflect counterparty credit quality and our creditworthiness, among other things, as well as unobservable parameters. Any such valuation adjustments are applied consistently over time. See Note 17 - Fair Value Measurements.
Transfers of Financial Assets. Transfers of financial assets are accounted for as sales when control over the assets has been surrendered. Control over transferred assets is deemed to be surrendered when (i) the assets have been isolated from us, (ii) the transferee obtains the right (free of conditions that constrain it from taking advantage of that right) to pledge or exchange the transferred assets, and (iii) we do not maintain effective control over the transferred assets through an agreement to repurchase them before their maturity.
Loss Contingencies. Loss contingencies, including claims and legal actions arising in the ordinary course of business are recorded as liabilities when the likelihood of loss is probable and an amount or range of loss can be reasonably estimated.
Trust Assets. Assets of our trust department, other than cash on deposit at Frost Bank, are not included in the accompanying financial statements because they are not our assets.
Accounting Changes, Reclassifications and Restatement. Certain items in prior financial statements have been reclassified to conform to the current presentation.
Note 2 - Securities
Securities. Year-end securities held to maturity and available for sale consisted of the following:
2017 | 2016 | ||||||||||||||||||||||||||||||
Amortized Cost | Gross Unrealized Gains | Gross Unrealized Losses | Estimated Fair Value | Amortized Cost | Gross Unrealized Gains | Gross Unrealized Losses | Estimated Fair Value | ||||||||||||||||||||||||
Held to Maturity: | |||||||||||||||||||||||||||||||
U.S. Treasury | $ | — | $ | — | $ | — | $ | — | $ | 249,889 | $ | 1,762 | $ | — | $ | 251,651 | |||||||||||||||
Residential mortgage-backed securities | 3,610 | 15 | 38 | 3,587 | 4,511 | 39 | — | 4,550 | |||||||||||||||||||||||
States and political subdivisions | 1,428,488 | 26,462 | 2,746 | 1,452,204 | 1,994,710 | 16,821 | 6,335 | 2,005,196 | |||||||||||||||||||||||
Other | — | — | — | — | 1,350 | — | — | 1,350 | |||||||||||||||||||||||
Total | $ | 1,432,098 | $ | 26,477 | $ | 2,784 | $ | 1,455,791 | $ | 2,250,460 | $ | 18,622 | $ | 6,335 | $ | 2,262,747 | |||||||||||||||
Available for Sale: | |||||||||||||||||||||||||||||||
U.S. Treasury | $ | 3,453,391 | $ | 7,494 | $ | 15,732 | $ | 3,445,153 | $ | 4,003,692 | $ | 24,984 | $ | 8,945 | $ | 4,019,731 | |||||||||||||||
Residential mortgage-backed securities | 648,288 | 19,048 | 2,250 | 665,086 | 756,072 | 30,388 | 1,293 | 785,167 | |||||||||||||||||||||||
States and political subdivisions | 6,185,711 | 167,293 | 16,795 | 6,336,209 | 5,403,918 | 50,101 | 98,134 | 5,355,885 | |||||||||||||||||||||||
Other | 42,561 | — | — | 42,561 | 42,494 | — | — | 42,494 | |||||||||||||||||||||||
Total | $ | 10,329,951 | $ | 193,835 | $ | 34,777 | $ | 10,489,009 | $ | 10,206,176 | $ | 105,473 | $ | 108,372 | $ | 10,203,277 | |||||||||||||||
92
All mortgage-backed securities included in the above table were issued by U.S. government agencies and corporations. At December 31, 2017, approximately 98.2% of the securities in our municipal bond portfolio were issued by political subdivisions or agencies within the State of Texas, of which approximately 67.8% are either guaranteed by the Texas Permanent School Fund, which has a “triple-A” insurer financial strength rating, or are secured by U.S. Treasury securities via defeasance of the debt by the issuers. Securities with limited marketability, such as stock in the Federal Reserve Bank and the Federal Home Loan Bank, are carried at cost and are reported as other available for sale securities in the table above. The carrying value of securities pledged to secure public funds, trust deposits, repurchase agreements and for other purposes, as required or permitted by law was $3.8 billion at December 31, 2017 and $3.9 billion at December 31, 2016.
During 2012, we reclassified certain securities from available for sale to held to maturity. The securities had an aggregate fair value of $2.3 billion with an aggregate net unrealized gain of $165.7 million ($107.7 million, net of tax) on the date of the transfer. The net unamortized, unrealized gain on the remaining transferred securities included in accumulated other comprehensive income in the accompanying balance sheet totaled $11.6 million ($7.5 million, net of tax) at December 31, 2017 and $27.7 million ($18.0 million, net of tax) at December 31, 2016. This amount will be amortized out of accumulated other comprehensive income over the remaining life of the underlying securities as an adjustment of the yield on those securities.
Unrealized Losses. Year-end securities with unrealized losses, segregated by length of impairment, were as follows:
Less than 12 Months | More than 12 Months | Total | |||||||||||||||||||||
Estimated Fair Value | Unrealized Losses | Estimated Fair Value | Unrealized Losses | Estimated Fair Value | Unrealized Losses | ||||||||||||||||||
2017 | |||||||||||||||||||||||
Held to Maturity: | |||||||||||||||||||||||
Residential mortgage-backed securities | $ | 2,694 | $ | 38 | $ | — | $ | — | $ | 2,694 | $ | 38 | |||||||||||
States and political subdivisions | 28,591 | 58 | 74,113 | 2,688 | 102,704 | 2,746 | |||||||||||||||||
Total | $ | 31,285 | $ | 96 | $ | 74,113 | $ | 2,688 | $ | 105,398 | $ | 2,784 | |||||||||||
Available for Sale: | |||||||||||||||||||||||
U.S. Treasury | $ | 2,336,081 | $ | 9,861 | $ | 517,575 | $ | 5,871 | $ | 2,853,656 | $ | 15,732 | |||||||||||
Residential mortgage-backed securities | 144,264 | 949 | 45,436 | 1,301 | 189,700 | 2,250 | |||||||||||||||||
States and political subdivisions | 148,575 | 1,194 | 838,329 | 15,601 | 986,904 | 16,795 | |||||||||||||||||
Total | $ | 2,628,920 | $ | 12,004 | $ | 1,401,340 | $ | 22,773 | $ | 4,030,260 | $ | 34,777 | |||||||||||
Less than 12 Months | More than 12 Months | Total | |||||||||||||||||||||
Estimated Fair Value | Unrealized Losses | Estimated Fair Value | Unrealized Losses | Estimated Fair Value | Unrealized Losses | ||||||||||||||||||
2016 | |||||||||||||||||||||||
Held to Maturity: | |||||||||||||||||||||||
States and political subdivisions | $ | 425,896 | $ | 2,596 | $ | 183,245 | $ | 3,739 | $ | 609,141 | $ | 6,335 | |||||||||||
Total | $ | 425,896 | $ | 2,596 | $ | 183,245 | $ | 3,739 | $ | 609,141 | $ | 6,335 | |||||||||||
Available for Sale: | |||||||||||||||||||||||
U.S. Treasury | $ | 1,421,216 | $ | 8,945 | $ | — | $ | — | $ | 1,421,216 | $ | 8,945 | |||||||||||
Residential mortgage-backed securities | 81,442 | 1,031 | 6,413 | 262 | 87,855 | 1,293 | |||||||||||||||||
States and political subdivisions | 2,695,997 | 98,134 | — | — | 2,695,997 | 98,134 | |||||||||||||||||
Total | $ | 4,198,655 | $ | 108,110 | $ | 6,413 | $ | 262 | $ | 4,205,068 | $ | 108,372 | |||||||||||
Declines in the fair value of held-to-maturity and available-for-sale securities below their cost that are deemed to be other than temporary are reflected in earnings as realized losses to the extent the impairment is related to credit losses. The amount of the impairment related to other factors is recognized in other comprehensive income. In estimating other-than-temporary impairment losses, management considers, among other things, (i) the length of time and the extent to which the fair value has been less than cost, (ii) the financial condition and near-term prospects of the issuer, and (iii) the intent and our ability to retain our investment in the issuer for a period of time sufficient to allow for any anticipated recovery in cost.
93
Management has the ability and intent to hold the securities classified as held to maturity in the table above until they mature, at which time we expect to receive full value for the securities. Furthermore, as of December 31, 2017, management does not have the intent to sell any of the securities classified as available for sale in the table above and believes that it is more likely than not that we will not have to sell any such securities before a recovery of cost. Any unrealized losses are due to increases in market interest rates over the yields available at the time the underlying securities were purchased. The fair value is expected to recover as the securities approach their maturity date or repricing date or if market yields for such investments decline. Management does not believe any of the securities are impaired due to reasons of credit quality. Accordingly, as of December 31, 2017, management believes the impairments detailed in the table above are temporary and no impairment loss has been realized in our consolidated income statement.
Contractual Maturities. The amortized cost and estimated fair value of securities, excluding trading securities, at December 31, 2017 are presented below by contractual maturity. Expected maturities may differ from contractual maturities because issuers may have the right to call or prepay obligations. Residential mortgage-backed securities and equity securities are shown separately since they are not due at a single maturity date.
Held to Maturity | Available for Sale | ||||||||||||||
Amortized Cost | Estimated Fair Value | Amortized Cost | Estimated Fair Value | ||||||||||||
Due in one year or less | $ | 264,587 | $ | 267,924 | $ | 57,390 | $ | 58,057 | |||||||
Due after one year through five years | 159,765 | 163,819 | 4,063,797 | 4,056,508 | |||||||||||
Due after five years through ten years | 386,711 | 391,784 | 425,148 | 439,008 | |||||||||||
Due after ten years | 617,425 | 628,677 | 5,092,767 | 5,227,789 | |||||||||||
Residential mortgage-backed securities | 3,610 | 3,587 | 648,288 | 665,086 | |||||||||||
Equity securities | — | — | 42,561 | 42,561 | |||||||||||
Total | $ | 1,432,098 | $ | 1,455,791 | $ | 10,329,951 | $ | 10,489,009 | |||||||
Sales of Securities. During 2016, we sold certain securities issued by municipalities that, based upon our internal credit analysis, had experienced significant deterioration in creditworthiness. The risk exposure presented by these municipalities had increased beyond acceptable levels and we determined that it was reasonably possible that all amounts due would not be collected. In the first case, our credit analysis determined that most of the affected municipalities had been significantly impacted by the significant decline in market oil prices due to the fact that their tax bases are heavily reliant on the energy industry relative to other sectors of the economy. Specifically, the revenues of these municipalities had been adversely impacted by the sustained low-level of oil prices. Additionally, some of these municipalities had already been downgraded or had been put on credit watch and were subsequently downgraded by various credit rating agencies. In the second case, we sold certain securities related to a municipality that was unrelated to a reliance on the energy industry. This municipality had experienced significant deterioration in creditworthiness as a result of the emergence of significant funding obligations which resulted in credit downgrades. In both cases, some of the securities we sold were classified as held to maturity prior to their sale. Despite their classification as held to maturity, we believe the sale of these securities was merited and permissible under the applicable accounting guidelines because of the significant deterioration in the creditworthiness of the issuers.
Sales of securities held to maturity were as follows:
2017 | 2016 | 2015 | |||||||||
Proceeds from sales | $ | — | $ | 136,719 | $ | — | |||||
Amortized cost | — | 132,974 | — | ||||||||
Gross realized gains | — | 3,770 | — | ||||||||
Gross realized losses | — | (25 | ) | — | |||||||
Tax expense related to securities gains/losses | — | (1,311 | ) | — | |||||||
Sales of securities available for sale were as follows:
2017 | 2016 | 2015 | |||||||||
Proceeds from sales | $ | 11,963,359 | $ | 14,847,380 | $ | 12,683,169 | |||||
Gross realized gains | 1 | 13,289 | 228 | ||||||||
Gross realized losses | (4,942 | ) | (2,059 | ) | (159 | ) | |||||
Tax benefit (expense) related to securities gains/losses | 1,729 | (3,931 | ) | (24 | ) | ||||||
94
Premiums and Discounts. Premium amortization and discount accretion included in interest income on securities was as follows:
2017 | 2016 | 2015 | |||||||||
Premium amortization | $ | (97,841 | ) | $ | (90,782 | ) | $ | (84,467 | ) | ||
Discount accretion | 7,908 | 11,077 | 10,682 | ||||||||
Net (premium amortization) discount accretion | $ | (89,933 | ) | $ | (79,705 | ) | $ | (73,785 | ) | ||
Trading Account Securities. Year-end trading account securities, at estimated fair value, were as follows:
2017 | 2016 | ||||||
U.S. Treasury | $ | 19,210 | $ | 16,594 | |||
States and political subdivisions | 1,888 | 109 | |||||
Total | $ | 21,098 | $ | 16,703 | |||
Net gains and losses on trading account securities were as follows:
2017 | 2016 | 2015 | |||||||||
Net gain on sales transactions | $ | 1,408 | $ | 1,236 | $ | 1,109 | |||||
Net mark-to-market gains (losses) | (43 | ) | (157 | ) | (53 | ) | |||||
Net gain on trading account securities | $ | 1,365 | $ | 1,079 | $ | 1,056 | |||||
Note 3 - Loans
Year-end loans, including leases net of unearned discounts, consisted of the following:
2017 | 2016 | ||||||
Commercial and industrial | $ | 4,792,388 | $ | 4,344,000 | |||
Energy: | |||||||
Production | 1,182,326 | 971,767 | |||||
Service | 171,795 | 221,213 | |||||
Other | 144,972 | 193,081 | |||||
Total energy | 1,499,093 | 1,386,061 | |||||
Commercial real estate: | |||||||
Commercial mortgages | 3,887,742 | 3,481,157 | |||||
Construction | 1,066,696 | 1,043,261 | |||||
Land | 331,986 | 311,030 | |||||
Total commercial real estate | 5,286,424 | 4,835,448 | |||||
Consumer real estate: | |||||||
Home equity loans | 355,342 | 345,130 | |||||
Home equity lines of credit | 291,950 | 264,862 | |||||
Other | 376,002 | 326,793 | |||||
Total consumer real estate | 1,023,294 | 936,785 | |||||
Total real estate | 6,309,718 | 5,772,233 | |||||
Consumer and other | 544,466 | 473,098 | |||||
Total loans | $ | 13,145,665 | $ | 11,975,392 | |||
Concentrations of Credit. Most of our lending activity occurs within the State of Texas, including the four largest metropolitan areas of Austin, Dallas/Ft. Worth, Houston and San Antonio, as well as other markets. The majority of our loan portfolio consists of commercial and industrial and commercial real estate loans. As of December 31, 2017 and 2016, there were no concentrations of loans related to any single industry in excess of 10% of total loans other than energy loans, which totaled 11.4% and 11.6% of total loans, respectively. Unfunded commitments to extend credit and standby letters of credit issued to customers in the energy industry totaled $1.1 billion and $46.7 million, respectively, as of December 31, 2017.
95
Foreign Loans. We have U.S. dollar denominated loans and commitments to borrowers in Mexico. The outstanding balance of these loans and the unfunded amounts available under these commitments were not significant at December 31, 2017 or 2016.
Overdrafts. Deposit account overdrafts reported as loans totaled $7.3 million and $6.3 million at December 31, 2017 and 2016.
Related Party Loans. In the ordinary course of business, we have granted loans to certain directors, executive officers and their affiliates (collectively referred to as “related parties”). Activity in related party loans during 2017 is presented in the following table. Other changes were primarily related to changes in related-party status.
Balance outstanding at December 31, 2016 | $ | 142,771 | |
Principal additions | 270,684 | ||
Principal reductions | (271,325 | ) | |
Other changes | 24,273 | ||
Balance outstanding at December 31, 2017 | $ | 166,403 | |
Non-Accrual and Past Due Loans. Loans are considered past due if the required principal and interest payments have not been received as of the date such payments were due. Loans are placed on non-accrual status when, in management’s opinion, the borrower may be unable to meet payment obligations as they become due, as well as when required by regulatory provisions. In determining whether or not a borrower may be unable to meet payment obligations for each class of loans, we consider the borrower’s debt service capacity through the analysis of current financial information, if available, and/or current information with regards to our collateral position. Regulatory provisions would typically require the placement of a loan on non-accrual status if (i) principal or interest has been in default for a period of 90 days or more unless the loan is both well secured and in the process of collection or (ii) full payment of principal and interest is not expected. Loans may be placed on non-accrual status regardless of whether or not such loans are considered past due. When interest accrual is discontinued, all unpaid accrued interest is reversed. Interest income on non-accrual loans is recognized only to the extent that cash payments are received in excess of principal due. A loan may be returned to accrual status when all the principal and interest amounts contractually due are brought current and future principal and interest amounts contractually due are reasonably assured, which is typically evidenced by a sustained period (at least six months) of repayment performance by the borrower.
Year-end non-accrual loans, segregated by class of loans, were as follows:
2017 | 2016 | ||||||
Commercial and industrial | $ | 46,186 | $ | 31,475 | |||
Energy | 94,302 | 57,571 | |||||
Commercial real estate: | |||||||
Buildings, land and other | 7,589 | 8,550 | |||||
Construction | — | — | |||||
Consumer real estate | 2,109 | 2,130 | |||||
Consumer and other | 128 | 425 | |||||
Total | $ | 150,314 | $ | 100,151 | |||
As of December 31, 2017 and 2016, non-accrual loans reported in the table above included $53.6 million and $44.9 million related to loans that were restructured as “troubled debt restructurings” during 2017 and 2016, respectively. See the section captioned “Troubled Debt Restructurings” elsewhere in this note.
Had non-accrual loans performed in accordance with their original contract terms, we would have recognized additional interest income, net of tax, of approximately $3.7 million in 2017, $3.1 million in 2016 and $1.6 million in 2015.
96
An age analysis of past due loans (including both accruing and non-accruing loans), segregated by class of loans, as of December 31, 2017 was as follows:
Loans 30-89 Days Past Due | Loans 90 or More Days Past Due | Total Past Due Loans | Current Loans | Total Loans | Accruing Loans 90 or More Days Past Due | ||||||||||||||||||
Commercial and industrial | $ | 41,169 | $ | 12,418 | $ | 53,587 | $ | 4,738,801 | $ | 4,792,388 | $ | 5,589 | |||||||||||
Energy | 22,100 | 49,214 | 71,314 | 1,427,779 | 1,499,093 | 100 | |||||||||||||||||
Commercial real estate: | |||||||||||||||||||||||
Buildings, land and other | 29,714 | 4,482 | 34,196 | 4,185,532 | 4,219,728 | 2,615 | |||||||||||||||||
Construction | 2,191 | 2,331 | 4,522 | 1,062,174 | 1,066,696 | 2,331 | |||||||||||||||||
Consumer real estate | 7,707 | 4,427 | 12,134 | 1,011,160 | 1,023,294 | 3,138 | |||||||||||||||||
Consumer and other | 4,791 | 665 | 5,456 | 539,010 | 544,466 | 659 | |||||||||||||||||
Total | $ | 107,672 | $ | 73,537 | $ | 181,209 | $ | 12,964,456 | $ | 13,145,665 | $ | 14,432 | |||||||||||
Impaired Loans. Loans are considered impaired when, based on current information and events, it is probable we will be unable to collect all amounts due in accordance with the original contractual terms of the loan agreement, including scheduled principal and interest payments. Impairment is evaluated in total for smaller-balance loans of a similar nature and on an individual loan basis for other loans. If a loan is impaired, a specific valuation allowance is allocated, if necessary, so that the loan is reported net, at the present value of estimated future cash flows using the loan’s existing rate or at the fair value of collateral if repayment is expected solely from the collateral. Interest payments on impaired loans are typically applied to principal unless collectibility of the principal amount is reasonably assured, in which case interest is recognized on a cash basis. Impaired loans, or portions thereof, are charged off when deemed uncollectible.
Regulatory guidelines require us to reevaluate the fair value of collateral supporting impaired collateral dependent loans on at least an annual basis. While our policy is to comply with the regulatory guidelines, our general practice is to reevaluate the fair value of collateral supporting impaired collateral dependent loans on a quarterly basis. Thus, appraisals are generally not considered to be outdated, and we typically do not make any adjustments to the appraised values. The fair value of collateral supporting impaired collateral dependent loans is evaluated by our internal appraisal services using a methodology that is consistent with the Uniform Standards of Professional Appraisal Practice. The fair value of collateral supporting impaired collateral dependent construction loans is based on an “as is” valuation.
97
Year-end impaired loans are set forth in the following table. No interest income was recognized on impaired loans subsequent to their classification as impaired.
Unpaid Contractual Principal Balance | Recorded Investment With No Allowance | Recorded Investment With Allowance | Total Recorded Investment | Related Allowance | Average Recorded Investment | ||||||||||||||||||
2017 | |||||||||||||||||||||||
Commercial and industrial | $ | 60,781 | $ | 28,038 | $ | 15,722 | $ | 43,760 | $ | 7,553 | $ | 30,073 | |||||||||||
Energy | 99,606 | 33,080 | 61,162 | 94,242 | 13,267 | 76,492 | |||||||||||||||||
Commercial real estate: | |||||||||||||||||||||||
Buildings, land and other | 10,795 | 6,394 | — | 6,394 | — | 6,164 | |||||||||||||||||
Construction | — | — | — | — | — | — | |||||||||||||||||
Consumer real estate | 1,214 | 1,214 | — | 1,214 | — | 1,167 | |||||||||||||||||
Consumer and other | — | — | — | — | — | 11 | |||||||||||||||||
Total | $ | 172,396 | $ | 68,726 | $ | 76,884 | $ | 145,610 | $ | 20,820 | $ | 113,907 | |||||||||||
2016 | |||||||||||||||||||||||
Commercial and industrial | $ | 40,288 | $ | 19,862 | $ | 9,047 | $ | 28,909 | $ | 5,436 | $ | 26,074 | |||||||||||
Energy | 60,522 | 27,759 | 29,804 | 57,563 | 3,750 | 57,360 | |||||||||||||||||
Commercial real estate: | |||||||||||||||||||||||
Buildings, land and other | 11,369 | 6,866 | — | 6,866 | — | 17,729 | |||||||||||||||||
Construction | — | — | — | — | — | 438 | |||||||||||||||||
Consumer real estate | 977 | 655 | — | 655 | — | 537 | |||||||||||||||||
Consumer and other | 32 | 30 | — | 30 | — | 25 | |||||||||||||||||
Total | $ | 113,188 | $ | 55,172 | $ | 38,851 | $ | 94,023 | $ | 9,186 | $ | 102,163 | |||||||||||
2015 | |||||||||||||||||||||||
Commercial and industrial | $ | 26,067 | $ | 18,776 | $ | 4,084 | $ | 22,860 | $ | 2,378 | $ | 27,338 | |||||||||||
Energy | 25,240 | 8,689 | 12,450 | 21,139 | 2,000 | 7,235 | |||||||||||||||||
Commercial real estate: | |||||||||||||||||||||||
Buildings, land and other | 37,126 | 32,425 | — | 32,425 | — | 18,211 | |||||||||||||||||
Construction | 793 | 569 | — | 569 | — | 1,320 | |||||||||||||||||
Consumer real estate | 755 | 485 | — | 485 | — | 664 | |||||||||||||||||
Consumer and other | — | — | — | — | — | — | |||||||||||||||||
Total | $ | 89,981 | $ | 60,944 | $ | 16,534 | $ | 77,478 | $ | 4,378 | $ | 54,768 | |||||||||||
Troubled Debt Restructurings. The restructuring of a loan is considered a “troubled debt restructuring” if both (i) the borrower is experiencing financial difficulties and (ii) the creditor has granted a concession. Concessions may include interest rate reductions or below market interest rates, principal forgiveness, restructuring amortization schedules, reductions in collateral and other actions intended to minimize potential losses. Troubled debt restructurings that occurred during 2017, 2016 and 2015 are set forth in the following table.
2017 | 2016 | 2015 | |||||||||||||||||||||
Balance at Restructure | Balance at Year-end | Balance at Restructure | Balance at Year-end | Balance at Restructure | Balance at Year-end | ||||||||||||||||||
Commercial and industrial | $ | 4,026 | $ | 3,766 | $ | 2,148 | $ | 1,022 | $ | 709 | $ | 536 | |||||||||||
Energy | 56,096 | 54,330 | 87,572 | 43,841 | — | — | |||||||||||||||||
Commercial real estate: | |||||||||||||||||||||||
Buildings, land and other | — | — | 1,455 | — | — | — | |||||||||||||||||
Construction | 388 | 388 | 243 | — | — | — | |||||||||||||||||
$ | 60,510 | $ | 58,484 | $ | 91,418 | $ | 44,863 | $ | 709 | $ | 536 | ||||||||||||
Loan modifications are typically related to extending amortization periods, converting loans to interest only for a limited period of time, deferral of interest payments, waiver of certain covenants, consolidating notes and/or reducing collateral or interest rates. The modifications during the reported periods did not significantly impact our determination of the allowance for loan losses. Additional information related to restructured loans was as follows:
98
2017 | 2016 | 2015 | |||||||||
Restructured loans past due in excess of 90 days at period-end: | |||||||||||
Number of loans | 1 | 2 | 1 | ||||||||
Dollar amount of loans | $ | 43,137 | $ | 3,230 | $ | 259 | |||||
Restructured loans on non-accrual status at period end | 53,622 | 44,863 | 536 | ||||||||
Charge-offs of restructured loans: | |||||||||||
Recognized in connection with restructuring | — | 4,115 | 88 | ||||||||
Recognized on previously restructured loans | 9,951 | 9,490 | — | ||||||||
Proceeds from sale of restructured loans | — | 30,470 | — | ||||||||
Credit Quality Indicators. As part of the on-going monitoring of the credit quality of our loan portfolio, management tracks certain credit quality indicators including trends related to (i) the weighted-average risk grade of commercial loans, (ii) the level of classified commercial loans, (iii) the delinquency status of consumer loans (see details above) (iv) net charge-offs, (v) non-performing loans (see details above) and (vi) the general economic conditions in the State of Texas.
We utilize a risk grading matrix to assign a risk grade to each of our commercial loans. Loans are graded on a scale of 1 to 14. A description of the general characteristics of the 14 risk grades is as follows:
• | Grades 1, 2 and 3 - These grades include loans to very high credit quality borrowers of investment or near investment grade. These borrowers are generally publicly traded (grades 1 and 2), have significant capital strength, moderate leverage, stable earnings and growth, and readily available financing alternatives. Smaller entities, regardless of strength, would generally not fit in these grades. |
• | Grades 4 and 5 - These grades include loans to borrowers of solid credit quality with moderate risk. Borrowers in these grades are differentiated from higher grades on the basis of size (capital and/or revenue), leverage, asset quality and the stability of the industry or market area. |
• | Grades 6, 7 and 8 - These grades include “pass grade” loans to borrowers of acceptable credit quality and risk. Such borrowers are differentiated from Grades 4 and 5 in terms of size, secondary sources of repayment or they are of lesser stature in other key credit metrics in that they may be over-leveraged, under capitalized, inconsistent in performance or in an industry or an economic area that is known to have a higher level of risk, volatility, or susceptibility to weaknesses in the economy. |
• | Grade 9 - This grade includes loans on management’s “watch list” and is intended to be utilized on a temporary basis for pass grade borrowers where a significant risk-modifying action is anticipated in the near term. |
• | Grade 10 - This grade is for “Other Assets Especially Mentioned” in accordance with regulatory guidelines. This grade is intended to be temporary and includes loans to borrowers whose credit quality has clearly deteriorated and are at risk of further decline unless active measures are taken to correct the situation. |
• | Grade 11 - This grade includes “Substandard” loans, in accordance with regulatory guidelines, for which the accrual of interest has not been stopped. By definition under regulatory guidelines, a “Substandard” loan has defined weaknesses which make payment default or principal exposure likely, but not yet certain. Such loans are apt to be dependent upon collateral liquidation, a secondary source of repayment or an event outside of the normal course of business. |
• | Grade 12 - This grade includes “Substandard” loans, in accordance with regulatory guidelines, for which the accrual of interest has been stopped. This grade includes loans where interest is more than 120 days past due and not fully secured and loans where a specific valuation allowance may be necessary, but generally does not exceed 30% of the principal balance. |
• | Grade 13 - This grade includes “Doubtful” loans in accordance with regulatory guidelines. Such loans are placed on non-accrual status and may be dependent upon collateral having a value that is difficult to determine or upon some near-term event which lacks certainty. Additionally, these loans generally have a specific valuation allowance in excess of 30% of the principal balance. |
• | Grade 14 - This grade includes “Loss” loans in accordance with regulatory guidelines. Such loans are to be charged-off or charged-down when payment is acknowledged to be uncertain or when the timing or value of payments cannot be determined. “Loss” is not intended to imply that the loan or some portion of it will never be paid, nor does it in any way imply that there has been a forgiveness of debt. |
99
In monitoring credit quality trends in the context of assessing the appropriate level of the allowance for loan losses, we monitor portfolio credit quality by the weighted-average risk grade of each class of commercial loan. Individual relationship managers review updated financial information for all pass grade loans to recalculate the risk grade on at least an annual basis. When a loan has a calculated risk grade of 9, it is still considered a pass grade loan; however, it is considered to be on management’s “watch list,” where a significant risk-modifying action is anticipated in the near term. When a loan has a calculated risk grade of 10 or higher, a special assets officer monitors the loan on an on-going basis. The following tables present weighted average risk grades for all commercial loans by class.
December 31, 2017 | December 31, 2016 | ||||||||||||
Weighted Average Risk Grade | Loans | Weighted Average Risk Grade | Loans | ||||||||||
Commercial and industrial | |||||||||||||
Risk grades 1-8 | 6.06 | $ | 4,378,839 | 6.01 | $ | 3,989,722 | |||||||
Risk grade 9 | 9.00 | 170,285 | 9.00 | 106,988 | |||||||||
Risk grade 10 | 10.00 | 99,260 | 10.00 | 115,420 | |||||||||
Risk grade 11 | 11.00 | 97,818 | 11.00 | 100,245 | |||||||||
Risk grade 12 | 12.00 | 38,633 | 12.00 | 25,939 | |||||||||
Risk grade 13 | 13.00 | 7,553 | 13.00 | 5,686 | |||||||||
Total | 6.41 | $ | 4,792,388 | 6.35 | $ | 4,344,000 | |||||||
Energy | |||||||||||||
Risk grades 1-8 | 6.01 | $ | 1,199,207 | 6.34 | $ | 854,688 | |||||||
Risk grade 9 | 9.00 | 50,427 | 9.00 | 78,524 | |||||||||
Risk grade 10 | 10.00 | 64,282 | 10.00 | 150,872 | |||||||||
Risk grade 11 | 11.00 | 90,875 | 11.00 | 244,406 | |||||||||
Risk grade 12 | 12.00 | 81,035 | 12.00 | 53,821 | |||||||||
Risk grade 13 | 13.00 | 13,267 | 13.00 | 3,750 | |||||||||
Total | 6.97 | $ | 1,499,093 | 7.95 | $ | 1,386,061 | |||||||
Commercial real estate: | |||||||||||||
Buildings, land and other | |||||||||||||
Risk grades 1-8 | 6.75 | $ | 3,868,659 | 6.67 | $ | 3,463,064 | |||||||
Risk grade 9 | 9.00 | 151,487 | 9.00 | 109,110 | |||||||||
Risk grade 10 | 10.00 | 129,391 | 10.00 | 145,067 | |||||||||
Risk grade 11 | 11.00 | 62,602 | 11.00 | 66,396 | |||||||||
Risk grade 12 | 12.00 | 7,589 | 12.00 | 8,550 | |||||||||
Risk grade 13 | 13.00 | — | 13.00 | — | |||||||||
Total | 7.00 | $ | 4,219,728 | 6.95 | $ | 3,792,187 | |||||||
Construction | |||||||||||||
Risk grades 1-8 | 7.11 | $ | 1,019,635 | 6.97 | $ | 1,023,194 | |||||||
Risk grade 9 | 9.00 | 18,042 | 9.00 | 15,829 | |||||||||
Risk grade 10 | 10.00 | 23,393 | 10.00 | 2,889 | |||||||||
Risk grade 11 | 11.00 | 5,626 | 11.00 | 1,349 | |||||||||
Risk grade 12 | 12.00 | — | 12.00 | — | |||||||||
Risk grade 13 | 13.00 | — | 13.00 | — | |||||||||
Total | 7.23 | $ | 1,066,696 | 7.01 | $ | 1,043,261 | |||||||
We have established maximum loan to value standards to be applied during the origination process of commercial and consumer real estate loans. We do not subsequently monitor loan-to-value ratios (either individually or on a weighted-average basis) for loans that are subsequently considered to be of a pass grade (grades 9 or better) and/or current with respect to principal and interest payments. As stated above, when an individual commercial real estate loan has a calculated risk grade of 10 or higher, a special assets officer analyzes the loan to determine whether the loan is impaired. At that time, we reassess the loan to value position in the loan. If the loan is determined to be collateral dependent, specific allocations of the allowance for loan losses are made for the amount of any collateral deficiency. If a collateral deficiency is ultimately deemed to be uncollectible, the amount is charged-off. These loans and related assessments of collateral position are monitored on an individual, case-by-case basis. We do not monitor loan-to-value ratios on a weighted-average portfolio-basis for commercial real estate loans having a calculated risk grade of 10 or higher as excess collateral from one borrower cannot be used to offset a collateral deficit for another borrower. When
100
an individual consumer real estate loan becomes past due by more than 10 days, the assigned relationship manager will begin collection efforts. We only reassess the loan to value position in a consumer real estate loan if, during the course of the collections process, it is determined that the loan has become collateral dependent, and any collateral deficiency is recognized as a charge-off to the allowance for loan losses. Accordingly, we do not monitor loan-to-value ratios on a weighted-average basis for collateral dependent consumer real estate loans.
Generally, a commercial loan, or a portion thereof, is charged-off immediately when it is determined, through the analysis of any available current financial information with regards to the borrower, that the borrower is incapable of servicing unsecured debt, there is little or no prospect for near term improvement and no realistic strengthening action of significance is pending or, in the case of secured debt, when it is determined, through analysis of current information with regards to our collateral position, that amounts due from the borrower are in excess of the calculated current fair value of the collateral. Notwithstanding the foregoing, generally, commercial loans that become past due 180 cumulative days are charged-off. Generally, a consumer loan, or a portion thereof, is charged-off in accordance with regulatory guidelines which provide that such loans be charged-off when we become aware of the loss, such as from a triggering event that may include new information about a borrower’s intent/ability to repay the loan, bankruptcy, fraud or death, among other things, but in any event the charge-off must be taken within specified delinquency time frames. Such delinquency time frames state that closed-end retail loans (loans with pre-defined maturity dates, such as real estate mortgages, home equity loans and consumer installment loans) that become past due 120 cumulative days and open-end retail loans (loans that roll-over at the end of each term, such as home equity lines of credit) that become past due 180 cumulative days should be classified as a loss and charged-off.
Net (charge-offs)/recoveries, segregated by class of loan, were as follows:
2017 | 2016 | 2015 | |||||||||
Commercial and industrial | $ | (17,453 | ) | $ | (12,259 | ) | $ | (6,535 | ) | ||
Energy | (10,009 | ) | (18,588 | ) | (5,997 | ) | |||||
Commercial real estate: | |||||||||||
Buildings, land and other | 735 | 813 | 314 | ||||||||
Construction | 11 | 23 | 18 | ||||||||
Consumer real estate | (506 | ) | (257 | ) | (91 | ) | |||||
Consumer and other | (5,919 | ) | (4,219 | ) | (3,237 | ) | |||||
Total | $ | (33,141 | ) | $ | (34,487 | ) | $ | (15,528 | ) | ||
In assessing the general economic conditions in the State of Texas, management monitors and tracks the Texas Leading Index (“TLI”), which is produced by the Federal Reserve Bank of Dallas. The TLI is a single summary statistic that is designed to signal the likelihood of the Texas economy’s transition from expansion to recession and vice versa. Management believes this index provides a reliable indication of the direction of overall credit quality. The TLI is a composite of the following eight leading indicators: (i) Texas Value of the Dollar, (ii) U.S. Leading Index, (iii) real oil prices (iv) well permits, (v) initial claims for unemployment insurance, (vi) Texas Stock Index, (vii) Help-Wanted Index and (viii) average weekly hours worked in manufacturing. The TLI totaled 128.7 at December 31, 2017 and 123.1 at December 31, 2016. A higher TLI value implies more favorable economic conditions.
Allowance for Loan Losses. The allowance for loan losses is a reserve established through a provision for loan losses charged to expense, which represents management’s best estimate of inherent losses that have been incurred within the existing portfolio of loans. The allowance, in the judgment of management, is necessary to reserve for estimated loan losses and risks inherent in the loan portfolio. Our allowance for loan loss methodology follows the accounting guidance set forth in U.S. generally accepted accounting principles and the Interagency Policy Statement on the Allowance for Loan and Lease Losses, which was jointly issued by U.S. bank regulatory agencies. In that regard, our allowance for loan losses includes allowance allocations calculated in accordance with ASC Topic 310, “Receivables” and allowance allocations calculated in accordance with ASC Topic 450, “Contingencies.” Accordingly, the methodology is based on historical loss experience by type of credit and internal risk grade, specific homogeneous risk pools and specific loss allocations, with adjustments for current events and conditions. Our process for determining the appropriate level of the allowance for loan losses is designed to account for credit deterioration as it occurs. The provision for loan losses reflects loan quality trends, including the levels of and trends related to non-accrual loans, past due loans, potential problem loans, criticized loans and net charge-offs or recoveries, among other factors. The provision for loan losses also reflects the totality of actions taken on all loans for a particular period. In other words, the amount of the provision reflects not only the necessary increases in the allowance for loan losses related to newly identified criticized loans,
101
but it also reflects actions taken related to other loans including, among other things, any necessary increases or decreases in required allowances for specific loans or loan pools.
The level of the allowance reflects management’s continuing evaluation of industry concentrations, specific credit risks, loan loss and recovery experience, current loan portfolio quality, present economic, political and regulatory conditions and unidentified losses inherent in the current loan portfolio. Portions of the allowance may be allocated for specific credits; however, the entire allowance is available for any credit that, in management’s judgment, should be charged off. While management utilizes its best judgment and information available, the ultimate determination of the appropriate level of the allowance is dependent upon a variety of factors beyond our control, including, among other things, the performance of our loan portfolio, the economy, changes in interest rates and the view of the regulatory authorities toward loan classifications. We monitor whether or not the allowance for loan loss allocation model, as a whole, calculates an appropriate level of allowance for loan losses that moves in direct correlation to the general macroeconomic and loan portfolio conditions we experience over time.
Our allowance for loan losses consists of: (i) specific valuation allowances determined in accordance with ASC Topic 310 based on probable losses on specific loans; (ii) historical valuation allowances determined in accordance with ASC Topic 450 based on historical loan loss experience for similar loans with similar characteristics and trends, adjusted, as necessary, to reflect the impact of current conditions; (iii) general valuation allowances determined in accordance with ASC Topic 450 based on various risk factors that are internal to us; and (iv) macroeconomic valuation allowances determined in accordance with ASC Topic 450 based on general economic conditions and other risk factors that are external to us.
The allowances established for probable losses on specific loans are based on a regular analysis and evaluation of problem loans. Loans are classified based on an internal credit risk grading process that evaluates, among other things: (i) the obligor’s ability to repay; (ii) the underlying collateral, if any; and (iii) the economic environment and industry in which the borrower operates. This analysis is performed at the relationship manager level for all commercial loans. When a loan has a calculated grade of 10 or higher, a special assets officer analyzes the loan to determine whether the loan is impaired and, if impaired, the need to specifically allocate a portion of the allowance for loan losses to the loan. Specific valuation allowances are determined by analyzing the borrower’s ability to repay amounts owed, collateral deficiencies, the relative risk grade of the loan and economic conditions affecting the borrower’s industry, among other things.
Historical valuation allowances are calculated based on the historical gross loss experience of specific types of loans and the internal risk grade of such loans. We calculate historical gross loss ratios for pools of similar loans with similar characteristics based on the proportion of actual charge-offs experienced to the total population of loans in the pool. The historical gross loss ratios are periodically (no less than annually) updated based on actual charge-off experience. A historical valuation allowance is established for each pool of similar loans based upon the product of the historical gross loss ratio and the total dollar amount of the loans in the pool. Our pools of similar loans include similarly risk-graded groups of commercial and industrial loans, energy loans, commercial real estate loans, consumer real estate loans, consumer and other loans and overdrafts. Prior to 2016, we used a single, combined historical loss allocation factor for all consumer and other loans, which included overdrafts. In 2016, we began using two separate historical loss allocation factors for consumer and other loans, one historical loss allocation factor for consumer and other loans, excluding overdrafts, and a separate historical loss allocation factor for overdrafts. While the effect of this change resulted in a decrease in the estimated valuation allowances needed for consumer and other loans, the impact of the change was not significant to our overall allocation of the allowance for loan losses.
General valuation allowances include allocations for groups of similar loans with similar risk characteristics that exceed certain concentration limits established by management and/or our board of directors. Concentration risk limits have been established, among other things, for certain industry concentrations, large balance and highly leveraged credit relationships that exceed specified risk grades and loans originated with policy exceptions that exceed specified risk grades. Additionally, general valuation allowances are provided for loans that did not undergo a separate, independent concurrence review during the underwriting process (generally those loans under $1.0 million at origination). Our allowance methodology for general valuation allowances also includes a reduction factor for recoveries of prior charge-offs to compensate for the fact that historical loss allocations are based upon gross charge-offs rather than net. The adjustment for recoveries is based on the lower of annualized, year-to-date gross recoveries or the total gross recoveries by loan portfolio segment for the preceding four quarters, adjusted, when necessary, for expected future trends in recoveries.
102
The components of the macroeconomic valuation allowance include (i) reserves allocated as a result of applying an environmental risk adjustment factor to the base historical loss allocation, (ii) reserves allocated for loans to borrowers in distressed industries and (iii) reserves allocated based upon current economic trends and other quantitative and qualitative factors that could impact our loan portfolio segments. The aggregate sum of these components for each portfolio segment reflects management's assessment of current and expected economic conditions and other external factors that impact the inherent credit quality of loans in that portfolio segment.
The environmental adjustment factor is based upon a more qualitative analysis of risk and is calculated through a survey of senior officers who are involved in credit making decisions at a corporate-wide and/or regional level. On a quarterly basis, survey participants rate the degree of various risks utilizing a numeric scale that translates to varying grades of high, moderate or low levels of risk. The results are then input into a risk-weighting matrix to determine an appropriate environmental risk adjustment factor. The various risks that may be considered in the determination of the environmental adjustment factor include, among other things, (i) the experience, ability and effectiveness of the bank’s lending management and staff; (ii) the effectiveness of our loan policies, procedures and internal controls; (iii) changes in asset quality; (iv) the impact of legislative and governmental influences affecting industry sectors; (v) the effectiveness of the internal loan review function; (vi) the impact of competition on loan structuring and pricing; and (vii) the impact of rising interest rates on portfolio risk. In periods where the surveyed risks are perceived to be higher, the risk-weighting matrix will generally result in a higher environmental adjustment factor, which, in turn will result in higher levels of general valuation allowance allocations. The opposite holds true in periods where the surveyed risks are perceived to be lower.
Macroeconomic valuation allowances also include amounts allocated for loans to borrowers in distressed industries within our commercial loan portfolio segments. To determine the amount of the allocation for our commercial and industrial and commercial real estate loan portfolio segments, management calculates the weighted-average risk grade for all loans to borrowers in distressed industries by loan portfolio segment. A multiple is then applied to the amount by which the weighted-average risk grade for loans to borrowers in distressed industries exceeds the weighted-average risk grade for all pass-grade loans within the loan portfolio segment to derive an allocation factor for loans to borrowers in distressed industries. The amount of the allocation for each loan portfolio segment is the product of this allocation factor and the outstanding balance of pass-grade loans within the identified distressed industries that have a risk grade of 6 or higher. Management identifies potential distressed industries by analyzing industry trends related to delinquencies, classifications and charge-offs. At December 31, 2017 and 2016, certain segments of contractors were considered to be a distressed industry based on elevated levels of delinquencies, classifications and charge-offs relative to other industries within our commercial loan portfolios. Furthermore, we determined, through a review of borrower financial information that, as a whole, contractors have experienced, among other things, decreased revenues, reduced backlog of work, compressed margins and little, if any, net income.
The aforementioned methodology for allocating reserves for distressed industries within commercial and industrial and commercial real estate loan portfolio segments does not translate to our energy loan portfolio segment as the segment is made up of a single industry. For energy loans, management analyzes current economic trends, commodity prices and various other quantitative and qualitative factors that impact the inherent credit quality of our energy loan portfolio segment. If, based upon this analysis, management concludes that the prevailing conditions could have an adverse impact on the credit quality of our energy loan portfolio, management performs a sensitivity stress test on individual loans within our energy loan portfolio. The sensitivity stress test includes a commodity price shock to 75% of the commodity price deck. We also assess the financial strength of individual borrowers, the quality of collateral, the relative experience of the individual borrowers and their ability to withstand an economic downturn. The sensitivity stress test allows us to identify potential credit issues during periods of economic uncertainty. Reserve allocations resulting from the sensitivity stress test are calculated by hypothetically increasing the risk grades for affected borrowers and applying our allowance methodology to determine the incremental reserves that would be required.
Macroeconomic valuation allowances may also include additional reserves allocated based upon management's assessment of current and expected economic conditions, trends and other quantitative and qualitative factors that could impact the credit quality of our loan portfolio segments. Additional reserves are allocated when, based upon this assessment, management believes that there are inherent credit risks for a given portfolio segment that have not yet materialized through the migration of loan risk grades and, therefore, have not yet impacted our historical or general valuation allowances.
103
The following table presents details of the allowance for loan losses, segregated by loan portfolio segment.
Commercial and Industrial | Energy | Commercial Real Estate | Consumer Real Estate | Consumer and Other | Total | ||||||||||||||||||
December 31, 2017 | |||||||||||||||||||||||
Historical valuation allowances | $ | 26,401 | $ | 22,073 | $ | 18,931 | $ | 2,473 | $ | 5,603 | $ | 75,481 | |||||||||||
Specific valuation allowances | 7,553 | 13,267 | — | — | — | 20,820 | |||||||||||||||||
General valuation allowances | 9,112 | 7,964 | 4,165 | 2,133 | (91 | ) | 23,283 | ||||||||||||||||
Macroeconomic valuation allowances | 16,548 | 8,224 | 7,852 | 1,051 | 2,105 | 35,780 | |||||||||||||||||
Total | $ | 59,614 | $ | 51,528 | $ | 30,948 | $ | 5,657 | $ | 7,617 | $ | 155,364 | |||||||||||
December 31, 2016 | |||||||||||||||||||||||
Historical valuation allowances | $ | 33,251 | $ | 34,626 | $ | 16,976 | $ | 2,225 | $ | 4,585 | $ | 91,663 | |||||||||||
Specific valuation allowances | 5,436 | 3,750 | — | — | — | 9,186 | |||||||||||||||||
General valuation allowances | 6,708 | 3,769 | 5,004 | 1,506 | (144 | ) | 16,843 | ||||||||||||||||
Macroeconomic valuation allowances | 7,520 | 18,508 | 8,233 | 507 | 585 | 35,353 | |||||||||||||||||
Total | $ | 52,915 | $ | 60,653 | $ | 30,213 | $ | 4,238 | $ | 5,026 | $ | 153,045 | |||||||||||
We monitor whether or not the allowance for loan loss allocation model, as a whole, calculates an appropriate level of allowance for loan losses that moves in direct correlation to the general macroeconomic and loan portfolio conditions we experience over time. In assessing the general macroeconomic trends/conditions, we analyze trends in the components of the TLI, as well as any available information related to regional, national and international economic conditions and events and the impact such conditions and events may have on us and our customers. With regard to assessing loan portfolio conditions, we analyze trends in weighted-average portfolio risk-grades, classified and non-performing loans and charge-off activity. In periods where general macroeconomic and loan portfolio conditions are in a deteriorating trend or remain at deteriorated levels, based on historical trends, we would expect to see the allowance for loan loss allocation model, as a whole, calculate higher levels of required allowances than in periods where general macroeconomic and loan portfolio conditions are in an improving trend or remain at an elevated level, based on historical trends.
The Corporation’s recorded investment in loans related to each balance in the allowance for loan losses by portfolio segment and detailed on the basis of the impairment methodology used by the Corporation was as follows:
Commercial and Industrial | Energy | Commercial Real Estate | Consumer Real Estate | Consumer and Other | Total | ||||||||||||||||||
December 31, 2017 | |||||||||||||||||||||||
Individually evaluated | $ | 43,760 | $ | 94,242 | $ | 6,394 | $ | 1,214 | $ | — | $ | 145,610 | |||||||||||
Collectively evaluated | 4,748,628 | 1,404,851 | 5,280,030 | 1,022,080 | 544,466 | 13,000,055 | |||||||||||||||||
Total | $ | 4,792,388 | $ | 1,499,093 | $ | 5,286,424 | $ | 1,023,294 | $ | 544,466 | $ | 13,145,665 | |||||||||||
December 31, 2016 | |||||||||||||||||||||||
Individually evaluated | $ | 28,909 | $ | 57,563 | $ | 6,866 | $ | 655 | $ | 30 | $ | 94,023 | |||||||||||
Collectively evaluated | 4,315,091 | 1,328,498 | 4,828,582 | 936,130 | 473,068 | 11,881,369 | |||||||||||||||||
Total | $ | 4,344,000 | $ | 1,386,061 | $ | 4,835,448 | $ | 936,785 | $ | 473,098 | $ | 11,975,392 | |||||||||||
104
The following table details activity in the allowance for loan losses by portfolio segment for 2017, 2016 and 2015. Allocation of a portion of the allowance to one category of loans does not preclude its availability to absorb losses in other categories.
Commercial and Industrial | Energy | Commercial Real Estate | Consumer Real Estate | Consumer and Other | Total | ||||||||||||||||||
2017 | |||||||||||||||||||||||
Beginning balance | $ | 52,915 | $ | 60,653 | $ | 30,213 | $ | 4,238 | $ | 5,026 | $ | 153,045 | |||||||||||
Provision for loan losses | 24,152 | 884 | (11 | ) | 1,925 | 8,510 | 35,460 | ||||||||||||||||
Charge-offs | (20,619 | ) | (10,595 | ) | (86 | ) | (925 | ) | (15,579 | ) | (47,804 | ) | |||||||||||
Recoveries | 3,166 | 586 | 832 | 419 | 9,660 | 14,663 | |||||||||||||||||
Net charge-offs | (17,453 | ) | (10,009 | ) | 746 | (506 | ) | (5,919 | ) | (33,141 | ) | ||||||||||||
Ending balance | $ | 59,614 | $ | 51,528 | $ | 30,948 | $ | 5,657 | $ | 7,617 | $ | 155,364 | |||||||||||
Allocated to loans: | |||||||||||||||||||||||
Individually evaluated for impairment | $ | 7,553 | $ | 13,267 | $ | — | $ | — | $ | — | $ | 20,820 | |||||||||||
Collectively evaluated for impairment | 52,061 | 38,261 | 30,948 | 5,657 | 7,617 | 134,544 | |||||||||||||||||
Ending balance | $ | 59,614 | $ | 51,528 | $ | 30,948 | $ | 5,657 | $ | 7,617 | $ | 155,364 | |||||||||||
2016 | |||||||||||||||||||||||
Beginning balance | $ | 42,993 | $ | 54,696 | $ | 24,313 | $ | 4,659 | $ | 9,198 | $ | 135,859 | |||||||||||
Provision for loan losses | 22,181 | 24,545 | 5,064 | (164 | ) | 47 | 51,673 | ||||||||||||||||
Charge-offs | (15,910 | ) | (18,644 | ) | (82 | ) | (814 | ) | (12,878 | ) | (48,328 | ) | |||||||||||
Recoveries | 3,651 | 56 | 918 | 557 | 8,659 | 13,841 | |||||||||||||||||
Net charge-offs | (12,259 | ) | (18,588 | ) | 836 | (257 | ) | (4,219 | ) | (34,487 | ) | ||||||||||||
Ending balance | $ | 52,915 | $ | 60,653 | $ | 30,213 | $ | 4,238 | $ | 5,026 | $ | 153,045 | |||||||||||
Allocated to loans: | |||||||||||||||||||||||
Individually evaluated for impairment | $ | 5,436 | $ | 3,750 | $ | — | $ | — | $ | — | $ | 9,186 | |||||||||||
Collectively evaluated for impairment | 47,479 | 56,903 | 30,213 | 4,238 | 5,026 | 143,859 | |||||||||||||||||
Ending balance | $ | 52,915 | $ | 60,653 | $ | 30,213 | $ | 4,238 | $ | 5,026 | $ | 153,045 | |||||||||||
2015 | |||||||||||||||||||||||
Beginning balance | $ | 44,273 | $ | 14,919 | $ | 27,163 | $ | 5,178 | $ | 8,009 | $ | 99,542 | |||||||||||
Provision for loan losses | 5,255 | 45,774 | (3,182 | ) | (428 | ) | 4,426 | 51,845 | |||||||||||||||
Charge-offs | (11,092 | ) | (6,000 | ) | (657 | ) | (577 | ) | (11,246 | ) | (29,572 | ) | |||||||||||
Recoveries | 4,557 | 3 | 989 | 486 | 8,009 | 14,044 | |||||||||||||||||
Net charge-offs | (6,535 | ) | (5,997 | ) | 332 | (91 | ) | (3,237 | ) | (15,528 | ) | ||||||||||||
Ending balance | $ | 42,993 | $ | 54,696 | $ | 24,313 | $ | 4,659 | $ | 9,198 | $ | 135,859 | |||||||||||
Allocated to loans: | |||||||||||||||||||||||
Individually evaluated for impairment | $ | 2,378 | $ | 2,000 | $ | — | $ | — | $ | — | $ | 4,378 | |||||||||||
Collectively evaluated for impairment | 40,615 | 52,696 | 24,313 | 4,659 | 9,198 | 131,481 | |||||||||||||||||
Ending balance | $ | 42,993 | $ | 54,696 | $ | 24,313 | $ | 4,659 | $ | 9,198 | $ | 135,859 | |||||||||||
105
Note 4 - Premises and Equipment
Year-end premises and equipment were as follows:
2017 | 2016 | ||||||
Land | $ | 107,249 | $ | 106,505 | |||
Buildings | 379,829 | 361,573 | |||||
Furniture and equipment | 179,424 | 167,723 | |||||
Leasehold improvements | 74,314 | 67,540 | |||||
Construction in progress | 11,107 | 19,508 | |||||
751,923 | 722,849 | ||||||
Less accumulated depreciation and amortization | (230,965 | ) | (197,028 | ) | |||
Total premises and equipment, net | $ | 520,958 | $ | 525,821 | |||
Depreciation and amortization of premises and equipment totaled $36.3 million in 2017, $36.0 million in 2016 and $28.5 million in 2015.
Comprehensive Development Agreement. In July 2015, we entered into a comprehensive development agreement with the City of San Antonio and a third party controlled by one of our directors whereby under separate agreements, (i) we sold our existing headquarters building to the City of San Antonio and other adjacent properties to the third party in the fourth quarter of 2016, (ii) the third party has agreed to build a new office building where we will be the primary tenant (the "New Frost Headquarters"), and (iii) we have agreed to lease back our existing headquarters building from the City of San Antonio until the construction of the New Frost Headquarters is complete, which is currently expected to take place in 2019. In connection with the sale and subsequent leaseback of our existing headquarters building with the City of San Antonio and the sale of other adjacent properties to the third party in the fourth quarter of 2016, we recognized a net gain totaling $10.3 million in 2016 and a deferred gain. The deferred gain totaled $4.2 million at December 31, 2017 and $7.1 million at December 31, 2016, and will be amortized into income over the term of the lease. During 2017, amortization of the deferred gain totaled $2.9 million. Under the comprehensive development agreement, we also agreed to sell various properties adjacent to the New Frost Headquarters to the third party in 2019. We do not expect any gains or losses that may be realized on those future sales to have a significant impact on our financial statements.
Note 5 - Goodwill and Other Intangible Assets
Goodwill and other intangible assets are presented in the tables below. During 2016, we recorded goodwill totaling $284 thousand and other intangible assets totaling $405 thousand in connection with an insurance acquisition.
Goodwill. Year-end goodwill was as follows:
2017 | 2016 | ||||||
Goodwill | $ | 654,952 | $ | 654,952 | |||
Other Intangible Assets. Year-end other intangible assets were as follows:
Gross Intangible Assets | Accumulated Amortization | Net Intangible Assets | |||||||||
2017 | |||||||||||
Core deposits | $ | 9,300 | $ | (5,256 | ) | $ | 4,044 | ||||
Customer relationships | 4,669 | (3,683 | ) | 986 | |||||||
Non-compete agreements | 74 | (31 | ) | 43 | |||||||
$ | 14,043 | $ | (8,970 | ) | $ | 5,073 | |||||
2016 | |||||||||||
Core deposits | $ | 9,300 | $ | (4,002 | ) | $ | 5,298 | ||||
Customer relationships | 6,102 | (4,692 | ) | 1,410 | |||||||
Non-compete agreements | 74 | (6 | ) | 68 | |||||||
$ | 15,476 | $ | (8,700 | ) | $ | 6,776 | |||||
106
Other intangible assets are amortized on an accelerated basis over their estimated lives, which range from 5 to 10 years. Amortization expense related to intangible assets totaled $1.7 million in 2017, $2.4 million in 2016, and $3.3 million in 2015. The estimated aggregate future amortization expense for intangible assets remaining as of December 31, 2017 is as follows:
2018 | $ | 1,424 | |
2019 | 1,167 | ||
2020 | 918 | ||
2021 | 697 | ||
2022 | 481 | ||
Thereafter | 386 | ||
$ | 5,073 | ||
Note 6 - Deposits
Year-end deposits were as follows:
2017 | 2016 | ||||||
Non-interest-bearing demand deposits: | |||||||
Commercial and individual | $ | 10,412,882 | $ | 9,670,989 | |||
Correspondent banks | 222,648 | 280,751 | |||||
Public funds | 561,563 | 561,629 | |||||
Total non-interest-bearing demand deposits | 11,197,093 | 10,513,369 | |||||
Interest-bearing deposits: | |||||||
Private accounts: | |||||||
Savings and interest checking | 6,788,766 | 6,436,065 | |||||
Money market accounts | 7,624,471 | 7,486,431 | |||||
Time accounts of $100,000 or more | 453,668 | 460,028 | |||||
Time accounts under $100,000 | 324,636 | 338,714 | |||||
Total private accounts | 15,191,541 | 14,721,238 | |||||
Public funds: | |||||||
Savings and interest checking | 410,140 | 446,872 | |||||
Money market accounts | 59,008 | 113,669 | |||||
Time accounts of $100,000 or more | 14,301 | 15,748 | |||||
Time accounts under $100,000 | 306 | 679 | |||||
Total public funds | 483,755 | 576,968 | |||||
Total interest-bearing deposits | 15,675,296 | 15,298,206 | |||||
Total deposits | $ | 26,872,389 | $ | 25,811,575 | |||
The following table presents additional information about our year-end deposits:
2017 | 2016 | ||||||
Deposits from foreign sources (primarily Mexico) | $ | 716,339 | $ | 776,003 | |||
Deposits not covered by deposit insurance | 13,281,040 | 12,889,047 | |||||
Deposits from certain directors, executive officers and their affiliates | 196,686 | 199,969 | |||||
Scheduled maturities of time deposits, including both private and public funds, at December 31, 2017 were as follows:
2018 | $ | 643,058 | |
2019 | 149,853 | ||
2020 | — | ||
2021 | — | ||
2022 | — | ||
$ | 792,911 | ||
107
Scheduled maturities of time deposits in amounts of $100,000 or more, including both private and public funds, at December 31, 2017, were as follows:
Due within 3 months or less | $ | 138,888 | |
Due after 3 months and within 6 months | 75,805 | ||
Due after 6 months and within 12 months | 163,756 | ||
Due after 12 months | 89,520 | ||
$ | 467,969 | ||
Note 7 - Borrowed Funds
Federal Funds Purchased and Securities Sold Under Agreements to Repurchase. Federal funds purchased are short-term borrowings that typically mature within one to ninety days. Federal funds purchased totaled $30.6 million and $13.7 million at December 31, 2017 and 2016. Securities sold under agreements to repurchase are secured short-term borrowings that typically mature overnight or within thirty to ninety days. Securities sold under agreements to repurchase are stated at the amount of cash received in connection with the transaction. We may be required to provide additional collateral based on the fair value of the underlying securities. Securities sold under agreements to repurchase totaled $1.1 billion and $963.3 million at December 31, 2017 and 2016.
Subordinated Notes Payable. In March 2017, we issued $100 million of 4.50% subordinated notes that mature on March 17, 2027. The notes, which qualify as Tier 2 capital for Cullen/Frost, bear interest at the rate of 4.50% per annum, payable semi-annually on each March 17 and September 17. The notes are unsecured and subordinated in right of payment to the payment of our existing and future senior indebtedness and structurally subordinated to all existing and future indebtedness of our subsidiaries. Unamortized debt issuance costs related to these notes, totaled approximately $1.4 million at December 31, 2017. Proceeds from sale of the notes were used for general corporate purposes.
Our $100 million of 5.75% fixed-to-floating rate subordinated notes originally issued in February 2007 matured and were redeemed on February 15, 2017. The notes qualified as Tier 2 capital for Cullen/Frost under the capital rules in effect prior to 2015. Prior to February 2012, the notes had a fixed interest rate of 5.75% per annum, after which the notes bore interest at a rate per annum equal to three-month LIBOR for the related interest period plus 0.53% (1.43% at December 31, 2016), paid quarterly.
Junior Subordinated Deferrable Interest Debentures. At December 31, 2017 and 2016, we had $123.7 million of junior subordinated deferrable interest debentures issued to Cullen/Frost Capital Trust II (“Trust II”), a wholly owned Delaware statutory business trust. Unamortized debt issuance costs related to Trust II totaled $931 thousand and $988 thousand at December 31, 2017 and 2016. At December 31, 2017 and 2016, we also had $13.4 million of junior subordinated deferrable interest debentures issued to WNB Capital Trust I (“WNB Trust”), a wholly owned Delaware statutory business trust acquired in connection with the acquisition of WNB Bancshares, Inc. (“WNB”) in 2014. Trust II and WNB Trust are variable interest entities for which we are not the primary beneficiary. As such, the accounts of Trust II and WNB Trust are not included in our consolidated financial statements. See Note 1 - Summary of Significant Accounting Policies for additional information about our consolidation policy. Details of our transactions with the capital trust are presented below.
Trust II was formed in 2004 for the purpose of issuing $120 million of floating rate (three-month LIBOR plus a margin of 1.55%) trust preferred securities, which represent beneficial interests in the assets of the trust. The trust preferred securities will mature on March 1, 2034 and are currently redeemable with the approval of the Federal Reserve Board in whole or in part at our option. Distributions on the trust preferred securities are payable quarterly in arrears on March 1, June 1, September 1 and December 1 of each year. Trust II also issued $3.7 million of common equity securities to Cullen/Frost. The proceeds of the offering of the trust preferred securities and common equity securities were used to purchase $123.7 million of floating rate (three-month LIBOR plus a margin of 1.55%, which was equal to 3.03% and 2.48% at December 31, 2017 and 2016) junior subordinated deferrable interest debentures issued by us, which have terms substantially similar to the trust preferred securities.
WNB Trust was formed in 2004 by WNB for the purpose of issuing $13.0 million of floating rate (three-month LIBOR plus a margin of 2.35%) trust preferred securities, which represent beneficial interests in the assets of the trust. The trust preferred securities will mature on July 23, 2034 and are currently redeemable with the approval of the Federal Reserve Board in whole or in part at our option. Distributions on the trust preferred securities are payable quarterly in arrears on January 23, April 23, July 23 and October 23 of each year. WNB Trust also issued $403 thousand of common
108
equity securities to WNB. The proceeds of the offering of the trust preferred securities and common equity securities were used to purchase $13.4 million of floating rate (three-month LIBOR plus a margin of 2.35%, which was equal to 3.71% and 3.23% at December 31, 2017and 2016) junior subordinated deferrable interest debentures issued by WNB, which have terms substantially similar to the trust preferred securities.
We have the right at any time during the term of the debentures issued to Trust II and WNB Trust to defer payments of interest at any time or from time to time for an extension period not exceeding 20 consecutive quarterly periods with respect to each extension period. Under the terms of the debentures, in the event that under certain circumstances there is an event of default under the debentures or we have elected to defer interest on the debentures, we may not, with certain exceptions, declare or pay any dividends or distributions on our capital stock or purchase or acquire any of our capital stock.
Payments of distributions on the trust preferred securities and payments on redemption of the trust preferred securities are guaranteed by us on a limited basis. We are obligated by agreement to pay any costs, expenses or liabilities of Trust II and WNB Trust other than those arising under the trust preferred securities. Our obligations under the junior subordinated debentures, the related indentures, the trust agreements establishing the trusts, the guarantees and the agreements as to expenses and liabilities, in the aggregate, constitute a full and unconditional guarantee by us of Trust II’s and WNB Trust's obligations under the trust preferred securities.
Although the accounts of Trust II and WNB Trust are not included in our consolidated financial statements, the $120.0 million in trust preferred securities issued by Trust II and the $13.0 million in trust preferred securities issued by WNB Trust are included in the capital of Cullen/Frost for regulatory capital purposes as of December 31, 2017 and 2016. See Note 9 - Capital and Regulatory Matters.
Note 8 - Off-Balance-Sheet Arrangements, Commitments, Guarantees and Contingencies
Financial Instruments with Off-Balance-Sheet Risk. In the normal course of business, we enter into various transactions, which, in accordance with generally accepted accounting principles are not included in our consolidated balance sheets. We enter into these transactions to meet the financing needs of our customers. These transactions include commitments to extend credit and standby letters of credit, which involve, to varying degrees, elements of credit risk and interest rate risk in excess of the amounts recognized in the consolidated balance sheets. We minimize our exposure to loss under these commitments by subjecting them to credit approval and monitoring procedures.
We enter into contractual commitments to extend credit, normally with fixed expiration dates or termination clauses, at specified rates and for specific purposes. Substantially all of our commitments to extend credit are contingent upon customers maintaining specific credit standards at the time of loan funding. Standby letters of credit are written conditional commitments we issued to guarantee the performance of a customer to a third party. In the event the customer does not perform in accordance with the terms of the agreement with the third party, we would be required to fund the commitment. The maximum potential amount of future payments we could be required to make is represented by the contractual amount of the commitment. If the commitment were funded, we would be entitled to seek recovery from the customer. Our policies generally require that standby letter of credit arrangements contain security and debt covenants similar to those contained in loan agreements.
We consider the fees collected in connection with the issuance of standby letters of credit to be representative of the fair value of our obligation undertaken in issuing the guarantee. In accordance with applicable accounting standards related to guarantees, we defer fees collected in connection with the issuance of standby letters of credit. The fees are then recognized in income proportionately over the life of the standby letter of credit agreement. The deferred standby letter of credit fees represent the fair value of our potential obligations under the standby letter of credit guarantees.
Year-end financial instruments with off-balance-sheet risk were as follows:
2017 | 2016 | ||||||
Commitments to extend credit | $ | 7,949,400 | $ | 7,476,420 | |||
Standby letters of credit | 236,595 | 239,482 | |||||
Deferred standby letter of credit fees | 1,843 | 2,054 | |||||
Credit Card Guarantees. We guarantee the credit card debt of certain customers to the merchant bank that issues the cards. At December 31, 2017 and 2016, the guarantees totaled approximately $8.4 million and $8.3 million, of which amounts, $1.2 million and $975 thousand were fully collateralized.
109
Lease Commitments. We lease certain office facilities and office equipment under operating leases. Rent expense for all operating leases totaled $30.5 million in 2017, $28.9 million in 2016 and $28.9 million in 2015. Future minimum lease payments due under non-cancelable operating leases at December 31, 2017 were as follows:
2018 | $ | 27,990 | |
2019 | 28,790 | ||
2020 | 31,907 | ||
2021 | 30,855 | ||
2022 | 28,639 | ||
Thereafter | 347,187 | ||
$ | 495,368 | ||
It is expected that certain leases will be renewed, or equipment replaced with new leased equipment, as these leases expire. Aggregate future minimum rentals to be received under non-cancelable subleases greater than one year at December 31, 2017, were $445 thousand.
We lease certain branch facilities from various partnership interests of certain directors. Payments related to these leases totaled $1.4 million in 2017, $1.0 million in 2016 and $963 thousand in 2015.
Change in Control Agreements. We have change-in-control agreements with certain executive officers. Under these agreements, each covered person could receive, upon the effectiveness of a change-in-control, two to three times (depending on the person) his or her base compensation plus the target bonus established for the year, and any unpaid base salary and pro rata target bonus for the year in which the termination occurs, including vacation pay. Additionally, the executive’s insurance benefits will continue for two to three full years after the termination and all long-term incentive awards will immediately vest.
Litigation. We are subject to various claims and legal actions that have arisen in the course of conducting business. Management does not expect the ultimate disposition of these matters to have a material adverse impact on our financial statements.
Note 9 - Capital and Regulatory Matters
Banks and bank holding companies are subject to various regulatory capital requirements administered by state and federal banking agencies. Capital adequacy guidelines and, additionally for banks, prompt corrective action regulations, involve quantitative measures of assets, liabilities, and certain off-balance-sheet items calculated under regulatory accounting practices. Capital amounts and classifications are also subject to qualitative judgments by regulators about components, risk weighting and other factors.
The Basel III Capital Rules, a new comprehensive capital framework for U.S. banking organizations, became effective for Cullen/Frost and Frost Bank on January 1, 2015 (subject to a phase-in period for certain provisions). Quantitative measures established by the Basel III Capital Rules to ensure capital adequacy require the maintenance of minimum amounts and ratios (set forth in the table below) of Common Equity Tier 1 capital, Tier 1 capital and Total capital (as defined in the regulations) to risk-weighted assets (as defined), and of Tier 1 capital to adjusted quarterly average assets (as defined).
Cullen/Frost’s and Frost Bank’s Common Equity Tier 1 capital includes common stock and related paid-in capital, net of treasury stock, and retained earnings. In connection with the adoption of the Basel III Capital Rules, we elected to opt-out of the requirement to include most components of accumulated other comprehensive income in Common Equity Tier 1. Common Equity Tier 1 for both Cullen/Frost and Frost Bank is reduced by, goodwill and other intangible assets, net of associated deferred tax liabilities, and subject to transition provisions. Frost Bank's Common Equity Tier 1 is also reduced by its equity investment in its financial subsidiary, Frost Insurance Agency (“FIA”).
Tier 1 capital includes Common Equity Tier 1 capital and additional Tier 1 capital. For Cullen/Frost, additional Tier 1 capital at December 31, 2017 and 2016 included $144.5 million of 5.375% non-cumulative perpetual preferred stock. Frost Bank did not have any additional Tier 1 capital beyond Common Equity Tier 1 at December 31, 2017 or 2016.
Total capital includes Tier 1 capital and Tier 2 capital. Tier 2 capital for both Cullen/Frost and Frost Bank includes a permissible portion of the allowance for loan losses. Tier 2 capital for Cullen/Frost also includes trust preferred
110
securities that were excluded from Tier 1 capital and qualified subordinated debt. At both December 31, 2017 and 2016, Cullen/Frost's Tier 2 capital included $133.0 million of trust preferred securities. At December 31, 2017, Tier 2 Capital for Cullen/Frost included $100.0 million related to the permissible portion of our aggregate $100 million of 4.50% subordinated notes. The permissible portion of qualified subordinated notes decreases 20% per year during the final five years of the term of the notes. Accordingly, no portion of our $100 million of floating rate subordinated notes that matured on February 15, 2017 were included in Tier 2 capital at December 31, 2016.
The Common Equity Tier 1, Tier 1 and Total capital ratios are calculated by dividing the respective capital amounts by risk-weighted assets. Risk-weighted assets are calculated based on regulatory requirements and include total assets, with certain exclusions, allocated by risk weight category, and certain off-balance-sheet items, among other things. The leverage ratio is calculated by dividing Tier 1 capital by adjusted quarterly average total assets, which exclude goodwill and other intangible assets, among other things.
When fully phased in on January 1, 2019, the Basel III Capital Rules will require Cullen/Frost and Frost Bank to maintain (i) a minimum ratio of Common Equity Tier 1 capital to risk-weighted assets of at least 4.5%, plus a 2.5% “capital conservation buffer” (which is added to the 4.5% Common Equity Tier 1 capital ratio as that buffer is phased in, effectively resulting in a minimum ratio of Common Equity Tier 1 capital to risk-weighted assets of at least 7.0% upon full implementation), (ii) a minimum ratio of Tier 1 capital to risk-weighted assets of at least 6.0%, plus the capital conservation buffer (which is added to the 6.0% Tier 1 capital ratio as that buffer is phased in, effectively resulting in a minimum Tier 1 capital ratio of 8.5% upon full implementation), (iii) a minimum ratio of Total capital (that is, Tier 1 plus Tier 2) to risk-weighted assets of at least 8.0%, plus the capital conservation buffer (which is added to the 8.0% total capital ratio as that buffer is phased in, effectively resulting in a minimum total capital ratio of 10.5% upon full implementation) and (iv) a minimum leverage ratio of 4.0%, calculated as the ratio of Tier 1 capital to average quarterly assets.
The implementation of the capital conservation buffer began on January 1, 2016 at the 0.625% level and will be phased in over a four-year period (increasing by that amount on each subsequent January 1, until it reaches 2.5% on January 1, 2019). The Basel III Capital Rules also provide for a “countercyclical capital buffer” that is applicable to only certain covered institutions and does not have any current applicability to Cullen/Frost or Frost Bank. The capital conservation buffer is designed to absorb losses during periods of economic stress and, as detailed above, effectively increases the minimum required risk-weighted capital ratios. Banking institutions with a ratio of Common Equity Tier 1 capital to risk-weighted assets below the effective minimum (4.5% plus the capital conservation buffer and, if applicable, the countercyclical capital buffer) will face constraints on dividends, equity repurchases and compensation based on the amount of the shortfall.
111
The following table presents actual and required capital ratios as of December 31, 2017 and December 31, 2016 for Cullen/Frost and Frost Bank under the Basel III Capital Rules. The minimum required capital amounts presented include the minimum required capital levels as of December 31, 2017 and December 31, 2016 based on the phase-in provisions of the Basel III Capital Rules and the minimum required capital levels as of January 1, 2019 when the Basel III Capital Rules have been fully phased-in. Capital levels required to be considered well capitalized are based upon prompt corrective action regulations, as amended to reflect the changes under the Basel III Capital Rules.
Actual | Minimum Capital Required - Basel III Phase-In Schedule | Minimum Capital Required - Basel III Fully Phased-In | Required to be Considered Well Capitalized | ||||||||||||||||||||||||
Capital Amount | Ratio | Capital Amount | Ratio | Capital Amount | Ratio | Capital Amount | Ratio | ||||||||||||||||||||
2017 | |||||||||||||||||||||||||||
Common Equity Tier 1 to Risk-Weighted Assets | |||||||||||||||||||||||||||
Cullen/Frost | $ | 2,426,048 | 12.42 | % | $ | 1,123,430 | 5.75 | % | $ | 1,367,583 | 7.00 | % | $ | 1,269,965 | 6.50 | % | |||||||||||
Frost Bank | 2,518,999 | 12.92 | 1,120,663 | 5.75 | 1,364,214 | 7.00 | 1,266,836 | 6.50 | |||||||||||||||||||
Tier 1 Capital to Risk-Weighted Assets | |||||||||||||||||||||||||||
Cullen/Frost | 2,570,534 | 13.16 | 1,416,499 | 7.25 | 1,660,637 | 8.50 | 1,563,033 | 8.00 | |||||||||||||||||||
Frost Bank | 2,518,999 | 12.92 | 1,413,010 | 7.25 | 1,656,546 | 8.50 | 1,559,183 | 8.00 | |||||||||||||||||||
Total Capital to Risk-Weighted Assets | |||||||||||||||||||||||||||
Cullen/Frost | 2,959,326 | 15.15 | 1,807,257 | 9.25 | 2,051,375 | 10.50 | 1,953,792 | 10.00 | |||||||||||||||||||
Frost Bank | 2,674,791 | 13.72 | 1,802,805 | 9.25 | 2,046,321 | 10.50 | 1,948,979 | 10.00 | |||||||||||||||||||
Leverage Ratio | |||||||||||||||||||||||||||
Cullen/Frost | 2,570,534 | 8.46 | 1,215,227 | 4.00 | 1,215,186 | 4.00 | 1,519,034 | 5.00 | |||||||||||||||||||
Frost Bank | 2,518,999 | 8.30 | 1,214,295 | 4.00 | 1,214,254 | 4.00 | 1,517,869 | 5.00 | |||||||||||||||||||
2016 | |||||||||||||||||||||||||||
Common Equity Tier 1 to Risk-Weighted Assets | |||||||||||||||||||||||||||
Cullen/Frost | $ | 2,239,186 | 12.52 | % | $ | 916,360 | 5.125 | % | $ | 1,251,425 | 7.00 | % | $ | 1,162,213 | 6.50 | % | |||||||||||
Frost Bank | 2,296,480 | 12.88 | 913,460 | 5.125 | 1,247,463 | 7.00 | 1,158,535 | 6.50 | |||||||||||||||||||
Tier 1 Capital to Risk-Weighted Assets | |||||||||||||||||||||||||||
Cullen/Frost | 2,383,672 | 13.33 | 1,184,563 | 6.625 | 1,519,587 | 8.50 | 1,430,416 | 8.00 | |||||||||||||||||||
Frost Bank | 2,296,480 | 12.88 | 1,180,814 | 6.625 | 1,514,776 | 8.50 | 1,425,889 | 8.00 | |||||||||||||||||||
Total Capital to Risk-Weighted Assets | |||||||||||||||||||||||||||
Cullen/Frost | 2,669,717 | 14.93 | 1,542,168 | 8.625 | 1,877,137 | 10.50 | 1,788,020 | 10.00 | |||||||||||||||||||
Frost Bank | 2,449,525 | 13.74 | 1,537,286 | 8.625 | 1,871,194 | 10.50 | 1,782,361 | 10.00 | |||||||||||||||||||
Leverage Ratio | |||||||||||||||||||||||||||
Cullen/Frost | 2,383,672 | 8.14 | 1,171,682 | 4.00 | 1,171,573 | 4.00 | 1,464,602 | 5.00 | |||||||||||||||||||
Frost Bank | 2,296,480 | 7.85 | 1,170,249 | 4.00 | 1,170,141 | 4.00 | 1,462,812 | 5.00 | |||||||||||||||||||
Management believes that, as of December 31, 2017, Cullen/Frost and its bank subsidiary, Frost Bank, were “well capitalized” based on the ratios presented above.
Cullen/Frost and Frost Bank are subject to the regulatory capital requirements administered by the Federal Reserve Board and, for Frost Bank, the Federal Deposit Insurance Corporation (“FDIC”). Regulatory authorities can initiate certain mandatory actions if Cullen/Frost or Frost Bank fail to meet the minimum capital requirements, which could have a direct material effect on our financial statements. Management believes, as of December 31, 2017, that Cullen/Frost and Frost Bank meet all capital adequacy requirements to which they are subject.
112
Preferred Stock. On February 15, 2013, we issued and sold 6,000,000 shares, or $150.0 million in aggregate liquidation preference, of our 5.375% Non-Cumulative Perpetual Preferred Stock, Series A, par value $0.01 and liquidation preference $25 per share (“Series A Preferred Stock”). Dividends on the Series A Preferred stock, if declared, accrue and are payable quarterly, in arrears, at a rate of 5.375%. The Series A Preferred Stock qualifies as Tier 1 capital for the purposes of the regulatory capital calculations. The net proceeds from the issuance and sale of the Series A Preferred Stock, after deducting underwriting discount and commissions, and the payment of expenses, were approximately $144.5 million. The net proceeds from the offering were used to fund the repurchase of common stock.
Stock Repurchase Plans. From time to time, our board of directors has authorized stock repurchase plans. In general, stock repurchase plans allow us to proactively manage our capital position and return excess capital to shareholders. Shares purchased under such plans also provide us with shares of common stock necessary to satisfy obligations related to stock compensation awards. On October 24, 2017, our board of directors authorized a $150.0 million stock repurchase program, allowing us to repurchase shares of our common stock over a two-year period from time to time at various prices in the open market or through private transactions. No shares were repurchased under this plan during 2017. Under prior plans, we repurchased 1,134,966 shares at a total cost of $100.0 million during 2017 and 1,485,493 shares at a total cost of $100.0 million during 2015.
Dividend Restrictions. In the ordinary course of business, Cullen/Frost is dependent upon dividends from Frost Bank to provide funds for the payment of dividends to shareholders and to provide for other cash requirements. Banking regulations may limit the amount of dividends that may be paid. Approval by regulatory authorities is required if the effect of dividends declared would cause the regulatory capital of Frost Bank to fall below specified minimum levels. Approval is also required if dividends declared exceed the net profits for that year combined with the retained net profits for the preceding two years. Under the foregoing dividend restrictions and while maintaining its “well capitalized” status, at December 31, 2017, Frost Bank could pay aggregate dividends of up to $544.8 million to Cullen/Frost without prior regulatory approval.
Under the terms of the junior subordinated deferrable interest debentures that Cullen/Frost has issued to Cullen/Frost Capital Trust II and WNB Capital Trust I, Cullen/Frost has the right at any time during the term of the debentures to defer the payment of interest at any time or from time to time for an extension period not exceeding 20 consecutive quarterly periods with respect to each extension period. In the event that we have elected to defer interest on the debentures, we may not, with certain exceptions, declare or pay any dividends or distributions on our capital stock or purchase or acquire any of our capital stock.
Under the terms of the Series A Preferred Stock, in the event that we do not declare and pay dividends on the Series A Preferred Stock for the most recent dividend period, we may not, with certain exceptions, declare or pay dividends on, or purchase, redeem or otherwise acquire, shares of our common stock or any of our securities that rank junior to the Series A Preferred Stock.
Note 10 - Earnings Per Common Share
Earnings Per Common Share. Earnings per common share is computed using the two-class method. Basic earnings per common share is computed by dividing net earnings allocated to common stock by the weighted-average number of common shares outstanding during the applicable period, excluding outstanding participating securities. Participating securities include non-vested stock awards/stock units, deferred stock units and performance stock units (during the performance period), though no actual shares of common stock related to any type of stock unit have been issued. Non-vested stock awards/stock units and deferred stock units are considered participating securities because holders of these securities receive non-forfeitable dividends at the same rate as holders of our common stock. Holders of performance stock units receive dividend equivalent payments for dividends paid during the performance period at the vesting date of the award based upon the number of units that ultimately vest. Diluted earnings per common share is computed using the weighted-average number of shares determined for the basic earnings per common share computation plus the dilutive effect of stock compensation using the treasury stock method.
113
The following table presents a reconciliation of net income available to common shareholders, net earnings allocated to common stock and the number of shares used in the calculation of basic and diluted earnings per common share.
2017 | 2016 | 2015 | |||||||||
Net Income | $ | 364,149 | $ | 304,261 | $ | 279,328 | |||||
Less: Preferred stock dividends | 8,063 | 8,063 | 8,063 | ||||||||
Net income available to common shareholders | 356,086 | 296,198 | 271,265 | ||||||||
Less: Earnings allocated to participating securities | 2,016 | 1,145 | 941 | ||||||||
Net earnings allocated to common stock | $ | 354,070 | $ | 295,053 | $ | 270,324 | |||||
Distributed earnings allocated to common stock | $ | 143,356 | $ | 134,374 | $ | 131,702 | |||||
Undistributed earnings allocated to common stock | 210,714 | 160,679 | 138,622 | ||||||||
Net earnings allocated to common stock | $ | 354,070 | $ | 295,053 | $ | 270,324 | |||||
Weighted-average shares outstanding for basic earnings per common share | 63,693,927 | 62,376,260 | 62,758,074 | ||||||||
Dilutive effect of stock compensation | 968,161 | 592,615 | 715,250 | ||||||||
Weighted-average shares outstanding for diluted earnings per common share | 64,662,088 | 62,968,875 | 63,473,324 | ||||||||
Note 11 - Employee Benefit Plans
Retirement Plans
Profit Sharing Plans. The profit-sharing plan is a defined contribution retirement plan that covers employees who have completed at least one year of service and are age 21 or older. All contributions to the plan are made at our discretion and may be made without regard to current or accumulated profits. Contributions are allocated to eligible participants uniformly, based upon compensation, age and other factors. Plan participants self-direct the investment of allocated contributions by choosing from a menu of investment options. Account assets are subject to withdrawal restrictions and participants vest in their accounts after three years of service. We also maintain a separate non-qualified profit sharing plan for certain employees whose participation in the qualified profit sharing plan is limited. The plan offers such employees an alternative means of receiving comparable benefits. Expense related to these plans totaled $12.7 million in 2017, $11.6 million in 2016 and $11.3 million in 2015.
Retirement Plan and Restoration Plan. We maintain a non-contributory defined benefit plan (the “Retirement Plan”) that was frozen as of December 31, 2001. The plan provides pension and death benefits to substantially all employees who were at least 21 years of age and had completed at least one year of service prior to December 31, 2001. Defined benefits are provided based on an employee’s final average compensation and years of service at the time the plan was frozen and age at retirement. The freezing of the plan provides that future salary increases will not be considered. Our funding policy is to contribute yearly, at least the amount necessary to satisfy the funding standards of the Employee Retirement Income Security Act (“ERISA”).
Our Restoration of Retirement Income Plan (the “Restoration Plan”) provides benefits for eligible employees that are in excess of the limits under Section 415 of the Internal Revenue Code of 1986, as amended, that apply to the Retirement Plan. The Restoration Plan is designed to comply with the requirements of ERISA. The entire cost of the plan, which was also frozen as of December 31, 2001, is supported by our contributions.
114
We use a December 31 measurement date for our defined benefit plans. Combined activity in our defined benefit pension plans was as follows:
2017 | 2016 | 2015 | |||||||||
Change in plan assets: | |||||||||||
Fair value of plan assets at beginning of year | $ | 157,214 | $ | 163,270 | $ | 168,185 | |||||
Actual return on plan assets | 23,518 | 5,174 | 1,567 | ||||||||
Employer contributions | 1,049 | 4,819 | 736 | ||||||||
Benefits paid | (13,331 | ) | (16,049 | ) | (7,218 | ) | |||||
Fair value of plan assets at end of year | 168,450 | 157,214 | 163,270 | ||||||||
Change in benefit obligation: | |||||||||||
Benefit obligation at beginning of year | 176,751 | 194,140 | 199,637 | ||||||||
Interest cost | 6,189 | 6,958 | 8,210 | ||||||||
Actuarial (gain) loss | 12,998 | (8,298 | ) | (6,489 | ) | ||||||
Benefits paid | (13,331 | ) | (16,049 | ) | (7,218 | ) | |||||
Benefit obligation at end of year | 182,607 | 176,751 | 194,140 | ||||||||
Funded status of the plan at end of year and accrued benefit (liability) recognized | $ | (14,157 | ) | $ | (19,537 | ) | $ | (30,870 | ) | ||
Accumulated benefit obligation at end of year | $ | 182,607 | $ | 176,751 | $ | 194,140 | |||||
Certain disaggregated information related to our defined benefit pension plans as of year-end was as follows:
Retirement Plan | Restoration Plan | ||||||||||||||
2017 | 2016 | 2017 | 2016 | ||||||||||||
Projected benefit obligation | $ | 166,191 | $ | 160,778 | $ | 16,416 | $ | 15,973 | |||||||
Accumulated benefit obligation | 166,191 | 160,778 | 16,416 | 15,973 | |||||||||||
Fair value of plan assets | 168,450 | 157,214 | — | — | |||||||||||
Funded status of the plan at end of year and accrued benefit (liability) recognized | 2,259 | (3,564 | ) | (16,416 | ) | (15,973 | ) | ||||||||
The components of the combined net periodic cost (benefit) for our defined benefit pension plans are presented in the table below. Supplemental executive retirement plan (“SERP”) settlement costs were related to the retirement of a former executive officer.
2017 | 2016 | 2015 | |||||||||
Expected return on plan assets, net of expenses | $ | (11,117 | ) | $ | (11,558 | ) | $ | (11,932 | ) | ||
Interest cost on projected benefit obligation | 6,189 | 6,958 | 8,210 | ||||||||
Net amortization and deferral | 5,429 | 6,247 | 6,995 | ||||||||
SERP settlement costs | — | 1,027 | — | ||||||||
Net periodic expense (benefit) | $ | 501 | $ | 2,674 | $ | 3,273 | |||||
As of December 31, 2015, we changed the method we use to estimate the interest cost component of net periodic benefit cost for our defined benefit pension and other post-retirement benefit plans. Prior to the change, we estimated the interest cost component utilizing a single weighted-average discount rate derived from the yield curve used to measure our projected benefit obligation. Under the new method, we utilize a full yield curve approach in the estimation of the interest cost component by applying the specific annual spot rates along the yield curve used in the measurement of our projected benefit obligation to the relevant projected cash flows. We view the full yield curve method as more representationally faithful of effective settlement rates as the interest cost component of the net periodic cost is measured more precisely, reflecting the difference in the timing of future benefit payment cash flows. This new method constituted a change in an accounting estimate that was inseparable from a change in accounting principle and was accounted for prospectively, with the resulting change impacting the recognition of net periodic benefit cost beginning January 1, 2016.
115
Amounts related to our defined benefit pension plans recognized as a component of other comprehensive income were as follows:
2017 | 2016 | 2015 | |||||||||
Net actuarial gain (loss) | $ | 4,832 | $ | 9,188 | $ | 3,118 | |||||
Deferred tax (expense) benefit | (1,774 | ) | (3,216 | ) | (1,091 | ) | |||||
Other comprehensive income (loss), net of tax | $ | 3,058 | $ | 5,972 | $ | 2,027 | |||||
Amounts recognized as a component of accumulated other comprehensive loss as of year-end that have not been recognized as a component of the combined net period benefit cost of our defined benefit pension plans are presented in the following table. We expect to recognize approximately $5.0 million of the net actuarial loss reported in the following table as of December 31, 2017 as a component of net periodic benefit cost during 2018.
2017 | 2016 | ||||||
Net actuarial loss | $ | (57,900 | ) | $ | (62,732 | ) | |
Deferred tax benefit | 12,160 | 21,956 | |||||
Amounts included in accumulated other comprehensive income/loss, net of tax | (37,718 | ) | (40,776 | ) | |||
The weighted-average assumptions used to determine the benefit obligations as of the end of the years indicated and the net periodic benefit cost for the years indicated are presented in the table below. Because the plans were frozen, increases in compensation are not considered after 2001.
2017 | 2016 | 2015 | ||||||
Benefit obligations: | ||||||||
Discount rate | 3.68 | % | 4.24 | % | 4.55 | % | ||
Net periodic benefit cost: | ||||||||
Discount rate | 4.24 | % | 4.55 | % | 4.20 | % | ||
Expected return on plan assets | 7.25 | 7.25 | 7.25 | |||||
Management uses an asset allocation optimization model to analyze the potential risks and rewards associated with various asset allocation strategies on a quarterly basis. As of December 31, 2017, management’s investment objective for our defined benefit plans is to achieve long-term growth. This strategy provides for a target asset allocation of approximately 65% invested in equity securities, approximately 32% invested in fixed income debt securities with any remainder invested in cash or short-term cash equivalents. The modeling process calculates, with a 90% confidence ratio, the potential risk associated with a given asset allocation and helps achieve adequate diversification of investment assets. The plan assets are reviewed annually to determine if the obligations can be met with the current investment mix and funding strategy.
The major categories of assets in our Retirement Plan as of year-end are presented in the following table. Assets are segregated by the level of the valuation inputs within the fair value hierarchy established by ASC Topic 820 “Fair Value Measurements and Disclosures,” utilized to measure fair value (see Note 17 - Fair Value Measurements). Our Restoration Plan is unfunded.
2017 | 2016 | ||||||
Level 1: | |||||||
Mutual funds | $ | 165,322 | $ | 153,765 | |||
Cash and cash equivalents | 3,128 | 3,208 | |||||
Level 2: | |||||||
U.S. government agency securities | — | 241 | |||||
Total fair value of plan assets | $ | 168,450 | $ | 157,214 | |||
Mutual funds include various equity, fixed-income and blended funds with varying investment strategies. Approximately 65% of mutual fund investments consist of equity investments as of December 31, 2017. The investment objective of equity funds is long-term capital appreciation with current income. The remaining mutual fund investments consist of U.S. fixed-income securities, including investment-grade U.S. Treasury securities, U.S. government agency securities and mortgage-backed securities, corporate bonds and notes and collateralized mortgage obligations. The investment objective of fixed-income funds is to maximize investment return while preserving investment principal.
116
U.S. government agency securities include obligations of Ginnie Mae. Our investment strategies prohibit selling assets short and the use of derivatives. Additionally, our defined benefit plans do not directly invest in real estate, commodities, or private investments.
The asset allocation optimization model is used to estimate the expected long-term rate of return for a given asset allocation strategy. Expectations of returns for each asset class are based on comprehensive reviews of historical data and economic/financial market theory. During periods with volatile interest rates and equity security prices, the model may call for changes in the allocation of plan investments to achieve desired returns. Management assumed a long-term rate of return of 7.25% in the determination of the net periodic benefit cost for 2017. The expected long-term rate of return on assets was selected from within the reasonable range of rates determined by historical real returns, net of inflation, for the asset classes covered by the plan’s investment policy and projections of inflation over the long-term period during which benefits are payable to plan participants.
As of December 31, 2017, expected future benefit payments related to our defined benefit plans were as follows:
2018 | $ | 9,395 | |
2019 | 9,837 | ||
2020 | 10,230 | ||
2021 | 10,524 | ||
2022 | 10,770 | ||
2023 through 2026 | 55,927 | ||
$ | 106,683 | ||
We expect to contribute $1.1 million to the defined benefit plans during 2018.
Supplemental Executive Retirement Plan. We maintained a supplemental executive retirement plan (“SERP”) for one key executive who retired in 2016. The plan provided for target retirement benefits, as a percentage of pay, beginning at age 55. The target percentage was 45 percent of pay at age 55, increasing to 60 percent at age 60 and later. Benefits under the SERP were reduced, dollar-for-dollar, by benefits received under the profit sharing, non-qualified profit sharing, defined benefit retirement and restoration plans, described above, and any social security benefits. Settlement costs related to the SERP during 2016 are reported as a component of net periodic pension expense, detailed above.
Savings Plans
401(k) Plan and Thrift Incentive Plan. We maintain a 401(k) stock purchase plan that permits each participant to make before- or after-tax contributions in an amount not less than 2% and not exceeding 50% of eligible compensation and subject to dollar limits from Internal Revenue Service regulations. We match 100% of the employee’s contributions to the plan based on the amount of each participant’s contributions up to a maximum of 6% of eligible compensation. Eligible employees must complete 90 days of service in order to enroll and vest in our matching contributions immediately. Expense related to the plan totaled $14.3 million in 2017, $13.6 million in 2016, and $13.3 million in 2015. Our matching contribution is initially invested in the Cullen/Frost common stock fund. However, employees may immediately reallocate our matching portion, as well as invest their individual contribution, to any of a variety of investment alternatives offered under the 401(k) Plan.
We maintain a thrift incentive stock purchase plan to offer certain employees whose participation in the 401(k) plan is limited an alternative means of receiving comparable benefits. Expense related to this plan was not significant during 2017, 2016 and 2015.
Stock Compensation Plans
We have three active stock compensation plans (the 2005 Omnibus Incentive Plan, the 2007 Outside Directors Incentive Plan and the 2015 Omnibus Incentive Plan). All of the plans have been approved by our shareholders. During 2015, the 2015 Omnibus Incentive Plan (“2015 Plan”) was established to replace both the 2005 Omnibus Incentive Plan (“2005 Plan”) and the 2007 Outside Directors Incentive Plan (the “2007 Directors Plan”). All remaining shares authorized for grant under the superseded 2005 Plan and 2007 Directors Plan were transferred to the 2015 Plan. Our stock compensation plans were established to (i) motivate superior performance by means of performance-related incentives, (ii) encourage and provide for the acquisition of an ownership interest in our company by employees and
117
non-employee directors and (iii) enable us to attract and retain qualified and competent persons as employees and to serve as members of our board of directors.
Under the 2015 Plan, we may grant, among other things, nonqualified stock options, incentive stock options, stock awards, stock appreciation rights, restricted stock units, performance share units or any combination thereof to certain employees and non-employee directors. Any of the authorized shares may be used for any type of award allowable under the Plan. The Compensation and Benefits Committee (“Committee”) of our Board of Directors has sole authority to (i) establish the awards to be issued, (ii) select the employees and non-employee directors to receive awards, and (iii) approve the terms and conditions of each award contract. Each award under the stock plans is evidenced by an award agreement that specifies the award price, the duration of the award, the number of shares to which the award pertains, and such other provisions as the Committee determines. For stock options, the option price for each grant is at least equal to the fair market value of a share of Cullen/Frost’s common stock on the date of grant. Options granted expire at such time as the Committee determines at the date of grant and in no event does the exercise period exceed a maximum of ten years. As defined in the plans, outstanding awards may immediately vest upon a change-in-control of Cullen/Frost and, in the case of awards granted under the 2015 Plan, subsequent termination resulting from the change in control.
A combined summary of activity in our active stock plans is presented in the table. Performance stock units outstanding are presented assuming attainment of the maximum payout rate as set forth by the performance criteria. The target award level for performance stock units granted in 2017 and 2016 was 24,162 and 29,240, respectively. As of December 31, 2017, there were 1,367,750 shares remaining available for grant for future awards.
Director Deferred Stock Units Outstanding | Non-Vested Stock Awards/Stock Units Outstanding | Performance Stock Units Outstanding | Stock Options Outstanding | |||||||||||||||||||||||||
Number of Units | Weighted- Average Fair Value at Grant | Number of Shares/Units | Weighted- Average Fair Value at Grant | Number of Units | Weighted- Average Fair Value at Grant | Number of Shares | Weighted- Average Exercise Price | |||||||||||||||||||||
January 1, 2015 | 38,867 | $ | 59.39 | 175,490 | $ | 60.55 | — | $ | — | 5,029,882 | $ | 58.99 | ||||||||||||||||
Authorized | — | — | — | — | — | — | — | — | ||||||||||||||||||||
Granted | 6,576 | 72.94 | 53,990 | 65.11 | — | — | 890,940 | 65.11 | ||||||||||||||||||||
Exercised/vested | — | — | (56,300 | ) | 48.00 | — | — | (287,326 | ) | 51.70 | ||||||||||||||||||
Forfeited/expired | — | — | — | — | — | — | (21,256 | ) | 66.72 | |||||||||||||||||||
December 31, 2015 | 45,443 | 61.35 | 173,180 | 66.05 | — | — | 5,612,240 | 60.30 | ||||||||||||||||||||
Authorized | — | — | — | — | — | — | — | — | ||||||||||||||||||||
Granted | 8,216 | 63.25 | 132,800 | 76.07 | 43,860 | 69.70 | — | — | ||||||||||||||||||||
Exercised/vested | — | — | (49,130 | ) | 54.56 | — | — | (1,476,841 | ) | 53.40 | ||||||||||||||||||
Forfeited/expired | — | — | — | — | — | — | (46,371 | ) | 71.04 | |||||||||||||||||||
December 31, 2016 | 53,659 | 61.48 | 256,850 | 73.43 | 43,860 | 69.70 | 4,089,028 | 62.67 | ||||||||||||||||||||
Authorized | — | — | — | — | — | — | — | — | ||||||||||||||||||||
Granted | 5,447 | 95.37 | 99,833 | 98.90 | 36,243 | 92.27 | — | — | ||||||||||||||||||||
Exercised/vested | (6,098 | ) | 62.29 | (39,740 | ) | 71.59 | — | — | (1,118,122 | ) | 60.59 | |||||||||||||||||
Forfeited/expired | — | — | (4,287 | ) | 79.52 | — | — | (53,764 | ) | 69.78 | ||||||||||||||||||
December 31, 2017 | 53,008 | $ | 64.87 | 312,656 | $ | 81.71 | 80,103 | $ | 79.91 | 2,917,142 | $ | 63.34 | ||||||||||||||||
Options awarded to employees generally have a ten-year life and vest in equal annual installments over a four-year period. Non-vested stock awards/stock units awarded to employees generally have a four-year-cliff vesting period. No options were awarded to non-employee directors during the reported periods. Deferred stock units awarded to non-employee directors generally have immediate vesting. Upon retirement from our board of directors, non-employee directors will receive one share of our common stock for each deferred stock unit held. Outstanding non-vested stock units and deferred stock units receive equivalent dividend payments as such dividends are declared on our common stock.
Performance stock units represent shares potentially issuable in the future. Issuance is based upon the measure of our achievement of relative return on assets over a three-year performance period compared to an identified peer group's achievement of relative return on assets over the same three-year performance period. The ultimate number of shares issuable under each performance award is the product of the award target and the award payout percentage for the given
118
level of achievement. The level of achievement is measured as the percentile rank of relative return on assets among the peer group. The award payout percentages by level of achievement are as follows: (i) less than 25th percentile pays out at 0% of target, (ii) 25th percentile pays out at 50% of target, (iii) 50th percentile pays out at 100% of target and (iv) 75th percentile or more pays out at 150% of target. Achievement between the aforementioned percentiles will result in an award payout percentage determined based on straight-line interpolation between the percentiles. Performance stock units are eligible to receive equivalent dividend payments as such dividends are declared on our common stock during the performance period. Equivalent dividend payments are based upon the ultimate number of shares issued under each performance award and are deferred until such time that the units vest and shares are issued.
Other information regarding options outstanding and exercisable as of December 31, 2017 is as follows:
Options Outstanding | Options Exercisable | |||||||||||||||||||||||
Range of Exercise Prices | Number of Shares | Weighted- Average Exercise Price | Weighted- Average Remaining Contractual Life in Years | Number of Shares | Weighted- Average Exercise Price | |||||||||||||||||||
$ | 45.01 | to | $ | 50.00 | 294,230 | $ | 48.00 | 3.82 | 294,230 | $ | 48.00 | |||||||||||||
50.01 | to | 55.00 | 915,923 | 52.79 | 3.04 | 915,923 | 52.79 | |||||||||||||||||
65.01 | to | 70.00 | 711,477 | 65.11 | 7.49 | 294,507 | 65.11 | |||||||||||||||||
70.01 | to | 75.00 | 345,195 | 71.39 | 5.78 | 345,195 | 71.39 | |||||||||||||||||
75.01 | to | 80.00 | 650,317 | 78.94 | 6.58 | 445,131 | 78.94 | |||||||||||||||||
Total | 2,917,142 | 63.34 | 5.32 | 2,294,986 | 61.63 | |||||||||||||||||||
The total intrinsic value of outstanding in-the-money stock options and outstanding in-the-money exercisable stock options was $91.3 million and $75.8 million at December 31, 2017.
Shares issued in connection with stock compensation awards are issued from available treasury shares. If no treasury shares are available, new shares are issued from available authorized shares. Shares issued in connection with stock compensation awards along with other related information were as follows:
2017 | 2016 | 2015 | |||||||||
New shares issued from available authorized shares | 603,842 | — | — | ||||||||
Issued from available treasury stock | 547,078 | 1,509,121 | 337,056 | ||||||||
Total | 1,150,920 | 1,509,121 | 337,056 | ||||||||
Proceeds from stock option exercises | $ | 67,746 | $ | 78,866 | $ | 14,853 | |||||
Intrinsic value of stock options exercised | 38,275 | 30,935 | 5,766 | ||||||||
Fair value of stock awards/units vested | 4,578 | 3,679 | 3,728 | ||||||||
Stock-based Compensation Expense. Stock-based compensation expense is recognized ratably over the requisite service period for all awards. For most stock option awards, the service period generally matches the vesting period. For stock options granted to certain executive officers and for non-vested stock units granted to all participants, the service period does not extend past the date the participant reaches 65 years of age. Deferred stock units granted to non-employee directors generally have immediate vesting and the related expense is fully recognized on the date of grant. For performance stock units, the service period generally matches the three-year performance period specified by the award, however, the service period does not extend past the date the participant reaches 65 years of age. Expense recognized each period is dependent upon our estimate of the number of shares that will ultimately be issued.
119
Stock-based compensation expense and the related income tax benefit is presented in the following table. The service period for performance stock units granted each year begins on January 1 of the following year.
2017 | 2016 | 2015 | |||||||||
Stock options | $ | 6,230 | $ | 8,235 | $ | 9,660 | |||||
Non-vested stock awards/stock units | 4,992 | 3,044 | 2,597 | ||||||||
Deferred stock-units | 519 | 520 | 480 | ||||||||
Performance stock units | 1,272 | — | — | ||||||||
Total | $ | 13,013 | $ | 11,799 | $ | 12,737 | |||||
Income tax benefit | $ | 4,555 | $ | 4,130 | $ | 4,458 | |||||
Unrecognized stock-based compensation expense and the weighted-average period over which the expense is expected to be recognized at December 31, 2017 is presented in the table below. Unrecognized stock-based compensation expense related to performance stock units is presented assuming attainment of the maximum payout rate as set forth by the performance criteria.
Unrecognized Expense | Weighted-Average Number of Years for Expense Recognition | ||||
Stock options | $ | 5,575 | 1.4 | ||
Non-vested stock awards/stock units | 14,953 | 3.0 | |||
Performance stock units | 5,129 | 2.1 | |||
Total | $ | 25,657 | |||
Valuation of Stock-Based Compensation. For the purposes of recognizing stock-based compensation expense, the fair value of non-vested stock awards/stock units and deferred stock units is the market price of the stock on the measurement date, which, for us, is the date of the award. The fair value of performance stock units is determined in a similar manner except that the market price of the stock on the measurement date is discounted by the present value of the dividends expected to be paid on our common stock during the service period of the award because dividend equivalent payments on performance stock units are deferred until such time that the units vest and shares are issued. In applying this discount to the market price of our stock on the measurement date, we assumed we would pay a flat quarterly dividend during the service period equal to our most recent dividend payment, which was $0.57 in 2017 and $0.54 in 2016, discounted at a weighted-average risk-free rate of 1.7% in 2017 and 1.0% in 2016.
The fair value of employee stock options granted is estimated on the measurement date, which, for us, is the date of grant. The fair value of stock options is estimated using a binomial lattice-based valuation model that takes into account employee exercise patterns based on changes in our stock price and other variables, and allows for the use of dynamic assumptions about interest rates and expected volatility.
No stock options were granted during 2017 or 2016. The weighted-average fair value of stock options granted during 2015, estimated using a binomial lattice-based valuation model, was $10.23. The assumptions used to determine the fair value of options granted in 2015 included (i) weighted-average risk free rate of 2.05%, (ii) dividend yield of 3.02%, (iii) weighted-average expected market price volatility of 26.48% and (iv) weighted-average expected term of 5.7 years. Expected volatility is based on the short-term historical volatility (estimated over the most recent two years) and the long-term historical volatility (estimated over a period at least equal to the contractual term of the options) of our stock, and other factors. A variance targeting methodology is utilized to estimate the convergence, or mean reversion, from short-term to long-term volatility within the model. In estimating the fair value of stock options under the binomial lattice-based valuation model, separate groups of employees that have similar historical exercise behavior are considered separately. The expected term of options granted is derived using a regression model and represents the period of time that options granted are expected to be outstanding. Certain groups of employees exhibit different behavior.
120
Note 12 - Other Non-Interest Income and Expense
Other non-interest income and expense totals are presented in the following tables. Components of these totals exceeding 1% of the aggregate of total net interest income and total non-interest income for any of the years presented are stated separately.
2017 | 2016 | 2015 | |||||||||
Other non-interest income: | |||||||||||
Other | $ | 37,222 | $ | 41,144 | $ | 35,656 | |||||
Total | $ | 37,222 | $ | 41,144 | $ | 35,656 | |||||
Other non-interest expense: | |||||||||||
Advertising, promotions and public relations | $ | 29,337 | $ | 27,677 | $ | 28,858 | |||||
Professional services | 27,968 | 26,664 | 26,283 | ||||||||
Travel/meals and entertainment | 15,066 | 14,393 | 15,346 | ||||||||
Check card expense | 12,479 | 15,572 | 13,008 | ||||||||
Other | 90,439 | 94,682 | 82,066 | ||||||||
Total | $ | 175,289 | $ | 178,988 | $ | 165,561 | |||||
Note 13 - Income Taxes
Income tax expense was as follows:
2017 | 2016 | 2015 | |||||||||
Current income tax expense | $ | 58,707 | $ | 48,748 | $ | 59,530 | |||||
Deferred income tax expense (benefit) | (14,493 | ) | (11,598 | ) | (19,059 | ) | |||||
Income tax expense, as reported | $ | 44,214 | $ | 37,150 | $ | 40,471 | |||||
Effective tax rate | 10.8 | % | 10.9 | % | 12.7 | % | |||||
A reconciliation between reported income tax expense and the amounts computed by applying the U.S. federal statutory income tax rate of 35% to income before income taxes is presented in the following table.
2017 | 2016 | 2015 | |||||||||
Income tax expense computed at the statutory rate | $ | 142,927 | $ | 119,494 | $ | 111,930 | |||||
Effect of tax-exempt interest | (81,995 | ) | (75,696 | ) | (70,889 | ) | |||||
Bank owned life insurance income | (1,116 | ) | (1,260 | ) | (1,255 | ) | |||||
Net tax benefit from stock-based compensation | (9,062 | ) | (5,063 | ) | — | ||||||
Provisional deferred tax adjustment related to reduction in U.S. federal statutory income tax rate | (4,047 | ) | — | — | |||||||
Correction for prior year tax-exempt interest | (2,906 | ) | — | — | |||||||
Other | 413 | (325 | ) | 685 | |||||||
Income tax expense, as reported | $ | 44,214 | $ | 37,150 | $ | 40,471 | |||||
Income tax expense for 2017 was impacted by the adjustment of our deferred tax assets and liabilities related to the reduction in the U.S. federal statutory income tax rate to 21% under the Tax Cuts and Jobs Act, which was enacted on December 22, 2017. As a result of the new law, which is more fully discussed below, we recognized a provisional net tax benefit totaling $4.0 million, as detailed in the table above. Income tax expense for 2017 was also impacted by the correction of an over-accrual of taxes that resulted from incorrectly classifying certain tax-exempt loans as taxable for federal income tax purposes since 2013. As a result, we recognized tax benefits totaling $2.9 million related to the 2013 through 2016 tax years, as detailed in the table above. During 2016, we adopted a new accounting standard that requires the income tax effects associated with stock-based compensation to be recognized as a component of income tax expense. We recognized net tax benefits related to stock-based compensation totaling $9.1 million in 2017 and $5.1 million in 2016, as detailed in the table above. See Note 1 - Significant Accounting Policies for additional information related to the accounting for the income tax effects of stock-based compensation. There were no unrecognized tax benefits during any of the reported periods. Interest and/or penalties related to income taxes are reported as a component of income tax expense. Such amounts were not significant during the reported periods.
121
Year-end deferred taxes are presented in the table below. As a result of the Tax Cuts and Jobs Act enacted on December 22, 2017 (discussed below), deferred taxes as of December 31, 2017 are based on the newly enacted U.S. statutory federal income tax rate of 21%. Deferred taxes as of December 31, 2016 are based on the previously enacted U.S. statutory federal income tax rate of 35%.
2017 | 2016 | ||||||
Deferred tax assets: | |||||||
Allowance for loan losses | $ | 32,626 | $ | 53,566 | |||
Alternative minimum tax carryforward, no expiration date | 47,104 | 30,384 | |||||
Net actuarial loss on defined benefit post-retirement benefit plans | 12,160 | 21,956 | |||||
Stock-based compensation | 9,904 | 18,140 | |||||
Bonus accrual | 1,136 | 7,035 | |||||
Gain on sale of assets | 883 | 2,485 | |||||
Transaction costs | 875 | 1,587 | |||||
Other | 3,996 | 4,449 | |||||
Total gross deferred tax assets | 108,684 | 139,602 | |||||
Deferred tax liabilities: | |||||||
Premises and equipment | (20,236 | ) | (33,777 | ) | |||
Defined benefit post-retirement benefit plans | (9,012 | ) | (14,828 | ) | |||
Intangible assets | (9,014 | ) | (11,697 | ) | |||
Net unrealized gain on securities available for sale and transferred securities | (35,829 | ) | (8,699 | ) | |||
Leases | (1,646 | ) | (3,042 | ) | |||
Section 481(a) change in accounting method (tangible property) | — | (1,694 | ) | ||||
Prepaid expenses | (996 | ) | (1,743 | ) | |||
Other | (233 | ) | (436 | ) | |||
Total gross deferred tax liabilities | (76,966 | ) | (75,916 | ) | |||
Net deferred tax asset (liability) | $ | 31,718 | $ | 63,686 | |||
No valuation allowance for deferred tax assets was recorded at December 31, 2017 and 2016 as management believes it is more likely than not that all of the deferred tax assets will be realized against deferred tax liabilities and projected future taxable income. There were no unrecognized tax benefits during any of the reported periods.
We file income tax returns in the U.S. federal jurisdiction. We are no longer subject to U.S. federal income tax examinations by tax authorities for years before 2014.
Tax Cuts and Jobs Act. The Tax Cuts and Jobs Act was enacted on December 22, 2017. Among other things, the new law (i) establishes a new, flat corporate federal statutory income tax rate of 21%, (ii) eliminates the corporate alternative minimum tax and allows the use of any such carryforwards to offset regular tax liability for any taxable year, (iii) limits the deduction for net interest expense incurred by U.S. corporations, (iv) allows businesses to immediately expense, for tax purposes, the cost of new investments in certain qualified depreciable assets, (v) eliminates or reduces certain deductions related to meals and entertainment expenses, (vi) modifies the limitation on excessive employee remuneration to eliminate the exception for performance-based compensation and clarifies the definition of a covered employee and (vii) limits the deductibility of deposit insurance premiums. The Tax Cuts and Jobs Act also significantly changes U.S. tax law related to foreign operations, however, such changes do not currently impact us.
As stated above, as a result of the enactment of the Tax Cuts and Jobs Act on December 22, 2017, we remeasured our deferred tax assets and liabilities based upon the newly enacted U.S. statutory federal income tax rate of 21%, which is the tax rate at which these assets and liabilities are expected to reverse in the future. Notwithstanding the foregoing, we are still analyzing certain aspects of the new law and refining our calculations, which could affect the measurement of these assets and liabilities or give rise to new deferred tax amounts. Nonetheless, we recognized a provisional net tax benefit related to the remeasurement of our deferred tax assets and liabilities totaling $4.0 million.
122
Note 14 - Other Comprehensive Income (Loss)
The tax effects allocated to each component of other comprehensive income (loss) were as follows:
Before Tax Amount | Tax Expense, (Benefit) | Net of Tax Amount | |||||||||
2017 | |||||||||||
Securities available for sale and transferred securities: | |||||||||||
Change in net unrealized gain/loss during the period | $ | 157,016 | $ | 48,626 | $ | 108,390 | |||||
Change in net unrealized gain on securities transferred to held to maturity | (16,193 | ) | (5,668 | ) | (10,525 | ) | |||||
Reclassification adjustment for net (gains) losses included in net income | 4,941 | 1,729 | 3,212 | ||||||||
Total securities available for sale and transferred securities | 145,764 | 44,687 | 101,077 | ||||||||
Defined-benefit post-retirement benefit plans: | |||||||||||
Change in the net actuarial gain/loss | (597 | ) | (126 | ) | (471 | ) | |||||
Reclassification adjustment for net amortization of actuarial gain/loss included in net income as a component of net periodic cost (benefit) | 5,429 | 1,900 | 3,529 | ||||||||
Total defined-benefit post-retirement benefit plans | 4,832 | 1,774 | 3,058 | ||||||||
Total other comprehensive income (loss) | $ | 150,596 | $ | 46,461 | $ | 104,135 | |||||
2016 | |||||||||||
Securities available for sale and transferred securities: | |||||||||||
Change in net unrealized gain/loss during the period | $ | (175,061 | ) | $ | (61,271 | ) | $ | (113,790 | ) | ||
Change in net unrealized gain on securities transferred to held to maturity | (32,207 | ) | (11,272 | ) | (20,935 | ) | |||||
Reclassification adjustment for net (gains) losses included in net income | (14,975 | ) | (5,242 | ) | (9,733 | ) | |||||
Total securities available for sale and transferred securities | (222,243 | ) | (77,785 | ) | (144,458 | ) | |||||
Defined-benefit post-retirement benefit plans: | |||||||||||
Change in the net actuarial gain/loss | 1,914 | 670 | 1,244 | ||||||||
Reclassification adjustment for net amortization of actuarial gain/loss included in net income as a component of net periodic cost (benefit) | 7,274 | 2,546 | 4,728 | ||||||||
Total defined-benefit post-retirement benefit plans | 9,188 | 3,216 | 5,972 | ||||||||
Total other comprehensive income (loss) | $ | (213,055 | ) | $ | (74,569 | ) | $ | (138,486 | ) | ||
2015 | |||||||||||
Securities available for sale and transferred securities: | |||||||||||
Change in net unrealized gain/loss during the period | $ | (12,450 | ) | $ | (4,358 | ) | $ | (8,092 | ) | ||
Change in net unrealized gain on securities transferred to held to maturity | (33,601 | ) | (11,760 | ) | (21,841 | ) | |||||
Reclassification adjustment for net (gains) losses included in net income | (69 | ) | (24 | ) | (45 | ) | |||||
Total securities available for sale and transferred securities | (46,120 | ) | (16,142 | ) | (29,978 | ) | |||||
Defined-benefit post-retirement benefit plans: | |||||||||||
Change in the net actuarial gain/loss | (3,877 | ) | (1,357 | ) | (2,520 | ) | |||||
Reclassification adjustment for net amortization of actuarial gain/loss included in net income as a component of net periodic cost (benefit) | 6,995 | 2,448 | 4,547 | ||||||||
Total defined-benefit post-retirement benefit plans | 3,118 | 1,091 | 2,027 | ||||||||
Total other comprehensive income (loss) | $ | (43,002 | ) | $ | (15,051 | ) | $ | (27,951 | ) | ||
123
Activity in accumulated other comprehensive income, net of tax, was as follows:
Securities Available For Sale | Defined Benefit Plans | Accumulated Other Comprehensive Income | |||||||||
Balance January 1, 2017 | $ | 16,153 | $ | (40,776 | ) | $ | (24,623 | ) | |||
Other comprehensive income (loss) before reclassification | 97,865 | (471 | ) | 97,394 | |||||||
Amounts reclassified from accumulated other comprehensive income (loss) | 3,212 | 3,529 | 6,741 | ||||||||
Net other comprehensive income (loss) during period | 101,077 | 3,058 | 104,135 | ||||||||
Balance December 31, 2017 | $ | 117,230 | $ | (37,718 | ) | $ | 79,512 | ||||
Balance January 1, 2016 | $ | 160,611 | $ | (46,748 | ) | $ | 113,863 | ||||
Other comprehensive income (loss) before reclassification | (134,725 | ) | 1,244 | (133,481 | ) | ||||||
Amounts reclassified from accumulated other comprehensive income (loss) | (9,733 | ) | 4,728 | (5,005 | ) | ||||||
Net other comprehensive income (loss) during period | (144,458 | ) | 5,972 | (138,486 | ) | ||||||
Balance December 31, 2016 | $ | 16,153 | $ | (40,776 | ) | $ | (24,623 | ) | |||
Balance January 1, 2015 | $ | 190,589 | $ | (48,775 | ) | $ | 141,814 | ||||
Other comprehensive income (loss) before reclassification | (29,933 | ) | (2,520 | ) | (32,453 | ) | |||||
Amounts reclassified from accumulated other comprehensive income (loss) | (45 | ) | 4,547 | 4,502 | |||||||
Net other comprehensive income (loss) during period | (29,978 | ) | 2,027 | (27,951 | ) | ||||||
Balance December 31, 2015 | $ | 160,611 | $ | (46,748 | ) | $ | 113,863 | ||||
Note 15 - Derivative Financial Instruments
The fair value of derivative positions outstanding is included in accrued interest receivable and other assets and accrued interest payable and other liabilities in the accompanying consolidated balance sheets and in the net change in each of these financial statement line items in the accompanying consolidated statements of cash flows.
Interest Rate Derivatives. We utilize interest rate swaps, caps and floors to mitigate exposure to interest rate risk and to facilitate the needs of our customers. Our objectives for utilizing these derivative instruments are described below:
We have entered into certain interest rate swap contracts that are matched to specific fixed-rate commercial loans or leases that we have entered into with our customers. These contracts have been designated as hedging instruments to hedge the risk of changes in the fair value of the underlying commercial loan/lease due to changes in interest rates. The related contracts are structured so that the notional amounts reduce over time to generally match the expected amortization of the underlying loan/lease.
We have entered into certain interest rate swap, cap and floor contracts that are not designated as hedging instruments. These derivative contracts relate to transactions in which we enter into an interest rate swap, cap and/or floor with a customer while at the same time entering into an offsetting interest rate swap, cap and/or floor with a third-party financial institution. In connection with each swap transaction, we agree to pay interest to the customer on a notional amount at a variable interest rate and receive interest from the customer on a similar notional amount at a fixed interest rate. At the same time, we agree to pay a third-party financial institution the same fixed interest rate on the same notional amount and receive the same variable interest rate on the same notional amount. The transaction allows our customer to effectively convert a variable rate loan to a fixed rate. Because we act as an intermediary for our customer, changes in the fair value of the underlying derivative contracts for the most part offset each other and do not significantly impact our results of operations.
124
The notional amounts and estimated fair values of interest rate derivative contracts outstanding at December 31, 2017 and 2016 are presented in the following table. The fair values of interest rate derivative contracts are estimated utilizing internal valuation models with observable market data inputs, or as determined by the Chicago Mercantile Exchange (“CME”) for centrally cleared derivative contracts. Beginning in 2017, CME rules legally characterize variation margin payments for centrally cleared derivatives as settlements of the derivatives' exposure rather than collateral. As a result, the variation margin payment and the related derivative instruments are considered a single unit of account for accounting and financial reporting purposes. Variation margin, as determined by the CME, is settled daily. As a result, derivative contracts that clear through the CME have an estimated fair value of zero as of December 31, 2017.
December 31, 2017 | December 31, 2016 | ||||||||||||||
Notional Amount | Estimated Fair Value | Notional Amount | Estimated Fair Value | ||||||||||||
Derivatives designated as hedges of fair value: | |||||||||||||||
Financial institution counterparties: | |||||||||||||||
Loan/lease interest rate swaps - assets | $ | 13,679 | $ | 242 | $ | 41,818 | $ | 368 | |||||||
Loan/lease interest rate swaps - liabilities | 11,147 | (593 | ) | 18,812 | (1,278 | ) | |||||||||
Non-hedging interest rate derivatives: | |||||||||||||||
Financial institution counterparties: | |||||||||||||||
Loan/lease interest rate swaps - assets | 430,449 | 1,418 | 206,745 | 2,649 | |||||||||||
Loan/lease interest rate swaps - liabilities | 541,496 | (12,820 | ) | 694,965 | (25,466 | ) | |||||||||
Loan/lease interest rate caps - assets | 114,619 | 480 | 85,966 | 575 | |||||||||||
Customer counterparties: | |||||||||||||||
Loan/lease interest rate swaps - assets | 541,496 | 17,882 | 694,965 | 25,467 | |||||||||||
Loan/lease interest rate swaps - liabilities | 430,449 | (4,861 | ) | 206,745 | (2,649 | ) | |||||||||
Loan/lease interest rate caps - liabilities | 114,619 | (480 | ) | 85,966 | (575 | ) | |||||||||
The weighted-average rates paid and received for interest rate swaps outstanding at December 31, 2017 were as follows:
Weighted-Average | |||||
Interest Rate Paid | Interest Rate Received | ||||
Interest rate swaps: | |||||
Fair value hedge loan/lease interest rate swaps | 3.09 | % | 1.47 | % | |
Non-hedging interest rate swaps - financial institution counterparties | 3.93 | 2.97 | |||
Non-hedging interest rate swaps - customer counterparties | 2.97 | 3.93 | |||
The weighted-average strike rate for outstanding interest rate caps was 3.07% at December 31, 2017.
125
Commodity Derivatives. We enter into commodity swaps and option contracts that are not designated as hedging instruments primarily to accommodate the business needs of our customers. Upon the origination of a commodity swap or option contract with a customer, we simultaneously enter into an offsetting contract with a third party financial institution to mitigate the exposure to fluctuations in commodity prices.
The notional amounts and estimated fair values of non-hedging commodity swap and option derivative positions outstanding are presented in the following table. We obtain dealer quotations and use internal valuation models with observable market data inputs to value our commodity derivative positions.
December 31, 2017 | December 31, 2016 | ||||||||||||||
Notional Units | Notional Amount | Estimated Fair Value | Notional Amount | Estimated Fair Value | |||||||||||
Financial institution counterparties: | |||||||||||||||
Oil - assets | Barrels | 253 | $ | 193 | 227 | $ | 206 | ||||||||
Oil - liabilities | Barrels | 2,731 | (13,448 | ) | 944 | (4,400 | ) | ||||||||
Natural gas - assets | MMBTUs | 5,927 | 1,399 | — | — | ||||||||||
Natural gas - liabilities | MMBTUs | 3,917 | (326 | ) | 1,299 | (1,357 | ) | ||||||||
Customer counterparties: | |||||||||||||||
Oil - assets | Barrels | 2,731 | 13,709 | 944 | 4,580 | ||||||||||
Oil - liabilities | Barrels | 253 | (187 | ) | 227 | (206 | ) | ||||||||
Natural gas - assets | MMBTUs | 3,917 | 340 | 1,299 | 1,393 | ||||||||||
Natural gas - liabilities | MMBTUs | 5,927 | (1,366 | ) | — | — | |||||||||
Foreign Currency Derivatives. We enter into foreign currency forward contracts that are not designated as hedging instruments primarily to accommodate the business needs of our customers. Upon the origination of a foreign currency denominated transaction with a customer, we simultaneously enter into an offsetting contract with a third party financial institution to negate the exposure to fluctuations in foreign currency exchange rates. We also utilize foreign currency forward contracts that are not designated as hedging instruments to mitigate the economic effect of fluctuations in foreign currency exchange rates on foreign currency holdings and certain short-term, non-U.S. dollar denominated loans. The notional amounts and fair values of open foreign currency forward contracts were as follows:
December 31, 2017 | December 31, 2016 | ||||||||||||||
Notional Currency | Notional Amount | Estimated Fair Value | Notional Amount | Estimated Fair Value | |||||||||||
Financial institution counterparties: | |||||||||||||||
Forward contracts - assets | EUR | 4,014 | $ | 77 | — | $ | — | ||||||||
Forward contracts - assets | GBP | 127 | 1 | — | — | ||||||||||
Forward contracts - liabilities | EUR | 4,846 | (37 | ) | 870 | (9 | ) | ||||||||
Forward contracts - liabilities | CAD | 25,413 | (142 | ) | 2,214 | (21 | ) | ||||||||
Forward contracts - liabilities | GBP | 1,178 | (9 | ) | 419 | (3 | ) | ||||||||
Customer counterparties: | |||||||||||||||
Forward contracts - assets | EUR | 3,867 | 58 | — | — | ||||||||||
Forward contracts - assets | CAD | 25,282 | 279 | 2,205 | 29 | ||||||||||
Forward contracts - liabilities | EUR | 4,041 | (51 | ) | — | — | |||||||||
Forward contracts - liabilities | GBP | 127 | — | — | — | ||||||||||
Gains, Losses and Derivative Cash Flows. For fair value hedges, the changes in the fair value of both the derivative hedging instrument and the hedged item are included in other non-interest income or other non-interest expense. The extent that such changes in fair value do not offset represents hedge ineffectiveness. Net cash flows from interest rate swaps on commercial loans/leases designated as hedging instruments in effective hedges of fair value are included in interest income on loans. For non-hedging derivative instruments, gains and losses due to changes in fair value and all cash flows are included in other non-interest income and other non-interest expense.
126
Amounts included in the consolidated statements of income related to interest rate derivatives designated as hedges of fair value were as follows:
2017 | 2016 | 2015 | |||||||||
Commercial loan/lease interest rate swaps: | |||||||||||
Amount of gain (loss) included in interest income on loans | $ | (726 | ) | $ | (1,362 | ) | $ | (1,796 | ) | ||
Amount of (gain) loss included in other non-interest expense | (14 | ) | (44 | ) | 11 | ||||||
As stated above, we enter into non-hedge related derivative positions primarily to accommodate the business needs of our customers. Upon the origination of a derivative contract with a customer, we simultaneously enter into an offsetting derivative contract with a third party financial institution. We recognize immediate income based upon the difference in the bid/ask spread of the underlying transactions with our customers and the third party. Because we act only as an intermediary for our customer, subsequent changes in the fair value of the underlying derivative contracts for the most part offset each other and do not significantly impact our results of operations.
Amounts included in the consolidated statements of income related to non-hedging interest rate, commodity and foreign currency derivative instruments are presented in the table below.
2017 | 2016 | 2015 | |||||||||
Non-hedging interest rate derivatives: | |||||||||||
Other non-interest income | $ | 3,123 | $ | 2,883 | $ | 2,580 | |||||
Other non-interest expense | 1 | — | (43 | ) | |||||||
Non-hedging commodity derivatives: | |||||||||||
Other non-interest income | 440 | 421 | 208 | ||||||||
Non-hedging foreign currency derivatives: | |||||||||||
Other non-interest income | 300 | 30 | 78 | ||||||||
Counterparty Credit Risk. Derivative contracts involve the risk of dealing with both bank customers and institutional derivative counterparties and their ability to meet contractual terms. Institutional counterparties must have an investment grade credit rating and be approved by our Asset/Liability Management Committee. Our credit exposure on interest rate swaps is limited to the net favorable value and interest payments of all swaps by each counterparty, while our credit exposure on commodity swaps/options and foreign currency forward contracts is limited to the net favorable value of all contracts by each counterparty. Credit exposure may be reduced by the amount of collateral pledged by the counterparty. There are no credit-risk-related contingent features associated with any of our derivative contracts. Certain derivative contracts with upstream financial institution counterparties may be terminated with respect to a party in the transaction, if such party does not have at least a minimum level rating assigned to either its senior unsecured long-term debt or its deposit obligations by certain third-party rating agencies.
Our credit exposure relating to interest rate swaps, commodity swaps/options and foreign currency forward contracts with bank customers was approximately $30.8 million at December 31, 2017. This credit exposure is partly mitigated as transactions with customers are generally secured by the collateral, if any, securing the underlying transaction being hedged. Our credit exposure, net of collateral pledged, relating to interest rate swaps, commodity swaps/options and foreign currency forward contracts with upstream financial institution counterparties was approximately $7.6 million at December 31, 2017. This amount was primarily related to excess collateral we posted to counterparties. Collateral levels for upstream financial institution counterparties are monitored and adjusted as necessary. See Note 16 – Balance Sheet Offsetting and Repurchase Agreements for additional information regarding our credit exposure with upstream financial institution counterparties.
The aggregate fair value of securities we posted as collateral related to derivative contracts totaled $10.7 million at December 31, 2017. At such date, we also had $19.6 million in cash collateral on deposit with other financial institution counterparties.
Note 16 - Balance Sheet Offsetting and Repurchase Agreements
Balance Sheet Offsetting. Certain financial instruments, including resell and repurchase agreements and derivatives, may be eligible for offset in the consolidated balance sheet and/or subject to master netting arrangements or similar agreements. Our derivative transactions with upstream financial institution counterparties are generally executed under International Swaps and Derivative Association (“ISDA”) master agreements which include “right of set-off”
127
provisions. In such cases there is generally a legally enforceable right to offset recognized amounts and there may be an intention to settle such amounts on a net basis. Nonetheless, we do not generally offset such financial instruments for financial reporting purposes.
Information about financial instruments that are eligible for offset in the consolidated balance sheet as of December 31, 2017 is presented in the following tables.
Gross Amount Recognized | Gross Amount Offset | Net Amount Recognized | |||||||||
December 31, 2017 | |||||||||||
Financial assets: | |||||||||||
Derivatives: | |||||||||||
Loan/lease interest rate swaps and caps | $ | 2,140 | $ | — | $ | 2,140 | |||||
Commodity swaps and options | 1,592 | — | 1,592 | ||||||||
Foreign currency forward contracts | 78 | — | 78 | ||||||||
Total derivatives | 3,810 | — | 3,810 | ||||||||
Resell agreements | 9,642 | — | 9,642 | ||||||||
Total | $ | 13,452 | $ | — | $ | 13,452 | |||||
Financial liabilities: | |||||||||||
Derivatives: | |||||||||||
Loan/lease interest rate swaps | $ | 13,413 | $ | — | $ | 13,413 | |||||
Commodity swaps and options | 13,774 | — | 13,774 | ||||||||
Foreign currency forward contracts | 188 | — | 188 | ||||||||
Total derivatives | 27,375 | — | 27,375 | ||||||||
Repurchase agreements | 1,117,199 | — | 1,117,199 | ||||||||
Total | $ | 1,144,574 | $ | — | $ | 1,144,574 | |||||
Gross Amounts Not Offset | |||||||||||||||
Net Amount Recognized | Financial Instruments | Collateral | Net Amount | ||||||||||||
December 31, 2017 | |||||||||||||||
Financial assets: | |||||||||||||||
Derivatives: | |||||||||||||||
Counterparty A | $ | 395 | $ | (395 | ) | $ | — | $ | — | ||||||
Counterparty B | 1,028 | (1,028 | ) | — | — | ||||||||||
Counterparty C | 55 | (55 | ) | — | — | ||||||||||
Counterparty D | — | — | — | — | |||||||||||
Other counterparties | 2,332 | (1,830 | ) | (387 | ) | 115 | |||||||||
Total derivatives | 3,810 | (3,308 | ) | (387 | ) | 115 | |||||||||
Resell agreements | 9,642 | — | (9,642 | ) | — | ||||||||||
Total | $ | 13,452 | $ | (3,308 | ) | $ | (10,029 | ) | $ | 115 | |||||
Financial liabilities: | |||||||||||||||
Derivatives: | |||||||||||||||
Counterparty A | $ | 7,397 | $ | (395 | ) | $ | (7,002 | ) | $ | — | |||||
Counterparty B | 4,466 | (1,028 | ) | (3,101 | ) | 337 | |||||||||
Counterparty C | 1,520 | (55 | ) | (1,450 | ) | 15 | |||||||||
Counterparty D | — | — | — | — | |||||||||||
Other counterparties | 13,992 | (1,830 | ) | (11,215 | ) | 947 | |||||||||
Total derivatives | 27,375 | (3,308 | ) | (22,768 | ) | 1,299 | |||||||||
Repurchase agreements | 1,117,199 | — | (1,117,199 | ) | — | ||||||||||
Total | $ | 1,144,574 | $ | (3,308 | ) | $ | (1,139,967 | ) | $ | 1,299 | |||||
128
Information about financial instruments that are eligible for offset in the consolidated balance sheet as of December 31, 2016 is presented in the following tables.
Gross Amount Recognized | Gross Amount Offset | Net Amount Recognized | |||||||||
December 31, 2016 | |||||||||||
Financial assets: | |||||||||||
Derivatives: | |||||||||||
Loan/lease interest rate swaps and caps | $ | 3,592 | $ | — | $ | 3,592 | |||||
Commodity swaps and options | 206 | — | 206 | ||||||||
Foreign currency forward contracts | — | — | — | ||||||||
Total derivatives | 3,798 | — | 3,798 | ||||||||
Resell agreements | 9,642 | — | 9,642 | ||||||||
Total | $ | 13,440 | $ | — | $ | 13,440 | |||||
Financial liabilities: | |||||||||||
Derivatives: | |||||||||||
Loan/lease interest rate swaps | $ | 26,744 | $ | — | $ | 26,744 | |||||
Commodity swaps and options | 5,757 | — | 5,757 | ||||||||
Foreign currency forward contracts | 33 | — | 33 | ||||||||
Total derivatives | 32,534 | — | 32,534 | ||||||||
Repurchase agreements | 963,317 | — | 963,317 | ||||||||
Total | $ | 995,851 | $ | — | $ | 995,851 | |||||
Gross Amounts Not Offset | |||||||||||||||
Net Amount Recognized | Financial Instruments | Collateral | Net Amount | ||||||||||||
December 31, 2016 | |||||||||||||||
Financial assets: | |||||||||||||||
Derivatives: | |||||||||||||||
Counterparty A | $ | 687 | $ | (687 | ) | $ | — | $ | — | ||||||
Counterparty B | 223 | (223 | ) | — | — | ||||||||||
Counterparty C | 158 | (158 | ) | — | — | ||||||||||
Counterparty D | 1,820 | (1,820 | ) | — | — | ||||||||||
Other counterparties | 910 | (677 | ) | (64 | ) | 169 | |||||||||
Total derivatives | 3,798 | (3,565 | ) | (64 | ) | 169 | |||||||||
Resell agreements | 9,642 | — | (9,642 | ) | — | ||||||||||
Total | $ | 13,440 | $ | (3,565 | ) | $ | (9,706 | ) | $ | 169 | |||||
Financial liabilities: | |||||||||||||||
Derivatives: | |||||||||||||||
Counterparty A | $ | 11,233 | $ | (687 | ) | $ | (10,026 | ) | $ | 520 | |||||
Counterparty B | 6,867 | (223 | ) | (6,344 | ) | 300 | |||||||||
Counterparty C | 4,578 | (158 | ) | (4,415 | ) | 5 | |||||||||
Counterparty D | 7,706 | (1,820 | ) | (5,886 | ) | — | |||||||||
Other counterparties | 2,150 | (677 | ) | (676 | ) | 797 | |||||||||
Total derivatives | 32,534 | (3,565 | ) | (27,347 | ) | 1,622 | |||||||||
Repurchase agreements | 963,317 | — | (963,317 | ) | — | ||||||||||
Total | $ | 995,851 | $ | (3,565 | ) | $ | (990,664 | ) | $ | 1,622 | |||||
129
Repurchase Agreements. We utilize securities sold under agreements to repurchase to facilitate the needs of our customers and to facilitate secured short-term funding needs. Securities sold under agreements to repurchase are stated at the amount of cash received in connection with the transaction. We monitor collateral levels on a continuous basis. We may be required to provide additional collateral based on the fair value of the underlying securities. Securities pledged as collateral under repurchase agreements are maintained with our safekeeping agents.
The remaining contractual maturity of repurchase agreements in the consolidated balance sheets as of December 31, 2017 and December 31, 2016 is presented in the following tables.
Remaining Contractual Maturity of the Agreements | |||||||||||||||||||
Overnight and Continuous | Up to 30 Days | 30-90 Days | Greater than 90 Days | Total | |||||||||||||||
December 31, 2017 | |||||||||||||||||||
Repurchase agreements: | |||||||||||||||||||
U.S. Treasury | $ | 1,036,891 | $ | — | $ | — | $ | — | $ | 1,036,891 | |||||||||
Residential mortgage-backed securities | 80,308 | — | — | — | 80,308 | ||||||||||||||
Total borrowings | $ | 1,117,199 | $ | — | $ | — | $ | — | $ | 1,117,199 | |||||||||
Gross amount of recognized liabilities for repurchase agreements | $ | 1,117,199 | |||||||||||||||||
Amounts related to agreements not included in offsetting disclosures above | $ | — | |||||||||||||||||
December 31, 2016 | |||||||||||||||||||
Repurchase agreements: | |||||||||||||||||||
U.S. Treasury | $ | 841,475 | $ | — | $ | — | $ | — | $ | 841,475 | |||||||||
Residential mortgage-backed securities | 121,842 | — | — | — | 121,842 | ||||||||||||||
Total borrowings | $ | 963,317 | $ | — | $ | — | $ | — | $ | 963,317 | |||||||||
Gross amount of recognized liabilities for repurchase agreements | $ | 963,317 | |||||||||||||||||
Amounts related to agreements not included in offsetting disclosures above | $ | — | |||||||||||||||||
Note 17 - Fair Value Measurements
The fair value of an asset or liability is the price that would be received to sell that asset or paid to transfer that liability in an orderly transaction occurring in the principal market (or most advantageous market in the absence of a principal market) for such asset or liability. In estimating fair value, we utilize valuation techniques that are consistent with the market approach, the income approach and/or the cost approach. Such valuation techniques are consistently applied. Inputs to valuation techniques include the assumptions that market participants would use in pricing an asset or liability. ASC Topic 820 establishes a fair value hierarchy for valuation inputs that gives the highest priority to quoted prices in active markets for identical assets or liabilities and the lowest priority to unobservable inputs. The fair value hierarchy is as follows:
• | Level 1 Inputs - Unadjusted quoted prices in active markets for identical assets or liabilities that the reporting entity has the ability to access at the measurement date. |
• | Level 2 Inputs - Inputs other than quoted prices included in Level 1 that are observable for the asset or liability, either directly or indirectly. These might include quoted prices for similar assets or liabilities in active markets, quoted prices for identical or similar assets or liabilities in markets that are not active, inputs other than quoted prices that are observable for the asset or liability (such as interest rates, volatilities, prepayment speeds, credit risks, etc.) or inputs that are derived principally from or corroborated by market data by correlation or other means. |
• | Level 3 Inputs - Unobservable inputs for determining the fair values of assets or liabilities that reflect an entity’s own assumptions about the assumptions that market participants would use in pricing the assets or liabilities. |
In general, fair value is based upon quoted market prices, where available. If such quoted market prices are not available, fair value is based upon internally developed models that primarily use, as inputs, observable market-based parameters. Valuation adjustments may be made to ensure that financial instruments are recorded at fair value. These
130
adjustments may include amounts to reflect counterparty credit quality and our creditworthiness, among other things, as well as unobservable parameters. Any such valuation adjustments are applied consistently over time. Our valuation methodologies may produce a fair value calculation that may not be indicative of net realizable value or reflective of future fair values. While management believes our valuation methodologies are appropriate and consistent with other market participants, the use of different methodologies or assumptions to determine the fair value of certain financial instruments could result in a different estimate of fair value at the reporting date. Furthermore, the reported fair value amounts have not been comprehensively revalued since the presentation dates, and therefore, estimates of fair value after the balance sheet date may differ significantly from the amounts presented herein. A more detailed description of the valuation methodologies used for assets and liabilities measured at fair value is set forth below. Transfers between levels of the fair value hierarchy are recognized on the actual date of the event or circumstances that caused the transfer, which generally coincides with our monthly and/or quarterly valuation process.
Financial Assets and Financial Liabilities: Financial assets and financial liabilities measured at fair value on a recurring basis include the following:
Securities Available for Sale. U.S. Treasury securities are reported at fair value utilizing Level 1 inputs. Other securities classified as available for sale are reported at fair value utilizing Level 2 inputs. For these securities, we obtain fair value measurements from an independent pricing service. The fair value measurements consider observable data that may include dealer quotes, market spreads, cash flows, the U.S. Treasury yield curve, live trading levels, trade execution data, market consensus prepayment speeds, credit information and the bond’s terms and conditions, among other things.
We review the prices supplied by the independent pricing service, as well as their underlying pricing methodologies, for reasonableness and to ensure such prices are aligned with traditional pricing matrices. In general, we do not purchase investment portfolio securities that are esoteric or that have a complicated structure. Our entire portfolio consists of traditional investments, nearly all of which are U.S. Treasury obligations, federal agency bullet or mortgage pass-through securities, or general obligation or revenue based municipal bonds. Pricing for such instruments is fairly generic and is easily obtained. From time to time, we will validate prices supplied by the independent pricing service by comparison to prices obtained from third-party sources or derived using internal models.
Trading Securities. U.S. Treasury securities and exchange-listed common stock are reported at fair value utilizing Level 1 inputs. Other securities classified as trading are reported at fair value utilizing Level 2 inputs in the same manner as described above for securities available for sale.
Derivatives. Derivatives are generally reported at fair value utilizing Level 2 inputs, except for foreign currency contracts, which are reported at fair value utilizing Level 1 inputs. We obtain dealer quotations and utilize internally developed valuation models to value commodity swaps/options. We utilize internally developed valuation models and/or third-party models with observable market data inputs to validate the valuations provided by the dealers. Though there has never been a significant discrepancy in the valuations, should such a significant discrepancy arise, we would obtain price verification from a third-party dealer. We utilize internal valuation models with observable market data inputs to estimate fair values of customer interest rate swaps, caps and floors. We also obtain dealer quotations for these derivatives for comparative purposes to assess the reasonableness of the model valuations. In cases where significant credit valuation adjustments are incorporated into the estimation of fair value, reported amounts are considered to have been derived utilizing Level 3 inputs.
For purposes of potential valuation adjustments to our derivative positions, we evaluate the credit risk of our counterparties as well as ours. Accordingly, we have considered factors such as the likelihood of our default and the default of our counterparties, our net exposures and remaining contractual life, among other things, in determining if any fair value adjustments related to credit risk are required. Counterparty exposure is evaluated by netting positions that are subject to master netting arrangements, as well as considering the amount of collateral securing the position. We review our counterparty exposure on a regular basis, and, when necessary, appropriate business actions are taken to adjust the exposure. We also utilize this approach to estimate our own credit risk on derivative liability positions. To date, we have not realized any significant losses due to a counterparty’s inability to pay any net uncollateralized position. The change in value of derivative assets and derivative liabilities attributable to credit risk was not significant during the reported periods.
131
The following tables summarize financial assets and financial liabilities measured at fair value on a recurring basis as of December 31, 2017 and 2016, segregated by the level of the valuation inputs within the fair value hierarchy utilized to measure fair value:
Level 1 Inputs | Level 2 Inputs | Level 3 Inputs | Total Fair Value | ||||||||||||
2017 | |||||||||||||||
Securities available for sale: | |||||||||||||||
U.S. Treasury | $ | 3,445,153 | $ | — | $ | — | $ | 3,445,153 | |||||||
Residential mortgage-backed securities | — | 665,086 | — | 665,086 | |||||||||||
States and political subdivisions | — | 6,336,209 | — | 6,336,209 | |||||||||||
Other | — | 42,561 | — | 42,561 | |||||||||||
Trading account securities: | |||||||||||||||
U.S. Treasury | 19,210 | — | — | 19,210 | |||||||||||
States and political subdivisions | — | 1,888 | — | 1,888 | |||||||||||
Derivative assets: | |||||||||||||||
Interest rate swaps, caps and floors | — | 20,022 | — | 20,022 | |||||||||||
Commodity swaps and options | — | 14,408 | 1,233 | 15,641 | |||||||||||
Foreign currency forward contracts | 415 | — | — | 415 | |||||||||||
Derivative liabilities: | |||||||||||||||
Interest rate swaps, caps and floors | — | 18,754 | — | 18,754 | |||||||||||
Commodity swaps and options | — | 15,327 | — | 15,327 | |||||||||||
Foreign currency forward contracts | 239 | — | — | 239 | |||||||||||
2016 | |||||||||||||||
Securities available for sale: | |||||||||||||||
U.S. Treasury | $ | 4,019,731 | $ | — | $ | — | $ | 4,019,731 | |||||||
Residential mortgage-backed securities | — | 785,167 | — | 785,167 | |||||||||||
States and political subdivisions | — | 5,355,885 | — | 5,355,885 | |||||||||||
Other | — | 42,494 | — | 42,494 | |||||||||||
Trading account securities: | |||||||||||||||
U.S. Treasury | 16,594 | — | — | 16,594 | |||||||||||
States and political subdivisions | — | 109 | — | 109 | |||||||||||
Derivative assets: | |||||||||||||||
Interest rate swaps, caps and floors | — | 29,059 | — | 29,059 | |||||||||||
Commodity swaps and options | — | 6,179 | — | 6,179 | |||||||||||
Foreign currency forward contracts | 29 | — | — | 29 | |||||||||||
Derivative liabilities: | |||||||||||||||
Interest rate swaps, caps and floors | — | 29,968 | — | 29,968 | |||||||||||
Commodity swaps and options | — | 5,963 | — | 5,963 | |||||||||||
Foreign currency forward contracts | 33 | — | — | 33 | |||||||||||
Derivative assets, measured at fair value on a recurring basis using significant unobservable (Level 3) inputs during the reported periods consist of commodity swaps sold to loan customers. The significant unobservable (Level 3) inputs used in the fair value measurement of these commodity swaps sold to loan customers primarily relate to the probability of default and loss severity in the event of default. The probability of default is determined by the underlying risk grade of the loan (see Note 3 – Loans) underlying the commodity swap in that the probability of default increases as a loan’s risk grade deteriorates, while the loss severity is estimated through an analysis of the collateral supporting both the underlying loan and commodity swap. Generally, a change in the assumption used for the probability of default is accompanied by a directionally similar change in the assumption used for the loss severity. As of December 31, 2017, 2017, the weighted-average risk grade of loans underlying commodity swaps measured at fair value using significant unobservable (Level 3) inputs was 12.0. The weighted-average loss severity in the event of default on the commodity swaps was 15.4%. A reconciliation of the beginning and ending balances of derivative assets measured at fair value on a recurring basis using significant unobservable (Level 3) inputs is not presented as such amounts were not significant during the reported periods.
132
Certain financial assets and financial liabilities are measured at fair value on a nonrecurring basis; that is, the instruments are not measured at fair value on an ongoing basis but are subject to fair value adjustments in certain circumstances (for example, when there is evidence of impairment). Financial assets measured at fair value on a non-recurring basis during the reported periods include certain impaired loans reported at the fair value of the underlying collateral if repayment is expected solely from the collateral. Collateral values are estimated using Level 2 inputs based on observable market data, typically in the case of real estate collateral, or Level 3 inputs based on customized discounting criteria, typically in the case of non-real estate collateral such as inventory, accounts receivable, equipment or other business assets. During the reported periods, all fair value measurements for impaired loans utilized Level 3 inputs.
The following table presents impaired loans that were remeasured and reported at fair value through a specific valuation allowance allocation of the allowance for loan losses based upon the fair value of the underlying collateral:
2017 | 2016 | 2015 | |||||||||
Carrying value of impaired loans before allocations | $ | 75,435 | $ | 33,626 | $ | 14,921 | |||||
Specific valuation allowance allocations | (19,533 | ) | (3,961 | ) | (2,765 | ) | |||||
Fair value | $ | 55,902 | $ | 29,665 | $ | 12,156 | |||||
Non-Financial Assets and Non-Financial Liabilities: We do not have any non-financial assets or non-financial liabilities measured at fair value on a recurring basis. Certain non-financial assets measured at fair value on a non-recurring basis include foreclosed assets (upon initial recognition or subsequent impairment), non-financial assets and non-financial liabilities measured at fair value in the second step of a goodwill impairment test, and intangible assets and other non-financial long-lived assets measured at fair value for impairment assessment. Non-financial assets measured at fair value on a non-recurring basis during the reported periods include certain foreclosed assets which, upon initial recognition, were remeasured and reported at fair value through a charge-off to the allowance for loan losses and certain foreclosed assets which, subsequent to their initial recognition, were remeasured at fair value through a write-down included in other non-interest expense. The fair value of a foreclosed asset is estimated using Level 2 inputs based on observable market data or Level 3 inputs based on customized discounting criteria. During the reported periods, all fair value measurements for foreclosed assets utilized Level 2 inputs.
The following table presents foreclosed assets that were remeasured and reported at fair value:
2017 | 2016 | 2015 | |||||||||
Foreclosed assets remeasured at initial recognition: | |||||||||||
Carrying value of foreclosed assets prior to remeasurement | $ | 279 | $ | 756 | $ | 1,102 | |||||
Charge-offs recognized in the allowance for loan losses | — | (3 | ) | (169 | ) | ||||||
Fair value | $ | 279 | $ | 753 | $ | 933 | |||||
Foreclosed assets remeasured subsequent to initial recognition: | |||||||||||
Carrying value of foreclosed assets prior to remeasurement | $ | 89 | $ | 492 | $ | 205 | |||||
Write-downs included in other non-interest expense | (16 | ) | (217 | ) | (36 | ) | |||||
Fair value | $ | 73 | $ | 275 | $ | 169 | |||||
Charge-offs recognized upon loan foreclosures are generally offset by general or specific allocations of the allowance for loan losses and generally do not, and did not during the reported periods, significantly impact our provision for loan losses. Regulatory guidelines require us to reevaluate the fair value of other real estate owned on at least an annual basis. While our policy is to comply with the regulatory guidelines, our general practice is to reevaluate the fair value of collateral supporting impaired collateral dependent loans on a quarterly basis. Thus, appraisals are generally not considered to be outdated, and we typically do not make any adjustments to the appraised values.
ASC Topic 825, “Financial Instruments,” requires disclosure of the fair value of financial assets and financial liabilities, including those financial assets and financial liabilities that are not measured and reported at fair value on a recurring basis or non-recurring basis. The estimated fair value approximates carrying value for cash and cash equivalents, accrued interest and the cash surrender value of life insurance policies. The methodologies for other financial assets and financial liabilities that are not measured and reported at fair value on a recurring basis or non-recurring basis are discussed below:
Loans. The estimated fair value approximates carrying value for variable-rate loans that reprice frequently and with no significant change in credit risk. The fair value of fixed-rate loans and variable-rate loans which reprice on an infrequent basis is estimated by discounting future cash flows using the current interest rates at which similar loans
133
with similar terms would be made to borrowers of similar credit quality. An overall valuation adjustment is made for specific credit risks as well as general portfolio credit risk.
Deposits. The estimated fair value approximates carrying value for demand deposits. The fair value of fixed-rate deposit liabilities with defined maturities is estimated by discounting future cash flows using the interest rates currently offered for deposits of similar remaining maturities. The estimated fair value of deposits does not take into account the value of our long-term relationships with depositors, commonly known as core deposit intangibles, which are separate intangible assets, and not considered financial instruments. Nonetheless, we would likely realize a core deposit premium if our deposit portfolio were sold in the principal market for such deposits.
Borrowed Funds. The estimated fair value approximates carrying value for short-term borrowings. The fair value of long-term fixed-rate borrowings is estimated using quoted market prices, if available, or by discounting future cash flows using current interest rates for similar financial instruments. The estimated fair value approximates carrying value for variable-rate junior subordinated deferrable interest debentures that reprice quarterly.
Loan Commitments, Standby and Commercial Letters of Credit. Our lending commitments have variable interest rates and “escape” clauses if the customer’s credit quality deteriorates. Therefore, the fair values of these items are not significant and are not included in the following table.
The estimated fair values of financial instruments that are reported at amortized cost in our consolidated balance sheets, segregated by the level of valuation inputs within the fair value hierarchy utilized to measure fair value, were as follows:
December 31, 2017 | December 31, 2016 | ||||||||||||||
Carrying Amount | Estimated Fair Value | Carrying Amount | Estimated Fair Value | ||||||||||||
Financial assets: | |||||||||||||||
Level 2 inputs: | |||||||||||||||
Cash and cash equivalents | $ | 5,053,047 | $ | 5,053,047 | $ | 4,141,445 | $ | 4,141,445 | |||||||
Securities held to maturity | 1,432,098 | 1,455,791 | 2,250,460 | 2,262,747 | |||||||||||
Cash surrender value of life insurance policies | 180,477 | 180,477 | 177,884 | 177,884 | |||||||||||
Accrued interest receivable | 167,508 | 167,508 | 156,714 | 156,714 | |||||||||||
Level 3 inputs: | |||||||||||||||
Loans, net | 12,990,301 | 12,981,165 | 11,822,347 | 11,903,956 | |||||||||||
Financial liabilities: | |||||||||||||||
Level 2 inputs: | |||||||||||||||
Deposits | 26,872,389 | 26,866,676 | 25,811,575 | 25,812,039 | |||||||||||
Federal funds purchased and repurchase agreements | 1,147,824 | 1,147,824 | 976,992 | 976,992 | |||||||||||
Junior subordinated deferrable interest debentures | 136,184 | 137,115 | 136,127 | 137,115 | |||||||||||
Subordinated notes payable and other borrowings | 98,552 | 105,311 | 99,990 | 100,000 | |||||||||||
Accrued interest payable | 3,358 | 3,358 | 1,204 | 1,204 | |||||||||||
Under ASC Topic 825, entities may choose to measure eligible financial instruments at fair value at specified election dates. The fair value measurement option (i) may be applied instrument by instrument, with certain exceptions, (ii) is generally irrevocable and (iii) is applied only to entire instruments and not to portions of instruments. Unrealized gains and losses on items for which the fair value measurement option has been elected must be reported in earnings at each subsequent reporting date. During the reported periods, we had no financial instruments measured at fair value under the fair value measurement option.
134
Note 18 - Operating Segments
We are managed under a matrix organizational structure whereby our two primary operating segments, Banking and Frost Wealth Advisors, overlap a regional reporting structure. The regions are primarily based upon geographic location and include Austin, Corpus Christi, Dallas, Fort Worth, Houston, Permian Basin, Rio Grande Valley, San Antonio and Statewide. We are primarily managed based on the line of business structure. In that regard, all regions have the same lines of business, which have the same product and service offerings, have similar types and classes of customers and utilize similar service delivery methods. Pricing guidelines for products and services are the same across all regions. The regional reporting structure is primarily a means to scale the lines of business to provide a local, community focus for customer relations and business development.
Banking and Frost Wealth Advisors are delineated by the products and services that each segment offers. The Banking operating segment includes both commercial and consumer banking services, Frost Insurance Agency and, prior to June 30, 2015, Frost Securities. Commercial banking services are provided to corporations and other business clients and include a wide array of lending and cash management products. Consumer banking services include direct lending and depository services. Frost Insurance Agency provides insurance brokerage services to individuals and businesses covering corporate and personal property and casualty products, as well as group health and life insurance products. Frost Securities, Inc. provided advisory and private equity services to middle market companies. The operations of Frost Securities were discontinued and the entity was closed effective June 30, 2015. The Frost Wealth Advisors operating segment includes fee-based services within private trust, retirement services, and financial management services, including personal wealth management and securities brokerage services. A third operating segment, Non-Banks, is for the most part the parent holding company, as well as certain other insignificant non-bank subsidiaries of the parent that, for the most part, have little or no activity. The parent company’s principal activities include the direct and indirect ownership of our banking and non-banking subsidiaries and the issuance of debt and equity. Our principal source of revenue is dividends from our subsidiaries.
The accounting policies of each reportable segment are the same as those of our consolidated entity except for the following items, which impact the Banking and Frost Wealth Advisors segments: (i) expenses for consolidated back-office operations and general overhead-type expenses such as executive administration, accounting and internal audit are allocated to operating segments based on estimated uses of those services, (ii) income tax expense for the individual segments is calculated essentially at the statutory rate, and (iii) the parent company records the tax expense or benefit necessary to reconcile to the consolidated total.
We use a match-funded transfer pricing process to assess operating segment performance. The process helps us to (i) identify the cost or opportunity value of funds within each business segment, (ii) measure the profitability of a particular business segment by relating appropriate costs to revenues, (iii) evaluate each business segment in a manner consistent with its economic impact on consolidated earnings, and (iv) enhance asset and liability pricing decisions.
Financial results by operating segment are detailed below. Certain prior period amounts have been reclassified to conform to the current presentation. Frost Wealth Advisors excludes off balance sheet managed and custody assets with a total fair value of $32.8 billion, $29.3 billion and $30.7 billion at December 31, 2017, 2016 and 2015.
Banking | Frost Wealth Advisors | Non-Banks | Consolidated | ||||||||||||
2017 | |||||||||||||||
Net interest income (expense) | $ | 856,593 | $ | 17,644 | $ | (7,815 | ) | $ | 866,422 | ||||||
Provision for loan losses | 35,460 | — | — | 35,460 | |||||||||||
Non-interest income | 207,810 | 128,819 | (159 | ) | 336,470 | ||||||||||
Non-interest expense | 644,072 | 108,931 | 6,066 | 759,069 | |||||||||||
Income (loss) before income taxes | 384,871 | 37,532 | (14,040 | ) | 408,363 | ||||||||||
Income tax expense (benefit) | 37,837 | 13,137 | (6,760 | ) | 44,214 | ||||||||||
Net income (loss) | 347,034 | 24,395 | (7,280 | ) | 364,149 | ||||||||||
Preferred stock dividends | — | — | 8,063 | 8,063 | |||||||||||
Net income (loss) available to common shareholders | $ | 347,034 | $ | 24,395 | $ | (15,343 | ) | $ | 356,086 | ||||||
Revenues from (expenses to) external customers | $ | 1,064,403 | $ | 146,463 | $ | (7,974 | ) | $ | 1,202,892 | ||||||
Average assets (in millions) | $ | 30,391 | $ | 43 | $ | 16 | $ | 30,450 | |||||||
135
Banking | Frost Wealth Advisors | Non-Banks | Consolidated | ||||||||||||
2016 | |||||||||||||||
Net interest income (expense) | $ | 769,625 | $ | 11,335 | $ | (4,624 | ) | $ | 776,336 | ||||||
Provision for loan losses | 51,672 | 1 | — | 51,673 | |||||||||||
Non-interest income | 229,791 | 120,102 | (185 | ) | 349,708 | ||||||||||
Non-interest expense | 624,396 | 102,062 | 6,502 | 732,960 | |||||||||||
Income (loss) before income taxes | 323,348 | 29,374 | (11,311 | ) | 341,411 | ||||||||||
Income tax expense (benefit) | 33,683 | 10,281 | (6,814 | ) | 37,150 | ||||||||||
Net income (loss) | 289,665 | 19,093 | (4,497 | ) | 304,261 | ||||||||||
Preferred stock dividends | — | — | 8,063 | 8,063 | |||||||||||
Net income (loss) available to common shareholders | $ | 289,665 | $ | 19,093 | $ | (12,560 | ) | $ | 296,198 | ||||||
Revenues from (expenses to) external customers | $ | 999,416 | $ | 131,437 | $ | (4,809 | ) | $ | 1,126,044 | ||||||
Average assets (in millions) | $ | 28,795 | $ | 34 | $ | 3 | $ | 28,832 | |||||||
2015 | |||||||||||||||
Net interest income (expense) | $ | 732,671 | $ | 7,634 | $ | (3,673 | ) | $ | 736,632 | ||||||
Provision for loan losses | 51,848 | (3 | ) | — | 51,845 | ||||||||||
Non-interest income | 205,606 | 121,489 | 1,635 | 328,730 | |||||||||||
Non-interest expense | 589,394 | 98,405 | 5,919 | 693,718 | |||||||||||
Income (loss) before income taxes | 297,035 | 30,721 | (7,957 | ) | 319,799 | ||||||||||
Income tax expense (benefit) | 34,997 | 10,753 | (5,279 | ) | 40,471 | ||||||||||
Net income (loss) | 262,038 | 19,968 | (2,678 | ) | 279,328 | ||||||||||
Preferred stock dividends | — | — | 8,063 | 8,063 | |||||||||||
Net income (loss) available to common shareholders | $ | 262,038 | $ | 19,968 | $ | (10,741 | ) | $ | 271,265 | ||||||
Revenues from (expenses to) external customers | $ | 938,277 | $ | 129,123 | $ | (2,038 | ) | $ | 1,065,362 | ||||||
Average assets (in millions) | $ | 28,023 | $ | 36 | $ | 2 | $ | 28,061 | |||||||
Note 19 - Condensed Financial Statements of Parent Company
Condensed financial statements pertaining only to Cullen/Frost Bankers, Inc. are presented below. Investments in subsidiaries are stated using the equity method of accounting.
Condensed Balance Sheets
December 31, | |||||||
2017 | 2016 | ||||||
Assets: | |||||||
Cash | $ | 9,301 | $ | 9,854 | |||
Resell agreements | 256,000 | 279,270 | |||||
Total cash and cash equivalents | 265,301 | 289,124 | |||||
Investment in subsidiaries | 3,274,921 | 2,949,346 | |||||
Accrued interest receivable and other assets | 3,006 | 5,799 | |||||
Total assets | $ | 3,543,228 | $ | 3,244,269 | |||
Liabilities: | |||||||
Junior subordinated deferrable interest debentures, net of unamortized issuance costs | $ | 136,184 | $ | 136,127 | |||
Subordinated notes, net of unamortized issuance costs | 98,552 | 99,990 | |||||
Accrued interest payable and other liabilities | 10,629 | 5,624 | |||||
Total liabilities | 245,365 | 241,741 | |||||
Shareholders’ Equity | 3,297,863 | 3,002,528 | |||||
Total liabilities and shareholders’ equity | $ | 3,543,228 | $ | 3,244,269 | |||
136
Condensed Statements of Income
Year Ended December 31, | |||||||||||
2017 | 2016 | 2015 | |||||||||
Income: | |||||||||||
Dividend income paid by Frost Bank | $ | 149,671 | $ | 141,377 | $ | 126,375 | |||||
Dividend income paid by non-banks | 915 | 895 | 1,830 | ||||||||
Interest and other income | 421 | 33 | 82 | ||||||||
Total income | 151,007 | 142,305 | 128,287 | ||||||||
Expenses: | |||||||||||
Interest expense | 7,815 | 4,624 | 3,673 | ||||||||
Salaries and employee benefits | 1,202 | 1,828 | 1,376 | ||||||||
Other | 6,373 | 5,933 | 5,727 | ||||||||
Total expenses | 15,390 | 12,385 | 10,776 | ||||||||
Income before income taxes and equity in undistributed earnings of subsidiaries | 135,617 | 129,920 | 117,511 | ||||||||
Income tax benefit | 7,092 | 7,015 | 6,062 | ||||||||
Equity in undistributed earnings of subsidiaries | 221,440 | 167,326 | 155,755 | ||||||||
Net income | 364,149 | 304,261 | 279,328 | ||||||||
Preferred stock dividends | 8,063 | 8,063 | 8,063 | ||||||||
Net income available to common shareholders | $ | 356,086 | $ | 296,198 | $ | 271,265 | |||||
Condensed Statements of Cash Flows
Year Ended December 31, | |||||||||||
2017 | 2016 | 2015 | |||||||||
Operating Activities: | |||||||||||
Net income | $ | 364,149 | $ | 304,261 | $ | 279,328 | |||||
Adjustments to reconcile net income to net cash provided by operating activities: | |||||||||||
Equity in undistributed earnings of subsidiaries | (221,440 | ) | (167,326 | ) | (155,755 | ) | |||||
Stock-based compensation | 519 | 520 | 480 | ||||||||
Net tax benefit from stock-based compensation | 318 | 185 | 161 | ||||||||
Net change in other assets and other liabilities | 7,665 | (940 | ) | 2,460 | |||||||
Net cash from operating activities | 151,211 | 136,700 | 126,674 | ||||||||
Investing Activities: | |||||||||||
Redemption of investment in Frost Securities, Inc. | — | — | 216 | ||||||||
Net cash from investing activities | — | — | 216 | ||||||||
Financing Activities: | |||||||||||
Proceeds from issuance of subordinated notes | 98,434 | — | — | ||||||||
Principal payments on subordinated notes | (100,000 | ) | — | — | |||||||
Proceeds from stock option exercises | 67,746 | 78,866 | 14,853 | ||||||||
Proceeds from stock-based compensation activities of subsidiaries | 12,494 | 11,279 | 12,257 | ||||||||
Purchase of treasury stock | (101,473 | ) | (1,290 | ) | (101,237 | ) | |||||
Cash dividends paid on preferred stock | (8,063 | ) | (8,063 | ) | (8,063 | ) | |||||
Cash dividends paid on common stock | (144,172 | ) | (134,902 | ) | (132,161 | ) | |||||
Net cash from financing activities | (175,034 | ) | (54,110 | ) | (214,351 | ) | |||||
Net change in cash and cash equivalents | (23,823 | ) | 82,590 | (87,461 | ) | ||||||
Cash and cash equivalents at beginning of year | 289,124 | 206,534 | 293,995 | ||||||||
Cash and cash equivalents at end of year | $ | 265,301 | $ | 289,124 | $ | 206,534 | |||||
137
Note 20 - Accounting Standards Updates
Accounting Standards Update (ASU) 2014-09, “Revenue from Contracts with Customers (Topic 606).” ASU 2014-09 implements a common revenue standard that clarifies the principles for recognizing revenue. The core principle of ASU 2014-09 is that an entity should recognize revenue to depict the transfer of promised goods or services to customers in an amount that reflects the consideration to which the entity expects to be entitled in exchange for those goods or services. To achieve that core principle, an entity should apply the following steps: (i) identify the contract(s) with a customer, (ii) identify the performance obligations in the contract, (iii) determine the transaction price, (iv) allocate the transaction price to the performance obligations in the contract and (v) recognize revenue when (or as) the entity satisfies a performance obligation. Our revenue is comprised of net interest income on financial assets and financial liabilities, which is explicitly excluded from the scope of ASU 2014-09, and non-interest income. ASU 2014-09 will require us to change how we recognize certain recurring revenue streams within trust and investment management fees, insurance commissions and fees and other insignificant components of non-interest income; however, these changes will not have a significant impact on our financial statements. ASU 2014-09 will be effective for us on January 1, 2018 using a modified retrospective transition approach and will not have a significant impact on our financial statements.
ASU 2016-01, “Financial Instruments – Overall (Subtopic 825-10): Recognition and Measurement of Financial Assets and Financial Liabilities." ASU 2016-01, among other things, (i) requires equity investments, with certain exceptions, to be measured at fair value with changes in fair value recognized in net income, (ii) simplifies the impairment assessment of equity investments without readily determinable fair values by requiring a qualitative assessment to identify impairment, (iii) eliminates the requirement for public business entities to disclose the methods and significant assumptions used to estimate the fair value that is required to be disclosed for financial instruments measured at amortized cost on the balance sheet, (iv) requires public business entities to use the exit price notion when measuring the fair value of financial instruments for disclosure purposes, (v) requires an entity to present separately in other comprehensive income the portion of the total change in the fair value of a liability resulting from a change in the instrument-specific credit risk when the entity has elected to measure the liability at fair value in accordance with the fair value option for financial instruments, (vi) requires separate presentation of financial assets and financial liabilities by measurement category and form of financial asset on the balance sheet or the accompanying notes to the financial statements and (viii) clarifies that an entity should evaluate the need for a valuation allowance on a deferred tax asset related to available-for-sale securities. ASU 2016-01 will be effective for us on January 1, 2018 and will not have a significant impact on our financial statements.
ASU 2016-02, “Leases (Topic 842).” ASU 2016-02 will, among other things, require lessees to recognize a lease liability, which is a lessee's obligation to make lease payments arising from a lease, measured on a discounted basis; and a right-of-use asset, which is an asset that represents the lessee’s right to use, or control the use of, a specified asset for the lease term. ASU 2016-02 does not significantly change lease accounting requirements applicable to lessors; however, certain changes were made to align, where necessary, lessor accounting with the lessee accounting model and ASC Topic 606, “Revenue from Contracts with Customers.” ASU 2016-02 will be effective for us on January 1, 2019 and will require transition using a modified retrospective approach for leases existing at, or entered into after, the beginning of the earliest comparative period presented in the financial statements. Notwithstanding the foregoing, in January 2018, the Financial Accounting Standards Board issued a proposal to provide an additional transition method that would allow entities to not apply the guidance in ASU 2016-02 in the comparative periods presented in the financial statements and instead recognized a cumulative-effect adjustment to the opening balance of retained earnings in the period of adoption. We are currently evaluating the potential impact of ASU 2016-02 on our financial statements. In that regard, we have selected, and will soon implement, a third-party vendor solution to assist us in the application of ASU 2016-02.
ASU 2016-05,“Derivatives and Hedging (Topic 815) Effect of Derivative Contract Novations on Existing Hedge Accounting Relationships.” ASU 2016-05 clarifies that a change in the counterparty to a derivative instrument that has been designated as the hedging instrument under ASC Topic 815 does not, in and of itself, require dedesignation of that hedging relationship provided that all other hedge accounting criteria continue to be met. ASU 2016-05 became effective for us on January 1, 2017 and did not have a significant impact on our financial statements.
138
ASU 2016-07, “Investments - Equity Method and Joint Ventures (Topic 323): Simplifying the Transition to the Equity Method of Accounting.” ASU 2016-07 affects all entities that have an investment that becomes qualified for the equity method of accounting as a result of an increase in the level of ownership interest or degree of influence. ASU 2016-07 simplifies the transition to the equity method of accounting by eliminating retroactive adjustment of the investment when an investment qualifies for use of the equity method, among other things. ASU 2016-07 became effective for us on January 1, 2017 and did not have a significant impact on our financial statements.
ASU 2016-09, “Compensation - Stock Compensation (Topic 718): Improvements to Employee Share-Based Payment Accounting.” Under ASU 2016-09 all excess tax benefits and tax deficiencies related to share-based payment awards should be recognized as income tax expense or benefit in the income statement during the period in which they occur. Previously, such amounts were recorded in the pool of excess tax benefits included in additional paid-in capital, if such pool was available. Because excess tax benefits are no longer recognized in additional paid-in capital, the assumed proceeds from applying the treasury stock method when computing earnings per share should exclude the amount of excess tax benefits that would have previously been recognized in additional paid-in capital. Additionally, excess tax benefits should be classified along with other income tax cash flows as an operating activity rather than a financing activity, as was previously the case. ASU 2016-09 also provided that an entity make an entity-wide accounting policy election to either estimate the number of awards that are expected to vest (current GAAP at the time) or account for forfeitures when they occur. ASU 2016-09 changed the threshold to qualify for equity classification (rather than as a liability) to permit withholding up to the maximum statutory tax rates (rather than the minimum as was previously the case) in the applicable jurisdictions. We elected to adopt the provisions of ASU 2016-09 in 2016 in advance of the required application date of January 1, 2017. See Note 1 - Summary of Significant Accounting Policies and Note 13 - Income Taxes.
ASU 2016-13, “Financial Instruments - Credit Losses (Topic 326): Measurement of Credit Losses on Financial Instruments.” ASU 2016-13 requires the measurement of all expected credit losses for financial assets held at the reporting date based on historical experience, current conditions, and reasonable and supportable forecasts and requires enhanced disclosures related to the significant estimates and judgments used in estimating credit losses, as well as the credit quality and underwriting standards of an organization’s portfolio. In addition, ASU 2016-13 amends the accounting for credit losses on available-for-sale debt securities and purchased financial assets with credit deterioration. ASU 2016-13 will be effective on January 1, 2020. We are currently evaluating the potential impact of ASU 2016-13 on our financial statements. In that regard, we have formed a cross-functional working group, under the direction of our Chief Financial Officer and our Chief Risk Officer. The working group is comprised of individuals from various functional areas including credit, risk management, finance and information technology, among others. We are currently developing an implementation plan to include assessment of processes, portfolio segmentation, model development, system requirements and the identification of data and resource needs, among other things. We are also currently evaluating selected third-party vendor solutions to assist us in the application of the ASU 2016-13. The adoption of ASU 2016-13 is likely to result in an increase in the allowance for loan losses as a result of changing from an “incurred loss” model, which encompasses allowances for current known and inherent losses within the portfolio, to an “expected loss” model, which encompasses allowances for losses expected to be incurred over the life of the portfolio. Furthermore, ASU 2016-13 will necessitate that we establish an allowance for expected credit losses on debt securities. While we are currently unable to reasonably estimate the impact of adopting ASU 2016-13, we expect that the impact of adoption will be significantly influenced by the composition, characteristics and quality of our loan and securities portfolios as well as the prevailing economic conditions and forecasts as of the adoption date.
ASU 2016-15, “Statement of Cash Flows (Topic 230) - Classification of Certain Cash Receipts and Cash Payments.” ASU 2016-15 provides guidance related to certain cash flow issues in order to reduce the current and potential future diversity in practice. ASU 2016-15 will be effective for us on January 1, 2018 and is not expected to have a significant impact on our financial statements.
ASU 2016-16, “Income Taxes (Topic 740) - Intra-Entity Transfers of Assets Other Than Inventory.” ASU 2016-16 provides guidance stating that an entity should recognize the income tax consequences of an intra-entity transfer of an asset other than inventory when the transfer occurs. ASU 2016-16 will be effective for us on January 1, 2018 and is not expected to have a significant impact on our financial statements.
139
ASU 2016-18, “Statement of Cash Flows (Topic 230) - Restricted Cash.” ASU 2016-18 requires that a statement of cash flows explain the change during the period in the total of cash, cash equivalents, and amounts generally described as restricted cash or restricted cash equivalents. Therefore, amounts generally described as restricted cash and restricted cash equivalents should be included with cash and cash equivalents when reconciling the beginning-of-period and end-of-period total amounts shown on the statement of cash flows. ASU 2016-18 will be effective for us on January 1, 2018 and is not expected to have a significant impact on our financial statements.
ASU 2017-01, “Business Combinations (Topic 805) - Clarifying the Definition of a Business.” ASU 2017-01 clarifies the definition and provides a more robust framework to use in determining when a set of assets and activities constitutes a business. ASU 2017-01 is intended to provide guidance when evaluating whether transactions should be accounted for as acquisitions (or disposals) of assets or businesses. ASU 2017-01 will be effective for us on January 1, 2018 and is not expected to have a significant impact on our financial statements.
ASU 2017-04, “Intangibles - Goodwill and Other (Topic 350) - Simplifying the Test for Goodwill Impairment.” ASU 2017-04 eliminates Step 2 from the goodwill impairment test which required entities to compute the implied fair value of goodwill. Under ASU 2017-04, an entity should perform its annual, or interim, goodwill impairment test by comparing the fair value of a reporting unit with its carrying amount. An entity should recognize an impairment charge for the amount by which the carrying amount exceeds the reporting unit’s fair value; however, the loss recognized should not exceed the total amount of goodwill allocated to that reporting unit. ASU 2017-04 will be effective for us on January 1, 2020, with earlier adoption permitted and is not expected to have a significant impact on our financial statements.
ASU 2017-05, “Other Income - Gains and Losses from the Derecognition of Nonfinancial Assets (Subtopic 610-20) - Clarifying the Scope of Asset Derecognition Guidance and Accounting for Partial Sales of Nonfinancial Assets.” ASU 2017-05 clarifies the scope of Subtopic 610-20 and adds guidance for partial sales of nonfinancial assets, including partial sales of real estate. Historically, U.S. GAAP contained several different accounting models to evaluate whether the transfer of certain assets qualified for sale treatment. ASU 2017-05 reduces the number of potential accounting models that might apply and clarifies which model does apply in various circumstances. ASU 2017-05 will be effective for us on January 1, 2018 and is not expected to have a significant impact on our financial statements.
ASU 2017-08,“Receivables - Nonrefundable Fees and Other Costs (Subtopic 310-20) - Premium Amortization on Purchased Callable Debt Securities.” ASU 2017-08 shortens the amortization period for certain callable debt securities held at a premium to require such premiums to be amortized to the earliest call date unless applicable guidance related to certain pools of securities is applied to consider estimated prepayments. Under prior guidance, entities were generally required to amortize premiums on individual, non-pooled callable debt securities as a yield adjustment over the contractual life of the security. ASU 2017-08 does not change the accounting for callable debt securities held at a discount. ASU 2017-08 will be effective for us on January 1, 2019, with early adoption permitted. We are currently evaluating the potential impact of ASU 2017-08 on our financial statements.
ASU 2017-09, “Compensation - Stock Compensation (Topic 718) - Scope of Modification Accounting.” ASU 2017-09 clarifies when changes to the terms or conditions of a share-based payment award must be accounted for as modifications. Under ASU 2017-09, an entity will not apply modification accounting to a share-based payment award if all of the following are the same immediately before and after the change: (i) the award's fair value, (ii) the award's vesting conditions and (iii) the award's classification as an equity or liability instrument. ASU 2017-09 will be effective for us on January 1, 2018 and is not expected to have a significant impact on our financial statements.
ASU 2017-12, “Derivatives and Hedging (Topic 815) - Targeted Improvements to Accounting for Hedging Activities.” ASU 2017-12 amends the hedge accounting recognition and presentation requirements in ASC 815 to improve the transparency and understandability of information conveyed to financial statement users about an entity’s risk management activities to better align the entity’s financial reporting for hedging relationships with those risk management activities and to reduce the complexity of and simplify the application of hedge accounting. ASU 2017-12 will be effective for us on January 1, 2019 and is not expected to have a significant impact on our financial statements.
140
[THIS PAGE INTENTIONALLY LEFT BLANK]
141
Cullen/Frost Bankers, Inc.
Consolidated Average Balance Sheets
(Dollars in thousands - tax-equivalent basis)
The following unaudited schedule is presented for additional information and analysis.
Year Ended December 31, | |||||||||||||||||||||
2017 | 2016 | ||||||||||||||||||||
Average Balance | Interest Income/ Expense | Yield/ Cost | Average Balance | Interest Income/ Expense | Yield/ Cost | ||||||||||||||||
Assets: | |||||||||||||||||||||
Interest-bearing deposits | $ | 3,579,737 | $ | 41,608 | 1.16 | % | $ | 3,062,189 | $ | 16,103 | 0.53 | % | |||||||||
Federal funds sold and resell agreements | 73,140 | 936 | 1.28 | 42,361 | 272 | 0.64 | |||||||||||||||
Securities: | |||||||||||||||||||||
Taxable | 4,892,827 | 92,979 | 1.92 | 5,251,192 | 103,025 | 2.01 | |||||||||||||||
Tax-exempt | 7,353,279 | 391,730 | 5.37 | 6,806,448 | 369,335 | 5.57 | |||||||||||||||
Total securities | 12,246,106 | 484,709 | 3.99 | 12,057,640 | 472,360 | 4.02 | |||||||||||||||
Loans, net of unearned discount | 12,460,148 | 542,703 | 4.36 | 11,554,823 | 463,299 | 4.01 | |||||||||||||||
Total earning assets and average rate earned | 28,359,131 | 1,069,956 | 3.79 | 26,717,013 | 952,034 | 3.60 | |||||||||||||||
Cash and due from banks | 505,611 | 513,441 | |||||||||||||||||||
Allowance for loan losses | (153,505 | ) | (151,901 | ) | |||||||||||||||||
Premises and equipment, net | 522,625 | 562,875 | |||||||||||||||||||
Accrued interest receivable and other assets | 1,216,345 | 1,190,665 | |||||||||||||||||||
Total assets | $ | 30,450,207 | $ | 28,832,093 | |||||||||||||||||
Liabilities: | |||||||||||||||||||||
Non-interest-bearing demand deposits: | |||||||||||||||||||||
Commercial and individual | $ | 10,155,502 | $ | 9,215,962 | |||||||||||||||||
Correspondent banks | 245,759 | 310,445 | |||||||||||||||||||
Public funds | 418,165 | 507,912 | |||||||||||||||||||
Total non-interest-bearing demand deposits | 10,819,426 | 10,034,319 | |||||||||||||||||||
Interest-bearing deposits: | |||||||||||||||||||||
Private accounts: | |||||||||||||||||||||
Savings and interest checking | 6,376,855 | 1,303 | 0.02 | 5,745,385 | 1,054 | 0.02 | |||||||||||||||
Money market deposit accounts | 7,502,494 | 12,721 | 0.17 | 7,466,252 | 4,673 | 0.06 | |||||||||||||||
Time accounts | 775,940 | 1,764 | 0.23 | 811,102 | 1,331 | 0.16 | |||||||||||||||
Public funds | 430,203 | 1,400 | 0.33 | 454,786 | 190 | 0.04 | |||||||||||||||
Total interest-bearing deposits | 15,085,492 | 17,188 | 0.11 | 14,477,525 | 7,248 | 0.05 | |||||||||||||||
Total deposits | 25,904,918 | 24,511,844 | |||||||||||||||||||
Federal funds purchased and repurchase agreements | 978,571 | 1,522 | 0.16 | 770,942 | 204 | 0.03 | |||||||||||||||
Junior subordinated deferrable interest debentures | 136,157 | 3,955 | 2.90 | 136,100 | 3,281 | 2.41 | |||||||||||||||
Subordinated notes payable and other notes | 90,037 | 3,860 | 4.29 | 99,933 | 1,343 | 1.34 | |||||||||||||||
Federal Home Loan Bank advances | — | — | — | — | — | — | |||||||||||||||
Total interest-bearing liabilities and average rate paid | 16,290,257 | 26,525 | 0.16 | 15,484,500 | 12,076 | 0.08 | |||||||||||||||
Accrued interest payable and other liabilities | 167,260 | 254,378 | |||||||||||||||||||
Total liabilities | 27,276,943 | 25,773,197 | |||||||||||||||||||
Shareholders’ equity | 3,173,264 | 3,058,896 | |||||||||||||||||||
Total liabilities and shareholders’ equity | $ | 30,450,207 | $ | 28,832,093 | |||||||||||||||||
Net interest income | $ | 1,043,431 | $ | 939,958 | |||||||||||||||||
Net interest spread | 3.63 | % | 3.52 | % | |||||||||||||||||
Net interest income to total average earning assets | 3.69 | % | 3.56 | % | |||||||||||||||||
For these computations: (i) average balances are presented on a daily average basis, (ii) information is shown on a taxable-equivalent basis assuming a 35% tax rate, (iii) average loans include loans on non-accrual status, and (iv) average securities include unrealized gains and losses on securities available for sale, while yields are based on average amortized cost.
142
Year Ended December 31, | ||||||||||||||||||||||||||||||||||||||||||
2015 | 2014 | 2013 | 2012 | |||||||||||||||||||||||||||||||||||||||
Average Balance | Interest Income/ Expense | Yield/ Cost | Average Balance | Interest Income/ Expense | Yield/ Cost | Average Balance | Interest Income/ Expense | Yield/ Cost | Average Balance | Interest Income/ Expense | Yield/ Cost | |||||||||||||||||||||||||||||||
$ | 3,047,515 | $ | 8,123 | 0.27 | % | $ | 4,189,110 | $ | 10,725 | 0.26 | % | $ | 2,849,467 | $ | 7,284 | 0.26 | % | $ | 1,589,110 | $ | 4,300 | 0.27 | % | |||||||||||||||||||
24,695 | 107 | 0.43 | 19,683 | 83 | 0.42 | 17,259 | 82 | 0.48 | 25,364 | 104 | 0.41 | |||||||||||||||||||||||||||||||
5,438,973 | 112,601 | 2.11 | 4,439,993 | 93,087 | 2.14 | 5,276,574 | 97,873 | 1.90 | 6,496,224 | 132,432 | 2.10 | |||||||||||||||||||||||||||||||
6,175,925 | 340,417 | 5.59 | 4,929,665 | 271,543 | 5.58 | 3,618,347 | 206,442 | 5.75 | 2,448,191 | 150,807 | 6.68 | |||||||||||||||||||||||||||||||
11,614,898 | 453,018 | 3.97 | 9,369,658 | 364,630 | 3.96 | 8,894,921 | 304,315 | 3.48 | 8,944,415 | 283,239 | 3.31 | |||||||||||||||||||||||||||||||
11,267,402 | 439,651 | 3.90 | 10,299,025 | 447,036 | 4.34 | 9,229,574 | 421,114 | 4.56 | 8,456,818 | 407,284 | 4.82 | |||||||||||||||||||||||||||||||
25,954,510 | 900,899 | 3.50 | 23,877,476 | 822,474 | 3.47 | 20,991,221 | 732,795 | 3.52 | 19,015,707 | 694,927 | 3.73 | |||||||||||||||||||||||||||||||
531,534 | 554,439 | 559,361 | 573,023 | |||||||||||||||||||||||||||||||||||||||
(107,799 | ) | (97,932 | ) | (96,426 | ) | (108,073 | ) | |||||||||||||||||||||||||||||||||||
513,624 | 363,790 | 310,544 | 321,137 | |||||||||||||||||||||||||||||||||||||||
1,168,757 | 1,068,528 | 985,722 | 1,023,299 | |||||||||||||||||||||||||||||||||||||||
$ | 28,060,626 | $ | 25,766,301 | $ | 22,750,422 | $ | 20,825,093 | |||||||||||||||||||||||||||||||||||
$ | 9,334,604 | $ | 8,384,376 | $ | 6,967,933 | $ | 6,300,944 | |||||||||||||||||||||||||||||||||||
353,766 | 351,803 | 323,706 | 332,136 | |||||||||||||||||||||||||||||||||||||||
491,440 | 388,851 | 366,135 | 388,847 | |||||||||||||||||||||||||||||||||||||||
10,179,810 | 9,125,030 | 7,657,774 | 7,021,927 | |||||||||||||||||||||||||||||||||||||||
4,831,927 | 996 | 0.02 | 4,211,336 | 924 | 0.02 | 3,608,273 | 1,321 | 0.04 | 3,018,116 | 1,618 | 0.05 | |||||||||||||||||||||||||||||||
7,715,890 | 6,418 | 0.08 | 7,342,967 | 7,852 | 0.11 | 6,596,764 | 10,091 | 0.15 | 5,834,822 | 12,085 | 0.21 | |||||||||||||||||||||||||||||||
874,368 | 1,473 | 0.17 | 966,420 | 2,053 | 0.21 | 970,984 | 2,468 | 0.25 | 1,025,022 | 3,783 | 0.37 | |||||||||||||||||||||||||||||||
438,763 | 137 | 0.03 | 407,006 | 193 | 0.05 | 434,299 | 579 | 0.13 | 392,213 | 613 | 0.16 | |||||||||||||||||||||||||||||||
13,860,948 | 9,024 | 0.07 | 12,927,729 | 11,022 | 0.09 | 11,610,320 | 14,459 | 0.12 | 10,270,173 | 18,099 | 0.18 | |||||||||||||||||||||||||||||||
24,040,758 | 22,052,759 | 19,268,094 | 17,292,100 | |||||||||||||||||||||||||||||||||||||||
648,851 | 167 | 0.03 | 560,841 | 134 | 0.02 | 538,656 | 121 | 0.02 | 603,934 | 140 | 0.02 | |||||||||||||||||||||||||||||||
136,042 | 2,725 | 2.00 | 130,477 | 2,488 | 1.89 | 122,524 | 6,426 | 5.19 | 122,466 | 6,806 | 5.50 | |||||||||||||||||||||||||||||||
99,814 | 948 | 0.95 | 99,693 | 893 | 0.89 | 99,573 | 939 | 0.94 | 99,454 | 1,705 | 1.71 | |||||||||||||||||||||||||||||||
— | — | — | — | — | — | 1 | — | 6.00 | 16 | 1 | 6.00 | |||||||||||||||||||||||||||||||
14,745,655 | 12,864 | 0.09 | 13,718,740 | 14,537 | 0.11 | 12,371,074 | 21,945 | 0.18 | 11,096,043 | 26,751 | 0.24 | |||||||||||||||||||||||||||||||
239,969 | 210,305 | 266,533 | 334,378 | |||||||||||||||||||||||||||||||||||||||
25,165,434 | 23,054,075 | 20,295,381 | 18,452,348 | |||||||||||||||||||||||||||||||||||||||
2,895,192 | 2,712,226 | 2,455,041 | 2,372,745 | |||||||||||||||||||||||||||||||||||||||
$ | 28,060,626 | $ | 25,766,301 | $ | 22,750,422 | $ | 20,825,093 | |||||||||||||||||||||||||||||||||||
$ | 888,035 | $ | 807,937 | $ | 710,850 | $ | 668,176 | |||||||||||||||||||||||||||||||||||
3.41 | % | 3.36 | % | 3.34 | % | 3.49 | % | |||||||||||||||||||||||||||||||||||
3.45 | % | 3.41 | % | 3.41 | % | 3.59 | % | |||||||||||||||||||||||||||||||||||
143
ITEM 9. CHANGES IN AND DISAGREEMENTS WITH ACCOUNTANTS ON ACCOUNTING AND FINANCIAL DISCLOSURE
None
ITEM 9A. CONTROLS AND PROCEDURES
As of the end of the period covered by this Annual Report on Form 10-K, an evaluation was carried out by our management, with the participation of our Chief Executive Officer and Chief Financial Officer, of the effectiveness of our disclosure controls and procedures (as defined in Rule 13a-15(e) under the Securities Exchange Act of 1934). Based upon that evaluation, the Chief Executive Officer and Chief Financial Officer concluded that the disclosure controls and procedures were effective as of the end of the period covered by this report. No changes were made to our internal control over financial reporting (as defined in Rule 13a-15(f) under the Securities Exchange Act of 1934) during the last fiscal quarter that materially affected, or are reasonably likely to materially affect, our internal control over financial reporting.
Management’s Report on Internal Control Over Financial Reporting
The management of Cullen/Frost Bankers, Inc. is responsible for establishing and maintaining adequate internal control over financial reporting. Our internal control over financial reporting is a process designed under the supervision of our Chief Executive Officer and Chief Financial Officer to provide reasonable assurance regarding the reliability of financial reporting and the preparation of our financial statements for external purposes in accordance with generally accepted accounting principles.
As of December 31, 2017, management assessed the effectiveness of our internal control over financial reporting based on the criteria for effective internal control over financial reporting established in “Internal Control - Integrated Framework,” issued by the Committee of Sponsoring Organizations (“COSO”) of the Treadway Commission (“2013 framework”). Based on the assessment, management determined that we maintained effective internal control over financial reporting as of December 31, 2017, based on those criteria.
Ernst & Young LLP, the independent registered public accounting firm that audited our consolidated financial statements included in this Annual Report on Form 10-K, has issued an attestation report on the effectiveness of our internal control over financial reporting as of December 31, 2017. The report, which expresses an unqualified opinion on the effectiveness of our internal control over financial reporting as of December 31, 2017, is included in this Item under the heading “Attestation Report of Independent Registered Public Accounting Firm.”
Attestation Report of Independent Registered Public Accounting Firm
Report of Independent Registered Public Accounting Firm
To the Shareholders and the Board of Directors of
Cullen/Frost Bankers, Incorporated
Opinion on Internal Control over Financial Reporting
We have audited Cullen/Frost Bankers, Inc.’s internal control over financial reporting as of December 31, 2017, based on criteria established in Internal Control - Integrated Framework issued by the Committee of Sponsoring Organizations of the Treadway Commission (2013 framework) (the COSO criteria). In our opinion, Cullen/Frost Bankers, Inc. (the Company) maintained, in all material respects, effective internal control over financial reporting as of December 31, 2017, based on all COSO criteria.
We have also audited, in accordance with the standards of the Public Company Accounting Oversight Board (United States)(PCAOB), the consolidated balance sheets of the Company as of December 31, 2017 and 2016, and the related consolidated statements of income, comprehensive income, changes in shareholders’ equity and cash flows for each of the three years in the period ended December 31, 2017, and the related notes of the Company and our report dated February 7, 2018 expressed an unqualified opinion thereon.
144
Basis for Opinion
The Company’s management is responsible for maintaining effective internal control over financial reporting and for its assessment of the effectiveness of internal control over financial reporting included in the accompanying Management’s Report on Internal Control Over Financial Reporting. Our responsibility is to express an opinion on the Company’s internal control over financial reporting based on our audit. We are a public accounting firm registered with the PCAOB and are required to be independent with respect to the Company in accordance with the U.S. federal securities laws and the applicable rules and regulations of the Securities and Exchange Commission and the PCAOB.
We conducted our audit in accordance with the standards of the PCAOB. Those standards require that we plan and perform the audit to obtain reasonable assurance about whether effective internal control over financial reporting was maintained in all material respects.
Our audit included obtaining an understanding of internal control over financial reporting, assessing the risk that a material weakness exists, testing and evaluating the design and operating effectiveness of internal control based on the assessed risk, and performing such other procedures as we considered necessary in the circumstances. We believe that our audit provides a reasonable basis for our opinion.
Definition and Limitations of Internal Control over Financial Reporting
A company’s internal control over financial reporting is a process designed to provide reasonable assurance regarding the reliability of financial reporting and the preparation of financial statements for external purposes in accordance with generally accepted accounting principles. A company’s internal control over financial reporting includes those policies and procedures that (1) pertain to the maintenance of records that, in reasonable detail, accurately and fairly reflect the transactions and dispositions of the assets of the company; (2) provide reasonable assurance that transactions are recorded as necessary to permit preparation of financial statements in accordance with generally accepted accounting principles, and that receipts and expenditures of the company are being made only in accordance with authorizations of management and directors of the company; and (3) provide reasonable assurance regarding prevention or timely detection of unauthorized acquisition, use, or disposition of the company’s assets that could have a material effect on the financial statements.
Because of its inherent limitations, internal control over financial reporting may not prevent or detect misstatements. Also, projections of any evaluation of effectiveness to future periods are subject to the risk that controls may become inadequate because of changes in conditions, or that the degree of compliance with the policies or procedures may deteriorate.
San Antonio, Texas
February 7, 2018
ITEM 9B. OTHER INFORMATION
None
145
PART III
ITEM 10. DIRECTORS, EXECUTIVE OFFICERS AND CORPORATE GOVERNANCE
Certain information regarding executive officers is included under the section captioned “Executive Officers of the Registrant” in Part I, Item 1, elsewhere in this Annual Report on Form 10-K. Other information required by this Item is incorporated herein by reference to our Proxy Statement (Schedule 14A) for our 2018 Annual Meeting of Shareholders to be filed with the SEC within 120 days of our fiscal year-end.
ITEM 11. EXECUTIVE COMPENSATION
The information required by this Item is incorporated herein by reference to our Proxy Statement (Schedule 14A) for our 2018 Annual Meeting of Shareholders to be filed with the SEC within 120 days of our fiscal year-end.
ITEM 12. SECURITY OWNERSHIP OF CERTAIN BENEFICIAL OWNERS AND MANAGEMENT AND RELATED STOCKHOLDER MATTERS
Certain information regarding securities authorized for issuance under our equity compensation plans is included under the section captioned “Stock-Based Compensation Plans” in Part II, Item 5, elsewhere in this Annual Report on Form 10-K. Other information required by this Item is incorporated herein by reference to our Proxy Statement (Schedule 14A) for our 2018 Annual Meeting of Shareholders to be filed with the SEC within 120 days of our fiscal year-end.
ITEM 13. CERTAIN RELATIONSHIPS AND RELATED TRANSACTIONS, AND DIRECTOR INDEPENDENCE
The information required by this Item is incorporated herein by reference to our Proxy Statement (Schedule 14A) for our 2018 Annual Meeting of Shareholders to be filed with the SEC within 120 days of our fiscal year-end.
ITEM 14. PRINCIPAL ACCOUNTING FEES AND SERVICES
The information required by this Item is incorporated herein by reference to our Proxy Statement (Schedule 14A) for our 2018 Annual Meeting of Shareholders to be filed with the SEC within 120 days of our fiscal year-end.
146
PART IV
ITEM 15. EXHIBITS, FINANCIAL STATEMENT SCHEDULES
(a) | The following documents are filed as part of this Annual Report on Form 10-K: |
1. | Consolidated Financial Statements. Reference is made to Part II, Item 8, of this Annual Report on Form 10-K. |
2. | Consolidated Financial Statement Schedules. These schedules are omitted as the required information is inapplicable or the information is presented in the consolidated financial statements or related notes. |
3. | Exhibits. The exhibits to this Annual Report on Form 10-K listed below have been included only with the copy of this report filed with the Securities and Exchange Commission. |
Incorporated by Reference | |||||||||||||
Exhibit Number | Exhibit Description | Filed Herewith | Form | File No. | Exhibit | Filing Date | |||||||
3.1 | 10-Q | 001-13221 | 3.1 | 7/26/2006 | |||||||||
3.2 | 8-K | 001-13221 | 3.2 | 1/28/2016 | |||||||||
3.3 | 8-A | 001-13221 | 3.3 | 2/15/2013 | |||||||||
4.1P* | Instruments Defining the Rights of Holders of Long-Term Debt | ||||||||||||
10.1+ | 10-K | 001-13221 | 10.1 | 3/31/1999 | |||||||||
10.2P+ | 1991 Thrift Incentive Stock Purchase Plan for Employees of Cullen/Frost Bankers, Inc. and its Affiliates | S-8 | 33-39478 | 4.4 | 3/18/1991 | ||||||||
10.3+ | 10-K | 001-13221 | 10.13 | 3/30/1995 | |||||||||
10.4+ | X | ||||||||||||
10.5+ | X | ||||||||||||
10.6+ | X | ||||||||||||
10.7+ | 10-K | 001-13221 | 10.11 | 3/28/2003 | |||||||||
10.8+ | 10-K | 001-13221 | 10.12 | 2/4/2005 | |||||||||
10.9+ | DEF 14A | 001-13221 | Annex A | 3/20/2013 | |||||||||
10.10+ | S-8 | 333-143397 | 4.4 | 5/31/2007 | |||||||||
10.11+ | DEF 14A | 001-13221 | Annex A | 3/23/2015 | |||||||||
10.12+ | 10-K | 011-13221 | 10.12 | 2/3/2017 | |||||||||
10.13 | X | ||||||||||||
10.14 | X | ||||||||||||
10.15 | X | ||||||||||||
21.1 | X | ||||||||||||
23.1 | X | ||||||||||||
24.1 | X | ||||||||||||
31.1 | X | ||||||||||||
31.2 | X | ||||||||||||
32.1++ | X | ||||||||||||
32.2++ | X | ||||||||||||
101 | Interactive Data File | X | |||||||||||
_________________________
* | We agree to furnish to the SEC, upon request, copies of any such instruments. |
+ | Management contract or compensatory plan or arrangement. |
++ | This exhibit shall not be deemed “filed” for purposes of Section 18 of the Securities Exchange Act of 1934, or otherwise subject to the liability of that section, and shall not be deemed to be incorporated by reference into any filing under the Securities Act of 1933 or the Securities Exchange Act of 1934. |
(b) | Exhibits - See exhibit index included in Item 15(a)3 of this Annual Report on Form 10-K. |
(c) | Financial Statement Schedules - See Item 15(a)2 of this Annual Report on Form 10-K. |
ITEM 16. FORM 10-K SUMMARY
None
147
SIGNATURES
Pursuant to the requirements of Section 13 or 15(d) of the Securities Exchange Act of 1934, the registrant has duly caused this report to be signed on its behalf by the undersigned, thereunto duly authorized.
Date: | February 7, 2018 | CULLEN/FROST BANKERS, INC. | |
(Registrant) | |||
By: | /s/ JERRY SALINAS | ||
Jerry Salinas Group Executive Vice President and Chief Financial Officer | |||
Pursuant to the requirements of the Securities Exchange Act of 1934, this report has been signed by the following persons on behalf of the registrant and in the capacities and on the dates indicated.
Signature | Title | Date |
/s/ PHILLIP D. GREEN* | Chairman of the Board, Director and Chief Executive Officer (Principal Executive Officer) | February 7, 2018 |
Phillip D. Green | ||
/s/ JERRY SALINAS | Group Executive Vice President and Chief Financial Officer (Principal Financial Officer and Principal Accounting Officer) | February 7, 2018 |
Jerry Salinas | ||
/s/ R. DENNY ALEXANDER* | Director | February 7, 2018 |
R. Denny Alexander | ||
/s/ CARLOS ALVAREZ* | Director | February 7, 2018 |
Carlos Alvarez | ||
/s/ CHRIS AVERY* | Director | February 7, 2018 |
Chris Avery | ||
/s/ SAM DAWSON* | Director | February 7, 2018 |
Sam Dawson | ||
/s/ CRAWFORD H. EDWARDS* | Director | February 7, 2018 |
Crawford H. Edwards | ||
/s/ RUBEN M. ESCOBEDO* | Director | February 7, 2018 |
Ruben M. Escobedo | ||
/s/ PATRICK B. FROST* | Director and President of Frost Bank | February 7, 2018 |
Patrick B. Frost | ||
/s/ DAVID J. HAEMISEGGER* | Director | February 7, 2018 |
David J. Haemisegger | ||
/s/ KAREN E. JENNINGS* | Director | February 7, 2018 |
Karen E. Jennings | ||
/s/ RICHARD M. KLEBERG, III* | Director | February 7, 2018 |
Richard M. Kleberg, III | ||
/s/ CHARLES W. MATTHEWS* | Director | February 7, 2018 |
Charles W. Matthews | ||
/s/ IDA CLEMENT STEEN* | Director | February 7, 2018 |
Ida Clement Steen | ||
/s/ GRAHAM WESTON* | Director | February 7, 2018 |
Graham Weston | ||
/s/ HORACE WILKINS, JR.* | Director | February 7, 2018 |
Horace Wilkins, Jr. | ||
*By: /s/ JERRY SALINAS | Group Executive Vice President and Chief Financial Officer (Principal Financial Officer and Principal Accounting Officer) | February 7, 2018 |
Jerry Salinas As attorney-in-fact for the persons indicated | ||
148