Exhibit 99.1

Supplemental Package
For the Quarter Ended June 30, 2015
Forest City Enterprises, Inc. and Subsidiaries
Supplemental Package
Second Quarter 2015
NYSE: FCEA, FCEB
Index
Corporate Description | |
Selected Financial Information | |
Consolidated Balance Sheets | |
Consolidated Statements of Operations | |
Net Asset Value Components | |
Supplemental Operating Information | |
Occupancy Data | |
Retail Sales Data | |
Leasing Summary | |
Comparable Net Operating Income (NOI) | |
NOI Detail | |
NOI by Product Type | |
NOI by Core Market | |
Reconciliation of NOI to Earnings (Loss) Before Income Taxes | |
Segment Operating Results | |
Reconciliation of Net Earnings (Loss) to FFO | |
Reconciliation of FFO to Operating FFO | |
Reconciliation of Net Earnings (Loss) to EBITDA | |
Operating FFO Bridges | |
Historical Trends | |
Development Pipeline | |
Supplemental Financial Information | |
Common Stock Data/Financial Covenants | |
Nonrecourse Debt Maturities Table | |
Summary of FFO by Segment | |
This supplemental package, together with other statements and information publicly disseminated by us, contains “forward-looking statements” within the meaning of Section 27A of the Securities Act of 1933, as amended, and Section 21E of the Securities Exchange Act of 1934, as amended. Such statements reflect management’s current views with respect to financial results related to future events and are based on assumptions and expectations that may not be realized and are inherently subject to risks and uncertainties, many of which cannot be predicted with accuracy and some of which might not even be anticipated. Future events and actual results, financial or otherwise, may differ, perhaps materially, from the results discussed in the forward-looking statements. Risk factors discussed in Item 1A of our Form 10-Q for the quarter ended June 30, 2015 and Item 1A of our Form 10-K for the year ended December 31, 2014 and other factors that might cause differences, some of which could be material, include, but are not limited to, the company's conversion to REIT status, its ability to qualify or to remain qualified as a REIT, realizing the anticipated benefits to shareholders if it successfully elects REIT status, the impact of complying with REIT qualification requirements, the amount and timing of any future distributions including those that it would be required to make as a REIT, the impact of issuing equity, debt or both to satisfy its E&P Distribution and other REIT conversion costs, the impact of covenants that could prevent it from satisfying REIT distribution requirements, its lack of experience operating as a REIT if it successfully converts, the impact of current lending and capital market conditions on its liquidity, its ability to finance or refinance projects or repay its debt, the impact of the slow economic recovery on its ownership, development and management of its commercial real estate portfolio, general real estate investment and development risks, using modular construction as a new construction methodology and owning a factory to produce modular units, vacancies in its properties, risks associated with developing and managing properties in partnership with others, downturns in the housing market, competition, illiquidity of real estate investments, bankruptcy or defaults of tenants, anchor store consolidations or closings, international activities, the impact of terrorist acts and other armed conflicts, risks of owning and operating an arena, risks associated with an investment in a professional sports team, the ability to sell all or a portion of its ownership interests in a professional sports team and arena, its substantial debt leverage and the ability to obtain and service debt, the impact of restrictions imposed by its credit facility and senior debt, exposure to hedging agreements, the level and volatility of interest rates, the continued availability of tax-exempt government financing, the impact of credit rating downgrades, effects of uninsured or underinsured losses, effects of a downgrade or failure of its insurance carriers, environmental liabilities, conflicts of interest, risks associated with the sale of tax credits, the ability to maintain effective internal controls, compliance with governmental regulations, increased legislative and regulatory scrutiny of the financial services industry, changes in federal, state or local tax laws, volatility in the market price of its publicly traded securities, inflation risks, litigation risks, cybersecurity risks, cyber incidents, its ability to achieve its strategic goals are based on significant assumptions, the effect on the market price of its common stock following its E&P Distribution and its conversion to REIT status, its ability to obtain the shareholder approval necessary for it to convert to REIT status, its ability to complete non-core asset sales, the impact to its deferred tax liability balance upon conversion to REIT status, and its ability to obtain requisite consents needed to complete the conversion to REIT status as well as other risks listed from time to time in the company's SEC filings, including but not limited to, the company's annual and quarterly reports. We have no obligation to revise or update any forward-looking statements, other than as imposed by law, as a result of future events or new information. Readers are cautioned not to place undue reliance on such forward-looking statements.
1
Forest City Enterprises, Inc. and Subsidiaries
Supplemental Financial and Operating Information
Corporate Description
We principally engage in the ownership, development, management and acquisition of commercial and residential real estate and land throughout the United States. We have $10.3 billion of consolidated assets in 24 states and the District of Columbia at June 30, 2015. Our core markets include Boston, Chicago, Dallas, Denver, Los Angeles, Philadelphia and the greater metropolitan areas of New York City, San Francisco and Washington D.C. We have regional offices in Boston, Dallas, Denver, Los Angeles, New York City, San Francisco, Washington, D.C. and our corporate headquarters in Cleveland, Ohio.
We operate through three strategic business units, which represent four reportable operating segments (collectively, the "Real Estate Groups"):
• | Commercial Group, our largest strategic business unit, owns, develops, acquires and operates regional malls, specialty/urban retail centers, office and life science buildings and mixed-use projects. Additionally, it operates Barclays Center, a sports and entertainment arena located in Brooklyn, New York, which is reported as a separate operating segment ("Arena"). |
• | Residential Group owns, develops, acquires and operates residential rental properties, including upscale and middle-market apartments, adaptive re-use developments and subsidized senior housing. Additionally, it owns interests in entities that develop and manage military family housing. |
• | Land Development Group acquires and sells both land and developed lots to residential, commercial and industrial customers at its Stapleton project in Denver, Colorado. |
Corporate Activities is the other reportable operating segment, which includes our equity method investment in the Brooklyn Nets (the "Nets"), a member of the National Basketball Association ("NBA").
REIT Conversion
On January 13, 2015, we announced our Board of Directors approved a plan to pursue conversion to Real Estate Investment Trust ("REIT") status. On July 10, 2015, Forest City Realty Trust, Inc., our newly formed wholly owned subsidiary, filed a registration statement on Form S-4 containing a preliminary proxy statement of the Company and a preliminary prospectus of Forest City Realty Trust, Inc. with the Securities and Exchange Commission in connection with our plan to convert to REIT status. We expect to elect REIT status for our taxable year ended December 31, 2016, subject to business conditions, the completion of related preparatory work, obtaining necessary regulatory approvals and third-party consents.
Supplemental Financial and Operating Information
We recommend this supplemental package be read in conjunction with our Form 10-Q for the three and six months ended June 30, 2015. This supplemental package contains information prepared in accordance with generally accepted accounting principles ("GAAP") under the full consolidation accounting method and information prepared under the pro-rata consolidation method, a non-GAAP measure. We present certain financial amounts under the pro-rata consolidation method because we believe this information is useful to financial statement users as this method reflects the manner in which we operate our business. We believe the non-GAAP financial and operating information presented under the pro-rata consolidation method, net operating income ("NOI"), comparable NOI, Funds From Operations ("FFO"), Operating FFO, Earnings Before Interest, Taxes, Depreciation and Amortization ("EBITDA") and Adjusted EBITDA are necessary to understand our business and operating results, along with net earnings and other GAAP measures. Our financial statement users can use these non-GAAP measures as supplementary information to evaluate our business. Our non-GAAP measures are not intended to be performance measures that should be regarded as alternatives to, or more meaningful than, our GAAP measures.
Consolidation Methods
In line with industry practice, we have a number of investments in which our economic ownership is less than 100% as a means of procuring opportunities and sharing risk. Under GAAP, the full consolidation method is used to report assets and liabilities at 100% if deemed to be under our control or if we are deemed to be the primary beneficiary of the variable interest entity ("VIE"), even if our ownership is not 100%. Under the pro-rata consolidation method, we generally present our investments proportionate to our economic share of ownership. We provide reconciliations from the full consolidation method to the pro-rata consolidation method throughout this supplemental package.
FFO
The majority of our peers in the publicly traded real estate industry are REITs and report operations using FFO as defined by the National Association of Real Estate Investment Trusts ("NAREIT"). Although we are not a REIT, we believe it is important to publish this measure to allow for easier comparison of our performance to our peers. The major difference between us and our REIT peers is that we are a taxable entity and any taxable income we generate could result in payment of federal or state income taxes. Our REIT peers typically do not pay federal or state income taxes on their qualified REIT investments, but distribute a significant portion of their taxable income to shareholders. Due to our effective tax management policies, we have not historically been a significant payer of income taxes. This has allowed us to retain our internally generated cash flows but has also resulted in large non-cash expenses for deferred taxes as required by GAAP.
2
Forest City Enterprises, Inc. and Subsidiaries
Supplemental Financial and Operating Information
FFO is defined by NAREIT as net earnings excluding the following items at our proportionate share: i) gain (loss) on full or partial disposition of rental properties, divisions and other investments (net of tax); ii) non-cash charges for real estate depreciation and amortization; iii) impairment of depreciable real estate (net of tax); and iv) cumulative or retrospective effect of change in accounting principle (net of tax).
Operating FFO
In addition to reporting FFO, we report Operating FFO as an additional measure of our operating performance. We believe it is appropriate to adjust FFO for significant items driven by transactional activity and factors relating to the financial and real estate markets, rather than factors specific to the on-going operating performance of our properties. We use Operating FFO as an indicator of continuing operating results in planning and executing our business strategy. Operating FFO should not be considered to be an alternative to net earnings computed under GAAP as an indicator of our operating performance and may not be directly comparable to similarly-titled measures reported by other companies.
We define Operating FFO as FFO adjusted to exclude: i) impairment of non-depreciable real estate; ii) write-offs of abandoned development projects and demolition costs; iii) income recognized on state and federal historic and other tax credits; iv) gains or losses from extinguishment of debt; v) change in fair market value of nondesignated hedges; vi) gains or losses on change in control of interests; vii) the adjustment to recognize rental revenues and rental expense using the straight-line method; viii) participation payments to ground lessors on refinancing of our properties; ix) other transactional items; x) the Nets pre-tax FFO; and xi) income taxes on FFO.
EBITDA
EBITDA, a non-GAAP measure, is defined as net earnings excluding the following items at our proportionate share: i) non-cash charges for depreciation and amortization; ii) interest expense; iii) amortization of mortgage procurement costs; and iv) income taxes. EBITDA may not be directly comparable to similarly-titled measures reported by other companies.
Adjusted EBITDA
We define Adjusted EBITDA as EBITDA adjusted to exclude: i) impairment of real estate; ii) gains or losses from extinguishment of debt; iii) gain (loss) on full or partial disposition of rental properties, development projects and other investments; iv) gains or losses on change in control of interests; and v) other transactional items. We believe EBITDA, Adjusted EBITDA and net debt to Adjusted EBITDA provide additional information in evaluating our credit and ability to service our debt obligations. Adjusted EBITDA may not be directly comparable to similarly-titled measures reported by other companies.
NOI
NOI, a non-GAAP measure, is defined as revenues (excluding straight-line rent adjustments) less operating expenses (including depreciation and amortization for non-real estate groups) plus interest income, equity in earnings (loss) of unconsolidated entities (excluding gain (loss) on disposition, impairment, interest expense, gain (loss) on extinguishment of debt and depreciation and amortization of unconsolidated entities). We believe NOI provides additional information about our core operations and, along with earnings, is necessary to understand our business and operating results. NOI may not be directly comparable to similarly-titled measures reported by other companies.
Comparable NOI
In addition to NOI, we use comparable NOI as a metric to evaluate the performance of our multi-family, office and retail properties. This measure provides a same-store comparison of operating results of all stabilized properties that are open and operating in all periods presented. Write-offs of abandoned development projects, non-capitalizable development costs and unallocated management and service company overhead, net of tax credit income, are not directly attributable to an operating property and are considered non-comparable NOI. In addition, certain income and expense items at the property level, such as lease termination income, real estate tax assessments or rebates and participation payments as a result of refinancing transactions and NOI impacts of changes in ownership percentages, are excluded from comparable NOI and are included in non-comparable NOI. Retained properties that are considered non-comparable are disclosed in the Segment Operating Results of this supplemental package. Other properties and activities such as Arena, subsidized senior housing, military housing, corporate activities and land sales are not evaluated on a comparable basis and the NOI from these properties and activities is considered non-comparable NOI.
Comparable NOI is an operating statistic defined as NOI from stabilized properties operated in all periods presented, net of noncontrolling interests. Comparable NOI is useful because it measures the performance of the same properties on a period-to-period basis and is used to assess operating performance and resource allocation of the operating properties within our strategic business units. While property dispositions, acquisitions or other factors impact net earnings in the short term, we believe comparable NOI presents a more consistent view of the overall performance of our operating portfolio from period to period. A reconciliation of NOI to earnings (loss) before income taxes, the most comparable financial measure calculated in accordance with GAAP, a reconciliation of NOI to earnings (loss) before income taxes for each strategic business unit and a reconciliation from NOI to comparable NOI are included in this supplemental package.
3
Forest City Enterprises, Inc. and Subsidiaries
Supplemental Financial and Operating Information
Supplemental Operating Information
The operating information contained in this document includes: occupancy data, retail sales data, leasing summaries, comparable NOI, NOI by product type and core market, reconciliation of NOI to earnings (loss) before income taxes, segment operating results discussion, reconciliation of net earnings (loss) to FFO, reconciliation of FFO to Operating FFO, reconciliation of net earnings (loss) to EBITDA, Operating FFO bridges, historical trends and our development pipeline. We believe this information gives interested parties a better understanding and more information about our operating performance. The term “comparable,” which is used throughout this document, is generally defined as including stabilized properties open and operated in both the three and six months ended June 30, 2015 and 2014. We believe occupancy data, retail sales data, leasing spreads on retail and office properties, and other rental rate information on multi-family properties represent meaningful operating statistics about us.
Corporate Headquarters
Forest City Enterprises, Inc.
Terminal Tower
50 Public Square, Suite 1100
Cleveland, Ohio 44113
Annual Report on Form 10-K
A copy of the Annual Report on Form 10-K as filed with the Securities and Exchange Commission for the year ended December 31, 2014, can be found on our website under SEC Filings or may be obtained without charge upon written request to:
Jeffrey B. Linton
Senior Vice President - Corporate Communication
JeffLinton@forestcity.net
Website
www.forestcity.net
The information contained on this website is not incorporated herein by reference and does not constitute a part of this supplemental package.
Investor Relations
Jeffrey M. Frericks
Vice President - Capital Markets
JeffreyFrericks@forestcity.net
Investor Presentations
Please note we periodically post updated investor presentations on the Investors page of our website at www.forestcity.net. It is possible the periodic updates may include information deemed to be material. Therefore, we encourage investors, the media, and other interested parties to review the Investors page of our website at www.forestcity.net for the most recent investor presentation.
Transfer Agent and Registrar
Wells Fargo
Shareowner Services
P.O. Box 64854
St. Paul, MN 55164-9440
(800) 468-9716
www.shareowneronline.com
NYSE Listings
FCEA - Class A Common Stock ($.33 1/3 par value)
FCEB - Class B Common Stock ($.33 1/3 par value)
Dividend Reinvestment and Stock Purchase Plan
We offer our shareholders the opportunity to purchase additional shares of common stock through the Forest City Enterprises, Inc. Dividend Reinvestment and Stock Purchase Plan (the “Plan”). You may obtain a copy of the Plan prospectus and an enrollment card by contacting Wells Fargo Shareowner Services at (800) 468-9716 or by visiting www.shareowneronline.com.
4
Forest City Enterprises, Inc. and Subsidiaries
Selected Financial Information
Consolidated Balance Sheet – June 30, 2015 (Unaudited)
Full Consolidation (GAAP) | Less Noncontrolling Interest | Plus Unconsolidated Investments at Pro-Rata | Pro-Rata Consolidation (Non-GAAP) | |||||||||
(in thousands) | ||||||||||||
Assets | ||||||||||||
Real Estate | ||||||||||||
Completed rental properties | ||||||||||||
Residential | $ | 2,596,651 | $ | 369,493 | $ | 993,490 | $ | 3,220,648 | ||||
Commercial | ||||||||||||
Retail centers | 1,755,718 | — | 1,664,284 | 3,420,002 | ||||||||
Office buildings | 3,732,452 | 110,169 | 92,544 | 3,714,827 | ||||||||
Arena | 942,259 | 580,746 | — | 361,513 | ||||||||
Corporate and other equipment | 10,364 | — | — | 10,364 | ||||||||
Total completed rental properties | 9,037,444 | 1,060,408 | 2,750,318 | 10,727,354 | ||||||||
Projects under construction | ||||||||||||
Residential | 320,922 | 178,353 | 74,881 | 217,450 | ||||||||
Commercial | ||||||||||||
Retail centers | — | — | — | — | ||||||||
Office buildings | 34,994 | — | 55,801 | 90,795 | ||||||||
Total projects under construction | 355,916 | 178,353 | 130,682 | 308,245 | ||||||||
Projects under development | ||||||||||||
Operating properties | 35,004 | — | 11,444 | 46,448 | ||||||||
Residential | 140,173 | 25,506 | 226,612 | 341,279 | ||||||||
Commercial | ||||||||||||
Retail centers | 39,104 | — | 3,941 | 43,045 | ||||||||
Office buildings | 88,930 | 8,834 | 3,470 | 83,566 | ||||||||
Total projects under development | 303,211 | 34,340 | 245,467 | 514,338 | ||||||||
Total projects under construction and development | 659,127 | 212,693 | 376,149 | 822,583 | ||||||||
Land inventory | 93,918 | 5,044 | 10,217 | 99,091 | ||||||||
Total Real Estate | 9,790,489 | 1,278,145 | 3,136,684 | 11,649,028 | ||||||||
Less accumulated depreciation | (1,658,183 | ) | (122,613 | ) | (623,296 | ) | (2,158,866 | ) | ||||
Real Estate, net | 8,132,306 | 1,155,532 | 2,513,388 | 9,490,162 | ||||||||
Cash and equivalents | 334,850 | 58,832 | 54,558 | 330,576 | ||||||||
Restricted cash | 244,890 | 27,190 | 118,450 | 336,150 | ||||||||
Notes and accounts receivable, net | 446,160 | 31,559 | 56,762 | 471,363 | ||||||||
Investments in and advances to unconsolidated entities | 667,485 | (125,862 | ) | (652,424 | ) | 140,923 | ||||||
Lease and mortgage procurement costs, net | 174,058 | 24,352 | 82,232 | 231,938 | ||||||||
Prepaid expenses and other deferred costs, net | 114,762 | 14,186 | 15,727 | 116,303 | ||||||||
Intangible assets, net | 213,792 | 16,007 | 15,853 | 213,638 | ||||||||
Total Assets | $ | 10,328,303 | $ | 1,201,796 | $ | 2,204,546 | $ | 11,331,053 | ||||
5
Forest City Enterprises, Inc. and Subsidiaries
Selected Financial Information
Consolidated Balance Sheet – June 30, 2015 (Unaudited)
Full Consolidation (GAAP) | Less Noncontrolling Interest | Plus Unconsolidated Investments at Pro-Rata | Pro-Rata Consolidation (Non-GAAP) | |||||||||
(in thousands) | ||||||||||||
Liabilities and Equity | ||||||||||||
Liabilities | ||||||||||||
Mortgage debt and notes payable, nonrecourse | ||||||||||||
Completed rental properties | ||||||||||||
Residential | $ | 1,424,181 | $ | 206,252 | $ | 684,948 | $ | 1,902,877 | ||||
Commercial | ||||||||||||
Retail centers | 635,892 | — | 1,246,154 | 1,882,046 | ||||||||
Office buildings | 1,771,073 | 43,884 | 64,784 | 1,791,973 | ||||||||
Arena | 459,274 | 312,794 | — | 146,480 | ||||||||
Total completed rental properties | 4,290,420 | 562,930 | 1,995,886 | 5,723,376 | ||||||||
Projects under construction | ||||||||||||
Residential | 85,382 | 20,376 | 2,241 | 67,247 | ||||||||
Commercial | ||||||||||||
Retail centers | — | — | — | — | ||||||||
Office buildings | 28,796 | — | 35,214 | 64,010 | ||||||||
Total projects under construction | 114,178 | 20,376 | 37,455 | 131,257 | ||||||||
Projects under development | ||||||||||||
Operating properties | — | — | — | — | ||||||||
Residential | 31,742 | — | 125,965 | 157,707 | ||||||||
Commercial | ||||||||||||
Retail centers | — | — | — | — | ||||||||
Office buildings | — | — | — | — | ||||||||
Total projects under development | 31,742 | — | 125,965 | 157,707 | ||||||||
Total projects under construction and development | 145,920 | 20,376 | 163,420 | 288,964 | ||||||||
Land inventory | — | — | 8,580 | 8,580 | ||||||||
Total mortgage debt and notes payable, nonrecourse | 4,436,340 | 583,306 | 2,167,886 | 6,020,920 | ||||||||
Revolving credit facility | — | — | — | — | ||||||||
Convertible senior debt | 411,194 | — | — | 411,194 | ||||||||
Construction payables | 141,716 | 54,206 | 22,827 | 110,337 | ||||||||
Operating accounts payable and accrued expenses | 717,475 | 93,106 | 149,376 | 773,745 | ||||||||
Accrued derivative liability | 87,050 | — | 7,857 | 94,907 | ||||||||
Total Accounts payable, accrued expenses and other liabilities | 946,241 | 147,312 | 180,060 | 978,989 | ||||||||
Cash distributions and losses in excess of investments in unconsolidated entities | 138,697 | (21,361 | ) | (143,400 | ) | 16,658 | ||||||
Deferred income taxes | 668,172 | — | — | 668,172 | ||||||||
Total Liabilities | 6,600,644 | 709,257 | 2,204,546 | 8,095,933 | ||||||||
Redeemable Noncontrolling Interest | 173,281 | 173,281 | — | — | ||||||||
Equity | ||||||||||||
Shareholders’ Equity | ||||||||||||
Shareholders’ equity before accumulated other comprehensive loss | 3,135,591 | — | — | 3,135,591 | ||||||||
Accumulated other comprehensive loss | (52,133 | ) | — | — | (52,133 | ) | ||||||
Total Shareholders’ Equity | 3,083,458 | — | — | 3,083,458 | ||||||||
Noncontrolling interest | 470,920 | 319,258 | — | 151,662 | ||||||||
Total Equity | 3,554,378 | 319,258 | — | 3,235,120 | ||||||||
Total Liabilities and Equity | $ | 10,328,303 | $ | 1,201,796 | $ | 2,204,546 | $ | 11,331,053 | ||||
6
Forest City Enterprises, Inc. and Subsidiaries
Selected Financial Information
Consolidated Balance Sheet – December 31, 2014 (Unaudited)
Full Consolidation (GAAP) | Less Noncontrolling Interest | Plus Unconsolidated Investments at Pro-Rata | Pro-Rata Consolidation (Non-GAAP) | |||||||||
(in thousands) | ||||||||||||
Assets | ||||||||||||
Real Estate | ||||||||||||
Completed rental properties | ||||||||||||
Residential | $ | 2,470,813 | $ | 370,855 | $ | 1,060,830 | $ | 3,160,788 | ||||
Commercial | ||||||||||||
Retail centers | 1,747,127 | — | 1,654,140 | 3,401,267 | ||||||||
Office buildings | 2,584,854 | 107,656 | 262,524 | 2,739,722 | ||||||||
Arena | 940,029 | 579,518 | — | 360,511 | ||||||||
Corporate and other equipment | 10,738 | — | — | 10,738 | ||||||||
Total completed rental properties | 7,753,561 | 1,058,029 | 2,977,494 | 9,673,026 | ||||||||
Projects under construction | ||||||||||||
Residential | 176,148 | 96,567 | 9,262 | 88,843 | ||||||||
Commercial | ||||||||||||
Retail centers | — | — | — | — | ||||||||
Office buildings | 8,940 | — | 42,923 | 51,863 | ||||||||
Total projects under construction | 185,088 | 96,567 | 52,185 | 140,706 | ||||||||
Projects under development | ||||||||||||
Operating properties | 29,187 | — | 12,589 | 41,776 | ||||||||
Residential | 139,923 | 22,769 | 214,084 | 331,238 | ||||||||
Commercial | ||||||||||||
Retail centers | 33,807 | — | 4,014 | 37,821 | ||||||||
Office buildings | 89,952 | 8,791 | 3,180 | 84,341 | ||||||||
Total projects under development | 292,869 | 31,560 | 233,867 | 495,176 | ||||||||
Total projects under construction and development | 477,957 | 128,127 | 286,052 | 635,882 | ||||||||
Land inventory | 97,469 | 5,351 | 8,537 | 100,655 | ||||||||
Total Real Estate | 8,328,987 | 1,191,507 | 3,272,083 | 10,409,563 | ||||||||
Less accumulated depreciation | (1,555,965 | ) | (106,096 | ) | (680,584 | ) | (2,130,453 | ) | ||||
Real Estate, net | 6,773,022 | 1,085,411 | 2,591,499 | 8,279,110 | ||||||||
Cash and equivalents | 326,518 | 41,062 | 79,716 | 365,172 | ||||||||
Restricted cash | 266,530 | 30,484 | 125,680 | 361,726 | ||||||||
Notes and accounts receivable, net | 419,038 | 26,052 | 59,786 | 452,772 | ||||||||
Investments in and advances to unconsolidated entities | 620,466 | (105,718 | ) | (605,009 | ) | 121,175 | ||||||
Lease and mortgage procurement costs, net | 173,104 | 24,061 | 81,617 | 230,660 | ||||||||
Prepaid expenses and other deferred costs, net | 112,484 | 12,635 | 14,702 | 114,551 | ||||||||
Intangible assets, net | 123,778 | 17,554 | 16,436 | 122,660 | ||||||||
Total Assets | $ | 8,814,940 | $ | 1,131,541 | $ | 2,364,427 | $ | 10,047,826 | ||||
7
Forest City Enterprises, Inc. and Subsidiaries
Selected Financial Information
Consolidated Balance Sheet – December 31, 2014 (Unaudited)
Full Consolidation (GAAP) | Less Noncontrolling Interest | Plus Unconsolidated Investments at Pro-Rata | Pro-Rata Consolidation (Non-GAAP) | |||||||||
(in thousands) | ||||||||||||
Liabilities and Equity | ||||||||||||
Liabilities | ||||||||||||
Mortgage debt and notes payable, nonrecourse | ||||||||||||
Completed rental properties | ||||||||||||
Residential | $ | 1,376,329 | $ | 202,112 | $ | 740,668 | $ | 1,914,885 | ||||
Commercial | ||||||||||||
Retail centers | 638,310 | — | 1,252,645 | 1,890,955 | ||||||||
Office buildings | 1,642,913 | 72,277 | 247,424 | 1,818,060 | ||||||||
Arena | 457,055 | 310,381 | — | 146,674 | ||||||||
Total completed rental properties | 4,114,607 | 584,770 | 2,240,737 | 5,770,574 | ||||||||
Projects under construction | ||||||||||||
Residential | 61,905 | 4,266 | 1,293 | 58,932 | ||||||||
Commercial | ||||||||||||
Retail centers | — | — | — | — | ||||||||
Office buildings | 29,422 | — | 23,370 | 52,792 | ||||||||
Total projects under construction | 91,327 | 4,266 | 24,663 | 111,724 | ||||||||
Projects under development | ||||||||||||
Operating properties | — | — | — | — | ||||||||
Residential | 32,267 | — | 97,467 | 129,734 | ||||||||
Commercial | ||||||||||||
Retail centers | — | — | — | — | ||||||||
Office buildings | — | — | — | — | ||||||||
Total projects under development | 32,267 | — | 97,467 | 129,734 | ||||||||
Total projects under construction and development | 123,594 | 4,266 | 122,130 | 241,458 | ||||||||
Land inventory | — | — | 8,580 | 8,580 | ||||||||
Total mortgage debt and notes payable, nonrecourse | 4,238,201 | 589,036 | 2,371,447 | 6,020,612 | ||||||||
Revolving credit facility | — | — | — | — | ||||||||
Convertible senior debt | 700,000 | — | — | 700,000 | ||||||||
Construction payables | 110,108 | 26,866 | 34,557 | 117,799 | ||||||||
Operating accounts payable and accrued expenses | 634,541 | 71,262 | 162,154 | 725,433 | ||||||||
Accrued derivative liability | 102,362 | — | 7,755 | 110,117 | ||||||||
Total Accounts payable, accrued expenses and other liabilities | 847,011 | 98,128 | 204,466 | 953,349 | ||||||||
Cash distributions and losses in excess of investments in unconsolidated entities | 211,493 | (21,775 | ) | (211,486 | ) | 21,782 | ||||||
Deferred income taxes | 482,474 | — | — | 482,474 | ||||||||
Total Liabilities | 6,479,179 | 665,389 | 2,364,427 | 8,178,217 | ||||||||
Redeemable Noncontrolling Interest | 183,038 | 183,038 | — | — | ||||||||
Equity | ||||||||||||
Shareholders’ Equity | ||||||||||||
Shareholders’ equity before accumulated other comprehensive loss | 1,776,793 | — | — | 1,776,793 | ||||||||
Accumulated other comprehensive loss | (58,846 | ) | — | — | (58,846 | ) | ||||||
Total Shareholders’ Equity | 1,717,947 | — | — | 1,717,947 | ||||||||
Noncontrolling interest | 434,776 | 283,114 | — | 151,662 | ||||||||
Total Equity | 2,152,723 | 283,114 | — | 1,869,609 | ||||||||
Total Liabilities and Equity | $ | 8,814,940 | $ | 1,131,541 | $ | 2,364,427 | $ | 10,047,826 | ||||
8
Forest City Enterprises, Inc. and Subsidiaries
Selected Financial Information
Consolidated Statement of Operations – Three Months Ended June 30, 2015 (Unaudited)
Full Consolidation (GAAP) | Less Noncontrolling Interest | Plus Unconsolidated Investments at Pro-Rata | Pro-Rata Consolidation (Non-GAAP) | |||||||||
(in thousands) | ||||||||||||
Revenues | ||||||||||||
Rental | $ | 147,980 | $ | 11,410 | $ | 62,880 | $ | 199,450 | ||||
Tenant recoveries | 32,355 | 2,117 | 17,184 | 47,422 | ||||||||
Service and management fees | 11,863 | 37 | 1,637 | 13,463 | ||||||||
Parking and other | 14,623 | 647 | 4,954 | 18,930 | ||||||||
Arena | 27,040 | 12,201 | — | 14,839 | ||||||||
Land sales | 15,391 | 1,539 | 139 | 13,991 | ||||||||
Subsidized Senior Housing | — | — | 12,223 | 12,223 | ||||||||
Military Housing | 10,507 | 1,655 | 1,412 | 10,264 | ||||||||
Total revenues | 259,759 | 29,606 | 100,429 | 330,582 | ||||||||
Expenses | ||||||||||||
Property operating and management | 95,707 | 4,883 | 24,374 | 115,198 | ||||||||
Real estate taxes | 21,910 | 1,823 | 8,129 | 28,216 | ||||||||
Ground rent | 3,047 | 79 | 3,083 | 6,051 | ||||||||
Arena operating | 17,862 | 7,901 | — | 9,961 | ||||||||
Cost of land sales | 4,216 | 394 | — | 3,822 | ||||||||
Subsidized Senior Housing operating | — | — | 7,362 | 7,362 | ||||||||
Military Housing operating | 2,126 | 918 | 633 | 1,841 | ||||||||
Corporate general and administrative | 12,201 | — | — | 12,201 | ||||||||
REIT conversion and reorganization costs | 9,771 | — | — | 9,771 | ||||||||
166,840 | 15,998 | 43,581 | 194,423 | |||||||||
Depreciation and amortization | 65,002 | 7,585 | 20,527 | 77,944 | ||||||||
Write-offs of abandoned development projects | 5,778 | — | 10,191 | 15,969 | ||||||||
Total expenses | 237,620 | 23,583 | 74,299 | 288,336 | ||||||||
Operating income | 22,139 | 6,023 | 26,130 | 42,246 | ||||||||
Interest and other income | 9,278 | 506 | 363 | 9,135 | ||||||||
Net gain on disposition of full or partial interests in rental properties | — | — | 19,284 | 19,284 | ||||||||
Net gain on change in control of interests | 487,684 | — | — | 487,684 | ||||||||
Interest expense | (47,752 | ) | (7,263 | ) | (25,182 | ) | (65,671 | ) | ||||
Amortization of mortgage procurement costs | (1,862 | ) | (45 | ) | (791 | ) | (2,608 | ) | ||||
Loss on extinguishment of debt | (3,190 | ) | — | (383 | ) | (3,573 | ) | |||||
Earnings (loss) before income taxes | 466,297 | (779 | ) | 19,421 | 486,497 | |||||||
Income tax expense | ||||||||||||
Current | 5,268 | — | — | 5,268 | ||||||||
Deferred | 176,962 | — | — | 176,962 | ||||||||
182,230 | — | — | 182,230 | |||||||||
Earnings (loss) from unconsolidated entities, gross of tax | 19,009 | 99 | (19,421 | ) | (511 | ) | ||||||
Net earnings (loss) | 303,076 | (680 | ) | — | 303,756 | |||||||
Noncontrolling interests | ||||||||||||
Loss attributable to noncontrolling interests, gross of tax | 680 | 680 | — | — | ||||||||
Net earnings attributable to Forest City Enterprises, Inc. | $ | 303,756 | $ | — | $ | — | $ | 303,756 | ||||
9
Forest City Enterprises, Inc. and Subsidiaries
Selected Financial Information
Consolidated Statement of Operations – Six Months Ended June 30, 2015 (Unaudited)
Full Consolidation (GAAP) | Less Noncontrolling Interest | Plus Unconsolidated Investments at Pro-Rata | Pro-Rata Consolidation (Non-GAAP) | |||||||||
(in thousands) | ||||||||||||
Revenues | ||||||||||||
Rental | $ | 289,086 | $ | 22,423 | $ | 127,481 | $ | 394,144 | ||||
Tenant recoveries | 63,080 | 3,761 | 35,470 | 94,789 | ||||||||
Service and management fees | 21,483 | 72 | 3,351 | 24,762 | ||||||||
Parking and other | 26,499 | 1,216 | 10,301 | 35,584 | ||||||||
Arena | 55,860 | 25,202 | — | 30,658 | ||||||||
Land sales | 24,054 | 2,403 | 1,099 | 22,750 | ||||||||
Subsidized Senior Housing | — | — | 24,102 | 24,102 | ||||||||
Military Housing | 16,779 | 1,655 | 2,781 | 17,905 | ||||||||
Total revenues | 496,841 | 56,732 | 204,585 | 644,694 | ||||||||
Expenses | ||||||||||||
Property operating and management | 188,725 | 8,854 | 50,831 | 230,702 | ||||||||
Real estate taxes | 42,698 | 3,316 | 17,047 | 56,429 | ||||||||
Ground rent | 5,675 | 167 | 6,181 | 11,689 | ||||||||
Arena operating | 37,820 | 16,868 | — | 20,952 | ||||||||
Cost of land sales | 6,527 | 611 | — | 5,916 | ||||||||
Subsidized Senior Housing operating | — | — | 15,442 | 15,442 | ||||||||
Military Housing operating | 4,351 | 923 | 1,347 | 4,775 | ||||||||
Corporate general and administrative | 25,704 | — | — | 25,704 | ||||||||
REIT conversion and reorganization costs | 15,983 | — | — | 15,983 | ||||||||
327,483 | 30,739 | 90,848 | 387,592 | |||||||||
Depreciation and amortization | 126,816 | 15,146 | 42,196 | 153,866 | ||||||||
Write-offs of abandoned development projects | 5,778 | — | 10,191 | 15,969 | ||||||||
Total expenses | 460,077 | 45,885 | 143,235 | 557,427 | ||||||||
Operating income | 36,764 | 10,847 | 61,350 | 87,267 | ||||||||
Interest and other income | 18,982 | 916 | 646 | 18,712 | ||||||||
Net gain on disposition of full or partial interests in rental properties | — | — | 19,284 | 19,284 | ||||||||
Net gain on change in control of interests | 487,684 | — | — | 487,684 | ||||||||
Interest expense | (100,328 | ) | (15,176 | ) | (51,036 | ) | (136,188 | ) | ||||
Amortization of mortgage procurement costs | (3,963 | ) | (144 | ) | (1,588 | ) | (5,407 | ) | ||||
Loss on extinguishment of debt | (38,344 | ) | — | (608 | ) | (38,952 | ) | |||||
Earnings (loss) before income taxes | 400,795 | (3,557 | ) | 28,048 | 432,400 | |||||||
Income tax expense | ||||||||||||
Current | 3,524 | — | — | 3,524 | ||||||||
Deferred | 179,521 | — | — | 179,521 | ||||||||
183,045 | — | — | 183,045 | |||||||||
Earnings from unconsolidated entities, gross of tax | 28,322 | 82 | (28,048 | ) | 192 | |||||||
Net earnings (loss) | 246,072 | (3,475 | ) | — | 249,547 | |||||||
Noncontrolling interests | ||||||||||||
Loss attributable to noncontrolling interests, gross of tax | 3,475 | 3,475 | — | — | ||||||||
Net earnings attributable to Forest City Enterprises, Inc. | $ | 249,547 | $ | — | $ | — | $ | 249,547 | ||||
10
Forest City Enterprises, Inc. and Subsidiaries
Selected Financial Information
Consolidated Statement of Operations – Three Months Ended June 30, 2014 (Unaudited)
Full Consolidation (GAAP) | Less Noncontrolling Interest | Plus Unconsolidated Investments at Pro-Rata | Plus Discontinued Operations | Pro-Rata Consolidation (Non-GAAP) | |||||||||||
(in thousands) | |||||||||||||||
Revenues | |||||||||||||||
Rental | $ | 130,562 | $ | 3,671 | $ | 69,088 | $ | 136 | $ | 196,115 | |||||
Tenant recoveries | 25,542 | 1,391 | 19,160 | (97 | ) | 43,214 | |||||||||
Service and management fees | 10,916 | 27 | 2,157 | — | 13,046 | ||||||||||
Parking and other | 12,520 | 228 | 5,440 | — | 17,732 | ||||||||||
Arena | 24,572 | 11,090 | — | — | 13,482 | ||||||||||
Land sales | 18,537 | 1,791 | 1,571 | — | 18,317 | ||||||||||
Subsidized Senior Housing | — | — | 11,635 | — | 11,635 | ||||||||||
Military Housing | 6,988 | (31 | ) | 1,433 | — | 8,452 | |||||||||
Total revenues | 229,637 | 18,167 | 110,484 | 39 | 321,993 | ||||||||||
Expenses | |||||||||||||||
Property operating and management | 89,637 | 1,546 | 25,833 | 181 | 114,105 | ||||||||||
Real estate taxes | 19,548 | 750 | 9,739 | (1,930 | ) | 26,607 | |||||||||
Ground rent | 2,174 | 87 | 2,987 | — | 5,074 | ||||||||||
Arena operating | 14,818 | 6,609 | — | — | 8,209 | ||||||||||
Cost of land sales | 7,837 | 655 | 985 | — | 8,167 | ||||||||||
Subsidized Senior Housing operating | — | — | 7,297 | — | 7,297 | ||||||||||
Military Housing operating | 1,734 | (24 | ) | 725 | — | 2,483 | |||||||||
Corporate general and administrative | 10,059 | — | — | — | 10,059 | ||||||||||
145,807 | 9,623 | 47,566 | (1,749 | ) | 182,001 | ||||||||||
Depreciation and amortization | 59,318 | 4,747 | 22,180 | — | 76,751 | ||||||||||
Write-offs of abandoned development projects and demolition costs | 933 | — | — | — | 933 | ||||||||||
Impairment of real estate | 129,829 | — | — | — | 129,829 | ||||||||||
Total expenses | 335,887 | 14,370 | 69,746 | (1,749 | ) | 389,514 | |||||||||
Operating income (loss) | (106,250 | ) | 3,797 | 40,738 | 1,788 | (67,521 | ) | ||||||||
Interest and other income | 12,375 | 566 | (372 | ) | — | 11,437 | |||||||||
Net loss on disposition of partial interest in development project | (19,590 | ) | (3,379 | ) | — | — | (16,211 | ) | |||||||
Net gain on disposition of full or partial interests in rental properties | — | — | 16,090 | 1,276 | 17,366 | ||||||||||
Interest expense | (57,153 | ) | (5,848 | ) | (27,905 | ) | (55 | ) | (79,265 | ) | |||||
Amortization of mortgage procurement costs | (1,768 | ) | (87 | ) | (788 | ) | — | (2,469 | ) | ||||||
Loss on extinguishment of debt | (714 | ) | — | (44 | ) | (431 | ) | (1,189 | ) | ||||||
Earnings (loss) before income taxes | (173,100 | ) | (4,951 | ) | 27,719 | 2,578 | (137,852 | ) | |||||||
Income tax expense (benefit) | |||||||||||||||
Current | (30,435 | ) | — | — | 1,928 | (28,507 | ) | ||||||||
Deferred | (16,512 | ) | — | — | (490 | ) | (17,002 | ) | |||||||
(46,947 | ) | — | — | 1,438 | (45,509 | ) | |||||||||
Earnings (loss) from unconsolidated entities, gross of tax | 27,168 | 98 | (27,719 | ) | — | (649 | ) | ||||||||
Earnings (loss) from continuing operations | (98,985 | ) | (4,853 | ) | — | 1,140 | (92,992 | ) | |||||||
Discontinued operations, net of tax | |||||||||||||||
Operating earnings from rental properties | 797 | — | — | (797 | ) | — | |||||||||
Gain on disposition of rental properties | 343 | — | — | (343 | ) | — | |||||||||
1,140 | — | — | (1,140 | ) | — | ||||||||||
Net loss | (97,845 | ) | (4,853 | ) | — | — | (92,992 | ) | |||||||
Noncontrolling interests | |||||||||||||||
Loss from continuing operations attributable to noncontrolling interests, gross of tax | 4,853 | 4,853 | — | — | — | ||||||||||
Net loss attributable to Forest City Enterprises, Inc. | $ | (92,992 | ) | $ | — | $ | — | $ | — | $ | (92,992 | ) | |||
11
Forest City Enterprises, Inc. and Subsidiaries
Selected Financial Information
Consolidated Statement of Operations – Six Months Ended June 30, 2014 (Unaudited)
Full Consolidation (GAAP) | Less Noncontrolling Interest | Plus Unconsolidated Investments at Pro-Rata | Plus Discontinued Operations | Pro-Rata Consolidation (Non-GAAP) | |||||||||||
(in thousands) | |||||||||||||||
Revenues | |||||||||||||||
Rental | $ | 258,483 | $ | 7,390 | $ | 140,541 | $ | 4,015 | $ | 395,649 | |||||
Tenant recoveries | 59,064 | 3,289 | 37,156 | 1,377 | 94,308 | ||||||||||
Service and management fees | 23,903 | 77 | 3,605 | — | 27,431 | ||||||||||
Parking and other | 24,668 | 491 | 11,057 | 36 | 35,270 | ||||||||||
Arena | 59,929 | 27,040 | — | — | 32,889 | ||||||||||
Land sales | 35,244 | 3,462 | 2,441 | 1,601 | 35,824 | ||||||||||
Subsidized Senior Housing | — | — | 23,296 | — | 23,296 | ||||||||||
Military Housing | 17,883 | 1,358 | 2,846 | — | 19,371 | ||||||||||
Total revenues | 479,174 | 43,107 | 220,942 | 7,029 | 664,038 | ||||||||||
Expenses | |||||||||||||||
Property operating and management | 190,728 | 3,360 | 54,458 | 2,539 | 244,365 | ||||||||||
Real estate taxes | 39,754 | 1,607 | 18,550 | (667 | ) | 56,030 | |||||||||
Ground rent | 4,054 | 175 | 7,134 | — | 11,013 | ||||||||||
Arena operating | 38,294 | 17,112 | — | — | 21,182 | ||||||||||
Cost of land sales | 14,202 | 1,258 | 990 | 1,142 | 15,076 | ||||||||||
Subsidized Senior Housing operating | — | — | 15,425 | — | 15,425 | ||||||||||
Military Housing operating | 8,258 | 1,311 | 1,523 | — | 8,470 | ||||||||||
Corporate general and administrative | 21,620 | — | — | — | 21,620 | ||||||||||
316,910 | 24,823 | 98,080 | 3,014 | 393,181 | |||||||||||
Depreciation and amortization | 114,327 | 9,362 | 42,983 | 986 | 148,934 | ||||||||||
Write-offs of abandoned development projects and demolition costs | 933 | — | — | — | 933 | ||||||||||
Impairment of real estate | 129,829 | — | — | — | 129,829 | ||||||||||
Total expenses | 561,999 | 34,185 | 141,063 | 4,000 | 672,877 | ||||||||||
Operating income (loss) | (82,825 | ) | 8,922 | 79,879 | 3,029 | (8,839 | ) | ||||||||
Interest and other income | 23,878 | 1,032 | 196 | — | 23,042 | ||||||||||
Net loss on disposition of partial interest in development project | (19,590 | ) | (3,379 | ) | — | — | (16,211 | ) | |||||||
Net gain (loss) on disposition of full or partial interests in rental properties | (467 | ) | — | 40,886 | 28,042 | 68,461 | |||||||||
Net gain on change in control of interests | 2,759 | — | — | — | 2,759 | ||||||||||
Interest expense | (119,605 | ) | (12,376 | ) | (55,905 | ) | (5,538 | ) | (168,672 | ) | |||||
Amortization of mortgage procurement costs | (3,893 | ) | (250 | ) | (1,589 | ) | (41 | ) | (5,273 | ) | |||||
Loss on extinguishment of debt | (878 | ) | — | (296 | ) | (448 | ) | (1,622 | ) | ||||||
Earnings (loss) before income taxes | (200,621 | ) | (6,051 | ) | 63,171 | 25,044 | (106,355 | ) | |||||||
Income tax expense (benefit) | |||||||||||||||
Current | 5,499 | — | — | 3,675 | 9,174 | ||||||||||
Deferred | (48,515 | ) | — | — | 8,407 | (40,108 | ) | ||||||||
(43,016 | ) | — | — | 12,082 | (30,934 | ) | |||||||||
Earnings (loss) from unconsolidated entities, gross of tax | 61,197 | 77 | (63,171 | ) | — | (2,051 | ) | ||||||||
Earnings (loss) from continuing operations | (96,408 | ) | (5,974 | ) | — | 12,962 | (77,472 | ) | |||||||
Discontinued operations, net of tax | |||||||||||||||
Operating loss from rental properties | (1,844 | ) | (8 | ) | — | 1,836 | — | ||||||||
Gain on disposition of rental properties | 14,856 | 58 | — | (14,798 | ) | — | |||||||||
13,012 | 50 | — | (12,962 | ) | — | ||||||||||
Net loss | (83,396 | ) | (5,924 | ) | — | — | (77,472 | ) | |||||||
Noncontrolling interests | |||||||||||||||
Loss from continuing operations attributable to noncontrolling interests, gross of tax | 5,974 | 5,974 | — | — | — | ||||||||||
Earnings from discontinued operations attributable to noncontrolling interests | (50 | ) | (50 | ) | — | — | — | ||||||||
5,924 | 5,924 | — | — | — | |||||||||||
Net loss attributable to Forest City Enterprises, Inc. | $ | (77,472 | ) | $ | — | $ | — | $ | — | $ | (77,472 | ) | |||
12
Forest City Enterprises, Inc. and Subsidiaries
Selected Financial Information
Net Asset Value Components – June 30, 2015
The following represents components of our business relevant to calculate Net Asset Value (“NAV”), a non-GAAP measure. There is no directly comparable GAAP financial measure to NAV. We consider NAV to be a useful supplemental measure which assists both management and investors to estimate the fair value of our Company. The calculation of NAV involves significant estimates and can be calculated using various methods. Each individual investor must determine the specific methodology, assumptions and estimates to use to arrive at an estimated NAV of the Company.
The components of NAV do not consider the potential changes in rental and fee income streams or development platform. The components include non-GAAP financial measures, such as NOI and information related to our rental properties business prepared using the pro-rata consolidation method. Although these measures are not presented in accordance with GAAP, investors can use these non-GAAP measures as supplementary information to evaluate our business. The non-GAAP measures presented are not intended to be performance measures that should be regarded as alternatives to, or more meaningful than, our GAAP measures.
Net Asset Value Components - June 30, 2015 | |||||||||||||||||||
Completed Rental Properties | |||||||||||||||||||
Q2 2015 | Net Stabilized | Stabilized | Annualized | Nonrecourse | |||||||||||||||
(Dollars in millions at pro-rata) | NOI (1) | Adjustments (2) | NOI | Stabilized NOI (3) | Debt (4) | ||||||||||||||
Commercial Real Estate | A | B | =A+B | ||||||||||||||||
Retail | |||||||||||||||||||
Regional Malls | $ | 31.6 | $ | 4.1 | $ | 35.7 | $ | 142.8 | $ | (1,361.2 | ) | ||||||||
Specialty Retail Centers | 13.3 | 0.3 | 13.6 | 54.4 | (520.8 | ) | |||||||||||||
Subtotal Retail | $ | 44.9 | $ | 4.4 | $ | 49.3 | $ | 197.2 | $ | (1,882.0 | ) | ||||||||
Office | |||||||||||||||||||
Life Science | $ | 14.1 | $ | 8.1 | $ | 22.2 | $ | 88.8 | $ | (563.5 | ) | ||||||||
New York | 36.0 | 0.3 | 36.3 | 145.2 | (1,066.1 | ) | |||||||||||||
Central Business District | 5.1 | (0.2 | ) | 4.9 | 19.6 | (57.6 | ) | ||||||||||||
Suburban/Other | 4.3 | (0.3 | ) | 4.0 | 16.0 | (104.8 | ) | ||||||||||||
Subtotal Office | $ | 59.5 | $ | 7.9 | $ | 67.4 | $ | 269.6 | $ | (1,792.0 | ) | ||||||||
Arena | $ | 4.9 | $ | 2.7 | $ | 7.6 | $ | 30.3 | $ | (146.5 | ) | ||||||||
Residential Real Estate | |||||||||||||||||||
Apartments, Core Markets | $ | 30.7 | $ | 3.0 | $ | 33.7 | $ | 134.8 | $ | (1,362.7 | ) | ||||||||
Apartments, Non-Core Markets | 10.7 | 1.8 | 12.5 | 50.0 | (380.8 | ) | |||||||||||||
Subsidized Senior Housing | 4.9 | (0.8 | ) | 4.1 | 16.4 | (130.8 | ) | ||||||||||||
Military Housing | 8.8 | (4.5 | ) | 4.3 | 17.0 | (28.6 | ) | ||||||||||||
Subtotal Rental Properties | $ | 164.4 | $ | 14.5 | $ | 178.9 | $ | 715.3 | $ | (5,723.4 | ) | ||||||||
Other | (26.6 | ) | 17.8 | (8.8 | ) | (35.0 | ) | — | |||||||||||
Total Rental Properties | $ | 137.8 | $ | 32.3 | $ | 170.1 | $ | 680.3 | $ | (5,723.4 | ) | ||||||||
Development Pipeline | Book Value (4) | ||||||||||||||||||
Projects under construction | $ | 308.2 | $ | (131.3 | ) | ||||||||||||||
Projects under development | $ | 514.3 | $ | (157.7 | ) | ||||||||||||||
Land inventory | $ | 99.1 | $ | (8.6 | ) | ||||||||||||||
Other Tangible Assets | |||||||||||||||||||
Cash and equivalents | $ | 330.6 | |||||||||||||||||
Restricted cash | $ | 336.2 | |||||||||||||||||
Notes and accounts receivable, net (5) | $ | 471.4 | |||||||||||||||||
Net investments and advances to unconsolidated entities | $ | 124.3 | |||||||||||||||||
Prepaid expenses and other deferred costs, net | $ | 116.3 | |||||||||||||||||
Recourse Debt and Other Liabilities | |||||||||||||||||||
Revolving credit facility | $ | — | |||||||||||||||||
Convertible senior debt | $ | (411.2 | ) | ||||||||||||||||
Less: convertible debt | $ | 411.2 | |||||||||||||||||
Construction payables | $ | (110.3 | ) | ||||||||||||||||
Operating accounts payable and accrued expenses (6) | $ | (773.7 | ) | ||||||||||||||||
Share Data (in millions) | |||||||||||||||||||
Diluted weighted average number of shares for the three months ended June 30, 2015 | 257.9 | ||||||||||||||||||
Shares outstanding (including diluted shares) as of June 30, 2015 | 274.8 | ||||||||||||||||||
13
Forest City Enterprises, Inc. and Subsidiaries
Selected Financial Information
Net Asset Value Components – June 30, 2015 (continued)
(1) | Q2 2015 NOI is reconciled to NOI at full consolidation by Product Group for the three months ended June 30, 2015 in the Supplemental Operating Information section of this supplemental package. |
(2) | The net stabilized adjustments column represents net adjustments assumed to arrive at an estimated annualized stabilized NOI for properties currently in initial lease-up periods, net of the removal of partial period NOI for recently sold properties. The following properties are currently in their initial lease-up periods: |
Cost at Full Consolidation (GAAP) | Cost at FCE Pro-Rata Share (Non-GAAP) | Lease Commitment % as of | |||||
Property | July 28, 2015 | ||||||
(in millions) | |||||||
Apartments: | |||||||
Radian | $ | 0.0 | $ | 65.0 | 97%; Retail: 100% | ||
The Yards - Twelve12 | $ | 119.5 | $ | 119.5 | 95%; Retail: 96% | ||
3700M | $ | 0.0 | $ | 22.7 | 84% | ||
Winchester Lofts (Non-Core Market) | $ | 62.8 | $ | 62.8 | 72% | ||
Regional Mall: | |||||||
Westchester's Ridge Hill | $ | 891.1 | $ | 891.1 | 71%/81% | ||
a) | NOI for the apartments in the above table is reflected at 5% of the pro-rata cost. This assumption does not reflect our anticipated NOI, but rather is used in order to establish a hypothetical basis for an estimated valuation of leased-up properties. |
b) | NOI for Westchester's Ridge Hill is reflected at 4% of the pro-rata cost disclosed in the above table. This assumption does not reflect our anticipated NOI, but rather is used in order to establish a hypothetical basis for an estimated valuation of this leased-up property. The lease commitment percentage above represents 71% of leases that have been signed of the total 1,336,000 square feet after construction is complete. The leased percentage excluding Parcel L is 81%. Parcel L is a self contained pad site at the southern end of the center and has been assumed to be leased in the future predominantly to a single retail tenant in its own phase. Given its location on the end of the site, the lease commitment percentage has been presented both with and without the anticipated square footage for Parcel L in the denominator of Gross Leasable Area. |
c) | Annual NOI for the Arena is expected to stabilize at approximately $55 million at full consolidation in the 2016 calendar year. Based on the partnership agreement, we expect to receive 55% of the NOI allocation until certain member loans are repaid. Therefore, we have included a stabilization adjustment to the Q2 2015 NOI to arrive at an annual stabilized NOI of $30.3 million. |
In addition, we include stabilization adjustments to the Q2 2015 NOI as follows:
d) | Due to the June 2015 acquisition of our former partner's 49% equity interest in seven life science office properties and two parking garages at University Park at MIT ("MIT Assets") (Life Science), we have included stabilization adjustments to the Q2 2015 NOI to reflect NOI at our new 100% ownership percentage. The estimated cash on cost yield of this investment is approximately 5.25%, based on forward 12-month NOI, adjusted for the stabilization of 88 Sidney Street, one of the seven office buildings, which had a temporary decline in occupancy. |
e) | Due to planned renovations at Ballston Common (Regional Mall), we have included stabilization adjustments to the Q2 2015 NOI to arrive at our estimate of stabilized NOI. |
f) | Due to quarterly fluctuations of NOI as a result of distribution restrictions from our limited-distribution subsidized senior housing properties, we have included a stabilization adjustment to the Q2 2015 NOI to arrive at our estimate of stabilized NOI. |
g) | At the conclusion of the initial development period at each of our military housing communities, we estimate the ongoing property and asset management fees, net of operating expenses, to be $17.0 million. |
h) | Other excludes write-offs of abandoned development projects of $16.0 million, tax credit income of $4.0 million and certain variable development and operating overhead. |
The net stabilized adjustments are not comparable to any GAAP measure and therefore do not have a reconciliation to the nearest comparable GAAP measure.
(3) | Pro-rata annualized stabilized NOI is calculated by taking the Q2 2015 stabilized NOI times a multiple of four. |
(4) | Amounts are derived from the respective pro-rata balance sheet line item as of June 30, 2015 and are reconciled to their GAAP equivalents in the Selected Financial Information section of this supplemental package. |
(5) | Includes $161.0 million of straight-line rent receivable (net of $8.7 million of allowance for doubtful accounts). |
(6) | Includes $61.0 million of straight-line rent payable. |
14
Forest City Enterprises, Inc. and Subsidiaries
Supplemental Operating Information
Occupancy Data
Retail and office occupancy data represents leased occupancy at the end of the quarter. Leased occupancy percentage is calculated by dividing the sum of the total tenant occupied space under the lease and vacant space under lease by gross leasable area ("GLA"). Occupancy data includes leases with original terms of one year or less.
Leased Occupancy | ||
As of June 30, | ||
Retail | 2015 | 2014 |
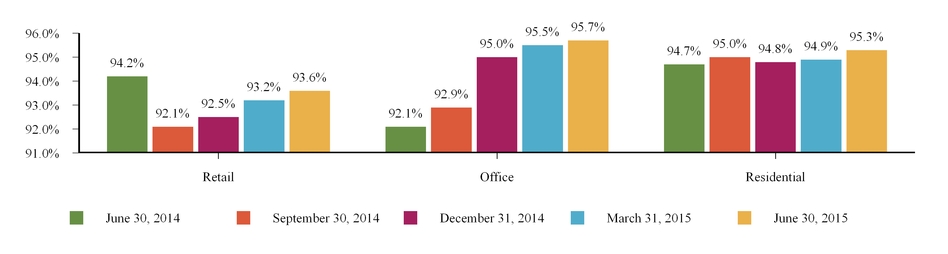
Comparable | 93.6% | 91.9% |
Total | 93.3% | 91.8% |
Office | ||
Comparable | 95.7% | 93.5% |
Total | 95.1% | 91.7% |
Residential occupancy data represents economic occupancy, which is calculated by dividing the period-to-date gross potential rent less vacancy by gross potential rent. Residential occupancy data excludes military and limited-distribution subsidized senior housing units.
Economic Occupancy | ||
Six Months Ended June 30, | ||
Residential | 2015 | 2014 |
Comparable | 95.3% | 94.5% |
Total | 93.3% | 92.2% |
The graph below provides comparable leased and economic occupancy data as reported in previous quarters. Prior period amounts may differ from above since the properties qualifying as comparable change from period to period.
Comparable Occupancy Percentage Trend
15
Forest City Enterprises, Inc. and Subsidiaries
Supplemental Operating Information
Retail Sales Data
The following provides retail sales data for small shop inline tenants at our regional malls. We believe this data allows investors to better understand the productivity of our small shop inline tenants.
The graph below represents regional mall sales for tenants that were open and operating for the duration of each rolling 12-month period presented. Those tenants that have begun and/or ceased operations in the rolling 12-month periods shown are not included.
FCE Regional Mall Sales per Square Foot (1) (2)
Rolling 12-month basis for periods presented
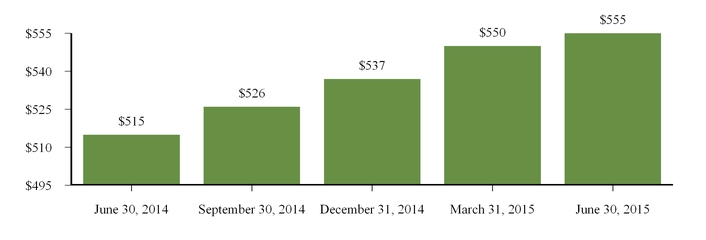
(1) | All sales data is derived from schedules provided by our tenants and is not subject to the same internal control and verification procedures applied to other data supplied in this supplemental package. |
(2) | The increase for the rolling 12-months ended September 30, 2014 over the prior period is partially due to the inclusion of sales data at Westchester’s Ridge Hill. With a comparable inclusion of Westchester’s Ridge Hill sales data, sales per square foot for the rolling 12-months ended June 30, 2014 would have been $520. |
16
Forest City Enterprises, Inc. and Subsidiaries
Supplemental Operating Information
Leasing Summary
Retail Centers
The following tables represent those new leases and GLA signed and rent per square foot ("SF") on the same space in which there was a former tenant and existing tenant renewals.
Regional Malls
Quarter | Number of Leases Signed | GLA Signed | Contractual Rent Per SF (1) | Expired Rent Per SF (1) | Cash Basis % Change over Prior Rent | ||||||||||||
Q3 2014 | 45 | 128,871 | $ | 50.33 | $ | 41.58 | 21.0 | % | |||||||||
Q4 2014 | 31 | 115,496 | $ | 59.57 | $ | 47.42 | 25.6 | % | |||||||||
Q1 2015 | 34 | 169,951 | $ | 46.51 | $ | 36.92 | 26.0 | % | |||||||||
Q2 2015 | 21 | 48,967 | $ | 63.79 | $ | 49.62 | 28.6 | % | |||||||||
Total | 131 | 463,285 | $ | 52.89 | $ | 42.23 | 25.2 | % | |||||||||
Specialty Retail Centers
Quarter | Number of Leases Signed | GLA Signed | Contractual Rent Per SF (1) | Expired Rent Per SF (1) | Cash Basis % Change over Prior Rent | ||||||||||||
Q3 2014 | 4 | 9,169 | $ | 32.40 | $ | 30.36 | 6.7 | % | |||||||||
Q4 2014 | 3 | 23,198 | $ | 52.55 | $ | 50.48 | 4.1 | % | |||||||||
Q1 2015 | 11 | 40,421 | $ | 34.55 | $ | 35.41 | (2.4 | )% | |||||||||
Q2 2015 | 7 | 42,562 | $ | 31.74 | $ | 29.95 | 6.0 | % | |||||||||
Total | 25 | 115,350 | $ | 36.96 | $ | 36.02 | 2.6 | % | |||||||||
Office Buildings
The following table represents those new leases and GLA signed on the same space in which there was a former tenant and existing tenant renewals along with all other new leases signed within the rolling 12-month period.
Same-Space Leases | Other New Leases | ||||||||||||||||||||||
Quarter | Number of Leases Signed | GLA Signed | Contractual Rent Per SF (1) | Expired Rent Per SF (1) | Cash Basis % Change over Prior Rent | Number of Leases Signed | GLA Signed | Contractual Rent Per SF (1) | Total GLA Signed | ||||||||||||||
Q3 2014 | 14 | 136,474 | $ | 55.11 | $ | 55.63 | (0.9 | )% | 3 | 21,513 | $ | 21.18 | 157,987 | ||||||||||
Q4 2014 | 38 | 450,848 | $ | 40.31 | $ | 38.36 | 5.1 | % | 5 | 44,432 | $ | 36.26 | 495,280 | ||||||||||
Q1 2015 | 18 | 75,460 | $ | 22.49 | $ | 21.40 | 5.1 | % | 2 | 8,196 | $ | 21.94 | 83,656 | ||||||||||
Q2 2015 | 24 | 223,312 | $ | 33.34 | $ | 31.82 | 4.8 | % | 4 | 4,696 | $ | 20.89 | 228,008 | ||||||||||
Total | 94 | 886,094 | $ | 39.51 | $ | 37.95 | 4.1 | % | 14 | 78,837 | $ | 29.74 | 964,931 | ||||||||||
(1) | Retail and Office contractual rent per square foot includes base rent and fixed additional charges for common area maintenance and real estate taxes as of rental commencement. Retail contractual rent per square foot also includes fixed additional marketing/promotional charges. For all expiring leases, contractual rent per square foot includes any applicable escalations. |
17
Forest City Enterprises, Inc. and Subsidiaries
Supplemental Operating Information
Apartment Communities
The following tables present leasing information of our apartment communities. Prior period amounts may differ from data as reported in previous quarters since the properties that qualify as comparable change from period to period.
Quarterly Comparison
Monthly Average Residential Rental Rates (2) | Economic Residential Occupancy | |||||||||||||||||
Comparable Apartment | Leasable Units | Three Months Ended June 30, | Three Months Ended June 30, | |||||||||||||||
Communities (1) | at Pro-Rata % (3) | 2015 | 2014 | % Change | 2015 | 2014 | % Change | |||||||||||
Core Markets | 7,967 | $ | 1,894 | $ | 1,843 | 2.8 | % | 95.9 | % | 95.9 | % | — | ||||||
Non-Core Markets | 7,401 | $ | 890 | $ | 870 | 2.3 | % | 94.8 | % | 93.2 | % | 1.6 | % | |||||
Total Comparable Apartments | 15,368 | $ | 1,411 | $ | 1,375 | 2.6 | % | 95.6 | % | 95.1 | % | 0.5 | % | |||||
Year-to-Date Comparison
Monthly Average Residential Rental Rates (2) | Economic Residential Occupancy | |||||||||||||||||
Comparable Apartment | Leasable Units | Six Months Ended June 30, | Six Months Ended June 30, | |||||||||||||||
Communities (1) | at Pro-Rata % (3) | 2015 | 2014 | % Change | 2015 | 2014 | % Change | |||||||||||
Core Markets | 7,967 | $ | 1,886 | $ | 1,836 | 2.7 | % | 95.7 | % | 95.4 | % | 0.3 | % | |||||
Non-Core Markets | 7,401 | $ | 886 | $ | 867 | 2.2 | % | 94.3 | % | 92.6 | % | 1.7 | % | |||||
Total Comparable Apartments | 15,368 | $ | 1,405 | $ | 1,369 | 2.6 | % | 95.3 | % | 94.5 | % | 0.8 | % | |||||
Sequential Comparison
Monthly Average Residential Rental Rates (2) | Economic Residential Occupancy | |||||||||||||||||
Three Months Ended | Three Months Ended | |||||||||||||||||
Comparable Apartment | Leasable Units | June 30, | March 31, | June 30, | March 31, | |||||||||||||
Communities (1) | at Pro-Rata % (3) | 2015 | 2015 | % Change | 2015 | 2015 | % Change | |||||||||||
Core Markets | 8,487 | $ | 1,863 | $ | 1,847 | 0.9 | % | 95.9 | % | 95.2 | % | 0.7 | % | |||||
Non-Core Markets | 7,759 | $ | 936 | $ | 925 | 1.2 | % | 94.8 | % | 93.8 | % | 1.0 | % | |||||
Total Comparable Apartments | 16,246 | $ | 1,420 | $ | 1,407 | 0.9 | % | 95.6 | % | 94.7 | % | 0.9 | % | |||||
(1) | Includes stabilized apartment communities completely opened and operated in the periods presented. These apartment communities include units leased at affordable apartment rates which provide a discount from average market rental rates. For the three months ended June 30, 2015, 17.5% of leasable units in core markets and 4.7% of leasable units in non-core markets were affordable housing units. Excludes all military and limited-distribution subsidized senior housing units. |
(2) | Represents gross potential rent less concessions. |
(3) | Leasable units at pro-rata represent our share of comparable leasable units at the apartment community. |
18
(THIS PAGE INTENTIONALLY LEFT BLANK)
19
Forest City Enterprises, Inc. and Subsidiaries
Supplemental Operating Information
Comparable NOI - Pro-Rata
Three Months Ended | Six Months Ended | ||||
June 30, 2015 | June 30, 2015 | ||||
Retail | 4.4 | % | 5.4 | % | |
Office | 2.4 | % | 3.9 | % | |
Apartments | 5.2 | % | 5.7 | % | |
Total | 3.8 | % | 4.8 | % | |
The tables below provide the percentage change of Comparable NOI as reported in previous quarters. GAAP reconciliations for previous periods can be found in prior supplemental packages furnished with the Securities and Exchange Commission and are available on our website at www.forestcity.net.
Quarterly Historical Trends | Annual Historical Trends | |||||||||||||||||||||||||
Three Months Ended | Year Ended | 11 Months Ended | Year Ended | |||||||||||||||||||||||
June 30, 2015 | March 31, 2015 | December 31, 2014 | September 30, 2014 | June 30, 2014 | December 31, 2014 | December 31, 2013 | January 31, 2013 | |||||||||||||||||||
Retail | 4.4 | % | 6.4 | % | 10.5 | % | 6.5 | % | 2.3 | % | Retail | 2.6 | % | 3.6 | % | 2.1 | % | |||||||||
Office | 2.4 | % | 4.4 | % | 9.2 | % | 4.7 | % | 7.1 | % | Office | 6.6 | % | (6.4 | )% | 2.1 | % | |||||||||
Apartments | 5.2 | % | 5.5 | % | 2.8 | % | 3.4 | % | 4.6 | % | Apartments | 4.3 | % | 4.7 | % | 7.3 | % | |||||||||
Total | 3.8 | % | 5.3 | % | 7.7 | % | 4.8 | % | 5.0 | % | Total | 4.8 | % | (0.2 | )% | 3.2 | % | |||||||||
20
Forest City Enterprises, Inc. and Subsidiaries
Supplemental Operating Information
Net Operating Income (in thousands) | ||||||||||||||||||||||||||
Three Months Ended June 30, 2015 | Three Months Ended June 30, 2014 | % Change | ||||||||||||||||||||||||
Full Consolidation (1) | Less Noncontrolling Interest | Pro-Rata Consolidation (Non-GAAP) | Full Consolidation (1) | Less Noncontrolling Interest | Plus Discontinued Operations | Pro-Rata Consolidation (Non-GAAP) | Full Consolidation (1) | Pro-Rata Consolidation (Non-GAAP) | ||||||||||||||||||
Retail | ||||||||||||||||||||||||||
Comparable | ||||||||||||||||||||||||||
Adjusted revenues | $ | 76,233 | $ | — | $ | 76,233 | $ | 72,808 | $ | — | $ | — | $ | 72,808 | 4.7 | % | 4.7 | % | ||||||||
Adjusted operating expenses | 34,801 | — | 34,801 | 33,115 | — | — | 33,115 | 5.1 | % | 5.1 | % | |||||||||||||||
Comparable NOI | 41,432 | — | 41,432 | 39,693 | — | — | 39,693 | 4.4 | % | 4.4 | % | |||||||||||||||
Non-Comparable NOI | 3,492 | — | 3,492 | 3,846 | — | 1,808 | 5,654 | |||||||||||||||||||
Total | 44,924 | — | 44,924 | 43,539 | — | 1,808 | 45,347 | |||||||||||||||||||
Office Buildings | ||||||||||||||||||||||||||
Comparable | ||||||||||||||||||||||||||
Adjusted revenues | 106,661 | 4,900 | 101,761 | 101,388 | 4,325 | — | 97,063 | 5.2 | % | 4.8 | % | |||||||||||||||
Adjusted operating expenses | 45,554 | 2,426 | 43,128 | 41,884 | 2,081 | — | 39,803 | 8.8 | % | 8.4 | % | |||||||||||||||
Comparable NOI | 61,107 | 2,474 | 58,633 | 59,504 | 2,244 | — | 57,260 | 2.7 | % | 2.4 | % | |||||||||||||||
Non-Comparable NOI | 920 | 84 | 836 | (176 | ) | (40 | ) | — | (136 | ) | ||||||||||||||||
Total | 62,027 | 2,558 | 59,469 | 59,328 | 2,204 | — | 57,124 | |||||||||||||||||||
Apartments | ||||||||||||||||||||||||||
Comparable | ||||||||||||||||||||||||||
Adjusted revenues | 72,052 | 4,347 | 67,705 | 69,072 | 4,019 | — | 65,053 | 4.3 | % | 4.1 | % | |||||||||||||||
Adjusted operating expenses | 30,240 | 1,653 | 28,587 | 29,456 | 1,573 | — | 27,883 | 2.7 | % | 2.5 | % | |||||||||||||||
Comparable NOI | 41,812 | 2,694 | 39,118 | 39,616 | 2,446 | — | 37,170 | 5.5 | % | 5.2 | % | |||||||||||||||
Non-Comparable NOI | 5,144 | 2,814 | 2,330 | 2,027 | (1,688 | ) | — | 3,715 | ||||||||||||||||||
Total | 46,956 | 5,508 | 41,448 | 41,643 | 758 | — | 40,885 | |||||||||||||||||||
Arena | 9,153 | 4,300 | 4,853 | 9,357 | 4,481 | — | 4,876 | |||||||||||||||||||
Subsidized Senior Housing | 4,894 | — | 4,894 | 4,392 | — | — | 4,392 | |||||||||||||||||||
Military Housing | 9,587 | 737 | 8,850 | 5,701 | (6 | ) | — | 5,707 | ||||||||||||||||||
Land sales | — | — | — | 488 | 13 | — | 475 | |||||||||||||||||||
Write-offs of abandoned development projects and demolition costs | (15,969 | ) | — | (15,969 | ) | (933 | ) | — | — | (933 | ) | |||||||||||||||
Other (2) | (10,991 | ) | (370 | ) | (10,621 | ) | (10,906 | ) | 363 | — | (11,269 | ) | ||||||||||||||
Total Rental Properties | ||||||||||||||||||||||||||
Comparable | ||||||||||||||||||||||||||
Adjusted revenues | 254,946 | 9,247 | 245,699 | 243,268 | 8,344 | — | 234,924 | 4.8 | % | 4.6 | % | |||||||||||||||
Adjusted operating expenses | 110,595 | 4,079 | 106,516 | 104,455 | 3,654 | — | 100,801 | 5.9 | % | 5.7 | % | |||||||||||||||
Comparable NOI | 144,351 | 5,168 | 139,183 | 138,813 | 4,690 | — | 134,123 | 4.0 | % | 3.8 | % | |||||||||||||||
Non-Comparable NOI | 6,230 | 7,565 | (1,335 | ) | 13,796 | 3,123 | 1,808 | 12,481 | ||||||||||||||||||
Total | 150,581 | 12,733 | 137,848 | 152,609 | 7,813 | 1,808 | 146,604 | |||||||||||||||||||
Land Development Group | 14,310 | 1,480 | 12,830 | 13,635 | 1,395 | — | 12,240 | |||||||||||||||||||
Corporate Activities | (13,630 | ) | — | (13,630 | ) | (10,928 | ) | — | — | (10,928 | ) | |||||||||||||||
Corporate Activities - REIT conversion and reorganization costs | (9,771 | ) | — | (9,771 | ) | — | — | — | — | |||||||||||||||||
Grand Total | $ | 141,490 | $ | 14,213 | $ | 127,277 | $ | 155,316 | $ | 9,208 | $ | 1,808 | $ | 147,916 | ||||||||||||
(1) | Includes the Company's pro-rata share of NOI from unconsolidated subsidiaries accounted for under the equity method of accounting. |
(2) | Includes non-capitalizable development costs and unallocated management and service company overhead, net of tax credit income. |
21
Forest City Enterprises, Inc. and Subsidiaries
Supplemental Operating Information
Net Operating Income (in thousands) | ||||||||||||||||||||||||||
Six Months Ended June 30, 2015 | Six Months Ended June 30, 2014 | % Change | ||||||||||||||||||||||||
Full Consolidation (1) | Less Noncontrolling Interest | Pro-Rata Consolidation (Non-GAAP) | Full Consolidation (1) | Less Noncontrolling Interest | Plus Discontinued Operations | Pro-Rata Consolidation (Non-GAAP) | Full Consolidation (1) | Pro-Rata Consolidation (Non-GAAP) | ||||||||||||||||||
Retail | ||||||||||||||||||||||||||
Comparable | ||||||||||||||||||||||||||
Adjusted revenues | $ | 151,450 | $ | — | $ | 151,450 | $ | 146,085 | $ | — | $ | — | $ | 146,085 | 3.7 | % | 3.7 | % | ||||||||
Adjusted operating expenses | 69,481 | — | 69,481 | 68,281 | — | — | 68,281 | 1.8 | % | 1.8 | % | |||||||||||||||
Comparable NOI | 81,969 | — | 81,969 | 77,804 | — | — | 77,804 | 5.4 | % | 5.4 | % | |||||||||||||||
Non-Comparable NOI | 7,306 | — | 7,306 | 6,886 | — | 3,678 | 10,564 | |||||||||||||||||||
Total | 89,275 | — | 89,275 | 84,690 | — | 3,678 | 88,368 | |||||||||||||||||||
Office Buildings | ||||||||||||||||||||||||||
Comparable | ||||||||||||||||||||||||||
Adjusted revenues | 210,118 | 9,552 | 200,566 | 201,582 | 9,013 | — | 192,569 | 4.2 | % | 4.2 | % | |||||||||||||||
Adjusted operating expenses | 90,581 | 4,730 | 85,851 | 86,572 | 4,410 | — | 82,162 | 4.6 | % | 4.5 | % | |||||||||||||||
Comparable NOI | 119,537 | 4,822 | 114,715 | 115,010 | 4,603 | — | 110,407 | 3.9 | % | 3.9 | % | |||||||||||||||
Non-Comparable NOI | 2,974 | 258 | 2,716 | (565 | ) | 130 | (43 | ) | (738 | ) | ||||||||||||||||
Total | 122,511 | 5,080 | 117,431 | 114,445 | 4,733 | (43 | ) | 109,669 | ||||||||||||||||||
Apartments | ||||||||||||||||||||||||||
Comparable | ||||||||||||||||||||||||||
Adjusted revenues | 142,874 | 8,600 | 134,274 | 137,254 | 7,939 | — | 129,315 | 4.1 | % | 3.8 | % | |||||||||||||||
Adjusted operating expenses | 61,072 | 3,195 | 57,877 | 60,162 | 3,144 | — | 57,018 | 1.5 | % | 1.5 | % | |||||||||||||||
Comparable NOI | 81,802 | 5,405 | 76,397 | 77,092 | 4,795 | — | 72,297 | 6.1 | % | 5.7 | % | |||||||||||||||
Non-Comparable NOI | 10,660 | 6,420 | 4,240 | 3,874 | (3,201 | ) | — | 7,075 | ||||||||||||||||||
Total | 92,462 | 11,825 | 80,637 | 80,966 | 1,594 | — | 79,372 | |||||||||||||||||||
Arena | 17,987 | 8,334 | 9,653 | 21,221 | 9,928 | — | 11,293 | |||||||||||||||||||
Subsidized Senior Housing | 8,713 | — | 8,713 | 7,956 | — | — | 7,956 | |||||||||||||||||||
Military Housing | 14,948 | 732 | 14,216 | 10,680 | 47 | — | 10,633 | |||||||||||||||||||
Land sales | — | — | — | 488 | 13 | 459 | 934 | |||||||||||||||||||
Write-offs of abandoned development projects and demolition costs | (15,969 | ) | — | (15,969 | ) | (933 | ) | — | — | (933 | ) | |||||||||||||||
Other (2) | (26,522 | ) | (1,378 | ) | (25,144 | ) | (21,107 | ) | 411 | — | (21,518 | ) | ||||||||||||||
Total Rental Properties | ||||||||||||||||||||||||||
Comparable | ||||||||||||||||||||||||||
Adjusted revenues | 504,442 | 18,152 | 486,290 | 484,921 | 16,952 | — | 467,969 | 4.0 | % | 3.9 | % | |||||||||||||||
Adjusted operating expenses | 221,134 | 7,925 | 213,209 | 215,015 | 7,554 | — | 207,461 | 2.8 | % | 2.8 | % | |||||||||||||||
Comparable NOI | 283,308 | 10,227 | 273,081 | 269,906 | 9,398 | — | 260,508 | 5.0 | % | 4.8 | % | |||||||||||||||
Non-Comparable NOI | 20,097 | 14,366 | 5,731 | 28,500 | 7,328 | 4,094 | 25,266 | |||||||||||||||||||
Total | 303,405 | 24,593 | 278,812 | 298,406 | 16,726 | 4,094 | 285,774 | |||||||||||||||||||
Land Development Group | 25,482 | 2,398 | 23,084 | 26,515 | 2,667 | — | 23,848 | |||||||||||||||||||
Corporate Activities | (28,608 | ) | — | (28,608 | ) | (24,349 | ) | — | — | (24,349 | ) | |||||||||||||||
Corporate Activities - REIT conversion and reorganization costs | (15,983 | ) | — | (15,983 | ) | — | — | — | — | |||||||||||||||||
Grand Total | $ | 284,296 | $ | 26,991 | $ | 257,305 | $ | 300,572 | $ | 19,393 | $ | 4,094 | $ | 285,273 | ||||||||||||
(1) | Includes the Company's pro-rata share of NOI from unconsolidated subsidiaries accounted for under the equity method of accounting. |
(2) | Includes non-capitalizable development costs and unallocated management and service company overhead, net of tax credit income and a 2014 legal settlement at Heritage, an apartment community in San Diego, California. |
22
Forest City Enterprises, Inc. and Subsidiaries
Supplemental Operating Information
Net Operating Income by Product Type
Pro-Rata Consolidation (dollars in thousands)
Six Months Ended June 30, 2015 | Six Months Ended June 30, 2014 | |
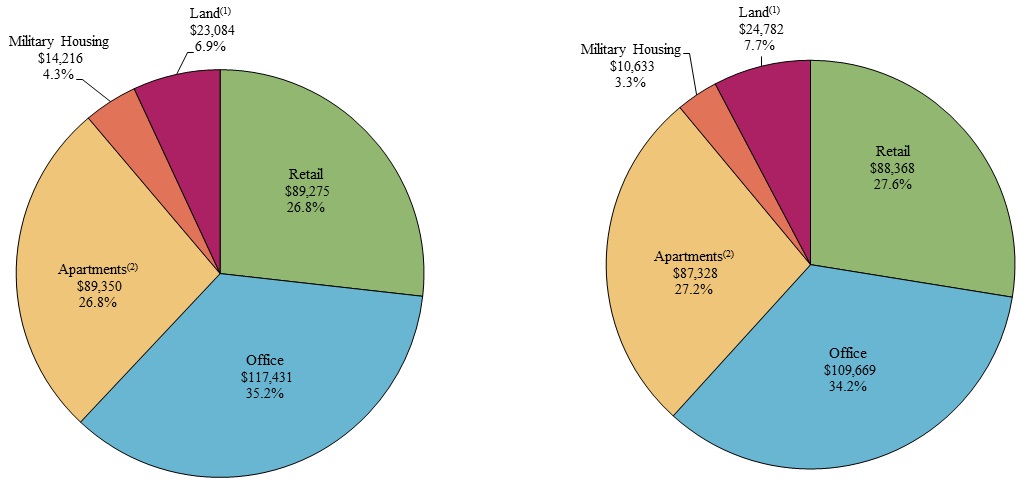
NOI by Product Type | $ | 333,356 | NOI by Product Type | $ | 320,780 | |||
Arena | 9,653 | Arena | 11,293 | |||||
Corporate Activities | (28,608 | ) | Corporate Activities | (24,349 | ) | |||
Corporate Activities - REIT conversion and reorganization costs | (15,983 | ) | Corporate Activities - REIT conversion and reorganization costs | — | ||||
Write-offs of abandoned development projects | (15,969 | ) | Write-offs of abandoned development projects and demolition costs | (933 | ) | |||
Other (3) | (25,144 | ) | Other (3) | (21,518 | ) | |||
Grand Total NOI | $ | 257,305 | Grand Total NOI | $ | 285,273 | |||
(1) | Includes commercial and residential outlot land sales. |
(2) | Includes limited-distribution subsidized senior housing. |
(3) | Includes non-capitalizable development costs and unallocated management and service company overhead, net of tax credit income and a 2014 legal settlement at Heritage. |
23
Forest City Enterprises, Inc. and Subsidiaries
Supplemental Operating Information
Net Operating Income by Core Market
Pro-Rata Consolidation (dollars in thousands)
Six Months Ended June 30, 2015 | Six Months Ended June 30, 2014 | |
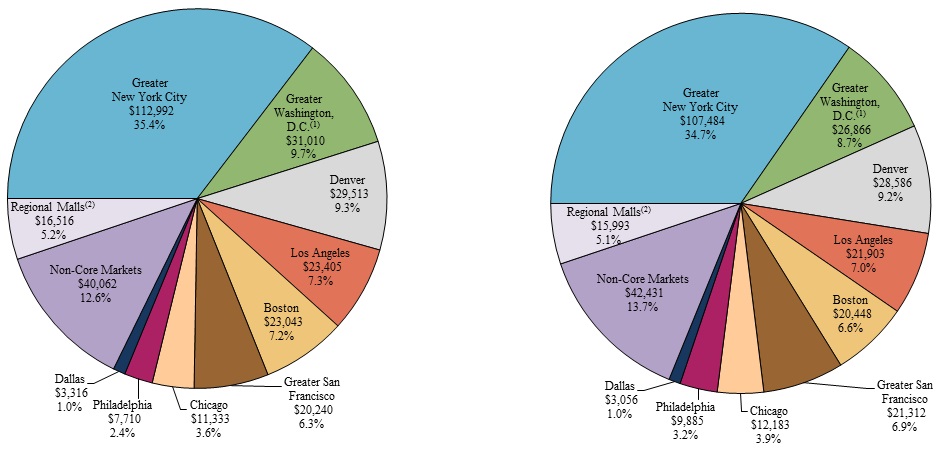
NOI by Market | $ | 319,140 | NOI by Market | $ | 310,147 | |||
Arena | 9,653 | Arena | 11,293 | |||||
Military Housing | 14,216 | Military Housing | 10,633 | |||||
Corporate Activities | (28,608 | ) | Corporate Activities | (24,349 | ) | |||
Corporate Activities - REIT conversion and reorganization costs | (15,983 | ) | Corporate Activities - REIT conversion and reorganization costs | — | ||||
Write-offs of abandoned development projects | (15,969 | ) | Write-offs of abandoned development projects and demolition costs | (933 | ) | |||
Other (3) | (25,144 | ) | Other (3) | (21,518 | ) | |||
Grand Total NOI | $ | 257,305 | Grand Total NOI | $ | 285,273 | |||
(1) | Includes Richmond, Virginia. |
(2) | Represents Regional Malls located in Non-Core Markets. Regional Malls located in Core Markets are included in their applicable Core Markets. |
(3) | Includes non-capitalizable development costs and unallocated management and service company overhead, net of tax credit income and a 2014 legal settlement at Heritage. |
24
Forest City Enterprises, Inc. and Subsidiaries
Supplemental Operating Information
Reconciliation of Net Operating Income (non-GAAP) to Earnings (Loss) Before Income Taxes (GAAP) (in thousands)
Three Months Ended June 30, 2015 | Three Months Ended June 30, 2014 | |||||||||||||||||||||||||||
Full Consolidation (GAAP) | Less Noncontrolling Interest | Plus Unconsolidated Investments at Pro-Rata | Pro-Rata Consolidation (Non-GAAP) | Full Consolidation (GAAP) | Less Noncontrolling Interest | Plus Unconsolidated Investments at Pro-Rata | Plus Discontinued Operations | Pro-Rata Consolidation (Non-GAAP) | ||||||||||||||||||||
Total revenues | $ | 259,759 | $ | 29,606 | $ | 100,429 | $ | 330,582 | $ | 229,637 | $ | 18,167 | $ | 110,484 | $ | 39 | $ | 321,993 | ||||||||||
Exclude straight-line adjustment | (738 | ) | — | — | (738 | ) | (1,354 | ) | — | — | 20 | (1,334 | ) | |||||||||||||||
Add interest and other income | 9,278 | 506 | 363 | 9,135 | 12,375 | 566 | (372 | ) | — | 11,437 | ||||||||||||||||||
Equity in earnings (loss) of unconsolidated entities | 19,009 | 99 | (19,421 | ) | (511 | ) | 27,168 | 98 | (27,719 | ) | — | (649 | ) | |||||||||||||||
Exclude operating expenses of unconsolidated entities | 43,581 | — | (43,581 | ) | — | 47,566 | — | (47,566 | ) | — | — | |||||||||||||||||
Exclude write-offs of abandoned development projects of unconsolidated entities | 10,191 | — | (10,191 | ) | — | — | — | — | — | — | ||||||||||||||||||
Exclude gain on disposition of unconsolidated entities | (19,284 | ) | — | 19,284 | — | (16,090 | ) | — | 16,090 | — | — | |||||||||||||||||
Exclude depreciation and amortization of unconsolidated entities | 21,318 | — | (21,318 | ) | — | 22,968 | — | (22,968 | ) | — | — | |||||||||||||||||
Exclude interest expense of unconsolidated entities | 25,182 | — | (25,182 | ) | — | 27,905 | — | (27,905 | ) | — | — | |||||||||||||||||
Exclude loss on extinguishment of debt of unconsolidated entities | 383 | — | (383 | ) | — | 44 | — | (44 | ) | — | — | |||||||||||||||||
Adjusted revenues | 368,679 | 30,211 | — | 338,468 | 350,219 | 18,831 | — | 59 | 331,447 | |||||||||||||||||||
Operating expenses | 166,840 | 15,998 | 43,581 | 194,423 | 145,807 | 9,623 | 47,566 | (1,749 | ) | 182,001 | ||||||||||||||||||
Operating expenses of unconsolidated entities | 43,581 | — | (43,581 | ) | — | 47,566 | — | (47,566 | ) | — | — | |||||||||||||||||
Write-offs of abandoned development projects and demolition costs | 5,778 | — | 10,191 | 15,969 | 933 | — | — | — | 933 | |||||||||||||||||||
Write-offs of abandoned development projects of unconsolidated entities | 10,191 | — | (10,191 | ) | — | — | — | — | — | — | ||||||||||||||||||
Non-Real Estate depreciation and amortization | 1,230 | — | — | 1,230 | 1,090 | — | — | — | 1,090 | |||||||||||||||||||
Exclude straight-line rent adjustment | (431 | ) | — | — | (431 | ) | (493 | ) | — | — | — | (493 | ) | |||||||||||||||
Adjusted operating expenses | 227,189 | 15,998 | — | 211,191 | 194,903 | 9,623 | — | (1,749 | ) | 183,531 | ||||||||||||||||||
Net operating income | $ | 141,490 | $ | 14,213 | $ | — | $ | 127,277 | $ | 155,316 | $ | 9,208 | $ | — | $ | 1,808 | $ | 147,916 | ||||||||||
Interest expense | (47,752 | ) | (7,263 | ) | (25,182 | ) | (65,671 | ) | (57,153 | ) | (5,848 | ) | (27,905 | ) | (55 | ) | (79,265 | ) | ||||||||||
Interest expense of unconsolidated entities | (25,182 | ) | — | 25,182 | — | (27,905 | ) | — | 27,905 | — | — | |||||||||||||||||
Loss on extinguishment of debt | (3,190 | ) | — | (383 | ) | (3,573 | ) | (714 | ) | — | (44 | ) | (431 | ) | (1,189 | ) | ||||||||||||
Loss on extinguishment of debt of unconsolidated entities | (383 | ) | — | 383 | — | (44 | ) | — | 44 | — | — | |||||||||||||||||
Equity in (earnings) loss of unconsolidated entities | (19,009 | ) | (99 | ) | 19,421 | 511 | (27,168 | ) | (98 | ) | 27,719 | — | 649 | |||||||||||||||
Net loss on disposition of partial interest in development project | — | — | — | — | (19,590 | ) | (3,379 | ) | — | — | (16,211 | ) | ||||||||||||||||
Net gain on disposition of full or partial interests in rental properties | — | — | 19,284 | 19,284 | — | — | 16,090 | 1,276 | 17,366 | |||||||||||||||||||
Gain on disposition of unconsolidated entities | 19,284 | — | (19,284 | ) | — | 16,090 | — | (16,090 | ) | — | — | |||||||||||||||||
Net gain on change in control of interests | 487,684 | — | — | 487,684 | — | — | — | — | — | |||||||||||||||||||
Impairment of consolidated and unconsolidated real estate | — | — | — | — | (129,829 | ) | — | — | — | (129,829 | ) | |||||||||||||||||
Depreciation and amortization—Real Estate Groups (a) | (63,772 | ) | (7,585 | ) | (20,527 | ) | (76,714 | ) | (58,228 | ) | (4,747 | ) | (22,180 | ) | — | (75,661 | ) | |||||||||||
Amortization of mortgage procurement costs | (1,862 | ) | (45 | ) | (791 | ) | (2,608 | ) | (1,768 | ) | (87 | ) | (788 | ) | — | (2,469 | ) | |||||||||||
Depreciation and amortization of unconsolidated entities | (21,318 | ) | — | 21,318 | — | (22,968 | ) | — | 22,968 | — | — | |||||||||||||||||
Straight-line rent adjustment | 307 | — | — | 307 | 861 | — | — | (20 | ) | 841 | ||||||||||||||||||
Earnings (loss) before income taxes | $ | 466,297 | $ | (779 | ) | $ | 19,421 | $ | 486,497 | $ | (173,100 | ) | $ | (4,951 | ) | $ | 27,719 | $ | 2,578 | $ | (137,852 | ) | ||||||
(a) Depreciation and amortization—Real Estate Groups | $ | 63,772 | $ | 7,585 | $ | 20,527 | $ | 76,714 | $ | 58,228 | $ | 4,747 | $ | 22,180 | $ | — | $ | 75,661 | ||||||||||
Depreciation and amortization—Non-Real Estate | 1,230 | — | — | 1,230 | 1,090 | — | — | — | 1,090 | |||||||||||||||||||
Total depreciation and amortization | $ | 65,002 | $ | 7,585 | $ | 20,527 | $ | 77,944 | $ | 59,318 | $ | 4,747 | $ | 22,180 | $ | — | $ | 76,751 | ||||||||||
25
Forest City Enterprises, Inc. and Subsidiaries
Supplemental Operating Information
Reconciliation of Net Operating Income (non-GAAP) to Earnings (Loss) Before Income Taxes (GAAP) (in thousands) (continued) | ||||||||||||||||||||||||||||
Six Months Ended June 30, 2015 | Six Months Ended June 30, 2014 | |||||||||||||||||||||||||||
Full Consolidation (GAAP) | Less Noncontrolling Interest | Plus Unconsolidated Investments at Pro-Rata | Pro-Rata Consolidation (Non-GAAP) | Full Consolidation (GAAP) | Less Noncontrolling Interest | Plus Unconsolidated Investments at Pro-Rata | Plus Discontinued Operations | Pro-Rata Consolidation (Non-GAAP) | ||||||||||||||||||||
Total revenues | $ | 496,841 | $ | 56,732 | $ | 204,585 | $ | 644,694 | $ | 479,174 | $ | 43,107 | $ | 220,942 | $ | 7,029 | $ | 664,038 | ||||||||||
Exclude straight-line adjustment | (1,247 | ) | — | — | (1,247 | ) | (4,388 | ) | — | — | 79 | (4,309 | ) | |||||||||||||||
Add interest and other income | 18,982 | 916 | 646 | 18,712 | 23,878 | 1,032 | 196 | — | 23,042 | |||||||||||||||||||
Equity in earnings (loss) of unconsolidated entities | 28,322 | 82 | (28,048 | ) | 192 | 61,197 | 77 | (63,171 | ) | — | (2,051 | ) | ||||||||||||||||
Exclude operating expenses of unconsolidated entities | 90,848 | — | (90,848 | ) | — | 98,080 | — | (98,080 | ) | — | — | |||||||||||||||||
Exclude write-offs of abandoned development projects of unconsolidated entities | 10,191 | — | (10,191 | ) | — | — | — | — | — | — | ||||||||||||||||||
Exclude gain on disposition of unconsolidated entities | (19,284 | ) | — | 19,284 | — | (40,886 | ) | — | 40,886 | — | — | |||||||||||||||||
Exclude depreciation and amortization of unconsolidated entities | 43,784 | — | (43,784 | ) | — | 44,572 | — | (44,572 | ) | — | — | |||||||||||||||||
Exclude interest expense of unconsolidated entities | 51,036 | — | (51,036 | ) | — | 55,905 | — | (55,905 | ) | — | — | |||||||||||||||||
Exclude loss on extinguishment of debt of unconsolidated entities | 608 | — | (608 | ) | — | 296 | — | (296 | ) | — | — | |||||||||||||||||
Adjusted revenues | 720,081 | 57,730 | — | 662,351 | 717,828 | 44,216 | — | 7,108 | 680,720 | |||||||||||||||||||
Operating expenses | 327,483 | 30,739 | 90,848 | 387,592 | 316,910 | 24,823 | 98,080 | 3,014 | 393,181 | |||||||||||||||||||
Operating expenses of unconsolidated entities | 90,848 | — | (90,848 | ) | — | 98,080 | — | (98,080 | ) | — | — | |||||||||||||||||
Write-offs of abandoned development projects and demolition costs | 5,778 | — | 10,191 | 15,969 | 933 | — | — | — | 933 | |||||||||||||||||||
Write-offs of abandoned development projects of unconsolidated entities | 10,191 | — | (10,191 | ) | — | — | — | — | — | — | ||||||||||||||||||
Non-Real Estate depreciation and amortization | 2,372 | — | — | 2,372 | 2,267 | — | — | — | 2,267 | |||||||||||||||||||
Exclude straight-line rent adjustment | (887 | ) | — | — | (887 | ) | (934 | ) | — | — | — | (934 | ) | |||||||||||||||
Adjusted operating expenses | 435,785 | 30,739 | — | 405,046 | 417,256 | 24,823 | — | 3,014 | 395,447 | |||||||||||||||||||
Net operating income | $ | 284,296 | $ | 26,991 | $ | — | $ | 257,305 | $ | 300,572 | $ | 19,393 | $ | — | $ | 4,094 | $ | 285,273 | ||||||||||
Interest expense | (100,328 | ) | (15,176 | ) | (51,036 | ) | (136,188 | ) | (119,605 | ) | (12,376 | ) | (55,905 | ) | (5,538 | ) | (168,672 | ) | ||||||||||
Interest expense of unconsolidated entities | (51,036 | ) | — | 51,036 | — | (55,905 | ) | — | 55,905 | — | — | |||||||||||||||||
Loss on extinguishment of debt | (38,344 | ) | — | (608 | ) | (38,952 | ) | (878 | ) | — | (296 | ) | (448 | ) | (1,622 | ) | ||||||||||||
Loss on extinguishment of debt of unconsolidated entities | (608 | ) | — | 608 | — | (296 | ) | — | 296 | — | — | |||||||||||||||||
Equity in (earnings) loss of unconsolidated entities | (28,322 | ) | (82 | ) | 28,048 | (192 | ) | (61,197 | ) | (77 | ) | 63,171 | — | 2,051 | ||||||||||||||
Net loss on disposition of partial interest in development project | — | — | — | — | (19,590 | ) | (3,379 | ) | — | — | (16,211 | ) | ||||||||||||||||
Net gain (loss) on disposition of full or partial interests in rental properties | — | — | 19,284 | 19,284 | (467 | ) | — | 40,886 | 28,042 | 68,461 | ||||||||||||||||||
Gain on disposition of unconsolidated entities | 19,284 | — | (19,284 | ) | — | 40,886 | — | (40,886 | ) | — | — | |||||||||||||||||
Net gain on change in control of interests | 487,684 | — | — | 487,684 | 2,759 | — | — | — | 2,759 | |||||||||||||||||||
Impairment of consolidated and unconsolidated real estate | — | — | — | — | (129,829 | ) | — | — | — | (129,829 | ) | |||||||||||||||||
Depreciation and amortization—Real Estate Groups (a) | (124,444 | ) | (15,146 | ) | (42,196 | ) | (151,494 | ) | (112,060 | ) | (9,362 | ) | (42,983 | ) | (986 | ) | (146,667 | ) | ||||||||||
Amortization of mortgage procurement costs | (3,963 | ) | (144 | ) | (1,588 | ) | (5,407 | ) | (3,893 | ) | (250 | ) | (1,589 | ) | (41 | ) | (5,273 | ) | ||||||||||
Depreciation and amortization of unconsolidated entities | (43,784 | ) | — | 43,784 | — | (44,572 | ) | — | 44,572 | — | — | |||||||||||||||||
Straight-line rent adjustment | 360 | — | — | 360 | 3,454 | — | — | (79 | ) | 3,375 | ||||||||||||||||||
Earnings (loss) before income taxes | $ | 400,795 | $ | (3,557 | ) | $ | 28,048 | $ | 432,400 | $ | (200,621 | ) | $ | (6,051 | ) | $ | 63,171 | $ | 25,044 | $ | (106,355 | ) | ||||||
(a) Depreciation and amortization—Real Estate Groups | $ | 124,444 | $ | 15,146 | $ | 42,196 | $ | 151,494 | $ | 112,060 | $ | 9,362 | $ | 42,983 | $ | 986 | $ | 146,667 | ||||||||||
Depreciation and amortization—Non-Real Estate | 2,372 | — | — | 2,372 | 2,267 | — | — | — | 2,267 | |||||||||||||||||||
Total depreciation and amortization | $ | 126,816 | $ | 15,146 | $ | 42,196 | $ | 153,866 | $ | 114,327 | $ | 9,362 | $ | 42,983 | $ | 986 | $ | 148,934 | ||||||||||
26
Forest City Enterprises, Inc. and Subsidiaries
Supplemental Operating Information
Segment Operating Results - Quarterly Comparison
The following tables present revenues, operating expenses and interest expense by segment on a pro-rata basis for the three months ended June 30, 2015 compared with the three months ended June 30, 2014.
Commercial Group | Residential Group | Arena | Land Development Group | Total | |||||||||||
Revenues for the three months ended June 30, 2014 | $ | 189,228 | $ | 100,404 | $ | 13,482 | $ | 18,879 | $ | 321,993 | |||||
Increase (decrease) due to: | |||||||||||||||
Comparable portfolio | 7,251 | 1,565 | — | — | 8,816 | ||||||||||
Non-comparable properties (1) | 6 | 6,382 | 1,357 | — | 7,745 | ||||||||||
Properties in which partners' interest recently acquired | 2,993 | 1,710 | — | — | 4,703 | ||||||||||
Recently disposed properties | (4,271 | ) | (5,370 | ) | — | — | (9,641 | ) | |||||||
Properties in which partial interest was recently disposed | — | (2,798 | ) | — | — | (2,798 | ) | ||||||||
Land sales | (1,584 | ) | (135 | ) | — | (2,607 | ) | (4,326 | ) | ||||||
Military housing | — | 1,812 | — | — | 1,812 | ||||||||||
Subsidized senior housing | — | 588 | — | — | 588 | ||||||||||
Other | 1,266 | 931 | — | (507 | ) | 1,690 | |||||||||
Revenues for the three months ended June 30, 2015 | $ | 194,889 | $ | 105,089 | $ | 14,839 | $ | 15,765 | $ | 330,582 | |||||
Corporate Activities | Commercial Group | Residential Group | Arena | Land Development Group | Total | |||||||||||||
Operating expenses for the three months ended June 30, 2014 | $ | 10,059 | $ | 97,645 | $ | 56,382 | $ | 8,209 | $ | 9,706 | $ | 182,001 | ||||||
Increase (decrease) due to: | ||||||||||||||||||
Comparable portfolio | — | 3,896 | 1,300 | — | — | 5,196 | ||||||||||||
Non-comparable properties (1) | — | (156 | ) | 2,106 | 1,752 | — | 3,702 | |||||||||||
Properties in which partners' interest recently acquired | — | 1,155 | 671 | — | — | 1,826 | ||||||||||||
Recently disposed properties | — | (801 | ) | (3,449 | ) | — | — | (4,250 | ) | |||||||||
Properties in which partial interest was recently disposed | — | — | (1,297 | ) | — | — | (1,297 | ) | ||||||||||
Land cost of sales | — | (1,228 | ) | (16 | ) | — | (3,101 | ) | (4,345 | ) | ||||||||
Military housing | — | — | (642 | ) | — | — | (642 | ) | ||||||||||
Subsidized senior housing | — | — | 65 | — | — | 65 | ||||||||||||
REIT conversion and reorganization costs | 9,771 | — | — | — | 9,771 | |||||||||||||
Development, management, corporate and other expenses | 2,142 | (3,880 | ) | 4,090 | — | 44 | 2,396 | |||||||||||
Operating expenses for the three months ended June 30, 2015 | $ | 21,972 | $ | 96,631 | $ | 59,210 | $ | 9,961 | $ | 6,649 | $ | 194,423 | ||||||
Corporate Activities | Commercial Group | Residential Group | Arena | Land Development Group | Total | |||||||||||||
Interest expense for the three months ended June 30, 2014 | $ | 9,555 | $ | 51,872 | $ | 13,157 | $ | 4,748 | $ | (67 | ) | $ | 79,265 | |||||
Increase (decrease) due to: | ||||||||||||||||||
Comparable portfolio | — | (3,118 | ) | (617 | ) | — | — | (3,735 | ) | |||||||||
Non-comparable properties (1) | — | 164 | 1,617 | 33 | — | 1,814 | ||||||||||||
Properties in which partners' interest recently acquired | — | 291 | (21 | ) | — | — | 270 | |||||||||||
Recently disposed properties | — | (1,052 | ) | (791 | ) | — | — | (1,843 | ) | |||||||||
Properties in which partial interest was recently disposed | — | — | (2,075 | ) | — | — | (2,075 | ) | ||||||||||
Capitalized interest | — | (2,310 | ) | (2,191 | ) | — | 87 | (4,414 | ) | |||||||||
Mark-to-market adjustments on non-designated swaps | (18 | ) | (51 | ) | (871 | ) | — | (311 | ) | (1,251 | ) | |||||||
Corporate borrowings | (3,501 | ) | — | — | — | — | (3,501 | ) | ||||||||||
Other | — | 1,063 | (6 | ) | — | 84 | 1,141 | |||||||||||
Interest expense for the three months ended June 30, 2015 | $ | 6,036 | $ | 46,859 | $ | 8,202 | $ | 4,781 | $ | (207 | ) | $ | 65,671 | |||||
27
Forest City Enterprises, Inc. and Subsidiaries
Supplemental Operating Information
(1) | The following table presents the increases (decreases) in revenues, operating expenses and interest expense for Commercial and Residential properties in lease-up and other non-comparable properties: |
Three Months Ended June 30, 2015 vs. 2014 | ||||||||||
Property | Quarter Opened | Revenues | Operating Expenses | Interest Expense | ||||||
Commercial: | ||||||||||
Property in lease-up: | ||||||||||
The Yards - Lumbershed | Q3-13 | $ | 66 | $ | 29 | $ | 15 | |||
Non-comparable property: | ||||||||||
Ballston Common | (60 | ) | (185 | ) | 149 | |||||
Total Commercial | $ | 6 | $ | (156 | ) | $ | 164 | |||
Residential: | ||||||||||
Properties in lease-up: | ||||||||||
1111 Stratford | Q3-13/Q1-14 | $ | 326 | $ | (88 | ) | $ | (20 | ) | |
2175 Market Street | Q4-14 | 198 | 26 | 34 | ||||||
3700M | Q3-14 | 350 | 180 | 135 | ||||||
Aster Conservatory Green | Q3-13/14 | 832 | 126 | 337 | ||||||
Radian | Q2-14 | 894 | 95 | 281 | ||||||
The Continental | Q1-13 | 27 | (99 | ) | (14 | ) | ||||
The Yards - Twelve12 | Q2-14 | 2,011 | 948 | 517 | ||||||
Winchester Lofts | Q4-14 | 175 | 290 | 160 | ||||||
Non-comparable properties: | ||||||||||
Heritage | 909 | (38 | ) | (96 | ) | |||||
500 Sterling Place | 660 | 666 | 283 | |||||||
Total Residential | $ | 6,382 | $ | 2,106 | $ | 1,617 | ||||
Commercial Group - Quarterly Comparison
The increases in revenues, operating expenses and interest expense related to partners’ interest recently acquired are related to Boulevard Mall (Q4-2014), a regional mall located in Amherst, New York, and seven life science office properties and two parking facilities at University Park at MIT, a mixed-use life science office campus in Cambridge, Massachusetts. The decreases in revenues, operating expenses and interest expense related to recent disposals are due to our ongoing strategy to sell operating assets in non-core markets. The decrease in interest expense for the comparable portfolio is primarily due to the paydown of nonrecourse mortgage notes for One MetroTech Center, Harlem Office, Ballston Common Office Center and Skylight Office Tower.
Ballston Common, a regional mall in Arlington, Virginia, is classified as a non-comparable property due to its upcoming planned renovation project.
Residential Group - Quarterly Comparison
The increases in revenues and operating expenses related to partners’ interest recently acquired are related to three operating apartment communities located in Northeast Ohio. The decreases in revenues, operating expenses and interest expense related to recent disposals are due to our ongoing strategy to sell operating assets in non-core markets. The decreases in revenues, operating expenses and interest expense related to partial interest recently disposed are related to the contribution of two operating apartment communities into our strategic capital partnership with Arizona State Retirement System in the prior year.
Heritage is classified as a non-comparable property due to its recently completed renovation project resulting in a significant number of units being off-line.
500 Sterling Place, an apartment community in Brooklyn, New York, was acquired (Q1-2015) and is classified as a non-comparable property.
Corporate Activities - Quarterly Comparison
The increase in operating expenses is primarily due to a recovery of a $3,200,000 legal settlement in 2014 which did not recur in 2015. The decrease in interest expense is due to the privately negotiated exchanges of a portion of our Senior Notes due 2016, 2018 and 2020 for Class A common stock in the first quarter of 2015.
28
Forest City Enterprises, Inc. and Subsidiaries
Supplemental Operating Information
Segment Operating Results - Year-to-Date Comparison
The following tables present revenues, operating expenses and interest expense by segment on a pro-rata basis for the six months ended June 30, 2015 compared with the six months ended June 30, 2014.
Commercial Group | Residential Group | Arena | Land Development Group | Total | |||||||||||
Revenues for the six months ended June 30, 2014 | $ | 390,447 | $ | 204,296 | $ | 32,889 | $ | 36,406 | $ | 664,038 | |||||
Increase (decrease) due to: | |||||||||||||||
Comparable portfolio | 10,407 | 4,038 | — | — | 14,445 | ||||||||||
Non-comparable properties (1) | 22 | 12,409 | (2,231 | ) | — | 10,200 | |||||||||
Properties in which partners' interest recently acquired | 4,207 | 1,775 | — | — | 5,982 | ||||||||||
Recently disposed properties | (14,044 | ) | (10,252 | ) | — | — | (24,296 | ) | |||||||
Properties in which partial interest was recently disposed | — | (6,481 | ) | — | — | (6,481 | ) | ||||||||
Land sales | (3,184 | ) | (135 | ) | — | (9,755 | ) | (13,074 | ) | ||||||
Military housing | — | (1,466 | ) | — | — | (1,466 | ) | ||||||||
Subsidized senior housing | — | 806 | — | — | 806 | ||||||||||
Other | (3,638 | ) | (1,314 | ) | — | (508 | ) | (5,460 | ) | ||||||
Revenues for the six months ended June 30, 2015 | $ | 384,217 | $ | 203,676 | $ | 30,658 | $ | 26,143 | $ | 644,694 | |||||
Corporate Activities | Commercial Group | Residential Group | Arena | Land Development Group | Total | |||||||||||||
Operating expenses for the six months ended June 30, 2014 | $ | 21,620 | $ | 210,075 | $ | 121,921 | $ | 21,182 | $ | 18,383 | $ | 393,181 | ||||||
Increase (decrease) due to: | ||||||||||||||||||
Comparable portfolio | — | 2,690 | 1,055 | — | — | 3,745 | ||||||||||||
Non-comparable properties (1) | — | (462 | ) | 4,489 | (230 | ) | — | 3,797 | ||||||||||
Properties in which partners' interest recently acquired | — | 917 | 637 | — | — | 1,554 | ||||||||||||
Recently disposed properties | — | (6,680 | ) | (6,276 | ) | — | — | (12,956 | ) | |||||||||
Properties in which partial interest was recently disposed | — | — | (2,911 | ) | — | — | (2,911 | ) | ||||||||||
Land cost of sales | — | (2,370 | ) | (21 | ) | — | (6,769 | ) | (9,160 | ) | ||||||||
Military housing | — | — | (3,695 | ) | — | — | (3,695 | ) | ||||||||||
Subsidized senior housing | — | — | 17 | — | — | 17 | ||||||||||||
REIT conversion and reorganization costs | 15,983 | — | — | — | — | 15,983 | ||||||||||||
Development, management, corporate and other expenses | 4,084 | (11,026 | ) | 5,284 | — | (305 | ) | (1,963 | ) | |||||||||
Operating expenses for the six months ended June 30, 2015 | $ | 41,687 | $ | 193,144 | $ | 120,500 | $ | 20,952 | $ | 11,309 | $ | 387,592 | ||||||
Corporate Activities | Commercial Group | Residential Group | Arena | Land Development Group | Total | |||||||||||||
Interest expense for the six months ended June 30, 2014 | $ | 18,837 | $ | 110,759 | $ | 29,710 | $ | 9,456 | $ | (90 | ) | $ | 168,672 | |||||
Increase (decrease) due to: | ||||||||||||||||||
Comparable portfolio | — | (5,882 | ) | (1,094 | ) | — | — | (6,976 | ) | |||||||||
Non-comparable properties (1) | — | 166 | 3,925 | 129 | — | 4,220 | ||||||||||||
Properties in which partners' interest recently acquired | — | 476 | (26 | ) | — | — | 450 | |||||||||||
Recently disposed properties | — | (7,533 | ) | (1,694 | ) | — | — | (9,227 | ) | |||||||||
Properties in which partial interest was recently disposed | — | (4,198 | ) | — | — | (4,198 | ) | |||||||||||
Capitalized interest | — | (3,688 | ) | (4,556 | ) | — | 178 | (8,066 | ) | |||||||||
Mark-to-market adjustments on non-designated swaps | (44 | ) | (82 | ) | (4,218 | ) | — | (662 | ) | (5,006 | ) | |||||||
Corporate borrowings | (4,611 | ) | — | — | — | — | (4,611 | ) | ||||||||||
Other | — | 298 | 614 | — | 18 | 930 | ||||||||||||
Interest expense for the six months ended June 30, 2015 | $ | 14,182 | $ | 94,514 | $ | 18,463 | $ | 9,585 | $ | (556 | ) | $ | 136,188 | |||||
29
Forest City Enterprises, Inc. and Subsidiaries
Supplemental Operating Information
(1) | The following table presents the increases (decreases) in revenues, operating expenses and interest expense for Commercial and Residential properties in lease-up and other non-comparable properties: |
Six Months Ended June 30, 2015 vs. 2014 | ||||||||||
Property | Quarter Opened | Revenues | Operating Expenses | Interest Expense | ||||||
Commercial: | ||||||||||
Property in lease-up: | ||||||||||
The Yards - Lumbershed | Q3-13 | $ | 63 | $ | 4 | $ | 39 | |||
Non-comparable property: | ||||||||||
Ballston Common | (41 | ) | (466 | ) | 127 | |||||
Total Commercial | $ | 22 | $ | (462 | ) | $ | 166 | |||
Residential: | ||||||||||
Properties in lease-up: | ||||||||||
1111 Stratford | Q3-13/Q1-14 | $ | 767 | $ | (129 | ) | $ | — | ||
2175 Market Street | Q4-14 | 320 | 91 | 65 | ||||||
3700M | Q3-14 | 607 | 451 | 265 | ||||||
Aster Conservatory Green | Q3-13/14 | 1,793 | 306 | 570 | ||||||
Radian | Q2-14 | 1,601 | 505 | 788 | ||||||
The Continental | Q1-13 | 197 | (65 | ) | 6 | |||||
The Yards - Twelve12 | Q2-14 | 3,730 | 1,588 | 1,044 | ||||||
Winchester Lofts | Q4-14 | 249 | 592 | 799 | ||||||
Non-comparable properties: | ||||||||||
Heritage | 1,950 | 425 | (139 | ) | ||||||
500 Sterling Place | 1,195 | 725 | 527 | |||||||
Total Residential | $ | 12,409 | $ | 4,489 | $ | 3,925 | ||||
Commercial Group - Year-to-Date Comparison
The increases in revenues, operating expenses and interest expense related to partners’ interest recently acquired are related to Boulevard Mall (Q4-2014), a regional mall located in Amherst, New York, and seven life science office properties and two parking facilities at University Park at MIT, a mixed-use life science office campus in Cambridge, Massachusetts. The decreases in revenues, operating expenses and interest expense related to recent disposals are due to our ongoing strategy to sell operating assets in non-core markets. The decrease in interest expense for the comparable portfolio is primarily due to the paydown of nonrecourse mortgage notes for One MetroTech Center, Harlem Office, Ballston Common Office Center and Skylight Office Tower.
Ballston Common, a regional mall in Arlington, Virginia, is classified as a non-comparable property due to its upcoming planned renovation project.
Residential Group - Year-to-Date Comparison
The increases in revenues and operating expenses related to partners’ interest recently acquired are related to three operating apartment communities located in Northeast Ohio. The decreases in revenues, operating expenses and interest expense related to recent disposals are due to our ongoing strategy to sell operating assets in non-core markets. The decreases in revenues, operating expenses and interest expense related to partial interest recently disposed are related to the contribution of two operating apartment communities into our strategic capital partnership with Arizona State Retirement System in the prior year.
Heritage is classified as a non-comparable property due to its recently completed renovation project resulting in a significant number of units being off-line.
500 Sterling Place, an apartment community in Brooklyn, New York, was acquired (Q1-2015) and is classified as a non-comparable property.
Corporate Activities - Year-to-Date Comparison
The increase in operating expenses is primarily due to a recovery of a $3,200,000 legal settlement in 2014 which did not recur in 2015. The decrease in interest expense is due to the privately negotiated exchanges of a portion of our Senior Notes due 2016, 2018 and 2020 for Class A common stock in the first quarter of 2015.
30
Forest City Enterprises, Inc. and Subsidiaries
Supplemental Operating Information
Net Earnings (Loss) Attributable to Forest City Enterprises, Inc. - Quarterly Comparison
Net earnings attributable to Forest City Enterprises, Inc. for the three months ended June 30, 2015 was $303,756,000 versus net loss of $(92,992,000) for the three months ended June 30, 2014. Although we have substantial recurring revenue sources, significant transactions often create substantial variances in operating results between periods. The variance to the prior year period is primarily attributable to the following fluctuations, which are pre-tax, include unconsolidated investment activity and are net of noncontrolling interests:
Asset Dispositions - $15,155,000
• | $16,211,000 related to the net loss on partial disposition of our interest in Pacific Park Brooklyn, a 22 acre mixed-use project in Brooklyn, New York, related to the formation of a new joint venture with Greenland in 2014; |
• | $(2,974,000) related to a combined fluctuation in revenues, operating expenses and interest expense at properties in which we disposed of our full or partial interest during 2015 and 2014; and |
• | $1,918,000 related to increased gains on disposition of full or partial interest in rental properties and unconsolidated investments in 2015 compared to 2014. |
Financing Transactions - $6,782,000
• | $4,414,000 related to a decrease in interest expense in 2015 compared with 2014 due to increased capitalized interest on projects under construction and development as we increased our construction pipeline; |
• | $3,501,000 related to a decrease in interest expense on corporate debt due to separate, privately negotiated exchange transactions involving certain Senior Notes due 2016, 2018 and 2020 during February and March 2015; |
• | $(2,384,000) related to increased losses on extinguishment of debt in 2015 compared to 2014; and |
• | $1,251,000 related to the change in fair market value of certain derivatives not qualifying for hedge accounting between the comparable periods, which was marked to market through interest expense. |
Non-Cash Transactions - $602,477,000
• | $487,684,000 related to gains on change in control of interest from the June 2015 acquisition of our partner’s 49% equity ownership interest in the MIT Assets, and the April 2015 acquisition of our partner’s 50% equity ownership interest in three operating apartment communities (Cherry Tree, Chestnut Lake and Stratford Crossing); |
• | $129,829,000 related to decreased impairment of real estate in 2015 compared to 2014; and |
• | $(15,036,000) related to increased write-offs of abandoned development projects in 2015 compared to 2014. |
Operations - $2,270,000
• | $(9,771,000) related to REIT conversion and reorganization costs incurred in 2015; |
• | $7,355,000 related to a combined fluctuation in revenues, operating expenses and interest expense in our comparable portfolio in 2015 compared with 2014; |
• | $2,607,000 related to a combined fluctuation in revenues, operating expenses and interest expense in properties in which we recently acquired our partners’ interest; |
• | $2,454,000 related to a combined fluctuation in revenues and operating expenses in our Military Housing business unit in 2015 compared with 2014; |
• | $(2,302,000) in interest and other income primarily related to decreases in the income recognition on the allocation of state and federal historic preservation, low income housing and new market tax credits in 2015 compared with 2014; and |
• | $1,927,000 related to a combined fluctuation in revenues, operating expenses and interest expense at properties in lease-up at June 30, 2015. |
Income Taxes
• | $(227,739,000) due to increased income tax expense attributable to both continuing and discontinued operations primarily related to the fluctuations in pre-tax earnings. These fluctuations are primarily due to the various transactions discussed herein. |
31
Forest City Enterprises, Inc. and Subsidiaries
Supplemental Operating Information
Net Earnings (Loss) Attributable to Forest City Enterprises, Inc. - Year-to-Date Comparison
Net earnings attributable to Forest City Enterprises, Inc. for the six months ended June 30, 2015 was $249,547,000 versus net loss of $(77,472,000) for the six months ended June 30, 2014. The variance to the prior year period is primarily attributable to the following fluctuations, which are pre-tax, include unconsolidated investment activity and are net of noncontrolling interests:
Asset Dispositions - $(37,437,000)
• | $(49,177,000) related to decreased gains on disposition of full or partial interest in rental properties and unconsolidated investments in 2015 compared to 2014; |
• | $16,211,000 related to the net loss on partial disposition of our interest in Pacific Park Brooklyn, related to the formation of a new joint venture with Greenland in 2014; |
• | $(2,986,000) related to decreased Land Development Group sales in 2015 compared with 2014, primarily at our Stapleton project; and |
• | $(1,485,000) related to a combined fluctuation in revenues, operating expenses and interest expense at properties in which we disposed of our full or partial interest during 2015 and 2014. |
Financing Transactions - $(19,647,000)
• | $(37,330,000) related to increased losses on extinguishment of debt in February and March 2015 compared with 2014 primarily due to to separate, privately negotiated exchange transactions involving a portion of Senior Notes due 2016, 2018 and 2020; |
• | $8,066,000 related to a decrease in interest expense in 2015 compared with 2014 due to increased capitalized interest on projects under construction and development as we increased our construction pipeline; |
• | $5,006,000 related to the change in fair market value of certain derivatives not qualifying for hedge accounting between the comparable periods, which was marked to market through interest expense; and |
• | $4,611,000 related to a decrease in interest expense on corporate debt due to separate, privately negotiated exchange transactions involving certain Senior Notes due 2016, 2018 and 2020 in February and March 2015. |
Non-Cash Transactions - $594,786,000
• | $484,925,000 related to increased gains on change in control of interest in 2015 compared with 2014 activity primarily from the June 2015 acquisition of our partner’s 49% equity ownership interest in the MIT Assets, and the April 2015 acquisition of our partner’s 50% equity ownership interest in three operating apartment communities (Cherry Tree, Chestnut Lake and Stratford Crossing) offset by 2014 activity; |
• | $129,829,000 related to decreased impairment of real estate in 2015 compared to 2014; |
• | $(15,036,000) related to increased write-offs of abandoned development projects in 2015 compared to 2014; and |
• | $(4,932,000) related to an increase in depreciation and amortization expense in 2015 compared with 2014 primarily due to recently opened properties and the change from equity method of accounting to full consolidation method upon the acquisition of our partner's interest in the MIT Assets and three operating apartment communities in Q2 2015, and one apartment community and one regional mall in Q4 2014. These increases were partially offset by the disposition of full or partial interests in several properties during 2015 and 2014. |
Operations - $3,848,000
• | $17,676,000 related to a combined fluctuation in revenues, operating expenses and interest expense in our comparable portfolio in 2015 compared with 2014; |
• | $(15,983,000) related to REIT conversion and reorganization costs incurred in 2015; |
• | $(4,330,000) in interest and other income primarily related to income recognized by a legal settlement at Heritage in 2014, which did not recur in 2015, and decreases in the income recognition on the allocation of state and federal historic preservation, low income housing and new market tax credits in 2015 compared with 2014; |
• | $3,978,000 related to a combined fluctuation in revenues, operating expenses and interest expense in properties in which we recently acquired our partners’ interest; |
• | $2,408,000 related to a combined fluctuation in revenues, operating expenses and interest expense at properties in lease-up at June 30, 2015; |
• | $2,229,000 related to a combined fluctuation in revenues and operating expenses in our Military Housing business unit in 2015 compared with 2014; and |
32
Forest City Enterprises, Inc. and Subsidiaries
Supplemental Operating Information
• | $(2,130,000) related to a combined fluctuation in revenues, operating expenses and interest expense at Barclays Center in 2015 compared with 2014. |
Income Taxes
• | $(213,979,000) due to increased income tax expense attributable to both continuing and discontinued operations primarily related to the fluctuations in pre-tax earnings, including gains included in discontinued operations. These fluctuations are primarily due to the various transactions discussed herein. |
Capital Expenditures for our Operating Portfolio – Our diversified real estate portfolio requires capital expenditures, including tenant improvements, to maintain and improve its operating performance. The following table represents our capital expenditures by segment:
Six Months Ended June 30, 2015 | Six Months Ended June 30, 2014 | ||||||||||||
Full Consolidation (GAAP) | Pro-Rata Consolidation (Non-GAAP) | Full Consolidation (GAAP) | Pro-Rata Consolidation (Non-GAAP) | ||||||||||
(in thousands) | |||||||||||||
Operating properties: | |||||||||||||
Commercial Group | $ | 13,272 | $ | 23,294 | $ | 9,415 | $ | 18,730 | |||||
Residential Group | 6,009 | 10,448 | 6,576 | 11,454 | |||||||||
Arena | 2,314 | 787 | 1,390 | 473 | |||||||||
Other | 22 | 22 | 31 | 31 | |||||||||
Total operating properties | 21,617 | 34,551 | 17,412 | 30,688 | |||||||||
Tenant improvements | |||||||||||||
Commercial Group | 20,867 | 24,824 | 6,475 | 11,652 | |||||||||
Total capital expenditures | $ | 42,484 | $ | 59,375 | $ | 23,887 | $ | 42,340 | |||||
33
(THIS PAGE INTENTIONALLY LEFT BLANK)
34
Forest City Enterprises, Inc. and Subsidiaries
Supplemental Operating Information
Reconciliation of Net Earnings (Loss) to FFO
The table below reconciles net earnings (loss), the most comparable GAAP measure, to FFO, a non-GAAP measure.
Three Months Ended June 30, | Six Months Ended June 30, | ||||||||||||
2015 | 2014 | 2015 | 2014 | ||||||||||
(in thousands) | |||||||||||||
Net earnings (loss) attributable to Forest City Enterprises, Inc. | $ | 303,756 | $ | (92,992 | ) | $ | 249,547 | $ | (77,472 | ) | |||
Depreciation and Amortization—Real Estate Groups | 76,714 | 75,661 | 151,494 | 146,667 | |||||||||
Gain on disposition of full or partial interests in rental properties | (19,284 | ) | (17,366 | ) | (19,284 | ) | (68,461 | ) | |||||
Impairment of depreciable rental properties | — | 129,059 | — | 129,059 | |||||||||
Income tax expense (benefit) adjustment — current and deferred (1): | |||||||||||||
Gain on disposition of full or partial interests in rental properties | 7,461 | 8,820 | 7,461 | 28,718 | |||||||||
Impairment of depreciable rental properties | — | (50,053 | ) | — | (50,053 | ) | |||||||
FFO attributable to Forest City Enterprises, Inc. | $ | 368,647 | $ | 53,129 | $ | 389,218 | $ | 108,458 | |||||
FFO Per Share - Diluted | |||||||||||||
Numerator (in thousands): | |||||||||||||
FFO attributable to Forest City Enterprises, Inc. | $ | 368,647 | $ | 53,129 | $ | 389,218 | $ | 108,458 | |||||
If-Converted Method (adjustments for interest, net of tax): | |||||||||||||
5.000% Notes due 2016 | 73 | 382 | 383 | 765 | |||||||||
4.250% Notes due 2018 | 1,495 | 2,277 | 3,529 | 4,554 | |||||||||
3.625% Notes due 2020 | 953 | 1,664 | 2,396 | 3,328 | |||||||||
FFO for per share data | $ | 371,168 | $ | 57,452 | $ | 395,526 | $ | 117,105 | |||||
Denominator: | |||||||||||||
Weighted average shares outstanding—Basic | 233,377,771 | 198,341,355 | 218,254,445 | 198,041,879 | |||||||||
Effect of stock options, restricted stock and performance shares | 3,160,648 | 1,540,864 | 2,964,450 | 1,733,435 | |||||||||
Effect of convertible debt | 18,389,062 | 32,138,215 | 23,211,264 | 32,138,215 | |||||||||
Effect of convertible Class A Common Units | 2,973,190 | 3,461,710 | 2,973,190 | 3,553,721 | |||||||||
Weighted average shares outstanding - Diluted | 257,900,671 | 235,482,144 | 247,403,349 | 235,467,250 | |||||||||
FFO Per Share | $ | 1.44 | $ | 0.24 | $ | 1.60 | $ | 0.50 | |||||
(1) | The following table provides detail of income tax expense (benefit): |
Three Months Ended June 30, | Six Months Ended June 30, | ||||||||||||
2015 | 2014 | 2015 | 2014 | ||||||||||
(in thousands) | |||||||||||||
Income tax expense (benefit) on FFO | |||||||||||||
Operating Earnings: | |||||||||||||
Current taxes | $ | 2,386 | $ | (15,215 | ) | $ | 642 | $ | (6,582 | ) | |||
Deferred taxes | 172,383 | 10,939 | 174,942 | (3,017 | ) | ||||||||
Total income tax expense (benefit) on FFO | 174,769 | (4,276 | ) | 175,584 | (9,599 | ) | |||||||
Income tax expense (benefit) on non-FFO | |||||||||||||
Disposition of full or partial interests in rental properties: | |||||||||||||
Current taxes | $ | 2,882 | $ | (13,292 | ) | $ | 2,882 | $ | 15,756 | ||||
Deferred taxes | 4,579 | 22,112 | 4,579 | 12,962 | |||||||||
Disposition of full or partial interests in rental properties | 7,461 | 8,820 | 7,461 | 28,718 | |||||||||
Impairment of depreciable rental properties | |||||||||||||
Deferred taxes | $ | — | $ | (50,053 | ) | $ | — | $ | (50,053 | ) | |||
Total income tax expense (benefit) on non-FFO | 7,461 | (41,233 | ) | 7,461 | (21,335 | ) | |||||||
Grand Total | $ | 182,230 | $ | (45,509 | ) | $ | 183,045 | $ | (30,934 | ) | |||
35
Forest City Enterprises, Inc. and Subsidiaries
Supplemental Operating Information
Reconciliation of FFO to Operating FFO - Pro-Rata Consolidation
Three Months Ended June 30, | Six Months Ended June 30, | ||||||||||||||
2015 | 2014 | % Change | 2015 | 2014 | % Change | ||||||||||
(in thousands) | (in thousands) | ||||||||||||||
FFO attributable to Forest City Enterprises, Inc. | $ | 368,647 | $ | 53,129 | $ | 389,218 | $ | 108,458 | |||||||
Impairment of non-depreciable real estate | — | 770 | — | 770 | |||||||||||
Write-offs of abandoned development projects and demolition costs | 15,969 | 933 | 15,969 | 933 | |||||||||||
Tax credit income | (3,957 | ) | (5,480 | ) | (7,212 | ) | (9,427 | ) | |||||||
Loss on extinguishment of debt | 3,573 | 1,189 | 38,952 | 1,622 | |||||||||||
Change in fair market value of nondesignated hedges | (2,979 | ) | (1,681 | ) | (5,092 | ) | 2,991 | ||||||||
Net gain on change in control of interests | (487,684 | ) | — | (487,684 | ) | (2,759 | ) | ||||||||
Straight-line rent adjustments | (307 | ) | (841 | ) | (360 | ) | (3,375 | ) | |||||||
Participation payments | — | — | — | 1,469 | |||||||||||
Net loss on disposition of partial interest in development project | — | 16,211 | — | 16,211 | |||||||||||
REIT conversion and reorganization costs | 9,771 | — | 15,983 | — | |||||||||||
Nets Pre-tax FFO | 791 | 261 | 1,593 | 1,414 | |||||||||||
Income tax expense (benefit) on FFO | 174,769 | (4,276 | ) | 175,584 | (9,599 | ) | |||||||||
Operating FFO attributable to Forest City Enterprises, Inc. | $ | 78,593 | $ | 60,215 | 30.5% | $ | 136,951 | $ | 108,708 | 26.0% | |||||
Operating FFO Per Share - Diluted | |||||||||||||||
Numerator (in thousands): | |||||||||||||||
Operating FFO attributable to Forest City Enterprises, Inc. | $ | 78,593 | $ | 60,215 | $ | 136,951 | $ | 108,708 | |||||||
If-Converted Method (adjustments for interest, pre-tax): | |||||||||||||||
5.000% Notes due 2016 | 119 | 625 | 626 | 1,250 | |||||||||||
4.250% Notes due 2018 | 2,443 | 3,719 | 5,765 | 7,438 | |||||||||||
3.625% Notes due 2020 | 1,557 | 2,719 | 3,914 | 5,438 | |||||||||||
Operating FFO for per share data | $ | 82,712 | $ | 67,278 | $ | 147,256 | $ | 122,834 | |||||||
Denominator: | |||||||||||||||
Weighted average shares outstanding - Diluted | 257,900,671 | 235,482,144 | 247,403,349 | 235,467,250 | |||||||||||
Operating FFO Per Share | $ | 0.32 | $ | 0.29 | $ | 0.60 | $ | 0.52 | |||||||
Three Months Ended June 30, | Six Months Ended June 30, | ||||||||||||||
2015 | 2014 | 2015 | 2014 | ||||||||||||
(in thousands) | (in thousands) | ||||||||||||||
Operating FFO by segment: | |||||||||||||||
Commercial Group | $ | 49,430 | $ | 37,834 | $ | 94,112 | $ | 69,109 | |||||||
Residential Group | 35,240 | 30,190 | 60,990 | 55,683 | |||||||||||
Arena | 72 | 108 | 68 | 1,757 | |||||||||||
Land Group | 12,726 | 12,305 | 22,978 | 23,931 | |||||||||||
Corporate Group | (18,875 | ) | (20,222 | ) | (41,197 | ) | (41,772 | ) | |||||||
Operating FFO | $ | 78,593 | $ | 60,215 | $ | 136,951 | $ | 108,708 | |||||||
36
Forest City Enterprises, Inc. and Subsidiaries
Supplemental Operating Information
Reconciliation of Net Earnings (Loss) to EBITDA - Pro-Rata Consolidation
Three Months Ended June 30, | Six Months Ended June 30, | ||||||||||||
2015 | 2014 | 2015 | 2014 | ||||||||||
(in thousands) | |||||||||||||
Net earnings (loss) attributable to Forest City Enterprises, Inc. | $ | 303,756 | $ | (92,992 | ) | $ | 249,547 | $ | (77,472 | ) | |||
Depreciation and amortization | 77,944 | 76,751 | 153,866 | 148,934 | |||||||||
Interest expense | 65,671 | 79,265 | 136,188 | 168,672 | |||||||||
Amortization of mortgage procurement costs | 2,608 | 2,469 | 5,407 | 5,273 | |||||||||
Income tax expense (benefit) | 182,230 | (45,509 | ) | 183,045 | (30,934 | ) | |||||||
EBITDA attributable to Forest City Enterprises, Inc | $ | 632,209 | $ | 19,984 | $ | 728,053 | $ | 214,473 | |||||
Impairment of real estate | — | 129,829 | — | 129,829 | |||||||||
Net loss on extinguishment of debt | 3,573 | 1,189 | 38,952 | 1,622 | |||||||||
Net loss on disposition of partial interest in development project | — | 16,211 | — | 16,211 | |||||||||
Net gain on disposition of full or partial interests in rental properties | (19,284 | ) | (17,366 | ) | (19,284 | ) | (68,461 | ) | |||||
Net gain on change in control of interests | (487,684 | ) | — | (487,684 | ) | (2,759 | ) | ||||||
Adjusted EBITDA attributable to Forest City Enterprises, Inc. | $ | 128,814 | $ | 149,847 | $ | 260,037 | $ | 290,915 | |||||
As of June 30, | As of June 30, | ||||||||||||
2015 | 2014 | 2015 | 2014 | ||||||||||
(in thousands) | |||||||||||||
Total mortgage debt and notes payable, nonrecourse | $ | 6,020,920 | $ | 6,013,635 | $ | 6,020,920 | $ | 6,013,635 | |||||
Revolving credit facility | — | 308,000 | — | 308,000 | |||||||||
Convertible senior debt | 411,194 | 700,000 | 411,194 | 700,000 | |||||||||
Total debt | $ | 6,432,114 | $ | 7,021,635 | $ | 6,432,114 | $ | 7,021,635 | |||||
Less cash and equivalents | (330,576 | ) | (490,792 | ) | (330,576 | ) | (490,792 | ) | |||||
Net Debt | $ | 6,101,538 | $ | 6,530,843 | $ | 6,101,538 | $ | 6,530,843 | |||||
Net Debt to Adjusted EBITDA (Annualized) (1) (2) | 11.8 | x | 10.9 | x | 11.7 | x | 11.2 | x | |||||
(1) | Due to the June 2015 acquisition of our partner’s 49% equity ownership interest in the MIT Assets, the June 30, 2015 Net Debt includes approximately $178,000 of debt without the benefit of additional EBITDA expected to be generated by our additional ownership interests. Absent this debt, the Net Debt to Adjusted EBITDA for the three and six months ended June 30, 2015 would have been 11.5x and 11.4x, respectively. |
(2) | Adjusted EBITDA for the three and six months ended June 30, 2015 includes write-offs of abandoned development projects of $15,969. Absent this annualized expense, along with the adjustment described in (1) above, the Net Debt to Adjusted EBITDA for the three and six months ended June 30, 2015 would have been 10.2x and 10.7x, respectively. |
37
(THIS PAGE INTENTIONALLY LEFT BLANK)
38
Forest City Enterprises, Inc. and Subsidiaries
Supplemental Operating Information
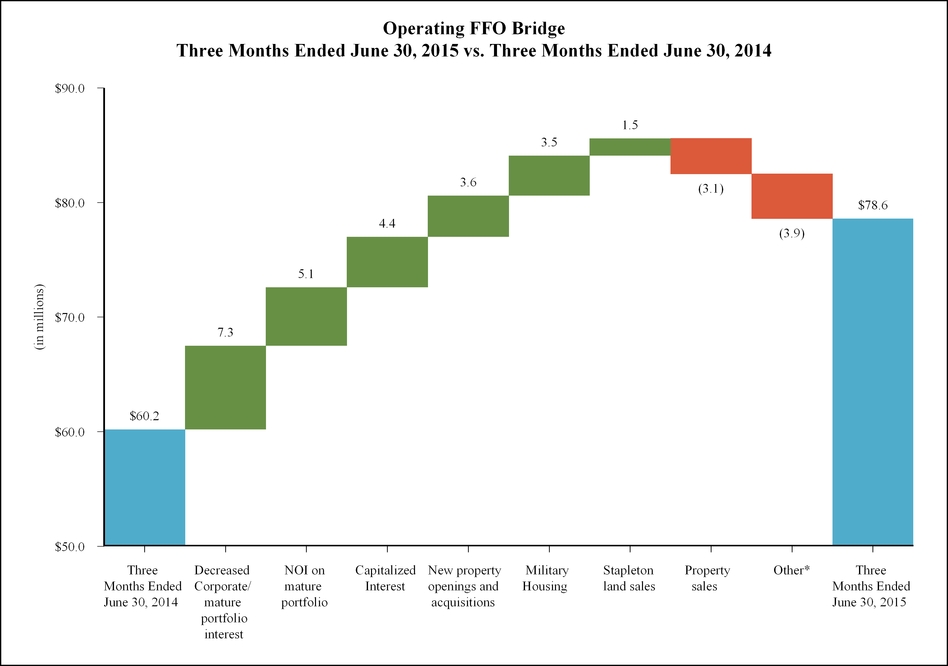
* Other is primarily related to a recovery of a $3.2 million legal settlement in 2014 which did not recur in 2015.
39
Forest City Enterprises, Inc. and Subsidiaries
Supplemental Operating Information
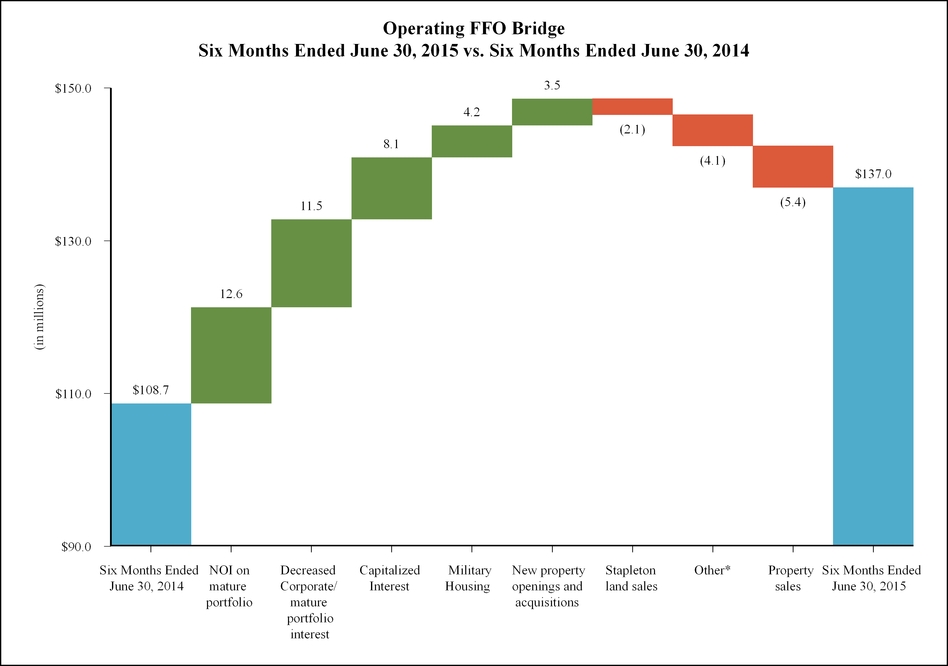
* Other is primarily related to a recovery of a $3.2 million legal settlement in 2014 which did not recur in 2015.
40
Forest City Enterprises, Inc. and Subsidiaries
Supplemental Operating Information
Historical Trends
Through the implementation of our strategic plan, we approach our business by:
• | Focusing on core markets and products as we develop, own and operate a high-quality portfolio |
• | Driving operational excellence through all aspects of our company |
• | Building a strong, sustaining capital structure, improved balance sheet and debt metrics |
The tables below illustrate our progress as we continue to implement our strategic plan. The financial and operating data presented is as reported in previous year-end supplemental packages. GAAP reconciliations for previous years can be found in prior supplemental packages furnished with the Securities and Exchange Commission ("SEC") and are available on our website at www.forestcity.net.
Development ratio is calculated in accordance with our financial covenants contained in our revolving credit facility. Total debt includes outstanding borrowings on our revolving credit facility, convertible senior debt, nonrecourse mortgages and notes payable. Net debt to Adjusted EBITDA is defined as total debt, less cash and equivalents, divided by Adjusted EBITDA. All metrics are reflected at our pro-rata share.
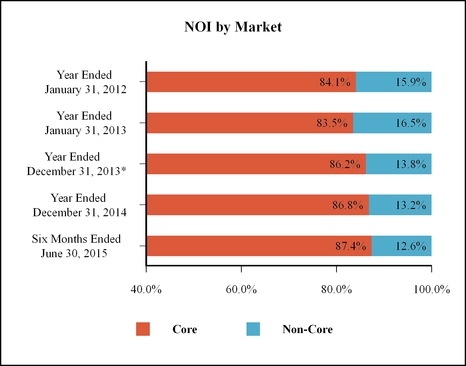
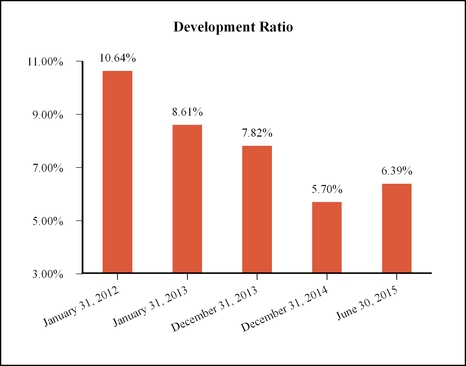
41
Forest City Enterprises, Inc. and Subsidiaries
Supplemental Operating Information
Historical Trends (continued)
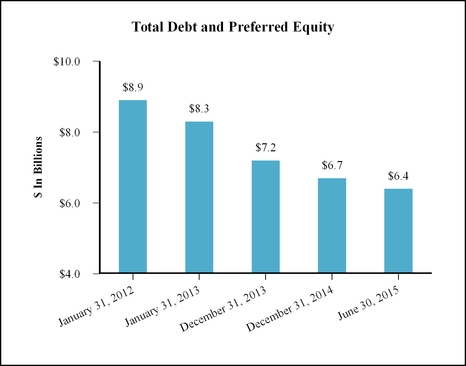
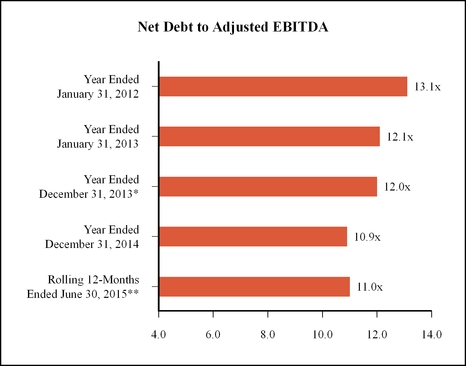
* | Represents data for the year ended December 31, 2013, which is consistent with our new calendar year-end. As such, data for the year ended December 31, 2013 includes results for the month ended January 31, 2013, which has previously been included in the financial results for the year ended January 31, 2013 included in our supplemental package furnished with the SEC on March 27, 2013. |
** | Due to the June 2015 acquisition of our partner’s 49% equity ownership interest in the MIT Assets, the June 30, 2015 Net Debt includes approximately $178,000,000 of debt without the benefit of additional EBITDA expected to be generated by our additional ownership interests. Absent this debt, the Net Debt to Adjusted EBITDA for the rolling 12-months ended June 30, 2015 would have been 10.7x. |
** | Adjusted EBITDA for the rolling 12-months ended June 30, 2015 includes write-offs of abandoned development projects of $16,691,000. Absent this expense, along with the adjustment described above, the Net Debt to Adjusted EBITDA for the rolling 12-months ended June 30, 2015 would have been 10.4x. |
42
Forest City Enterprises, Inc. and Subsidiaries
Supplemental Operating Information
Development Pipeline
Property Acquisition/Expansion Opening and Projects Under Construction
June 30, 2015
Location | Date Acquired/ Anticipated Opening | FCE Legal Ownership % (a) | Pro-Rata FCE % (a) (1) | Total Cost at 100% (2) | Cost at Full Consolidation (GAAP) (b) | Cost at FCE Pro-Rata Share (Non-GAAP) (c) (1) X (2) | Sq. ft./ No. of Units | Gross Leasable Area | Lease Commitment % (d) | ||||||||||||||||
(in millions) | |||||||||||||||||||||||||
2015 Property Acquisition | |||||||||||||||||||||||||
Residential: | |||||||||||||||||||||||||
500 Sterling Place | Brooklyn, NY | Q1-15 | 100 | % | 100 | % | $ | 48.1 | $ | 48.1 | $ | 48.1 | 77 | — | 91% | ||||||||||
2015 Property Expansion Opening | |||||||||||||||||||||||||
Retail: | |||||||||||||||||||||||||
Galleria at Sunset | Henderson, NV | Q2-15 | 51 | % | (e) | 51 | % | $ | 24.7 | $ | 0.0 | $ | 12.6 | 32,000 | 32,000 | 84% | |||||||||
Projects Under Construction | |||||||||||||||||||||||||
Residential: | |||||||||||||||||||||||||
Arizona State Retirement System Joint Venture: | |||||||||||||||||||||||||
The Yards - Arris | Washington, D.C. | Q1-16 | 25 | % | 25 | % | $ | 145.1 | $ | 145.1 | $ | 36.3 | 327 | 19,000 | |||||||||||
Blossom Plaza | Los Angeles, CA | Q2-16 | 25 | % | 25 | % | 104.9 | 104.9 | 26.2 | 237 | 19,000 | ||||||||||||||
Eliot on 4th (1001 4th Street, SW) | Washington, D.C. | Q4-16 | 25 | % | 25 | % | 143.0 | 143.0 | 35.8 | 365 | 5,000 | ||||||||||||||
Museum Towers II | Philadelphia, PA | Q4-16 | 25 | % | 25 | % | 114.0 | 114.0 | 28.5 | 286 | — | ||||||||||||||
507.0 | 507.0 | 126.8 | 1,215 | 43,000 | |||||||||||||||||||||
Greenland Joint Venture: | |||||||||||||||||||||||||
535 Carlton | Brooklyn, NY | Q4-16/17 | 30 | % | (e) | 30 | % | 164.6 | 0.0 | 49.4 | 298 | — | |||||||||||||
550 Vanderbilt (condominiums) | Brooklyn, NY | Q1-17/18 | 30 | % | (e) | 30 | % | 361.6 | 0.0 | 108.5 | 278 | 7,000 | |||||||||||||
38 Sixth Ave | Brooklyn, NY | Q2-17/18 | 30 | % | (e) | 30 | % | 202.7 | 0.0 | 60.8 | 303 | 28,000 | |||||||||||||
Pacific Park - Parking (f) | Brooklyn, NY | Q3-16/18 | 30 | % | (e) | 30 | % | 99.6 | 0.0 | 29.9 | — | — | |||||||||||||
828.5 | 0.0 | 248.6 | 879 | 35,000 | |||||||||||||||||||||
Aster Town Center II | Denver, CO | Q3/Q4-15 | 90 | % | 90 | % | 23.4 | 23.4 | 21.1 | 135 | — | ||||||||||||||
The Lofts at Capitol Quarter | Washington, D.C. | Q4-15/Q1-16 | 25 | % | (e) | 25 | % | 53.8 | 0.0 | 13.5 | 195 | — | |||||||||||||
B2 BKLYN | Brooklyn, NY | Q3-16 | 100 | % | 100 | % | 162.1 | 162.1 | 162.1 | 363 | 4,000 | ||||||||||||||
$ | 1,574.8 | $ | 692.5 | $ | 572.1 | 2,787 | 82,000 | ||||||||||||||||||
Office: | |||||||||||||||||||||||||
300 Massachusetts Ave | Cambridge, MA | Q1-16 | 50 | % | (e) | 50 | % | $ | 175.0 | $ | 0.0 | $ | 87.5 | 246,000 | 246,000 | 96% | |||||||||
1812 Ashland Ave | Baltimore, MD | Q3-16 | 85 | % | 100 | % | 60.7 | 60.7 | 60.7 | 164,000 | 164,000 | 70% | |||||||||||||
The Bridge at Cornell Tech | Roosevelt Island, NY | Q2-17 | 100 | % | 100 | % | 164.1 | 164.1 | 164.1 | 235,000 | 235,000 | 39% | |||||||||||||
$ | 399.8 | $ | 224.8 | $ | 312.3 | 645,000 | 645,000 | ||||||||||||||||||
Retail Expansion: | |||||||||||||||||||||||||
Boulevard Mall | Buffalo, NY | Q4-15 | 100 | % | 100 | % | 10.9 | 10.9 | 10.9 | 46,000 | 46,000 | 100% | |||||||||||||
Total Projects Under Construction | $ | 1,985.5 | $ | 928.2 | $ | 895.3 | |||||||||||||||||||
Estimated Initial Yield on Cost | 5.5% - 6.0% | (g) | |||||||||||||||||||||||
Other | |||||||||||||||||||||||||
Kapolei Lofts | Kapolei, HI | Q3-15/Q1-17 | 100 | % | 0 | % | (h) | $ | 154.8 | $ | 154.8 | $ | 0.0 | 499 | — | ||||||||||
See footnotes on the following page.
43
Forest City Enterprises, Inc. and Subsidiaries
Supplemental Operating Information
FOOTNOTES
(a) | The Company invests in certain real estate projects through joint ventures and, at times, may provide funding at percentages that differ from the Company's legal ownership. |
(b) | Amounts represent estimated project costs to achieve stabilization and are presented on the full consolidation method of accounting, a GAAP measure. Under full consolidation, costs are reported as consolidated at 100% if we are deemed to have control or to be the primary beneficiary of our investments in the Company's VIE. Upon completion, our completed rental properties recorded on the consolidated balance sheet may include costs, in addition to costs above, not allocated to our partners, such as corporate capitalized interest. |
(c) | Project cost at pro-rata share represents the Company's share of project cost, based on the Company's pro-rata ownership of each property (a non-GAAP measure). Under the pro-rata consolidation method of accounting, the Company determines its pro-rata share by multiplying its pro-rata ownership by the total project cost of the applicable property. |
(d) | Lease commitments as of July 28, 2015. |
(e) | Reported under the equity method of accounting. This method represents a GAAP measure for investments in which the Company is not deemed to have control or to be the primary beneficiary of our investments in a VIE. |
(f) | Expected to include 950 parking spaces. |
(g) | Range of estimated initial yield on cost is calculated using estimated pro-rata initial stabilized NOI divided by FCE pro-rata share of project cost per above, net of anticipated subsidies and other cost adjustments. 550 Vanderbilt (condominiums) has been excluded from estimated initial yield on cost. |
(h) | Kapolei Lofts is a residential project currently under construction on land leased by the Company. The land lessor is entitled to a preferred return that currently exceeds anticipated operating cash flow of the project, and therefore, this project is reflected at 0% for pro-rata purposes. In accordance with the waterfall provisions of the distribution Agreement, the Company expects to share in the net proceeds upon a sale of the project. |
44
Forest City Enterprises, Inc. and Subsidiaries
Supplemental Operating Information
Development Pipeline
Projects Under Development
June 30, 2015
Below is a summary of our active large scale development projects which are crucial to our long-term growth. While we cannot make any assurances on the timing or delivery of these projects, our track record speaks to our ability to bring large, complex projects to fruition when there is demand and available construction financing. The projects listed below represent pro-rata costs of $321.5 million ($138.6 million at full consolidation) of Projects Under Development on our balance sheet and pro-rata mortgage debt of $136.5 million ($10.6 million at full consolidation).
1) | Pacific Park Brooklyn - Brooklyn, NY |
Pacific Park Brooklyn, a 22-acre mixed-use project, is located adjacent to the state-of-the-art arena, Barclays Center. At full build-out, Pacific Park Brooklyn is expected to feature more than 6,400 units of housing, including 2,250 affordable units, approximately 250,000 square feet of retail space, and more than 8 acres of landscaped open space. Projects currently under construction include B2 BKLYN, a 50% market-rate and 50% affordable rental building with 363 residential units, 535 Carlton, a 100% affordable rental building with 298 residential units, 550 Vanderbilt, 278-unit condominium building, 38 Sixth Ave, a 303-unit, 100% affordable rental building and a parking garage which is expected to include 950 parking spaces.
2) | The Yards - Washington, D.C. |
The Yards is a 42-acre mixed-use project, located in the neighborhood of the Washington Nationals baseball park in the Capitol Riverfront District. At full build-out, the project is expected to include up to 2,800 residential units, 1.8 million square feet of office space and approximately 300,000 square feet of retail and dining space. The Yards features a 5.5-acre publicly funded public park that is a gathering place and recreational focus for the community. Current completed projects include a 170-unit residential building, Foundry Lofts; two retail centers: Boilermaker Shops and Lumber Shed, with 40,000 and 31,000 square feet, respectively; and Twelve12, a mixed-use property, with 218 residential units and 88,000 square feet of retail space. Arris, a mixed-use project, is currently under construction and is expected to feature 327 residential units and 19,000 square feet of retail space.
3) | The Science + Technology Park at Johns Hopkins - Baltimore, MD |
The Science + Technology Park at Johns Hopkins is a 31-acre center for collaborative research directly adjacent to the world-renowned Johns Hopkins medical and research complex. Plans call for 1.1 million square feet in five buildings, with future phases able to support additional expansion. Current completed projects include the 279,000 square-foot 855 North Wolfe Street, a 492,000 square-foot parking garage for Johns Hopkins and a 234,000 square-foot commercial building developed on a fee basis which is fully leased by the Department of Health & Mental Hygiene. Currently under construction is a 164,000 square-foot office building, 1812 Ashland Ave.
4) Waterfront Station - Washington, D.C.
Located in Southwest Washington, D.C., Waterfront Station is adjacent to the Waterfront/Southeastern University MetroRail station. Waterfront Station is expected to include 660,000 square feet of office space, 365 residential units and 40,000 square feet of retail stores and restaurants. Currently under construction is a 365-unit residential building, Eliot on 4th.
5) Pier 70 - San Francisco, CA
Pier 70 is a former shipyard on San Francisco's eastern waterfront. The Forest City master development area of 28 acres is a mixed-use project, which is expected to include 3.2 million total square feet, consisting of 900,000 to 1.8 million square feet of office space, approximately 400,000 square feet of traditional retail, local production, and cultural/community uses, 1,000 to 2,000 residential units, approximately 2,000 parking spaces and 7 acres of waterfront parks.
6) 5M - San Francisco, CA
5M is a mixed-use project on approximately 4 acres in downtown San Francisco. 5M is expected to include approximately 800,000 square feet of commercial uses and 690 residential units. The project will retain two existing historic buildings as well as the iconic San Francisco Chronicle building and would create significant new open spaces for the neighborhood. The project is designed to house a dynamic ground-floor mix featuring local retail and arts, cultural and community uses for a total of approximately 1.7 million square feet of development.
45
Forest City Enterprises, Inc. and Subsidiaries
Supplemental Operating Information
Development Pipeline
Land Inventory
Land inventory represents undeveloped land parcels we currently do not intend to hold for future vertical development. A summary of our land inventory follows:
June 30, 2015 | December 31, 2014 | |||||||||||
Full Consolidation (GAAP) | Pro-Rata Consolidation (Non-GAAP) | Full Consolidation (GAAP) | Pro-Rata Consolidation (Non-GAAP) | |||||||||
(in thousands) | ||||||||||||
Stapleton | $ | 48,273 | $ | 43,559 | $ | 51,604 | $ | 46,583 | ||||
Commercial outlots | 45,645 | 55,532 | 45,865 | 54,072 | ||||||||
Total Land Inventory (1) | $ | 93,918 | $ | 99,091 | $ | 97,469 | $ | 100,655 | ||||
(1) | A full reconciliation of pro-rata consolidation (non-GAAP) to their GAAP equivalents can be found in the Selected Financial Information section of this supplemental package. |
Stapleton
Stapleton represents one of the nation's largest urban redevelopments. At full build-out of 4,700 acres or 7.5 square miles, Stapleton is planned for more than 12,000 homes and apartments, 3 million square feet of retail and 10 million square feet of office/research and development/industrial space. Located 10 minutes east of Downtown Denver and 20 minutes from Denver International Airport, Stapleton is expected to be home to 30,000 residents and 35,000 workers when complete. As of June 30, 2015, we own 223 gross acres, of which 93 acres are saleable. We also have an option to purchase an additional 846 gross acres at Stapleton.
Commercial Outlots
Commercial outlots are primarily undeveloped parcels of land adjacent to our retail assets throughout the United States. These parcels are sold to third party operators that benefit from being in close proximity to the existing retail asset. Typically, these outlots have zoning and entitlements consistent with our retail asset. Also included in commercial outlots is Las Vegas Land, a 13.5 acre parcel of undeveloped land located in downtown Las Vegas, NV adjacent to the City Hall.
46
(THIS PAGE INTENTIONALLY LEFT BLANK)
47
Forest City Enterprises, Inc. and Subsidiaries
Supplemental Financial Information
Common Stock Data (NYSE: FCE A and FCE B)
The following summarizes information related to the Company’s Class A and Class B common stock based on information reported by the New York Stock Exchange:
Quarter Ended | |||||||||||||||||||
June 30, 2015 | March 31, 2015 | December 31, 2014 | September 30, 2014 | June 30, 2014 | |||||||||||||||
Class A Common Stock | |||||||||||||||||||
Closing Price, end of period | $ | 22.10 | $ | 25.52 | $ | 21.30 | $ | 19.56 | $ | 19.87 | |||||||||
High Closing Price | $ | 25.73 | $ | 25.79 | $ | 21.67 | $ | 21.30 | $ | 20.09 | |||||||||
Low Closing Price | $ | 22.10 | $ | 21.00 | $ | 19.20 | $ | 19.17 | $ | 18.46 | |||||||||
Average Closing Price | $ | 23.68 | $ | 24.53 | $ | 20.79 | $ | 19.99 | $ | 19.10 | |||||||||
Total Volume | 102,548,636 | 69,096,438 | 70,389,527 | 47,200,607 | 40,112,884 | ||||||||||||||
Average Volume | 1,627,756 | 1,132,728 | 1,099,836 | 737,509 | 636,712 | ||||||||||||||
Common shares outstanding, end of period | 231,391,181 | 193,501,911 | 179,763,952 | 179,695,113 | 179,662,635 | ||||||||||||||
Class B Common Stock | |||||||||||||||||||
Closing Price, end of period | $ | 23.00 | $ | 25.50 | $ | 21.34 | $ | 19.83 | $ | 19.89 | |||||||||
High Closing Price | $ | 25.71 | $ | 25.75 | $ | 21.70 | $ | 21.30 | $ | 20.05 | |||||||||
Low Closing Price | $ | 22.50 | $ | 21.05 | $ | 19.24 | $ | 19.13 | $ | 18.48 | |||||||||
Average Closing Price | $ | 23.87 | $ | 24.63 | $ | 20.70 | $ | 20.03 | $ | 19.08 | |||||||||
Total Volume | 64,791 | 37,129 | 59,140 | 121,763 | 46,127 | ||||||||||||||
Average Volume | 1,028 | 609 | 924 | 1,903 | 732 | ||||||||||||||
Common shares outstanding, end of period | 18,891,153 | 18,942,503 | 19,208,517 | 19,220,506 | 19,227,650 | ||||||||||||||
Common Equity Market Capitalization | $ | 5,548,241,619 | $ | 5,421,202,595 | $ | 4,238,881,931 | $ | 3,895,979,044 | $ | 3,952,334,516 | |||||||||
Quarterly dividends declared per common share Class A and Class B | $ | — | $ | — | $ | — | $ | — | $ | — | |||||||||
Financial Covenants
The Company’s revolving credit facility contains certain restrictive financial covenants. A summary of the key financial covenants as defined in the agreement, all of which the Company is compliant with at June 30, 2015, follows:
Requirement Per Agreement | As of June 30, 2015 | As of March 31, 2015 | As of December 31, 2014 | As of September 30, 2014 | |||||||||||||||
(dollars in thousands) | |||||||||||||||||||
Credit Facility Financial Covenants | |||||||||||||||||||
Debt Service Coverage Ratio | 1.45x | 1.97 | x | 1.88 | x | 1.81 | x | 1.72 | x | ||||||||||
Debt Yield Ratio | >9.50% | 12.50 | % | 11.88 | % | 12.11 | % | 11.80 | % | ||||||||||
Cash Flow Coverage Ratio | 3.00x | 8.62 | x | 7.40 | x | 6.91 | x | 6.36 | x | ||||||||||
Total Development Ratio | <17% | 6.39 | % | 6.33 | % | 5.70 | % | 7.18 | % | ||||||||||
Minimum Consolidated Shareholders’ Equity, as defined | $ | 2,925,050 | $ | 5,242,324 | $ | 4,155,729 | $ | 3,848,400 | $ | 3,755,092 | |||||||||
48
Forest City Enterprises, Inc. and Subsidiaries
Supplemental Financial Information
Nonrecourse Debt Maturities Table (dollars in thousands)
As of June 30, 2015
Year Ending December 31, 2015 | Year Ending December 31, 2016 | ||||||||||||||||||||||||
Full Consolidation | Less Noncontrolling Interest | Plus Unconsolidated Investments at Pro-Rata | Pro-Rata Consolidation | Full Consolidation | Less Noncontrolling Interest | Plus Unconsolidated Investments at Pro-Rata | Pro-Rata Consolidation | ||||||||||||||||||
Fixed: | |||||||||||||||||||||||||
Fixed-rate debt | $ | 30,172 | $ | 1,629 | $ | 31,710 | $ | 60,253 | $ | 203,036 | $ | 46,400 | $ | 173,438 | $ | 330,074 | |||||||||
Weighted average rate | 6.08 | % | 8.18 | % | 5.72 | % | 5.84 | % | 7.86 | % | 10.75 | % | 5.72 | % | 6.33 | % | |||||||||
Variable: | |||||||||||||||||||||||||
Variable-rate debt | 37,841 | 4,123 | 9,660 | 43,378 | 73,819 | — | 2,257 | 76,076 | |||||||||||||||||
Weighted average rate | 3.04 | % | 2.93 | % | 3.65 | % | 3.19 | % | 2.33 | % | — | % | 3.39 | % | 2.36 | % | |||||||||
Tax-Exempt | 45,000 | — | 546 | 45,546 | — | — | — | — | |||||||||||||||||
Weighted average rate | 2.28 | % | — | % | 1.44 | % | 2.27 | % | — | % | — | % | — | % | — | % | |||||||||
Total variable-rate debt | 82,841 | 4,123 | 10,206 | 88,924 | 73,819 | — | 2,257 | 76,076 | |||||||||||||||||
Total Nonrecourse Debt | $ | 113,013 | $ | 5,752 | $ | 41,916 | $ | 149,177 | $ | 276,855 | $ | 46,400 | $ | 175,695 | $ | 406,150 | |||||||||
Weighted Average Rate | 3.55 | % | 4.42 | % | 5.19 | % | 3.98 | % | 6.39 | % | 10.75 | % | 5.69 | % | 5.59 | % | |||||||||
Year Ending December 31, 2017 | Year Ending December 31, 2018 | ||||||||||||||||||||||||
Full Consolidation | Less Noncontrolling Interest | Plus Unconsolidated Investments at Pro-Rata | Pro-Rata Consolidation | Full Consolidation | Less Noncontrolling Interest | Plus Unconsolidated Investments at Pro-Rata | Pro-Rata Consolidation | ||||||||||||||||||
Fixed: | |||||||||||||||||||||||||
Fixed-rate debt | $ | 267,196 | $ | 10,954 | $ | 358,553 | $ | 614,795 | $ | 208,108 | $ | 7,083 | $ | 248,988 | $ | 450,013 | |||||||||
Weighted average rate | 5.65 | % | 5.99 | % | 5.73 | % | 5.69 | % | 4.57 | % | 3.81 | % | 4.99 | % | 4.81 | % | |||||||||
Variable: | |||||||||||||||||||||||||
Variable-rate debt | 981,806 | 354 | 62,624 | 1,044,076 | 23,712 | — | 2,502 | 26,214 | |||||||||||||||||
Weighted average rate | 5.79 | % | 2.73 | % | 1.56 | % | 5.54 | % | 3.20 | % | — | % | 3.48 | % | 3.23 | % | |||||||||
Tax-Exempt | — | — | 25,234 | 25,234 | 95,798 | 13,247 | 53,040 | 135,591 | |||||||||||||||||
Weighted average rate | — | % | — | % | 0.97 | % | 0.97 | % | 1.22 | % | 1.98 | % | 2.07 | % | 1.48 | % | |||||||||
Total variable-rate debt | 981,806 | 354 | 87,858 | 1,069,310 | 119,510 | 13,247 | 55,542 | 161,805 | |||||||||||||||||
Total Nonrecourse Debt | $ | 1,249,002 | $ | 11,308 | $ | 446,411 | $ | 1,684,105 | $ | 327,618 | $ | 20,330 | $ | 304,530 | $ | 611,818 | |||||||||
Weighted Average Rate | 5.76 | % | 5.88 | % | 4.87 | % | 5.52 | % | 3.49 | % | 2.62 | % | 4.47 | % | 4.01 | % | |||||||||
49
Forest City Enterprises, Inc. and Subsidiaries
Supplemental Financial Information
Scheduled Maturities Table: Nonrecourse Debt (dollars in thousands) (continued)
As of June 30, 2015
Year Ending December 31, 2019 | Thereafter | ||||||||||||||||||||||||
Full Consolidation | Less Noncontrolling Interest | Plus Unconsolidated Investments at Pro-Rata | Pro-Rata Consolidation | Full Consolidation | Less Noncontrolling Interest | Plus Unconsolidated Investments at Pro-Rata | Pro-Rata Consolidation | ||||||||||||||||||
Fixed: | |||||||||||||||||||||||||
Fixed-rate debt | $ | 115,147 | $ | 3,885 | $ | 40,563 | $ | 151,825 | $ | 1,583,631 | $ | 335,574 | $ | 962,090 | $ | 2,210,147 | |||||||||
Weighted average rate | 3.96 | % | 4.80 | % | 5.74 | % | 4.42 | % | 5.38 | % | 7.32 | % | 4.38 | % | 4.65 | % | |||||||||
Variable: | |||||||||||||||||||||||||
Variable-rate debt | 241,068 | 53,293 | 106,780 | 294,555 | 53,222 | — | 3,041 | 56,263 | |||||||||||||||||
Weighted average rate | 2.17 | % | 1.25 | % | 4.14 | % | 3.05 | % | 3.07 | % | — | % | 1.16 | % | 2.97 | % | |||||||||
Tax-Exempt | 8,500 | — | 20,000 | 28,500 | 468,284 | 106,764 | 66,860 | 428,380 | |||||||||||||||||
Weighted average rate | 3.05 | % | — | % | 0.87 | % | 1.52 | % | 1.12 | % | 1.31 | % | 1.01 | % | 1.05 | % | |||||||||
Total variable-rate debt | 249,568 | 53,293 | 126,780 | 323,055 | 521,506 | 106,764 | 69,901 | 484,643 | |||||||||||||||||
Total Nonrecourse Debt | $ | 364,715 | $ | 57,178 | $ | 167,343 | $ | 474,880 | $ | 2,105,137 | $ | 442,338 | $ | 1,031,991 | $ | 2,694,790 | |||||||||
Weighted Average Rate | 2.76 | % | 1.50 | % | 4.14 | % | 3.40 | % | 4.37 | % | 5.87 | % | 4.15 | % | 4.04 | % | |||||||||
Total | |||||||||||||||||||||||||
Full Consolidation | Less Noncontrolling Interest | Plus Unconsolidated Investments at Pro-Rata | Pro-Rata Consolidation | ||||||||||||||||||||||
Fixed: | |||||||||||||||||||||||||
Fixed-rate debt | $ | 2,407,290 | $ | 405,525 | $ | 1,815,342 | $ | 3,817,107 | |||||||||||||||||
Weighted average rate | 5.49 | % | 7.60 | % | 4.91 | % | 4.99 | % | |||||||||||||||||
Variable: | |||||||||||||||||||||||||
Variable-rate debt | 1,411,468 | 57,770 | 186,864 | 1,540,562 | |||||||||||||||||||||
Weighted average rate | 4.77 | % | 1.38 | % | 3.18 | % | 4.70 | % | |||||||||||||||||
Tax-Exempt | 617,582 | 120,011 | 165,680 | 663,251 | |||||||||||||||||||||
Weighted average rate | 1.24 | % | 1.38 | % | 1.33 | % | 1.24 | % | |||||||||||||||||
Total variable-rate debt | 2,029,050 | 177,781 | 352,544 | 2,203,813 | |||||||||||||||||||||
Total Nonrecourse Debt | $ | 4,436,340 | $ | 583,306 | $ | 2,167,886 | $ | 6,020,920 | |||||||||||||||||
Weighted Average Rate | 4.67 | % | 5.70 | % | 4.49 | % | 4.50 | % | |||||||||||||||||
50
Forest City Enterprises, Inc. and Subsidiaries
Supplemental Financial Information
Summary of FFO by Segment - Three and Six Months Ended June 30, 2015 (in thousands)
Three Months Ended June 30, 2015 | Six Months Ended June 30, 2015 | |||||||||||||||||||||||||
Full Consolidation (GAAP) | Less Noncontrolling Interest | Plus Unconsolidated Investments at Pro-Rata | Pro-Rata Consolidation (Non-GAAP) | Full Consolidation (GAAP) | Less Noncontrolling Interest | Plus Unconsolidated Investments at Pro-Rata | Pro-Rata Consolidation (Non-GAAP) | |||||||||||||||||||
Commercial Group | ||||||||||||||||||||||||||
Total revenues | $ | 134,607 | $ | 5,274 | $ | 65,556 | $ | 194,889 | $ | 263,152 | $ | 10,036 | $ | 131,101 | $ | 384,217 | ||||||||||
Exclude straight-line rent adjustment | (555 | ) | — | — | (555 | ) | (865 | ) | — | — | (865 | ) | ||||||||||||||
Add interest and other income | 1,273 | 4 | 55 | 1,324 | 3,906 | 10 | 89 | 3,985 | ||||||||||||||||||
Equity in earnings (loss) of unconsolidated entities | 8,265 | — | (8,265 | ) | — | 14,992 | — | (14,992 | ) | — | ||||||||||||||||
Exclude operating expenses of unconsolidated entities | 25,182 | — | (25,182 | ) | — | 51,174 | — | (51,174 | ) | — | ||||||||||||||||
Exclude write-offs of abandoned development projects of unconsolidated entities | — | — | — | — | — | — | — | — | ||||||||||||||||||
Exclude gain on disposition of unconsolidated entities | — | — | — | — | — | — | — | — | ||||||||||||||||||
Exclude depreciation and amortization of unconsolidated entities | 14,080 | — | (14,080 | ) | — | 28,471 | — | (28,471 | ) | — | ||||||||||||||||
Exclude interest expense of unconsolidated entities | 18,084 | — | (18,084 | ) | — | 36,545 | — | (36,545 | ) | — | ||||||||||||||||
Exclude loss on extinguishment of debt of unconsolidated entities | — | — | — | — | 8 | — | (8 | ) | — | |||||||||||||||||
Adjusted revenues | 200,936 | 5,278 | — | 195,658 | 397,383 | 10,046 | — | 387,337 | ||||||||||||||||||
Operating expenses | 74,119 | 2,670 | 25,182 | 96,631 | 147,209 | 5,239 | 51,174 | 193,144 | ||||||||||||||||||
Operating expenses of unconsolidated entities | 25,182 | — | (25,182 | ) | — | 51,174 | — | (51,174 | ) | — | ||||||||||||||||
Write-offs of abandoned development projects | 5,104 | — | — | 5,104 | 5,104 | — | — | 5,104 | ||||||||||||||||||
Write-offs of abandoned development projects of unconsolidated entities | — | — | — | — | — | — | — | — | ||||||||||||||||||
Non-Real Estate depreciation and amortization | 285 | — | — | 285 | 505 | — | — | 505 | ||||||||||||||||||
Exclude straight-line rent adjustment | (391 | ) | — | — | (391 | ) | (827 | ) | — | — | (827 | ) | ||||||||||||||
Adjusted operating expenses | 104,299 | 2,670 | — | 101,629 | 203,165 | 5,239 | — | 197,926 | ||||||||||||||||||
Net operating income | 96,637 | 2,608 | — | 94,029 | 194,218 | 4,807 | — | 189,411 | ||||||||||||||||||
Interest expense | (29,849 | ) | (1,074 | ) | (18,084 | ) | (46,859 | ) | (60,171 | ) | (2,202 | ) | (36,545 | ) | (94,514 | ) | ||||||||||
Interest expense of unconsolidated entities | (18,084 | ) | — | 18,084 | — | (36,545 | ) | — | 36,545 | — | ||||||||||||||||
Loss on extinguishment of debt | (3,102 | ) | — | — | (3,102 | ) | (3,114 | ) | — | (8 | ) | (3,122 | ) | |||||||||||||
Loss on extinguishment of debt of unconsolidated entities | — | — | — | — | (8 | ) | — | 8 | — | |||||||||||||||||
Amortization of mortgage procurement costs - Real Estate Groups | (1,756 | ) | — | — | (1,756 | ) | (3,720 | ) | — | — | (3,720 | ) | ||||||||||||||
Net gain on change in control of interests | 463,643 | — | — | 463,643 | 463,643 | — | — | 463,643 | ||||||||||||||||||
Straight-line rent adjustment | 164 | — | — | 164 | 38 | — | — | 38 | ||||||||||||||||||
Noncontrolling interest in FFO | (1,534 | ) | (1,534 | ) | — | — | (2,605 | ) | (2,605 | ) | — | — | ||||||||||||||
Income tax benefit (expense) on FFO | — | — | — | — | — | — | — | — | ||||||||||||||||||
FFO attributable to Forest City Enterprises, Inc. | $ | 506,119 | $ | — | $ | — | $ | 506,119 | $ | 551,736 | $ | — | $ | — | $ | 551,736 | ||||||||||
Depreciation and amortization - Real Estate Groups | (46,172 | ) | — | — | (46,172 | ) | (91,856 | ) | — | — | (91,856 | ) | ||||||||||||||
Net gain on disposition of full or partial interests in rental properties | — | — | — | — | — | — | — | — | ||||||||||||||||||
Gain on disposition of unconsolidated entities | — | — | — | — | — | — | — | — | ||||||||||||||||||
Net earnings (loss) attributable to Forest City Enterprises, Inc. | $ | 459,947 | $ | — | $ | — | $ | 459,947 | $ | 459,880 | $ | — | $ | — | $ | 459,880 | ||||||||||
51
Forest City Enterprises, Inc. and Subsidiaries
Supplemental Financial Information
Summary of FFO by Segment - Three and Six Months Ended June 30, 2015 (in thousands) (continued)
Three Months Ended June 30, 2015 | Six Months Ended June 30, 2015 | |||||||||||||||||||||||||
Full Consolidation (GAAP) | Less Noncontrolling Interest | Plus Unconsolidated Investments at Pro-Rata | Pro-Rata Consolidation (Non-GAAP) | Full Consolidation (GAAP) | Less Noncontrolling Interest | Plus Unconsolidated Investments at Pro-Rata | Pro-Rata Consolidation (Non-GAAP) | |||||||||||||||||||
Residential Group | ||||||||||||||||||||||||||
Total revenues | $ | 80,860 | $ | 10,408 | $ | 34,637 | $ | 105,089 | $ | 150,520 | $ | 18,776 | $ | 71,932 | $ | 203,676 | ||||||||||
Exclude straight-line rent adjustment | (175 | ) | — | — | (175 | ) | (363 | ) | — | — | (363 | ) | ||||||||||||||
Add interest and other income | 3,764 | 92 | 306 | 3,978 | 6,760 | 95 | 554 | 7,219 | ||||||||||||||||||
Equity in earnings (loss) of unconsolidated entities | 12,048 | 99 | (11,669 | ) | 280 | 13,758 | 82 | (12,836 | ) | 840 | ||||||||||||||||
Exclude operating expenses of unconsolidated entities | 17,821 | — | (17,821 | ) | — | 38,599 | — | (38,599 | ) | — | ||||||||||||||||
Exclude write-offs of abandoned development projects of unconsolidated entities | 10,191 | — | (10,191 | ) | — | 10,191 | — | (10,191 | ) | — | ||||||||||||||||
Exclude gain on disposition of unconsolidated entities | (19,284 | ) | — | 19,284 | — | (19,284 | ) | — | 19,284 | — | ||||||||||||||||
Exclude depreciation and amortization of unconsolidated entities | 7,228 | — | (7,228 | ) | — | 15,293 | — | (15,293 | ) | — | ||||||||||||||||
Exclude interest expense of unconsolidated entities | 6,935 | — | (6,935 | ) | — | 14,251 | — | (14,251 | ) | — | ||||||||||||||||
Exclude loss on extinguishment of debt of unconsolidated entities | 383 | — | (383 | ) | — | 600 | — | (600 | ) | — | ||||||||||||||||
Adjusted revenues | 119,771 | 10,599 | — | 109,172 | 230,325 | 18,953 | — | 211,372 | ||||||||||||||||||
Operating expenses | 46,163 | 4,774 | 17,821 | 59,210 | 89,402 | 7,501 | 38,599 | 120,500 | ||||||||||||||||||
Operating expenses of unconsolidated entities | 17,821 | — | (17,821 | ) | — | 38,599 | — | (38,599 | ) | — | ||||||||||||||||
Write-offs of abandoned development projects | 674 | — | 10,191 | 10,865 | 674 | — | 10,191 | 10,865 | ||||||||||||||||||
Write-offs of abandoned development projects of unconsolidated entities | 10,191 | — | (10,191 | ) | — | 10,191 | — | (10,191 | ) | — | ||||||||||||||||
Non-Real Estate depreciation and amortization | 171 | — | — | 171 | 319 | — | — | 319 | ||||||||||||||||||
Exclude straight-line rent adjustment | (40 | ) | — | — | (40 | ) | (60 | ) | — | — | (60 | ) | ||||||||||||||
Adjusted operating expenses | 74,980 | 4,774 | — | 70,206 | 139,125 | 7,501 | — | 131,624 | ||||||||||||||||||
Net operating income | 44,791 | 5,825 | — | 38,966 | 91,200 | 11,452 | — | 79,748 | ||||||||||||||||||
Interest expense | (2,145 | ) | (878 | ) | (6,935 | ) | (8,202 | ) | (6,610 | ) | (2,398 | ) | (14,251 | ) | (18,463 | ) | ||||||||||
Interest expense of unconsolidated entities | (6,935 | ) | — | 6,935 | — | (14,251 | ) | — | 14,251 | — | ||||||||||||||||
Loss on extinguishment of debt | (88 | ) | — | (383 | ) | (471 | ) | (88 | ) | — | (600 | ) | (688 | ) | ||||||||||||
Loss on extinguishment of debt of unconsolidated entities | (383 | ) | — | 383 | — | (600 | ) | — | 600 | — | ||||||||||||||||
Amortization of mortgage procurement costs - Real Estate Groups | (852 | ) | — | — | (852 | ) | (1,687 | ) | — | — | (1,687 | ) | ||||||||||||||
Net gain on change in control of interests | 24,041 | — | — | 24,041 | 24,041 | — | — | 24,041 | ||||||||||||||||||
Straight-line rent adjustment | 135 | — | — | 135 | 303 | — | — | 303 | ||||||||||||||||||
Noncontrolling interest in FFO | (4,947 | ) | (4,947 | ) | — | — | (9,054 | ) | (9,054 | ) | — | — | ||||||||||||||
Income tax benefit (expense) on FFO | — | — | — | — | — | — | — | — | ||||||||||||||||||
FFO attributable to Forest City Enterprises, Inc. | $ | 53,617 | $ | — | $ | — | $ | 53,617 | $ | 83,254 | $ | — | $ | — | $ | 83,254 | ||||||||||
Depreciation and amortization - Real Estate Groups | (25,108 | ) | — | — | (25,108 | ) | (49,108 | ) | — | — | (49,108 | ) | ||||||||||||||
Net gain on disposition of full or partial interests in rental properties | — | — | 19,284 | 19,284 | — | — | 19,284 | 19,284 | ||||||||||||||||||
Gain on disposition of unconsolidated entities | 19,284 | — | (19,284 | ) | — | 19,284 | — | (19,284 | ) | — | ||||||||||||||||
Net earnings (loss) attributable to Forest City Enterprises, Inc. | $ | 47,793 | $ | — | $ | — | $ | 47,793 | $ | 53,430 | $ | — | $ | — | $ | 53,430 | ||||||||||
52
Forest City Enterprises, Inc. and Subsidiaries
Supplemental Financial Information
Summary of FFO by Segment - Three and Six Months Ended June 30, 2015 (in thousands) (continued)
Three Months Ended June 30, 2015 | Six Months Ended June 30, 2015 | |||||||||||||||||||||||||
Full Consolidation (GAAP) | Less Noncontrolling Interest | Plus Unconsolidated Investments at Pro-Rata | Pro-Rata Consolidation (Non-GAAP) | Full Consolidation (GAAP) | Less Noncontrolling Interest | Plus Unconsolidated Investments at Pro-Rata | Pro-Rata Consolidation (Non-GAAP) | |||||||||||||||||||
Arena | ||||||||||||||||||||||||||
Total revenues | $ | 27,040 | $ | 12,201 | $ | — | $ | 14,839 | $ | 55,860 | $ | 25,202 | $ | — | $ | 30,658 | ||||||||||
Exclude straight-line rent adjustment | (8 | ) | — | — | (8 | ) | (19 | ) | — | — | (19 | ) | ||||||||||||||
Add interest and other income | — | — | — | — | — | — | — | — | ||||||||||||||||||
Equity in earnings (loss) of unconsolidated entities | — | — | — | — | — | — | — | — | ||||||||||||||||||
Exclude operating expenses of unconsolidated entities | — | — | — | — | — | — | — | — | ||||||||||||||||||
Exclude write-offs of abandoned development projects of unconsolidated entities | — | — | — | — | — | — | — | — | ||||||||||||||||||
Exclude gain on disposition of unconsolidated entities | — | — | — | — | — | — | — | — | ||||||||||||||||||
Exclude depreciation and amortization of unconsolidated entities | — | — | — | — | — | — | — | — | ||||||||||||||||||
Exclude interest expense of unconsolidated entities | — | — | — | — | — | — | — | — | ||||||||||||||||||
Exclude loss on extinguishment of debt of unconsolidated entities | — | — | — | — | — | — | — | — | ||||||||||||||||||
Adjusted revenues | 27,032 | 12,201 | — | 14,831 | 55,841 | 25,202 | — | 30,639 | ||||||||||||||||||
Operating expenses | 17,862 | 7,901 | — | 9,961 | 37,820 | 16,868 | — | 20,952 | ||||||||||||||||||
Operating expenses of unconsolidated entities | — | — | — | — | — | — | — | — | ||||||||||||||||||
Write-offs of abandoned development projects | — | — | — | — | — | — | — | — | ||||||||||||||||||
Write-offs of abandoned development projects of unconsolidated entities | — | — | — | — | — | — | — | — | ||||||||||||||||||
Non-Real Estate depreciation and amortization | 17 | — | — | 17 | 34 | — | — | 34 | ||||||||||||||||||
Exclude straight-line rent adjustment | — | — | — | — | — | — | — | — | ||||||||||||||||||
Adjusted operating expenses | 17,879 | 7,901 | — | 9,978 | 37,854 | 16,868 | — | 20,986 | ||||||||||||||||||
Net operating income | 9,153 | 4,300 | — | 4,853 | 17,987 | 8,334 | — | 9,653 | ||||||||||||||||||
Interest expense | (10,127 | ) | (5,346 | ) | — | (4,781 | ) | (20,235 | ) | (10,650 | ) | — | (9,585 | ) | ||||||||||||
Interest expense of unconsolidated entities | — | — | — | — | — | — | — | — | ||||||||||||||||||
Loss on extinguishment of debt | — | — | — | — | — | — | — | — | ||||||||||||||||||
Loss on extinguishment of debt of unconsolidated entities | — | — | — | — | — | — | — | — | ||||||||||||||||||
Amortization of mortgage procurement costs - Real Estate Groups | — | — | — | — | — | — | — | — | ||||||||||||||||||
Net gain on change in control of interests | — | — | — | — | — | — | — | — | ||||||||||||||||||
Straight-line rent adjustment | 8 | — | — | 8 | 19 | — | — | 19 | ||||||||||||||||||
Noncontrolling interest in FFO | 1,046 | 1,046 | — | — | 2,316 | 2,316 | — | — | ||||||||||||||||||
Income tax benefit (expense) on FFO | — | — | — | — | — | — | — | — | ||||||||||||||||||
FFO attributable to Forest City Enterprises, Inc. | $ | 80 | $ | — | $ | — | $ | 80 | $ | 87 | $ | — | $ | — | $ | 87 | ||||||||||
Depreciation and amortization - Real Estate Groups | (5,062 | ) | — | — | (5,062 | ) | (10,117 | ) | — | — | (10,117 | ) | ||||||||||||||
Net gain on disposition of full or partial interests in rental properties | — | — | — | — | — | — | — | — | ||||||||||||||||||
Gain on disposition of unconsolidated entities | — | — | — | — | — | — | — | — | ||||||||||||||||||
Net earnings (loss) attributable to Forest City Enterprises, Inc. | $ | (4,982 | ) | $ | — | $ | — | $ | (4,982 | ) | $ | (10,030 | ) | $ | — | $ | — | $ | (10,030 | ) | ||||||
53
Forest City Enterprises, Inc. and Subsidiaries
Supplemental Financial Information
Summary of FFO by Segment - Three and Six Months Ended June 30, 2015 (in thousands) (continued)
Three Months Ended June 30, 2015 | Six Months Ended June 30, 2015 | |||||||||||||||||||||||||
Full Consolidation (GAAP) | Less Noncontrolling Interest | Plus Unconsolidated Investments at Pro-Rata | Pro-Rata Consolidation (Non-GAAP) | Full Consolidation (GAAP) | Less Noncontrolling Interest | Plus Unconsolidated Investments at Pro-Rata | Pro-Rata Consolidation (Non-GAAP) | |||||||||||||||||||
Land Group | ||||||||||||||||||||||||||
Total revenues | $ | 17,252 | $ | 1,723 | $ | 236 | $ | 15,765 | $ | 27,309 | $ | 2,718 | $ | 1,552 | $ | 26,143 | ||||||||||
Exclude straight-line rent adjustment | — | — | — | — | — | — | — | — | ||||||||||||||||||
Add interest and other income | 4,141 | 410 | 2 | 3,733 | 8,181 | 811 | 3 | 7,373 | ||||||||||||||||||
Equity in earnings (loss) of unconsolidated entities | (513 | ) | — | 513 | — | 1,165 | — | (220 | ) | 945 | ||||||||||||||||
Exclude operating expenses of unconsolidated entities | 578 | — | (578 | ) | — | 1,075 | — | (1,075 | ) | — | ||||||||||||||||
Exclude write-offs of abandoned development projects of unconsolidated entities | — | — | — | — | — | — | — | — | ||||||||||||||||||
Exclude gain on disposition of unconsolidated entities | — | — | — | — | — | — | — | — | ||||||||||||||||||
Exclude depreciation and amortization of unconsolidated entities | 10 | — | (10 | ) | — | 20 | — | (20 | ) | — | ||||||||||||||||
Exclude interest expense of unconsolidated entities | 163 | — | (163 | ) | — | 240 | — | (240 | ) | — | ||||||||||||||||
Exclude loss on extinguishment of debt of unconsolidated entities | — | — | — | — | — | — | — | — | ||||||||||||||||||
Adjusted revenues | 21,631 | 2,133 | — | 19,498 | 37,990 | 3,529 | — | 34,461 | ||||||||||||||||||
Operating expenses | 6,724 | 653 | 578 | 6,649 | 11,365 | 1,131 | 1,075 | 11,309 | ||||||||||||||||||
Operating expenses of unconsolidated entities | 578 | — | (578 | ) | — | 1,075 | — | (1,075 | ) | — | ||||||||||||||||
Write-offs of abandoned development projects | — | — | — | — | — | — | — | — | ||||||||||||||||||
Write-offs of abandoned development projects of unconsolidated entities | — | — | — | — | — | — | — | — | ||||||||||||||||||
Non-Real Estate depreciation and amortization | 19 | — | — | 19 | 68 | — | — | 68 | ||||||||||||||||||
Exclude straight-line rent adjustment | — | — | — | — | — | — | — | — | ||||||||||||||||||
Adjusted operating expenses | 7,321 | 653 | — | 6,668 | 12,508 | 1,131 | — | 11,377 | ||||||||||||||||||
Net operating income | 14,310 | 1,480 | — | 12,830 | 25,482 | 2,398 | — | 23,084 | ||||||||||||||||||
Interest expense | 405 | 35 | (163 | ) | 207 | 870 | 74 | (240 | ) | 556 | ||||||||||||||||
Interest expense of unconsolidated entities | (163 | ) | — | 163 | — | (240 | ) | — | 240 | — | ||||||||||||||||
Loss on extinguishment of debt | — | — | — | — | — | — | — | — | ||||||||||||||||||
Loss on extinguishment of debt of unconsolidated entities | — | — | — | — | — | — | — | — | ||||||||||||||||||
Amortization of mortgage procurement costs - Real Estate Groups | — | — | — | — | — | — | — | — | ||||||||||||||||||
Net gain on change in control of interests | — | — | — | — | — | — | — | — | ||||||||||||||||||
Straight-line rent adjustment | — | — | — | — | — | — | — | — | ||||||||||||||||||
Noncontrolling interest in FFO | (1,515 | ) | (1,515 | ) | — | — | (2,472 | ) | (2,472 | ) | — | — | ||||||||||||||
Income tax benefit (expense) on FFO | — | — | — | — | — | — | — | — | ||||||||||||||||||
FFO attributable to Forest City Enterprises, Inc. | $ | 13,037 | $ | — | $ | — | $ | 13,037 | $ | 23,640 | $ | — | $ | — | $ | 23,640 | ||||||||||
Depreciation and amortization - Real Estate Groups | (372 | ) | — | — | (372 | ) | (413 | ) | — | — | (413 | ) | ||||||||||||||
Net gain on disposition of full or partial interests in rental properties | — | — | — | — | — | — | — | — | ||||||||||||||||||
Gain on disposition of unconsolidated entities | — | — | — | — | — | — | — | — | ||||||||||||||||||
Net earnings (loss) attributable to Forest City Enterprises, Inc. | $ | 12,665 | $ | — | $ | — | $ | 12,665 | $ | 23,227 | $ | — | $ | — | $ | 23,227 | ||||||||||
54
Forest City Enterprises, Inc. and Subsidiaries
Supplemental Financial Information
Summary of FFO by Segment - Three and Six Months Ended June 30, 2015 (in thousands) (continued)
Three Months Ended June 30, 2015 | Six Months Ended June 30, 2015 | |||||||||||||||||||||||||
Full Consolidation (GAAP) | Less Noncontrolling Interest | Plus Unconsolidated Investments at Pro-Rata | Pro-Rata Consolidation (Non-GAAP) | Full Consolidation (GAAP) | Less Noncontrolling Interest | Plus Unconsolidated Investments at Pro-Rata | Pro-Rata Consolidation (Non-GAAP) | |||||||||||||||||||
Corporate Group | ||||||||||||||||||||||||||
Total revenues | $ | — | $ | — | $ | — | $ | — | $ | — | $ | — | $ | — | $ | — | ||||||||||
Exclude straight-line rent adjustment | — | — | — | — | — | — | — | — | ||||||||||||||||||
Add interest and other income | 100 | — | — | 100 | 135 | — | — | 135 | ||||||||||||||||||
Equity in earnings (loss) of unconsolidated entities | (791 | ) | — | — | (791 | ) | (1,593 | ) | — | — | (1,593 | ) | ||||||||||||||
Exclude operating expenses of unconsolidated entities | — | — | — | — | — | — | — | — | ||||||||||||||||||
Exclude write-offs of abandoned development projects of unconsolidated entities | — | — | — | — | — | — | — | — | ||||||||||||||||||
Exclude gain on disposition of unconsolidated entities | — | — | — | — | — | — | — | — | ||||||||||||||||||
Exclude depreciation and amortization of unconsolidated entities | — | — | — | — | — | — | — | — | ||||||||||||||||||
Exclude interest expense of unconsolidated entities | — | — | — | — | — | — | — | — | ||||||||||||||||||
Exclude loss on extinguishment of debt of unconsolidated entities | — | — | — | — | — | — | — | — | ||||||||||||||||||
Adjusted revenues | (691 | ) | — | — | (691 | ) | (1,458 | ) | — | — | (1,458 | ) | ||||||||||||||
Operating expenses | 21,972 | — | — | 21,972 | 41,687 | — | — | 41,687 | ||||||||||||||||||
Operating expenses of unconsolidated entities | — | — | — | — | — | — | — | — | ||||||||||||||||||
Write-offs of abandoned development projects | — | — | — | — | — | — | — | — | ||||||||||||||||||
Write-offs of abandoned development projects of unconsolidated entities | — | — | — | — | — | — | — | — | ||||||||||||||||||
Non-Real Estate depreciation and amortization | 738 | — | — | 738 | 1,446 | — | — | 1,446 | ||||||||||||||||||
Exclude straight-line rent adjustment | — | — | — | — | — | — | — | — | ||||||||||||||||||
Adjusted operating expenses | 22,710 | — | — | 22,710 | 43,133 | — | — | 43,133 | ||||||||||||||||||
Net operating income | (23,401 | ) | — | — | (23,401 | ) | (44,591 | ) | — | — | (44,591 | ) | ||||||||||||||
Interest expense | (6,036 | ) | — | — | (6,036 | ) | (14,182 | ) | — | — | (14,182 | ) | ||||||||||||||
Interest expense of unconsolidated entities | — | — | — | — | — | — | — | — | ||||||||||||||||||
Loss on extinguishment of debt | — | — | — | — | (35,142 | ) | — | — | (35,142 | ) | ||||||||||||||||
Loss on extinguishment of debt of unconsolidated entities | — | — | — | — | — | — | — | — | ||||||||||||||||||
Amortization of mortgage procurement costs - Real Estate Groups | — | — | — | — | — | — | — | — | ||||||||||||||||||
Net gain on change in control of interests | — | — | — | — | — | — | — | — | ||||||||||||||||||
Straight-line rent adjustment | — | — | — | — | — | — | — | — | ||||||||||||||||||
Noncontrolling interest in FFO | — | — | — | — | — | — | — | — | ||||||||||||||||||
Income tax benefit (expense) on FFO | (174,769 | ) | — | — | (174,769 | ) | (175,584 | ) | — | — | (175,584 | ) | ||||||||||||||
FFO attributable to Forest City Enterprises, Inc. | $ | (204,206 | ) | $ | — | $ | — | $ | (204,206 | ) | $ | (269,499 | ) | $ | — | $ | — | $ | (269,499 | ) | ||||||
Depreciation and amortization - Real Estate Groups | — | — | — | — | — | — | — | — | ||||||||||||||||||
Net gain on disposition of full or partial interests in rental properties | — | — | — | — | — | — | — | — | ||||||||||||||||||
Gain on disposition of unconsolidated entities | — | — | — | — | — | — | — | — | ||||||||||||||||||
Income tax benefit (expense) on non-FFO: | ||||||||||||||||||||||||||
Gain on disposition of rental properties | (7,461 | ) | — | — | (7,461 | ) | (7,461 | ) | — | — | (7,461 | ) | ||||||||||||||
Net earnings (loss) attributable to Forest City Enterprises, Inc. | $ | (211,667 | ) | $ | — | $ | — | $ | (211,667 | ) | $ | (276,960 | ) | $ | — | $ | — | $ | (276,960 | ) | ||||||
55
Forest City Enterprises, Inc. and Subsidiaries
Supplemental Financial Information
Summary of FFO by Segment - Three and Six Months Ended June 30, 2015 (in thousands) (continued)
Three Months Ended June 30, 2015 | Six Months Ended June 30, 2015 | |||||||||||||||||||||||||
Full Consolidation (GAAP) | Less Noncontrolling Interest | Plus Unconsolidated Investments at Pro-Rata | Pro-Rata Consolidation (Non-GAAP) | Full Consolidation (GAAP) | Less Noncontrolling Interest | Plus Unconsolidated Investments at Pro-Rata | Pro-Rata Consolidation (Non-GAAP) | |||||||||||||||||||
Total | ||||||||||||||||||||||||||
Total revenues | $ | 259,759 | $ | 29,606 | $ | 100,429 | $ | 330,582 | $ | 496,841 | $ | 56,732 | $ | 204,585 | $ | 644,694 | ||||||||||
Exclude straight-line rent adjustment | (738 | ) | — | — | (738 | ) | (1,247 | ) | — | — | (1,247 | ) | ||||||||||||||
Add interest and other income | 9,278 | 506 | 363 | 9,135 | 18,982 | 916 | 646 | 18,712 | ||||||||||||||||||
Equity in earnings (loss) of unconsolidated entities | 19,009 | 99 | (19,421 | ) | (511 | ) | 28,322 | 82 | (28,048 | ) | 192 | |||||||||||||||
Exclude operating expenses of unconsolidated entities | 43,581 | — | (43,581 | ) | — | 90,848 | — | (90,848 | ) | — | ||||||||||||||||
Exclude write-offs of abandoned development projects of unconsolidated entities | 10,191 | — | (10,191 | ) | — | 10,191 | — | (10,191 | ) | — | ||||||||||||||||
Exclude gain on disposition of unconsolidated entities | (19,284 | ) | — | 19,284 | — | (19,284 | ) | — | 19,284 | — | ||||||||||||||||
Exclude depreciation and amortization of unconsolidated entities | 21,318 | — | (21,318 | ) | — | 43,784 | — | (43,784 | ) | — | ||||||||||||||||
Exclude interest expense of unconsolidated entities | 25,182 | — | (25,182 | ) | — | 51,036 | — | (51,036 | ) | — | ||||||||||||||||
Exclude loss on extinguishment of debt of unconsolidated entities | 383 | — | (383 | ) | — | 608 | — | (608 | ) | — | ||||||||||||||||
Adjusted revenues | 368,679 | 30,211 | — | 338,468 | 720,081 | 57,730 | — | 662,351 | ||||||||||||||||||
Operating expenses | 166,840 | 15,998 | 43,581 | 194,423 | 327,483 | 30,739 | 90,848 | 387,592 | ||||||||||||||||||
Operating expenses of unconsolidated entities | 43,581 | — | (43,581 | ) | — | 90,848 | — | (90,848 | ) | — | ||||||||||||||||
Write-offs of abandoned development projects | 5,778 | — | 10,191 | 15,969 | 5,778 | — | 10,191 | 15,969 | ||||||||||||||||||
Write-offs of abandoned development projects of unconsolidated entities | 10,191 | — | (10,191 | ) | — | 10,191 | — | (10,191 | ) | — | ||||||||||||||||
Non-Real Estate depreciation and amortization | 1,230 | — | — | 1,230 | 2,372 | — | — | 2,372 | ||||||||||||||||||
Exclude straight-line rent adjustment | (431 | ) | — | — | (431 | ) | (887 | ) | — | — | (887 | ) | ||||||||||||||
Adjusted operating expenses | 227,189 | 15,998 | — | 211,191 | 435,785 | 30,739 | — | 405,046 | ||||||||||||||||||
Net operating income | 141,490 | 14,213 | — | 127,277 | 284,296 | 26,991 | — | 257,305 | ||||||||||||||||||
Interest expense | (47,752 | ) | (7,263 | ) | (25,182 | ) | (65,671 | ) | (100,328 | ) | (15,176 | ) | (51,036 | ) | (136,188 | ) | ||||||||||
Interest expense of unconsolidated entities | (25,182 | ) | — | 25,182 | — | (51,036 | ) | — | 51,036 | — | ||||||||||||||||
Loss on extinguishment of debt | (3,190 | ) | — | (383 | ) | (3,573 | ) | (38,344 | ) | — | (608 | ) | (38,952 | ) | ||||||||||||
Loss on extinguishment of debt of unconsolidated entities | (383 | ) | — | 383 | — | (608 | ) | — | 608 | — | ||||||||||||||||
Amortization of mortgage procurement costs - Real Estate Groups | (2,608 | ) | — | — | (2,608 | ) | (5,407 | ) | — | — | (5,407 | ) | ||||||||||||||
Net gain on change in control of interests | 487,684 | — | — | 487,684 | 487,684 | — | — | 487,684 | ||||||||||||||||||
Straight-line rent adjustment | 307 | — | — | 307 | 360 | — | — | 360 | ||||||||||||||||||
Noncontrolling interest in FFO | (6,950 | ) | (6,950 | ) | — | — | (11,815 | ) | (11,815 | ) | — | — | ||||||||||||||
Income tax benefit (expense) on FFO | (174,769 | ) | — | — | (174,769 | ) | (175,584 | ) | — | — | (175,584 | ) | ||||||||||||||
FFO attributable to Forest City Enterprises, Inc. | $ | 368,647 | $ | — | $ | — | $ | 368,647 | $ | 389,218 | $ | — | $ | — | $ | 389,218 | ||||||||||
Depreciation and amortization - Real Estate Groups | (76,714 | ) | — | — | (76,714 | ) | (151,494 | ) | — | — | (151,494 | ) | ||||||||||||||
Net gain on disposition of full or partial interests in rental properties | — | — | 19,284 | 19,284 | — | — | 19,284 | 19,284 | ||||||||||||||||||
Gain on disposition of unconsolidated entities | 19,284 | — | (19,284 | ) | — | 19,284 | — | (19,284 | ) | — | ||||||||||||||||
Income tax benefit (expense) on non-FFO: | ||||||||||||||||||||||||||
Gain on disposition of rental properties | (7,461 | ) | — | — | (7,461 | ) | (7,461 | ) | — | — | (7,461 | ) | ||||||||||||||
Net earnings (loss) attributable to Forest City Enterprises, Inc. | $ | 303,756 | $ | — | $ | — | $ | 303,756 | $ | 249,547 | $ | — | $ | — | $ | 249,547 | ||||||||||
56