EXHIBIT 13
Management’s Discussion and Analysis
Overview
U.S. Bancorp and its subsidiaries (the “Company”) achieved record earnings in 2012, reflecting growth in net interest income and fee revenues, sound expense management and improved credit quality. The Company’s results demonstrated the strength of its diverse business model and prudent growth strategy, as it achieved these results during a year of modest economic growth and while absorbing the unfavorable impact of new regulation on both revenue and expense. The Company experienced solid growth in loans and deposits during 2012, as it continued to expand and deepen relationships with current customers, as well as acquire new customers and market share. The Company’s fee-based revenues also grew over the prior year, led by mortgage banking, which posted record production levels and earnings as a result of an expanded presence in the market and the favorable interest rate environment. With ongoing investments in its business line growth initiatives and small, strategic acquisitions, the Company remains positioned to continue to grow and leverage the expected slow, but steady, economic recovery.
The Company earned $5.6 billion in 2012, an increase of 15.9 percent over 2011. Growth in total net revenue of $1.2 billion (6.2 percent) was attributable to an increase in both net interest income and noninterest income. Net interest income increased as the result of higher average earning assets, continued growth in lower cost core deposit funding and the positive impact from long-term debt repricing. Noninterest income grew year-over-year as increases in mortgage banking revenue and other fee-based businesses were partially offset by expected decreases in revenue from recent legislative and regulatory actions. The Company’s total net charge-offs and nonperforming assets decreased throughout the year. The Company also continued to focus on effectively controlling expenses while making investments to increase revenue and enhance customer service, with an industry-leading efficiency ratio (the ratio of noninterest expense to taxable-equivalent net revenue, excluding net securities gains and losses) in 2012 of 51.5 percent. As a result, the Company’s return on average common equity was 16.2 percent, the highest among the Company’s peers.
With the Company’s growth in earnings during 2012, it continued to generate significant capital. The Company’s capital position remained strong. Using proposed rules for the Basel III standardized approach released June 2012, the Company’s Tier 1 common equity ratio was 8.1 percent at December 31, 2012 — above the Company’s targeted ratio of 8.0 percent and well above the minimum of 7.0 percent required in 2019 when these proposed rules are to be fully implemented. The Company had a Tier 1 common equity to risk-weighted assets ratio (using Basel I definition) of 9.0 percent and a Tier 1 capital ratio of 10.8 percent at December 31, 2012. In addition, at December 31, 2012, the Company’s total risk-based capital ratio was 13.1 percent, and its tangible common equity to risk-weighted assets ratio was 8.6 percent (refer to “Non-GAAP Financial Measures” for further information on the calculation of certain of these measures). Given the strength of its capital position and on-going ability to generate significant capital through earnings, the Company was able to return 62 percent of its earnings to common shareholders in the form of dividends and common share repurchases during 2012. Credit rating organizations rate the Company’s debt among the highest of its large domestic banking peers. This comparative financial strength provides the Company with favorable funding costs, strong liquidity and the ability to attract new customers, leading to growth in loans and deposits.
In 2012, the Company’s loans and deposits grew significantly. Average loans and deposits increased $13.9 billion (6.9 percent) and $22.6 billion (10.6 percent), respectively, over 2011. Loan growth reflected increases in commercial loans, including small business loans, residential mortgages, credit card loans and commercial real estate loans, partially offset by a modest decrease in other retail loans and a 19.3 percent decrease in loans covered by loss sharing agreements with the Federal Deposit Insurance Corporation (“FDIC”) (“covered” loans), which is a run-off portfolio. Deposit growth reflected the Company’s continued benefit from customer “flight-to-quality”.
The Company’s provision for credit losses decreased $461 million (19.7 percent) in 2012, compared with 2011. Net charge-offs decreased $746 million (26.2 percent) in 2012, compared with 2011, principally due to improvement in the commercial, commercial real estate and credit card portfolio classes. The provision for credit losses was $215 million less than net charge-offs in 2012, compared with $500 million less than net charge-offs in 2011.
| 20 | U.S. BANCORP |
| TABLE 1 | Selected Financial Data |
| Year Ended December 31 (Dollars and Shares in Millions, Except Per Share Data) |
2012 | 2011 | 2010 | 2009 | 2008 | |||||||||||||||
| Condensed Income Statement |
||||||||||||||||||||
| Net interest income (taxable-equivalent basis) (a) |
$ | 10,969 | $ | 10,348 | $ | 9,788 | $ | 8,716 | $ | 7,866 | ||||||||||
| Noninterest income |
9,334 | 8,791 | 8,438 | 8,403 | 7,789 | |||||||||||||||
| Securities gains (losses), net |
(15 | ) | (31 | ) | (78 | ) | (451 | ) | (978 | ) | ||||||||||
| Total net revenue |
20,288 | 19,108 | 18,148 | 16,668 | 14,677 | |||||||||||||||
| Noninterest expense |
10,456 | 9,911 | 9,383 | 8,281 | 7,348 | |||||||||||||||
| Provision for credit losses |
1,882 | 2,343 | 4,356 | 5,557 | 3,096 | |||||||||||||||
| Income before taxes |
7,950 | 6,854 | 4,409 | 2,830 | 4,233 | |||||||||||||||
| Taxable-equivalent adjustment |
224 | 225 | 209 | 198 | 134 | |||||||||||||||
| Applicable income taxes |
2,236 | 1,841 | 935 | 395 | 1,087 | |||||||||||||||
| Net income |
5,490 | 4,788 | 3,265 | 2,237 | 3,012 | |||||||||||||||
| Net (income) loss attributable to noncontrolling interests |
157 | 84 | 52 | (32 | ) | (66 | ) | |||||||||||||
| Net income attributable to U.S. Bancorp |
$ | 5,647 | $ | 4,872 | $ | 3,317 | $ | 2,205 | $ | 2,946 | ||||||||||
| Net income applicable to U.S. Bancorp common shareholders |
$ | 5,383 | $ | 4,721 | $ | 3,332 | $ | 1,803 | $ | 2,819 | ||||||||||
| Per Common Share |
||||||||||||||||||||
| Earnings per share |
$ | 2.85 | $ | 2.47 | $ | 1.74 | $ | .97 | $ | 1.62 | ||||||||||
| Diluted earnings per share |
2.84 | 2.46 | 1.73 | .97 | 1.61 | |||||||||||||||
| Dividends declared per share |
.78 | .50 | .20 | .20 | 1.70 | |||||||||||||||
| Book value per share |
18.31 | 16.43 | 14.36 | 12.79 | 10.47 | |||||||||||||||
| Market value per share |
31.94 | 27.05 | 26.97 | 22.51 | 25.01 | |||||||||||||||
| Average common shares outstanding |
1,887 | 1,914 | 1,912 | 1,851 | 1,742 | |||||||||||||||
| Average diluted common shares outstanding |
1,896 | 1,923 | 1,921 | 1,859 | 1,756 | |||||||||||||||
| Financial Ratios |
||||||||||||||||||||
| Return on average assets |
1.65 | % | 1.53 | % | 1.16 | % | .82 | % | 1.21 | % | ||||||||||
| Return on average common equity |
16.2 | 15.8 | 12.7 | 8.2 | 13.9 | |||||||||||||||
| Net interest margin (taxable-equivalent basis) (a) |
3.58 | 3.65 | 3.88 | 3.67 | 3.66 | |||||||||||||||
| Efficiency ratio (b) |
51.5 | 51.8 | 51.5 | 48.4 | 46.9 | |||||||||||||||
| Net charge-offs as a percent of average loans outstanding |
.97 | 1.41 | 2.17 | 2.08 | 1.10 | |||||||||||||||
| Average Balances |
||||||||||||||||||||
| Loans |
$ | 215,374 | $ | 201,427 | $ | 193,022 | $ | 185,805 | $ | 165,552 | ||||||||||
| Loans held for sale |
7,847 | 4,873 | 5,616 | 5,820 | 3,914 | |||||||||||||||
| Investment securities (c) |
72,501 | 63,645 | 47,763 | 42,809 | 42,850 | |||||||||||||||
| Earning assets |
306,270 | 283,290 | 252,042 | 237,287 | 215,046 | |||||||||||||||
| Assets |
342,849 | 318,264 | 285,861 | 268,360 | 244,400 | |||||||||||||||
| Noninterest-bearing deposits |
67,241 | 53,856 | 40,162 | 37,856 | 28,739 | |||||||||||||||
| Deposits |
235,710 | 213,159 | 184,721 | 167,801 | 136,184 | |||||||||||||||
| Short-term borrowings |
28,549 | 30,703 | 33,719 | 29,149 | 38,237 | |||||||||||||||
| Long-term debt |
28,448 | 31,684 | 30,835 | 36,520 | 39,250 | |||||||||||||||
| Total U.S. Bancorp shareholders’ equity |
37,611 | 32,200 | 28,049 | 26,307 | 22,570 | |||||||||||||||
| Period End Balances |
||||||||||||||||||||
| Loans |
$ | 223,329 | $ | 209,835 | $ | 197,061 | $ | 194,755 | $ | 184,955 | ||||||||||
| Investment securities |
74,528 | 70,814 | 52,978 | 44,768 | 39,521 | |||||||||||||||
| Assets |
353,855 | 340,122 | 307,786 | 281,176 | 265,912 | |||||||||||||||
| Deposits |
249,183 | 230,885 | 204,252 | 183,242 | 159,350 | |||||||||||||||
| Long-term debt |
25,516 | 31,953 | 31,537 | 32,580 | 38,359 | |||||||||||||||
| Total U.S. Bancorp shareholders’ equity |
38,998 | 33,978 | 29,519 | 25,963 | 26,300 | |||||||||||||||
| Asset Quality |
||||||||||||||||||||
| Nonperforming assets |
$ | 2,671 | $ | 3,774 | $ | 5,048 | $ | 5,907 | $ | 2,624 | ||||||||||
| Allowance for credit losses |
4,733 | 5,014 | 5,531 | 5,264 | 3,639 | |||||||||||||||
| Allowance for credit losses as a percentage of period-end loans |
2.12 | % | 2.39 | % | 2.81 | % | 2.70 | % | 1.97 | % | ||||||||||
| Capital Ratios |
||||||||||||||||||||
| Tier 1 capital |
10.8 | % | 10.8 | % | 10.5 | % | 9.6 | % | 10.6 | % | ||||||||||
| Total risk-based capital |
13.1 | 13.3 | 13.3 | 12.9 | 14.3 | |||||||||||||||
| Leverage |
9.2 | 9.1 | 9.1 | 8.5 | 9.8 | |||||||||||||||
| Tangible common equity to tangible assets (d) |
7.2 | 6.6 | 6.0 | 5.3 | 3.3 | |||||||||||||||
| Tangible common equity to risk-weighted assets using Basel I definition (d) |
8.6 | 8.1 | 7.2 | 6.1 | 3.7 | |||||||||||||||
| Tier 1 common equity to risk-weighted assets using Basel I definition (d) |
9.0 | 8.6 | 7.8 | 6.8 | 5.1 | |||||||||||||||
| Tier 1 common equity to risk-weighted assets using Basel III proposals published prior to June 2012 (d) |
– | 8.2 | 7.3 | – | – | |||||||||||||||
| Tier 1 common equity to risk-weighted assets approximated using proposed rules for the Basel III standardized approach released June 2012 (d) |
8.1 | – | – | – | – | |||||||||||||||
| (a) | Presented on a fully taxable-equivalent basis utilizing a tax rate of 35 percent. |
| (b) | Computed as noninterest expense divided by the sum of net interest income on a taxable-equivalent basis and noninterest income excluding net securities gains (losses). |
| (c) | Excludes unrealized gains and losses on available-for-sale investment securities and any premiums or discounts recorded related to the transfer of investment securities at fair value from available-for-sale to held-to-maturity. |
| (d) | See Non-GAAP Financial Measures beginning on page 65. |
| U.S. BANCORP | 21 |
Earnings Summary The Company reported net income attributable to U.S. Bancorp of $5.6 billion in 2012, or $2.84 per diluted common share, compared with $4.9 billion, or $2.46 per diluted common share, in 2011. Return on average assets and return on average common equity were 1.65 percent and 16.2 percent, respectively, in 2012, compared with 1.53 percent and 15.8 percent, respectively, in 2011. The Company’s results for 2012 included an $80 million expense accrual for a mortgage foreclosure-related regulatory settlement. The results for 2011 included a $263 million gain from the settlement of litigation related to the termination of a merchant processing referral agreement (“merchant settlement gain”), a $46 million gain related to the acquisition of First Community Bank of New Mexico (“FCB”) and a $130 million expense accrual related to mortgage servicing matters. The provision for credit losses was $215 million lower than net charge-offs for 2012, compared with $500 million lower than net charge-offs for 2011.
Total net revenue, on a taxable-equivalent basis, for 2012 was $1.2 billion (6.2 percent) higher than 2011, reflecting a 6.0 percent increase in net interest income and a 6.4 percent increase in noninterest income. Net interest income increased in 2012 as a result of an increase in average earning assets, continued growth in lower cost core deposit funding and the positive impact from long-term debt repricing. Noninterest income increased primarily due to higher mortgage banking revenue, trust and investment management fees, merchant processing services revenue, and commercial products revenue, partially offset by the 2011 merchant settlement gain and lower debit card revenue as a result of legislative changes.
Total noninterest expense in 2012 increased $545 million (5.5 percent), compared with 2011, primarily due to higher compensation expense, employee benefits costs and mortgage servicing review-related professional services costs.
Acquisitions In January 2012, the Company acquired the banking operations of BankEast, a subsidiary of BankEast Corporation, from the FDIC. This transaction did not include a loss sharing agreement. The Company acquired approximately $261 million of assets and assumed approximately $252 million of deposits from the FDIC with this transaction.
In November 2012, the Company acquired the hedge fund administration servicing business of Alternative Investment Solutions, LLC. The Company recorded approximately $108 million of assets, including intangibles, and approximately $3 million of liabilities with this transaction.
In December 2012, the Company acquired FSV Payment Systems, Inc., a prepaid card program manager with a proprietary processing platform. The Company recorded approximately $243 million of assets, including intangibles, and approximately $28 million of liabilities with this transaction.
In January 2011, the Company acquired the banking operations of FCB from the FDIC. The FCB transaction did not include a loss sharing agreement. The Company acquired 38 branch locations and approximately $1.8 billion in assets, assumed approximately $2.1 billion in liabilities, and received approximately $412 million in cash from the FDIC. The Company recognized a $46 million gain on this transaction during the first quarter of 2011.
Statement of Income Analysis
Net Interest Income Net interest income, on a taxable-equivalent basis, was $11.0 billion in 2012, compared with $10.3 billion in 2011 and $9.8 billion in 2010. The $621 million (6.0 percent) increase in net interest income in 2012, compared with 2011, was primarily the result of growth in average earning assets and lower cost core deposit funding, as well as the positive impact from long-term debt repricing. Average earning assets were $23.0 billion (8.1 percent) higher in 2012 than in 2011, driven by increases in loans and investment securities. Average deposits increased $22.6 billion (10.6 percent) in 2012, compared with 2011. The net interest margin in 2012 was 3.58 percent, compared with 3.65 percent in 2011 and 3.88 percent in 2010. The decrease in the net interest margin in 2012, compared with 2011, reflected higher average balances in lower-yielding investment securities and lower loan rates, partially offset by lower rates on deposits and long-term debt, and the inclusion of credit card balance transfer fees in interest income beginning in the first quarter of 2012. Refer to the “Interest Rate Risk Management” section for further information on the sensitivity of the Company’s net interest income to changes in interest rates.
Average total loans were $215.4 billion in 2012, compared with $201.4 billion in 2011. The $13.9 billion (6.9 percent) increase was driven by growth in commercial loans, residential mortgages, credit card loans and commercial real estate loans, partially offset by decreases in other retail loans and covered loans. Average commercial loans increased $9.2 billion (17.9 percent) year-over-year, primarily driven by higher demand from new and existing customers. Average residential mortgages increased $6.6 billion (19.5 percent), reflecting higher origination and refinancing activity due to the low interest rate environment. Average credit card balances increased $569 million (3.5 percent) in 2012, compared with 2011, reflecting the impact of the purchase of a credit card portfolio in the fourth quarter of 2011, partially offset by a portfolio sale in the third quarter of 2012. Growth in average commercial real estate balances of $991 million (2.8 percent) was primarily due to higher demand from new and existing customers. The $261 million (.5 percent) decrease in average other retail loans was primarily due to lower home equity and second mortgage and student loan balances, partially offset by higher installment loan and retail leasing balances. Average covered loans decreased $3.1 billion (19.3 percent) in 2012, compared with 2011.
| 22 | U.S. BANCORP |
| TABLE 2 | Analysis of Net Interest Income (a) |
| Year Ended December 31 (Dollars in Millions) | 2012 | 2011 | 2010 | 2012 v 2011 |
2011 v 2010 |
|||||||||||||||||
| Components of Net Interest Income |
||||||||||||||||||||||
| Income on earning assets (taxable-equivalent basis) |
$ | 13,112 | $ | 12,870 | $ | 12,375 | $ | 242 | $ | 495 | ||||||||||||
| Expense on interest-bearing liabilities (taxable-equivalent basis) |
2,143 | 2,522 | 2,587 | (379 | ) | (65 | ) | |||||||||||||||
| Net interest income (taxable-equivalent basis) |
$ | 10,969 | $ | 10,348 | $ | 9,788 | $ | 621 | $ | 560 | ||||||||||||
| Net interest income, as reported |
$ | 10,745 | $ | 10,123 | $ | 9,579 | $ | 622 | $ | 544 | ||||||||||||
| Average Yields and Rates Paid |
||||||||||||||||||||||
| Earning assets yield (taxable-equivalent basis) |
4.28 | % | 4.54 | % | 4.91 | % | (.26 | )% | (.37 | )% | ||||||||||||
| Rate paid on interest-bearing liabilities (taxable-equivalent basis) |
.95 | 1.14 | 1.24 | (.19 | ) | (.10 | ) | |||||||||||||||
| Gross interest margin (taxable-equivalent basis) |
3.33 | % | 3.40 | % | 3.67 | % | (.07 | )% | (.27 | )% | ||||||||||||
| Net interest margin (taxable-equivalent basis) |
3.58 | % | 3.65 | % | 3.88 | % | (.07 | )% | (.23 | )% | ||||||||||||
| Average Balances |
||||||||||||||||||||||
| Investment securities (b) |
$ | 72,501 | $ | 63,645 | $ | 47,763 | $ | 8,856 | $ | 15,882 | ||||||||||||
| Loans |
215,374 | 201,427 | 193,022 | 13,947 | 8,405 | |||||||||||||||||
| Earning assets |
306,270 | 283,290 | 252,042 | 22,980 | 31,248 | |||||||||||||||||
| Interest-bearing liabilities |
225,466 | 221,690 | 209,113 | 3,776 | 12,577 | |||||||||||||||||
| (a) | Interest and rates are presented on a fully taxable-equivalent basis utilizing a federal tax rate of 35 percent. |
| (b) | Excludes unrealized gains and losses on available-for-sale investment securities and any premiums or discounts recorded related to the transfer of investment securities at fair value from available-for-sale to held-to-maturity. |
Average investment securities in 2012 were $8.9 billion (13.9 percent) higher than 2011, primarily due to purchases of government agency mortgage-backed securities, net of prepayments and maturities, as the Company continued to increase its on-balance sheet liquidity in response to anticipated regulatory requirements.
Average total deposits for 2012 were $22.6 billion (10.6 percent) higher than 2011. Average noninterest-bearing deposits in 2012 were $13.4 billion (24.9 percent) higher than 2011 due to growth in average balances in a majority of the lines of business, including Wholesale Banking and Commercial Real Estate, Wealth Management and Securities Services, and Consumer and Small Business Banking. Average total savings deposits were $7.3 billion (6.4 percent) higher in 2012, compared with 2011, primarily due to growth in Consumer and Small Business Banking balances resulting from continued strong participation in a product offering that includes multiple bank products in a package, and higher corporate trust balances. These increases were partially offset by lower government banking and broker-dealer balances. Average time certificates of deposit less than $100,000 were lower in 2012 by $728 million (4.8 percent), compared with 2011, a result of maturities and lower renewals. Average time deposits greater than $100,000 were $2.6 billion (8.8 percent) higher in 2012, compared with 2011. Time deposits greater than $100,000 are managed as an alternative to other funding sources such as wholesale borrowing, based largely on relative pricing.
The $560 million (5.7 percent) increase in net interest income in 2011, compared with 2010, was primarily the result of growth in average earning assets and lower cost core deposit funding. Average earning assets were $31.2 billion (12.4 percent) higher in 2011 compared with 2010, driven by increases in investment securities, loans and cash balances at the Federal Reserve reflected in other earning assets. Average deposits increased $28.4 billion (15.4 percent) in 2011, compared with 2010.
Average total loans increased $8.4 billion (4.4 percent) in 2011, compared with 2010, driven by growth in residential mortgages, commercial loans, commercial real estate loans and other retail loans, partially offset by lower covered loans and credit card loans. Average residential mortgages increased $6.0 billion (21.7 percent) resulting from the net effect of origination and prepayment activity in the portfolio during 2011 due to the low interest rate environment. Average commercial loans increased $4.6 billion (9.8 percent) in 2011, compared with 2010, primarily driven by higher demand from new and existing customers, including small business. Growth in average commercial real estate balances of $1.2 billion (3.6 percent) was primarily due to the FCB acquisition. The $513 million (1.1 percent) increase in average other retail loans in 2011, compared with 2010, was primarily due to higher automobile and installment loans, and retail leasing balances, partially offset by lower home equity and second mortgage balances. Average credit card balances decreased $319 million (1.9 percent), as a result of consumers spending less and paying down their balances. Average covered loans decreased $3.6 billion (18.2 percent) in 2011, compared with 2010.
| U.S. BANCORP | 23 |
| TABLE 3 | Net Interest Income — Changes Due to Rate and Volume (a) |
| 2012 v 2011 | 2011 v 2010 | |||||||||||||||||||||||||
| Year Ended December 31 (Dollars in Millions) | Volume | Yield/Rate | Total | Volume | Yield/Rate | Total | ||||||||||||||||||||
| Increase (decrease) in |
||||||||||||||||||||||||||
| Interest Income |
||||||||||||||||||||||||||
| Investment securities |
$ | 275 | $ | (316 | ) | $ | (41 | ) | $ | 586 | $ | (369 | ) | $ | 217 | |||||||||||
| Loans held for sale |
122 | (40 | ) | 82 | (32 | ) | (14 | ) | (46 | ) | ||||||||||||||||
| Loans |
||||||||||||||||||||||||||
| Commercial |
369 | (272 | ) | 97 | 193 | (99 | ) | 94 | ||||||||||||||||||
| Commercial real estate |
45 | (29 | ) | 16 | 56 | 36 | 92 | |||||||||||||||||||
| Residential mortgages |
318 | (123 | ) | 195 | 311 | (115 | ) | 196 | ||||||||||||||||||
| Credit card |
54 | 101 | 155 | (30 | ) | 52 | 22 | |||||||||||||||||||
| Other retail |
(14 | ) | (147 | ) | (161 | ) | 30 | (137 | ) | (107 | ) | |||||||||||||||
| Total loans, excluding covered loans |
772 | (470 | ) | 302 | 560 | (263 | ) | 297 | ||||||||||||||||||
| Covered loans |
(179 | ) | 77 | (102 | ) | (179 | ) | 122 | (57 | ) | ||||||||||||||||
| Total loans |
593 | (393 | ) | 200 | 381 | (141 | ) | 240 | ||||||||||||||||||
| Other earning assets |
(52 | ) | 53 | 1 | 226 | (142 | ) | 84 | ||||||||||||||||||
| Total earning assets |
938 | (696 | ) | 242 | 1,161 | (666 | ) | 495 | ||||||||||||||||||
| Interest Expense |
||||||||||||||||||||||||||
| Interest-bearing deposits |
||||||||||||||||||||||||||
| Interest checking |
4 | (23 | ) | (19 | ) | 5 | (17 | ) | (12 | ) | ||||||||||||||||
| Money market accounts |
3 | (17 | ) | (14 | ) | 18 | (74 | ) | (56 | ) | ||||||||||||||||
| Savings accounts |
12 | (58 | ) | (46 | ) | 33 | (42 | ) | (9 | ) | ||||||||||||||||
| Time certificates of deposit less than $100,000 |
(14 | ) | (28 | ) | (42 | ) | (25 | ) | 12 | (13 | ) | |||||||||||||||
| Time deposits greater than $100,000 |
26 | (54 | ) | (28 | ) | 25 | (23 | ) | 2 | |||||||||||||||||
| Total interest-bearing deposits |
31 | (180 | ) | (149 | ) | 56 | (144 | ) | (88 | ) | ||||||||||||||||
| Short-term borrowings |
(38 | ) | (52 | ) | (90 | ) | (50 | ) | 31 | (19 | ) | |||||||||||||||
| Long-term debt |
(117 | ) | (23 | ) | (140 | ) | 30 | 12 | 42 | |||||||||||||||||
| Total interest-bearing liabilities |
(124 | ) | (255 | ) | (379 | ) | 36 | (101 | ) | (65 | ) | |||||||||||||||
| Increase (decrease) in net interest income |
$ | 1,062 | $ | (441 | ) | $ | 621 | $ | 1,125 | $ | (565 | ) | $ | 560 | ||||||||||||
| (a) | This table shows the components of the change in net interest income by volume and rate on a taxable-equivalent basis utilizing a tax rate of 35 percent. This table does not take into account the level of noninterest-bearing funding, nor does it fully reflect changes in the mix of assets and liabilities. The change in interest not solely due to changes in volume or rates has been allocated on a pro-rata basis to volume and yield/rate. |
Average investment securities in 2011 were $15.9 billion (33.3 percent) higher than 2010, primarily due to planned purchases of U.S. Treasury and government agency mortgage-backed securities, as the Company increased its on-balance sheet liquidity in response to anticipated regulatory requirements.
Average total deposits for 2011 were $28.4 billion (15.4 percent) higher than 2010. Excluding deposits from acquisitions, 2011 average total deposits increased $19.3 billion (10.5 percent) over 2010. Average noninterest-bearing deposits in 2011 were $13.7 billion (34.1 percent) higher than 2010, primarily due to growth in Wholesale Banking and Commercial Real Estate, and Wealth Management and Securities Services balances. Average total savings deposits were $13.8 billion (13.7 percent) higher in 2011, compared with 2010, primarily due to growth in corporate and institutional trust balances, as well as an increase in Consumer and Small Business Banking balances. These increases were partially offset by lower broker-dealer balances. Average time certificates of deposit less than $100,000 were lower in 2011 by $1.4 billion (8.4 percent), compared with 2010, a result of maturities and lower renewals. Average time deposits greater than $100,000 were $2.3 billion (8.5 percent) higher in 2011, compared with 2010, primarily due to acquisitions.
Provision for Credit Losses The provision for credit losses reflects changes in the size and credit quality of the entire portfolio of loans. The Company maintains an allowance for credit losses considered appropriate by management for probable and estimable incurred losses, based on factors discussed in the “Analysis and Determination of Allowance for Credit Losses” section.
In 2012, the provision for credit losses was $1.9 billion, compared with $2.3 billion and $4.4 billion in 2011 and 2010, respectively. The provision for credit losses was lower than net charge-offs by $215 million in 2012 and $500 million in 2011, and exceeded net charge-offs by $175 million in 2010. The $461 million (19.7 percent) decrease in the provision for credit losses in 2012, compared with 2011, reflected improving credit trends and the underlying risk profile of the loan portfolio as economic conditions continued to slowly improve, partially offset by portfolio growth. Accruing loans ninety days or more past due decreased by $183 million (21.7 percent) (excluding covered loans) from
| 24 | U.S. BANCORP |
December 31, 2011 to December 31, 2012, reflecting improvement in residential mortgages, credit card and other retail loan portfolios during 2012. Nonperforming assets decreased $486 million (18.9 percent) (excluding covered assets) from December 31, 2011 to December 31, 2012, led by reductions in nonperforming construction and development loans of $307 million (56.3 percent), as the Company continued to resolve and reduce exposure to these problem assets, as well as improvement in other commercial loan portfolios. Net charge-offs decreased $746 million (26.2 percent) from 2011, due to the improvement in most loan portfolios as economic conditions continued to slowly improve.
The $2.0 billion (46.2 percent) decrease in the provision for credit losses in 2011, compared with 2010, reflected improving credit trends and the underlying risk profile of the loan portfolio as economic conditions continued to stabilize in 2011, partially offset by portfolio growth. Accruing loans ninety days or more past due decreased by $251 million (22.9 percent) (excluding covered loans) from December 31, 2010 to December 31, 2011, reflecting a moderation in the level of stress in economic conditions during 2011 as compared to 2010. Nonperforming assets decreased $777 million (23.2 percent) (excluding covered assets) from December 31, 2010 to December 31, 2011, led by a reduction in commercial real estate nonperforming assets of $394 million (30.5 percent), as the Company continued to resolve and reduce exposure to these assets. Net charge-offs decreased $1.3 billion (32.0 percent) in 2011 from 2010, due to the improvement in the commercial, commercial real estate, credit card and other retail loan portfolios.
Refer to “Corporate Risk Profile” for further information on the provision for credit losses, net charge-offs, nonperforming assets and other factors considered by the Company in assessing the credit quality of the loan portfolio and establishing the allowance for credit losses.
Noninterest Income Noninterest income in 2012 was $9.3 billion, compared with $8.8 billion in 2011 and $8.4 billion in 2010. The $559 million (6.4 percent) increase in 2012 over 2011 was due to strong mortgage banking revenue growth of 96.5 percent, principally due to strong origination and sales revenue, as well as an increase in loan servicing revenue. In addition, merchant processing services revenue and investment products fees and commissions increased 3.0 percent and 16.3 percent, respectively, primarily due to higher transaction volumes. Trust and investment management fees increased 5.5 percent due to improved market conditions and business expansion. Commercial products revenue was 4.4 percent higher, principally driven by increases in high-grade bond underwriting fees and commercial loan fees. Net securities losses were 51.6 percent lower in 2012, compared with 2011, primarily due to higher realized gains on securities sold in 2012. Offsetting these positive variances was a 16.9 percent decrease in credit and debit card revenue due to lower debit card interchange fees as a result of 2011 legislation (estimated impact of $328 million for 2012 and $77 million for 2011), net of mitigation efforts, and the impact of the inclusion of credit card balance transfer fees in interest income beginning in the first quarter of 2012. ATM processing services revenue was lower 23.5 percent, due to excluding surcharge fees the Company passes through to others from revenue, beginning in the first quarter of 2012, rather than reporting those amounts in occupancy expense as in previous periods. Other income also decreased 26.5 percent, primarily due to the 2011 merchant settlement gain, gain on the FCB acquisition and gains related to the Company’s investment in Visa Inc., and a 2012 equity-method investment charge, partially offset by a 2012 gain on the sale of a credit card portfolio.
| TABLE 4 | Noninterest Income |
| Year Ended December 31 (Dollars in Millions) | 2012 | 2011 | 2010 | 2012 v 2011 |
2011 v 2010 |
|||||||||||||||||
| Credit and debit card revenue |
$ | 892 | $ | 1,073 | $ | 1,091 | (16.9 | )% | (1.6 | )% | ||||||||||||
| Corporate payment products revenue |
744 | 734 | 710 | 1.4 | 3.4 | |||||||||||||||||
| Merchant processing services |
1,395 | 1,355 | 1,253 | 3.0 | 8.1 | |||||||||||||||||
| ATM processing services |
346 | 452 | 423 | (23.5 | ) | 6.9 | ||||||||||||||||
| Trust and investment management fees |
1,055 | 1,000 | 1,080 | 5.5 | (7.4 | ) | ||||||||||||||||
| Deposit service charges |
653 | 659 | 710 | (.9 | ) | (7.2 | ) | |||||||||||||||
| Treasury management fees |
541 | 551 | 555 | (1.8 | ) | (.7 | ) | |||||||||||||||
| Commercial products revenue |
878 | 841 | 771 | 4.4 | 9.1 | |||||||||||||||||
| Mortgage banking revenue |
1,937 | 986 | 1,003 | 96.5 | (1.7 | ) | ||||||||||||||||
| Investment products fees and commissions |
150 | 129 | 111 | 16.3 | 16.2 | |||||||||||||||||
| Securities gains (losses), net |
(15 | ) | (31 | ) | (78 | ) | 51.6 | 60.3 | ||||||||||||||
| Other |
743 | 1,011 | 731 | (26.5 | ) | 38.3 | ||||||||||||||||
| Total noninterest income |
$ | 9,319 | $ | 8,760 | $ | 8,360 | 6.4 | % | 4.8 | % | ||||||||||||
| U.S. BANCORP | 25 |
The $400 million (4.8 percent) increase in noninterest income in 2011 over 2010 was due to higher payments-related revenues of 3.5 percent due to growth in transaction volumes and new business initiatives, partially offset by a decline in credit and debit card revenue due to the impact of legislative changes to debit card interchange fees beginning in the fourth quarter of 2011; higher ATM processing services income of 6.9 percent largely due to increased transaction volumes; an increase in commercial products revenue of 9.1 percent due to higher commercial leasing revenue, syndication fees and other commercial loan fees; a 16.2 percent increase in investment products fees and commissions due to business initiatives; and lower net securities losses of 60.3 percent, primarily due to lower impairments and an increase in other income. The increase in other income of 38.3 percent reflected the 2011 merchant settlement gain, the gain on the FCB acquisition and gains related to the Company’s investment in Visa Inc., in addition to higher retail lease residual revenue, partially offset by a gain recognized on the exchange of the Company’s proprietary long-term mutual fund business for an equity interest in Nuveen Investments in 2010. Offsetting these positive variances was a decrease in deposit service charges of 7.2 percent as a result of 2010 legislative and pricing changes. Trust and investment management fees declined 7.4 percent as a result of the sale of the Company’s proprietary long-term mutual fund business and lower money market investment management fees, due to the low interest rate environment, partially offset by the positive impact of a securitization trust administration acquisition and improved equity market conditions. Mortgage banking revenue decreased 1.7 percent, principally due to lower origination and sales revenue, partially offset by higher loan servicing revenue and a favorable net change in the valuation of mortgage servicing rights (“MSRs”) and related economic hedging activities.
Noninterest Expense Noninterest expense in 2012 was $10.5 billion, compared with $9.9 billion in 2011 and $9.4 billion in 2010. The Company’s efficiency ratio was 51.5 percent in 2012, compared with 51.8 percent in 2011. The $545 million (5.5 percent) increase in noninterest expense in 2012 over 2011 was principally due to higher compensation expense, employee benefits expense and professional services expense. Compensation expense increased 6.9 percent, primarily as a result of growth in staffing for business initiatives and mortgage servicing-related activities, in addition to higher commissions and merit increases. Employee benefits expense increased 11.8 percent principally due to higher pension and medical insurance costs and staffing levels. Professional services expense increased 38.4 percent principally due to mortgage servicing review-related projects. Technology and communications expense was 8.3 percent higher due to business expansion and technology projects. Other expense increased 2.2 percent in 2012, from 2011, reflecting the $80 million expense accrual for a mortgage foreclosure-related regulatory settlement, higher regulatory and insurance-related costs and an accrual recorded by the Company related to its portion of obligations associated with Visa Inc., partially offset by a $130 million expense accrual related to mortgage servicing matters recorded in 2011, lower FDIC assessments and lower costs related to other real estate owned. These increases were partially offset by a decrease of 8.2 percent in net occupancy and equipment expense, principally reflecting the change in presentation of ATM surcharge revenue passed through to others, and a 8.4 percent decrease in other intangibles expense due to the reduction or completion of amortization of certain intangibles.
The $528 million (5.6 percent) increase in noninterest expense in 2011 over 2010 was principally due to increased compensation, employee benefits, net occupancy and equipment, and professional services expenses, partially offset by a decrease in other intangibles expense. Compensation expense increased 6.9 percent, primarily due to an increase in
| TABLE 5 | Noninterest Expense |
| Year Ended December 31 (Dollars in Millions) | 2012 | 2011 | 2010 | 2012 v 2011 |
2011 v 2010 |
|||||||||||||||||
| Compensation |
$ | 4,320 | $ | 4,041 | $ | 3,779 | 6.9 | % | 6.9 | % | ||||||||||||
| Employee benefits |
945 | 845 | 694 | 11.8 | 21.8 | |||||||||||||||||
| Net occupancy and equipment |
917 | 999 | 919 | (8.2 | ) | 8.7 | ||||||||||||||||
| Professional services |
530 | 383 | 306 | 38.4 | 25.2 | |||||||||||||||||
| Marketing and business development |
388 | 369 | 360 | 5.1 | 2.5 | |||||||||||||||||
| Technology and communications |
821 | 758 | 744 | 8.3 | 1.9 | |||||||||||||||||
| Postage, printing and supplies |
304 | 303 | 301 | .3 | .7 | |||||||||||||||||
| Other intangibles |
274 | 299 | 367 | (8.4 | ) | (18.5 | ) | |||||||||||||||
| Other |
1,957 | 1,914 | 1,913 | 2.2 | .1 | |||||||||||||||||
| Total noninterest expense |
$ | 10,456 | $ | 9,911 | $ | 9,383 | 5.5 | % | 5.6 | % | ||||||||||||
| Efficiency ratio (a) |
51.5 | % | 51.8 | % | 51.5 | % | ||||||||||||||||
| (a) | Computed as noninterest expense divided by the sum of net interest income on a taxable-equivalent basis and noninterest income excluding securities gains (losses), net. |
| 26 | U.S. BANCORP |
staffing related to branch expansion and other business initiatives, and merit increases. Employee benefits expense increased 21.8 percent due to higher pension costs and the impact of additional staffing. Net occupancy and equipment expense increased 8.7 percent, principally due to business expansion and technology initiatives. Professional services expense increased 25.2 percent due to mortgage servicing-related and other projects across multiple business lines. Other intangibles expense decreased 18.5 percent due to the reduction or completion of amortization of certain intangibles. Other expense was essentially flat and reflected the $130 million expense accrual related to mortgage servicing matters recorded in 2011, offset by lower conversion costs and insurance and litigation related costs.
Pension Plans Because of the long-term nature of pension plans, the related accounting is complex and can be impacted by several factors, including investment funding policies, accounting methods and actuarial assumptions.
The Company’s pension accounting reflects the long-term nature of the benefit obligations and the investment horizon of plan assets. Amounts recorded in the financial statements reflect actuarial assumptions about participant benefits and plan asset returns. Changes in actuarial assumptions and differences in actual plan experience compared with actuarial assumptions are deferred and recognized in expense in future periods. Differences related to participant benefits are recognized in expense over the future service period of the employees. Differences related to the expected return on plan assets are included in expense over a period of approximately twelve years.
The Company expects pension expense to increase $158 million in 2013, primarily driven by a $92 million increase related to a decrease in the discount rate, a $51 million increase related to the recognition of deferred actuarial losses from previous years and a $12 million increase related to lower future expected returns on plan assets. If performance of plan assets equals the actuarially-assumed long-term expected return, the cumulative asset return difference not yet being amortized will not have a significant incremental impact on pension expense in future years. Because of the complexity of forecasting pension plan activities, the accounting methods utilized for pension plans, the Company’s ability to respond to factors affecting the plans and the hypothetical nature of actuarial assumptions, actual pension expense will differ from these amounts.
Refer to Note 16 of the Notes to the Consolidated Financial Statements for further information on the Company’s pension plan funding practices, investment policies and asset allocation strategies, and accounting policies for pension plans.
The following table shows an analysis of hypothetical changes in the long-term rate of return (“LTROR”) and discount rate:
| LTROR (Dollars in Millions) | Down 100 Basis Points |
Up 100 Basis Points |
||||||
| Incremental benefit (expense) |
$ | (24 | ) | $ | 24 | |||
| Percent of 2012 net income |
(.26 | )% | .26 | % | ||||
| Discount Rate (Dollars in Millions) | Down 100 Basis Points |
Up 100 Basis Points |
||||||
| Incremental benefit (expense) |
$ | (115 | ) | $ | 92 | |||
| Percent of 2012 net income |
(1.26 | )% | 1.01 | % | ||||
Income Tax Expense The provision for income taxes was $2.2 billion (an effective rate of 28.9 percent) in 2012, compared with $1.8 billion (an effective rate of 27.8 percent) in 2011 and $935 million (an effective rate of 22.3 percent) in 2010. The increase in the effective tax rate over 2011 principally reflected the impact of higher pretax earnings year-over-year.
For further information on income taxes, refer to Note 18 of the Notes to Consolidated Financial Statements.
Balance Sheet Analysis
Average earning assets were $306.3 billion in 2012, compared with $283.3 billion in 2011. The increase in average earning assets of $23.0 billion (8.1 percent) was primarily due to an increase in loan balances of $13.9 billion (6.9 percent) and planned increases in investment securities of $8.9 billion (13.9 percent).
For average balance information, refer to Consolidated Daily Average Balance Sheet and Related Yields and Rates on pages 142 and 143.
Loans The Company’s loan portfolio was $223.3 billion at December 31, 2012, an increase of $13.5 billion (6.4 percent) from December 31, 2011. The increase was driven by growth in commercial loans of $9.6 billion (16.9 percent), residential mortgages of $6.9 billion (18.7 percent) and commercial real estate loans of $1.1 billion (3.1 percent), partially offset by decreases in covered loans of $3.5 billion (23.5 percent), credit card loans of $245 million (1.4 percent), reflecting the impact of the sale of a branded portfolio in 2012, and other retail loans of $395 million (.8 percent). Table 6 provides a summary of the loan distribution by product type, while Table 12 provides a summary of the selected loan maturity distribution by loan category. Average total loans increased $13.9 billion (6.9 percent) in 2012, compared with 2011. The increase was due to growth in most loan portfolio classes in 2012.
| U.S. BANCORP | 27 |
Commercial Commercial loans, including lease financing, increased $9.6 billion (16.9 percent) as of December 31, 2012, compared with December 31, 2011. Average commercial loans increased $9.2 billion (17.9 percent) in 2012, compared with 2011. The growth was primarily driven by higher demand from new and existing customers. Table 7 provides a summary of commercial loans by industry and geographical locations.
Commercial Real Estate The Company’s portfolio of commercial real estate loans, which includes commercial mortgages and construction and development loans, increased $1.1 billion (3.1 percent) at December 31, 2012, compared with December 31, 2011. Average commercial real estate loans increased $991 million (2.8 percent) in 2012, compared with 2011. The increases reflected higher demand from new and existing customers. Table 8 provides a summary of commercial real estate loans by property type and geographical location. The collateral for $1.7 billion of commercial real estate loans included in covered loans at December 31, 2012 was in California, compared with $2.5 billion at December 31, 2011.
The Company classifies loans as construction loans until the completion of the construction phase. Following construction, if permanent financing is provided by the Company, the loan is reclassified to the commercial mortgage category. In 2012, approximately $978 million of construction loans were reclassified to the commercial mortgage category for bridge financing after completion of the construction phase. At December 31, 2012 and 2011, $225 million and $289 million, respectively, of tax-exempt industrial development loans were secured by real estate. The Company’s commercial mortgage and construction and development loans had unfunded commitments of $9.0 billion and $7.0 billion at December 31, 2012 and 2011, respectively.
The Company also finances the operations of real estate developers and other entities with operations related to real estate. These loans are not secured directly by real estate but are subject to terms and conditions similar to commercial loans. These loans were included in the commercial loan category and totaled $3.1 billion and $1.9 billion at December 31, 2012 and 2011, respectively.
| TABLE 6 | Loan Portfolio Distribution |
| 2012 | 2011 | 2010 | 2009 | 2008 | ||||||||||||||||||||||||||||||||||||||||||||
| At December 31 (Dollars in Millions) | Amount | Percent of Total |
Amount | Percent of Total |
Amount | Percent of Total |
Amount | Percent of Total |
Amount | Percent of Total |
||||||||||||||||||||||||||||||||||||||
| Commercial |
||||||||||||||||||||||||||||||||||||||||||||||||
| Commercial |
$ | 60,742 | 27.2 | % | $ | 50,734 | 24.2 | % | $ | 42,272 | 21.5 | % | $ | 42,255 | 21.7 | % | $ | 49,759 | 26.9 | % | ||||||||||||||||||||||||||||
| Lease financing |
5,481 | 2.5 | 5,914 | 2.8 | 6,126 | 3.1 | 6,537 | 3.4 | 6,859 | 3.7 | ||||||||||||||||||||||||||||||||||||||
| Total commercial |
66,223 | 29.7 | 56,648 | 27.0 | 48,398 | 24.6 | 48,792 | 25.1 | 56,618 | 30.6 | ||||||||||||||||||||||||||||||||||||||
| Commercial Real Estate |
||||||||||||||||||||||||||||||||||||||||||||||||
| Commercial mortgages |
31,005 | 13.9 | 29,664 | 14.1 | 27,254 | 13.8 | 25,306 | 13.0 | 23,434 | 12.7 | ||||||||||||||||||||||||||||||||||||||
| Construction and development |
5,948 | 2.6 | 6,187 | 3.0 | 7,441 | 3.8 | 8,787 | 4.5 | 9,779 | 5.3 | ||||||||||||||||||||||||||||||||||||||
| Total commercial real estate |
36,953 | 16.5 | 35,851 | 17.1 | 34,695 | 17.6 | 34,093 | 17.5 | 33,213 | 18.0 | ||||||||||||||||||||||||||||||||||||||
| Residential Mortgages |
||||||||||||||||||||||||||||||||||||||||||||||||
| Residential mortgages |
32,648 | 14.6 | 28,669 | 13.7 | 24,315 | 12.3 | 20,581 | 10.6 | 18,232 | 9.9 | ||||||||||||||||||||||||||||||||||||||
| Home equity loans, first liens |
11,370 | 5.1 | 8,413 | 4.0 | 6,417 | 3.3 | 5,475 | 2.8 | 5,348 | 2.9 | ||||||||||||||||||||||||||||||||||||||
| Total residential mortgages |
44,018 | 19.7 | 37,082 | 17.7 | 30,732 | 15.6 | 26,056 | 13.4 | 23,580 | 12.8 | ||||||||||||||||||||||||||||||||||||||
| Credit Card |
17,115 | 7.7 | 17,360 | 8.3 | 16,803 | 8.5 | 16,814 | 8.6 | 13,520 | 7.3 | ||||||||||||||||||||||||||||||||||||||
| Other Retail |
||||||||||||||||||||||||||||||||||||||||||||||||
| Retail leasing |
5,419 | 2.4 | 5,118 | 2.4 | 4,569 | 2.3 | 4,568 | 2.3 | 5,126 | 2.8 | ||||||||||||||||||||||||||||||||||||||
| Home equity and second mortgages |
16,726 | 7.5 | 18,131 | 8.6 | 18,940 | 9.6 | 19,439 | 10.0 | 19,177 | 10.3 | ||||||||||||||||||||||||||||||||||||||
| Revolving credit |
3,332 | 1.5 | 3,344 | 1.6 | 3,472 | 1.8 | 3,506 | 1.8 | 3,205 | 1.7 | ||||||||||||||||||||||||||||||||||||||
| Installment |
5,463 | 2.4 | 5,348 | 2.6 | 5,459 | 2.8 | 5,455 | 2.8 | 5,525 | 3.0 | ||||||||||||||||||||||||||||||||||||||
| Automobile |
12,593 | 5.6 | 11,508 | 5.5 | 10,897 | 5.5 | 9,544 | 4.9 | 9,212 | 5.0 | ||||||||||||||||||||||||||||||||||||||
| Student |
4,179 | 1.9 | 4,658 | 2.2 | 5,054 | 2.5 | 4,629 | 2.4 | 4,603 | 2.5 | ||||||||||||||||||||||||||||||||||||||
| Total other retail |
47,712 | 21.3 | 48,107 | 22.9 | 48,391 | 24.5 | 47,141 | 24.2 | 46,848 | 25.3 | ||||||||||||||||||||||||||||||||||||||
| Total loans, excluding covered loans |
212,021 | 94.9 | 195,048 | 93.0 | 179,019 | 90.8 | 172,896 | 88.8 | 173,779 | 94.0 | ||||||||||||||||||||||||||||||||||||||
| Covered Loans |
11,308 | 5.1 | 14,787 | 7.0 | 18,042 | 9.2 | 21,859 | 11.2 | 11,176 | 6.0 | ||||||||||||||||||||||||||||||||||||||
| Total loans |
$ | 223,329 | 100.0 | % | $ | 209,835 | 100.0 | % | $ | 197,061 | 100.0 | % | $ | 194,755 | 100.0 | % | $ | 184,955 | 100.0 | % | ||||||||||||||||||||||||||||
| 28 | U.S. BANCORP |
| TABLE 7 | Commercial Loans by Industry Group and Geography |
| December 31, 2012 | December 31, 2011 | |||||||||||||||||
| (Dollars in Millions) | Loans | Percent | Loans | Percent | ||||||||||||||
| Industry Group |
||||||||||||||||||
| Manufacturing |
$ | 9,518 | 14.4 | % | $ | 8,085 | 14.3 | % | ||||||||||
| Finance and insurance |
6,579 | 9.9 | 5,749 | 10.1 | ||||||||||||||
| Wholesale trade |
6,297 | 9.5 | 5,485 | 9.7 | ||||||||||||||
| Real estate, rental and leasing |
5,855 | 8.8 | 4,229 | 7.5 | ||||||||||||||
| Retail trade |
4,735 | 7.2 | 3,683 | 6.5 | ||||||||||||||
| Healthcare and social assistance |
4,733 | 7.1 | 3,850 | 6.8 | ||||||||||||||
| Public administration |
4,709 | 7.1 | 3,695 | 6.5 | ||||||||||||||
| Transport and storage |
2,549 | 3.9 | 2,409 | 4.3 | ||||||||||||||
| Information |
2,203 | 3.3 | 2,115 | 3.7 | ||||||||||||||
| Professional, scientific and technical services |
2,185 | 3.3 | 1,932 | 3.4 | ||||||||||||||
| Arts, entertainment and recreation |
2,124 | 3.2 | 2,046 | 3.6 | ||||||||||||||
| Mining |
2,122 | 3.2 | 1,987 | 3.5 | ||||||||||||||
| Educational services |
1,964 | 3.0 | 1,422 | 2.5 | ||||||||||||||
| Other services |
1,670 | 2.5 | 1,760 | 3.1 | ||||||||||||||
| Agriculture, forestry, fishing and hunting |
1,553 | 2.4 | 1,429 | 2.5 | ||||||||||||||
| Utilities |
1,390 | 2.1 | 1,272 | 2.3 | ||||||||||||||
| Other |
6,037 | 9.1 | 5,500 | 9.7 | ||||||||||||||
| Total |
$ | 66,223 | 100.0 | % | $ | 56,648 | 100.0 | % | ||||||||||
| Geography |
||||||||||||||||||
| California |
$ | 8,081 | 12.2 | % | $ | 6,664 | 11.8 | % | ||||||||||
| Colorado |
2,722 | 4.1 | 2,292 | 4.0 | ||||||||||||||
| Illinois |
3,544 | 5.3 | 3,110 | 5.5 | ||||||||||||||
| Minnesota |
4,720 | 7.1 | 3,968 | 7.0 | ||||||||||||||
| Missouri |
2,922 | 4.4 | 2,499 | 4.4 | ||||||||||||||
| Ohio |
3,240 | 4.9 | 3,050 | 5.4 | ||||||||||||||
| Oregon |
1,792 | 2.7 | 1,514 | 2.7 | ||||||||||||||
| Washington |
2,626 | 4.0 | 2,568 | 4.5 | ||||||||||||||
| Wisconsin |
2,727 | 4.1 | 2,357 | 4.2 | ||||||||||||||
| Iowa, Kansas, Nebraska, North Dakota, South Dakota |
4,244 | 6.4 | 3,586 | 6.3 | ||||||||||||||
| Arkansas, Indiana, Kentucky, Tennessee |
3,545 | 5.4 | 3,246 | 5.7 | ||||||||||||||
| Idaho, Montana, Wyoming |
1,096 | 1.7 | 1,113 | 2.0 | ||||||||||||||
| Arizona, Nevada, New Mexico, Utah |
2,435 | 3.7 | 2,351 | 4.1 | ||||||||||||||
| Total banking region |
43,694 | 66.0 | 38,318 | 67.6 | ||||||||||||||
| Florida, Michigan, New York, Pennsylvania, Texas |
11,082 | 16.7 | 9,204 | 16.3 | ||||||||||||||
| All other states |
11,447 | 17.3 | 9,126 | 16.1 | ||||||||||||||
| Total outside Company’s banking region |
22,529 | 34.0 | 18,330 | 32.4 | ||||||||||||||
| Total |
$ | 66,223 | 100.0 | % | $ | 56,648 | 100.0 | % | ||||||||||
Residential Mortgages Residential mortgages held in the loan portfolio at December 31, 2012, increased $6.9 billion (18.7 percent) over December 31, 2011. Average residential mortgages increased $6.6 billion (19.5 percent) in 2012, compared with 2011. The growth reflected origination and refinancing activity due to the low interest rate environment. Residential mortgages originated and placed in the Company’s loan portfolio are primarily well secured jumbo mortgages to borrowers with high credit quality. The Company generally retains portfolio loans through maturity; however, the Company’s intent may change over time based upon various factors such as ongoing asset/liability management activities, assessment of product profitability, credit risk, liquidity needs, and capital implications. If the Company’s intent or ability to hold an existing portfolio loan changes, it is transferred to loans held for sale.
Credit Card Total credit card loans decreased $245 million (1.4 percent) at December 31, 2012, compared with December 31, 2011, reflecting the impact of the sale of a branded credit card portfolio during the third quarter of 2012 and customers paying down their balances. Average credit card balances increased $569 million (3.5 percent) in 2012, compared with 2011, reflecting the impact of the purchase of a credit card portfolio in the fourth quarter of 2011, partially offset by the portfolio sale in the third quarter of 2012.
| U.S. BANCORP | 29 |
| TABLE 8 | Commercial Real Estate Loans by Property Type and Geography |
| December 31, 2012 | December 31, 2011 | |||||||||||||||||
| (Dollars in Millions) | Loans | Percent | Loans | Percent | ||||||||||||||
| Property Type |
||||||||||||||||||
| Business owner occupied |
$ | 11,405 | 30.9 | % | $ | 11,756 | 32.8 | % | ||||||||||
| Commercial property |
||||||||||||||||||
| Industrial |
1,586 | 4.3 | 1,561 | 4.4 | ||||||||||||||
| Office |
4,833 | 13.1 | 4,590 | 12.8 | ||||||||||||||
| Retail |
4,537 | 12.3 | 4,402 | 12.3 | ||||||||||||||
| Other commercial |
3,735 | 10.1 | 3,632 | 10.1 | ||||||||||||||
| Homebuilders |
||||||||||||||||||
| Condominiums |
146 | .4 | 283 | .8 | ||||||||||||||
| Other residential |
996 | 2.7 | 988 | 2.8 | ||||||||||||||
| Multi-family |
6,857 | 18.5 | 6,293 | 17.5 | ||||||||||||||
| Hotel/motel |
2,569 | 6.9 | 2,041 | 5.7 | ||||||||||||||
| Health care facilities |
289 | .8 | 305 | .8 | ||||||||||||||
| Total |
$ | 36,953 | 100.0 | % | $ | 35,851 | 100.0 | % | ||||||||||
| Geography |
||||||||||||||||||
| California |
$ | 8,039 | 21.8 | % | $ | 7,634 | 21.3 | % | ||||||||||
| Colorado |
1,644 | 4.5 | 1,569 | 4.4 | ||||||||||||||
| Illinois |
1,555 | 4.2 | 1,411 | 3.9 | ||||||||||||||
| Minnesota |
1,958 | 5.3 | 1,891 | 5.3 | ||||||||||||||
| Missouri |
1,560 | 4.2 | 1,599 | 4.4 | ||||||||||||||
| Ohio |
1,512 | 4.1 | 1,436 | 4.0 | ||||||||||||||
| Oregon |
1,921 | 5.2 | 1,961 | 5.5 | ||||||||||||||
| Washington |
3,586 | 9.7 | 3,540 | 9.9 | ||||||||||||||
| Wisconsin |
2,011 | 5.4 | 1,892 | 5.3 | ||||||||||||||
| Iowa, Kansas, Nebraska, North Dakota, South Dakota |
2,349 | 6.4 | 2,295 | 6.4 | ||||||||||||||
| Arkansas, Indiana, Kentucky, Tennessee |
1,886 | 5.1 | 1,736 | 4.8 | ||||||||||||||
| Idaho, Montana, Wyoming |
1,156 | 3.1 | 1,183 | 3.3 | ||||||||||||||
| Arizona, Nevada, New Mexico, Utah |
2,958 | 8.0 | 3,189 | 8.9 | ||||||||||||||
| Total banking region |
32,135 | 87.0 | 31,336 | 87.4 | ||||||||||||||
| Florida, Michigan, New York, Pennsylvania, Texas |
2,405 | 6.5 | 2,470 | 6.9 | ||||||||||||||
| All other states |
2,413 | 6.5 | 2,045 | 5.7 | ||||||||||||||
| Total outside Company’s banking region |
4,818 | 13.0 | 4,515 | 12.6 | ||||||||||||||
| Total |
$ | 36,953 | 100.0 | % | $ | 35,851 | 100.0 | % | ||||||||||
Other Retail Total other retail loans, which include retail leasing, home equity and second mortgages and other retail loans, decreased $395 million (.8 percent) at December 31, 2012, compared with December 31, 2011. Average other retail loans decreased $261 million (.5 percent) in 2012, compared with 2011. The decreases were primarily due to lower home equity and second mortgages and student loan balances, partially offset by higher automobile and installment loans, and retail leasing balances.
| 30 | U.S. BANCORP |
| TABLE 9 | Residential Mortgages by Geography |
| December 31, 2012 | December 31, 2011 | |||||||||||||||||
| (Dollars in Millions) | Loans | Percent | Loans | Percent | ||||||||||||||
| California |
$ | 6,022 | 13.7 | % | $ | 4,339 | 11.7 | % | ||||||||||
| Colorado |
2,674 | 6.1 | 2,354 | 6.3 | ||||||||||||||
| Illinois |
2,882 | 6.5 | 2,560 | 6.9 | ||||||||||||||
| Minnesota |
3,521 | 8.0 | 2,955 | 8.0 | ||||||||||||||
| Missouri |
2,064 | 4.7 | 1,849 | 5.0 | ||||||||||||||
| Ohio |
2,301 | 5.2 | 2,051 | 5.5 | ||||||||||||||
| Oregon |
1,836 | 4.2 | 1,541 | 4.2 | ||||||||||||||
| Washington |
2,543 | 5.8 | 2,101 | 5.7 | ||||||||||||||
| Wisconsin |
1,482 | 3.4 | 1,325 | 3.6 | ||||||||||||||
| Iowa, Kansas, Nebraska, North Dakota, South Dakota |
2,049 | 4.6 | 1,759 | 4.7 | ||||||||||||||
| Arkansas, Indiana, Kentucky, Tennessee |
3,233 | 7.3 | 2,822 | 7.6 | ||||||||||||||
| Idaho, Montana, Wyoming |
989 | 2.2 | 825 | 2.2 | ||||||||||||||
| Arizona, Nevada, New Mexico, Utah |
2,753 | 6.3 | 2,281 | 6.2 | ||||||||||||||
| Total banking region |
34,349 | 78.0 | 28,762 | 77.6 | ||||||||||||||
| Florida, Michigan, New York, Pennsylvania, Texas |
4,329 | 9.9 | 3,819 | 10.3 | ||||||||||||||
| All other states |
5,340 | 12.1 | 4,501 | 12.1 | ||||||||||||||
| Total outside Company’s banking region |
9,669 | 22.0 | 8,320 | 22.4 | ||||||||||||||
| Total |
$ | 44,018 | 100.0 | % | $ | 37,082 | 100.0 | % | ||||||||||
| TABLE 10 | Credit Card Loans by Geography |
| December 31, 2012 | December 31, 2011 | |||||||||||||||||
| (Dollars in Millions) | Loans | Percent | Loans | Percent | ||||||||||||||
| California |
$ | 1,757 | 10.3 | % | $ | 1,719 | 9.9 | % | ||||||||||
| Colorado |
665 | 3.9 | 670 | 3.9 | ||||||||||||||
| Illinois |
796 | 4.6 | 791 | 4.5 | ||||||||||||||
| Minnesota |
1,196 | 7.0 | 1,193 | 6.9 | ||||||||||||||
| Missouri |
616 | 3.6 | 619 | 3.6 | ||||||||||||||
| Ohio |
1,071 | 6.3 | 1,326 | 7.6 | ||||||||||||||
| Oregon |
597 | 3.5 | 623 | 3.6 | ||||||||||||||
| Washington |
771 | 4.5 | 849 | 4.9 | ||||||||||||||
| Wisconsin |
972 | 5.7 | 959 | 5.5 | ||||||||||||||
| Iowa, Kansas, Nebraska, North Dakota, South Dakota |
862 | 5.0 | 863 | 5.0 | ||||||||||||||
| Arkansas, Indiana, Kentucky, Tennessee |
1,342 | 7.8 | 1,353 | 7.8 | ||||||||||||||
| Idaho, Montana, Wyoming |
352 | 2.1 | 377 | 2.2 | ||||||||||||||
| Arizona, Nevada, New Mexico, Utah |
794 | 4.6 | 788 | 4.5 | ||||||||||||||
| Total banking region |
11,791 | 68.9 | 12,130 | 69.9 | ||||||||||||||
| Florida, Michigan, New York, Pennsylvania, Texas |
2,884 | 16.8 | 2,923 | 16.8 | ||||||||||||||
| All other states |
2,440 | 14.3 | 2,307 | 13.3 | ||||||||||||||
| Total outside Company’s banking region |
5,324 | 31.1 | 5,230 | 30.1 | ||||||||||||||
| Total |
$ | 17,115 | 100.0 | % | $ | 17,360 | 100.0 | % | ||||||||||
| U.S. BANCORP | 31 |
| TABLE 11 | Other Retail Loans by Geography |
| December 31, 2012 | December 31, 2011 | |||||||||||||||||
| (Dollars in Millions) | Loans | Percent | Loans | Percent | ||||||||||||||
| California |
$ | 5,545 | 11.6 | % | $ | 5,793 | 12.0 | % | ||||||||||
| Colorado |
2,068 | 4.3 | 2,175 | 4.5 | ||||||||||||||
| Illinois |
2,232 | 4.7 | 2,233 | 4.6 | ||||||||||||||
| Minnesota |
4,113 | 8.6 | 4,400 | 9.2 | ||||||||||||||
| Missouri |
2,234 | 4.7 | 2,170 | 4.5 | ||||||||||||||
| Ohio |
2,628 | 5.5 | 2,620 | 5.5 | ||||||||||||||
| Oregon |
1,748 | 3.7 | 1,851 | 3.9 | ||||||||||||||
| Washington |
1,954 | 4.1 | 2,058 | 4.3 | ||||||||||||||
| Wisconsin |
1,845 | 3.9 | 1,907 | 4.0 | ||||||||||||||
| Iowa, Kansas, Nebraska, North Dakota, South Dakota |
2,465 | 5.2 | 2,522 | 5.2 | ||||||||||||||
| Arkansas, Indiana, Kentucky, Tennessee |
2,772 | 5.8 | 2,765 | 5.8 | ||||||||||||||
| Idaho, Montana, Wyoming |
1,071 | 2.2 | 1,125 | 2.3 | ||||||||||||||
| Arizona, Nevada, New Mexico, Utah |
2,080 | 4.4 | 2,135 | 4.4 | ||||||||||||||
| Total banking region |
32,755 | 68.7 | 33,754 | 70.2 | ||||||||||||||
| Florida, Michigan, New York, Pennsylvania, Texas |
6,957 | 14.6 | 6,493 | 13.5 | ||||||||||||||
| All other states |
8,000 | 16.7 | 7,860 | 16.3 | ||||||||||||||
| Total outside Company’s banking region |
14,957 | 31.3 | 14,353 | 29.8 | ||||||||||||||
| Total |
$ | 47,712 | 100.0 | % | $ | 48,107 | 100.0 | % | ||||||||||
Of the total residential mortgages, credit card and other retail loans outstanding at December 31, 2012, approximately 72.5 percent were to customers located in the Company’s primary banking region. Tables 9, 10 and 11 provide a geographic summary of residential mortgages, credit card loans and other retail loans outstanding, respectively, as of December 31, 2012 and 2011. The collateral for $5.1 billion of residential mortgages and other retail loans included in covered loans at December 31, 2012 was in California, compared with $5.2 billion at December 31, 2011.
Loans Held for Sale Loans held for sale, consisting primarily of residential mortgages to be sold in the secondary market, were $8.0 billion at December 31, 2012, compared with $7.2 billion at December 31, 2011. The increase in loans held for sale was principally due to an increase in mortgage loan origination and refinancing activity due to the low interest rate environment.
Most of the residential mortgage loans the Company originates follow guidelines that allow the loans to be sold into existing, highly liquid secondary markets; in particular in government agency transactions and to government sponsored enterprises (“GSEs”).
| TABLE 12 | Selected Loan Maturity Distribution |
| At December 31, 2012 (Dollars in Millions) | One Year or Less |
Over One Through Five Years |
Over Five Years |
Total | ||||||||||||
| Commercial |
$ | 24,339 | $ | 38,471 | $ | 3,413 | $ | 66,223 | ||||||||
| Commercial real estate |
8,379 | 22,007 | 6,567 | 36,953 | ||||||||||||
| Residential mortgages |
2,187 | 6,531 | 35,300 | 44,018 | ||||||||||||
| Credit card |
17,115 | — | — | 17,115 | ||||||||||||
| Other retail |
8,854 | 25,618 | 13,240 | 47,712 | ||||||||||||
| Covered loans |
2,469 | 3,080 | 5,759 | 11,308 | ||||||||||||
| Total loans |
$ | 63,343 | $ | 95,707 | $ | 64,279 | $ | 223,329 | ||||||||
| Total of loans due after one year with |
||||||||||||||||
| Predetermined interest rates |
$ | 74,680 | ||||||||||||||
| Floating interest rates |
$ | 85,306 | ||||||||||||||
| 32 | U.S. BANCORP |
| TABLE 13 | Investment Securities |
| Available-for-Sale | Held-to-Maturity | |||||||||||||||||||||||||||||||||
| At December 31, 2012 (Dollars in Millions) | Amortized Cost |
Fair Value |
Weighted- Average Maturity in Years |
Weighted- Yield (e) |
Amortized Cost |
Fair Value |
Weighted- Average Maturity in Years |
Weighted- Average Yield (e) |
||||||||||||||||||||||||||
| U.S. Treasury and Agencies |
||||||||||||||||||||||||||||||||||
| Maturing in one year or less |
$ | 960 | $ | 961 | .8 | 1.42 | % | $ | 501 | $ | 503 | .7 | .90 | % | ||||||||||||||||||||
| Maturing after one year through five years |
95 | 98 | 1.9 | 1.61 | 1,995 | 2,015 | 1.3 | 1.01 | ||||||||||||||||||||||||||
| Maturing after five years through ten years |
155 | 165 | 7.4 | 3.11 | 598 | 603 | 9.5 | 1.78 | ||||||||||||||||||||||||||
| Maturing after ten years |
1 | 2 | 14.7 | 4.15 | 60 | 60 | 12.2 | 1.86 | ||||||||||||||||||||||||||
| Total |
$ | 1,211 | $ | 1,226 | 1.8 | 1.65 | % | $ | 3,154 | $ | 3,181 | 3.0 | 1.16 | % | ||||||||||||||||||||
| Mortgage-Backed Securities (a) |
||||||||||||||||||||||||||||||||||
| Maturing in one year or less |
$ | 2,749 | $ | 2,762 | .6 | 1.64 | % | $ | 296 | $ | 297 | .6 | 1.53 | % | ||||||||||||||||||||
| Maturing after one year through five years |
22,736 | 23,409 | 3.2 | 2.35 | 29,419 | 29,942 | 3.2 | 2.05 | ||||||||||||||||||||||||||
| Maturing after five years through ten years |
4,177 | 4,200 | 6.0 | 1.96 | 1,294 | 1,309 | 6.4 | 1.49 | ||||||||||||||||||||||||||
| Maturing after ten years |
290 | 296 | 12.7 | 1.78 | 58 | 58 | 10.3 | 1.21 | ||||||||||||||||||||||||||
| Total |
$ | 29,952 | $ | 30,667 | 3.5 | 2.23 | % | $ | 31,067 | $ | 31,606 | 3.3 | 2.02 | % | ||||||||||||||||||||
| Asset-Backed Securities (a) |
||||||||||||||||||||||||||||||||||
| Maturing in one year or less |
$ | 7 | $ | 9 | – | .21 | % | $ | – | $ | 4 | .2 | 1.26 | % | ||||||||||||||||||||
| Maturing after one year through five years |
36 | 46 | 3.4 | 6.31 | 11 | 10 | 3.3 | .65 | ||||||||||||||||||||||||||
| Maturing after five years through ten years |
568 | 579 | 7.4 | 2.33 | 8 | 9 | 6.6 | .67 | ||||||||||||||||||||||||||
| Maturing after ten years |
– | – | 18.6 | 5.83 | 7 | 16 | 22.3 | .78 | ||||||||||||||||||||||||||
| Total |
$ | 611 | $ | 634 | 7.1 | 2.54 | % | $ | 26 | $ | 39 | 9.5 | .70 | % | ||||||||||||||||||||
| Obligations of State and Political |
||||||||||||||||||||||||||||||||||
| Maturing in one year or less |
$ | 24 | $ | 24 | .3 | 7.68 | % | $ | – | $ | – | .7 | 6.77 | % | ||||||||||||||||||||
| Maturing after one year through five years |
5,293 | 5,646 | 3.5 | 6.73 | 5 | 6 | 3.0 | 7.50 | ||||||||||||||||||||||||||
| Maturing after five years through ten years |
729 | 772 | 7.8 | 5.85 | 3 | 3 | 8.6 | 7.36 | ||||||||||||||||||||||||||
| Maturing after ten years |
13 | 13 | 17.0 | 16.15 | 12 | 12 | 14.8 | 5.33 | ||||||||||||||||||||||||||
| Total |
$ | 6,059 | $ | 6,455 | 4.1 | 6.65 | % | $ | 20 | $ | 21 | 10.8 | 6.16 | % | ||||||||||||||||||||
| Other Debt Securities |
||||||||||||||||||||||||||||||||||
| Maturing in one year or less |
$ | 55 | $ | 55 | .1 | 6.45 | % | $ | 2 | $ | 2 | .3 | 1.03 | % | ||||||||||||||||||||
| Maturing after one year through five years |
6 | 6 | 1.2 | 1.15 | 94 | 91 | 3.2 | 1.23 | ||||||||||||||||||||||||||
| Maturing after five years through ten years |
– | – | – | – | 26 | 12 | 7.8 | 1.05 | ||||||||||||||||||||||||||
| Maturing after ten years |
759 | 676 | 22.3 | 2.90 | – | – | – | – | ||||||||||||||||||||||||||
| Total |
$ | 820 | $ | 737 | 20.6 | 3.12 | % | $ | 122 | $ | 105 | 4.2 | 1.19 | % | ||||||||||||||||||||
| Other Investments |
$ | 387 | $ | 420 | 17.0 | 2.53 | % | $ | – | $ | – | – | – | % | ||||||||||||||||||||
| Total investment securities (d) |
$ | 39,040 | $ | 40,139 | 4.1 | 2.93 | % | $ | 34,389 | $ | 34,952 | 3.3 | 1.94 | % | ||||||||||||||||||||
| (a) | Information related to asset and mortgage-backed securities included above is presented based upon weighted-average maturities anticipating future prepayments. |
| (b) | Information related to obligations of state and politcal subdivisions is presented based upon yield to first optional call date if the security is purchased at a premium, yield to maturity if purchased at par or a discount. |
| (c) | Maturity calculations for obligations of state and politicial subdivisions are based on the first optional call date for securities with a fair value above par and contractual maturity for securities with a fair value equal to or below par. |
| (d) | The weighted-average maturity of the available-for-sale investment securities was 5.2 years at December 31, 2011, with a corresponding weighted-average yield of 3.19 percent. The weighted-average maturity of the held-to-maturity investment securities was 3.9 years at December 31, 2011, with a corresponding weighted-average yield of 2.21 percent. |
| (e) | Average yields are presented on a fully-taxable equivalent basis under a tax rate of 35 percent. Yields on available-for-sale and held-to-maturity investment securities are computed based on amortized cost balances, excluding any premiums or discounts recorded related to the transfer of investment securities at fair value from available-for-sale to held-to-maturity. Average yield and maturity calculations exclude equity securities that have no stated yield or maturity. |
| 2012 | 2011 | |||||||||||||||||
| At December 31 (Dollars in Millions) | Amortized Cost |
Percent of Total |
Amortized Cost |
Percent of Total |
||||||||||||||
| U.S. Treasury and agencies |
$ | 4,365 | 5.9 | % | $ | 3,605 | 5.1 | % | ||||||||||
| Mortgage-backed securities |
61,019 | 83.1 | 57,561 | 82.0 | ||||||||||||||
| Asset-backed securities |
637 | .9 | 949 | 1.4 | ||||||||||||||
| Obligations of state and political subdivisions |
6,079 | 8.3 | 6,417 | 9.1 | ||||||||||||||
| Other debt securities and investments |
1,329 | 1.8 | 1,701 | 2.4 | ||||||||||||||
| Total investment securities |
$ | 73,429 | 100.0 | % | $ | 70,233 | 100.0 | % | ||||||||||
| U.S. BANCORP | 33 |
Investment Securities The Company uses its investment securities portfolio to manage enterprise interest rate risk, provide liquidity (including the ability to meet proposed regulatory requirements), generate interest and dividend income, and as collateral for public deposits and wholesale funding sources. While the Company intends to hold its investment securities indefinitely, it may sell available-for-sale securities in response to structural changes in the balance sheet and related interest rate risk and to meet liquidity requirements, among other factors.
Investment securities totaled $74.5 billion at December 31, 2012, compared with $70.8 billion at December 31, 2011. The $3.7 billion (5.2 percent) increase primarily reflected $3.1 billion of net investment purchases and a $517 million favorable change in net unrealized gains (losses) on available-for-sale investment securities. Held-to-maturity securities were $34.4 billion at December 31, 2012, compared with $18.9 billion at December 31, 2011, due to the transfer of approximately $11.7 billion of available-for-sale investment securities to the held-to-maturity category during 2012, reflecting the Company’s intent to hold those securities to maturity, and growth in government agency mortgage-backed securities as the Company increased its on-balance sheet liquidity in response to anticipated regulatory requirements.
Average investment securities were $72.5 billion in 2012, compared with $63.6 billion in 2011. The weighted-average yield of the available-for-sale portfolio was 2.93 percent at December 31, 2012, compared with 3.19 percent at December 31, 2011. The average maturity of the available-for-sale portfolio was 4.1 years at December 31, 2012, compared with 5.2 years at December 31, 2011. The weighted-average yield of the held-to-maturity portfolio was 1.94 percent at December 31, 2012, compared with 2.21 percent at December 31, 2011. The average maturity of the held-to-maturity portfolio was 3.3 years at December 31, 2012, compared with 3.9 years at December 31, 2011. Investment securities by type are shown in Table 13.
The Company’s available-for-sale securities are carried at fair value with changes in fair value reflected in other comprehensive income (loss) unless a security is deemed to be other-than-temporarily impaired. At December 31, 2012, the Company’s net unrealized gains on available-for-sale securities were $1.1 billion, compared with $581 million at December 31, 2011. The favorable change in net unrealized gains was primarily due to increases in the fair value of non-agency mortgage-backed and state and political securities. Gross unrealized losses on available-for-sale securities totaled $147 million at December 31, 2012, compared with $691 million at December 31, 2011.
The Company conducts a regular assessment of its investment portfolio to determine whether any securities are other-than-temporarily impaired. When assessing unrealized losses for other-than-temporary impairment, the Company considers the nature of the investment, the financial condition of the issuer, the extent and duration of unrealized loss, expected cash flows of underlying assets and market conditions. At December 31, 2012, the Company had no plans to sell securities with unrealized losses and believes it is more likely than not that it would not be required to sell such securities before recovery of their amortized cost.
There is limited market activity for non-agency mortgage-backed securities held by the Company. As a result, the Company estimates the fair value of these securities using estimates of expected cash flows, discount rates and management’s assessment of various other market factors, which are judgmental in nature. The Company recorded $46 million of impairment charges in earnings during 2012 on non-agency mortgage-backed securities. These impairment charges were due to changes in expected cash flows primarily resulting from increases in defaults in the underlying mortgage pools. During 2012, the Company also recognized impairment charges of $27 million in earnings related to certain perpetual preferred securities issued by financial institutions, following the downgrades of money center banks by a rating agency. The unrealized loss on perpetual preferred securities in a loss position at December 31, 2012, was $14 million. Further adverse changes in market conditions may result in additional impairment charges in future periods.
During 2011, the Company recorded $35 million of impairment charges in earnings predominately on non-agency mortgage-backed securities. These impairment charges were due to changes in expected cash flows primarily resulting from increases in defaults in the underlying mortgage pools.
Refer to Notes 4 and 20 in the Notes to Consolidated Financial Statements for further information on investment securities.
| 34 | U.S. BANCORP |
| TABLE 14 | Deposits |
The composition of deposits was as follows:
| 2012 | 2011 | 2010 | 2009 | 2008 | ||||||||||||||||||||||||||||||||||||||||||||
| At December 31 (Dollars in Millions) | Amount | Percent of Total |
Amount | Percent of Total |
Amount | Percent of Total |
Amount | Percent of Total |
Amount | Percent of Total |
||||||||||||||||||||||||||||||||||||||
| Noninterest-bearing deposits |
$ | 74,172 | 29.8 | % | $ | 68,579 | 29.7 | % | $ | 45,314 | 22.2 | % | $ | 38,186 | 20.8 | % | $ | 37,494 | 23.5 | % | ||||||||||||||||||||||||||||
| Interest-bearing deposits |
||||||||||||||||||||||||||||||||||||||||||||||||
| Interest checking |
50,430 | 20.2 | 45,933 | 19.9 | 43,183 | 21.2 | 38,436 | 21.0 | 32,254 | 20.2 | ||||||||||||||||||||||||||||||||||||||
| Money market savings |
50,987 | 20.5 | 45,854 | 19.9 | 46,855 | 22.9 | 40,848 | 22.3 | 26,137 | 16.4 | ||||||||||||||||||||||||||||||||||||||
| Savings accounts |
30,811 | 12.4 | 28,018 | 12.1 | 24,260 | 11.9 | 16,885 | 9.2 | 9,070 | 5.7 | ||||||||||||||||||||||||||||||||||||||
| Total of savings deposits |
132,228 | 53.1 | 119,805 | 51.9 | 114,298 | 56.0 | 96,169 | 52.5 | 67,461 | 42.3 | ||||||||||||||||||||||||||||||||||||||
| Time certificates of deposit less than $100,000 |
13,744 | 5.5 | 14,952 | 6.5 | 15,083 | 7.4 | 18,966 | 10.4 | 18,425 | 11.7 | ||||||||||||||||||||||||||||||||||||||
| Time deposits greater than $100,000 |
||||||||||||||||||||||||||||||||||||||||||||||||
| Domestic |
12,148 | 4.8 | 12,583 | 5.4 | 12,330 | 6.0 | 16,858 | 9.2 | 20,791 | 13.0 | ||||||||||||||||||||||||||||||||||||||
| Foreign |
16,891 | 6.8 | 14,966 | 6.5 | 17,227 | 8.4 | 13,063 | 7.1 | 15,179 | 9.5 | ||||||||||||||||||||||||||||||||||||||
| Total interest-bearing deposits |
175,011 | 70.2 | 162,306 | 70.3 | 158,938 | 77.8 | 145,056 | 79.2 | 121,856 | 76.5 | ||||||||||||||||||||||||||||||||||||||
| Total deposits |
$ | 249,183 | 100.0 | % | $ | 230,885 | 100.0 | % | $ | 204,252 | 100.0 | % | $ | 183,242 | 100.0 | % | $ | 159,350 | 100.0 | % | ||||||||||||||||||||||||||||
The maturity of time deposits was as follows:
| At December 31, 2012 (Dollars in Millions) | Certificates Less Than $100,000 |
Time Deposits Greater Than $100,000 |
Total | |||||||||
| Three months or less |
$ | 1,512 | $ | 18,963 | $ | 20,475 | ||||||
| Three months through six months |
1,911 | 1,595 | 3,506 | |||||||||
| Six months through one year |
3,215 | 2,197 | 5,412 | |||||||||
| 2014 |
3,584 | 2,949 | 6,533 | |||||||||
| 2015 |
1,769 | 1,775 | 3,544 | |||||||||
| 2016 |
1,061 | 937 | 1,998 | |||||||||
| 2017 |
688 | 619 | 1,307 | |||||||||
| Thereafter |
4 | 4 | 8 | |||||||||
| Total |
$ | 13,744 | $ | 29,039 | $ | 42,783 | ||||||
Deposits Total deposits were $249.2 billion at December 31, 2012, compared with $230.9 billion at December 31, 2011. The $18.3 billion (7.9 percent) increase in total deposits reflected organic growth in core deposits due to the overall “flight-to-quality” by customers. Average total deposits increased $22.6 billion (10.6 percent) over 2011 due to increases in noninterest-bearing and total savings account balances, reflecting organic growth.
Noninterest-bearing deposits at December 31, 2012, increased $5.6 billion (8.2 percent) over December 31, 2011. Average noninterest-bearing deposits increased $13.4 billion (24.9 percent) in 2012, compared with 2011. The increases were due to growth in balances in the majority of the lines of business, including Wholesale Banking and Commercial Real Estate, Wealth Management and Securities Services, and Consumer and Small Business Banking.
Interest-bearing savings deposits increased $12.4 billion (10.4 percent) at December 31, 2012, compared with December 31, 2011. The increase in these deposit balances was related to increases in money market savings, interest checking and savings account balances. The $5.1 billion (11.2 percent) increase in money market savings account balances was primarily due to higher Wholesale Banking and Commercial Real Estate, and corporate trust balances. The $4.5 billion (9.8 percent) increase in interest checking account balances was primarily due to higher Consumer and Small Business Banking and broker-dealer balances, partially offset by lower Wholesale Banking and Commercial Real Estate balances. The $2.8 billion (10.0 percent) increase in savings account balances reflected continued strong participation in a savings product offered by Consumer and Small Business Banking that includes multiple bank products in a package. Average interest-bearing savings deposits in 2012 increased $7.3 billion (6.4 percent), compared with 2011, primarily due to growth in Consumer and Small Business Banking and corporate trust balances, partially offset by lower government banking and broker-dealer balances.
Interest-bearing time deposits at December 31, 2012, increased $282 million (.7 percent), compared with December 31, 2011, driven by an increase in time deposits greater than $100,000, partially offset by a decrease in time certificates of deposit less than $100,000. Time deposits greater than
| U.S. BANCORP | 35 |
$100,000 increased $1.5 billion (5.4 percent) at December 31, 2012, compared with December 31, 2011. Average time deposits greater than $100,000 in 2012 increased $2.6 billion (8.8 percent), compared with 2011. Time deposits greater than $100,000 are managed as an alternative to other funding sources such as wholesale borrowing, based largely on relative pricing. Time certificates of deposit less than $100,000 decreased $1.2 billion (8.1 percent) at December 31, 2012, compared with December 31, 2011. Average time certificates of deposit less than $100,000 in 2012 decreased $728 million (4.8 percent), compared with 2011. The decreases were the result of lower Consumer and Small Business Banking balances.
Borrowings The Company utilizes both short-term and long-term borrowings as part of its asset/liability management and funding strategies. Short-term borrowings, which include federal funds purchased, commercial paper, repurchase agreements, borrowings secured by high-grade assets and other short-term borrowings, were $26.3 billion at December 31, 2012, compared with $30.5 billion at December 31, 2011. The $4.2 billion (13.7 percent) decrease in short-term borrowings reflected reduced borrowing needs by the Company as a result of an increase in deposits.
Long-term debt was $25.5 billion at December 31, 2012, compared with $32.0 billion at December 31, 2011. The $6.5 billion (20.1 percent) decrease was primarily due to repayments and maturities of $3.8 billion of medium-term notes and $1.1 billion of subordinated debt, $2.7 billion of redemptions of junior subordinated debentures and a $3.4 billion decrease in Federal Home Loan Bank (“FHLB”) advances, partially offset by issuances of $1.3 billion of subordinated debt and $2.3 billion of medium-term notes, and a $1.1 billion increase in long-term debt related to certain consolidated variable interest entities. Refer to Note 12 of the Notes to Consolidated Financial Statements for additional information regarding long-term debt and the “Liquidity Risk Management” section for discussion of liquidity management of the Company.
Corporate Risk Profile
Overview Managing risks is an essential part of successfully operating a financial services company. The Company’s most prominent risk exposures are credit, residual value, operational, interest rate, market, liquidity and reputation risk. Credit risk is the risk of not collecting the interest and/or the principal balance of a loan, investment or derivative contract when it is due. Residual value risk is the potential reduction in the end-of-term value of leased assets. Operational risk includes risks related to fraud, processing errors, technology, breaches of internal controls and in data security, and business continuation and disaster recovery. Operational risk also includes legal and compliance risks, including risks arising from the failure to adhere to laws, rules, regulations and internal policies and procedures. Interest rate risk is the potential reduction of net interest income as a result of changes in interest rates, which can affect the re-pricing of assets and liabilities differently. Market risk arises from fluctuations in interest rates, foreign exchange rates, and security prices that may result in changes in the values of financial instruments, such as trading and available-for-sale securities, certain mortgage loans held for sale, MSRs and derivatives that are accounted for on a fair value basis. Liquidity risk is the possible inability to fund obligations to depositors, investors or borrowers. Further, corporate strategic decisions, as well as the risks described above, could give rise to reputation risk. Reputation risk is the risk that negative publicity or press, whether true or not, could result in costly litigation or cause a decline in the Company’s stock value, customer base, funding sources or revenue. In addition to the risks identified above, other risk factors exist that may impact the Company. Refer to “Risk Factors” beginning on page 145, for a detailed discussion of these factors.
Credit Risk Management The Company’s strategy for credit risk management includes well-defined, centralized credit policies, uniform underwriting criteria, and ongoing risk monitoring and review processes for all commercial and consumer credit exposures. The strategy also emphasizes diversification on a geographic, industry and customer level, regular credit examinations and management reviews of loans exhibiting deterioration of credit quality. The Risk Management Committee of the Company’s Board of Directors oversees the Company’s credit risk management process.
In addition, credit quality ratings as defined by the Company, are an important part of the Company’s overall credit risk management and evaluation of its allowance for credit losses. Loans with a pass rating represent those not classified on the Company’s rating scale for problem credits, as minimal risk has been identified. Loans with a special mention or classified rating, including all of the Company’s loans that are 90 days or more past due and still accruing, nonaccrual loans, those considered troubled debt restructurings (“TDRs”), and loans in a junior lien position that are current but are behind a modified or delinquent loan in a first lien position, encompass all loans held by the Company that it considers to have a potential or well-defined weakness that may put full collection of contractual cash flows at risk. The Company’s internal credit quality ratings for consumer loans are primarily based on delinquency and nonperforming status, except for a limited population of larger loans within those portfolios that are individually evaluated. For this limited population, the determination of the internal credit quality rating may also consider collateral value and customer cash flows. The Company obtains recent collateral value estimates for the majority of its residential mortgage and home equity and
| 36 | U.S. BANCORP |
second mortgage portfolios, which allows the Company to compute estimated loan-to-value (“LTV”) ratios reflecting current market conditions. These individual refreshed LTV ratios are considered in the determination of the appropriate allowance for credit losses. The decline in housing prices over the past several years has deteriorated the collateral support of the residential mortgage, home equity and second mortgage portfolios. However, the underwriting criteria the Company employs consider the relevant income and credit characteristics of the borrower, such that the collateral is not the primary source of repayment. The Company strives to identify potential problem loans early, record any necessary charge-offs promptly and maintain appropriate allowance levels for probable incurred loan losses. Refer to Notes 1 and 5 in the Notes to Consolidated Financial Statements for further information of the Company’s loan portfolios including internal credit quality ratings.
The Company categorizes its loan portfolio into three segments, which is the level at which it develops and documents a systematic methodology to determine the allowance for credit losses. The Company’s three loan portfolio segments are commercial lending, consumer lending and covered loans. The commercial lending segment includes loans and leases made to small business, middle market, large corporate, commercial real estate, financial institution, and public sector customers. Key risk characteristics relevant to commercial lending segment loans include the industry and geography of the borrower’s business, purpose of the loan, repayment source, borrower’s debt capacity and financial flexibility, loan covenants, and nature of pledged collateral, if any. These risk characteristics, among others, are considered in determining estimates about the likelihood of default by the borrowers and the severity of loss in the event of default. The Company considers these risk characteristics in assigning internal risk ratings to, or forecasting losses on, these loans which are the significant factors in determining the allowance for credit losses for loans in the commercial lending segment.
The consumer lending segment represents loans and leases made to consumer customers including residential mortgages, credit card loans, and other retail loans such as revolving consumer lines, auto loans and leases, student loans, and home equity loans and lines. Home equity or second mortgage loans are junior lien closed-end accounts fully disbursed at origination. These loans typically are fixed rate loans, secured by residential real estate, with a 10 or 15 year fixed payment amortization schedule. Home equity lines are revolving accounts giving the borrower the ability to draw and repay balances repeatedly, up to a maximum commitment, and are secured by residential real estate. These include accounts in either a first or junior lien position. Typical terms on home equity lines are variable rates benchmarked to the prime rate, with a 15-year draw period during which a minimum payment is equivalent to the monthly interest, followed by a 10-year amortization period. At December 31, 2012, substantially all of the Company’s home equity lines were in the draw period. Key risk characteristics relevant to consumer lending segment loans primarily relate to the borrowers’ capacity and willingness to repay and include unemployment rates and other economic factors, customer payment history and in some cases, updated LTV information on real estate based loans. These risk characteristics, among others, are reflected in forecasts of delinquency levels, bankruptcies and losses which are the primary factors in determining the allowance for credit losses for the consumer lending segment.
The covered loan segment represents loans acquired in FDIC-assisted transactions that are covered by loss sharing agreements with the FDIC that greatly reduce the risk of future credit losses to the Company. Key risk characteristics for covered segment loans are consistent with the segment they would otherwise be included in had the loss share coverage not been in place, but consider the indemnification provided by the FDIC.
The Company further disaggregates its loan portfolio segments into various classes based on their underlying risk characteristics. The two classes within the commercial lending segment are commercial loans and commercial real estate loans. The three classes within the consumer lending segment are residential mortgages, credit card loans and other retail loans. The covered loan segment consists of only one class.
Because business processes and credit risks associated with unfunded credit commitments are essentially the same as for loans, the Company utilizes similar processes to estimate its liability for unfunded credit commitments. The Company also engages in non-lending activities that may give rise to credit risk, including derivative transactions for balance sheet hedging purposes, foreign exchange transactions, deposit overdrafts and interest rate swap contracts for customers, investments in securities and other financial assets, and settlement risk, including Automated Clearing House transactions and the processing of credit card transactions for merchants. These activities are subject to credit review, analysis and approval processes.
Economic and Other Factors In evaluating its credit risk, the Company considers changes, if any, in underwriting activities, the loan portfolio composition (including product mix and geographic, industry or customer-specific concentrations), trends in loan performance, the level of allowance coverage relative to similar banking institutions and macroeconomic factors, such as changes in unemployment rates, gross domestic product and consumer bankruptcy filings.
Beginning in late 2007, financial markets suffered significant disruptions, leading to and exacerbated by declining real estate values and subsequent economic
| U.S. BANCORP | 37 |
challenges, both domestically and globally. Median home prices declined across most domestic markets, which had a significant adverse impact on the collectability of residential mortgage loans. Residential mortgage delinquencies increased throughout 2008 and 2009. High unemployment levels beginning in 2009, further increased losses in prime-based residential portfolios and credit cards.
Although economic conditions generally have stabilized from the dramatic downturn experienced in 2008 and 2009, and the financial markets have generally improved, business activities across a range of industries continue to face difficulties due to lower consumer confidence and spending, continued elevated unemployment and under-employment, and continued stress in the residential mortgage portfolio. Credit costs peaked for the Company in late 2009 and have trended downward thereafter. The provision for credit losses was lower than net charge-offs by $215 million in 2012 and $500 million in 2011, and exceeded net charge-offs by $175 million in 2010. The $461 million (19.7 percent) decrease in the provision for credit losses in 2012, compared with 2011, reflected improving credit trends and the underlying risk profile of the loan portfolio as economic conditions continued to slowly improve, partially offset by portfolio growth.
Credit Diversification The Company manages its credit risk, in part, through diversification of its loan portfolio and limit setting by product type criteria and concentrations. As part of its normal business activities, the Company offers a broad array of traditional commercial lending products and specialized products such as asset-based lending, commercial lease financing, agricultural credit, warehouse mortgage lending, small business lending, commercial real estate, health care and correspondent banking. The Company also offers an array of consumer lending products, including residential mortgages, credit card loans, automobile loans, retail leases, home equity, revolving credit, lending to students and other consumer loans. These consumer lending products are primarily offered through the branch office network, home mortgage and loan production offices and indirect distribution channels, such as automobile dealers. The Company monitors and manages the portfolio diversification by industry, customer and geography. Table 6 provides information with respect to the overall product diversification and changes in the mix during 2012.
The commercial loan class is diversified among various industries with somewhat higher concentrations in manufacturing, finance and insurance, wholesale trade, and real estate, rental and leasing. Additionally, the commercial loan class is diversified across the Company’s geographical markets with 66.0 percent of total commercial loans within the Company’s Consumer and Small Business Banking markets. Credit relationships outside of the Company’s Consumer and Small Business Banking markets relate to the corporate banking, mortgage banking, auto dealer and leasing businesses, focusing on large national customers and specifically targeted industries. Loans to mortgage banking customers are primarily warehouse lines which are collateralized with the underlying mortgages. The Company regularly monitors its mortgage collateral position to manage its risk exposure. Table 7 provides a summary of significant industry groups and geographical locations of commercial loans outstanding at December 31, 2012 and 2011.
The commercial real estate loan class reflects the Company’s focus on serving business owners within its geographic footprint as well as regional and national investment-based real estate owners and builders. Within the commercial real estate loan class, different property types have varying degrees of credit risk. Table 8 provides a summary of the significant property types and geographical locations of commercial real estate loans outstanding at December 31, 2012 and 2011. At December 31, 2012, approximately 30.9 percent of the commercial real estate loans represented business owner-occupied properties that tend to exhibit less credit risk than non owner-occupied properties. The investment-based real estate mortgages are diversified among various property types with somewhat higher concentrations in multi-family and retail properties. From a geographical perspective, the Company’s commercial real estate loan class is generally well diversified. However, at December 31, 2012, 21.8 percent of the Company’s commercial real estate loans were secured by collateral in California, which has experienced higher delinquency levels and credit quality deterioration due to excess home inventory levels and declining valuations. Included in commercial real estate at year-end 2012 was approximately $804 million in loans related to land held for development and $1.4 billion of loans related to residential and commercial acquisition and development properties. These loans are subject to quarterly monitoring for changes in local market conditions due to a higher credit risk profile. The commercial real estate loan class is diversified across the Company’s geographical markets with 87.0 percent of total commercial real estate loans outstanding at December 31, 2012, within the Company’s Consumer and Small Business Banking markets.
The Company’s consumer lending segment utilizes several distinct business processes and channels to originate consumer credit, including traditional branch lending, indirect lending, portfolio acquisitions, correspondent banks and loan brokers. Each distinct underwriting and origination activity manages unique credit risk characteristics and prices its loan production commensurate with the differing risk profiles.
Residential mortgages represent an important financial product for consumer customers of the Company and are originated through the Company’s branches, loan production offices and a wholesale network of originators. The Company may retain residential mortgage loans it originates on its
| 38 | U.S. BANCORP |
balance sheet or sell the loans into the secondary market while retaining the servicing rights and customer relationships. Utilizing the secondary markets enables the Company to effectively reduce its credit and other asset/liability risks. For residential mortgages that are retained in the Company’s portfolio and for home equity and second mortgages, credit risk is also diversified by geography and managed by adherence to LTV and borrower credit criteria during the underwriting process.
The Company estimates updated LTV information quarterly, based on a method that combines automated valuation model updates and relevant home price indices. LTV is the ratio of the loan’s outstanding principal balance to the current estimate of property value. For home equity and second mortgages, combined loan-to-value (“CLTV”) is the combination of the first mortgage original principal balance and the second lien outstanding principal balance, relative to the current estimate of property value. Certain loans do not have a LTV or CLTV, primarily due to lack of availability of relevant automated valuation model and/or home price indices values, or lack of necessary valuation data on acquired loans.
The following tables provide summary information for the LTVs of residential mortgages and home equity and second mortgages by borrower type at December 31, 2012:
| Residential mortgages (Dollars in Millions) |
Interest Only |
Amortizing | Total | Percent of Total |
||||||||||||
| Prime Borrowers |
||||||||||||||||
| Less than or equal to 80% |
$ | 1,864 | $ | 25,786 | $ | 27,650 | 76.1 | % | ||||||||
| Over 80% through 90% |
458 | 3,459 | 3,917 | 10.8 | ||||||||||||
| Over 90% through 100% |
369 | 1,475 | 1,844 | 5.1 | ||||||||||||
| Over 100% |
925 | 1,877 | 2,802 | 7.7 | ||||||||||||
| No LTV available |
– | 116 | 116 | .3 | ||||||||||||
| Total |
$ | 3,616 | $ | 32,713 | $ | 36,329 | 100.0 | % | ||||||||
| Sub-Prime Borrowers |
||||||||||||||||
| Less than or equal to 80% |
$ | 1 | $ | 544 | $ | 545 | 34.2 | % | ||||||||
| Over 80% through 90% |
2 | 234 | 236 | 14.8 | ||||||||||||
| Over 90% through 100% |
2 | 239 | 241 | 15.1 | ||||||||||||
| Over 100% |
8 | 563 | 571 | 35.9 | ||||||||||||
| No LTV available |
– | – | – | – | ||||||||||||
| Total |
$ | 13 | $ | 1,580 | $ | 1,593 | 100.0 | % | ||||||||
| Other Borrowers |
||||||||||||||||
| Less than or equal to 80% |
$ | 9 | $ | 257 | $ | 266 | 32.3 | % | ||||||||
| Over 80% through 90% |
3 | 176 | 179 | 21.8 | ||||||||||||
| Over 90% through 100% |
3 | 103 | 106 | 12.9 | ||||||||||||
| Over 100% |
3 | 268 | 271 | 33.0 | ||||||||||||
| No LTV available |
– | – | – | – | ||||||||||||
| Total |
$ | 18 | $ | 804 | $ | 822 | 100.0 | % | ||||||||
| Loans Purchased From GNMA Mortgage Pools (a) |
$ | – | $ | 5,274 | $ | 5,274 | 100.0 | % | ||||||||
| Total |
||||||||||||||||
| Less than or equal to 80% |
$ | 1,874 | $ | 26,587 | $ | 28,461 | 64.6 | % | ||||||||
| Over 80% through 90% |
463 | 3,869 | 4,332 | 9.8 | ||||||||||||
| Over 90% through 100% |
374 | 1,817 | 2,191 | 5.0 | ||||||||||||
| Over 100% |
936 | 2,708 | 3,644 | 8.3 | ||||||||||||
| No LTV available |
– | 116 | 116 | .3 | ||||||||||||
| Loans purchased from GNMA mortgage pools (a) |
– | 5,274 | 5,274 | 12.0 | ||||||||||||
| Total |
$ | 3,647 | $ | 40,371 | $ | 44,018 | 100.0 | % | ||||||||
| (a) | Represents loans purchased from Government National Mortgage Association (“GNMA”) mortgage pools whose payments are primarily insured by the Federal Housing Administration or guaranteed by the Department of Veterans Affairs. |
| Home equity and second mortgages (Dollars in Millions) |
Lines | Loans | Total | Percent of Total |
||||||||||||
| Prime Borrowers |
||||||||||||||||
| Less than or equal to 80% |
$ | 7,751 | $ | 535 | $ | 8,286 | 52.0 | % | ||||||||
| Over 80% through 90% |
2,403 | 248 | 2,651 | 16.6 | ||||||||||||
| Over 90% through 100% |
1,600 | 197 | 1,797 | 11.3 | ||||||||||||
| Over 100% |
2,427 | 458 | 2,885 | 18.1 | ||||||||||||
| No LTV/CLTV available |
289 | 26 | 315 | 2.0 | ||||||||||||
| Total |
$ | 14,470 | $ | 1,464 | $ | 15,934 | 100.0 | % | ||||||||
| Sub-Prime Borrowers |
||||||||||||||||
| Less than or equal to 80% |
$ | 39 | $ | 28 | $ | 67 | 18.3 | % | ||||||||
| Over 80% through 90% |
17 | 20 | 37 | 10.1 | ||||||||||||
| Over 90% through 100% |
17 | 38 | 55 | 15.0 | ||||||||||||
| Over 100% |
42 | 164 | 206 | 56.3 | ||||||||||||
| No LTV/CLTV available |
– | 1 | 1 | .3 | ||||||||||||
| Total |
$ | 115 | $ | 251 | $ | 366 | 100.0 | % | ||||||||
| Other Borrowers |
||||||||||||||||
| Less than or equal to 80% |
$ | 280 | $ | 4 | $ | 284 | 66.7 | % | ||||||||
| Over 80% through 90% |
64 | 5 | 69 | 16.2 | ||||||||||||
| Over 90% through 100% |
30 | 2 | 32 | 7.5 | ||||||||||||
| Over 100% |
32 | 6 | 38 | 8.9 | ||||||||||||
| No LTV/CLTV available |
3 | – | 3 | .7 | ||||||||||||
| Total |
$ | 409 | $ | 17 | $ | 426 | 100.0 | % | ||||||||
| Total |
||||||||||||||||
| Less than or equal to 80% |
$ | 8,070 | $ | 567 | $ | 8,637 | 51.6 | % | ||||||||
| Over 80% through 90% |
2,484 | 273 | 2,757 | 16.5 | ||||||||||||
| Over 90% through 100% |
1,647 | 237 | 1,884 | 11.3 | ||||||||||||
| Over 100% |
2,501 | 628 | 3,129 | 18.7 | ||||||||||||
| No LTV/CLTV available |
292 | 27 | 319 | 1.9 | ||||||||||||
| Total |
$ | 14,994 | $ | 1,732 | $ | 16,726 | 100.0 | % | ||||||||
At December 31, 2012, approximately $1.6 billion of residential mortgages were to customers that may be defined as sub-prime borrowers based on credit scores from independent agencies at loan origination, compared with $1.9 billion at December 31, 2011. In addition to residential mortgages, at December 31, 2012, $.4 billion of home equity and second mortgage loans were to customers that may be defined as sub-prime borrowers, compared with $.5 billion at December 31, 2011. The total amount of consumer lending segment residential mortgage, home equity and second mortgage loans to customers that may be defined as sub-prime borrowers represented only .6 percent of total assets at December 31, 2012, compared with .7 percent at December 31, 2011. The Company considers sub-prime loans to be those made to borrowers with a risk of default significantly higher than those approved for prime lending programs, as reflected in credit scores obtained from independent agencies at loan origination, in addition to other credit underwriting criteria. Sub-prime portfolios include only loans originated according to the Company’s underwriting programs specifically designed to serve customers with weakened credit histories. The sub-prime designation indicators have been and will continue to be subject to re-evaluation over time as borrower characteristics, payment performance and economic conditions change. The sub-prime loans originated during periods from June 2009 and
| U.S. BANCORP | 39 |
after are with borrowers who met the Company’s program guidelines and have a credit score that generally is at or below a threshold of 620 to 650 depending on the program. Sub-prime loans originated during periods prior to June 2009 were based upon program level guidelines without regard to credit score.
Covered loans included $1.3 billion in loans with negative-amortization payment options at December 31, 2012, compared with $1.5 billion at December 31, 2011. Other than covered loans, the Company does not have any residential mortgages with payment schedules that would cause balances to increase over time.
Home equity and second mortgages were $16.7 billion at December 31, 2012, compared with $18.1 billion at December 31, 2011, and included $5.1 billion of home equity lines in a first lien position and $11.6 billion of home equity and second mortgage loans and lines in a junior lien position. Loans and lines in a junior lien position at December 31, 2012, included approximately $3.7 billion of loans and lines for which the Company also serviced the related first lien loan, and approximately $7.9 billion where the Company did not service the related first lien loan. The Company was able to determine the status of the related first liens using information the Company has as the servicer of the first lien, information it received from its primary regulator on loans serviced by other large servicers or information reported on customer credit bureau files. The Company also evaluates other indicators of credit risk for these junior lien loans and lines including delinquency, estimated average CLTV ratios and weighted-average credit scores in making its assessment of credit risk, related loss estimates and determining the allowance for credit losses.
The following table provides a summary of delinquency statistics and other credit quality indicators for the Company’s junior lien positions at December 31, 2012:
| Junior Liens Behind | ||||||||||||
| (Dollars in Millions) | Company First Lien |
Third Party First Lien |
Total | |||||||||
| Total |
$ | 3,673 | $ | 7,950 | $ | 11,623 | ||||||
| Percent 30 – 89 days past due |
.85 | % | 1.19 | % | 1.08 | % | ||||||
| Percent 90 days or more past due |
.26 | % | .28 | % | .27 | % | ||||||
| Weighted-average CLTV |
86 | % | 85 | % | 85 | % | ||||||
| Weighted-average credit score |
750 | 746 | 747 | |||||||||
See the Analysis and Determination of the Allowance for Credit Losses section for additional information on how the Company determines the allowance for credit losses for loans in a junior lien position.
Credit card and other retail loans principally reflect the Company’s focus on consumers within its geographical footprint of branches and certain niche lending activities that are nationally focused. Approximately 68.6 percent of the Company’s credit card balances relate to cards originated through the Company’s branches or co-branded, travel and affinity programs that generally experience better credit quality performance than portfolios generated through other channels.
Tables 9, 10 and 11 provide a geographical summary of the residential mortgage, credit card and other retail loan portfolios, respectively.
Assets acquired by the Company in FDIC-assisted transactions included nonperforming loans and other loans with characteristics indicative of a high credit risk profile, including a substantial concentration in California, loans with negative-amortization payment options, and homebuilder and other construction finance loans. Because most of these loans are covered under loss sharing agreements with the FDIC, the Company’s financial exposure to losses from these assets is substantially reduced. To the extent actual losses exceed the Company’s estimates at acquisition, the Company’s financial risk would only be its share of those losses under the loss sharing agreements.
| 40 | U.S. BANCORP |
| TABLE 15 | Delinquent Loan Ratios as a Percent of Ending Loan Balances |
| At December 31, 90 days or more past due excluding nonperforming loans |
2012 | 2011 | 2010 | 2009 | 2008 | |||||||||||||||
| Commercial |
||||||||||||||||||||
| Commercial |
.10 | % | .09 | % | .15 | % | .25 | % | .15 | % | ||||||||||
| Lease financing |
– | – | .02 | – | – | |||||||||||||||
| Total commercial |
.09 | .08 | .13 | .22 | .13 | |||||||||||||||
| Commercial Real Estate |
||||||||||||||||||||
| Commercial mortgages |
.02 | .02 | – | – | – | |||||||||||||||
| Construction and development |
.02 | .13 | .01 | .07 | .36 | |||||||||||||||
| Total commercial real estate |
.02 | .04 | – | .02 | .11 | |||||||||||||||
| Residential Mortgages (a) |
.64 | .98 | 1.63 | 2.80 | 1.55 | |||||||||||||||
| Credit Card |
1.27 | 1.36 | 1.86 | 2.59 | 2.20 | |||||||||||||||
| Other Retail |
||||||||||||||||||||
| Retail leasing |
.02 | .02 | .05 | .11 | .16 | |||||||||||||||
| Other |
.22 | .43 | .49 | .57 | .45 | |||||||||||||||
| Total other retail (b) |
.20 | .38 | .45 | .53 | .42 | |||||||||||||||
| Total loans, excluding covered loans |
.31 | .43 | .61 | .88 | .56 | |||||||||||||||
| Covered Loans |
5.86 | 6.15 | 6.04 | 3.59 | 5.25 | |||||||||||||||
| Total loans |
.59 | % | .84 | % | 1.11 | % | 1.19 | % | .84 | % | ||||||||||
| At December 31, 90 days or more past due including nonperforming loans |
2012 | 2011 | 2010 | 2009 | 2008 | |||||||||||||||
| Commercial |
.27 | % | .63 | % | 1.37 | % | 2.25 | % | .82 | % | ||||||||||
| Commercial real estate |
1.50 | 2.55 | 3.73 | 5.22 | 3.34 | |||||||||||||||
| Residential mortgages (a) |
2.14 | 2.73 | 3.70 | 4.59 | 2.44 | |||||||||||||||
| Credit card |
2.12 | 2.65 | 3.22 | 3.43 | 2.69 | |||||||||||||||
| Other retail (b) |
.66 | .52 | .58 | .66 | .47 | |||||||||||||||
| Total loans, excluding covered loans |
1.11 | 1.54 | 2.19 | 2.87 | 1.57 | |||||||||||||||
| Covered loans |
9.28 | 12.42 | 12.94 | 9.76 | 8.55 | |||||||||||||||
| Total loans |
1.52 | % | 2.30 | % | 3.17 | % | 3.64 | % | 2.00 | % | ||||||||||
| (a) | Delinquent loan ratios exclude $3.2 billion, $2.6 billion, $2.6 billion, $2.2 billion and $1.1 billion at December 31, 2012, 2011, 2010, 2009 and 2008, respectively, of loans purchased from GNMA mortgage pools whose repayments are primarily insured by the Federal Housing Administration or guaranteed by the Department of Veterans Affairs. Including these loans, the ratio of residential mortgages 90 days or more past due including all nonperforming loans was 9.45 percent, 9.84 percent, 12.28 percent, 12.86 percent and 6.95 percent at December 31, 2012, 2011, 2010, 2009, and 2008, respectively. |
| (b) | Delinquent loan ratios exclude student loans that are guaranteed by the federal government. Including these loans, the ratio of total other retail loans 90 days or more past due including all nonperforming loans was 1.08 percent, .99 percent, 1.04 percent, .91 percent and .64 percent at December 31, 2012, 2011, 2010, 2009 and 2008, respectively. |
Loan Delinquencies Trends in delinquency ratios are an indicator, among other considerations, of credit risk within the Company’s loan portfolios. The entire balance of an account is considered delinquent if the minimum payment contractually required to be made is not received by the specified date on the billing statement. The Company measures delinquencies, both including and excluding nonperforming loans, to enable comparability with other companies. Delinquent loans purchased from Government National Mortgage Association (“GNMA”) mortgage pools whose repayments of principal and interest are primarily insured by the Federal Housing Administration or guaranteed by the Department of Veterans Affairs, are excluded from delinquency statistics. In addition, in certain situations, a consumer lending customer’s account may be re-aged to remove it from delinquent status. Generally, the purpose of re-aging accounts is to assist customers who have recently overcome temporary financial difficulties, and have demonstrated both the ability and willingness to resume regular payments. To qualify for re-aging, the account must have been open for at least nine months and cannot have been re-aged during the preceding 365 days. An account may not be re-aged more than two times in a five-year period. To qualify for re-aging, the customer must also have made three regular minimum monthly payments within the last 90 days. In addition, the Company may re-age the consumer lending account of a customer who has experienced longer-term financial difficulties and apply modified, concessionary terms and conditions to the account. Such additional re-ages are limited to one in a five-year period and must meet the qualifications for re-aging described above. All re-aging strategies must be independently approved by the Company’s credit administration function. Commercial lending loans are generally not subject to re-aging policies.
Accruing loans 90 days or more past due totaled $1.3 billion ($660 million excluding covered loans) at
| U.S. BANCORP | 41 |
December 31, 2012, compared with $1.8 billion ($843 million excluding covered loans) at December 31, 2011, and $2.2 billion ($1.1 billion excluding covered loans) at December 31, 2010. The $183 million (21.7 percent) decrease, excluding covered loans, reflected improvement in residential mortgages, credit card and other retail loan portfolios during 2012. These loans are not included in nonperforming assets and continue to accrue interest because they are adequately secured by collateral, are in the process of collection and are reasonably expected to result in repayment or restoration to current status, or are managed in homogeneous portfolios with specified charge-off timeframes adhering to regulatory guidelines. The ratio of accruing loans 90 days or more past due to total loans was .59 percent (.31 percent excluding covered loans) at December 31, 2012, compared with .84 percent (.43 percent excluding covered loans) at December 31, 2011, and 1.11 percent (.61 percent excluding covered loans) at December 31, 2010.
The following table provides summary delinquency information for residential mortgages, credit card and other retail loans included in the consumer lending segment:
| Amount | As a Percent of Ending Loan Balances |
|||||||||||||||||
| At December 31 (Dollars in Millions) |
2012 | 2011 | 2012 | 2011 | ||||||||||||||
| Residential Mortgages (a) |
||||||||||||||||||
| 30-89 days |
$ | 348 | $ | 404 | .79 | % | 1.09 | % | ||||||||||
| 90 days or more |
281 | 364 | .64 | .98 | ||||||||||||||
| Nonperforming |
661 | 650 | 1.50 | 1.75 | ||||||||||||||
| Total |
$ | 1,290 | $ | 1,418 | 2.93 | % | 3.82 | % | ||||||||||
| Credit Card |
||||||||||||||||||
| 30-89 days |
$ | 227 | $ | 238 | 1.33 | % | 1.37 | % | ||||||||||
| 90 days or more |
217 | 236 | 1.27 | 1.36 | ||||||||||||||
| Nonperforming |
146 | 224 | .85 | 1.29 | ||||||||||||||
| Total |
$ | 590 | $ | 698 | 3.45 | % | 4.02 | % | ||||||||||
| Other Retail |
||||||||||||||||||
| Retail Leasing |
||||||||||||||||||
| 30-89 days |
$ | 12 | $ | 10 | .22 | % | .19 | % | ||||||||||
| 90 days or more |
1 | 1 | .02 | .02 | ||||||||||||||
| Nonperforming |
1 | – | .02 | – | ||||||||||||||
| Total |
$ | 14 | $ | 11 | .26 | % | .21 | % | ||||||||||
| Home Equity and Second Mortgages |
||||||||||||||||||
| 30-89 days |
$ | 126 | $ | 162 | .76 | % | .90 | % | ||||||||||
| 90 days or more |
51 | 133 | .30 | .73 | ||||||||||||||
| Nonperforming |
189 | 40 | 1.13 | .22 | ||||||||||||||
| Total |
$ | 366 | $ | 335 | 2.19 | % | 1.85 | % | ||||||||||
| Other (b) |
||||||||||||||||||
| 30-89 days |
$ | 152 | $ | 168 | .59 | % | .68 | % | ||||||||||
| 90 days or more |
44 | 50 | .17 | .20 | ||||||||||||||
| Nonperforming |
27 | 27 | .11 | .11 | ||||||||||||||
| Total |
$ | 223 | $ | 245 | .87 | % | .99 | % | ||||||||||
| (a) | Excludes $3.2 billion and $2.6 billion at December 31, 2012 and 2011, respectively, of loans purchased from GNMA mortgage pools that are 90 days or more past due that continue to accrue interest. |
| (b) | Includes revolving credit, installment, automobile and student loans. |
| 42 | U.S. BANCORP |
The following tables provide further information on residential mortgages and home equity and second mortgages as a percent of ending loan balances by borrower type at December 31:
| Residential mortgages (a) | 2012 | 2011 | ||||||
| Prime Borrowers |
||||||||
| 30-89 days |
.65 | % | .92 | % | ||||
| 90 days or more |
.58 | .90 | ||||||
| Nonperforming |
1.36 | 1.67 | ||||||
| Total |
2.59 | % | 3.49 | % | ||||
| Sub-Prime Borrowers |
||||||||
| 30-89 days |
6.41 | % | 6.70 | % | ||||
| 90 days or more |
3.89 | 4.91 | ||||||
| Nonperforming |
9.60 | 7.99 | ||||||
| Total |
19.90 | % | 19.60 | % | ||||
| Other Borrowers |
||||||||
| 30-89 days |
.97 | % | .92 | % | ||||
| 90 days or more |
.97 | 1.07 | ||||||
| Nonperforming |
1.83 | 1.07 | ||||||
| Total |
3.77 | % | 3.06 | % | ||||
| (a) | Excludes delinquent and nonperforming information on loans purchased from GNMA mortgage pools as their repayments are primarily insured by the Federal Housing Administration or guaranteed by the Department of Veterans Affairs. |
| Home equity and second mortgages | 2012 | 2011 | ||||||
| Prime Borrowers |
||||||||
| 30-89 days |
.64 | % | .78 | % | ||||
| 90 days or more |
.28 | .66 | ||||||
| Nonperforming |
1.03 | .21 | ||||||
| Total |
1.95 | % | 1.65 | % | ||||
| Sub-Prime Borrowers |
||||||||
| 30-89 days |
4.92 | % | 5.11 | % | ||||
| 90 days or more |
1.36 | 2.89 | ||||||
| Nonperforming |
4.10 | .22 | ||||||
| Total |
10.38 | % | 8.22 | % | ||||
| Other Borrowers |
||||||||
| 30-89 days |
1.41 | % | 1.43 | % | ||||
| 90 days or more |
.47 | 1.43 | ||||||
| Nonperforming |
2.35 | .47 | ||||||
| Total |
4.23 | % | 3.33 | % | ||||
The following table provides summary delinquency information for covered loans:
| Amount |
As a Percent of Ending |
|||||||||||||||||
| At December 31 (Dollars in Millions) |
2012 | 2011 | 2012 | 2011 | ||||||||||||||
| 30-89 days |
$ | 359 | $ | 362 | 3.18 | % | 2.45 | % | ||||||||||
| 90 days or more |
663 | 910 | 5.86 | 6.15 | ||||||||||||||
| Nonperforming |
386 | 926 | 3.41 | 6.26 | ||||||||||||||
| Total |
$ | 1,408 | $ | 2,198 | 12.45 | % | 14.86 | % | ||||||||||
Restructured Loans In certain circumstances, the Company may modify the terms of a loan to maximize the collection of amounts due when a borrower is experiencing financial difficulties or is expected to experience difficulties in the near-term. In most cases the modification is either a concessionary reduction in interest rate, extension of the maturity date or reduction in the principal balance that would otherwise not be considered.
Troubled Debt Restructurings Concessionary modifications are classified as TDRs unless the modification results in only an insignificant delay in the payments to be received. TDRs accrue interest if the borrower complies with the revised terms and conditions and has demonstrated repayment performance at a level commensurate with the modified terms over several payment cycles. Loans classified as TDRs are considered impaired loans for reporting and measurement purposes.
The Company continues to work with customers to modify loans for borrowers who are experiencing financial difficulties, including those acquired through FDIC-assisted acquisitions. Many of the Company’s TDRs are determined on a case-by-case basis in connection with ongoing loan collection processes. The modifications vary within each of the Company’s loan classes. Commercial lending segment TDRs generally include extensions of the maturity date and may be accompanied by an increase or decrease to the interest rate. The Company may also work with the borrower to make other changes to the loan to mitigate losses, such as obtaining additional collateral and/or guarantees to support the loan.
The Company has also implemented certain residential mortgage loan restructuring programs that may result in TDRs. The Company participates in the U.S. Department of the Treasury Home Affordable Modification Program (“HAMP”). HAMP gives qualifying homeowners an opportunity to permanently modify their loan and achieve more affordable monthly payments, with the U.S. Department of the Treasury compensating the Company for a portion of the reduction in monthly amounts due from borrowers participating in this program. The Company also modifies residential mortgage loans under Federal Housing Administration, Department of Veterans Affairs, and other internal programs. Under these programs, the Company provides concessions to qualifying borrowers experiencing financial difficulties. The concessions may include adjustments to interest rates, conversion of adjustable rates to fixed rates, extensions of maturity dates or deferrals of payments, capitalization of accrued interest and/or outstanding advances, or in limited situations, partial forgiveness of loan principal. In most instances, participation in residential mortgage loan restructuring programs requires the customer to complete a short-term trial period. A permanent loan modification is contingent on the customer successfully completing the trial period arrangement and the loan documents are not modified until that time. The Company reports loans in a trial period arrangement as TDRs.
Credit card and other retail loan modifications are generally part of distinct restructuring programs. The
| U.S. BANCORP | 43 |
Company offers a workout program providing customers modification solutions over a specified time period, generally up to 60 months. The Company also provides modification programs to qualifying customers experiencing a temporary financial hardship in which reductions are made to monthly required minimum payments for up to 12 months.
In accordance with regulatory guidance, the Company considers secured consumer loans that have had debt discharged through bankruptcy where the borrower has not reaffirmed the debt to be TDRs. If the loan amount exceeds the collateral value, the loan is charged down to collateral value and the remaining amount is reported as nonperforming.
Modifications to loans in the covered segment are similar in nature to that described above for non-covered loans, and the evaluation and determination of TDR status is similar, except that acquired loans restructured after acquisition are not considered TDRs for purposes of the Company’s accounting and disclosure if the loans evidenced credit deterioration as of the acquisition date and are accounted for in pools. Losses associated with modifications on covered loans, including the economic impact of interest rate reductions, are generally eligible for reimbursement under the loss sharing agreements.
The following table provides a summary of TDRs by loan class, including the delinquency status for TDRs that continue to accrue interest and TDRs included in nonperforming assets:
| At December 31, 2012 (Dollars in Millions) |
As a Percent of Performing TDRs | |||||||||||||||||||
| Performing TDRs |
30-89 Days Past Due |
90 Days or More Past Due |
Nonperforming TDRs |
Total TDRs |
||||||||||||||||
| Commercial |
$ | 281 | 6.0 | % | 1.2 | % | $ | 64 | (a) | $ | 345 | |||||||||
| Commercial real estate |
531 | 3.7 | – | 208 | (b) | 739 | ||||||||||||||
| Residential mortgages |
2,087 | 6.1 | 5.2 | 334 | 2,421 | (d) | ||||||||||||||
| Credit card |
296 | 11.0 | 7.0 | 146 | (c) | 442 | ||||||||||||||
| Other retail |
226 | 8.1 | 4.0 | 87 | (c) | 313 | (e) | |||||||||||||
| TDRs, excluding GNMA and covered loans |
3,421 | 6.3 | 4.1 | 839 | 4,260 | |||||||||||||||
| Loans purchased from GNMA mortgage pools |
1,778 | 8.7 | 53.0 | – | 1,778 | (f) | ||||||||||||||
| Covered loans |
381 | 4.5 | 7.4 | 105 | 486 | |||||||||||||||
| Total |
$ | 5,580 | 6.9 | % | 19.9 | % | $ | 944 | $ | 6,524 | ||||||||||
| (a) | Primarily represents loans less than six months from the modification date that have not met the performance period required to return to accrual status (generally six months) and small business credit cards with a modified rate equal to 0 percent. |
| (b) | Primarily represents loans less than six months from the modification date that have not met the performance period required to return to accrual status (generally six months). |
| (c) | Primarily represents loans with a modified rate equal to 0 percent. |
| (d) | Includes $236 million of residential mortgage loans to borrowers that have had debt discharged through bankruptcy and $55 million in trial period arrangements. |
| (e) | Includes $159 million of other retail loans to borrowers that have had debt discharged through bankruptcy and $4 million in trial period arrangements. |
| (f) | Includes $224 million of Federal Housing Administration and Department of Veterans Affairs residential mortgage loans to borrowers that have had debt discharged through bankruptcy and $353 million in trial period arrangements. |
Short-term Modifications The Company makes short-term modifications that it does not consider to be TDRs, in limited circumstances, to assist borrowers experiencing temporary hardships. Consumer lending programs include payment reductions, deferrals of up to three past due payments, and the ability to return to current status if the borrower makes required payments. The Company may also make short-term modifications to commercial lending loans, with the most common modification being an extension of the maturity date of three months or less. Such extensions generally are used when the maturity date is imminent and the borrower is experiencing some level of financial stress, but the Company believes the borrower will pay all contractual amounts owed. Short-term modifications were not material at December 31, 2012.
Nonperforming Assets The level of nonperforming assets represents another indicator of the potential for future credit losses. Nonperforming assets include nonaccrual loans, restructured loans not performing in accordance with modified terms and not accruing interest, restructured loans that have not met the performance period required to return to accrual status, other real estate owned and other nonperforming assets owned by the Company. Nonperforming assets are generally either originated by the Company or acquired under FDIC loss sharing agreements that substantially reduce the risk of credit losses to the Company. Interest payments collected from assets on nonaccrual status are generally applied against the principal balance and not recorded as income.
At December 31, 2012, total nonperforming assets were $2.7 billion, compared with $3.8 billion at December 31, 2011 and $5.0 billion at December 31, 2010. Excluding covered assets, nonperforming assets were $2.1 billion at December 31, 2012, compared with $2.6 billion at December 31, 2011 and $3.4 billion at December 31, 2010. The $486 million (18.9 percent) decrease in nonperforming assets, excluding covered assets, from December 31, 2011 to December 31, 2012, was primarily driven by reductions in construction and development loans, as the Company
| 44 | U.S. BANCORP |
continued to reduce exposure to these problem assets, as well as improvement in commercial mortgages and other commercial loan portfolios. These decreases were partially offset by increases in nonperforming residential mortgages and other retail loans. These increases were principally the result of a regulatory clarification in the treatment of residential mortgage and other consumer loans to borrowers who have had debt discharged through bankruptcy, and the inclusion, beginning in the second quarter of 2012, of junior lien loans and lines greater than 120 days past due, as well as junior lien loans behind a first lien greater than 180 days past due or on nonaccrual status, as nonperforming loans. These changes did not have a material impact on the Company’s allowance for credit losses. Nonperforming covered assets at December 31, 2012 were $583 million, compared with $1.2 billion at December 31, 2011 and $1.7 billion at December 31, 2010. These assets are covered by loss sharing agreements with the FDIC that substantially reduce the risk of credit losses to the Company. The ratio of total nonperforming assets to total loans and other real estate was 1.19 percent (.98 percent excluding covered assets) at December 31, 2012, compared with 1.79 percent (1.32 percent excluding covered assets) at December 31, 2011 and 2.55 percent (1.87 percent excluding covered assets) at December 31, 2010.
Other real estate owned, excluding covered assets, was $381 million at December 31, 2012, compared with $404 million at December 31, 2011 and $511 million at December 31, 2010, and was related to foreclosed properties that previously secured loan balances. Other real estate owned includes properties vacated by the borrower and maintained by Company, regardless of whether title in the property has transferred to the Company.
The following table provides an analysis of other real estate owned, excluding covered assets, as a percent of their related loan balances, including geographical location detail for residential (residential mortgage, home equity and second mortgage) and commercial (commercial and commercial real estate) loan balances:
| At December 31, (Dollars in Millions) |
Amount | As a Percent of Ending Loan Balances |
||||||||||||||
| 2012 | 2011 | 2012 | 2011 | |||||||||||||
| Residential |
||||||||||||||||
| Minnesota |
$ | 20 | $ | 22 | .34 | % | .39 | % | ||||||||
| Illinois |
19 | 10 | .55 | .31 | ||||||||||||
| California |
16 | 16 | .18 | .22 | ||||||||||||
| Washington |
14 | 6 | .38 | .18 | ||||||||||||
| Florida |
14 | 5 | 1.55 | .60 | ||||||||||||
| All other states |
185 | 92 | .49 | .26 | ||||||||||||
| Total residential |
268 | 151 | .44 | .27 | ||||||||||||
| Commercial |
||||||||||||||||
| Missouri |
17 | 5 | .37 | .12 | ||||||||||||
| Nevada |
11 | 44 | .87 | 3.13 | ||||||||||||
| Arizona |
10 | 16 | .83 | 1.41 | ||||||||||||
| California |
8 | 26 | .05 | .18 | ||||||||||||
| Washington |
7 | 9 | .11 | .15 | ||||||||||||
| All other states |
60 | 153 | .08 | .23 | ||||||||||||
| Total commercial |
113 | 253 | .11 | .27 | ||||||||||||
| Total |
$ | 381 | $ | 404 | .18 | % | .21 | % | ||||||||
| U.S. BANCORP | 45 |
| TABLE 16 | Nonperforming Assets (a) |
| At December 31 (Dollars in Millions) | 2012 | 2011 | 2010 | 2009 | 2008 | |||||||||||||||
| Commercial |
||||||||||||||||||||
| Commercial |
$ | 107 | $ | 280 | $ | 519 | $ | 866 | $ | 290 | ||||||||||
| Lease financing |
16 | 32 | 78 | 125 | 102 | |||||||||||||||
| Total commercial |
123 | 312 | 597 | 991 | 392 | |||||||||||||||
| Commercial Real Estate |
||||||||||||||||||||
| Commercial mortgages |
308 | 354 | 545 | 581 | 294 | |||||||||||||||
| Construction and development |
238 | 545 | 748 | 1,192 | 780 | |||||||||||||||
| Total commercial real estate |
546 | 899 | 1,293 | 1,773 | 1,074 | |||||||||||||||
| Residential Mortgages (b) |
661 | 650 | 636 | 467 | 210 | |||||||||||||||
| Credit Card |
146 | 224 | 228 | 142 | 67 | |||||||||||||||
| Other Retail |
||||||||||||||||||||
| Retail leasing |
1 | – | – | – | – | |||||||||||||||
| Other |
216 | 67 | 65 | 62 | 25 | |||||||||||||||
| Total other retail |
217 | 67 | 65 | 62 | 25 | |||||||||||||||
| Total nonperforming loans, excluding covered loans |
1,693 | 2,152 | 2,819 | 3,435 | 1,768 | |||||||||||||||
| Covered Loans |
386 | 926 | 1,244 | 1,350 | 369 | |||||||||||||||
| Total nonperforming loans |
2,079 | 3,078 | 4,063 | 4,785 | 2,137 | |||||||||||||||
| Other Real Estate (c) (d) |
381 | 404 | 511 | 437 | 190 | |||||||||||||||
| Covered Other Real Estate (d) |
197 | 274 | 453 | 653 | 274 | |||||||||||||||
| Other Assets |
14 | 18 | 21 | 32 | 23 | |||||||||||||||
| Total nonperforming assets |
$ | 2,671 | $ | 3,774 | $ | 5,048 | $ | 5,907 | $ | 2,624 | ||||||||||
| Total nonperforming assets, excluding covered assets |
$ | 2,088 | $ | 2,574 | $ | 3,351 | $ | 3,904 | $ | 1,981 | ||||||||||
| Excluding Covered Assets |
||||||||||||||||||||
| Accruing loans 90 days or more past due (b) |
$ | 660 | $ | 843 | $ | 1,094 | $ | 1,525 | $ | 967 | ||||||||||
| Nonperforming loans to total loans |
.80 | % | 1.10 | % | 1.57 | % | 1.99 | % | 1.02 | % | ||||||||||
| Nonperforming assets to total loans plus other real estate (c) |
.98 | % | 1.32 | % | 1.87 | % | 2.25 | % | 1.14 | % | ||||||||||
| Including Covered Assets |
||||||||||||||||||||
| Accruing loans 90 days or more past due (b) |
$ | 1,323 | $ | 1,753 | $ | 2,184 | $ | 2,309 | $ | 1,554 | ||||||||||
| Nonperforming loans to total loans |
.93 | % | 1.47 | % | 2.06 | % | 2.46 | % | 1.16 | % | ||||||||||
| Nonperforming assets to total loans plus other real estate (c) |
1.19 | % | 1.79 | % | 2.55 | % | 3.02 | % | 1.42 | % | ||||||||||
| Changes in Nonperforming Assets |
||||||||||||||||
| (Dollars in Millions) | Commercial and Commercial Real Estate |
Credit Card, Other Retail and Residential Mortgages (f) |
Covered Assets |
Total | ||||||||||||
| Balance December 31, 2011 |
$ | 1,475 | $ | 1,099 | $ | 1,200 | $ | 3,774 | ||||||||
| Additions to nonperforming assets |
||||||||||||||||
| New nonaccrual loans and foreclosed properties |
864 | 1,203 | 267 | 2,334 | ||||||||||||
| Advances on loans |
46 | – | – | 46 | ||||||||||||
| Total additions |
910 | 1,203 | 267 | 2,380 | ||||||||||||
| Reductions in nonperforming assets |
||||||||||||||||
| Paydowns, payoffs |
(711 | ) | (301 | ) | (598 | ) | (1,610 | ) | ||||||||
| Net sales |
(344 | ) | (135 | ) | (237 | ) | (716 | ) | ||||||||
| Return to performing status |
(43 | ) | (137 | ) | (36 | ) | (216 | ) | ||||||||
| Charge-offs (e) |
(507 | ) | (421 | ) | (13 | ) | (941 | ) | ||||||||
| Total reductions |
(1,605 | ) | (994 | ) | (884 | ) | (3,483 | ) | ||||||||
| Net additions to (reductions in) nonperforming assets |
(695 | ) | 209 | (617 | ) | (1,103 | ) | |||||||||
| Balance December 31, 2012 |
$ | 780 | $ | 1,308 | $ | 583 | $ | 2,671 | ||||||||
| (a) | Throughout this document, nonperforming assets and related ratios do not include accruing loans 90 days or more past due. |
| (b) | Excludes $3.2 billion, $2.6 billion, $2.6 billion, $2.2 billion and $1.1 billion at December 31, 2012, 2011, 2010, 2009 and 2008, respectively, of loans purchased from GNMA mortgage pools that are 90 days or more past due that continue to accrue interest, as their repayments are primarily insured by the Federal Housing Administration or guaranteed by the Department of Veterans Affairs. |
| (c) | Foreclosed GNMA loans of $548 million, $692 million, $575 million, $359 million and $209 million at December 31, 2012, 2011, 2010, 2009 and 2008, respectively, continue to accrue interest and are recorded as other assets and excluded from nonperforming assets because they are insured by the Federal Housing Administration or guaranteed by the Department of Veterans Affairs. |
| (d) | Includes equity investments in entities whose principal assets are other real estate owned. |
| (e) | Charge-offs exclude actions for certain card products and loan sales that were not classified as nonperforming at the time the charge-off occurred. |
| (f) | Residential mortgage information excludes changes related to residential mortgages serviced by others. |
| 46 | U.S. BANCORP |
| TABLE 17 | Net Charge-Offs as a Percent of Average Loans Outstanding |
| Year Ended December 31 | 2012 | 2011 | 2010 | 2009 | 2008 | |||||||||||||||
| Commercial |
||||||||||||||||||||
| Commercial |
.43 | % | .76 | % | 1.80 | % | 1.60 | % | .53 | % | ||||||||||
| Lease financing |
.63 | .96 | 1.47 | 2.82 | 1.36 | |||||||||||||||
| Total commercial |
.45 | .79 | 1.76 | 1.75 | .63 | |||||||||||||||
| Commercial Real Estate |
||||||||||||||||||||
| Commercial mortgages |
.37 | .73 | 1.23 | .42 | .15 | |||||||||||||||
| Construction and development |
.86 | 4.20 | 6.32 | 5.35 | 1.48 | |||||||||||||||
| Total commercial real estate |
.45 | 1.40 | 2.47 | 1.82 | .55 | |||||||||||||||
| Residential Mortgages |
1.09 | 1.45 | 1.97 | 2.00 | 1.01 | |||||||||||||||
| Credit Card (a) |
4.01 | 5.19 | 7.32 | 6.90 | 4.73 | |||||||||||||||
| Other Retail |
||||||||||||||||||||
| Retail leasing |
.04 | – | .27 | .74 | .65 | |||||||||||||||
| Home equity and second mortgages |
1.72 | 1.66 | 1.72 | 1.75 | 1.01 | |||||||||||||||
| Other |
.94 | 1.20 | 1.68 | 1.85 | 1.39 | |||||||||||||||
| Total other retail |
1.13 | 1.25 | 1.56 | 1.69 | 1.15 | |||||||||||||||
| Total loans, excluding covered loans |
1.03 | 1.53 | 2.41 | 2.23 | 1.10 | |||||||||||||||
| Covered Loans |
.08 | .07 | .09 | .09 | .38 | |||||||||||||||
| Total loans |
.97 | % | 1.41 | % | 2.17 | % | 2.08 | % | 1.10 | % | ||||||||||
| (a) | Net charge-off as a percent of average loans outstanding, excluding portfolio purchases where the acquired loans were recorded at fair value at the purchase date, were 4.16 percent, 5.36 percent, 7.99 percent and 7.14 percent for the years ended December 31, 2012, 2011, 2010 and 2009, respectively. |
Analysis of Loan Net Charge-offs Total loan net charge-offs were $2.1 billion in 2012, compared with $2.8 billion in 2011 and $4.2 billion in 2010. The ratio of total loan net charge-offs to average loans was .97 percent in 2012, compared with 1.41 percent in 2011 and 2.17 percent in 2010. The decrease in total net charge-offs in 2012, compared with 2011, was due to improvement in most loan categories as economic conditions continued to slowly improve.
Commercial and commercial real estate loan net charge- offs for 2012 were $441 million (.45 percent of average loans outstanding), compared with $904 million (1.04 percent of average loans outstanding) in 2011 and $1.7 billion (2.06 percent of average loans outstanding) in 2010. The decrease in net charge-offs in 2012, compared with 2011, reflected the Company’s continued efforts to resolve and reduce exposure to problem assets in its commercial real estate portfolios and improvement in its other commercial portfolios due to the continued improvement in the economy. The decrease in net charge-offs in 2011, compared with 2010, also reflected efforts to reduce exposure to problem assets in the Company’s commercial real estate portfolios and improvement in the other commercial portfolios.
Residential mortgage loan net charge-offs for 2012 were $438 million (1.09 percent of average loans outstanding), compared with $489 million (1.45 percent of average loans outstanding) in 2011 and $546 million (1.97 percent of average loans outstanding) in 2010. Credit card loan net charge-offs in 2012 were $667 million (4.01 percent of average loans outstanding), compared with $834 million (5.19 percent of average loans outstanding) in 2011 and $1.2 billion (7.32 percent of average loans outstanding) in 2010. Other retail loan net charge-offs for 2012 were $541 million (1.13 percent of average loans outstanding), compared with $604 million (1.25 percent of average loans outstanding) in 2011 and $745 million (1.56 percent of average loans outstanding) in 2010. The decrease in total residential mortgage, credit card and other retail loan net charge-offs in 2012, compared with 2011, reflected the impact of more stable economic conditions, partially offset by current year incremental charge-offs in the residential mortgages and other retail loan portfolios related to regulatory clarification on bankruptcy loans. The decrease in total residential mortgage, credit card and other retail loan net charge-offs in 2011, compared with 2010, reflected the impact of more stable economic conditions.
| U.S. BANCORP | 47 |
The following table provides an analysis of net charge-offs as a percent of average loans outstanding for residential mortgages and home equity and second mortgages by borrower type:
| Year Ended December 31 (Dollars in Millions) |
Average Loans | Percent of Average Loans | ||||||||||||||||
| 2012 | 2011 | 2012 | 2011 | |||||||||||||||
| Residential Mortgages |
||||||||||||||||||
| Prime borrowers |
$ | 32,811 | $ | 26,642 | .95 | % | 1.34 | % | ||||||||||
| Sub-prime borrowers |
1,725 | 1,975 | 6.43 | 6.18 | ||||||||||||||
| Other borrowers |
745 | 555 | 1.88 | 1.80 | ||||||||||||||
| Loans purchased from GNMA mortgage pools (a) |
5,009 | 4,539 | .04 | – | ||||||||||||||
| Total |
$ | 40,290 | $ | 33,711 | 1.09 | 1.45 | ||||||||||||
| Home Equity and Second Mortgages |
||||||||||||||||||
| Prime borrowers |
$ | 16,622 | $ | 17,646 | 1.53 | % | 1.45 | % | ||||||||||
| Sub-prime borrowers |
407 | 491 | 8.85 | 9.16 | ||||||||||||||
| Other borrowers |
422 | 418 | 2.37 | 1.91 | ||||||||||||||
| Total |
$ | 17,451 | $ | 18,555 | 1.72 | 1.66 | ||||||||||||
| (a) | Represents loans purchased from GNMA mortgage pools whose payments are primarily insured by the Federal Housing Administration or guaranteed by the Department of Veterans Affairs. |
Analysis and Determination of the Allowance for Credit Losses The allowance for credit losses reserves for probable and estimable losses incurred in the Company’s loan and lease portfolio and includes certain amounts that do not represent loss exposure to the Company because those losses are recoverable under loss sharing agreements with the FDIC. The allowance for credit losses is increased through provisions charged to operating earnings and reduced by net charge-offs. Management evaluates the allowance each quarter to ensure it appropriately reserves for incurred losses. The evaluation of each element and the overall allowance is based on a continuing assessment of problem loans, recent loss experience and other factors, including regulatory guidance and economic conditions. Because business processes and credit risks associated with unfunded credit commitments are essentially the same as for loans, the Company utilizes similar processes to estimate its liability for unfunded credit commitments, which is included in other liabilities in the Consolidated Balance Sheet. Both the allowance for loan losses and the liability for unfunded credit commitments are included in the Company’s analysis of credit losses and reported reserve ratios.
At December 31, 2012, the allowance for credit losses was $4.7 billion (2.12 percent of total loans and 2.15 percent of loans excluding covered loans), compared with an allowance of $5.0 billion (2.39 percent of total loans and 2.52 percent of loans excluding covered loans) at December 31, 2011. The ratio of the allowance for credit losses to nonperforming loans was 228 percent (269 percent excluding covered loans) at December 31, 2012, compared with 163 percent (228 percent excluding covered loans) at December 31, 2011. The ratio of the allowance for credit losses to annual loan net charge-offs at December 31, 2012, was 226 percent, compared with 176 percent at December 31, 2011, as net charge-offs continue to decline due to stabilizing economic conditions. Management determined the allowance for credit losses was appropriate at December 31, 2012.
The allowance recorded for loans in the commercial lending segment is based on reviews of individual credit relationships and considers the migration analysis of commercial lending segment loans and actual loss experience. The Company currently uses a 12-year period of historical losses in considering actual loss experience, because it believes that period best reflects the losses incurred in the portfolio. This timeframe and the results of the analysis are evaluated quarterly to determine if they are appropriate. The allowance recorded for impaired loans greater than $5 million in the commercial lending segment is based on an individual loan analysis utilizing expected cash flows discounted using the original effective interest rate, the observable market price, or the fair value of the collateral for collateral-dependent loans. The allowance recorded for all other commercial lending segment loans is determined on a homogenous pool basis and includes consideration of product mix, risk characteristics of the portfolio, bankruptcy experience, and historical losses, adjusted for current trends. The allowance established for commercial lending segment loans, was $1.9 billion at December 31, 2012, compared with $2.2 billion at December 31, 2011. The decrease in the allowance for commercial lending segment loans of $256 million at December 31, 2012, compared with December 31, 2011, reflected the impact of efforts by the Company to resolve and reduce exposure to problem assets in the commercial real estate portfolios and overall improvement in economic conditions affecting incurred losses, partially offset by growth in the portfolios.
The allowance recorded for purchased impaired and TDR loans in the consumer lending segment is determined on a homogenous pool basis utilizing expected cash flows discounted using the original effective interest rate of the pool. The allowance for collateral-dependent loans in the consumer lending segment is determined based on the fair value of the collateral. The allowance recorded for all other consumer lending segment loans is determined on a homogenous pool basis and includes consideration of product mix, risk characteristics of the portfolio, bankruptcy experience, delinquency status, refreshed LTV ratios when possible, portfolio growth and historical losses, adjusted for current trends. Credit card and other retail loans 90 days or more past due are generally not placed on nonaccrual status because of the relatively short period of time to charge-off and, therefore, are excluded from nonperforming loans and measures that include nonperforming loans as part of the calculation.
When evaluating the appropriateness of the allowance for credit losses for any loans and lines in a junior lien position,
| 48 | U.S. BANCORP |
| TABLE 18 | Summary of Allowance for Credit Losses |
| (Dollars in Millions) | 2012 | 2011 | 2010 | 2009 | 2008 | |||||||||||||||
| Balance at beginning of year |
$ | 5,014 | $ | 5,531 | $ | 5,264 | $ | 3,639 | $ | 2,260 | ||||||||||
| Charge-Offs |
||||||||||||||||||||
| Commercial |
||||||||||||||||||||
| Commercial |
312 | 423 | 784 | 769 | 282 | |||||||||||||||
| Lease financing |
66 | 93 | 134 | 227 | 113 | |||||||||||||||
| Total commercial |
378 | 516 | 918 | 996 | 395 | |||||||||||||||
| Commercial real estate |
||||||||||||||||||||
| Commercial mortgages |
145 | 231 | 333 | 103 | 34 | |||||||||||||||
| Construction and development |
97 | 312 | 538 | 516 | 139 | |||||||||||||||
| Total commercial real estate |
242 | 543 | 871 | 619 | 173 | |||||||||||||||
| Residential mortgages |
461 | 502 | 554 | 493 | 236 | |||||||||||||||
| Credit card |
769 | 922 | 1,270 | 1,093 | 630 | |||||||||||||||
| Other retail |
||||||||||||||||||||
| Retail leasing |
9 | 10 | 25 | 47 | 41 | |||||||||||||||
| Home equity and second mortgages |
327 | 327 | 348 | 347 | 185 | |||||||||||||||
| Other |
330 | 396 | 490 | 504 | 344 | |||||||||||||||
| Total other retail |
666 | 733 | 863 | 898 | 570 | |||||||||||||||
| Covered loans (a) |
11 | 13 | 20 | 12 | 5 | |||||||||||||||
| Total charge-offs |
2,527 | 3,229 | 4,496 | 4,111 | 2,009 | |||||||||||||||
| Recoveries |
||||||||||||||||||||
| Commercial |
||||||||||||||||||||
| Commercial |
72 | 74 | 48 | 30 | 27 | |||||||||||||||
| Lease financing |
31 | 36 | 43 | 40 | 26 | |||||||||||||||
| Total commercial |
103 | 110 | 91 | 70 | 53 | |||||||||||||||
| Commercial real estate |
||||||||||||||||||||
| Commercial mortgages |
31 | 22 | 13 | 2 | 1 | |||||||||||||||
| Construction and development |
45 | 23 | 13 | 3 | – | |||||||||||||||
| Total commercial real estate |
76 | 45 | 26 | 5 | 1 | |||||||||||||||
| Residential mortgages |
23 | 13 | 8 | 4 | 2 | |||||||||||||||
| Credit card |
102 | 88 | 70 | 62 | 65 | |||||||||||||||
| Other retail |
||||||||||||||||||||
| Retail leasing |
7 | 10 | 13 | 11 | 6 | |||||||||||||||
| Home equity and second mortgages |
26 | 19 | 17 | 9 | 7 | |||||||||||||||
| Other |
92 | 100 | 88 | 81 | 56 | |||||||||||||||
| Total other retail |
125 | 129 | 118 | 101 | 69 | |||||||||||||||
| Covered loans (a) |
1 | 1 | 2 | 1 | – | |||||||||||||||
| Total recoveries |
430 | 386 | 315 | 243 | 190 | |||||||||||||||
| Net Charge-Offs |
||||||||||||||||||||
| Commercial |
||||||||||||||||||||
| Commercial |
240 | 349 | 736 | 739 | 255 | |||||||||||||||
| Lease financing |
35 | 57 | 91 | 187 | 87 | |||||||||||||||
| Total commercial |
275 | 406 | 827 | 926 | 342 | |||||||||||||||
| Commercial real estate |
||||||||||||||||||||
| Commercial mortgages |
114 | 209 | 320 | 101 | 33 | |||||||||||||||
| Construction and development |
52 | 289 | 525 | 513 | 139 | |||||||||||||||
| Total commercial real estate |
166 | 498 | 845 | 614 | 172 | |||||||||||||||
| Residential mortgages |
438 | 489 | 546 | 489 | 234 | |||||||||||||||
| Credit card |
667 | 834 | 1,200 | 1,031 | 565 | |||||||||||||||
| Other retail |
||||||||||||||||||||
| Retail leasing |
2 | – | 12 | 36 | 35 | |||||||||||||||
| Home equity and second mortgages |
301 | 308 | 331 | 338 | 178 | |||||||||||||||
| Other |
238 | 296 | 402 | 423 | 288 | |||||||||||||||
| Total other retail |
541 | 604 | 745 | 797 | 501 | |||||||||||||||
| Covered loans (a) |
10 | 12 | 18 | 11 | 5 | |||||||||||||||
| Total net charge-offs |
2,097 | 2,843 | 4,181 | 3,868 | 1,819 | |||||||||||||||
| Provision for credit losses |
1,882 | 2,343 | 4,356 | 5,557 | 3,096 | |||||||||||||||
| Net change for credit losses to be reimbursed by the FDIC |
(33 | ) | (17 | ) | 92 | – | – | |||||||||||||
| Other changes |
(33 | ) | – | – | (64 | ) | 102 | |||||||||||||
| Balance at end of year |
$ | 4,733 | $ | 5,014 | $ | 5,531 | $ | 5,264 | $ | 3,639 | ||||||||||
| Components |
||||||||||||||||||||
| Allowance for loan losses, excluding losses to be reimbursed by the FDIC |
$ | 4,382 | $ | 4,678 | $ | 5,218 | $ | 5,079 | $ | 3,514 | ||||||||||
| Allowance for credit losses to be reimbursed by the FDIC |
42 | 75 | 92 | – | – | |||||||||||||||
| Liability for unfunded credit commitments |
309 | 261 | 221 | 185 | 125 | |||||||||||||||
| Total allowance for credit losses |
$ | 4,733 | $ | 5,014 | $ | 5,531 | $ | 5,264 | $ | 3,639 | ||||||||||
| Allowance for Credit Losses as a Percentage of |
||||||||||||||||||||
| Period-end loans, excluding covered loans |
2.15 | % | 2.52 | % | 3.03 | % | 3.04 | % | 2.09 | % | ||||||||||
| Nonperforming loans, excluding covered loans |
269 | 228 | 192 | 153 | 206 | |||||||||||||||
| Nonperforming and accruing loans 90 days or more past due, excluding covered loans |
194 | 164 | 138 | 106 | 133 | |||||||||||||||
| Nonperforming assets, excluding covered assets |
218 | 191 | 162 | 135 | 184 | |||||||||||||||
| Net charge-offs, excluding covered loans |
218 | 174 | 130 | 136 | 201 | |||||||||||||||
| Period-end loans |
2.12 | % | 2.39 | % | 2.81 | % | 2.70 | % | 1.97 | % | ||||||||||
| Nonperforming loans |
228 | 163 | 136 | 110 | 170 | |||||||||||||||
| Nonperforming and accruing loans 90 days or more past due |
139 | 104 | 89 | 74 | 99 | |||||||||||||||
| Nonperforming assets |
177 | 133 | 110 | 89 | 139 | |||||||||||||||
| Net charge-offs |
226 | 176 | 132 | 136 | 200 | |||||||||||||||
| Note: | At December 31, 2012 and 2011, $1.7 billion and $1.8 billion, respectively, of the total allowance for credit losses related to incurred losses on credit card and other retail loans. |
| (a) | Relates to covered loan charge-offs and recoveries not reimbursable by the FDIC. |
| U.S. BANCORP | 49 |
| TABLE 19 | Elements of the Allowance for Credit Losses |
| Allowance Amount | Allowance as a Percent of Loans | |||||||||||||||||||||||||||||||||||||||||
| At December 31 (Dollars in Millions) | 2012 | 2011 | 2010 | 2009 | 2008 | 2012 | 2011 | 2010 | 2009 | 2008 | ||||||||||||||||||||||||||||||||
| Commercial |
||||||||||||||||||||||||||||||||||||||||||
| Commercial |
$ | 979 | $ | 929 | $ | 992 | $ | 1,026 | $ | 782 | 1.61 | % | 1.83 | % | 2.35 | % | 2.43 | % | 1.57 | % | ||||||||||||||||||||||
| Lease financing |
72 | 81 | 112 | 182 | 208 | 1.31 | 1.37 | 1.83 | 2.78 | 3.03 | ||||||||||||||||||||||||||||||||
| Total commercial |
1,051 | 1,010 | 1,104 | 1,208 | 990 | 1.59 | 1.78 | 2.28 | 2.48 | 1.75 | ||||||||||||||||||||||||||||||||
| Commercial Real Estate |
||||||||||||||||||||||||||||||||||||||||||
| Commercial mortgages |
641 | 850 | 929 | 548 | 258 | 2.07 | 2.87 | 3.41 | 2.17 | 1.10 | ||||||||||||||||||||||||||||||||
| Construction and development |
216 | 304 | 362 | 453 | 191 | 3.63 | 4.91 | 4.86 | 5.16 | 1.95 | ||||||||||||||||||||||||||||||||
| Total commercial real estate |
857 | 1,154 | 1,291 | 1,001 | 449 | 2.32 | 3.22 | 3.72 | 2.94 | 1.35 | ||||||||||||||||||||||||||||||||
| Residential Mortgages |
935 | 927 | 820 | 672 | 524 | 2.12 | 2.50 | 2.67 | 2.58 | 2.22 | ||||||||||||||||||||||||||||||||
| Credit Card |
863 | 992 | 1,395 | 1,495 | 926 | 5.04 | 5.71 | 8.30 | 8.89 | 6.85 | ||||||||||||||||||||||||||||||||
| Other Retail |
||||||||||||||||||||||||||||||||||||||||||
| Retail leasing |
11 | 12 | 11 | 30 | 49 | .20 | .23 | .24 | .66 | .96 | ||||||||||||||||||||||||||||||||
| Home equity and second mortgages |
583 | 536 | 411 | 374 | 255 | 3.49 | 2.96 | 2.17 | 1.92 | 1.33 | ||||||||||||||||||||||||||||||||
| Other |
254 | 283 | 385 | 467 | 372 | .99 | 1.14 | 1.55 | 2.02 | 1.65 | ||||||||||||||||||||||||||||||||
| Total other retail |
848 | 831 | 807 | 871 | 676 | 1.78 | 1.73 | 1.67 | 1.85 | 1.44 | ||||||||||||||||||||||||||||||||
| Covered Loans |
179 | 100 | 114 | 17 | 74 | 1.58 | .68 | .63 | .08 | .66 | ||||||||||||||||||||||||||||||||
| Total allowance |
$ | 4,733 | $ | 5,014 | $ | 5,531 | $ | 5,264 | $ | 3,639 | 2.12 | % | 2.39 | % | 2.81 | % | 2.70 | % | 1.97 | % | ||||||||||||||||||||||
the Company considers the delinquency and modification status of the first lien. At December 31, 2012, the Company serviced the first lien on 32 percent of the home equity loans and lines in a junior lien position. The Company also considers information received from its primary regulator on the status of the first liens that are serviced by other large servicers in the industry and the status of first lien mortgage accounts reported on customer credit bureau files. Regardless of whether or not the Company services the first lien, an assessment is made of economic conditions, problem loans, recent loss experience and other factors in determining the allowance for credit losses. Based on the available information, the Company estimated $505 million or 3.0 percent of the total home equity portfolio at December 31, 2012, represented junior liens where the first lien was delinquent or modified.
The Company uses historical loss experience on the loans and lines in a junior lien position where the first lien is serviced by the Company or can be identified in credit bureau data to establish loss estimates for junior lien loans and lines the Company services when they are current, but the first lien is delinquent or modified. Historically, the number of junior lien defaults in any period has been a small percentage of the total portfolio (for example, only 1.7 percent for the twelve months ended December 31, 2012), and the long-term average loss rate on the small percentage of loans that default has been approximately 80 percent. In periods of economic stress such as the current environment, the Company has experienced loss severity rates in excess of 90 percent for junior liens that default. In addition, the Company obtains updated credit scores on its home equity portfolio each quarter and in some cases more frequently, and uses this information to qualitatively supplement its loss estimation methods. Credit score distributions for the portfolio are monitored monthly and any changes in the distribution are one of the factors considered in assessing the Company’s loss estimates.
The allowance established for consumer lending segment loans was $2.6 billion at December 31, 2012, compared with $2.8 billion at December 31, 2011. The $104 million decrease in the allowance for consumer lending segment loans at December 31, 2012, compared with December 31, 2011, reflected the impact of more stable economic conditions.
The allowance for the covered loan segment is evaluated each quarter in a manner similar to that described for non-covered loans, and represents any decreases in expected cash flows on those loans after the acquisition date. The provision for credit losses for covered loans considers the indemnification provided by the FDIC. The allowance established for covered loans was $179 million at December 31, 2012, compared with $100 million at December 31, 2011. The increase reflected a delay in the anticipated timing of defaults and collateral disposition.
In addition, the evaluation of the appropriate allowance for credit losses for purchased non-impaired loans acquired after January 1, 2009, in the various loan segments considers credit discounts recorded as a part of the initial determination of the fair value of the loans. For these loans, no allowance for credit losses is recorded at the purchase date. Credit discounts representing the principal losses expected over the life of the loans are a component of the initial fair value. Subsequent to the purchase date, the methods utilized to estimate the required allowance for credit losses for these loans is similar to originated loans; however, the Company records a provision for credit losses only when the required
| 50 | U.S. BANCORP |
allowance, net of any expected reimbursement under any loss sharing agreements with the FDIC, exceeds any remaining credit discounts.
The evaluation of the appropriate allowance for credit losses for purchased impaired loans in the various loan segments considers the expected cash flows to be collected from the borrower. These loans are initially recorded at fair value and therefore no allowance for credit losses is recorded at the purchase date.
Subsequent to the purchase date, the expected cash flows of purchased loans are subject to evaluation. Decreases in the present value of expected cash flows are recognized by recording an allowance for credit losses with the related provision for credit losses reduced for the amount reimbursable by the FDIC, where applicable. If the expected cash flows on the purchased loans increase such that a previously recorded impairment allowance can be reversed, the Company records a reduction in the allowance with a related reduction in losses reimbursable by the FDIC, where applicable. Increases in expected cash flows of purchased loans and decreases in expected cash flows of the FDIC indemnification assets, when there are no previous impairment allowances, are considered together and recognized over the remaining life of the loans. Refer to Note 1 of the Notes to Consolidated Financial Statements, for more information.
The Company’s methodology for determining the appropriate allowance for credit losses for all the loan segments also considers the imprecision inherent in the methodologies used. As a result, in addition to the amounts determined under the methodologies described above, management also considers the potential impact of other qualitative factors which include, but are not limited to, economic factors; geographic and other concentration risks; delinquency and nonaccrual trends; current business conditions; changes in lending policy, underwriting standards, internal review and other relevant business practices; and the regulatory environment. The consideration of these items results in adjustments to allowance amounts included in the Company’s allowance for credit losses for each of the above loan segments. Table 19 shows the amount of the allowance for credit losses by loan segment, class and underlying portfolio category.
Although the Company determines the amount of each element of the allowance separately and considers this process to be an important credit management tool, the entire allowance for credit losses is available for the entire loan portfolio. The actual amount of losses incurred can vary significantly from the estimated amounts.
Residual Value Risk Management The Company manages its risk to changes in the residual value of leased assets through disciplined residual valuation setting at the inception of a lease, diversification of its leased assets, regular residual asset valuation reviews and monitoring of residual value gains or losses upon the disposition of assets. Commercial lease originations are subject to the same well-defined underwriting standards referred to in the “Credit Risk Management” section which includes an evaluation of the residual value risk. Retail lease residual value risk is mitigated further by originating longer-term vehicle leases and effective end-of-term marketing of off-lease vehicles.
Included in the retail leasing portfolio was approximately $3.8 billion of retail leasing residuals at December 31, 2012, compared with $3.4 billion at December 31, 2011. The Company monitors concentrations of leases by manufacturer and vehicle “make and model.” As of December 31, 2012, vehicle lease residuals related to sport utility vehicles were 55.9 percent of the portfolio, while mid-range and upscale vehicle classes represented approximately 17.9 percent and 13.8 percent of the portfolio, respectively. At year-end 2012, the largest vehicle-type concentration represented 7.5 percent of the aggregate residual value of the vehicles in the portfolio. At December 31, 2012, the weighted-average origination term of the portfolio was 41 months, compared with 42 months at December 31, 2011.
Since the beginning of 2009, used vehicle prices have increased substantially as sales of new vehicles were affected by the financial condition of the automobile manufacturers, various government programs and involvement with the manufacturers, and consumers’ preference for used, instead of new, vehicles due to uncertainty about the economy. As economic conditions continue to improve, new vehicle sales and production have increased and the demand for, and price of, used vehicles has begun to decrease.
At December 31, 2012, the commercial leasing portfolio had $567 million of residuals, compared with $620 million at December 31, 2011. At year-end 2012, lease residuals related to trucks and other transportation equipment were 33.2 percent of the total residual portfolio. Business and office equipment represented 24.4 percent of the aggregate portfolio, while railcars represented 11.9 percent and manufacturing equipment represented 10.0 percent. No other concentrations of more than 10 percent existed at December 31, 2012.
Operational Risk Management Operational risk represents the risk of loss resulting from the Company’s operations, including, but not limited to, the risk of fraud by employees or persons outside the Company, unauthorized access to its computer systems, the execution of unauthorized transactions by employees, errors relating to transaction processing and technology, breaches of internal controls and in data security, compliance requirements, and business continuation and disaster recovery. Operational risk also includes the potential legal actions that could arise as a result of an operational deficiency or as a result of noncompliance with applicable regulatory standards, adverse business decisions or their
| U.S. BANCORP | 51 |
implementation, and customer attrition due to potential negative publicity.
The Company operates in many different businesses in diverse markets and relies on the ability of its employees and systems to process a high number of transactions. Operational risk is inherent in all business activities, and the management of this risk is important to the achievement of the Company’s objectives. In the event of a breakdown in the internal control system, unauthorized access or improper operation of systems, or improper employees’ actions, the Company could suffer financial loss, face regulatory action and suffer damage to its reputation.
The Company manages operational risk through a risk management framework and its internal control processes. Within this framework, the Risk Management Committee of the Company’s Board of Directors provides oversight and assesses the most significant operational risks facing the Company within its business lines. Under the guidance of the Risk Management Committee, enterprise risk management personnel establish policies and interact with business lines to monitor significant operating risks on a regular basis. In addition, enterprise risk management is responsible for establishing a culture of compliance and compliance program standards and policies, and performing risk assessments on the business lines’ adherence to laws, rules, regulations and internal policies and procedures.
The significant increase in regulation and regulatory oversight initiatives over the past three years has substantially increased the importance of the Company’s enterprise risk management personnel and activities. For example, the Consumer Financial Protection Bureau (“CFPB”) has authority to prescribe rules, or issue orders or guidelines pursuant to any federal consumer financial law. The CFPB regulates and examines the Company, its banks and other subsidiaries with respect to matters that relate to these laws and consumer financial services and products. The CFPB’s rulemaking, examination and enforcement authority increases enforcement risk in this area and has even resulted in fines and penalties against certain of the Company’s competitors. Refer to “Supervision and Regulation” in the Company’s Annual Report on Form 10-K for further discussion of the regulatory framework applicable to bank holding companies and their subsidiaries, and the substantial changes to that regulation.
Business lines have direct and primary responsibility and accountability for identifying, controlling, and monitoring operational risks embedded in their business activities. Business managers maintain a system of controls with the objective of providing proper transaction authorization and execution, proper system operations, safeguarding of assets from misuse or theft, and ensuring the reliability of financial and other data. Business managers ensure the controls are appropriate and are implemented as designed.
Each business line within the Company has designated risk managers. These risk managers are responsible for, among other things, coordinating the completion of ongoing risk assessments and ensuring that operational risk management is integrated into business decision-making activities. The Company’s internal audit function validates the system of internal controls through regular and ongoing risk-based audit procedures and reports on the effectiveness of internal controls to executive management and the Audit Committee of the Board of Directors. Management also provides various operational risk-related reporting to the Risk Management Committee of the Board of Directors.
Customer-related business conditions may also increase operational risk, or the level of operational losses in certain transaction processing business units, including merchant processing activities. Ongoing risk monitoring of customer activities and their financial condition and operational processes serve to mitigate customer-related operational risk. Refer to Note 21 of the Notes to Consolidated Financial Statements for further discussion on merchant processing. Business continuation and disaster recovery planning is also critical to effectively managing operational risks. Each business unit of the Company is required to develop, maintain and test these plans at least annually to ensure that recovery activities, if needed, can support mission critical functions, including technology, networks and data centers supporting customer applications and business operations.
While the Company believes it has designed effective methods to minimize operational risks, there is no absolute assurance that business disruption or operational losses would not occur in the event of a disaster. On an ongoing basis, management makes process changes and investments to enhance its systems of internal controls and business continuity and disaster recovery plans.
Recently, the Company and other large financial institutions were targets of various denial-of-service attacks on customer-facing websites and computer systems as part of what is believed to have been a coordinated effort to disrupt the operations of financial institutions. As a result of the Company’s controls, processes and systems to protect its networks, computers, software and data from attack, damage or unauthorized access, the Company has not experienced any material losses relating to these or other attempts to attack its systems. However, attack attempts on the Company’s computer systems are increasing and the Company continues to develop and enhance its controls and processes to protect against these attempts.
Interest Rate Risk Management In the banking industry, changes in interest rates are a significant risk that can impact
| 52 | U.S. BANCORP |
earnings, market valuations and safety and soundness of an entity. To minimize the volatility of net interest income and the market value of assets and liabilities, the Company manages its exposure to changes in interest rates through asset and liability management activities within guidelines established by its Asset Liability Committee (“ALCO”) and approved by the Board of Directors. The ALCO has the responsibility for approving and ensuring compliance with the ALCO management policies, including interest rate risk exposure. The Company uses net interest income simulation analysis and market value of equity modeling for measuring and analyzing consolidated interest rate risk.
Net Interest Income Simulation Analysis One of the primary tools used to measure interest rate risk and the effect of interest rate changes on net interest income is simulation analysis. The monthly analysis incorporates substantially all of the Company’s assets and liabilities and off-balance sheet instruments, together with forecasted changes in the balance sheet and assumptions that reflect the current interest rate environment. Through this simulation, management estimates the impact on net interest income of a 200 basis point (“bps”) upward or downward gradual change of market interest rates over a one-year period. The simulation also estimates the effect of immediate and sustained parallel shifts in the yield curve of 50 bps as well as the effect of immediate and sustained flattening or steepening of the yield curve. This simulation includes assumptions about how the balance sheet is likely to be affected by changes in loan and deposit growth. Assumptions are made to project interest rates for new loans and deposits based on historical analysis, management’s outlook and re-pricing strategies. These assumptions are validated on a periodic basis. A sensitivity analysis is provided for key variables of the simulation. The results are reviewed by the ALCO monthly and are used to guide asset/liability management strategies.
The table below summarizes the projected impact to net interest income over the next 12 months of various potential interest rate changes. The Company manages its interest rate risk position by holding assets on the balance sheet with desired interest rate risk characteristics, implementing certain pricing strategies for loans and deposits and through the selection of derivatives and various funding and investment portfolio strategies. The Company manages the overall interest rate risk profile within policy limits. The ALCO policy limits the estimated change in net interest income in a gradual 200 bps rate change scenario to a 4.0 percent decline of forecasted net interest income over the next 12 months. At December 31, 2012 and 2011, the Company was within policy.
Market Value of Equity Modeling The Company also manages interest rate sensitivity by utilizing market value of equity modeling, which measures the degree to which the market values of the Company’s assets and liabilities and off-balance sheet instruments will change given a change in interest rates. Management measures the impact of changes in market interest rates under a number of scenarios, including immediate and sustained parallel shifts, and flattening or steepening of the yield curve. The ALCO policy limits the change in the market value of equity in a 200 bps parallel rate shock to a 15.0 percent decline. A 200 bps increase would have resulted in a 2.5 percent decrease in the market value of equity at December 31, 2012, compared with a 2.0 percent decrease at December 31, 2011. A 200 bps decrease, where possible given current rates, would have resulted in a 5.3 percent decrease in the market value of equity at December 31, 2012, compared with a 6.4 percent decrease at December 31, 2011.
The valuation analysis is dependent upon certain key assumptions about the nature of assets and liabilities with non-contractual maturities. Management estimates the average life and rate characteristics of asset and liability accounts based upon historical analysis and management’s expectation of rate behavior. Mortgage prepayment assumptions are based on many key variables, including current and projected interest rates compared with underlying contractual rates, the time since origination and period to next reset date if floating rate loans, and other factors including housing price indices and geography, which are updated regularly based on historical experience and forward market expectations. The balance and pricing assumptions of deposits that have no stated maturity are based on historical performance, the competitive environment, customer
Sensitivity of Net Interest Income
| December 31, 2012 | December 31, 2011 | |||||||||||||||||||||||||||||||||
| Down 50 bps Immediate |
Up 50 bps Immediate |
Down 200 bps Gradual |
Up 200 bps Gradual |
Down 50 bps Immediate |
Up 50 bps Immediate |
Down 200 bps Gradual |
Up 200 bps Gradual |
|||||||||||||||||||||||||||
| Net interest income |
* | 1.42 | % | * | 1.90 | % | * | 1.57 | % | * | 1.92 | % | ||||||||||||||||||||||
| * | Given the current level of interest rates, a downward rate scenario can not be computed. |
| U.S. BANCORP | 53 |
behavior, and product mix. These assumptions are validated on a periodic basis. A sensitivity analysis of key variables of the valuation analysis is provided to the ALCO monthly and is used to guide asset/liability management strategies.
Use of Derivatives to Manage Interest Rate and Other Risks To reduce the sensitivity of earnings to interest rate, prepayment, credit, price and foreign currency fluctuations (asset and liability management positions), the Company enters into derivative transactions. The Company uses derivatives for asset and liability management purposes primarily in the following ways:
| • | To convert fixed-rate debt from fixed-rate payments to floating-rate payments; |
| • | To convert the cash flows associated with floating-rate loans and debt from floating-rate payments to fixed-rate payments; |
| • | To mitigate changes in value of the Company’s mortgage origination pipeline, funded mortgage loans held for sale and MSRs; |
| • | To mitigate remeasurement volatility of foreign currency denominated balances; and |
| • | To mitigate the volatility of the Company’s investment in foreign operations driven by fluctuations in foreign currency exchange rates. |
To manage these risks, the Company may enter into exchange-traded and over-the-counter derivative contracts, including interest rate swaps, swaptions, futures, forwards and options. In addition, the Company enters into interest rate and foreign exchange derivative contracts to support the business requirements of its customers (customer-related positions). The Company minimizes the market and liquidity risks of customer-related positions by entering into similar offsetting positions with broker-dealers. The Company does not utilize derivatives for speculative purposes.
The Company does not designate all of the derivatives that it enters into for risk management purposes as accounting hedges because of the inefficiency of applying the accounting requirements and may instead elect fair value accounting for the related hedged items. In particular, the Company enters into interest rate swaps, forward commitments to buy to-be-announced securities (“TBAs”), U.S. Treasury futures and options on U.S. Treasury futures to mitigate fluctuations in the value of its MSRs, but does not designate those derivatives as accounting hedges. The estimated net sensitivity to changes in interest rates of the fair value of the MSRs and the related derivative instruments at December 31, 2012, to an immediate 25, 50 and 100 bps downward movement in interest rates would be an increase of approximately $6 million, $32 million and $103 million, respectively. An upward movement in interest rates at December 31, 2012, of 25 and 50 bps would increase the fair value of the MSRs and related derivative instruments by approximately $5 million and $6 million, respectively, while a 100 bps increase would decrease the fair value of the MSRs and related derivative instruments by $6 million. Refer to Note 9 of the Notes to Consolidated Financial Statements for additional information regarding MSRs.
Additionally, the Company uses forward commitments to sell TBAs and other commitments to sell residential mortgage loans at specified prices to economically hedge the interest rate risk in its residential mortgage loan production activities. At December 31, 2012, the Company had $18.5 billion of forward commitments to sell, hedging $7.4 billion of mortgage loans held for sale and $15.1 billion of unfunded mortgage loan commitments. The forward commitments to sell and the unfunded mortgage loan commitments on loans intended to be sold are considered derivatives under the accounting guidance related to accounting for derivative instruments and hedging activities. The Company has elected the fair value option for the mortgage loans held for sale.
Derivatives are subject to credit risk associated with counterparties to the contracts. Credit risk associated with derivatives is measured by the Company based on the probability of counterparty default. The Company manages the credit risk of its derivative positions by diversifying its positions among various counterparties, by entering into master netting agreements, and, where possible by requiring collateral agreements. The Company may also transfer counterparty credit risk related to interest rate swaps to third parties through the use of risk participation agreements.
For additional information on derivatives and hedging activities, refer to Note 19 in the Notes to Consolidated Financial Statements.
Market Risk Management In addition to interest rate risk, the Company is exposed to other forms of market risk, principally related to trading activities which support customers’ strategies to manage their own foreign currency, interest rate risk and funding activities. The Company’s Market Risk Committee (“MRC”), underneath the ALCO, oversees market risk management. The MRC monitors and reviews the Company’s trading positions and establishes policies for market risk management, including exposure limits for each portfolio. The Company uses a Value at Risk (“VaR”) approach to measure general market risk. Theoretically, VaR represents the statistical risk of loss the Company has to adverse market movements over a one-day time horizon. The Company uses the Historical Simulation method to calculate VaR for its trading businesses measured at the ninety-ninth percentile using a one-year look-back period for distributions derived from past market data. The market factors used in the calculations include those pertinent to market risks inherent in
| 54 | U.S. BANCORP |
the underlying trading portfolios, principally those that affect its investment grade bond trading business, foreign currency transaction business, client derivatives business, loan trading business and municipal securities business. On average, the Company expects the one-day VaR to be exceeded two to three times per year in each business. The Company monitors the effectiveness of its risk programs by back-testing the performance of its VaR models, regularly updating the historical data used by the VaR models and stress testing. If the Company were to experience market losses in excess of the estimated VaR more often than expected, the VaR models and associated assumptions would be analyzed and adjusted. The Company stress tests its market risk measurements to provide management with perspectives on market events that may not be captured by its VaR models, including worst case historical market movement combinations that have not necessarily occurred on the same date.
The average, high and low VaR amounts for the Company’s trading positions for 2012, were $1 million, $3 million and $1 million, respectively, compared with $2 million, $4 million and $1 million, respectively, for 2011.
The Company also measures the market risk of its hedging activities related to MSRs and residential mortgage loans held for sale using the Historical Simulation method. The VaRs are measured at the ninety-ninth percentile and employ factors pertinent to the market risks inherent in the valuation of the assets and hedges. A three-year look-back period is used to obtain past market data. The Company monitors the effectiveness of the models through back-testing, updating the data and regular validations. The average, high and low VaR amounts for the MSRs and related hedges for 2012, were $4 million, $8 million and $2 million, respectively, compared with $7 million, $14 million and $2 million, respectively, for 2011. The average, high and low VaR amounts for residential mortgage loans held for sale and related hedges for 2012, were $2 million, $7 million and $1 million, respectively, compared with $4 million, $7 million and $2 million, respectively, for 2011.
Liquidity Risk Management The Company’s liquidity risk management process is designed to identify, measure, and manage the Company’s funding and liquidity risk to meet its daily funding needs and to address expected and unexpected changes in its funding requirements. The Company engages in various activities to manage its liquidity risk. These include diversifying its funding sources, stress testing, and holding readily-marketable assets which can be used as a source of liquidity if needed. In addition, the Company’s profitable operations, sound credit quality and strong capital position have enabled it to develop a large and reliable base of core deposit funding within its market areas and in domestic and global capital markets.
The Risk Management Committee of the Company’s Board of Directors oversees the Company’s liquidity risk management process and approves the Company’s liquidity policy and contingency funding plan. The ALCO reviews and approves the Company’s liquidity policies and guidelines, and regularly assesses the Company’s ability to meet funding requirements arising from adverse company-specific or market events.
The Company’s liquidity policies require it to maintain diversified wholesale funding sources to avoid maturity, name and market concentrations. The Company operates a Grand Cayman branch for issuing Eurodollar time deposits. In addition, the Company has relationships with dealers to issue national market retail and institutional savings certificates and short-term and medium-term notes. The Company also maintains a significant correspondent banking network and relationships. Accordingly, the Company has access to national federal funds, funding through repurchase agreements and sources of stable, regionally-based certificates of deposit and commercial paper.
The Company regularly projects its funding needs under various stress scenarios and maintains contingency plans consistent with the Company’s access to diversified sources of contingent funding. The Company maintains a substantial level of total available liquidity in the form of on-balance sheet and off-balance sheet funding sources. These include cash at the Federal Reserve, unencumbered liquid assets, and capacity to borrow at the FHLB and the Federal Reserve Discount Window. Unencumbered liquid assets in the Company’s available-for-sale and held-to-maturity investment portfolios provide asset liquidity through the Company’s ability to sell the securities or pledge and borrow against them. At December 31, 2012, the fair value of unencumbered available-for-sale and held-to-maturity investment securities totaled $54.1 billion, compared with $48.7 billion at December 31, 2011. Refer to Table 13 and “Balance Sheet Analysis” for further information on investment securities maturities and trends. Asset liquidity is further enhanced by the Company’s ability to pledge loans to access secured borrowing facilities through the FHLB and Federal Reserve Bank. At December 31, 2012, the Company could have borrowed an additional $60.9 billion at the FHLB and Federal Reserve Bank based on collateral available for additional borrowings.
The Company’s diversified deposit base provides a sizeable source of relatively stable and low-cost funding, while reducing the Company’s reliance on the wholesale markets. Total deposits were $249.2 billion at December 31, 2012, compared with $230.9 billion at December 31, 2011, reflecting organic growth in core deposits and acquired balances. Refer to Table 14 and “Balance Sheet Analysis” for further information on deposit trends.
| U.S. BANCORP | 55 |
| TABLE 20 | Debt Ratings |
| Moody’s | Standard & Poor’s |
Fitch | Dominion Bond Rating Service |
|||||||||||||
| U.S. Bancorp |
||||||||||||||||
| Short-term borrowings |
F1+ | R-1 (middle) | ||||||||||||||
| Senior debt and medium-term notes |
A1 | A+ | AA- | AA | ||||||||||||
| Subordinated debt |
A2 | A | A+ | AA (low) | ||||||||||||
| Preferred stock |
Baa1 | BBB+ | BBB | A | ||||||||||||
| Commercial paper |
P-1 | A-1 | F1+ | R-1 (middle) | ||||||||||||
| U.S. Bank National Association |
||||||||||||||||
| Short-term time deposits |
P-1 | A-1+ | F1+ | R-1 (high) | ||||||||||||
| Long-term time deposits |
Aa3 | AA- | AA | AA (high) | ||||||||||||
| Bank notes |
Aa3/P-1 | AA-/A-1+ | AA-/F1+ | AA (high) | ||||||||||||
| Subordinated debt |
A1 | A+ | A+ | AA | ||||||||||||
| Senior unsecured debt |
Aa3 | AA- | AA- | AA (high) | ||||||||||||
| Commercial paper |
P-1 | A-1+ | F1+ | R-1 (high) | ||||||||||||
Additional funding is provided by long-term debt and short-term borrowings. Long-term debt was $25.5 billion at December 31, 2012, and is an important funding source because of its multi-year borrowing structure. Refer to Note 12 of the Notes to Consolidated Financial Statements for information on the terms and maturities of the Company’s long-term debt issuances and “Balance Sheet Analysis” for discussion on long-term debt trends. Short-term borrowings were $26.3 billion at December 31, 2012, and supplement the Company’s other funding sources. Refer to Note 11 of the Notes to Consolidated Financial Statements and “Balance Sheet Analysis” for information on the terms and trends of the Company’s short-term borrowings.
The Company’s ability to raise negotiated funding at competitive prices is influenced by rating agencies’ views of the Company’s credit quality, liquidity, capital and earnings. Table 20 details the rating agencies’ most recent assessments.
In addition to assessing liquidity risk on a consolidated basis, the Company monitors the parent company’s liquidity. The parent company’s routine funding requirements consist primarily of operating expenses, dividends paid to shareholders, debt service, repurchases of common stock and funds used for acquisitions. The parent company obtains funding to meet its obligations from dividends collected from its subsidiaries and the issuance of debt securities. The Company maintains sufficient funding to meet expected parent company obligations, without access to the wholesale funding markets or dividends from subsidiaries, for 12 months when forecasted payments of common stock dividends are included and 24 months assuming dividends were reduced to zero. The parent company currently has available funds considerably greater than the amounts required to satisfy these conditions.
Under United States Securities and Exchange Commission rules, the parent company is classified as a “well-known seasoned issuer,” which allows it to file a registration statement that does not have a limit on issuance capacity. “Well-known seasoned issuers” generally include those companies with outstanding common securities with a market value of at least $700 million held by non-affiliated parties or those companies that have issued at least $1 billion in aggregate principal amount of non-convertible securities, other than common equity, in the last three years. However, the parent company’s ability to issue debt and other securities under a registration statement filed with the United States Securities and Exchange Commission under these rules is limited by the debt issuance authority granted by the Company’s Board of Directors and/or the ALCO policy.
At December 31, 2012, parent company long-term debt outstanding was $12.8 billion, compared with $14.6 billion at December 31, 2011. The $1.8 billion decrease was primarily due to $2.7 billion of medium-term note maturities and $2.7 billion of redemptions of junior subordinated debentures, partially offset by issuances of $1.3 billion of subordinated debt and $2.3 billion of medium–term notes. At December 31, 2012, there was $2.8 billion of parent company debt scheduled to mature in 2013. Future debt maturities may be met through medium-term note and capital security issuances and dividends from subsidiaries, as well as from parent company cash and cash equivalents.
Federal banking laws regulate the amount of dividends that may be paid by banking subsidiaries without prior approval. The amount of dividends available to the parent company from its banking subsidiaries after meeting the regulatory capital requirements for well-capitalized banks was approximately $7.9 billion at December 31, 2012. For further information, see Note 22 of the Notes to Consolidated Financial Statements.
European Exposures Certain European countries have experienced severe credit deterioration. The Company does not hold sovereign debt of any European country, but may
| 56 | U.S. BANCORP |
| TABLE 21 | Contractual Obligations |
| Payments Due By Period | ||||||||||||||||||||
| At December 31, 2012 (Dollars in Millions) | One Year or Less |
Over One Through Three Years |
Over Three Through Five Years |
Over Five Years |
Total | |||||||||||||||
| Contractual Obligations (a) |
||||||||||||||||||||
| Long-term debt (b) |
$ | 2,894 | $ | 7,217 | $ | 6,780 | $ | 8,625 | $ | 25,516 | ||||||||||
| Operating leases |
232 | 381 | 253 | 432 | 1,298 | |||||||||||||||
| Purchase obligations |
221 | 282 | 74 | — | 577 | |||||||||||||||
| Benefit obligations (c) |
23 | 42 | 43 | 122 | 230 | |||||||||||||||
| Time deposits |
29,393 | 10,077 | 3,305 | 8 | 42,783 | |||||||||||||||
| Contractual interest payments (d) |
1,300 | 1,220 | 724 | 1,291 | 4,535 | |||||||||||||||
| Total |
$ | 34,063 | $ | 19,219 | $ | 11,179 | $ | 10,478 | $ | 74,939 | ||||||||||
| (a) | Unrecognized tax positions of $302 million at December 31, 2012, are excluded as the Company cannot make a reasonably reliable estimate of the period of cash settlement with the respective taxing authority. |
| (b) | Includes obligations under capital leases. |
| (c) | Amounts only include obligations related to the unfunded non-qualified pension plans. |
| (d) | Includes accrued interest and future contractual interest obligations. |
have indirect exposure to sovereign debt through its investments in, and transactions with, European banks. At December 31, 2012, the Company had investments in perpetual preferred stock issued by European banks with an amortized cost totaling $70 million and unrealized losses totaling $10 million, compared with an amortized cost totaling $169 million and unrealized losses totaling $48 million, at December 31, 2011. The Company also transacts with various European banks as counterparties to interest rate swaps and foreign currency transactions for its hedging and customer-related activities, however none of these banks are domiciled in the countries experiencing the most significant credit deterioration. These derivative transactions are subject to master netting and collateral support agreements which significantly limit the Company’s exposure to loss as they generally require daily posting of collateral. At December 31, 2012, the Company was in a net payable position to each of these European banks.
The Company has not bought or sold credit protection on the debt of any European country or any company domiciled in Europe, nor does it provide retail lending services in Europe. While the Company does not offer commercial lending services in Europe, it does provide financing to domestic multinational corporations that generate revenue from customers in European countries and provides a limited number of corporate credit cards to their European subsidiaries. While an economic downturn in Europe could have a negative impact on these customers’ revenues, it is unlikely that any effect on the overall credit worthiness of these multinational corporations would be material to the Company.
The Company provides merchant processing and corporate trust services in Europe and through banking affiliations in Europe. Operating cash for these businesses are deposited on a short-term basis with certain European banks. However, exposure is mitigated by the Company placing deposits at multiple banks and managing the amounts on deposit at any bank based on institution-specific deposit limits. At December 31, 2012, the Company had an aggregate amount on deposit with European banks of approximately $358 million.
The money market funds managed by a subsidiary of the Company do not have any investments in European sovereign debt. Other than investments in banks in the countries of the Netherlands and Germany, those funds do not have any unsecured investments in banks domiciled in the Eurozone.
Off-Balance Sheet Arrangements Off-balance sheet arrangements include any contractual arrangement to which an unconsolidated entity is a party, under which the Company has an obligation to provide credit or liquidity enhancements or market risk support. Off-balance sheet arrangements also include any obligation under a variable interest held by an unconsolidated entity that provides financing, liquidity, credit enhancement or market risk support. The Company has not utilized private label asset securitizations as a source of funding.
Commitments to extend credit are legally binding and generally have fixed expiration dates or other termination clauses. Many of the Company’s commitments to extend credit expire without being drawn, and therefore, total commitment amounts do not necessarily represent future liquidity requirements or the Company’s exposure to credit loss. Commitments to extend credit also include consumer credit lines that are cancelable upon notification to the consumer. Total contractual amounts of commitments to extend credit at December 31, 2012 were $209.7 billion. The Company also issues various types of letters of credit, including standby and commercial. Total contractual amounts of letters of credit at December 31, 2012 were $18.8 billion. For more information on the Company’s commitments to
| U.S. BANCORP | 57 |
extend credit and letters of credit, refer to Note 21 in the Notes to Consolidated Financial Statements.
The Company’s off-balance sheet arrangements with unconsolidated entities primarily consist of private investment funds or partnerships that make equity investments, provide debt financing or support community-based tax-advantaged investments. In addition to providing investment returns, these arrangements in many cases assist the Company in complying with requirements of the Community Reinvestment Act. The investments in these entities generate a return primarily through the realization of federal and state income tax credits. The entities in which the Company invests are generally considered variable interest entities. The Company’s recorded investment in these entities as of December 31, 2012 was approximately $1.8 billion.
The Company also has non-controlling financial investments in private funds and partnerships considered variable interest entities. The Company’s recorded investment in these entities was approximately $72 million at December 31, 2012 and the Company had unfunded commitments to invest an additional $16 million. For more information on the Company’s interests in unconsolidated variable interest entities, refer to Note 7 in the Notes to Consolidated Financial Statements.
Guarantees are contingent commitments issued by the Company to customers or other third parties requiring the Company to perform if certain conditions exist or upon the occurrence or nonoccurrence of a specified event, such as a scheduled payment to be made under contract. The Company’s primary guarantees include commitments from securities lending activities in which indemnifications are provided to customers; indemnification or buy-back provisions related to sales of loans and tax credit investments; merchant charge-back guarantees through the Company’s involvement in providing merchant processing services; and minimum revenue guarantee arrangements. For certain guarantees, the Company may have access to collateral to support the guarantee, or through the exercise of other recourse provisions, be able to offset some or all of any payments made under these guarantees.
The Company and certain of its subsidiaries, along with other Visa U.S.A. Inc. member banks, have a contingent guarantee obligation to indemnify Visa Inc. for potential losses arising from antitrust lawsuits challenging the practices of Visa U.S.A. Inc., MasterCard International, the Company and several other Visa U.S.A. Inc. member banks. The indemnification by the Company and other Visa U.S.A. Inc. member banks has no maximum amount. Refer to Note 21 in the Notes to Consolidated Financial Statements for further details regarding guarantees, other commitments, and contingent liabilities, including maximum potential future payments and current carrying amounts.
Capital Management The Company is committed to managing capital to maintain strong protection for depositors and creditors and for maximum shareholder benefit. The Company continually assesses its business risks and capital position. The Company also manages its capital to exceed regulatory capital requirements for well-capitalized bank holding companies. These requirements follow the Capital Accord of the Basel Committee on Banking Supervision (“Basel I”). To achieve its capital goals, the Company employs a variety of capital management tools, including dividends, common share repurchases, and the issuance of subordinated debt, non-cumulative perpetual preferred stock, common stock and other capital instruments.
On March 13, 2012, the Company increased its dividend rate per common share by 56 percent, from $.125 per quarter to $.195 per quarter.
The Company repurchased approximately 59 million shares of its common stock in 2012, compared with approximately 22 million shares in 2011. The average price paid for the shares repurchased in 2012 was $31.78 per share, compared with $24.71 per share in 2011. As of December 31, 2012, the Company had approximately 54 million shares that may yet be purchased under the current Board of Directors approved authorization. For a more complete analysis of activities impacting shareholders’ equity and capital management programs, refer to Note 14 of the Notes to Consolidated Financial Statements.
Total U.S. Bancorp shareholders’ equity was $39.0 billion at December 31, 2012, compared with $34.0 billion at December 31, 2011. The increase was primarily the result of corporate earnings and the issuance of $2.2 billion of non-cumulative perpetual preferred stock to replace certain junior subordinated debentures, due to proposed rule changes for securities that qualify as Tier 1 capital, partially offset by dividends and common share repurchases.
Banking regulators define minimum capital requirements for banks and financial services holding companies. These requirements are expressed in the form of a minimum Tier 1 capital ratio, total risk-based capital ratio, and Tier 1 leverage ratio. The minimum required level for these ratios is 4.0 percent, 8.0 percent, and 4.0 percent, respectively. The Company targets its regulatory capital levels, at both the bank and bank holding company level, to exceed the “well-capitalized” threshold for these ratios of 6.0 percent, 10.0 percent, and 5.0 percent, respectively. The most recent notification from the Office of the Comptroller of the Currency categorized each of the Company’s banks as “well-capitalized”, under the FDIC Improvement Act prompt corrective action provisions that are applicable to all banks. There are no conditions or events since that notification that management believes have changed the risk-based category of any covered subsidiary banks.
| 58 | U.S. BANCORP |
As an approved mortgage seller and servicer, U.S. Bank National Association, through its mortgage banking division, is required to maintain various levels of shareholders’ equity, as specified by various agencies, including the United States Department of Housing and Urban Development, Government National Mortgage Association, Federal Home Loan Mortgage Corporation and the Federal National Mortgage Association. At December 31, 2012, U.S. Bank National Association met these requirements.
Table 22 provides a summary of regulatory capital ratios defined by banking regulators under the FDIC Improvement Act prompt corrective action provisions applicable to all banks, as of December 31, 2012 and 2011, including Tier 1 and total risk-based capital ratios. In 2010, the Basel Committee on Banking Supervision issued Basel III, a global regulatory framework, proposed to enhance international capital standards. In June 2012, U.S. banking regulators proposed regulatory enhancements to the regulatory capital requirements for U.S. banks, which implement aspects of Basel III and the Dodd-Frank Act, such as redefining the regulatory capital elements and minimum capital ratios, introducing regulatory capital buffers above those minimums, revising the rules for calculating risk-weighted assets and introducing a new Tier 1 common equity ratio. The Company continues to evaluate these proposals, but does not expect their impact to be material to the financial statements.
The Company believes certain capital ratios in addition to regulatory capital ratios defined by banking regulators under the FDIC Improvement Act prompt corrective action provisions are useful in evaluating its capital adequacy. The Company’s Tier 1 common equity (using Basel I definition) and tangible common equity, as a percent of risk-weighted assets, were 9.0 percent and 8.6 percent, respectively, at December 31, 2012, compared with 8.6 percent and 8.1 percent, respectively, at December 31, 2011. The Company’s tangible common equity divided by tangible assets was 7.2 percent at December 31, 2012, compared with 6.6 percent at December 31, 2011. Additionally, the Company’s approximate Tier 1 common equity to risk-weighted assets ratio using proposed rules for the Basel III standardized approach released June 2012, was 8.1 percent at December 31, 2012. Refer to “Non-GAAP Financial Measures” for further information regarding the calculation of these ratios.
Fourth Quarter Summary
The Company reported net income attributable to U.S. Bancorp of $1.4 billion for the fourth quarter of 2012, or $.72 per diluted common share, compared with $1.4 billion, or $.69 per diluted common share, for the fourth quarter of 2011. Return on average assets and return on average common equity were 1.62 percent and 15.6 percent, respectively, for the fourth quarter of 2012, compared with returns of 1.62 percent and 16.8 percent, respectively, for the fourth quarter of 2011. Included in the fourth quarter 2012 results were the $80 million expense accrual for a mortgage foreclosure-related regulatory settlement and a provision for credit losses less than net charge-offs by $25 million. Included in the fourth quarter 2011 results were the $263 million
| TABLE 22 | Regulatory Capital Ratios |
| At December 31 (Dollars in Millions) | 2012 | 2011 | ||||||
| U.S. Bancorp |
||||||||
| Tier 1 capital |
$ | 31,203 | $ | 29,173 | ||||
| As a percent of risk-weighted assets |
10.8 | % | 10.8 | % | ||||
| As a percent of adjusted quarterly average assets (leverage ratio) |
9.2 | % | 9.1 | % | ||||
| Total risk-based capital |
$ | 37,780 | $ | 36,067 | ||||
| As a percent of risk-weighted assets |
13.1 | % | 13.3 | % | ||||
| Bank Subsidiaries |
||||||||
| U.S. Bank National Association |
||||||||
| Tier 1 capital |
10.6 | % | 9.6 | % | ||||
| Total risk-based capital |
12.7 | 12.5 | ||||||
| Leverage |
9.0 | 8.1 | ||||||
| U.S. Bank National Association ND |
||||||||
| Tier 1 capital |
15.8 | % | 13.4 | % | ||||
| Total risk-based capital |
18.8 | 16.4 | ||||||
| Leverage |
14.7 | 12.9 | ||||||
| Bank Regulatory Capital Requirements | Minimum | Well- Capitalized |
||||||
| Tier 1 capital |
4.0 | % | 6.0 | % | ||||
| Total risk-based capital |
8.0 | 10.0 | ||||||
| Leverage |
4.0 | 5.0 | ||||||
| U.S. BANCORP | 59 |
| TABLE 23 | Fourth Quarter Results |
| Three Months Ended December 31, |
||||||||
| (Dollars and Shares in Millions, Except Per Share Data) | 2012 | 2011 | ||||||
| Condensed Income Statement |
||||||||
| Net interest income (taxable-equivalent basis) (a) |
$ | 2,783 | $ | 2,673 | ||||
| Noninterest income |
2,326 | 2,440 | ||||||
| Securities gains (losses), net |
3 | (9 | ) | |||||
| Total net revenue |
5,112 | 5,104 | ||||||
| Noninterest expense |
2,686 | 2,696 | ||||||
| Provision for credit losses |
443 | 497 | ||||||
| Income before taxes |
1,983 | 1,911 | ||||||
| Taxable-equivalent adjustment |
56 | 56 | ||||||
| Applicable income taxes |
552 | 527 | ||||||
| Net income |
1,375 | 1,328 | ||||||
| Net (income) loss attributable to noncontrolling interests |
45 | 22 | ||||||
| Net income attributable to U.S. Bancorp |
$ | 1,420 | $ | 1,350 | ||||
| Net income applicable to U.S. Bancorp common shareholders |
$ | 1,349 | $ | 1,314 | ||||
| Per Common Share |
||||||||
| Earnings per share |
$ | .72 | $ | .69 | ||||
| Diluted earnings per share |
$ | .72 | $ | .69 | ||||
| Dividends declared per share |
$ | .195 | $ | .125 | ||||
| Average common shares outstanding |
1,872 | 1,904 | ||||||
| Average diluted common shares outstanding |
1,880 | 1,911 | ||||||
| Financial Ratios |
||||||||
| Return on average assets |
1.62 | % | 1.62 | % | ||||
| Return on average common equity |
15.6 | 16.8 | ||||||
| Net interest margin (taxable-equivalent basis) (a) |
3.55 | 3.60 | ||||||
| Efficiency ratio |
52.6 | 52.7 | ||||||
| (a) | Interest and rates are presented on a fully taxable-equivalent basis utilizing a tax rate of 35 percent. |
merchant settlement gain, the $130 million expense accrual related to mortgage servicing matters and a provision for credit losses less than net charge-offs by $125 million.
Total net revenue, on a taxable-equivalent basis for the fourth quarter of 2012, was $8 million (.2 percent) higher than the fourth quarter of 2011, reflecting a 4.1 percent increase in net interest income, largely offset by a 4.2 percent decrease in noninterest income. The increase in net interest income from 2011 was the result of higher average earning assets, continued growth in lower cost core deposit funding and the positive impact from long-term debt repricing. Noninterest income decreased from a year ago, primarily due to the $263 million merchant settlement gain recorded in the fourth quarter of 2011, partially offset by higher mortgage banking revenue.
Noninterest expense in the fourth quarter of 2012 was $2.7 billion, or $10 million (.4 percent) lower than the fourth quarter of 2011. The decrease reflected the accrual for mortgage servicing matters recorded in the fourth quarter of 2011, partially offset by the fourth quarter of 2012 mortgage foreclosure-related regulatory settlement accrual, as well as higher mortgage servicing review-related professional services costs.
Fourth quarter 2012 net interest income, on a taxable-equivalent basis, was $2.8 billion, compared with $2.7 billion in the fourth quarter of 2011. The $110 million (4.1 percent) increase was principally the result of growth in average earning assets and lower cost core deposit funding, as well as the positive impact from long-term debt repricing. Average earning assets for the fourth quarter of 2012 increased over the fourth quarter of 2011 by $17.1 billion (5.8 percent), driven by increases of $13.2 billion (6.4 percent) in loans and $4.1 billion (5.9 percent) in investment securities. The net interest margin in the fourth quarter of 2012 was 3.55 percent, compared with 3.60 percent in the fourth quarter of 2011, reflecting higher average balances in lower-yielding investment securities and lower loan rates, partially offset by lower rates on deposits and long-term debt and a reduction in cash balances held at the Federal Reserve.
Noninterest income in the fourth quarter of 2012 was $2.3 billion, compared with $2.4 billion in the same period of 2011, a decrease of $102 million (4.2 percent). The decrease was principally driven by a decline in other income due to the merchant settlement gain and a gain related to the Company’s investment in Visa Inc., both recorded in the fourth quarter of 2011. In addition, merchant processing services revenue was
| 60 | U.S. BANCORP |
$24 million (6.3 percent) lower due to lower rates and the reversal in the fourth quarter of 2011 of an accrual for a terminated revenue sharing agreement, partially offset by higher volumes. ATM processing services revenue decreased $28 million (25.2 percent), due to excluding surcharge fees the Company passes through to others from revenue beginning in the first quarter of 2012, rather than reporting those amounts in occupancy expense as in previous periods. Offsetting these negative variances was an $11 million (4.8 percent) increase in credit and debit card revenue, principally driven by higher volumes, partially offset by the impact of the inclusion of credit card balance transfer fees in interest income beginning in the first quarter of 2012. Corporate payment products revenue was $7 million (4.1 percent) higher due to an increase in volume and higher rates. Trust and investment management fees increased $31 million (12.7 percent) due to improved market conditions and business expansion. Commercial products revenue was $6 million (2.7 percent) higher, principally driven by an increase in high-grade bond underwriting fees and commercial leasing revenue, partially offset by lower syndication fees. Mortgage banking revenue increased $173 million (57.1 percent) over the fourth quarter of 2011 principally due to higher origination and sales revenue, as well as an increase in loan servicing revenue. Investment products fees and commissions increased $8 million (25.8 percent) due to higher sales volumes. In addition, there was a $12 million favorable change in net securities gains (losses).
Noninterest expense in the fourth quarter of 2012 was $2.7 billion, or $10 million (.4 percent) lower than the fourth quarter of 2011. The decrease was primarily due to a reduction in other expense, partially offset by higher compensation expense, employee benefits expense and professional services expense. Other expense decreased $88 million (14.7 percent) as the $130 million mortgage servicing-related expense accrual recorded in the fourth quarter of 2011, lower FDIC insurance expense and lower other real estate owned costs, were partially offset by the $80 million fourth quarter of 2012 accrual for a mortgage foreclosure-related regulatory settlement. Net occupancy and equipment expense decreased $15 million (6.0 percent), principally reflecting the change in presentation of ATM surcharge revenue passed through to others. In addition, marketing and business development expense was $9 million (8.0 percent) lower than the prior year, reflecting the timing of charitable contributions, and other intangibles expense was $8 million (10.8 percent) lower due to the reduction or completion of amortization of certain intangibles. These reductions were partially offset by increased compensation and employee benefits expenses of $26 million (2.5 percent) and $29 million (14.4 percent), respectively. Compensation expense increased primarily as a result of growth in staffing for business initiatives and mortgage servicing-related activities, in addition to higher commissions and merit increases. Employee benefits expense increased principally due to higher pension and medical insurance costs and staffing levels. Professional services expense was $35 million (26.7 percent) higher due to mortgage servicing review-related projects. Technology and communications expense was $19 million (9.7 percent) higher due to business expansion and technology projects.
The provision for credit losses for the fourth quarter of 2012 was $443 million, a decrease of $54 million (10.9 percent) from the same period of 2011. Net charge-offs decreased $154 million (24.8 percent) in the fourth quarter of 2012, compared with the fourth quarter of 2011, principally due to improvement in the commercial, commercial real estate and credit card portfolios. The provision for credit losses was lower than net charge-offs by $25 million in the fourth quarter of 2012, compared with $125 million in the fourth quarter of 2011. Given the current economic conditions, the Company expects the level of net charge-offs to be relatively stable to down modestly in the first quarter of 2013. The Company expects total nonperforming assets to trend lower in the first quarter of 2013.
The provision for income taxes for the fourth quarter of 2012 resulted in an effective tax rate of 28.6 percent, compared with an effective tax rate of 28.4 percent in the fourth quarter of 2011. The increase in the effective rate for the fourth quarter of 2012, compared with the same period of the prior year, principally reflected the marginal impact of higher pretax earnings year-over-year.
Line of Business Financial Review
The Company’s major lines of business are Wholesale Banking and Commercial Real Estate, Consumer and Small Business Banking, Wealth Management and Securities Services, Payment Services, and Treasury and Corporate Support. These operating segments are components of the Company about which financial information is prepared and is evaluated regularly by management in deciding how to allocate resources and assess performance.
Basis for Financial Presentation Business line results are derived from the Company’s business unit profitability reporting systems by specifically attributing managed balance sheet assets, deposits and other liabilities and their related income or expense. Goodwill and other intangible assets are assigned to the lines of business based on the mix of business of the acquired entity. Within the Company, capital levels are evaluated and managed centrally; however, capital is allocated to the operating segments to support evaluation of business performance. Business lines are allocated capital on a risk-adjusted basis considering economic and regulatory capital requirements. Generally, the determination of the amount of
| U.S. BANCORP | 61 |
| TABLE 24 | Line of Business Financial Performance |
| Wholesale Banking and Commercial Real Estate |
Consumer and Small Business Banking |
|||||||||||||||||||||||||||||
| Year Ended December 31 (Dollars in Millions) |
2012 | 2011 | Percent Change |
2012 | 2011 | Percent Change |
||||||||||||||||||||||||
| Condensed Income Statement |
||||||||||||||||||||||||||||||
| Net interest income (taxable-equivalent basis) |
$ | 2,099 | $ | 2,123 | (1.1 | )% | $ | 4,731 | $ | 4,599 | 2.9 | % | ||||||||||||||||||
| Noninterest income |
1,224 | 1,222 | .2 | 3,567 | 2,745 | 29.9 | ||||||||||||||||||||||||
| Securities gains (losses), net |
– | – | – | – | – | – | ||||||||||||||||||||||||
| Total net revenue |
3,323 | 3,345 | (.7 | ) | 8,298 | 7,344 | 13.0 | |||||||||||||||||||||||
| Noninterest expense |
1,266 | 1,254 | 1.0 | 4,986 | 4,651 | 7.2 | ||||||||||||||||||||||||
| Other intangibles |
16 | 16 | – | 52 | 75 | (30.7 | ) | |||||||||||||||||||||||
| Total noninterest expense |
1,282 | 1,270 | .9 | 5,038 | 4,726 | 6.6 | ||||||||||||||||||||||||
| Income before provision and income taxes |
2,041 | 2,075 | (1.6 | ) | 3,260 | 2,618 | 24.5 | |||||||||||||||||||||||
| Provision for credit losses |
1 | 424 | (99.8 | ) | 1,160 | 1,391 | (16.6 | ) | ||||||||||||||||||||||
| Income before income taxes |
2,040 | 1,651 | 23.6 | 2,100 | 1,227 | 71.1 | ||||||||||||||||||||||||
| Income taxes and taxable-equivalent adjustment |
743 | 600 | 23.8 | 765 | 446 | 71.5 | ||||||||||||||||||||||||
| Net income |
1,297 | 1,051 | 23.4 | 1,335 | 781 | 70.9 | ||||||||||||||||||||||||
| Net (income) loss attributable to noncontrolling interests |
– | 4 | * | (1 | ) | (1 | ) | – | ||||||||||||||||||||||
| Net income attributable to U.S. Bancorp |
$ | 1,297 | $ | 1,055 | 22.9 | $ | 1,334 | $ | 780 | 71.0 | ||||||||||||||||||||
| Average Balance Sheet |
||||||||||||||||||||||||||||||
| Commercial |
$ | 45,171 | $ | 37,396 | 20.8 | % | $ | 8,218 | $ | 7,391 | 11.2 | % | ||||||||||||||||||
| Commercial real estate |
19,658 | 19,293 | 1.9 | 16,135 | 15,539 | 3.8 | ||||||||||||||||||||||||
| Residential mortgages |
59 | 67 | (11.9 | ) | 39,826 | 33,248 | 19.8 | |||||||||||||||||||||||
| Credit card |
– | – | – | – | – | – | ||||||||||||||||||||||||
| Other retail |
7 | 5 | 40.0 | 45,596 | 45,760 | (.4 | ) | |||||||||||||||||||||||
| Total loans, excluding covered loans |
64,895 | 56,761 | 14.3 | 109,775 | 101,938 | 7.7 | ||||||||||||||||||||||||
| Covered loans |
914 | 1,493 | (38.8 | ) | 7,523 | 8,405 | (10.5 | ) | ||||||||||||||||||||||
| Total loans |
65,809 | 58,254 | 13.0 | 117,298 | 110,343 | 6.3 | ||||||||||||||||||||||||
| Goodwill |
1,604 | 1,604 | – | 3,516 | 3,520 | (.1 | ) | |||||||||||||||||||||||
| Other intangible assets |
36 | 52 | (30.8 | ) | 1,787 | 2,043 | (12.5 | ) | ||||||||||||||||||||||
| Assets |
71,698 | 64,088 | 11.9 | 134,372 | 124,399 | 8.0 | ||||||||||||||||||||||||
| Noninterest-bearing deposits |
31,102 | 25,183 | 23.5 | 20,510 | 17,941 | 14.3 | ||||||||||||||||||||||||
| Interest checking |
10,343 | 12,687 | (18.5 | ) | 29,947 | 26,620 | 12.5 | |||||||||||||||||||||||
| Savings products |
9,362 | 9,371 | (.1 | ) | 43,431 | 40,555 | 7.1 | |||||||||||||||||||||||
| Time deposits |
17,161 | 14,523 | 18.2 | 23,838 | 24,446 | (2.5 | ) | |||||||||||||||||||||||
| Total deposits |
67,968 | 61,764 | 10.0 | 117,726 | 109,562 | 7.5 | ||||||||||||||||||||||||
| Total U.S. Bancorp shareholders’ equity |
6,440 | 5,582 | 15.4 | 11,279 | 9,433 | 19.6 | ||||||||||||||||||||||||
| * | Not meaningful |
capital allocated to each business line includes credit and operational capital allocations following a Basel II regulatory framework. Interest income and expense is determined based on the assets and liabilities managed by the business line. Because funding and asset liability management is a central function, funds transfer-pricing methodologies are utilized to allocate a cost of funds used or credit for funds provided to all business line assets and liabilities, respectively, using a matched funding concept. Also, each business unit is allocated the taxable-equivalent benefit of tax-exempt products. The residual effect on net interest income of asset/liability management activities is included in Treasury and Corporate Support. Noninterest income and expenses directly managed by each business line, including fees, service charges, salaries and benefits, and other direct revenues and costs are accounted for within each segment’s financial results in a manner similar to the consolidated financial statements. Occupancy costs are allocated based on utilization of facilities by the lines of business. Generally, operating losses are charged to the line of business when the loss event is realized in a manner similar to a loan charge-off. Noninterest expenses incurred by centrally managed operations or business lines that directly support another business line’s operations are charged to the applicable business line based on its utilization of those services, primarily measured by the volume of customer activities, number of employees or other relevant factors. These allocated expenses are reported as net shared services expense within noninterest expense. Certain activities that do not directly support the operations of the lines of business or for which the lines of business are not considered
| 62 | U.S. BANCORP |
| Wealth Management and Securities Services |
Payment Services |
Treasury and Corporate Support |
Consolidated Company |
|||||||||||||||||||||||||||||||||||||||||||||||||||
| 2012 | 2011 | Percent Change |
2012 | 2011 | Percent Change |
2012 | 2011 | Percent Change |
2012 | 2011 | Percent Change |
|||||||||||||||||||||||||||||||||||||||||||
| $ | 354 | $ | 355 | (.3 | )% | $ | 1,548 | $ | 1,354 | 14.3 | % | $ | 2,237 | $ | 1,917 | 16.7 | % | $ | 10,969 | $ | 10,348 | 6.0 | % | |||||||||||||||||||||||||||||||
| 1,122 | 1,052 | 6.7 | 3,192 | 3,242 | (1.5 | ) | 229 | 530 | (56.8 | ) | 9,334 | 8,791 | 6.2 | |||||||||||||||||||||||||||||||||||||||||
| – | – | – | – | – | – | (15 | ) | (31 | ) | 51.6 | (15 | ) | (31 | ) | 51.6 | |||||||||||||||||||||||||||||||||||||||
| 1,476 | 1,407 | 4.9 | 4,740 | 4,596 | 3.1 | 2,451 | 2,416 | 1.4 | 20,288 | 19,108 | 6.2 | |||||||||||||||||||||||||||||||||||||||||||
| 1,152 | 1,082 | 6.5 | 1,836 | 1,776 | 3.4 | 942 | 849 | 11.0 | 10,182 | 9,612 | 5.9 | |||||||||||||||||||||||||||||||||||||||||||
| 40 | 36 | 11.1 | 166 | 172 | (3.5 | ) | – | – | – | 274 | 299 | (8.4 | ) | |||||||||||||||||||||||||||||||||||||||||
| 1,192 | 1,118 | 6.6 | 2,002 | 1,948 | 2.8 | 942 | 849 | 11.0 | 10,456 | 9,911 | 5.5 | |||||||||||||||||||||||||||||||||||||||||||
| 284 | 289 | (1.7 | ) | 2,738 | 2,648 | 3.4 | 1,509 | 1,567 | (3.7 | ) | 9,832 | 9,197 | 6.9 | |||||||||||||||||||||||||||||||||||||||||
| 15 | 7 | * | 695 | 508 | 36.8 | 11 | 13 | (15.4 | ) | 1,882 | 2,343 | (19.7 | ) | |||||||||||||||||||||||||||||||||||||||||
| 269 | 282 | (4.6 | ) | 2,043 | 2,140 | (4.5 | ) | 1,498 | 1,554 | (3.6 | ) | 7,950 | 6,854 | 16.0 | ||||||||||||||||||||||||||||||||||||||||
| 98 | 102 | (3.9 | ) | 744 | 779 | (4.5 | ) | 110 | 139 | (20.9 | ) | 2,460 | 2,066 | 19.1 | ||||||||||||||||||||||||||||||||||||||||
| 171 | 180 | (5.0 | ) | 1,299 | 1,361 | (4.6 | ) | 1,388 | 1,415 | (1.9 | ) | 5,490 | 4,788 | 14.7 | ||||||||||||||||||||||||||||||||||||||||
| – | – | – | (38 | ) | (40 | ) | 5.0 | 196 | 121 | 62.0 | 157 | 84 | 86.9 | |||||||||||||||||||||||||||||||||||||||||
| $ | 171 | $ | 180 | (5.0 | ) | $ | 1,261 | $ | 1,321 | (4.5 | ) | $ | 1,584 | $ | 1,536 | 3.1 | $ | 5,647 | $ | 4,872 | 15.9 | |||||||||||||||||||||||||||||||||
| $ | 1,347 | $ | 1,068 | 26.1 | % | $ | 5,962 | $ | 5,640 | 5.7 | % | $ | 132 | $ | 121 | 9.1 | % | $ | 60,830 | $ | 51,616 | 17.9 | % | |||||||||||||||||||||||||||||||
| 587 | 576 | 1.9 | – | – | – | 125 | 106 | 17.9 | 36,505 | 35,514 | 2.8 | |||||||||||||||||||||||||||||||||||||||||||
| 399 | 386 | 3.4 | – | – | – | 6 | 10 | (40.0 | ) | 40,290 | 33,711 | 19.5 | ||||||||||||||||||||||||||||||||||||||||||
| – | – | – | 16,653 | 16,084 | 3.5 | – | – | – | 16,653 | 16,084 | 3.5 | |||||||||||||||||||||||||||||||||||||||||||
| 1,524 | 1,535 | (.7 | ) | 810 | 898 | (9.8 | ) | 1 | 1 | – | 47,938 | 48,199 | (.5 | ) | ||||||||||||||||||||||||||||||||||||||||
| 3,857 | 3,565 | 8.2 | 23,425 | 22,622 | 3.5 | 264 | 238 | 10.9 | 202,216 | 185,124 | 9.2 | |||||||||||||||||||||||||||||||||||||||||||
| 11 | 12 | (8.3 | ) | 5 | 5 | – | 4,705 | 6,388 | (26.3 | ) | 13,158 | 16,303 | (19.3 | ) | ||||||||||||||||||||||||||||||||||||||||
| 3,868 | 3,577 | 8.1 | 23,430 | 22,627 | 3.5 | 4,969 | 6,626 | (25.0 | ) | 215,374 | 201,427 | 6.9 | ||||||||||||||||||||||||||||||||||||||||||
| 1,473 | 1,463 | .7 | 2,360 | 2,362 | (.1 | ) | – | – | – | 8,953 | 8,949 | – | ||||||||||||||||||||||||||||||||||||||||||
| 171 | 184 | (7.1 | ) | 690 | 791 | (12.8 | ) | 4 | 5 | (20.0 | ) | 2,688 | 3,075 | (12.6 | ) | |||||||||||||||||||||||||||||||||||||||
| 6,528 | 6,008 | 8.7 | 29,576 | 27,936 | 5.9 | 100,675 | 95,833 | 5.1 | 342,849 | 318,264 | 7.7 | |||||||||||||||||||||||||||||||||||||||||||
| 14,511 | 9,688 | 49.8 | 643 | 673 | (4.5 | ) | 475 | 371 | 28.0 | 67,241 | 53,856 | 24.9 | ||||||||||||||||||||||||||||||||||||||||||
| 3,950 | 3,199 | 23.5 | 1,192 | 320 | * | 1 | 1 | – | 45,433 | 42,827 | 6.1 | |||||||||||||||||||||||||||||||||||||||||||
| 23,505 | 21,637 | 8.6 | 39 | 30 | 30.0 | 133 | 180 | (26.1 | ) | 76,470 | 71,773 | 6.5 | ||||||||||||||||||||||||||||||||||||||||||
| 5,090 | 5,548 | (8.3 | ) | – | – | – | 477 | 186 | * | 46,566 | 44,703 | 4.2 | ||||||||||||||||||||||||||||||||||||||||||
| 47,056 | 40,072 | 17.4 | 1,874 | 1,023 | 83.2 | 1,086 | 738 | 47.2 | 235,710 | 213,159 | 10.6 | |||||||||||||||||||||||||||||||||||||||||||
| 2,232 | 2,081 | 7.3 | 5,686 | 5,280 | 7.7 | 11,974 | 9,824 | 21.9 | 37,611 | 32,200 | 16.8 | |||||||||||||||||||||||||||||||||||||||||||
financially accountable in evaluating their performance are not charged to the lines of business. The income or expenses associated with these corporate activities is reported within the Treasury and Corporate Support line of business. Income taxes are assessed to each line of business at a standard tax rate with the residual tax expense or benefit to arrive at the consolidated effective tax rate included in Treasury and Corporate Support.
Designations, assignments and allocations change from time to time as management systems are enhanced, methods of evaluating performance or product lines change or business segments are realigned to better respond to the Company’s diverse customer base. During 2012, certain organization and methodology changes were made and, accordingly, 2011 results were restated and presented on a comparable basis.
Wholesale Banking and Commercial Real Estate Wholesale Banking and Commercial Real Estate offers lending, equipment finance and small-ticket leasing, depository services, treasury management, capital markets, international trade services and other financial services to middle market, large corporate, commercial real estate, financial institution and public sector clients. Wholesale Banking and Commercial Real Estate contributed $1.3 billion of the Company’s net income in 2012, or an increase of $242 million (22.9 percent) compared with 2011. The increase was primarily driven by lower provision for credit losses, partially offset by lower total net revenue and higher noninterest expense.
Total net revenue decreased $22 million (.7 percent) in 2012, compared with 2011. Net interest income, on a taxable-equivalent basis, decreased $24 million (1.1 percent) in 2012,
| U.S. BANCORP | 63 |
compared with 2011, driven by the net impact of lower rates on loans and the impact of lower rates on the margin benefit from deposits, partially offset by higher average loan and deposit balances. Noninterest income was essentially flat in 2012, compared with 2011.
Noninterest expense increased $12 million (.9 percent) in 2012, compared with 2011, primarily due to higher compensation and employee benefits expense, partially offset by lower costs related to other real estate owned. The provision for credit losses decreased $423 million (99.8 percent) in 2012, compared with 2011. The favorable change was primarily due to lower net charge-offs and a reduction in the reserve allocation. Nonperforming assets were $520 million at December 31, 2012, compared with $979 million at December 31, 2011. Nonperforming assets as a percentage of period-end loans were .75 percent at December 31, 2012, compared with 1.58 percent at December 31, 2011. Refer to the “Corporate Risk Profile” section for further information on factors impacting the credit quality of the loan portfolios.
Consumer and Small Business Banking Consumer and Small Business Banking delivers products and services through banking offices, telephone servicing and sales, on-line services, direct mail, ATM processing and over mobile devices, such as mobile phones and tablet computers. It encompasses community banking, metropolitan banking, in-store banking, small business banking, consumer lending, mortgage banking, workplace banking, student banking and 24-hour banking. Consumer and Small Business Banking contributed $1.3 billion of the Company’s net income in 2012, or an increase of $554 million (71.0 percent), compared with 2011. The increase was due to higher total net revenue and lower provision for credit losses, partially offset by an increase in noninterest expense. Within Consumer and Small Business Banking, the retail banking division contributed $471 million of the total net income in 2012, or an increase of $104 million (28.3 percent) over the prior year. Mortgage banking contributed $863 million of the business line’s net income in 2012, or an increase of $450 million over the prior year.
Total net revenue increased $954 million (13.0 percent) in 2012, compared with 2011. Net interest income, on a taxable-equivalent basis, increased $132 million (2.9 percent) in 2012, compared with 2011. The year-over-year increase in net interest income was primarily due to higher average loan and deposit balances, partially offset by lower loan rates and the impact of lower rates on the margin benefit from deposits. Noninterest income increased $822 million (29.9 percent) in 2012, compared with 2011, primarily the result of strong mortgage origination and sales revenue, as well as an increase in loan servicing revenue, partially offset by a decrease in ATM processing services revenue as a result of the change in presentation of the surcharge revenue passed through to others.
Noninterest expense increased $312 million (6.6 percent) in 2012, compared with 2011. The increase reflected the foreclosure-related regulatory settlement accrual and higher mortgage servicing review-related costs, higher compensation and employee benefits expense, and higher net shared services costs, partially offset by lower net occupancy and equipment expense due to the presentation change to ATM surcharge revenue passed through to others and lower FDIC assessments and other intangibles expense.
The provision for credit losses decreased $231 million (16.6 percent) in 2012, compared with 2011, due to lower net charge-offs and a reduction in the reserve allocation. As a percentage of average loans outstanding, net charge-offs decreased to .92 percent in 2012, compared with 1.19 percent in 2011. Nonperforming assets were $1.4 billion at December 31, 2012, unchanged from December 31, 2011. Nonperforming assets as a percentage of period-end loans were 1.16 percent at December 31, 2012, compared with 1.21 percent at December 31, 2011. Refer to the “Corporate Risk Profile” section for further information on factors impacting the credit quality of the loan portfolios.
Wealth Management and Securities Services Wealth Management and Securities Services provides private banking, financial advisory services, investment management, retail brokerage services, insurance, trust, custody and fund servicing through five businesses: Wealth Management, Corporate Trust Services, U.S. Bancorp Asset Management, Institutional Trust & Custody and Fund Services. Wealth Management and Securities Services contributed $171 million of the Company’s net income in 2012, a decrease of $9 million (5.0 percent), compared with 2011. The decrease from the prior year was primarily due to higher noninterest expense, partially offset by higher noninterest income.
Total net revenue increased $69 million (4.9 percent) in 2012, compared with 2011. Noninterest income increased $70 million (6.7 percent) in 2012, compared with 2011, primarily due to the impact of improved market conditions, business expansion and an increase in investment product fees and commissions.
Noninterest expense increased $74 million (6.6 percent) in 2012, compared with 2011. The increase in noninterest expense was primarily due to higher compensation and employee benefits expense and an increase in net shared services costs.
Payment Services Payment Services includes consumer and business credit cards, stored-value cards, debit cards, corporate and purchasing card services, consumer lines of credit and merchant processing. Payment Services contributed $1.3 billion of the Company’s net income in 2012, or a
| 64 | U.S. BANCORP |
decrease of $60 million (4.5 percent) compared with 2011. The decrease was primarily due to an increase in the provision for credit losses and higher noninterest expense, partially offset by an increase in total net revenue.
Total net revenue increased $144 million (3.1 percent) in 2012, compared with 2011. Net interest income, on a taxable-equivalent basis, increased $194 million (14.3 percent) in 2012, compared with 2011, primarily due to higher average loan balances and loan yields, including the credit card balance transfer fees presentation change. Noninterest income decreased $50 million (1.5 percent) in 2012, compared with 2011. Credit and debit card revenue decreased due to lower debit card interchange fees as a result of 2011 legislation, net of mitigation efforts, and the impact of the inclusion of credit card balance transfer fees in interest income beginning in the first quarter or 2012. These negative variances were partially offset by higher transaction volumes. The decrease in credit and debit card revenue was partially offset by higher merchant processing services revenue, primarily due to increased transaction volumes, and higher other revenue due to the impact of the gain on the credit card portfolio sale during 2012.
Noninterest expense increased $54 million (2.8 percent) in 2012, compared with 2011, due to higher compensation, professional services, outside data processing and net shared services expense. The provision for credit losses increased $187 million (36.8 percent) in 2012, compared with 2011, due to changes in the reserve allocation, partially offset by lower net charge-offs. In addition, the 2012 provision for credit losses reflected lower reserve releases than in 2011. As a percentage of average loans outstanding, net charge-offs were 3.44 percent in 2012, compared with 4.47 percent in 2011.
Treasury and Corporate Support Treasury and Corporate Support includes the Company’s investment portfolios, most covered commercial and commercial real estate loans and related other real estate owned, funding, capital management, interest rate risk management, the net effect of transfer pricing related to average balances and the residual aggregate of those expenses associated with corporate activities that are managed on a consolidated basis. Treasury and Corporate Support recorded net income of $1.6 billion in 2012, compared with $1.5 billion in 2011.
Total net revenue increased $35 million (1.4 percent) in 2012, compared with 2011. Net interest income, on a taxable-equivalent basis, increased $320 million (16.7 percent) in 2012, compared with 2011, reflecting lower long-term funding rates, partially offset by lower rates on the investment securities portfolio. Noninterest income decreased $285 million (57.1 percent) in 2012, compared with 2011, primarily due to the 2011 merchant settlement gain, gain on the FCB acquisition and gains related to the Company’s investment in Visa Inc., partially offset by higher commercial products revenue.
Noninterest expense increased $93 million (11.0 percent) in 2012, compared with 2011, primarily due to litigation and insurance-related matters, and increased compensation and employee benefits expense, partially offset by the accrual for mortgage servicing-related matters recorded in 2011.
Income taxes are assessed to each line of business at a managerial tax rate of 36.4 percent with the residual tax expense or benefit to arrive at the consolidated effective tax rate included in Treasury and Corporate Support.
Non-GAAP Financial Measures
In addition to capital ratios defined by banking regulators under the FDIC Improvement Act prompt corrective action provisions applicable to all banks, the Company considers various other measures when evaluating capital utilization and adequacy, including:
| • | Tangible common equity to tangible assets, |
| • | Tangible common equity to risk-weighted assets using Basel I definition, |
| • | Tier 1 common equity to risk-weighted assets using Basel I definition, |
| • | Tier 1 common equity to risk-weighted assets using Basel III proposals published prior to June 2012, and |
| • | Tier 1 common equity to risk-weighted assets approximated using proposed rules for the Basel III standardized approach released June 2012. |
These measures are viewed by management as useful additional methods of reflecting the level of capital available to withstand unexpected market or economic conditions. Additionally, presentation of these measures allows investors, analysts and banking regulators to assess the Company’s capital position relative to other financial services companies. These measures differ from capital ratios defined by current banking regulations principally in that the numerator excludes trust preferred securities and preferred stock, the nature and extent of which varies among different financial services companies. These measures are not defined in generally accepted accounting principles (“GAAP”) or federal banking regulations. As a result, these measures disclosed by the Company may be considered non-GAAP financial measures.
There may be limits in the usefulness of these measures to investors. As a result, the Company encourages readers to consider the consolidated financial statements and other financial information contained in this report in their entirety, and not to rely on any single financial measure.
| U.S. BANCORP | 65 |
The following table shows the Company’s calculation of these Non-GAAP financial measures:
| At December 31 (Dollars in Millions) | 2012 | 2011 | 2010 | 2009 | 2008 | |||||||||||||||
| Total equity |
$ | 40,267 | $ | 34,971 | $ | 30,322 | $ | 26,661 | $ | 27,033 | ||||||||||
| Preferred stock |
(4,769 | ) | (2,606 | ) | (1,930 | ) | (1,500 | ) | (7,931 | ) | ||||||||||
| Noncontrolling interests |
(1,269 | ) | (993 | ) | (803 | ) | (698 | ) | (733 | ) | ||||||||||
| Goodwill (net of deferred tax liability) |
(8,351 | ) | (8,239 | ) | (8,337 | ) | (8,482 | ) | (8,153 | ) | ||||||||||
| Intangible assets, other than mortgage servicing rights |
(1,006 | ) | (1,217 | ) | (1,376 | ) | (1,657 | ) | (1,640 | ) | ||||||||||
| Tangible common equity (a) |
24,872 | 21,916 | 17,876 | 14,324 | 8,576 | |||||||||||||||
| Tier 1 capital, determined in accordance with prescribed regulatory requirements using Basel I definition |
31,203 | 29,173 | 25,947 | 22,610 | 24,426 | |||||||||||||||
| Trust preferred securities |
– | (2,675 | ) | (3,949 | ) | (4,524 | ) | (4,024 | ) | |||||||||||
| Preferred stock |
(4,769 | ) | (2,606 | ) | (1,930 | ) | (1,500 | ) | (7,931 | ) | ||||||||||
| Noncontrolling interests, less preferred stock not eligible for Tier 1 capital |
(685 | ) | (687 | ) | (692 | ) | (692 | ) | (693 | ) | ||||||||||
| Tier 1 common equity using Basel I definition (b) |
25,749 | 23,205 | 19,376 | 15,894 | 11,778 | |||||||||||||||
| Tangible common equity (as calculated above) |
21,916 | 17,876 | ||||||||||||||||||
| Adjustments (1) |
450 | 381 | ||||||||||||||||||
| Tier 1 common equity using Basel III proposals published prior to June 2012 (c) |
22,366 | 18,257 | ||||||||||||||||||
| Tangible common equity (as calculated above) |
24,872 | |||||||||||||||||||
| Adjustments (2) |
126 | |||||||||||||||||||
| Tier 1 common equity approximated using proposed rules for the Basel III standardized approach released June 2012 (d) |
24,998 | |||||||||||||||||||
| Total assets |
353,855 | 340,122 | 307,786 | 281,176 | 265,912 | |||||||||||||||
| Goodwill (net of deferred tax liability) |
(8,351 | ) | (8,239 | ) | (8,337 | ) | (8,482 | ) | (8,153 | ) | ||||||||||
| Intangible assets, other than mortgage servicing rights |
(1,006 | ) | (1,217 | ) | (1,376 | ) | (1,657 | ) | (1,640 | ) | ||||||||||
| Tangible assets (e) |
344,498 | 330,666 | 298,073 | 271,037 | 256,119 | |||||||||||||||
| Risk-weighted assets, determined in accordance with prescribed regulatory requirements using Basel I definition (f) |
287,611 | 271,333 | 247,619 | 235,233 | 230,628 | |||||||||||||||
| Risk-weighted assets using Basel III proposals published prior to June 2012 (g) |
274,351 | 251,704 | ||||||||||||||||||
| Risk-weighted assets, determined in accordance with prescribed regulatory requirements using Basel I definition |
287,611 | |||||||||||||||||||
| Adjustments (3) |
21,233 | |||||||||||||||||||
| Risk-weighted assets approximated using proposed rules for the Basel III standardized approach released June 2012 (h) |
308,844 | |||||||||||||||||||
| Ratios |
||||||||||||||||||||
| Tangible common equity to tangible assets (a)/(e) |
7.2 | % | 6.6 | % | 6.0 | % | 5.3 | % | 3.3 | % | ||||||||||
| Tangible common equity to risk-weighted assets using Basel I definition (a)/(f) |
8.6 | 8.1 | 7.2 | 6.1 | 3.7 | |||||||||||||||
| Tier 1 common equity to risk-weighted assets using Basel I |
9.0 | 8.6 | 7.8 | 6.8 | 5.1 | |||||||||||||||
| Tier 1 common equity to risk-weighted assets using Basel III proposals published prior to June 2012 (c)/(g) |
– | 8.2 | 7.3 | – | – | |||||||||||||||
| Tier 1 common equity to risk-weighted assets approximated using proposed rules for the Basel III standardized approach released June 2012 (d)/(h) |
8.1 | – | – | – | – | |||||||||||||||
| (1) | Principally net losses on cash flow hedges included in accumulated other comprehensive income. |
| (2) | Includes net losses on cash flow hedges included in accumulated other comprehensive income, unrealized losses on securities transferred from available-for-sale to held-to-maturity included in accumulated other comprehensive income and disallowed mortgage servicing rights. |
| (3) | Includes higher risk-weighting for residential mortgages, unfunded loan commitments, investment securities and mortgage servicing rights, and other adjustments. |
Accounting Changes
To the extent the adoption of new accounting standards materially affects the Company’s financial condition or results of operations, the impacts are discussed in the applicable section(s) of the Management’s Discussion and Analysis and the Notes to Consolidated Financial Statements.
Critical Accounting Policies
The accounting and reporting policies of the Company comply with accounting principles generally accepted in the United States and conform to general practices within the banking industry. The preparation of financial statements in conformity with GAAP requires management to make
| 66 | U.S. BANCORP |
estimates and assumptions. The Company’s financial position and results of operations can be affected by these estimates and assumptions, which are integral to understanding the Company’s financial statements. Critical accounting policies are those policies management believes are the most important to the portrayal of the Company’s financial condition and results, and require management to make estimates that are difficult, subjective or complex. Most accounting policies are not considered by management to be critical accounting policies. Several factors are considered in determining whether or not a policy is critical in the preparation of financial statements. These factors include, among other things, whether the estimates are significant to the financial statements, the nature of the estimates, the ability to readily validate the estimates with other information (including third-parties sources or available prices), and sensitivity of the estimates to changes in economic conditions and whether alternative accounting methods may be utilized under GAAP. Management has discussed the development and the selection of critical accounting policies with the Company’s Audit Committee.
Significant accounting policies are discussed in Note 1 of the Notes to Consolidated Financial Statements. Those policies considered to be critical accounting policies are described below.
Allowance for Credit Losses The allowance for credit losses is established to provide for probable losses incurred in the Company’s credit portfolio. The methods utilized to estimate the allowance for credit losses, key assumptions and quantitative and qualitative information considered by management in determining the appropriate allowance for credit losses are discussed in the “Credit Risk Management” section.
Management’s evaluation of the appropriate allowance for credit losses is often the most critical of all the accounting estimates for a banking institution. It is an inherently subjective process impacted by many factors as discussed throughout the Management’s Discussion and Analysis section of the Annual Report. Although risk management practices, methodologies and other tools are utilized to determine each element of the allowance, degrees of imprecision exist in these measurement tools due in part to subjective judgments involved and an inherent lagging of credit quality measurements relative to the stage of the business cycle. Even determining the stage of the business cycle is highly subjective. As discussed in the “Analysis and Determination of Allowance for Credit Losses” section, management considers the effect of imprecision and many other factors in determining the allowance for credit losses. If not considered, incurred losses in the portfolio related to imprecision and other subjective factors could have a dramatic adverse impact on the liquidity and financial viability of a bank.
Given the many subjective factors affecting the credit portfolio, changes in the allowance for credit losses may not directly coincide with changes in the risk ratings of the credit portfolio reflected in the risk rating process. This is in part due to the timing of the risk rating process in relation to changes in the business cycle, the exposure and mix of loans within risk rating categories, levels of nonperforming loans and the timing of charge-offs and recoveries. For example, the amount of loans within specific risk ratings may change, providing a leading indicator of improving credit quality, while nonperforming loans and net charge-offs continue at elevated levels. Also, inherent loss ratios, determined through migration analysis and historical loss performance over the estimated business cycle of a loan, may not change to the same degree as net charge-offs. Because risk ratings and inherent loss ratios primarily drive the allowance specifically allocated to commercial lending segment loans, the amount of the allowance might decline; however, the degree of change differs somewhat from the level of changes in nonperforming loans and net charge-offs. Also, management would maintain an appropriate allowance for credit losses by increasing the allowance during periods of economic uncertainty or changes in the business cycle.
Some factors considered in determining the appropriate allowance for credit losses are quantifiable while other factors require qualitative judgment. Management conducts an analysis with respect to the accuracy of risk ratings and the volatility of inherent losses, and utilizes this analysis along with qualitative factors, including uncertainty in the economy from changes in unemployment rates, the level of bankruptcies and concentration risks, including risks associated with the weakened housing market and highly leveraged enterprise-value credits, in determining the overall level of the allowance for credit losses. The Company’s determination of the allowance for commercial lending segment loans is sensitive to the assigned credit risk ratings and inherent loss rates at December 31, 2012. In the event that 10 percent of period ending loan balances (including unfunded commitments) within each risk category of this segment of the loan portfolio experienced downgrades of two risk categories, the allowance for credit losses would increase by approximately $232 million at December 31, 2012. The Company believes the allowance for credit losses appropriately considers the imprecision in estimating credit losses based on credit risk ratings and inherent loss rates but actual losses may differ from those estimates. In the event that inherent loss or estimated loss rates for commercial lending segment loans increased by 10 percent, the allowance for credit losses would increase by approximately $143 million at December 31, 2012. The Company’s determination of the allowance for consumer lending segment loans is sensitive to changes in estimated loss rates. In the event that estimated loss
| U.S. BANCORP | 67 |
rates for this segment of the loan portfolio increased by 10 percent, the allowance for credit losses would increase by approximately $168 million at December 31, 2012. Because several quantitative and qualitative factors are considered in determining the allowance for credit losses, these sensitivity analyses do not necessarily reflect the nature and extent of future changes in the allowance for credit losses. They are intended to provide insights into the impact of adverse changes in risk rating and inherent losses and do not imply any expectation of future deterioration in the risk rating or loss rates. Given current processes employed by the Company, management believes the risk ratings and inherent loss rates currently assigned are appropriate. It is possible that others, given the same information, may at any point in time reach different reasonable conclusions that could be significant to the Company’s financial statements. Refer to the “Analysis and Determination of the Allowance for Credit Losses” section for further information.
Fair Value Estimates A portion of the Company’s assets and liabilities are carried at fair value on the Consolidated Balance Sheet, with changes in fair value recorded either through earnings or other comprehensive income (loss) in accordance with applicable accounting principles generally accepted in the United States. These include all of the Company’s available-for-sale securities, derivatives and other trading instruments, MSRs and most mortgage loans held for sale. The estimation of fair value also affects other loans held for sale, which are recorded at the lower-of-cost-or-fair value. The determination of fair value is important for certain other assets that are periodically evaluated for impairment using fair value estimates including goodwill and other intangible assets, impaired loans, other real estate owned and other repossessed assets.
Fair value is generally defined as the exit price at which an asset or liability could be exchanged in a current transaction between willing, unrelated parties, other than in a forced or liquidation sale. Fair value is based on quoted market prices in an active market, or if market prices are not available, is estimated using models employing techniques such as matrix pricing or discounting expected cash flows. The significant assumptions used in the models, which include assumptions for interest rates, discount rates, prepayments and credit losses, are independently verified against observable market data where possible. Where observable market data is not available, the estimate of fair value becomes more subjective and involves a high degree of judgment. In this circumstance, fair value is estimated based on management’s judgment regarding the value that market participants would assign to the asset or liability. This valuation process takes into consideration factors such as market illiquidity. Imprecision in estimating these factors can impact the amount recorded on the balance sheet for a particular asset or liability with related impacts to earnings or other comprehensive income (loss).
When available, trading and available-for-sale securities are valued based on quoted market prices. However, certain securities are traded less actively and therefore, quoted market prices may not be available. The determination of fair value may require benchmarking to similar instruments or performing a discounted cash flow analysis using estimates of future cash flows and prepayment, interest and default rates. An example is non-agency residential mortgage-backed securities. For more information on investment securities, refer to Note 4 of the Notes to Consolidated Financial Statements.
As few derivative contracts are listed on an exchange, the majority of the Company’s derivative positions are valued using valuation techniques that use readily observable market inputs. Certain derivatives, however, must be valued using techniques that include unobservable inputs. For these instruments, the significant assumptions must be estimated and therefore, are subject to judgment. Note 19 of the Notes to Consolidated Financial Statements provides a summary of the Company’s derivative positions.
Refer to Note 20 of the Notes to Consolidated Financial Statements for additional information regarding estimations of fair value.
Purchased Loans and Related Indemnification Assets In accordance with applicable authoritative accounting guidance effective for the Company beginning January 1, 2009, all purchased loans and related indemnification assets arising from loss-sharing arrangements with the FDIC are recorded at fair value at date of purchase. The initial valuation of these loans and the related indemnification assets requires management to make subjective judgments concerning estimates about how the acquired loans will perform in the future using valuation methods including discounted cash flow analysis and independent third party appraisals. Factors that may significantly affect the initial valuation include, among others, market-based and industry data related to expected changes in interest rates, assumptions related to probability and severity of credit losses, estimated timing of credit losses including the foreclosure and liquidation of collateral, expected prepayment rates, required or anticipated loan modifications, unfunded loan commitments, the specific terms and provisions of any loss sharing agreements, and specific industry and market conditions that may impact discount rates and independent third party appraisals.
On an ongoing basis, the accounting for purchased loans and related indemnification assets follows applicable authoritative accounting guidance for purchased non-impaired loans and purchased impaired loans. Refer to Note 1 and Note 5 of the Notes to Consolidated Financial Statements for additional information. In addition, refer to the “Analysis and
| 68 | U.S. BANCORP |
Determination of the Allowance for Credit Losses” section for information on the determination of the required allowance for credit losses, if any, for these loans.
Mortgage Servicing Rights MSRs are capitalized as separate assets when loans are sold and servicing is retained, or may be purchased from others. MSRs are initially recorded at fair value and remeasured at each subsequent reporting date. Because MSRs do not trade in an active market with readily observable prices, the Company determines the fair value by estimating the present value of the asset’s future cash flows utilizing market-based prepayment rates, discount rates, and other assumptions validated through comparison to trade information, industry surveys and independent third party valuations. Changes in the fair value of MSRs are recorded in earnings during the period in which they occur. Risks inherent in the MSRs’ valuation include higher than expected prepayment rates and/or delayed receipt of cash flows. The Company may utilize derivatives, including interest rate swaps, forward commitments to buy TBAs, and futures and options contracts, to mitigate the valuation risk.
Goodwill and Other Intangibles The Company records all assets and liabilities acquired in purchase acquisitions, including goodwill and other intangibles, at fair value. Goodwill is not amortized but is subject, at a minimum, to annual tests for impairment. In certain situations, interim impairment tests may be required if events occur or circumstances change that would more likely than not reduce the fair value of a reporting segment below its carrying amount. Other intangible assets are amortized over their estimated useful lives using straight-line and accelerated methods and are subject to impairment if events or circumstances indicate a possible inability to realize the carrying amount.
The initial recognition of goodwill and other intangible assets and subsequent impairment analysis require management to make subjective judgments concerning estimates of how the acquired assets will perform in the future using valuation methods including discounted cash flow analysis. Additionally, estimated cash flows may extend beyond ten years and, by their nature, are difficult to determine over an extended timeframe. Events and factors that may significantly affect the estimates include, among others, competitive forces, customer behaviors and attrition, changes in revenue growth trends, cost structures, technology, changes in discount rates and specific industry and market conditions. In determining the reasonableness of cash flow estimates, the Company reviews historical performance of the underlying assets or similar assets in an effort to assess and validate assumptions utilized in its estimates.
In assessing the fair value of reporting units, the Company considers the stage of the current business cycle and potential changes in market conditions in estimating the timing and extent of future cash flows. Also, management often utilizes other information to validate the reasonableness of its valuations, including public market comparables, and multiples of recent mergers and acquisitions of similar businesses. Valuation multiples may be based on revenue, price-to-earnings and tangible capital ratios of comparable public companies and business segments. These multiples may be adjusted to consider competitive differences, including size, operating leverage and other factors. The carrying amount of a reporting unit is determined based on the amount of equity required for the reporting unit’s activities, considering the specific assets and liabilities of the reporting unit. The Company determines the amount of equity for each reporting unit on a risk-adjusted basis considering economic and regulatory capital requirements, and includes deductions and limitations related to certain types of assets including MSRs, purchased credit card relationship intangibles, and capital markets activity in the Company’s Wholesale Banking and Commercial Real Estate segment. The Company does not assign corporate assets and liabilities to reporting units that do not relate to the operations of the reporting unit or are not considered in determining the fair value of the reporting unit. These assets and liabilities primarily relate to the Company’s investment securities portfolio and other investments (including direct equity investments, bank-owned life insurance and tax-advantaged investments) and corporate debt and other funding liabilities. In the most recent goodwill impairment test, the portion of the Company’s total equity allocated to the Treasury and Corporate Support operating segment included approximately $3 billion in excess of the economic and regulatory capital requirements of that segment.
The Company’s annual assessment of potential goodwill impairment was completed during the second quarter of 2012. Based on the results of this assessment, no goodwill impairment was recognized. Because of current economic conditions the Company continues to monitor goodwill and other intangible assets for impairment indicators throughout the year.
Income Taxes The Company estimates income tax expense based on amounts expected to be owed to various tax jurisdictions. Currently, the Company files tax returns in approximately 235 federal, state and local domestic jurisdictions and 14 foreign jurisdictions. The estimated income tax expense is reported in the Consolidated Statement of Income. Accrued taxes represent the net estimated amount due to or to be received from taxing jurisdictions either currently or in the future and are reported in other assets or other liabilities on the Consolidated Balance Sheet. In estimating accrued taxes, the Company assesses the relative merits and risks of the appropriate tax treatment considering statutory, judicial and regulatory guidance in the context of
| U.S. BANCORP | 69 |
the tax position. Because of the complexity of tax laws and regulations, interpretation can be difficult and subject to legal judgment given specific facts and circumstances. It is possible that others, given the same information, may at any point in time reach different reasonable conclusions regarding the estimated amounts of accrued taxes.
Changes in the estimate of accrued taxes occur periodically due to changes in tax rates, interpretations of tax laws, the status of examinations being conducted by various taxing authorities, and newly enacted statutory, judicial and regulatory guidance that impacts the relative merits and risks of tax positions. These changes, when they occur, affect accrued taxes and can be significant to the operating results of the Company. Refer to Note 18 of the Notes to Consolidated Financial Statements for additional information regarding income taxes.
Controls and Procedures
Under the supervision and with the participation of the Company’s management, including its principal executive officer and principal financial officer, the Company has evaluated the effectiveness of the design and operation of its disclosure controls and procedures (as defined in Rules 13a-15(e) and 15d-15(e) under the Securities Exchange Act of 1934 (the “Exchange Act”)). Based upon this evaluation, the principal executive officer and principal financial officer have concluded that, as of the end of the period covered by this report, the Company’s disclosure controls and procedures were effective.
During the most recently completed fiscal quarter, there was no change made in the Company’s internal controls over financial reporting (as defined in Rules 13a-15(f) and 15d-15(f) under the Exchange Act) that has materially affected, or is reasonably likely to materially affect, the Company’s internal control over financial reporting.
The annual report of the Company’s management on internal control over financial reporting is provided on page 71. The attestation report of Ernst & Young LLP, the Company’s independent accountants, regarding the Company’s internal control over financial reporting is provided on page 73.
| 70 | U.S. BANCORP |
Report of Management
Responsibility for the financial statements and other information presented throughout this Annual Report rests with the management of U.S. Bancorp. The Company believes the consolidated financial statements have been prepared in conformity with accounting principles generally accepted in the United States and present the substance of transactions based on the circumstances and management’s best estimates and judgment.
In meeting its responsibilities for the reliability of the financial statements, management is responsible for establishing and maintaining an adequate system of internal control over financial reporting as defined by Rules 13a-15(f) and 15d-15(f) under the Securities Exchange Act of 1934. The Company’s system of internal control is designed to provide reasonable assurance regarding the reliability of financial reporting and the preparation of publicly filed financial statements in accordance with accounting principles generally accepted in the United States.
To test compliance, the Company carries out an extensive audit program. This program includes a review for compliance with written policies and procedures and a comprehensive review of the adequacy and effectiveness of the system of internal control. Although control procedures are designed and tested, it must be recognized that there are limits inherent in all systems of internal control and, therefore, errors and irregularities may nevertheless occur. Also, estimates and judgments are required to assess and balance the relative cost and expected benefits of the controls. Projection of any evaluation of effectiveness to future periods are subject to the risk that controls may become inadequate because of changes in conditions, or that the degree of compliance with the policies or procedures may deteriorate.
The Board of Directors of the Company has an Audit Committee composed of directors who are independent of U.S. Bancorp. The Audit Committee meets periodically with management, the internal auditors and the independent accountants to consider audit results and to discuss internal accounting control, auditing and financial reporting matters.
Management assessed the effectiveness of the Company’s system of internal control over financial reporting as of December 31, 2012. In making this assessment, management used the criteria set forth by the Committee of Sponsoring Organizations of the Treadway Commission in its Internal Control-Integrated Framework. Based on our assessment and those criteria, management believes the Company designed and maintained effective internal control over financial reporting as of December 31, 2012.
The Company’s independent accountants, Ernst & Young LLP, have been engaged to render an independent professional opinion on the financial statements and issue an attestation report on the Company’s internal control over financial reporting. Their opinion on the financial statements appearing on page 72 and their attestation on internal control over financial reporting appearing on page 73 are based on procedures conducted in accordance with auditing standards of the Public Company Accounting Oversight Board (United States).
| U.S. BANCORP | 71 |
Report of Independent Registered Public Accounting Firm on the Consolidated Financial Statements
The Board of Directors and Shareholders of U.S. Bancorp:
We have audited the accompanying consolidated balance sheets of U.S. Bancorp as of December 31, 2012 and 2011, and the related consolidated statements of income, comprehensive income, shareholders’ equity, and cash flows for each of the three years in the period ended December 31, 2012. These financial statements are the responsibility of U.S. Bancorp’s management. Our responsibility is to express an opinion on these financial statements based on our audits.
We conducted our audits in accordance with the standards of the Public Company Accounting Oversight Board (United States). Those standards require that we plan and perform the audit to obtain reasonable assurance about whether the financial statements are free of material misstatement. An audit includes examining, on a test basis, evidence supporting the amounts and disclosures in the financial statements. An audit also includes assessing the accounting principles used and significant estimates made by management, as well as evaluating the overall financial statement presentation. We believe that our audits provide a reasonable basis for our opinion.
In our opinion, the financial statements referred to above present fairly, in all material respects, the consolidated financial position of U.S. Bancorp at December 31, 2012 and 2011, and the consolidated results of its operations and its cash flows for each of the three years in the period ended December 31, 2012, in conformity with U.S. generally accepted accounting principles.
We also have audited, in accordance with the standards of the Public Company Accounting Oversight Board (United States), U.S. Bancorp’s internal control over financial reporting as of December 31, 2012, based on criteria established in Internal Control — Integrated Framework issued by the Committee of Sponsoring Organizations of the Treadway Commission and our report dated February 22, 2013 expressed an unqualified opinion thereon.

Minneapolis, Minnesota
February 22, 2013
| 72 | U.S. BANCORP |
Report of Independent Registered Public Accounting Firm on Internal Control Over Financial Reporting
The Board of Directors and Shareholders of U.S. Bancorp:
We have audited U.S. Bancorp’s internal control over financial reporting as of December 31, 2012, based on criteria established in Internal Control — Integrated Framework issued by the Committee of Sponsoring Organizations of the Treadway Commission (the COSO criteria). U.S. Bancorp’s management is responsible for maintaining effective internal control over financial reporting, and for its assessment of the effectiveness of internal control over financial reporting included in the accompanying Report of Management. Our responsibility is to express an opinion on U.S. Bancorp’s internal control over financial reporting based on our audit.
We conducted our audit in accordance with the standards of the Public Company Accounting Oversight Board (United States). Those standards require that we plan and perform the audit to obtain reasonable assurance about whether effective internal control over financial reporting was maintained in all material respects. Our audit included obtaining an understanding of internal control over financial reporting, assessing the risk that a material weakness exists, testing and evaluating the design and operating effectiveness of internal control based on the assessed risk, and performing such other procedures as we considered necessary in the circumstances. We believe that our audit provides a reasonable basis for our opinion.
A company’s internal control over financial reporting is a process designed to provide reasonable assurance regarding the reliability of financial reporting and the preparation of financial statements for external purposes in accordance with generally accepted accounting principles. A company’s internal control over financial reporting includes those policies and procedures that (1) pertain to the maintenance of records that, in reasonable detail, accurately and fairly reflect the transactions and dispositions of the assets of the company; (2) provide reasonable assurance that transactions are recorded as necessary to permit preparation of financial statements in accordance with generally accepted accounting principles, and that receipts and expenditures of the company are being made only in accordance with authorizations of management and directors of the company; and (3) provide reasonable assurance regarding prevention or timely detection of unauthorized acquisition, use, or disposition of the company’s assets that could have a material effect on the financial statements.
Because of its inherent limitations, internal control over financial reporting may not prevent or detect misstatements. Also, projections of any evaluation of effectiveness to future periods are subject to the risk that controls may become inadequate because of changes in conditions, or that the degree of compliance with the policies or procedures may deteriorate.
In our opinion, U.S. Bancorp maintained, in all material respects, effective internal control over financial reporting as of December 31, 2012, based on the COSO criteria.
We also have audited, in accordance with the standards of the Public Company Accounting Oversight Board (United States), the consolidated balance sheets of U.S. Bancorp as of December 31, 2012 and 2011, and the related consolidated statements of income, comprehensive income, shareholders’ equity, and cash flows for each of the three years in the period ended December 31, 2012 and our report dated February 22, 2013 expressed an unqualified opinion thereon.
Minneapolis, Minnesota
February 22, 2013
| U.S. BANCORP | 73 |
Consolidated Financial Statements and Notes Table of Contents
| Consolidated Financial Statements |
||||
| 75 | ||||
| 76 | ||||
| 77 | ||||
| 78 | ||||
| 79 | ||||
| Notes to Consolidated Financial Statements |
||||
| 80 | ||||
| 88 | ||||
| 88 | ||||
| 89 | ||||
| Note 5 — Loans and Allowance for Credit Losses |
93 | |||
| 101 | ||||
| Note 7 — Accounting for Transfers and Servicing of Financial Assets and Variable Interest Entities |
101 | |||
| 103 | ||||
| 103 | ||||
| 104 | ||||
| 105 | ||||
| 106 | ||||
| 107 | ||||
| 107 | ||||
| 110 | ||||
| 111 | ||||
| 116 | ||||
| 118 | ||||
| 119 | ||||
| 123 | ||||
| 132 | ||||
| 137 | ||||
| 138 |
| 74 | U.S. BANCORP |
Consolidated Balance Sheet
| At December 31 (Dollars in Millions) | 2012 | 2011 | ||||||
| Assets |
||||||||
| Cash and due from banks |
$ | 8,252 | $ | 13,962 | ||||
| Investment securities |
||||||||
| Held-to-maturity (fair value $34,952 and $19,216, respectively; including $1,482 and $155 pledged as collateral, respectively) (a) |
34,389 | 18,877 | ||||||
| Available-for-sale ($1,906 and $6,831 pledged as collateral, respectively) (a) |
40,139 | 51,937 | ||||||
| Loans held for sale (included $7,957 and $6,925 of mortgage loans carried at fair value, respectively) |
7,976 | 7,156 | ||||||
| Loans |
||||||||
| Commercial |
66,223 | 56,648 | ||||||
| Commercial real estate |
36,953 | 35,851 | ||||||
| Residential mortgages |
44,018 | 37,082 | ||||||
| Credit card |
17,115 | 17,360 | ||||||
| Other retail |
47,712 | 48,107 | ||||||
| Total loans, excluding covered loans |
212,021 | 195,048 | ||||||
| Covered loans |
11,308 | 14,787 | ||||||
| Total loans |
223,329 | 209,835 | ||||||
| Less allowance for loan losses |
(4,424 | ) | (4,753 | ) | ||||
| Net loans |
218,905 | 205,082 | ||||||
| Premises and equipment |
2,670 | 2,657 | ||||||
| Goodwill |
9,143 | 8,927 | ||||||
| Other intangible assets |
2,706 | 2,736 | ||||||
| Other assets |
29,675 | 28,788 | ||||||
| Total assets |
$ | 353,855 | $ | 340,122 | ||||
| Liabilities and Shareholders’ Equity |
||||||||
| Deposits |
||||||||
| Noninterest-bearing |
$ | 74,172 | $ | 68,579 | ||||
| Interest-bearing |
145,972 | 134,757 | ||||||
| Time deposits greater than $100,000 |
29,039 | 27,549 | ||||||
| Total deposits |
249,183 | 230,885 | ||||||
| Short-term borrowings |
26,302 | 30,468 | ||||||
| Long-term debt |
25,516 | 31,953 | ||||||
| Other liabilities |
12,587 | 11,845 | ||||||
| Total liabilities |
313,588 | 305,151 | ||||||
| Shareholders’ equity |
||||||||
| Preferred stock |
4,769 | 2,606 | ||||||
| Common stock, par value $0.01 a share — authorized: 4,000,000,000 shares; |
21 | 21 | ||||||
| Capital surplus |
8,201 | 8,238 | ||||||
| Retained earnings |
34,720 | 30,785 | ||||||
| Less cost of common stock in treasury: 2012 — 256,294,227 shares; 2011 — 215,904,019 shares |
(7,790 | ) | (6,472 | ) | ||||
| Accumulated other comprehensive income (loss) |
(923 | ) | (1,200 | ) | ||||
| Total U.S. Bancorp shareholders’ equity |
38,998 | 33,978 | ||||||
| Noncontrolling interests |
1,269 | 993 | ||||||
| Total equity |
40,267 | 34,971 | ||||||
| Total liabilities and equity |
$ | 353,855 | $ | 340,122 | ||||
| (a) | Includes only collateral pledged by the Company where counterparties have the right to sell or pledge the collateral. |
See Notes to Consolidated Financial Statements.
| U.S. BANCORP | 75 |
Consolidated Statement of Income
| Year Ended December 31 (Dollars and Shares in Millions, Except Per Share Data) | 2012 | 2011 | 2010 | |||||||||
| Interest Income |
||||||||||||
| Loans |
$ | 10,558 | $ | 10,370 | $ | 10,145 | ||||||
| Loans held for sale |
282 | 200 | 246 | |||||||||
| Investment securities |
1,792 | 1,820 | 1,601 | |||||||||
| Other interest income |
251 | 249 | 166 | |||||||||
| Total interest income |
12,883 | 12,639 | 12,158 | |||||||||
| Interest Expense |
||||||||||||
| Deposits |
691 | 840 | 928 | |||||||||
| Short-term borrowings |
442 | 531 | 548 | |||||||||
| Long-term debt |
1,005 | 1,145 | 1,103 | |||||||||
| Total interest expense |
2,138 | 2,516 | 2,579 | |||||||||
| Net interest income |
10,745 | 10,123 | 9,579 | |||||||||
| Provision for credit losses |
1,882 | 2,343 | 4,356 | |||||||||
| Net interest income after provision for credit losses |
8,863 | 7,780 | 5,223 | |||||||||
| Noninterest Income |
||||||||||||
| Credit and debit card revenue |
892 | 1,073 | 1,091 | |||||||||
| Corporate payment products revenue |
744 | 734 | 710 | |||||||||
| Merchant processing services |
1,395 | 1,355 | 1,253 | |||||||||
| ATM processing services |
346 | 452 | 423 | |||||||||
| Trust and investment management fees |
1,055 | 1,000 | 1,080 | |||||||||
| Deposit service charges |
653 | 659 | 710 | |||||||||
| Treasury management fees |
541 | 551 | 555 | |||||||||
| Commercial products revenue |
878 | 841 | 771 | |||||||||
| Mortgage banking revenue |
1,937 | 986 | 1,003 | |||||||||
| Investment products fees and commissions |
150 | 129 | 111 | |||||||||
| Securities gains (losses), net |
||||||||||||
| Realized gains (losses), net |
59 | 4 | 13 | |||||||||
| Total other-than-temporary impairment |
(62 | ) | (60 | ) | (157 | ) | ||||||
| Portion of other-than-temporary impairment recognized in other comprehensive income |
(12 | ) | 25 | 66 | ||||||||
| Total securities gains (losses), net |
(15 | ) | (31 | ) | (78 | ) | ||||||
| Other |
743 | 1,011 | 731 | |||||||||
| Total noninterest income |
9,319 | 8,760 | 8,360 | |||||||||
| Noninterest Expense |
||||||||||||
| Compensation |
4,320 | 4,041 | 3,779 | |||||||||
| Employee benefits |
945 | 845 | 694 | |||||||||
| Net occupancy and equipment |
917 | 999 | 919 | |||||||||
| Professional services |
530 | 383 | 306 | |||||||||
| Marketing and business development |
388 | 369 | 360 | |||||||||
| Technology and communications |
821 | 758 | 744 | |||||||||
| Postage, printing and supplies |
304 | 303 | 301 | |||||||||
| Other intangibles |
274 | 299 | 367 | |||||||||
| Other |
1,957 | 1,914 | 1,913 | |||||||||
| Total noninterest expense |
10,456 | 9,911 | 9,383 | |||||||||
| Income before income taxes |
7,726 | 6,629 | 4,200 | |||||||||
| Applicable income taxes |
2,236 | 1,841 | 935 | |||||||||
| Net income |
5,490 | 4,788 | 3,265 | |||||||||
| Net (income) loss attributable to noncontrolling interests |
157 | 84 | 52 | |||||||||
| Net income attributable to U.S. Bancorp |
$ | 5,647 | $ | 4,872 | $ | 3,317 | ||||||
| Net income applicable to U.S. Bancorp common shareholders |
$ | 5,383 | $ | 4,721 | $ | 3,332 | ||||||
| Earnings per common share |
$ | 2.85 | $ | 2.47 | $ | 1.74 | ||||||
| Diluted earnings per common share |
$ | 2.84 | $ | 2.46 | $ | 1.73 | ||||||
| Dividends declared per common share |
$ | .78 | $ | .50 | $ | .20 | ||||||
| Average common shares outstanding |
1,887 | 1,914 | 1,912 | |||||||||
| Average diluted common shares outstanding |
1,896 | 1,923 | 1,921 | |||||||||
See Notes to Consolidated Financial Statements.
| 76 | U.S. BANCORP |
Consolidated Statement of Comprehensive Income
| Year Ended December 31 (Dollars in Millions) | 2012 | 2011 | 2010 | |||||||||
| Net income |
$ | 5,490 | $ | 4,788 | $ | 3,265 | ||||||
| Other Comprehensive Income (Loss) |
||||||||||||
| Changes in unrealized gains and losses on securities available-for-sale |
715 | 920 | 278 | |||||||||
| Other-than-temporary impairment not recognized in earnings on securities available-for-sale |
12 | (25 | ) | (66 | ) | |||||||
| Amortization of unrealized gains on securities transferred from available-for-sale to held-to-maturity |
(51 | ) | – | – | ||||||||
| Changes in unrealized gains (losses) on derivative hedges |
(74 | ) | (343 | ) | (383 | ) | ||||||
| Foreign currency translation |
14 | (16 | ) | 24 | ||||||||
| Reclassification to earnings of realized gains and losses |
376 | 363 | 365 | |||||||||
| Unrealized gains (losses) on retirement plans |
(543 | ) | (464 | ) | (197 | ) | ||||||
| Income taxes related to other comprehensive income |
(172 | ) | (166 | ) | (5 | ) | ||||||
| Total other comprehensive income (loss) |
277 | 269 | 16 | |||||||||
| Comprehensive income |
5,767 | 5,057 | 3,281 | |||||||||
| Comprehensive (income) loss attributable to noncontrolling interests |
157 | 84 | 52 | |||||||||
| Comprehensive income attributable to U.S. Bancorp |
$ | 5,924 | $ | 5,141 | $ | 3,333 | ||||||
See Notes to Consolidated Financial Statements.
| U.S. BANCORP | 77 |
Consolidated Statement of Shareholders’ Equity
| U.S. Bancorp Shareholders | ||||||||||||||||||||||||||||||||||||||||
| (Dollars and Shares in Millions) | Common Shares Outstanding |
Preferred Stock |
Common Stock |
Capital Surplus |
Retained Earnings |
Treasury Stock |
Accumulated Other Comprehensive Income (Loss) |
Total U.S. Bancorp |
Noncontrolling Interests |
Total Equity |
||||||||||||||||||||||||||||||
| Balance December 31, 2009 |
1,913 | $ | 1,500 | $ | 21 | $ | 8,319 | $ | 24,116 | $ | (6,509 | ) | $ | (1,484 | ) | $ | 25,963 | $ | 698 | $ | 26,661 | |||||||||||||||||||
| Change in accounting principle |
(72 | ) | (1 | ) | (73 | ) | (16 | ) | (89 | ) | ||||||||||||||||||||||||||||||
| Net income (loss) |
3,317 | 3,317 | (52 | ) | 3,265 | |||||||||||||||||||||||||||||||||||
| Other comprehensive income (loss) |
16 | 16 | 16 | |||||||||||||||||||||||||||||||||||||
| Preferred stock dividends |
(89 | ) | (89 | ) | (89 | ) | ||||||||||||||||||||||||||||||||||
| Common stock dividends |
(385 | ) | (385 | ) | (385 | ) | ||||||||||||||||||||||||||||||||||
| Issuance of preferred stock |
430 | 10 | 118 | 558 | 558 | |||||||||||||||||||||||||||||||||||
| Issuance of common and treasury stock |
9 | (134 | ) | 263 | 129 | 129 | ||||||||||||||||||||||||||||||||||
| Purchase of treasury stock |
(1 | ) | (16 | ) | (16 | ) | (16 | ) | ||||||||||||||||||||||||||||||||
| Distributions to noncontrolling interests |
– | (76 | ) | (76 | ) | |||||||||||||||||||||||||||||||||||
| Net other changes in noncontrolling interests |
– | 249 | 249 | |||||||||||||||||||||||||||||||||||||
| Stock option and restricted stock grants |
99 | 99 | 99 | |||||||||||||||||||||||||||||||||||||
| Balance December 31, 2010 |
1,921 | $ | 1,930 | $ | 21 | $ | 8,294 | $ | 27,005 | $ | (6,262 | ) | $ | (1,469 | ) | $ | 29,519 | $ | 803 | $ | 30,322 | |||||||||||||||||||
| Change in accounting principle |
(2 | ) | (2 | ) | (2 | ) | ||||||||||||||||||||||||||||||||||
| Net income (loss) |
4,872 | 4,872 | (84 | ) | 4,788 | |||||||||||||||||||||||||||||||||||
| Other comprehensive income (loss) |
269 | 269 | 269 | |||||||||||||||||||||||||||||||||||||
| Preferred stock dividends |
(129 | ) | (129 | ) | (129 | ) | ||||||||||||||||||||||||||||||||||
| Common stock dividends |
(961 | ) | (961 | ) | (961 | ) | ||||||||||||||||||||||||||||||||||
| Issuance of preferred stock |
676 | 676 | 676 | |||||||||||||||||||||||||||||||||||||
| Issuance of common and treasury stock |
11 | (147 | ) | 340 | 193 | 193 | ||||||||||||||||||||||||||||||||||
| Purchase of treasury stock |
(22 | ) | (550 | ) | (550 | ) | (550 | ) | ||||||||||||||||||||||||||||||||
| Distributions to noncontrolling interests |
– | (80 | ) | (80 | ) | |||||||||||||||||||||||||||||||||||
| Purchase of noncontrolling interests |
(3 | ) | (3 | ) | (8 | ) | (11 | ) | ||||||||||||||||||||||||||||||||
| Net other changes in noncontrolling interests |
– | 362 | 362 | |||||||||||||||||||||||||||||||||||||
| Stock option and restricted stock grants |
94 | 94 | 94 | |||||||||||||||||||||||||||||||||||||
| Balance December 31, 2011 |
1,910 | $ | 2,606 | $ | 21 | $ | 8,238 | $ | 30,785 | $ | (6,472 | ) | $ | (1,200 | ) | $ | 33,978 | $ | 993 | $ | 34,971 | |||||||||||||||||||
| Net income (loss) |
5,647 | 5,647 | (157 | ) | 5,490 | |||||||||||||||||||||||||||||||||||
| Other comprehensive income (loss) |
277 | 277 | 277 | |||||||||||||||||||||||||||||||||||||
| Preferred stock dividends |
(238 | ) | (238 | ) | (238 | ) | ||||||||||||||||||||||||||||||||||
| Common stock dividends |
(1,474 | ) | (1,474 | ) | (1,474 | ) | ||||||||||||||||||||||||||||||||||
| Issuance of preferred stock |
2,163 | 2,163 | 2,163 | |||||||||||||||||||||||||||||||||||||
| Issuance of common and treasury stock |
18 | (119 | ) | 560 | 441 | 441 | ||||||||||||||||||||||||||||||||||
| Purchase of treasury stock |
(59 | ) | (1,878 | ) | (1,878 | ) | (1,878 | ) | ||||||||||||||||||||||||||||||||
| Distributions to noncontrolling interests |
– | (76 | ) | (76 | ) | |||||||||||||||||||||||||||||||||||
| Net other changes in noncontrolling interests |
– | 509 | 509 | |||||||||||||||||||||||||||||||||||||
| Stock option and restricted stock grants |
82 | 82 | 82 | |||||||||||||||||||||||||||||||||||||
| Balance December 31, 2012 |
1,869 | $ | 4,769 | $ | 21 | $ | 8,201 | $ | 34,720 | $ | (7,790 | ) | $ | (923 | ) | $ | 38,998 | $ | 1,269 | $ | 40,267 | |||||||||||||||||||
See Notes to Consolidated Financial Statements.
| 78 | U.S. BANCORP |
Consolidated Statement of Cash Flows
| Year Ended December 31 (Dollars in Millions) | 2012 | 2011 | 2010 | |||||||||
| Operating Activities |
||||||||||||
| Net income attributable to U.S. Bancorp |
$ | 5,647 | $ | 4,872 | $ | 3,317 | ||||||
| Adjustments to reconcile net income to net cash provided by operating activities |
||||||||||||
| Provision for credit losses |
1,882 | 2,343 | 4,356 | |||||||||
| Depreciation and amortization of premises and equipment |
287 | 266 | 229 | |||||||||
| Amortization of intangibles |
274 | 299 | 367 | |||||||||
| Provision for deferred income taxes |
49 | 748 | (370 | ) | ||||||||
| (Gain) loss on sale of loans held for sale |
(2,889 | ) | (860 | ) | (1,289 | ) | ||||||
| (Gain) loss on sale of securities and other assets |
(242 | ) | (25 | ) | 29 | |||||||
| Loans originated for sale in the secondary market, net of repayments |
(81,219 | ) | (46,366 | ) | (53,614 | ) | ||||||
| Proceeds from sales of loans held for sale |
82,302 | 48,094 | 50,721 | |||||||||
| Other, net |
1,867 | 449 | 1,495 | |||||||||
| Net cash provided by operating activities |
7,958 | 9,820 | 5,241 | |||||||||
| Investing Activities |
||||||||||||
| Proceeds from sales of available-for-sale investment securities |
2,060 | 1,018 | 1,212 | |||||||||
| Proceeds from maturities of held-to-maturity investment securities |
6,336 | 1,404 | 167 | |||||||||
| Proceeds from maturities of available-for-sale investment securities |
15,374 | 12,713 | 16,068 | |||||||||
| Purchases of held-to-maturity investment securities |
(10,247 | ) | (18,500 | ) | (1,010 | ) | ||||||
| Purchases of available-for-sale investment securities |
(16,605 | ) | (13,229 | ) | (24,025 | ) | ||||||
| Net increase in loans outstanding |
(15,158 | ) | (13,418 | ) | (6,322 | ) | ||||||
| Proceeds from sales of loans |
1,895 | 820 | 1,829 | |||||||||
| Purchases of loans |
(2,741 | ) | (3,078 | ) | (4,278 | ) | ||||||
| Acquisitions, net of cash acquired |
94 | 636 | 923 | |||||||||
| Other, net |
(1,261 | ) | (1,070 | ) | (936 | ) | ||||||
| Net cash used in investing activities |
(20,253 | ) | (32,704 | ) | (16,372 | ) | ||||||
| Financing Activities |
||||||||||||
| Net increase in deposits |
18,050 | 24,846 | 20,527 | |||||||||
| Net increase (decrease) in short-term borrowings |
(4,167 | ) | (2,205 | ) | 592 | |||||||
| Proceeds from issuance of long-term debt |
4,966 | 3,611 | 7,044 | |||||||||
| Principal payments or redemption of long-term debt |
(11,415 | ) | (3,300 | ) | (8,394 | ) | ||||||
| Fees paid on exchange of income trust securities for perpetual preferred stock |
– | – | (4 | ) | ||||||||
| Proceeds from issuance of preferred stock |
2,163 | 676 | – | |||||||||
| Proceeds from issuance of common stock |
395 | 180 | 119 | |||||||||
| Repurchase of common stock |
(1,856 | ) | (514 | ) | – | |||||||
| Cash dividends paid on preferred stock |
(204 | ) | (118 | ) | (89 | ) | ||||||
| Cash dividends paid on common stock |
(1,347 | ) | (817 | ) | (383 | ) | ||||||
| Net cash provided by financing activities |
6,585 | 22,359 | 19,412 | |||||||||
| Change in cash and due from banks |
(5,710 | ) | (525 | ) | 8,281 | |||||||
| Cash and due from banks at beginning of period |
13,962 | 14,487 | 6,206 | |||||||||
| Cash and due from banks at end of period |
$ | 8,252 | $ | 13,962 | $ | 14,487 | ||||||
| Supplemental Cash Flow Disclosures |
||||||||||||
| Cash paid for income taxes |
$ | 1,469 | $ | 495 | $ | 424 | ||||||
| Cash paid for interest |
2,218 | 2,563 | 2,631 | |||||||||
| Net noncash transfers to foreclosed property |
564 | 702 | 1,384 | |||||||||
| Noncash transfer of investment securities available-for-sale to held-to-maturity |
11,705 | – | – | |||||||||
| Acquisitions |
||||||||||||
| Assets (sold) acquired |
$ | 194 | $ | 1,761 | $ | (14 | ) | |||||
| Liabilities sold (assumed) |
(260 | ) | (2,100 | ) | (907 | ) | ||||||
| Net |
$ | (66 | ) | $ | (339 | ) | $ | (921 | ) | |||
See Notes to Consolidated Financial Statements.
| U.S. BANCORP | 79 |
Notes to Consolidated Financial Statements
| NOTE 1 | Significant Accounting Policies |
U.S. Bancorp is a multi-state financial services holding company headquartered in Minneapolis, Minnesota. U.S. Bancorp and its subsidiaries (the “Company”) provide a full range of financial services, including lending and depository services through banking offices principally in the Midwest and West regions of the United States. The Company also engages in credit card, merchant, and ATM processing, mortgage banking, insurance, trust and investment management, brokerage, and leasing activities principally in domestic markets.
Basis of Presentation The consolidated financial statements include the accounts of the Company and its subsidiaries and all variable interest entities (“VIEs”) for which the Company has both the power to direct the activities of the VIE that most significantly impact the VIE’s economic performance, and the obligation to absorb losses or right to receive benefits of the VIE that could potentially be significant to the VIE. Consolidation eliminates all significant intercompany accounts and transactions. Certain items in prior periods have been reclassified to conform to the current presentation.
Uses of Estimates The preparation of financial statements in conformity with generally accepted accounting principles requires management to make estimates and assumptions that affect the amounts reported in the financial statements and accompanying notes. Actual experience could differ from those estimates.
Business Segments
Within the Company, financial performance is measured by major lines of business based on the products and services provided to customers through its distribution channels. The Company has five reportable operating segments:
Wholesale Banking and Commercial Real Estate Wholesale Banking and Commercial Real Estate offers lending, equipment finance and small-ticket leasing, depository services, treasury management, capital markets, international trade services and other financial services to middle market, large corporate, commercial real estate, financial institution and public sector clients.
Consumer and Small Business Banking Consumer and Small Business Banking delivers products and services through banking offices, telephone servicing and sales, on-line services, direct mail, ATM processing and over mobile devices, such as mobile phones and tablet computers. It encompasses community banking, metropolitan banking, in-store banking, small business banking, consumer lending, mortgage banking, workplace banking, student banking and 24-hour banking.
Wealth Management and Securities Services Wealth Management and Securities Services provides private banking, financial advisory services, investment management, retail brokerage services, insurance, trust, custody and fund servicing through five businesses: Wealth Management, Corporate Trust Services, U.S. Bancorp Asset Management, Institutional Trust & Custody and Fund Services.
Payment Services Payment Services includes consumer and business credit cards, stored-value cards, debit cards, corporate and purchasing card services, consumer lines of credit and merchant processing.
Treasury and Corporate Support Treasury and Corporate Support includes the Company’s investment portfolios, most covered commercial and commercial real estate loans and related other real estate owned (“OREO”), funding, capital management, interest rate risk management, the net effect of transfer pricing related to average balances and the residual aggregate of those expenses associated with corporate activities that are managed on a consolidated basis.
Segment Results Accounting policies for the lines of business are the same as those used in preparation of the consolidated financial statements with respect to activities specifically attributable to each business line. However, the preparation of business line results requires management to allocate funding costs and benefits, expenses and other financial elements to each line of business. For details of these methodologies and segment results, see “Basis for Financial Presentation” and Table 24 “Line of Business Financial Performance” included in Management’s Discussion and Analysis which is incorporated by reference into these Notes to Consolidated Financial Statements.
Securities
Realized gains or losses on securities are determined on a trade date basis based on the specific amortized cost of the investments sold.
Trading Securities Debt and equity securities held for resale are classified as trading securities and are included in other assets and reported at fair value. Changes in fair value and realized gains or losses are reported in noninterest income.
Available-for-sale Securities These securities are not trading securities but may be sold before maturity in response to changes in the Company’s interest rate risk profile, funding
| 80 | U.S. BANCORP |
needs, demand for collateralized deposits by public entities or other reasons. Available-for-sale securities are carried at fair value with unrealized net gains or losses reported within other comprehensive income (loss) in shareholders’ equity. Declines in fair value related to other-than-temporary impairment, if any, are reported in noninterest income.
Held-to-maturity Securities Debt securities for which the Company has the positive intent and ability to hold to maturity are reported at historical cost adjusted for amortization of premiums and accretion of discounts. Declines in fair value related to other-than-temporary impairment, if any, are reported in noninterest income.
Securities Purchased Under Agreements to Resell and Securities Sold Under Agreements to Repurchase Securities purchased under agreements to resell and securities sold under agreements to repurchase are accounted for as collateralized financing transactions and are recorded at the amounts at which the securities were acquired or sold, plus accrued interest. The fair value of collateral received is continually monitored and additional collateral is obtained or requested to be returned to the Company as deemed appropriate.
Equity Investments in Operating Entities
Equity investments in public entities in which the Company’s ownership is less than 20 percent are accounted for as available-for-sale securities and are carried at fair value. Similar investments in private entities are accounted for using the cost method. Investments in entities where the Company has a significant influence (generally between 20 percent and 50 percent ownership) but does not control the entity are accounted for using the equity method. Investments in limited partnerships and limited liability companies where the Company’s ownership interest is greater than 5 percent are accounted for using the equity method. All equity investments are evaluated for impairment at least annually and more frequently if certain criteria are met.
Loans
The Company offers a broad array of lending products and categorizes its loan portfolio into three segments, which is the level at which it develops and documents a systematic methodology to determine the allowance for credit losses. The Company’s three loan portfolio segments are commercial lending, consumer lending and covered loans. The Company further disaggregates its loan portfolio segments into various classes based on their underlying risk characteristics. The two classes within the commercial lending segment are commercial loans and commercial real estate loans. The three classes within consumer lending are residential mortgages, credit card loans and other retail loans. The covered loan segment consists of only one class.
The Company’s accounting methods for loans differ depending on whether the loans are originated or purchased, and for purchased loans, whether the loans were acquired at a discount related to evidence of credit deterioration since date of origination.
Originated Loans Held for Investment Loans the Company originates as held for investment are reported at the principal amount outstanding, net of unearned income, net deferred loan fees or costs, and any direct principal charge-offs. Interest income is accrued on the unpaid principal balances as earned. Loan and commitment fees and certain direct loan origination costs are deferred and recognized over the life of the loan and/or commitment period as yield adjustments.
Purchased Loans All purchased loans (non-impaired and impaired) acquired after January 1, 2009 are initially measured at fair value as of the acquisition date in accordance with applicable authoritative accounting guidance. Credit discounts are included in the determination of fair value. An allowance for credit losses is not recorded at the acquisition date for loans purchased after January 1, 2009. In accordance with applicable authoritative accounting guidance, purchased non-impaired loans acquired in a business combination prior to January 1, 2009 were generally recorded at the predecessor’s carrying value including an allowance for credit losses.
In determining the acquisition date fair value of purchased impaired loans, and in subsequent accounting, the Company generally aggregates purchased consumer loans and certain smaller balance commercial loans into pools of loans with common risk characteristics, while accounting for larger balance commercial loans individually. Expected cash flows at the purchase date in excess of the fair value of loans are recorded as interest income over the life of the loans if the timing and amount of the future cash flows is reasonably estimable. Subsequent to the purchase date, increases in cash flows over those expected at the purchase date are recognized as interest income prospectively. The present value of any decreases in expected cash flows, other than from decreases in variable interest rates, after the purchase date is recognized by recording an allowance for credit losses. Revolving loans, including lines of credit and credit cards loans, and leases are excluded from purchased impaired loans accounting.
For purchased loans acquired after January 1, 2009 that are not deemed impaired at acquisition, credit discounts representing the principal losses expected over the life of the loan are a component of the initial fair value. Subsequent to the purchase date, the methods utilized to estimate the required allowance for credit losses for these loans is similar to originated loans; however, the Company records a provision for credit losses only when the required allowance exceeds any remaining credit discounts. The remaining differences between the purchase price and the unpaid
| U.S. BANCORP | 81 |
principal balance at the date of acquisition are recorded in interest income over the life of the loans.
Covered Assets Loans covered under loss sharing or similar credit protection agreements with the Federal Deposit Insurance Corporation (“FDIC”) are reported in loans along with the related indemnification asset. Foreclosed real estate covered under similar agreements is recorded in other assets. In accordance with applicable authoritative accounting guidance effective for the Company beginning January 1, 2009, all purchased loans and related indemnification assets are recorded at fair value at date of purchase.
In October 2012, the Financial Accounting Standards Board issued accounting guidance, which the Company will adopt January 1, 2013, applicable to indemnification assets related to FDIC loss-sharing agreements. The guidance requires any reduction in expected cash flows from the FDIC resulting from increases in expected cash flows of the covered assets (when there are no previous valuation allowances to reverse) to be amortized over the shorter of the remaining contractual term of the indemnification agreements or the remaining life of the covered assets. Prior to the 2013 adoption of this guidance, the Company has amortized decreases in expected cash flows from the FDIC over the expected life of the covered assets. The Company does not expect adopting this guidance will materially affect its financial statements.
Commitments to Extend Credit Unfunded commitments for residential mortgage loans intended to be held for sale are considered derivatives and recorded on the balance sheet at fair value with changes in fair value recorded in income. All other unfunded loan commitments are not considered derivatives. For loans purchased after January 1, 2009, the fair value of the unfunded credit commitments is considered in the determination of the fair value of the loans recorded at the date of acquisition. Reserves for credit exposure on all other unfunded credit commitments are recorded in other liabilities.
Allowance for Credit Losses The allowance for credit losses reserves for probable and estimable losses incurred in the Company’s loan and lease portfolio and includes certain amounts that do not represent loss exposure to the Company because those losses are recoverable under loss sharing agreements with the FDIC. The allowance for credit losses is increased through provisions charged to operating earnings and reduced by net charge-offs. Management evaluates the allowance each quarter to ensure it appropriately reserves for incurred losses.
The allowance recorded for loans in the commercial lending segment is based on reviews of individual credit relationships and considers the migration analysis of commercial lending segment loans and actual loss experience. The Company currently uses a 12-year period of historical losses in considering actual loss experience, because it believes that period best reflects the losses incurred in the portfolio. This timeframe and the results of the analysis are evaluated quarterly to determine if they are appropriate. The allowance recorded for impaired loans greater than $5 million in the commercial lending segment is based on an individual loan analysis utilizing expected cash flows discounted using the original effective interest rate, the observable market price, or the fair value of the collateral for collateral-dependent loans. The allowance recorded for all other commercial lending segment loans is determined on a homogenous pool basis and includes consideration of product mix, risk characteristics of the portfolio, bankruptcy experience, and historical losses, adjusted for current trends. The Company also considers the impacts of any loan modifications made to commercial lending segment loans and any subsequent payment defaults to its expectations of cash flows, principal balance, and current expectations about the borrower’s ability to pay in determining the allowance for credit losses.
The allowance recorded for purchased impaired and Troubled Debt Restructuring (“TDR”) loans in the consumer lending segment is determined on a homogenous pool basis utilizing expected cash flows discounted using the original effective interest rate of the pool. The allowance for collateral-dependent loans in the consumer lending segment is determined based on the fair value of the collateral. The allowance recorded for all other consumer lending segment loans is determined on a homogenous pool basis and includes consideration of product mix, risk characteristics of the portfolio, bankruptcy experience, delinquency status, refreshed loan-to-value ratios when possible, portfolio growth and historical losses, adjusted for current trends. The Company also considers any modifications made to consumer lending segment loans including the impacts of any subsequent payment defaults since modification in determining the allowance for credit losses, such as the borrower’s ability to pay under the restructured terms, and the timing and amount of payments.
The allowance for the covered loan segment is evaluated each quarter in a manner similar to that described for non-covered loans and represents any decreases in expected cash flows of those loans after the acquisition date. The provision for credit losses for covered loans considers the indemnification provided by the FDIC.
In addition, subsequent payment defaults on loan modifications considered TDRs are considered in the underlying factors used in the determination of the appropriateness of the allowance for credit losses. For each loan segment, the Company estimates future loan charge-offs through a variety of analysis, trends and underlying assumptions. With respect to the commercial lending segment, TDRs may be collectively evaluated for impairment where
| 82 | U.S. BANCORP |
observed performance history, including defaults, is a primary driver of the loss allocation. For commercial TDRs individually evaluated for impairment, attributes of the borrower are the primary factors in determining the allowance for credit losses. However, incorporation of loss history is factored into the allowance methodology applied to this category of loans. With respect to the consumer lending segment, performance of the portfolio, including defaults on TDRs, is considered when estimating future cash flows.
The Company’s methodology for determining the appropriate allowance for credit losses for all the loan segments also considers the imprecision inherent in the methodologies used. As a result, in addition to the amounts determined under the methodologies described above, management also considers the potential impact of other qualitative factors which include, but are not limited to, economic factors; geographic and other concentration risks; delinquency and nonaccrual trends; current business conditions; changes in lending policy, underwriting standards, internal review and other relevant business practices; and the regulatory environment. The consideration of these items results in adjustments to allowance amounts included in the Company’s allowance for credit losses for each of the above loan segments.
The Company also assesses the credit risk associated with off-balance sheet loan commitments, letters of credit, and derivatives. Credit risk associated with derivatives is reflected in the fair values recorded for those positions. The liability for off-balance sheet credit exposure related to loan commitments and other credit guarantees is included in other liabilities. Because business processes and credit risks associated with unfunded credit commitments are essentially the same as for loans, the Company utilizes similar processes to estimate its liability for unfunded credit commitments.
Credit Quality The quality of the Company’s loan portfolios is assessed as a function of net credit losses, levels of nonperforming assets and delinquencies, and credit quality ratings as defined by the Company.
For all loan classes, loans are considered past due based on the number of days delinquent except for monthly amortizing loans which are classified delinquent based upon the number of contractually required payments not made (for example, two missed payments is considered 30 days delinquent).
Commercial lending segment loans are generally placed on nonaccrual status when the collection of principal and interest has become 90 days past due or is otherwise considered doubtful. When a loan is placed on nonaccrual status, unpaid accrued interest is reversed. Commercial lending segment loans are generally fully or partially charged down to the fair value of the collateral securing the loan, less costs to sell, when the loan is considered uncollectible.
Consumer lending segment loans are generally charged-off at a specific number of days or payments past due. Residential mortgages and other retail loans secured by 1-4 family properties are generally charged down to the fair value of the collateral securing the loan, less costs to sell, at 180 days past due, and placed on nonaccrual status in instances where a partial charge-off occurs unless the loan is well secured and in the process of collection. Loans and lines in a junior lien position secured by 1-4 family properties are placed on nonaccrual status at 120 days past due or when behind a first lien that has become 180 days or greater past due or placed on nonaccrual status. Any secured consumer lending segment loan whose borrower has had debt discharged through bankruptcy, for which the loan amount exceeds the fair value of the collateral, is charged down to the fair value of the related collateral and the remaining balance is placed on nonaccrual status. Credit card loans continue to accrue interest until the account is charged off. Credit cards are charged off at 180 days past due. Other retail loans not secured by 1-4 family properties are charged-off at 120 days past due; and revolving consumer lines are charged off at 180 days past due. Similar to credit cards, other retail loans are generally not placed on nonaccrual status because of the relative short period of time to charge-off. Certain retail customers having financial difficulties may have the terms of their credit card and other loan agreements modified to require only principal payments and, as such, are reported as nonaccrual.
For all loan classes, interest payments received on nonaccrual loans are generally recorded as a reduction to the loan carrying amount. Interest payments are generally recorded as reductions to a loan’s carrying amount while a loan is on nonaccrual and are recognized as interest income upon payoff of the loan. Interest income may be recognized for interest payments if the remaining carrying amount of the loan is believed to be collectible. In certain circumstances, loans in any class may be restored to accrual status, such as when a loan has demonstrated sustained repayment performance or no amounts are past due and prospects for future payment are no longer in doubt; or the loan becomes well secured and is in the process of collection. Loans where there has been a partial charge-off may be returned to accrual status if all principal and interest (including amounts previously charged-off) is expected to be collected and the loan is current.
Covered loans not considered to be purchased impaired are evaluated for delinquency, nonaccrual status and charge-off consistent with the class of loan they would be included in had the loss share coverage not been in place. Generally, purchased impaired loans are considered accruing loans. However, the timing and amount of future cash flows for some loans is not reasonably estimable. Those loans are classified as nonaccrual loans and interest income is not recognized until the timing and amount of the future cash flows can be reasonably estimated.
| U.S. BANCORP | 83 |
The Company classifies its loan portfolios using internal credit quality ratings on a quarterly basis. These ratings include: pass, special mention and classified, and are an important part of the Company’s overall credit risk management process and evaluation of the allowance for credit losses. Loans with a pass rating represent those not classified on the Company’s rating scale for problem credits, as minimal credit risk has been identified. Special mention loans are those that have a potential weakness deserving management’s close attention. Classified loans are those where a well-defined weakness has been identified that may put full collection of contractual cash flows at risk. It is possible that others, given the same information, may reach different reasonable conclusions regarding the credit quality rating classification of specific loans.
Troubled Debt Restructurings In certain circumstances, the Company may modify the terms of a loan to maximize the collection of amounts due when a borrower is experiencing financial difficulties or is expected to experience difficulties in the near-term. Concessionary modifications are classified as TDRs unless the modification results in only an insignificant delay in payments to be received. The Company recognizes interest on TDRs if the borrower complies with the revised terms and conditions as agreed upon with the Company and has demonstrated repayment performance at a level commensurate with the modified terms over several payment cycles. To the extent a previous restructuring was insignificant, the Company considers the cumulative effect of past restructurings related to the receivable when determining whether a current restructuring is a TDR. Loans classified as TDRs are considered impaired loans for reporting and measurement purposes.
Many of the Company’s TDRs are determined on a case-by-case basis in connection with ongoing loan collection processes. However, the Company has also implemented certain restructuring programs that may result in TDRs.
For the commercial lending segment, modifications generally result in the Company working with borrowers on a case-by-case basis. Commercial and commercial real estate modifications generally include extensions of the maturity date and may be accompanied by an increase or decrease to the interest rate, which may not be deemed a market rate of interest. In addition, the Company may work with the borrower in identifying other changes that mitigate loss to the Company, which may include additional collateral or guarantees to support the loan. To a lesser extent, the Company may waive contractual principal. The Company classifies these concessions as TDRs to the extent the Company determines that the borrower is experiencing financial difficulty.
Modifications for the consumer lending segment are generally part of programs the Company has initiated. The Company participates in the U.S. Department of Treasury Home Affordable Modification Program (“HAMP”). HAMP gives qualifying homeowners an opportunity to permanently modify residential mortgage loans and achieve more affordable monthly payments, with the U.S. Department of Treasury compensating the Company for a portion of the reduction in monthly amounts due from borrowers participating in this program. The Company also modifies residential mortgage loans under Federal Housing Administration, Department of Veterans Affairs, or other internal programs. Under these programs, the Company provides concessions to qualifying borrowers experiencing financial difficulties. The concessions may include adjustments to interest rates, conversion of adjustable rates to fixed rates, extension of maturity dates or deferrals of payments, capitalization of accrued interest and/or outstanding advances, or in limited situations, partial forgiveness of loan principal. In most instances, participation in residential mortgage loan restructuring programs requires the customer to complete a short-term trial period. A permanent loan modification is contingent on the customer successfully completing the trial period arrangement and the loan documents are not modified until that time. The Company reports loans in a trial period arrangement as TDRs.
Credit card and other retail loan modifications are generally part of two distinct restructuring programs. The Company offers workout programs providing customers experiencing financial difficulty with modifications whereby balances may be amortized up to 60 months, and generally include waiver of fees and reduced interest rates. The Company also provides modification programs to qualifying customers experiencing a temporary financial hardship in which reductions are made to monthly required minimum payments for up to 12 months. Balances related to these programs are generally frozen, however, accounts may be reopened upon successful exit of the program, in which account privileges may be restored.
In addition, the Company considers secured loans to consumer borrowers that have debt discharged through bankruptcy where the borrower has not reaffirmed the debt to be TDRs.
Modifications to loans in the covered segment are similar in nature to that described above for non-covered loans, and the evaluation and determination of TDR status is similar, except that acquired loans restructured after acquisition are not considered TDRs for purposes of the Company’s accounting and disclosure if the loans evidenced credit deterioration as of the acquisition date and are accounted for in pools. Losses associated with the modification on covered loans, including the economic impact of interest rate reductions, are generally eligible for reimbursement under loss sharing agreements with the FDIC.
Impaired Loans For all loan classes, a loan is considered to be impaired when, based on current events or information, it is probable the Company will be unable to collect all amounts
| 84 | U.S. BANCORP |
due per the contractual terms of the loan agreement. Impaired loans include all nonaccrual and TDR loans. For all loan classes, interest income on TDR loans is recognized under the modified terms and conditions if the borrower has demonstrated repayment performance at a level commensurate with the modified terms over several payment cycles. Interest income is generally not recognized on other impaired loans until the loan is paid off. However, interest income may be recognized for interest payments if the remaining carrying amount of the loan is believed to be collectible.
Factors used by the Company in determining whether all principal and interest payments due on commercial and commercial real estate loans will be collected and therefore whether those loans are impaired include, but are not limited to, the financial condition of the borrower, collateral and/or guarantees on the loan, and the borrower’s estimated future ability to pay based on industry, geographic location and certain financial ratios. The evaluation of impairment on residential mortgages, credit card and other retail loans is primarily driven by delinquency status of individual loans or whether a loan has been modified. Individual covered loans, whose future losses are covered by loss sharing agreements with the FDIC that substantially reduce the risk of credit losses to the Company, are evaluated for impairment and accounted for in a manner consistent with the class of loan they would have been included in had the loss sharing coverage not been in place.
Leases The Company’s lease portfolio consists of both direct financing and leveraged leases. The net investment in direct financing leases is the sum of all minimum lease payments and estimated residual values, less unearned income. Unearned income is recorded in interest income over the terms of the leases to produce a level yield.
The investment in leveraged leases is the sum of all lease payments, less nonrecourse debt payments, plus estimated residual values, less unearned income. Income from leveraged leases is recognized over the term of the leases based on the unrecovered equity investment.
Residual values on leased assets are reviewed regularly for other-than-temporary impairment. Residual valuations for retail automobile leases are based on independent assessments of expected used car sale prices at the end-of-term. Impairment tests are conducted based on these valuations considering the probability of the lessee returning the asset to the Company, re-marketing efforts, insurance coverage and ancillary fees and costs. Valuations for commercial leases are based upon external or internal management appraisals. When there is impairment of the Company’s interest in the residual value of a leased asset, the carrying value is reduced to the estimated fair value with the writedown recognized in the current period.
Other Real Estate OREO is included in other assets, and is property acquired through foreclosure or other proceedings on defaulted loans. OREO includes properties vacated by the borrower and maintained by the Company, regardless of whether title in the property has transferred to the Company. OREO is initially recorded at fair value, less estimated selling costs. OREO is evaluated regularly and any decreases in value along with holding costs, such as taxes and insurance, are reported in noninterest expense.
Loans Held for Sale
Loans held for sale (“LHFS”) represent mortgage loan originations intended to be sold in the secondary market and other loans that management has an active plan to sell. LHFS are carried at the lower-of-cost-or-fair value as determined on an aggregate basis by type of loan with the exception of loans for which the Company has elected fair value accounting, which are carried at fair value. The credit component of any writedowns upon the transfer of loans to LHFS is reflected in loan charge-offs.
Where an election is made to carry the LHFS at fair value, any further decreases or subsequent increases in fair value are recognized in noninterest income. Where an election is made to carry LHFS at lower-of-cost-or-fair value, any further decreases are recognized in noninterest income and increases in fair value are not recognized until the loans are sold. Fair value elections are made at the time of origination or purchase based on the Company’s fair value election policy.
Derivative Financial Instruments
In the ordinary course of business, the Company enters into derivative transactions to manage its interest rate, prepayment, credit, price and foreign currency risk and to accommodate the business requirements of its customers. Derivative instruments are reported in other assets or other liabilities at fair value. Changes in a derivative’s fair value are recognized currently in earnings unless specific hedge accounting criteria are met.
All derivative instruments that qualify and are designated for hedge accounting are recorded at fair value and classified either as a hedge of the fair value of a recognized asset or liability (“fair value hedge”), a hedge of the variability of cash flows to be received or paid related to a recognized asset or liability or a forecasted transaction (“cash flow hedge”), or a hedge of the volatility of an investment in foreign operations driven by changes in foreign currency exchange rates (“net investment hedge”). Changes in the fair value of a derivative that is highly effective and designated as a fair value hedge, and the offsetting changes in the fair value of the hedged item, are recorded in earnings. Effective changes in the fair value of
| U.S. BANCORP | 85 |
a derivative designated as a cash flow hedge are recorded in other comprehensive income (loss) until cash flows of the hedged item are realized. Any change in fair value resulting from hedge ineffectiveness is immediately recorded in noninterest income. Effective changes in the fair value of net investment hedges are recorded in other comprehensive income (loss). The Company performs an assessment, both at the inception of a hedge and, at a minimum, on a quarterly basis thereafter, to determine whether derivatives designated as hedging instruments are highly effective in offsetting changes in the value of the hedged items.
If a derivative designated as a cash flow hedge is terminated or ceases to be highly effective, the gain or loss in other comprehensive income (loss) is amortized to earnings over the period the forecasted hedged transactions impact earnings. If a hedged forecasted transaction is no longer probable, hedge accounting is ceased and any gain or loss included in other comprehensive income (loss) is reported in earnings immediately, unless the forecasted transaction is at least reasonably possible of occuring, whereby the amounts within other comprehensive income (loss) remain.
Revenue Recognition
The Company recognizes revenue as it is earned based on contractual terms, as transactions occur, or as services are provided and collectability is reasonably assured. In certain circumstances, noninterest income is reported net of associated expenses that are directly related to variable volume-based sales or revenue sharing arrangements or when the Company acts on an agency basis for others. Certain specific policies include the following:
Credit and Debit Card Revenue and Corporate Payment Products Revenue Credit and debit card revenue includes interchange income from consumer credit and debit cards, annual fees, and other transaction and account management fees. Corporate payment products revenue primarily includes interchange income from corporate and purchasing card transactions processed through card association networks and merchant discount income from closed loop network transactions. Interchange income is a fee paid by a merchant bank to the card-issuing bank through the interchange network. Interchange fees are set by the credit card associations and are based on cardholder purchase volumes. Merchant discount income is a fee paid by a merchant to the Company through the closed loop network. Merchant discount fees are set by the Company directly with the merchant. The Company records interchange and merchant discount income as transactions occur. Transaction and account management fees are recognized as transactions occur or services are provided, except for annual fees, which are recognized over the applicable period. Volume-related payments to partners and credit card associations and expenses for rewards programs are also recorded within credit and debit card revenue and corporate payment products revenue. Payments to partners and expenses related to rewards programs are recorded when earned by the partner or customer.
Merchant Processing Services Merchant processing services revenue consists principally of transaction and account management fees charged to merchants for the electronic processing of transactions, net of interchange fees paid to the card-issuing bank, card association assessments, and revenue sharing amounts, and is recognized at the time the merchant’s transactions are processed or other services are performed. The Company may enter into revenue sharing agreements with referral partners or in connection with purchases of merchant contracts from sellers. The revenue sharing amounts are determined primarily on sales volume processed or revenue generated for a particular group of merchants. Merchant processing revenue also includes revenues related to point-of-sale equipment recorded as sales when the equipment is shipped or as earned for equipment rentals.
Trust and Investment Management Fees Trust and investment management fees are recognized over the period in which services are performed and are based on a percentage of the fair value of the assets under management or administration, fixed based on account type, or transaction-based fees.
Commercial Products Revenue Commercial products revenue primarily includes revenue related to ancillary services provided to Wholesale Banking and Commercial Real Estate customers including standby letter of credit fees, non-yield related loan fees, capital markets related revenue and non-yield related leasing revenue. These fees are recognized as earned or as transactions occur and services are provided.
Mortgage Banking Revenue Mortgage banking revenue includes revenue derived from mortgages originated and subsequently sold, generally with servicing retained. The primary components include: gains and losses on mortgage sales; servicing revenue, including losses related to the repurchase of previously sold loans; changes in fair value for mortgage loans originated with the intent to sell and measured at fair value under the fair value option; changes in the fair value of mortgage servicing rights (“MSRs”); and the impact of risk management activities associated with the mortgage origination pipeline, funded loans and MSRs. Net interest income from mortgage loans is recorded in interest income. Refer to Other Significant Policies in Note 1, as well as Note 9 and Note 20 for a further discussion of MSRs.
Deposit Service Charges Service charges on deposit accounts are primarily monthly fees based on minimum balances or transaction-based fees. These fees are recognized as earned or as transactions occur and services are provided.
| 86 | U.S. BANCORP |
Other Significant Policies
Intangible Assets The price paid over the net fair value of acquired businesses (“goodwill”) is not amortized. Other intangible assets are amortized over their estimated useful lives, using straight-line and accelerated methods. The recoverability of goodwill and other intangible assets is evaluated annually, at a minimum, or on an interim basis if events or circumstances indicate a possible inability to realize the carrying amount. The evaluation includes assessing the estimated fair value of the intangible asset based on market prices for similar assets, where available, and the present value of the estimated future cash flows associated with the intangible asset.
Income Taxes Deferred taxes are recorded to reflect the tax consequences on future years of differences between the tax basis of assets and liabilities and their financial reporting carrying amounts.
Mortgage Servicing Rights MSRs are capitalized as separate assets when loans are sold and servicing is retained or if they are purchased from others. MSRs are recorded at fair value. The Company determines the fair value by estimating the present value of the asset’s future cash flows utilizing market-based prepayment rates, discount rates, and other assumptions validated through comparison to trade information, industry surveys and independent third party valuations. Changes in the fair value of MSRs are recorded in earnings during the period in which they occur.
Pensions For purposes of its pension plans, the Company utilizes its fiscal year-end as the measurement date. At the measurement date, plan assets are determined based on fair value, generally representing observable market prices or the net asset value provided by the plans’ administrator. The actuarial cost method used to compute the pension liabilities and related expense is the projected unit credit method. The projected benefit obligation is principally determined based on the present value of projected benefit distributions at an assumed discount rate. The discount rate utilized is based on the investment yield of high quality corporate bonds available in the marketplace with maturities equal to projected cash flows of future benefit payments as of the measurement date. Periodic pension expense (or income) includes service costs, interest costs based on the assumed discount rate, the expected return on plan assets based on an actuarially derived market-related value and amortization of actuarial gains and losses. Pension accounting reflects the long-term nature of benefit obligations and the investment horizon of plan assets, and can have the effect of reducing earnings volatility related to short-term changes in interest rates and market valuations. Actuarial gains and losses include the impact of plan amendments and various unrecognized gains and losses which are deferred and amortized over the future service periods of active employees. The market-related value utilized to determine the expected return on plan assets is based on fair value adjusted for the difference between expected returns and actual performance of plan assets. The unrealized difference between actual experience and expected returns is included in expense over a period of approximately twelve years. The overfunded or underfunded status of the plans is recorded as an asset or liability on the Consolidated Balance Sheet, with changes in that status recognized through other comprehensive income (loss).
Premises and Equipment Premises and equipment are stated at cost less accumulated depreciation and depreciated primarily on a straight-line basis over the estimated life of the assets. Estimated useful lives range up to 40 years for newly constructed buildings and from 3 to 20 years for furniture and equipment.
Capitalized leases, less accumulated amortization, are included in premises and equipment. Capitalized lease obligations are included in long-term debt. Capitalized leases are amortized on a straight-line basis over the lease term and the amortization is included in depreciation expense.
Stock-Based Compensation The Company grants stock-based awards, including restricted stock, restricted stock units and options to purchase common stock of the Company. Stock option grants are for a fixed number of shares to employees and directors with an exercise price equal to the fair value of the shares at the date of grant. Restricted stock and restricted stock unit grants are awarded at no cost to the recipient. Stock-based compensation for awards is recognized in the Company’s results of operations on a straight-line basis over the vesting period. The Company immediately recognizes compensation cost of awards to employees that meet retirement status, despite their continued active employment. The amortization of stock-based compensation reflects estimated forfeitures adjusted for actual forfeiture experience. As compensation expense is recognized, a deferred tax asset is recorded that represents an estimate of the future tax deduction from exercise or release of restrictions. At the time stock-based awards are exercised, cancelled, expire, or restrictions are released, the Company may be required to recognize an adjustment to tax expense, depending on the market price of the Company’s common stock at that time.
Per Share Calculations Earnings per common share is calculated by dividing net income applicable to U.S. Bancorp common shareholders by the weighted average number of common shares outstanding. Diluted earnings per common share is calculated by adjusting income and outstanding shares, assuming conversion of all potentially dilutive securities.
| U.S. BANCORP | 87 |
| NOTE 2 | Business Combinations and Divestitures |
In January 2012, the Company acquired the banking operations of BankEast, a subsidiary of BankEast Corporation, from the FDIC. This transaction did not include a loss sharing agreement. The Company acquired approximately $261 million of assets and assumed approximately $252 million of deposits from the FDIC with this transaction.
In November 2012, the Company acquired the hedge fund administration servicing business of Alternative Investment Solutions, LLC. The Company recorded approximately $108 million of assets, including intangibles, and approximately $3 million of liabilities with this transaction.
In December 2012, the Company acquired FSV Payment Systems, Inc., a prepaid card program manager with a proprietary processing platform. The Company recorded approximately $243 million of assets, including intangibles, and approximately $28 million of liabilities with this transaction.
During 2011, the Company acquired the banking operations of First Community Bank of New Mexico (“FCB”) from the FDIC. The FCB transaction did not include a loss sharing agreement. The Company acquired 38 branch locations and approximately $1.8 billion in assets, assumed approximately $2.1 billion in liabilities, and received approximately $412 million in cash from the FDIC. In addition, the Company recognized a $46 million gain on this transaction during 2011.
| NOTE 3 | Restrictions on Cash and Due from Banks |
The Federal Reserve Bank requires bank subsidiaries to maintain minimum average reserve balances, either in the form of cash or reserve balances held with the Federal Reserve Bank. The amount of those required reserve balances was approximately $1.7 billion at December 31, 2012 and 2011. At December 31, 2012 and 2011, the Company held $.9 billion and $8.5 billion, respectively, of balances at the Federal Reserve Bank. These balances are included in cash and due from banks on the Consolidated Balance Sheet.
| 88 | U.S. BANCORP |
| NOTE 4 | Investment Securities |
The amortized cost, other-than-temporary impairment recorded in other comprehensive income (loss), gross unrealized holding gains and losses, and fair value of held-to-maturity and available-for-sale investment securities at December 31 were as follows:
| 2012 | 2011 | |||||||||||||||||||||||||||||||||||||||||
| Unrealized Losses | Unrealized Losses | |||||||||||||||||||||||||||||||||||||||||
| (Dollars in Millions) | Amortized Cost |
Unrealized Gains |
Other-than- Temporary (e) |
Other (f) | Fair Value | Amortized Cost |
Unrealized Gains |
Other-than- Temporary (e) |
Other (f) | Fair Value | ||||||||||||||||||||||||||||||||
| Held-to-maturity (a) |
||||||||||||||||||||||||||||||||||||||||||
| U.S. Treasury and agencies |
$ | 3,154 | $ | 27 | $ | – | $ | – | $ | 3,181 | $ | 2,560 | $ | 35 | $ | – | $ | – | $ | 2,595 | ||||||||||||||||||||||
| Mortgage-backed securities |
||||||||||||||||||||||||||||||||||||||||||
| Residential |
||||||||||||||||||||||||||||||||||||||||||
| Agency |
31,064 | 545 | – | (6 | ) | 31,603 | 16,085 | 333 | – | (3 | ) | 16,415 | ||||||||||||||||||||||||||||||
| Non-agency non-prime (d) |
1 | – | – | – | 1 | 2 | – | – | – | 2 | ||||||||||||||||||||||||||||||||
| Commercial non-agency |
2 | – | – | – | 2 | 4 | – | – | (2 | ) | 2 | |||||||||||||||||||||||||||||||
| Asset-backed securities |
||||||||||||||||||||||||||||||||||||||||||
| Collateralized debt obligations/Collateralized loan obligations |
7 | 15 | – | – | 22 | 52 | 13 | – | (2 | ) | 63 | |||||||||||||||||||||||||||||||
| Other |
19 | 2 | (3 | ) | (1 | ) | 17 | 23 | 1 | (6 | ) | (1 | ) | 17 | ||||||||||||||||||||||||||||
| Obligations of state and political subdivisions |
20 | 1 | – | – | 21 | 23 | 1 | – | (1 | ) | 23 | |||||||||||||||||||||||||||||||
| Obligations of foreign governments |
7 | – | – | – | 7 | 7 | – | – | – | 7 | ||||||||||||||||||||||||||||||||
| Other debt securities |
115 | – | – | (17 | ) | 98 | 121 | – | – | (29 | ) | 92 | ||||||||||||||||||||||||||||||
| Total held-to-maturity |
$ | 34,389 | $ | 590 | $ | (3 | ) | $ | (24 | ) | $ | 34,952 | $ | 18,877 | $ | 383 | $ | (6 | ) | $ | (38 | ) | $ | 19,216 | ||||||||||||||||||
| Available-for-sale (b) |
||||||||||||||||||||||||||||||||||||||||||
| U.S. Treasury and agencies |
$ | 1,211 | $ | 16 | $ | – | $ | (1 | ) | $ | 1,226 | $ | 1,045 | $ | 13 | $ | – | $ | (1 | ) | $ | 1,057 | ||||||||||||||||||||
| Mortgage-backed securities |
||||||||||||||||||||||||||||||||||||||||||
| Residential |
||||||||||||||||||||||||||||||||||||||||||
| Agency |
28,754 | 746 | – | (5 | ) | 29,495 | 39,337 | 981 | – | (4 | ) | 40,314 | ||||||||||||||||||||||||||||||
| Non-agency |
||||||||||||||||||||||||||||||||||||||||||
| Prime (c) |
641 | 3 | (16 | ) | (4 | ) | 624 | 911 | 5 | (63 | ) | (50 | ) | 803 | ||||||||||||||||||||||||||||
| Non-prime (d) |
372 | 4 | (20 | ) | (1 | ) | 355 | 1,047 | 9 | (247 | ) | (7 | ) | 802 | ||||||||||||||||||||||||||||
| Commercial |
||||||||||||||||||||||||||||||||||||||||||
| Agency |
185 | 8 | – | – | 193 | 133 | 7 | – | – | 140 | ||||||||||||||||||||||||||||||||
| Non-agency |
– | – | – | – | – | 42 | 2 | – | (2 | ) | 42 | |||||||||||||||||||||||||||||||
| Asset-backed securities |
||||||||||||||||||||||||||||||||||||||||||
| Collateralized debt obligations/Collateralized loan obligations |
32 | 10 | – | – | 42 | 180 | 31 | (3 | ) | (2 | ) | 206 | ||||||||||||||||||||||||||||||
| Other |
579 | 14 | – | (1 | ) | 592 | 694 | 16 | (5 | ) | (24 | ) | 681 | |||||||||||||||||||||||||||||
| Obligations of state and political subdivisions |
6,059 | 396 | – | – | 6,455 | 6,394 | 167 | – | (22 | ) | 6,539 | |||||||||||||||||||||||||||||||
| Obligations of foreign governments |
6 | – | – | – | 6 | 6 | – | – | – | 6 | ||||||||||||||||||||||||||||||||
| Corporate debt securities |
814 | 2 | – | (85 | ) | 731 | 1,000 | 1 | – | (174 | ) | 827 | ||||||||||||||||||||||||||||||
| Perpetual preferred securities |
205 | 27 | – | (14 | ) | 218 | 379 | 25 | – | (86 | ) | 318 | ||||||||||||||||||||||||||||||
| Other investments |
182 | 20 | – | – | 202 | 188 | 15 | – | (1 | ) | 202 | |||||||||||||||||||||||||||||||
| Total available-for-sale |
$ | 39,040 | $ | 1,246 | $ | (36 | ) | $ | (111 | ) | $ | 40,139 | $ | 51,356 | $ | 1,272 | $ | (318 | ) | $ | (373 | ) | $ | 51,937 | ||||||||||||||||||
| (a) | Held-to-maturity investment securities are carried at historical cost or at fair value at the time of transfer from the available-for-sale to held-to-maturity category, adjusted for amortization of premiums and accretion of discounts and credit-related other-than-temporary impairment. |
| (b) | Available-for-sale investment securities are carried at fair value with unrealized net gains or losses reported within accumulated other comprehensive income (loss) in shareholders’ equity. |
| (c) | Prime securities are those designated as such by the issuer at origination. When an issuer designation is unavailable, the Company determines at acquisition date the categorization based on asset pool characteristics (such as weighted-average credit score, loan-to-value, loan type, prevalence of low documentation loans) and deal performance (such as pool delinquencies and security market spreads). When the Company determines the designation, prime securities typically have a weighted average credit score of 725 or higher and a loan-to-value of 80 percent or lower; however, other pool characteristics may result in designations that deviate from these credit score and loan-to-value thresholds. |
| (d) | Includes all securities not meeting the conditions to be designated as prime. |
| (e) | Represents impairment not related to credit for those investment securities that have been determined to be other-than-temporarily impaired. |
| (f) | Represents unrealized losses on investment securities that have not been determined to be other-than-temporarily impaired. |
| U.S. BANCORP | 89 |
During 2012, the Company transferred $11.7 billion of available-for-sale agency mortgage-backed investment securities to the held-to-maturity category, reflecting the Company’s intent to hold those securities to maturity.
The weighted-average maturity of the available-for-sale investment securities was 4.1 years at December 31, 2012, compared with 5.2 years at December 31, 2011. The corresponding weighted-average yields were 2.93 percent and 3.19 percent, respectively. The weighted-average maturity of the held-to-maturity investment securities was 3.3 years at December 31, 2012, and 3.9 years at December 31, 2011. The corresponding weighted-average yields were 1.94 percent and 2.21 percent, respectively.
For amortized cost, fair value and yield by maturity date of held-to-maturity and available-for-sale investment securities outstanding at December 31, 2012, refer to Table 13 included in Management’s Discussion and Analysis which is incorporated by reference into these Notes to Consolidated Financial Statements.
Investment securities with a fair value of $20.1 billion at December 31, 2012, and $20.7 billion at December 31, 2011, were pledged to secure public, private and trust deposits, repurchase agreements and for other purposes required by contractual obligation or law. Included in these amounts were securities where the Company and certain counterparties have agreements granting the counterparties the right to sell or pledge the securities. Investment securities delivered under these types of arrangements had a fair value of $3.4 billion at December 31, 2012, and $7.0 billion at December 31, 2011.
The following table provides information about the amount of interest income from taxable and non-taxable investment securities:
| Year Ended December 31 (Dollars in Millions) | 2012 | 2011 | 2010 | |||||||||
| Taxable |
$ | 1,515 | $ | 1,517 | $ | 1,292 | ||||||
| Non-taxable |
277 | 303 | 309 | |||||||||
| Total interest income from investment securities |
$ | 1,792 | $ | 1,820 | $ | 1,601 | ||||||
The following table provides information about the amount of gross gains and losses realized through the sales of available-for-sale investment securities:
| Year Ended December 31 (Dollars in Millions) | 2012 | 2011 | 2010 | |||||||||
| Realized gains |
$ | 158 | $ | 11 | $ | 21 | ||||||
| Realized losses |
(99 | ) | (7 | ) | (8 | ) | ||||||
| Net realized gains (losses) |
$ | 59 | $ | 4 | $ | 13 | ||||||
| Income tax (benefit) on net realized gains (losses) |
$ | 23 | $ | 2 | $ | 5 | ||||||
In 2007, the Company purchased certain structured investment securities (“SIVs”) from certain money market funds managed by an affiliate of the Company. Subsequent to the initial purchase, the Company exchanged its interest in the SIVs for a pro-rata portion of the underlying investment securities according to the applicable restructuring agreements. The SIVs and the investment securities received are collectively referred to as “SIV-related securities”. During 2012, the Company sold essentially all of the SIV-related securities.
Some of the SIV-related securities evidenced credit deterioration at the time of acquisition by the Company. All investment securities with evidence of credit deterioration at acquisition have been subsequently sold by the Company as of December 31, 2012. Changes in the accretable balance for these investment securities were as follows:
| Year Ended December 31 (Dollars in Millions) | 2012 | 2011 | 2010 | |||||||||
| Balance at beginning of period |
$ | 100 | $ | 139 | $ | 292 | ||||||
| Additions (a) |
– | – | 66 | |||||||||
| Disposals |
(90 | ) | – | (219 | ) (b) | |||||||
| Accretion |
(11 | ) | (17 | ) | (29 | ) | ||||||
| Other (c) |
1 | (22 | ) | 29 | ||||||||
| Balance at end of period |
$ | – | $ | 100 | $ | 139 | ||||||
| (a) | Primarily resulted from the exchange of certain SIVs for the underlying investment securities. |
| (b) | Primarily resulted from the sale of securities covered under loss sharing agreements with the FDIC and the exchange of certain SIVs for the underlying investment securities. |
| (c) | Primarily represents changes in projected future cash flows related to variable rates on certain investment securities. |
The Company conducts a regular assessment of its investment securities with unrealized losses to determine whether investment securities are other-than-temporarily impaired considering, among other factors, the nature of the investment securities, credit ratings or financial condition of the issuer, the extent and duration of the unrealized loss, expected cash flows of underlying collateral, market conditions and whether the Company intends to sell or it is more likely than not the Company will be required to sell the investment securities.
| 90 | U.S. BANCORP |
The following table summarizes other-than-temporary impairment by investment category:
| 2012 | 2011 | 2010 | ||||||||||||||||||||||||||||||||||||||
| Year Ended December 31 (Dollars in Millions) | Losses Recorded in Earnings |
Other Gains (Losses) (c) |
Total | Losses Recorded in Earnings |
Other Gains (Losses) (c) |
Total | Losses Recorded in Earnings |
Other Gains (Losses) (c) |
Total | |||||||||||||||||||||||||||||||
| Held-to-maturity |
||||||||||||||||||||||||||||||||||||||||
| Other asset-backed securities |
$ | – | $ | – | $ | – | $ | – | $ | – | $ | – | $ | (2 | ) | $ | – | $ | (2 | ) | ||||||||||||||||||||
| Total held-to-maturity |
$ | – | $ | – | $ | – | $ | – | $ | – | $ | – | $ | (2 | ) | $ | – | $ | (2 | ) | ||||||||||||||||||||
| Available-for-sale |
||||||||||||||||||||||||||||||||||||||||
| Mortgage-backed securities |
||||||||||||||||||||||||||||||||||||||||
| Non-agency residential |
||||||||||||||||||||||||||||||||||||||||
| Prime (a) |
$ | (12 | ) | $ | (9 | ) | $ | (21 | ) | $ | (3 | ) | $ | (5 | ) | $ | (8 | ) | $ | (5 | ) | $ | (10 | ) | $ | (15 | ) | |||||||||||||
| Non-prime (b) |
(33 | ) | 21 | (12 | ) | (24 | ) | (23 | ) | (47 | ) | (63 | ) | (60 | ) | (123 | ) | |||||||||||||||||||||||
| Commercial non-agency |
(1 | ) | (1 | ) | (2 | ) | – | – | – | – | – | – | ||||||||||||||||||||||||||||
| Asset-backed securities |
||||||||||||||||||||||||||||||||||||||||
| Collateralized debt obligations/Collateralized loan obligations |
– | – | – | – | – | – | (6 | ) | (1 | ) | (7 | ) | ||||||||||||||||||||||||||||
| Other |
(1 | ) | 1 | – | (4 | ) | 3 | (1 | ) | (13 | ) | 4 | (9 | ) | ||||||||||||||||||||||||||
| Obligations of state and political subdivisions |
– | – | – | (4 | ) | – | (4 | ) | – | – | – | |||||||||||||||||||||||||||||
| Perpetual preferred securities |
(27 | ) | – | (27 | ) | – | – | – | (1 | ) | – | (1 | ) | |||||||||||||||||||||||||||
| Other debt securities |
– | – | – | – | – | – | (1 | ) | 1 | – | ||||||||||||||||||||||||||||||
| Total available-for-sale |
$ | (74 | ) | $ | 12 | $ | (62 | ) | $ | (35 | ) | $ | (25 | ) | $ | (60 | ) | $ | (89 | ) | $ | (66 | ) | $ | (155 | ) | ||||||||||||||
| (a) | Prime securities are those designated as such by the issuer at origination. When an issuer designation is unavailable, the Company determines at acquisition date the categorization based on asset pool characteristics (such as weighted-average credit score, loan-to-value, loan type, prevalence of low documentation loans) and deal performance (such as pool delinquencies and security market spreads). |
| (b) | Includes all securities not meeting the conditions to be designated as prime. |
| (c) | Losses represent the non-credit portion of other-than-temporary impairment recorded in other comprehensive income (loss) for investment securities determined to be other-than-temporarily impaired during the period. Gains represent recoveries in the fair value of securities that have or previously had non-credit other-than-temporary impairment. |
The Company determined the other-than-temporary impairment recorded in earnings for debt securities not intended to be sold by estimating the future cash flows of each individual investment security, using market information where available, and discounting the cash flows at the original effective rate of the investment security. Other-than-temporary impairment recorded in other comprehensive income (loss) was measured as the difference between that discounted amount and the fair value of each investment security. For perpetual preferred securities determined to be other-than-temporarily impaired, the Company recorded a loss in earnings for the entire difference between the securities’ fair value and their amortized cost.
The following table includes the ranges for principal assumptions used for those available-for-sale non-agency mortgage-backed securities determined to be other-than-temporarily impaired:
| Prime (a) | Non-Prime (b) | |||||||||||||||||||||||||
| Minimum | Maximum | Average | Minimum | Maximum | Average | |||||||||||||||||||||
| December 31, 2012 |
||||||||||||||||||||||||||
| Estimated lifetime prepayment rates |
6 | % | 22 | % | 14 | % | 3 | % | 10 | % | 6 | % | ||||||||||||||
| Lifetime probability of default rates |
3 | 6 | 4 | 3 | 10 | 7 | ||||||||||||||||||||
| Lifetime loss severity rates |
40 | 50 | 47 | 45 | 65 | 56 | ||||||||||||||||||||
| December 31, 2011 |
||||||||||||||||||||||||||
| Estimated lifetime prepayment rates |
4 | % | 15 | % | 14 | % | 2 | % | 11 | % | 6 | % | ||||||||||||||
| Lifetime probability of default rates |
2 | 9 | 3 | 1 | 20 | 5 | ||||||||||||||||||||
| Lifetime loss severity rates |
40 | 50 | 46 | 8 | 70 | 52 | ||||||||||||||||||||
| (a) | Prime securities are those designated as such by the issuer at origination. When an issuer designation is unavailable, the Company determines at acquisition date the categorization based on asset pool characteristics (such as weighted-average credit score, loan-to-value, loan type, prevalence of low documentation loans) and deal performance (such as pool delinquencies and security market spreads). |
| (b) | Includes all securities not meeting the conditions to be designated as prime. |
| U.S. BANCORP | 91 |
Changes in the credit losses on debt securities (excludes perpetual preferred securities) are summarized as follows:
| Year Ended December 31 (Dollars in Millions) | 2012 | 2011 | 2010 | |||||||||
| Balance at beginning of period |
$ | 298 | $ | 358 | $ | 335 | ||||||
| Additions to Credit Losses Due to Other-than-temporary Impairments |
||||||||||||
| Credit losses on securities not previously considered other-than-temporarily impaired |
6 | 7 | 18 | |||||||||
| Decreases in expected cash flows on securities for which other-than-temporary impairment was previously recognized |
41 | 28 | 72 | |||||||||
| Total other-than-temporary impairment on debt securities |
47 | 35 | 90 | |||||||||
| Other Changes in Credit Losses |
||||||||||||
| Increases in expected cash flows |
(15 | ) | (21 | ) | (26 | ) | ||||||
| Realized losses (a) |
(39 | ) | (73 | ) | (60 | ) | ||||||
| Credit losses on security sales and securities expected to be sold |
(157 | ) | (1 | ) | – | |||||||
| Other |
– | – | 19 | |||||||||
| Balance at end of period |
$ | 134 | $ | 298 | $ | 358 | ||||||
| (a) | Primarily represents principal losses allocated to mortgage and asset-backed securities in the Company’s portfolio under the terms of the securitization transaction documents. |
At December 31, 2012, certain investment securities had a fair value below amortized cost. The following table shows the gross unrealized losses and fair value of the Company’s investment securities with unrealized losses, aggregated by investment category and length of time the individual investment securities have been in continuous unrealized loss positions, at December 31, 2012:
| Less Than 12 Months | 12 Months or Greater | Total | ||||||||||||||||||||||||||
| (Dollars in Millions) | Fair Value |
Unrealized Losses |
Fair Value |
Unrealized Losses |
Fair Value |
Unrealized Losses |
||||||||||||||||||||||
| Held-to-maturity |
||||||||||||||||||||||||||||
| U.S. Treasury and agencies |
$ | 100 | $ | – | $ | – | $ | – | $ | 100 | $ | – | ||||||||||||||||
| Mortgage-backed securities |
||||||||||||||||||||||||||||
| Residential agency |
1,015 | (6 | ) | – | – | 1,015 | (6 | ) | ||||||||||||||||||||
| Commercial non-agency |
– | – | 2 | – | 2 | – | ||||||||||||||||||||||
| Other asset-backed securities |
– | – | 10 | (4 | ) | 10 | (4 | ) | ||||||||||||||||||||
| Corporate debt securities |
– | – | 97 | (17 | ) | 97 | (17 | ) | ||||||||||||||||||||
| Total held-to-maturity |
$ | 1,115 | $ | (6 | ) | $ | 109 | $ | (21 | ) | $ | 1,224 | $ | (27 | ) | |||||||||||||
| Available-for-sale |
||||||||||||||||||||||||||||
| U.S. Treasury and agencies |
$ | 400 | $ | (1 | ) | $ | – | $ | – | $ | 400 | $ | (1 | ) | ||||||||||||||
| Mortgage-backed securities |
||||||||||||||||||||||||||||
| Residential |
||||||||||||||||||||||||||||
| Agency |
3,316 | (5 | ) | 173 | – | 3,489 | (5 | ) | ||||||||||||||||||||
| Non-agency (a) |
||||||||||||||||||||||||||||
| Prime (b) |
17 | – | 404 | (20 | ) | 421 | (20 | ) | ||||||||||||||||||||
| Non-prime (c) |
– | – | 284 | (21 | ) | 284 | (21 | ) | ||||||||||||||||||||
| Other asset-backed securities |
– | – | 2 | (1 | ) | 2 | (1 | ) | ||||||||||||||||||||
| Obligations of state and political subdivisions |
48 | – | 12 | – | 60 | – | ||||||||||||||||||||||
| Obligations of foreign governments |
6 | – | – | – | 6 | – | ||||||||||||||||||||||
| Corporate debt securities |
5 | – | 586 | (85 | ) | 591 | (85 | ) | ||||||||||||||||||||
| Perpetual preferred securities |
– | – | 119 | (14 | ) | 119 | (14 | ) | ||||||||||||||||||||
| Other investments |
2 | – | 3 | – | 5 | – | ||||||||||||||||||||||
| Total available-for-sale |
$ | 3,794 | $ | (6 | ) | $ | 1,583 | $ | (141 | ) | $ | 5,377 | $ | (147 | ) | |||||||||||||
| (a) | The Company has $41 million of unrealized losses on residential non-agency mortgage-backed securities. Credit-related other-than-temporary impairment on these securities may occur if there is further deterioration in the underlying collateral pool performance. Borrower defaults may increase if current economic conditions persist or worsen. Additionally, further deterioration in home prices may increase the severity of projected losses. |
| (b) | Prime securities are those designated as such by the issuer at origination. When an issuer designation is unavailable, the Company determines at acquisition date the categorization based on asset pool characteristics (such as weighted-average credit score, loan-to-value, loan type, prevalence of low documentation loans) and deal performance (such as pool delinquencies and security market spreads). |
| (c) | Includes all securities not meeting the conditions to be designated as prime. |
The Company does not consider these unrealized losses to be credit-related. These unrealized losses primarily relate to changes in interest rates and market spreads subsequent to purchase. A substantial portion of investment securities that have unrealized losses are either corporate debt or mortgage-backed securities issued with high investment grade credit ratings. In general, the issuers of the investment securities are contractually prohibited from prepayment at less than par, and the Company did not pay significant purchase premiums for these investment securities. At December 31, 2012, the Company had no plans to sell investment securities with unrealized losses, and believes it is more likely than not it would not be required to sell such investment securities before recovery of their amortized cost.
| 92 | U.S. BANCORP |
| NOTE 5 | Loans and Allowance for Credit Losses |
The composition of the loan portfolio at December 31, disaggregated by class and underlying specific portfolio type, was as follows:
| (Dollars in Millions) | 2012 | 2011 | ||||||
| Commercial |
||||||||
| Commercial |
$ | 60,742 | $ | 50,734 | ||||
| Lease financing |
5,481 | 5,914 | ||||||
| Total commercial |
66,223 | 56,648 | ||||||
| Commercial Real Estate |
||||||||
| Commercial mortgages |
31,005 | 29,664 | ||||||
| Construction and development |
5,948 | 6,187 | ||||||
| Total commercial real estate |
36,953 | 35,851 | ||||||
| Residential Mortgages |
||||||||
| Residential mortgages |
32,648 | 28,669 | ||||||
| Home equity loans, first liens |
11,370 | 8,413 | ||||||
| Total residential mortgages |
44,018 | 37,082 | ||||||
| Credit Card |
17,115 | 17,360 | ||||||
| Other Retail |
||||||||
| Retail leasing |
5,419 | 5,118 | ||||||
| Home equity and second mortgages |
16,726 | 18,131 | ||||||
| Revolving credit |
3,332 | 3,344 | ||||||
| Installment |
5,463 | 5,348 | ||||||
| Automobile |
12,593 | 11,508 | ||||||
| Student |
4,179 | 4,658 | ||||||
| Total other retail |
47,712 | 48,107 | ||||||
| Total loans, excluding covered loans |
212,021 | 195,048 | ||||||
| Covered Loans |
11,308 | 14,787 | ||||||
| Total loans |
$ | 223,329 | $ | 209,835 | ||||
The Company had loans of $74.1 billion at December 31, 2012, and $67.0 billion at December 31, 2011, pledged at the Federal Home Loan Bank (“FHLB”), and loans of $48.6 billion at December 31, 2012, and $47.2 billion at December 31, 2011, pledged at the Federal Reserve Bank.
The majority of the Company’s loans are to borrowers in the states in which it has Consumer and Small Business Banking offices. Collateral for commercial loans may include marketable securities, accounts receivable, inventory and equipment. For details of the Company’s commercial portfolio by industry group and geography as of December 31, 2012 and 2011, see Table 7 included in Management’s Discussion and Analysis which is incorporated by reference into these Notes to Consolidated Financial Statements.
For detail of the Company’s commercial real estate portfolio by property type and geography as of December 31, 2012 and 2011, see Table 8 included in Management’s Discussion and Analysis which is incorporated by reference into these Notes to Consolidated Financial Statements. Such loans are collateralized by the related property. The Company has an equity interest in a joint venture, that it accounts for under the equity method, whose principal activities are to lend to entities that develop land, and construct and sell residential homes. The Company provides a warehousing line to this joint venture. Warehousing advances to this joint venture are repaid when the sale of loans is completed or the real estate is permanently refinanced by others. At December 31, 2012 and 2011, the Company had $486 million and $716 million, respectively, of outstanding advances to this joint venture. These advances are included in commercial real estate loans.
Originated loans are reported at the principal amount outstanding, net of unearned interest and deferred fees and costs. Net unearned interest and deferred fees and costs amounted to $.8 billion at December 31, 2012, and $1.1 billion at December 31, 2011. All purchased loans and related indemnification assets are recorded at fair value at the date of purchase. The Company evaluates purchased loans for impairment at the date of purchase in accordance with applicable authoritative accounting guidance. Purchased loans with evidence of credit deterioration since origination for which it is probable that all contractually required payments will not be collected are considered “purchased impaired loans.” All other purchased loans are considered “purchased nonimpaired loans.”
On the acquisition date, the estimate of the contractually required payments receivable for all purchased impaired loans acquired in the 2012 acquisition of BankEast, a subsidiary of BankEast Corporation, from the FDIC was $63 million, the cash flows expected to be collected was $41 million including interest, and the estimated fair value of the loans was $28
| U.S. BANCORP | 93 |
million. These amounts were determined based upon the estimated remaining life of the underlying loans, which includes the effects of estimated prepayments. For the purchased nonimpaired loans acquired in the BankEast transaction, the estimate as of the acquisition date of the contractually required payments receivable was $135 million, the contractual cash flows not expected to be collected was $22 million, and the estimated fair value of the loans was $96 million. The BankEast transaction did not include a loss sharing agreement.
Changes in the accretable balance for all purchased impaired loans, including those acquired in the BankEast transaction, for the years ended December 31, were as follows:
| (Dollars in Millions) | 2012 | 2011 | 2010 | |||||||||
| Balance at beginning of period |
$ | 2,619 | $ | 2,890 | $ | 2,845 | ||||||
| Purchases |
13 | 100 | – | |||||||||
| Accretion |
(437 | ) | (451 | ) | (421 | ) | ||||||
| Disposals |
(208 | ) | (67 | ) | (27 | ) | ||||||
| Reclassifications (to)/from nonaccretable difference (a) |
454 | 184 | 536 | |||||||||
| Other (b) |
(732 | ) | (37 | ) | (43 | ) | ||||||
| Balance at end of period |
$ | 1,709 | $ | 2,619 | $ | 2,890 | ||||||
| (a) | Primarily relates to changes in expected credit performance. |
| (b) | Primarily relates to changes in variable rates, and in 2012 to a change in the Company’s expectations regarding potential sale of modified covered loans at the end of the indemnification agreements which results in a reduction in the expected contractual interest payments included in the accretable balance for those loans that may be sold. |
Allowance for Credit Losses The allowance for credit losses reserves for probable and estimable losses incurred in the Company’s loan and lease portfolio and includes certain amounts that do not represent loss exposure to the Company because those losses are recoverable under loss sharing agreements with the FDIC.
Activity in the allowance for credit losses by portfolio class was as follows:
| (Dollars in Millions) | Commercial | Commercial Real Estate |
Residential Mortgages |
Credit Card |
Other Retail |
Total Loans, Excluding Covered Loans |
Covered Loans |
Total Loans |
||||||||||||||||||||||||
| Balance at December 31, 2009 |
$ | 1,208 | $ | 1,001 | $ | 672 | $ | 1,495 | $ | 871 | $ | 5,247 | $ | 17 | $ | 5,264 | ||||||||||||||||
| Add |
||||||||||||||||||||||||||||||||
| Provision for credit losses |
723 | 1,135 | 694 | 1,100 | 681 | 4,333 | 23 | 4,356 | ||||||||||||||||||||||||
| Deduct |
||||||||||||||||||||||||||||||||
| Loans charged off |
918 | 871 | 554 | 1,270 | 863 | 4,476 | 20 | 4,496 | ||||||||||||||||||||||||
| Less recoveries of loans charged off |
(91 | ) | (26 | ) | (8 | ) | (70 | ) | (118 | ) | (313 | ) | (2 | ) | (315 | ) | ||||||||||||||||
| Net loans charged off |
827 | 845 | 546 | 1,200 | 745 | 4,163 | 18 | 4,181 | ||||||||||||||||||||||||
| Net change for credit losses to be reimbursed by the FDIC |
– | – | – | – | – | – | 92 | 92 | ||||||||||||||||||||||||
| Balance at December 31, 2010 |
$ | 1,104 | $ | 1,291 | $ | 820 | $ | 1,395 | $ | 807 | $ | 5,417 | $ | 114 | $ | 5,531 | ||||||||||||||||
| Add |
||||||||||||||||||||||||||||||||
| Provision for credit losses |
312 | 361 | 596 | 431 | 628 | 2,328 | 15 | 2,343 | ||||||||||||||||||||||||
| Deduct |
||||||||||||||||||||||||||||||||
| Loans charged off |
516 | 543 | 502 | 922 | 733 | 3,216 | 13 | 3,229 | ||||||||||||||||||||||||
| Less recoveries of loans charged off |
(110 | ) | (45 | ) | (13 | ) | (88 | ) | (129 | ) | (385 | ) | (1 | ) | (386 | ) | ||||||||||||||||
| Net loans charged off |
406 | 498 | 489 | 834 | 604 | 2,831 | 12 | 2,843 | ||||||||||||||||||||||||
| Net change for credit losses to be reimbursed by the FDIC |
– | – | – | – | – | – | (17 | ) | (17 | ) | ||||||||||||||||||||||
| Balance at December 31, 2011 |
$ | 1,010 | $ | 1,154 | $ | 927 | $ | 992 | $ | 831 | $ | 4,914 | $ | 100 | $ | 5,014 | ||||||||||||||||
| Add |
||||||||||||||||||||||||||||||||
| Provision for credit losses |
316 | (131 | ) | 446 | 571 | 558 | 1,760 | 122 | 1,882 | |||||||||||||||||||||||
| Deduct |
||||||||||||||||||||||||||||||||
| Loans charged off |
378 | 242 | 461 | 769 | 666 | 2,516 | 11 | 2,527 | ||||||||||||||||||||||||
| Less recoveries of loans charged off |
(103 | ) | (76 | ) | (23 | ) | (102 | ) | (125 | ) | (429 | ) | (1 | ) | (430 | ) | ||||||||||||||||
| Net loans charged off |
275 | 166 | 438 | 667 | 541 | 2,087 | 10 | 2,097 | ||||||||||||||||||||||||
| Net change for credit losses to be reimbursed by the FDIC |
– | – | – | – | – | – | (33 | ) | (33 | ) | ||||||||||||||||||||||
| Other changes |
– | – | – | (33 | ) | – | (33 | ) | – | (33 | ) | |||||||||||||||||||||
| Balance at December 31, 2012 |
$ | 1,051 | $ | 857 | $ | 935 | $ | 863 | $ | 848 | $ | 4,554 | $ | 179 | $ | 4,733 | ||||||||||||||||
| 94 | U.S. BANCORP |
Additional detail of the allowance for credit losses by portfolio class was as follows:
| (Dollars in Millions) | Commercial | Commercial Real Estate |
Residential Mortgages |
Credit Card |
Other Retail |
Total Loans, Excluding Covered Loans |
Covered Loans |
Total Loans |
||||||||||||||||||||||||
| Allowance Balance at December 31, 2012 Related to |
||||||||||||||||||||||||||||||||
| Loans individually evaluated for impairment (a) |
$ | 10 | $ | 30 | $ | – | $ | – | $ | – | $ | 40 | $ | – | $ | 40 | ||||||||||||||||
| TDRs collectively evaluated for impairment |
28 | 29 | 446 | 153 | 97 | 753 | 1 | 754 | ||||||||||||||||||||||||
| Other loans collectively evaluated for impairment |
1,013 | 791 | 489 | 710 | 751 | 3,754 | 17 | 3,771 | ||||||||||||||||||||||||
| Loans acquired with deteriorated credit quality |
– | 7 | – | – | – | 7 | 161 | 168 | ||||||||||||||||||||||||
| Total allowance for credit losses |
$ | 1,051 | $ | 857 | $ | 935 | $ | 863 | $ | 848 | $ | 4,554 | $ | 179 | $ | 4,733 | ||||||||||||||||
| Allowance Balance at December 31, 2011 Related to |
||||||||||||||||||||||||||||||||
| Loans individually evaluated for impairment (a) |
$ | 16 | $ | 61 | $ | 1 | $ | – | $ | – | $ | 78 | $ | 2 | $ | 80 | ||||||||||||||||
| TDRs collectively evaluated for impairment |
40 | 33 | 490 | 219 | 57 | 839 | – | 839 | ||||||||||||||||||||||||
| Other loans collectively evaluated for impairment |
954 | 1,057 | 436 | 773 | 774 | 3,994 | 22 | 4,016 | ||||||||||||||||||||||||
| Loans acquired with deteriorated credit quality |
– | 3 | – | – | – | 3 | 76 | 79 | ||||||||||||||||||||||||
| Total allowance for credit losses |
$ | 1,010 | $ | 1,154 | $ | 927 | $ | 992 | $ | 831 | $ | 4,914 | $ | 100 | $ | 5,014 | ||||||||||||||||
| (a) | Represents the allowance for credit losses related to loans greater than $5 million classified as nonperforming or TDRs. |
Additional detail of loan balances by portfolio class was as follows:
| (Dollars in Millions) | Commercial | Commercial Real Estate |
Residential Mortgages |
Credit Card |
Other Retail |
Total Loans, Excluding Covered Loans |
Covered Loans (b) |
Total Loans |
||||||||||||||||||||||||
| December 31, 2012 |
||||||||||||||||||||||||||||||||
| Loans individually evaluated for impairment (a) |
$ | 171 | $ | 510 | $ | – | $ | – | $ | – | $ | 681 | $ | 48 | $ | 729 | ||||||||||||||||
| TDRs collectively evaluated for impairment |
185 | 391 | 4,199 | 442 | 313 | 5,530 | 145 | 5,675 | ||||||||||||||||||||||||
| Other loans collectively evaluated for impairment |
65,863 | 35,952 | 39,813 | 16,673 | 47,399 | 205,700 | 5,814 | 211,514 | ||||||||||||||||||||||||
| Loans acquired with deteriorated credit quality |
4 | 100 | 6 | – | – | 110 | 5,301 | 5,411 | ||||||||||||||||||||||||
| Total loans |
$ | 66,223 | $ | 36,953 | $ | 44,018 | $ | 17,115 | $ | 47,712 | $ | 212,021 | $ | 11,308 | $ | 223,329 | ||||||||||||||||
| December 31, 2011 |
||||||||||||||||||||||||||||||||
| Loans individually evaluated for impairment (a) |
$ | 222 | $ | 812 | $ | 6 | $ | – | $ | – | $ | 1,040 | $ | 204 | $ | 1,244 | ||||||||||||||||
| TDRs collectively evaluated for impairment |
277 | 331 | 3,430 | 584 | 148 | 4,770 | 113 | 4,883 | ||||||||||||||||||||||||
| Other loans collectively evaluated for impairment |
56,138 | 34,574 | 33,642 | 16,776 | 47,959 | 189,089 | 8,616 | 197,705 | ||||||||||||||||||||||||
| Loans acquired with deteriorated credit quality |
11 | 134 | 4 | – | – | 149 | 5,854 | 6,003 | ||||||||||||||||||||||||
| Total loans |
$ | 56,648 | $ | 35,851 | $ | 37,082 | $ | 17,360 | $ | 48,107 | $ | 195,048 | $ | 14,787 | $ | 209,835 | ||||||||||||||||
| (a) | Represents loans greater than $5 million classified as nonperforming or TDRs. |
| (b) | Includes expected reimbursements from the FDIC under loss sharing agreements. |
Credit Quality The quality of the Company’s loan portfolios is assessed as a function of net credit losses, levels of nonperforming assets and delinquencies, and credit quality ratings as defined by the Company. These credit quality ratings are an important part of the Company’s overall credit risk management process and evaluation of its allowance for credit losses.
| U.S. BANCORP | 95 |
The following table provides a summary of loans by portfolio class, including the delinquency status of those that continue to accrue interest, and those that are nonperforming:
| Accruing | ||||||||||||||||||||
| (Dollars in Millions) | Current | 30-89 Days Past Due |
90 Days or More Past Due |
Nonperforming | Total | |||||||||||||||
| December 31, 2012 |
||||||||||||||||||||
| Commercial |
$ | 65,701 | $ | 341 | $ | 58 | $ | 123 | $ | 66,223 | ||||||||||
| Commercial real estate |
36,241 | 158 | 8 | 546 | 36,953 | |||||||||||||||
| Residential mortgages (a) |
42,728 | 348 | 281 | 661 | 44,018 | |||||||||||||||
| Credit card |
16,525 | 227 | 217 | 146 | 17,115 | |||||||||||||||
| Other retail |
47,109 | 290 | 96 | 217 | 47,712 | |||||||||||||||
| Total loans, excluding covered loans |
208,304 | 1,364 | 660 | 1,693 | 212,021 | |||||||||||||||
| Covered loans |
9,900 | 359 | 663 | 386 | 11,308 | |||||||||||||||
| Total loans |
$ | 218,204 | $ | 1,723 | $ | 1,323 | $ | 2,079 | $ | 223,329 | ||||||||||
| December 31, 2011 |
||||||||||||||||||||
| Commercial |
$ | 55,991 | $ | 300 | $ | 45 | $ | 312 | $ | 56,648 | ||||||||||
| Commercial real estate |
34,800 | 138 | 14 | 899 | 35,851 | |||||||||||||||
| Residential mortgages (a) |
35,664 | 404 | 364 | 650 | 37,082 | |||||||||||||||
| Credit card |
16,662 | 238 | 236 | 224 | 17,360 | |||||||||||||||
| Other retail |
47,516 | 340 | 184 | 67 | 48,107 | |||||||||||||||
| Total loans, excluding covered loans |
190,633 | 1,420 | 843 | 2,152 | 195,048 | |||||||||||||||
| Covered loans |
12,589 | 362 | 910 | 926 | 14,787 | |||||||||||||||
| Total loans |
$ | 203,222 | $ | 1,782 | $ | 1,753 | $ | 3,078 | $ | 209,835 | ||||||||||
| (a) | At December 31, 2012, $441 million of loans 30 – 89 days past due and $3.2 billion of loans 90 days or more past due purchased from Government National Mortgage Association (“GNMA”) mortgage pools whose repayments are insured by the Federal Housing Administration or guaranteed by the Department of Veterans Affairs, were classified as current, compared with $545 million and $2.6 billion at December 31, 2011, respectively. |
Total nonperforming assets include nonaccrual loans, restructured loans not performing in accordance with modified terms, other real estate and other nonperforming assets owned by the Company. For details of the Company’s nonperforming assets as of December 31, 2012 and 2011, see Table 16 included in Management’s Discussion and Analysis which is incorporated by reference into these Notes to Consolidated Financial Statements.
The following table provides a summary of loans by portfolio class and the Company’s internal credit quality rating:
| Criticized | ||||||||||||||||||||||
| (Dollars in Millions) | Pass | Special Mention |
Classified (a) | Total Criticized |
Total | |||||||||||||||||
| December 31, 2012 |
||||||||||||||||||||||
| Commercial |
$ | 63,906 | $ | 1,114 | $ | 1,203 | $ | 2,317 | $ | 66,223 | ||||||||||||
| Commercial real estate |
34,096 | 621 | 2,236 | 2,857 | 36,953 | |||||||||||||||||
| Residential mortgages (b) |
42,897 | 18 | 1,103 | 1,121 | 44,018 | |||||||||||||||||
| Credit card |
16,752 | – | 363 | 363 | 17,115 | |||||||||||||||||
| Other retail |
47,294 | 36 | 382 | 418 | 47,712 | |||||||||||||||||
| Total loans, excluding covered loans |
204,945 | 1,789 | 5,287 | 7,076 | 212,021 | |||||||||||||||||
| Covered loans |
10,786 | 61 | 461 | 522 | 11,308 | |||||||||||||||||
| Total loans |
$ | 215,731 | $ | 1,850 | $ | 5,748 | $ | 7,598 | $ | 223,329 | ||||||||||||
| Total outstanding commitments |
$ | 442,047 | $ | 3,231 | $ | 6,563 | $ | 9,794 | $ | 451,841 | ||||||||||||
| December 31, 2011 |
||||||||||||||||||||||
| Commercial |
$ | 54,003 | $ | 1,047 | $ | 1,598 | $ | 2,645 | $ | 56,648 | ||||||||||||
| Commercial real estate |
30,733 | 793 | 4,325 | 5,118 | 35,851 | |||||||||||||||||
| Residential mortgages (b) |
35,814 | 19 | 1,249 | 1,268 | 37,082 | |||||||||||||||||
| Credit card |
16,910 | – | 450 | 450 | 17,360 | |||||||||||||||||
| Other retail |
47,665 | 24 | 418 | 442 | 48,107 | |||||||||||||||||
| Total loans, excluding covered loans |
185,125 | 1,883 | 8,040 | 9,923 | 195,048 | |||||||||||||||||
| Covered loans |
13,966 | 187 | 634 | 821 | 14,787 | |||||||||||||||||
| Total loans |
$ | 199,091 | $ | 2,070 | $ | 8,674 | $ | 10,744 | $ | 209,835 | ||||||||||||
| Total outstanding commitments |
$ | 410,457 | $ | 3,418 | $ | 9,690 | $ | 13,108 | $ | 423,565 | ||||||||||||
| (a) | Classified rating on consumer loans primarily based on delinquency status. |
| (b) | At December 31, 2012, $3.2 billion of GNMA loans 90 days or more past due and $2.4 billion of restructured GNMA loans whose repayments are insured by the Federal Housing Administration or guaranteed by the Department of Veterans Affairs were classified with a pass rating, compared with $2.6 billion and $2.0 billion at December 31, 2011, respectively. |
| 96 | U.S. BANCORP |
For all loan classes, a loan is considered to be impaired when, based on current events or information, it is probable the Company will be unable to collect all amounts due per the contractual terms of the loan agreement. A summary of impaired loans, which include all nonaccrual and TDR loans, by portfolio class was as follows:
| (Dollars in Millions) | Period-end Recorded Investment (a) |
Unpaid Principal Balance |
Valuation Allowance |
Commitments to Lend Additional Funds |
||||||||||||
| December 31, 2012 |
||||||||||||||||
| Commercial |
$ | 404 | $ | 1,200 | $ | 40 | $ | 39 | ||||||||
| Commercial real estate |
1,077 | 2,251 | 70 | 4 | ||||||||||||
| Residential mortgages |
2,748 | 3,341 | 415 | – | ||||||||||||
| Credit card |
442 | 442 | 153 | – | ||||||||||||
| Other retail |
443 | 486 | 101 | 3 | ||||||||||||
| Total impaired loans, excluding GNMA and covered loans |
5,114 | 7,720 | 779 | 46 | ||||||||||||
| Loans purchased from GNMA mortgage pools |
1,778 | 1,778 | 39 | – | ||||||||||||
| Covered loans |
767 | 1,584 | 20 | 12 | ||||||||||||
| Total |
$ | 7,659 | $ | 11,082 | $ | 838 | $ | 58 | ||||||||
| December 31, 2011 |
||||||||||||||||
| Commercial |
$ | 657 | $ | 1,437 | $ | 62 | $ | 68 | ||||||||
| Commercial real estate |
1,436 | 2,503 | 124 | 25 | ||||||||||||
| Residential mortgages |
2,652 | 3,193 | 482 | 2 | ||||||||||||
| Credit card |
584 | 584 | 219 | – | ||||||||||||
| Other retail |
188 | 197 | 57 | – | ||||||||||||
| Total impaired loans, excluding GNMA and covered loans |
5,517 | 7,914 | 944 | 95 | ||||||||||||
| Loans purchased from GNMA mortgage pools |
1,265 | 1,265 | 18 | – | ||||||||||||
| Covered loans |
1,170 | 1,642 | 43 | 49 | ||||||||||||
| Total |
$ | 7,952 | $ | 10,821 | $ | 1,005 | $ | 144 | ||||||||
| (a) | Substantially all loans classified as impaired at December 31, 2012 and 2011, had an associated allowance for credit losses. The total amount of interest income recognized during 2012 on loans classified as impaired at December 31, 2012, excluding those acquired with deteriorated credit quality, was $222 million, compared to what would have been recognized at the original contractual terms of the loans of $410 million. |
| U.S. BANCORP | 97 |
Additional information on impaired loans for the years ended December 31 follows:
| (Dollars in Millions) | Average Recorded Investment |
Interest Income Recognized |
||||||
| 2012 |
||||||||
| Commercial |
$ | 470 | $ | 18 | ||||
| Commercial real estate |
1,314 | 43 | ||||||
| Residential mortgages |
2,717 | 130 | ||||||
| Credit card |
510 | 28 | ||||||
| Other retail |
301 | 19 | ||||||
| Total impaired loans, excluding GNMA and covered loans |
5,312 | 238 | ||||||
| Loans purchased from GNMA mortgage pools |
1,448 | 73 | ||||||
| Covered loans |
980 | 29 | ||||||
| Total |
$ | 7,740 | $ | 340 | ||||
| 2011 |
||||||||
| Commercial |
$ | 534 | $ | 12 | ||||
| Commercial real estate |
1,537 | 18 | ||||||
| Residential mortgages |
2,557 | 100 | ||||||
| Credit card |
485 | 15 | ||||||
| Other retail |
164 | 5 | ||||||
| Total impaired loans, excluding GNMA and covered loans |
5,277 | 150 | ||||||
| Loans purchased from GNMA mortgage pools |
710 | 25 | ||||||
| Covered loans |
780 | 11 | ||||||
| Total |
$ | 6,767 | $ | 186 | ||||
| 2010 |
||||||||
| Commercial |
$ | 693 | $ | 8 | ||||
| Commercial real estate |
1,601 | 2 | ||||||
| Residential mortgages |
2,297 | 72 | ||||||
| Credit card |
418 | 11 | ||||||
| Other retail |
150 | 6 | ||||||
| Total |
$ | 5,159 | $ | 99 | ||||
| 98 | U.S. BANCORP |
Troubled Debt Restructurings In certain circumstances, the Company may modify the terms of a loan to maximize the collection of amounts due when a borrower is experiencing financial difficulties or is expected to experience difficulties in the near-term. The following table provides a summary of loans modified as TDRs for the years ended December 31, by portfolio class:
| (Dollars in Millions) | Number of Loans |
Pre-Modification Outstanding Loan Balance |
Post-Modification Outstanding Loan Balance |
|||||||||
| 2012 |
||||||||||||
| Commercial |
4,843 | $ | 307 | $ | 272 | |||||||
| Commercial real estate |
312 | 493 | 461 | |||||||||
| Residential mortgages |
4,616 | 638 | 623 | |||||||||
| Credit card |
49,320 | 241 | 255 | |||||||||
| Other retail |
10,461 | 279 | 275 | |||||||||
| Total loans, excluding GNMA and covered loans |
69,552 | 1,958 | 1,886 | |||||||||
| Loans purchased from GNMA mortgage pools |
9,518 | 1,280 | 1,245 | |||||||||
| Covered loans |
192 | 277 | 263 | |||||||||
| Total loans |
79,262 | $ | 3,515 | $ | 3,394 | |||||||
| 2011 |
||||||||||||
| Commercial |
5,285 | $ | 456 | $ | 427 | |||||||
| Commercial real estate |
506 | 1,078 | 1,060 | |||||||||
| Residential mortgages |
3,611 | 708 | 704 | |||||||||
| Credit card |
55,951 | 322 | 321 | |||||||||
| Other retail |
4,028 | 73 | 72 | |||||||||
| Total loans, excluding GNMA and covered loans |
69,381 | 2,637 | 2,584 | |||||||||
| Loans purchased from GNMA mortgage pools |
9,569 | 1,277 | 1,356 | |||||||||
| Covered loans |
283 | 604 | 575 | |||||||||
| Total loans |
79,233 | $ | 4,518 | $ | 4,515 | |||||||
Residential mortgages, home equity and second mortgages, and loans purchased from Government National Mortgage Association (“GNMA”) mortgage pools in the table above include trial period arrangements offered to customers during the periods presented. The post-modification balances for these loans reflect the current outstanding balance until a permanent modification is made. In addition, the post-modification balances typically include capitalization of unpaid accrued interest and/or fees under the various modification programs. At December 31, 2012, 156 residential mortgages, 36 home equity and second mortgage loans and 583 loans purchased from GNMA mortgage pools with outstanding balances of $24 million, $2 million and $93 million, respectively, were in a trial period and have estimated post-modification balances of $24 million, $2 million and $85 million, respectively, assuming permanent modification occurs at the end of the trial period.
| U.S. BANCORP | 99 |
The following table provides a summary of TDR loans that defaulted (fully or partially charged-off or became 90 days or more past due) for the years ended December 31, that were modified as TDRs within 12 months previous to default.
| (Dollars in Millions) | Number of Loans |
Amount Defaulted |
||||||
| 2012 |
||||||||
| Commercial |
859 | $ | 48 | |||||
| Commercial real estate |
111 | 232 | ||||||
| Residential mortgages |
1,073 | 146 | ||||||
| Credit card |
9,774 | 54 | ||||||
| Other retail |
1,818 | 56 | ||||||
| Total loans, excluding GNMA and covered loans |
13,635 | 536 | ||||||
| Loans purchased from GNMA mortgage pools |
1,245 | 177 | ||||||
| Covered loans |
68 | 97 | ||||||
| Total loans |
14,948 | $ | 810 | |||||
| 2011 |
||||||||
| Commercial |
665 | $ | 26 | |||||
| Commercial real estate |
64 | 67 | ||||||
| Residential mortgages |
623 | 127 | ||||||
| Credit card |
7,108 | 36 | ||||||
| Other retail |
557 | 13 | ||||||
| Total loans, excluding GNMA and covered loans |
9,017 | 269 | ||||||
| Loans purchased from GNMA mortgage pools |
857 | 124 | ||||||
| Covered loans |
11 | 26 | ||||||
| Total loans |
9,885 | $ | 419 | |||||
In addition to the defaults in the table above, for the year ended December 31, 2012, the Company had an estimated 789 residential mortgage loans, home equity and second mortgage loans, and loans purchased from GNMA mortgage pools with aggregate outstanding balances of $121 million where borrowers did not successfully complete the trial period arrangement and therefore are no longer eligible for a permanent modification under the applicable modification program.
Covered Assets Covered assets represent loans and other assets acquired from the FDIC, subject to loss sharing agreements, and include expected reimbursements from the FDIC. The carrying amount of the covered assets at December 31, consisted of purchased impaired loans, purchased nonimpaired loans, and other assets as shown in the following table:
| 2012 | 2011 | |||||||||||||||||||||||||||||||||
| (Dollars in Millions) | Purchased Impaired Loans |
Purchased Nonimpaired Loans |
Other Assets |
Total | Purchased Impaired Loans |
Purchased Nonimpaired Loans |
Other Assets |
Total | ||||||||||||||||||||||||||
| Commercial loans |
$ | – | $ | 143 | $ | – | $ | 143 | $ | 68 | $ | 137 | $ | – | $ | 205 | ||||||||||||||||||
| Commercial real estate loans |
1,323 | 2,695 | – | 4,018 | 1,956 | 4,037 | – | 5,993 | ||||||||||||||||||||||||||
| Residential mortgage loans |
3,978 | 1,109 | – | 5,087 | 3,830 | 1,360 | – | 5,190 | ||||||||||||||||||||||||||
| Credit card loans |
– | 5 | – | 5 | – | 6 | – | 6 | ||||||||||||||||||||||||||
| Other retail loans |
– | 775 | – | 775 | – | 867 | – | 867 | ||||||||||||||||||||||||||
| Losses reimbursable by the FDIC (a) |
– | – | 1,280 | 1,280 | – | – | 2,526 | 2,526 | ||||||||||||||||||||||||||
| Covered loans |
5,301 | 4,727 | 1,280 | 11,308 | 5,854 | 6,407 | 2,526 | 14,787 | ||||||||||||||||||||||||||
| Foreclosed real estate |
– | – | 197 | 197 | – | – | 274 | 274 | ||||||||||||||||||||||||||
| Total covered assets |
$ | 5,301 | $ | 4,727 | $ | 1,477 | $ | 11,505 | $ | 5,854 | $ | 6,407 | $ | 2,800 | $ | 15,061 | ||||||||||||||||||
| (a) | Relates to loss sharing agreements with remaining terms from 2 to 7 years. |
At December 31, 2012, $82 million of the purchased impaired loans included in covered loans were classified as nonperforming assets, compared with $189 million at December 31, 2011, because the expected cash flows are primarily based on the liquidation of underlying collateral and the timing and amount of the cash flows could not be reasonably estimated. Interest income is recognized on other purchased impaired loans through accretion of the difference between the carrying amount of those loans and their expected cash flows. The initial determination of the fair value of the purchased loans includes the impact of expected credit losses and, therefore, no allowance for credit losses is recorded at the purchase date. To the extent credit deterioration occurs after the date of acquisition, the Company records an allowance for credit losses.
| 100 | U.S. BANCORP |
| NOTE 6 | Leases |
The components of the net investment in sales-type and direct financing leases at December 31 were as follows:
| (Dollars in Millions) | 2012 | 2011 | ||||||
| Aggregate future minimum lease payments to be received |
$ | 10,738 | $ | 10,882 | ||||
| Unguaranteed residual values accruing to the lessor’s benefit |
890 | 1,079 | ||||||
| Unearned income |
(1,123 | ) | (1,332 | ) | ||||
| Initial direct costs |
175 | 181 | ||||||
| Total net investment in sales-type and direct financing leases (a) |
$ | 10,680 | $ | 10,810 | ||||
| (a) | The accumulated allowance for uncollectible minimum lease payments was $80 million and $91 million at December 31, 2012 and 2011, respectively. |
The minimum future lease payments to be received from sales-type and direct financing leases were as follows at December 31, 2012:
| (Dollars in Millions) | ||||
| 2013 |
$ | 2,526 | ||
| 2014 |
3,474 | |||
| 2015 |
3,053 | |||
| 2016 |
1,090 | |||
| 2017 |
294 | |||
| Thereafter |
301 | |||
| NOTE 7 | Accounting for Transfers and Servicing of Financial Assets and Variable Interest Entities |
The Company sells financial assets in the normal course of business. The majority of the Company’s financial asset sales are residential mortgage loan sales primarily to GSEs through established programs, the sale or syndication of tax-advantaged investments, commercial loan sales through participation agreements, and other individual or portfolio loan and securities sales. In accordance with the accounting guidance for asset transfers, the Company considers any ongoing involvement with transferred assets in determining whether the assets can be derecognized from the balance sheet. For loans sold under participation agreements, the Company also considers the terms of the loan participation agreement and whether they meet the definition of a participating interest and thus qualify for derecognition. With the exception of servicing and certain performance-based guarantees, the Company’s continuing involvement with financial assets sold is minimal and generally limited to market customary representation and warranty clauses. The guarantees provided to certain third-parties in connection with the sale or syndication of certain assets, primarily loan portfolios and tax-advantaged investments, are further discussed in Note 21. When the Company sells financial assets, it may retain servicing rights and/or other interests in the transferred financial assets. The gain or loss on sale depends on the previous carrying amount of the transferred financial assets and the consideration received and any liabilities incurred in exchange for the transferred assets. Upon transfer, any servicing assets and other interests that continue to be held by the Company are initially recognized at fair value. For further information on MSRs, refer to Note 9. On a limited basis, the Company may acquire and package high-grade corporate bonds for select corporate customers, in which the Company generally has no continuing involvement with these transactions. Additionally, the Company is an authorized GNMA issuer and issues GNMA securities on a regular basis. The Company has no other asset securitizations or similar asset-backed financing arrangements that are off-balance sheet.
The Company is involved in various entities that are considered to be VIEs. The Company’s investments in VIEs primarily represent private investment funds or partnerships that make equity investments, provide debt financing or support community-based investments that may enable the Company to ensure regulatory compliance with the Community Reinvestment Act. In addition, the Company sponsors entities to which it transfers tax-advantaged investments. The Company’s investments in these entities are designed to generate a return primarily through the realization of federal and state income tax credits over specified time periods. The Company realized federal and state income tax
| U.S. BANCORP | 101 |
credits related to these investments of $883 million, $756 million and $713 million for the years ended December 31, 2012, 2011 and 2010, respectively. The Company amortizes its investments in these entities as the tax credits are realized. Amortization expense is recorded in tax expense for investments meeting certain characteristics, and in other noninterest expense for other investments. Amortization expense recorded in tax expense was $482 million, $278 million and $228 million, and in other noninterest expense was $523 million, $528 million and $546 million for the years ended December 31, 2012, 2011 and 2010, respectively.
At December 31, 2012, approximately $7.1 billion of the Company’s assets and $5.2 billion of its liabilities included on the Consolidated Balance Sheet were related to community development and tax-advantaged investment VIEs which the Company has consolidated, compared with $5.6 billion and $4.0 billion, respectively, at December 31, 2011. The majority of the assets of these consolidated VIEs are reported in other assets, and the liabilities are reported in long-term debt. The assets of a particular VIE are the primary source of funds to settle its obligations. The creditors of the VIEs do not have recourse to the general credit of the Company. The Company’s exposure to the consolidated VIEs is generally limited to the carrying value of its variable interests plus any related tax credits previously recognized or sold to others with a guarantee.
In addition, the Company sponsors a conduit to which it previously transferred high-grade investment securities. The Company consolidates the conduit because of its ability to manage the activities of the conduit. At December 31, 2012, $144 million of the held-to-maturity investment securities on the Company’s Consolidated Balance Sheet related to the conduit, compared with $202 million at December 31, 2011.
The Company also sponsors a municipal bond securities tender option bond program. The Company controls the activities of the program’s entities, is entitled to the residual returns and provides credit, liquidity and remarketing arrangements to the program. As a result, the Company has consolidated the program’s entities. At December 31, 2012, $5.3 billion of available-for-sale securities and $5.0 billion of short-term borrowings on the Consolidated Balance Sheet were related to the tender option bond program, compared with $5.4 billion of available-for-sale securities and $5.3 billion of short-term borrowings at December 31, 2011.
The Company is not required to consolidate VIEs in which it has concluded it does not have a controlling financial interest, and thus is not the primary beneficiary. In such cases, the Company does not have both the power to direct the entities’ most significant activities and the obligation to absorb losses or right to receive benefits that could potentially be significant to the VIEs. The Company’s investments in these unconsolidated VIEs generally are carried in other assets on the Consolidated Balance Sheet. The Company’s investments in unconsolidated VIEs at December 31, 2012, ranged from less than $1 million to $58 million, with an aggregate amount of approximately $1.9 billion, net of $1.3 billion of liabilities recorded primarily for unfunded capital commitments of the Company to specific project sponsors. The Company’s investments in unconsolidated VIEs at December 31, 2011, ranged from less than $1 million to $37 million, with an aggregate amount of $1.8 billion, net of liabilities of $965 million for unfunded capital commitments. While the Company believes potential losses from these investments are remote, the Company’s maximum exposure to loss from these unconsolidated VIEs was approximately $5.2 billion at December 31, 2012, compared with $4.8 billion at December 31, 2011. The maximum exposure to loss was primarily related to community development tax-advantaged investments and included $1.8 billion at December 31, 2012 and 2011, recorded on the Company’s Consolidated Balance Sheet and $3.3 billion at December 31, 2012, and $3.0 billion at December 31, 2011, of previously recorded tax credits which remain subject to recapture by taxing authorities based on compliance features required to be met at the project level. The remaining amounts related to investments in private investment funds and partnerships for which the maximum exposure to loss included amounts recorded on the Consolidated Balance Sheet and any unfunded commitments. The maximum exposure was determined by assuming a scenario where the separate investments within the individual private funds become worthless, and the community-based business and housing projects and related tax credits completely fail and do not meet certain government compliance requirements.
| 102 | U.S. BANCORP |
| NOTE 8 | Premises and Equipment |
Premises and equipment at December 31 consisted of the following:
| (Dollars in Millions) | 2012 | 2011 | ||||||
| Land |
$ | 534 | $ | 525 | ||||
| Buildings and improvements |
3,222 | 3,144 | ||||||
| Furniture, fixtures and equipment |
2,543 | 2,449 | ||||||
| Capitalized building and equipment leases |
97 | 95 | ||||||
| Construction in progress |
42 | 44 | ||||||
| 6,438 | 6,257 | |||||||
| Less accumulated depreciation and amortization |
(3,768 | ) | (3,600 | ) | ||||
| Total |
$ | 2,670 | $ | 2,657 | ||||
| NOTE 9 | Mortgage Servicing Rights |
The Company serviced $215.6 billion of residential mortgage loans for others at December 31, 2012, and $191.1 billion at December 31, 2011. The net impact included in mortgage banking revenue of fair value changes of MSRs and derivatives used to economically hedge MSRs were net gains of $102 million, $183 million and $139 million for the years ended December 31, 2012, 2011 and 2010, respectively. Loan servicing fees, not including valuation changes, included in mortgage banking revenue, were $720 million, $651 million and $600 million for the years ended December 31, 2012, 2011 and 2010, respectively.
Changes in fair value of capitalized MSRs for the years ended December 31, are summarized as follows:
| (Dollars in Millions) | 2012 | 2011 | 2010 | |||||||||
| Balance at beginning of period |
$ | 1,519 | $ | 1,837 | $ | 1,749 | ||||||
| Rights purchased |
42 | 35 | 65 | |||||||||
| Rights capitalized |
957 | 619 | 639 | |||||||||
| Changes in fair value of MSRs |
||||||||||||
| Due to fluctuations in market interest rates (a) |
(249 | ) | (619 | ) | (255 | ) | ||||||
| Due to revised assumptions or models (b) |
(21 | ) | 33 | 6 | ||||||||
| Other changes in fair value (c) |
(548 | ) | (386 | ) | (367 | ) | ||||||
| Balance at end of period |
$ | 1,700 | $ | 1,519 | $ | 1,837 | ||||||
| (a) | Includes changes in MSR value associated with changes in market interest rates, including estimated prepayment rates and anticipated earnings on escrow deposits. |
| (b) | Includes changes in MSR value not caused by changes in market interest rates, such as changes in cost to service, ancillary income, and discount rate, as well as the impact of any model changes. |
| (c) | Primarily represents changes due to realization of expected cash flows over time (decay). |
The estimated sensitivity to changes in interest rates of the fair value of the MSRs portfolio and the related derivative instruments as of December 31 follows:
| 2012 | 2011 | |||||||||||||||||||||||||||||||||||||||||||||||||
| (Dollars in Millions) | Down 100 bps |
Down 50 bps |
Down 25 bps |
Up 25 bps |
Up 50 bps |
Up 100 bps |
Down 100 bps |
Down 50 bps |
Down 25 bps |
Up 25 bps |
Up 50 bps |
Up 100 bps |
||||||||||||||||||||||||||||||||||||||
| MSR portfolio |
$ | (370 | ) | $ | (217 | ) | $ | (118 | ) | $ | 126 | $ | 249 | $ | 480 | $ | (305 | ) | $ | (183 | ) | $ | (98 | ) | $ | 107 | $ | 223 | $ | 460 | ||||||||||||||||||||
| Derivative instrument hedges |
473 | 249 | 124 | (121 | ) | (243 | ) | (486 | ) | 378 | 204 | 104 | (107 | ) | (217 | ) | (445 | ) | ||||||||||||||||||||||||||||||||
| Net sensitivity |
$ | 103 | $ | 32 | $ | 6 | $ | 5 | $ | 6 | $ | (6 | ) | $ | 73 | $ | 21 | $ | 6 | $ | — | $ | 6 | $ | 15 | |||||||||||||||||||||||||
The fair value of MSRs and their sensitivity to changes in interest rates is influenced by the mix of the servicing portfolio and characteristics of each segment of the portfolio. The Company’s servicing portfolio consists of the distinct portfolios of government-insured mortgages, conventional mortgages and Mortgage Revenue Bond Programs (“MRBP”). The servicing portfolios are predominantly comprised of fixed-rate agency loans with limited adjustable-rate or jumbo mortgage loans. The MRBP division specializes in servicing loans made under state and local housing authority programs. These programs provide mortgages to low-income and moderate-income borrowers and are generally government-insured programs with a favorable rate subsidy, down payment and/or closing cost assistance.
| U.S. BANCORP | 103 |
A summary of the Company’s MSRs and related characteristics by portfolio as of December 31 follows:
| 2012 | 2011 | |||||||||||||||||||||||||||||||||
| (Dollars in Millions) | MRBP | Government | Conventional (b) | Total | MRBP | Government | Conventional (b) | Total | ||||||||||||||||||||||||||
| Servicing portfolio |
$ | 14,143 | $ | 39,048 | $ | 162,446 | $ | 215,637 | $ | 13,357 | $ | 32,567 | $ | 145,158 | $ | 191,082 | ||||||||||||||||||
| Fair value |
$ | 154 | $ | 314 | $ | 1,232 | $ | 1,700 | $ | 155 | $ | 290 | $ | 1,074 | $ | 1,519 | ||||||||||||||||||
| Value (bps) (a) |
109 | 80 | 76 | 79 | 116 | 89 | 74 | 79 | ||||||||||||||||||||||||||
| Weighted-average servicing fees (bps) |
40 | 33 | 30 | 31 | 40 | 36 | 29 | 31 | ||||||||||||||||||||||||||
| Multiple (value/servicing fees) |
2.73 | 2.42 | 2.53 | 2.55 | 2.90 | 2.47 | 2.55 | 2.55 | ||||||||||||||||||||||||||
| Weighted-average note rate |
5.13 | % | 4.57 | % | 4.48 | % | 4.54 | % | 5.50 | % | 5.08 | % | 4.97 | % | 5.03 | % | ||||||||||||||||||
| Weighted-average age (in years) |
4.2 | 2.4 | 2.5 | 2.6 | 4.2 | 2.5 | 2.8 | 2.8 | ||||||||||||||||||||||||||
| Weighted-average expected prepayment (constant prepayment rate) |
13.2 | % | 21.2 | % | 20.4 | % | 20.1 | % | 12.9 | % | 21.1 | % | 22.1 | % | 21.3 | % | ||||||||||||||||||
| Weighted-average expected life (in years) |
6.1 | 4.2 | 4.1 | 4.2 | 6.4 | 4.0 | 3.8 | 4.0 | ||||||||||||||||||||||||||
| Weighted-average discount rate |
12.1 | % | 11.4 | % | 10.0 | % | 10.4 | % | 12.1 | % | 11.3 | % | 10.0 | % | 10.4 | % | ||||||||||||||||||
| (a) | Value is calculated as fair value divided by the servicing portfolio. |
| (b) | Represents loans sold primarily to GSEs. |
| NOTE 10 | Intangible Assets |
Intangible assets consisted of the following:
| Estimated Life (a) | Amortization Method (b) |
Balance | ||||||||||||||||
| At December 31 (Dollars in Millions) | 2012 | 2011 | ||||||||||||||||
| Goodwill |
(c) | $ | 9,143 | $ | 8,927 | |||||||||||||
| Merchant processing contracts |
10 years/8 years | SL/AC | 281 | 348 | ||||||||||||||
| Core deposit benefits |
22 years/5 years | SL/AC | 176 | 232 | ||||||||||||||
| Mortgage servicing rights |
(c) | 1,700 | 1,519 | |||||||||||||||
| Trust relationships |
14 years/6 years | SL/AC | 149 | 166 | ||||||||||||||
| Other identified intangibles |
9 years/5 years | SL/AC | 400 | 471 | ||||||||||||||
| Total |
$ | 11,849 | $ | 11,663 | ||||||||||||||
| (a) | Estimated life represents the amortization period for assets subject to the straight line method and the weighted average or life of the underlying cash flows amortization period for intangibles subject to accelerated methods. If more than one amortization method is used for a category, the estimated life for each method is calculated and reported separately. |
| (b) | Amortization methods: SL = straight line method |
| AC = accelerated | methods generally based on cash flows |
| (c) | Goodwill is evaluated for impairment, but not amortized. Mortgage servicing rights are recorded at fair value, and are not amortized. |
Aggregate amortization expense consisted of the following:
| Year Ended December 31 (Dollars in Millions) | 2012 | 2011 | 2010 | |||||||||
| Merchant processing contracts |
$ | 74 | $ | 90 | $ | 102 | ||||||
| Core deposit benefits |
60 | 81 | 102 | |||||||||
| Trust relationships |
39 | 35 | 49 | |||||||||
| Other identified intangibles |
101 | 93 | 114 | |||||||||
| Total |
$ | 274 | $ | 299 | $ | 367 | ||||||
The estimated amortization expense for the next five years is as follows:
| (Dollars in Millions) | ||||
| 2013 |
$ | 218 | ||
| 2014 |
171 | |||
| 2015 |
138 | |||
| 2016 |
111 | |||
| 2017 |
91 | |||
| 104 | U.S. BANCORP |
The following table reflects the changes in the carrying value of goodwill for the years ended December 31, 2012, 2011 and 2010:
| (Dollars in Millions) | Wholesale Banking and Commercial Real Estate |
Consumer and Small Business Banking |
Wealth Management and Securities Services |
Payment Services |
Treasury and Corporate Support |
Consolidated Company |
||||||||||||||||||
| Balance at December 31, 2009 |
$ | 1,605 | $ | 3,526 | $ | 1,515 | $ | 2,365 | $ | – | $ | 9,011 | ||||||||||||
| Goodwill acquired |
– | 9 | 5 | – | – | 14 | ||||||||||||||||||
| Disposal |
– | – | (57 | ) | – | – | (57 | ) | ||||||||||||||||
| Other (a) |
– | – | – | (14 | ) | – | (14 | ) | ||||||||||||||||
| Balance at December 31, 2010 |
$ | 1,605 | $ | 3,535 | $ | 1,463 | $ | 2,351 | $ | – | $ | 8,954 | ||||||||||||
| Other (a) |
– | (21 | ) | – | (6 | ) | – | (27 | ) | |||||||||||||||
| Balance at December 31, 2011 |
$ | 1,605 | $ | 3,514 | $ | 1,463 | $ | 2,345 | $ | – | $ | 8,927 | ||||||||||||
| Goodwill acquired |
– | – | 65 | 143 | – | 208 | ||||||||||||||||||
| Other (a) |
– | – | – | 8 | – | 8 | ||||||||||||||||||
| Balance at December 31, 2012 |
$ | 1,605 | $ | 3,514 | $ | 1,528 | $ | 2,496 | $ | – | $ | 9,143 | ||||||||||||
| (a) | Other changes in goodwill include a reclassification from goodwill to covered loans related to an FDIC-assisted acquisition for Consumer and Small Business Banking and the effect of foreign exchange translation for Payment Services. |
| NOTE 11 | Short-Term Borrowings (a) |
The following table is a summary of short-term borrowings for the last three years:
| 2012 | 2011 | 2010 | ||||||||||||||||||||||||||
| (Dollars in Millions) | Amount | Rate | Amount | Rate | Amount | Rate | ||||||||||||||||||||||
| At Year-End |
||||||||||||||||||||||||||||
| Federal funds purchased |
$ | 950 | .11 | % | $ | 1,036 | .11 | % | $ | 776 | .17 | % | ||||||||||||||||
| Securities sold under agreements to repurchase |
3,388 | 3.26 | 6,986 | 3.35 | 9,261 | 2.70 | ||||||||||||||||||||||
| Commercial paper |
16,202 | .12 | 15,973 | .12 | 15,885 | .20 | ||||||||||||||||||||||
| Other short-term borrowings |
5,762 | .29 | 6,473 | .26 | 6,635 | .59 | ||||||||||||||||||||||
| Total |
$ | 26,302 | .57 | % | $ | 30,468 | .89 | % | $ | 32,557 | .99 | % | ||||||||||||||||
| Average for the Year |
||||||||||||||||||||||||||||
| Federal funds purchased (b) |
$ | 1,338 | 15.32 | % | $ | 968 | 22.61 | % | $ | 2,180 | 10.09 | % | ||||||||||||||||
| Securities sold under agreements to repurchase |
4,942 | 3.52 | 7,483 | 3.22 | 9,211 | 2.75 | ||||||||||||||||||||||
| Commercial paper |
15,806 | .14 | 15,204 | .15 | 15,349 | .20 | ||||||||||||||||||||||
| Other short-term borrowings |
6,463 | .72 | 7,048 | .77 | 6,979 | .75 | ||||||||||||||||||||||
| Total (b) |
$ | 28,549 | 1.57 | % | $ | 30,703 | 1.75 | % | $ | 33,719 | 1.65 | % | ||||||||||||||||
| Maximum Month-End Balance |
||||||||||||||||||||||||||||
| Federal funds purchased |
$ | 2,467 | $ | 1,172 | $ | 6,034 | ||||||||||||||||||||||
| Securities sold under agreements to repurchase |
5,922 | 9,071 | 9,261 | |||||||||||||||||||||||||
| Commercial paper |
17,385 | 16,768 | 15,981 | |||||||||||||||||||||||||
| Other short-term borrowings |
7,443 | 7,514 | 8,700 | |||||||||||||||||||||||||
| (a) | Interest and rates are presented on a fully taxable-equivalent basis utilizing a tax rate of 35 percent. |
| (b) | Average federal funds purchased and total short-term borrowings rates include amounts paid by the Company to certain corporate card customers for paying outstanding noninterest-bearing corporate card balances within certain time frames per specific agreements. These activities reduce the Company’s short-term funding needs, and if they did not occur, the Company would use other funding alternatives, including the use of federal funds purchased. The amount of this compensation expense paid by the Company and included in federal funds purchased and total short-term borrowings rates for 2012, 2011 and 2010 was $203 million, $218 million and $216 million, respectively. |
| U.S. BANCORP | 105 |
| NOTE 12 | Long-Term Debt |
Long-term debt (debt with original maturities of more than one year) at December 31 consisted of the following:
| (Dollars in Millions) | Rate Type | Rate (a) | Maturity Date | 2012 | 2011 | |||||||||||||
| U.S. Bancorp (Parent Company) |
||||||||||||||||||
| Subordinated notes |
Fixed | 7.500 | % | 2026 | $ | 199 | $ | 199 | ||||||||||
| Fixed | 2.950 | % | 2022 | 1,300 | – | |||||||||||||
| Convertible senior debentures (b) |
Floating | – | % | 2035 | – | 10 | ||||||||||||
| Floating | – | % | 2036 | – | 10 | |||||||||||||
| Floating | – | % | 2037 | – | 21 | |||||||||||||
| Medium-term notes |
Fixed | 1.125% – 4.200 | % | 2013 – 2022 | 10,600 | 10,530 | ||||||||||||
| Floating | .694 | % | 2012 | – | 500 | |||||||||||||
| Junior subordinated debentures |
Fixed | 3.442 | % | 2016 | 500 | 500 | ||||||||||||
| Junior subordinated debentures held by unconsolidated trusts (b) |
Fixed | 6.300% – 6.625 | % | 2039 – 2067 | – | 2,691 | ||||||||||||
| Capitalized lease obligations, mortgage indebtedness and other (c) |
173 | 132 | ||||||||||||||||
| Subtotal |
12,772 | 14,593 | ||||||||||||||||
| Subsidiaries |
||||||||||||||||||
| Subordinated notes |
Fixed | 6.300 | % | 2014 | 963 | 963 | ||||||||||||
| Fixed |
4.950 | % | 2014 | 1,000 | 1,000 | |||||||||||||
| Fixed |
4.800 | % | 2015 | 500 | 500 | |||||||||||||
| Fixed |
4.375 | % | 2017 | – | 1,169 | |||||||||||||
| Fixed |
3.778 | % | 2020 | 500 | 500 | |||||||||||||
| Floating |
.620 | % | 2014 | 373 | 414 | |||||||||||||
| Federal Home Loan Bank advances |
Fixed | .500% – 8.250 | % | 2013 – 2026 | 16 | 3,710 | ||||||||||||
| Floating |
.311% – .575 | % | 2014 – 2022 | 4,579 | 4,332 | |||||||||||||
| Bank notes |
Fixed | 5.920 | % | 2012 | – | 99 | ||||||||||||
| Floating |
.058% – .062 | % | 2046 – 2048 | 143 | 1,146 | |||||||||||||
| Capitalized lease obligations, mortgage indebtedness and other (c) |
4,670 | 3,527 | ||||||||||||||||
| Subtotal |
12,744 | 17,360 | ||||||||||||||||
| Total |
$ | 25,516 | $ | 31,953 | ||||||||||||||
| (a) | Weighted-average interest rates of medium-term notes, Federal Home Loan Bank advances and bank notes were 2.55 percent, .36 percent and .06 percent, respectively. |
| (b) | All remaining outstanding balances were redeemed by the Company during 2012. |
| (c) | Other includes consolidated community development and tax-advantaged investment VIEs, debt issuance fees, and unrealized gains and losses and deferred amounts relating to derivative instruments. |
During 2011, a wholly-owned unconsolidated trust, formed for the purpose of issuing redeemable Income Trust Securities (“ITS”) to third party investors, sold the remaining $676 million of 5.54 percent fixed rate junior subordinated debentures, originally issued by the Company to the trust, to investors to generate cash proceeds to purchase the Company’s Series A Non-Cumulative Perpetual Preferred Stock (“Series A Preferred Stock”). As part of this sale, a consolidated subsidiary of the Company purchased $176 million of the junior subordinated debentures, which effectively retired the debt. The Company classifies the remaining $500 million as junior subordinated debentures in long-term debt. In addition, during 2012, the Company elected to redeem $2.7 billion of junior subordinated debentures issued to five other wholly-owned unconsolidated trusts that had interest payable at fixed rates ranging from 6.30 percent to 6.63 percent, and during 2011, the Company elected to redeem $618 million of junior subordinated debentures issued to four wholly-owned unconsolidated trusts that had interest payable at fixed rates ranging from 5.75 percent to 10.20 percent. There were no issuances of junior subordinated debentures in 2012 or 2011.
The Company has arrangements with the Federal Home Loan Bank and Federal Reserve Bank whereby the Company could have borrowed an additional $60.9 billion and $56.4 billion at December 31, 2012 and 2011, respectively, based on collateral available.
Maturities of long-term debt outstanding at December 31, 2012, were:
| (Dollars in Millions) | Parent Company |
Consolidated | ||||||
| 2013 |
$ | 2,849 | $ | 2,894 | ||||
| 2014 |
1,499 | 4,133 | ||||||
| 2015 |
1,747 | 3,084 | ||||||
| 2016 |
1,948 | 4,007 | ||||||
| 2017 |
1,246 | 2,773 | ||||||
| Thereafter |
3,483 | 8,625 | ||||||
| Total |
$ | 12,772 | $ | 25,516 | ||||
| 106 | U.S. BANCORP |
| NOTE 13 | Junior Subordinated Debentures |
As of December 31, 2012, the Company sponsored, and wholly owned 100 percent of the common equity of, USB Capital IX, a wholly-owned unconsolidated trust, formed for the purpose of issuing redeemable ITS to third party investors, originally investing the proceeds in junior subordinated debt securities (“Debentures”) issued by the Company and entering into stock purchase contracts to purchase preferred stock in the future. The Company’s obligations under the transaction documents, taken together, have the effect of providing a full and unconditional guarantee by the Company, on a junior subordinated basis, of the payment obligations of the trust. During 2010, the Company exchanged depositary shares representing an ownership interest in the Company’s Series A Preferred Stock to acquire a portion of the ITS issued by USB Capital IX. This exchange allowed the Company to retire $575 million of the Debentures and cancel a pro-rata portion of stock purchase contracts. During 2011, USB Capital IX sold the remaining $676 million of Debentures to investors to generate cash proceeds to be used to purchase the Company’s Series A Preferred Stock pursuant to the stock purchase contracts. As of December 31, 2012, $676 million of the Company’s Series A Preferred Stock is the sole asset of USB Capital IX.
As of December 31, 2011, the Company sponsored, and wholly owned 100 percent of the common equity of, five unconsolidated trusts that were formed for the purpose of issuing Company-obligated mandatorily redeemable preferred securities (“Trust Preferred Securities”) to third party investors and investing the proceeds from the sale of the Trust Preferred Securities solely in Debentures issued by the Company. The Debentures held by these trusts, which totaled $2.7 billion at December 31, 2011,were the sole assets of these trusts. During 2012, the Company elected to redeem all of the outstanding Debentures and dissolved the trusts.
| NOTE 14 | Shareholders’ Equity |
At December 31, 2012 and 2011, the Company had authority to issue 4 billion shares of common stock and 50 million shares of preferred stock. The Company had 1.9 billion shares of common stock outstanding at December 31, 2012 and 2011, and had 126 million shares reserved for future issuances, primarily under stock option plans, at December 31, 2012.
The number of shares issued and outstanding and the carrying amount of each outstanding series of the Company’s preferred stock was as follows:
| 2012 | 2011 | |||||||||||||||||||||||||||||||||
| At December 31 (Dollars in Millions) |
Shares Issued and Outstanding |
Liquidation Preference |
Discount | Carrying Amount |
Shares Issued and Outstanding |
Liquidation Preference |
Discount | Carrying Amount |
||||||||||||||||||||||||||
| Series A |
12,510 | $ | 1,251 | $ | 145 | $ | 1,106 | 12,510 | $ | 1,251 | $ | 145 | $ | 1,106 | ||||||||||||||||||||
| Series B |
40,000 | 1,000 | – | 1,000 | 40,000 | 1,000 | – | 1,000 | ||||||||||||||||||||||||||
| Series D |
20,000 | 500 | – | 500 | 20,000 | 500 | – | 500 | ||||||||||||||||||||||||||
| Series F |
44,000 | 1,100 | 12 | 1,088 | – | – | – | – | ||||||||||||||||||||||||||
| Series G |
43,400 | 1,085 | 10 | 1,075 | – | – | – | – | ||||||||||||||||||||||||||
| Total preferred stock (a) |
159,910 | $ | 4,936 | $ | 167 | $ | 4,769 | 72,510 | $ | 2,751 | $ | 145 | $ | 2,606 | ||||||||||||||||||||
| (a) | The par value of all shares issued and outstanding at December 31, 2012 and 2011, was $1.00 per share. |
During 2012, the Company issued depositary shares representing an ownership interest in 44,000 shares of Series F Non-Cumulative Perpetual Preferred Stock with a liquidation preference of $25,000 per share (the “Series F Preferred Stock”), and depositary shares representing an ownership interest in 43,400 shares of Series G Non-Cumulative Perpetual Preferred Stock with a liquidation preference of $25,000 per share (the “Series G Preferred Stock”). The Series F Preferred Stock and Series G Preferred Stock have no stated maturity and will not be subject to any sinking fund or other obligation of the Company. Dividends, if declared, will accrue and be payable quarterly, in arrears, at a rate per annum equal to 6.50 percent from the date of issuance to, but excluding, January 15, 2022, and thereafter at a floating rate per annum equal to three-month LIBOR plus 4.468 percent for the Series F Preferred Stock, and 6.00 percent from the date of issuance to, but excluding, April 15, 2017, and thereafter at a floating rate per annum equal to three-month LIBOR plus 4.86125 percent for the Series G Preferred Stock. Both series are redeemable at the Company’s option, in whole or in part, on or after January 15, 2022, for the Series F Preferred Stock and April 15, 2017, for the Series G Preferred Stock. Both series are redeemable at the Company’s option, in whole, but not in part, prior to January 15, 2022, for the Series F Preferred Stock and prior to April 15, 2017, for the Series G Preferred Stock, within 90 days following an official administrative or judicial decision, amendment to, or change in the laws or regulations that would not allow the Company
| U.S. BANCORP | 107 |
to treat the full liquidation value of the Series F Preferred Stock or Series G Preferred Stock, respectively, as Tier 1 capital for purposes of the capital adequacy guidelines of the Federal Reserve Board.
During 2010, the Company issued depositary shares representing an ownership interest in 5,746 shares of Series A Preferred Stock to investors, in exchange for their portion of USB Capital IX Income Trust Securities. During 2011, the Company issued depositary shares representing an ownership interest in 6,764 shares of Series A Preferred Stock to USB Capital IX, thereby settling the stock purchase contract established between the Company and USB Capital IX as part of the 2006 issuance of USB Capital IX Income Trust Securities. The preferred shares were issued to USB Capital IX for the purchase price specified in the stock forward purchase contract. The Series A Preferred stock has a liquidation preference of $100,000 per share, no stated maturity and will not be subject to any sinking fund or other obligation of the Company. Dividends, if declared, will accrue and be payable quarterly, in arrears, at a rate per annum equal to the greater of three-month LIBOR plus 1.02 percent or 3.50 percent. The Series A Preferred Stock is redeemable at the Company’s option, subject to prior approval by the Federal Reserve Board.
During 2006, the Company issued depositary shares representing an ownership interest in 40,000 shares of Series B Non-Cumulative Perpetual Preferred Stock with a liquidation preference of $25,000 per share (the “Series B Preferred Stock”), and during 2008, the Company issued depositary shares representing an ownership interest in 20,000 shares of Series D Non-Cumulative Perpetual Preferred Stock with a liquidation preference of $25,000 per share (the “Series D Preferred Stock”). The Series B Preferred Stock and Series D Preferred Stock have no stated maturity and will not be subject to any sinking fund or other obligation of the Company. Dividends, if declared, will accrue and be payable quarterly, in arrears, at a rate per annum equal to the greater of three-month LIBOR plus .60 percent, or 3.50 percent on the Series B Preferred Stock, and 7.875 percent per annum on the Series D Preferred Stock. Both series are redeemable at the Company’s option, on or after specific dates, subject to the prior approval of the Federal Reserve Board.
During 2012, 2011 and 2010, the Company repurchased shares of its common stock under various authorizations approved by its Board of Directors. As of December 31, 2012, the Company had approximately 54 million shares that may yet be purchased under the current Board of Directors approved authorization.
The following table summarizes the Company’s common stock repurchased in each of the last three years:
| (Dollars and Shares in Millions) | Shares | Value | ||||||
| 2012 |
59 | $ | 1,878 | |||||
| 2011 |
22 | 550 | ||||||
| 2010 |
1 | 16 | ||||||
| 108 | U.S. BANCORP |
Shareholders’ equity is affected by transactions and valuations of asset and liability positions that require adjustments to accumulated other comprehensive income (loss). The reconciliation of the transactions affecting accumulated other comprehensive income (loss) included in shareholders’ equity for the years ended December 31, is as follows:
| Transactions | Balances Net-of-Tax |
|||||||||||||||
| (Dollars in Millions) | Pre-tax | Tax-effect | Net-of-tax | |||||||||||||
| 2012 |
||||||||||||||||
| Changes in unrealized gains and losses on securities available-for-sale (a) |
$ | 491 | $ | (188 | ) | $ | 303 | $ | 679 | |||||||
| Other-than-temporary impairment not recognized in earnings on securities available-for-sale |
12 | (5 | ) | 7 | – | |||||||||||
| Changes in unrealized gains on securities transferred from available-for-sale to held-to-maturity (a) |
173 | (66 | ) | 107 | 107 | |||||||||||
| Changes in unrealized gains (losses) on derivative hedges |
(74 | ) | 28 | (46 | ) | (404 | ) | |||||||||
| Foreign currency translation |
14 | (5 | ) | 9 | (40 | ) | ||||||||||
| Reclassification to earnings of realized gains and losses |
376 | (144 | ) | 232 | – | |||||||||||
| Unrealized gains (losses) on retirement plans |
(543 | ) | 208 | (335 | ) | (1,265 | ) | |||||||||
| Total |
$ | 449 | $ | (172 | ) | $ | 277 | $ | (923 | ) | ||||||
| 2011 |
||||||||||||||||
| Changes in unrealized gains and losses on securities available-for-sale |
$ | 920 | $ | (351 | ) | $ | 569 | $ | 360 | |||||||
| Other-than-temporary impairment not recognized in earnings on securities available-for-sale |
(25 | ) | 10 | (15 | ) | – | ||||||||||
| Changes in unrealized gains (losses) on derivative hedges |
(343 | ) | 130 | (213 | ) | (489 | ) | |||||||||
| Foreign currency translation |
(16 | ) | 6 | (10 | ) | (49 | ) | |||||||||
| Reclassification to earnings of realized gains and losses |
363 | (138 | ) | 225 | – | |||||||||||
| Unrealized gains (losses) on retirement plans |
(464 | ) | 177 | (287 | ) | (1,022 | ) | |||||||||
| Total |
$ | 435 | $ | (166 | ) | $ | 269 | $ | (1,200 | ) | ||||||
| 2010 |
||||||||||||||||
| Changes in unrealized gains and losses on securities available-for-sale |
$ | 277 | $ | (105 | ) | $ | 172 | $ | (213 | ) | ||||||
| Other-than-temporary impairment not recognized in earnings on securities available-for-sale |
(66 | ) | 25 | (41 | ) | – | ||||||||||
| Changes in unrealized gains (losses) on derivative hedges |
(383 | ) | 148 | (235 | ) | (414 | ) | |||||||||
| Foreign currency translation |
24 | (10 | ) | 14 | (39 | ) | ||||||||||
| Reclassification to earnings of realized gains and losses |
365 | (139 | ) | 226 | – | |||||||||||
| Unrealized gains (losses) on retirement plans |
(197 | ) | 76 | (121 | ) | (803 | ) | |||||||||
| Total |
$ | 20 | $ | (5 | ) | $ | 15 | $ | (1,469 | ) | ||||||
| (a) | Transactions reflect unrealized gains on securities transferred from available-for-sale to held-to-maturity at the date of transfer. |
Regulatory Capital The measures used to assess capital by bank regulatory agencies include two principal risk-based ratios, Tier 1 and total risk-based capital. Tier 1 capital is considered core capital and includes common shareholders’ equity plus qualifying preferred stock, trust preferred securities and noncontrolling interests in consolidated subsidiaries (subject to certain limitations), and is adjusted for the aggregate impact of certain items included in other comprehensive income (loss). Total risk-based capital includes Tier 1 capital and other items such as subordinated debt and the allowance for credit losses. Both measures are stated as a percentage of risk-adjusted assets, which are measured based on their perceived credit risk and include certain off-balance sheet exposures, such as unfunded loan commitments, letters of credit, and derivative contracts. The Company is also subject to a leverage ratio requirement, a non risk-based asset ratio, which is defined as Tier 1 capital as a percentage of average assets adjusted for goodwill and other non-qualifying intangibles and other assets.
For a summary of the regulatory capital requirements and the actual ratios as of December 31, 2012 and 2011, for the Company and its bank subsidiaries, see Table 22 included in Management’s Discussion and Analysis, which is incorporated by reference into these Notes to Consolidated Financial Statements.
| U.S. BANCORP | 109 |
The following table provides the components of the Company’s regulatory capital at December 31:
| (Dollars in Millions) | 2012 | 2011 | ||||||
| Tier 1 Capital |
||||||||
| Common shareholders’ equity |
$ | 34,229 | $ | 31,372 | ||||
| Qualifying preferred stock |
4,769 | 2,606 | ||||||
| Qualifying trust preferred securities |
– | 2,675 | ||||||
| Noncontrolling interests, less preferred stock not eligible for Tier 1 capital |
685 | 687 | ||||||
| Less intangible assets |
||||||||
| Goodwill (net of deferred tax liability) |
(8,351 | ) | (8,239 | ) | ||||
| Other disallowed intangible assets |
(829 | ) | (905 | ) | ||||
| Other (a) |
700 | 977 | ||||||
| Total Tier 1 Capital |
31,203 | 29,173 | ||||||
| Tier 2 Capital |
||||||||
| Eligible portion of allowance for credit losses |
3,609 | 3,412 | ||||||
| Eligible subordinated debt |
2,953 | 3,469 | ||||||
| Other |
15 | 13 | ||||||
| Total Tier 2 Capital |
6,577 | 6,894 | ||||||
| Total Risk Based Capital |
$ | 37,780 | $ | 36,067 | ||||
| Risk-Weighted Assets |
$ | 287,611 | $ | 271,333 | ||||
| (a) | Includes the impact of items included in other comprehensive income (loss), such as unrealized gains (losses) on available-for-sale securities, accumulated net gains on cash flow hedges, pension liability adjustments, etc. |
Noncontrolling interests principally represent preferred stock of consolidated subsidiaries. During 2006, the Company’s primary banking subsidiary formed USB Realty Corp., a real estate investment trust, for the purpose of issuing 5,000 shares of Fixed-to-Floating Rate Exchangeable Non-cumulative Perpetual Series A Preferred Stock with a liquidation preference of $100,000 per share (“Series A Preferred Securities”) to third party investors, and investing the proceeds in certain assets, consisting predominately of mortgage-backed securities from the Company. Dividends on the Series A Preferred Securities, if declared, will accrue and be payable quarterly, in arrears, at a rate per annum equal to three-month LIBOR plus 1.147 percent. If USB Realty Corp. has not declared a dividend on the Series A Preferred Securities before the dividend payment date for any dividend period, such dividend shall not be cumulative and shall cease to accrue and be payable, and USB Realty Corp. will have no obligation to pay dividends accrued for such dividend period, whether or not dividends on the Series A Preferred Securities are declared for any future dividend period.
The Series A Preferred Securities will be redeemable, in whole or in part, at the option of USB Realty Corp. on each fifth anniversary after the dividend payment date occurring in January 2012, and in whole but not in part, at the option of USB Realty Corp. on any dividend date that is not a five-year date. Any redemption will be subject to the approval of the Office of the Comptroller of the Currency.
| NOTE 15 | Earnings Per Share |
The components of earnings per share were:
| Year Ended December 31 (Dollars and Shares in Millions, Except Per Share Data) |
2012 | 2011 | 2010 | |||||||||
| Net income attributable to U.S. Bancorp |
$ | 5,647 | $ | 4,872 | $ | 3,317 | ||||||
| Preferred dividends |
(238 | ) | (129 | ) | (89 | ) | ||||||
| Equity portion of gain on ITS exchange transaction, net of tax (a) |
– | – | 118 | |||||||||
| Earnings allocated to participating stock awards |
(26 | ) | (22 | ) | (14 | ) | ||||||
| Net income applicable to U.S. Bancorp common shareholders |
$ | 5,383 | $ | 4,721 | $ | 3,332 | ||||||
| Average common shares outstanding |
1,887 | 1,914 | 1,912 | |||||||||
| Net effect of the exercise and assumed purchase of stock awards and conversion of outstanding convertible notes |
9 | 9 | 9 | |||||||||
| Average diluted common shares outstanding |
1,896 | 1,923 | 1,921 | |||||||||
| Earnings per common share |
$ | 2.85 | $ | 2.47 | $ | 1.74 | ||||||
| Diluted earnings per common share |
$ | 2.84 | $ | 2.46 | $ | 1.73 | ||||||
| (a) | During 2010, the Company exchanged depositary shares representing an ownership interest in 5,746 shares of Series A Preferred Stock for approximately 46 percent of the outstanding ITS issued by USB Capital IX to third party investors, retired a pro-rata portion of the related junior subordinated debentures and cancelled a pro-rata portion of the related stock purchase contracts. |
| 110 | U.S. BANCORP |
Options and warrants outstanding at December 31, 2012, 2011 and 2010, to purchase 22 million, 54 million and 56 million common shares, respectively, were not included in the computation of diluted earnings per share for the years ended December 31, 2012, 2011 and 2010, respectively, because they were antidilutive. Convertible senior debentures that could potentially be converted into shares of the Company’s common stock pursuant to specified formulas, were not included in the computation of dilutive earnings per share because they were antidilutive.
| NOTE 16 | Employee Benefits |
Employee Retirement Savings Plan The Company has a defined contribution retirement savings plan that covers substantially all its employees. Qualified employees are allowed to contribute up to 75 percent of their annual compensation, subject to Internal Revenue Service limits, through salary deductions under Section 401(k) of the Internal Revenue Code. Employee contributions are invested, at the employees’ direction, among a variety of investment alternatives. Employee contributions are 100 percent matched by the Company, up to four percent of an employee’s eligible annual compensation. The Company’s matching contribution vests immediately. Although the matching contribution is initially invested in the Company’s common stock, an employee can reinvest the matching contribution among various investment alternatives. Total expense for the Company’s matching contributions was $111 million, $103 million and $96 million in 2012, 2011 and 2010, respectively.
Pension Plans The Company has tax qualified noncontributory defined benefit pension plans that provide benefits to substantially all its employees. Participants receive annual cash balance pay credits based on eligible pay multiplied by a percentage determined by their age and years of service. Participants also receive an annual interest credit. Employees become vested upon completing three years of vesting service. For participants in the plan before 2010 that elected to stay under their existing formula, pension benefits are provided to eligible employees based on years of service, multiplied by a percentage of their final average pay. As a result of plan mergers, a portion of pension benefits may also be provided using a cash balance benefit formula where only interest credits continue to be credited to participants’ accounts.
In general, the Company’s qualified pension plans’ funding objectives include maintaining a funded status sufficient to meet participant benefit obligations over time while reducing long-term funding requirements and pension costs. The Company has an established process for evaluating all of the plans, their performance and significant plan assumptions, including the assumed discount rate and the long-term rate of return (“LTROR”). Annually, the Company’s Compensation and Human Resources Committee (the “Committee”), assisted by outside consultants, evaluates plan objectives, funding policies and plan investment policies considering its long-term investment time horizon and asset allocation strategies. The process also evaluates significant plan assumptions. Although plan assumptions are established annually, the Company may update its analysis on an interim basis in order to be responsive to significant events that occur during the year, such as plan mergers and amendments.
The Company’s funding policy is to contribute amounts to its plans sufficient to meet the minimum funding requirements of the Employee Retirement Income Security Act of 1974, as amended by the Pension Protection Act, plus such additional amounts as the Company determines to be appropriate. The Company made a contribution of $35 million to its main pension plan in 2012, and made no contributions to its qualified pension plans in 2011. The Company anticipates making contributions of $207 million to its main pension plan in 2013. Any contributions made to the qualified plans are invested in accordance with established investment policies and asset allocation strategies.
In addition to the funded qualified pension plans, the Company maintains non-qualified plans that are unfunded and provide benefits to certain employees. The assumptions used in computing the accumulated benefit obligation, the projected benefit obligation and net pension expense are substantially consistent with those assumptions used for the funded qualified plans. In 2013, the Company expects to contribute $23 million to its non-qualified pension plans which equals the 2013 expected benefit payments.
Postretirement Welfare Plan In addition to providing pension benefits, the Company provides health care and death benefits to certain retired employees. Generally, all active employees may become eligible for subsidized retiree health care benefits by meeting defined age and service requirements. The medical plan contains other cost-sharing features such as deductibles and coinsurance. The estimated cost of these retiree benefit payments is accrued during the employees’ active service. Contributions have previously been made to the plan, and in 2013, the Company anticipates no contributions to its postretirement welfare plan.
| U.S. BANCORP | 111 |
The following table summarizes the changes in benefit obligations and plan assets for the years ended December 31, and the funded status and amounts recognized in the Consolidated Balance Sheet at December 31 for the retirement plans:
| Pension Plans |
Postretirement Welfare Plan |
|||||||||||||||||
| (Dollars in Millions) | 2012 | 2011 | 2012 | 2011 | ||||||||||||||
| Change in Projected Benefit Obligation |
||||||||||||||||||
| Benefit obligation at beginning of measurement period |
$ | 3,261 | $ | 2,929 | $ | 170 | $ | 181 | ||||||||||
| Service cost |
129 | 119 | 5 | 4 | ||||||||||||||
| Interest cost |
168 | 169 | 7 | 9 | ||||||||||||||
| Plan participants’ contributions |
– | – | 10 | 13 | ||||||||||||||
| Actuarial loss (gain) |
681 | 177 | (26 | ) | (15 | ) | ||||||||||||
| Lump sum settlements |
(33 | ) | (28 | ) | – | – | ||||||||||||
| Benefit payments |
(110 | ) | (105 | ) | (26 | ) | (25 | ) | ||||||||||
| Federal subsidy on benefits paid |
– | – | 2 | 3 | ||||||||||||||
| Benefit obligation at end of measurement period (a) |
$ | 4,096 | $ | 3,261 | $ | 142 | $ | 170 | ||||||||||
| Change in Fair Value of Plan Assets |
||||||||||||||||||
| Fair value at beginning of measurement period |
$ | 2,103 | $ | 2,305 | $ | 120 | $ | 131 | ||||||||||
| Actual return on plan assets |
305 | (90 | ) | – | – | |||||||||||||
| Employer contributions |
56 | 21 | 1 | 1 | ||||||||||||||
| Plan participants’ contributions |
– | – | 10 | 13 | ||||||||||||||
| Lump sum settlements |
(33 | ) | (28 | ) | – | – | ||||||||||||
| Benefit payments |
(110 | ) | (105 | ) | (26 | ) | (25 | ) | ||||||||||
| Fair value at end of measurement period |
$ | 2,321 | $ | 2,103 | $ | 105 | $ | 120 | ||||||||||
| Funded (Unfunded) Status |
$ | (1,775 | ) | $ | (1,158 | ) | $ | (37 | ) | $ | (50 | ) | ||||||
| Components of the Consolidated Balance Sheet |
||||||||||||||||||
| Current benefit liability |
$ | (23 | ) | $ | (21 | ) | $ | – | $ | – | ||||||||
| Noncurrent benefit liability |
(1,752 | ) | (1,137 | ) | (37 | ) | (50 | ) | ||||||||||
| Recognized amount |
$ | (1,775 | ) | $ | (1,158 | ) | $ | (37 | ) | $ | (50 | ) | ||||||
| Accumulated Other Comprehensive Income (Loss), Pretax |
||||||||||||||||||
| Net actuarial gain (loss) |
$ | (2,152 | ) | $ | (1,746 | ) | $ | 84 | $ | 67 | ||||||||
| Net prior service credit (cost) |
21 | 25 | – | – | ||||||||||||||
| Recognized amount |
$ | (2,131 | ) | $ | (1,721 | ) | $ | 84 | $ | 67 | ||||||||
| (a) | At December 31, 2012 and 2011, the accumulated benefit obligation for all pension plans was $3.8 billion and $3.0 billion, respectively. |
The following table provides information for pension plans with benefit obligations in excess of plan assets at December 31:
| (Dollars in Millions) | 2012 | 2011 | ||||||
| Pension Plans with Projected Benefit Obligations in Excess of Plan Assets |
||||||||
| Projected benefit obligation |
$ | 4,096 | $ | 3,261 | ||||
| Fair value of plan assets |
2,321 | 2,103 | ||||||
| Pension Plans with Accumulated Benefit Obligations in Excess of Plan Assets |
||||||||
| Accumulated benefit obligation |
3,776 | 2,986 | ||||||
| Fair value of plan assets |
2,321 | 2,066 | ||||||
| 112 | U.S. BANCORP |
The following table sets forth the components of net periodic benefit cost and other amounts recognized in accumulated other comprehensive income (loss) for the years ended December 31 for the retirement plans:
| Pension Plans | Postretirement Welfare Plan | |||||||||||||||||||||||||
| (Dollars in Millions) | 2012 | 2011 | 2010 | 2012 | 2011 | 2010 | ||||||||||||||||||||
| Components of Net Periodic Benefit Cost |
||||||||||||||||||||||||||
| Service cost |
$ | 129 | $ | 119 | $ | 93 | $ | 5 | $ | 4 | $ | 7 | ||||||||||||||
| Interest cost |
168 | 169 | 155 | 7 | 9 | 11 | ||||||||||||||||||||
| Expected return on plan assets |
(191 | ) | (207 | ) | (215 | ) | (2 | ) | (5 | ) | (5 | ) | ||||||||||||||
| Prior service cost (credit) and transition obligation (asset) amortization |
(4 | ) | (9 | ) | (12 | ) | – | – | – | |||||||||||||||||
| Actuarial loss (gain) amortization |
161 | 125 | 64 | (7 | ) | (6 | ) | (5 | ) | |||||||||||||||||
| Net periodic benefit cost |
$ | 263 | $ | 197 | $ | 85 | $ | 3 | $ | 2 | $ | 8 | ||||||||||||||
| Other Changes in Plan Assets and Benefit Obligations |
||||||||||||||||||||||||||
| Recognized in Other Comprehensive Income (Loss) |
||||||||||||||||||||||||||
| Net actuarial gain (loss) arising during the year |
$ | (567 | ) | $ | (474 | ) | $ | (203 | ) | $ | 24 | $ | 10 | $ | 6 | |||||||||||
| Net actuarial loss (gain) amortized during the year |
161 | 125 | 64 | (7 | ) | (6 | ) | (5 | ) | |||||||||||||||||
| Net prior service credit (cost) arising during the year |
– | – | – | – | – | – | ||||||||||||||||||||
| Net prior service cost (credit) and transition obligation (asset) amortized during the year |
(4 | ) | (9 | ) | (12 | ) | – | – | – | |||||||||||||||||
| Total recognized in other comprehensive income (loss) |
$ | (410 | ) | $ | (358 | ) | $ | (151 | ) | $ | 17 | $ | 4 | $ | 1 | |||||||||||
| Total recognized in net periodic benefit cost and other comprehensive income (loss) (a) (b) |
$ | (673 | ) | $ | (555 | ) | $ | (236 | ) | $ | 14 | $ | 2 | $ | (7 | ) | ||||||||||
| (a) | The pretax estimated actuarial loss (gain) and prior service cost (credit) for the pension plans that will be amortized from accumulated other comprehensive income (loss) into net periodic benefit cost in 2013 are $264 million and $(5) million, respectively. |
| (b) | The pretax estimated actuarial loss (gain) for the postretirement welfare plan that will be amortized from accumulated other comprehensive income (loss) into net periodic benefit cost in 2013 is $(11) million. |
The following table sets forth weighted average assumptions used to determine the projected benefit obligations at December 31:
| Pension Plans | Postretirement Welfare Plan |
|||||||||||||||||
| (Dollars in Millions) | 2012 | 2011 | 2012 | 2011 | ||||||||||||||
| Discount rate (a) |
4.1 | % | 5.1 | % | 3.1 | % | 4.3 | % | ||||||||||
| Rate of compensation increase (b) |
4.1 | 4.1 | * | * | ||||||||||||||
| Health care cost trend rate for the next year (c) |
||||||||||||||||||
| Prior to age 65 |
8.0 | % | 8.0 | % | ||||||||||||||
| After age 65 |
8.0 | 12.0 | ||||||||||||||||
| Effect on accumulated postretirement benefit obligation |
||||||||||||||||||
| One percent increase |
$ | 5 | $ | 8 | ||||||||||||||
| One percent decrease |
(5 | ) | (8 | ) | ||||||||||||||
| (a) | The discount rates were developed using a cash flow matching bond model with a modified duration for the qualified pension plans, non-qualified pension plans and postretirement welfare plan of 15.9, 12.2 and 7.2 years, respectively, for 2012, and 14.8, 11.4 and 7.7 years, respectively, for 2011. |
| (b) | Determined on a liability weighted basis. |
| (c) | The pre-65 and post-65 rates are assumed to decrease gradually to 5.0 percent by 2019 and remain at this level thereafter. |
| * | Not applicable |
| U.S. BANCORP | 113 |
The following table sets forth weighted average assumptions used to determine net periodic benefit cost for the years ended December 31:
| Pension Plans | Postretirement Welfare Plan | |||||||||||||||||||||||||
| (Dollars in Millions) | 2012 | 2011 | 2010 | 2012 | 2011 | 2010 | ||||||||||||||||||||
| Discount rate (a) |
5.1 | % | 5.7 | % | 6.2 | % | 4.3 | % | 4.9 | % | 5.6 | % | ||||||||||||||
| Expected return on plan assets (b) |
8.0 | 8.3 | 8.5 | 2.3 | 3.5 | 3.5 | ||||||||||||||||||||
| Rate of compensation increase (c) |
4.1 | 4.0 | 3.0 | * | * | * | ||||||||||||||||||||
| Health care cost trend rate (d) |
||||||||||||||||||||||||||
| Prior to age 65 |
8.0 | % | 8.0 | % | 8.0 | % | ||||||||||||||||||||
| After age 65 |
12.0 | 14.0 | 14.0 | |||||||||||||||||||||||
| Effect on total of service cost and interest cost |
||||||||||||||||||||||||||
| One percent increase |
$ | – | $ | – | $ | – | ||||||||||||||||||||
| One percent decrease |
– | – | – | |||||||||||||||||||||||
| (a) | The discount rates were developed using a cash flow matching bond model with a modified duration for the qualified pension plans, non-qualified pension plans and postretirement welfare plan of 14.8, 11.4 and 7.7 years, respectively, for 2012, and 14.0, 11.0 and 7.7 years, respectively, for 2011. |
| (b) | With the help of an independent pension consultant, a range of potential expected rates of return, economic conditions historical performance relative to assumed rates of return and asset allocation, and peer group LTROR information are used in developing the plan assumptions for its expected long-term rates of return on plan assets. The Company determined its 2012 expected long-term rates of return reflecting current economic conditions and plan assets. |
| (c) | Determined on a liability weighted basis. |
| (d) | The pre-65 and post-65 rates are assumed to decrease gradually to 5.5 percent by 2017 and 6.0 percent by 2015, respectively, and remain at these levels thereafter. |
| * | Not applicable |
Investment Policies and Asset Allocation In establishing its investment policies and asset allocation strategies, the Company considers expected returns and the volatility associated with different strategies. An independent consultant performs modeling that projects numerous outcomes using a broad range of possible scenarios, including a mix of possible rates of inflation and economic growth. Starting with current economic information, the model bases its projections on past relationships between inflation, fixed income rates and equity returns when these types of economic conditions have existed over the previous 30 years, both in the United States and in foreign countries.
Generally, based on historical performance of the various investment asset classes, investments in equities have outperformed other investment classes but are subject to higher volatility. While an asset allocation including debt securities and other assets generally has lower volatility and may provide protection in a declining interest rate environment, it limits the pension plans’ long-term up-side potential. Given the pension plans’ investment horizon and the financial viability of the Company to meet its funding objectives, the Committee has determined that an asset allocation strategy investing principally in global equities diversified among various domestic and international equity categories is appropriate. The target asset allocation for the Company’s qualified pension plans at December 31, 2012 was 35 percent passively managed global equities, 25 percent actively managed global equities, 10 percent mid-small cap equities, 5 percent emerging markets equities, 5 percent real estate equities, and 20 percent debt securities. The target asset allocation at December 31, 2011 was 45 percent passively managed global equities, 25 percent actively managed global equities, 10 percent mid-small cap equities, 5 percent emerging markets equities, 5 percent real estate equities, and 10 percent debt securities.
At December 31, 2012 and 2011, plan assets of the qualified pension plans included asset management arrangements with related parties totaling $168 million and $95 million, respectively.
Under a contractual agreement with U.S. Bancorp Asset Management, Inc. an affiliate of the Company, certain plan assets are lent to qualified borrowers on a short-term basis in exchange for investment fee income. These borrowers may collateralize the loaned securities with either cash or non-cash securities. Cash collateral held at December 31, 2012 and 2011 totaled $14 million and $12 million, respectively, with obligations to return the cash collateral of $20 million at December 31, 2012 and 2011.
Per authoritative accounting guidance, the Company groups plan assets into a three-level hierarchy for valuation techniques used to measure their fair value based on whether the valuation inputs are observable or unobservable. Refer to Note 20 for further discussion on these levels.
The assets of the qualified pension plans include investments in equity and U.S. Treasury securities whose fair values are determined based on quoted prices in active markets and are classified within Level 1 of the fair value hierarchy. The qualified pension plans also invest in collective investment and mutual funds whose fair values are determined using the net asset value provided by the administrator of the fund and as a result are classified as Level 2. In addition, the qualified pension plans invest in debt securities and foreign currency transactions that are valued using third party pricing services and are classified as Level 2. The qualified pension
| 114 | U.S. BANCORP |
plan invests in a money market mutual fund with cash collateral from its securities lending arrangement, whose fair value is determined based on quoted prices in markets that are less active and therefore is classified as Level 2. Additionally, the qualified pension plan has investments in limited partnership interests and debt securities whose fair values are determined by the Company by analyzing the limited partnerships’ audited financial statements and by averaging the prices obtained from independent pricing services, respectively. These securities are classified as Level 3.
The following table summarizes the plan investment assets measured at fair value at December 31:
| Pension Plans | Postretirement Welfare Plan |
|||||||||||||||||||||||||||||||||||||
| 2012 | 2011 | 2012 | 2011 | |||||||||||||||||||||||||||||||||||
| (Dollars in Millions) | Level 1 | Level 2 | Level 3 | Level 1 | Level 2 | Level 3 | Level 1 | Level 1 | ||||||||||||||||||||||||||||||
| Cash and cash equivalents |
$ | 119 | $ | – | $ | – | $ | 23 | $ | – | $ | – | $ | 105 | $ | 120 | ||||||||||||||||||||||
| Debt securities |
151 | 114 | 7 | 63 | 36 | 7 | – | – | ||||||||||||||||||||||||||||||
| Corporate stock |
||||||||||||||||||||||||||||||||||||||
| Domestic equity securities |
275 | – | – | 232 | – | – | – | – | ||||||||||||||||||||||||||||||
| Mid-small cap equity securities |
173 | – | – | 159 | – | – | – | – | ||||||||||||||||||||||||||||||
| International equity securities |
285 | – | – | 250 | – | – | – | – | ||||||||||||||||||||||||||||||
| Real estate equity securities |
132 | – | – | 103 | – | – | – | – | ||||||||||||||||||||||||||||||
| Collective investment funds |
||||||||||||||||||||||||||||||||||||||
| Domestic equity securities |
– | 400 | – | – | 509 | – | – | – | ||||||||||||||||||||||||||||||
| Mid-small cap equity securities |
– | 59 | – | – | 53 | – | – | – | ||||||||||||||||||||||||||||||
| Emerging markets equity securities |
– | 61 | – | – | 51 | – | – | – | ||||||||||||||||||||||||||||||
| International equity securities |
– | 362 | – | – | 455 | – | – | – | ||||||||||||||||||||||||||||||
| Mutual funds |
||||||||||||||||||||||||||||||||||||||
| Money market |
– | 7 | – | – | 6 | – | – | – | ||||||||||||||||||||||||||||||
| Debt securities |
– | 129 | – | – | 127 | – | – | – | ||||||||||||||||||||||||||||||
| Emerging markets equity securities |
– | 71 | – | – | 50 | – | – | – | ||||||||||||||||||||||||||||||
| Other |
– | (7 | ) | 3 | – | (7 | ) | 6 | – | – | ||||||||||||||||||||||||||||
| Total (a) |
$ | 1,135 | $ | 1,196 | $ | 10 | $ | 830 | $ | 1,280 | $ | 13 | $ | 105 | $ | 120 | ||||||||||||||||||||||
| (a) | Total investment assets of the pension plans exclude obligations to return cash collateral to qualified borrowers of $20 million at December 31, 2012 and 2011, under security lending arrangements. |
The following table summarizes the changes in fair value for all plan investment assets measured at fair value using significant unobservable inputs (Level 3) for the years ended December 31:
| 2012 | 2011 | 2010 | ||||||||||||||||||||||||||
| (Dollars in Millions) | Debt Securities |
Other | Debt Securities |
Other | Debt Securities |
Other | ||||||||||||||||||||||
| Balance at beginning of period |
$ | 7 | $ | 6 | $ | 8 | $ | 6 | $ | 7 | $ | 6 | ||||||||||||||||
| Unrealized gains (losses) relating to assets still held at end of year |
1 | (2 | ) | — | (9 | ) | 3 | — | ||||||||||||||||||||
| Purchases, sales, and settlements, net |
(1 | ) | (1 | ) | (1 | ) | 9 | (2 | ) | — | ||||||||||||||||||
| Balance at end of period |
$ | 7 | $ | 3 | $ | 7 | $ | 6 | $ | 8 | $ | 6 | ||||||||||||||||
The following benefit payments are expected to be paid from the retirement plans for the years ended December 31:
| (Dollars in Millions) | Pension Plans |
Postretirement Welfare Plan (a) |
Medicare Part D Subsidy Receipts |
|||||||||||||
| 2013 |
$ | 161 | $ | 16 | $ | 2 | ||||||||||
| 2014 |
166 | 16 | 2 | |||||||||||||
| 2015 |
174 | 17 | 2 | |||||||||||||
| 2016 |
184 | 17 | 2 | |||||||||||||
| 2017 |
190 | 17 | 3 | |||||||||||||
| 2018 — 2022 |
1,096 | 80 | 14 | |||||||||||||
| (a) | Net of expected retiree contributions and before Medicare Part D subsidy. |
| U.S. BANCORP | 115 |
| NOTE 17 | Stock-Based Compensation |
As part of its employee and director compensation programs, the Company may grant certain stock awards under the provisions of the existing stock compensation plans, including plans assumed in acquisitions. The plans provide for grants of options to purchase shares of common stock at a fixed price equal to the fair value of the underlying stock at the date of grant. Option grants are generally exercisable up to ten years from the date of grant. In addition, the plans provide for grants of shares of common stock or stock units that are subject to restriction on transfer prior to vesting. Most stock and unit awards vest over three to five years and are subject to forfeiture if certain vesting requirements are not met. Stock incentive plans of acquired companies are generally terminated at the merger closing dates. Participants under such plans receive the Company’s common stock, or options to buy the Company’s stock, based on the conversion terms of the various merger agreements. At December 31, 2012, there were 58 million shares (subject to adjustment for forfeitures) available for grant under various plans.
Stock Option Awards
The following is a summary of stock options outstanding and exercised under various stock options plans of the Company:
| Year Ended December 31 | Stock Options/Shares |
Weighted- Average Exercise Price |
Weighted-Average Remaining Contractual Term |
Aggregate Intrinsic Value (in millions) |
||||||||||||
| 2012 |
||||||||||||||||
| Number outstanding at beginning of period |
75,823,941 | $ | 27.60 | |||||||||||||
| Granted |
4,180,492 | 28.65 | ||||||||||||||
| Exercised |
(15,681,323 | ) | 23.12 | |||||||||||||
| Cancelled (a) |
(1,151,192 | ) | 24.90 | |||||||||||||
| Number outstanding at end of period (b) |
63,171,918 | $ | 28.83 | 4.9 | $ | 196 | ||||||||||
| Exercisable at end of period |
50,671,654 | $ | 30.12 | 4.2 | $ | 92 | ||||||||||
| 2011 |
||||||||||||||||
| Number outstanding at beginning of period |
85,622,705 | $ | 26.80 | |||||||||||||
| Granted |
4,063,369 | 28.66 | ||||||||||||||
| Exercised |
(8,508,107 | ) | 19.49 | |||||||||||||
| Cancelled (a) |
(5,354,026 | ) | 28.44 | |||||||||||||
| Number outstanding at end of period (b) |
75,823,941 | $ | 27.60 | 5.2 | $ | (42 | ) | |||||||||
| Exercisable at end of period |
57,039,334 | $ | 29.14 | 4.4 | $ | (120 | ) | |||||||||
| 2010 |
||||||||||||||||
| Number outstanding at beginning of period |
88,379,469 | $ | 26.49 | |||||||||||||
| Granted |
5,417,631 | 23.98 | ||||||||||||||
| Exercised |
(5,769,586 | ) | 19.38 | |||||||||||||
| Cancelled (a) |
(2,404,809 | ) | 27.03 | |||||||||||||
| Number outstanding at end of period (b) |
85,622,705 | $ | 26.80 | 5.5 | $ | 15 | ||||||||||
| Exercisable at end of period |
57,542,065 | $ | 28.28 | 4.4 | $ | (76 | ) | |||||||||
| (a) | Options cancelled include both non-vested (i.e., forfeitures) and vested options. |
| (b) | Outstanding options include stock-based awards that may be forfeited in future periods. The impact of the estimated forfeitures is reflected in compensation expense. |
Stock-based compensation expense is based on the estimated fair value of the award at the date of grant or modification. The fair value of each option award is estimated on the date of grant using the Black-Scholes option-pricing model, requiring the use of subjective assumptions. Because employee stock options have characteristics that differ from those of traded options, including vesting provisions and trading limitations that impact their liquidity, the determined value used to measure compensation expense may vary from their actual fair value. The following table includes the weighted average estimated fair value and assumptions utilized by the Company for newly issued grants:
| Year Ended December 31 | 2012 | 2011 | 2010 | |||||||||
| Estimated fair value |
$ | 10.19 | $ | 10.55 | $ | 8.36 | ||||||
| Risk-free interest rates |
.9 | % | 2.5 | % | 2.5 | % | ||||||
| Dividend yield |
2.6 | % | 2.5 | % | 3.0 | % | ||||||
| Stock volatility factor |
.49 | .47 | .47 | |||||||||
| Expected life of options (in years) |
5.5 | 5.5 | 5.5 | |||||||||
| 116 | U.S. BANCORP |
Expected stock volatility is based on several factors including the historical volatility of the Company’s stock, implied volatility determined from traded options and other factors. The Company uses historical data to estimate option exercises and employee terminations to estimate the expected life of options. The risk-free interest rate for the expected life of the options is based on the U.S. Treasury yield curve in effect on the date of grant. The expected dividend yield is based on the Company’s expected dividend yield over the life of the options.
The following summarizes certain stock option activity of the Company:
| Year Ended December 31 (Dollars in Millions) | 2012 | 2011 | 2010 | |||||||||
| Fair value of options vested |
$ | 49 | $ | 54 | $ | 61 | ||||||
| Intrinsic value of options exercised |
143 | 61 | 35 | |||||||||
| Cash received from options exercised |
362 | 165 | 112 | |||||||||
| Tax benefit realized from options exercised |
75 | 23 | 13 | |||||||||
To satisfy option exercises, the Company predominantly uses treasury stock.
Additional information regarding stock options outstanding as of December 31, 2012, is as follows:
| Outstanding Options | Exercisable Options | |||||||||||||||||||||
| Range of Exercise Prices | Shares | Weighted- Average Remaining Contractual Life (Years) |
Weighted- Average Exercise Price |
Shares | Weighted- Average Exercise Price |
|||||||||||||||||
| $11.02 – $15.00 |
6,877,581 | 6.1 | $ | 11.39 | 3,922,950 | $ | 11.37 | |||||||||||||||
| $15.01 – $20.00 |
186,439 | 3.7 | 19.35 | 171,651 | 19.47 | |||||||||||||||||
| $20.01 – $25.00 |
4,241,644 | 7.1 | 23.82 | 1,831,981 | 23.79 | |||||||||||||||||
| $25.01 – $30.00 |
17,691,503 | 5.4 | 29.05 | 10,591,999 | 29.36 | |||||||||||||||||
| $30.01 – $35.00 |
24,669,720 | 4.2 | 31.69 | 24,648,451 | 31.69 | |||||||||||||||||
| $35.01 – $36.25 |
9,505,031 | 4.0 | 36.06 | 9,504,622 | 36.06 | |||||||||||||||||
| 63,171,918 | 4.9 | $ | 28.83 | 50,671,654 | $ | 30.12 | ||||||||||||||||
Restricted Stock and Unit Awards
A summary of the status of the Company’s restricted shares of stock and unit awards is presented below:
| 2012 | 2011 | 2010 | ||||||||||||||||||||||||||
| Year Ended December 31 | Shares | Weighted- Average Grant-Date Fair Value |
Shares | Weighted- Average Grant-Date Fair Value |
Shares | Weighted- Average Grant-Date Fair Value |
||||||||||||||||||||||
| Nonvested Shares |
||||||||||||||||||||||||||||
| Outstanding at beginning of period |
8,995,295 | $ | 22.46 | 8,811,027 | $ | 19.74 | 6,788,203 | $ | 16.68 | |||||||||||||||||||
| Granted |
3,085,077 | 28.70 | 3,136,086 | 28.20 | 4,398,660 | 24.05 | ||||||||||||||||||||||
| Vested |
(2,931,820 | ) | 20.97 | (2,552,979 | ) | 20.15 | (1,862,228 | ) | 18.71 | |||||||||||||||||||
| Cancelled |
(212,809 | ) | 25.01 | (398,839 | ) | 22.20 | (513,608 | ) | 20.00 | |||||||||||||||||||
| Outstanding at end of period |
8,935,743 | (a) | $ | 25.04 | 8,995,295 | $ | 22.46 | 8,811,027 | $ | 19.74 | ||||||||||||||||||
| (a) | Includes maximum number of shares to be received by participants under awards that are based on the achievement of certain future performance criteria by the Company. |
The total fair value of shares vested was $86 million, $72 million and $44 million for 2012, 2011 and 2010, respectively. Stock-based compensation expense was $129 million, $118 million and $113 million for 2012, 2011 and 2010, respectively. On an after-tax basis, stock-based compensation was $80 million, $73 million and $70 million for 2012, 2011 and 2010, respectively. As of December 31, 2012, there was $151 million of total unrecognized compensation cost related to nonvested share-based arrangements granted under the plans. That cost is expected to be recognized over a weighted-average period of 2.4 years as compensation expense.
| U.S. BANCORP | 117 |
| NOTE 18 | Income Taxes |
The components of income tax expense were:
| Year Ended December 31 (Dollars in Millions) | 2012 | 2011 | 2010 | |||||||||
| Federal |
||||||||||||
| Current |
$ | 1,853 | $ | 907 | $ | 1,105 | ||||||
| Deferred |
45 | 689 | (339 | ) | ||||||||
| Federal income tax |
1,898 | 1,596 | 766 | |||||||||
| State |
||||||||||||
| Current |
334 | 186 | 200 | |||||||||
| Deferred |
4 | 59 | (31 | ) | ||||||||
| State income tax |
338 | 245 | 169 | |||||||||
| Total income tax provision |
$ | 2,236 | $ | 1,841 | $ | 935 | ||||||
A reconciliation of expected income tax expense at the federal statutory rate of 35 percent to the Company’s applicable income tax expense follows:
| Year Ended December 31 (Dollars in Millions) | 2012 | 2011 | 2010 | |||||||||
| Tax at statutory rate |
$ | 2,704 | $ | 2,320 | $ | 1,470 | ||||||
| State income tax, at statutory rates, net of federal tax benefit |
220 | 159 | 110 | |||||||||
| Tax effect of |
||||||||||||
| Tax credits, net of related expenses |
(479 | ) | (458 | ) | (462 | ) | ||||||
| Tax-exempt income |
(219 | ) | (226 | ) | (214 | ) | ||||||
| Noncontrolling interests |
55 | 29 | 18 | |||||||||
| Other items |
(45 | ) | 17 | 13 | ||||||||
| Applicable income taxes |
$ | 2,236 | $ | 1,841 | $ | 935 | ||||||
The tax effects of fair value adjustments on securities available-for-sale, derivative instruments in cash flow hedges, foreign currency translation adjustments, pension and post-retirement plans and certain tax benefits related to stock options are recorded directly to shareholders’ equity as part of other comprehensive income (loss).
In preparing its tax returns, the Company is required to interpret complex tax laws and regulations and utilize income and cost allocation methods to determine its taxable income. On an ongoing basis, the Company is subject to examinations by federal, state, local and foreign taxing authorities that may give rise to differing interpretations of these complex laws, regulations and methods. Due to the nature of the examination process, it generally takes years before these examinations are completed and matters are resolved. Changes in income tax expense and associated liabilities related to the resolution of income tax examinations in 2012, 2011 and 2010 were not significant. Federal tax examinations for all years ending through December 31, 2008, are completed and resolved. The Company’s tax returns for the years ended December 31, 2009 and 2010 are under examination by the Internal Revenue Service. The years open to examination by state and local government authorities vary by jurisdiction.
A reconciliation of the changes in the federal, state and foreign unrecognized tax position balances are summarized as follows:
| Year Ended December 31 (Dollars in Millions) | 2012 | 2011 | 2010 | |||||||||
| Balance at beginning of period |
$ | 479 | $ | 532 | $ | 440 | ||||||
| Additions for tax positions taken in prior years |
73 | 24 | 116 | |||||||||
| Additions for tax positions taken in the current year |
5 | 2 | 30 | |||||||||
| Exam resolutions |
(245 | ) | (70 | ) | – | |||||||
| Statute expirations |
(10 | ) | (9 | ) | (54 | ) | ||||||
| Balance at end of period |
$ | 302 | $ | 479 | $ | 532 | ||||||
The total amount of unrecognized tax positions that, if recognized, would impact the effective income tax rate as of December 31, 2012, 2011 and 2010, were $240 million, $220 million and $253 million, respectively. The change in unrecognized tax position balances in 2012 from exam resolutions relates to determination of the timing of deductions for losses on various securities and debt obligations. The Company classifies interest and penalties related to unrecognized tax positions as a component of income tax expense. At December 31, 2012, the Company’s uncertain tax position balances included $39 million in accrued interest. During the years ended December 31, 2012,
| 118 | U.S. BANCORP |
2011 and 2010 the Company recorded approximately $(8) million, $(2) million and $(6) million, respectively, in interest on unrecognized tax positions.
Deferred income tax assets and liabilities reflect the tax effect of estimated temporary differences between the carrying amounts of assets and liabilities for financial reporting purposes and the amounts used for the same items for income tax reporting purposes.
The significant components of the Company’s net deferred tax asset (liability) as of December 31 were:
| (Dollars in Millions) | 2012 | 2011 | ||||||
| Deferred Tax Assets |
||||||||
| Allowance for credit losses |
$ | 1,756 | $ | 1,872 | ||||
| Pension and postretirement benefits |
523 | 281 | ||||||
| Accrued expenses |
476 | 399 | ||||||
| Stock compensation |
183 | 203 | ||||||
| Federal, state and foreign net operating loss carryforwards |
60 | 26 | ||||||
| Securities available-for-sale and financial instruments |
– | 85 | ||||||
| Partnerships and other investment assets |
395 | 571 | ||||||
| Other deferred tax assets, net |
180 | 96 | ||||||
| Gross deferred tax assets |
3,573 | 3,533 | ||||||
| Deferred Tax Liabilities |
||||||||
| Leasing activities |
(2,792 | ) | (3,048 | ) | ||||
| Goodwill and other intangible assets |
(565 | ) | (517 | ) | ||||
| Mortgage servicing rights |
(490 | ) | (522 | ) | ||||
| Securities available-for-sale and financial instruments |
(232 | ) | – | |||||
| Loans |
(168 | ) | (175 | ) | ||||
| Fixed assets |
(201 | ) | (169 | ) | ||||
| Other deferred tax liabilities, net |
(361 | ) | (176 | ) | ||||
| Gross deferred tax liabilities |
(4,809 | ) | (4,607 | ) | ||||
| Valuation allowance |
(84 | ) | (51 | ) | ||||
| Net Deferred Tax Asset (Liability) |
$ | (1,320 | ) | $ | (1,125 | ) | ||
The Company has approximately $723 million of federal, state and foreign net operating loss carryforwards which expire at various times through 2032. Limitations on the ability to realize these carryforwards is reflected in the associated valuation allowance. Management has determined it is more likely than not the other net deferred tax assets could be realized through carry back to taxable income in prior years, future reversals of existing taxable temporary differences and future taxable income.
At December 31, 2012, retained earnings included approximately $102 million of base year reserves of acquired thrift institutions, for which no deferred federal income tax liability has been recognized. These base year reserves would be recaptured if the Company’s banking subsidiaries cease to qualify as a bank for federal income tax purposes. The base year reserves also remain subject to income tax penalty provisions that, in general, require recapture upon certain stock redemptions of, and excess distributions to, stockholders.
| NOTE 19 | Derivative Instruments |
The Company recognizes all derivatives in the Consolidated Balance Sheet at fair value in other assets or in other liabilities. On the date the Company enters into a derivative contract, the derivative is designated as either a hedge of the fair value of a recognized asset or liability (“fair value hedge”); a hedge of a forecasted transaction or the variability of cash flows to be paid related to a recognized asset or liability (“cash flow hedge”); a hedge of the volatility of an investment in foreign operations driven by changes in foreign currency exchange rates (“net investment hedge”); or a designation is not made as it is a customer-related transaction, an economic hedge for asset/liability risk management purposes or another stand-alone derivative created through the Company’s operations (“free-standing derivative”).
| U.S. BANCORP | 119 |
The following table provides information on the fair value of the Company’s derivative positions as of December 31:
| 2012 | 2011 | |||||||||||||||||
| (Dollars in Millions) | Asset Derivatives |
Liability Derivatives |
Asset Derivatives |
Liability Derivatives |
||||||||||||||
| Total fair value of derivative positions |
$ | 1,806 | $ | 2,183 | $ | 1,913 | $ | 2,554 | ||||||||||
| Netting (a) |
(418 | ) | (1,549 | ) | (294 | ) | (1,889 | ) | ||||||||||
| Total |
$ | 1,388 | $ | 634 | $ | 1,619 | $ | 665 | ||||||||||
| (a) | Represents netting of derivative asset and liability balances, and related collateral, with the same counterparty subject to master netting agreements. At December 31, 2012, the amount of collateral posted by counterparties, consisting primarily of cash and money market investments, that was netted against derivative assets was $84 million and the amount of cash collateral posted by the Company that was netted against derivative liabilities was $1.2 billion, compared with $88 million and $1.7 billion, respectively, at December 31, 2011. |
Of the Company’s $62.0 billion of total notional amount of asset and liability management positions at December 31, 2012, $12.8 billion was designated as a fair value, cash flow or net investment hedge. When a derivative is designated as a fair value, cash flow or net investment hedge, the Company performs an assessment, at inception and, at a minimum, quarterly thereafter, to determine the effectiveness of the derivative in offsetting changes in the value or cash flows of the hedged item(s).
Fair Value Hedges These derivatives are primarily interest rate swaps that hedge the change in fair value related to interest rate changes of underlying fixed-rate debt and junior subordinated debentures. Changes in the fair value of derivatives designated as fair value hedges, and changes in the fair value of the hedged items, are recorded in earnings. All fair value hedges were highly effective for the year ended December 31, 2012, and the change in fair value attributed to hedge ineffectiveness was not material.
Cash Flow Hedges These derivatives are interest rate swaps that are hedges of the forecasted cash flows from the underlying variable-rate loans and debt. Changes in the fair value of derivatives designated as cash flow hedges are recorded in other comprehensive income (loss) until the cash flows of the hedged items are realized. If a derivative designated as a cash flow hedge is terminated or ceases to be highly effective, the gain or loss in other comprehensive income (loss) is amortized to earnings over the period the forecasted hedged transactions impact earnings. If a hedged forecasted transaction is no longer probable, hedge accounting is ceased and any gain or loss included in other comprehensive income (loss) is reported in earnings immediately, unless the forecasted transaction is at least reasonably possible of occurring, whereby the amounts within other comprehensive income (loss) remain. At December 31, 2012, the Company had $404 million (net-of-tax) of realized and unrealized losses on derivatives classified as cash flow hedges recorded in other comprehensive income (loss), compared with $489 million (net-of-tax) at December 31, 2011. The estimated amount to be reclassified from other comprehensive income (loss) into earnings during the next 12 months is a loss of $133 million (net-of-tax). This amount includes gains and losses related to hedges that were terminated early for which the forecasted transactions are still probable. All cash flow hedges were highly effective for the year ended December 31, 2012, and the change in fair value attributed to hedge ineffectiveness was not material.
Net Investment Hedges The Company uses forward commitments to sell specified amounts of certain foreign currencies, and occasionally non-derivative debt instruments, to hedge the volatility of its investment in foreign operations driven by fluctuations in foreign currency exchange rates. The ineffectiveness on all net investment hedges was not material for the year ended December 31, 2012. There were no non-derivative debt instruments designated as net investment hedges at December 31, 2012 or 2011.
Other Derivative Positions The Company enters into free-standing derivatives to mitigate interest rate risk and for other risk management purposes. These derivatives include forward commitments to sell to-be-announced securities (“TBAs”) and other commitments to sell residential mortgage loans, which are used to economically hedge the interest rate risk related to residential mortgage loans held for sale and unfunded mortgage loan commitments. The Company also enters into interest rate swaps, forward commitments to buy TBAs, U.S. Treasury futures and options on U.S. Treasury futures to economically hedge the change in the fair value of the Company’s MSRs. The Company also enters into foreign currency forwards to economically hedge remeasurement gains and losses the Company recognizes on foreign currency denominated assets and liabilities. In addition, the Company acts as a seller and buyer of interest rate derivatives and foreign exchange contracts for its customers. To mitigate the market and liquidity risk associated with these customer derivatives, the Company enters into similar offsetting positions with broker-dealers. The Company also has derivative contracts that are created through its operations, including commitments to originate mortgage loans held for sale and certain derivative financial guarantee contracts.
For additional information on the Company’s purpose for entering into derivative transactions and its overall risk management strategies, refer to “Management Discussion and Analysis — Use of Derivatives to Manage Interest Rate and Other Risks” which is incorporated by reference into these Notes to Consolidated Financial Statements.
| 120 | U.S. BANCORP |
The following table summarizes the asset and liability management derivative positions of the Company:
| Asset Derivatives | Liability Derivatives | |||||||||||||||||||||||||
| (Dollars in Millions) | Notional Value |
Fair Value |
Weighted-Average Remaining Maturity In Years |
Notional Value |
Fair Value |
Weighted-Average Remaining Maturity In Years |
||||||||||||||||||||
| December 31, 2012 |
||||||||||||||||||||||||||
| Fair value hedges |
||||||||||||||||||||||||||
| Interest rate contracts |
||||||||||||||||||||||||||
| Receive fixed/pay floating swaps |
$ | 500 | $ | 30 | 3.09 | $ | – | $ | – | – | ||||||||||||||||
| Cash flow hedges |
||||||||||||||||||||||||||
| Interest rate contracts |
||||||||||||||||||||||||||
| Pay fixed/receive floating swaps |
32 | – | 9.88 | 4,528 | 718 | 3.79 | ||||||||||||||||||||
| Receive fixed/pay floating swaps |
7,000 | 45 | 1.84 | – | – | – | ||||||||||||||||||||
| Net investment hedges |
||||||||||||||||||||||||||
| Foreign exchange forward contracts |
758 | 1 | .07 | – | – | – | ||||||||||||||||||||
| Other economic hedges |
||||||||||||||||||||||||||
| Interest rate contracts |
||||||||||||||||||||||||||
| Futures and forwards |
||||||||||||||||||||||||||
| Buy |
11,164 | 138 | .07 | 2,921 | 13 | .04 | ||||||||||||||||||||
| Sell |
6,299 | 18 | .11 | 12,223 | 57 | .09 | ||||||||||||||||||||
| Options |
||||||||||||||||||||||||||
| Purchased |
2,435 | – | .07 | – | – | – | ||||||||||||||||||||
| Written |
4,991 | 123 | .12 | 4 | – | .06 | ||||||||||||||||||||
| Receive fixed/pay floating swaps |
350 | 1 | 10.21 | 3,775 | 14 | 10.21 | ||||||||||||||||||||
| Foreign exchange forward contracts |
618 | 4 | .03 | 1,383 | 6 | .01 | ||||||||||||||||||||
| Equity contracts |
31 | – | 2.80 | 27 | – | 2.46 | ||||||||||||||||||||
| Credit contracts |
1,056 | 3 | 4.56 | 1,947 | 10 | 3.11 | ||||||||||||||||||||
| December 31, 2011 |
||||||||||||||||||||||||||
| Fair value hedges |
||||||||||||||||||||||||||
| Interest rate contracts |
||||||||||||||||||||||||||
| Receive fixed/pay floating swaps |
500 | 27 | 4.09 | – | – | – | ||||||||||||||||||||
| Foreign exchange cross-currency swaps |
688 | 17 | 5.17 | 432 | 23 | 5.17 | ||||||||||||||||||||
| Cash flow hedges |
||||||||||||||||||||||||||
| Interest rate contracts |
||||||||||||||||||||||||||
| Pay fixed/receive floating swaps |
– | – | – | 4,788 | 803 | 4.03 | ||||||||||||||||||||
| Receive fixed/pay floating swaps |
750 | – | 2.75 | 6,250 | 6 | 2.86 | ||||||||||||||||||||
| Net investment hedges |
||||||||||||||||||||||||||
| Foreign exchange forward contracts |
708 | 4 | .08 | – | – | – | ||||||||||||||||||||
| Other economic hedges |
||||||||||||||||||||||||||
| Interest rate contracts |
||||||||||||||||||||||||||
| Futures and forwards |
||||||||||||||||||||||||||
| Buy |
14,270 | 150 | .07 | 29 | – | .12 | ||||||||||||||||||||
| Sell |
231 | 1 | .15 | 14,415 | 134 | .11 | ||||||||||||||||||||
| Options |
||||||||||||||||||||||||||
| Purchased |
1,250 | – | .07 | – | – | – | ||||||||||||||||||||
| Written |
4,421 | 80 | .10 | 11 | 1 | .13 | ||||||||||||||||||||
| Receive fixed/pay floating swaps |
2,625 | 9 | 10.21 | – | – | – | ||||||||||||||||||||
| Foreign exchange forward contracts |
307 | 1 | .08 | 1,414 | 11 | .08 | ||||||||||||||||||||
| Equity contracts |
54 | 1 | 1.05 | 10 | – | .64 | ||||||||||||||||||||
| Credit contracts |
800 | 7 | 3.71 | 1,600 | 8 | 3.59 | ||||||||||||||||||||
| U.S. BANCORP | 121 |
The following table summarizes the customer-related derivative positions of the Company:
| Asset Derivatives | Liability Derivatives | |||||||||||||||||||||||||
| (Dollars in Millions) | Notional Value |
Fair Value |
Weighted-Average Remaining Maturity In Years |
Notional Value |
Fair Value |
Weighted-Average Remaining Maturity In Years |
||||||||||||||||||||
| December 31, 2012 |
||||||||||||||||||||||||||
| Interest rate contracts |
||||||||||||||||||||||||||
| Receive fixed/pay floating swaps |
$ | 16,671 | $ | 1,085 | 4.78 | $ | 1,090 | $ | 15 | 9.30 | ||||||||||||||||
| Pay fixed/receive floating swaps |
928 | 14 | 11.12 | 16,923 | 1,042 | 4.74 | ||||||||||||||||||||
| Options |
||||||||||||||||||||||||||
| Purchased |
3,046 | 16 | 5.24 | 28 | – | 4.42 | ||||||||||||||||||||
| Written |
286 | – | .75 | 2,788 | 16 | 5.68 | ||||||||||||||||||||
| Foreign exchange rate contracts |
||||||||||||||||||||||||||
| Forwards, spots and swaps (a) |
12,186 | 322 | .43 | 11,861 | 286 | .44 | ||||||||||||||||||||
| Options |
||||||||||||||||||||||||||
| Purchased |
323 | 6 | .55 | – | – | – | ||||||||||||||||||||
| Written |
– | – | – | 323 | 6 | .55 | ||||||||||||||||||||
| December 31, 2011 |
||||||||||||||||||||||||||
| Interest rate contracts |
||||||||||||||||||||||||||
| Receive fixed/pay floating swaps |
16,230 | 1,216 | 4.98 | 523 | 1 | 2.52 | ||||||||||||||||||||
| Pay fixed/receive floating swaps |
99 | – | 1.81 | 16,206 | 1,182 | 5.10 | ||||||||||||||||||||
| Options |
||||||||||||||||||||||||||
| Purchased |
2,660 | 26 | 6.11 | – | – | – | ||||||||||||||||||||
| Written |
– | – | – | 2,660 | 26 | 6.11 | ||||||||||||||||||||
| Foreign exchange rate contracts |
||||||||||||||||||||||||||
| Forwards, spots and swaps (a) |
7,936 | 369 | .54 | 7,731 | 354 | .54 | ||||||||||||||||||||
| Options |
||||||||||||||||||||||||||
| Purchased |
127 | 5 | .41 | – | – | – | ||||||||||||||||||||
| Written |
– | – | – | 127 | 5 | .41 | ||||||||||||||||||||
| (a) | Reflects the net of long and short positions. |
The table below shows the effective portion of the gains (losses) recognized in other comprehensive income (loss) and the gains (losses) reclassified from other comprehensive income (loss) into earnings (net-of-tax) for the years ended December 31:
| Gains (Losses) Recognized in Other Comprehensive Income (Loss) |
Gains (Losses) Reclassified from Other Comprehensive Income (Loss) into Earnings |
|||||||||||||||||||||||||
| (Dollars in Millions) | 2012 | 2011 | 2010 | 2012 | 2011 | 2010 | ||||||||||||||||||||
| Asset and Liability Management Positions |
||||||||||||||||||||||||||
| Cash flow hedges |
||||||||||||||||||||||||||
| Interest rate contracts (a) |
$ | (46 | ) | $ | (213 | ) | $ | (235 | ) | $ | (131 | ) | $ | (138 | ) | $ | (148 | ) | ||||||||
| Net investment hedges |
||||||||||||||||||||||||||
| Foreign exchange forward contracts |
(19 | ) | 34 | (25 | ) | – | – | – | ||||||||||||||||||
| Non-derivative debt instruments |
20 | – | – | – | – | – | ||||||||||||||||||||
| Note: | Ineffectiveness on cash flow and net investment hedges was not material for the years ended December 31, 2012, 2011 and 2010. |
| (a) | Gains (Losses) reclassified from other comprehensive income (loss) into interest income on loans and interest expense on long-term debt. |
| 122 | U.S. BANCORP |
The table below shows the gains (losses) recognized in earnings for fair value hedges, other economic hedges and the customer-related positions for the years ended December 31:
| (Dollars in Millions) | Location of Gains (Losses) Recognized in Earnings |
2012 | 2011 | 2010 | ||||||||||
| Asset and Liability Management Positions |
||||||||||||||
| Fair value hedges (a) |
||||||||||||||
| Interest rate contracts |
Other noninterest income | $ | 3 | $ | (36 | ) | $ | (31 | ) | |||||
| Foreign exchange cross-currency swaps |
Other noninterest income | 42 | (69 | ) | (193 | ) | ||||||||
| Other economic hedges |
||||||||||||||
| Interest rate contracts |
||||||||||||||
| Futures and forwards |
Mortgage banking revenue | 437 | 23 | 831 | ||||||||||
| Purchased and written options |
Mortgage banking revenue | 854 | 456 | 425 | ||||||||||
| Receive fixed/pay floating swaps |
Mortgage banking revenue | 175 | 518 | – | ||||||||||
| Pay fixed/receive floating swaps |
Mortgage banking revenue | – | 1 | – | ||||||||||
| Foreign exchange forward contracts |
Commercial products revenue | (63 | ) | (81 | ) | (16 | ) | |||||||
| Equity contracts |
Compensation expense | 2 | 1 | 1 | ||||||||||
| Credit contracts |
Other noninterest income/expense | (8 | ) | – | (6 | ) | ||||||||
| Customer-Related Positions |
||||||||||||||
| Interest rate contracts |
||||||||||||||
| Receive fixed/pay floating swaps |
Other noninterest income | (118 | ) | 302 | 201 | |||||||||
| Pay fixed/receive floating swaps |
Other noninterest income | 124 | (317 | ) | (196 | ) | ||||||||
| Purchased and written options |
Other noninterest income | – | – | 1 | ||||||||||
| Foreign exchange rate contracts |
||||||||||||||
| Forwards, spots and swaps |
Commercial products revenue | 50 | 53 | 49 | ||||||||||
| Purchased and written options |
Commercial products revenue | – | – | 1 | ||||||||||
| (a) | Gains (Losses) on items hedged by interest rate contracts and foreign exchange forward contracts, included in noninterest income (expense), were $(3) million and $(44) million for the year ended December 31, 2012, respectively, $29 million and $72 million for the year ended December 31, 2011, respectively, and $35 million and $193 million for the year ended December 31, 2010, respectively. The ineffective portion was immaterial for the years ended December 31, 2012, 2011 and 2010. |
Derivatives are subject to credit risk associated with counterparties to the derivative contracts. The Company measures that credit risk using a credit valuation adjustment and includes it within the fair value of the derivative. The Company manages counterparty credit risk through diversification of its derivative positions among various counterparties, by entering into master netting agreements and, where possible, by requiring collateral agreements. A master netting agreement allows two counterparties, who have multiple derivative contracts with each other, the ability to net settle amounts under all contracts, including any related collateral posted, through a single payment and in a single currency. Collateral agreements require the counterparty to post, on a daily basis, collateral (typically cash or money market investments) equal to the Company’s net derivative receivable. For highly-rated counterparties, the agreements may include minimum dollar posting thresholds, but allow for the Company to call for immediate, full collateral coverage when credit-rating thresholds are triggered by counterparties.
The Company’s collateral agreements are bilateral and, therefore, contain provisions that require collateralization of the Company’s net liability derivative positions. Required collateral coverage is based on certain net liability thresholds and contingent upon the Company’s credit rating from two of the nationally recognized statistical rating organizations. If the Company’s credit rating were to fall below credit ratings thresholds established in the collateral agreements, the counterparties to the derivatives could request immediate full collateral coverage for derivatives in net liability positions. The aggregate fair value of all derivatives under collateral agreements that were in a net liability position at December 31, 2012, was $1.6 billion. At December 31, 2012, the Company had $1.2 billion of cash posted as collateral against this net liability position.
| NOTE 20 | Fair Values of Assets and Liabilities |
The Company uses fair value measurements for the initial recording of certain assets and liabilities, periodic remeasurement of certain assets and liabilities, and disclosures. Derivatives, trading and available-for-sale investment securities, certain mortgage loans held for sale (“MLHFS”) and MSRs are recorded at fair value on a recurring basis. Additionally, from time to time, the Company may be required to record at fair value other assets on a nonrecurring basis, such as loans held for sale, loans held for investment and certain other assets. These nonrecurring fair value adjustments typically involve application of lower-of-cost-or-fair value accounting or impairment write-downs of individual assets.
Fair value is defined as the exchange price that would be received for an asset or paid to transfer a liability (an exit price) in the principal or most advantageous market for the asset or liability in an orderly transaction between market participants on the measurement date. A fair value
| U.S. BANCORP | 123 |
measurement reflects all of the assumptions that market participants would use in pricing the asset or liability, including assumptions about the risk inherent in a particular valuation technique, the effect of a restriction on the sale or use of an asset, and the risk of nonperformance.
The Company groups its assets and liabilities measured at fair value into a three-level hierarchy for valuation techniques used to measure financial assets and financial liabilities at fair value. This hierarchy is based on whether the valuation inputs are observable or unobservable. These levels are:
| • | Level 1 — Quoted prices in active markets for identical assets or liabilities. Level 1 includes U.S. Treasury and exchange-traded instruments. |
| • | Level 2 — Observable inputs other than Level 1 prices, such as quoted prices for similar assets or liabilities; quoted prices in markets that are not active; or other inputs that are observable or can be corroborated by observable market data for substantially the full term of the assets or liabilities. Level 2 includes debt securities that are traded less frequently than exchange-traded instruments and which are typically valued using third party pricing services; derivative contracts and other assets and liabilities, including securities, whose value is determined using a pricing model with inputs that are observable in the market or can be derived principally from or corroborated by observable market data; and MLHFS whose values are determined using quoted prices for similar assets or pricing models with inputs that are observable in the market or can be corroborated by observable market data. |
| • | Level 3 — Unobservable inputs that are supported by little or no market activity and that are significant to the fair value of the assets or liabilities. Level 3 assets and liabilities include financial instruments whose values are determined using pricing models, discounted cash flow methodologies, or similar techniques, as well as instruments for which the determination of fair value requires significant management judgment or estimation. This category includes MSRs, certain debt securities and certain derivative contracts. |
When the Company changes its valuation inputs for measuring financial assets and financial liabilities at fair value, either due to changes in current market conditions or other factors, it may need to transfer those assets or liabilities to another level in the hierarchy based on the new inputs used. The Company recognizes these transfers at the end of the reporting period that the transfers occur. During the years ended December 31, 2012, 2011 and 2010, there were no transfers of financial assets or financial liabilities between the hierarchy levels.
The Company has processes and controls in place to increase the reliability of estimates it makes in determining fair value measurements. Items quoted on an exchange are verified to the quoted price. Items provided by a third party pricing service are subject to price verification procedures as discussed in more detail in the specific valuation discussions provided in the section that follows. For fair value measurements modeled internally, the Company’s valuation models are subject to the Company’s Model Risk Governance Policy and Program, as maintained by the Company’s credit administration department. The purpose of model validation is to assess the accuracy of the models’ input, processing, and reporting components. All models are required to be independently reviewed and approved prior to being placed in use, and are subject to formal change control procedures. Under the Company’s Model Risk Governance Policy, models are required to be reviewed at least annually to ensure they are operating as intended. Inputs into the models are market observable inputs whenever available. When market observable inputs are not available, the inputs are developed based upon analysis of historical experience and evaluation of other relevant market data. Significant unobservable model inputs are subject to review by senior management in corporate functions, who are independent from the modeling. Significant unobservable model inputs are also compared to actual results, typically on a quarterly basis. Significant Level 3 fair value measurements are also subject to corporate-level review and are benchmarked to market transactions or other market data, when available. Additional discussion of processes and controls are provided in the valuation methodologies section that follows.
The following section describes the valuation methodologies used by the Company to measure financial assets and liabilities at fair value and for estimating fair value for financial instruments not recorded at fair value as required under disclosure guidance related to the fair value of financial instruments. In addition, the following section includes an indication of the level of the fair value hierarchy in which the assets or liabilities are classified. Where appropriate, the description includes information about the valuation models and key inputs to those models. During 2012, 2011 and 2010, there were no significant changes to the valuation techniques used by the Company to measure fair value.
Cash and Due From Banks The carrying value of cash and due from banks approximate fair value and are classified within Level 1. Fair value is provided for disclosure purposes only.
Federal Funds Sold and Securities Purchased Under Resale Agreements The carrying value of federal funds sold and securities purchased under resale agreements approximate fair value because of the relatively short time between the origination of the instrument and its expected realization and are classified within Level 2. Fair value is provided for disclosure purposes only.
| 124 | U.S. BANCORP |
Investment Securities When quoted market prices for identical securities are available in an active market, these prices are used to determine fair value and these securities are classified within Level 1 of the fair value hierarchy. Level 1 investment securities are predominantly U.S. Treasury securities.
For other securities, quoted market prices may not be readily available for the specific securities. When possible, the Company determines fair value based on market observable information, including quoted market prices for similar securities, inactive transaction prices, and broker quotes. These securities are classified within Level 2 of the fair value hierarchy. Level 2 valuations are generally provided by a third party pricing service. The Company reviews the valuation methodologies utilized by the pricing service and, on a quarterly basis, reviews the security level prices provided by the pricing service against management’s expectation of fair value, based on changes in various benchmarks and market knowledge from recent trading activity. Additionally, each quarter, the Company validates the fair value provided by the pricing services by comparing them to recent observable market trades (where available), broker provided quotes, or other independent secondary pricing sources. Prices obtained from the pricing service are adjusted if they are found to be inconsistent with observable market data. Level 2 investment securities are predominantly agency mortgage-backed securities, certain other asset-backed securities, municipal securities, corporate debt securities, agency debt securities and perpetual preferred securities.
The fair value of securities for which there are no market trades, or where trading is inactive as compared to normal market activity, are classified within Level 3 of the fair value hierarchy. The Company determines the fair value of these securities using a discounted cash flow methodology and incorporating observable market information, where available. These valuations are modeled by a unit within the Company’s treasury department. The valuations use assumptions regarding housing prices, interest rates and borrower performance. Inputs are refined and updated at least quarterly to reflect market developments and actual performance. The primary valuation drivers of these securities are the prepayment rates, default rates and default severities associated with the underlying collateral, as well as the discount rate used to calculate the present value of the projected cash flows. Level 3 fair values, including the assumptions used, are subject to review by senior management in corporate functions, who are independent from the modeling. The fair value measurements are also compared to fair values provided by third party pricing services, where available. Securities classified within Level 3 include non-agency mortgage-backed securities, non-agency commercial mortgage-backed securities, certain asset-backed securities, certain collateralized debt obligations and collateralized loan obligations, certain corporate debt securities and SIV-related securities.
Mortgage Loans Held For Sale MLHFS measured at fair value, for which an active secondary market and readily available market prices exist, are initially valued at the transaction price and are subsequently valued by comparison to instruments with similar collateral and risk profiles. MLHFS are classified within Level 2. Included in mortgage banking revenue was a $287 million net gain, a $15 million net gain and a $125 million net loss, for the years ended December 31, 2012, 2011 and 2010, respectively, from the changes to fair value of these MLHFS under fair value option accounting guidance. Changes in fair value due to instrument specific credit risk were immaterial. Interest income for MLHFS is measured based on contractual interest rates and reported as interest income in the Consolidated Statement of Income. Electing to measure MLHFS at fair value reduces certain timing differences and better matches changes in fair value of these assets with changes in the value of the derivative instruments used to economically hedge them without the burden of complying with the requirements for hedge accounting.
Loans The loan portfolio includes adjustable and fixed-rate loans, the fair value of which was estimated using discounted cash flow analyses and other valuation techniques. The expected cash flows of loans considered historical prepayment experiences and estimated credit losses and were discounted using current rates offered to borrowers of similar credit characteristics. Generally, loan fair values reflect Level 3 information. Fair value is provided for disclosure purposes only, with the exception of impaired collateral-based loans that are measured at fair value on a non-recurring basis utilizing the underlying collateral fair value.
Mortgage Servicing Rights MSRs are valued using a discounted cash flow methodology. Accordingly, MSRs are classified within Level 3. The Company determines fair value by estimating the present value of the asset’s future cash flows using prepayment rates, discount rates, and other assumptions. The MSR valuations, as well as the assumptions used, are developed by the mortgage banking division and are subject to review by senior management in corporate functions, who are independent from the modeling. The MSR valuations and assumptions are validated through comparison to trade information and industry surveys when available, and are also compared to independent third party valuations each quarter. Risks inherent in MSR valuation include higher than expected prepayment rates and/or delayed receipt of cash flows. There is minimal market activity for MSRs, therefore the determination of fair value requires significant management judgment. Refer to Note 9 for further information on MSR valuation assumptions.
| U.S. BANCORP | 125 |
Derivatives The majority of derivatives held by the Company are executed over-the-counter and are valued using standard cash flow, Black-Derman-Toy and Monte Carlo valuation techniques. The models incorporate inputs, depending on the type of derivative, including interest rate curves, foreign exchange rates and volatility. In addition, all derivative values incorporate an assessment of the risk of counterparty nonperformance, measured based on the Company’s evaluation of credit risk as well as external assessments of credit risk, where available. The Company monitors and manages its nonperformance risk by considering its ability to net derivative positions under master netting agreements, as well as collateral received or provided under collateral support agreements. Accordingly, the Company has elected to measure the fair value of derivatives, at a counterparty level, on a net basis. The majority of the derivatives are classified within Level 2 of the fair value hierarchy, as the significant inputs to the models, including nonperformance risk, are observable. However, certain derivative transactions are with counterparties where risk of nonperformance cannot be observed in the market, and therefore the credit valuation adjustments result in these derivatives being classified within Level 3 of the fair value hierarchy. The credit valuation adjustments for nonperformance risk are determined by the Company’s treasury department using credit assumptions provided by credit administration. The credit assumptions are compared to actual results quarterly and are recalibrated as appropriate.
The Company also has commitments to sell, purchase and originate mortgage loans that meet the accounting requirements of a derivative. These mortgage loan commitments are valued by pricing models that include market observable and unobservable inputs, which result in the commitments being classified within Level 3 of the fair value hierarchy. The unobservable inputs include assumptions about the percentage of commitments that actually become a closed loan and the MSR value that is inherent in the underlying loan value, both of which are developed by the Company’s mortgage banking division. The closed loan percentages for the mortgage loan commitments are monitored on an on-going basis, as these percentages are also used for the Company’s economic hedging activities. The inherent MSR value for the commitments are generated by the same models used for the Company’s MSRs and thus are subject to the same processes and controls as described for the MSRs above.
Other Financial Instruments Other financial instruments include cost method equity investments and community development and tax-advantaged related assets and liabilities. The majority of the Company’s cost method equity investments are in Federal Home Loan Bank and Federal Reserve Bank stock, whose carrying amounts approximate their fair value and are classified within Level 2. Investments in private equity and other limited partnership funds are estimated using fund provided net asset values. These equity investments are classified within Level 3. Fair value is provided for disclosure purposes only.
Community development and tax-advantaged investments generate a return primarily through the realization of federal and state income tax credits, with a duration typically equal to the period that the tax credits are realized. Asset balances primarily represent the assets of the underlying community development and tax-advantaged entities the Company consolidated per applicable authoritative accounting guidance. Liabilities of the underlying consolidated entities were included in long-term debt. The carrying value of the asset balances are a reasonable estimate of fair value and are classified within Level 3. Refer to Note 7 for further information on community development and tax-advantaged related assets and liabilities. Fair value is provided for disclosure purposes only.
Deposit Liabilities The fair value of demand deposits, savings accounts and certain money market deposits is equal to the amount payable on demand. The fair value of fixed-rate certificates of deposit was estimated by discounting the contractual cash flow using current market rates. Deposit liabilities are classified within Level 2. Fair value is provided for disclosure purposes only.
Short-term Borrowings Federal funds purchased, securities sold under agreements to repurchase, commercial paper and other short-term funds borrowed have floating rates or short-term maturities. The fair value of short-term borrowings was determined by discounting contractual cash flows using current market rates. Short-term borrowings are classified within Level 2. Fair value is provided for disclosure purposes only.
Long-term Debt The fair value for most long-term debt was determined by discounting contractual cash flows using current market rates. Junior subordinated debt instruments were valued using market quotes. Long-term debt is classified within Level 2. Fair value is provided for disclosure purposes only.
Loan Commitments, Letters of Credit and Guarantees The fair value of commitments, letters of credit and guarantees represents the estimated costs to terminate or otherwise settle the obligations with a third party. Other loan commitments, letters of credit and guarantees are not actively traded, and the Company estimates their fair value based on the related amount of unamortized deferred commitment fees adjusted for the probable losses for these arrangements. These arrangements are classified within Level 3. Fair value is provided for disclosure purposes only.
| 126 | U.S. BANCORP |
Significant Unobservable Inputs of Level 3 Assets and Liabilities
The following section provides information on the significant inputs used by the Company to determine the fair value measurements of Level 3 assets and liabilities recorded at fair value on the Consolidated Balance Sheet. In addition, the following section includes a discussion of the sensitivity of the fair value measurements to changes in the significant inputs and a description of any interrelationships between these inputs for Level 3 assets and liabilities recorded at fair value on a recurring basis. The discussion below excludes nonrecurring fair value measurements of collateral value used for impairment measures for loans and other real estate owned. These valuations utilize third party appraisal or broker price opinions, and are classified as Level 3 due to the significant judgment involved.
Available-For-Sale Investment Securities The significant unobservable inputs used in the fair value measurement of the Company’s modeled Level 3 available-for-sale investment securities are prepayment rates, probability of default and loss severities associated with the underlying collateral, as well as the discount margin used to calculate the present value of the projected cash flows. Increases in prepayment rates for Level 3 securities will typically result in higher fair values, as increased prepayment rates accelerate the receipt of expected cash flows and reduce exposure to credit losses. Increases in the probability of default and loss severities will result in lower fair values, as these increases reduce expected cash flows. Discount margin is the Company’s estimate of the current market spread above the respective benchmark rate. Higher discount margin will result in lower fair values, as it reduces the present value of the expected cash flows.
Prepayment rates generally move in the opposite direction of market interest rates. In the current environment, an increase in the probability of default will generally be accompanied with an increase in loss severity, as both are impacted by underlying collateral values. Discount margins are influenced by market expectations about the security’s collateral performance, and therefore may directionally move with probability and severity of default; however, discount margins are also impacted by broader market forces, such as competing investment yields, sector liquidity, economic news, and other macroeconomic factors.
The following table shows the significant valuation assumption ranges for Level 3 available-for-sale investment securities at December 31, 2012:
| Minimum | Maximum | Average | ||||||||||
| Residential Prime Non-Agency Mortgage-Backed Securities (a) |
||||||||||||
| Estimated lifetime prepayment rates |
5 | % | 22 | % | 13 | % | ||||||
| Lifetime probability of default rates |
– | 6 | 3 | |||||||||
| Lifetime loss severity rates |
25 | 70 | 43 | |||||||||
| Discount margin |
2 | 6 | 4 | |||||||||
| Residential Non-Prime Non-Agency Mortgage-Backed Securities (b) |
||||||||||||
| Estimated lifetime prepayment rates |
2 | % | 10 | % | 6 | % | ||||||
| Lifetime probability of default rates |
3 | 10 | 7 | |||||||||
| Lifetime loss severity rates |
15 | 70 | 54 | |||||||||
| Discount margin |
2 | 7 | 5 | |||||||||
| Other Asset-Backed Securities |
||||||||||||
| Estimated lifetime prepayment rates |
6 | % | 6 | % | 6 | % | ||||||
| Lifetime probability of default rates |
4 | 4 | 4 | |||||||||
| Lifetime loss severity rates |
40 | 40 | 40 | |||||||||
| Discount margin |
18 | 18 | 18 | |||||||||
| (a) | Prime securities are those designated as such by the issuer at origination. When an issuer designation is unavailable, the Company determines at acquisition date the categorization based on asset pool characteristics (such as weighted-average credit score, loan-to-value, loan type, prevalence of low documentation loans) and deal performance (such as pool delinquencies and security market spreads). |
| (b) | Includes all securities not meeting the conditions to be designated as prime. |
Mortgage Servicing Rights The significant unobservable inputs used in the fair value measurement of the Company’s MSRs are expected prepayments and the discount rate used to calculate the present value of the projected cash flows. Significant increases in either of these inputs in isolation would result in a significantly lower fair value measurement. Significant decreases in either of these inputs in isolation would result in a significantly higher fair value measurement. There is no direct interrelationship between prepayments and discount rate. Prepayment rates generally move in the opposite direction of market interest rates. Discount rates are generally impacted by changes in market return requirements.
The following table shows the significant valuation assumption ranges for MSRs at December 31, 2012:
| Minimum | Maximum | Average | ||||||||||
| Expected prepayment |
13 | % | 28 | % | 20 | % | ||||||
| Discount rate |
10 | 14 | 10 | |||||||||
| U.S. BANCORP | 127 |
Derivatives The Company has two distinct Level 3 derivative portfolios: (i) the Company’s commitments to sell, purchase and originate mortgage loans that meet the requirements of a derivative, and (ii) the Company’s asset/liability and customer-related derivatives that are Level 3 due to unobservable inputs related to measurement of risk of nonperformance by the counterparty.
The significant unobservable inputs used in the fair value measurement of the Company’s derivative commitments to sell, purchase and originate mortgage loans are the percentage of commitments that actually become a closed loan and the MSR value that is inherent in the underlying loan value. A significant increase in the rate of loans that close would result in a larger derivative asset or liability. A significant increase in the inherent MSR value would result in an increase in the derivative asset or a reduction in the derivative liability. Expected loan close rates and the inherent MSR values are directly impacted by changes in market rates and will generally move in the same direction as interest rates.
The following table shows the significant valuation assumption ranges for the Company’s derivative commitments to sell, purchase and originate mortgage loans at December 31, 2012:
| Minimum | Maximum | Average | ||||||||||
| Expected loan close rate |
17 | % | 100 | % | 79 | % | ||||||
| Inherent MSR value (basis points per loan) |
54 | 192 | 109 | |||||||||
The significant unobservable input used in the fair value measurement of certain of the Company’s asset/liability and customer-related derivatives is the credit valuation adjustment related to the risk of counterparty nonperformance. A significant increase in the credit valuation adjustment would result in a lower fair value measurement. A significant decrease in the credit valuation adjustment would result in a higher fair value measurement. The credit valuation adjustment is impacted by changes in the Company’s assessment of the counterparty’s credit position. At December 31, 2012, the minimum, maximum and average credit valuation adjustment as a percentage of the derivative contract fair value prior to adjustment was 0 percent, 90 percent and 7 percent, respectively.
| 128 | U.S. BANCORP |
The following table summarizes the balances of assets and liabilities measured at fair value on a recurring basis:
| (Dollars in Millions) | Level 1 | Level 2 | Level 3 | Netting | Total | |||||||||||||||
| December 31, 2012 |
||||||||||||||||||||
| Available-for-sale securities |
||||||||||||||||||||
| U.S. Treasury and agencies |
$ | 491 | $ | 735 | $ | – | $ | – | $ | 1,226 | ||||||||||
| Mortgage-backed securities |
||||||||||||||||||||
| Residential |
||||||||||||||||||||
| Agency |
– | 29,495 | – | – | 29,495 | |||||||||||||||
| Non-agency |
||||||||||||||||||||
| Prime (a) |
– | – | 624 | – | 624 | |||||||||||||||
| Non-prime (b) |
– | – | 355 | – | 355 | |||||||||||||||
| Commercial |
||||||||||||||||||||
| Agency |
– | 193 | – | – | 193 | |||||||||||||||
| Asset-backed securities |
||||||||||||||||||||
| Collateralized debt obligations/Collateralized loan obligations |
– | 42 | – | – | 42 | |||||||||||||||
| Other |
– | 577 | 15 | – | 592 | |||||||||||||||
| Obligations of state and political subdivisions |
– | 6,455 | – | – | 6,455 | |||||||||||||||
| Obligations of foreign governments |
– | 6 | – | – | 6 | |||||||||||||||
| Corporate debt securities |
– | 722 | 9 | – | 731 | |||||||||||||||
| Perpetual preferred securities |
– | 218 | – | – | 218 | |||||||||||||||
| Other investments |
187 | 15 | – | – | 202 | |||||||||||||||
| Total available-for-sale |
678 | 38,458 | 1,003 | – | 40,139 | |||||||||||||||
| Mortgage loans held for sale |
– | 7,957 | – | – | 7,957 | |||||||||||||||
| Mortgage servicing rights |
– | – | 1,700 | – | 1,700 | |||||||||||||||
| Derivative assets |
– | 572 | 1,234 | (418 | ) | 1,388 | ||||||||||||||
| Other assets |
94 | 386 | – | – | 480 | |||||||||||||||
| Total |
$ | 772 | $ | 47,373 | $ | 3,937 | $ | (418 | ) | $ | 51,664 | |||||||||
| Derivative liabilities |
$ | – | $ | 2,128 | $ | 55 | $ | (1,549 | ) | $ | 634 | |||||||||
| Short-term borrowings (c) |
50 | 351 | – | – | 401 | |||||||||||||||
| Total |
$ | 50 | $ | 2,479 | $ | 55 | $ | (1,549 | ) | $ | 1,035 | |||||||||
| December 31, 2011 |
||||||||||||||||||||
| Available-for-sale securities |
||||||||||||||||||||
| U.S. Treasury and agencies |
$ | 562 | $ | 495 | $ | – | $ | – | $ | 1,057 | ||||||||||
| Mortgage-backed securities |
||||||||||||||||||||
| Residential |
||||||||||||||||||||
| Agency |
– | 40,314 | – | – | 40,314 | |||||||||||||||
| Non-agency |
||||||||||||||||||||
| Prime (a) |
– | – | 803 | – | 803 | |||||||||||||||
| Non-prime (b) |
– | – | 802 | – | 802 | |||||||||||||||
| Commercial |
||||||||||||||||||||
| Agency |
– | 140 | – | – | 140 | |||||||||||||||
| Non-agency |
– | – | 42 | – | 42 | |||||||||||||||
| Asset-backed securities |
||||||||||||||||||||
| Collateralized debt obligations/Collateralized loan obligations |
– | 86 | 120 | – | 206 | |||||||||||||||
| Other |
– | 564 | 117 | – | 681 | |||||||||||||||
| Obligations of state and political subdivisions |
– | 6,539 | – | – | 6,539 | |||||||||||||||
| Obligations of foreign governments |
– | 6 | – | – | 6 | |||||||||||||||
| Corporate debt securities |
– | 818 | 9 | – | 827 | |||||||||||||||
| Perpetual preferred securities |
– | 318 | – | – | 318 | |||||||||||||||
| Other investments |
193 | 9 | – | – | 202 | |||||||||||||||
| Total available-for-sale |
755 | 49,289 | 1,893 | – | 51,937 | |||||||||||||||
| Mortgage loans held for sale |
– | 6,925 | – | – | 6,925 | |||||||||||||||
| Mortgage servicing rights |
– | – | 1,519 | – | 1,519 | |||||||||||||||
| Derivative assets |
– | 632 | 1,281 | (294 | ) | 1,619 | ||||||||||||||
| Other assets |
146 | 467 | – | – | 613 | |||||||||||||||
| Total |
$ | 901 | $ | 57,313 | $ | 4,693 | $ | (294 | ) | $ | 62,613 | |||||||||
| Derivative liabilities |
$ | – | $ | 2,501 | $ | 53 | $ | (1,889 | ) | $ | 665 | |||||||||
| Short-term borrowings (c) |
75 | 538 | – | – | 613 | |||||||||||||||
| Total |
$ | 75 | $ | 3,039 | $ | 53 | $ | (1,889 | ) | $ | 1,278 | |||||||||
| (a) | Prime securities are those designated as such by the issuer at origination. When an issuer designation is unavailable, the Company determines at acquisition date the categorization based on asset pool characteristics (such as weighted-average credit score, loan-to-value, loan type, prevalence of low documentation loans) and deal performance (such as pool delinquencies and security market spreads). |
| (b) | Includes all securities not meeting the conditions to be designated as prime. |
| (c) | Represents the Company’s obligation on securities sold short required to be accounted for at fair value per applicable accounting guidance. |
| U.S. BANCORP | 129 |
The following table presents the changes in fair value for all assets and liabilities measured at fair value on a recurring basis using significant unobservable inputs (Level 3) for the years ended December 31, 2012 and 2011:
| (Dollars in Millions) | Beginning of Period Balance |
Net Gains (Losses) Included in Net Income |
Net Gains (Losses) Included in Other Compre hensive Income (Loss) |
Purchases | Sales | Principal Pay ments |
Issuances | Settle ments |
End of Period |
Net Change in Still Held at End of Period |
||||||||||||||||||||||||||||||
| 2012 |
||||||||||||||||||||||||||||||||||||||||
| Available-for-sale securities |
||||||||||||||||||||||||||||||||||||||||
| Mortgage-backed securities |
||||||||||||||||||||||||||||||||||||||||
| Residential non-agency |
||||||||||||||||||||||||||||||||||||||||
| Prime (a) |
$ | 803 | $ | (10 | ) | $ | 91 | $ | – | $ | (109 | ) | $ | (151 | ) | $ | – | $ | – | $ | 624 | $ | 65 | |||||||||||||||||
| Non-prime (b) |
802 | (24 | ) | 228 | – | (562 | ) | (89 | ) | – | – | 355 | 80 | |||||||||||||||||||||||||||
| Commercial non-agency |
42 | 1 | – | – | (38 | ) | (5 | ) | – | – | – | – | ||||||||||||||||||||||||||||
| Asset-backed securities |
||||||||||||||||||||||||||||||||||||||||
| Collateralized debt obligations/Collateralized loan obligations |
120 | 13 | (8 | ) | – | (104 | ) | (21 | ) | – | – | – | – | |||||||||||||||||||||||||||
| Other |
117 | 7 | – | 3 | (93 | ) | (19 | ) | – | – | 15 | 2 | ||||||||||||||||||||||||||||
| Corporate debt securities |
9 | – | – | – | – | – | – | – | 9 | – | ||||||||||||||||||||||||||||||
| Total available-for-sale |
1,893 | (13 | ) (c) | 311 | (f) | 3 | (906 | ) | (285 | ) | – | – | 1,003 | 147 | ||||||||||||||||||||||||||
| Mortgage servicing rights |
1,519 | (818 | ) (d) | – | 42 | – | – | 957 | (g) | – | 1,700 | (818 | ) (d) | |||||||||||||||||||||||||||
| Net derivative assets and liabilities |
1,228 | 2,398 | (e) | – | 3 | (5 | ) | – | – | (2,445 | ) | 1,179 | (2,068 | ) (h) | ||||||||||||||||||||||||||
| 2011 |
||||||||||||||||||||||||||||||||||||||||
| Available-for-sale securities |
||||||||||||||||||||||||||||||||||||||||
| Mortgage-backed securities |
||||||||||||||||||||||||||||||||||||||||
| Residential non-agency |
||||||||||||||||||||||||||||||||||||||||
| Prime (a) |
$ | 1,103 | $ | 6 | $ | 4 | $ | – | $ | (115 | ) | $ | (195 | ) | $ | – | $ | – | $ | 803 | $ | (4 | ) | |||||||||||||||||
| Non-prime (b) |
947 | (7 | ) | 1 | – | (13 | ) | (126 | ) | – | – | 802 | 1 | |||||||||||||||||||||||||||
| Commercial non-agency |
50 | 3 | (3 | ) | – | (4 | ) | (4 | ) | – | – | 42 | (2 | ) | ||||||||||||||||||||||||||
| Asset-backed securities |
||||||||||||||||||||||||||||||||||||||||
| Collateralized debt obligations/Collateralized loan obligations |
135 | 13 | 5 | – | – | (33 | ) | – | – | 120 | 5 | |||||||||||||||||||||||||||||
| Other |
133 | 10 | (7 | ) | 5 | – | (24 | ) | – | – | 117 | (7 | ) | |||||||||||||||||||||||||||
| Corporate debt securities |
9 | – | – | – | – | – | – | – | 9 | – | ||||||||||||||||||||||||||||||
| Total available-for-sale |
2,377 | 25 | (i) | – | (f) | 5 | (132 | ) | (382 | ) | – | – | 1,893 | (7 | ) | |||||||||||||||||||||||||
| Mortgage servicing rights |
1,837 | (972 | ) (d) | – | 35 | – | – | 619 | (g) | – | 1,519 | (972 | ) (d) | |||||||||||||||||||||||||||
| Net derivative assets and liabilities |
851 | 1,550 | (j) | – | 1 | (8 | ) | – | – | (1,166 | ) | 1,228 | (383 | ) (k) | ||||||||||||||||||||||||||
| (a) | Prime securities are those designated as such by the issuer at origination. When an issuer designation is unavailable, the Company determines at acquisition date the categorization based on asset pool characteristics (such as weighted-average credit score, loan-to-value, loan type, prevalence of low documentation loans) and deal performance (such as pool delinquencies and security market spreads). |
| (b) | Includes all securities not meeting the conditions to be designated as prime. |
| (c) | Approximately $(47) million included in securities gains (losses) and $34 million included in interest income. |
| (d) | Included in mortgage banking revenue. |
| (e) | Approximately $359 million included in other noninterest income and $2.0 billion included in mortgage banking revenue. |
| (f) | Included in changes in unrealized gains and losses on securities available-for-sale. |
| (g) | Represents MSRs capitalized during the period. |
| (h) | Approximately $109 million included in other noninterest income and $2.0 billion included in mortgage banking revenue. |
| (i) | Approximately $(31) million included in securities gains (losses) and $56 million included in interest income. |
| (j) | Approximately $716 million included in other noninterest income and $834 million included in mortgage banking revenue. |
| (k) | Approximately $262 million included in other noninterest income and $(645) million included in mortgage banking revenue. |
| 130 | U.S. BANCORP |
The following table presents the changes in fair value for all assets and liabilities measured at fair value on a recurring basis using significant unobservable inputs (Level 3) for the year ended December 31, 2010:
| (Dollars in Millions) | Beginning of Period Balance |
Net Gains (Losses) Included in Net Income |
Net Gains (Losses) Included in Other Comprehensive Income (Loss) |
Net Total Purchases, Sales Principal Payments, Issuances and Settlements |
End of Period Balance |
Net Change in Still Held at End of Period |
||||||||||||||||||
| Available-for-sale securities |
||||||||||||||||||||||||
| Mortgage-backed securities |
||||||||||||||||||||||||
| Residential non-agency |
||||||||||||||||||||||||
| Prime (a) |
$ | 1,429 | $ | 2 | $ | 82 | $ | (410 | ) | $ | 1,103 | $ | 76 | |||||||||||
| Non-prime (b) |
968 | (47 | ) | 146 | (120 | ) | 947 | 145 | ||||||||||||||||
| Commercial non-agency |
13 | 2 | 3 | 32 | 50 | 3 | ||||||||||||||||||
| Asset-backed securities |
||||||||||||||||||||||||
| Collateralized debt obligations/Collateralized loan obligations |
98 | 7 | – | 30 | 135 | 4 | ||||||||||||||||||
| Other |
357 | 2 | 11 | (237 | ) | 133 | 12 | |||||||||||||||||
| Corporate debt securities |
10 | (1 | ) | – | – | 9 | – | |||||||||||||||||
| Other investments |
231 | 5 | 10 | (246 | ) | – | – | |||||||||||||||||
| Total available-for-sale |
3,106 | (30 | ) (c) | 252 | (f) | (951 | ) | 2,377 | 240 | |||||||||||||||
| Mortgage servicing rights |
1,749 | (616 | ) (d) | – | 704 | 1,837 | (616 | ) (d) | ||||||||||||||||
| Net derivative assets and liabilities |
815 | 1,427 | (e) | – | (1,391 | ) | 851 | (318 | ) (g) | |||||||||||||||
| (a) | Prime securities are those designated as such by the issuer at origination. When an issuer designation is unavailable, the Company determines at acquisition date the categorization based on asset pool characteristics (such as weighted-average credit score, loan-to-value, loan type, prevalence of low documentation loans) and deal performance (such as pool delinquencies and security market spreads). |
| (b) | Includes all securities not meeting the conditions to be designated as prime. |
| (c) | Approximately $(91) million included in securities gains (losses) and $61 million included in interest income. |
| (d) | Included in mortgage banking revenue. |
| (e) | Approximately $632 million included in other noninterest income and $795 million included in mortgage banking revenue. |
| (f) | Included in changes in unrealized gains and losses on securities available-for-sale. |
| (g) | Approximately $483 million included in other noninterest income and $(801) million included in mortgage banking revenue. |
The Company is also required periodically to measure certain other financial assets at fair value on a nonrecurring basis. These measurements of fair value usually result from the application of lower-of-cost-or-fair value accounting or write-downs of individual assets.
The following table summarizes the adjusted carrying values and the level of valuation assumptions for assets measured at fair value on a nonrecurring basis as of December 31:
| 2012 | 2011 | |||||||||||||||||||||||||||||||||
| (Dollars in Millions) | Level 1 | Level 2 | Level 3 | Total | Level 1 | Level 2 | Level 3 | Total | ||||||||||||||||||||||||||
| Loans (a) |
$ | – | $ | – | $ | 140 | $ | 140 | $ | – | $ | – | $ | 168 | $ | 168 | ||||||||||||||||||
| Other assets (b) |
– | – | 194 | 194 | – | – | 310 | 310 | ||||||||||||||||||||||||||
| (a) | Represents the carrying value of loans for which adjustments were based on the fair value of the collateral, excluding loans fully charged-off. |
| (b) | Primarily represents the fair value of foreclosed properties that were measured at fair value based on an appraisal or broker price opinion of the collateral subsequent to their initial acquisition. |
The following table summarizes losses recognized related to nonrecurring fair value measurements of individual assets or portfolios for the years ended December 31:
| (Dollars in Millions) | 2012 | 2011 | 2010 | |||||||||
| Loans (a) |
$ | 68 | $ | 177 | $ | 363 | ||||||
| Other assets (b) |
160 | 316 | 309 | |||||||||
| (a) | Represents write-downs of loans which were based on the fair value of the collateral, excluding loans fully charged-off. |
| (b) | Primarily represents related losses of foreclosed properties that were measured at fair value subsequent to their initial acquisition. |
| U.S. BANCORP | 131 |
Fair Value Option
The following table summarizes the differences between the aggregate fair value carrying amount of MLHFS for which the fair value option has been elected and the aggregate unpaid principal amount that the Company is contractually obligated to receive at maturity as of December 31:
| 2012 | 2011 | |||||||||||||||||||||||||
| (Dollars in Millions) | Fair Value Carrying Amount |
Aggregate Unpaid Principal |
Carrying Amount Over (Under) Unpaid Principal |
Fair Value Carrying Amount |
Aggregate Unpaid Principal |
Carrying Amount Over (Under) Unpaid Principal |
||||||||||||||||||||
| Total loans |
$ | 7,957 | $ | 7,588 | $ | 369 | $ | 6,925 | $ | 6,635 | $ | 290 | ||||||||||||||
| Nonaccrual loans |
8 | 13 | (5 | ) | 10 | 15 | (5 | ) | ||||||||||||||||||
| Loans 90 days or more past due |
2 | 3 | (1 | ) | 3 | 4 | (1 | ) | ||||||||||||||||||
Disclosures about Fair Value of Financial Instruments
The following table summarizes the estimated fair value for financial instruments as of December 31, 2012 and 2011, and includes financial instruments that are not accounted for at fair value. In accordance with disclosure guidance related to fair values of financial instruments, the Company did not include assets and liabilities that are not financial instruments, such as the value of goodwill, long-term relationships with deposit, credit card, merchant processing and trust customers, other purchased intangibles, premises and equipment, deferred taxes and other liabilities. Additionally, in accordance with the disclosure guidance, insurance contracts and investments accounted for under the equity method are excluded.
The estimated fair values of the Company’s financial instruments as of December 31, are shown in the table below:
| 2012 | 2011 | |||||||||||||||||||||||||||||
| Carrying Amount |
Fair Value | Carrying Amount |
Fair Value |
|||||||||||||||||||||||||||
| (Dollars in Millions) | Level 1 | Level 2 | Level 3 | Total | ||||||||||||||||||||||||||
| Financial Assets |
||||||||||||||||||||||||||||||
| Cash and due from banks |
$ | 8,252 | $ | 8,252 | $ | – | $ | – | $ | 8,252 | $ | 13,962 | $ | 13,962 | ||||||||||||||||
| Federal funds sold and securities purchased under resale agreements |
437 | – | 437 | – | 437 | 64 | 64 | |||||||||||||||||||||||
| Investment securities held-to-maturity |
34,389 | 2,984 | 31,845 | 123 | 34,952 | 18,877 | 19,216 | |||||||||||||||||||||||
| Mortgages held for sale (a) |
– | – | – | – | – | 3 | 3 | |||||||||||||||||||||||
| Other loans held for sale |
19 | – | – | 19 | 19 | 228 | 228 | |||||||||||||||||||||||
| Loans |
218,905 | – | – | 220,494 | 220,494 | 205,082 | 206,646 | |||||||||||||||||||||||
| Other financial instruments |
7,367 | – | 1,228 | 6,157 | 7,385 | 6,095 | 6,140 | |||||||||||||||||||||||
| Financial Liabilities |
||||||||||||||||||||||||||||||
| Deposits |
249,183 | – | 249,594 | – | 249,594 | 230,885 | 231,184 | |||||||||||||||||||||||
| Short-term borrowings (b) |
25,901 | – | 25,917 | – | 25,917 | 29,855 | 29,835 | |||||||||||||||||||||||
| Long-term debt |
25,516 | – | 26,205 | – | 26,205 | 31,953 | 32,664 | |||||||||||||||||||||||
| (a) | Balance excludes mortgages held for sale for which the fair value option under applicable accounting guidance was elected. |
| (b) | Excludes the Company’s obligation on securities sold short required to be accounted for at fair value per applicable accounting guidance. |
The fair value of unfunded commitments, standby letters of credit and other guarantees is approximately equal to their carrying value. The carrying value of unfunded commitments and standby letters of credit was $415 million and $381 million at December 31, 2012 and 2011, respectively. The carrying value of other guarantees was $452 million and $359 million at December 31, 2012 and 2011, respectively.
| NOTE 21 | Guarantees and Contingent Liabilities |
Visa Restructuring and Card Association Litigation The Company’s payment services business issues and acquires credit and debit card transactions through the Visa U.S.A. Inc. card association or its affiliates (collectively “Visa”). In 2007, Visa completed a restructuring and issued shares of Visa Inc. common stock to its financial institution members in contemplation of its initial public offering (“IPO”) completed in the first quarter of 2008 (the “Visa Reorganization”). As a part of the Visa Reorganization, the Company received its proportionate number of shares of Visa Inc. common stock, which were subsequently converted to Class B shares of Visa Inc. (“Class B shares”). Visa U.S.A. Inc. (“Visa U.S.A.”) and MasterCard International (collectively, the “Card Associations”) are defendants in antitrust lawsuits challenging the practices of the Card Associations (the “Visa Litigation”). Visa U.S.A. member banks have a contingent obligation to indemnify Visa Inc. under the Visa U.S.A. bylaws (which were modified at the time of the restructuring in October 2007) for potential losses arising from the Visa Litigation. The indemnification by the Visa U.S.A. member banks has no specific maximum amount.
| 132 | U.S. BANCORP |
Using proceeds from its IPO and through reductions to the conversion ratio applicable to the Class B shares held by Visa U.S.A. member banks, Visa Inc. has funded an escrow account for the benefit of member financial institutions to fund their indemnification obligations associated with the Visa Litigation. The receivable related to the escrow account is classified in other liabilities as a direct offset to the related Visa Litigation contingent liability. On October 19, 2012, Visa signed a settlement agreement to resolve class action claims associated with the multi-district interchange litigation, the largest of the remaining Visa Litigation matters. The settlement has not yet been finally approved by the court, is not yet binding, and has been challenged by some class members. At December 31, 2012, the carrying amount of the Company’s liability related to the Visa Litigation matters, net of its share of the escrow fundings, was $65 million and included the Company’s estimate of its share of the temporary reduction in interchange rates specified in the settlement agreement. The remaining Class B shares held by the Company will be eligible for conversion to Class A shares, and thereby become marketable, upon settlement of the Visa Litigation. These shares are excluded from the Company’s financial instruments disclosures included in Note 20.
Commitments to Extend Credit Commitments to extend credit are legally binding and generally have fixed expiration dates or other termination clauses. The contractual amount represents the Company’s exposure to credit loss, in the event of default by the borrower. The Company manages this credit risk by using the same credit policies it applies to loans. Collateral is obtained to secure commitments based on management’s credit assessment of the borrower. The collateral may include marketable securities, receivables, inventory, equipment and real estate. Since the Company expects many of the commitments to expire without being drawn, total commitment amounts do not necessarily represent the Company’s future liquidity requirements. In addition, the commitments include consumer credit lines that are cancelable upon notification to the consumer.
The contract or notional amounts of unfunded commitments to extend credit at December 31, 2012, excluding those commitments considered derivatives, were as follows:
| Term | ||||||||||||
| (Dollars in Millions) | Less Than One Year |
Greater One Year |
Total | |||||||||
| Commercial and commercial real estate |
$ | 23,486 | $ | 73,183 | $ | 96,669 | ||||||
| Corporate and purchasing cards (a) |
19,737 | — | 19,737 | |||||||||
| Residential mortgages |
224 | 8 | 232 | |||||||||
| Retail credit cards (a) |
65,207 | 408 | 65,615 | |||||||||
| Other retail |
9,947 | 16,628 | 26,575 | |||||||||
| Covered |
59 | 828 | 887 | |||||||||
| (a) | Primarily cancelable at the Company’s discretion. |
Lease Commitments Rental expense for operating leases totaled $295 million in 2012, $291 million in 2011 and $277 million in 2010. Future minimum payments, net of sublease rentals, under capitalized leases and noncancelable operating leases with initial or remaining terms of one year or more, consisted of the following at December 31, 2012:
| (Dollars in Millions) | Capitalized Leases |
Operating Leases |
||||||||
| 2013 |
$ | 10 | $ | 232 | ||||||
| 2014 |
9 | 208 | ||||||||
| 2015 |
7 | 173 | ||||||||
| 2016 |
7 | 139 | ||||||||
| 2017 |
5 | 114 | ||||||||
| Thereafter |
25 | 432 | ||||||||
| Total minimum lease payments |
63 | $ | 1,298 | |||||||
| Less amount representing interest |
24 | |||||||||
| Present value of net minimum lease payments |
$ | 39 | ||||||||
| U.S. BANCORP | 133 |
Other Guarantees and Contingent Liabilities
The following table is a summary of other guarantees and contingent liabilities of the Company at December 31, 2012:
| (Dollars in Millions) | Collateral Held |
Carrying Amount |
Maximum Potential Future Payments |
|||||||||
| Standby letters of credit |
$ | — | $ | 83 | $ | 18,481 | ||||||
| Third-party borrowing arrangements |
— | — | 303 | |||||||||
| Securities lending indemnifications |
5,748 | — | 5,634 | |||||||||
| Asset sales |
— | 324 | 2,797 | |||||||||
| Merchant processing |
623 | 82 | 77,804 | |||||||||
| Contingent consideration arrangements |
— | 12 | 14 | |||||||||
| Tender option bond program guarantee |
5,337 | — | 5,027 | |||||||||
| Minimum revenue guarantees |
— | 15 | 17 | |||||||||
| Other |
— | 19 | 3,466 | |||||||||
Letters of Credit Standby letters of credit are commitments the Company issues to guarantee the performance of a customer to a third party. The guarantees frequently support public and private borrowing arrangements, including commercial paper issuances, bond financings and other similar transactions. The Company issues commercial letters of credit on behalf of customers to ensure payment or collection in connection with trade transactions. In the event of a customer’s nonperformance, the Company’s credit loss exposure is the same as in any extension of credit, up to the letter’s contractual amount. Management assesses the borrower’s credit to determine the necessary collateral, which may include marketable securities, receivables, inventory, equipment and real estate. Since the conditions requiring the Company to fund letters of credit may not occur, the Company expects its liquidity requirements to be less than the total outstanding commitments. The maximum potential future payments guaranteed by the Company under standby letter of credit arrangements at December 31, 2012, were approximately $18.5 billion with a weighted-average term of approximately 20 months. The estimated fair value of standby letters of credit was approximately $83 million at December 31, 2012.
The contract or notional amount of letters of credit at December 31, 2012, were as follows:
| Term | ||||||||||||
| (Dollars in Millions) | Less Than One Year |
Greater One Year |
Total | |||||||||
| Standby |
$ | 7,958 | $ | 10,523 | $ | 18,481 | ||||||
| Commercial |
273 | 43 | 316 | |||||||||
Guarantees Guarantees are contingent commitments issued by the Company to customers or other third parties. The Company’s guarantees primarily include parent guarantees related to subsidiaries’ third party borrowing arrangements; third party performance guarantees inherent in the Company’s business operations, such as indemnified securities lending programs and merchant charge-back guarantees; indemnification or buy-back provisions related to certain asset sales; and contingent consideration arrangements related to acquisitions. For certain guarantees, the Company has recorded a liability related to the potential obligation, or has access to collateral to support the guarantee or through the exercise of other recourse provisions can offset some or all of the maximum potential future payments made under these guarantees.
Third Party Borrowing Arrangements The Company provides guarantees to third parties as a part of certain subsidiaries’ borrowing arrangements, primarily representing guaranteed operating or capital lease payments or other debt obligations with maturity dates extending through 2013. The maximum potential future payments guaranteed by the Company under these arrangements were approximately $303 million at December 31, 2012.
Commitments from Securities Lending The Company participates in securities lending activities by acting as the customer’s agent involving the loan of securities. The Company indemnifies customers for the difference between the fair value of the securities lent and the fair value of the collateral received. Cash collateralizes these transactions. The maximum potential future payments guaranteed by the Company under these arrangements were approximately $5.6 billion at December 31, 2012, and represented the fair value of the securities lent to third parties. At December 31, 2012, the Company held $5.7 billion of cash as collateral for these arrangements.
| 134 | U.S. BANCORP |
Asset Sales The Company has provided guarantees to certain third parties in connection with the sale or syndication of certain assets, primarily loan portfolios and tax-advantaged investments. These guarantees are generally in the form of asset buy-back or make-whole provisions that are triggered upon a credit event or a change in the tax-qualifying status of the related projects, as applicable, and remain in effect until the loans are collected or final tax credits are realized, respectively. The maximum potential future payments guaranteed by the Company under these arrangements were approximately $2.8 billion at December 31, 2012, and represented the proceeds received from the buyer or the guaranteed portion in these transactions where the buy-back or make-whole provisions have not yet expired. At December 31, 2012, the Company had reserved $84 million for potential losses related to the sale or syndication of tax-advantaged investments.
The maximum potential future payments do not include loan sales where the Company provides standard representation and warranties to the buyer against losses related to loan underwriting documentation defects that may have existed at the time of sale that generally are identified after the occurrence of a triggering event such as delinquency. For these types of loan sales, the maximum potential future payments is generally the unpaid principal balance of loans sold measured at the end of the current reporting period. Actual losses will be significantly less than the maximum exposure, as only a fraction of loans sold will have a representation and warranty breach, and any losses on repurchase would generally be mitigated by any collateral held against the loans.
The Company regularly sells loans to GSEs as part of its mortgage banking activities. The Company provides customary representation and warranties to the GSEs in conjunction with these sales. These representations and warranties generally require the Company to repurchase assets if it is subsequently determined that a loan did not meet specified criteria, such as a documentation deficiency or rescission of mortgage insurance. If the Company is unable to cure or refute a repurchase request, the Company is generally obligated to repurchase the loan or otherwise reimburse the counterparty for losses. At December 31, 2012, the Company had reserved $240 million for potential losses from representation and warranty obligations, compared with $160 million at December 31, 2011. The $80 million increase was primarily the result of the GSEs increasing the number of loans selected for repurchase review, including expanding the review period to include earlier years. The Company’s reserve reflects management’s best estimate of losses for representation and warranty obligations. The Company’s reserving methodology uses current information about investor repurchase requests, and assumptions about defect rate, concur rate, repurchase mix, and loss severity, based upon the Company’s most recent loss trends. The Company also considers qualitative factors that may result in anticipated losses differing from historical loss trends, such as loan vintage, underwriting characteristics and macroeconomic trends.
The following table is a rollforward of the Company’s representation and warranty reserve:
| Year Ended December 31 (Dollars in Millions) | 2012 | 2011 | 2010 | |||||||||
| Balance at beginning of period |
$ | 160 | $ | 180 | $ | 72 | ||||||
| Net realized losses |
(120 | ) | (137 | ) | (93 | ) | ||||||
| Additions to reserve |
200 | 117 | 201 | |||||||||
| Balance at end of period |
$ | 240 | $ | 160 | $ | 180 | ||||||
As of December 31, 2012 and 2011, the Company had $131 million and $105 million, respectively, of unresolved representation and warranty claims from the GSEs. The Company does not have a significant amount of unresolved claims from investors other than the GSEs.
Merchant Processing The Company, through its subsidiaries, provides merchant processing services. Under the rules of credit card associations, a merchant processor retains a contingent liability for credit card transactions processed. This contingent liability arises in the event of a billing dispute between the merchant and a cardholder that is ultimately resolved in the cardholder’s favor. In this situation, the transaction is “charged-back” to the merchant and the disputed amount is credited or otherwise refunded to the cardholder. If the Company is unable to collect this amount from the merchant, it bears the loss for the amount of the refund paid to the cardholder.
A cardholder, through its issuing bank, generally has until the latter of up to four months after the date the transaction is processed or the receipt of the product or service to present a charge-back to the Company as the merchant processor. The absolute maximum potential liability is estimated to be the total volume of credit card transactions that meet the associations’ requirements to be valid charge-back transactions at any given time. Management estimates that the maximum potential exposure for charge-backs would approximate the total amount of merchant transactions processed through the credit card associations for the last four months. For the last four months this amount totaled approximately $77.8 billion. In most cases, this contingent
| U.S. BANCORP | 135 |
liability is unlikely to arise, as most products and services are delivered when purchased and amounts are refunded when items are returned to merchants. However, where the product or service is not provided until a future date (“future delivery”), the potential for this contingent liability increases. To mitigate this risk, the Company may require the merchant to make an escrow deposit, place maximum volume limitations on future delivery transactions processed by the merchant at any point in time, or require various credit enhancements (including letters of credit and bank guarantees). Also, merchant processing contracts may include event triggers to provide the Company more financial and operational control in the event of financial deterioration of the merchant.
The Company’s primary exposure to future delivery is related to merchant processing for airline companies. The Company currently processes card transactions in the United States, Canada and Europe for these merchants. In the event of liquidation of these merchants, the Company could become financially liable for refunding tickets purchased through the credit card associations under the charge-back provisions. Charge-back risk related to these merchants is evaluated in a manner similar to credit risk assessments and, as such, merchant processing contracts contain various provisions to protect the Company in the event of default. At December 31, 2012, the value of airline tickets purchased to be delivered at a future date was $4.5 billion. The Company held collateral of $515 million in escrow deposits, letters of credit and indemnities from financial institutions, and liens on various assets. With respect to future delivery risk for other merchants, the Company held $17 million of merchant escrow deposits as collateral. In addition to specific collateral or other credit enhancements, the Company maintains a liability for its implied guarantees associated with future delivery. At December 31, 2012, the liability was $70 million primarily related to these airline processing arrangements.
In the normal course of business, the Company has unresolved charge-backs. The Company assesses the likelihood of its potential liability based on the extent and nature of unresolved charge-backs and its historical loss experience. At December 31, 2012, the Company held $91 million of merchant escrow deposits as collateral and had a recorded liability for potential losses of $12 million.
Contingent Consideration Arrangements The Company has contingent payment obligations related to certain business combination transactions. Payments are guaranteed as long as certain post-acquisition performance-based criteria are met or customer relationships are maintained. At December 31, 2012, the maximum potential future payments required to be made by the Company under these arrangements was approximately $14 million. If required, the majority of these contingent payments are payable within the next 12 months.
Tender Option Bond Program Guarantee As discussed in Note 7, the Company sponsors a municipal bond securities tender option bond program and consolidates the program’s entities on its Consolidated Balance Sheet. The Company provides financial performance guarantees related to the program’s entities. At December 31, 2012, the Company guaranteed $5.0 billion of borrowings of the program’s entities, included on the Consolidated Balance Sheet in short-term borrowings. The Company also included on its Consolidated Balance Sheet the related $5.3 billion of available-for-sale investment securities serving as collateral for this arrangement.
Minimum Revenue Guarantees In the normal course of business, the Company may enter into revenue share agreements with third party business partners who generate customer referrals or provide marketing or other services related to the generation of revenue. In certain of these agreements, the Company may guarantee that a minimum amount of revenue share payments will be made to the third party over a specified period of time. At December 31, 2012, the maximum potential future payments required to be made by the Company under these agreements were $17 million and the Company had recorded a related liability of $15 million.
Other Guarantees and Commitments The Company has also made other financial performance guarantees and commitments related to the operations of its subsidiaries. At December 31, 2012, the maximum potential future payments guaranteed or committed by the Company under these arrangements were approximately $3.5 billion and the Company had recorded a related liability of $19 million.
Checking Account Overdraft Fee Litigation The Company is a defendant in three separate cases primarily challenging the Company’s daily ordering of debit transactions posted to customer checking accounts for the period from 2003 to 2010. On July 2, 2012, the Company reached a settlement in principle with the lead plaintiffs for these cases, subject to final documentation and court approvals. The settlement will provide for a payment by the Company of $55 million, which was previously accrued, in exchange for a release of claims asserted against the Company in these matters.
Mortgage-Related Actions and Investigations Certain federal and state governmental authorities have reached a settlement agreement with five major financial institutions regarding their mortgage origination, servicing, and foreclosure activities. Those governmental authorities contacted other financial institutions, including the Company, to discuss their potential participation in a settlement. The Company has not agreed to any settlement at this point; however, if a settlement were reached it would likely include an agreement to comply with specified servicing standards, and settlement payments to governmental authorities as well as a monetary commitment
| 136 | U.S. BANCORP |
that could be satisfied under various loan modification programs (in addition to the programs the Company already has in place). The Company has a $130 million accrued liability with respect to these and related matters.
During the second quarter of 2011, the Company and its two primary banking subsidiaries entered into Consent Orders with U.S. federal banking regulators regarding the Company’s residential mortgage servicing and foreclosure processes. On January 7, 2013, U.S. federal banking regulators announced a settlement agreement had been reached with the Company and other financial institutions relating to certain portions of the Consent Orders. In conjunction with the settlement, the Company agreed to pay $80 million, which it has accrued, to be distributed to borrowers, in a manner to be determined by the regulators. The Company also agreed to make certain concessions to borrowers, including potential principal forgiveness, short sale approvals and loan modifications. The impact of these concessions is reflected in the Company’s allowance for loan losses and discounts on acquired loans.
The Company is currently subject to other investigations and examinations by government agencies concerning mortgage-related practices, including those related to Federal Housing Administration insured residential home loans.
Other The Company is subject to various other litigation, investigations and legal and administrative cases and proceedings that arise in the ordinary course of its businesses. Due to their complex nature, it may be years before some matters are resolved. While it is impossible to ascertain the ultimate resolution or range of financial liability with respect to these contingent matters, the Company believes that the aggregate amount of such liabilities will not have a material adverse effect on the financial condition, results of operations or cash flows of the Company.
| NOTE 22 | U.S. Bancorp (Parent Company) |
Condensed Balance Sheet
| At December 31 (Dollars in Millions) | 2012 | 2011 | ||||||
| Assets |
||||||||
| Due from banks, principally interest-bearing |
$ | 3,630 | $ | 4,728 | ||||
| Available-for-sale securities |
425 | 1,166 | ||||||
| Investments in bank subsidiaries |
38,007 | 33,179 | ||||||
| Investments in nonbank subsidiaries |
1,445 | 1,321 | ||||||
| Advances to bank subsidiaries |
6,173 | 6,094 | ||||||
| Advances to nonbank subsidiaries |
1,404 | 1,190 | ||||||
| Other assets |
1,550 | 1,481 | ||||||
| Total assets |
$ | 52,634 | $ | 49,159 | ||||
| Liabilities and Shareholders’ Equity |
||||||||
| Short-term funds borrowed |
$ | 134 | $ | 29 | ||||
| Long-term debt |
12,772 | 14,593 | ||||||
| Other liabilities |
730 | 559 | ||||||
| Shareholders’ equity |
38,998 | 33,978 | ||||||
| Total liabilities and shareholders’ equity |
$ | 52,634 | $ | 49,159 | ||||
Condensed Statement of Income
| Year Ended December 31 (Dollars in Millions) | 2012 | 2011 | 2010 | |||||||||
| Income |
||||||||||||
| Dividends from bank subsidiaries |
$ | 250 | $ | 1,500 | $ | – | ||||||
| Dividends from nonbank subsidiaries |
4 | 7 | 3 | |||||||||
| Interest from subsidiaries |
96 | 101 | 109 | |||||||||
| Other income |
149 | 134 | 105 | |||||||||
| Total income |
499 | 1,742 | 217 | |||||||||
| Expense |
||||||||||||
| Interest on short-term funds borrowed |
1 | 1 | 1 | |||||||||
| Interest on long-term debt |
392 | 424 | 366 | |||||||||
| Other expense |
122 | 79 | 80 | |||||||||
| Total expense |
515 | 504 | 447 | |||||||||
| Income before income taxes and equity in undistributed income of subsidiaries |
(16 | ) | 1,238 | (230 | ) | |||||||
| Applicable income taxes |
(85 | ) | (83 | ) | (70 | ) | ||||||
| Income of parent company |
69 | 1,321 | (160 | ) | ||||||||
| Equity in undistributed income of subsidiaries |
5,578 | 3,551 | 3,477 | |||||||||
| Net income attributable to U.S. Bancorp |
$ | 5,647 | $ | 4,872 | $ | 3,317 | ||||||
| U.S. BANCORP | 137 |
Condensed Statement of Cash Flows
| Year Ended December 31 (Dollars in Millions) | 2012 | 2011 | 2010 | |||||||||
| Operating Activities |
||||||||||||
| Net income attributable to U.S. Bancorp |
$ | 5,647 | $ | 4,872 | $ | 3,317 | ||||||
| Adjustments to reconcile net income to net cash provided by operating activities |
||||||||||||
| Equity in undistributed income of subsidiaries |
(5,578 | ) | (3,551 | ) | (3,477 | ) | ||||||
| Other, net |
(35 | ) | 12 | 130 | ||||||||
| Net cash provided by (used in) operating activities |
34 | 1,333 | (30 | ) | ||||||||
| Investing Activities |
||||||||||||
| Proceeds from sales and maturities of investment securities |
979 | 297 | 298 | |||||||||
| Purchases of investment securities |
(35 | ) | (36 | ) | (63 | ) | ||||||
| Investments in subsidiaries |
– | – | (1,750 | ) | ||||||||
| Equity distributions from subsidiaries |
845 | 77 | 58 | |||||||||
| Net (increase) decrease in short-term advances to subsidiaries |
207 | (4,613 | ) | (253 | ) | |||||||
| Long-term advances to subsidiaries |
(500 | ) | – | (300 | ) | |||||||
| Principal collected on long-term advances to subsidiaries |
– | – | 300 | |||||||||
| Other, net |
(22 | ) | (3 | ) | 33 | |||||||
| Net cash provided by (used in) investing activities |
1,474 | (4,278 | ) | (1,677 | ) | |||||||
| Financing Activities |
||||||||||||
| Net increase (decrease) in short-term borrowings |
105 | (31 | ) | (782 | ) | |||||||
| Proceeds from issuance of long-term debt |
3,550 | 2,426 | 4,250 | |||||||||
| Principal payments or redemption of long-term debt |
(5,412 | ) | (851 | ) | (5,250 | ) | ||||||
| Fees paid on exchange of income trust securities for perpetual preferred stock |
– | – | (4 | ) | ||||||||
| Proceeds from issuance of preferred stock |
2,163 | 676 | – | |||||||||
| Proceeds from issuance of common stock |
395 | 180 | 119 | |||||||||
| Repurchase of common stock |
(1,856 | ) | (514 | ) | – | |||||||
| Cash dividends paid on preferred stock |
(204 | ) | (118 | ) | (89 | ) | ||||||
| Cash dividends paid on common stock |
(1,347 | ) | (817 | ) | (383 | ) | ||||||
| Net cash provided by (used in) financing activities |
(2,606 | ) | 951 | (2,139 | ) | |||||||
| Change in cash and due from banks |
(1,098 | ) | (1,994 | ) | (3,846 | ) | ||||||
| Cash and due from banks at beginning of year |
4,728 | 6,722 | 10,568 | |||||||||
| Cash and due from banks at end of year |
$ | 3,630 | $ | 4,728 | $ | 6,722 | ||||||
Transfer of funds (dividends, loans or advances) from bank subsidiaries to the Company is restricted. Federal law requires loans to the Company or its affiliates to be secured and generally limits loans to the Company or an individual affiliate to 10 percent of each bank’s unimpaired capital and surplus. In the aggregate, loans to the Company and all affiliates cannot exceed 20 percent of each bank’s unimpaired capital and surplus.
Dividend payments to the Company by its subsidiary banks are subject to regulatory review and statutory limitations and, in some instances, regulatory approval. The approval of the Office of the Comptroller of the Currency is required if total dividends by a national bank in any calendar year exceed the bank’s net income for that year combined with its retained net income for the preceding two calendar years, or if the bank’s retained earnings are less than zero. Furthermore, dividends are restricted by the Comptroller of the Currency’s minimum capital constraints for all national banks. Within these guidelines, all bank subsidiaries have the ability to pay dividends without prior regulatory approval. The amount of dividends available to the parent company from the bank subsidiaries at December 31, 2012, was approximately $7.9 billion.
| NOTE 23 | Subsequent Events |
The Company has evaluated the impact of events that have occurred subsequent to December 31, 2012 through the date the consolidated financial statements were filed with the United States Securities and Exchange Commission. Based on this evaluation, the Company has determined none of these events were required to be recognized or disclosed in the consolidated financial statements and related notes.
| 138 | U.S. BANCORP |
U.S. Bancorp
Consolidated Balance Sheet — Five Year Summary (Unaudited)
| At December 31 (Dollars in Millions) | 2012 | 2011 | 2010 | 2009 | 2008 | % Change 2012 v 2011 |
||||||||||||||||||
| Assets |
||||||||||||||||||||||||
| Cash and due from banks |
$ | 8,252 | $ | 13,962 | $ | 14,487 | $ | 6,206 | $ | 6,859 | (40.9 | )% | ||||||||||||
| Held-to-maturity securities |
34,389 | 18,877 | 1,469 | 47 | 53 | 82.2 | ||||||||||||||||||
| Available-for-sale securities |
40,139 | 51,937 | 51,509 | 44,721 | 39,468 | (22.7 | ) | |||||||||||||||||
| Loans held for sale |
7,976 | 7,156 | 8,371 | 4,772 | 3,210 | 11.5 | ||||||||||||||||||
| Loans |
223,329 | 209,835 | 197,061 | 194,755 | 184,955 | 6.4 | ||||||||||||||||||
| Less allowance for loan losses |
(4,424 | ) | (4,753 | ) | (5,310 | ) | (5,079 | ) | (3,514 | ) | 6.9 | |||||||||||||
| Net loans |
218,905 | 205,082 | 191,751 | 189,676 | 181,441 | 6.7 | ||||||||||||||||||
| Other assets |
44,194 | 43,108 | 40,199 | 35,754 | 34,881 | 2.5 | ||||||||||||||||||
| Total assets |
$ | 353,855 | $ | 340,122 | $ | 307,786 | $ | 281,176 | $ | 265,912 | 4.0 | |||||||||||||
| Liabilities and Shareholders’ Equity |
||||||||||||||||||||||||
| Deposits |
||||||||||||||||||||||||
| Noninterest-bearing |
$ | 74,172 | $ | 68,579 | $ | 45,314 | $ | 38,186 | $ | 37,494 | 8.2 | % | ||||||||||||
| Interest-bearing |
175,011 | 162,306 | 158,938 | 145,056 | 121,856 | 7.8 | ||||||||||||||||||
| Total deposits |
249,183 | 230,885 | 204,252 | 183,242 | 159,350 | 7.9 | ||||||||||||||||||
| Short-term borrowings |
26,302 | 30,468 | 32,557 | 31,312 | 33,983 | (13.7 | ) | |||||||||||||||||
| Long-term debt |
25,516 | 31,953 | 31,537 | 32,580 | 38,359 | (20.1 | ) | |||||||||||||||||
| Other liabilities |
12,587 | 11,845 | 9,118 | 7,381 | 7,187 | 6.3 | ||||||||||||||||||
| Total liabilities |
313,588 | 305,151 | 277,464 | 254,515 | 238,879 | 2.8 | ||||||||||||||||||
| Total U.S. Bancorp shareholders’ equity |
38,998 | 33,978 | 29,519 | 25,963 | 26,300 | 14.8 | ||||||||||||||||||
| Noncontrolling interests |
1,269 | 993 | 803 | 698 | 733 | 27.8 | ||||||||||||||||||
| Total equity |
40,267 | 34,971 | 30,322 | 26,661 | 27,033 | 15.1 | ||||||||||||||||||
| Total liabilities and equity |
$ | 353,855 | $ | 340,122 | $ | 307,786 | $ | 281,176 | $ | 265,912 | 4.0 | |||||||||||||
| U.S. BANCORP | 139 |
U.S. Bancorp
Consolidated Statement of Income — Five-Year Summary (Unaudited)
| Year Ended December 31 (Dollars in Millions) | 2012 | 2011 | 2010 | 2009 | 2008 | % Change 2012 v 2011 |
||||||||||||||||||
| Interest Income |
||||||||||||||||||||||||
| Loans |
$ | 10,558 | $ | 10,370 | $ | 10,145 | $ | 9,564 | $ | 10,051 | 1.8 | % | ||||||||||||
| Loans held for sale |
282 | 200 | 246 | 277 | 227 | 41.0 | ||||||||||||||||||
| Investment securities |
1,792 | 1,820 | 1,601 | 1,606 | 1,984 | (1.5 | ) | |||||||||||||||||
| Other interest income |
251 | 249 | 166 | 91 | 156 | .8 | ||||||||||||||||||
| Total interest income |
12,883 | 12,639 | 12,158 | 11,538 | 12,418 | 1.9 | ||||||||||||||||||
| Interest Expense |
||||||||||||||||||||||||
| Deposits |
691 | 840 | 928 | 1,202 | 1,881 | (17.7 | ) | |||||||||||||||||
| Short-term borrowings |
442 | 531 | 548 | 539 | 1,066 | (16.8 | ) | |||||||||||||||||
| Long-term debt |
1,005 | 1,145 | 1,103 | 1,279 | 1,739 | (12.2 | ) | |||||||||||||||||
| Total interest expense |
2,138 | 2,516 | 2,579 | 3,020 | 4,686 | (15.0 | ) | |||||||||||||||||
| Net interest income |
10,745 | 10,123 | 9,579 | 8,518 | 7,732 | 6.1 | ||||||||||||||||||
| Provision for credit losses |
1,882 | 2,343 | 4,356 | 5,557 | 3,096 | (19.7 | ) | |||||||||||||||||
| Net interest income after provision for credit losses |
8,863 | 7,780 | 5,223 | 2,961 | 4,636 | 13.9 | ||||||||||||||||||
| Noninterest Income |
||||||||||||||||||||||||
| Credit and debit card revenue |
892 | 1,073 | 1,091 | 1,055 | 1,039 | (16.9 | ) | |||||||||||||||||
| Corporate payment products revenue |
744 | 734 | 710 | 669 | 671 | 1.4 | ||||||||||||||||||
| Merchant processing services |
1,395 | 1,355 | 1,253 | 1,148 | 1,151 | 3.0 | ||||||||||||||||||
| ATM processing services |
346 | 452 | 423 | 410 | 366 | (23.5 | ) | |||||||||||||||||
| Trust and investment management fees |
1,055 | 1,000 | 1,080 | 1,168 | 1,314 | 5.5 | ||||||||||||||||||
| Deposit service charges |
653 | 659 | 710 | 970 | 1,081 | (.9 | ) | |||||||||||||||||
| Treasury management fees |
541 | 551 | 555 | 552 | 517 | (1.8 | ) | |||||||||||||||||
| Commercial products revenue |
878 | 841 | 771 | 615 | 492 | 4.4 | ||||||||||||||||||
| Mortgage banking revenue |
1,937 | 986 | 1,003 | 1,035 | 270 | 96.5 | ||||||||||||||||||
| Investment products fees and commissions |
150 | 129 | 111 | 109 | 147 | 16.3 | ||||||||||||||||||
| Securities gains (losses), net |
(15 | ) | (31 | ) | (78 | ) | (451 | ) | (978 | ) | 51.6 | |||||||||||||
| Other |
743 | 1,011 | 731 | 672 | 741 | (26.5 | ) | |||||||||||||||||
| Total noninterest income |
9,319 | 8,760 | 8,360 | 7,952 | 6,811 | 6.4 | ||||||||||||||||||
| Noninterest Expense |
||||||||||||||||||||||||
| Compensation |
4,320 | 4,041 | 3,779 | 3,135 | 3,039 | 6.9 | ||||||||||||||||||
| Employee benefits |
945 | 845 | 694 | 574 | 515 | 11.8 | ||||||||||||||||||
| Net occupancy and equipment |
917 | 999 | 919 | 836 | 781 | (8.2 | ) | |||||||||||||||||
| Professional services |
530 | 383 | 306 | 255 | 240 | 38.4 | ||||||||||||||||||
| Marketing and business development |
388 | 369 | 360 | 378 | 310 | 5.1 | ||||||||||||||||||
| Technology and communications |
821 | 758 | 744 | 673 | 598 | 8.3 | ||||||||||||||||||
| Postage, printing and supplies |
304 | 303 | 301 | 288 | 294 | .3 | ||||||||||||||||||
| Other intangibles |
274 | 299 | 367 | 387 | 355 | (8.4 | ) | |||||||||||||||||
| Other |
1,957 | 1,914 | 1,913 | 1,755 | 1,216 | 2.2 | ||||||||||||||||||
| Total noninterest expense |
10,456 | 9,911 | 9,383 | 8,281 | 7,348 | 5.5 | ||||||||||||||||||
| Income before income taxes |
7,726 | 6,629 | 4,200 | 2,632 | 4,099 | 16.5 | ||||||||||||||||||
| Applicable income taxes |
2,236 | 1,841 | 935 | 395 | 1,087 | 21.5 | ||||||||||||||||||
| Net income |
5,490 | 4,788 | 3,265 | 2,237 | 3,012 | 14.7 | ||||||||||||||||||
| Net (income) loss attributable to noncontrolling interests |
157 | 84 | 52 | (32 | ) | (66 | ) | 86.9 | ||||||||||||||||
| Net income attributable to U.S. Bancorp |
$ | 5,647 | $ | 4,872 | $ | 3,317 | $ | 2,205 | $ | 2,946 | 15.9 | |||||||||||||
| Net income applicable to U.S. Bancorp common shareholders |
$ | 5,383 | $ | 4,721 | $ | 3,332 | $ | 1,803 | $ | 2,819 | 14.0 | |||||||||||||
| 140 | U.S. BANCORP |
U.S. Bancorp
Quarterly Consolidated Financial Data (Unaudited)
| 2012 | 2011 | |||||||||||||||||||||||||||||||||
| (Dollars in Millions, Except Per Share Data) | First Quarter |
Second Quarter |
Third Quarter |
Fourth Quarter |
First Quarter |
Second Quarter |
Third Quarter |
Fourth Quarter |
||||||||||||||||||||||||||
| Interest Income |
||||||||||||||||||||||||||||||||||
| Loans |
$ | 2,638 | $ | 2,631 | $ | 2,650 | $ | 2,639 | $ | 2,552 | $ | 2,563 | $ | 2,621 | $ | 2,634 | ||||||||||||||||||
| Loans held for sale |
65 | 67 | 76 | 74 | 63 | 34 | 42 | 61 | ||||||||||||||||||||||||||
| Investment securities |
468 | 470 | 438 | 416 | 428 | 459 | 470 | 463 | ||||||||||||||||||||||||||
| Other interest income |
61 | 60 | 63 | 67 | 57 | 63 | 67 | 62 | ||||||||||||||||||||||||||
| Total interest income |
3,232 | 3,228 | 3,227 | 3,196 | 3,100 | 3,119 | 3,200 | 3,220 | ||||||||||||||||||||||||||
| Interest Expense |
||||||||||||||||||||||||||||||||||
| Deposits |
181 | 177 | 172 | 161 | 234 | 210 | 202 | 194 | ||||||||||||||||||||||||||
| Short-term borrowings |
123 | 127 | 103 | 89 | 133 | 131 | 143 | 124 | ||||||||||||||||||||||||||
| Long-term debt |
294 | 266 | 226 | 219 | 281 | 290 | 289 | 285 | ||||||||||||||||||||||||||
| Total interest expense |
598 | 570 | 501 | 469 | 648 | 631 | 634 | 603 | ||||||||||||||||||||||||||
| Net interest income |
2,634 | 2,658 | 2,726 | 2,727 | 2,452 | 2,488 | 2,566 | 2,617 | ||||||||||||||||||||||||||
| Provision for credit losses |
481 | 470 | 488 | 443 | 755 | 572 | 519 | 497 | ||||||||||||||||||||||||||
| Net interest income after provision for credit losses |
2,153 | 2,188 | 2,238 | 2,284 | 1,697 | 1,916 | 2,047 | 2,120 | ||||||||||||||||||||||||||
| Noninterest Income |
||||||||||||||||||||||||||||||||||
| Credit and debit card revenue |
202 | 235 | 213 | 242 | 267 | 286 | 289 | 231 | ||||||||||||||||||||||||||
| Corporate payment products revenue |
175 | 190 | 201 | 178 | 175 | 185 | 203 | 171 | ||||||||||||||||||||||||||
| Merchant processing services |
337 | 359 | 345 | 354 | 301 | 338 | 338 | 378 | ||||||||||||||||||||||||||
| ATM processing services |
87 | 89 | 87 | 83 | 112 | 114 | 115 | 111 | ||||||||||||||||||||||||||
| Trust and investment management fees |
252 | 262 | 265 | 276 | 256 | 258 | 241 | 245 | ||||||||||||||||||||||||||
| Deposit service charges |
153 | 156 | 174 | 170 | 143 | 162 | 183 | 171 | ||||||||||||||||||||||||||
| Treasury management fees |
134 | 142 | 135 | 130 | 137 | 144 | 137 | 133 | ||||||||||||||||||||||||||
| Commercial products revenue |
211 | 216 | 225 | 226 | 191 | 218 | 212 | 220 | ||||||||||||||||||||||||||
| Mortgage banking revenue |
452 | 490 | 519 | 476 | 199 | 239 | 245 | 303 | ||||||||||||||||||||||||||
| Investment products fees and commissions |
35 | 38 | 38 | 39 | 32 | 35 | 31 | 31 | ||||||||||||||||||||||||||
| Securities gains (losses), net |
– | (19 | ) | 1 | 3 | (5 | ) | (8 | ) | (9 | ) | (9 | ) | |||||||||||||||||||||
| Other |
201 | 197 | 193 | 152 | 204 | 175 | 186 | 446 | ||||||||||||||||||||||||||
| Total noninterest income |
2,239 | 2,355 | 2,396 | 2,329 | 2,012 | 2,146 | 2,171 | 2,431 | ||||||||||||||||||||||||||
| Noninterest Expense |
||||||||||||||||||||||||||||||||||
| Compensation |
1,052 | 1,076 | 1,109 | 1,083 | 959 | 1,004 | 1,021 | 1,057 | ||||||||||||||||||||||||||
| Employee benefits |
260 | 229 | 225 | 231 | 230 | 210 | 203 | 202 | ||||||||||||||||||||||||||
| Net occupancy and equipment |
220 | 230 | 233 | 234 | 249 | 249 | 252 | 249 | ||||||||||||||||||||||||||
| Professional services |
84 | 136 | 144 | 166 | 70 | 82 | 100 | 131 | ||||||||||||||||||||||||||
| Marketing and business development |
109 | 80 | 96 | 103 | 65 | 90 | 102 | 112 | ||||||||||||||||||||||||||
| Technology and communications |
201 | 201 | 205 | 214 | 185 | 189 | 189 | 195 | ||||||||||||||||||||||||||
| Postage, printing and supplies |
74 | 77 | 75 | 78 | 74 | 76 | 76 | 77 | ||||||||||||||||||||||||||
| Other intangibles |
71 | 70 | 67 | 66 | 75 | 75 | 75 | 74 | ||||||||||||||||||||||||||
| Other |
489 | 502 | 455 | 511 | 407 | 450 | 458 | 599 | ||||||||||||||||||||||||||
| Total noninterest expense |
2,560 | 2,601 | 2,609 | 2,686 | 2,314 | 2,425 | 2,476 | 2,696 | ||||||||||||||||||||||||||
| Income before income taxes |
1,832 | 1,942 | 2,025 | 1,927 | 1,395 | 1,637 | 1,742 | 1,855 | ||||||||||||||||||||||||||
| Applicable income taxes |
527 | 564 | 593 | 552 | 366 | 458 | 490 | 527 | ||||||||||||||||||||||||||
| Net income |
1,305 | 1,378 | 1,432 | 1,375 | 1,029 | 1,179 | 1,252 | 1,328 | ||||||||||||||||||||||||||
| Net (income) loss attributable to noncontrolling interests |
33 | 37 | 42 | 45 | 17 | 24 | 21 | 22 | ||||||||||||||||||||||||||
| Net income attributable to U.S. Bancorp |
$ | 1,338 | $ | 1,415 | $ | 1,474 | $ | 1,420 | $ | 1,046 | $ | 1,203 | $ | 1,273 | $ | 1,350 | ||||||||||||||||||
| Net income applicable to U.S. Bancorp common shareholders |
$ | 1,285 | $ | 1,345 | $ | 1,404 | $ | 1,349 | $ | 1,003 | $ | 1,167 | $ | 1,237 | $ | 1,314 | ||||||||||||||||||
| Earnings per common share |
$ | .68 | $ | .71 | $ | .74 | $ | .72 | $ | .52 | $ | .61 | $ | .65 | $ | .69 | ||||||||||||||||||
| Diluted earnings per common share |
$ | .67 | $ | .71 | $ | .74 | $ | .72 | $ | .52 | $ | .60 | $ | .64 | $ | .69 | ||||||||||||||||||
| U.S. BANCORP | 141 |
U.S. Bancorp
Consolidated Daily Average Balance Sheet and Related Yields and Rates (a) (Unaudited)
| 2012 | 2011 | |||||||||||||||||||||||||||||
| Year Ended December 31 (Dollars in Millions) | Average |
Interest | Yields and Rates |
Average Balances |
Interest | Yields and Rates |
||||||||||||||||||||||||
| Assets |
||||||||||||||||||||||||||||||
| Investment securities |
$ | 72,501 | $ | 1,939 | 2.67 | % | $ | 63,645 | $ | 1,980 | 3.11 | % | ||||||||||||||||||
| Loans held for sale |
7,847 | 282 | 3.60 | 4,873 | 200 | 4.10 | ||||||||||||||||||||||||
| Loans (b) |
||||||||||||||||||||||||||||||
| Commercial |
60,830 | 2,168 | 3.56 | 51,616 | 2,071 | 4.01 | ||||||||||||||||||||||||
| Commercial real estate |
36,505 | 1,638 | 4.49 | 35,514 | 1,622 | 4.57 | ||||||||||||||||||||||||
| Residential mortgages |
40,290 | 1,827 | 4.53 | 33,711 | 1,632 | 4.84 | ||||||||||||||||||||||||
| Credit card |
16,653 | 1,693 | 10.16 | 16,084 | 1,538 | 9.56 | ||||||||||||||||||||||||
| Other retail |
47,938 | 2,488 | 5.19 | 48,199 | 2,649 | 5.50 | ||||||||||||||||||||||||
| Total loans, excluding covered loans |
202,216 | 9,814 | 4.85 | 185,124 | 9,512 | 5.14 | ||||||||||||||||||||||||
| Covered loans |
13,158 | 826 | 6.28 | 16,303 | 928 | 5.69 | ||||||||||||||||||||||||
| Total loans |
215,374 | 10,640 | 4.94 | 201,427 | 10,440 | 5.18 | ||||||||||||||||||||||||
| Other earning assets |
10,548 | 251 | 2.38 | 13,345 | 250 | 1.87 | ||||||||||||||||||||||||
| Total earning assets |
306,270 | 13,112 | 4.28 | 283,290 | 12,870 | 4.54 | ||||||||||||||||||||||||
| Allowance for loan losses |
(4,642 | ) | (5,192 | ) | ||||||||||||||||||||||||||
| Unrealized gain (loss) on investment securities |
1,077 | 227 | ||||||||||||||||||||||||||||
| Other assets |
40,144 | 39,939 | ||||||||||||||||||||||||||||
| Total assets |
$ | 342,849 | $ | 318,264 | ||||||||||||||||||||||||||
| Liabilities and Shareholders’ Equity |
||||||||||||||||||||||||||||||
| Noninterest-bearing deposits |
$ | 67,241 | $ | 53,856 | ||||||||||||||||||||||||||
| Interest-bearing deposits |
||||||||||||||||||||||||||||||
| Interest checking |
45,433 | 46 | .10 | 42,827 | 65 | .15 | ||||||||||||||||||||||||
| Money market savings |
46,874 | 62 | .13 | 45,119 | 76 | .17 | ||||||||||||||||||||||||
| Savings accounts |
29,596 | 66 | .22 | 26,654 | 112 | .42 | ||||||||||||||||||||||||
| Time certificates of deposit less than $100,000 |
14,509 | 248 | 1.71 | 15,237 | 290 | 1.91 | ||||||||||||||||||||||||
| Time deposits greater than $100,000 |
32,057 | 269 | .84 | 29,466 | 297 | 1.01 | ||||||||||||||||||||||||
| Total interest-bearing deposits |
168,469 | 691 | .41 | 159,303 | 840 | .53 | ||||||||||||||||||||||||
| Short-term borrowings |
28,549 | 447 | 1.57 | 30,703 | 537 | 1.75 | ||||||||||||||||||||||||
| Long-term debt |
28,448 | 1,005 | 3.53 | 31,684 | 1,145 | 3.61 | ||||||||||||||||||||||||
| Total interest-bearing liabilities |
225,466 | 2,143 | .95 | 221,690 | 2,522 | 1.14 | ||||||||||||||||||||||||
| Other liabilities |
11,406 | 9,602 | ||||||||||||||||||||||||||||
| Shareholders’ equity |
||||||||||||||||||||||||||||||
| Preferred equity |
4,381 | 2,414 | ||||||||||||||||||||||||||||
| Common equity |
33,230 | 29,786 | ||||||||||||||||||||||||||||
| Total U.S. Bancorp shareholders’ equity |
37,611 | 32,200 | ||||||||||||||||||||||||||||
| Noncontrolling interests |
1,125 | 916 | ||||||||||||||||||||||||||||
| Total equity |
38,736 | 33,116 | ||||||||||||||||||||||||||||
| Total liabilities and equity |
$ | 342,849 | $ | 318,264 | ||||||||||||||||||||||||||
| Net interest income |
$ | 10,969 | $ | 10,348 | ||||||||||||||||||||||||||
| Gross interest margin |
3.33 | % | 3.40 | % | ||||||||||||||||||||||||||
| Gross interest margin without taxable-equivalent increments |
3.26 | % | 3.32 | % | ||||||||||||||||||||||||||
| Percent of Earning Assets |
||||||||||||||||||||||||||||||
| Interest income |
4.28 | % | 4.54 | % | ||||||||||||||||||||||||||
| Interest expense |
.70 | .89 | ||||||||||||||||||||||||||||
| Net interest margin |
3.58 | % | 3.65 | % | ||||||||||||||||||||||||||
| Net interest margin without taxable-equivalent increments |
3.51 | % | 3.57 | % | ||||||||||||||||||||||||||
| * | Not meaningful |
| (a) | Interest and rates are presented on a fully taxable-equivalent basis utilizing a tax rate of 35 percent. |
| (b) | Interest income and rates on loans include loan fees. Nonaccrual loans are included in average loan balances. |
| 142 | U.S. BANCORP |
| 2010 | 2009 | 2008 | 2012 v 2011 | |||||||||||||||||||||||||||||||||||||||||||||
| Average Balances |
Interest | Yields and Rates |
Average Balances |
Interest | Yields and Rates |
Average Balances |
Interest | Yields and Rates |
% Change Average Balances |
|||||||||||||||||||||||||||||||||||||||
| $ | 47,763 | $ | 1,763 | 3.69 | % | $ | 42,809 | $ | 1,770 | 4.13 | % | $ | 42,850 | $ | 2,160 | 5.04 | % | 13.9 | % | |||||||||||||||||||||||||||||
| 5,616 | 246 | 4.37 | 5,820 | 277 | 4.76 | 3,914 | 227 | 5.80 | 61.0 | |||||||||||||||||||||||||||||||||||||||
| 47,028 | 1,977 | 4.20 | 52,827 | 2,074 | 3.93 | 54,307 | 2,702 | 4.98 | 17.9 | |||||||||||||||||||||||||||||||||||||||
| 34,269 | 1,530 | 4.46 | 33,751 | 1,453 | 4.30 | 31,110 | 1,771 | 5.69 | 2.8 | |||||||||||||||||||||||||||||||||||||||
| 27,704 | 1,436 | 5.18 | 24,481 | 1,380 | 5.64 | 23,257 | 1,419 | 6.10 | 19.5 | |||||||||||||||||||||||||||||||||||||||
| 16,403 | 1,516 | 9.25 | 14,937 | 1,363 | 9.12 | 11,954 | 1,284 | 10.74 | 3.5 | |||||||||||||||||||||||||||||||||||||||
| 47,686 | 2,756 | 5.78 | 47,086 | 2,762 | 5.87 | 43,616 | 2,850 | 6.53 | (.5 | ) | ||||||||||||||||||||||||||||||||||||||
| 173,090 | 9,215 | 5.32 | 173,082 | 9,032 | 5.22 | 164,244 | 10,026 | 6.10 | 9.2 | |||||||||||||||||||||||||||||||||||||||
| 19,932 | 985 | 4.94 | 12,723 | 578 | 4.54 | 1,308 | 61 | 4.68 | (19.3 | ) | ||||||||||||||||||||||||||||||||||||||
| 193,022 | 10,200 | 5.28 | 185,805 | 9,610 | 5.17 | 165,552 | 10,087 | 6.09 | 6.9 | |||||||||||||||||||||||||||||||||||||||
| 5,641 | 166 | 2.94 | 2,853 | 91 | 3.20 | 2,730 | 156 | 5.71 | (21.0 | ) | ||||||||||||||||||||||||||||||||||||||
| 252,042 | 12,375 | 4.91 | 237,287 | 11,748 | 4.95 | 215,046 | 12,630 | 5.87 | 8.1 | |||||||||||||||||||||||||||||||||||||||
| (5,399 | ) | (4,451 | ) | (2,527 | ) | 10.6 | ||||||||||||||||||||||||||||||||||||||||||
|
|
94 |
|
(1,594 | ) | (2,068 | ) | * | |||||||||||||||||||||||||||||||||||||||||
| 39,124 | 37,118 | 33,949 | .5 | |||||||||||||||||||||||||||||||||||||||||||||
| $ | 285,861 | $ | 268,360 | $ | 244,400 | 7.7 | ||||||||||||||||||||||||||||||||||||||||||
| $ | 40,162 | $ | 37,856 | $ | 28,739 | 24.9 | % | |||||||||||||||||||||||||||||||||||||||||
| 40,184 | 77 | .19 | 36,866 | 78 | .21 | 31,137 | 251 | .81 | 6.1 | |||||||||||||||||||||||||||||||||||||||
| 39,679 | 132 | .33 | 31,795 | 145 | .46 | 26,300 | 330 | 1.25 | 3.9 | |||||||||||||||||||||||||||||||||||||||
| 20,903 | 121 | .58 | 13,109 | 71 | .54 | 5,929 | 20 | .34 | 11.0 | |||||||||||||||||||||||||||||||||||||||
|
|
16,628 |
|
303 | 1.82 | 17,879 | 461 | 2.58 | 13,583 | 472 | 3.47 | (4.8 | ) | ||||||||||||||||||||||||||||||||||||
| 27,165 | 295 | 1.08 | 30,296 | 447 | 1.48 | 30,496 | 808 | 2.65 | 8.8 | |||||||||||||||||||||||||||||||||||||||
| 144,559 | 928 | .64 | 129,945 | 1,202 | .93 | 107,445 | 1,881 | 1.75 | 5.8 | |||||||||||||||||||||||||||||||||||||||
| 33,719 | 556 | 1.65 | 29,149 | 551 | 1.89 | 38,237 | 1,144 | 2.99 | (7.0 | ) | ||||||||||||||||||||||||||||||||||||||
| 30,835 | 1,103 | 3.58 | 36,520 | 1,279 | 3.50 | 39,250 | 1,739 | 4.43 | (10.2 | ) | ||||||||||||||||||||||||||||||||||||||
| 209,113 | 2,587 | 1.24 | 195,614 | 3,032 | 1.55 | 184,932 | 4,764 | 2.58 | 1.7 | |||||||||||||||||||||||||||||||||||||||
| 7,787 | 7,869 | 7,405 | 18.8 | |||||||||||||||||||||||||||||||||||||||||||||
| 1,742 | 4,445 | 2,246 | 81.5 | |||||||||||||||||||||||||||||||||||||||||||||
| 26,307 | 21,862 | 20,324 | 11.6 | |||||||||||||||||||||||||||||||||||||||||||||
|
|
28,049 |
|
26,307 | 22,570 | 16.8 | |||||||||||||||||||||||||||||||||||||||||||
| 750 | 714 | 754 | 22.8 | |||||||||||||||||||||||||||||||||||||||||||||
| 28,799 | 27,021 | 23,324 | 17.0 | |||||||||||||||||||||||||||||||||||||||||||||
| $ | 285,861 | $ | 268,360 | $ | 244,400 | 7.7 | ||||||||||||||||||||||||||||||||||||||||||
| $ | 9,788 | $ | 8,716 | $ | 7,866 | |||||||||||||||||||||||||||||||||||||||||||
| 3.67 | % | 3.40 | % | 3.29 | % | |||||||||||||||||||||||||||||||||||||||||||
|
|
3.59 |
% |
3.32 | % | 3.23 | % | ||||||||||||||||||||||||||||||||||||||||||
| 4.91 | % | 4.95 | % | 5.87 | % | |||||||||||||||||||||||||||||||||||||||||||
| 1.03 | 1.28 | 2.21 | ||||||||||||||||||||||||||||||||||||||||||||||
| 3.88 | % | 3.67 | % | 3.66 | % | |||||||||||||||||||||||||||||||||||||||||||
|
|
3.80 |
% |
3.59 | % | 3.60 | % | ||||||||||||||||||||||||||||||||||||||||||
| U.S. BANCORP | 143 |
U.S. Bancorp
Supplemental Financial Data (Unaudited)
| Earnings Per Common Share Summary | 2012 | 2011 | 2010 | 2009 | 2008 | |||||||||||||||
| Earnings per common share |
$ 2.85 | $ 2.47 | $ 1.74 | $ .97 | $ 1.62 | |||||||||||||||
| Diluted earnings per common share |
2.84 | 2.46 | 1.73 | .97 | 1.61 | |||||||||||||||
| Dividends declared per common share |
.78 | .50 | .20 | .20 | 1.70 | |||||||||||||||
| Ratios | ||||||||||||||||||||
| Return on average assets |
1.65 | % | 1.53 | % | 1.16 | % | .82 | % | 1.21 | % | ||||||||||
| Return on average common equity |
16.2 | 15.8 | 12.7 | 8.2 | 13.9 | |||||||||||||||
| Average total U.S. Bancorp shareholders’ equity to average assets |
11.0 | 10.1 | 9.8 | 9.8 | 9.2 | |||||||||||||||
| Dividends per common share to net income per common share |
27.4 | 20.2 | 11.5 | 20.6 | 104.9 | |||||||||||||||
| Other Statistics (Dollars and Shares in Millions) | ||||||||||||||||||||
| Common shares outstanding (a) |
1,869 | 1,910 | 1,921 | 1,913 | 1,755 | |||||||||||||||
| Average common shares outstanding and common stock equivalents |
||||||||||||||||||||
| Earnings per common share |
1,887 | 1,914 | 1,912 | 1,851 | 1,742 | |||||||||||||||
| Diluted earnings per common share |
1,896 | 1,923 | 1,921 | 1,859 | 1,756 | |||||||||||||||
| Number of shareholders (b) |
49,430 | 52,677 | 55,371 | 58,610 | 61,611 | |||||||||||||||
| Common dividends declared |
$ | 1,474 | $ | 961 | $ | 385 | $ | 375 | $ | 2,971 | ||||||||||
| (a) | Defined as total common shares less common stock held in treasury at December 31. |
| (b) | Based on number of common stock shareholders of record at December 31. |
Stock Price Range and Dividends
| 2012 | 2011 | |||||||||||||||||||||||||||||||||
| Sales Price | Sales Price | |||||||||||||||||||||||||||||||||
| High | Low | Closing Price |
Dividends Declared |
High | Low | Closing Price |
Dividends Declared |
|||||||||||||||||||||||||||
| First quarter |
$ | 32.23 | $ | 27.21 | $ | 31.68 | $ | .195 | $ | 28.94 | $ | 25.65 | $ | 26.43 | $ | .125 | ||||||||||||||||||
| Second quarter |
32.98 | 28.58 | 32.16 | .195 | 27.05 | 23.66 | 25.51 | .125 | ||||||||||||||||||||||||||
| Third quarter |
35.15 | 31.76 | 34.30 | .195 | 27.17 | 20.10 | 23.54 | .125 | ||||||||||||||||||||||||||
| Fourth quarter |
35.46 | 30.96 | 31.94 | .195 | 27.58 | 21.84 | 27.05 | .125 | ||||||||||||||||||||||||||
The common stock of U.S. Bancorp is traded on the New York Stock Exchange, under the ticker symbol “USB.” At January 31, 2013, there were 49,345 holders of record of the Company’s common stock.
Stock Performance Chart
The following chart compares the cumulative total shareholder return on the Company’s common stock during the five years ended December 31, 2012, with the cumulative total return on the Standard & Poor’s 500 Index and the KBW Bank Index. The comparison assumes $100 was invested on December 31, 2007, in the Company’s common stock and in each of the foregoing indices and assumes the reinvestment of all dividends. The comparisons in the graph are based upon historical data and are not indicative of, nor intended to forecast, future performance of the Company’s common stock.
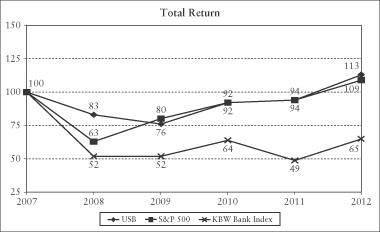
| 144 | U.S. BANCORP |
Company Information
General Business Description U.S. Bancorp is a multi-state financial services holding company headquartered in Minneapolis, Minnesota. U.S. Bancorp was incorporated in Delaware in 1929 and operates as a financial holding company and a bank holding company under the Bank Holding Company Act of 1956. The Company provides a full range of financial services, including lending and depository services, cash management, capital markets, and trust and investment management services. It also engages in credit card services, merchant and ATM processing, mortgage banking, insurance, brokerage and leasing.
U.S. Bancorp’s banking subsidiaries are engaged in the general banking business, principally in domestic markets. The subsidiaries range in size from $51 million to $254 billion in deposits and provide a wide range of products and services to individuals, businesses, institutional organizations, governmental entities and other financial institutions. Commercial and consumer lending services are principally offered to customers within the Company’s domestic markets, to domestic customers with foreign operations and to large national customers focusing on specific targeted industries. Lending services include traditional credit products as well as credit card services, leasing financing and import/export trade, asset-backed lending, agricultural finance and other products. Depository services include checking accounts, savings accounts and time certificate contracts. Ancillary services such as capital markets, treasury management and receivable lock-box collection are provided to corporate customers. U.S. Bancorp’s bank and trust subsidiaries provide a full range of asset management and fiduciary services for individuals, estates, foundations, business corporations and charitable organizations.
U.S. Bancorp’s non-banking subsidiaries primarily offer investment and insurance products to the Company’s customers principally within its markets, and fund processing services to a broad range of mutual and other funds.
Banking and investment services are provided through a network of 3,084 banking offices principally operating in the Midwest and West regions of the United States. The Company operates a network of 5,065 ATMs and provides 24-hour, seven day a week telephone customer service. Mortgage banking services are provided through banking offices and loan production offices throughout the Company’s markets. Lending products may be originated through banking offices, indirect correspondents, brokers or other lending sources. The Company is also one of the largest providers of Visa® corporate and purchasing card services and corporate trust services in the United States. A wholly-owned subsidiary, Elavon, Inc. (“Elavon”), provides merchant processing services directly to merchants and through a network of banking affiliations. Affiliates of Elavon provide similar merchant services in Canada, Mexico, Brazil and segments of Europe. The Company also provides trust services in Europe. These foreign operations are not significant to the Company.
On a full-time equivalent basis, as of December 31, 2012, U.S. Bancorp employed 64,486 people.
Risk Factors An investment in the Company involves risk, including the possibility that the value of the investment could fall substantially and that dividends or other distributions on the investment could be reduced or eliminated. Below are risk factors that could adversely affect the Company’s financial results and condition and the value of, and return on, an investment in the Company. There may be other factors not discussed below or elsewhere that could adversely affect the Company’s financial results and condition.
Industry Risk Factors
Difficult business and economic conditions may continue to adversely affect the financial services industry The Company’s business activities and earnings are affected by general business conditions in the United States and abroad, including factors such as the level and volatility of short-term and long-term interest rates, inflation, home prices, unemployment and under-employment levels, bankruptcies, household income, consumer spending, fluctuations in both debt and equity capital markets, liquidity of the global financial markets, the availability and cost of capital and credit, investor sentiment and confidence in the financial markets, and the strength of the domestic and global economies in which the Company operates. The deterioration of any of these conditions can adversely affect the Company’s consumer and commercial businesses and securities portfolios, its level of charge-offs and provision for credit losses, its capital levels and liquidity, and its results of operations.
Although the domestic economy continued its modest recovery in 2012, elevated unemployment, under-employment and household debt, along with continued stress in the consumer real estate market and certain commercial real estate markets, pose challenges to domestic economic performance and the financial services industry. The sustained high unemployment rate and the lengthy duration of unemployment have directly impaired consumer finances and pose risks to the financial services industry. The housing market remains weak and elevated levels of distressed and delinquent mortgages pose further risks to the housing market. The declines in the housing and commercial real estate markets, with falling real estate prices, increasing foreclosures and high unemployment, continue to negatively impact the credit performance of real estate related loans and
| U.S. BANCORP | 145 |
have resulted in, and may continue to result in, significant write-downs of asset values by the Company and other financial institutions. Additionally, certain European countries have experienced credit deterioration primarily due to excessive debt levels, poor economic conditions, and fiscal disorder. Deterioration in economic conditions in Europe could slow the recovery of the domestic economy or negatively impact the Company’s borrowers or other counterparties that have direct or indirect exposure to Europe. Additional negative market developments may further erode consumer confidence levels and may cause adverse changes in payment patterns, causing increases in delinquencies and default rates. Such developments could increase the Company’s charge-offs and provision for credit losses. Continuing economic deterioration that affects household or corporate incomes could also result in reduced demand for credit or fee-based products and services. A worsening of these conditions would likely exacerbate the lingering effects of the difficult market conditions experienced by the Company and others in the financial services industry.
Proposed rulemaking may adversely affect the Company The Company’s regulators have recently proposed rules under the Dodd-Frank Wall Street Reform and Consumer Protection Act (the “Dodd-Frank Act”) that impact the Company, and the Company expects to continue to face increased regulation. These regulations may affect the manner in which the Company does business and the products and services that it provides, affect or restrict the Company’s ability to compete in its current businesses or its ability to enter into or acquire new businesses, reduce or limit the Company’s revenue or impose additional fees, assessments or taxes on the Company, intensify the regulatory supervision of the Company and the financial services industry, and adversely affect the Company’s business operations or have other negative consequences.
The Dodd-Frank Act was signed into law in 2010 and mandated the most wide-ranging overhaul of financial industry regulation in decades. This legislation, among other things, established a Consumer Financial Protection Bureau (the “CFPB”) with broad authority to administer and enforce a new federal regulatory framework of consumer financial regulation. Since its establishment in 2012, the CFPB has become active in its oversight of business practices relating to various consumer financial products, resulting in fines and penalties against certain of the Company’s competitors. The Dodd-Frank Act also enhanced the regulation of consumer mortgage banking and gave authority to the new CFPB to implement mortgage regulations. Proposed and anticipated mortgage rules could dramatically alter how the industry makes mortgage loans as changes are being made throughout the life cycle of a loan, from application to origination to servicing. In addition, many of the other provisions of the Dodd-Frank Act have extended implementation periods and delayed effective dates and still require extensive rulemaking, guidance and interpretation by various regulatory agencies. Accordingly, in many respects, the ultimate impact of the legislation and its effects on the United States financial system and the Company still remain uncertain. Nevertheless, the Company expects that the Dodd-Frank Act, including current and future rules implementing its provisions and the interpretations of those rules, will have a detrimental impact on revenues and expenses, require the Company to change certain of its business practices, intensify the regulatory supervision of the Company and the financial services industry, increase the Company’s capital requirements and impose additional assessments and costs on the Company, and otherwise adversely affect the Company’s business.
Other changes in the laws, regulations and policies governing financial services companies could alter the Company’s business environment and adversely affect operations The Board of Governors of the Federal Reserve System regulates the supply of money and credit in the United States. Its fiscal and monetary policies determine in a large part the Company’s cost of funds for lending and investing and the return that can be earned on those loans and investments, both of which affect the Company’s net interest margin. Federal Reserve Board policies can also materially affect the value of financial instruments that the Company holds, such as debt securities, certain mortgage loans held for sale and mortgage servicing rights (“MSRs”). Its policies also can affect the Company’s borrowers, potentially increasing the risk that they may fail to repay their loans or satisfy their obligations to the Company. Changes in policies of the Federal Reserve Board are beyond the Company’s control and the impact of changes in those policies on the Company’s activities and results of operations can be difficult to predict.
The Company and its bank subsidiaries are heavily regulated at the federal and state levels. This regulation is to protect depositors, federal deposit insurance funds and the banking system as a whole. Congress and state legislatures and federal and state agencies continually review banking laws, regulations and policies for possible changes. Changes in statutes, regulations or policies could affect the Company in substantial and unpredictable ways, including limiting the types of financial services and products that the Company offers and/or increasing the ability of non-banks to offer competing financial services and products. The Company cannot predict whether any of this potential legislation will be enacted, and if enacted, the effect that it or any regulations would have on the Company’s financial condition or results of operations.
| 146 | U.S. BANCORP |
Further downgrades in the U.S. government’s sovereign credit rating could result in risks to the Company and general economic conditions that the Company is not able to predict Recently, certain ratings agencies downgraded their sovereign credit rating, or negatively revised their outlook, of the U.S. government, and have indicated that they will continue to assess fiscal projections, as well as the medium-term economic outlook for the United States. Because of these developments, there continues to be the perceived risk of a sovereign credit ratings downgrade of the U.S. government, including the ratings of U.S. Treasury securities. If such a downgrade were to occur, the ratings and perceived creditworthiness of instruments issued, insured or guaranteed by institutions, agencies or instrumentalities directly linked to the U.S. government could also be correspondingly affected. A downgrade might adversely affect the market value of such instruments. Instruments of this nature are often held by financial institutions, including the Company, for investment, liquidity planning and collateral purposes. A downgrade of the sovereign credit ratings of the U.S. government and perceived creditworthiness of U.S. government-related obligations could impact the Company’s liquidity.
The Company’s lending businesses and the value of the loans and debt securities it holds may be adversely affected by economic conditions, including a reversal or slowing of the current moderate recovery. Downward valuation of debt securities could also negatively impact the Company’s capital position Given the high percentage of the Company’s assets represented directly or indirectly by loans, and the importance of lending to its overall business, weak economic conditions are likely to have a negative impact on the Company’s business and results of operations. This could adversely impact loan utilization rates as well as delinquencies, defaults and customer ability to meet obligations under the loans. This is particularly the case during the period in which the aftermath of recessionary conditions continues and the positive effects of economic recovery appear to be slow to materialize and unevenly spread among the Company’s customers.
Further, weak economic conditions would likely have a negative impact on the Company’s business, its ability to serve its customers, and its results of operations. Such conditions are likely to lead to increases in the number of borrowers who become delinquent or default or otherwise demonstrate a decreased ability to meet their obligations under their loans. This would result in higher levels of nonperforming loans, net charge-offs, provision for credit losses and valuation adjustments on loans held for sale. The value to the Company of other assets such as investment securities, most of which are debt securities or other financial instruments supported by loans, similarly would be negatively impacted by widespread decreases in credit quality resulting from a weakening of the economy.
The Company is subject to liquidity risk The Company’s liquidity is essential for the operation of its business. Market conditions or other events could negatively affect the Company’s level or cost of funding. Although the Company has implemented strategies to maintain sufficient and diverse sources of funding to accommodate planned, as well as unanticipated, changes in assets and liabilities under both normal and adverse conditions, any substantial, unexpected or prolonged changes in the level or cost of liquidity could adversely affect the Company’s business.
The Company’s credit ratings affect its liquidity The Company’s credit ratings are important to its liquidity. A reduction in the Company’s credit ratings could adversely affect its liquidity and competitive position, increase its funding costs or limit its access to the capital markets. The Company’s credit ratings are subject to ongoing review by the rating agencies which consider a number of factors, including the Company’s own financial strength, performance, prospects and operations, as well as factors not within the control of the Company, including conditions affecting the financial services industry generally. There can be no assurance that the Company will maintain its current ratings.
Loss of customer deposits could increase the Company’s funding costs The Company relies on bank deposits to be a low cost and stable source of funding. The Company competes with banks and other financial services companies for deposits. If the Company’s competitors raise the rates they pay on deposits, the Company’s funding costs may increase, either because the Company raises its rates to avoid losing deposits or because the Company loses deposits and must rely on more expensive sources of funding. Higher funding costs reduce the Company’s net interest margin and net interest income. In addition, the Company’s bank customers could take their money out of the bank and put it in alternative investments. Checking and savings account balances and other forms of customer deposits may decrease when customers
| U.S. BANCORP | 147 |
perceive alternative investments, such as the stock market, as providing a better risk/return tradeoff. When customers move money out of bank deposits and into other investments, the Company may lose a relatively low cost source of funds, increasing the Company’s funding costs and reducing the Company’s net interest income.
The soundness of other financial institutions could adversely affect the Company The Company’s ability to engage in routine funding or settlement transactions could be adversely affected by the actions and commercial soundness of other domestic or foreign financial institutions. Financial services institutions are interrelated as a result of trading, clearing, counterparty or other relationships. The Company has exposure to many different counterparties, and the Company routinely executes and settles transactions with counterparties in the financial industry, including brokers and dealers, commercial banks, investment banks, mutual and hedge funds, and other institutional clients. As a result, defaults by, or even rumors or questions about, one or more financial services institutions, or the financial services industry generally, could lead to losses or defaults by the Company or by other institutions and impact the Company’s predominately United States-based businesses or the less significant merchant processing and trust businesses it operates in foreign countries. Many of these transactions expose the Company to credit risk in the event of default of the Company’s counterparty or client. In addition, the Company’s credit risk may be further increased when the collateral held by the Company cannot be realized upon or is liquidated at prices not sufficient to recover the full amount of the financial instrument exposure due the Company. There is no assurance that any such losses would not materially and adversely affect the Company’s results of operations.
The financial services industry is highly competitive, and competitive pressures could intensify and adversely affect the Company’s financial results The Company operates in a highly competitive industry that could become even more competitive as a result of legislative, regulatory and technological changes, as well as continued industry consolidation which may increase in connection with current economic and market conditions. This consolidation may produce larger, better-capitalized and more geographically diverse companies that are capable of offering a wider array of financial products and services at more competitive prices. The Company competes with other commercial banks, savings and loan associations, mutual savings banks, finance companies, mortgage banking companies, credit unions, investment companies, credit card companies, and a variety of other financial services and advisory companies. In addition, technology has lowered barriers to entry and made it possible for non-banks to offer products and services traditionally provided by banks, and for financial institutions to compete with technology companies in providing electronic and internet-based financial services. Many of the Company’s competitors have fewer regulatory constraints, and some have lower cost structures. Also, the potential need to adapt to industry changes in information technology systems, on which the Company and financial services industry are highly dependent, could present operational issues and require capital spending.
The Company continually encounters technological change The financial services industry is continually undergoing rapid technological change with frequent introductions of new technology-driven products and services. The effective use of technology increases efficiency and enables financial institutions to better serve customers and to reduce costs. The Company’s future success depends, in part, upon its ability to address customer needs by using technology to provide products and services that will satisfy customer demands, as well as to create additional efficiencies in the Company’s operations. The Company may not be able to effectively implement new technology-driven products and services or be successful in marketing these products and services to its customers. Failure to successfully keep pace with technological change affecting the financial services industry could negatively affect the Company’s revenue and profit.
Improvements in economic indicators disproportionately affecting the financial services industry may lag improvements in the general economy Should the stabilization of the United States economy continue, the improvement of certain economic indicators, such as unemployment and real estate asset values and rents, may nevertheless continue to lag behind the overall economy. These economic indicators typically affect certain industries, such as real estate and financial services, more significantly. Furthermore, financial services companies with a substantial lending business, like the Company’s, are dependent upon the ability of their borrowers to make debt service payments on loans. Should unemployment or real estate asset values fail to recover for an extended period of time, the Company could be adversely affected.
Changes in consumer use of banks and changes in consumer spending and saving habits could adversely affect the Company’s financial results Technology and other changes now allow many consumers to complete financial transactions without using banks. For example, consumers can pay bills and transfer funds directly without going through a bank. This process of eliminating banks as intermediaries, known as “disintermediation,” could result in the loss of fee income, as well as the loss of customer deposits and income generated from those deposits. In addition, changes in consumer spending and saving habits could adversely affect the Company’s operations, and the Company may be unable to
| 148 | U.S. BANCORP |
timely develop competitive new products and services in response to these changes that are accepted by new and existing customers.
Changes in interest rates could reduce the Company’s net interest income The operations of financial institutions such as the Company are dependent to a large degree on net interest income, which is the difference between interest income from loans and investments and interest expense on deposits and borrowings. An institution’s net interest income is significantly affected by market rates of interest, which in turn are affected by prevailing economic conditions, by the fiscal and monetary policies of the federal government and by the policies of various regulatory agencies. Like all financial institutions, the Company’s balance sheet is affected by fluctuations in interest rates. Volatility in interest rates can also result in the flow of funds away from financial institutions into direct investments. Direct investments, such as United States government and corporate securities and other investment vehicles (including mutual funds) generally pay higher rates of return than financial institutions, because of the absence of federal insurance premiums and reserve requirements.
Company Risk Factors
The Company’s allowance for loan losses may not cover actual losses When the Company loans money, or commits to loan money, it incurs credit risk, or the risk of losses if its borrowers do not repay their loans. Like all financial institutions, the Company reserves for credit losses by establishing an allowance through a charge to earnings to provide for loan defaults and non-performance. The amount of the Company’s allowance for loan losses is based on its historical loss experience as well as an evaluation of the risks associated with its loan portfolio, including the size and composition of the loan portfolio, current economic conditions and geographic concentrations within the portfolio. The stress on the United States economy and the local economies in which the Company does business may be greater or last longer than expected, resulting in, among other things, greater than expected deterioration in credit quality of the loan portfolio, or in the value of collateral securing those loans. In addition, the process the Company uses to estimate losses inherent in its credit exposure requires difficult, subjective, and complex judgments, including forecasts of economic conditions and how these economic predictions might impair the ability of its borrowers to repay their loans, which may no longer be capable of accurate estimation which may, in turn, impact the reliability of the process. As with any such assessments, there is also the possibility that the Company will fail to identify the proper factors or to accurately estimate the impacts of the factors that the Company does identify. The Company also makes loans to borrowers where it does not have or service the loan with the first lien on the property securing its loan. For loans in a junior lien position, the Company may not have access to information on the position or performance of the first lien when it is held and serviced by a third party and this may adversely affect the accuracy of the loss estimates for loans of these types. Increases in the Company’s allowance for loan losses may not be adequate to cover actual loan losses, and future provisions for loan losses could materially and adversely affect its financial results.
The Company may suffer increased losses in its loan portfolio despite its underwriting practices The Company seeks to mitigate the risks inherent in its loan portfolio by adhering to specific underwriting practices. These practices generally include: analysis of a borrower’s credit history, financial statements, tax returns and cash flow projections; valuation of collateral based on reports of independent appraisers; and verification of liquid assets. Although the Company believes that its underwriting criteria are, and historically have been, appropriate for the various kinds of loans it makes, the Company has already incurred high levels of losses on loans that have met these criteria, and may continue to experience higher than expected losses depending on economic factors and consumer behavior. In addition, the Company’s ability to assess the creditworthiness of its customers may be impaired if the models and approaches it uses to select, manage, and underwrite its customers become less predictive of future behaviors. Finally, the Company may have higher credit risk, or experience higher credit losses, to the extent its loans are concentrated by loan type, industry segment, borrower type, or location of the borrower or collateral. For example, the Company’s credit risk and credit losses can increase if borrowers who engage in similar activities are uniquely or disproportionately affected by economic or market conditions, or by regulation, such as regulation related to climate change. Continued deterioration in economic conditions or real estate values in states or regions where the Company has relatively larger concentrations of residential or commercial real estate could result in significantly higher credit costs. For example, at December 31, 2012, 21.8 percent of the Company’s commercial real estate loans and 13.7 percent of its residential mortgages were secured by collateral in California. Continued deterioration in real estate values and underlying economic conditions in California could result in significantly higher credit losses to the Company.
The Company faces increased risk arising out of its mortgage lending and servicing businesses During 2011, the Company and its two primary banking subsidiaries, entered into consent orders with various regulatory authorities as a result of an interagency horizontal review of the foreclosure practices of the 14 largest mortgage servicers in the United States. The consent orders mandated certain changes to the Company’s
| U.S. BANCORP | 149 |
mortgage servicing and foreclosure processes. In addition to the interagency examination by U.S. federal banking regulators, the Company has received inquiries from other governmental, legislative and regulatory authorities on this topic, has cooperated, and continues to cooperate, with these inquiries. These inquiries may lead to other administrative, civil or criminal proceedings, possibly resulting in remedies including fines, penalties, restitution, or alterations in the Company’s business practices. Additionally, reputational damage arising from the consent orders or from other inquiries and industry-wide publicity could also have an adverse effect upon the Company’s existing mortgage business and could reduce future business opportunities.
In addition to governmental or regulatory investigations, the Company, like other companies with residential mortgage origination and servicing operations, faces the risk of class actions and other litigation arising out of these operations. The Company has reserved for these matters, but the ultimate resolution could exceed those reserves.
Changes in interest rates can reduce the value of the Company’s mortgage servicing rights and mortgages held for sale, and can make its mortgage banking revenue volatile from quarter to quarter, which can reduce its earnings The Company has a portfolio of MSRs, which is the right to service a mortgage loan–collect principal, interest and escrow amounts–for a fee. The Company initially carries its MSRs using a fair value measurement of the present value of the estimated future net servicing income, which includes assumptions about the likelihood of prepayment by borrowers. Changes in interest rates can affect prepayment assumptions and thus fair value. As interest rates fall, prepayments tend to increase as borrowers refinance, and the fair value of MSR’s can decrease, which in turn reduces the Company’s earnings.
An increase in interest rates tends to lead to a decrease in demand for mortgage loans, reducing the Company’s income from loan originations. Although revenue from the Company’s MSRs may increase at the same time through increases in fair value, this offsetting revenue effect, or “natural hedge,” is not perfectly correlated in amount or timing. The Company typically uses derivatives and other instruments to hedge its mortgage banking interest rate risk, but this hedging activity may not always be successful. The Company could incur significant losses from its hedging activities, and there may be periods where it elects not to hedge its mortgage banking interest rate risk. As a result of these factors, mortgage banking revenue can experience significant volatility.
Maintaining or increasing the Company’s market share may depend on lowering prices and market acceptance of new products and services The Company’s success depends, in part, on its ability to adapt its products and services to evolving industry standards. There is increasing pressure to provide products and services at lower prices. Lower prices can reduce the Company’s net interest margin and revenues from its fee-based products and services. In addition, the widespread adoption of new technologies, including internet services, could require the Company to make substantial expenditures to modify or adapt the Company’s existing products and services. Also, these and other capital investments in the Company’s businesses may not produce expected growth in earnings anticipated at the time of the expenditure. The Company might not be successful in introducing new products and services, achieving market acceptance of its products and services, or developing and maintaining loyal customers.
The Company relies on its employees, systems and certain counterparties, and certain failures could materially adversely affect its operations The Company operates in many different businesses in diverse markets and relies on the ability of its employees and systems to process a high number of transactions. Operational risk is the risk of loss resulting from the Company’s operations, including, but not limited to, the risk of fraud by employees or persons outside of the Company, unauthorized access to its computer systems, the execution of unauthorized transactions by employees, errors relating to transaction processing and technology, breaches of the internal control system and compliance requirements and business continuation and disaster recovery. This risk of loss also includes the potential legal actions that could arise as a result of an operational deficiency or as a result of noncompliance with applicable regulatory standards, adverse business decisions or their implementation, and customer attrition due to potential negative publicity. Third parties with which the Company does business could also be sources of operational risk to the Company, including risks relating to breakdowns or failures of those parties’ systems or employees. In the event of a breakdown in the internal control system, improper operation of systems or improper employee actions, the Company could suffer financial loss, face regulatory action and suffer damage to its reputation.
If personal, confidential or proprietary information of customers or clients in the Company’s possession were to be mishandled or misused, the Company could suffer significant regulatory consequences, reputational damage and financial loss. This mishandling or misuse could include, for example, situations in which the information is erroneously provided to parties who are not permitted to have the information, either by fault of the Company’s systems, employees, or counterparties, or where the information is intercepted or otherwise inappropriately taken by third parties.
| 150 | U.S. BANCORP |
A breach in the security of the Company’s systems could disrupt its businesses, result in the disclosure of confidential information, damage its reputation and create significant financial and legal exposure Although the Company devotes significant resources to maintain and regularly upgrade its systems and processes that are designed to protect the security of the Company’s computer systems, software, networks and other technology assets and the confidentiality, integrity and availability of information belonging to the Company and its customers, there is no assurance that the Company’s security measures will provide absolute security. In fact, many other financial services institutions and companies engaged in data processing have reported breaches in the security of their websites or other systems, some of which have involved sophisticated and targeted attacks intended to obtain unauthorized access to confidential information, destroy data, disable or degrade service, or sabotage systems, often through the introduction of computer viruses or malware, cyberattacks and other means. The Company and several other financial institutions in the United States have recently experienced attacks from technically sophisticated and well-resourced third parties that were intended to disrupt normal business activities by making internet banking systems inaccessible to customers for extended periods. These “denial-of-service” attacks have not breached the Company’s data security systems, but require substantial resources to defend, and may affect customer satisfaction and behavior.
Despite the Company’s efforts to ensure the integrity of its systems, it is possible that the Company may not be able to anticipate or to implement effective preventive measures against all security breaches of these types, especially because the techniques used change frequently or are not recognized until launched, and because security attacks can originate from a wide variety of sources, including persons who are involved with organized crime or associated with external service providers or who may be linked to terrorist organizations or hostile foreign governments. Those parties may also attempt to fraudulently induce employees, customers or other users of the Company’s systems to disclose sensitive information in order to gain access to the Company’s data or that of its customers or clients. These risks may increase in the future as the Company continues to increase its mobile payments and other internet-based product offerings and expands its internal usage of web-based products and applications.
If the Company’s security systems were penetrated or circumvented, it could cause serious negative consequences for the Company, including significant disruption of the Company’s operations, misappropriation of confidential information of the Company or that of its customers, or damage to computers or systems of the Company and those of its customers and counterparties, and could result in violations of applicable privacy and other laws, financial loss to the Company or to its customers, loss of confidence in the Company’s security measures, customer dissatisfaction, significant litigation exposure, and harm to the Company’s reputation, all of which could have a material adverse effect on the Company.
The change in residual value of leased assets may have an adverse impact on the Company’s financial results The Company engages in leasing activities and is subject to the risk that the residual value of the property under lease will be less than the Company’s recorded asset value. Adverse changes in the residual value of leased assets can have a negative impact on the Company’s financial results. The risk of changes in the realized value of the leased assets compared to recorded residual values depends on many factors outside of the Company’s control, including supply and demand for the assets, condition of the assets at the end of the lease term, and other economic factors.
Negative publicity could damage the Company’s reputation and adversely impact its business and financial results Reputation risk, or the risk to the Company’s business, earnings and capital from negative publicity, is inherent in the Company’s business and increased substantially because of the financial crisis beginning in 2008. The reputation of the financial services industry in general has been damaged as a result of the financial crisis and other matters affecting the financial services industry, including mortgage foreclosure issues. Negative public opinion about the financial services industry generally or the Company specifically could adversely affect the Company’s ability to keep and attract customers, and expose the Company to litigation and regulatory action. Negative publicity can result from the Company’s actual or alleged conduct in any number of activities, including lending practices, mortgage servicing and foreclosure practices, corporate governance, regulatory compliance, mergers and acquisitions, and related disclosure, sharing or inadequate protection of customer information, and actions taken by government regulators and community organizations in response to that conduct. Because most of the Company’s businesses operate under the “U.S. Bank” brand, actual or alleged conduct by one business can result in negative publicity about other businesses the Company operates. Although the Company takes steps to minimize reputation risk in dealing with customers and other constituencies, the Company, as a large diversified financial services company with a high industry profile, is inherently exposed to this risk.
The Company’s reported financial results depend on management’s selection of accounting methods and certain assumptions and estimates The Company’s accounting policies and methods are fundamental to how the Company records and reports its financial condition and results of operations. The Company’s management must exercise
| U.S. BANCORP | 151 |
judgment in selecting and applying many of these accounting policies and methods so they comply with generally accepted accounting principles and reflect management’s judgment regarding the most appropriate manner to report the Company’s financial condition and results. In some cases, management must select the accounting policy or method to apply from two or more alternatives, any of which might be reasonable under the circumstances, yet might result in the Company’s reporting materially different results than would have been reported under a different alternative.
Certain accounting policies are critical to presenting the Company’s financial condition and results. They require management to make difficult, subjective or complex judgments about matters that are uncertain. Materially different amounts could be reported under different conditions or using different assumptions or estimates. These critical accounting policies include: the allowance for credit losses; estimations of fair value; the valuation of purchased loans and related indemnification assets; the valuation of MSRs; the valuation of goodwill and other intangible assets; and income taxes. Because of the uncertainty of estimates involved in these matters, the Company may be required to do one or more of the following: significantly increase the allowance for credit losses and/or sustain credit losses that are significantly higher than the reserve provided; recognize significant impairment on its goodwill and other intangible asset balances; or significantly increase its accrued taxes liability. For more information, refer to “Critical Accounting Policies” in this Annual Report.
Changes in accounting standards could materially impact the Company’s financial statements From time to time, the Financial Accounting Standards Board and the United States Securities and Exchange Commission change the financial accounting and reporting standards that govern the preparation of the Company’s financial statements. These changes can be hard to predict and can materially impact how the Company records and reports its financial condition and results of operations. In some cases, the Company could be required to apply a new or revised standard retroactively, resulting in the Company’s restating prior period financial statements.
Acquisitions may not produce revenue enhancements or cost savings at levels or within timeframes originally anticipated and may result in unforeseen integration difficulties and dilution to existing shareholders The Company regularly explores opportunities to acquire financial services businesses or assets and may also consider opportunities to acquire other banks or financial institutions. The Company cannot predict the number, size or timing of acquisitions.
There can be no assurance that the Company’s acquisitions will have the anticipated positive results, including results related to expected revenue increases, cost savings, increases in geographic or product presence, and/or other projected benefits from the acquisition. Integration efforts could divert management’s attention and resources, which could adversely affect the Company’s operations or results. The integration could result in higher than expected customer loss, deposit attrition (run-off), loss of key employees, disruption of the Company’s business or the business of the acquired company, or otherwise adversely affect the Company’s ability to maintain relationships with customers and employees or achieve the anticipated benefits of the acquisition. Also, the negative effect of any divestitures required by regulatory authorities in acquisitions or business combinations may be greater than expected.
The Company must generally receive federal regulatory approval before it can acquire a bank or bank holding company. The Company cannot be certain when or if, or on what terms and conditions, any required regulatory approvals will be granted. The Company may be required to sell banks or branches as a condition to receiving regulatory approval.
Future acquisitions could be material to the Company and it may issue additional shares of stock to pay for those acquisitions, which would dilute current shareholders’ ownership interests.
The Company’s business could suffer if the Company fails to attract and retain skilled people The Company’s success depends, in large part, on its ability to attract and retain key people. Competition for the best people in most activities the Company engages in can be intense. The Company may not be able to hire the best people or to keep them. Recent strong scrutiny of compensation practices has resulted and may continue to result in additional regulation and legislation in this area as well as additional legislative and regulatory initiatives, and there is no assurance that this will not cause increased turnover or impede the Company’s ability to retain and attract the highest caliber employees.
The Company relies on other companies to provide key components of the Company’s business infrastructure Third party vendors provide key components of the Company’s business infrastructure, such as internet connections, network access and mutual fund distribution. While the Company has selected these third party vendors carefully, it does not control their actions. Any problems caused by these third parties, including as a result of their not providing the Company their services for any reason or their performing their services poorly, could adversely affect the Company’s ability to deliver products and services to the Company’s customers and otherwise to conduct its business. Replacing these third party vendors could also entail significant delay and expense. In addition, failure of third party vendors to handle current or higher volumes of use could adversely affect the Company’s ability to deliver products and services to clients and otherwise to conduct business. Technological or financial
| 152 | U.S. BANCORP |
difficulties of a third party service provider could adversely affect the Company’s business to the extent those difficulties result in the interruption or discontinuation of services provided by that party.
The Company has risk related to legal proceedings The Company is involved in judicial, regulatory and arbitration proceedings concerning matters arising from its business activities. The Company establishes reserves for legal claims when payments associated with the claims become probable and the costs can be reasonably estimated. The Company may still incur legal costs for a matter even if it has not established a reserve. In addition, the actual cost of resolving a legal claim may be substantially higher than any amounts reserved for that matter. The ultimate resolution of any pending or future legal proceeding, depending on the remedy sought and granted, could materially adversely affect the Company’s results of operations and financial condition.
The Company is exposed to risk of environmental liability when it takes title to properties In the course of the Company’s business, the Company may foreclose on and take title to real estate. As a result, the Company could be subject to environmental liabilities with respect to these properties. The Company may be held liable to a governmental entity or to third parties for property damage, personal injury, investigation and clean-up costs incurred by these parties in connection with environmental contamination or may be required to investigate or clean up hazardous or toxic substances or chemical releases at a property. The costs associated with investigation or remediation activities could be substantial. In addition, if the Company is the owner or former owner of a contaminated site, it may be subject to common law claims by third parties based on damages and costs resulting from environmental contamination emanating from the property. If the Company becomes subject to significant environmental liabilities, its financial condition and results of operations could be adversely affected.
The Company’s business and financial performance could be adversely affected, directly or indirectly, by disasters, by terrorist activities or by international hostilities Neither the occurrence nor the potential impact of disasters, terrorist activities or international hostilities can be predicted. However, these occurrences could impact the Company directly (for example, by interrupting the Company’s systems, which could prevent the Company from obtaining deposits, originating loans and processing and controlling its flow of business, causing significant damage to the Company’s facilities or otherwise preventing the Company from conducting business in the ordinary course), or indirectly as a result of their impact on the Company’s borrowers, depositors, other customers, suppliers or other counterparties (for example, by damaging properties pledged as collateral for the Company’s loans or impairing the ability of certain borrowers to repay their loans). The Company could also suffer adverse consequences to the extent that disasters, terrorist activities or international hostilities affect the financial markets or the economy in general or in any particular region. These types of impacts could lead, for example, to an increase in delinquencies, bankruptcies or defaults that could result in the Company experiencing higher levels of nonperforming assets, net charge-offs and provisions for credit losses.
The Company’s ability to mitigate the adverse consequences of these occurrences is in part dependent on the quality of the Company’s resiliency planning, and the Company’s ability, if any, to anticipate the nature of any such event that occurs. The adverse impact of disasters, terrorist activities or international hostilities also could be increased to the extent that there is a lack of preparedness on the part of national or regional emergency responders or on the part of other organizations and businesses that the Company transacts with, particularly those that it depends upon, but has no control over. Additionally, the nature and level of natural disasters may be exacerbated by global climate change.
The Company relies on dividends from its subsidiaries for its liquidity needs The Company is a separate and distinct legal entity from its bank subsidiaries and non-bank subsidiaries. The Company receives a significant portion of its cash from dividends paid by its subsidiaries. These dividends are the principal source of funds to pay dividends on the Company’s stock and interest and principal on its debt. Various federal and state laws and regulations limit the amount of dividends that its bank subsidiaries and certain of its non-bank subsidiaries may pay to the Company without regulatory approval. Also, the Company’s right to participate in a distribution of assets upon a subsidiary’s liquidation or reorganization is subject to prior claims of the subsidiary’s creditors, except to the extent that any of the Company’s claims as a creditor of that subsidiary may be recognized.
The Company has non-banking businesses that are subject to various risks and uncertainties The Company is a diversified financial services company, and the Company’s business model is based on a mix of businesses that provide a broad range of products and services delivered through multiple distribution channels. In addition to banking, the Company provides payment services, investments, mortgages and corporate and personal trust services. Although the Company believes its diversity helps lessen the effect of downturns in any one segment of its industry, it also means the Company’s earnings could be subject to various specific risks and uncertainties related to these non-banking businesses.
| U.S. BANCORP | 153 |
The Company’s stock price can be volatile The Company’s stock price can fluctuate widely in response to a variety of factors, including:
| • | actual or anticipated variations in the Company’s quarterly operating results; |
| • | recommendations by securities analysts; |
| • | significant acquisitions or business combinations; |
| • | strategic partnerships, joint ventures or capital commitments by, or involving, the Company or the Company’s competitors; |
| • | operating and stock price performance of other companies that investors deem comparable to the Company; |
| • | new technology used or services offered by the Company’s competitors; |
| • | news reports relating to trends, concerns and other issues in the financial services industry; and |
| • | changes in government regulations. |
General market fluctuations, industry factors and general economic and political conditions and events, as well as interest rate changes, currency fluctuations, or unforeseen events such as terrorist attacks could cause the Company’s stock price to decrease regardless of the Company’s operating results.
| 154 | U.S. BANCORP |
Directors
Richard K. Davis1,6
Chairman, President and Chief Executive Officer
U.S. Bancorp
Minneapolis, Minnesota
Douglas M. Baker, Jr.5,6
Chairman and Chief Executive Officer
Ecolab Inc.
(Cleaning and sanitizing products)
St. Paul, Minnesota
Y. Marc Belton3,4
Executive Vice President, Global Strategy,
Growth and Marketing Innovation
General Mills, Inc.
(Consumer food products)
Minneapolis, Minnesota
Victoria Buyniski Gluckman2,4
Retired Chairman and Chief Executive Officer
United Medical Resources, Inc.,
a wholly owned subsidiary of
UnitedHealth Group Incorporated
(Healthcare benefits administration)
Cincinnati, Ohio
Arthur D. Collins, Jr.1,2,5
Retired Chairman and Chief Executive Officer
Medtronic, Inc.
(Medical device and technology)
Chicago, Illinois
Roland A. Hernandez3,4
Founding Principal and Chief Executive Officer
Hernandez Media Ventures
(Media)
Pasadena, California
Doreen Woo Ho3,6
President
San Francisco Port Commission
(Government)
San Francisco, California
Joel W. Johnson3,6
Retired Chairman and Chief Executive Officer
Hormel Foods Corporation
(Consumer food products)
Scottsdale, Arizona
Olivia F. Kirtley1,3,5
Business Consultant
(Consulting)
Louisville, Kentucky
Jerry W. Levin1,2,5
Chairman and Chief Executive Officer
Wilton Brands Inc.
(Consumer products) and
Chairman and Chief Executive Officer
JW Levin Partners LLC
(Private investment and advisory)
New York, New York
David B. O’Maley2,5
Retired Chairman, President
and Chief Executive Officer
Ohio National Financial Services, Inc.
(Insurance)
Cincinnati, Ohio
O’dell M. Owens, M.D., M.P.H.1,3,4
President
Cincinnati State Technical and Community College
(Higher education)
Cincinnati, Ohio
Craig D. Schnuck4,6
Former Chairman and Chief Executive Officer
Schnuck Markets, Inc.
(Food retail)
St. Louis, Missouri
Patrick T. Stokes1,2,6
Former Chairman and Former Chief Executive Officer
Anheuser-Busch Companies, Inc.
(Consumer products)
St. Louis, Missouri
1. Executive Committee
2. Compensation and Human Resources Committee
3. Audit Committee
4. Community Reinvestment and Public Policy Committee
5. Governance Committee
6. Risk Management Committee
| U.S. BANCORP | 157 |