
Annual Report
August 31, 2023
MFS® Global Real
Estate Fund
Estate Fund

GRE-ANN
MFS® Global Real
Estate Fund
Estate Fund
CONTENTS
| 1 | |
| 3 | |
| 6 | |
| 9 | |
| 11 | |
| 14 | |
| 16 | |
| 17 | |
| 18 | |
| 24 | |
| 34 | |
| 36 | |
| 40 | |
| 44 | |
| 45 | |
| 45 | |
| 45 | |
| 45 | |
| 45 | |
| 46 |
| back cover |
The report is prepared for the
general information of shareholders. It is authorized for distribution to prospective investors only when preceded or accompanied by a current prospectus.
NOT FDIC INSURED
• MAY LOSE VALUE • NO BANK GUARANTEE
Portfolio Composition
| (g) | The Global Industry Classification Standard (GICS®) was developed by and/or is the exclusive property of MSCI, Inc. and S&P Global Market Intelligence Inc. (“S&P Global Market Intelligence”). GICS is a service mark of MSCI and S&P Global Market Intelligence and has been licensed for use by MFS. MFS has applied its own internal sector/industry classification methodology for equity securities and non-equity securities that are unclassified by GICS. |
| (x) | Represents the portfolio’s exposure to issuer countries as a percentage of a portfolio’s net assets. For purposes of this presentation, United States includes Cash & Cash Equivalents. |
1
Portfolio Composition - continued
| (y) | Represents the portfolio’s exposure to a particular currency as a percentage of a portfolio's net assets. For purposes of this presentation, United States Dollar includes Cash & Cash Equivalents. |
Cash & Cash Equivalents includes
any cash, investments in money market funds, short-term securities, and other assets less liabilities. Please see the Statement of Assets and Liabilities for additional information related to the fund’s cash
position and other assets and liabilities.
Percentages are based on net assets
as of August 31, 2023.
The portfolio is actively managed
and current holdings may be different.
2
Management Review
Summary of Results
For the twelve months ended August
31, 2023, Class A shares of the MFS Global Real Estate Fund (fund) provided a total return of -4.76%, at net asset value. This compares with a return of -5.19% for the fund’s benchmark, the FTSE EPRA Nareit
Developed Real Estate Index (net div) (FTSE Index).
Market Environment
During the reporting period, central
banks around the world had to combat the strongest inflationary pressures in four decades, fueled by the global fiscal response to the pandemic, disrupted supply chains and the dislocations to energy markets stemming
from the war in Ukraine. Interest rates rose substantially, but the effects of a tighter monetary policy may not have been fully experienced yet, given that monetary policy works with long and variable lags. Strains
resulting from the abrupt tightening of monetary policy began to affect some parts of the economy, most acutely among small and regional US banks, which suffered from deposit flight as depositors sought higher yields
on their savings. Those shifts exposed an asset-liability mismatch that forced the closure of several institutions by regulators. Given the importance of small and mid-sized lenders to the provision of credit in the
US, concerns were raised in the aftermath of the crisis that credit availability could become constrained, leading to slower economic growth, although those effects have been limited thus far. China’s
abandonment of its Zero-COVID policy ushered in a brief uptick in economic activity in the world’s second-largest economy in early 2023, although its momentum soon stalled as focus turned to the country’s
highly-indebted property development sector. In developed markets, consumer demand for services remained stronger than the demand for goods.
Policymakers found themselves in the
difficult position of trying to restrain inflation without tipping economies into recession. Despite the challenging macroeconomic and geopolitical environment, central banks remained focused on controlling price
pressures while also confronting increasing financial stability concerns. Central banks had to juggle achieving their inflation mandates while using macroprudential tools to keep banking systems liquid, a potentially
difficult balancing act, and one that suggested that we may be nearing a peak in policy rates.
Against an environment of relatively
tight labor markets, tighter global financial conditions and volatile materials prices, investor anxiety appeared to have increased over the potential that corporate profit margins may be past peak for this cycle.
That said, signs that supply chains have generally normalized, coupled with low levels of unemployment across developed markets and hopes that inflation levels have peaked, were supportive factors for the
macroeconomic backdrop.
Contributors to Performance
Relative to the FTSE Index, the
fund’s real estate investments within Mexico benefited performance, led by holding shares of real estate property development firm Corporacion Inmobiliaria Vesta(b) (Mexico). The stock price of Corporacion
Inmobiliaria Vesta appreciated as the company delivered financial results ahead of expectations, primarily driven by strong occupancy rate and rental revenues, higher-than-anticipated land purchases in Mexico City and
a solid construction pipeline.
3
Management Review - continued
Favorable stock selection and, to a
lesser extent, an overweight position in real estate investments in Australia also supported relative returns, driven by the fund’s holdings of industrial property and business space management firm Goodman
Group(b) (Australia).
Elsewhere, the fund’s holdings
of post-acute healthcare services provider Encompass Health(b) contributed to relative returns. The stock price of Encompass Health advanced as the company’s financial results exceeded expectations, primarily
driven by volume growth, cost controls and improvement in labor costs. The company also raised its fiscal year guidance, which further supported the stock. The fund’s overweight positions in property developer
and manager Simon Property Group, data centers operator Equinix and real estate investment trust Phillips Edison, and not holding shares of storage facility operator Public Storage, real estate companies
LinkREIT (Hong Kong) and Realty Income, and real estate investment trust Medical Properties Trust, further benefited relative performance.
During the reporting period, the
fund’s relative currency exposure, resulting primarily from differences between the fund's and the benchmark's exposures to holdings of securities denominated in foreign currencies, was another contributor to
relative performance. All of MFS’ investment decisions are driven by the fundamentals of each individual opportunity and as such, it is common for our funds to have different currency exposure than the
benchmark.
Detractors from Performance
Security selection and, to a lesser
extent, an underweight position in real estate investments within Japan detracted from relative performance. Within Japan, holding shares of real estate services provider KATITAS(b) (Japan) held back relative results.
The stock price of KATITAS declined as the company reported a deterioration in its gross margin due to ongoing higher materials and housing product costs.
Security selection within Hong Kong
also hindered relative results, led by the fund’s holdings of industrial and logistics property manager ESR Group(b)(h) (Hong Kong). The stock price of ESR Group fell due to a slowdown in e-commerce sales, lower
revenues and rising competition in the management space.
Securities in other countries that
detracted from relative returns included the fund's overweight positions in real estate investment trusts, Extra Space Storage and Sun Communities, and the timing of the fund’s ownership in shares of senior
housing operator Welltower(h). Additionally, holding shares of real estate investment trust SBA Communications(b), broadcast and communication tower management firm American
4
Management Review - continued
Tower(b)(h), telecommunications tower operator
Helios Towers(b) (United Kingdom) and real estate investment trust Rayonier(b), and not holding shares of real estate investment trust Digital Realty Trust, further weakened the fund’s relative
performance.
Respectfully,
Portfolio Manager(s)
Rick Gable and Mark Syn
Rick Gable and Mark Syn
| (b) | Security is not a benchmark constituent. |
| (h) | Security was not held in the portfolio at period end. |
The views expressed in this report
are those of the portfolio manager(s) only through the end of the period of the report as stated on the cover and do not necessarily reflect the views of MFS or any other person in the MFS organization. These views
are subject to change at any time based on market or other conditions, and MFS disclaims any responsibility to update such views. These views may not be relied upon as investment advice or an indication of trading
intent on behalf of any MFS portfolio. References to specific securities are not recommendations of such securities, and may not be representative of any MFS portfolio’s current or future investments.
5
Performance Summary THROUGH 8/31/23
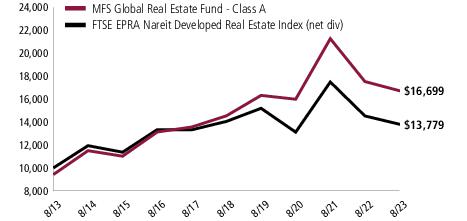
The following chart illustrates a
representative class of the fund’s historical performance in comparison to its benchmark(s). Performance results include the deduction of the maximum applicable sales charge and reflect the percentage change in
net asset value, including reinvestment of dividends and capital gains distributions. The performance of other share classes will be greater than or less than that of the class depicted below. Benchmarks are unmanaged
and may not be invested in directly. Benchmark returns do not reflect sales charges, commissions or expenses. (See Notes to Performance Summary.)
Performance data shown represents past
performance and is no guarantee of future results. Investment return and principal value fluctuate so your shares, when sold, may be worth more or less than the original cost; current performance may be lower or
higher than quoted. The performance shown does not reflect the deduction of taxes, if any, that a shareholder would pay on fund distributions or the redemption of fund shares.
Growth of a Hypothetical $10,000
Investment
6
Performance Summary - continued
Total Returns through 8/31/23
Average annual without sales
charge
| Share Class | Class Inception Date | 1-yr | 5-yr | 10-yr | Life (t) |
| A | 3/11/09 | (4.76)% | 2.80% | 5.89% | N/A |
| B | 12/19/14 | (5.44)% | 2.05% | N/A | 3.58% |
| C | 12/19/14 | (5.45)% | 2.05% | N/A | 3.58% |
| I | 3/11/09 | (4.57)% | 3.07% | 6.13% | N/A |
| R1 | 12/19/14 | (5.49)% | 2.04% | N/A | 3.58% |
| R2 | 12/19/14 | (5.03)% | 2.55% | N/A | 4.10% |
| R3 | 12/19/14 | (4.80)% | 2.80% | N/A | 4.36% |
| R4 | 12/19/14 | (4.47)% | 3.06% | N/A | 4.62% |
| R6 | 7/02/12 | (4.39)% | 3.16% | 6.22% | N/A |
Comparative benchmark(s)
| FTSE EPRA Nareit Developed Real Estate Index (net div) (f) | (5.19)% | (0.40)% | 3.26% | N/A |
Average annual with sales
charge
| A With Initial Sales Charge (5.75%) | (10.24)% | 1.59% | 5.26% | N/A |
| B With CDSC (Declining over six years from 4% to 0%) (v) | (9.04)% | 1.69% | N/A | 3.58% |
| C With CDSC (1% for 12 months) (v) | (6.35)% | 2.05% | N/A | 3.58% |
CDSC – Contingent Deferred
Sales Charge.
Class I, R1, R2, R3, R4, and R6
shares do not have a sales charge.
| (f) | Source: FactSet Research Systems Inc. |
| (t) | For the period from the class inception date through the stated period end (for those share classes with less than 10 years of performance history). No comparative benchmark performance information is provided for “life” periods. (See Notes to Performance Summary.) |
| (v) | Assuming redemption at the end of the applicable period. |
Benchmark Definition(s)
FTSE EPRA Nareit Developed Real
Estate Index(c) (net div) – measures the performance of eligible real estate equities worldwide that generate a majority of their revenue and income through
the ownership, disposure and development of income-producing real estate.
It is not possible to invest
directly in an index.
| (c) | FTSE International Limited (“FTSE”)© FTSE 2019. “FTSE®” is a trademark of the London Stock Exchange Group companies and is used by FTSE International Limited under license. “FT-SE®”, “FOOTSIE®” and “FTSE4GOOD®” are trademarks of the London Stock Exchange Group companies. “Nareit®” is a trademark of the National Association of Real Estate Investment Trusts (“Nareit”) and “EPRA®” is a trademark of the European Public Real Estate Association (“EPRA”) and all are used by FTSE under license. The FTSE EPRA Nareit Developed Real Estate |
7
Performance Summary - continued
Index is calculated by FTSE.
Neither FTSE, Euronext N.V., Nareit, nor EPRA sponsor, endorse, or promote this product and are not in any way connected to it and do not accept any liability. All intellectual property rights in the index values and
constituent list vests in FTSE, Euronext N.V., Nareit, and EPRA. Neither FTSE nor its licensors accept any liability for any errors or omissions in the FTSE indices and/or FTSE ratings or underlying data. No further
distribution of FTSE Data is permitted without FTSE's express written consent.
Notes to Performance Summary
Average annual total return
represents the average annual change in value for each share class for the periods presented. Life returns are presented where the share class has less than 10 years of performance history and represent the average
annual total return from the class inception date to the stated period end date. As the fund's share classes may have different inception dates, the life returns may represent different time periods and may not be
comparable.
Performance results reflect any
applicable expense subsidies and waivers in effect during the periods shown. Without such subsidies and waivers the fund's performance results would be less favorable. Please see the prospectus and financial
statements for complete details.
Performance results do not include
adjustments made for financial reporting purposes in accordance with U.S. generally accepted accounting principles and may differ from amounts reported in the financial highlights.
From time to time the fund may
receive proceeds from litigation settlements, without which performance would be lower.
8
Expense Table
Fund expenses borne by the
shareholders during the period,
March 1, 2023 through August 31, 2023
March 1, 2023 through August 31, 2023
As a shareholder of the fund, you
incur two types of costs: (1) transaction costs, including sales charges (loads) on certain purchase or redemption payments, and (2) ongoing costs, including management fees; distribution and service (12b-1) fees; and
other fund expenses. This example is intended to help you understand your ongoing costs (in dollars) of investing in the fund and to compare these costs with the ongoing costs of investing in other mutual funds.
The example is based on an
investment of $1,000 invested at the beginning of the period and held for the entire period March 1, 2023 through August 31, 2023.
Actual Expenses
The first line for each share class
in the following table provides information about actual account values and actual expenses. You may use the information in this line, together with the amount you invested, to estimate the expenses that you paid over
the period. Simply divide your account value by $1,000 (for example, an $8,600 account value divided by $1,000 = 8.6), then multiply the result by the number in the first line under the heading entitled
“Expenses Paid During Period” to estimate the expenses you paid on your account during this period.
Hypothetical Example for
Comparison Purposes
The second line for each share class
in the following table provides information about hypothetical account values and hypothetical expenses based on the fund’s actual expense ratio and an assumed rate of return of 5% per year before expenses,
which is not the fund’s actual return. The hypothetical account values and expenses may not be used to estimate the actual ending account balance or expenses you paid for the period. You may use this information
to compare the ongoing costs of investing in the fund and other funds. To do so, compare this 5% hypothetical example with the 5% hypothetical examples that appear in the shareholder reports of the other funds.
Please note that the expenses shown
in the table are meant to highlight your ongoing costs only and do not reflect any transactional costs, such as sales charges (loads). Therefore, the second line for each share class in the table is useful in
comparing ongoing costs only, and will not help you determine the relative total costs of owning different funds. In addition, if these transactional costs were included, your costs would have been higher.
9
Expense Table - continued
| Share Class | Annualized Expense Ratio | Beginning Account Value 3/01/23 | Ending Account Value 8/31/23 | Expenses Paid During Period (p) 3/01/23-8/31/23 | |
| A | Actual | 1.18% | $1,000.00 | $983.19 | $5.90 |
| Hypothetical (h) | 1.18% | $1,000.00 | $1,019.26 | $6.01 | |
| B | Actual | 1.93% | $1,000.00 | $980.15 | $9.63 |
| Hypothetical (h) | 1.93% | $1,000.00 | $1,015.48 | $9.80 | |
| C | Actual | 1.93% | $1,000.00 | $980.10 | $9.63 |
| Hypothetical (h) | 1.93% | $1,000.00 | $1,015.48 | $9.80 | |
| I | Actual | 0.93% | $1,000.00 | $984.47 | $4.65 |
| Hypothetical (h) | 0.93% | $1,000.00 | $1,020.52 | $4.74 | |
| R1 | Actual | 1.93% | $1,000.00 | $979.96 | $9.63 |
| Hypothetical (h) | 1.93% | $1,000.00 | $1,015.48 | $9.80 | |
| R2 | Actual | 1.43% | $1,000.00 | $982.64 | $7.15 |
| Hypothetical (h) | 1.43% | $1,000.00 | $1,018.00 | $7.27 | |
| R3 | Actual | 1.18% | $1,000.00 | $983.24 | $5.90 |
| Hypothetical (h) | 1.18% | $1,000.00 | $1,019.26 | $6.01 | |
| R4 | Actual | 0.93% | $1,000.00 | $985.11 | $4.65 |
| Hypothetical (h) | 0.93% | $1,000.00 | $1,020.52 | $4.74 | |
| R6 | Actual | 0.85% | $1,000.00 | $985.75 | $4.25 |
| Hypothetical (h) | 0.85% | $1,000.00 | $1,020.92 | $4.33 |
| (h) | 5% class return per year before expenses. |
| (p) | “Expenses Paid During Period” are equal to each class’s annualized expense ratio, as shown above, multiplied by the average account value over the period, multiplied by 184/365 (to reflect the one-half year period). Expenses paid do not include any applicable sales charges (loads). If these transaction costs had been included, your costs would have been higher. |
10
Portfolio of Investments
8/31/23
The Portfolio of Investments is a
complete list of all securities owned by your fund. It is categorized by broad-based asset classes.
| Issuer | Shares/Par | Value ($) | ||
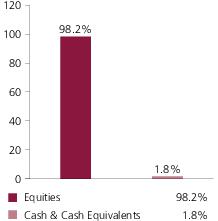
| Common Stocks – 98.2% | ||||
| Brokerage & Asset Managers – 0.7% | ||||
| Brookfield Asset Management Ltd. | 497,357 | $17,185,908 | ||
| Construction – 6.7% | ||||
| American Homes 4 Rent, “A”, REIT | 1,323,896 | $47,713,212 | ||
| AvalonBay Communities, Inc., REIT | 299,909 | 55,129,272 | ||
| Essex Property Trust, Inc., REIT | 252,844 | 60,275,481 | ||
| $163,117,965 | ||||
| Engineering - Construction – 3.0% | ||||
| Corporacion Inmobiliaria Vesta S.A.B. de C.V. | 12,274,184 | $45,510,332 | ||
| Prologis Property Mexico S.A. de C.V., REIT | 8,039,679 | 28,168,700 | ||
| $73,679,032 | ||||
| Forest & Paper Products – 4.2% | ||||
| Rayonier, Inc., REIT | 1,776,574 | $53,119,563 | ||
| Weyerhaeuser Co., REIT | 1,496,346 | 49,005,331 | ||
| $102,124,894 | ||||
| Medical & Health Technology & Services – 3.6% | ||||
| Encompass Health Corp. | 612,413 | $43,505,820 | ||
| Universal Health Services, Inc. | 327,886 | 44,166,244 | ||
| $87,672,064 | ||||
| Network & Telecom – 6.0% | ||||
| Equinix, Inc., REIT | 186,327 | $145,592,191 | ||
| Printing & Publishing – 0.8% | ||||
| Lamar Advertising Co., REIT | 204,818 | $18,683,498 | ||
| Real Estate – 68.6% | ||||
| Alexandria Real Estate Equities, Inc., REIT | 430,719 | $50,109,848 | ||
| Big Yellow Group PLC, REIT | 3,173,616 | 43,218,598 | ||
| Brixmor Property Group, Inc., REIT | 2,024,017 | 44,487,894 | ||
| Canadian Apartment Properties, REIT | 841,324 | 30,179,821 | ||
| CapitaLand India Trusts IEU, REIT | 19,323,063 | 16,585,707 | ||
| CapitaLand Investment Ltd. | 24,079,200 | 57,728,076 | ||
| CubeSmart, REIT | 874,881 | 36,491,286 | ||
| Douglas Emmett, Inc., REIT | 869,352 | 11,884,042 | ||
| Embassy Office Parks, REIT | 3,277,774 | 12,082,662 | ||
| Equity Lifestyle Properties, Inc., REIT | 1,088,657 | 72,896,473 | ||
| Extra Space Storage, Inc., REIT | 527,904 | 67,930,687 | ||
| Farmland Partners, Inc., REIT | 979,715 | 10,874,836 | ||
11
Portfolio of Investments –
continued
| Issuer | Shares/Par | Value ($) | ||
| Common Stocks – continued | ||||
| Real Estate – continued | ||||
| Federal Realty Investment Trust, REIT | 432,110 | $42,320,853 | ||
| Goodman Group, REIT | 5,685,098 | 86,050,278 | ||
| Grainger PLC | 19,264,889 | 57,644,016 | ||
| Granite REIT | 906,627 | 50,511,309 | ||
| Heiwa Real Estate Co. Ltd. | 563,600 | 15,146,060 | ||
| Japan Logistics Fund, Inc., REIT | 14,718 | 30,853,225 | ||
| Japan Metropolitan Fund Investment Corp., REIT | 29,516 | 19,840,302 | ||
| KATITAS Co. Ltd. | 2,556,700 | 40,855,888 | ||
| LEG Immobilien SE (a) | 199,471 | 14,405,346 | ||
| Mitsui Fudosan Co. Ltd. | 2,137,000 | 46,883,426 | ||
| National Storage, REIT | 25,718,846 | 38,661,700 | ||
| NNN REIT, Inc. | 1,249,306 | 49,210,163 | ||
| Nomura Real Estate Holdings | 699,200 | 17,627,173 | ||
| Parkway Real Estate LLC, REIT | 6,072,400 | 17,254,072 | ||
| Phillips Edison & Co., REIT | 1,315,158 | 44,531,250 | ||
| Prologis, Inc., REIT | 1,883,210 | 233,894,682 | ||
| Region RE Ltd., REIT | 455,204 | 637,091 | ||
| Rexford Industrial Realty, Inc., REIT | 746,752 | 39,928,829 | ||
| Rural Funds Group, REIT | 4,105,210 | 5,745,537 | ||
| SEGRO PLC, REIT | 4,679,971 | 43,717,380 | ||
| Shaftesbury Capital PLC, REIT | 33,757,236 | 50,290,046 | ||
| Shurgard Self Storage Ltd., REIT | 867,774 | 39,850,131 | ||
| Simon Property Group, Inc., REIT | 205,953 | 23,373,606 | ||
| Sino Land Co. Ltd. | 19,801,635 | 22,699,408 | ||
| Star Asia Investment Corp., REIT | 42,237 | 16,808,291 | ||
| Sun Communities, Inc., REIT | 469,235 | 57,443,749 | ||
| Swire Properties Ltd. | 8,701,800 | 18,197,290 | ||
| Unite Group PLC, REIT | 2,852,501 | 33,985,404 | ||
| Urban Edge Properties, REIT | 1,078,850 | 17,649,986 | ||
| Vonovia SE, REIT | 1,433,710 | 34,373,184 | ||
| $1,664,859,605 | ||||
| Telecommunications - Wireless – 3.3% | ||||
| Cellnex Telecom S.A. | 1,008,113 | $38,588,120 | ||
| SBA Communications Corp., REIT | 184,896 | 41,514,699 | ||
| $80,102,819 | ||||
| Telephone Services – 1.3% | ||||
| Helios Towers PLC (a) | 26,880,059 | $31,038,071 | ||
| Total Common Stocks (Identified Cost, $2,300,021,839) | $2,384,056,047 | |||
12
Portfolio of Investments –
continued
| Issuer | Shares/Par | Value ($) | ||
| Investment Companies (h) – 1.3% | ||||
| Money Market Funds – 1.3% | ||||
| MFS Institutional Money Market Portfolio, 5.3% (v) (Identified Cost, $32,590,020) | 32,589,917 | $32,593,176 | ||
| Other Assets, Less Liabilities – 0.5% | 10,964,186 | |||
| Net Assets – 100.0% | $2,427,613,409 | |||
| (a) | Non-income producing security. | |||
| (h) | An affiliated issuer, which may be considered one in which the fund owns 5% or more of the outstanding voting securities, or a company which is under common control. At period end, the aggregate values of the fund's investments in affiliated issuers and in unaffiliated issuers were $32,593,176 and $2,384,056,047, respectively. | |||
| (v) | Affiliated issuer that is available only to investment companies managed by MFS. The rate quoted for the MFS Institutional Money Market Portfolio is the annualized seven-day yield of the fund at period end. |
| The following abbreviations are used in this report and are defined: | |
| IEU | International Equity Unit |
| REIT | Real Estate Investment Trust |
See Notes to Financial Statements
13
Financial Statements
Statement of Assets and
Liabilities
At 8/31/23
This statement represents your
fund’s balance sheet, which details the assets and liabilities comprising the total value of the fund.
| Assets | |
| Investments in unaffiliated issuers, at value (identified cost, $2,300,021,839) | $2,384,056,047 |
| Investments in affiliated issuers, at value (identified cost, $32,590,020) | 32,593,176 |
| Foreign currency, at value (identified cost, $407,965) | 408,069 |
| Receivables for | |
| Investments sold | 8,911,437 |
| Fund shares sold | 1,293,910 |
| Dividends | 4,820,143 |
| Other assets | 2,381 |
| Total assets | $2,432,085,163 |
| Liabilities | |
| Payables for | |
| Investments purchased | $1,623,964 |
| Fund shares reacquired | 2,075,106 |
| Payable to affiliates | |
| Investment adviser | 106,597 |
| Administrative services fee | 1,966 |
| Shareholder servicing costs | 414,652 |
| Distribution and service fees | 1,653 |
| Payable for independent Trustees' compensation | 14 |
| Accrued expenses and other liabilities | 247,802 |
| Total liabilities | $4,471,754 |
| Net assets | $2,427,613,409 |
| Net assets consist of | |
| Paid-in capital | $2,484,196,840 |
| Total distributable earnings (loss) | (56,583,431) |
| Net assets | $2,427,613,409 |
| Shares of beneficial interest outstanding | 152,882,297 |
14
Statement of Assets and Liabilities – continued
| Net assets | Shares outstanding | Net asset value per share (a) | |
| Class A | $60,446,227 | 3,827,175 | $15.79 |
| Class B | 672,331 | 42,558 | 15.80 |
| Class C | 10,848,882 | 688,481 | 15.76 |
| Class I | 1,056,119,848 | 66,618,136 | 15.85 |
| Class R1 | 537,134 | 34,322 | 15.65 |
| Class R2 | 2,813,755 | 177,510 | 15.85 |
| Class R3 | 5,957,414 | 376,045 | 15.84 |
| Class R4 | 1,134,249 | 71,448 | 15.88 |
| Class R6 | 1,289,083,569 | 81,046,622 | 15.91 |
| (a) | Maximum offering price per share was equal to the net asset value per share for all share classes, except for Class A, for which the maximum offering price per share was $16.75 [100 / 94.25 x $15.79]. On sales of $50,000 or more, the maximum offering price of Class A shares is reduced. A contingent deferred sales charge may be imposed on redemptions of Class A, Class B, and Class C shares. Redemption price per share was equal to the net asset value per share for Classes I, R1, R2, R3, R4, and R6. |
See Notes to Financial Statements
15
Financial Statements
Statement of Operations
Year ended 8/31/23
This statement describes how much
your fund earned in investment income and accrued in expenses. It also describes any gains and/or losses generated by fund operations.
| Net investment income (loss) | |
| Income | |
| Dividends | $72,710,648 |
| Dividends from affiliated issuers | 2,214,561 |
| Other | 141,096 |
| Interest | 331 |
| Foreign taxes withheld | (2,438,011) |
| Total investment income | $72,628,625 |
| Expenses | |
| Management fee | $19,873,377 |
| Distribution and service fees | 327,175 |
| Shareholder servicing costs | 1,120,907 |
| Administrative services fee | 368,102 |
| Independent Trustees' compensation | 40,494 |
| Custodian fee | 248,187 |
| Shareholder communications | 80,306 |
| Audit and tax fees | 105,111 |
| Legal fees | 13,499 |
| Miscellaneous | 239,179 |
| Total expenses | $22,416,337 |
| Reduction of expenses by investment adviser and distributor | (318,233) |
| Net expenses | $22,098,104 |
| Net investment income (loss) | $50,530,521 |
| Realized and unrealized gain (loss) | |
| Realized gain (loss) (identified cost basis) | |
| Unaffiliated issuers | $(131,145,026) |
| Affiliated issuers | 16,607 |
| Foreign currency | (56,074) |
| Net realized gain (loss) | $(131,184,493) |
| Change in unrealized appreciation or depreciation | |
| Unaffiliated issuers | $(34,201,814) |
| Affiliated issuers | (1,671) |
| Translation of assets and liabilities in foreign currencies | (1,645) |
| Net unrealized gain (loss) | $(34,205,130) |
| Net realized and unrealized gain (loss) | $(165,389,623) |
| Change in net assets from operations | $(114,859,102) |
See Notes to Financial Statements
16
Financial Statements
Statements of Changes in Net
Assets
These statements describe the
increases and/or decreases in net assets resulting from operations, any distributions, and any shareholder transactions.
| Year ended | ||
| 8/31/23 | 8/31/22 | |
| Change in net assets | ||
| From operations | ||
| Net investment income (loss) | $50,530,521 | $38,439,317 |
| Net realized gain (loss) | (131,184,493) | 169,282,748 |
| Net unrealized gain (loss) | (34,205,130) | (756,952,956) |
| Change in net assets from operations | $(114,859,102) | $(549,230,891) |
| Total distributions to shareholders | $(138,502,792) | $(66,500,521) |
| Change in net assets from fund share transactions | $51,807,127 | $609,206,028 |
| Total change in net assets | $(201,554,767) | $(6,525,384) |
| Net assets | ||
| At beginning of period | 2,629,168,176 | 2,635,693,560 |
| At end of period | $2,427,613,409 | $2,629,168,176 |
See Notes to Financial Statements
17
Financial Statements
Financial Highlights
The financial highlights table is
intended to help you understand the fund's financial performance for the past 5 years. Certain information reflects financial results for a single fund share. The total returns in the table represent the rate that an
investor would have earned (or lost) on an investment in the fund share class (assuming reinvestment of all distributions) held for the entire period.
| Class A | Year ended | ||||
| 8/31/23 | 8/31/22 | 8/31/21 | 8/31/20 | 8/31/19 | |
| Net asset value, beginning of period | $17.49 | $21.62 | $16.38 | $17.68 | $16.19 |
| Income (loss) from investment operations | |||||
| Net investment income (loss) (d) | $0.28 | $0.21 | $0.23 | $0.31 | $0.34 |
| Net realized and unrealized gain (loss) | (1.10) | (3.92) | 5.15 | (0.64) | 1.56 |
| Total from investment operations | $(0.82) | $(3.71) | $5.38 | $(0.33) | $1.90 |
| Less distributions declared to shareholders | |||||
| From net investment income | $(0.04) | $(0.30) | $(0.14) | $(0.97) | $(0.33) |
| From net realized gain | (0.84) | (0.12) | — | — | (0.08) |
| Total distributions declared to shareholders | $(0.88) | $(0.42) | $(0.14) | $(0.97) | $(0.41) |
| Net asset value, end of period (x) | $15.79 | $17.49 | $21.62 | $16.38 | $17.68 |
| Total return (%) (r)(s)(t)(x) | (4.81) | (17.53) | 33.02 | (2.04) | 12.24 |
| Ratios (%) (to average net assets) and Supplemental data: | |||||
| Expenses before expense reductions | 1.20 | 1.18 | 1.19 | 1.22 | 1.26 |
| Expenses after expense reductions | 1.19 | 1.17 | 1.18 | 1.21 | 1.25 |
| Net investment income (loss) | 1.78 | 1.05 | 1.21 | 1.89 | 2.06 |
| Portfolio turnover | 30 | 29 | 22 | 39 | 55 |
| Net assets at end of period (000 omitted) | $60,446 | $77,694 | $112,559 | $75,185 | $79,083 |
See Notes to Financial Statements
18
Financial Highlights – continued
| Class B (y) | Year ended | ||||
| 8/31/23 | 8/31/22 | 8/31/21 | 8/31/20 | 8/31/19 | |
| Net asset value, beginning of period | $17.57 | $21.74 | $16.47 | $17.78 | $16.26 |
| Income (loss) from investment operations | |||||
| Net investment income (loss) (d) | $0.17 | $0.06 | $0.09 | $0.19 | $0.22 |
| Net realized and unrealized gain (loss) | (1.10) | (3.96) | 5.18 | (0.65) | 1.59 |
| Total from investment operations | $(0.93) | $(3.90) | $5.27 | $(0.46) | $1.81 |
| Less distributions declared to shareholders | |||||
| From net investment income | $— | $(0.15) | $(0.00)(w) | $(0.85) | $(0.21) |
| From net realized gain | (0.84) | (0.12) | — | — | (0.08) |
| Total distributions declared to shareholders | $(0.84) | $(0.27) | $(0.00)(w) | $(0.85) | $(0.29) |
| Net asset value, end of period (x) | $15.80 | $17.57 | $21.74 | $16.47 | $17.78 |
| Total return (%) (r)(s)(t)(x) | (5.44) | (18.19) | 32.02 | (2.79) | 11.46 |
| Ratios (%) (to average net assets) and Supplemental data: | |||||
| Expenses before expense reductions | 1.95 | 1.93 | 1.94 | 1.97 | 2.01 |
| Expenses after expense reductions | 1.94 | 1.92 | 1.93 | 1.96 | 2.00 |
| Net investment income (loss) | 1.04 | 0.32 | 0.48 | 1.15 | 1.33 |
| Portfolio turnover | 30 | 29 | 22 | 39 | 55 |
| Net assets at end of period (000 omitted) | $672 | $1,126 | $1,396 | $1,173 | $1,247 |
| Class C (y) | Year ended | ||||
| 8/31/23 | 8/31/22 | 8/31/21 | 8/31/20 | 8/31/19 | |
| Net asset value, beginning of period | $17.53 | $21.70 | $16.45 | $17.76 | $16.26 |
| Income (loss) from investment operations | |||||
| Net investment income (loss) (d) | $0.17 | $0.06 | $0.09 | $0.19 | $0.22 |
| Net realized and unrealized gain (loss) | (1.10) | (3.96) | 5.18 | (0.66) | 1.58 |
| Total from investment operations | $(0.93) | $(3.90) | $5.27 | $(0.47) | $1.80 |
| Less distributions declared to shareholders | |||||
| From net investment income | $— | $(0.15) | $(0.02) | $(0.84) | $(0.22) |
| From net realized gain | (0.84) | (0.12) | — | — | (0.08) |
| Total distributions declared to shareholders | $(0.84) | $(0.27) | $(0.02) | $(0.84) | $(0.30) |
| Net asset value, end of period (x) | $15.76 | $17.53 | $21.70 | $16.45 | $17.76 |
| Total return (%) (r)(s)(t)(x) | (5.45) | (18.19) | 32.09 | (2.81) | 11.44 |
| Ratios (%) (to average net assets) and Supplemental data: | |||||
| Expenses before expense reductions | 1.95 | 1.93 | 1.94 | 1.97 | 2.01 |
| Expenses after expense reductions | 1.94 | 1.92 | 1.93 | 1.95 | 2.00 |
| Net investment income (loss) | 1.03 | 0.32 | 0.47 | 1.15 | 1.33 |
| Portfolio turnover | 30 | 29 | 22 | 39 | 55 |
| Net assets at end of period (000 omitted) | $10,849 | $13,171 | $16,414 | $11,213 | $10,165 |
See Notes to Financial Statements
19
Financial Highlights – continued
| Class I | Year ended | ||||
| 8/31/23 | 8/31/22 | 8/31/21 | 8/31/20 | 8/31/19 | |
| Net asset value, beginning of period | $17.56 | $21.71 | $16.45 | $17.75 | $16.26 |
| Income (loss) from investment operations | |||||
| Net investment income (loss) (d) | $0.32 | $0.27 | $0.27 | $0.35 | $0.39 |
| Net realized and unrealized gain (loss) | (1.10) | (3.94) | 5.17 | (0.64) | 1.56 |
| Total from investment operations | $(0.78) | $(3.67) | $5.44 | $(0.29) | $1.95 |
| Less distributions declared to shareholders | |||||
| From net investment income | $(0.09) | $(0.36) | $(0.18) | $(1.01) | $(0.38) |
| From net realized gain | (0.84) | (0.12) | — | — | (0.08) |
| Total distributions declared to shareholders | $(0.93) | $(0.48) | $(0.18) | $(1.01) | $(0.46) |
| Net asset value, end of period (x) | $15.85 | $17.56 | $21.71 | $16.45 | $17.75 |
| Total return (%) (r)(s)(t)(x) | (4.57) | (17.32) | 33.31 | (1.80) | 12.52 |
| Ratios (%) (to average net assets) and Supplemental data: | |||||
| Expenses before expense reductions | 0.95 | 0.93 | 0.94 | 0.97 | 1.01 |
| Expenses after expense reductions | 0.94 | 0.92 | 0.93 | 0.96 | 1.00 |
| Net investment income (loss) | 2.03 | 1.32 | 1.47 | 2.14 | 2.40 |
| Portfolio turnover | 30 | 29 | 22 | 39 | 55 |
| Net assets at end of period (000 omitted) | $1,056,120 | $1,143,428 | $1,070,398 | $703,606 | $663,977 |
See Notes to Financial Statements
20
Financial Highlights – continued
| Class R1 (y) | Year ended | ||||
| 8/31/23 | 8/31/22 | 8/31/21 | 8/31/20 | 8/31/19 | |
| Net asset value, beginning of period | $17.42 | $21.51 | $16.32 | $17.65 | $16.26 |
| Income (loss) from investment operations | |||||
| Net investment income (loss) (d) | $0.16 | $0.06 | $0.09 | $0.19 | $0.23 |
| Net realized and unrealized gain (loss) | (1.09) | (3.92) | 5.13 | (0.65) | 1.55 |
| Total from investment operations | $(0.93) | $(3.86) | $5.22 | $(0.46) | $1.78 |
| Less distributions declared to shareholders | |||||
| From net investment income | $— | $(0.11) | $(0.03) | $(0.87) | $(0.31) |
| From net realized gain | (0.84) | (0.12) | — | — | (0.08) |
| Total distributions declared to shareholders | $(0.84) | $(0.23) | $(0.03) | $(0.87) | $(0.39) |
| Net asset value, end of period (x) | $15.65 | $17.42 | $21.51 | $16.32 | $17.65 |
| Total return (%) (r)(s)(t)(x) | (5.49) | (18.15) | 32.03 | (2.80) | 11.45 |
| Ratios (%) (to average net assets) and Supplemental data: | |||||
| Expenses before expense reductions | 1.95 | 1.94 | 1.95 | 1.97 | 2.01 |
| Expenses after expense reductions | 1.94 | 1.92 | 1.93 | 1.96 | 2.00 |
| Net investment income (loss) | 1.03 | 0.31 | 0.48 | 1.14 | 1.39 |
| Portfolio turnover | 30 | 29 | 22 | 39 | 55 |
| Net assets at end of period (000 omitted) | $537 | $501 | $485 | $411 | $333 |
| Class R2 (y) | Year ended | ||||
| 8/31/23 | 8/31/22 | 8/31/21 | 8/31/20 | 8/31/19 | |
| Net asset value, beginning of period | $17.55 | $21.71 | $16.45 | $17.76 | $16.26 |
| Income (loss) from investment operations | |||||
| Net investment income (loss) (d) | $0.24 | $0.17 | $0.18 | $0.27 | $0.30 |
| Net realized and unrealized gain (loss) | (1.10) | (3.96) | 5.18 | (0.65) | 1.58 |
| Total from investment operations | $(0.86) | $(3.79) | $5.36 | $(0.38) | $1.88 |
| Less distributions declared to shareholders | |||||
| From net investment income | $(0.00)(w) | $(0.25) | $(0.10) | $(0.93) | $(0.30) |
| From net realized gain | (0.84) | (0.12) | — | — | (0.08) |
| Total distributions declared to shareholders | $(0.84) | $(0.37) | $(0.10) | $(0.93) | $(0.38) |
| Net asset value, end of period (x) | $15.85 | $17.55 | $21.71 | $16.45 | $17.76 |
| Total return (%) (r)(s)(t)(x) | (5.03) | (17.76) | 32.71 | (2.32) | 12.00 |
| Ratios (%) (to average net assets) and Supplemental data: | |||||
| Expenses before expense reductions | 1.45 | 1.43 | 1.44 | 1.47 | 1.51 |
| Expenses after expense reductions | 1.44 | 1.42 | 1.43 | 1.46 | 1.50 |
| Net investment income (loss) | 1.53 | 0.82 | 0.97 | 1.67 | 1.82 |
| Portfolio turnover | 30 | 29 | 22 | 39 | 55 |
| Net assets at end of period (000 omitted) | $2,814 | $2,818 | $3,504 | $2,270 | $2,190 |
See Notes to Financial Statements
21
Financial Highlights – continued
| Class R3 (y) | Year ended | ||||
| 8/31/23 | 8/31/22 | 8/31/21 | 8/31/20 | 8/31/19 | |
| Net asset value, beginning of period | $17.55 | $21.70 | $16.44 | $17.76 | $16.26 |
| Income (loss) from investment operations | |||||
| Net investment income (loss) (d) | $0.28 | $0.21 | $0.23 | $0.31 | $0.34 |
| Net realized and unrealized gain (loss) | (1.10) | (3.94) | 5.17 | (0.65) | 1.57 |
| Total from investment operations | $(0.82) | $(3.73) | $5.40 | $(0.34) | $1.91 |
| Less distributions declared to shareholders | |||||
| From net investment income | $(0.05) | $(0.30) | $(0.14) | $(0.98) | $(0.33) |
| From net realized gain | (0.84) | (0.12) | — | — | (0.08) |
| Total distributions declared to shareholders | $(0.89) | $(0.42) | $(0.14) | $(0.98) | $(0.41) |
| Net asset value, end of period (x) | $15.84 | $17.55 | $21.70 | $16.44 | $17.76 |
| Total return (%) (r)(s)(t)(x) | (4.80) | (17.53) | 33.04 | (2.09) | 12.22 |
| Ratios (%) (to average net assets) and Supplemental data: | |||||
| Expenses before expense reductions | 1.20 | 1.18 | 1.20 | 1.22 | 1.26 |
| Expenses after expense reductions | 1.19 | 1.17 | 1.18 | 1.21 | 1.25 |
| Net investment income (loss) | 1.77 | 1.05 | 1.22 | 1.90 | 2.05 |
| Portfolio turnover | 30 | 29 | 22 | 39 | 55 |
| Net assets at end of period (000 omitted) | $5,957 | $6,865 | $6,082 | $4,255 | $3,768 |
| Class R4 (y) | Year ended | ||||
| 8/31/23 | 8/31/22 | 8/31/21 | 8/31/20 | 8/31/19 | |
| Net asset value, beginning of period | $17.56 | $21.72 | $16.45 | $17.75 | $16.26 |
| Income (loss) from investment operations | |||||
| Net investment income (loss) (d) | $0.33 | $0.28 | $0.27 | $0.35 | $0.38 |
| Net realized and unrealized gain (loss) | (1.10) | (3.97) | 5.18 | (0.64) | 1.56 |
| Total from investment operations | $(0.77) | $(3.69) | $5.45 | $(0.29) | $1.94 |
| Less distributions declared to shareholders | |||||
| From net investment income | $(0.07) | $(0.35) | $(0.18) | $(1.01) | $(0.37) |
| From net realized gain | (0.84) | (0.12) | — | — | (0.08) |
| Total distributions declared to shareholders | $(0.91) | $(0.47) | $(0.18) | $(1.01) | $(0.45) |
| Net asset value, end of period (x) | $15.88 | $17.56 | $21.72 | $16.45 | $17.75 |
| Total return (%) (r)(s)(t)(x) | (4.47) | (17.36) | 33.37 | (1.79) | 12.46 |
| Ratios (%) (to average net assets) and Supplemental data: | |||||
| Expenses before expense reductions | 0.95 | 0.92 | 0.95 | 0.97 | 1.01 |
| Expenses after expense reductions | 0.94 | 0.91 | 0.93 | 0.96 | 1.00 |
| Net investment income (loss) | 2.04 | 1.32 | 1.47 | 2.13 | 2.30 |
| Portfolio turnover | 30 | 29 | 22 | 39 | 55 |
| Net assets at end of period (000 omitted) | $1,134 | $1,242 | $5,680 | $3,649 | $3,893 |
See Notes to Financial Statements
22
Financial Highlights – continued
| Class R6 | Year ended | ||||
| 8/31/23 | 8/31/22 | 8/31/21 | 8/31/20 | 8/31/19 | |
| Net asset value, beginning of period | $17.61 | $21.78 | $16.49 | $17.80 | $16.29 |
| Income (loss) from investment operations | |||||
| Net investment income (loss) (d) | $0.34 | $0.28 | $0.29 | $0.37 | $0.40 |
| Net realized and unrealized gain (loss) | (1.09) | (3.96) | 5.19 | (0.65) | 1.58 |
| Total from investment operations | $(0.75) | $(3.68) | $5.48 | $(0.28) | $1.98 |
| Less distributions declared to shareholders | |||||
| From net investment income | $(0.11) | $(0.37) | $(0.19) | $(1.03) | $(0.39) |
| From net realized gain | (0.84) | (0.12) | — | — | (0.08) |
| Total distributions declared to shareholders | $(0.95) | $(0.49) | $(0.19) | $(1.03) | $(0.47) |
| Net asset value, end of period (x) | $15.91 | $17.61 | $21.78 | $16.49 | $17.80 |
| Total return (%) (r)(s)(t)(x) | (4.39) | (17.31) | 33.49 | (1.76) | 12.68 |
| Ratios (%) (to average net assets) and Supplemental data: | |||||
| Expenses before expense reductions | 0.86 | 0.84 | 0.87 | 0.89 | 0.93 |
| Expenses after expense reductions | 0.85 | 0.82 | 0.85 | 0.88 | 0.92 |
| Net investment income (loss) | 2.12 | 1.41 | 1.55 | 2.23 | 2.40 |
| Portfolio turnover | 30 | 29 | 22 | 39 | 55 |
| Net assets at end of period (000 omitted) | $1,289,084 | $1,382,324 | $1,419,175 | $1,068,677 | $918,174 |
| (d) | Per share data is based on average shares outstanding. |
| (r) | Certain expenses have been reduced without which performance would have been lower. |
| (s) | From time to time the fund may receive proceeds from litigation settlements, without which performance would be lower. |
| (t) | Total returns do not include any applicable sales charges. |
| (w) | Per share amount was less than $0.01. |
| (x) | The net asset values and total returns have been calculated on net assets which include adjustments made in accordance with U.S. generally accepted accounting principles required at period end for financial reporting purposes. |
| (y) | Per share amounts have been restated on a retroactive basis to reflect a reverse stock split completed at the ratios noted below after the close of business on November 2, 2018. Class B 1 : 0.5437 Class C 1 : 0.5399 Class R1 1 : 0.5487 Class R2 1 : 0.5473 Class R3 1 : 0.5493 Class R4 1 : 0.5504 |
See Notes to Financial Statements
23
Notes to Financial Statements
(1) Business and
Organization
MFS Global Real Estate Fund (the
fund) is a diversified series of MFS Series Trust XIII (the trust). The trust is organized as a Massachusetts business trust and is registered under the Investment Company Act of 1940, as amended, as an open-end
management investment company.
The fund is an investment company
and accordingly follows the investment company accounting and reporting guidance of the Financial Accounting Standards Board (FASB) Accounting Standards Codification Topic 946 Financial Services - Investment
Companies.
(2) Significant Accounting
Policies
General — The preparation of financial statements in conformity with U.S. generally accepted accounting principles requires management to make estimates and assumptions that affect the
reported amounts of assets and liabilities, and disclosure of contingent assets and liabilities at the date of the financial statements and the reported amounts of increases and decreases in net assets from operations
during the reporting period. Actual results could differ from those estimates. In the preparation of these financial statements, management has evaluated subsequent events occurring after the date of the fund’s
Statement of Assets and Liabilities through the date that the financial statements were issued. The fund invests a significant amount of its net assets in U.S. and foreign real estate related investments and as a result is subject to certain risks associated with the direct ownership
of real estate and the real estate industry in general. These include risks related to general, regional and local economic conditions; difficulties in valuing and disposing of real estate; fluctuations in interest
rates and property tax rates, shifts in zoning laws, environmental regulations and other governmental action; cash flow dependency; increased operating expenses; lack of availability of mortgage funds; losses due to
natural disasters; overbuilding; losses due to casualty or condemnation; changes in property values and rental rates; the management skill and creditworthiness of the manager; and other factors. The fund invests in foreign securities. Investments in foreign securities are vulnerable to the effects of changes in the relative values of the local currency and the U.S. dollar and to
the effects of changes in each country’s market, economic, industrial, political, regulatory, geopolitical, environmental, public health, and other conditions.
Balance Sheet Offsetting — The fund's accounting policy with respect to balance sheet offsetting is that, absent an event of default by the counterparty or a termination of the agreement, the International
Swaps and Derivatives Association (ISDA) Master Agreement, or similar agreement, does not result in an offset of reported amounts of financial assets and financial liabilities in the Statement of Assets and
Liabilities across transactions between the fund and the applicable counterparty. The fund's right to setoff may be restricted or prohibited by the bankruptcy or insolvency laws of the particular jurisdiction to which
a specific master netting agreement counterparty is subject. Balance sheet offsetting disclosures, to the extent applicable to the fund, have been included in the fund’s Significant Accounting Policies note
under the captions for each of the fund’s in-scope financial instruments and transactions.
Investment Valuations — Subject to its oversight, the fund's Board of Trustees has delegated primary responsibility for determining or causing to be determined the value of the fund’s investments to MFS as
the fund's adviser, pursuant to the fund’s valuation policy and procedures which have been adopted by the adviser and approved by the
24
Notes to Financial Statements -
continued
Board. In accordance with Rule 2a-5 under the
Investment Company Act of 1940, the Board of Trustees designated the adviser as the “valuation designee” of the fund. If the adviser, as valuation designee, determines that reliable market quotations are
not readily available for an investment, the investment is valued at fair value as determined in good faith by the adviser in accordance with the adviser’s fair valuation policy and procedures.
Under the fund's valuation policy
and procedures, equity securities, including restricted equity securities, are generally valued at the last sale or official closing price on their primary market or exchange as provided by a third-party pricing
service. Equity securities, for which there were no sales reported that day, are generally valued at the last quoted daily bid quotation on their primary market or exchange as provided by a third-party pricing
service. Short-term instruments with a maturity at issuance of 60 days or less may be valued at amortized cost, which approximates market value.
Open-end investment companies are generally valued
at net asset value per share. The values of foreign securities and other assets and liabilities expressed in foreign currencies are converted to U.S. dollars using the mean of bid and asked prices for rates provided
by a third-party pricing service.
Under the fund’s valuation
policy and procedures, market quotations are not considered to be readily available for debt instruments, floating rate loans, and many types of derivatives. These investments are generally valued at fair value based
on information from third-party pricing services or otherwise determined by the adviser in accordance with the adviser’s fair valuation policy and procedures. Securities and other assets generally valued on the
basis of information from a third-party pricing service may also be valued at a broker/dealer bid quotation. In determining values, third-party pricing services can utilize both transaction data and market information
such as yield, quality, coupon rate, maturity, type of issue, trading characteristics, spreads and other market data. An investment may also be valued at fair value if the adviser determines that the
investment’s value has been materially affected by events occurring after the close of the exchange or market on which the investment is principally traded (such as foreign exchange or market) and prior to the
determination of the fund’s net asset value, or after the halt of trading of a specific security where trading does not resume prior to the close of the exchange or market on which the security is principally
traded. Events that occur after foreign markets close (such as developments in foreign markets and significant movements in the U.S. markets) and prior to the determination of the fund’s net asset value may be
deemed to have a material effect on the value of securities traded in foreign markets. Accordingly, the fund’s foreign equity securities may often be valued at fair value. The adviser generally relies on
third-party pricing services or other information (such as the correlation with price movements of similar securities in the same or other markets; the type, cost and investment characteristics of the security; the
business and financial condition of the issuer; and trading and other market data) to assist in determining whether to fair value and at what value to fair value an investment. The value of an investment for purposes
of calculating the fund’s net asset value can differ depending on the source and method used to determine value. When fair valuation is used, the value of an investment used to determine the fund’s net
asset value may differ from quoted or published prices for the same investment. There can be no assurance that the fund could obtain the fair value assigned to an investment if it were to sell the investment at the
same time at which the fund determines its net asset value per share.
25
Notes to Financial Statements -
continued
Various inputs are used in
determining the value of the fund's assets or liabilities. These inputs are categorized into three broad levels. In certain cases, the inputs used to measure fair value may fall into different levels of the fair value
hierarchy. In such cases, an investment's level within the fair value hierarchy is based on the lowest level of input that is significant to the fair value measurement. The fund's assessment of the significance of a
particular input to the fair value measurement in its entirety requires judgment, and considers factors specific to the investment. Level 1 includes unadjusted quoted prices in active markets for identical assets or
liabilities. Level 2 includes other significant observable market-based inputs (including quoted prices for similar securities, interest rates, prepayment speed, and credit risk). Level 3 includes significant
unobservable inputs, which may include the adviser's own assumptions in determining the fair value of investments. The following is a summary of the levels used as of August 31, 2023 in valuing the fund's assets and
liabilities:
| Financial Instruments | Level 1 | Level 2 | Level 3 | Total |
| Equity Securities | $2,384,056,047 | $— | $— | $2,384,056,047 |
| Mutual Funds | 32,593,176 | — | — | 32,593,176 |
| Total | $2,416,649,223 | $— | $— | $2,416,649,223 |
For further information regarding
security characteristics, see the Portfolio of Investments.
Foreign Currency Translation — Purchases and sales of foreign investments, income, and expenses are converted into U.S. dollars based upon currency exchange rates prevailing on the respective dates of such
transactions or on the reporting date for foreign denominated receivables and payables. Gains and losses attributable to foreign currency exchange rates on sales of securities are recorded for financial statement
purposes as net realized gains and losses on investments. Gains and losses attributable to foreign exchange rate movements on receivables, payables, income and expenses are recorded for financial statement purposes as
foreign currency transaction gains and losses. That portion of both realized and unrealized gains and losses on investments that results from fluctuations in foreign currency exchange rates is not separately
disclosed.
Indemnifications — Under the fund's organizational documents, its officers and Trustees may be indemnified against certain liabilities and expenses arising out of the performance of their duties to
the fund. Additionally, in the normal course of business, the fund enters into agreements with service providers that may contain indemnification clauses. The fund's maximum exposure under these agreements is unknown
as this would involve future claims that may be made against the fund that have not yet occurred.
Investment Transactions and
Income — Interest income is recorded on the accrual basis. Dividends received in cash are recorded on the ex-dividend date. Certain dividends from foreign securities will be recorded when the fund is informed of the dividend if such information is
obtained subsequent to the ex-dividend date. Dividend and interest payments received in additional securities are recorded on the ex-dividend or ex-interest date in an amount equal to the value of the security on such
date.
Distributions from REITs may be characterized as
ordinary income, net capital gain, or a return of capital to the fund. The proper characterization of REIT distributions is
26
Notes to Financial Statements -
continued
generally not known until after the end of each
calendar year. As such, estimates are used in reporting the character of income and distributions for financial statement purposes. The fund receives substantial distributions from holdings in REITs.
The fund may receive proceeds from
litigation settlements. Any proceeds received from litigation involving portfolio holdings are reflected in the Statement of Operations in realized gain/loss if the security has been disposed of by the fund or in
unrealized gain/loss if the security is still held by the fund. Any other proceeds from litigation not related to portfolio holdings are reflected as other income in the Statement of Operations.
Investment transactions are recorded
on the trade date. In determining the net gain or loss on securities sold, the cost of securities is determined on the identified cost basis.
Tax Matters and Distributions — The fund intends to qualify as a regulated investment company, as defined under Subchapter M of the Internal Revenue Code, and to distribute all of its taxable income, including
realized capital gains. As a result, no provision for federal income tax is required. The fund’s federal tax returns, when filed, will remain subject to examination by the Internal Revenue Service for a three
year period. Management has analyzed the fund’s tax positions taken on federal and state tax returns for all open tax years and does not believe that there are any uncertain tax positions that require
recognition of a tax liability. Foreign taxes, if any, have been accrued by the fund in the accompanying financial statements in accordance with the applicable foreign tax law. Foreign income taxes may be withheld by
certain countries in which the fund invests. Additionally, capital gains realized by the fund on securities issued in or by certain foreign countries may be subject to capital gains tax imposed by those
countries.
Distributions to shareholders are
recorded on the ex-dividend date. Income and capital gain distributions are determined in accordance with income tax regulations, which may differ from U.S. generally accepted accounting principles. Certain capital
accounts in the financial statements are periodically adjusted for permanent differences in order to reflect their tax character. These adjustments have no impact on net assets or net asset value per share. Temporary
differences which arise from recognizing certain items of income, expense, gain or loss in different periods for financial statement and tax purposes will reverse at some time in the future.
Book/tax differences primarily
relate to passive foreign investment companies and wash sale loss deferrals.
The tax character of distributions
declared to shareholders for the last two fiscal years is as follows:
| Year ended 8/31/23 | Year ended 8/31/22 | |
| Ordinary income (including any short-term capital gains) | $14,500,887 | $50,000,023 |
| Long-term capital gains | 124,001,905 | 16,500,498 |
| Total distributions | $138,502,792 | $66,500,521 |
27
Notes to Financial Statements -
continued
The federal tax cost and the tax
basis components of distributable earnings were as follows:
| As of 8/31/23 | |
| Cost of investments | $2,364,680,828 |
| Gross appreciation | 295,612,778 |
| Gross depreciation | (243,644,383) |
| Net unrealized appreciation (depreciation) | $51,968,395 |
| Undistributed ordinary income | 32,342,832 |
| Post-October capital loss deferral | (140,830,777) |
| Other temporary differences | (63,881) |
| Total distributable earnings (loss) | $(56,583,431) |
Multiple Classes of Shares of
Beneficial Interest — The fund offers multiple classes of shares, which differ in their respective distribution and service fees. The fund's income, realized and unrealized gain (loss), and common
expenses are allocated to shareholders based on the daily net assets of each class. Dividends are declared separately for each class. Differences in per share dividend rates are generally due to differences in
separate class expenses. Class B and Class C shares will convert to Class A shares approximately eight years after purchase. The fund’s distributions declared to shareholders as reported in the Statements of
Changes in Net Assets are presented by class as follows:
| Year ended 8/31/23 | Year ended 8/31/22 | ||
| Class A | $3,610,022 | $1,768,149 | |
| Class B | 50,081 | 17,117 | |
| Class C | 614,058 | 205,778 | |
| Class I | 57,962,597 | 30,224,650 | |
| Class R1 | 23,952 | 4,427 | |
| Class R2 | 139,097 | 58,854 | |
| Class R3 | 345,654 | 126,788 | |
| Class R4 | 65,342 | 128,149 | |
| Class R6 | 75,691,989 | 33,966,609 | |
| Total | $138,502,792 | $66,500,521 |
(3) Transactions with
Affiliates
Investment Adviser — The fund has an investment advisory agreement with MFS to provide overall investment management and related administrative services and facilities to the fund. The management fee is computed daily and paid monthly at the following annual rates based on the fund's average daily net assets:
| Up to $1 billion | 0.90% |
| In excess of $1 billion and up to $2.5 billion | 0.75% |
| In excess of $2.5 billion | 0.65% |
MFS has agreed in writing to reduce
its management fee by a specified amount if certain MFS mutual fund assets exceed thresholds agreed to by MFS and the fund's Board of Trustees. MFS has also agreed in writing to waive at least 0.01% of its
28
Notes to Financial Statements -
continued
management fee as part of this agreement. The
agreement to waive at least 0.01% of the management fee will continue until modified by the fund's Board of Trustees, but such agreement will continue at least until December 31, 2023. For the year ended August 31,
2023, this management fee reduction amounted to $318,232, which is included in the reduction of total expenses in the Statement of Operations. The management fee incurred for the year ended August 31, 2023 was
equivalent to an annual effective rate of 0.80% of the fund's average daily net assets.
The investment adviser has agreed in
writing to pay a portion of the fund’s total annual operating expenses, excluding interest, taxes, extraordinary expenses, brokerage and transaction costs, certain tax reclaim recovery expenses (including
contingency fees and closing agreement expenses), and investment-related expenses, such that total fund operating expenses do not exceed the following rates annually of each class’s average daily net assets:
| Classes | ||||||||
| A | B | C | I | R1 | R2 | R3 | R4 | R6 |
| 1.35% | 2.10% | 2.10% | 1.10% | 2.10% | 1.60% | 1.35% | 1.10% | 1.04% |
This written agreement will continue
until modified by the fund’s Board of Trustees, but such agreement will continue at least until December 31, 2024. For the year ended August 31, 2023, the fund’s actual operating expenses did not exceed
the limit and therefore, the investment adviser did not pay any portion of the fund’s expenses related to this agreement.
Distributor — MFS Fund Distributors, Inc. (MFD), a wholly-owned subsidiary of MFS, as distributor, received $10,711 for the year ended August 31, 2023, as its portion of the initial sales charge
on sales of Class A shares of the fund.
The Board of Trustees has adopted a
distribution plan for certain share classes pursuant to Rule 12b-1 of the Investment Company Act of 1940.
The fund's distribution plan
provides that the fund will pay MFD for services provided by MFD and financial intermediaries in connection with the distribution and servicing of certain share classes. One component of the plan is a
distribution fee paid to MFD and another component of the plan is a service fee paid to MFD. MFD may subsequently pay all, or a portion, of the distribution and/or service fees to financial intermediaries. The
distribution and service fees are computed daily and paid monthly.
29
Notes to Financial Statements -
continued
Distribution Plan Fee Table:
| Distribution Fee Rate (d) | Service Fee Rate (d) | Total Distribution Plan (d) | Annual Effective Rate (e) | Distribution and Service Fee | |
| Class A | — | 0.25% | 0.25% | 0.25% | $ 165,261 |
| Class B | 0.75% | 0.25% | 1.00% | 1.00% | 8,825 |
| Class C | 0.75% | 0.25% | 1.00% | 1.00% | 118,547 |
| Class R1 | 0.75% | 0.25% | 1.00% | 1.00% | 4,998 |
| Class R2 | 0.25% | 0.25% | 0.50% | 0.50% | 13,934 |
| Class R3 | — | 0.25% | 0.25% | 0.25% | 15,610 |
| Total Distribution and Service Fees | $327,175 |
| (d) | In accordance with the distribution plan for certain classes, the fund pays distribution and/or service fees equal to these annual percentage rates of each class’s average daily net assets. The distribution and service fee rates disclosed by class represent the current rates in effect at the end of the reporting period. Any rate changes, if applicable, are detailed below. |
| (e) | The annual effective rates represent actual fees incurred under the distribution plan for the year ended August 31, 2023 based on each class's average daily net assets. MFD has voluntarily agreed to rebate a portion of each class's 0.25% service fee attributable to accounts for which there is no financial intermediary specified on the account except for accounts attributable to MFS or its affiliates' seed money. For the year ended August 31, 2023, this rebate amounted to $1 for Class A shares and is included in the reduction of total expenses in the Statement of Operations. |
Certain Class A shares are
subject to a contingent deferred sales charge (CDSC) in the event of a shareholder redemption within 18 months of purchase. Class B shares are subject to a CDSC in the event of a shareholder redemption within six
years of purchase. Class C shares are subject to a CDSC in the event of a shareholder redemption within 12 months of purchase. All contingent deferred sales charges are paid to MFD and during the year ended
August 31, 2023, were as follows:
| Amount | |
| Class A | $7,237 |
| Class B | 224 |
| Class C | 473 |
Shareholder Servicing Agent — MFS Service Center, Inc. (MFSC), a wholly-owned subsidiary of MFS, receives a fee from the fund for its services as shareholder servicing agent calculated as a percentage of the
average daily net assets of the fund as determined periodically under the supervision of the fund's Board of Trustees. For the year ended August 31, 2023, the fee was $35,221, which equated to 0.0014% annually of the
fund's average daily net assets. MFSC also receives reimbursement from the fund for out-of-pocket expenses, sub-accounting and other shareholder servicing costs which may be paid to affiliated and unaffiliated service
providers. Class R6 shares do not incur sub-accounting fees. For the year ended August 31, 2023, these out-of-pocket expenses, sub-accounting and other shareholder servicing costs amounted to $1,085,686.
Administrator — MFS provides certain financial, legal, shareholder communications, compliance, and other administrative services to the fund. Under an administrative services agreement, the
fund reimburses MFS the costs incurred to provide these
30
Notes to Financial Statements -
continued
services. The fund is charged an annual fixed
amount of $17,500 plus a fee based on average daily net assets. The administrative services fee is computed daily and paid monthly. The administrative services fee incurred for the year ended August 31, 2023
was equivalent to an annual effective rate of 0.0150% of the fund's average daily net assets.
Trustees’ and Officers’
Compensation — The fund pays compensation to independent Trustees in the form of a retainer, attendance fees, and additional compensation to Board and Committee chairpersons.
Independent Trustees’ compensation is accrued daily and paid subsequent to each Trustee Board meeting. The fund does not pay compensation directly to Trustees or officers of the fund who are also officers
of the investment adviser, all of whom receive remuneration from MFS for their services to the fund. Certain officers and Trustees of the fund are officers or directors of MFS, MFD, and MFSC.
Other — The fund invests in the MFS Institutional Money Market Portfolio which is managed by MFS and seeks current income consistent with preservation of capital and liquidity. This money
market fund does not pay a management fee to MFS but does incur investment and operating costs.
The adviser has voluntarily
undertaken to reimburse the fund from its own resources on a quarterly basis for the cost of investment research embedded in the cost of the fund’s securities trades. This agreement may be rescinded at any time.
For the year ended August 31, 2023, this reimbursement amounted to $140,368, which is included in “Other” income in the Statement of Operations.
(4) Portfolio Securities
For the year ended August 31, 2023,
purchases and sales of investments, other than short-term obligations, aggregated $710,873,944 and $726,590,977, respectively.
(5) Shares of Beneficial
Interest
The fund's Declaration of Trust
permits the Trustees to issue an unlimited number of full and fractional shares of beneficial interest. Transactions in fund shares were as follows:
| Year ended 8/31/23 | Year ended 8/31/22 | ||||
| Shares | Amount | Shares | Amount | ||
| Shares sold | |||||
| Class A | 564,723 | $8,974,409 | 1,658,755 | $34,094,678 | |
| Class B | 630 | 9,981 | 7,671 | 162,435 | |
| Class C | 78,098 | 1,244,482 | 89,992 | 1,799,139 | |
| Class I | 17,943,726 | 283,923,826 | 31,890,513 | 669,812,347 | |
| Class R1 | 5,385 | 85,073 | 10,509 | 199,518 | |
| Class R2 | 54,018 | 849,655 | 43,779 | 895,501 | |
| Class R3 | 107,257 | 1,700,467 | 207,687 | 4,000,372 | |
| Class R4 | 18,003 | 290,567 | 131,468 | 2,814,096 | |
| Class R6 | 15,509,890 | 246,353,977 | 21,283,551 | 439,851,620 | |
| 34,281,730 | $543,432,437 | 55,323,925 | $1,153,629,706 | ||
31
Notes to Financial Statements -
continued
| Year ended 8/31/23 | Year ended 8/31/22 | ||||
| Shares | Amount | Shares | Amount | ||
| Shares issued to shareholders in reinvestment of distributions | |||||
| Class A | 223,581 | $3,601,891 | 82,635 | $1,762,602 | |
| Class B | 3,091 | 50,081 | 794 | 17,117 | |
| Class C | 37,991 | 613,933 | 9,472 | 203,643 | |
| Class I | 3,451,144 | 55,701,471 | 1,370,461 | 29,300,452 | |
| Class R1 | 1,492 | 23,952 | 207 | 4,427 | |
| Class R2 | 8,591 | 139,097 | 2,730 | 58,561 | |
| Class R3 | 21,389 | 345,654 | 5,922 | 126,788 | |
| Class R4 | 4,043 | 65,342 | 5,991 | 128,149 | |
| Class R6 | 3,711,958 | 60,059,484 | 1,125,035 | 24,120,743 | |
| 7,463,280 | $120,600,905 | 2,603,247 | $55,722,482 | ||
| Shares reacquired | |||||
| Class A | (1,404,542) | $(22,358,816) | (2,503,953) | $(52,071,608) | |
| Class B | (25,237) | (404,219) | (8,618) | (172,907) | |
| Class C | (178,870) | (2,838,215) | (104,695) | (2,067,180) | |
| Class I | (19,908,075) | (317,365,437) | (17,425,159) | (353,779,924) | |
| Class R1 | (1,311) | (21,031) | (4,498) | (95,027) | |
| Class R2 | (45,671) | (720,744) | (47,365) | (961,400) | |
| Class R3 | (143,846) | (2,314,127) | (102,585) | (2,027,801) | |
| Class R4 | (21,323) | (336,930) | (328,278) | (6,870,408) | |
| Class R6 | (16,651,299) | (265,866,696) | (9,100,375) | (182,099,905) | |
| (38,380,174) | $(612,226,215) | (29,625,526) | $(600,146,160) | ||
| Net change | |||||
| Class A | (616,238) | $(9,782,516) | (762,563) | $(16,214,328) | |
| Class B | (21,516) | (344,157) | (153) | 6,645 | |
| Class C | (62,781) | (979,800) | (5,231) | (64,398) | |
| Class I | 1,486,795 | 22,259,860 | 15,835,815 | 345,332,875 | |
| Class R1 | 5,566 | 87,994 | 6,218 | 108,918 | |
| Class R2 | 16,938 | 268,008 | (856) | (7,338) | |
| Class R3 | (15,200) | (268,006) | 111,024 | 2,099,359 | |
| Class R4 | 723 | 18,979 | (190,819) | (3,928,163) | |
| Class R6 | 2,570,549 | 40,546,765 | 13,308,211 | 281,872,458 | |
| 3,364,836 | $51,807,127 | 28,301,646 | $609,206,028 | ||
The fund is one of several mutual
funds in which certain MFS funds may invest. The MFS funds do not invest in the underlying funds for the purpose of exercising management or control. At the end of the period, the MFS Growth Allocation Fund, the MFS
Moderate Allocation Fund, the MFS Aggressive Growth Allocation Fund, the MFS Conservative Allocation Fund, and MFS Lifetime 2040 Fund, were the owners of
32
Notes to Financial Statements -
continued
record of approximately 10%, 8%, 5%, 3%, and 1%,
respectively, of the value of outstanding voting shares of the fund. In addition, the MFS Lifetime Income Fund, the MFS Lifetime 2065 Fund, the MFS Lifetime 2060 Fund, the MFS Lifetime 2055 Fund, the MFS Lifetime 2050
Fund, the MFS Lifetime 2045 Fund, the MFS Lifetime 2035 Fund, the MFS Lifetime 2030 Fund, and the MFS Lifetime 2025 Fund were each the owners of record of less than 1% of the value of outstanding voting shares of
the
fund.
fund.
Effective June 1, 2019, purchases of
the fund’s Class B shares were closed to new and existing investors subject to certain exceptions. On March 30, 2023, the fund announced that effective after the close of business on September 29, 2023,
purchases of Class R1 and Class R2 shares will be closed to new eligible investors.
(6) Line of Credit
The fund and certain other funds
managed by MFS participate in a $1.45 billion unsecured committed line of credit of which $1.2 billion is reserved for use by the fund and certain other MFS U.S. funds. The line of credit is provided by a syndicate of
banks under a credit agreement. Borrowings may be made for temporary financing needs. Interest is charged to each fund, based on its borrowings, generally at a rate equal to the highest of 1) Daily Simple SOFR
(Secured Overnight Financing Rate) plus 0.10%, 2) the Federal Funds Effective Rate, or 3) the Overnight Bank Funding Rate, each plus an agreed upon spread. A commitment fee, based on the average daily unused portion
of the committed line of credit, is allocated among the participating funds. The line of credit expires on March 14, 2024 unless extended or renewed. In addition, the fund and other funds managed by MFS have
established unsecured uncommitted borrowing arrangements with certain banks for temporary financing needs. Interest is charged to each fund, based on its borrowings, at rates equal to customary reference rates plus an
agreed upon spread. For the year ended August 31, 2023, the fund’s commitment fee and interest expense were $13,254 and $0, respectively, and are included in “Miscellaneous” expense in the Statement
of Operations.
(7) Investments in Affiliated
Issuers
An affiliated issuer may be
considered one in which the fund owns 5% or more of the outstanding voting securities, or a company which is under common control. For the purposes of this report, the following were affiliated issuers:
| Affiliated Issuers | Beginning Value | Purchases | Sales Proceeds | Realized Gain (Loss) | Change in Unrealized Appreciation or Depreciation | Ending Value |
| MFS Institutional Money Market Portfolio | $51,572,424 | $448,395,295 | $467,389,479 | $16,607 | $(1,671) | $32,593,176 |
| Affiliated Issuers | Dividend Income | Capital Gain Distributions |
| MFS Institutional Money Market Portfolio | $2,214,561 | $— |
33
Report of Independent Registered Public
Accounting Firm
To the Shareholders of MFS Global
Real Estate Fund and the Board of Trustees of MFS Series Trust XIII
Opinion on the Financial Statements
We have audited the accompanying
statement of assets and liabilities of MFS Global Real Estate Fund (the “Fund”) (one of the funds constituting MFS Series Trust XIII (the “Trust”)), including the portfolio of investments, as
of August 31, 2023, and the related statement of operations for the year then ended, the statements of changes in net assets for each of the two years in the period then ended, the financial highlights for each of the
five years in the period then ended and the related notes (collectively referred to as the “financial statements”). In our opinion, the financial statements present fairly, in all material respects, the
financial position of the Fund (one of the funds constituting MFS Series Trust XIII) at August 31, 2023, the results of its operations for the year then ended, the changes in its net assets for each of the two years
in the period then ended and its financial highlights for each of the five years in the period then ended, in conformity with U.S. generally accepted accounting principles.
Basis for Opinion
These financial statements are the
responsibility of the Trust’s management. Our responsibility is to express an opinion on the Fund’s financial statements based on our audits. We are a public accounting firm registered with the Public
Company Accounting Oversight Board (United States) (“PCAOB”) and are required to be independent with respect to the Trust in accordance with the U.S. federal securities laws and the applicable rules and
regulations of the Securities and Exchange Commission and the PCAOB.
We conducted our audits in
accordance with the standards of the PCAOB. Those standards require that we plan and perform the audit to obtain reasonable assurance about whether the financial statements are free of material misstatement, whether
due to error or fraud. The Trust is not required to have, nor were we engaged to perform, an audit of the Trust’s internal control over financial reporting. As part of our audits, we are required to obtain an
understanding of internal control over financial reporting but not for the purpose of expressing an opinion on the effectiveness of the Trust’s internal control over financial reporting. Accordingly, we express
no such opinion.
34
Report of Independent Registered Public
Accounting Firm – continued
Our audits included performing
procedures to assess the risks of material misstatement of the financial statements, whether due to error or fraud, and performing procedures that respond to those risks. Such procedures included examining, on a test
basis, evidence regarding the amounts and disclosures in the financial statements. Our procedures included confirmation of securities owned as of August 31, 2023, by correspondence with the custodian, brokers and
others; when replies were not received from brokers and others, we performed other auditing procedures. Our audits also included evaluating the accounting principles used and significant estimates made by management,
as well as evaluating the overall presentation of the financial statements. We believe that our audits provide a reasonable basis for our opinion.

We have served as the auditor of one
or more MFS investment companies since 1993.
Boston, Massachusetts
October 16, 2023
October 16, 2023
35
Trustees and
Officers — Identification and Background
The Trustees and Officers of the
Trust, as of October 1, 2023, are listed below, together with their principal occupations during the past five years. (Their titles may have varied during that period.) The address of each Trustee and Officer is
111 Huntington Avenue, Boston, Massachusetts 02199-7618.
| Name, Age | Position(s) Held with Fund | Trustee/Officer Since(h) | Number of MFS Funds overseen by the Trustee | Principal Occupations During the Past Five Years | Other Directorships During the Past Five Years (j) | |||||
| INTERESTED TRUSTEE | ||||||||||
| Michael W. Roberge (k) (age 57) | Trustee | January 2021 | 136 | Massachusetts Financial Services Company, Chairman (since January 2021); Chief Executive Officer (since January 2017); Director; Chairman of the Board (since January 2022); President (until December 2018); Chief Investment Officer (until December 2018) | N/A | |||||
| INDEPENDENT TRUSTEES | ||||||||||
| John P. Kavanaugh (age 68) | Trustee and Chair of Trustees | January 2009 | 136 | Private investor | N/A | |||||
| Steven E. Buller (age 72) | Trustee | February 2014 | 136 | Private investor | N/A | |||||
| John A. Caroselli (age 69) | Trustee | March 2017 | 136 | Private investor; JC Global Advisors, LLC (management consulting), President (since 2015) | N/A | |||||
| Maureen R. Goldfarb (age 68) | Trustee | January 2009 | 136 | Private investor | N/A | |||||
| Peter D. Jones (age 68) | Trustee | January 2019 | 136 | Private investor | N/A | |||||
| James W. Kilman, Jr. (age 62) | Trustee | January 2019 | 136 | Burford Capital Limited (finance and investment management), Senior Advisor (since May 3, 2021), Chief Financial Officer (2019 - May 2, 2021); KielStrand Capital LLC (family office), Chief Executive Officer (since 2016) | Alpha-En Corporation, Director (2016-2019) |
36
Trustees and Officers - continued
| Name, Age | Position(s) Held with Fund | Trustee/Officer Since(h) | Number of MFS Funds overseen by the Trustee | Principal Occupations During the Past Five Years | Other Directorships During the Past Five Years (j) | |||||
| Clarence Otis, Jr. (age 67) | Trustee | March 2017 | 136 | Private investor | VF Corporation, Director; Verizon Communications, Inc., Director; The Travelers Companies, Director | |||||
| Maryanne L. Roepke (age 67) | Trustee | May 2014 | 136 | Private investor | N/A | |||||
| Laurie J. Thomsen (age 66) | Trustee | March 2005 | 136 | Private investor | The Travelers Companies, Director; Dycom Industries, Inc., Director |
| Name, Age | Position(s) Held with Fund | Trustee/Officer Since(h) | Number of MFS Funds for which the Person is an Officer | Principal Occupations During the Past Five Years | ||||
| OFFICERS | ||||||||
| Christopher R. Bohane (k) (age 49) | Assistant Secretary and Assistant Clerk | July 2005 | 136 | Massachusetts Financial Services Company, Senior Vice President and Senior Managing Counsel | ||||
| Kino Clark (k) (age 55) | Assistant Treasurer | January 2012 | 136 | Massachusetts Financial Services Company, Vice President | ||||
| John W. Clark, Jr. (k) (age 56) | Assistant Treasurer | April 2017 | 136 | Massachusetts Financial Services Company, Vice President | ||||
| David L. DiLorenzo (k) (age 55) | President | July 2005 | 136 | Massachusetts Financial Services Company, Senior Vice President | ||||
| Heidi W. Hardin (k) (age 56) | Secretary and Clerk | April 2017 | 136 | Massachusetts Financial Services Company, Executive Vice President and General Counsel | ||||
| Brian E. Langenfeld (k) (age 50) | Assistant Secretary and Assistant Clerk | June 2006 | 136 | Massachusetts Financial Services Company, Vice President and Managing Counsel |
37
Trustees and Officers - continued
| Name, Age | Position(s) Held with Fund | Trustee/Officer Since(h) | Number of MFS Funds for which the Person is an Officer | Principal Occupations During the Past Five Years | ||||
| Rosa E. Licea-Mailloux (k) (age 47) | Chief Compliance Officer | March 2022 | 136 | Massachusetts Financial Services Company, Vice President (since 2018); Director of Corporate Compliance (2018-2021), Senior Director Compliance (2021-2022), Senior Managing Director of North American Compliance & Chief Compliance Officer (since March 2022); Natixis Investment Managers (investment management), Funds Chief Compliance Officer, Deputy General Counsel & Senior Vice President (until 2018) | ||||
| Amanda S. Mooradian (k) (age 44) | Assistant Secretary and Assistant Clerk | September 2018 | 136 | Massachusetts Financial Services Company, Assistant Vice President and Senior Counsel | ||||
| Susan A. Pereira (k) (age 52) | Assistant Secretary and Assistant Clerk | July 2005 | 136 | Massachusetts Financial Services Company, Vice President and Managing Counsel | ||||
| Kasey L. Phillips (k) (age 52) | Assistant Treasurer | September 2012 | 136 | Massachusetts Financial Services Company, Vice President | ||||
| Matthew A. Stowe (k) (age 48) | Assistant Secretary and Assistant Clerk | October 2014 | 136 | Massachusetts Financial Services Company, Vice President and Senior Managing Counsel | ||||
| William B. Wilson (k) (age 41) | Assistant Secretary and Assistant Clerk | October 2022 | 136 | Massachusetts Financial Services Company, Assistant Vice President and Senior Counsel | ||||
| James O. Yost (k) (age 63) | Treasurer | September 1990 | 136 | Massachusetts Financial Services Company, Senior Vice President |
| (h) | Date first appointed to serve as Trustee/Officer of an MFS Fund. Each Trustee has served continuously since appointment unless indicated otherwise. From January 2012 through December 2016, Messrs. DiLorenzo and Yost served as Treasurer and Deputy Treasurer of the Funds, respectively. |
| (j) | Directorships or trusteeships of companies required to report to the Securities and Exchange Commission (i.e., “public companies”). |
| (k) | “Interested person” of the Trust within the meaning of the Investment Company Act of 1940 (referred to as the 1940 Act), which is the principal federal law governing investment companies like the fund, as a result of a position with MFS. The address of MFS is 111 Huntington Avenue, Boston, Massachusetts 02199-7618. |
38
Trustees and Officers - continued
Each Trustee (other than Messrs.
Jones, Kilman and Roberge) has been elected by shareholders and each Trustee and Officer holds office until his or her successor is chosen and qualified or until his or her earlier death, resignation, retirement or
removal. Mr. Roberge became a Trustee of the Funds on January 1, 2021 and Messrs. Jones and Kilman became Trustees of the Funds on January 1, 2019. The Trust does not hold annual meetings for the purpose of electing
Trustees, and Trustees are not elected for fixed terms. Under the terms of the Board's retirement policy, an Independent Trustee shall retire at the end of the calendar year in which he or she reaches the earlier of
75 years of age or 15 years of service on the Board (or, in the case of any Independent Trustee who joined the Board prior to 2015, 20 years of service on the Board).
Messrs. Buller, Kilman and Otis and
Ms. Roepke are members of the Trust’s Audit Committee.
Each of the Interested Trustees and
certain Officers hold comparable officer positions with certain affiliates of MFS.
The Statement of Additional
Information for a Fund includes further information about the Trustees and is available without charge upon request by calling 1-800-225-2606.
| Investment Adviser | Custodian |
| Massachusetts Financial Services Company 111 Huntington Avenue Boston, MA 02199-7618 | State Street Bank and Trust Company 1 Congress Street, Suite 1 Boston, MA 02114-2016 |
| Distributor | Independent Registered Public Accounting Firm |
| MFS Fund Distributors, Inc. 111 Huntington Avenue Boston, MA 02199-7618 | Ernst & Young LLP 200 Clarendon Street Boston, MA 02116 |
| Portfolio Manager(s) | |
| Rick Gable Mark Syn |
39
Board Review of Investment Advisory
Agreement
MFS Global Real Estate Fund
The Investment Company Act of 1940
requires that both the full Board of Trustees and a majority of the non-interested (“independent”) Trustees, voting separately, annually approve the continuation of the Fund’s investment advisory
agreement with MFS. The Trustees consider matters bearing on the Fund and its advisory arrangements at their meetings throughout the year, including a review of performance data at each regular meeting. In
addition, the independent Trustees met several times over the course of three months beginning in May and ending in July, 2023 (“contract review meetings”) for the specific purpose of considering whether
to approve the continuation of the investment advisory agreement for the Fund and the other investment companies that the Board oversees (the “MFS Funds”). The independent Trustees were assisted in
their evaluation of the Fund’s investment advisory agreement by independent legal counsel, from whom they received separate legal advice and with whom they met separately from MFS during various contract review
meetings. The independent Trustees were also assisted in this process by an independent consultant who was retained by and reported to the independent Trustees.
In connection with their
deliberations regarding the continuation of the investment advisory agreement, the Trustees, including the independent Trustees, considered such information and factors as they believed, in light of the legal advice
furnished to them and their own business judgment, to be relevant. The investment advisory agreement for the Fund was considered separately, although the Trustees also took into account the common interests of
all MFS Funds in their review. As described below, the Trustees considered the nature, quality, and extent of the various investment advisory, administrative, and shareholder services performed by MFS under the
existing investment advisory agreement and other arrangements with the Fund.
In connection with their contract
review meetings, the Trustees received and relied upon materials that included, among other items: (i) information provided by Broadridge Financial Solutions, Inc. (“Broadridge”), an independent third
party, on the investment performance of the Fund for various time periods ended December 31, 2022 and the investment performance of a group of funds with substantially similar investment classifications/objectives
(the “Broadridge performance universe”), (ii) information provided by Broadridge on the Fund’s advisory fees and other expenses and the advisory fees and other expenses of comparable funds identified
by Broadridge as well as all other funds in the same investment classification/category (the “Broadridge expense group and universe”), (iii) information provided by MFS on the advisory fees of portfolios
of other clients of MFS, including institutional separate accounts and other clients, (iv) information as to whether and to what extent applicable expense waivers, reimbursements or fee “breakpoints” are
observed for the Fund, (v) information regarding MFS’ financial results and financial condition, including MFS’ and certain of its affiliates’ estimated profitability from services performed for the
Fund and the MFS Funds as a whole, and compared to MFS’ institutional business, (vi) MFS’ views regarding the outlook for the mutual fund industry and the strategic business plans of MFS, (vii)
descriptions of various functions performed by MFS for the Funds, such as compliance monitoring and portfolio trading practices, and (viii) information regarding the overall organization of MFS, including information
about
40
Board Review of Investment Advisory
Agreement - continued
MFS’ senior management and other personnel
providing investment advisory, administrative and other services to the Fund and the other MFS Funds. The comparative performance, fee and expense information prepared and provided by Broadridge was not
independently verified and the independent Trustees did not independently verify any information provided to them by MFS.
The Trustees’ conclusion as to
the continuation of the investment advisory agreement was based on a comprehensive consideration of all information provided to the Trustees and not the result of any single factor. Some of the factors that
figured particularly in the Trustees’ deliberations are described below, although individual Trustees may have evaluated the information presented differently from one another, giving different weights to
various factors. It is also important to recognize that the fee arrangements for the Fund and other MFS Funds are the result of years of review and discussion between the independent Trustees and MFS, that
certain aspects of such arrangements may receive greater scrutiny in some years than in others, and that the Trustees’ conclusions may be based, in part, on their consideration of these same arrangements during
the course of the year and in prior years.
Based on information provided by
Broadridge and MFS, the Trustees reviewed the Fund’s total return investment performance as well as the Broadridge performance universe over various time periods. The Trustees placed particular emphasis on
the total return performance of the Fund’s Class I shares in comparison to the performance of funds in its Broadridge performance universe over the five-year period ended December 31, 2022, which the Trustees
believed was a long enough period to reflect differing market conditions. The total return performance of the Fund’s Class I shares was in the 1st quintile relative to the other funds in the universe for
this five-year period (the 1st quintile being the best performers and the 5th quintile being the worst performers). The total return performance of the Fund’s Class I shares was in the 5th quintile for the
one-year period and the 1st quintile for the three-year period ended December 31, 2022 relative to the Broadridge performance universe. Because of the passage of time, these performance results may differ from
the performance results for more recent periods, including those shown elsewhere in this report.
In the course of their
deliberations, the Trustees took into account information provided by MFS in connection with the contract review meetings, as well as during investment review meetings conducted with portfolio management personnel
during the course of the year regarding the Fund’s performance. After reviewing these and related factors, the Trustees concluded, within the context of their overall conclusions regarding the investment
advisory agreement, that they were satisfied with MFS’ responses and efforts relating to investment performance.
In assessing the reasonableness of
the Fund’s advisory fee, the Trustees considered, among other information, the Fund’s advisory fee and the total expense ratio of the Fund’s Class I shares as a percentage of average daily net assets
and the advisory fee and total expense ratios of the Broadridge expense group based on information provided by Broadridge. The Trustees considered that MFS currently observes an expense limitation for the Fund,
which may not be changed without the Trustees’ approval. The Trustees also considered that, according to the data provided by
41
Board Review of Investment Advisory
Agreement - continued
Broadridge (which takes into account any fee
reductions or expense limitations that were in effect during the Fund’s last fiscal year), the Fund’s effective advisory fee rate and total expense ratio were each approximately at the Broadridge expense
group median.
The Trustees also considered the
advisory fees charged by MFS to any institutional separate accounts advised by MFS (“separate accounts”) and unaffiliated investment companies for which MFS serves as subadviser (“subadvised
funds”) that have comparable investment strategies to the Fund, if any. In comparing these fees, the Trustees considered information provided by MFS as to the generally broader scope of services provided
by MFS to the Fund, as well as the more extensive regulatory burdens imposed on MFS in managing the Fund, in comparison to separate accounts and subadvised funds. The Trustees also considered the higher demands
placed on MFS’ investment personnel and trading infrastructure as a result of the daily cash in-flows and out-flows of the Fund in comparison to separate accounts.
The Trustees also considered whether
the Fund may benefit from any economies of scale in the management of the Fund in the event of growth in assets of the Fund and/or growth in assets of the MFS Funds as a whole. They noted that the Fund’s
advisory fee rate schedule is subject to contractual breakpoints that reduce the Fund’s advisory fee rate on average daily net assets over $1 billion and $2.5 billion. The Trustees also noted that MFS has
agreed in writing to waive a portion of the management fees of certain MFS Funds, including the Fund, if the total combined assets of certain funds within the MFS Funds’ complex increase above agreed upon
thresholds (the “group fee waiver”), enabling the Fund’s shareholders to share in the benefits from any economies of scale at the complex level. The group fee waiver is reviewed and renewed
annually between the Board and MFS. The Trustees concluded that the breakpoints and the group fee waiver were sufficient to allow the Fund to benefit from economies of scale as its assets and overall complex
assets grow.
The Trustees also considered
information prepared by MFS relating to MFS’ costs and profits with respect to the Fund, the MFS Funds considered as a group, and other investment companies and accounts advised by MFS, as well as MFS’
methodologies used to determine and allocate its costs to the MFS Funds, the Fund and other accounts and products for purposes of estimating profitability.
After reviewing these and other
factors described herein, the Trustees concluded, within the context of their overall conclusions regarding the investment advisory agreement, that the advisory fees charged to the Fund represent reasonable
compensation in light of the services being provided by MFS to the Fund.
In addition, the Trustees considered
MFS’ resources and related efforts to continue to retain, attract and motivate capable personnel to serve the Fund. The Trustees also considered current and developing conditions in the financial services
industry, including the presence of large and well-capitalized companies which are spending, and appear to be prepared to continue to spend, substantial sums to engage personnel and to provide services to competing
investment companies. In this regard, the Trustees also considered the financial resources of MFS and its ultimate parent, Sun Life Financial Inc. The Trustees also considered the advantages and possible
disadvantages to the Fund of having an adviser that also serves other investment companies as well as other accounts.
42
Board Review of Investment Advisory
Agreement - continued
The Trustees also considered the
nature, quality, cost, and extent of administrative, transfer agency, and distribution services provided to the Fund by MFS and its affiliates under agreements and plans other than the investment advisory agreement,
including any 12b-1 fees the Fund pays to MFS Fund Distributors, Inc., an affiliate of MFS. The Trustees also considered the nature, extent and quality of certain other services MFS performs or arranges for on
the Fund’s behalf, which may include securities lending programs, directed expense payment programs, class action recovery programs, and MFS’ interaction with third-party service providers, principally
custodians and sub-custodians. The Trustees concluded that the various non-advisory services provided by MFS and its affiliates on behalf of the Fund were satisfactory.
The Trustees considered so-called
“fall-out benefits” to MFS such as reputational value derived from serving as investment manager to the MFS Funds. The Trustees also considered that MFS discontinued its historic practice of
obtaining investment research from portfolio brokerage commissions paid by certain MFS Funds effective January 2018, and directly pays or voluntarily reimburses a Fund, if applicable, for the costs of external
research acquired through the use of the Fund’s portfolio brokerage commissions.
Based on their evaluation of factors
that they deemed to be material, including those factors described above, the Board of Trustees, including the independent Trustees, concluded that the Fund’s investment advisory agreement with MFS should be
continued for an additional one-year period, commencing August 1, 2023.
43
Statement Regarding Liquidity Risk Management
Program
The fund has adopted and
implemented a liquidity risk management program (the “Program”) as required by Rule 22e-4 under the Investment Company Act of 1940, as amended. The fund’s Board of Trustees (the “Board”)
has designated MFS as the administrator of the Program. The Program is reasonably designed to assess and manage the liquidity risk of the fund. Liquidity risk is the risk that the fund could not meet requests to
redeem shares issued by the fund without significant dilution of remaining investors' interests.
MFS provided a written report to the
Board for consideration at its March 2023 meeting that addressed the operation of the Program and provided an assessment of the adequacy and effectiveness of the Program during the period from January 1, 2022 to
December 31, 2022 (the “Covered Period”). The report concluded that during the Covered Period the Program had operated effectively in all material respects and had adequately and effectively been
implemented to assess and manage the fund’s liquidity risk. MFS also reported that there were no liquidity events that impacted the fund or its ability to timely meet redemptions without dilution to existing
shareholders during the Covered Period.
There can be no assurance that the
Program will achieve its objectives in the future. Further information on liquidity risk, and other principal risks to which an investment in the fund may be subject, can be found in the prospectus.
44
Proxy Voting Policies and
Information
MFS votes proxies on behalf of the
fund pursuant to proxy voting policies and procedures that are available without charge, upon request, by calling 1-800-225-2606, by visiting mfs.com/proxyvoting, or by visiting the SEC’s Web site at http://www.sec.gov.
Information regarding how the fund
voted proxies relating to portfolio securities during the most recent twelve-month period ended June 30 is available by August 31 of each year without charge by visiting mfs.com/proxyvoting, or by visiting the SEC’s Web site at http://www.sec.gov.
Quarterly Portfolio
Disclosure
The fund files a complete schedule
of portfolio holdings with the SEC for the first and third quarters of each fiscal year as an exhibit to its reports on Form N-PORT. The fund's Form N-PORT reports are available on the SEC's Web site at http://www.sec.gov. A shareholder can obtain the portfolio holdings report for the first and third quarters of the fund's fiscal year at mfs.com/openendfunds by choosing the fund's name and then scrolling to the “Resources” section and clicking on the “Prospectus and Reports” tab.
Further Information
From time to time, MFS may post
important information about the fund or the MFS Funds on the MFS Web site (mfs.com). This information is available at https://www.mfs.com/announcements or at mfs.com/openendfunds by choosing the fund’s name and then scrolling to the “Resources” section and clicking on the “Announcements” tab, if any.
Information About Fund
Contracts and Legal Claims
The fund has entered into
contractual arrangements with an investment adviser, administrator, distributor, shareholder servicing agent, and custodian who each provide services to the fund. Unless expressly stated otherwise, shareholders are
not parties to, or intended beneficiaries of these contractual arrangements, and these contractual arrangements are not intended to create any shareholder right to enforce them against the service providers or to seek
any remedy under them against the service providers, either directly or on behalf of the fund.
Under the Trust’s By-Laws and
Declaration of Trust, any claims asserted against or on behalf of the MFS Funds, including claims against Trustees and Officers, must be brought in state and federal courts located within the Commonwealth of
Massachusetts.
Federal Tax Information
(unaudited)
The fund will notify shareholders of
amounts for use in preparing 2023 income tax forms in January 2024. The following information is provided pursuant to provisions of the Internal Revenue Code.
The fund designates the maximum
amount allowable as qualified dividend income eligible to be taxed at the same rate as long-term capital gain.
The fund designates $137,086,000 as
capital gain dividends paid during the fiscal year.
The fund designates the maximum
amount allowable as Section 199A dividends as defined in Proposed Treasury Regulation §1.199A-3(d).
45
rev. 3/16
| FACTS | WHAT DOES MFS DO WITH YOUR PERSONAL INFORMATION? |
| Why? | Financial companies choose how they share your personal information. Federal law gives consumers the right to limit some but not all sharing. Federal law also requires us to tell you how we collect, share, and protect your personal information. Please read this notice carefully to understand what we do. |
| What? | The types of personal information we collect and share depend on the product or service you have with us. This information can include: |
| • Social Security number and account balances | |
| • Account transactions and transaction history | |
| • Checking account information and wire transfer instructions | |
| When you are no longer our customer, we continue to share your information as described in this notice. |
| How? | All financial companies need to share customers' personal information to run their everyday business. In the section below, we list the reasons financial companies can share their customers' personal information; the reasons MFS chooses to share; and whether you can limit this sharing. |
| Reasons we can share your personal information | Does MFS share? | Can you limit this sharing? |
| For our everyday business purposes – such as to process your transactions, maintain your account(s), respond to court orders and legal investigations, or report to credit bureaus | Yes | No |
| For our marketing purposes – to offer our products and services to you | No | We don't share |
| For joint marketing with other financial companies | No | We don't share |
| For our affiliates' everyday business purposes – information about your transactions and experiences | No | We don't share |
| For our affiliates' everyday business purposes – information about your creditworthiness | No | We don't share |
| For nonaffiliates to market to you | No | We don't share |
| Questions? | Call 800-225-2606 or go to mfs.com. |

46
Page 2
| Who we are | |
| Who is providing this notice? | MFS Funds, MFS Investment Management, MFS Institutional Advisors, Inc., and MFS Heritage Trust Company. |
| What we do | |
| How does MFS protect my personal information? | To protect your personal information from unauthorized access and use, we use security measures that comply with federal law. These measures include procedural, electronic, and physical safeguards for the protection of the personal information we collect about you. |
| How does MFS collect my personal information? | We collect your personal information, for example, when you |
| • open an account or provide account information | |
| • direct us to buy securities or direct us to sell your securities | |
| • make a wire transfer | |
| We also collect your personal information from others, such as credit bureaus, affiliates, or other companies. | |
| Why can't I limit all sharing? | Federal law gives you the right to limit only |
| • sharing for affiliates' everyday business purposes – information about your creditworthiness | |
| • affiliates from using your information to market to you | |
| • sharing for nonaffiliates to market to you | |
| State laws and individual companies may give you additional rights to limit sharing. | |
| Definitions | |
| Affiliates | Companies related by common ownership or control. They can be financial and nonfinancial companies. |
| • MFS does not share personal information with affiliates, except for everyday business purposes as described on page one of this notice. | |
| Nonaffiliates | Companies not related by common ownership or control. They can be financial and nonfinancial companies. |
| • MFS does not share with nonaffiliates so they can market to you. | |
| Joint marketing | A formal agreement between nonaffiliated financial companies that together market financial products or services to you. |
| • MFS doesn't jointly market. | |
| Other important information |
| If you own an MFS product or receive an MFS service in the name of a third party such as a bank or broker-dealer, their privacy policy may apply to you instead of ours. |
47
