| Novo Nordisk Annual Report 2021 | 2 | |||||||
| Novo Nordisk Annual Report 2021 | 2 | |||||||
| Management review | |||||
| Introducing Novo Nordisk | |||||
| Letter from the Chair | 4 | ||||
| Letter from the CEO | 5 | ||||
| Novo Nordisk at a glance | 6 | ||||
| Our business model: how we create value for society | 7 | ||||
| Performance highlights | 8 | ||||
| Strategic Aspirations | |||||
| Purpose and sustainability (ESG) | 11 | ||||
| Innovation and therapeutic focus | 24 | ||||
| Commercial execution | 30 | ||||
| Financials | 33 | ||||
| Key risks | |||||
| Risk management | 41 | ||||
| Management | |||||
| Board of Directors | 44 | ||||
| Executive Management | 47 | ||||

| Consolidated statements and additional information | |||||
| Consolidated financial statements | |||||
| Income statement | 50 | ||||
| Cash flow statement | 51 | ||||
| Balance sheet | 52 | ||||
| Equity statement | 53x | ||||
| Notes to the consolidated financial statements | 54 | ||||
| Consolidated ESG statement | |||||
| Consolidated statement of ESG performance | 85 | ||||
| Notes to the consolidated ESG statement | 86 | ||||
| Statements and Auditor's Reports | |||||
| Statement by the Board of Directors and the Executive Management | 92 | ||||
| Independent Auditor's Reports on the Financial Statement | 93 | ||||
| Independent Assurance Report on the ESG statement | 95 | ||||
| Additional information | |||||
| More information | 96 | ||||
| Financial calendar | 97 | ||||
| Product overview | 97 | ||||
| Novo Nordisk Annual Report 2021 | 3 | |||||||

| Novo Nordisk Annual Report 2021 | 4 | |||||||

| Novo Nordisk Annual Report 2021 | 5 | |||||||

| Novo Nordisk Annual Report 2021 | 6 | |||||||
| Novo Nordisk at a glance | Our corporate strategy | |||||||||||||
| Novo Nordisk is a global healthcare company, headquartered in Denmark. Our key contribution is to discover and develop innovative biological medicines and make them accessible to patients throughout the world. We aim to lead in all disease areas in which we are active. | Our corporate strategy has four distinct focus areas in which we operate. It is built on our purpose, the Novo Nordisk Way and our ambition to be a sustainable business. | We aim to strengthen our leadership and treatment options in Diabetes and Obesity care, secure leading positions within Biopharm and establish a strong presence in other serious chronic diseases such as NASH, cardiovascular disease and Alzheimer’s disease. Succeeding in this will drive sustainable growth for Novo Nordisk. | ||||||||||||
| 140,800 | 168 | 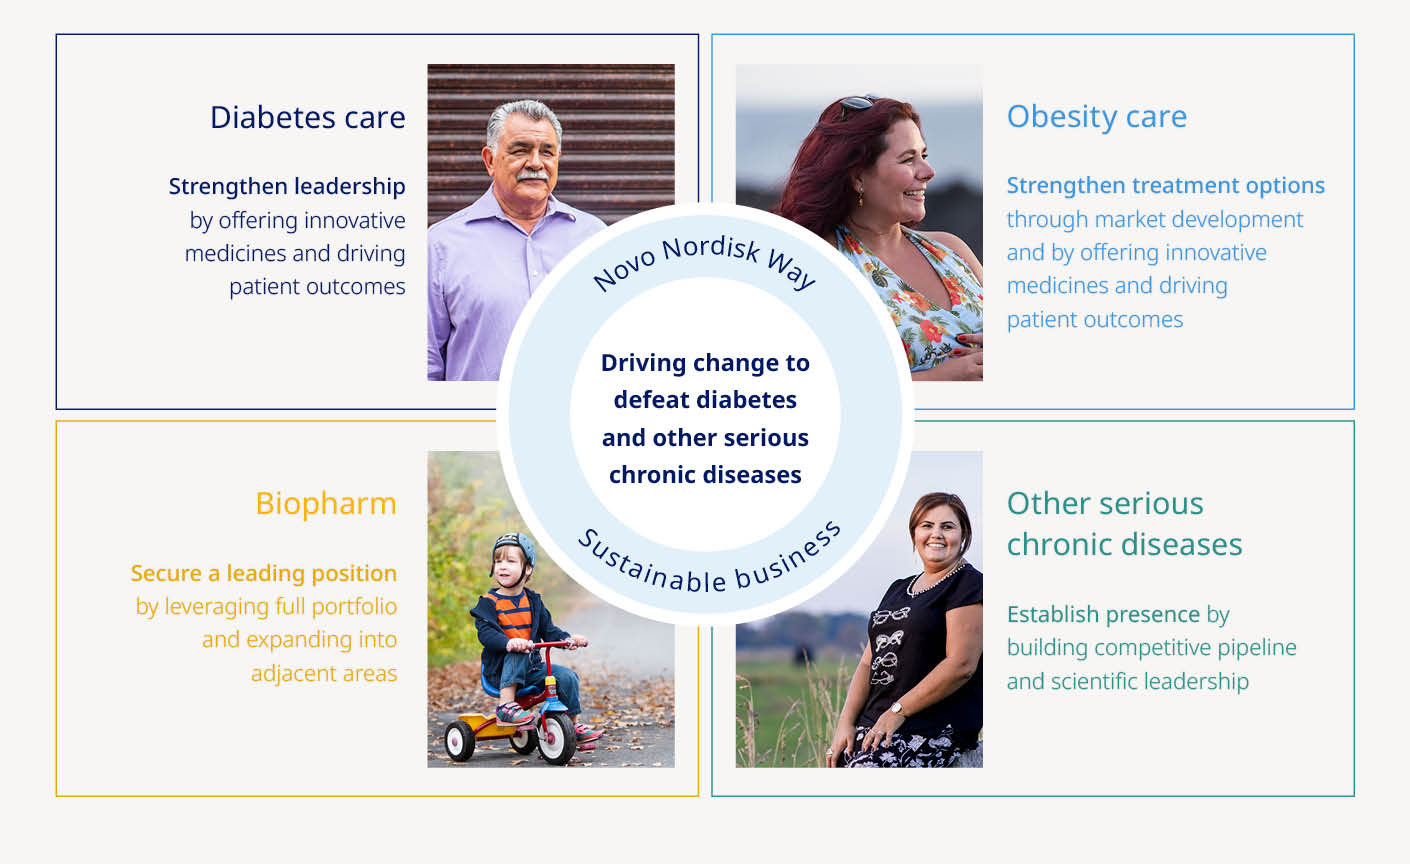 | ||||||||||||
| DKK million in net sales | countries with marketed products | |||||||||||||
| 58,644 | 80 | |||||||||||||
| DKK million in operating profit | countries with affiliates | |||||||||||||
| 29,319 | 5 | |||||||||||||
| DKK million in free cash flow | countries with R&D facilities | |||||||||||||
| employees worldwide | ||||||||||||||
| Novo Nordisk Annual Report 2021 | 7 | |||||||

| Novo Nordisk Annual Report 2021 | 8 | |||||||
 | 2021 Highlights | Strategic Aspirations 2025 | |||||||||||||||||||||
| Purpose and sustainability (ESG) | |||||||||||||||||||||||
Adding value to society: – Medical treatment provided to 34.6 million people living with diabetes 2021 – 46 new vulnerability assessments conducted enabling access to insulin to around 82,000 people living with diabetes – Reaching 18 countries and around 32,000 children in Changing Diabetes® in Children | Progress towards zero environmental impact: – 43% reduction in CO2 emissions compared to 2019 Evolve culture and ensure distinct core capabilities: – Launch of an aspirational gender diversity target | – Being respected for adding value to society – Progress towards zero environmental impact – Ensure distinct core capabilities and evolve culture | |||||||||||||||||||||
| Innovation and therapeutic focus | |||||||||||||||||||||||
Further raise innovation bar for diabetes treatment: – Approval of Xulthophy® and Ozempic® in China for the treatment of type 2 diabetes – Resubmission of semaglutide 2.0 mg in the US and approval in the EU in January 2022 – Phase 31 trial completed withh a glucose-sensitive insulin Develop superior treatment solutions for obisity: – Approval of Wigovy®, semaglutide 2.4 mg, in the US and approval in the EU in January 2022 – Phase 3adevelopment initiated with 50 mg oral semaglutide in obesity | Strengthen and progress Biopharm pipeline: – Sogroya® phase 3 programme in children with growth hormone deficiency successfully completed – First Mim8 phase 1/2 trial cohorts successfully completed Establish presence in other serious chronic diseases: – Phase 3a development initiated with ziltivekimab in cardiovascular disease and semaglutide in NASH and Alzheimer's disease Acquisition of Dicerna Pharmaceuticals and its RNAi platform to be applied across therapy areas | – Further raise the innovation bar for diabetes treatment – Develop a leading portfolio of superior treatment solutions for obesity – Strengthen and progress the Biopharm pipeline – Establish presence in other serious chronic diseases focusing on cardiovascular disease (CVD), NASH and chronic kidney disease (CKD) | |||||||||||||||||||||
| Commercial execution | |||||||||||||||||||||||
Strengthen diabetes leadership to more than one-third: – Diabetes value market share increased by 0.8 percentage point to 30.1% (MAT) | Strengthen obesity leadership and double sales: – Obesity care sales increased by 55% (CER) to DKK 8.4 billion Secure a sustained growth outlook for Biopharm: – Biopharm sales increased by 4% (CER) to DKK 19.2 billion | – Strengthen diabetes leadership – aim at global value market share of more than 1/3 – Strengthen obesity leadership and double 2019 reported sales – Secure a sustained growth outlook for Biopharm | |||||||||||||||||||||
| Financials | |||||||||||||||||||||||
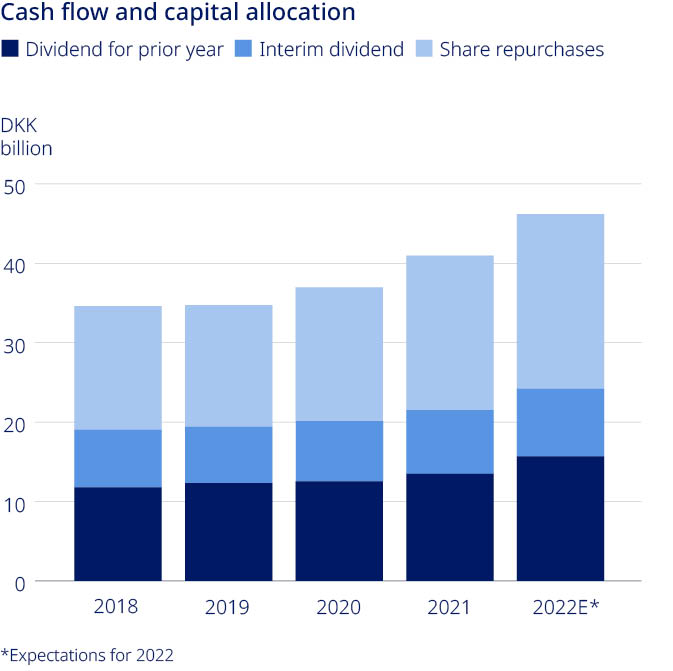
Deliver solid sales and operating profit growth: – Sales growth at 14% (CER) – International Operations sales growth of 14% (CER) – US sales growth of 13% (CER) with 60% of sales coming from products launched since 2015 – Operating profit growth of 13% (CER) | Drive operational efficiencies: – Continued productivity gains in Product Supply Enable attractive capital allocation to shareholders: – Free cash flow of DKK 29.3 billion – Share buyback of DKK 20 billion – Total dividend of DKK 10.40 per share and payout ratio of 49.6% | – Deliver solid sales and operating profit growth: – Deliver 6–10% sales growth in IO – Transform 70% of sales in the US (from 2015 to 2022) – Drive operational efficiencies across the value chain to enable investments in future growth assets – Deliver free cash flow to enable attractive capital allocation to shareholders | |||||||||||||||||||||
| Novo Nordisk Annual Report 2021 | 9 | |||||||
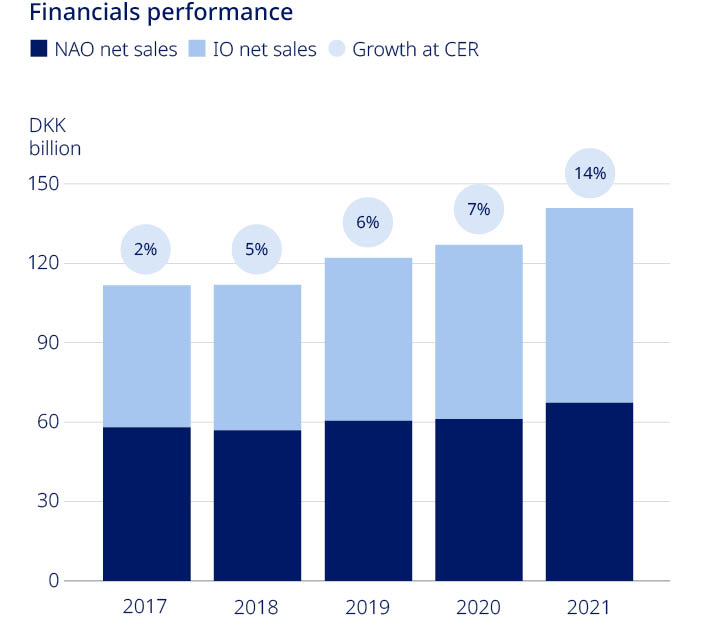
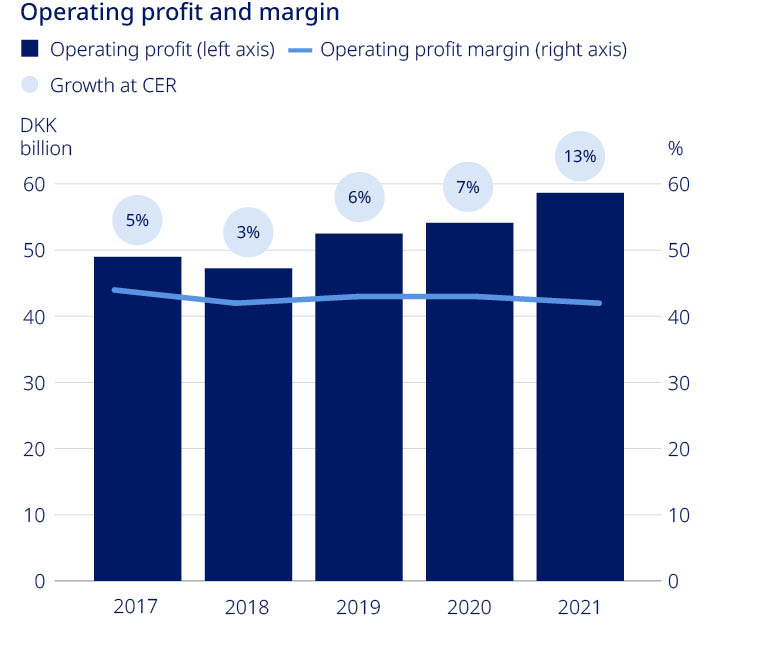
| DKK million | 2017 | 2018 | 2019 | 2020 | 2021 | 2020-21 | |||||||||||||||||||||||
 | Financial performance | Change | |||||||||||||||||||||||||||
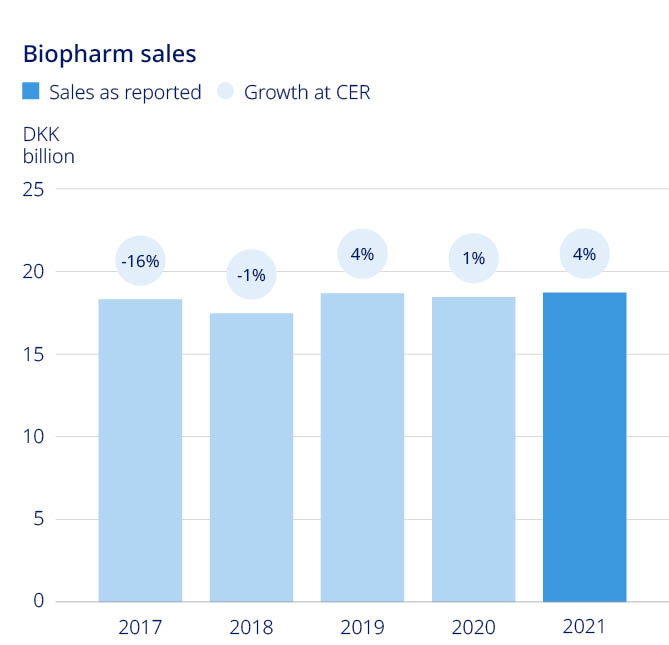
| Net sales | 111,696 | 111,831 | 122,021 | 126,946 | 140,800 | 11 | % | ||||||||||||||||||||||
| Sales growth as reported | (0.1 | %) | 0.1 | % | 9.1 | % | 4.0 | % | 10.9 | % | |||||||||||||||||||
Sales growth in constant exchange rates (CER)1 | 2.3 | % | 4.6 | % | 5.6 | % | 6.7 | % | 13.8 | % | |||||||||||||||||||
| Operating profit | 48,967 | 47,248 | 52,483 | 54,126 | 58,644 | 8 | % | ||||||||||||||||||||||
| Operating profit growth as reported | 1.1 | % | (3.5 | %) | 11.1 | % | 3.1 | % | 8.3 | % | |||||||||||||||||||
Operating profit growth in constant exchange rates (CER)1 | 4.8 | % | 2.8 | % | 5.6 | % | 6.8 | % | 12.7 | % | |||||||||||||||||||
| Depreciation, amortisation and impairment losses | 3,182 | 3,925 | 5,661 | 5,753 | 6,025 | ||||||||||||||||||||||||
| Net financials | (287) | 367 | (3,930) | (996) | 436 | ||||||||||||||||||||||||
| Profit before income taxes | 48,680 | 47,615 | 48,553 | 53,130 | 59,080 | 11 | % | ||||||||||||||||||||||
| Effective tax rate2 | 21.7 | % | 18.9 | % | 19.8 | % | 20.7 | % | 19.2 | % | |||||||||||||||||||
| Net profit | 38,130 | 38,628 | 38,951 | 42,138 | 47,757 | 13 | % | ||||||||||||||||||||||
Purchase of intangible assets2 | 1,022 | 2,774 | 2,299 | 16,256 | 1,050 | (94 | %) | ||||||||||||||||||||||
Purchase of property, plant and equipment2 | 7,626 | 9,636 | 8,932 | 5,825 | 6,335 | 9 | % | ||||||||||||||||||||||
| Cash used for acquisition of businesses | — | — | — | — | 18,283 | ||||||||||||||||||||||||
Free cash flow1 | 32,588 | 32,536 | 34,451 | 28,565 | 29,319 | 3 | % | ||||||||||||||||||||||
| Total assets | 102,355 | 110,769 | 125,612 | 144,922 | 194,508 | 34 | % | ||||||||||||||||||||||
| Equity | 49,815 | 51,839 | 57,593 | 63,325 | 70,746 | 12 | % | ||||||||||||||||||||||
| Financial ratios | |||||||||||||||||||||||||||||
Gross margin2 | 84.2 | % | 84.2 | % | 83.5 | % | 83.5 | % | 83.2 | % | |||||||||||||||||||
 | Sales and distribution costs in percentage of sales | 25.4 | % | 26.3 | % | 26.1 | % | 25.9 | % | 26.3 | % | ||||||||||||||||||
| Research and development costs in percentage of sales | 12.5 | % | 13.2 | % | 11.7 | % | 12.2 | % | 12.6 | % | |||||||||||||||||||
Operating margin2 | 43.8 | % | 42.2 | % | 43.0 | % | 42.6 | % | 41.7 | % | |||||||||||||||||||
Net profit margin2 | 34.1 | % | 34.5 | % | 31.9 | % | 33.2 | % | 33.9 | % | |||||||||||||||||||
Cash to earnings1 | 85.5 | % | 84.2 | % | 88.4 | % | 67.8 | % | 61.4 | % | |||||||||||||||||||
Operating profit after tax to net operating assets1 | 143,2% | 116,7% | 98.0 | % | 82.8 | % | 69.0 | % | |||||||||||||||||||||
Dividend payout ratio2 | 50.4 | % | 50.6 | % | 50.5 | % | 50.0 | % | 49.6 | % | |||||||||||||||||||
| Share performance and capital allocation | |||||||||||||||||||||||||||||
Basic earnings per share/ADR in DKK2 | 15.42 | 15.96 | 16.41 | 18.05 | 20.79 | 15 | % | ||||||||||||||||||||||
Diluted earnings per share/ADR in DKK2 | 15.39 | 15.93 | 16.38 | 18.01 | 20.74 | 15 | % | ||||||||||||||||||||||
| Total number of shares (million), 31 December | 2,500 | 2,450 | 2,400 | 2,350 | 2,310 | (2 | %) | ||||||||||||||||||||||
| Dividend per share in DKK | 7.85 | 8.15 | 8.35 | 9.10 | 10.40 | 3 | 14 | % | |||||||||||||||||||||
| Total dividend (DKK million) | 19,206 | 19,547 | 19,651 | 21,066 | 23,711 | 3 | 13 | % | |||||||||||||||||||||
| Share repurchases (DKK million) | 16,845 | 15,567 | 15,334 | 16,855 | 19,447 | 15 | % | ||||||||||||||||||||||
| Closing share price (DKK) | 335 | 298 | 387 | 427 | 735 | 72 | % | ||||||||||||||||||||||
1. See 'Non-IFRS financial measures' 2. See 'Financial definitions'. 3. Total dividend for the year including interim dividend of DKK 3.50 per share, corresponding to DKK 8,021 million, which was paid in August 2021. The remaining DKK 6.90 per share, corresponding to DKK 15,690 million, will be paid subject to approval at the Annual General Meeting in March 2022. | |||||||||||||||||||||||||||||
| Novo Nordisk Annual Report 2021 | 10 | |||||||

| Novo Nordisk Annual Report 2021 | 11 | |||||||

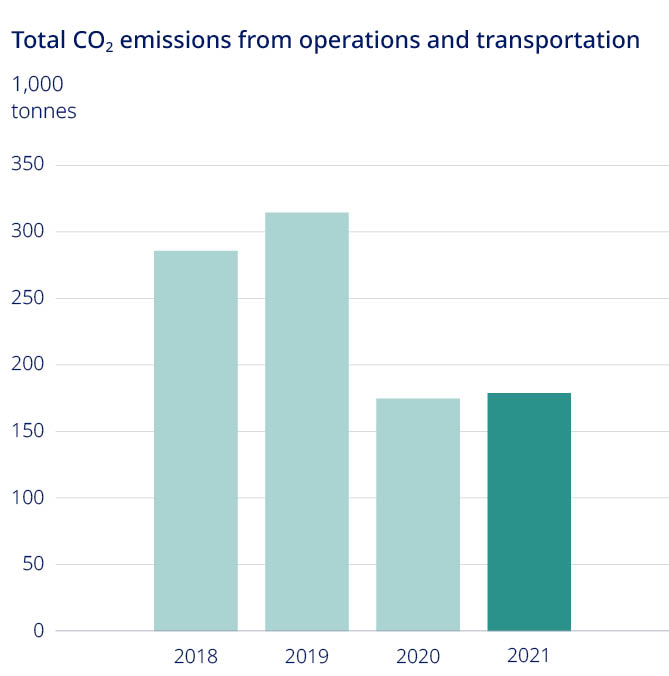
| 43% | |||||
decrease in our overall CO2 emissions compared to pre-COVID levels in 2019 | |||||
| 31,846 | |||||
children reached through our Changing Diabetes® in Children programme in 2021. This corresponds to an increase of 13% compared to 2020 | |||||
| Novo Nordisk Annual Report 2021 | 12 | |||||||
 | ||||||||
| Key ESG priorities | ||||||||
Environmental –CO2 emissions –Energy consumption –Environmental management –Plastic –Waste & circularity –Water | Social –Access & affordability –Diversity & inclusion –Employees –Human rights –Innovation –Prevention of serious chronic diseases –Sustainable tax | Governance –Bioethics –Business ethics –Corporate governance –Culture & values –Product safety –Remuneration –Risk management –Suppliers | ||||||
| Novo Nordisk Annual Report 2021 | 13 | |||||||
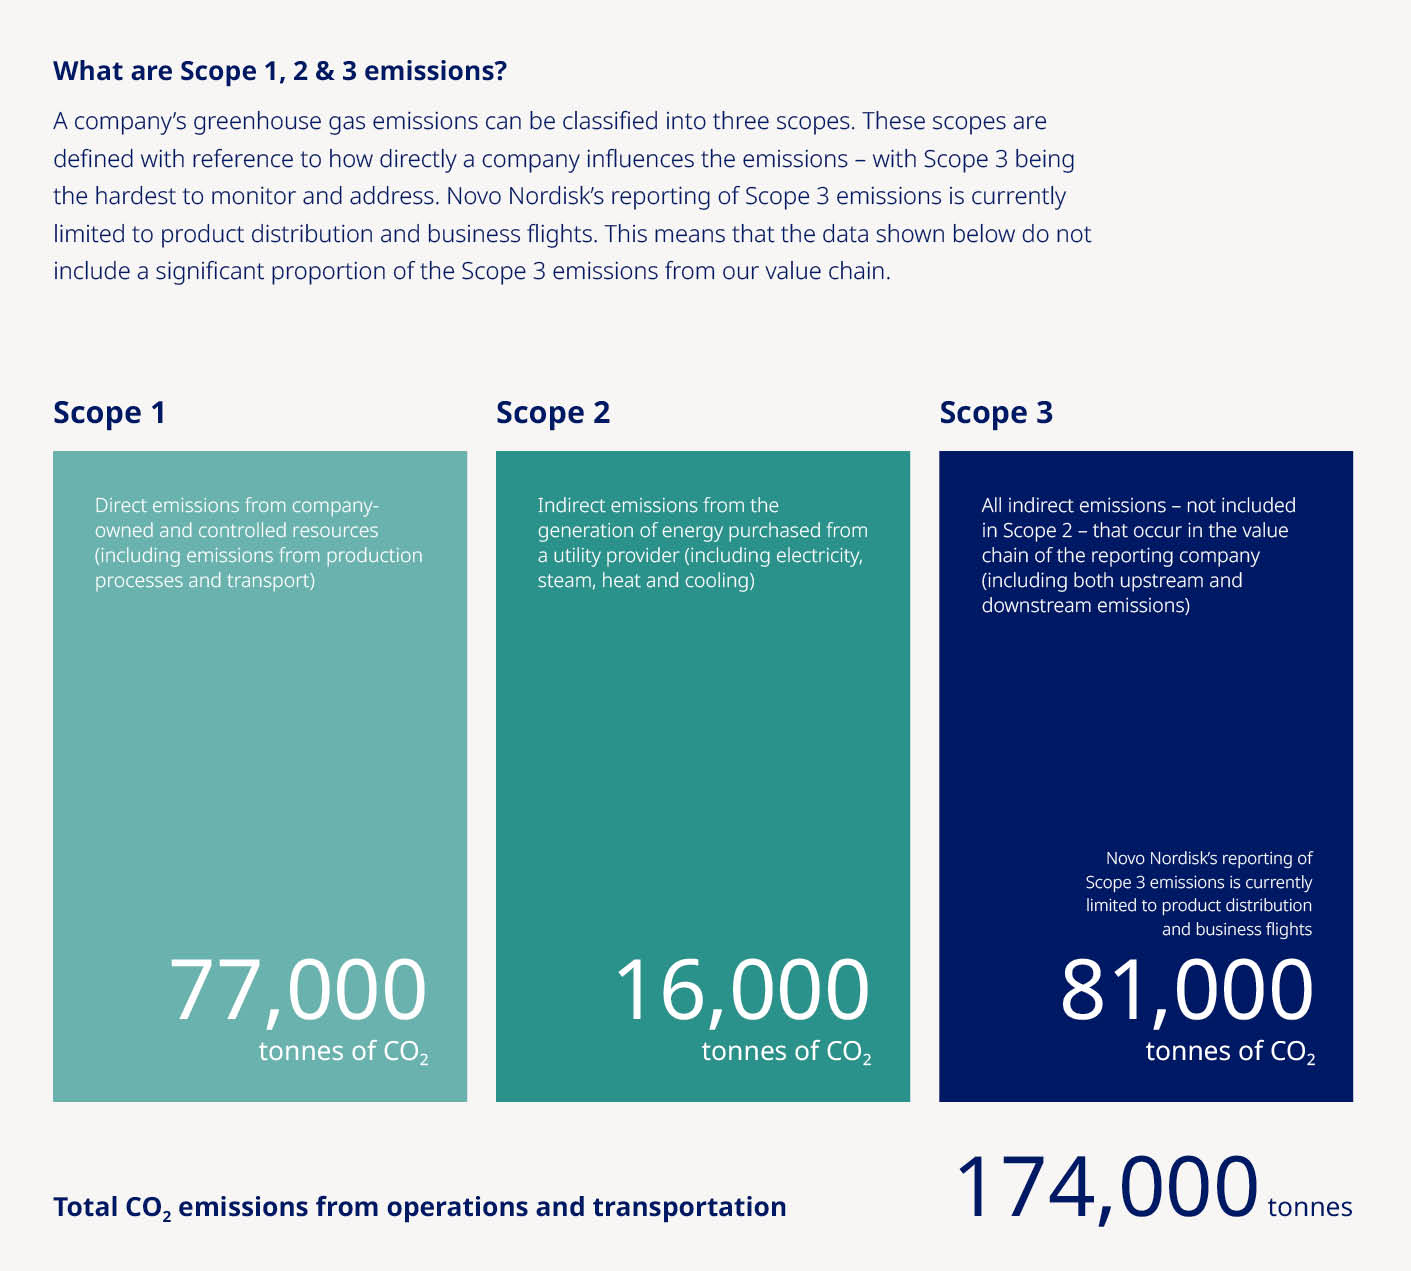
 made a significant commitment in 2021 to reach net-zero emissions across our entire value chain by 2045. Achieving this reduction calls for an ambitious plan to tackle Scope 3
 | Novo Nordisk Annual Report 2021 | 14 | |||||||
| Novo Nordisk Annual Report 2021 | 15 | |||||||
| 5+ million | ||||||||
| patients reached via our access and affordability efforts, corresponding to approximately | ||||||||
| 14% | ||||||||
| of all our diabetes patients | ||||||||
| Novo Nordisk Annual Report 2021 | 16 | |||||||
US Product Portfolio1 %, Change vs. Prior Year | |||||||||||||||||
| 2017 | 2018 | 2019 | 2020 | 2021 | |||||||||||||
List Price Change - Avg.2 | 6.9% | 5.0% | 5.5% | 2.3% | 2.0% | ||||||||||||
Net Price Change - Avg.2 | -9.0% | -8.6% | -13.2% | -16.9% | -12.3% | ||||||||||||
| Novo Nordisk Annual Report 2021 | 17 | |||||||
| Total US Insulin Portfolio %, Change vs. Prior Year | |||||||||||||||||
| 2017 | 2018 | 2019 | 2020 | 2021 | |||||||||||||
List Price Change - Avg.2 | 6.3% | 4.5% | 4.4% | 0.2% | 0.0% | ||||||||||||
Net Price Change - Avg.2 | -13.5% | -14.8% | -17.4% | -27.7% | -10.2% | ||||||||||||

| Novo Nordisk Annual Report 2021 | 18 | |||||||
| Women in leadership | |||||||||||||||||
| 2017 | 2018 | 2019 | 2020 | 2021 | |||||||||||||
| EVP/SVP | 14 | % | 13 | % | 18 | % | 24 | % | 28 | % | |||||||
| CVP | 28 | % | 31 | % | 33 | % | 37 | % | 39 | % | |||||||
| VP | 33 | % | 35 | % | 35 | % | 36 | % | 36 | % | |||||||
| Senior leadership | 31 | % | 32 | % | 33 | % | 35 | % | 36 | % | |||||||
| Director | 42 | % | 41 | % | 43 | % | 41 | % | 44 | % | |||||||
| Manager | 40 | % | 40 | % | 40 | % | 42 | % | 43 | % | |||||||
| All leaders | 40 | % | 40 | % | 40 | % | 41 | % | 43 | % | |||||||
| Novo Nordisk Annual Report 2021 | 19 | |||||||


| Novo Nordisk Annual Report 2021 | 20 | |||||||
| Novo Nordisk Annual Report 2021 | 21 | |||||||
| The Novo Nordisk Way – Essentials | ||||||||
1.We create value by having a patient centred business approach. 2.We set ambitious goals and strive for excellence. 3.We are accountable for our financial, environmental and social performance. 4.We provide innovation to the benefit of our stakeholders. 5.We build and maintain good relations with our key stakeholders. 6.We treat everyone with respect. 7.We focus on personal performance and development. 8.We have a healthy and engaging working environment. 9.We strive for agility and simplicity in everything we do. 10.We never compromise on quality and business ethics. | ||||||||
| Novo Nordisk Annual Report 2021 | 22 | |||||||
| Novo Nordisk Annual Report 2021 | 23 | |||||||
| We follow and adhere to legal requirements, international standards, recommendations and commitments including: | ||||||||||||||
Standards –Value Reporting Foundation/ Sustainability Accounting Standards Board –Taskforce on Climate-related Financial Disclosures –Science Based Targets initiative (SBTi) –World Economic Forum's Stakeholder Capitalism  | Legal requirements –The Danish Financial Statements Act –UK Bribery Act –UK and Australian Modern Slavery Acts –US Foreign Corrupt Practices Act Recommendations and commitments –UN Global Compact Ten Principles –UN Guiding Principles on Business and Human Rights –UN Political Declaration on Universal Health Coverage –UN Sustainable Development Goals –OECD Guidelines for Multinational Enterprises on Responsible Business Conduct –Danish Corporate Governance Recommendations For more information, see novonordisk.com. |  | ||||||||||||
Strategic Aspirations 2025 Purpose and sustainability | ||||||||
– Being respected for adding value to society – Progress towards zero environmental impact – Ensure distinct core capabilities and evolve culture | ||||||||
| Novo Nordisk Annual Report 2021 | 24 | |||||||

We are active in late stage assets across all our therapy areas | |||||
| Novo Nordisk Annual Report 2021 | 25 | |||||||
| Novo Nordisk Annual Report 2021 | 26 | |||||||
Strategic Aspirations 2025 Innovation and therapeutic focus | ||||||||
– Further raise the innovation-bar for diabetes treatment – Develop a leading portfolio of superior treatment solutions for obesity – Strengthen and progress the Biopharm pipeline –Establish presence in other serious chronic diseases focusing on Cardiovascular disease (CVD); Non-alcoholic steatohepatitis (NASH) | ||||||||
| Novo Nordisk Annual Report 2021 | 27 | |||||||
| Diabetes care | |||||||||||
| Project | Indication | Description | Phase | ||||||||
Semaglutide 2.0 mg NN9535 | Type 2 diabetes | A long-acting GLP-1 analogue for once-weekly treatment. |  | ||||||||
Oral semaglutide HD1 NN9924 | Type 2 diabetes | A long-acting oral GLP-1 analogue, 25 and 50 mg, intended for once-daily oral treatment. |  | ||||||||
Icodec NN1436 | Type 1 and 2 diabetes | A long-acting basal insulin analogue intended for once-weekly treatment. |  | ||||||||
Icosema NN1535 | Type 2 diabetes | A combination of GLP-1 analogue semaglutide and insulin icodec intended for once-weekly treatment. |  | ||||||||
FDC Sema – OW GIP NN9389 | Type 2 diabetes | A combination of semaglutide and novel GIP intended for once-weekly treatment. |  | ||||||||
CagriSema in T2D NN9388 | Type 2 diabetes | A combination of amylin analogue and GLP-1 analogue semaglutide intended for once-weekly treatment. |  | ||||||||
Insulin 965 NN1965 | Type 1 and 2 diabetes | A novel basal insulin analogue intended for once-daily treatment. |  | ||||||||
Glucose-sensitive insulin NN1845 | Type 1 and 2 diabetes | A glucose-sensitive insulin analogue intended for once-daily treatment. |  | ||||||||
Ideal Pump Insulin NN1471 | Type 1 diabetes | A novel insulin analogue ideal for use in a closed loop pump device as delivery. | | ||||||||
DNA Immunotherapy NN9041 | Type 1 diabetes | A novel plasmid encoding pre- and pro-insulin intended for preservation of beta cell function. | | ||||||||
| Obesity care | |||||||||||
Oral Sema Obesity NN9932 | Obesity | A long acting GLP-1 analogue intended for once-daily treatment. |  | ||||||||
PYY1875 NN9775 | Obesity | A novel analogue of the appetite-regulating hormone, PYY, intended for once-weekly treatment. |  | ||||||||
Cagrilinitide NN9838 | Obesity | A novel long-acting amylin analogue intended for once-weekly treatment. |  | ||||||||
CagriSema NN9838 | Obesity | A combination of amylin analogue cagrilintide and GLP-1 analogue semaglutide intended for once-weekly treatment. |  | ||||||||
LA-GDF15 NN9215 | Obesity | A long-acting GDF15 analogue intended for appetite regulation leading to weight loss. | | ||||||||
 | |||||||||||
| 1. High dose 2. GHD: Growth hormone deficiency 3. HGH: Human growth hormone 4. NASH: Non-alcoholic steatohepatitis 5. CVD: Cardiovascular disease 6. Alpha-1-AntiTrypsin Deficiency related liver disease 7. Asset without NN project ID. 8. This project also includes a phase 2b study in F4 in a collaboration with Gilead. | |||||||||||
| Biopharm | |||||||||||
| Project | Indication | Description | Phase | ||||||||
Sogroya® NN8640 | Adult GHD2 | A long-acting HGH3 derivative intended for once-weekly subcutaneous administration in adults. |  | ||||||||
Somapacitan NN8640 | GHD2 | A long-acting HGH3 derivative intended for once-weekly subcutaneous administration in children. |  | ||||||||
Concizumab NN7415 | Haemophilia A and B w/wo inhibitors | A monoclonal antibody against tissue factor pathway inhibitor (TFPI) intended for subcutaneous prophylaxis treatment. | | ||||||||
Macimorelin EX2020 | GHD2 | An oral diagnostic agent used for the diagnosis of GHD in adolescents and children. |  | ||||||||
Mim8 NN7769 | Haemophilia A with or without inhibitors | A next generation FVIII mimetic bispecific antibody for subcutaneous prophylaxis of haemophilia A regardless of inhibitor status. |  | ||||||||
Nedosiran7 | Primary Hyperoxaluria | An siRNA targeting lactate dehydrogenase A (or LDHA) for once monthly subcutaneous treatment. | | ||||||||
Eclipse NN7533 | Sickle cell disease | An oral combination treatment of sickle cell disease and beta thalassaemia. Project is developed in collaboration with EpiDestiny. |  | ||||||||
| Other serious chronic diseases | |||||||||||
Semaglutide8 NN9931 | NASH4 | A long-acting GLP-1 analogue for once-weekly treatment of NASH4. |  | ||||||||
Semaglutide Alzheimer NN6535 | Alzheimer's | A long-acting GLP-1 analogue for once-daily treatment of Alzheimer’s disease. | | ||||||||
Ziltivekimab NN6018 | CVD5 | A novel once-monthly monoclonal antibody intended for inhibition of IL-6 activity. | | ||||||||
Belcesiran7 | AATD6 | An siRNA targeting Alpha-1-AntiTrypsin (AAT) for once monthly subcutaneous treatment. |  | ||||||||
Oral PCSK9i NN6435 | CVD5 | A long-acting PCSK9 inhibitor for subcutaneous treatment. |  | ||||||||
FGF-21 NASH NN9500 | NASH4 | A long-acting FGF21 analogue for once-weekly treatment of NASH. |  | ||||||||
PRX004 NN6019 | CVD5 | An anti-amyloid immunotherapy treatment for ATTR5. |  | ||||||||
DCR-AUD7 | Alcohol Use Disorder | An siRNA targeting ALDH2 for once monthly subcutaneous treatment. |  | ||||||||
| Novo Nordisk Annual Report 2021 | 28 | |||||||
Research and development progress | ||||||||||||||||||||||||||||||||
| Diabetes | Obesity | Biopharm | Other serious chronic diseases | |||||||||||||||||||||||||||||
Regulatory events – A market authorisation application was resubmitted to the FDA for approval of semaglutide 2.0 mg May 2021. – Approval by the EU of Ozempic 2.0 mg. – Xultophy® was approved in China for diabetes management. – Ozempic® was approved in China for diabetes management. – A label extension for Insulatard® and Actrapid® was submitted to EMA to increase the non-refrigerated storage time prior to opening by 4 weeks. Clinical progress – A phase 3b trial was initiated with high dose Rybelsus®, 25 and 50 mg, in people with type 2 diabetes (T2D). – The phase 3a programme, COMBINE, was initiated investigating the once-daily combination of Icodec and semaglutide in people with T2D. – Phase 3a, ONWARDS trials were initiated investigating once-weekly Icodec in people with type 1 (T1D) and (T2D). – A Phase 2 trial was initiated to investigate the effects of the combination of semaglutide and novel GIP in people with T2D. – A Phase 2 trial was initiated to investigate the effects of the combination of semaglutide and cagrilintide in people with (T2D). – A Phase 1 trial for glucose sensitive insulin was completed. – A Phase 1 trial was initiated to investigate tolerogenic DNA plasmid in for preventive treatment of diabetes in people with T1D. | Regulatory events – Once-weekly sc semaglutide 2.4 mg was approved under the brand name Wegovy® for weight management in adults with obesity or overweight and at least one weight-related comorbidity in the US. A marketing authorisation application for semaglutide 2.4 mg obesity was submitted to the Japanese Health Authorities and approved in the EU. – Saxenda® was granted a label expansion to include the use in adolescents (aged 12 to <18 years) with obesity or overweight in the US and Europe. Clinical progress – A phase 3a trial was initiated to investigate the effects of once-weekly sc semaglutide 2.4 mg on physical function, symptoms and body weight in people with obesity-related heart failure with preserved ejection fraction (HFpEF). – A phase 3a trial OASIS-1 was initiated to investigate oral semaglutide 50 mg in people with obesity. | Regulatory events – The once-weekly growth hormone derivative, somapacitan, was approved in Japan and Europe for adults with growth hormone deficiency. – Regulatory file to support a prophylaxis indication for Rebinyn® was submitted. – Regulatory file to support a new indication for NovoSeven® in women with Postpartum haemorrhage was submitted. Clinical progress – Initial results from the phase 3a programme, REAL 4; investigating the once-weekly growth hormone derivative, somapacitan, in children with Growth Hormone Deficiency (GHD) were compiled. – Results from a phase 2 trial, REAL 5, in children, with short stature and born short for gestational age were compiled. – First cohorts of phase 1/2 trial with Mim8 successfully completed. – A phase 3a trial for macimorelin was initiated investigating an oral diagnostic agent used for the diagnosis of GHD in adolescents and children. | Clinical progress – A phase 3a programme, ESSENCE, was initiated investigating once-weekly semaglutide in people with Non-alcoholic steatohepatitis (NASH). – A phase 3a programme, EVOKE, was initiated investigating once-weekly semaglutide in people with Alzheimer’s Disease. – A phase 3a cardiovascular outcome trial, ZEUS, was initiated investigating once-monthly monoclonal antibody Ziltivekimab in people with Atherosclerotic Cardiovascular Disease (ASCVD), Chronic Kidney Disease (CKD) and residual inflammatory risk. – In collaboration with Gilead, a phase 2b trial was initiated investigating semaglutide in combination with Gileads investigational FXR agonist cilofexor and investigational ACC inhibitor firsocostat in people with compensated cirrhosis (F4) due to NASH. – A phase 2 trial was initiated investigating orally administrated PCSK9i for LDL-cholesterol lowering in people with ASCVD or general CV risk. – Novo Nordisk acquired phase 2 ready antibody PRX004 for the rare heart disease ATTR cardiomyopathy from Prothena Corporation PLC. – A phase 2 trial was initiated investigating once-weekly FGF21 in people with NASH. As part of phase 2 trial an additional treatment arm with Cagrilintide in combination with semaglutide is included in the trial. – Collaboration with Staten Biotechnology terminated | |||||||||||||||||||||||||||||
| Novo Nordisk Annual Report 2021 | 29 | |||||||
Patent status for marketed products The patent expiry dates for the products are shown in the table on the right. The dates provided are for expiry in the US, China, Japan and Europe of patents on the active ingredient, unless otherwise indicated, and include actual and estimated extensions of patent term, when applicable. For several products, in addition to the active ingredient patent, Novo Nordisk holds other patents on manufacturing processes, formulations or uses that may be relevant for exclusivity beyond the expiration of the active ingredient patent. Furthermore, regulatory data protection and/or orphan exclusivity may apply. | Key marketed products in main markets (active ingredients) | |||||||||||||||||||
| Diabetes: | US | China | Japan | Europe8 | ||||||||||||||||
Human insulin and Modern insulins1 | Expired | Expired | Expired | Expired | ||||||||||||||||
NovoNorm® (Prandin®) | Expired | Expired | Expired | Expired | ||||||||||||||||
Victoza®9 | 2023 | Expired | 2022 | 2023 | ||||||||||||||||
Tresiba® | 2029 | 2024 | 2027 | 2028 | ||||||||||||||||
Ryzodeg® | 2029 | 2024 | 2024 2 | 2028 | ||||||||||||||||
Xultophy® | 2029 | 2024 | 2024 2 | 2028 | ||||||||||||||||
Fiasp® | 2030 3 | 2030 3 | 2030 3 | 2030 3 | ||||||||||||||||
Ozempic® | 2032 | 2026 | 2031 | 2031 | ||||||||||||||||
Rybelsus® | 2032 4 | 20264 | 2031 4 | 2031 4 | ||||||||||||||||
| Obesity: | ||||||||||||||||||||
Saxenda® | 2023 | Expired | Expired | 2023 | ||||||||||||||||
Wegovy® | 2032 | 2026 | 2031 | 2031 | ||||||||||||||||
| Biopharm: | ||||||||||||||||||||
Norditropin® (SimpleXx®) | Expired | Expired | Expired | Expired | ||||||||||||||||
Sogroya® | 2034 | 2031 | 2036 | 2036 | ||||||||||||||||
NovoSeven® | Expired 5 | Expired 5 | Expired 5 | Expired 5 | ||||||||||||||||
NovoEight® | No patent | No patent | No patent | No patent | ||||||||||||||||
NovoThirteen® (TRETTEN®) | Expired | No patent | No patent | No patent | ||||||||||||||||
Refixia® (REBINYN®) | 2028 | 2022 | 2027 | 2027 | ||||||||||||||||
Esperoct® | 2032 | 2029 | 2034 | 2034 | ||||||||||||||||
Vagifem® 10 mcg | 2022 6,7 | No patent | Expired | Expired | ||||||||||||||||
1. Modern insulins are NovoRapid® (NovoLog®), NovoMix® 30 (NovoLog® Mix 70/30) and Levemir® 2. Patent term extension until 2027 may apply 3. Formulation patent; active ingredient patent has expired 4. Tablet formulation and once-daily treatment regimen are protected by additional patents expiring in 2031-2034 5. Room temperature-stable formulation patent until 2023 in China, Japan and Germany and until 2025 in the US 6. Patent covers low-dose treatment regimen 7. Licensed to several generic manufacturers from October 2016 8. Patent status varies from country to country. The figures in the table are based on Germany 9. We have granted and pending patents covering the Victoza® formulation. These patents generally expire in November 2024, except for the US where the formulation patent expires in February 2026 | ||||||||||||||||||||
| Novo Nordisk Annual Report 2021 | 30 | |||||||

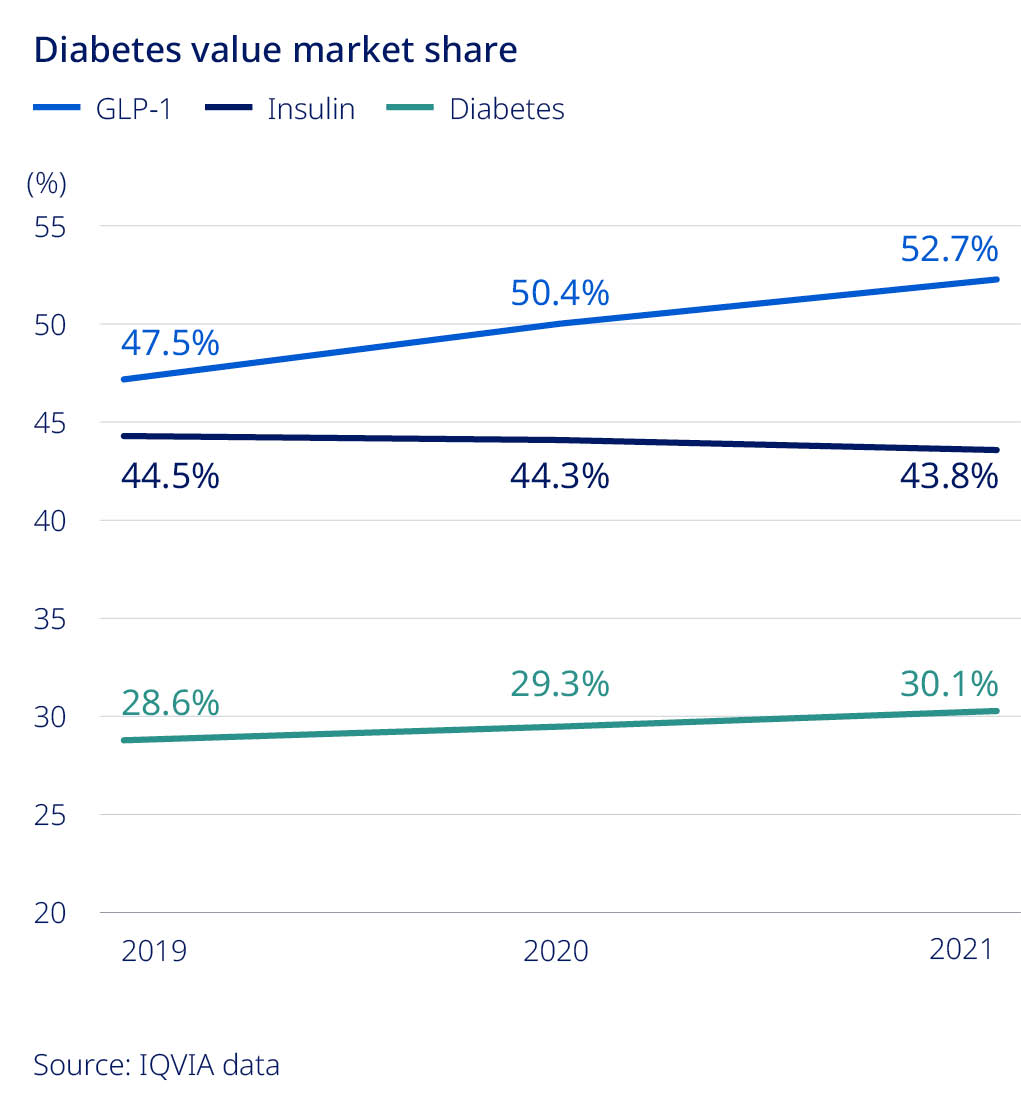
| 30.1% | ||||||||
| Value market share for diabetes | ||||||||
| 8,400 | ||||||||
| DKK million sales in obesity treatment | ||||||||
| Novo Nordisk Annual Report 2021 | 31 | |||||||
| Novo Nordisk Annual Report 2021 | 32 | |||||||

Strategic Aspirations 2025 Commercial execution | ||||||||
| – Strengthen Diabetes leadership – aim at global value market share of more than 1/3 – Strengthen Obesity leadership and double current sales (based on reported sales in 2019) – Secure a sustained growth outlook for Biopharm | ||||||||
| Novo Nordisk Annual Report 2021 | 33 | |||||||
| Novo Nordisk Annual Report 2021 | 34 | |||||||

| Novo Nordisk Annual Report 2021 | 35 | |||||||
| Novo Nordisk Annual Report 2021 | 36 | |||||||
| Expectations are as reported, if not otherwise stated | Expectations 2 February 2022 | ||||
| Sales growth | |||||
| at CER | 6% to 10% | ||||
| as reported | Around 5 percentage points higher than at CER | ||||
| Operating profit growth | |||||
| at CER | 4% to 8% | ||||
| as reported | Around 7 percentage points higher than at CER | ||||
| Financial items (net) | Loss of around DKK 2.8 billion | ||||
| Effective tax rate | 20% to 22% | ||||
| Capital expenditure (PP&E) | Around DKK 12.0 billion | ||||
| Depreciation, amortisation and impairment losses | Around DKK 6.5 billion | ||||
| Free cash flow (excluding impact from business development) | DKK 50-55 billion | ||||
| Novo Nordisk Annual Report 2021 | 37 | |||||||
| Novo Nordisk Annual Report 2021 | 38 | |||||||
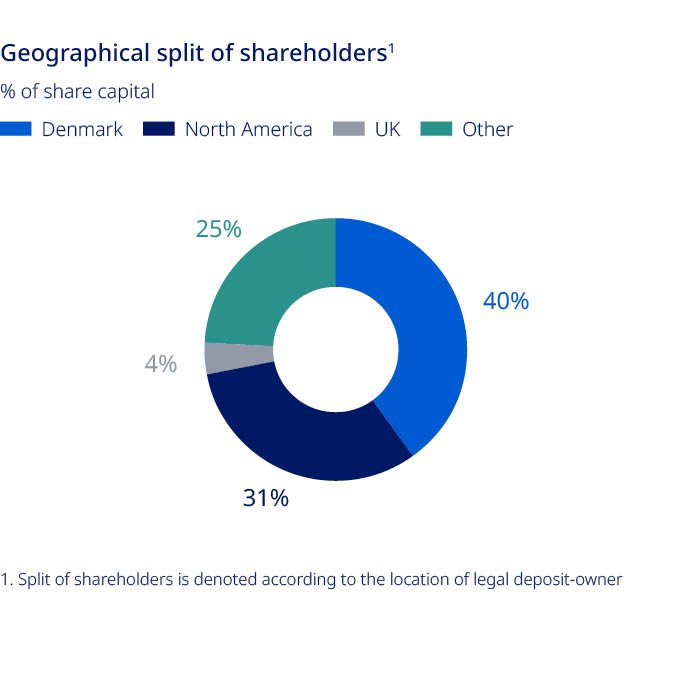
 Share capital and ownership
| Novo Nordisk Annual Report 2021 | 39 | |||||||

Strategic Aspirations 2025 Financial | |||||
| – Deliver solid sales and operating profit growth: – Deliver 6–10% sales growth in International Operations – Transform 70% of sales in the US (from 2015 to 2022) – Drive operational efficiencies across the value chain to enable investments in future growth assets – Deliver free cash flow to enable attractive capital allocation to shareholders | |||||
| Novo Nordisk Annual Report 2021 | 40 | |||||||

| Novo Nordisk Annual Report 2021 | 41 | |||||||
| Novo Nordisk Annual Report 2021 | 42 | |||||||
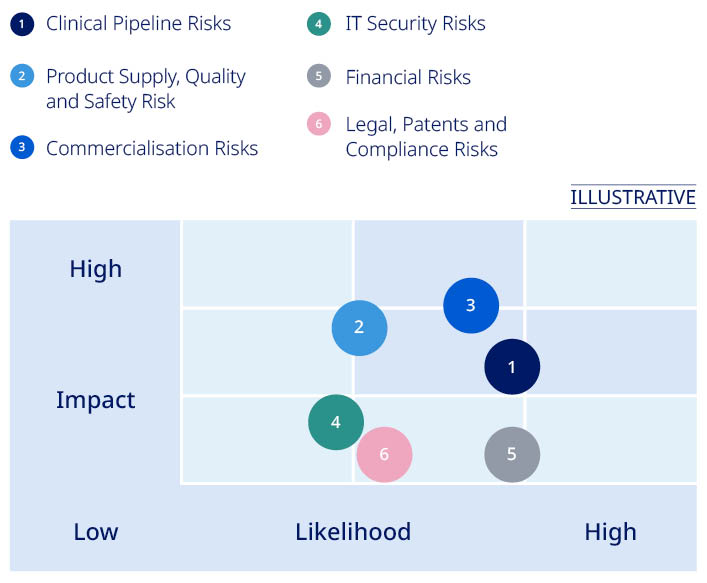
| Risk area | Description | Impact | Mitigating actions | |||||||||||
 | Clinical Pipeline Risks | Findings in clinical activities, regulatory processes or misunderstanding of commercial potential leading to delays or failure of products in the pipeline | –Patients would not benefit from innovative treatments –Could have an adverse impact on sales, profits and market position | –Pre-clinical and clinical activities to demonstrate safety and efficacy –Consultations with regulators to review pre-clinical and clinical findings and obtain guidance on development path | ||||||||||
 | Product Supply, Quality and Safety Risks | Disruption of product supply or quality failures may compromise the availability of products, ultimately impacting the health of patients and a lost commercial opportunity | –Product shortages could have potential implications for patients –Could put patients' health and lives at risk and jeopardise reputation and license to operate if regulatory compliance is not ensured –Could have an adverse impact on sales, profits and market position | –Establishing global production with multiple facilities and safety stock to reduce supply risk –Regular quality audits of internal units and suppliers and annual inspections by authorities document GMP compliance –Identification and correction of root causes when issues are identified. If necessary, products are recalled | ||||||||||
 | Commercialisation Risks | Market dynamics and geopolitical, macroeconomic or healthcare crises (e.g., pandemics) leading to reduced payer ability and willingness to pay | –Market dynamics could impact price levels and patient access –Could have an adverse impact on sales, profits and market position | –Innovation of novel products, clinical trial data and real-world evidence demonstrate added value of new products –Payer negotiations to ensure improved patients' access –Increased and new access and affordability initiatives | ||||||||||
 | IT Security Risks | Disruption to IT systems, such as cyber-attacks or infrastructure failure resulting in business disruption or breach of data confidentiality | –Could limit our ability to produce and safeguard product quality –Could compromise patients' or other individuals' privacy –Could limit our ability to maintain operations or limit future business opportunities if proprietary information is lost –Could have an adverse impact on sales, profits and market position | –Company-wide information security awareness activities –Continuity plans for non-availability of IT systems –Company-wide internal audit of IT security controls –Detection and protection mechanisms in IT systems and business processes | ||||||||||
 | Financial Risks | Exchange rate fluctuations (mainly in USD, CNY and JPY), disputes with tax authorities and changes to tax legislation and interpretation | –Could lead to significant tax adjustments, fines and higher-than-expected tax level –Could have an adverse impact on sales, profits and market position | –Hedging for selected currencies –Integrated treasury management –Applicable taxes paid in jurisdictions where business activity generates profits and multi-year Advance Pricing Agreements with tax authorities | ||||||||||
 | Legal, Patents and Compliance Risks | Breach of legislation, industry codes or company policies. Competitors asserting patents against Novo Nordisk or challenging patents critical for protection of commercial product and pipeline candidates | –Potential exposure to investigations, criminal and civil sanctions and other penalties –Could compromise our reputation and the rights and integrity of individuals involved –Unexpected loss of exclusivity for or injunctions against existing and pipeline products could have an adverse impact on future sales –Could have an adverse impact on sales, profits and market position | –Legal review of key activities –Business Ethics Code of Conduct integrated in our business, Compliance hotline in place and Internal Audit of compliance with business ethics standards –Internal controls to minimise vulnerability to patent infringement and invalidity actions | ||||||||||
| Novo Nordisk Annual Report 2021 | 43 | |||||||

| Novo Nordisk Annual Report 2021 | 44 | |||||||
| Board of Directors | |||||||||||||||||||||||||||||||||||||||||||||||
 |  |  |  |  |  | ||||||||||||||||||||||||||||||||||||||||||
Helge Lund Chair Norwegian. Born October 1962. Male. First elected 20171. Term 2022. Chair of the Nomination Committee and Chair of the Chair Committee. Positions and management duties: Chair of the board of directors and chair of the people & governance committee of BP p.l.c. Chair of the board of directors of Inkerman Holding AS. Member of the board of directors and member of the remuneration committee of Belron SA and of the board of directors of P/F Tjaldur. Operating advisor to Clayton Dubilier & Rice. Member of the board of trustees of the International Crisis Group. Competences: Global corporate leadership; healthcare and pharma industry; finance & accounting; business development, M&A and external innovation sourcing; human capital management; environmental, social & governance (ESG). 1. In addition, Helge Lund was a member of the Board for one year in 2014-2015 | Jeppe Christiansen Vice chair Danish. Born November 1959. Male. First elected 2013. Term 2022. Chair of the Remuneration Committee and member of the Chair Committee. Positions and management duties: Chief executive officer of Maj Invest Holding A/S and executive director of two wholly owned subsidiaries. Chair of the board of directors of Haldor Topsøe A/S, Emlika Holding ApS, and two wholly owned subsidiaries of the latter company, and chair of the board of directors of JEKC Holding ApS. Member of the board of directors of Novo Holdings A/S, KIRKBI A/S, BellaBeat Inc., Pluto Naturfonden and Randers Regnskov. Member of the board of governors of Det Kgl. Vajsenhus. Adjunct Professor, department of finance, Copenhagen Business School. Competences: Healthcare and pharma industry; finance & accounting; business development, M&A and external innovation sourcing; human capital management; environmental, social & governance (ESG). | Laurence Debroux French. Born July 1969. Female. First elected 2019. Term 2022. Chair of the Audit Committee and member of the Remuneration Committee. Positions and management duties: Member of the board of directors, chair of the audit committee and member of the ESG committee of Exor N.V. Member of the board of directors, control & risk committee and of the ESG committee of Juventus Football Club S.p.A. Member of the board of HEC Paris Business School and of Kite Insights (The Climate School). Competences: Global corporate leadership; healthcare and pharma industry; finance & accounting; business development, M&A and external innovation sourcing; human capital management; environmental, social & governance (ESG). | Andreas Fibig German. Born February 1962. Male. First elected 2018. Term 2022. Member of the Audit Committee. Positions and management duties: Chair, chief executive officer and member of the innovation and sustainability committee of International Flavors & Fragrances Inc. Chair of the board of directors of the German American Chamber of Commerce and executive committee member of the World Business Council for Sustainable Development (WBCSD). Competences: Global corporate leadership; healthcare and pharma industry; technology; finance & accounting; business development, M&A and external innovation sourcing; human capital management; environmental, social & governance (ESG). | Sylvie Grégoire Canadian and American. Born November 1961. Female. First elected 2015. Term 2022. Member of the Audit Committee, the Research & Development Committee and the Nomination Committee. Positions and management duties: Executive chair of the board of directors of EIP Pharma, Inc. Member of the board of directors and member of the nominating and corporate governance committee of Perkin Elmer Inc. Member of the board of directors of F2G Ltd. Competences: Global corporate leadership; healthcare and pharma industry; medicine & science; finance & accounting; business development, M&A and external innovation sourcing; human capital management. | Henrik Poulsen Danish. Born September 1967. Male. First elected 2021. Term 2022. Member of the Audit Committee. Positions and management duties: Deputy chair of the board of directors and member of the transaction committee of ISS A/S. Deputy chair of the supervisory board and member of the audit, remuneration and nomination committees of Carlsberg A/S. Member of the board of directors of Novo Holdings A/S and Ørsted A/S. Senior advisor to A.P. Møller Holding A/S and chair of the board of directors of Færch A/S. Member of the supervisory board of Bertelsmann SE & Co. KGaA. Competences: Global corporate leadership; finance & accounting; business development, M&A and external innovation sourcing; human capital management; environmental, social & governance (ESG). | ||||||||||||||||||||||||||||||||||||||||||
| Novo Nordisk Annual Report 2021 | 45 | |||||||
 |  |  |  |  |  | ||||||||||||||||||||||||||||||||||||||||||
Mette Bøjer Jensen Danish. Born December 1975. Female. First elected 2018. Term 2022. Employee representative. Member of the Nomination Committee. Positions and management duties: Wash & Sterilisation specialist in Product Supply, Novo Nordisk A/S. Competences: Not mapped for employee representatives. | Kasim Kutay British. Born May 1965. Male. First elected 2017. Term 2022. Member of the Nomination Committee and the Research & Development Committee. Positions and management duties: Chief executive officer of Novo Holdings A/S. Member of the board of directors and member of the nomination and remuneration committee of Novozymes A/S. Member of the board of directors and member of the nomination and remuneration committee of Evotec SE. Member of the board of directors of the Life Sciences Advisory board of Gimv NV. Competences: Global corporate leadership; healthcare and pharma industry; finance & accounting; business development, M&A and external innovation sourcing; human capital management. | Anne Marie Kverneland Danish. Born July 1956. Female. First elected 2000. Term 2022. Employee representative. Member of the Remuneration Committee. Positions and management duties: Laboratory technician and full-time union representative at Novo Nordisk A/S. Member of the board of directors of the Novo Nordisk Foundation. Competences: Not mapped for employee representatives. | Martin Mackay American and British. Born April 1956. Male. First elected 2018. Term 2022. Chair of the Research & Development Committee. Member of the Remuneration Committee. Positions and management duties: Co-founder, chair and CEO of Rallybio LLC. Member of the board of directors of 5:01 Acquisition Corporation. Senior advisor to New Leaf Venture Partners, LLC. Member of the board of directors and chair of the science & technology committee of Charles River Laboratories International, Inc. Competences: Global corporate leadership; healthcare and pharma industry; medicine & science; technology; business development, M&A and external innovation sourcing; human capital management. | Thomas Rantzau Danish. Born March 1972. Male. First elected 2018. Term 2022. Employee representative. Member of the Research & Development Committee. Positions and management duties: Area specialist in Product Supply, Novo Nordisk A/S. Competences: Not mapped for employee representatives. | Stig Strøbæk Danish. Born January 1964. Male. First elected 1998. Term 2022. Employee representative. Member of the Audit Committee. Positions and management duties: Electrician and a full-time union representative at Novo Nordisk A/S. Competences: Not mapped for employee representatives. | ||||||||||||||||||||||||||||||||||||||||||
| Novo Nordisk Annual Report 2021 | 46 | |||||||
| Independence and meeting attendance overview | ||||||||||||||||||||||||||
Meeting attendance in 20211 | ||||||||||||||||||||||||||
| Name | Independence2 | Board of Directors | Chair Committee | Audit Committee7 | Nomination Committee | Remuneration Committee | R&D Committee | |||||||||||||||||||
| Helge Lund | Independent |  |  |  | ||||||||||||||||||||||
| Jeppe Christiansen | Not independent 3 | |  | | ||||||||||||||||||||||
| Laurence Debroux | Independent 4,5,8 | |  |  | ||||||||||||||||||||||
| Andreas Fibig | Independent 4 |  | | |||||||||||||||||||||||
| Sylvie Grégoire | Independent 4 | | | |  | |||||||||||||||||||||
| Mette Bøjer Jensen | Not independent 6 | | | |||||||||||||||||||||||
| Kasim Kutay | Not independent 3 | | | | ||||||||||||||||||||||
| Anne Marie Kverneland | Not independent 6 | | | |||||||||||||||||||||||
| Martin Mackay | Independent | | | | ||||||||||||||||||||||
| Henrik Poulsen | Not independent 3,4,5,8 |  | | |||||||||||||||||||||||
| Thomas Rantzau | Not independent 6 | | | |||||||||||||||||||||||
| Stig Strøbæk | Not independent 4,6 | | | |||||||||||||||||||||||
| Board members who stepped down at the annual general meeting in March 2021 | ||||||||||||||||||||||||||
| Brian Daniels | Independent |  |  | | ||||||||||||||||||||||
| Liz Hewitt | Independent | | | | ||||||||||||||||||||||
| Novo Nordisk Annual Report 2021 | 47 | |||||||
| Executive Management | |||||||||||||||||||||||||||||||||||||||||||||||
 |  |  |  |  |  | ||||||||||||||||||||||||||||||||||||||||||
Lars Fruergaard Jørgensen President and chief executive officer (CEO) Born November 1966. Male. Other positions and management duties: Member of the supervisory board and member of the nomination committee of Carlsberg A/S. First vice president of the European Federation of Pharmaceutical Industries and Associations (EFPIA). | Monique Carter Executive vice president People & Organisation Born December 1973. Female. Other positions and management duties: No other management positions. | Maziar Mike Doustdar1 Executive vice president International Operations Born August 1970. Male. Other positions and management duties: No other management positions. | Ludovic Helfgott1 Executive vice president Biopharm Born July 1974. Male. Other positions and management duties: President of the Novo Nordisk Haemophilia Foundation Council. | Karsten Munk Knudsen Executive vice president Chief financial officer (CFO) Born December 1971. Male. Other positions and management duties: Chair of the board of directors of NNE A/S. Member of the board of directors and chair of the audit committee of Hempel A/S. | Doug Langa1 Executive vice president North America Operations Born October 1966. Male. Other positions and management duties: No other management positions. | ||||||||||||||||||||||||||||||||||||||||||
 |  |  |  | ||||||||||||||||||||||||||||||||||||||||||||
Martin Holst Lange Executive vice president Development Born October 1970. Male. Other positions and management duties: No other management positions. | Marcus Schindler Executive vice president Research & Early Development and chief scientific officer (CSO) Born September 1966. Male. Other positions and management duties: Adjunct Professor of Pharmacology at the University of Gothenburg. | Camilla Sylvest Executive vice president Commercial Strategy & Corporate Affairs Born November 1972. Female. Other positions and management duties: Vice chair of the board of directors of the World Diabetes Foundation. Member of the board of directors of Danish Crown A/S. | Henrik Wulff Executive vice president Product Supply, Quality & IT Born November 1970. Male. Other positions and management duties: Member of the board of directors and the remuneration committee of Ambu A/S. Member of the board of directors of Grundfos Holding A/S. | ||||||||||||||||||||||||||||||||||||||||||||
| Novo Nordisk Annual Report 2021 | 48 | |||||||

| Novo Nordisk Annual Report 2021 | 49 | |||||||
| Consolidated financial statements | |||||||||||
| Income statement | p. | 50 | |||||||||
| Cash flow statement | p. | 51 | |||||||||
| Balance sheet | p. | 52 | |||||||||
| Equity statement | p. | 53 | |||||||||
| Notes to the consolidated financial statements | |||||||||||
| Section 1 | |||||||||||
| Basis of preparation | |||||||||||
| p. | 54 | ||||||||||
| 1.2 | Changes in accounting policies and disclosures | p. | 54 | ||||||||
| Section 2 | |||||||||||
| Results for the year | |||||||||||
| 2.1 | Net sales and rebates | p. | 55 | ||||||||
| 2.2 | Segment information | p. | 56 | ||||||||
| 2.3 | Research and development costs | p. | 58 | ||||||||
| 2.4 | Employee costs | p. | 58 | ||||||||
| 2.5 | Other operating income and expenses | p. | 59 | ||||||||
| 2.6 | Income taxes and deferred income taxes | p. | 59 | ||||||||
| 2.7 | Earnings per share | p. | 60 | ||||||||
| Section 3 | |||||||||||
| Operating assets and liabilities | |||||||||||
| 3.1 | Intangible assets and property, plant and equipment | p. | 61 | ||||||||
| 3.2 | Inventories | p. | 64 | ||||||||
| 3.3 | Trade receivables | p. | 65 | ||||||||
| 3.4 | Provisions and contingent liabilities | p. | 66 | ||||||||
| 3.5 | Other liabilities | p. | 67 | ||||||||
| Section 4 | |||||||||||
| Capital structure and financial items | |||||||||||
| 4.1 | Distribution to shareholders | p. | 68 | ||||||||
| 4.2 | Share capital, Treasury shares and Other reserves | p. | 68 | ||||||||
| 4.3 | Financial risks | p. | 69 | ||||||||
| 4.4 | Derivative financial instruments | p. | 71 | ||||||||
| 4.5 | Borrowings | p. | 72 | ||||||||
| 4.6 | Cash and cash equivalents | p. | 73 | ||||||||
| 4.7 | Other non-cash items | p. | 73 | ||||||||
| 4.8 | Change in working capital | p. | 73 | ||||||||
| 4.9 | Financial assets and liabilities | p. | 74 | ||||||||
| 4.10 | Financial income and expenses | p. | 75 | ||||||||
| Section 5 | |||||||||||
| Other disclosures | |||||||||||
| 5.1 | Share-based payment schemes | p. | 76 | ||||||||
| 5.2 | Commitments | p. | 78 | ||||||||
| 5.3 | Acquisition of businesses | p. | 78 | ||||||||
| 5.4 | Related party transactions | p. | 79 | ||||||||
| 5.5 | Fee to statutory auditors | p. | 80 | ||||||||
| 5.6 | General accounting policies | p. | 80 | ||||||||
| 5.7 | Companies in the Novo Nordisk Group | p. | 81 | ||||||||
| Financial definitions (part of Management's review – not audited) | p. | 82 | |||||||||
| Non-IFRS financial measures (part of Management's review – not audited) | p. | 83 | |||||||||
| Consolidated ESG statement | p. | 85 | |||||||||
| Notes to the consolidated ESG statement | |||||||||||
| Section 6 | |||||||||||
| Basis of preparation | p. | 86 | |||||||||
| Section 7 | |||||||||||
| Environmental performance | |||||||||||
| 7.1 | Energy consumption for operations and share of renewable power | p. | 87 | ||||||||
| 7.2 | Water consumption for production sites | p. | 87 | ||||||||
| 7.3 | Breaches of environmental regulatory limit values | p. | 87 | ||||||||
| 7.4 | CO2 emissions from operations and transportation | p. | 87 | ||||||||
| 7.5 | Waste from production sites | p. | 88 | ||||||||
| Section 8 | |||||||||||
| Social performance | |||||||||||
| 8.1 | Patients reached with Novo Nordisk's Diabetes care products | p. | 88 | ||||||||
| 8.2 | Employees | p. | 89 | ||||||||
| 8.3 | Sustainable employer score | p. | 89 | ||||||||
| 8.4 | Frequency of occupational accidents | p. | 89 | ||||||||
| 8.5 | Gender diversity | p. | 89 | ||||||||
| 8.6 | Total tax contribution | p. | 90 | ||||||||
| 8.7 | Donations and other contributions | p. | 90 | ||||||||
| Section 9 | |||||||||||
| Governance performance | |||||||||||
| 9.1 | Business ethics reviews and training | p. | 90 | ||||||||
| 9.2 | Supplier audits | p. | 90 | ||||||||
| 9.3 | Product recalls | p. | 91 | ||||||||
| 9.4 | Failed inspections | p. | 91 | ||||||||
| 9.5 | Facilitations of the Novo Nordisk Way | p. | 91 | ||||||||
| 9.6 | Company reputation | p. | 91 | ||||||||
| 9.7 | Animals purchased for research | p. | 91 | ||||||||
| Novo Nordisk Annual Report 2021 | 50 | |||||||
| DKK million | Note | 2021 | 2020 | 2019 | ||||||||||||||||
| Income statement | ||||||||||||||||||||
| Net sales | 2.1, 2.2 | |||||||||||||||||||
| Cost of goods sold | 2.2 | ( | ( | ( | ||||||||||||||||
| Gross profit | ||||||||||||||||||||
| Sales and distribution costs | 2.2 | ( | ( | ( | ||||||||||||||||
| Research and development costs | 2.2, 2.3 | ( | ( | ( | ||||||||||||||||
| Administrative costs | 2.2 | ( | ( | ( | ||||||||||||||||
| Other operating income and expenses | 2.2, 2.5 | |||||||||||||||||||
| Operating profit | ||||||||||||||||||||
| Financial income | 4.10 | |||||||||||||||||||
| Financial expenses | 4.10 | ( | ( | ( | ||||||||||||||||
| Profit before income taxes | ||||||||||||||||||||
| Income taxes | 2.6 | ( | ( | ( | ||||||||||||||||
| Net profit | ||||||||||||||||||||
| Earnings per share | ||||||||||||||||||||
| Basic earnings per share (DKK) | 2.7 | |||||||||||||||||||
| Diluted earnings per share (DKK) | 2.7 | |||||||||||||||||||
| DKK million | Note | 2021 | 2020 | 2019 | ||||||||||||||||
| Statement of comprehensive income | ||||||||||||||||||||
| Net profit | ||||||||||||||||||||
| Other comprehensive income: | ||||||||||||||||||||
| Items that will not be reclassified subsequently to the income statement: | ||||||||||||||||||||
| Remeasurements of retirement benefit obligations | ( | ( | ||||||||||||||||||
| Items that will be reclassified subsequently to the income statement: | ||||||||||||||||||||
| Exchange rate adjustments of investments in subsidiaries | ( | |||||||||||||||||||
| Cash flow hedges: | ||||||||||||||||||||
| Realisation of previously deferred (gains)/losses | 4.2, 4.4 | ( | ||||||||||||||||||
| Deferred gains/(losses) incurred during the period | 4.2, 4.4 | ( | ( | |||||||||||||||||
| Other items | ||||||||||||||||||||
| Tax on other comprehensive income, income/(expense) | 2.6 | ( | ( | |||||||||||||||||
| Other comprehensive income, net of tax | ( | ( | ||||||||||||||||||
| Total comprehensive income | ||||||||||||||||||||
| Novo Nordisk Annual Report 2021 | 51 | |||||||
| DKK million | Note | 2021 | 2020 | 2019 | ||||||||||||||||
| Cash flow statement | ||||||||||||||||||||
| Net profit | ||||||||||||||||||||
| Adjustment of non-cash items: | ||||||||||||||||||||
| Income taxes in the income statement | 2.6 | |||||||||||||||||||
| Depreciation, amortisation and impairment losses | 3.1 | |||||||||||||||||||
| Other non-cash items | 4.7 | |||||||||||||||||||
| Change in working capital | 4.8 | ( | ( | ( | ||||||||||||||||
| Interest received | ||||||||||||||||||||
| Interest paid | ( | ( | ( | |||||||||||||||||
| Income taxes paid | 2.6 | ( | ( | ( | ||||||||||||||||
| Net cash generated from operating activities | ||||||||||||||||||||
| Purchase of intangible assets | 3.1 | ( | ( | ( | ||||||||||||||||
| Proceeds from sale of property, plant and equipment | ||||||||||||||||||||
| Purchase of property, plant and equipment | 3.1 | ( | ( | ( | ||||||||||||||||
| Cash used for acquisition of businesses | 5.3 | ( | ||||||||||||||||||
| Proceeds from other financial assets | ||||||||||||||||||||
| Purchase of other financial assets | ( | ( | ||||||||||||||||||
| Purchase of marketable securities | ( | |||||||||||||||||||
| Sale of marketable securities | ||||||||||||||||||||
| Investment in associated companies | 5.4 | ( | ( | |||||||||||||||||
| Proceeds from the divestment of Group and associated companies | ( | |||||||||||||||||||
| Dividend received from associated companies | 5.4 | |||||||||||||||||||
| Net cash used in investing activities | ( | ( | ( | |||||||||||||||||
| DKK million | Note | 2021 | 2020 | 2019 | ||||||||||||||||
| Purchase of treasury shares | 4.2 | ( | ( | ( | ||||||||||||||||
| Dividends paid | 4.1 | ( | ( | ( | ||||||||||||||||
| Proceeds from borrowings | 4.5 | |||||||||||||||||||
| Repayment of borrowings | 4.5 | ( | ( | ( | ||||||||||||||||
| Net cash used in financing activities | ( | ( | ( | |||||||||||||||||
| Net cash generated from activities | ( | ( | ( | |||||||||||||||||
| Cash and cash equivalents at the beginning of the year | ||||||||||||||||||||
| Exchange gains/(losses) on cash and cash equivalents | ( | ( | ||||||||||||||||||
| Cash and cash equivalents at the end of the year | 4.6 | |||||||||||||||||||
| Novo Nordisk Annual Report 2021 | 52 | |||||||
| DKK million | Note | 2021 | 2020 | ||||||||||||||
| Assets | |||||||||||||||||
| Intangible assets | 3.1 | ||||||||||||||||
| Property, plant and equipment | 3.1 | ||||||||||||||||
| Investments in associated companies | |||||||||||||||||
| Deferred income tax assets | 2.6 | ||||||||||||||||
| Other receivables and prepayments | |||||||||||||||||
| Other financial assets | |||||||||||||||||
| Total non-current assets | |||||||||||||||||
| Inventories | 3.2 | ||||||||||||||||
| Trade receivables | 3.3 | ||||||||||||||||
| Tax receivables | |||||||||||||||||
| Other receivables and prepayments | |||||||||||||||||
| Marketable securities | 4.3 | ||||||||||||||||
| Derivative financial instruments | 4.4 | ||||||||||||||||
| Cash at bank | 4.6 | ||||||||||||||||
| Total current assets | |||||||||||||||||
| Total assets | |||||||||||||||||
| DKK million | Note | 2021 | 2020 | ||||||||||||||
| Equity and liabilities | |||||||||||||||||
| Share capital | 4.2 | ||||||||||||||||
| Treasury shares | 4.2 | ( | ( | ||||||||||||||
| Retained earnings | |||||||||||||||||
| Other reserves | 4.2 | ( | ( | ||||||||||||||
| Total equity | |||||||||||||||||
| Borrowings | 4.5 | ||||||||||||||||
| Deferred income tax liabilities | 2.6 | ||||||||||||||||
| Retirement benefit obligations | |||||||||||||||||
| Other liabilities | 3.5 | ||||||||||||||||
| Provisions | 3.4 | ||||||||||||||||
| Total non-current liabilities | |||||||||||||||||
| Borrowings | 4.5 | ||||||||||||||||
| Trade payables | |||||||||||||||||
| Tax payables | |||||||||||||||||
| Other liabilities | 3.5 | ||||||||||||||||
| Derivative financial instruments | 4.4 | ||||||||||||||||
| Provisions | 3.4 | ||||||||||||||||
| Total current liabilities | |||||||||||||||||
| Total liabilities | |||||||||||||||||
| Total equity and liabilities | |||||||||||||||||
| Novo Nordisk Annual Report 2021 | 53 | |||||||
| 2021 | 2020 | 2019 | ||||||||||||||||||||||||||||||||||||||||||||||||||||||||||||
| DKK million | Share capital | Treasury shares | Retained earnings | Other reserves | Total | Share capital | Treasury shares | Retained earnings | Other reserves | Total | Share capital | Treasury shares | Retained earnings | Other reserves | Total | |||||||||||||||||||||||||||||||||||||||||||||||
| Balance at the beginning of the year | ( | ( | ( | ( | ( | ( | ||||||||||||||||||||||||||||||||||||||||||||||||||||||||
| Net profit | ||||||||||||||||||||||||||||||||||||||||||||||||||||||||||||||
| Other comprehensive income | ( | ( | ( | ( | ( | ( | ||||||||||||||||||||||||||||||||||||||||||||||||||||||||
| Total comprehensive income | ( | ( | ||||||||||||||||||||||||||||||||||||||||||||||||||||||||||||
Transfer of cash flow hedge reserve to intangible assets (note 4.2) | ||||||||||||||||||||||||||||||||||||||||||||||||||||||||||||||
| Transactions with owners: | ||||||||||||||||||||||||||||||||||||||||||||||||||||||||||||||
Dividends (note 4.1) | ( | ( | ( | ( | ( | ( | ||||||||||||||||||||||||||||||||||||||||||||||||||||||||
Share-based payments (note 5.1) | ||||||||||||||||||||||||||||||||||||||||||||||||||||||||||||||
| Tax related to restricted stock units | ||||||||||||||||||||||||||||||||||||||||||||||||||||||||||||||
Purchase of treasury shares (note 4.2) | ( | ( | ( | ( | ( | ( | ( | ( | ( | |||||||||||||||||||||||||||||||||||||||||||||||||||||
Reduction of the B share capital (note 4.2) | ( | ( | ( | |||||||||||||||||||||||||||||||||||||||||||||||||||||||||||
| Balance at the end of the year | ( | ( | ( | ( | ( | ( | ||||||||||||||||||||||||||||||||||||||||||||||||||||||||
| Novo Nordisk Annual Report 2021 | 54 | |||||||
| Principal accounting policies | Key accounting estimates and judgements | Estimation risk | Note | ||||||||||||||
| US net sales and rebates | Estimate of US sales deductions and provisions for sales rebates | High | 2.1 | ||||||||||||||
| Intangible assets from acquisition of businesses | Estimate in determining the fair value of intangible assets when acquiring assets in a business combination | High | 5.3 | ||||||||||||||
| Income taxes and deferred income taxes | Estimate regarding deferred income tax assets and provision for uncertain tax positions | Medium | 2.6 | ||||||||||||||
| Provisions and contingent liabilities | Estimate of ongoing legal disputes, litigation and investigations | Medium | 3.4 | ||||||||||||||
| Intangible assets | Estimate regarding impairment of assets and judgement of whether a transaction is an asset acquisition or a business combination | Low | 3.1 | ||||||||||||||
| Inventories | Estimate of indirect production costs capitalised and inventory write-down | Low | 3.2 | ||||||||||||||
| Novo Nordisk Annual Report 2021 | 55 | |||||||
| Gross-to-net sales reconciliation | |||||||||||||||||
| DKK million | 2021 | 2020 | 2019 | ||||||||||||||
| Gross sales | |||||||||||||||||
| US Managed Care and Medicare | ( | ( | ( | ||||||||||||||
| US wholesaler charge-backs | ( | ( | ( | ||||||||||||||
| US Medicaid rebates | ( | ( | ( | ||||||||||||||
| Other US discounts and sales returns | ( | ( | ( | ||||||||||||||
| Non-US rebates, discounts and sales returns | ( | ( | ( | ||||||||||||||
| Total gross-to-net sales adjustments | ( | ( | ( | ||||||||||||||
| Net sales | |||||||||||||||||
| Provisions for sales rebates | |||||||||||||||||
| DKK million | 2021 | 2020 | 2019 | ||||||||||||||
| At the beginning of the year | |||||||||||||||||
| Additional provisions, including increases to existing provisions | |||||||||||||||||
| Amount paid during the year | ( | ( | ( | ||||||||||||||
| Adjustments, including unused amounts reversed during the year | ( | ||||||||||||||||
| Effect of exchange rate adjustment | ( | ||||||||||||||||
| At the end of the year | |||||||||||||||||
| Novo Nordisk Annual Report 2021 | 56 | |||||||
| Business segments – Key figures | |||||||||||||||||||||||||||||||||||||||||||||||
| Diabetes and Obesity care | Biopharm | Total | |||||||||||||||||||||||||||||||||||||||||||||
| DKK million | 2021 | 2020 | 2019 | 2021 | 2020 | 2019 | 2021 | 2020 | 2019 | ||||||||||||||||||||||||||||||||||||||
| Total net sales | |||||||||||||||||||||||||||||||||||||||||||||||
| Cost of goods sold | ( | ( | ( | ( | ( | ( | ( | ( | ( | ||||||||||||||||||||||||||||||||||||||
| Sales and distribution costs | ( | ( | ( | ( | ( | ( | ( | ( | ( | ||||||||||||||||||||||||||||||||||||||
| Research and development costs | ( | ( | ( | ( | ( | ( | ( | ( | ( | ||||||||||||||||||||||||||||||||||||||
| Administrative costs | ( | ( | ( | ( | ( | ( | ( | ( | ( | ||||||||||||||||||||||||||||||||||||||
| Other operating income and expenses | |||||||||||||||||||||||||||||||||||||||||||||||
| Operating profit | |||||||||||||||||||||||||||||||||||||||||||||||
| Operating margin | % | % | % | % | % | % | % | % | % | ||||||||||||||||||||||||||||||||||||||
| Depreciation, amortisation and impairment losses expensed | ( | ( | ( | ( | ( | ( | ( | ( | ( | ||||||||||||||||||||||||||||||||||||||
| Novo Nordisk Annual Report 2021 | 57 | |||||||
| Net sales – Business segments and geographical areas | |||||||||||||||||||||||||||||||||||||||||||||||||||||||||||||||||
| Total International Operations | Total North America Operations | Total Novo Nordisk net sales | |||||||||||||||||||||||||||||||||||||||||||||||||||||||||||||||
| Total IO | EMEA | China | Rest of World | Total NAO | Of which the US | ||||||||||||||||||||||||||||||||||||||||||||||||||||||||||||
| DKK million | 2021 | 2020 | 2019 | 2021 | 2020 | 2019 | 2021 | 2020 | 2019 | 2021 | 2020 | 2019 | 2021 | 2020 | 2019 | 2021 | 2020 | 2019 | 2021 | 2020 | 2019 | ||||||||||||||||||||||||||||||||||||||||||||
| Diabetes and Obesity care segment: | |||||||||||||||||||||||||||||||||||||||||||||||||||||||||||||||||
Rybelsus® | |||||||||||||||||||||||||||||||||||||||||||||||||||||||||||||||||
Ozempic® | |||||||||||||||||||||||||||||||||||||||||||||||||||||||||||||||||
Victoza® | |||||||||||||||||||||||||||||||||||||||||||||||||||||||||||||||||
| Total GLP-1 | |||||||||||||||||||||||||||||||||||||||||||||||||||||||||||||||||
| Long-acting insulin | |||||||||||||||||||||||||||||||||||||||||||||||||||||||||||||||||
– of which Tresiba® | |||||||||||||||||||||||||||||||||||||||||||||||||||||||||||||||||
– of which Xultophy® | |||||||||||||||||||||||||||||||||||||||||||||||||||||||||||||||||
– of which Levemir® | |||||||||||||||||||||||||||||||||||||||||||||||||||||||||||||||||
| Premix insulin | |||||||||||||||||||||||||||||||||||||||||||||||||||||||||||||||||
– of which Ryzodeg® | |||||||||||||||||||||||||||||||||||||||||||||||||||||||||||||||||
– of which NovoMix® | |||||||||||||||||||||||||||||||||||||||||||||||||||||||||||||||||
| Fast-acting insulin | |||||||||||||||||||||||||||||||||||||||||||||||||||||||||||||||||
– of which Fiasp® | |||||||||||||||||||||||||||||||||||||||||||||||||||||||||||||||||
– of which NovoRapid® | |||||||||||||||||||||||||||||||||||||||||||||||||||||||||||||||||
| Human insulin | |||||||||||||||||||||||||||||||||||||||||||||||||||||||||||||||||
| Total insulin | |||||||||||||||||||||||||||||||||||||||||||||||||||||||||||||||||
| Other Diabetes care | |||||||||||||||||||||||||||||||||||||||||||||||||||||||||||||||||
| Total Diabetes care | |||||||||||||||||||||||||||||||||||||||||||||||||||||||||||||||||
Obesity care (Saxenda® and Wegovy®) | |||||||||||||||||||||||||||||||||||||||||||||||||||||||||||||||||
| Diabetes and Obesity care total | |||||||||||||||||||||||||||||||||||||||||||||||||||||||||||||||||
| Biopharm segment: | |||||||||||||||||||||||||||||||||||||||||||||||||||||||||||||||||
| Rare blood disorders | |||||||||||||||||||||||||||||||||||||||||||||||||||||||||||||||||
| – of which Haemophilia A | |||||||||||||||||||||||||||||||||||||||||||||||||||||||||||||||||
| – of which Haemophilia B | |||||||||||||||||||||||||||||||||||||||||||||||||||||||||||||||||
– of which NovoSeven® | |||||||||||||||||||||||||||||||||||||||||||||||||||||||||||||||||
| Rare endocrine disorders | |||||||||||||||||||||||||||||||||||||||||||||||||||||||||||||||||
| Other Biopharm | |||||||||||||||||||||||||||||||||||||||||||||||||||||||||||||||||
| Biopharm total | |||||||||||||||||||||||||||||||||||||||||||||||||||||||||||||||||
| Total sales by geographical area | |||||||||||||||||||||||||||||||||||||||||||||||||||||||||||||||||
| Total sales growth as reported | % | % | % | % | % | % | % | % | % | % | % | % | % | % | % | % | % | % | % | % | % | ||||||||||||||||||||||||||||||||||||||||||||
| Novo Nordisk Annual Report 2021 | 58 | |||||||
| DKK million | 2021 | 2020 | 2019 | ||||||||||||||
Employee costs (note 2.4) | |||||||||||||||||
Amortisation and impairment losses, intangible assets (note 3.1) | |||||||||||||||||
Depreciation and impairment losses, property, plant and equipment (note 3.1) | |||||||||||||||||
| Other research and development costs | |||||||||||||||||
| Total research and development costs | |||||||||||||||||
| As percentage of net sales | % | % | % | ||||||||||||||
| DKK million | 2021 | 2020 | 2019 | |||||||||||
| Wages and salaries | ||||||||||||||
Share-based payment costs (note 5.1) | ||||||||||||||
| Pensions – defined contribution plans | ||||||||||||||
Pensions – defined benefit plans (note N/A) | ||||||||||||||
| Other social security contributions | ||||||||||||||
| Other employee costs | ||||||||||||||
| Total employee costs for the year | ||||||||||||||
| Employee costs capitalised as intangible assets and property, plant and equipment | ( | ( | ( | |||||||||||
| Change in employee costs capitalised as inventories | ( | ( | ( | |||||||||||
| Total employee costs in the income statement | ||||||||||||||
| Included in the income statement: | ||||||||||||||
| Cost of goods sold | ||||||||||||||
| Sales and distribution costs | ||||||||||||||
| Research and development costs | ||||||||||||||
| Administrative costs | ||||||||||||||
| Other operating income and expenses | ||||||||||||||
| Total employee costs in the income statement | ||||||||||||||
| Number of employees | 2021 | 2020 | 2019 | ||||||||||||||
| Average number of full-time employees | |||||||||||||||||
| Year-end number of full-time employees | |||||||||||||||||
| Employees (total) | |||||||||||||||||
| Novo Nordisk Annual Report 2021 | 59 | |||||||
| Remuneration to Executive Management and Board of Directors | |||||||||||||||||
| DKK million | 2021 | 2020 | 2019 | ||||||||||||||
| Salary and short-term incentive | |||||||||||||||||
| Pension | |||||||||||||||||
| Benefits | |||||||||||||||||
Long-term incentive1 | |||||||||||||||||
| Severance payments | |||||||||||||||||
Executive Management in total2 | |||||||||||||||||
Fee to Board of Directors2 | |||||||||||||||||
| Total | |||||||||||||||||
1. Please refer to note 5.1 for further information. 2. Total remuneration for registered members of Executive Management amounts to DKK | |||||||||||||||||
| Income taxes expensed | |||||||||||||||||
| DKK million | 2021 | 2020 | 2019 | ||||||||||||||
| Current tax on profit for the year | |||||||||||||||||
| Deferred tax on profit for the year | ( | ( | |||||||||||||||
| Tax on profit for the year | |||||||||||||||||
| Current tax adjustments recognised for prior years | ( | ( | ( | ||||||||||||||
| Deferred tax adjustments recognised for prior years | ( | ( | |||||||||||||||
| Income taxes in the income statement | |||||||||||||||||
| Tax on other comprehensive income for the year, (income)/expense | ( | ||||||||||||||||
| Computation of effective tax rate | |||||||||||||||||
| DKK million | 2021 | 2020 | 2019 | ||||||||||||||
| Statutory corporate income tax rate in Denmark | % | % | % | ||||||||||||||
| Deviation in foreign subsidiaries' tax rates compared to the Danish tax rate (net) | ( | %) | ( | %) | ( | %) | |||||||||||
| Non-taxable income less non-tax-deductible expenses (net) | ( | %) | ( | %) | % | ||||||||||||
| Other adjustments (net) | ( | %) | % | ( | %) | ||||||||||||
| Effective tax rate | % | % | % | ||||||||||||||
| Income taxes paid | |||||||||||||||||
| DKK million | 2021 | 2020 | 2019 | ||||||||||||||
| Income taxes paid in Denmark for current year | |||||||||||||||||
| Income taxes paid outside Denmark for current year | |||||||||||||||||
| Income taxes paid/repayments relating to prior years | |||||||||||||||||
| Income taxes paid | |||||||||||||||||
| Novo Nordisk Annual Report 2021 | 60 | |||||||
| Development in deferred income tax assets and liabilities | |||||||||||||||||||||||||||||
| DKK million | Property, plant and equipment | Intangible assets | Inventories | Liabilities | Other | Offset within countries | Total | ||||||||||||||||||||||
| 2021 | |||||||||||||||||||||||||||||
| Net deferred tax asset/(liability) at 1 January | ( | ( | |||||||||||||||||||||||||||
| Income/(charge) to the income statement | ( | ( | |||||||||||||||||||||||||||
| Income/(charge) to other comprehensive income | ( | ||||||||||||||||||||||||||||
| Income/(charge) to equity | ( | ||||||||||||||||||||||||||||
| Additions from acquisitions | ( | ( | |||||||||||||||||||||||||||
| Effect of exchange rate adjustment | ( | ||||||||||||||||||||||||||||
| Net deferred tax asset/(liability) at 31 December | ( | ( | |||||||||||||||||||||||||||
| Classified as follows: | |||||||||||||||||||||||||||||
| Deferred tax asset at 31 December | ( | ||||||||||||||||||||||||||||
| Deferred tax liability at 31 December | ( | ( | ( | ( | ( | ( | |||||||||||||||||||||||
| 2020 | |||||||||||||||||||||||||||||
| Net deferred tax asset/(liability) at 1 January | ( | ( | |||||||||||||||||||||||||||
| Income/(charge) to the income statement | ( | ( | |||||||||||||||||||||||||||
| Income/(charge) to other comprehensive income | ( | ( | ( | ||||||||||||||||||||||||||
| Income/(charge) to equity | ( | ( | |||||||||||||||||||||||||||
| Additions from acquisitions | |||||||||||||||||||||||||||||
| Effect of exchange rate adjustment | ( | ( | ( | ( | |||||||||||||||||||||||||
| Net deferred tax asset/(liability) at 31 December | ( | ( | |||||||||||||||||||||||||||
| Classified as follows: | |||||||||||||||||||||||||||||
| Deferred tax asset at 31 December | ( | ||||||||||||||||||||||||||||
| Deferred tax liability at 31 December | ( | ( | ( | ( | ( | ( | |||||||||||||||||||||||
| 2021 | 2020 | 2019 | ||||||||||||||||||
| Net profit | ||||||||||||||||||||
| Average number of shares outstanding | in million shares | |||||||||||||||||||
Dilutive effect of average outstanding share pool1,2 | in million shares | |||||||||||||||||||
| Average number of shares outstanding, including dilutive effect of outstanding share pool | in million shares | |||||||||||||||||||
| Basic earnings per share | DKK | |||||||||||||||||||
| Diluted earnings per share | DKK | |||||||||||||||||||
1. For further information on the development in treasury shares, please refer to note 4.2 2. For further information on the outstanding share pool, please refer to note 5.1. | ||||||||||||||||||||
| Novo Nordisk Annual Report 2021 | 61 | |||||||
| DKK million | Goodwill | Intellec-tual property rights | Software and other intangibles | Total intangible assets | Land and buildings | Plant and machinery | Other equipment | Assets under construction | Property, plant and equipment | |||||||||||||||||||||||||||||
| 2021 | ||||||||||||||||||||||||||||||||||||||
| Cost at the beginning of the year | ||||||||||||||||||||||||||||||||||||||
| Additions from acquisition of businesses (note 5.3) | ||||||||||||||||||||||||||||||||||||||
| Additions during the year | ||||||||||||||||||||||||||||||||||||||
| Disposals during the year | ( | ( | ( | ( | ( | ( | ( | |||||||||||||||||||||||||||||||
| Transfer and reclassifications | ( | |||||||||||||||||||||||||||||||||||||
| Effect of exchange rate adjustment | ||||||||||||||||||||||||||||||||||||||
| Cost at the end of the year | ||||||||||||||||||||||||||||||||||||||
| Amortisation/depreciation and impairment losses at the beginning of the year | ||||||||||||||||||||||||||||||||||||||
| Amortisation/depreciation for the year | — | |||||||||||||||||||||||||||||||||||||
| Impairment losses for the year | ||||||||||||||||||||||||||||||||||||||
| Amortisation/depreciation and impairment losses reversed on disposals during the year | ( | ( | ( | ( | ( | ( | ( | |||||||||||||||||||||||||||||||
| Effect of exchange rate adjustment | ||||||||||||||||||||||||||||||||||||||
| Amortisation/depreciation and impairment losses at the end of the year | ||||||||||||||||||||||||||||||||||||||
| Carrying amount at the end of the year | ||||||||||||||||||||||||||||||||||||||
| 2020 | ||||||||||||||||||||||||||||||||||||||
| Cost at the beginning of the year | ||||||||||||||||||||||||||||||||||||||
| Additions during the year | ||||||||||||||||||||||||||||||||||||||
| Disposals during the year | ( | ( | ( | ( | ( | ( | ( | |||||||||||||||||||||||||||||||
| Transfer and reclassifications | ( | |||||||||||||||||||||||||||||||||||||
| Effect of exchange rate adjustment | ( | ( | ( | ( | ( | ( | ( | ( | ||||||||||||||||||||||||||||||
| Cost at the end of the year | ||||||||||||||||||||||||||||||||||||||
| Amortisation/depreciation and impairment losses at the beginning of the year | ||||||||||||||||||||||||||||||||||||||
| Amortisation/depreciation for the year | — | |||||||||||||||||||||||||||||||||||||
| Impairment losses for the year | ||||||||||||||||||||||||||||||||||||||
| Amortisation/depreciation and impairment losses reversed on disposals during the year | ( | ( | ( | ( | ( | ( | ( | |||||||||||||||||||||||||||||||
| Effect of exchange rate adjustment | ( | ( | ( | ( | ( | ( | ( | |||||||||||||||||||||||||||||||
| Amortisation/depreciation and impairment losses at the end of the year | ||||||||||||||||||||||||||||||||||||||
| Carrying amount at the end of the year | ||||||||||||||||||||||||||||||||||||||
| Novo Nordisk Annual Report 2021 | 62 | |||||||
| Amortisation and impairment losses | |||||||||||||||||
| DKK million | 2021 | 2020 | 2019 | ||||||||||||||
| Cost of goods sold | |||||||||||||||||
| Sales and distribution costs | |||||||||||||||||
| Research and development costs | |||||||||||||||||
| Administrative costs | |||||||||||||||||
| Other operating income and expenses | |||||||||||||||||
| Total amortisation and impairment loss | |||||||||||||||||
| Total amortisation | |||||||||||||||||
| Total impairment losses | |||||||||||||||||
| Novo Nordisk Annual Report 2021 | 63 | |||||||
| Depreciation and impairment losses | |||||||||||||||||
| DKK million | 2021 | 2020 | 2019 | ||||||||||||||
| Cost of goods sold | |||||||||||||||||
| Sales and distribution costs | |||||||||||||||||
| Research and development costs | |||||||||||||||||
| Administrative costs | |||||||||||||||||
| Other operating income and expenses | |||||||||||||||||
| Total depreciation and impairment losses | |||||||||||||||||
| Of which related to leased assets | |||||||||||||||||
| Leased property, plant and equipment | ||||||||||||||
| DKK million | 2021 | 2020 | ||||||||||||
| Land and buildings | ||||||||||||||
| Other equipment | ||||||||||||||
| Total | ||||||||||||||
| Novo Nordisk Annual Report 2021 | 64 | |||||||
| DKK million | 2021 | 2020 | ||||||||||||
| Raw materials | ||||||||||||||
| Work in progress | ||||||||||||||
| Finished goods | ||||||||||||||
| Total inventories (gross) | ||||||||||||||
| Write-downs at year-end | ( | ( | ||||||||||||
| Total inventories (net) | ||||||||||||||
| Indirect production costs included in work in progress and finished goods | ||||||||||||||
| Share of total inventories (net) | % | % | ||||||||||||
| Movements in inventory write-downs: | ||||||||||||||
| Write-downs at the beginning of the year | ||||||||||||||
| Write-downs during the year | ||||||||||||||
| Utilisation of write-downs | ( | ( | ||||||||||||
| Reversal of write-downs | ( | ( | ||||||||||||
| Write-downs at the end of the year | ||||||||||||||
| Novo Nordisk Annual Report 2021 | 65 | |||||||
| DKK million | Gross carrying amount | Loss allowance | Net carrying amount | ||||||||||||||
| 2021 | |||||||||||||||||
| Not yet due | ( | ||||||||||||||||
| 1-90 days | ( | ||||||||||||||||
| 91-180 days | ( | ||||||||||||||||
| 181-270 days | ( | ||||||||||||||||
| 271-360 days | ( | ||||||||||||||||
| More than 360 days past due | ( | ||||||||||||||||
| Trade receivables | ( | ||||||||||||||||
| EMEA | ( | ||||||||||||||||
| China | |||||||||||||||||
| Rest of World | ( | ||||||||||||||||
| North America Operations | ( | ||||||||||||||||
| Trade receivables | ( | ||||||||||||||||
| 2020 | |||||||||||||||||
| Not yet due | ( | ||||||||||||||||
| 1-90 days | ( | ||||||||||||||||
| 91-180 days | ( | ||||||||||||||||
| 181-270 days | ( | ||||||||||||||||
| 271-360 days | ( | ||||||||||||||||
| More than 360 days past due | ( | ||||||||||||||||
| Trade receivables | ( | ||||||||||||||||
| EMEA | ( | ||||||||||||||||
| China | |||||||||||||||||
| Rest of World | ( | ||||||||||||||||
| North America Operations | ( | ||||||||||||||||
| Trade receivables | ( | ||||||||||||||||
| DKK million | 2021 | 2020 | ||||||||||||
| Carrying amount at the beginning of the year | ||||||||||||||
| Reversal of allowance on realised losses | ( | ( | ||||||||||||
| Net movement recognised in income statement | ||||||||||||||
| Effect of exchange rate adjustment | ( | |||||||||||||
| Allowance at the end of the year | ||||||||||||||
| Novo Nordisk Annual Report 2021 | 66 | |||||||
| DKK million | Provisions for sales rebates1 | Provisions for legal disputes | Provisions for product returns | Other provi- sions2 | 2021 Total | 2020 Total | ||||||||||||||||||||
| At the beginning of the year | ||||||||||||||||||||||||||
| Additional provisions, including increases to existing provisions | ||||||||||||||||||||||||||
| Amount used during the year | ( | ( | ( | ( | ( | ( | ||||||||||||||||||||
| Adjustments, including unused amounts reversed during the year | ( | ( | ( | ( | ||||||||||||||||||||||
| Effect of exchange rate adjustment | ( | |||||||||||||||||||||||||
| At the end of the year | ||||||||||||||||||||||||||
Non-current liabilities3 | ||||||||||||||||||||||||||
| Current liabilities | ||||||||||||||||||||||||||
1. Provisions for sales rebates are related to US Managed Care, Medicare, Medicaid and other US rebate types, as well as rebates in a number of European countries and Canada. 2. Other provisions consists of various types of provision, including obligations in relation to employee benefits such as jubilee benefits, company-owned life insurance, etc. 3. For non-current liabilities, provision for sales rebates is expected to be settled after one year, provisions for product returns will be utilised in 2023 and 2024. In the case of provisions for legal disputes, the timing of settlement cannot be determined. | ||||||||||||||||||||||||||
| Novo Nordisk Annual Report 2021 | 67 | |||||||
| Novo Nordisk Annual Report 2021 | 68 | |||||||
| DKK million | 2021 | 2020 | 2019 | |||||||||||
| Interim dividend for the year | ||||||||||||||
| Dividend for prior year | ||||||||||||||
| Share repurchases for the year | ||||||||||||||
| Total | ||||||||||||||
| Development in number of shares | |||||||||||
Million shares | A shares | B shares | Total | ||||||||
| Shares beginning of 2020 | |||||||||||
| Shares cancelled in 2020 | ( | ( | |||||||||
| Outstanding shares end of 2020 | |||||||||||
| Shares cancelled in 2021 | ( | ( | |||||||||
| Outstanding shares end of 2021 | |||||||||||
| Treasury shares | 2021 | 2020 | ||||||||||||||||||
| Market value, DKK million | Treasury shares in % | Number of B shares (million) | Number of B shares (million) | |||||||||||||||||
| Holding at the be-ginning of the year | % | |||||||||||||||||||
| Cancellation of treasury shares | ( | ( | ( | |||||||||||||||||
| Transfer regarding restricted stock units | ( | ( | ( | |||||||||||||||||
| Purchase during the year | ||||||||||||||||||||
| Value adjustment | ||||||||||||||||||||
| Holding at the end of the year | % | |||||||||||||||||||
| Specification of Other reserves | |||||||||||||||||
| DKK million | Exchange rate ad- justments | Cash flow hedges | Tax and other items | Total | |||||||||||||
| 2019 | |||||||||||||||||
| Reserve at the beginning of the year | ( | ( | ( | ||||||||||||||
| Other comprehensive income, net | ( | ||||||||||||||||
| Reserve at the end of the year | ( | ( | ( | ||||||||||||||
| 2020 | |||||||||||||||||
| Other comprehensive income, net | ( | ( | ( | ||||||||||||||
Transferred to intangible assets1 | — | ( | |||||||||||||||
| Reserve at the end of the year | ( | ( | ( | ||||||||||||||
| 2021 | |||||||||||||||||
| Other comprehensive income, net | ( | ( | |||||||||||||||
Transferred to intangible assets1 | — | ( | |||||||||||||||
| Reserve at the end of the year | ( | ( | ( | ||||||||||||||
1.For information on transfer of cash flow hedge reserve to intangible assets refer to note 4.4. | |||||||||||||||||
| Novo Nordisk Annual Report 2021 | 69 | |||||||
| Type | Financial risk | ||||
| Foreign exchange risk | High | ||||
| Credit risk | Low | ||||
| Liquidity risk | Low | ||||
| Interest rate risk | Low | ||||
| Key currencies figures | |||||||||||||||||
| USD | CNY | JPY | CAD | GBP | |||||||||||||
| Average exchange rate applied (DKK per 100) | |||||||||||||||||
| 2021 | |||||||||||||||||
| 2020 | |||||||||||||||||
| 2019 | |||||||||||||||||
| Year-end exchange rate applied (DKK per 100) | |||||||||||||||||
| 2021 | |||||||||||||||||
| 2020 | |||||||||||||||||
| 2019 | |||||||||||||||||
Sensitivity on operating profit of an immediate 5% increase in key currencies1 | |||||||||||||||||
| DKK million | USD | CNY | JPY | CAD | GBP | ||||||||||||
| 2022 | |||||||||||||||||
| 2021 | |||||||||||||||||
1. An immediate | |||||||||||||||||
Sensitivity of an immediate 5% increase in all other currencies rates on 31 December versus DKK and EUR,1 | |||||||||||
| DKK million | 2021 | 2020 | |||||||||
| Sensitivity of all currencies | |||||||||||
| Income statement | |||||||||||
| Other comprehensive income | ( | ( | |||||||||
| Total | ( | ( | |||||||||
| Sensitivity of USD | |||||||||||
| Income statement | ( | ||||||||||
| Other comprehensive income | ( | ( | |||||||||
| Total | ( | ( | |||||||||
1. An immediate | |||||||||||
| Financial contracts coverage at year end | |||||||||||||||||
| Months | USD | CNY1 | JPY | CAD | GBP | ||||||||||||
| 2021 | |||||||||||||||||
| 2020 | |||||||||||||||||
| 1. Chinese yuan traded offshore (CNH) is used to hedge Novo Nordisk's CNY currency exposure. | |||||||||||||||||
| Novo Nordisk Annual Report 2021 | 70 | |||||||
| Credit exposure for cash at bank, marketable securities and derivative financial instruments (fair value) | |||||||||||||||||||||||
| DKK million | Cash at bank | Marketable securities | Derivative financial instruments | Total | |||||||||||||||||||
| 2021 | |||||||||||||||||||||||
| AAA range | |||||||||||||||||||||||
| AA range | |||||||||||||||||||||||
| A range | |||||||||||||||||||||||
| BBB range | |||||||||||||||||||||||
| Not rated or below BBB range | |||||||||||||||||||||||
| Total | |||||||||||||||||||||||
| 2020 | |||||||||||||||||||||||
| AAA range | |||||||||||||||||||||||
| AA range | |||||||||||||||||||||||
| A range | |||||||||||||||||||||||
| BBB range | |||||||||||||||||||||||
| Not rated or below BBB range | |||||||||||||||||||||||
| Total | |||||||||||||||||||||||
| DKK million | 2021 | 2020 | 2019 | ||||||||||||||
| US | |||||||||||||||||
| Japan | |||||||||||||||||
| Financial reserves | |||||||||||||||||
| DKK million | 2021 | 2020 | 2019 | ||||||||||||||
Cash and cash equivalents (note 4.6) | |||||||||||||||||
| Marketable securities | |||||||||||||||||
Undrawn committed credit facility1 | |||||||||||||||||
Undrawn bridge facility2 | |||||||||||||||||
Borrowings (Note 4.5) | ( | ( | ( | ||||||||||||||
Financial reserves3 | |||||||||||||||||
1. The undrawn committed credit facility comprises a EUR 2. For 2020, the undrawn bridge facility comprises the EUR 3. Additional non-IFRS financial measure; please refer to 'Non-IFRS financial measures', which is not part of the audited financial statements. | |||||||||||||||||
| Novo Nordisk Annual Report 2021 | 71 | |||||||
| Derivative financial instruments | 2021 | 2020 | |||||||||||||||||||||
| DKK million | Contract amount at year-end | Positive fair value at year-end | Negative fair value at year-end | Contract amount at year-end | Positive fair value at year-end | Negative fair value at year-end | |||||||||||||||||
Forward contracts USD1 | |||||||||||||||||||||||
| Forward contracts CNH, JPY, GBP and CAD | |||||||||||||||||||||||
| Forward contracts, cash flow hedges | |||||||||||||||||||||||
Forward contracts USD2 | |||||||||||||||||||||||
| Forward contracts CNH, CAD, EUR, GBP and JPY | |||||||||||||||||||||||
| Forward contracts, fair value hedges | |||||||||||||||||||||||
| Total derivative financial instruments | |||||||||||||||||||||||
| Recognised in the income statement | |||||||||||||||||||||||
| Recognised in other comprehensive income | |||||||||||||||||||||||
1. Average hedge rate for USD cash flow hedges is 2. Average hedge rate for USD fair value hedges is 628 at the end of 2021 and 634 at the end of 2020. | |||||||||||||||||||||||
| Novo Nordisk Annual Report 2021 | 72 | |||||||
| Contractual undiscounted cash flows | 2021 | 2020 | |||||||||||||||||||||||||||
| DKK million | Leases | Issued bonds | Loans | Bank overdrafts1 | Total | Leases | Loans | Bank overdrafts1 | Total | ||||||||||||||||||||
| Within 1 year | |||||||||||||||||||||||||||||
| 1-3 years | |||||||||||||||||||||||||||||
| 3-5 years | |||||||||||||||||||||||||||||
| More than 5 years | |||||||||||||||||||||||||||||
| Total contractual undiscounted cash flows at the end of the year | |||||||||||||||||||||||||||||
| Contractual discounted cash flows included in the balance sheet at the end of the year | |||||||||||||||||||||||||||||
| Non-current liabilities | |||||||||||||||||||||||||||||
| Current liabilities | |||||||||||||||||||||||||||||
| Reconciliation of liabilities arising from financing activities | Non-cash movements | ||||||||||||||||||||||||||||||||||
| DKK million | Beginning of the year | Re-payments | Proceeds | Additions2 | Disposals | Exchange rates | Other | End of the year | |||||||||||||||||||||||||||
2021 | |||||||||||||||||||||||||||||||||||
| Lease liabilities | ( | ||||||||||||||||||||||||||||||||||
| Issued bonds | ( | ||||||||||||||||||||||||||||||||||
| Loans | ( | ||||||||||||||||||||||||||||||||||
Bank overdrafts1 | ( | ||||||||||||||||||||||||||||||||||
| Liabilities arising from financing activities | ( | ||||||||||||||||||||||||||||||||||
Bank overdrafts1 | ( | ( | |||||||||||||||||||||||||||||||||
| Total borrowings | ( | ( | |||||||||||||||||||||||||||||||||
2020 | |||||||||||||||||||||||||||||||||||
| Lease liabilities | ( | ( | ( | ||||||||||||||||||||||||||||||||
| Loans | ( | ||||||||||||||||||||||||||||||||||
Bank overdrafts1 | ( | ||||||||||||||||||||||||||||||||||
| Liabilities arising from financing activities | ( | ( | ( | ||||||||||||||||||||||||||||||||
Bank overdrafts1 | |||||||||||||||||||||||||||||||||||
| Total borrowings | ( | ( | ( | ||||||||||||||||||||||||||||||||
1. Bank overdrafts includes DKK (DKK 2. Includes additions from acquisitions of businesses. | |||||||||||||||||||||||||||||||||||
| Issued bonds | |||||||||||
| EUR | EUR | ||||||||||
| Issue date | 4 June 2021 | 4 June 2021 | |||||||||
| Maturity date | 4 June 2024 | 4 June 2028 | |||||||||
| Interest type | Fixed | Fixed | |||||||||
| Coupon interest rate | % | % | |||||||||
| Carrying amount | |||||||||||
| Fair value | |||||||||||
| Novo Nordisk Annual Report 2021 | 73 | |||||||
| Cash and cash equivalents | |||||||||||||||||
| DKK million | 2021 | 2020 | 2019 | ||||||||||||||
Cash at bank (note 4.3) | |||||||||||||||||
Borrowings1 (note 4.5) | ( | ( | ( | ||||||||||||||
| Cash and cash equivalents | |||||||||||||||||
1. Bank overdrafts includes DKK | |||||||||||||||||
| DKK million | 2021 | 2020 | 2019 | ||||||||||||||
| Reversals of non-cash income statement items | |||||||||||||||||
Interest income and interest expenses, net (note 4.10) | |||||||||||||||||
Capital gain/(loss) on investments, net. etc (note 4.10) | ( | ||||||||||||||||
Result of associated companies (note 4.10) | ( | ||||||||||||||||
Share-based payment costs (note 5.1) | |||||||||||||||||
Increase/(decrease) in provisions (note 3.4) and retirement benefit obligations | |||||||||||||||||
| Other | ( | ||||||||||||||||
| Total other non-cash items | |||||||||||||||||
| DKK million | 2021 | 2020 | 2019 | ||||||||||||||
| Inventories | ( | ( | ( | ||||||||||||||
| Trade receivables | ( | ( | ( | ||||||||||||||
| Other receivables and prepayments | ( | ( | ( | ||||||||||||||
| Trade payables | ( | ( | |||||||||||||||
| Other liabilities | |||||||||||||||||
| Adjustment for payables related to non-current assets | ( | ||||||||||||||||
| Adjustment related to acquisition of businesses | ( | ||||||||||||||||
| Adjustment related to divestment of Group companies | ( | ||||||||||||||||
| Change in working capital including exchange rate adjustments | ( | ( | ( | ||||||||||||||
| Exchange rate adjustments | ( | ||||||||||||||||
| Cash flow change in working capital | ( | ( | ( | ||||||||||||||
| Novo Nordisk Annual Report 2021 | 74 | |||||||
| Financial assets by category | ||||||||||||||
| DKK million | 2021 | 2020 | ||||||||||||
| Other financial assets | ||||||||||||||
| Marketable securities | ||||||||||||||
Derivative financial instruments (note 4.4) | ||||||||||||||
| Financial assets at fair value through the income statement | ||||||||||||||
| Other financial assets | ||||||||||||||
| Trade receivables | ||||||||||||||
| Other receivables and prepayments (current and non-current) | ||||||||||||||
| – less prepayments and VAT receivables | ( | ( | ||||||||||||
Cash at bank (note 4.6) | ||||||||||||||
| Financial assets at amortised cost | ||||||||||||||
Trade receivables in a factoring portfolio1 | ||||||||||||||
| Financial assets at fair value through other comprehensive income | ||||||||||||||
| Total financial assets at the end of the year by category | ||||||||||||||
| Financial liabilities by category | ||||||||||||||
Derivative financial instruments (note 4.4) | ||||||||||||||
| Financial liabilities measured at fair value through the income statement | ||||||||||||||
Borrowings (non-current)2 (note 4.5) | ||||||||||||||
Borrowings (current)2 (note 4.5) | ||||||||||||||
| Trade payables | ||||||||||||||
| Other liabilities (non-current) | ||||||||||||||
| Other liabilities (current) | ||||||||||||||
| – less VAT and duties payable | ( | ( | ||||||||||||
| Financial liabilities measured at amortised cost | ||||||||||||||
Total financial liabilities at the end of the year by category3 | ||||||||||||||
1. Trade receivables which are measured at fair value through other comprehensive income, which have no associated loss allowance. Refer to note 3.3. | ||||||||||||||
2. The fair value of loans approximates the booked amount. 3. Please refer to note 4.5 for a maturity analysis for non-current and current borrowings. | ||||||||||||||
| Fair value measurement hierarchy | ||||||||||||||
| DKK million | 2021 | 2020 | ||||||||||||
| Active market data | ||||||||||||||
| Directly or indirectly observable market data | ||||||||||||||
| Not based on observable market data | ||||||||||||||
| Total financial assets at fair value | ||||||||||||||
| Active market data | ||||||||||||||
| Directly or indirectly observable market data | ||||||||||||||
| Not based on observable market data | ||||||||||||||
| Total financial liabilities at fair value | ||||||||||||||
| Novo Nordisk Annual Report 2021 | 75 | |||||||
| Financial income | |||||||||||||||||
| DKK million | 2021 | 2020 | 2019 | ||||||||||||||
| Financial income | |||||||||||||||||
Interest income1 | |||||||||||||||||
| Foreign exchange gain (net) | |||||||||||||||||
| Financial gain from forward contracts (net) | |||||||||||||||||
| Capital gain on investments, etc. | |||||||||||||||||
| Result of associated companies | |||||||||||||||||
| Total financial income | |||||||||||||||||
| Financial expenses | |||||||||||||||||
Interest expenses1 | |||||||||||||||||
| Foreign exchange loss (net) | |||||||||||||||||
| Financial loss from forward contracts (net) | |||||||||||||||||
| Capital loss on investments, etc. | |||||||||||||||||
| Capital loss on marketable securities | |||||||||||||||||
| Result of associated companies | |||||||||||||||||
| Other financial expenses | |||||||||||||||||
| Total financial expenses | |||||||||||||||||
| 1. Total interest income and expenses is measured at amortised cost for financial assets and liabilities. | |||||||||||||||||
| Financial impact from forward contracts, specified | |||||||||||||||||
| DKK million | 2021 | 2020 | 2019 | ||||||||||||||
| Income/(loss) transferred from other comprehensive income | ( | ( | |||||||||||||||
| Value adjustment of transferred contracts | ( | ( | |||||||||||||||
| Unrealised fair value adjustments of forward contracts | ( | ( | |||||||||||||||
| Realised foreign exchange gain/(loss) on forward contracts | ( | ||||||||||||||||
| Financial income/(expense) from forward contracts | ( | ( | |||||||||||||||
| Novo Nordisk Annual Report 2021 | 76 | |||||||
| Share-based payment expensed in the income statement | ||||||||||||||
| DKK million | 2021 | 2020 | 2019 | |||||||||||
| Restricted stock units to employees | ||||||||||||||
Long-term share-based incentive programme (Management Board)1 | ||||||||||||||
| Long-term share-based incentive programme (management group below Management Board) | ||||||||||||||
| Shares allocated to individual employees | ||||||||||||||
| Share-based payment expensed in the income statement | ||||||||||||||
1. In 2021, Novo Nordisk introduced a new share-based compensation programme with terms, which amortises the grant date valuation over | ||||||||||||||
| Novo Nordisk Annual Report 2021 | 77 | |||||||
| General terms and conditions of launched programmes | |||||||||||||||||||||||||||||||||||||||||||||||||||||||||||
| Restricted stock units to employees | Shares for Management Board | Shares for management group below Management Board | Shares allocated to individual employees | ||||||||||||||||||||||||||||||||||||||||||||||||||||||||
| 2021 | 2020 | 2019 | 2021 | 2020 | 2019 | 2021 | 2020 | 2019 | 2021 | 2020 | 2019 | ||||||||||||||||||||||||||||||||||||||||||||||||
| Number of shares awarded in the year (million) | |||||||||||||||||||||||||||||||||||||||||||||||||||||||||||
| Value per share at launch (DKK) | |||||||||||||||||||||||||||||||||||||||||||||||||||||||||||
| Total market value at launch (DKK million) | |||||||||||||||||||||||||||||||||||||||||||||||||||||||||||
| Performance and vesting period | 2019 to 2023 | 2021 to 2023 | 2020 to 2023 | 2019 to 2022 | 2021 to 2023 | 2020 to 2023 | 2019 to 2022 | 2021 to 2024 | 2020 to 2023 | 2019 to 2022 | |||||||||||||||||||||||||||||||||||||||||||||||||
| Allocated to recipients | Feb 2023 | Feb 2024 | Feb 2024 | Feb 2023 | Feb 2024 | Feb 2024 | Feb 2023 | 2024 | 2023 | 2022 | |||||||||||||||||||||||||||||||||||||||||||||||||
| Amortisation period | — | — | |||||||||||||||||||||||||||||||||||||||||||||||||||||||||
| Outstanding restricted stock units (million) | Restricted stock units to employees | Shares for Management Board | Shares for management group below Management Board | Shares allocated to individual employees | Total | |||||||||||||||||||||||||||||||||||||||||||||||||||||||||||||||||||||
| 2021 | 2020 | 2019 | 2021 | 2020 | 2019 | 2021 | 2020 | 2019 | 2021 | 2020 | 2019 | 2021 | 2020 | 2019 | ||||||||||||||||||||||||||||||||||||||||||||||||||||||||||||
| Outstanding at the beginning of the year | ||||||||||||||||||||||||||||||||||||||||||||||||||||||||||||||||||||||||||
| Released allocated shares | ( | ( | ( | ( | ( | ( | ( | ( | ( | ( | ( | ( | ( | ( | ( | |||||||||||||||||||||||||||||||||||||||||||||||||||||||||||
| Cancelled allocated shares | ( | ( | ( | ( | ( | ( | ( | ( | ( | ( | ( | ( | ||||||||||||||||||||||||||||||||||||||||||||||||||||||||||||||
| Allocated in the year | ||||||||||||||||||||||||||||||||||||||||||||||||||||||||||||||||||||||||||
Performance adjustment1 | — | — | — | — | — | 0.0 | — | — | — | |||||||||||||||||||||||||||||||||||||||||||||||||||||||||||||||||
| Outstanding at the end of the year | ||||||||||||||||||||||||||||||||||||||||||||||||||||||||||||||||||||||||||
| 1. The number of shares for Management Board and management group below Management board has been adjusted as the financial and non-financial targets set by the Board are expected to be exceeded for the 2021 programme. The number of shares for Management Board and management group below Management board has been adjusted as the sales growth target set by the Board for the 2018 programme is exceeded and is expected to be exceeded for the 2019 and 2020 programmes. | ||||||||||||||||||||||||||||||||||||||||||||||||||||||||||||||||||||||||||
| Novo Nordisk Annual Report 2021 | 78 | |||||||
Contractual obligations not recognised in the balance sheet | |||||||||||||||||
| DKK million | Current | Non-current | Total | ||||||||||||||
| 2021 | |||||||||||||||||
Leases1 | |||||||||||||||||
| Research and development obligations | |||||||||||||||||
Research and development – potential milestone payments2 | |||||||||||||||||
Commercial product launch – potential milestone payments2 | |||||||||||||||||
| Purchase obligations relating to investments in property, plant and equipment | |||||||||||||||||
| Other purchase obligations | |||||||||||||||||
| Total obligations not recognised in the balance sheet | |||||||||||||||||
| 2020 | |||||||||||||||||
Leases1 | |||||||||||||||||
| Research and development obligations | |||||||||||||||||
Research and development – potential milestone payments2 | |||||||||||||||||
Commercial product launch – potential milestone payments2 | |||||||||||||||||
| Purchase obligations relating to investments in property, plant and equipment | |||||||||||||||||
| Other purchase obligations | |||||||||||||||||
| Total obligations not recognised in the balance sheet | |||||||||||||||||
1. Predominantly relates to estimated variable property taxes, leases committed but not yet commenced and low value assets. 2. Potential milestone payments are associated with uncertainty as they are linked to successful achievements in research activities. | |||||||||||||||||
| Novo Nordisk Annual Report 2021 | 79 | |||||||
| DKK million | 2021 | |||||||
| Intellectual property rights | ||||||||
| Other intangible assets | ||||||||
| Financial assets | ||||||||
| Cash | ||||||||
| Deferred tax assets/liabilities, net | ( | |||||||
| Other net assets | ( | |||||||
| Net identifiable assets acquired | ||||||||
| Goodwill | ||||||||
| Purchase price | ||||||||
| Settlement of pre-existing relationship | ( | |||||||
| Fair value of existing shareholdings | ( | |||||||
| Consideration transferred | ||||||||
| Cash acquired | ( | |||||||
| Cash used for acquisition of businesses | ||||||||
| Material transactions with related parties | |||||||||||||||||
| DKK million | 2021 | 2020 | 2019 | ||||||||||||||
| Novo Holdings A/S | |||||||||||||||||
| Purchase of Novo Nordisk B shares | |||||||||||||||||
| Dividend payment to Novo Holdings A/S | |||||||||||||||||
| NNIT Group | |||||||||||||||||
| Services provided by NNIT | |||||||||||||||||
| Dividend payment from NNIT | ( | ( | ( | ||||||||||||||
| Novozymes Group | |||||||||||||||||
| Services provided by Novo Nordisk | ( | ( | ( | ||||||||||||||
| Services provided by Novozymes | |||||||||||||||||
| CS Solar Fund XIV | |||||||||||||||||
| Purchase of shares by Novo Nordisk | |||||||||||||||||
Liability for capital commitment1 | |||||||||||||||||
| Distribution by CS Solar Fund XIV | ( | ||||||||||||||||
1. The liability disclosed for 2019 related to capital commitment was paid in 2020 (DKK | |||||||||||||||||
| Novo Nordisk Annual Report 2021 | 80 | |||||||
| DKK million | 2021 | 2020 | 2019 | ||||||||||||||
| Statutory audit | |||||||||||||||||
| Audit-related services | |||||||||||||||||
| Tax advisory services | |||||||||||||||||
| Other services | |||||||||||||||||
| Total fee to statutory auditors | |||||||||||||||||
| Novo Nordisk Annual Report 2021 | 81 | |||||||
| Activity: | • | Sales and marketing | • | Production | ||||||||||
| • | Research and development | • | Services/investments | |||||||||||
| Company and country | Percentage of shares owned | Activity | ||||||||||||||||||
| Parent company | ||||||||||||||||||||
| Novo Nordisk A/S, Denmark | • | • | • | • | ||||||||||||||||
| Subsidiaries by geographical area | ||||||||||||||||||||
| North America Operations | ||||||||||||||||||||
| Novo Nordisk Canada Inc., Canada | • | |||||||||||||||||||
| Novo Nordisk Inc., United States | • | |||||||||||||||||||
| Novo Nordisk North America Operations A/S, Denmark | • | |||||||||||||||||||
| Novo Nordisk Pharmaceutical Industries LP, United States | • | |||||||||||||||||||
| Novo Nordisk Pharmatech US, Inc., United States | • | |||||||||||||||||||
| Novo Nordisk Pharma, Inc., United States | • | |||||||||||||||||||
| Novo Nordisk Research Center Indianapolis, Inc., United States | • | |||||||||||||||||||
| Novo Nordisk Research Center Seattle, Inc., United States | • | |||||||||||||||||||
| Novo Nordisk US Bio Production, Inc., United States | • | |||||||||||||||||||
| Novo Nordisk US Commercial Holdings, Inc., United States | • | |||||||||||||||||||
| Novo Nordisk US Holdings Inc., United States | • | |||||||||||||||||||
| Corvidia Therapeutics, Inc., United States | • | |||||||||||||||||||
| Dicerna Pharmaceuticals, Inc., United States | • | |||||||||||||||||||
| Emisphere Technologies, Inc., United States | • | |||||||||||||||||||
| International Operations | ||||||||||||||||||||
| Novo Nordisk Pharmaceuticals A/S, Denmark | • | |||||||||||||||||||
| Novo Nordisk Pharma Operations A/S, Denmark | • | • | ||||||||||||||||||
| Novo Nordisk Region AAMEO and LATAM A/S, Denmark | • | |||||||||||||||||||
| Novo Nordisk Region Europe A/S, Denmark | • | |||||||||||||||||||
| Novo Nordisk Region Japan & Korea A/S, Denmark | • | |||||||||||||||||||
| EMEA | ||||||||||||||||||||
| Aldaph SpA, Algeria | • | • | ||||||||||||||||||
| Novo Nordisk Pharma GmbH, Austria | • | |||||||||||||||||||
| S.A. Novo Nordisk Pharma N.V., Belgium | • | |||||||||||||||||||
| Novo Nordisk Pharma d.o.o., Bosnia and Herzegovina | • | |||||||||||||||||||
| Novo Nordisk Pharma EAD, Bulgaria | • | |||||||||||||||||||
| Novo Nordisk Hrvatska d.o.o., Croatia | • | |||||||||||||||||||
| Novo Nordisk s.r.o., Czech Republic | • | |||||||||||||||||||
| Novo Nordisk Denmark A/S, Denmark | • | |||||||||||||||||||
| Novo Nordisk Pharmatech A/S, Denmark | • | • | ||||||||||||||||||
| Novo Nordisk Egypt LLC, Egypt | • | |||||||||||||||||||
| Novo Nordisk Farma OY, Finland | • | |||||||||||||||||||
| Novo Nordisk, France | • | |||||||||||||||||||
| Novo Nordisk Production SAS, France | • | |||||||||||||||||||
| Novo Nordisk Pharma GmbH, Germany | • | |||||||||||||||||||
| Novo Nordisk Hellas Epe., Greece | • | |||||||||||||||||||
| Novo Nordisk Hungária Kft., Hungary | • | |||||||||||||||||||
| Neotope Neuroscience Limited, Ireland | • | |||||||||||||||||||
| Company and country | Percentage of shares owned | Activity | ||||||||||||||||||
| Novo Nordisk Limited, Ireland | • | |||||||||||||||||||
| Novo Nordisk Ltd, Israel | • | |||||||||||||||||||
| Novo Nordisk S.P.A., Italy | • | |||||||||||||||||||
| Novo Nordisk Kazakhstan LLP, Kazakhstan | • | |||||||||||||||||||
| Novo Nordisk Kenya Ltd., Kenya | • | |||||||||||||||||||
| Novo Nordisk Pharma SARL, Lebanon | • | |||||||||||||||||||
| UAB Novo Nordisk Pharma, Lithuania | • | |||||||||||||||||||
| Novo Nordisk Farma dooel, North Macedonia | • | |||||||||||||||||||
| Novo Nordisk Pharma SAS, Morocco | • | |||||||||||||||||||
| Novo Nordisk B.V., Netherlands | • | |||||||||||||||||||
| Novo Nordisk Finance (Netherlands) B.V., Netherlands | • | |||||||||||||||||||
| Novo Nordisk Pharma Limited, Nigeria | • | |||||||||||||||||||
| Novo Nordisk Norway AS, Norway | • | |||||||||||||||||||
| Novo Nordisk Pharmaceutical Services Sp. z o.o., Poland | • | |||||||||||||||||||
| Novo Nordisk Pharma Sp.z.o.o., Poland | • | |||||||||||||||||||
| Novo Nordisk Comércio Produtos Farmacêuticos Lda., Portugal | • | |||||||||||||||||||
| Novo Nordisk Farma S.R.L., Romania | • | |||||||||||||||||||
| Novo Nordisk Limited Liability Company, Russia | • | |||||||||||||||||||
| Novo Nordisk Production Support LLC, Russia | • | |||||||||||||||||||
| Novo Nordisk Saudi for Trading, Saudi Arabia | • | |||||||||||||||||||
| Novo Nordisk Pharma d.o.o. Belgrade (Serbia), Serbia | • | |||||||||||||||||||
| Novo Nordisk Slovakia s.r.o., Slovakia | • | |||||||||||||||||||
| Novo Nordisk, d.o.o., Slovenia | • | |||||||||||||||||||
| Novo Nordisk (Pty) Limited, South Africa | • | |||||||||||||||||||
| Novo Nordisk Pharma S.A., Spain | • | |||||||||||||||||||
| Novo Nordisk Scandinavia AB, Sweden | • | |||||||||||||||||||
| Novo Nordisk Health Care AG, Switzerland | • | • | ||||||||||||||||||
| Novo Nordisk Pharma AG, Switzerland | • | |||||||||||||||||||
| Novo Nordisk Tunisie SARL, Tunisia | • | |||||||||||||||||||
| Novo Nordisk Saglik Ürünleri Tic. Ltd. Sti., Turkey | • | |||||||||||||||||||
| Novo Nordisk Ukraine, LLC, Ukraine | • | |||||||||||||||||||
| Novo Nordisk Pharma Gulf FZE, United Arab Emirates | • | |||||||||||||||||||
| Novo Nordisk Holding Limited, United Kingdom | • | |||||||||||||||||||
| Novo Nordisk Limited, United Kingdom | • | |||||||||||||||||||
| Ziylo Limited, United Kingdom | • | |||||||||||||||||||
| Region China | ||||||||||||||||||||
| Novo Nordisk (China) Pharmaceuticals Co., Ltd., China | • | • | ||||||||||||||||||
| Novo Nordisk (Shanghai) Pharma Trading Co., Ltd., China | • | |||||||||||||||||||
| Beijing Novo Nordisk Pharmaceuticals Science & Technology Co., Ltd., China | • | |||||||||||||||||||
| Novo Nordisk Region China A/S, Denmark | • | |||||||||||||||||||
| Novo Nordisk Hong Kong Limited, Hong Kong | • | |||||||||||||||||||
| Novo Nordisk Pharma (Taiwan) Ltd., Taiwan | • | |||||||||||||||||||
| Company and country | Percentage of shares owned | Activity | ||||||||||||||||||
| Rest of World | ||||||||||||||||||||
| Novo Nordisk Pharma Argentina S.A., Argentina | • | |||||||||||||||||||
| Novo Nordisk Pharmaceuticals Pty. Ltd., Australia | • | |||||||||||||||||||
| Novo Nordisk Pharma (Private) Limited, Bangladesh | • | |||||||||||||||||||
| Novo Nordisk Produção Farmacêutica do Brasil Ltda., Brazil | • | |||||||||||||||||||
| Novo Nordisk Farmacêutica do Brasil Ltda., Brazil | • | |||||||||||||||||||
| Novo Nordisk Farmacéutica Limitada, Chile | • | |||||||||||||||||||
| Novo Nordisk Colombia SAS, Colombia | • | |||||||||||||||||||
| Novo Nordisk India Private Limited, India | • | |||||||||||||||||||
| Novo Nordisk Service Centre (India) Pvt. Ltd., India | • | |||||||||||||||||||
| PT. Novo Nordisk Indonesia, Indonesia | • | |||||||||||||||||||
| Novo Nordisk Pars, Iran | • | • | ||||||||||||||||||
| Novo Nordisk Pharma Ltd., Japan | • | • | ||||||||||||||||||
| Novo Nordisk Pharma (Malaysia) Sdn Bhd, Malaysia | • | |||||||||||||||||||
| Novo Nordisk Pharma Operations (Business Area) Sdn Bhd, Malaysia | • | |||||||||||||||||||
| Novo Nordisk Mexico S.A. de C.V., Mexico | • | |||||||||||||||||||
| Novo Nordisk Pharmaceuticals Ltd., New Zealand | • | |||||||||||||||||||
| Novo Nordisk Pharma (Private) Limited, Pakistan | • | |||||||||||||||||||
| Novo Nordisk Panama S.A., Panama | • | |||||||||||||||||||
| Novo Nordisk Peru S.A.C., Peru | • | |||||||||||||||||||
| Novo Nordisk Pharmaceuticals (Philippines) Inc., Philippines | • | |||||||||||||||||||
| Novo Nordisk Pharma (Singapore) Pte Ltd., Singapore | • | |||||||||||||||||||
| Novo Nordisk India Holding Pte Ltd., Singapore | • | |||||||||||||||||||
| Novo Nordisk Pharma Korea Ltd., South Korea | • | |||||||||||||||||||
| Novo Nordisk Lanka (PVT) Ltd, Sri Lanka | • | |||||||||||||||||||
| Novo Nordisk Pharma (Thailand) Ltd., Thailand | • | |||||||||||||||||||
| Novo Nordisk Venezuela Casa de Representación C.A., Venezuela | • | |||||||||||||||||||
| Other subsidiaries and associated companies | ||||||||||||||||||||
| NNE A/S, Denmark | • | |||||||||||||||||||
| NNIT A/S, Denmark | • | |||||||||||||||||||
| CS Solar Fund XIV, LLC, United States | • | |||||||||||||||||||
| Part of Management´s review - not audited | Novo Nordisk Annual Report 2021 | 82 | ||||||
| Part of Management´s review - not audited | Novo Nordisk Annual Report 2021 | 83 | ||||||
| Sales in constant exchange rates | |||||||||||||||||
| DKK million | 2021 | 2020 | 2019 | ||||||||||||||
Net sales IFRS | 140,800 | 126,946 | 122,021 | ||||||||||||||
| Effect of exchange rate | 3,643 | 3,254 | (3,923) | ||||||||||||||
| Sales in constant exchange rates | 144,443 | 130,200 | 118,098 | ||||||||||||||
| Net sales previous year | 126,946 | 122,021 | 111,831 | ||||||||||||||
| % increase/(decrease) in reported currencies | 10.9 | % | 4.0 | % | 9.1 | % | |||||||||||
| % increase/(decrease) in constant exchange rates | 13.8 | % | 6.7 | % | 5.6 | % | |||||||||||
| Operating profit in constant exchange rates | |||||||||||||||||
| DKK million | 2021 | 2020 | 2019 | ||||||||||||||
Operating profit IFRS | 58,644 | 54,126 | 52,483 | ||||||||||||||
| Effect of exchange rate | 2,332 | 1,930 | (2,607) | ||||||||||||||
| Operating profit in constant exchange rates | 60,976 | 56,056 | 49,876 | ||||||||||||||
| Operating profit previous year | 54,126 | 52,483 | 47,248 | ||||||||||||||
| % increase/(decrease) in reported currencies | 8.3 | % | 3.1 | % | 11.1 | % | |||||||||||
| % increase/(decrease) in constant exchange rates | 12.7 | % | 6.8 | % | 5.6 | % | |||||||||||
| Operating profit/equity in % | |||||||||||||||||
| DKK million | 2021 | 2020 | 2019 | ||||||||||||||
Operating profit IFRS | 58,644 | 54,126 | 52,483 | ||||||||||||||
/ Equity IFRS | 70,746 | 63,325 | 57,593 | ||||||||||||||
| Operating profit/equity in % | 82.9 | % | 85.5 | % | 91.1 | % | |||||||||||
| Operating profit after tax to net operating assets | |||||||||||||||||
| DKK million | 2021 | 2020 | 2019 | ||||||||||||||
| Operating profit after tax | 47,384 | 42,922 | 42,091 | ||||||||||||||
| / Average net operating assets | 68,634 | 51,824 | 42,940 | ||||||||||||||
| Operating profit after tax to net operating assets in % | 69.0 | % | 82.8 | % | 98.0 | % | |||||||||||
| DKK million | 2021 | 2020 | 2019 | ||||||||||||||
Operating profit IFRS | 58,644 | 54,126 | 52,483 | ||||||||||||||
| Tax on operating profit (using effective tax rate) | (11,260) | (11,204) | (10,392) | ||||||||||||||
| Operating profit after tax | 47,384 | 42,922 | 42,091 | ||||||||||||||
| Part of Management´s review - not audited | Novo Nordisk Annual Report 2021 | 84 | ||||||
| DKK million | 2021 | 2020 | 2019 | ||||||||||||||
| Intangible assets | 43,171 | 20,657 | 5,835 | ||||||||||||||
| Property, plant and equipment | 55,362 | 50,269 | 50,551 | ||||||||||||||
| Deferred income tax assets | 8,672 | 5,865 | 4,121 | ||||||||||||||
| Other receivables and prepayments (non-current) | 267 | 674 | 841 | ||||||||||||||
| Inventories | 19,621 | 18,536 | 17,641 | ||||||||||||||
| Trade receivables | 40,643 | 27,734 | 24,912 | ||||||||||||||
| Tax receivables | 1,119 | 289 | 806 | ||||||||||||||
| Other receivables and prepayments (current) | 5,037 | 4,161 | 3,434 | ||||||||||||||
| Deferred tax liabilities | (5,271) | (2,502) | (80) | ||||||||||||||
| Retirement benefit obligations | (1,280) | (1,399) | (1,334) | ||||||||||||||
| Other liabilities (non-current) | (360) | — | — | ||||||||||||||
| Provisions (non-current) | (4,374) | (4,526) | (4,613) | ||||||||||||||
| Trade payables | (8,870) | (5,717) | (6,358) | ||||||||||||||
| Tax payables | (3,658) | (3,913) | (4,212) | ||||||||||||||
| Other liabilities (current) | (19,600) | (17,005) | (15,085) | ||||||||||||||
| Provisions (current) | (51,520) | (34,814) | (31,120) | ||||||||||||||
| Net operating assets | 78,959 | 58,309 | 45,339 | ||||||||||||||
Average net operating assets1 | 68,634 | 51,824 | 42,940 | ||||||||||||||
| 1. Average net operating assets for 2019 was calculated based on an adjusted net operating assets figure for 2018, which was adjusted by the right-of-use assets of DKK 3,778 million as of 1 January 2019, following the implementation of IFRS 16. As a consequence, the net operating assets figure for 2018 was adjusted to DKK 40,541 million for the calculation of the average net operating assets for 2019. | |||||||||||||||||
| DKK million | 2021 | 2020 | 2019 | ||||||||||||||
| Equity | 70,746 | 63,325 | 57,593 | ||||||||||||||
| Investment in associated companies | (525) | (582) | (474) | ||||||||||||||
| Other financial assets | (916) | (1,066) | (1,334) | ||||||||||||||
| Marketable securities | (6,765) | — | — | ||||||||||||||
| Derivative financial instruments | (1,690) | (2,332) | (188) | ||||||||||||||
| Cash at bank | (10,720) | (12,757) | (15,475) | ||||||||||||||
| Borrowings – non-current | 12,961 | 2,897 | 3,009 | ||||||||||||||
| Borrowings – current | 13,684 | 7,459 | 1,474 | ||||||||||||||
| Derivative financial instruments | 2,184 | 1,365 | 734 | ||||||||||||||
| Net operating assets | 78,959 | 58,309 | 45,339 | ||||||||||||||
| DKK million | 2021 | 2020 | 2019 | ||||||||||||||
Cash and cash equivalents IFRS | 10,719 | 12,226 | 15,411 | ||||||||||||||
Marketable securities IFRS | 6,765 | — | — | ||||||||||||||
| Undrawn committed credit facility | 11,526 | 11,531 | 11,578 | ||||||||||||||
Undrawn bridge facility1 | — | 5,577 | — | ||||||||||||||
Borrowings1 | (12,861) | (576) | (595) | ||||||||||||||
Financial reserves1 | 16,149 | 28,758 | 26,394 | ||||||||||||||
| 1. Financial reserves for 2020 include amounts undrawn under credit facilities and overdrafts where the repayment of such facilities or overdrafts is not contractually required within 12 months of the balance sheet date. Financial reserves for 2020 include the DKK 5,577 million (EUR 750 million) undrawn portion of a bridge facility as the terms of the facility provided that the maturity could be extended, at the option of Novo Nordisk, through June 2022. In accordance with IFRS, the DKK 5,577 million (EUR 750 million) drawn portion of the bridge facility has nevertheless been classified as current debt as it was Management’s expectation that the facility would be repaid in 2021. The loan was repaid in 2021. | |||||||||||||||||
| Free cash flow | |||||||||||||||||
| DKK million | 2021 | 2020 | 2019 | ||||||||||||||
Net cash generated from operating activities IFRS | 55,000 | 51,951 | 46,782 | ||||||||||||||
Net cash used in investing activities IFRS | (31,605) | (22,436) | (11,509) | ||||||||||||||
Net purchase of marketable securities IFRS | 5,937 | — | — | ||||||||||||||
Addition on marketable securities through acquisition of business IFRS | 861 | — | — | ||||||||||||||
Repayment on lease liabilities IFRS | (874) | (950) | (822) | ||||||||||||||
| Free cash flow | 29,319 | 28,565 | 34,451 | ||||||||||||||
| Cash flow from operating activities/net profit in % | |||||||||||||||||
| DKK million | 2021 | 2020 | 2019 | ||||||||||||||
Net cash generated from operating activities IFRS | 55,000 | 51,951 | 46,782 | ||||||||||||||
/ Net profit IFRS | 47,757 | 42,138 | 38,951 | ||||||||||||||
| Cash flow from operating activities/net profit in % | 115.2 | % | 123.3 | % | 120.1 | % | |||||||||||
| Cash to earnings | |||||||||||||||||
| DKK million | 2021 | 2020 | 2019 | ||||||||||||||
| Free cash flow | 29,319 | 28,565 | 34,451 | ||||||||||||||
/ Net profit IFRS | 47,757 | 42,138 | 38,951 | ||||||||||||||
| Cash to earnings | 61.4 | % | 67.8 | % | 88.4 | % | |||||||||||
| Novo Nordisk Annual Report 2021 | 85 | |||||||
| Note | 2021 | 2020 | 2019 | |||||||||||||||||
| Environmental performance | ||||||||||||||||||||
| Resources | ||||||||||||||||||||
| Energy consumption for operations (1,000 GJ) | 7.1 | 3,387 | 3,191 | 2,993 | ||||||||||||||||
| Share of renewable power for production sites | 7.1 | 100% | 100% | 76% | ||||||||||||||||
Water consumption for production sites (1,000 m3) | 7.2 | 3,488 | 3,368 | 3,149 | ||||||||||||||||
| Breaches of environmental regulatory limit values | 7.3 | 12 | 15 | 16 | ||||||||||||||||
| Emissions and waste | ||||||||||||||||||||
CO2 emissions from operations and transportation (1,000 tonnes) | 7.4 | 174 | 170 | 306 | ||||||||||||||||
| Waste from production sites (1,000 tonnes) | 7.5 | 181 | 141 | 124 | ||||||||||||||||
| Social performance | ||||||||||||||||||||
| Patients | ||||||||||||||||||||
| Patients reached with Novo Nordisk's Diabetes care products (estimate in millions) | 8.1 | 34.6 | 32.8 | 30.0 | ||||||||||||||||
– Hereof reached via the Novo Nordisk Access to Insulin Commitment (estimate in millions)1 | 8.1 | 1.7 | 3.2 | 2.9 | ||||||||||||||||
– Hereof children reached through the Changing Diabetes® in Children programme (cumulative) | 8.1 | 31,846 | 28,296 | 25,695 | ||||||||||||||||
| People & employees | ||||||||||||||||||||
| Employees (total) | 8.2 | 48,478 | 45,323 | 43,258 | ||||||||||||||||
| Employee turnover | 8.2 | 11.0% | 7.9% | 11.4% | ||||||||||||||||
Sustainable employer score2 | 8.3 | 84% | N/A | N/A | ||||||||||||||||
| Frequency of occupational accidents (number per million working hours) | 8.4 | 1.3 | 1.3 | 2.2 | ||||||||||||||||
| Gender in leadership positions (ratio men:women) | 8.5 | 57:43 | 59:41 | 60:40 | ||||||||||||||||
| Gender in senior leadership positions (ratio men:women) | 8.5 | 64:36 | 65:35 | 67:33 | ||||||||||||||||
| Gender in the Board of Directors (ratio men:women) | 8.5 | 67:33 | 62:38 | 62:38 | ||||||||||||||||
| Societies | ||||||||||||||||||||
| Total tax contribution (DKK million) | 8.6 | 32,593 | 26,376 | 27,527 | ||||||||||||||||
| Donations and other contributions (DKK million) | 8.7 | 92 | 158 | 105 | ||||||||||||||||
| Governance performance | ||||||||||||||||||||
| Governing processes | ||||||||||||||||||||
| Business ethics reviews | 9.1 | 37 | 32 | 34 | ||||||||||||||||
| Relevant employees trained in business ethics | 9.1 | 98% | 99% | 99% | ||||||||||||||||
| Supplier audits | 9.2 | 253 | 177 | 236 | ||||||||||||||||
| Product recalls | 9.3 | 1 | — | 4 | ||||||||||||||||
| Failed inspections | 9.4 | — | — | — | ||||||||||||||||
| Values & trust | ||||||||||||||||||||
| Facilitations of the Novo Nordisk Way (total) | 9.5 | 34 | 26 | 32 | ||||||||||||||||
Company reputation (scale 0-100)3 | 9.6 | 82.6 | N/A | N/A | ||||||||||||||||
| Animals purchased for research | 9.7 | 47,879 | 50,036 | 49,637 | ||||||||||||||||
1. During 2020, the ceiling price was lowered from USD 4 to USD 3 which affects the comparability of 2021 and prior years. 2. In 2021, the engagement survey was entirely redesigned to support Novo Nordisk’s strategic goals. As a result, comparison to previous surveys is not appropriate. 3. Company reputation replaces Company trust in order to capture more dimensions of how Novo Nordisk is perceived by external stakeholders. | ||||||||||||||||||||
| Novo Nordisk Annual Report 2021 | 86 | |||||||
| Novo Nordisk Annual Report 2021 | 87 | |||||||
| Energy consumption for operations | ||||||||||||||
| 1,000 GJ | 2021 | 2020 | 2019 | |||||||||||
| Production | 2,859 | 2,718 | 2,458 | |||||||||||
| Office buildings and laboratories | 528 | 473 | 535 | |||||||||||
| Total energy consumption | 3,387 | 3,191 | 2,993 | |||||||||||
CO2 emissions from operations and transportation | |||||||||||
| 1,000 tonnes | 2021 | 2020 | 2019 | ||||||||
| Production | 39 | 37 | 86 | ||||||||
| Office buildings and laboratories | 8 | 8 | 13 | ||||||||
| Product distribution | 71 | 61 | 80 | ||||||||
| Business flights | 10 | 19 | 65 | ||||||||
| Company cars | 46 | 45 | 62 | ||||||||
Total CO2 emissions | 174 | 170 | 306 | ||||||||
CO2 emissions by Scope 1, 2 and 3 | |||||||||||
| 1,000 tonnes | 2021 | 2020 | 2019 | ||||||||
| Scope 1 | 77 | 75 | 86 | ||||||||
| – Production | 29 | 28 | 21 | ||||||||
– Office buildings and laboratories | 2 | 2 | 3 | ||||||||
| – Company cars | 46 | 45 | 62 | ||||||||
| Scope 2 | 16 | 15 | 75 | ||||||||
| – Production | 10 | 9 | 65 | ||||||||
– Office buildings and laboratories | 6 | 6 | 10 | ||||||||
Scope 31 | 81 | 80 | 145 | ||||||||
| – Business flights | 10 | 19 | 65 | ||||||||
| – Product distribution | 71 | 61 | 80 | ||||||||
Total CO2 emissions | 174 | 170 | 306 | ||||||||
1. Scope 3 emissions are restricted to CO2 emissions from business flights and product distribution. For a full overview of CO2 emissions, please visit cdp.net | |||||||||||
| Novo Nordisk Annual Report 2021 | 88 | |||||||
| Waste from production sites | |||||||||||||||||
| 1,000 tonnes | 2021 | 2020 | 2019 | ||||||||||||||
Organic residues | 143 | 108 | 89 | ||||||||||||||
| Other (paper, cardboard, metals, etc.) | 8 | 8 | 8 | ||||||||||||||
| Total recycling | 151 | 116 | 97 | ||||||||||||||
| Ethanol waste | 13 | 9 | 13 | ||||||||||||||
| Other (various combustible waste) | 9 | 6 | 5 | ||||||||||||||
| Total waste with energy recovery | 22 | 15 | 18 | ||||||||||||||
| Water waste | 5 | 5 | 5 | ||||||||||||||
| Other | 2 | 4 | 3 | ||||||||||||||
| Total waste with no energy recovery | 7 | 9 | 8 | ||||||||||||||
| Total waste to landfill | 1 | 1 | 1 | ||||||||||||||
| Total waste | 181 | 141 | 124 | ||||||||||||||
| Novo Nordisk Annual Report 2021 | 89 | |||||||
| Employees | |||||||||||||||||
| Number | 2021 | 2020 | 2019 | ||||||||||||||
| North America Operations | 6,106 | 6,213 | 6,190 | ||||||||||||||
| International Operations | 42,372 | 39,110 | 37,068 | ||||||||||||||
| – EMEA (Europe, the Middle East and Africa) | 26,680 | 24,600 | 23,540 | ||||||||||||||
| – of which in Denmark | 19,150 | 17,538 | 16,747 | ||||||||||||||
| – China (Mainland China, Hong Kong, Taiwan) | 5,833 | 5,548 | 5,263 | ||||||||||||||
| – Rest of World (all other countries) | 9,859 | 8,962 | 8,265 | ||||||||||||||
| Total employees | 45,323 | 43,258 | |||||||||||||||
| Full-time employees | 44,723 | 42,703 | |||||||||||||||
| Gender in leadership positions | |||||||||||||||||
| Ratio men:women | 2021 | 2020 | 2019 | ||||||||||||||
| CEO, EVP, SVP | 72:28 | 76:24 | 82:18 | ||||||||||||||
| CVP, VP | 63:37 | 64:36 | 66:34 | ||||||||||||||
| Director, Manager, Team Leader | 57:43 | 58:42 | 59:41 | ||||||||||||||
| Gender in leadership positions (overall) | 57:43 | 59:41 | 60:40 | ||||||||||||||
| Gender in senior leadership positions | 64:36 | 65:35 | 67:33 | ||||||||||||||
| Gender in the Board of Directors | 67:33 | 62:38 | 62:38 | ||||||||||||||
| Novo Nordisk Annual Report 2021 | 90 | |||||||
| Total tax contribution | |||||||||||||||||
| DKK million | Taxes borne | Taxes collected | 2021 | 2020 | 2019 | ||||||||||||
| Corporate income taxes paid | 14,438 | 3,952 | 18,390 | 13,577 | 14,392 | ||||||||||||
| Employment taxes | 1,893 | 8,947 | 10,840 | 9,588 | 9,638 | ||||||||||||
| Indirect taxes | 1,506 | 1,106 | 2,612 | 2,497 | 2,610 | ||||||||||||
| Other taxes | 751 | — | 751 | 714 | 887 | ||||||||||||
| Total | 18,588 | 14,005 | 32,593 | 26,376 | 27,527 | ||||||||||||
| Donations and other contributions | ||||||||||||||
| DKK million | 2021 | 2020 | 2019 | |||||||||||
| World Diabetes Foundation (WDF) | 92 | 138 | 86 | |||||||||||
| Novo Nordisk Haemophilia Foundation (NNHF) | — | 20 | 19 | |||||||||||
| Total donations and other contributions | 92 | 158 | 105 | |||||||||||
| Supplier audits | ||||||||||||||
| Number | 2021 | 2020 | 2019 | |||||||||||
| Responsible sourcing audits | 16 | 7 | 27 | |||||||||||
| Quality audits | 237 | 170 | 209 | |||||||||||
| Total supplier audits | 253 | 177 | 236 | |||||||||||
| Novo Nordisk Annual Report 2021 | 91 | |||||||
| Company reputation | ||||||||||||||
| Scale 0-100 | 2021 | 2020 | 2019 | |||||||||||
| People with diabetes | 77.1 | N/A | N/A | |||||||||||
| People with obesity | 79.4 | N/A | N/A | |||||||||||
| General practitioners | 81.5 | N/A | N/A | |||||||||||
| Diabetes specialists | 84.8 | N/A | N/A | |||||||||||
| Informed general public | 90.3 | N/A | N/A | |||||||||||
| Total score (average) | 82.6 | N/A | N/A | |||||||||||
| Animals purchased | ||||||||||||||
| Number | 2021 | 2020 | 2019 | |||||||||||
| Mice, rats and other rodents | 35,675 | 38,850 | 48,081 | |||||||||||
| Pigs | 759 | 783 | 880 | |||||||||||
| Rabbits | 184 | 239 | 349 | |||||||||||
| Dogs | 114 | 91 | 157 | |||||||||||
| Non-human primates | 495 | 264 | 168 | |||||||||||
| Fish | 10,638 | 9,804 | — | |||||||||||
| Other vertebrates | 14 | 5 | 2 | |||||||||||
| Total animals purchased | 47,879 | 50,036 | 49,637 | |||||||||||
| Novo Nordisk Annual Report 2021 | 92 | |||||||
| Registered Executive Management | Board of Directors | |||||||||||||||||||||||||
| Lars Fruergaard Jørgensen President and CEO | Karsten Munk Knudsen CFO | Helge Lund Chair | Jeppe Christiansen Vice chair | Laurence Debroux | ||||||||||||||||||||||
| Monique Carter | Martin Holst Lange | Andreas Fibig | Sylvie Grégoire | Mette Bøjer Jensen | ||||||||||||||||||||||
| Marcus Schindler | Camilla Sylvest | Kasim Kutay | Anne Marie Kverneland | Martin Mackay | ||||||||||||||||||||||
| Henrik Wulff | Henrik Poulsen | Thomas Rantzau | Stig Strøbæk | |||||||||||||||||||||||
| Novo Nordisk Annual Report 2021 | 93 | |||||||
| Novo Nordisk Annual Report 2021 | 94 | |||||||
| Novo Nordisk Annual Report 2021 | 95 | |||||||
| Novo Nordisk Annual Report 2021 | 96 | |||||||
| Novo Nordisk Annual Report 2021 | 97 | |||||||
| 2022 financial calender | |||||||||||||||||||||||||||||||||||||||||||||||||||||||||||||||||
24 March 2022 Annual General Meeting 2022 | 28 March 2022 Record date | 5 April 2022 Payment, ADRs | 4 August 2022 Financial statement for the first six months of 2022 | 15 August 2022 Record date | 23 August 2022 Payment, ADRs | 1 February 2023 Financial statement for 2022 and Annual Report 2022 | |||||||||||||||||||||||||||||||||||||||||||||||||||||||||||
 | |||||||||||||||||||||||||||||||||||||||||||||||||||||||||||||||||
25 March 2022 Ex-dividend | 29 March 2022 Payment, B-shares | 4 May 2022 Financial statement for the first three months of 2022 | 12 August 2022 Ex-dividend | 16 August 2022 Payment, B shares | 2 November 2022 Financial statement for the first nine months of 2022 | ||||||||||||||||||||||||||||||||||||||||||||||||||||||||||||
| Product overview | |||||||||||||||||||||||||||||||||||||||||||||||||||||||||||||||||
| Diabetes care | Obesity care | Biopharm | |||||||||||||||||||||||||||||||||||||||||||||||||||||||||||||||
New-generation insulin and combinations Tresiba®, insulin degludec Ryzodeg® 70/30, insulin degludec/insulin aspart Fiasp®, fast-acting insulin aspart Xultophy®*, insulin degludec/liraglutide Modern insulin Levemir®, insulin detemir NovoRapid®**, insulin aspart NovoMix® 30, biphasic insulin aspart NovoMix® 50, biphasic insulin aspart NovoMix® 70, biphasic insulin aspart Human insulin lnsulatard® isophane (NPH) insulin Actrapid®, regular human insulin Mixtard® 30, biphasic human insulin Mixtard® 40, biphasic human insulin Mixtard® 50, biphasic human insulin Glucagon-like peptide-1 Victoza®, liraglutide Ozempic®, semaglutide Rybelsus®, oral semaglutide | Pre-filled delivery system FlexTouch®, U100, U200 FlexPen® InnoLet® Ozempic® pen Ozempic® Single dose device Durable delivery systems NovoPen® 6 NovoPen® 5 NovoPen® 4 NovoPen Echo® Plus NovoPen Echo® Other delivery systems PumpCart®, NovoRapid® & Fiasp® cartridge to be used in pump Cartridge Vial Oral antidiabetic agents NovoNorm®, repaglinide Glucagon GlucaGen®, glucagon for diagnostic use GlucaGen® Hypokit, glucagon emergency kit for severe hypoglycaemia Needles NovoFine® Plus NovoFine® NovoTwist® NovoFine® AutoCover® | Glucagon-like peptide-1 Saxenda®, liraglutide 3.0 mg Wegovy®, semaglutide 2.4 mg, FlexTouch® Obesity delivery systems Saxenda® pen Wegovy®, Single dose device, FlexTouch® | Rare Blood Disorders NovoSeven®, recombinant factor VIIa, also available with pre-filled syringe in an increasing number of countries NovoEight®***, recombinant factor VIII NovoThirteen® (TRETTEN®), recombinant factor XIII Refixia®****, nonacog beta pegol; N9-GP Esperoct®, turoctocog alfa pegol, NS-GP Rare Endocrine Disorders Norditropin®, somatropin (rDNA origin) Sogroya®, somapacitan Macrilen™, macimorelin; growth hormone secretagogue receptor agonist Human growth hormone delivery system Pre-filled delivery system FlexPro® NordiFlex® NordiLet® NordiPen® Durable delivery systems Durable multi-dose delivery system to be used with Norditropin® SimpleXx® | Other delivery system PenMate®, automatic needle inserter (for NordiPen® and NordiFlex®) Hormone replacement therapy Vagifem®, estradiol hemihydrate Activelle®, estradiol/norethisterone acetate Kliogest®, estradiol/norethisterone acetate Novofem®, estradiol/norethisterone acetate Trisequens®, estradiol/norethisterone acetate Estrofem®, estradiol | |||||||||||||||||||||||||||||||||||||||||||||||||||||||||||||
* In the US approved under the brand name Xultophy® 100/3.6 ** In the US called NovoLog® *** In the US spelt Novoeight® **** In the US approved under the name of REBINYN® | |||||||||||||||||||||||||||||||||||||||||||||||||||||||||||||||||
| Financial statements of the parent company | Novo Nordisk Annual Report 2021 | 98 | ||||||
| DKK million | Note | 2021 | 2020 | ||||||||||||||
| Net sales | 2 | 112,553 | 100,940 | ||||||||||||||
| Cost of goods sold | 3 | (26,642) | (20,662) | ||||||||||||||
| Gross profit | 85,911 | 80,278 | |||||||||||||||
| Sales and distribution costs | 3 | (30,021) | (26,673) | ||||||||||||||
| Research and development costs | 3 | (15,244) | (14,524) | ||||||||||||||
| Administrative costs | 3 | (1,976) | (1,913) | ||||||||||||||
| Other operating income and expenses | 1,032 | 1,976 | |||||||||||||||
| Operating profit | 39,702 | 39,144 | |||||||||||||||
| Profit in subsidiaries, net of tax | 8 | 16,879 | 10,394 | ||||||||||||||
| Financial income | 4 | 2,415 | 2,144 | ||||||||||||||
| Financial expenses | 4 | (2,225) | (2,238) | ||||||||||||||
| Profit before income taxes | 56,771 | 49,444 | |||||||||||||||
| Income taxes | (9,248) | (7,285) | |||||||||||||||
| Net profit | 47,523 | 42,159 | |||||||||||||||
| DKK million | Note | 2021 | 2020 | ||||||||||||||
| Assets | |||||||||||||||||
| Intangible assets | 6 | 9,110 | 7,938 | ||||||||||||||
| Property, plant and equipment | 7 | 27,007 | 25,322 | ||||||||||||||
| Financial assets | 8 | 71,564 | 43,598 | ||||||||||||||
| Deferred income tax assets | 5 | 228 | — | ||||||||||||||
| Other receivables and prepayments | — | 218 | |||||||||||||||
| Total non-current assets | 107,909 | 77,076 | |||||||||||||||
| Raw materials | 3,754 | 2,781 | |||||||||||||||
| Work in progress | 10,899 | 10,647 | |||||||||||||||
| Finished goods | 2,131 | 2,246 | |||||||||||||||
| Inventories | 16,784 | 15,674 | |||||||||||||||
| Trade receivables | 2,128 | 1,523 | |||||||||||||||
| Amounts owed by affiliated companies | 13,200 | 15,893 | |||||||||||||||
| Tax receivables | 695 | — | |||||||||||||||
| Other receivables and prepayments | 2,967 | 2,353 | |||||||||||||||
| Receivables | 18,990 | 19,769 | |||||||||||||||
| Marketable securities | 5,904 | — | |||||||||||||||
| Derivative financial instruments | 9 | 1,690 | 2,332 | ||||||||||||||
| Cash at bank | 8,870 | 11,509 | |||||||||||||||
| Total current assets | 52,238 | 49,284 | |||||||||||||||
| Total assets | 160,147 | 126,360 | |||||||||||||||
| DKK million | Note | 2021 | 2020 | ||||||||||||||
| Equity and liabilities | |||||||||||||||||
| Share capital | 462 | 470 | |||||||||||||||
| Net revaluation reserve according to the equity method | 17,675 | 9,749 | |||||||||||||||
| Development costs reserve | 1,218 | 959 | |||||||||||||||
| Reserve for cash flow hedge | (1,600) | 1,617 | |||||||||||||||
| Retained earnings | 52,714 | 50,241 | |||||||||||||||
| Total equity | 70,469 | 63,036 | |||||||||||||||
| Borrowings | 10 | 10,111 | 596 | ||||||||||||||
| Deferred income tax liabilities | 5 | — | 523 | ||||||||||||||
| Other provisions | 11 | 1,377 | 1,348 | ||||||||||||||
| Total non-current liabilities | 11,488 | 2,467 | |||||||||||||||
| Borrowings | 10 | 12,648 | 6,275 | ||||||||||||||
| Derivative financial instruments | 9 | 2,184 | 1,365 | ||||||||||||||
| Trade payables | 3,048 | 2,910 | |||||||||||||||
| Amounts owed to affiliated companies | 53,826 | 40,931 | |||||||||||||||
| Tax payables | 171 | 3,114 | |||||||||||||||
| Other liabilities | 6,313 | 6,262 | |||||||||||||||
| Total current liabilities | 78,190 | 60,857 | |||||||||||||||
| Total liabilities | 89,678 | 63,324 | |||||||||||||||
| Total equity and liabilities | 160,147 | 126,360 | |||||||||||||||
| Financial statements of the parent company | Novo Nordisk Annual Report 2021 | 99 | ||||||
| DKK million | Share capital | Net revaluation reserve | Reserve for cash flow hedges and exchange rate adjustments | Develop- ment costs reserve | Retained earnings | 2021 | 2020 | ||||||||||||||||||||||
| Balance at the beginning of the year | 470 | 9,749 | 1,617 | 959 | 50,241 | 63,036 | 57,432 | ||||||||||||||||||||||
| Appropriated from net profit | 17,500 | 17,500 | 24,995 | ||||||||||||||||||||||||||
| Appropriated from net profit to net revaluation reserve | 6,312 | 6,312 | (3,902) | ||||||||||||||||||||||||||
| Exchange rate adjustments of investments in subsidiaries | 1,614 | 10 | 1,624 | (1,689) | |||||||||||||||||||||||||
| Effect of cash flow hedges transferred to the income statement | (3,227) | (3,227) | 1,940 | ||||||||||||||||||||||||||
| Fair value adjustments of cash flow hedges for the year | — | — | |||||||||||||||||||||||||||
| Development costs | 259 | (259) | — | — | |||||||||||||||||||||||||
| Other adjustments | 1,904 | 1,904 | (179) | ||||||||||||||||||||||||||
| Transactions with owners: | |||||||||||||||||||||||||||||
| Total dividend for the year | 23,711 | 23,711 | 21,066 | ||||||||||||||||||||||||||
| Interim dividends paid during the year | (8,021) | (8,021) | (7,570) | ||||||||||||||||||||||||||
| Dividends paid for prior year | (13,496) | (13,496) | (12,551) | ||||||||||||||||||||||||||
| Reduction of the B share capital | (8) | 8 | — | — | |||||||||||||||||||||||||
| Purchase of treasury shares | (19,447) | (19,447) | (16,855) | ||||||||||||||||||||||||||
| Share-based payments (note 3) | 383 | 383 | 327 | ||||||||||||||||||||||||||
| Tax related to restricted stock units | 190 | 190 | 22 | ||||||||||||||||||||||||||
| Balance at the end of the year | 462 | 17,675 | (1,600) | 1,218 | 52,714 | 70,469 | 63,036 | ||||||||||||||||||||||
| Proposed appropriation of net profit: | |||||||||||||||||||||||||||||
| Interim dividend for the year | 8,021 | 7,570 | |||||||||||||||||||||||||||
| Final dividend for the year | 15,690 | 13,496 | |||||||||||||||||||||||||||
| Appropriated to net revaluation reserve | 6,312 | (3,902) | |||||||||||||||||||||||||||
| Transferred to retained earnings | 17,500 | 24,995 | |||||||||||||||||||||||||||
| Distribution of net profit | 47,523 | 42,159 | |||||||||||||||||||||||||||
| DKK million | A share capital | B share capital | Total share capital | |||||||||||
| Beginning of 2017 | 107 | 403 | 510 | |||||||||||
| Cancelled in 2017 | — | (10) | 500 | |||||||||||
| Cancelled in 2018 | — | (10) | 490 | |||||||||||
| Cancelled in 2019 | — | (10) | 480 | |||||||||||
| Cancelled in 2020 | — | (10) | 470 | |||||||||||
| Cancelled in 2021 | — | (8) | 462 | |||||||||||
| Share capital at the end of the year | 107 | 355 | 462 | |||||||||||
| Financial statements of the parent company | Novo Nordisk Annual Report 2021 | 100 | ||||||
| DKK million | 2021 | 2020 | ||||||||||||
| Sales by business segment | ||||||||||||||
| Diabetes and Obesity care | 112,347 | 100,741 | ||||||||||||
| Biopharm | 206 | 199 | ||||||||||||
| Total sales | 112,553 | 100,940 | ||||||||||||
| Sales by geographical segment | ||||||||||||||
| North America Operations | 57,654 | 52,054 | ||||||||||||
| International Operations: | ||||||||||||||
| EMEA | 27,124 | 25,124 | ||||||||||||
| China | 15,608 | 12,554 | ||||||||||||
| Rest of World | 12,167 | 11,208 | ||||||||||||
| Total sales | 112,553 | 100,940 | ||||||||||||
| DKK million | 2021 | 2020 | ||||||||||||
| Wages and salaries | 12,485 | 11,503 | ||||||||||||
| Share-based payment costs | 383 | 327 | ||||||||||||
| Pensions | 1,116 | 1,045 | ||||||||||||
| Other social security contributions | 207 | 176 | ||||||||||||
| Other employee costs | 363 | 299 | ||||||||||||
| Total employee costs in the income statement | 14,554 | 13,350 | ||||||||||||
| Average number of full-time employees | 16,851 | 15,782 | ||||||||||||
| Year-end number of full-time employees | 17,534 | 16,151 | ||||||||||||
| DKK million | 2021 | 2020 | ||||||||||||
| Interest income relating to subsidiaries | 238 | 263 | ||||||||||||
| Result of associated company | — | 21 | ||||||||||||
| Foreign exchange gain (net) | — | 1,751 | ||||||||||||
| Financial gain from forward contracts (net) | 2,021 | — | ||||||||||||
| Other financial income | 156 | 109 | ||||||||||||
| Total financial income | 2,415 | 2,144 | ||||||||||||
| Interest expenses relating to subsidiaries | 13 | 137 | ||||||||||||
| Result of associated company | 13 | — | ||||||||||||
| Foreign exchange loss (net) | 1,978 | — | ||||||||||||
| Financial loss from forward contracts (net) | — | 1,777 | ||||||||||||
| Other financial expenses | 221 | 324 | ||||||||||||
| Total financial expenses | 2,225 | 2,238 | ||||||||||||
| Financial statements of the parent company | Novo Nordisk Annual Report 2021 | 101 | ||||||
| DKK million | 2021 | 2020 | ||||||||||||
| Net deferred tax asset/(liability) at the beginning of the year | (523) | 95 | ||||||||||||
| Income/(charge) to the income statement | (330) | (18) | ||||||||||||
| Income/(charge) to equity | 1,081 | (600) | ||||||||||||
| Net deferred tax asset/(liability) at the end of the year | 228 | (523) | ||||||||||||
| DKK million | 2021 | 2020 | ||||||||||||
| Cost at the beginning of the year | 11,077 | 6,065 | ||||||||||||
| Additions during the year | 1,560 | 5,165 | ||||||||||||
| Disposals during the year | (65) | (153) | ||||||||||||
| Cost at the end of the year | 12,572 | 11,077 | ||||||||||||
| Amortisation at the beginning of the year | 3,139 | 2,637 | ||||||||||||
| Amortisation during the year | 289 | 306 | ||||||||||||
| Impairment losses for the year | 34 | 349 | ||||||||||||
| Amortisation and impairment losses reversed on disposals during the year | — | (153) | ||||||||||||
| Amortisation at the end of the year | 3,462 | 3,139 | ||||||||||||
| Carrying amount at the end of the year | 9,110 | 7,938 | ||||||||||||
| DKK million | Land and buildings | Plant and machinery | Other equipment | Assets under con-struction | 2021 | 2020 | ||||||||||||||||||||
| Cost at the beginning of the year | 22,094 | 22,347 | 4,013 | 3,529 | 51,983 | 49,545 | ||||||||||||||||||||
| Additions during the year | 328 | 995 | 162 | 2,823 | 4,308 | 3,089 | ||||||||||||||||||||
| Disposals during the year | (108) | (145) | (34) | (9) | (296) | (651) | ||||||||||||||||||||
| Transfer from/(to) other items | 630 | 1,544 | 244 | (2,418) | — | — | ||||||||||||||||||||
| Cost at the end of the year | 22,944 | 24,741 | 4,385 | 3,925 | 55,995 | 51,983 | ||||||||||||||||||||
| Depreciation and impairment losses at the beginning of the year | 9,314 | 14,954 | 2,393 | — | 26,661 | 24,821 | ||||||||||||||||||||
| Depreciation for the year | 1,084 | 1,089 | 347 | — | 2,520 | 2,387 | ||||||||||||||||||||
| Impairment losses for the year | 9 | 18 | 54 | 9 | 90 | 97 | ||||||||||||||||||||
| Depreciation reversed on disposals during the year | (95) | (145) | (34) | (9) | (283) | (644) | ||||||||||||||||||||
| Depreciation and impairment losses at the end of the year | 10,312 | 15,916 | 2,760 | — | 28,988 | 26,661 | ||||||||||||||||||||
| Carrying amount at the end of the year | 12,632 | 8,825 | 1,625 | 3,925 | 27,007 | 25,322 | ||||||||||||||||||||
| Of which related to leased property, plant and equipment | 545 | — | 52 | — | 597 | 763 | ||||||||||||||||||||
| Leased property, plant and equipment primarily relates to lease of office buildings, warehouses, laboratories and vehicles. | ||||||||||||||||||||||||||
| Financial statements of the parent company | Novo Nordisk Annual Report 2021 | 102 | ||||||
| DKK million | Invest- ments in subsi- diaries | Amounts owed by affiliated companies | Invest- ment in associated company | Other securities and invest-ments | 2021 | 2020 | ||||||||||||||||||||
| Cost at the beginning of the year | 29,174 | 4,047 | 105 | 1,220 | 34,546 | 18,493 | ||||||||||||||||||||
| Investments during the year | 19,698 | 1,255 | 67 | 21,020 | 29,629 | |||||||||||||||||||||
| Divestments and repayments during the year | (989) | (590) | (1,579) | (13,576) | ||||||||||||||||||||||
| Cost at the end of the year | 48,872 | 4,313 | 105 | 697 | 53,987 | 34,546 | ||||||||||||||||||||
| Value adjustments at the beginning of the year | 26,255 | (245) | 111 | (452) | 25,669 | 28,803 | ||||||||||||||||||||
| Profit/(loss) before tax | 19,635 | 19,635 | 18,187 | |||||||||||||||||||||||
| Share of result after tax in associated company | (13) | (13) | 21 | |||||||||||||||||||||||
| Income taxes on profit for the year | (2,006) | (2,006) | (3,748) | |||||||||||||||||||||||
| Market value adjustment | 75 | 75 | (171) | |||||||||||||||||||||||
| Dividends received | (11,050) | (4) | (11,054) | (16,785) | ||||||||||||||||||||||
| Divestments during the year | 216 | 216 | (3) | |||||||||||||||||||||||
| Effect of exchange rate adjustment charged to the income statement | 281 | 17 | 298 | — | ||||||||||||||||||||||
| Effect of exchange rate adjustment charged to equity | 2,603 | 10 | 2,613 | (3,103) | ||||||||||||||||||||||
| Other adjustments | 500 | 500 | 2,468 | |||||||||||||||||||||||
| Value adjustments at the end of the year | 35,937 | 46 | 94 | (144) | 35,933 | 25,669 | ||||||||||||||||||||
| Unrealised internal profit at the beginning of the year | (16,617) | (16,617) | (13,420) | |||||||||||||||||||||||
| Unrealised internal profit movements in the year | (750) | (750) | (4,045) | |||||||||||||||||||||||
| Effect of exchange rate adjustment charged to equity | (989) | (989) | 848 | |||||||||||||||||||||||
| Unrealised internal profit at the end of the year | (18,356) | — | — | — | (18,356) | (16,617) | ||||||||||||||||||||
| Carrying amount at the end of the year | 66,453 | 4,359 | 199 | 553 | 71,564 | 43,598 | ||||||||||||||||||||
| Financial statements of the parent company | Novo Nordisk Annual Report 2021 | 103 | ||||||
| DKK million | 2021 | 2020 | ||||||||||||
| Within 1 year | 12,648 | 6,275 | ||||||||||||
| 1-5 years | 5,282 | 470 | ||||||||||||
| More than 5 years | 4,829 | 126 | ||||||||||||
| Total borrowings | 22,759 | 6,871 | ||||||||||||
| DKK million | 2021 | 2020 | ||||||||||||
| Statutory audit | 8 | 8 | ||||||||||||
| Audit-related services | 2 | 3 | ||||||||||||
| Tax advisory services | 2 | 5 | ||||||||||||
| Other services | 2 | 1 | ||||||||||||
| Total fee to statutory auditors | 14 | 17 | ||||||||||||
| DKK million | 2021 | 2020 | ||||||||||||
| Commitments | ||||||||||||||
Leases1 | 117 | 137 | ||||||||||||
Potential milestone payments2 | 11,978 | 6,794 | ||||||||||||
| Guarantees given for subsidiaries | 19,141 | 8,490 | ||||||||||||
| Other guarantees | 112 | 101 | ||||||||||||
1.Lease commitments predominantly relate to estimated variable property taxes and low value assets. 2. Potential milestone payments are associated with uncertainty as they are linked to successful achievements in research activities; please refer to note 5.2 to the consolidated financial statements. | ||||||||||||||