UNITED STATES
SECURITIES AND EXCHANGE COMMISSION
Washington, D.C. 20549
FORM N-CSR
CERTIFIED SHAREHOLDER REPORT OF REGISTERED
MANAGEMENT INVESTMENT COMPANIES
Investment Company Act file number 811-2105
Fidelity Salem Street Trust
(Exact name of registrant as specified in charter)
245 Summer St., Boston, Massachusetts 02210
(Address of principal executive offices) (Zip code)
Scott C. Goebel, Secretary
245 Summer St.
Boston, Massachusetts 02210
(Name and address of agent for service)
Registrant's telephone number, including area code: 617-563-7000
|
Date of fiscal year end: |
April 30 |
|
|
|
|
Date of reporting period: |
April 30, 2014 |
Item 1. Reports to Stockholders
Spartan® Mid Cap Index
Fund
Spartan Small Cap Index Fund
Investor Class
Fidelity Advantage® Class
Annual Report
April 30, 2014
(Fidelity Cover Art)
Contents
|
Shareholder Expense Example |
An example of shareholder expenses. |
|
|
Spartan® Mid Cap Index Fund |
||
|
Performance |
How the fund has done over time. |
|
|
Management's Discussion of Fund Performance |
The Portfolio Manager's review of fund performance and strategy. |
|
|
Investment Changes |
A summary of major shifts in the fund's investments over the past six months. |
|
|
Investments |
A complete list of the fund's investments with their market values. |
|
|
Financial Statements |
Statements of assets and liabilities, operations, and changes in net assets, as well as financial highlights. |
|
|
Spartan Small Cap Index Fund |
||
|
Performance |
|
|
|
Management's Discussion of Fund Performance |
The Portfolio Manager's review of fund performance and strategy. |
|
|
Investment Changes |
A summary of major shifts in the fund's investments over the past six months. |
|
|
Investments |
A complete list of the fund's investments with their market values. |
|
|
Financial Statements |
Statements of assets and liabilities, operations, and changes in net assets, as well as financial highlights. |
|
|
Notes |
Notes to the financial statements. |
|
|
Report of Independent Registered Public Accounting Firm |
|
|
|
Trustees and Officers |
|
|
|
Distributions |
|
|
To view a fund's proxy voting guidelines and proxy voting record for the 12-month period ended June 30, visit http://www.fidelity.com/proxyvotingresults or visit the Securities and Exchange Commission's (SEC) web site at http://www.sec.gov. You may also call 1-800-544-8544 to request a free copy of the proxy voting guidelines.
Annual Report
Standard & Poor's, S&P and S&P 500 are registered service marks of The McGraw-Hill Companies, Inc. and have been licensed for use by Fidelity Distributors Corporation.
Other third-party marks appearing herein are the property of their respective owners.
All other marks appearing herein are registered or unregistered trademarks or service marks of FMR LLC or an affiliated company. © 2014 FMR LLC. All rights reserved.
This report and the financial statements contained herein are submitted for the general information of the shareholders of the funds. This report is not authorized for distribution to prospective investors in the funds unless preceded or accompanied by an effective prospectus.
A fund files its complete schedule of portfolio holdings with the SEC for the first and third quarters of each fiscal year on Form N-Q. Forms N-Q are available on the SEC's web site at http://www.sec.gov. A fund's Forms N-Q may be reviewed and copied at the SEC's Public Reference Room in Washington, DC. Information regarding the operation of the SEC's Public Reference Room may be obtained by calling 1-800-SEC-0330. For a complete list of a fund's portfolio holdings, view the most recent holdings listing, semiannual report, or annual report on Fidelity's web site at http://www.fidelity.com, http://www.advisor.fidelity.com, or http://www.401k.com, as applicable.
NOT FDIC INSURED • MAY LOSE VALUE • NO BANK GUARANTEE
Neither the funds nor Fidelity Distributors Corporation is a bank.
Annual Report
Shareholder Expense Example
As a shareholder of a Fund, you incur two types of costs: (1) transaction costs, including redemption fees and (2) ongoing costs, including management fees and other Fund expenses. This Example is intended to help you understand your ongoing costs (in dollars) of investing in the Funds and to compare these costs with the ongoing costs of investing in other mutual funds.
The Example is based on an investment of $1,000 invested at the beginning of the period and held for the entire period (November 1, 2013 to April 30, 2014).
Actual Expenses
The first line of the accompanying table for each class of each fund provides information about actual account values and actual expenses. You may use the information in this line, together with the amount you invested, to estimate the expenses that you paid over the period. Simply divide your account value by $1,000.00 (for example, an $8,600 account value divided by $1,000.00 = 8.6), then multiply the result by the number in the first line for a class of the fund under the heading entitled "Expenses Paid During Period" to estimate the expenses you paid on your account during this period. A small balance maintenance fee of $12.00 that is charged once a year may apply for certain accounts with a value of less than $2,000. This fee is not included in the table below. If it was, the estimate of expenses you paid during the period would be higher, and your ending account value lower, by this amount. In addition, each Fund, as a shareholder in the underlying Fidelity Central Funds, will indirectly bear its pro-rata share of the fees and expenses incurred by the underlying Fidelity Central Funds. These fees and expenses are not included in the Fund's annualized expense ratio used to calculate the expense estimate in the table below.
Hypothetical Example for Comparison Purposes
The second line of the accompanying table for each class of each fund provides information about hypothetical account values and hypothetical expenses based on a Class' actual expense ratio and an assumed rate of return of 5% per year before expenses, which is not the Class' actual return. The hypothetical account values and expenses may not be used to estimate the actual ending account balance or expenses you paid for the period. You may use this information to compare the ongoing costs of investing in the Fund and other funds. To do so, compare this 5% hypothetical example with the 5% hypothetical examples that appear in the shareholder reports of the other funds. A small balance maintenance fee of $12.00 that is charged once a year may apply for certain accounts with a value of less than $2,000. This fee is not included in the table below. If it was, the estimate of expenses you paid during the period would be higher, and your ending account value lower, by this amount. In addition, each Fund, as a shareholder in the underlying Fidelity Central Funds, will indirectly bear its pro-rata share of the fees and expenses incurred by the underlying Fidelity Central Funds. These fees and expenses are not included in the Fund's annualized expense ratio used to calculate the expense estimate in the table below.
Please note that the expenses shown in the table are meant to highlight your ongoing costs only and do not reflect any transaction costs. Therefore, the second line of the table is useful in comparing ongoing costs only, and will not help you determine the relative total costs of owning different funds. In addition, if these transactional costs were included, your costs would have been higher.
Annual Report
|
|
Annualized |
Beginning |
Ending |
Expenses Paid |
|
Spartan Mid Cap Index Fund |
|
|
|
|
|
Investor Class |
.22% |
|
|
|
|
Actual |
|
$ 1,000.00 |
$ 1,076.10 |
$ 1.13 |
|
HypotheticalA |
|
$ 1,000.00 |
$ 1,023.70 |
$ 1.10 |
|
Fidelity Advantage Class |
.08% |
|
|
|
|
Actual |
|
$ 1,000.00 |
$ 1,076.90 |
$ .41 |
|
HypotheticalA |
|
$ 1,000.00 |
$ 1,024.40 |
$ .40 |
|
Institutional Class |
.06% |
|
|
|
|
Actual |
|
$ 1,000.00 |
$ 1,077.00 |
$ .31 |
|
HypotheticalA |
|
$ 1,000.00 |
$ 1,024.50 |
$ .30 |
|
Fidelity Advantage Institutional Class |
.04% |
|
|
|
|
Actual |
|
$ 1,000.00 |
$ 1,077.10 |
$ .21 |
|
HypotheticalA |
|
$ 1,000.00 |
$ 1,024.60 |
$ .20 |
|
Spartan Small Cap Index Fund |
|
|
|
|
|
Investor Class |
.23% |
|
|
|
|
Actual |
|
$ 1,000.00 |
$ 1,030.40 |
$ 1.16 |
|
HypotheticalA |
|
$ 1,000.00 |
$ 1,023.65 |
$ 1.15 |
|
Fidelity Advantage Class |
.09% |
|
|
|
|
Actual |
|
$ 1,000.00 |
$ 1,031.20 |
$ .45 |
|
HypotheticalA |
|
$ 1,000.00 |
$ 1,024.35 |
$ .45 |
|
Institutional Class |
.07% |
|
|
|
|
Actual |
|
$ 1,000.00 |
$ 1,032.00 |
$ .35 |
|
HypotheticalA |
|
$ 1,000.00 |
$ 1,024.45 |
$ .35 |
|
Fidelity Advantage Institutional Class |
.05% |
|
|
|
|
Actual |
|
$ 1,000.00 |
$ 1,032.10 |
$ .25 |
|
HypotheticalA |
|
$ 1,000.00 |
$ 1,024.55 |
$ .25 |
A 5% return per year before expenses
B Annualized expense ratio reflects expenses net of applicable fee waivers.
* Expenses are equal to each Class' annualized expense ratio, multiplied by the average account value over the period, multiplied by 181/ 365 (to reflect the one-half year period).
Annual Report
Spartan® Mid Cap Index Fund
Performance: The Bottom Line
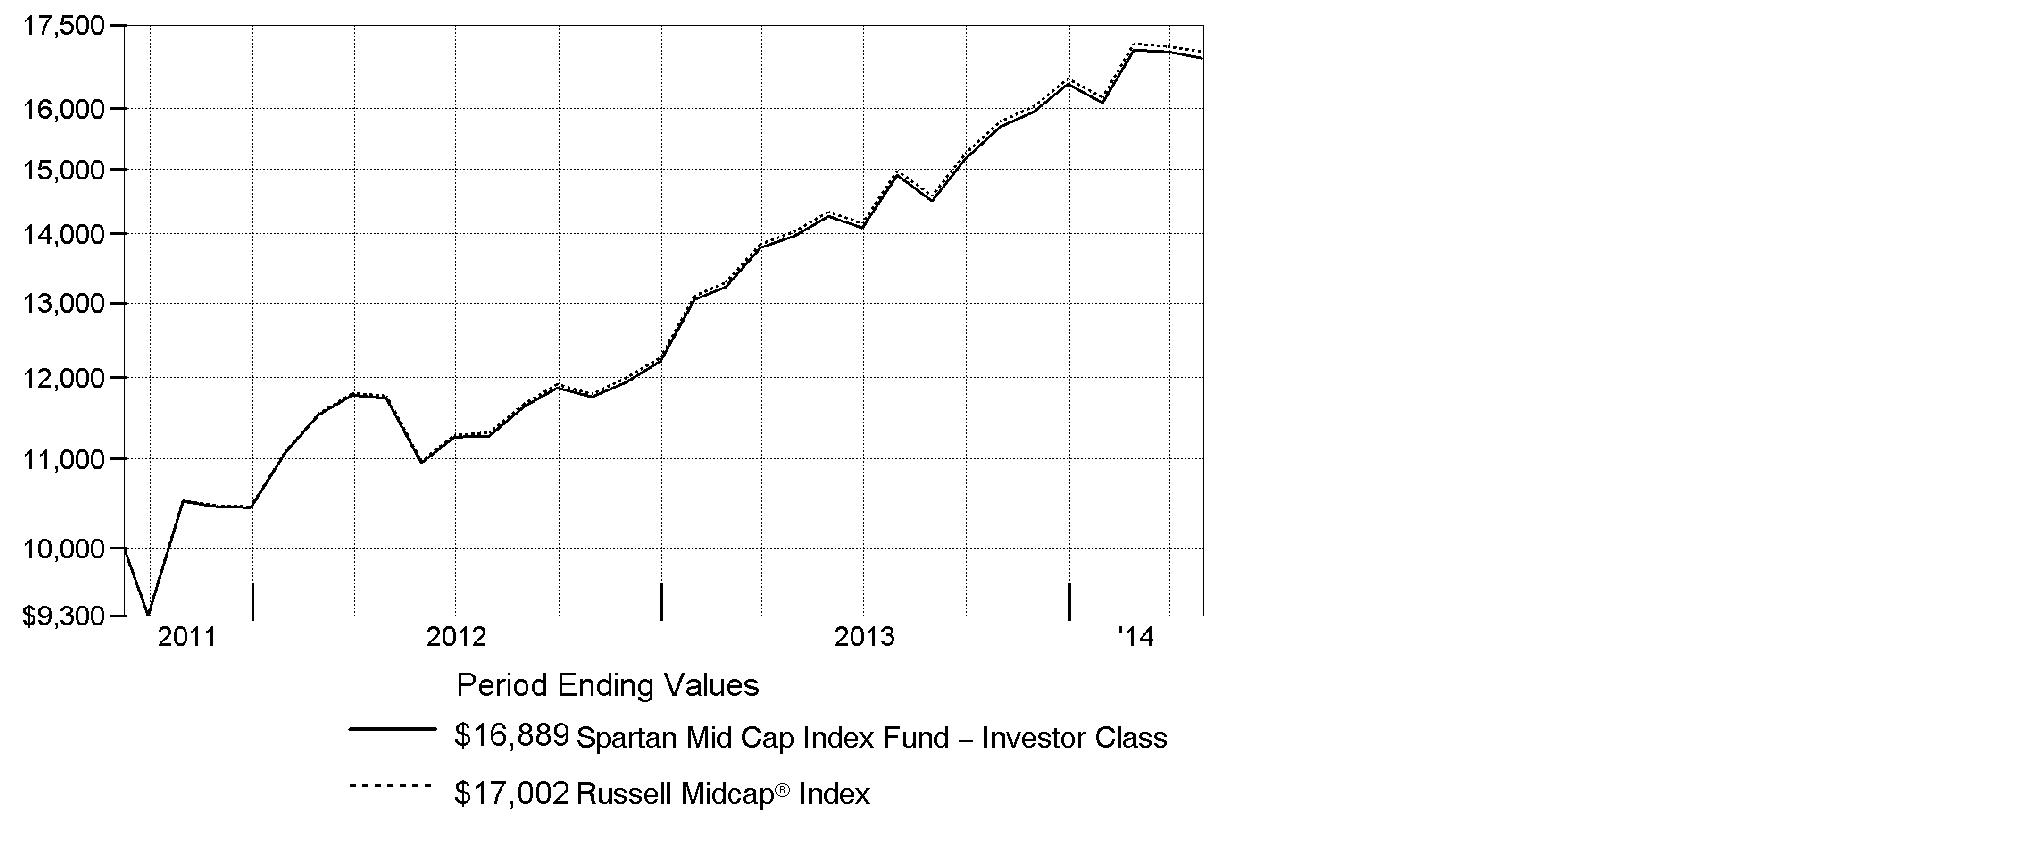
Average annual total return reflects the change in the value of an investment, assuming reinvestment of the class' distributions from dividend income and capital gains (the profits earned upon the sale of securities that have grown in value, if any) and assuming a constant rate of performance each year. The $10,000 table and the fund's returns do not reflect the deduction of taxes that a shareholder would pay on fund distributions or the redemption of fund shares. During periods of reimbursement by Fidelity, a fund's total return will be greater than it would be had the reimbursement not occurred. How a fund did yesterday is no guarantee of how it will do tomorrow.
Average Annual Total Returns
|
Periods ended April 30, 2014 |
Past 1 |
Life of |
|
Investor Class |
20.99% |
21.92% |
|
Fidelity Advantage® Class |
21.14% |
22.09% |
A From September 8, 2011.
$10,000 Over Life of Fund
Let's say hypothetically that $10,000 was invested in Spartan Mid Cap Index Fund - Investor Class on September 8, 2011, when the fund started. The chart shows how the value of your investment would have changed, and also shows how the Russell Midcap® Index performed over the same period.
Annual Report
Spartan Mid Cap Index Fund
Management's Discussion of Fund Performance
Market Recap: U.S. stocks overcame fears of higher interest rates, slower economic growth and a volatile start to 2014 to post strong gains for the 12 months ending April 30, 2014. The S&P 500® Index returned 20.44%, finishing near its all-time high. U.S. Federal Reserve policies that balanced stimulus reductions with low interest rates contributed to a broad advance, with eight of 10 S&P 500® market sectors posting a double-digit gain. Industrials was the best-performing sector, up about 30%, as demand improved for autos and other durable goods. Health care stocks rose 25%, as new insurance programs and a favorable drug-approval environment raised earnings-growth expectations. Conversely, the typically defensive telecommunication services sector was the only group to lose ground (-3%), while utilities (+8%) lagged. Volatility increased in the first quarter amid rising tension in Ukraine, fear of a slowing economy in China and a late-January decline for momentum stocks. Still, markets finished the period on an uptrend, aided by higher consumer spending and the lowest unemployment since 2008 - both of which helped to take the sting out of weather-beaten first-quarter gross domestic product (GDP) figures. The growth-oriented Nasdaq Composite Index® rose 25.20%, the small-cap Russell 2000® Index returned 20.50% and the Russell Midcap® Index added 21.25%.
Comments from Patrick Waddell, who was named Senior Portfolio Manager of the Geode Capital Management, LLC, investment management team for Spartan® Mid Cap Index Fund on April 4, 2014: For the 12-month period ending April 30, 2014, the fund's Investor Class and Fidelity Advantage® Class shares gained 20.99% and 21.14%, respectively, in line with the Russell Midcap® Index. Delta Air Lines was the top individual contributor, benefiting from strong financial results. Also doing very well was drugmaker Forest Laboratories; its shares more than doubled in February after the company agreed to be acquired at a premium price by Actavis, itself one of the fund's leading contributors. Tesla Motors, a maker of luxury electric vehicles, saw its share price rise more than fourfold, driven by investors' heightened optimism about the company's business prospects. The semiconductor industry provided yet another source of strength for the market. Within this group, Micron Technology and Avago Technologies both added to results. In contrast, some detractors were shares of real estate investment trusts (REITs), which lagged as investors worried about the potential financial impact of higher interest rates. Health care REITs HCP and Ventas, and mortgage REITs American Capital Agency and Annaly Capital Management, fared poorly. Another notable laggard was Catamaran, a pharmacy benefit manager; its shares dropped in February after the company gave weaker-than-expected earnings guidance.
The views expressed above reflect those of the portfolio manager(s) only through the end of the period as stated on the cover of this report and do not necessarily represent the views of Fidelity or any other person in the Fidelity organization. Any such views are subject to change at any time based upon market or other conditions and Fidelity disclaims any responsibility to update such views. These views may not be relied on as investment advice and, because investment decisions for a Fidelity fund are based on numerous factors, may not be relied on as an indication of trading intent on behalf of any Fidelity fund.
Annual Report
Spartan Mid Cap Index Fund
Investment Changes (Unaudited)
|
Top Ten Stocks as of April 30, 2014 |
||
|
|
% of fund's |
% of fund's net assets |
|
Actavis PLC |
0.6 |
0.5 |
|
Delta Air Lines, Inc. |
0.5 |
0.4 |
|
Alexion Pharmaceuticals, Inc. |
0.5 |
0.4 |
|
Micron Technology, Inc. |
0.4 |
0.3 |
|
Pioneer Natural Resources Co. |
0.4 |
0.5 |
|
Aon PLC |
0.4 |
0.4 |
|
Noble Energy, Inc. |
0.4 |
0.5 |
|
Forest Laboratories, Inc. |
0.4 |
0.2 |
|
Crown Castle International Corp. |
0.4 |
0.4 |
|
Sempra Energy |
0.4 |
0.4 |
|
|
4.4 |
|
|
Market Sectors as of April 30, 2014 |
||
|
|
% of fund's |
% of fund's net assets |
|
Financials |
20.0 |
19.6 |
|
Consumer Discretionary |
16.6 |
17.2 |
|
Industrials |
13.5 |
12.9 |
|
Information Technology |
13.3 |
13.1 |
|
Health Care |
11.0 |
10.6 |
|
Energy |
7.1 |
6.7 |
|
Utilities |
6.1 |
6.1 |
|
Materials |
5.7 |
5.5 |
|
Consumer Staples |
5.7 |
5.7 |
|
Telecommunication Services |
0.7 |
1.1 |
Annual Report
Spartan Mid Cap Index Fund
Investments April 30, 2014
Showing Percentage of Net Assets
|
Common Stocks - 99.7% |
|||
|
Shares |
Value |
||
|
CONSUMER DISCRETIONARY - 16.6% |
|||
|
Auto Components - 1.1% |
|||
|
Allison Transmission Holdings, Inc. |
3,633 |
$ 108,409 |
|
|
BorgWarner, Inc. |
24,439 |
1,518,639 |
|
|
Delphi Automotive PLC |
33,021 |
2,207,124 |
|
|
Gentex Corp. |
15,171 |
434,953 |
|
|
Lear Corp. |
8,527 |
708,253 |
|
|
The Goodyear Tire & Rubber Co. |
25,818 |
650,614 |
|
|
TRW Automotive Holdings Corp. (a) |
10,492 |
843,032 |
|
|
Visteon Corp. (a) |
5,251 |
455,839 |
|
|
|
6,926,863 |
||
|
Automobiles - 0.6% |
|||
|
Harley-Davidson, Inc. |
23,672 |
1,750,308 |
|
|
Tesla Motors, Inc. (a)(d) |
8,831 |
1,835,877 |
|
|
Thor Industries, Inc. |
4,678 |
284,750 |
|
|
|
3,870,935 |
||
|
Distributors - 0.4% |
|||
|
Genuine Parts Co. |
16,392 |
1,428,071 |
|
|
LKQ Corp. (a) |
31,360 |
913,203 |
|
|
|
2,341,274 |
||
|
Diversified Consumer Services - 0.3% |
|||
|
Apollo Ed Group, Inc. Class A (non-vtg.) (a) |
10,260 |
296,104 |
|
|
DeVry, Inc. |
6,657 |
299,765 |
|
|
Graham Holdings Co. |
462 |
310,108 |
|
|
H&R Block, Inc. |
28,619 |
813,352 |
|
|
Service Corp. International |
22,398 |
420,410 |
|
|
Weight Watchers International, Inc. (d) |
2,882 |
57,064 |
|
|
|
2,196,803 |
||
|
Hotels, Restaurants & Leisure - 2.2% |
|||
|
ARAMARK Holdings Corp. |
4,413 |
124,402 |
|
|
Bally Technologies, Inc. (a)(d) |
4,111 |
267,667 |
|
|
Brinker International, Inc. |
7,017 |
344,815 |
|
|
Burger King Worldwide, Inc. (d) |
10,540 |
275,410 |
|
|
Chipotle Mexican Grill, Inc. (a) |
3,265 |
1,627,603 |
|
|
Choice Hotels International, Inc. |
2,849 |
125,869 |
|
|
Darden Restaurants, Inc. |
13,651 |
678,591 |
|
|
Domino's Pizza, Inc. |
5,978 |
444,644 |
|
|
Dunkin' Brands Group, Inc. |
11,292 |
513,899 |
|
|
Hilton Worldwide Holdings, Inc. |
14,281 |
311,754 |
|
|
Hyatt Hotels Corp. Class A (a) |
4,819 |
271,213 |
|
|
International Game Technology |
26,012 |
326,451 |
|
|
Common Stocks - continued |
|||
|
Shares |
Value |
||
|
CONSUMER DISCRETIONARY - continued |
|||
|
Hotels, Restaurants & Leisure - continued |
|||
|
Marriott International, Inc. Class A (d) |
24,618 |
$ 1,426,121 |
|
|
MGM Mirage, Inc. (a) |
39,318 |
991,993 |
|
|
Norwegian Cruise Line Holdings Ltd. (a) |
2,879 |
94,345 |
|
|
Panera Bread Co. Class A (a)(d) |
2,794 |
427,398 |
|
|
Penn National Gaming, Inc. (a) |
7,414 |
82,740 |
|
|
Royal Caribbean Cruises Ltd. |
17,146 |
910,967 |
|
|
SeaWorld Entertainment, Inc. |
3,266 |
98,176 |
|
|
Six Flags Entertainment Corp. |
6,998 |
280,900 |
|
|
Starwood Hotels & Resorts Worldwide, Inc. |
20,571 |
1,576,767 |
|
|
Wendy's Co. |
27,496 |
228,492 |
|
|
Wyndham Worldwide Corp. |
13,479 |
961,592 |
|
|
Wynn Resorts Ltd. |
8,520 |
1,737,143 |
|
|
|
14,128,952 |
||
|
Household Durables - 1.6% |
|||
|
D.R. Horton, Inc. |
29,814 |
664,256 |
|
|
Garmin Ltd. (d) |
12,887 |
735,848 |
|
|
Harman International Industries, Inc. |
7,132 |
781,739 |
|
|
Jarden Corp. (a) |
13,396 |
765,581 |
|
|
Leggett & Platt, Inc. (d) |
15,134 |
497,303 |
|
|
Lennar Corp. Class A |
17,494 |
675,093 |
|
|
Mohawk Industries, Inc. (a) |
6,403 |
847,821 |
|
|
Newell Rubbermaid, Inc. |
30,426 |
916,127 |
|
|
NVR, Inc. (a) |
497 |
535,269 |
|
|
PulteGroup, Inc. |
41,089 |
755,627 |
|
|
Taylor Morrison Home Corp. |
3,408 |
72,284 |
|
|
Tempur Sealy International, Inc. (a) |
6,388 |
320,550 |
|
|
Toll Brothers, Inc. (a)(d) |
18,813 |
644,157 |
|
|
Tupperware Brands Corp. |
5,589 |
474,562 |
|
|
Whirlpool Corp. |
8,323 |
1,276,582 |
|
|
|
9,962,799 |
||
|
Internet & Catalog Retail - 1.0% |
|||
|
Expedia, Inc. |
11,188 |
794,236 |
|
|
Groupon, Inc. Class A (a)(d) |
44,193 |
308,909 |
|
|
HomeAway, Inc. (a) |
6,442 |
210,138 |
|
|
Lands' End, Inc. (a)(d) |
1,427 |
39,457 |
|
|
Liberty Interactive Corp.: |
|
|
|
|
(Venture Group) Series A (a) |
7,832 |
454,569 |
|
|
Series A (a) |
52,707 |
1,531,665 |
|
|
Netflix, Inc. (a) |
5,307 |
1,709,066 |
|
|
Common Stocks - continued |
|||
|
Shares |
Value |
||
|
CONSUMER DISCRETIONARY - continued |
|||
|
Internet & Catalog Retail - continued |
|||
|
TripAdvisor, Inc. (a) |
11,775 |
$ 950,714 |
|
|
zulily, Inc. (d) |
1,364 |
57,997 |
|
|
|
6,056,751 |
||
|
Leisure Products - 0.5% |
|||
|
Hasbro, Inc. |
12,140 |
670,856 |
|
|
Mattel, Inc. |
36,482 |
1,430,642 |
|
|
Polaris Industries, Inc. |
6,803 |
913,847 |
|
|
|
3,015,345 |
||
|
Media - 2.1% |
|||
|
AMC Networks, Inc. Class A (a)(d) |
6,372 |
418,449 |
|
|
Cablevision Systems Corp. - NY Group Class A (d) |
20,557 |
343,302 |
|
|
Charter Communications, Inc. Class A (a) |
6,949 |
941,798 |
|
|
Cinemark Holdings, Inc. |
12,220 |
361,956 |
|
|
Clear Channel Outdoor Holding, Inc. Class A |
4,568 |
36,635 |
|
|
Discovery Communications, Inc. Class A (a) |
25,855 |
1,962,395 |
|
|
DISH Network Corp. Class A (a) |
22,042 |
1,253,308 |
|
|
DreamWorks Animation SKG, Inc. Class A (a)(d) |
7,818 |
187,867 |
|
|
Gannett Co., Inc. |
24,258 |
659,090 |
|
|
Interpublic Group of Companies, Inc. |
45,039 |
784,579 |
|
|
John Wiley & Sons, Inc. Class A |
4,762 |
273,625 |
|
|
Lamar Advertising Co. Class A (a) |
8,354 |
417,032 |
|
|
Liberty Media Corp. Class A (a) |
10,111 |
1,311,498 |
|
|
Lions Gate Entertainment Corp. (d) |
8,554 |
226,938 |
|
|
Morningstar, Inc. |
2,211 |
162,133 |
|
|
Omnicom Group, Inc. |
27,326 |
1,849,424 |
|
|
Regal Entertainment Group Class A (d) |
8,411 |
158,127 |
|
|
Scripps Networks Interactive, Inc. Class A |
11,510 |
864,056 |
|
|
Starz - Liberty Capital Series A (a) |
11,402 |
367,943 |
|
|
The Madison Square Garden Co. Class A (a) |
6,483 |
353,972 |
|
|
|
12,934,127 |
||
|
Multiline Retail - 1.4% |
|||
|
Big Lots, Inc. (a) |
6,138 |
242,451 |
|
|
Dillard's, Inc. Class A |
2,871 |
281,157 |
|
|
Dollar General Corp. (a) |
32,744 |
1,848,071 |
|
|
Dollar Tree, Inc. (a) |
21,999 |
1,145,488 |
|
|
Family Dollar Stores, Inc. |
10,193 |
598,839 |
|
|
J.C. Penney Co., Inc. (a)(d) |
24,930 |
212,404 |
|
|
Kohl's Corp. |
22,052 |
1,208,229 |
|
|
Macy's, Inc. |
40,538 |
2,328,097 |
|
|
Common Stocks - continued |
|||
|
Shares |
Value |
||
|
CONSUMER DISCRETIONARY - continued |
|||
|
Multiline Retail - continued |
|||
|
Nordstrom, Inc. |
15,233 |
$ 933,478 |
|
|
Sears Holdings Corp. (a)(d) |
4,586 |
200,913 |
|
|
|
8,999,127 |
||
|
Specialty Retail - 3.7% |
|||
|
Aarons, Inc. Class A |
7,535 |
222,056 |
|
|
Abercrombie & Fitch Co. Class A (d) |
7,768 |
285,552 |
|
|
Advance Auto Parts, Inc. |
7,710 |
935,146 |
|
|
American Eagle Outfitters, Inc. (d) |
20,410 |
235,940 |
|
|
Ascena Retail Group, Inc. (a) |
13,532 |
232,750 |
|
|
AutoNation, Inc. (a) |
5,388 |
285,510 |
|
|
AutoZone, Inc. (a) |
3,526 |
1,882,496 |
|
|
Bed Bath & Beyond, Inc. (a) |
23,085 |
1,434,271 |
|
|
Best Buy Co., Inc. (d) |
28,631 |
742,402 |
|
|
Cabela's, Inc. Class A (a)(d) |
5,011 |
328,772 |
|
|
CarMax, Inc. (a)(d) |
23,727 |
1,038,768 |
|
|
Chico's FAS, Inc. |
16,074 |
255,255 |
|
|
CST Brands, Inc. |
6,443 |
210,235 |
|
|
Dick's Sporting Goods, Inc. |
10,457 |
550,666 |
|
|
DSW, Inc. Class A |
7,551 |
252,128 |
|
|
Foot Locker, Inc. |
15,780 |
734,243 |
|
|
GameStop Corp. Class A (d) |
12,572 |
498,857 |
|
|
Gap, Inc. |
29,501 |
1,159,389 |
|
|
GNC Holdings, Inc. |
9,636 |
433,620 |
|
|
Guess?, Inc. |
6,135 |
165,093 |
|
|
L Brands, Inc. |
25,403 |
1,376,843 |
|
|
Murphy U.S.A., Inc. (a) |
5,107 |
217,048 |
|
|
O'Reilly Automotive, Inc. (a) |
11,670 |
1,736,379 |
|
|
PetSmart, Inc. |
10,845 |
733,990 |
|
|
Ross Stores, Inc. |
23,220 |
1,580,818 |
|
|
Sally Beauty Holdings, Inc. (a) |
17,987 |
493,024 |
|
|
Signet Jewelers Ltd. |
8,543 |
865,577 |
|
|
Staples, Inc. (d) |
70,164 |
877,050 |
|
|
Tiffany & Co., Inc. |
11,812 |
1,033,432 |
|
|
Tractor Supply Co. |
14,655 |
985,402 |
|
|
Ulta Salon, Cosmetics & Fragrance, Inc. (a) |
6,676 |
585,552 |
|
|
Urban Outfitters, Inc. (a) |
11,366 |
405,255 |
|
|
Williams-Sonoma, Inc. |
10,253 |
644,093 |
|
|
|
23,417,612 |
||
|
Textiles, Apparel & Luxury Goods - 1.7% |
|||
|
Carter's, Inc. |
5,773 |
425,239 |
|
|
Common Stocks - continued |
|||
|
Shares |
Value |
||
|
CONSUMER DISCRETIONARY - continued |
|||
|
Textiles, Apparel & Luxury Goods - continued |
|||
|
Coach, Inc. |
29,669 |
$ 1,324,721 |
|
|
Deckers Outdoor Corp. (a)(d) |
3,630 |
286,589 |
|
|
Fossil Group, Inc. (a) |
5,118 |
545,835 |
|
|
Hanesbrands, Inc. |
10,413 |
854,803 |
|
|
Michael Kors Holdings Ltd. (a) |
21,280 |
1,940,736 |
|
|
PVH Corp. |
8,565 |
1,075,507 |
|
|
Ralph Lauren Corp. |
6,301 |
953,782 |
|
|
Under Armour, Inc. Class A (sub. vtg.) (a)(d) |
17,696 |
865,157 |
|
|
VF Corp. |
37,010 |
2,260,941 |
|
|
|
10,533,310 |
||
|
TOTAL CONSUMER DISCRETIONARY |
104,383,898 |
||
|
CONSUMER STAPLES - 5.7% |
|||
|
Beverages - 1.3% |
|||
|
Beam, Inc. |
16,790 |
1,401,461 |
|
|
Brown-Forman Corp. Class B (non-vtg.) |
15,974 |
1,433,187 |
|
|
Coca-Cola Enterprises, Inc. |
27,448 |
1,247,237 |
|
|
Constellation Brands, Inc. Class A (sub. vtg.) (a) |
16,243 |
1,296,841 |
|
|
Dr. Pepper Snapple Group, Inc. |
21,562 |
1,194,966 |
|
|
Molson Coors Brewing Co. Class B |
14,755 |
884,857 |
|
|
Monster Beverage Corp. (a) |
14,185 |
949,828 |
|
|
|
8,408,377 |
||
|
Food & Staples Retailing - 0.9% |
|||
|
Fresh Market, Inc. (a)(d) |
4,186 |
155,301 |
|
|
Kroger Co. |
54,943 |
2,529,576 |
|
|
Safeway, Inc. |
25,483 |
867,951 |
|
|
Sprouts Farmers Market LLC (d) |
2,090 |
66,817 |
|
|
Whole Foods Market, Inc. |
39,184 |
1,947,445 |
|
|
|
5,567,090 |
||
|
Food Products - 2.3% |
|||
|
Bunge Ltd. |
15,539 |
1,237,681 |
|
|
Campbell Soup Co. (d) |
18,517 |
842,338 |
|
|
ConAgra Foods, Inc. |
44,004 |
1,342,562 |
|
|
Dean Foods Co. |
9,909 |
156,959 |
|
|
Flowers Foods, Inc. |
18,129 |
372,007 |
|
|
Hillshire Brands Co. |
12,987 |
462,987 |
|
|
Hormel Foods Corp. |
14,070 |
670,998 |
|
|
Ingredion, Inc. |
8,188 |
576,845 |
|
|
Keurig Green Mountain, Inc. |
15,757 |
1,476,116 |
|
|
Common Stocks - continued |
|||
|
Shares |
Value |
||
|
CONSUMER STAPLES - continued |
|||
|
Food Products - continued |
|||
|
McCormick & Co., Inc. (non-vtg.) |
13,924 |
$ 991,389 |
|
|
Mead Johnson Nutrition Co. Class A |
21,387 |
1,887,617 |
|
|
Pinnacle Foods, Inc. |
3,447 |
104,789 |
|
|
The Hershey Co. |
15,836 |
1,524,057 |
|
|
The J.M. Smucker Co. |
11,327 |
1,095,094 |
|
|
Tyson Foods, Inc. Class A |
29,596 |
1,242,144 |
|
|
WhiteWave Foods Co. (a) |
14,669 |
406,185 |
|
|
|
14,389,768 |
||
|
Household Products - 0.5% |
|||
|
Church & Dwight Co., Inc. (d) |
14,589 |
1,006,787 |
|
|
Clorox Co. |
13,865 |
1,257,556 |
|
|
Energizer Holdings, Inc. |
6,575 |
734,362 |
|
|
|
2,998,705 |
||
|
Personal Products - 0.3% |
|||
|
Avon Products, Inc. |
45,485 |
695,011 |
|
|
Coty, Inc. Class A |
6,102 |
97,937 |
|
|
Herbalife Ltd. (d) |
9,012 |
540,540 |
|
|
Nu Skin Enterprises, Inc. Class A |
6,125 |
532,875 |
|
|
|
1,866,363 |
||
|
Tobacco - 0.4% |
|||
|
Lorillard, Inc. |
39,907 |
2,371,274 |
|
|
TOTAL CONSUMER STAPLES |
35,601,577 |
||
|
ENERGY - 7.1% |
|||
|
Energy Equipment & Services - 1.8% |
|||
|
Atwood Oceanics, Inc. (a) |
6,007 |
297,707 |
|
|
Cameron International Corp. (a) |
22,160 |
1,439,514 |
|
|
Diamond Offshore Drilling, Inc. (d) |
7,281 |
397,615 |
|
|
Dresser-Rand Group, Inc. (a) |
8,050 |
486,542 |
|
|
Dril-Quip, Inc. (a) |
4,293 |
485,624 |
|
|
FMC Technologies, Inc. (a) |
25,052 |
1,420,448 |
|
|
Frank's International NV (d) |
3,524 |
96,663 |
|
|
Helmerich & Payne, Inc. |
10,034 |
1,090,194 |
|
|
McDermott International, Inc. (a)(d) |
25,101 |
181,480 |
|
|
Nabors Industries Ltd. |
30,912 |
788,874 |
|
|
Oceaneering International, Inc. |
11,409 |
836,052 |
|
|
Oil States International, Inc. (a) |
5,809 |
564,286 |
|
|
Patterson-UTI Energy, Inc. |
15,544 |
505,646 |
|
|
Rowan Companies PLC |
13,183 |
407,618 |
|
|
Common Stocks - continued |
|||
|
Shares |
Value |
||
|
ENERGY - continued |
|||
|
Energy Equipment & Services - continued |
|||
|
RPC, Inc. |
6,455 |
$ 143,495 |
|
|
Seadrill Ltd. (d) |
37,327 |
1,314,657 |
|
|
Superior Energy Services, Inc. |
16,915 |
556,842 |
|
|
Tidewater, Inc. |
5,233 |
266,517 |
|
|
Unit Corp. |
5,200 |
342,940 |
|
|
|
11,622,714 |
||
|
Oil, Gas & Consumable Fuels - 5.3% |
|||
|
Antero Resources Corp. (d) |
3,988 |
261,892 |
|
|
Cabot Oil & Gas Corp. |
44,519 |
1,748,706 |
|
|
Cheniere Energy, Inc. (a) |
25,499 |
1,439,419 |
|
|
Chesapeake Energy Corp. |
61,204 |
1,759,615 |
|
|
Cimarex Energy Co. |
9,140 |
1,088,757 |
|
|
Cobalt International Energy, Inc. (a) |
29,086 |
523,548 |
|
|
Concho Resources, Inc. (a) |
11,070 |
1,444,082 |
|
|
CONSOL Energy, Inc. |
24,027 |
1,069,442 |
|
|
Continental Resources, Inc. (a)(d) |
4,520 |
626,110 |
|
|
CVR Energy, Inc. (d) |
1,666 |
81,884 |
|
|
Denbury Resources, Inc. (d) |
37,139 |
624,678 |
|
|
Energen Corp. |
7,651 |
596,089 |
|
|
EP Energy Corp. |
3,869 |
75,175 |
|
|
EQT Corp. |
15,893 |
1,732,178 |
|
|
Golar LNG Ltd. (NASDAQ) (d) |
4,661 |
206,016 |
|
|
Gulfport Energy Corp. (a) |
8,937 |
658,389 |
|
|
HollyFrontier Corp. |
21,457 |
1,128,424 |
|
|
Kosmos Energy Ltd. (a) |
10,438 |
113,983 |
|
|
Laredo Petroleum Holdings, Inc. (a)(d) |
4,385 |
128,174 |
|
|
Murphy Oil Corp. |
18,955 |
1,202,316 |
|
|
Newfield Exploration Co. (a) |
14,255 |
482,532 |
|
|
Noble Energy, Inc. |
37,881 |
2,719,098 |
|
|
Oasis Petroleum, Inc. (a)(d) |
10,667 |
496,122 |
|
|
ONEOK, Inc. |
21,773 |
1,376,489 |
|
|
PBF Energy, Inc. Class A |
2,470 |
76,027 |
|
|
Peabody Energy Corp. (d) |
28,500 |
541,785 |
|
|
Pioneer Natural Resources Co. |
14,427 |
2,788,306 |
|
|
QEP Resources, Inc. |
18,954 |
581,698 |
|
|
Range Resources Corp. |
17,227 |
1,558,182 |
|
|
Rice Energy, Inc. |
5,276 |
156,697 |
|
|
SandRidge Energy, Inc. (a)(d) |
52,340 |
359,052 |
|
|
SM Energy Co. |
7,007 |
519,429 |
|
|
Southwestern Energy Co. (a) |
37,128 |
1,777,689 |
|
|
Common Stocks - continued |
|||
|
Shares |
Value |
||
|
ENERGY - continued |
|||
|
Oil, Gas & Consumable Fuels - continued |
|||
|
Teekay Corp. |
4,036 |
$ 226,460 |
|
|
Tesoro Corp. |
14,262 |
802,808 |
|
|
Ultra Petroleum Corp. (a)(d) |
16,116 |
480,257 |
|
|
Whiting Petroleum Corp. (a) |
12,392 |
913,538 |
|
|
World Fuel Services Corp. |
7,675 |
349,520 |
|
|
WPX Energy, Inc. (a) |
21,106 |
449,136 |
|
|
|
33,163,702 |
||
|
TOTAL ENERGY |
44,786,416 |
||
|
FINANCIALS - 20.0% |
|||
|
Banks - 3.0% |
|||
|
Associated Banc-Corp. |
17,854 |
313,338 |
|
|
Bank of Hawaii Corp. |
4,789 |
264,209 |
|
|
BankUnited, Inc. |
6,833 |
225,421 |
|
|
BOK Financial Corp. |
2,810 |
183,830 |
|
|
CIT Group, Inc. |
21,146 |
910,335 |
|
|
City National Corp. |
4,888 |
354,722 |
|
|
Comerica, Inc. |
19,685 |
949,604 |
|
|
Commerce Bancshares, Inc. |
8,588 |
373,406 |
|
|
Cullen/Frost Bankers, Inc. (d) |
5,455 |
416,817 |
|
|
East West Bancorp, Inc. |
14,959 |
516,235 |
|
|
Fifth Third Bancorp |
92,382 |
1,903,993 |
|
|
First Citizen Bancshares, Inc. |
781 |
175,639 |
|
|
First Horizon National Corp. |
25,433 |
292,225 |
|
|
First Niagara Financial Group, Inc. |
37,380 |
333,430 |
|
|
First Republic Bank |
12,325 |
625,617 |
|
|
Fulton Financial Corp. |
20,328 |
247,798 |
|
|
Huntington Bancshares, Inc. |
88,825 |
813,637 |
|
|
KeyCorp |
96,797 |
1,320,311 |
|
|
M&T Bank Corp. (d) |
13,616 |
1,661,288 |
|
|
Popular, Inc. (a) |
10,917 |
337,335 |
|
|
Regions Financial Corp. |
149,412 |
1,515,038 |
|
|
Signature Bank (a) |
4,964 |
589,822 |
|
|
SunTrust Banks, Inc. |
57,065 |
2,183,307 |
|
|
SVB Financial Group (a) |
4,779 |
509,872 |
|
|
Synovus Financial Corp. |
103,757 |
333,060 |
|
|
TCF Financial Corp. |
17,388 |
272,992 |
|
|
Common Stocks - continued |
|||
|
Shares |
Value |
||
|
FINANCIALS - continued |
|||
|
Banks - continued |
|||
|
Valley National Bancorp (d) |
20,890 |
$ 209,318 |
|
|
Zions Bancorporation |
19,499 |
563,911 |
|
|
|
18,396,510 |
||
|
Capital Markets - 2.4% |
|||
|
Affiliated Managers Group, Inc. (a) |
5,574 |
1,104,767 |
|
|
American Capital Ltd. (a) |
29,839 |
447,287 |
|
|
Ameriprise Financial, Inc. |
20,142 |
2,248,451 |
|
|
Ares Capital Corp. |
30,947 |
531,360 |
|
|
Artisan Partners Asset Management, Inc. |
1,466 |
85,131 |
|
|
E*TRADE Financial Corp. (a) |
30,170 |
677,317 |
|
|
Eaton Vance Corp. (non-vtg.) |
12,788 |
461,263 |
|
|
Federated Investors, Inc. Class B (non-vtg.) |
9,684 |
276,381 |
|
|
Invesco Ltd. |
46,983 |
1,654,271 |
|
|
Lazard Ltd. Class A |
13,562 |
638,092 |
|
|
Legg Mason, Inc. |
11,752 |
551,051 |
|
|
LPL Financial |
5,651 |
267,575 |
|
|
Northern Trust Corp. |
25,264 |
1,522,156 |
|
|
Raymond James Financial, Inc. |
12,909 |
641,577 |
|
|
SEI Investments Co. |
15,250 |
493,795 |
|
|
T. Rowe Price Group, Inc. |
27,388 |
2,249,376 |
|
|
TD Ameritrade Holding Corp. |
24,453 |
780,051 |
|
|
Waddell & Reed Financial, Inc. Class A |
9,123 |
615,346 |
|
|
|
15,245,247 |
||
|
Consumer Finance - 0.2% |
|||
|
Santander Consumer U.S.A. Holdings, Inc. |
8,991 |
204,455 |
|
|
SLM Corp. |
46,931 |
1,208,473 |
|
|
|
1,412,928 |
||
|
Diversified Financial Services - 1.4% |
|||
|
CBOE Holdings, Inc. |
9,245 |
493,313 |
|
|
Interactive Brokers Group, Inc. |
4,868 |
116,345 |
|
|
IntercontinentalExchange Group, Inc. |
12,058 |
2,465,138 |
|
|
Leucadia National Corp. |
31,179 |
795,688 |
|
|
McGraw Hill Financial, Inc. |
28,960 |
2,141,013 |
|
|
Moody's Corp. |
20,542 |
1,612,547 |
|
|
MSCI, Inc. Class A (a) |
12,769 |
517,655 |
|
|
The NASDAQ OMX Group, Inc. |
11,785 |
434,867 |
|
|
Voya Financial, Inc. |
7,888 |
279,156 |
|
|
|
8,855,722 |
||
|
Common Stocks - continued |
|||
|
Shares |
Value |
||
|
FINANCIALS - continued |
|||
|
Insurance - 4.4% |
|||
|
Alleghany Corp. (a) |
1,769 |
$ 721,717 |
|
|
Allied World Assurance Co. Holdings Ltd. |
3,479 |
374,654 |
|
|
American Financial Group, Inc. |
8,299 |
484,911 |
|
|
American National Insurance Co. |
754 |
84,757 |
|
|
Aon PLC |
32,664 |
2,772,520 |
|
|
Arch Capital Group Ltd. (a) |
14,049 |
805,289 |
|
|
Arthur J. Gallagher & Co. |
15,736 |
708,435 |
|
|
Aspen Insurance Holdings Ltd. |
7,089 |
324,534 |
|
|
Assurant, Inc. |
7,716 |
520,136 |
|
|
Assured Guaranty Ltd. |
17,841 |
426,578 |
|
|
Axis Capital Holdings Ltd. |
11,837 |
541,543 |
|
|
Brown & Brown, Inc. |
12,494 |
372,071 |
|
|
Cincinnati Financial Corp. |
17,270 |
841,740 |
|
|
CNA Financial Corp. |
2,693 |
110,278 |
|
|
Endurance Specialty Holdings Ltd. |
4,553 |
231,383 |
|
|
Erie Indemnity Co. Class A |
2,551 |
182,779 |
|
|
Everest Re Group Ltd. |
4,977 |
786,515 |
|
|
Fidelity National Financial, Inc. Class A |
29,041 |
934,539 |
|
|
Genworth Financial, Inc. Class A (a) |
51,792 |
924,487 |
|
|
Hanover Insurance Group, Inc. |
4,668 |
272,845 |
|
|
Hartford Financial Services Group, Inc. |
48,209 |
1,729,257 |
|
|
HCC Insurance Holdings, Inc. |
10,621 |
487,929 |
|
|
Kemper Corp. |
4,904 |
193,267 |
|
|
Lincoln National Corp. |
28,417 |
1,378,509 |
|
|
Markel Corp. (a)(d) |
1,455 |
910,714 |
|
|
MBIA, Inc. (a) |
14,554 |
176,394 |
|
|
Mercury General Corp. |
2,779 |
133,003 |
|
|
Old Republic International Corp. |
27,558 |
456,360 |
|
|
PartnerRe Ltd. |
5,408 |
570,003 |
|
|
Principal Financial Group, Inc. |
31,041 |
1,453,960 |
|
|
ProAssurance Corp. |
6,572 |
298,500 |
|
|
Progressive Corp. |
63,723 |
1,545,283 |
|
|
Protective Life Corp. |
8,383 |
428,790 |
|
|
Reinsurance Group of America, Inc. |
7,657 |
587,368 |
|
|
RenaissanceRe Holdings Ltd. (d) |
4,395 |
444,818 |
|
|
StanCorp Financial Group, Inc. |
4,731 |
289,064 |
|
|
Torchmark Corp. |
9,698 |
772,931 |
|
|
Unum Group |
28,034 |
931,289 |
|
|
Validus Holdings Ltd. |
9,845 |
364,954 |
|
|
W.R. Berkley Corp. |
10,816 |
478,500 |
|
|
Common Stocks - continued |
|||
|
Shares |
Value |
||
|
FINANCIALS - continued |
|||
|
Insurance - continued |
|||
|
White Mountains Insurance Group Ltd. |
646 |
$ 385,184 |
|
|
XL Group PLC Class A |
29,113 |
912,693 |
|
|
|
27,350,481 |
||
|
Real Estate Investment Trusts - 7.7% |
|||
|
Alexandria Real Estate Equities, Inc. |
7,565 |
558,448 |
|
|
American Campus Communities, Inc. |
11,115 |
424,593 |
|
|
American Capital Agency Corp. |
37,599 |
853,873 |
|
|
American Homes 4 Rent Class A |
5,201 |
83,476 |
|
|
Annaly Capital Management, Inc. |
99,994 |
1,154,931 |
|
|
Apartment Investment & Management Co. Class A |
15,455 |
476,478 |
|
|
AvalonBay Communities, Inc. |
13,657 |
1,864,863 |
|
|
BioMed Realty Trust, Inc. |
19,742 |
412,608 |
|
|
Boston Properties, Inc. |
16,030 |
1,877,754 |
|
|
Brandywine Realty Trust (SBI) |
16,849 |
245,153 |
|
|
Brixmor Property Group, Inc. (d) |
4,917 |
107,977 |
|
|
Camden Property Trust (SBI) |
8,966 |
614,081 |
|
|
CBL & Associates Properties, Inc. |
17,265 |
313,705 |
|
|
Chimera Investment Corp. |
108,313 |
334,687 |
|
|
CommonWealth REIT (d) |
12,506 |
317,777 |
|
|
Corporate Office Properties Trust (SBI) |
9,235 |
247,036 |
|
|
Corrections Corp. of America |
12,186 |
399,701 |
|
|
Crown Castle International Corp. |
35,284 |
2,566,205 |
|
|
DDR Corp. |
30,989 |
532,081 |
|
|
Digital Realty Trust, Inc. (d) |
13,483 |
719,992 |
|
|
Douglas Emmett, Inc. |
15,177 |
418,885 |
|
|
Duke Realty LP |
34,020 |
596,030 |
|
|
Equity Lifestyle Properties, Inc. |
8,798 |
368,372 |
|
|
Essex Property Trust, Inc. |
6,441 |
1,115,968 |
|
|
Extra Space Storage, Inc. |
11,752 |
614,982 |
|
|
Federal Realty Investment Trust (SBI) |
6,846 |
804,679 |
|
|
Gaming & Leisure Properties |
10,152 |
373,086 |
|
|
General Growth Properties, Inc. |
59,176 |
1,359,273 |
|
|
Hatteras Financial Corp. |
10,171 |
199,046 |
|
|
HCP, Inc. |
48,005 |
2,009,489 |
|
|
Health Care REIT, Inc. |
30,043 |
1,895,413 |
|
|
Healthcare Trust of America, Inc. |
12,382 |
144,746 |
|
|
Home Properties, Inc. |
6,033 |
371,633 |
|
|
Hospitality Properties Trust (SBI) |
15,850 |
476,293 |
|
|
Host Hotels & Resorts, Inc. |
78,711 |
1,688,351 |
|
|
Kilroy Realty Corp. |
8,622 |
513,613 |
|
|
Common Stocks - continued |
|||
|
Shares |
Value |
||
|
FINANCIALS - continued |
|||
|
Real Estate Investment Trusts - continued |
|||
|
Kimco Realty Corp. |
43,155 |
$ 989,113 |
|
|
Liberty Property Trust (SBI) (d) |
13,689 |
513,338 |
|
|
Mack-Cali Realty Corp. |
9,044 |
184,226 |
|
|
MFA Financial, Inc. |
38,122 |
302,307 |
|
|
Mid-America Apartment Communities, Inc. |
7,885 |
549,190 |
|
|
National Retail Properties, Inc. |
12,556 |
428,536 |
|
|
Omega Healthcare Investors, Inc. |
12,887 |
448,210 |
|
|
Piedmont Office Realty Trust, Inc. Class A (d) |
16,635 |
292,942 |
|
|
Plum Creek Timber Co., Inc. |
18,685 |
814,666 |
|
|
Post Properties, Inc. |
5,723 |
287,352 |
|
|
Prologis, Inc. |
52,606 |
2,137,382 |
|
|
Rayonier, Inc. |
13,214 |
595,951 |
|
|
Realty Income Corp. |
23,392 |
1,016,382 |
|
|
Regency Centers Corp. |
9,757 |
511,560 |
|
|
Retail Properties America, Inc. |
13,803 |
197,659 |
|
|
Senior Housing Properties Trust (SBI) |
21,559 |
505,990 |
|
|
SL Green Realty Corp. |
9,623 |
1,007,624 |
|
|
Spirit Realty Capital, Inc. |
39,189 |
422,066 |
|
|
Starwood Property Trust, Inc. |
23,387 |
562,457 |
|
|
Starwood Waypoint Residential (a) |
3,973 |
107,946 |
|
|
Tanger Factory Outlet Centers, Inc. |
10,019 |
357,478 |
|
|
Taubman Centers, Inc. |
6,752 |
491,816 |
|
|
The Macerich Co. |
14,442 |
937,430 |
|
|
Two Harbors Investment Corp. |
38,411 |
398,706 |
|
|
UDR, Inc. |
26,516 |
685,704 |
|
|
Ventas, Inc. |
30,966 |
2,046,233 |
|
|
Vornado Realty Trust |
19,743 |
2,025,632 |
|
|
Weingarten Realty Investors (SBI) |
12,869 |
401,513 |
|
|
Weyerhaeuser Co. |
61,494 |
1,835,596 |
|
|
WP Carey, Inc. |
6,070 |
373,184 |
|
|
|
48,483,467 |
||
|
Real Estate Management & Development - 0.5% |
|||
|
CBRE Group, Inc. (a) |
29,513 |
786,226 |
|
|
Forest City Enterprises, Inc. Class A (a) |
16,639 |
314,643 |
|
|
Howard Hughes Corp. (a) |
4,183 |
597,165 |
|
|
Jones Lang LaSalle, Inc. |
4,658 |
539,816 |
|
|
Realogy Holdings Corp. (a) |
12,688 |
533,530 |
|
|
The St. Joe Co. (a)(d) |
7,054 |
125,914 |
|
|
|
2,897,294 |
||
|
Common Stocks - continued |
|||
|
Shares |
Value |
||
|
FINANCIALS - continued |
|||
|
Thrifts & Mortgage Finance - 0.4% |
|||
|
Hudson City Bancorp, Inc. |
55,848 |
$ 556,246 |
|
|
Nationstar Mortgage Holdings, Inc. (a)(d) |
2,192 |
71,744 |
|
|
New York Community Bancorp, Inc. (d) |
46,474 |
716,164 |
|
|
Ocwen Financial Corp. (a) |
10,965 |
415,574 |
|
|
People's United Financial, Inc. |
32,737 |
467,484 |
|
|
TFS Financial Corp. (a) |
8,373 |
112,114 |
|
|
Washington Federal, Inc. |
11,062 |
238,718 |
|
|
|
2,578,044 |
||
|
TOTAL FINANCIALS |
125,219,693 |
||
|
HEALTH CARE - 11.0% |
|||
|
Biotechnology - 1.6% |
|||
|
Alexion Pharmaceuticals, Inc. (a) |
20,616 |
3,261,451 |
|
|
Alkermes PLC (a) |
14,248 |
659,112 |
|
|
ARIAD Pharmaceuticals, Inc. (a)(d) |
18,883 |
137,279 |
|
|
BioMarin Pharmaceutical, Inc. (a) |
14,631 |
851,963 |
|
|
Cubist Pharmaceuticals, Inc. |
6,929 |
485,446 |
|
|
Incyte Corp. (a) |
10,819 |
525,371 |
|
|
Medivation, Inc. (a) |
7,944 |
478,308 |
|
|
Myriad Genetics, Inc. (a)(d) |
7,849 |
331,306 |
|
|
Pharmacyclics, Inc. (a)(d) |
6,139 |
580,627 |
|
|
Seattle Genetics, Inc. (a)(d) |
10,671 |
410,620 |
|
|
Theravance, Inc. (a)(d) |
8,412 |
226,451 |
|
|
United Therapeutics Corp. (a) |
4,928 |
492,849 |
|
|
Vertex Pharmaceuticals, Inc. (a) |
24,647 |
1,668,602 |
|
|
|
10,109,385 |
||
|
Health Care Equipment & Supplies - 2.3% |
|||
|
Alere, Inc. (a) |
8,611 |
287,607 |
|
|
Boston Scientific Corp. (a) |
142,572 |
1,797,833 |
|
|
C.R. Bard, Inc. |
8,066 |
1,107,704 |
|
|
CareFusion Corp. (a) |
21,932 |
856,664 |
|
|
DENTSPLY International, Inc. |
15,073 |
672,708 |
|
|
Edwards Lifesciences Corp. (a)(d) |
11,329 |
922,974 |
|
|
Hill-Rom Holdings, Inc. |
6,334 |
236,638 |
|
|
Hologic, Inc. (a)(d) |
28,481 |
597,674 |
|
|
IDEXX Laboratories, Inc. (a) |
5,674 |
717,421 |
|
|
ResMed, Inc. (d) |
14,958 |
745,656 |
|
|
Sirona Dental Systems, Inc. (a)(d) |
5,807 |
436,803 |
|
|
St. Jude Medical, Inc. |
29,960 |
1,901,561 |
|
|
Common Stocks - continued |
|||
|
Shares |
Value |
||
|
HEALTH CARE - continued |
|||
|
Health Care Equipment & Supplies - continued |
|||
|
Teleflex, Inc. |
4,353 |
$ 444,398 |
|
|
The Cooper Companies, Inc. |
5,083 |
670,499 |
|
|
Varian Medical Systems, Inc. (a)(d) |
11,458 |
911,484 |
|
|
Zimmer Holdings, Inc. |
17,785 |
1,721,588 |
|
|
|
14,029,212 |
||
|
Health Care Providers & Services - 3.1% |
|||
|
AmerisourceBergen Corp. |
24,376 |
1,588,828 |
|
|
Brookdale Senior Living, Inc. (a) |
10,516 |
334,829 |
|
|
Cardinal Health, Inc. |
36,104 |
2,509,589 |
|
|
Catamaran Corp. (a) |
21,741 |
825,962 |
|
|
Cigna Corp. |
30,133 |
2,411,845 |
|
|
Community Health Systems, Inc. (a) |
11,866 |
449,603 |
|
|
DaVita HealthCare Partners, Inc. (a) |
19,444 |
1,347,469 |
|
|
Envision Healthcare Holdings, Inc. |
5,124 |
173,140 |
|
|
HCA Holdings, Inc. (a) |
28,278 |
1,470,456 |
|
|
Health Net, Inc. (a) |
8,457 |
290,329 |
|
|
Henry Schein, Inc. (a) |
9,190 |
1,049,774 |
|
|
Humana, Inc. |
16,637 |
1,825,911 |
|
|
Laboratory Corp. of America Holdings (a)(d) |
9,228 |
910,804 |
|
|
LifePoint Hospitals, Inc. (a) |
4,702 |
262,936 |
|
|
MEDNAX, Inc. (a) |
10,614 |
628,880 |
|
|
Omnicare, Inc. |
10,472 |
620,675 |
|
|
Patterson Companies, Inc. |
9,227 |
375,539 |
|
|
Premier, Inc. |
3,334 |
100,020 |
|
|
Quest Diagnostics, Inc. |
15,355 |
858,805 |
|
|
Tenet Healthcare Corp. (a)(d) |
10,252 |
462,160 |
|
|
Universal Health Services, Inc. Class B |
9,586 |
784,039 |
|
|
VCA Antech, Inc. (a) |
9,388 |
287,554 |
|
|
|
19,569,147 |
||
|
Health Care Technology - 0.3% |
|||
|
Allscripts Healthcare Solutions, Inc. (a) |
18,849 |
286,882 |
|
|
Cerner Corp. (a) |
31,352 |
1,608,358 |
|
|
Veeva Systems, Inc. Class A (d) |
1,609 |
30,909 |
|
|
|
1,926,149 |
||
|
Life Sciences Tools & Services - 1.3% |
|||
|
Agilent Technologies, Inc. |
36,676 |
1,981,971 |
|
|
Bio-Rad Laboratories, Inc. Class A (a) |
2,193 |
270,200 |
|
|
Bruker BioSciences Corp. (a) |
11,622 |
240,111 |
|
|
Charles River Laboratories International, Inc. (a) |
5,196 |
279,129 |
|
|
Covance, Inc. (a) |
5,879 |
518,998 |
|
|
Common Stocks - continued |
|||
|
Shares |
Value |
||
|
HEALTH CARE - continued |
|||
|
Life Sciences Tools & Services - continued |
|||
|
Illumina, Inc. (a) |
13,141 |
$ 1,785,205 |
|
|
Mettler-Toledo International, Inc. (a) |
3,173 |
739,690 |
|
|
PerkinElmer, Inc. |
11,700 |
491,049 |
|
|
QIAGEN NV (a)(d) |
24,744 |
541,894 |
|
|
Quintiles Transnational Holdings, Inc. |
2,903 |
136,818 |
|
|
Techne Corp. |
3,901 |
348,398 |
|
|
Waters Corp. (a) |
9,052 |
891,984 |
|
|
|
8,225,447 |
||
|
Pharmaceuticals - 2.4% |
|||
|
Actavis PLC (a)(d) |
18,330 |
3,745,353 |
|
|
Endo International PLC (a) |
14,101 |
887,587 |
|
|
Forest Laboratories, Inc. (a) |
28,164 |
2,588,553 |
|
|
Hospira, Inc. (a) |
17,396 |
796,737 |
|
|
Jazz Pharmaceuticals PLC (a) |
5,443 |
734,261 |
|
|
Mylan, Inc. (a) |
40,280 |
2,045,418 |
|
|
Perrigo Co. PLC |
13,327 |
1,930,549 |
|
|
Salix Pharmaceuticals Ltd. (a)(d) |
6,436 |
707,960 |
|
|
Zoetis, Inc. Class A |
52,863 |
1,599,634 |
|
|
|
15,036,052 |
||
|
TOTAL HEALTH CARE |
68,895,392 |
||
|
INDUSTRIALS - 13.5% |
|||
|
Aerospace & Defense - 1.2% |
|||
|
Alliant Techsystems, Inc. |
3,403 |
490,781 |
|
|
BE Aerospace, Inc. (a) |
10,380 |
911,053 |
|
|
Exelis, Inc. |
19,933 |
369,558 |
|
|
Hexcel Corp. (a) |
10,694 |
445,833 |
|
|
Huntington Ingalls Industries, Inc. |
5,314 |
547,342 |
|
|
L-3 Communications Holdings, Inc. |
9,501 |
1,096,130 |
|
|
Rockwell Collins, Inc. |
14,302 |
1,110,550 |
|
|
Spirit AeroSystems Holdings, Inc. Class A (a) |
12,589 |
378,048 |
|
|
Textron, Inc. |
29,362 |
1,200,906 |
|
|
TransDigm Group, Inc. |
5,533 |
984,155 |
|
|
Triumph Group, Inc. |
5,453 |
353,409 |
|
|
|
7,887,765 |
||
|
Air Freight & Logistics - 0.3% |
|||
|
C.H. Robinson Worldwide, Inc. (d) |
15,923 |
937,865 |
|
|
Expeditors International of Washington, Inc. |
21,685 |
894,289 |
|
|
|
1,832,154 |
||
|
Common Stocks - continued |
|||
|
Shares |
Value |
||
|
INDUSTRIALS - continued |
|||
|
Airlines - 1.4% |
|||
|
Alaska Air Group, Inc. |
7,399 |
$ 696,098 |
|
|
American Airlines Group, Inc. |
20,648 |
724,125 |
|
|
Copa Holdings SA Class A |
3,514 |
475,374 |
|
|
Delta Air Lines, Inc. |
90,541 |
3,334,625 |
|
|
Southwest Airlines Co. |
76,350 |
1,845,380 |
|
|
United Continental Holdings, Inc. (a) |
37,597 |
1,536,589 |
|
|
|
8,612,191 |
||
|
Building Products - 0.5% |
|||
|
A.O. Smith Corp. |
8,176 |
382,310 |
|
|
Allegion PLC |
10,532 |
519,754 |
|
|
Armstrong World Industries, Inc. (a) |
2,669 |
140,283 |
|
|
Fortune Brands Home & Security, Inc. |
17,456 |
695,622 |
|
|
Lennox International, Inc. |
5,320 |
445,976 |
|
|
Masco Corp. |
37,797 |
759,342 |
|
|
Owens Corning |
12,561 |
513,117 |
|
|
|
3,456,404 |
||
|
Commercial Services & Supplies - 1.1% |
|||
|
ADT Corp. |
19,261 |
582,453 |
|
|
Cintas Corp. |
10,905 |
642,632 |
|
|
Clean Harbors, Inc. (a)(d) |
6,370 |
382,200 |
|
|
Copart, Inc. (a) |
11,887 |
431,141 |
|
|
Covanta Holding Corp. |
11,285 |
208,208 |
|
|
Iron Mountain, Inc. |
18,004 |
512,034 |
|
|
KAR Auction Services, Inc. |
7,965 |
237,198 |
|
|
Pitney Bowes, Inc. (d) |
21,290 |
570,572 |
|
|
R.R. Donnelley & Sons Co. |
20,459 |
360,078 |
|
|
Republic Services, Inc. |
28,493 |
999,819 |
|
|
Rollins, Inc. |
6,756 |
203,220 |
|
|
Stericycle, Inc. (a) |
9,096 |
1,059,138 |
|
|
Waste Connections, Inc. |
13,050 |
582,813 |
|
|
|
6,771,506 |
||
|
Construction & Engineering - 0.8% |
|||
|
AECOM Technology Corp. (a) |
10,940 |
354,675 |
|
|
Chicago Bridge & Iron Co. NV |
10,584 |
847,461 |
|
|
Fluor Corp. |
17,227 |
1,304,084 |
|
|
Jacobs Engineering Group, Inc. (a) |
13,754 |
793,606 |
|
|
KBR, Inc. |
15,629 |
396,508 |
|
|
Common Stocks - continued |
|||
|
Shares |
Value |
||
|
INDUSTRIALS - continued |
|||
|
Construction & Engineering - continued |
|||
|
Quanta Services, Inc. (a) |
21,956 |
$ 774,608 |
|
|
URS Corp. |
7,291 |
343,552 |
|
|
|
4,814,494 |
||
|
Electrical Equipment - 1.0% |
|||
|
AMETEK, Inc. |
25,633 |
1,351,372 |
|
|
Babcock & Wilcox Co. (d) |
11,889 |
413,618 |
|
|
Hubbell, Inc. Class B |
6,272 |
738,340 |
|
|
Regal-Beloit Corp. |
4,765 |
356,088 |
|
|
Rockwell Automation, Inc. |
14,754 |
1,758,382 |
|
|
Roper Industries, Inc. |
10,456 |
1,452,861 |
|
|
SolarCity Corp. (a)(d) |
2,398 |
127,694 |
|
|
|
6,198,355 |
||
|
Industrial Conglomerates - 0.1% |
|||
|
Carlisle Companies, Inc. |
6,724 |
553,049 |
|
|
Machinery - 4.2% |
|||
|
AGCO Corp. |
10,265 |
571,761 |
|
|
Colfax Corp. (a) |
10,967 |
789,405 |
|
|
Crane Co. |
5,130 |
373,105 |
|
|
Donaldson Co., Inc. |
15,475 |
651,343 |
|
|
Dover Corp. |
18,073 |
1,561,507 |
|
|
Flowserve Corp. |
15,107 |
1,103,566 |
|
|
Graco, Inc. |
6,478 |
469,655 |
|
|
Harsco Corp. |
8,603 |
205,870 |
|
|
IDEX Corp. |
8,687 |
647,790 |
|
|
Ingersoll-Rand PLC |
29,384 |
1,757,163 |
|
|
ITT Corp. |
9,497 |
409,701 |
|
|
Joy Global, Inc. (d) |
10,576 |
638,579 |
|
|
Kennametal, Inc. |
8,319 |
388,747 |
|
|
Lincoln Electric Holdings, Inc. |
8,780 |
586,592 |
|
|
Manitowoc Co., Inc. (d) |
14,116 |
448,606 |
|
|
Navistar International Corp. (a)(d) |
5,914 |
224,318 |
|
|
Nordson Corp. |
6,842 |
508,703 |
|
|
Oshkosh Truck Corp. |
9,300 |
516,243 |
|
|
PACCAR, Inc. |
37,356 |
2,390,037 |
|
|
Pall Corp. |
11,722 |
986,406 |
|
|
Parker Hannifin Corp. |
15,767 |
2,000,517 |
|
|
Pentair Ltd. |
21,583 |
1,603,401 |
|
|
Snap-On, Inc. |
6,156 |
714,096 |
|
|
SPX Corp. |
4,708 |
479,463 |
|
|
Stanley Black & Decker, Inc. |
17,094 |
1,468,204 |
|
|
Common Stocks - continued |
|||
|
Shares |
Value |
||
|
INDUSTRIALS - continued |
|||
|
Machinery - continued |
|||
|
Terex Corp. |
11,775 |
$ 509,740 |
|
|
Timken Co. |
9,136 |
576,299 |
|
|
Toro Co. |
6,103 |
387,785 |
|
|
Trinity Industries, Inc. |
8,322 |
624,649 |
|
|
Valmont Industries, Inc. |
2,835 |
422,160 |
|
|
WABCO Holdings, Inc. (a) |
6,169 |
660,145 |
|
|
Wabtec Corp. |
10,129 |
755,117 |
|
|
Xylem, Inc. |
19,459 |
731,464 |
|
|
|
26,162,137 |
||
|
Marine - 0.1% |
|||
|
Kirby Corp. (a) |
6,007 |
604,424 |
|
|
Professional Services - 1.0% |
|||
|
Dun & Bradstreet Corp. |
3,985 |
441,379 |
|
|
Equifax, Inc. |
12,696 |
899,004 |
|
|
IHS, Inc. Class A (a) |
6,911 |
833,674 |
|
|
Manpower, Inc. |
8,169 |
664,466 |
|
|
Nielsen Holdings B.V. |
23,091 |
1,084,122 |
|
|
Robert Half International, Inc. |
14,787 |
662,458 |
|
|
Towers Watson & Co. |
6,844 |
768,034 |
|
|
Verisk Analytics, Inc. (a) |
15,979 |
960,178 |
|
|
|
6,313,315 |
||
|
Road & Rail - 0.9% |
|||
|
AMERCO |
774 |
193,585 |
|
|
Avis Budget Group, Inc. (a)(d) |
11,397 |
599,368 |
|
|
Con-way, Inc. |
5,963 |
253,308 |
|
|
Genesee & Wyoming, Inc. Class A (a) |
4,596 |
455,050 |
|
|
Hertz Global Holdings, Inc. (a) |
36,589 |
1,041,689 |
|
|
J.B. Hunt Transport Services, Inc. |
9,597 |
730,332 |
|
|
Kansas City Southern |
11,638 |
1,174,041 |
|
|
Landstar System, Inc. |
4,916 |
309,659 |
|
|
Old Dominion Freight Lines, Inc. (a) |
7,512 |
455,453 |
|
|
Ryder System, Inc. |
5,528 |
454,291 |
|
|
|
5,666,776 |
||
|
Trading Companies & Distributors - 0.9% |
|||
|
Air Lease Corp. Class A |
7,424 |
266,299 |
|
|
Fastenal Co. |
31,322 |
1,568,606 |
|
|
GATX Corp. |
4,934 |
323,818 |
|
|
HD Supply Holdings, Inc. (a) |
6,519 |
168,060 |
|
|
MRC Global, Inc. (a) |
8,782 |
256,347 |
|
|
MSC Industrial Direct Co., Inc. Class A |
4,980 |
453,479 |
|
|
Common Stocks - continued |
|||
|
Shares |
Value |
||
|
INDUSTRIALS - continued |
|||
|
Trading Companies & Distributors - continued |
|||
|
United Rentals, Inc. (a)(d) |
9,911 |
$ 929,949 |
|
|
W.W. Grainger, Inc. |
6,225 |
1,583,640 |
|
|
WESCO International, Inc. (a) |
4,672 |
410,108 |
|
|
|
5,960,306 |
||
|
TOTAL INDUSTRIALS |
84,832,876 |
||
|
INFORMATION TECHNOLOGY - 13.3% |
|||
|
Communications Equipment - 1.0% |
|||
|
Brocade Communications Systems, Inc. (a) |
46,991 |
437,486 |
|
|
CommScope Holding Co., Inc. |
4,294 |
114,564 |
|
|
EchoStar Holding Corp. Class A (a) |
4,331 |
194,722 |
|
|
F5 Networks, Inc. (a)(d) |
7,951 |
836,207 |
|
|
Harris Corp. |
11,525 |
847,318 |
|
|
JDS Uniphase Corp. (a) |
24,585 |
311,492 |
|
|
Juniper Networks, Inc. (a) |
50,012 |
1,234,796 |
|
|
Motorola Solutions, Inc. |
23,884 |
1,518,545 |
|
|
Palo Alto Networks, Inc. (a) |
3,713 |
236,073 |
|
|
Polycom, Inc. (a) |
14,652 |
180,220 |
|
|
Riverbed Technology, Inc. (a) |
17,201 |
334,559 |
|
|
|
6,245,982 |
||
|
Electronic Equipment & Components - 1.1% |
|||
|
Amphenol Corp. Class A |
16,876 |
1,609,127 |
|
|
Arrow Electronics, Inc. (a)(d) |
11,082 |
628,904 |
|
|
Avnet, Inc. |
14,499 |
625,342 |
|
|
AVX Corp. |
4,775 |
63,746 |
|
|
CDW Corp. |
2,885 |
81,328 |
|
|
Dolby Laboratories, Inc. Class A (a)(d) |
4,834 |
192,635 |
|
|
FLIR Systems, Inc. |
15,013 |
511,043 |
|
|
Ingram Micro, Inc. Class A (a) |
16,116 |
434,487 |
|
|
IPG Photonics Corp. (a)(d) |
3,428 |
221,552 |
|
|
Jabil Circuit, Inc. |
21,332 |
368,190 |
|
|
Knowles Corp. (a) |
9,079 |
253,576 |
|
|
National Instruments Corp. |
10,237 |
279,572 |
|
|
Tech Data Corp. (a) |
4,008 |
250,460 |
|
|
Trimble Navigation Ltd. (a)(d) |
27,016 |
1,038,225 |
|
|
Vishay Intertechnology, Inc. |
13,934 |
198,141 |
|
|
Zebra Technologies Corp. Class A (a) |
5,350 |
371,504 |
|
|
|
7,127,832 |
||
|
Common Stocks - continued |
|||
|
Shares |
Value |
||
|
INFORMATION TECHNOLOGY - continued |
|||
|
Internet Software & Services - 0.9% |
|||
|
Akamai Technologies, Inc. (a) |
18,779 |
$ 996,602 |
|
|
AOL, Inc. (a) |
8,173 |
349,886 |
|
|
Equinix, Inc. (a)(d) |
5,199 |
976,424 |
|
|
IAC/InterActiveCorp |
7,901 |
523,678 |
|
|
LinkedIn Corp. (a) |
10,227 |
1,569,538 |
|
|
Pandora Media, Inc. (a) |
16,070 |
376,359 |
|
|
Rackspace Hosting, Inc. (a)(d) |
11,884 |
344,874 |
|
|
VeriSign, Inc. (a)(d) |
13,733 |
647,923 |
|
|
|
5,785,284 |
||
|
IT Services - 2.7% |
|||
|
Alliance Data Systems Corp. (a)(d) |
5,497 |
1,329,724 |
|
|
Amdocs Ltd. |
16,901 |
786,404 |
|
|
Booz Allen Hamilton Holding Corp. Class A |
3,223 |
74,903 |
|
|
Broadridge Financial Solutions, Inc. |
12,816 |
491,365 |
|
|
Computer Sciences Corp. |
15,875 |
939,483 |
|
|
CoreLogic, Inc. (a) |
10,125 |
283,804 |
|
|
DST Systems, Inc. |
3,592 |
331,146 |
|
|
Fidelity National Information Services, Inc. |
30,991 |
1,655,849 |
|
|
Fiserv, Inc. (a) |
26,594 |
1,616,383 |
|
|
FleetCor Technologies, Inc. (a) |
7,135 |
814,318 |
|
|
Gartner, Inc. Class A (a) |
9,922 |
684,023 |
|
|
Genpact Ltd. (a) |
17,698 |
298,388 |
|
|
Global Payments, Inc. |
7,615 |
508,910 |
|
|
Jack Henry & Associates, Inc. |
9,136 |
503,942 |
|
|
Leidos Holdings, Inc. |
7,140 |
265,894 |
|
|
Neustar, Inc. Class A (a)(d) |
6,379 |
164,068 |
|
|
Paychex, Inc. |
34,371 |
1,437,052 |
|
|
Science Applications International Corp. |
4,425 |
172,575 |
|
|
Teradata Corp. (a)(d) |
17,144 |
779,366 |
|
|
The Western Union Co. |
58,866 |
934,203 |
|
|
Total System Services, Inc. |
17,251 |
548,064 |
|
|
Vantiv, Inc. (a)(d) |
9,261 |
284,776 |
|
|
VeriFone Systems, Inc. (a) |
11,430 |
382,219 |
|
|
Xerox Corp. |
129,757 |
1,568,762 |
|
|
|
16,855,621 |
||
|
Semiconductors & Semiconductor Equipment - 3.6% |
|||
|
Advanced Micro Devices, Inc. (a)(d) |
63,743 |
260,709 |
|
|
Altera Corp. |
33,877 |
1,101,680 |
|
|
Analog Devices, Inc. |
32,595 |
1,671,798 |
|
|
Applied Materials, Inc. |
126,997 |
2,420,563 |
|
|
Common Stocks - continued |
|||
|
Shares |
Value |
||
|
INFORMATION TECHNOLOGY - continued |
|||
|
Semiconductors & Semiconductor Equipment - continued |
|||
|
Atmel Corp. (a) |
45,111 |
$ 350,512 |
|
|
Avago Technologies Ltd. |
26,011 |
1,651,699 |
|
|
Cree, Inc. (a)(d) |
12,395 |
584,672 |
|
|
Fairchild Semiconductor International, Inc. (a) |
13,083 |
166,547 |
|
|
First Solar, Inc. (a)(d) |
7,165 |
483,566 |
|
|
Freescale Semiconductor, Inc. (a)(d) |
6,794 |
149,264 |
|
|
KLA-Tencor Corp. |
17,560 |
1,123,664 |
|
|
Lam Research Corp. |
17,111 |
985,765 |
|
|
Linear Technology Corp. |
24,708 |
1,099,506 |
|
|
LSI Corp. |
57,946 |
645,518 |
|
|
Marvell Technology Group Ltd. |
41,414 |
656,826 |
|
|
Maxim Integrated Products, Inc. |
30,570 |
991,691 |
|
|
Microchip Technology, Inc. |
20,875 |
992,398 |
|
|
Micron Technology, Inc. (a) |
108,810 |
2,842,117 |
|
|
NVIDIA Corp. |
61,111 |
1,128,720 |
|
|
ON Semiconductor Corp. (a) |
47,755 |
449,375 |
|
|
Silicon Laboratories, Inc. (a) |
4,453 |
200,162 |
|
|
Skyworks Solutions, Inc. |
20,073 |
823,997 |
|
|
Teradyne, Inc. |
20,238 |
357,605 |
|
|
Xilinx, Inc. |
27,895 |
1,316,365 |
|
|
|
22,454,719 |
||
|
Software - 2.8% |
|||
|
Activision Blizzard, Inc. |
27,966 |
559,600 |
|
|
ANSYS, Inc. (a) |
9,853 |
751,882 |
|
|
Autodesk, Inc. (a) |
23,616 |
1,134,040 |
|
|
CA Technologies, Inc. |
34,619 |
1,043,417 |
|
|
Cadence Design Systems, Inc. (a)(d) |
29,964 |
466,240 |
|
|
Citrix Systems, Inc. (a) |
19,771 |
1,172,618 |
|
|
Compuware Corp. |
22,638 |
234,530 |
|
|
Concur Technologies, Inc. (a)(d) |
4,940 |
397,522 |
|
|
Electronic Arts, Inc. (a) |
31,971 |
904,779 |
|
|
FactSet Research Systems, Inc. (d) |
4,650 |
495,225 |
|
|
FireEye, Inc. (d) |
1,856 |
72,867 |
|
|
Fortinet, Inc. (a) |
14,380 |
316,072 |
|
|
Informatica Corp. (a) |
11,478 |
406,895 |
|
|
Intuit, Inc. |
31,368 |
2,376,126 |
|
|
MICROS Systems, Inc. (a) |
8,324 |
428,686 |
|
|
NetSuite, Inc. (a) |
3,724 |
287,902 |
|
|
Nuance Communications, Inc. (a)(d) |
27,639 |
444,712 |
|
|
Red Hat, Inc. (a) |
19,915 |
968,865 |
|
|
Common Stocks - continued |
|||
|
Shares |
Value |
||
|
INFORMATION TECHNOLOGY - continued |
|||
|
Software - continued |
|||
|
Rovi Corp. (a) |
10,109 |
$ 225,330 |
|
|
ServiceNow, Inc. (a)(d) |
8,784 |
436,740 |
|
|
SolarWinds, Inc. (a) |
6,946 |
280,063 |
|
|
Solera Holdings, Inc. |
7,291 |
472,311 |
|
|
Splunk, Inc. (a) |
11,864 |
647,418 |
|
|
Symantec Corp. |
73,578 |
1,492,162 |
|
|
Synopsys, Inc. (a) |
16,276 |
612,303 |
|
|
Tableau Software, Inc. |
1,120 |
61,902 |
|
|
TIBCO Software, Inc. (a) |
17,414 |
341,837 |
|
|
Workday, Inc. Class A (a)(d) |
4,277 |
312,520 |
|
|
Zynga, Inc. (a) |
63,647 |
257,770 |
|
|
|
17,602,334 |
||
|
Technology Hardware, Storage & Peripherals - 1.2% |
|||
|
3D Systems Corp. (a)(d) |
10,559 |
499,863 |
|
|
Diebold, Inc. |
6,687 |
251,498 |
|
|
Lexmark International, Inc. Class A |
6,674 |
286,982 |
|
|
NCR Corp. (a) |
17,392 |
530,630 |
|
|
NetApp, Inc. |
35,927 |
1,279,360 |
|
|
Nimble Storage, Inc. (d) |
983 |
24,231 |
|
|
SanDisk Corp. |
23,864 |
2,027,724 |
|
|
Stratasys Ltd. (a)(d) |
3,731 |
361,422 |
|
|
Western Digital Corp. |
22,320 |
1,967,062 |
|
|
|
7,228,772 |
||
|
TOTAL INFORMATION TECHNOLOGY |
83,300,544 |
||
|
MATERIALS - 5.7% |
|||
|
Chemicals - 2.5% |
|||
|
Airgas, Inc. |
6,871 |
730,112 |
|
|
Albemarle Corp. |
8,588 |
575,740 |
|
|
Ashland, Inc. |
8,298 |
801,587 |
|
|
Cabot Corp. |
6,794 |
392,693 |
|
|
Celanese Corp. Class A |
16,867 |
1,036,140 |
|
|
CF Industries Holdings, Inc. |
5,859 |
1,436,451 |
|
|
Cytec Industries, Inc. |
3,862 |
368,126 |
|
|
Eastman Chemical Co. |
16,359 |
1,426,014 |
|
|
FMC Corp. |
14,389 |
1,107,953 |
|
|
Huntsman Corp. |
20,456 |
512,423 |
|
|
International Flavors & Fragrances, Inc. |
8,560 |
843,331 |
|
|
Kronos Worldwide, Inc. (d) |
2,071 |
32,411 |
|
|
Common Stocks - continued |
|||
|
Shares |
Value |
||
|
MATERIALS - continued |
|||
|
Chemicals - continued |
|||
|
NewMarket Corp. |
1,000 |
$ 372,320 |
|
|
Rockwood Holdings, Inc. |
7,742 |
550,069 |
|
|
RPM International, Inc. |
14,034 |
598,690 |
|
|
Sherwin-Williams Co. |
9,353 |
1,869,104 |
|
|
Sigma Aldrich Corp. |
12,692 |
1,221,097 |
|
|
The Scotts Miracle-Gro Co. Class A |
4,567 |
279,546 |
|
|
Valspar Corp. |
8,946 |
653,416 |
|
|
W.R. Grace & Co. (a) |
8,021 |
738,734 |
|
|
Westlake Chemical Corp. |
4,309 |
306,801 |
|
|
|
15,852,758 |
||
|
Construction Materials - 0.3% |
|||
|
Eagle Materials, Inc. |
5,238 |
436,483 |
|
|
Martin Marietta Materials, Inc. (d) |
4,869 |
605,363 |
|
|
Vulcan Materials Co. |
13,731 |
886,061 |
|
|
|
1,927,907 |
||
|
Containers & Packaging - 1.2% |
|||
|
Aptargroup, Inc. |
7,066 |
476,390 |
|
|
Avery Dennison Corp. |
10,582 |
514,920 |
|
|
Ball Corp. |
14,879 |
836,051 |
|
|
Bemis Co., Inc. |
10,745 |
432,379 |
|
|
Crown Holdings, Inc. (a) |
15,091 |
711,842 |
|
|
Greif, Inc. Class A |
3,364 |
182,295 |
|
|
MeadWestvaco Corp. |
17,685 |
690,953 |
|
|
Owens-Illinois, Inc. (a) |
17,451 |
554,593 |
|
|
Packaging Corp. of America |
10,286 |
685,356 |
|
|
Rock-Tenn Co. Class A |
7,546 |
721,473 |
|
|
Sealed Air Corp. |
20,641 |
708,193 |
|
|
Silgan Holdings, Inc. |
4,680 |
232,830 |
|
|
Sonoco Products Co. |
10,569 |
444,744 |
|
|
|
7,192,019 |
||
|
Metals & Mining - 1.3% |
|||
|
Alcoa, Inc. |
123,667 |
1,665,794 |
|
|
Allegheny Technologies, Inc. (d) |
11,403 |
469,804 |
|
|
Carpenter Technology Corp. |
4,945 |
310,546 |
|
|
Cliffs Natural Resources, Inc. (d) |
16,172 |
286,568 |
|
|
Compass Minerals International, Inc. |
3,516 |
322,066 |
|
|
Newmont Mining Corp. |
51,987 |
1,290,837 |
|
|
Nucor Corp. |
33,520 |
1,734,660 |
|
|
Reliance Steel & Aluminum Co. |
8,112 |
574,492 |
|
|
Royal Gold, Inc. |
6,783 |
449,035 |
|
|
Common Stocks - continued |
|||
|
Shares |
Value |
||
|
MATERIALS - continued |
|||
|
Metals & Mining - continued |
|||
|
Steel Dynamics, Inc. |
23,344 |
$ 426,495 |
|
|
Tahoe Resources, Inc. (a) |
8,990 |
200,051 |
|
|
United States Steel Corp. (d) |
15,197 |
395,426 |
|
|
|
8,125,774 |
||
|
Paper & Forest Products - 0.4% |
|||
|
Domtar Corp. |
3,482 |
325,080 |
|
|
International Paper Co. |
46,984 |
2,191,804 |
|
|
|
2,516,884 |
||
|
TOTAL MATERIALS |
35,615,342 |
||
|
TELECOMMUNICATION SERVICES - 0.7% |
|||
|
Diversified Telecommunication Services - 0.4% |
|||
|
Frontier Communications Corp. (d) |
105,534 |
627,927 |
|
|
Intelsat SA (d) |
2,400 |
43,632 |
|
|
Level 3 Communications, Inc. (a) |
18,097 |
778,714 |
|
|
TW Telecom, Inc. (a) |
14,971 |
459,460 |
|
|
Windstream Holdings, Inc. (d) |
62,656 |
568,290 |
|
|
|
2,478,023 |
||
|
Wireless Telecommunication Services - 0.3% |
|||
|
SBA Communications Corp. Class A (a) |
13,498 |
1,211,580 |
|
|
T-Mobile U.S., Inc. (a) |
19,981 |
585,243 |
|
|
Telephone & Data Systems, Inc. |
10,005 |
272,036 |
|
|
U.S. Cellular Corp. (d) |
1,247 |
51,800 |
|
|
|
2,120,659 |
||
|
TOTAL TELECOMMUNICATION SERVICES |
4,598,682 |
||
|
UTILITIES - 6.1% |
|||
|
Electric Utilities - 2.2% |
|||
|
Edison International |
34,415 |
1,946,512 |
|
|
Entergy Corp. |
18,812 |
1,363,870 |
|
|
FirstEnergy Corp. |
44,172 |
1,490,805 |
|
|
Great Plains Energy, Inc. |
16,361 |
438,966 |
|
|
Hawaiian Electric Industries, Inc. (d) |
10,207 |
244,866 |
|
|
ITC Holdings Corp. |
16,536 |
611,336 |
|
|
Northeast Utilities |
33,225 |
1,570,214 |
|
|
OGE Energy Corp. |
20,854 |
778,480 |
|
|
Pepco Holdings, Inc. |
26,321 |
704,350 |
|
|
Pinnacle West Capital Corp. |
11,516 |
644,320 |
|
|
Common Stocks - continued |
|||
|
Shares |
Value |
||
|
UTILITIES - continued |
|||
|
Electric Utilities - continued |
|||
|
PPL Corp. |
66,698 |
$ 2,223,711 |
|
|
Westar Energy, Inc. |
13,489 |
483,985 |
|
|
Xcel Energy, Inc. |
52,478 |
1,672,474 |
|
|
|
14,173,889 |
||
|
Gas Utilities - 0.5% |
|||
|
AGL Resources, Inc. |
12,497 |
674,838 |
|
|
Atmos Energy Corp. |
10,473 |
534,542 |
|
|
National Fuel Gas Co. |
7,786 |
573,361 |
|
|
ONE Gas, Inc. |
5,447 |
199,251 |
|
|
Questar Corp. |
18,474 |
448,549 |
|
|
UGI Corp. |
12,000 |
560,280 |
|
|
|
2,990,821 |
||
|
Independent Power Producers & Energy Traders - 0.5% |
|||
|
Calpine Corp. (a) |
38,737 |
888,239 |
|
|
NRG Energy, Inc. |
34,065 |
1,114,607 |
|
|
The AES Corp. |
65,568 |
947,458 |
|
|
|
2,950,304 |
||
|
Multi-Utilities - 2.7% |
|||
|
Alliant Energy Corp. |
11,729 |
685,912 |
|
|
Ameren Corp. |
25,649 |
1,059,560 |
|
|
CenterPoint Energy, Inc. |
45,257 |
1,120,563 |
|
|
CMS Energy Corp. |
28,179 |
854,105 |
|
|
Consolidated Edison, Inc. |
30,928 |
1,794,752 |
|
|
DTE Energy Co. |
18,361 |
1,434,729 |
|
|
Integrys Energy Group, Inc. |
8,361 |
512,362 |
|
|
MDU Resources Group, Inc. |
19,906 |
705,071 |
|
|
NiSource, Inc. |
32,952 |
1,196,817 |
|
|
Public Service Enterprise Group, Inc. |
53,429 |
2,188,986 |
|
|
SCANA Corp. |
14,700 |
789,096 |
|
|
Sempra Energy |
25,705 |
2,534,770 |
|
|
TECO Energy, Inc. (d) |
23,025 |
413,529 |
|
|
Vectren Corp. |
8,726 |
354,014 |
|
|
Wisconsin Energy Corp. |
24,160 |
1,171,277 |
|
|
|
16,815,543 |
||
|
Common Stocks - continued |
|||
|
Shares |
Value |
||
|
UTILITIES - continued |
|||
|
Water Utilities - 0.2% |
|||
|
American Water Works Co., Inc. |
18,776 |
$ 854,871 |
|
|
Aqua America, Inc. (d) |
18,524 |
464,767 |
|
|
|
1,319,638 |
||
|
TOTAL UTILITIES |
38,250,195 |
||
|
TOTAL COMMON STOCKS (Cost $529,003,341) |
|
||
|
U.S. Treasury Obligations - 0.0% |
|||
|
|
Principal Amount |
|
|
|
U.S. Treasury Bills, yield at date of purchase 0.09% 7/24/14 (e) |
$ 300,000 |
|
|
|
Money Market Funds - 9.8% |
|||
|
Shares |
|
||
|
Fidelity Cash Central Fund, 0.11% (b) |
5,846,189 |
5,846,189 |
|
|
Fidelity Securities Lending Cash Central Fund, 0.10% (b)(c) |
55,676,889 |
55,676,889 |
|
|
TOTAL MONEY MARKET FUNDS (Cost $61,523,078) |
|
||
|
TOTAL INVESTMENT PORTFOLIO - 109.5% (Cost $590,826,360) |
687,307,683 |
||
|
NET OTHER ASSETS (LIABILITIES) - (9.5)% |
(59,904,269) |
||
|
NET ASSETS - 100% |
$ 627,403,414 |
||
|
Futures Contracts |
|||||
|
|
Expiration Date |
Underlying Face Amount at Value |
Unrealized Appreciation/ |
||
|
Purchased |
|||||
|
Equity Index Contracts |
|||||
|
21 CME E-mini S&P MidCap 400 Index Contracts (United States) |
June 2014 |
$ 2,841,510 |
$ 44,914 |
||
|
|
|
The face value of futures purchased as a percentage of net assets is 0.5% |
|
Legend |
|
(a) Non-income producing |
|
(b) Affiliated fund that is generally available only to investment companies and other accounts managed by Fidelity Investments. The rate quoted is the annualized seven-day yield of the fund at period end. A complete unaudited listing of the fund's holdings as of its most recent quarter end is available upon request. In addition, each Fidelity Central Fund's financial statements, which are not covered by the Fund's Report of Independent Registered Public Accounting Firm, are available on the SEC's website or upon request. |
|
(c) Investment made with cash collateral received from securities on loan. |
|
(d) Security or a portion of the security is on loan at period end. |
|
(e) Security or a portion of the security was pledged to cover margin requirements for futures contracts. At period end, the value of securities pledged amounted to $299,990. |
|
Affiliated Central Funds |
|
Information regarding fiscal year to date income earned by the Fund from investments in Fidelity Central Funds is as follows: |
|
Fund |
Income earned |
|
Fidelity Cash Central Fund |
$ 6,608 |
|
Fidelity Securities Lending Cash Central Fund |
131,099 |
|
Total |
$ 137,707 |
|
Other Information |
|
The following is a summary of the inputs used, as of April 30, 2014, involving the Fund's assets and liabilities carried at fair value. The inputs or methodology used for valuing securities may not be an indication of the risk associated with investing in those securities. For more information on valuation inputs, and their aggregation into the levels used in the table below, please refer to the Investment Valuation section in the accompanying Notes to Financial Statements. |
|
Valuation Inputs at Reporting Date: |
||||
|
Description |
Total |
Level 1 |
Level 2 |
Level 3 |
|
Investments in Securities: |
||||
|
Equities: |
||||
|
Consumer Discretionary |
$ 104,383,898 |
$ 104,383,898 |
$ - |
$ - |
|
Consumer Staples |
35,601,577 |
35,601,577 |
- |
- |
|
Energy |
44,786,416 |
44,786,416 |
- |
- |
|
Financials |
125,219,693 |
125,219,693 |
- |
- |
|
Health Care |
68,895,392 |
68,895,392 |
- |
- |
|
Industrials |
84,832,876 |
84,832,876 |
- |
- |
|
Information Technology |
83,300,544 |
83,300,544 |
- |
- |
|
Materials |
35,615,342 |
35,615,342 |
- |
- |
|
Telecommunication Services |
4,598,682 |
4,598,682 |
- |
- |
|
Utilities |
38,250,195 |
38,250,195 |
- |
- |
|
U.S. Government and Government Agency Obligations |
299,990 |
- |
299,990 |
- |
|
Money Market Funds |
61,523,078 |
61,523,078 |
- |
- |
|
Total Investments in Securities: |
$ 687,307,683 |
$ 687,007,693 |
$ 299,990 |
$ - |
|
Derivative Instruments: |
||||
|
Assets |
||||
|
Futures Contracts |
$ 44,914 |
$ 44,914 |
$ - |
$ - |
|
Value of Derivative Instruments |
|
The following table is a summary of the Fund's value of derivative instruments by primary risk exposure as of April 30, 2014. For additional information on derivative instruments, please refer to the Derivative Instruments section in the accompanying Notes to Financial Statements. |
|
Primary Risk Exposure / |
Value |
|
|
|
Asset |
Liability |
|
Equity Risk |
||
|
Futures Contracts (a) |
$ 44,914 |
$ - |
|
Total Value of Derivatives |
$ 44,914 |
$ - |
|
(a) Reflects gross cumulative appreciation (depreciation) on futures contracts as presented in the Schedule of Investments. Only the period end receivable or payable for daily variation margin and net unrealized appreciation (depreciation) are presented in the Statement of Assets and Liabilities. |
See accompanying notes which are an integral part of the financial statements.
Annual Report
Spartan Mid Cap Index Fund
Financial Statements
Statement of Assets and Liabilities
|
|
April 30, 2014 |
|
|
|
|
|
|
Assets |
|
|
|
Investment in securities, at value (including securities loaned of $54,781,279) - See accompanying schedule: Unaffiliated issuers (cost $529,303,282) |
$ 625,784,605 |
|
|
Fidelity Central Funds (cost $61,523,078) |
61,523,078 |
|
|
Total Investments (cost $590,826,360) |
|
$ 687,307,683 |
|
Segregated cash with brokers for derivative instruments |
|
72,014 |
|
Receivable for investments sold |
|
765,023 |
|
Receivable for fund shares sold |
|
1,783,910 |
|
Dividends receivable |
|
223,400 |
|
Distributions receivable from Fidelity Central Funds |
|
20,916 |
|
Receivable for daily variation margin for derivative instruments |
|
35,978 |
|
Receivable from investment adviser for expense reductions |
|
59,103 |
|
Other receivables |
|
71 |
|
Total assets |
|
690,268,098 |
|
|
|
|
|
Liabilities |
|
|
|
Payable for investments purchased |
$ 5,785,724 |
|
|
Payable for fund shares redeemed |
1,301,762 |
|
|
Accrued management fee |
62,043 |
|
|
Other affiliated payables |
38,266 |
|
|
Collateral on securities loaned, at value |
55,676,889 |
|
|
Total liabilities |
|
62,864,684 |
|
|
|
|
|
Net Assets |
|
$ 627,403,414 |
|
Net Assets consist of: |
|
|
|
Paid in capital |
|
$ 527,981,179 |
|
Undistributed net investment income |
|
2,402,433 |
|
Accumulated undistributed net realized gain (loss) on investments |
|
493,565 |
|
Net unrealized appreciation (depreciation) on investments |
|
96,526,237 |
|
Net Assets |
|
$ 627,403,414 |
See accompanying notes which are an integral part of the financial statements.
Annual Report
Statement of Assets and Liabilities - continued
|
|
April 30, 2014 |
|
|
|
|
|
|
Investor Class: |
|
$ 16.26 |
|
|
|
|
|
Fidelity Advantage Class: |
|
$ 16.28 |
|
|
|
|
|
Institutional Class: |
|
$ 16.29 |
|
|
|
|
|
Fidelity Advantage Institutional Class: |
|
$ 16.29 |
See accompanying notes which are an integral part of the financial statements.
Annual Report
Spartan Mid Cap Index Fund
Financial Statements - continued
Statement of Operations
|
|
Year ended April 30, 2014 |
|
|
|
|
|
|
Investment Income |
|
|
|
Dividends |
|
$ 6,790,787 |
|
Interest |
|
254 |
|
Income from Fidelity Central Funds (including $131,099 from security lending) |
|
137,707 |
|
Total income |
|
6,928,748 |
|
|
|
|
|
Expenses |
|
|
|
Management fee |
$ 532,775 |
|
|
Transfer agent fees |
326,053 |
|
|
Independent trustees' compensation |
1,570 |
|
|
Miscellaneous |
744 |
|
|
Total expenses before reductions |
861,142 |
|
|
Expense reductions |
(510,316) |
350,826 |
|
Net investment income (loss) |
|
6,577,922 |
|
Realized and Unrealized Gain (Loss) Net realized gain (loss) on: |
|
|
|
Investment securities: |
|
|
|
Unaffiliated issuers |
3,551,006 |
|
|
Futures contracts |
(24,891) |
|
|
Total net realized gain (loss) |
|
3,526,115 |
|
Change in net unrealized appreciation (depreciation) on: Investment securities |
68,893,513 |
|
|
Futures contracts |
4,937 |
|
|
Total change in net unrealized appreciation (depreciation) |
|
68,898,450 |
|
Net gain (loss) |
|
72,424,565 |
|
Net increase (decrease) in net assets resulting from operations |
|
$ 79,002,487 |
See accompanying notes which are an integral part of the financial statements.
Annual Report
Statement of Changes in Net Assets
|
|
Year ended |
Year ended |
|
Increase (Decrease) in Net Assets |
|
|
|
Operations |
|
|
|
Net investment income (loss) |
$ 6,577,922 |
$ 1,831,291 |
|
Net realized gain (loss) |
3,526,115 |
620,580 |
|
Change in net unrealized appreciation (depreciation) |
68,898,450 |
23,986,390 |
|
Net increase (decrease) in net assets resulting |
79,002,487 |
26,438,261 |
|
Distributions to shareholders from net investment income |
(4,447,495) |
(1,249,909) |
|
Distributions to shareholders from net realized gain |
(3,210,300) |
(309,278) |
|
Total distributions |
(7,657,795) |
(1,559,187) |
|
Share transactions - net increase (decrease) |
308,161,972 |
176,854,037 |
|
Redemption fees |
40,938 |
11,506 |
|
Total increase (decrease) in net assets |
379,547,602 |
201,744,617 |
|
|
|
|
|
Net Assets |
|
|
|
Beginning of period |
247,855,812 |
46,111,195 |
|
End of period (including undistributed net investment income of $2,402,433 and undistributed net investment income of $699,014, respectively) |
$ 627,403,414 |
$ 247,855,812 |
See accompanying notes which are an integral part of the financial statements.
Annual Report
Financial Highlights - Investor Class
|
Years ended April 30, |
2014 |
2013 |
2012 G |
|
Selected Per-Share Data |
|
|
|
|
Net asset value, beginning of period |
$ 13.66 |
$ 11.68 |
$ 10.00 |
|
Income from Investment Operations |
|
|
|
|
Net investment income (loss) D |
.20 |
.18 |
.09 |
|
Net realized and unrealized gain (loss) |
2.65 |
1.99 |
1.64 |
|
Total from investment operations |
2.85 |
2.17 |
1.73 |
|
Distributions from net investment income |
(.13) |
(.15) |
(.05) |
|
Distributions from net realized gain |
(.11) |
(.04) |
- |
|
Total distributions |
(.25) J |
(.19) |
(.05) |
|
Redemption fees added to paid in capital D, I |
- |
- |
- |
|
Net asset value, end of period |
$ 16.26 |
$ 13.66 |
$ 11.68 |
|
Total Return B, C |
20.99% |
18.93% |
17.37% |
|
Ratios to Average Net Assets E, H |
|
|
|
|
Expenses before reductions |
.33% |
.33% |
.33% A |
|
Expenses net of fee waivers, if any |
.22% |
.25% |
.26% A |
|
Expenses net of all reductions |
.22% |
.25% |
.26% A |
|
Net investment income (loss) |
1.35% |
1.56% |
1.24% A |
|
Supplemental Data |
|
|
|
|
Net assets, end of period (000 omitted) |
$ 15,099 |
$ 5,140 |
$ 7,794 |
|
Portfolio turnover rate F |
7% |
5% |
5% A |
A Annualized
B Total returns for periods of less than one year are not annualized.
C Total returns would have been lower if certain expenses had not been reduced during the applicable periods shown.
D Calculated based on average shares outstanding during the period.
E Fees and expenses of any underlying Fidelity Central Funds are not included in the Fund's expense ratio. The Fund indirectly bears its proportionate share of the expenses of any underlying Fidelity Central Funds.
F Amount does not include the portfolio activity of any underlying Fidelity Central Funds.
G For the period September 8, 2011 (commencement of operations) to April 30, 2012.
H Expense ratios reflect operating expenses of the class. Expenses before reductions do not reflect amounts reimbursed by the investment adviser or reductions from expense offset arrangements and do not represent the amount paid by the class during periods when reimbursements or reductions occur. Expenses net of fee waivers reflect expenses after reimbursement by the investment adviser but prior to reductions from expense offset arrangements. Expenses net of all reductions represent the net expenses paid by the class.
I Amount represents less than $.01 per share.
J Total distributions of $.25 per share is comprised of distributions from net investment income of $.134 and distributions from net realized gain of $.111 per share.
See accompanying notes which are an integral part of the financial statements.
Annual Report
Financial Highlights - Fidelity Advantage Class
|
Years ended April 30, |
2014 |
2013 |
2012 G |
|
Selected Per-Share Data |
|
|
|
|
Net asset value, beginning of period |
$ 13.68 |
$ 11.69 |
$ 10.00 |
|
Income from Investment Operations |
|
|
|
|
Net investment income (loss) D |
.23 |
.21 |
.10 |
|
Net realized and unrealized gain (loss) |
2.64 |
1.98 |
1.64 |
|
Total from investment operations |
2.87 |
2.19 |
1.74 |
|
Distributions from net investment income |
(.16) |
(.16) |
(.05) |
|
Distributions from net realized gain |
(.11) |
(.04) |
- |
|
Total distributions |
(.27) |
(.20) |
(.05) |
|
Redemption fees added to paid in capital D, I |
- |
- |
- |
|
Net asset value, end of period |
$ 16.28 |
$ 13.68 |
$ 11.69 |
|
Total Return B, C |
21.14% |
19.10% |
17.48% |
|
Ratios to Average Net Assets E, H |
|
|
|
|
Expenses before reductions |
.20% |
.20% |
.20% A |
|
Expenses net of fee waivers, if any |
.08% |
.09% |
.12% A |
|
Expenses net of all reductions |
.08% |
.09% |
.12% A |
|
Net investment income (loss) |
1.49% |
1.72% |
1.37% A |
|
Supplemental Data |
|
|
|
|
Net assets, end of period (000 omitted) |
$ 519,385 |
$ 198,767 |
$ 18,896 |
|
Portfolio turnover rate F |
7% |
5% |
5% A |
A Annualized
B Total returns for periods of less than one year are not annualized.
C Total returns would have been lower if certain expenses had not been reduced during the applicable periods shown.
D Calculated based on average shares outstanding during the period.
E Fees and expenses of any underlying Fidelity Central Funds are not included in the Fund's expense ratio. The Fund indirectly bears its proportionate share of the expenses of any underlying Fidelity Central Funds.
F Amount does not include the portfolio activity of any underlying Fidelity Central Funds.
G For the period September 8, 2011 (commencement of operations) to April 30, 2012.
H Expense ratios reflect operating expenses of the class. Expenses before reductions do not reflect amounts reimbursed by the investment adviser or reductions from expense offset arrangements and do not represent the amount paid by the class during periods when reimbursements or reductions occur. Expenses net of fee waivers reflect expenses after reimbursement by the investment adviser but prior to reductions from expense offset arrangements. Expenses net of all reductions represent the net expenses paid by the class.
I Amount represents less than $.01 per share.
See accompanying notes which are an integral part of the financial statements.
Annual Report
Financial Highlights - Institutional Class
|
Years ended April 30, |
2014 |
2013 |
2012 G |
|
Selected Per-Share Data |
|
|
|
|
Net asset value, beginning of period |
$ 13.68 |
$ 11.70 |
$ 10.00 |
|
Income from Investment Operations |
|
|
|
|
Net investment income (loss) D |
.23 |
.21 |
.10 |
|
Net realized and unrealized gain (loss) |
2.65 |
1.98 |
1.65 |
|
Total from investment operations |
2.88 |
2.19 |
1.75 |
|
Distributions from net investment income |
(.16) |
(.16) |
(.05) |
|
Distributions from net realized gain |
(.11) |
(.04) |
- |
|
Total distributions |
(.27) |
(.21) J |
(.05) |
|
Redemption fees added to paid in capital D, I |
- |
- |
- |
|
Net asset value, end of period |
$ 16.29 |
$ 13.68 |
$ 11.70 |
|
Total Return B, C |
21.24% |
19.04% |
17.59% |
|
Ratios to Average Net Assets E, H |
|
|
|
|
Expenses before reductions |
.14% |
.14% |
.14% A |
|
Expenses net of fee waivers, if any |
.06% |
.07% |
.08% A |
|
Expenses net of all reductions |
.06% |
.07% |
.08% A |
|
Net investment income (loss) |
1.51% |
1.74% |
1.41% A |
|
Supplemental Data |
|
|
|
|
Net assets, end of period (000 omitted) |
$ 88,657 |
$ 42,952 |
$ 19,312 |
|
Portfolio turnover rate F |
7% |
5% |
5% A |
A Annualized
B Total returns for periods of less than one year are not annualized.
C Total returns would have been lower if certain expenses had not been reduced during the applicable periods shown.
D Calculated based on average shares outstanding during the period.
E Fees and expenses of any underlying Fidelity Central Funds are not included in the Fund's expense ratio. The Fund indirectly bears its proportionate share of the expenses of any underlying Fidelity Central Funds.
F Amount does not include the portfolio activity of any underlying Fidelity Central Funds.
G For the period September 8, 2011 (commencement of operations) to April 30, 2012.
H Expense ratios reflect operating expenses of the class. Expenses before reductions do not reflect amounts reimbursed by the investment adviser or reductions from expense offset arrangements and do not represent the amount paid by the class during periods when reimbursements or reductions occur. Expenses net of fee waivers reflect expenses after reimbursement by the investment adviser but prior to reductions from expense offset arrangements. Expenses net of all reductions represent the net expenses paid by the class.
I Amount represents less than $.01 per share.
J Total distributions of $.21 per share is comprised of distributions from net investment income of $.1639 and distributions from net realized gain of $.044 per share.
See accompanying notes which are an integral part of the financial statements.
Annual Report
Financial Highlights - Fidelity Advantage Institutional Class
|
Years ended April 30, |
2014 |
2013 |
2012 G |
|
Selected Per-Share Data |
|
|
|
|
Net asset value, beginning of period |
$ 13.68 |
$ 11.70 |
$ 10.00 |
|
Income from Investment Operations |
|
|
|
|
Net investment income (loss) D |
.23 |
.22 |
.10 |
|
Net realized and unrealized gain (loss) |
2.65 |
1.97 |
1.65 |
|
Total from investment operations |
2.88 |
2.19 |
1.75 |
|
Distributions from net investment income |
(.16) |
(.17) |
(.05) |
|
Distributions from net realized gain |
(.11) |
(.04) |
- |
|
Total distributions |
(.27) |
(.21) |
(.05) |
|
Redemption fees added to paid in capital D, I |
- |
- |
- |
|
Net asset value, end of period |
$ 16.29 |
$ 13.68 |
$ 11.70 |
|
Total Return B, C |
21.26% |
19.06% |
17.60% |
|
Ratios to Average Net Assets E, H |
|
|
|
|
Expenses before reductions |
.12% |
.12% |
.12% A |
|
Expenses net of fee waivers, if any |
.04% |
.05% |
.06% A |
|
Expenses net of all reductions |
.04% |
.05% |
.06% A |
|
Net investment income (loss) |
1.53% |
1.77% |
1.43% A |
|
Supplemental Data |
|
|
|
|
Net assets, end of period (000 omitted) |
$ 4,263 |
$ 996 |
$ 109 |
|
Portfolio turnover rate F |
7% |
5% |
5% A |
A Annualized
B Total returns for periods of less than one year are not annualized.
C Total returns would have been lower if certain expenses had not been reduced during the applicable periods shown.
D Calculated based on average shares outstanding during the period.
E Fees and expenses of any underlying Fidelity Central Funds are not included in the Fund's expense ratio. The Fund indirectly bears its proportionate share of the expenses of any underlying Fidelity Central Funds.
F Amount does not include the portfolio activity of any underlying Fidelity Central Funds.
G For the period September 8, 2011 (commencement of operations) to April 30, 2012.
H Expense ratios reflect operating expenses of the class. Expenses before reductions do not reflect amounts reimbursed by the investment adviser or reductions from expense offset arrangements and do not represent the amount paid by the class during periods when reimbursements or reductions occur. Expenses net of fee waivers reflect expenses after reimbursement by the investment adviser but prior to reductions from expense offset arrangements. Expenses net of all reductions represent the net expenses paid by the class.
I Amount represents less than $.01 per share.
See accompanying notes which are an integral part of the financial statements.
Annual Report
Spartan Small Cap Index Fund
Performance: The Bottom Line
Average annual total return reflects the change in the value of an investment, assuming reinvestment of the class' distributions from dividend income and capital gains (the profits earned upon the sale of securities that have grown in value, if any) and assuming a constant rate of performance each year. The $10,000 table and the fund's returns do not reflect the deduction of taxes that a shareholder would pay on fund distributions or the redemption of fund shares. During periods of reimbursement by Fidelity, a fund's total return will be greater than it would be had the reimbursement not occurred. How a fund did yesterday is no guarantee of how it will do tomorrow.
Average Annual Total Returns
|
Periods ended April 30, 2014 |
Past 1 |
Life of |
|
Investor Class |
20.46% |
21.57% |
|
Fidelity Advantage Class |
20.61% |
21.73% |
A From September 8, 2011.
$10,000 Over Life of Fund
Let's say hypothetically that $10,000 was invested in Spartan Small Cap Index Fund - Investor Class on September 8, 2011, when the fund started. The chart shows how the value of your investment would have changed, and also shows how the Russell 2000® Index performed over the same period.
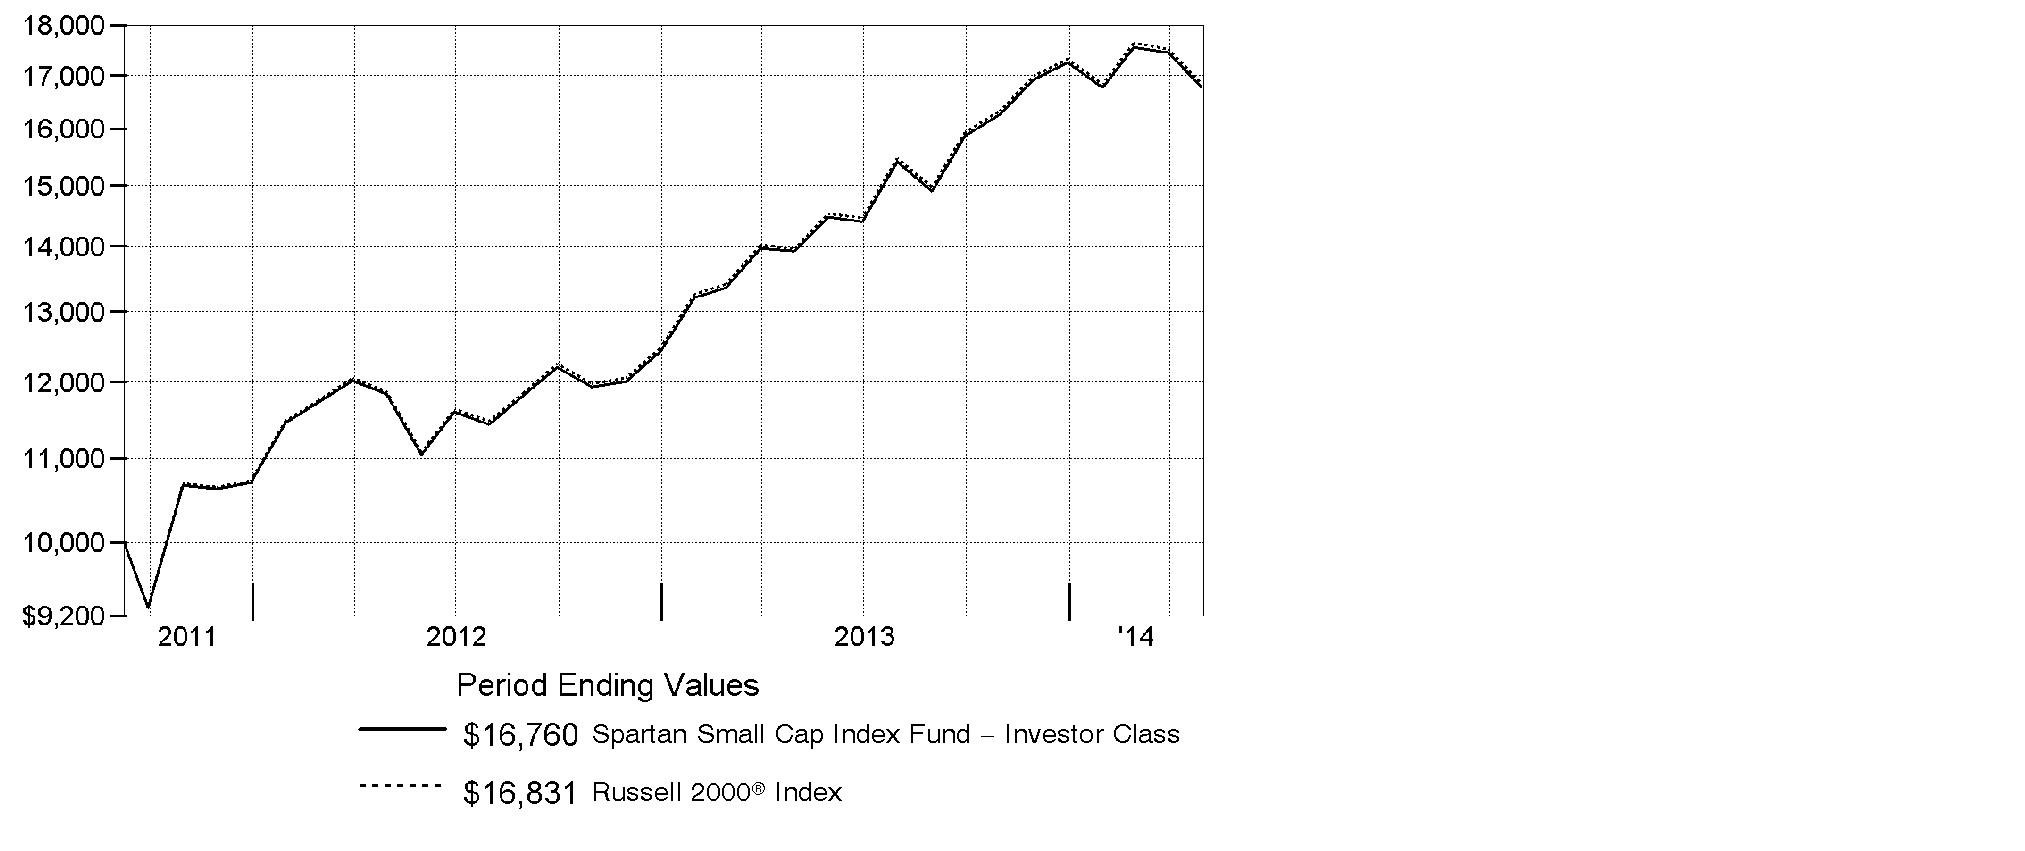
Annual Report
Spartan Small Cap Index Fund
Management's Discussion of Fund Performance
Market Recap: U.S. stocks overcame fears of higher interest rates, slower economic growth and a volatile start to 2014 to post strong gains for the 12 months ending April 30, 2014. The S&P 500® Index returned 20.44%, finishing near its all-time high. U.S. Federal Reserve policies that balanced stimulus reductions with low interest rates contributed to a broad advance, with eight of 10 S&P 500® market sectors posting a double-digit gain. Industrials was the best-performing sector, up about 30%, as demand improved for autos and other durable goods. Health care stocks rose 25%, as new insurance programs and a favorable drug-approval environment raised earnings-growth expectations. Conversely, the typically defensive telecommunication services sector was the only group to lose ground (-3%), while utilities (+8%) lagged. Volatility increased in the first quarter amid rising tension in Ukraine, fear of a slowing economy in China and a late-January decline for momentum stocks. Still, markets finished the period on an uptrend, aided by higher consumer spending and the lowest unemployment since 2009 - both of which helped to take the sting out of weather-beaten first-quarter gross domestic product (GDP) figures. The growth-oriented Nasdaq Composite Index® rose 25.20%, the small-cap Russell 2000® Index returned 20.50% and the Russell Midcap® Index added 21.25%.
Comments from Patrick Waddell, who was named Senior Portfolio Manager of the Geode Capital Management, LLC, investment management team for Spartan® Small Cap Index Fund on April 4, 2014: For the 12-month period ending April 30, 2014, the fund's Investor Class and Fidelity Advantage® Class shares gained 20.46% and 20.61%, respectively, in line with the Russell 2000® Index. There were many more contributors than detractors in a strong market during the period, led by Rite Aid. The pharmacy company turned a long-awaited profit in April driven by cost-cutting and higher prescription sales. Its shares are now at their highest point since 2001. In the health care sector, shares of Questcor Pharmaceuticals more than doubled in the period, driven by sales of its multiple sclerosis drug Acthar to treat additional conditions. Another biotechnology company, InterMune, saw its share price more than double in February after it received positive news surrounding a trial of its treatment for idiopathic pulmonary fibrosis, a serious lung ailment. The biggest detractor was CommVault Systems, a provider of information-management software; its shares had a one-day fall of 31% late in the period on weaker-than-expected revenue. Infinity Pharmaceuticals shares also weighed on results, following an early-stage cancer drug trial last June that did not go well, as well as continued operating losses.
The views expressed above reflect those of the portfolio manager(s) only through the end of the period as stated on the cover of this report and do not necessarily represent the views of Fidelity or any other person in the Fidelity organization. Any such views are subject to change at any time based upon market or other conditions and Fidelity disclaims any responsibility to update such views. These views may not be relied on as investment advice and, because investment decisions for a Fidelity fund are based on numerous factors, may not be relied on as an indication of trading intent on behalf of any Fidelity fund.
Annual Report
Spartan Small Cap Index Fund
Investment Changes (Unaudited)
|
Top Ten Stocks as of April 30, 2014 |
||
|
|
% of fund's |
% of fund's net assets |
|
American Realty Capital Properties, Inc. |
0.4 |
0.1 |
|
Acuity Brands, Inc. |
0.3 |
0.3 |
|
Rite Aid Corp. |
0.3 |
0.3 |
|
NorthStar Realty Finance Corp. |
0.3 |
0.1 |
|
SunEdison, Inc. |
0.3 |
0.2 |
|
Middleby Corp. |
0.3 |
0.3 |
|
CoStar Group, Inc. |
0.3 |
0.3 |
|
athenahealth, Inc. |
0.3 |
0.3 |
|
Kate Spade & Co. |
0.3 |
0.2 |
|
Questcor Pharmaceuticals, Inc. |
0.3 |
0.2 |
|
|
3.1 |
|
|
Market Sectors as of April 30, 2014 |
||
|
|
% of fund's |
% of fund's net assets |
|
Financials |
23.4 |
22.6 |
|
Information Technology |
17.1 |
17.6 |
|
Industrials |
14.5 |
14.5 |
|
Consumer Discretionary |
12.8 |
13.7 |
|
Health Care |
12.8 |
12.5 |
|
Energy |
6.0 |
5.9 |
|
Materials |
4.9 |
4.8 |
|
Consumer Staples |
3.8 |
4.0 |
|
Utilities |
3.3 |
3.1 |
|
Telecommunication Services |
0.7 |
0.7 |
Annual Report
Spartan Small Cap Index Fund
Investments April 30, 2014
Showing Percentage of Net Assets
|
Common Stocks - 99.3% |
|||
|
Shares |
Value |
||
|
CONSUMER DISCRETIONARY - 12.8% |
|||
|
Auto Components - 1.1% |
|||
|
American Axle & Manufacturing Holdings, Inc. (a) |
38,057 |
$ 671,706 |
|
|
Cooper Tire & Rubber Co. |
35,841 |
901,401 |
|
|
Dana Holding Corp. |
89,209 |
1,888,555 |
|
|
Dorman Products, Inc. (a)(d) |
14,253 |
820,260 |
|
|
Drew Industries, Inc. |
12,971 |
652,701 |
|
|
Federal-Mogul Corp. Class A (a) |
10,794 |
185,873 |
|
|
Fox Factory Holding Corp. |
5,188 |
88,144 |
|
|
Fuel Systems Solutions, Inc. (a) |
7,940 |
83,211 |
|
|
Gentherm, Inc. (a) |
19,921 |
724,128 |
|
|
Modine Manufacturing Co. (a) |
26,817 |
441,944 |
|
|
Remy International, Inc. |
7,986 |
211,789 |
|
|
Shiloh Industries, Inc. (a) |
3,526 |
69,603 |
|
|
Spartan Motors, Inc. |
19,324 |
102,610 |
|
|
Standard Motor Products, Inc. |
11,012 |
418,346 |
|
|
Stoneridge, Inc. (a) |
15,929 |
170,281 |
|
|
Superior Industries International, Inc. |
12,845 |
271,543 |
|
|
Tenneco, Inc. (a) |
34,360 |
2,057,133 |
|
|
Tower International, Inc. (a) |
3,414 |
94,943 |
|
|
|
9,854,171 |
||
|
Automobiles - 0.0% |
|||
|
Winnebago Industries, Inc. (a) |
15,699 |
375,206 |
|
|
Distributors - 0.3% |
|||
|
Core-Mark Holding Co., Inc. |
6,401 |
515,537 |
|
|
Pool Corp. |
26,190 |
1,545,734 |
|
|
VOXX International Corp. (a) |
11,258 |
132,282 |
|
|
Weyco Group, Inc. |
4,006 |
100,511 |
|
|
|
2,294,064 |
||
|
Diversified Consumer Services - 1.0% |
|||
|
American Public Education, Inc. (a)(d) |
9,853 |
340,914 |
|
|
Ascent Capital Group, Inc. (a) |
7,944 |
546,309 |
|
|
Bridgepoint Education, Inc. (a) |
8,683 |
137,626 |
|
|
Bright Horizons Family Solutions, Inc. (a) |
6,785 |
276,692 |
|
|
Capella Education Co. |
6,349 |
370,528 |
|
|
Career Education Corp. (a) |
30,304 |
218,795 |
|
|
Carriage Services, Inc. |
9,525 |
153,257 |
|
|
Corinthian Colleges, Inc. (a)(d) |
46,351 |
53,304 |
|
|
Education Management Corp. (a)(d) |
13,685 |
54,329 |
|
|
Grand Canyon Education, Inc. (a) |
25,660 |
1,106,459 |
|
|
Hillenbrand, Inc. |
30,814 |
936,746 |
|
|
Houghton Mifflin Harcourt Co. |
11,560 |
236,171 |
|
|
Common Stocks - continued |
|||
|
Shares |
Value |
||
|
CONSUMER DISCRETIONARY - continued |
|||
|
Diversified Consumer Services - continued |
|||
|
ITT Educational Services, Inc. (a)(d) |
13,110 |
$ 353,970 |
|
|
JTH Holding, Inc. Class A (a) |
2,687 |
73,086 |
|
|
K12, Inc. (a)(d) |
15,510 |
367,277 |
|
|
LifeLock, Inc. (a) |
35,879 |
563,300 |
|
|
Lincoln Educational Services Corp. |
12,947 |
52,824 |
|
|
Matthews International Corp. Class A |
15,583 |
628,774 |
|
|
Regis Corp. (d) |
27,111 |
356,239 |
|
|
Sotheby's Class A (Ltd. vtg.) |
38,629 |
1,624,736 |
|
|
Steiner Leisure Ltd. (a) |
8,218 |
354,771 |
|
|
Strayer Education, Inc. (a) |
6,176 |
263,283 |
|
|
Universal Technical Institute, Inc. |
12,839 |
154,196 |
|
|
|
9,223,586 |
||
|
Hotels, Restaurants & Leisure - 2.6% |
|||
|
Biglari Holdings, Inc. |
804 |
344,932 |
|
|
BJ's Restaurants, Inc. (a)(d) |
13,797 |
393,904 |
|
|
Bloomin' Brands, Inc. (a) |
31,325 |
667,849 |
|
|
Bob Evans Farms, Inc. (d) |
14,851 |
696,066 |
|
|
Boyd Gaming Corp. (a) |
38,917 |
459,999 |
|
|
Bravo Brio Restaurant Group, Inc. (a) |
11,117 |
166,421 |
|
|
Buffalo Wild Wings, Inc. (a) |
10,596 |
1,548,288 |
|
|
Caesars Entertainment Corp. (a)(d) |
24,105 |
445,219 |
|
|
Carrols Restaurant Group, Inc. (a) |
13,351 |
89,585 |
|
|
Churchill Downs, Inc. |
7,689 |
675,325 |
|
|
Chuy's Holdings, Inc. (a)(d) |
9,276 |
333,472 |
|
|
ClubCorp Holdings, Inc. |
11,471 |
216,114 |
|
|
Cracker Barrel Old Country Store, Inc. |
11,043 |
1,046,214 |
|
|
Del Frisco's Restaurant Group, Inc. (a) |
5,902 |
153,511 |
|
|
Denny's Corp. (a) |
51,232 |
345,304 |
|
|
Diamond Resorts International, Inc. |
9,914 |
185,491 |
|
|
DineEquity, Inc. |
9,242 |
700,636 |
|
|
Diversified Restaurant Holdings, Inc. (a) |
6,865 |
34,394 |
|
|
Einstein Noah Restaurant Group, Inc. |
4,413 |
67,784 |
|
|
Fiesta Restaurant Group, Inc. (a) |
12,537 |
458,980 |
|
|
Ignite Restaurant Group, Inc. (a)(d) |
4,238 |
59,925 |
|
|
International Speedway Corp. Class A |
15,953 |
501,562 |
|
|
Interval Leisure Group, Inc. |
22,118 |
569,981 |
|
|
Intrawest Resorts Holdings, Inc. |
10,095 |
114,477 |
|
|
Isle of Capri Casinos, Inc. (a) |
10,772 |
73,250 |
|
|
Jack in the Box, Inc. (a) |
23,634 |
1,265,364 |
|
|
Jamba, Inc. (a) |
8,554 |
94,607 |
|
|
Common Stocks - continued |
|||
|
Shares |
Value |
||
|
CONSUMER DISCRETIONARY - continued |
|||
|
Hotels, Restaurants & Leisure - continued |
|||
|
Krispy Kreme Doughnuts, Inc. (a)(d) |
36,569 |
$ 641,420 |
|
|
Life Time Fitness, Inc. (a)(d) |
24,299 |
1,166,352 |
|
|
Luby's, Inc. (a) |
10,172 |
55,132 |
|
|
Marcus Corp. |
10,673 |
178,559 |
|
|
Marriott Vacations Worldwide Corp. (a) |
16,251 |
885,354 |
|
|
Monarch Casino & Resort, Inc. (a) |
4,582 |
73,495 |
|
|
Morgans Hotel Group Co. (a) |
16,393 |
122,948 |
|
|
Multimedia Games Holding Co., Inc. (a) |
16,200 |
473,040 |
|
|
Nathan's Famous, Inc. (a) |
1,709 |
84,220 |
|
|
Noodles & Co. (d) |
3,417 |
112,043 |
|
|
Orient Express Hotels Ltd. Class A (a) |
53,634 |
702,605 |
|
|
Papa John's International, Inc. |
18,063 |
792,243 |
|
|
Pinnacle Entertainment, Inc. (a)(d) |
32,691 |
760,720 |
|
|
Popeyes Louisiana Kitchen, Inc. (a) |
13,309 |
507,073 |
|
|
Potbelly Corp. |
5,089 |
86,513 |
|
|
Red Robin Gourmet Burgers, Inc. (a) |
7,912 |
537,858 |
|
|
Ruby Tuesday, Inc. (a)(d) |
35,344 |
272,502 |
|
|
Ruth's Hospitality Group, Inc. |
19,828 |
249,635 |
|
|
Scientific Games Corp. Class A (a) |
27,342 |
327,557 |
|
|
Sonic Corp. (a) |
31,638 |
602,388 |
|
|
Speedway Motorsports, Inc. |
6,492 |
118,089 |
|
|
Texas Roadhouse, Inc. Class A |
35,154 |
869,710 |
|
|
The Cheesecake Factory, Inc. (d) |
29,734 |
1,334,759 |
|
|
Town Sports International Holdings, Inc. |
14,300 |
100,243 |
|
|
Vail Resorts, Inc. |
20,195 |
1,398,100 |
|
|
|
24,161,212 |
||
|
Household Durables - 1.1% |
|||
|
Bassett Furniture Industries, Inc. |
7,031 |
96,957 |
|
|
Beazer Homes U.S.A., Inc. (a)(d) |
13,831 |
262,236 |
|
|
Blyth, Inc. (d) |
6,054 |
56,726 |
|
|
Cavco Industries, Inc. (a) |
3,832 |
298,704 |
|
|
CSS Industries, Inc. |
4,771 |
114,361 |
|
|
Ethan Allen Interiors, Inc. |
13,675 |
332,029 |
|
|
EveryWare Global, Inc. (a)(d) |
3,681 |
10,012 |
|
|
Flexsteel Industries, Inc. |
2,711 |
93,042 |
|
|
Helen of Troy Ltd. (a) |
18,048 |
1,131,610 |
|
|
Hooker Furniture Corp. |
6,516 |
90,247 |
|
|
Hovnanian Enterprises, Inc. Class A (a)(d) |
64,457 |
287,478 |
|
|
Installed Building Products, Inc. (a) |
4,859 |
67,589 |
|
|
iRobot Corp. (a)(d) |
15,748 |
527,558 |
|
|
Common Stocks - continued |
|||
|
Shares |
Value |
||
|
CONSUMER DISCRETIONARY - continued |
|||
|
Household Durables - continued |
|||
|
KB Home |
46,765 |
$ 772,090 |
|
|
La-Z-Boy, Inc. |
29,806 |
722,199 |
|
|
LGI Homes, Inc. |
5,351 |
78,767 |
|
|
Libbey, Inc. (a) |
11,519 |
307,212 |
|
|
Lifetime Brands, Inc. |
6,232 |
119,031 |
|
|
M.D.C. Holdings, Inc. (d) |
21,859 |
603,308 |
|
|
M/I Homes, Inc. (a)(d) |
13,402 |
298,463 |
|
|
Meritage Homes Corp. (a) |
21,793 |
840,774 |
|
|
NACCO Industries, Inc. Class A |
2,649 |
141,960 |
|
|
New Home Co. LLC (a) |
5,050 |
69,438 |
|
|
Ryland Group, Inc. |
26,247 |
1,007,622 |
|
|
Skullcandy, Inc. (a) |
10,425 |
80,273 |
|
|
Standard Pacific Corp. (a)(d) |
82,478 |
658,999 |
|
|
TRI Pointe Homes, Inc. (a)(d) |
8,263 |
132,786 |
|
|
UCP, Inc. |
5,101 |
72,179 |
|
|
Universal Electronics, Inc. (a) |
8,914 |
332,938 |
|
|
WCI Communities, Inc. |
3,763 |
72,137 |
|
|
William Lyon Homes, Inc. (a) |
7,531 |
196,559 |
|
|
Zagg, Inc. (a)(d) |
18,320 |
79,692 |
|
|
|
9,954,976 |
||
|
Internet & Catalog Retail - 0.4% |
|||
|
1-800-FLOWERS.com, Inc. Class A (a) |
16,880 |
91,996 |
|
|
Blue Nile, Inc. (a)(d) |
6,826 |
237,067 |
|
|
FTD Companies, Inc. (a)(d) |
10,167 |
308,467 |
|
|
HSN, Inc. |
19,130 |
1,110,305 |
|
|
NutriSystem, Inc. |
15,894 |
238,410 |
|
|
Orbitz Worldwide, Inc. (a) |
13,637 |
100,232 |
|
|
Overstock.com, Inc. (a) |
6,236 |
99,901 |
|
|
PetMed Express, Inc. (d) |
10,826 |
141,712 |
|
|
RetailMeNot, Inc. |
5,611 |
167,264 |
|
|
Shutterfly, Inc. (a)(d) |
21,542 |
881,714 |
|
|
ValueVision Media, Inc. Class A (a) |
22,083 |
103,348 |
|
|
Vitacost.com, Inc. (a) |
12,141 |
80,980 |
|
|
|
3,561,396 |
||
|
Leisure Products - 0.5% |
|||
|
Arctic Cat, Inc. |
7,392 |
302,259 |
|
|
Black Diamond, Inc. (a)(d) |
12,554 |
139,977 |
|
|
Brunswick Corp. |
51,047 |
2,051,579 |
|
|
Callaway Golf Co. (d) |
43,180 |
376,098 |
|
|
JAKKS Pacific, Inc. (d) |
11,689 |
102,396 |
|
|
Common Stocks - continued |
|||
|
Shares |
Value |
||
|
CONSUMER DISCRETIONARY - continued |
|||
|
Leisure Products - continued |
|||
|
Johnson Outdoors, Inc. Class A |
2,606 |
$ 54,544 |
|
|
Leapfrog Enterprises, Inc. Class A (a)(d) |
34,935 |
239,305 |
|
|
Malibu Boats, Inc. Class A (a) |
4,630 |
103,064 |
|
|
Marine Products Corp. |
5,268 |
37,403 |
|
|
Nautilus, Inc. (a) |
17,383 |
144,800 |
|
|
Smith & Wesson Holding Corp. (a)(d) |
31,164 |
478,367 |
|
|
Sturm, Ruger & Co., Inc. (d) |
10,800 |
694,980 |
|
|
|
4,724,772 |
||
|
Media - 1.3% |
|||
|
A.H. Belo Corp. Class A |
10,515 |
121,028 |
|
|
AMC Entertainment Hld, Inc. Class A |
11,759 |
272,103 |
|
|
Beasley Broadcast Group, Inc. Class A |
1,578 |
12,151 |
|
|
Carmike Cinemas, Inc. (a) |
12,891 |
382,347 |
|
|
Central European Media Enterprises Ltd. Class A (a)(d) |
42,117 |
115,401 |
|
|
Crown Media Holdings, Inc. Class A (a) |
20,582 |
73,684 |
|
|
Cumulus Media, Inc. Class A (a) |
51,921 |
332,814 |
|
|
Daily Journal Corp. (a) |
594 |
104,722 |
|
|
Dex Media, Inc. (a)(d) |
9,778 |
71,673 |
|
|
E.W. Scripps Co. Class A (a) |
17,884 |
306,353 |
|
|
Entercom Communications Corp. Class A (a) |
13,448 |
145,238 |
|
|
Entravision Communication Corp. Class A |
30,405 |
161,451 |
|
|
Global Sources Ltd. (a)(d) |
11,733 |
104,306 |
|
|
Gray Television, Inc. (a) |
28,653 |
322,346 |
|
|
Harte-Hanks, Inc. |
23,874 |
191,947 |
|
|
Hemisphere Media Group, Inc. (a)(d) |
4,204 |
50,868 |
|
|
Journal Communications, Inc. Class A (a) |
24,566 |
197,019 |
|
|
Live Nation Entertainment, Inc. (a) |
79,561 |
1,661,234 |
|
|
Loral Space & Communications Ltd. (a) |
7,289 |
524,735 |
|
|
Martha Stewart Living Omnimedia, Inc. Class A (a)(d) |
13,774 |
53,856 |
|
|
MDC Partners, Inc. Class A (sub. vtg.) |
22,186 |
541,782 |
|
|
Media General, Inc. Class A (a)(d) |
10,741 |
164,552 |
|
|
Meredith Corp. |
20,260 |
892,858 |
|
|
National CineMedia, Inc. |
33,649 |
511,128 |
|
|
Nexstar Broadcasting Group, Inc. Class A |
16,417 |
654,217 |
|
|
ReachLocal, Inc. (a)(d) |
5,693 |
56,930 |
|
|
Reading International, Inc. Class A (a) |
10,625 |
75,225 |
|
|
Rentrak Corp. (a) |
5,850 |
333,392 |
|
|
Saga Communications, Inc. Class A |
2,877 |
127,451 |
|
|
Salem Communications Corp. Class A |
6,805 |
59,952 |
|
|
Scholastic Corp. |
14,791 |
486,772 |
|
|
Common Stocks - continued |
|||
|
Shares |
Value |
||
|
CONSUMER DISCRETIONARY - continued |
|||
|
Media - continued |
|||
|
SFX Entertainment, Inc. (d) |
11,564 |
$ 75,860 |
|
|
Sinclair Broadcast Group, Inc. Class A (d) |
38,815 |
1,037,525 |
|
|
Sizmek, Inc. (a) |
13,347 |
127,864 |
|
|
The McClatchy Co. Class A (a) |
33,435 |
183,224 |
|
|
The New York Times Co. Class A |
73,056 |
1,174,740 |
|
|
World Wrestling Entertainment, Inc. Class A (d) |
16,107 |
314,087 |
|
|
|
12,022,835 |
||
|
Multiline Retail - 0.1% |
|||
|
Burlington Stores, Inc. |
8,486 |
220,551 |
|
|
Fred's, Inc. Class A |
20,660 |
376,425 |
|
|
Gordmans Stores, Inc. |
3,733 |
16,761 |
|
|
The Bon-Ton Stores, Inc. |
7,546 |
83,006 |
|
|
Tuesday Morning Corp. (a) |
24,324 |
340,050 |
|
|
|
1,036,793 |
||
|
Specialty Retail - 3.1% |
|||
|
Aeropostale, Inc. (a)(d) |
43,103 |
214,222 |
|
|
America's Car Mart, Inc. (a)(d) |
4,563 |
164,907 |
|
|
ANN, Inc. (a) |
26,643 |
1,044,139 |
|
|
Asbury Automotive Group, Inc. (a) |
17,583 |
1,085,574 |
|
|
Barnes & Noble, Inc. (a)(d) |
22,631 |
371,148 |
|
|
bebe stores, Inc. |
19,627 |
99,116 |
|
|
Big 5 Sporting Goods Corp. |
9,364 |
114,334 |
|
|
Body Central Corp. (a)(d) |
6,388 |
6,644 |
|
|
Brown Shoe Co., Inc. |
24,169 |
570,147 |
|
|
Christopher & Banks Corp. (a) |
20,269 |
126,479 |
|
|
Citi Trends, Inc. (a) |
8,756 |
148,764 |
|
|
Conn's, Inc. (a)(d) |
12,549 |
555,042 |
|
|
Destination Maternity Corp. |
7,644 |
188,501 |
|
|
Destination XL Group, Inc. (a) |
23,827 |
128,666 |
|
|
Express, Inc. (a) |
48,249 |
702,988 |
|
|
Finish Line, Inc. Class A |
27,366 |
753,386 |
|
|
Five Below, Inc. (a)(d) |
18,522 |
746,622 |
|
|
Francesca's Holdings Corp. (a)(d) |
24,619 |
402,767 |
|
|
Genesco, Inc. (a)(d) |
13,529 |
1,033,210 |
|
|
Group 1 Automotive, Inc. (d) |
12,130 |
874,937 |
|
|
Haverty Furniture Companies, Inc. |
10,834 |
276,700 |
|
|
hhgregg, Inc. (a)(d) |
6,822 |
58,806 |
|
|
Hibbett Sports, Inc. (a)(d) |
14,788 |
796,334 |
|
|
Jos. A. Bank Clothiers, Inc. (a)(d) |
15,699 |
1,013,370 |
|
|
Kirkland's, Inc. (a) |
8,210 |
140,473 |
|
|
Common Stocks - continued |
|||
|
Shares |
Value |
||
|
CONSUMER DISCRETIONARY - continued |
|||
|
Specialty Retail - continued |
|||
|
Lithia Motors, Inc. Class A (sub. vtg.) |
12,391 |
$ 920,403 |
|
|
Lumber Liquidators Holdings, Inc. (a)(d) |
15,512 |
1,352,026 |
|
|
MarineMax, Inc. (a) |
13,588 |
218,223 |
|
|
Mattress Firm Holding Corp. (a)(d) |
7,491 |
338,518 |
|
|
Monro Muffler Brake, Inc. |
17,659 |
995,968 |
|
|
New York & Co., Inc. (a) |
17,397 |
72,893 |
|
|
Office Depot, Inc. (a) |
271,865 |
1,111,928 |
|
|
Outerwall, Inc. (a) |
11,496 |
797,248 |
|
|
Pacific Sunwear of California, Inc. (a) |
26,931 |
77,561 |
|
|
Penske Automotive Group, Inc. |
23,873 |
1,094,816 |
|
|
Pier 1 Imports, Inc. |
52,758 |
963,361 |
|
|
RadioShack Corp. (a)(d) |
57,397 |
82,078 |
|
|
Rent-A-Center, Inc. (d) |
30,115 |
879,659 |
|
|
Restoration Hardware Holdings, Inc. (a)(d) |
9,884 |
616,663 |
|
|
Sears Hometown & Outlet Stores, Inc. (a) |
4,856 |
114,650 |
|
|
Select Comfort Corp. (a) |
31,126 |
572,718 |
|
|
Shoe Carnival, Inc. |
8,431 |
192,564 |
|
|
Sonic Automotive, Inc. Class A (sub. vtg.) |
21,799 |
530,588 |
|
|
Stage Stores, Inc. (d) |
18,325 |
351,474 |
|
|
Stein Mart, Inc. |
15,551 |
194,388 |
|
|
Systemax, Inc. (a) |
6,746 |
116,638 |
|
|
The Buckle, Inc. (d) |
15,567 |
731,493 |
|
|
The Cato Corp. Class A (sub. vtg.) |
15,596 |
444,330 |
|
|
The Children's Place Retail Stores, Inc. |
12,899 |
619,152 |
|
|
The Container Store Group, Inc. (d) |
7,874 |
217,244 |
|
|
The Men's Wearhouse, Inc. |
26,807 |
1,270,116 |
|
|
The Pep Boys - Manny, Moe & Jack (a) |
29,383 |
300,294 |
|
|
Tile Shop Holdings, Inc. (a)(d) |
10,075 |
142,007 |
|
|
Tilly's, Inc. (a) |
5,632 |
63,642 |
|
|
Trans World Entertainment Corp. |
3,959 |
12,946 |
|
|
Vitamin Shoppe, Inc. (a)(d) |
17,142 |
820,759 |
|
|
West Marine, Inc. (a) |
8,867 |
94,877 |
|
|
Wet Seal, Inc. Class A (a)(d) |
44,584 |
50,380 |
|
|
Winmark Corp. |
1,419 |
107,645 |
|
|
Zale Corp. (a)(d) |
18,115 |
387,480 |
|
|
Zumiez, Inc. (a) |
11,634 |
284,451 |
|
|
|
28,758,457 |
||
|
Textiles, Apparel & Luxury Goods - 1.3% |
|||
|
American Apparel, Inc. (a)(d) |
54,539 |
35,254 |
|
|
Columbia Sportswear Co. (d) |
7,222 |
620,948 |
|
|
Common Stocks - continued |
|||
|
Shares |
Value |
||
|
CONSUMER DISCRETIONARY - continued |
|||
|
Textiles, Apparel & Luxury Goods - continued |
|||
|
Crocs, Inc. (a) |
49,184 |
$ 744,154 |
|
|
Culp, Inc. |
4,451 |
80,341 |
|
|
G-III Apparel Group Ltd. (a) |
9,482 |
680,523 |
|
|
Iconix Brand Group, Inc. (a)(d) |
28,750 |
1,221,875 |
|
|
Kate Spade & Co. (a)(d) |
71,410 |
2,482,926 |
|
|
Movado Group, Inc. |
10,028 |
393,900 |
|
|
Oxford Industries, Inc. |
7,497 |
494,877 |
|
|
Perry Ellis International, Inc. (a) |
6,799 |
102,665 |
|
|
Quiksilver, Inc. (a)(d) |
74,291 |
476,948 |
|
|
R.G. Barry Corp. |
5,302 |
96,921 |
|
|
Skechers U.S.A., Inc. Class A (sub. vtg.) (a) |
21,817 |
894,279 |
|
|
Steven Madden Ltd. (a) |
33,862 |
1,205,826 |
|
|
Tumi Holdings, Inc. (a)(d) |
26,666 |
544,520 |
|
|
Unifi, Inc. (a) |
8,464 |
187,393 |
|
|
Vera Bradley, Inc. (a)(d) |
12,028 |
340,392 |
|
|
Vince Holding Corp. |
6,733 |
185,225 |
|
|
Wolverine World Wide, Inc. (d) |
56,617 |
1,590,938 |
|
|
|
12,379,905 |
||
|
TOTAL CONSUMER DISCRETIONARY |
118,347,373 |
||
|
CONSUMER STAPLES - 3.8% |
|||
|
Beverages - 0.2% |
|||
|
Boston Beer Co., Inc. Class A (a)(d) |
4,660 |
1,146,546 |
|
|
Coca-Cola Bottling Co. Consolidated |
2,572 |
211,496 |
|
|
Craft Brew Alliance, Inc. (a) |
5,787 |
86,631 |
|
|
National Beverage Corp. (a) |
6,515 |
125,609 |
|
|
|
1,570,282 |
||
|
Food & Staples Retailing - 1.3% |
|||
|
Andersons, Inc. |
15,719 |
979,137 |
|
|
Casey's General Stores, Inc. |
21,637 |
1,485,596 |
|
|
Chefs' Warehouse Holdings (a)(d) |
9,573 |
192,322 |
|
|
Fairway Group Holdings Corp. (d) |
9,275 |
64,276 |
|
|
Ingles Markets, Inc. Class A |
6,657 |
153,044 |
|
|
Natural Grocers by Vitamin Cottage, Inc. (a)(d) |
4,861 |
173,052 |
|
|
PriceSmart, Inc. (d) |
10,671 |
1,024,843 |
|
|
Rite Aid Corp. (a) |
411,997 |
3,007,578 |
|
|
Roundy's, Inc. |
16,781 |
113,607 |
|
|
Spartan Stores, Inc. |
20,885 |
449,863 |
|
|
SUPERVALU, Inc. (a)(d) |
114,926 |
803,333 |
|
|
Common Stocks - continued |
|||
|
Shares |
Value |
||
|
CONSUMER STAPLES - continued |
|||
|
Food & Staples Retailing - continued |
|||
|
Susser Holdings Corp. (a)(d) |
10,211 |
$ 790,127 |
|
|
The Pantry, Inc. (a) |
13,141 |
197,641 |
|
|
United Natural Foods, Inc. (a)(d) |
27,863 |
1,923,383 |
|
|
Village Super Market, Inc. Class A |
3,260 |
78,859 |
|
|
Weis Markets, Inc. |
6,224 |
286,864 |
|
|
|
11,723,525 |
||
|
Food Products - 1.7% |
|||
|
Alico, Inc. |
1,349 |
47,107 |
|
|
Annie's, Inc. (a)(d) |
7,510 |
244,150 |
|
|
B&G Foods, Inc. Class A |
29,884 |
980,195 |
|
|
Boulder Brands, Inc. (a)(d) |
33,295 |
491,434 |
|
|
Cal-Maine Foods, Inc. |
8,279 |
493,677 |
|
|
Calavo Growers, Inc. |
7,199 |
223,817 |
|
|
Chiquita Brands International, Inc. (a)(d) |
25,633 |
294,267 |
|
|
Darling International, Inc. (a) |
89,111 |
1,783,111 |
|
|
Diamond Foods, Inc. (a)(d) |
12,761 |
390,104 |
|
|
Farmer Brothers Co. (a) |
3,350 |
66,029 |
|
|
Fresh Del Monte Produce, Inc. |
21,243 |
613,710 |
|
|
Griffin Land & Nurseries, Inc. |
1,450 |
42,340 |
|
|
Inventure Foods, Inc. (a) |
7,602 |
91,376 |
|
|
J&J Snack Foods Corp. |
8,399 |
786,146 |
|
|
John B. Sanfilippo & Son, Inc. |
4,877 |
112,415 |
|
|
Lancaster Colony Corp. |
10,423 |
988,934 |
|
|
Lifeway Foods, Inc. (d) |
2,583 |
38,771 |
|
|
Limoneira Co. (d) |
6,026 |
138,417 |
|
|
Omega Protein Corp. (a) |
11,154 |
126,709 |
|
|
Pilgrims Pride Corp. (a) |
34,240 |
748,486 |
|
|
Post Holdings, Inc. (a) |
21,786 |
1,138,536 |
|
|
Sanderson Farms, Inc. |
12,998 |
1,069,345 |
|
|
Seaboard Corp. (a) |
163 |
397,394 |
|
|
Seneca Foods Corp. Class A (a) |
5,248 |
149,043 |
|
|
Snyders-Lance, Inc. |
26,585 |
706,098 |
|
|
The Hain Celestial Group, Inc. (a)(d) |
21,700 |
1,866,634 |
|
|
Tootsie Roll Industries, Inc. |
11,327 |
319,308 |
|
|
TreeHouse Foods, Inc. (a) |
20,504 |
1,534,519 |
|
|
|
15,882,072 |
||
|
Household Products - 0.2% |
|||
|
Central Garden & Pet Co. Class A (non-vtg.) (a) |
23,340 |
193,022 |
|
|
Harbinger Group, Inc. (a)(d) |
18,374 |
214,241 |
|
|
Oil-Dri Corp. of America |
2,983 |
99,960 |
|
|
Common Stocks - continued |
|||
|
Shares |
Value |
||
|
CONSUMER STAPLES - continued |
|||
|
Household Products - continued |
|||
|
Orchids Paper Products Co. |
3,353 |
$ 90,095 |
|
|
Spectrum Brands Holdings, Inc. |
12,076 |
927,799 |
|
|
WD-40 Co. |
8,609 |
627,080 |
|
|
|
2,152,197 |
||
|
Personal Products - 0.2% |
|||
|
Elizabeth Arden, Inc. (a)(d) |
14,523 |
533,575 |
|
|
Inter Parfums, Inc. |
9,138 |
334,359 |
|
|
LifeVantage Corp. (a) |
60,945 |
84,104 |
|
|
MediFast, Inc. (a)(d) |
8,071 |
255,447 |
|
|
Nature's Sunshine Products, Inc. |
5,706 |
76,232 |
|
|
Nutraceutical International Corp. (a) |
4,384 |
109,249 |
|
|
Revlon, Inc. (a) |
6,537 |
197,025 |
|
|
Star Scientific, Inc. (a)(d) |
88,721 |
58,192 |
|
|
Synutra International, Inc. (a) |
10,309 |
57,524 |
|
|
The Female Health Co. |
13,680 |
103,421 |
|
|
USANA Health Sciences, Inc. (a)(d) |
3,406 |
231,131 |
|
|
|
2,040,259 |
||
|
Tobacco - 0.2% |
|||
|
Alliance One International, Inc. (a) |
50,199 |
129,011 |
|
|
Universal Corp. (d) |
13,164 |
718,359 |
|
|
Vector Group Ltd. (d) |
35,622 |
758,749 |
|
|
|
1,606,119 |
||
|
TOTAL CONSUMER STAPLES |
34,974,454 |
||
|
ENERGY - 6.0% |
|||
|
Energy Equipment & Services - 1.9% |
|||
|
Basic Energy Services, Inc. (a) |
16,694 |
441,055 |
|
|
Bolt Technology Corp. |
5,128 |
86,561 |
|
|
Bristow Group, Inc. |
20,458 |
1,571,174 |
|
|
C&J Energy Services, Inc. (a)(d) |
25,341 |
761,750 |
|
|
Cal Dive International, Inc. (a)(d) |
52,256 |
77,339 |
|
|
Carbo Ceramics, Inc. |
11,183 |
1,564,614 |
|
|
Dawson Geophysical Co. |
4,490 |
126,887 |
|
|
Era Group, Inc. (a) |
11,553 |
329,838 |
|
|
Exterran Holdings, Inc. |
32,493 |
1,397,849 |
|
|
Forum Energy Technologies, Inc. (a) |
22,131 |
660,832 |
|
|
Geospace Technologies Corp. (a)(d) |
7,240 |
420,861 |
|
|
Gulf Island Fabrication, Inc. |
8,103 |
162,546 |
|
|
Gulfmark Offshore, Inc. Class A |
15,116 |
680,371 |
|
|
Common Stocks - continued |
|||
|
Shares |
Value |
||
|
ENERGY - continued |
|||
|
Energy Equipment & Services - continued |
|||
|
Helix Energy Solutions Group, Inc. (a) |
60,015 |
$ 1,442,761 |
|
|
Hercules Offshore, Inc. (a)(d) |
89,358 |
399,430 |
|
|
Hornbeck Offshore Services, Inc. (a)(d) |
20,183 |
836,182 |
|
|
ION Geophysical Corp. (a)(d) |
80,012 |
352,053 |
|
|
Key Energy Services, Inc. (a) |
85,863 |
862,065 |
|
|
Matrix Service Co. (a) |
14,619 |
452,750 |
|
|
Mitcham Industries, Inc. (a) |
6,757 |
93,247 |
|
|
Natural Gas Services Group, Inc. (a) |
7,207 |
221,183 |
|
|
Newpark Resources, Inc. (a)(d) |
49,362 |
594,318 |
|
|
North Atlantic Drilling Ltd. |
40,000 |
343,200 |
|
|
Nuverra Environmental Solutions, Inc. (a)(d) |
7,866 |
133,801 |
|
|
Parker Drilling Co. (a) |
66,727 |
442,400 |
|
|
PHI, Inc. (non-vtg.) (a) |
6,953 |
311,494 |
|
|
Pioneer Energy Services Corp. (a) |
34,738 |
520,028 |
|
|
RigNet, Inc. (a) |
6,745 |
315,396 |
|
|
SEACOR Holdings, Inc. (a)(d) |
11,415 |
951,897 |
|
|
Tesco Corp. (a) |
17,221 |
344,420 |
|
|
TETRA Technologies, Inc. (a) |
43,783 |
547,288 |
|
|
TGC Industries, Inc. |
8,510 |
43,061 |
|
|
Vantage Drilling Co. (a)(d) |
111,135 |
185,595 |
|
|
Willbros Group, Inc. (a) |
23,053 |
256,119 |
|
|
|
17,930,365 |
||
|
Oil, Gas & Consumable Fuels - 4.1% |
|||
|
Abraxas Petroleum Corp. (a) |
46,888 |
256,008 |
|
|
Adams Resources & Energy, Inc. |
1,089 |
78,473 |
|
|
Alon U.S.A. Energy, Inc. (d) |
12,823 |
208,887 |
|
|
Alpha Natural Resources, Inc. (a)(d) |
123,602 |
531,489 |
|
|
Amyris, Inc. (a)(d) |
14,003 |
49,291 |
|
|
APCO Oil and Gas International, Inc. (a) |
4,931 |
68,935 |
|
|
Approach Resources, Inc. (a)(d) |
19,560 |
405,870 |
|
|
Arch Coal, Inc. (d) |
118,605 |
543,211 |
|
|
Athlon Energy, Inc. |
11,823 |
477,767 |
|
|
Bill Barrett Corp. (a) |
27,351 |
647,672 |
|
|
Bonanza Creek Energy, Inc. (a)(d) |
16,500 |
802,230 |
|
|
BPZ Energy, Inc. (a)(d) |
67,015 |
180,941 |
|
|
Callon Petroleum Co. (a) |
22,303 |
204,742 |
|
|
Carrizo Oil & Gas, Inc. (a) |
25,737 |
1,416,050 |
|
|
Clayton Williams Energy, Inc. (a) |
3,289 |
475,195 |
|
|
Clean Energy Fuels Corp. (a)(d) |
39,070 |
345,770 |
|
|
Cloud Peak Energy, Inc. (a) |
34,666 |
682,574 |
|
|
Common Stocks - continued |
|||
|
Shares |
Value |
||
|
ENERGY - continued |
|||
|
Oil, Gas & Consumable Fuels - continued |
|||
|
Comstock Resources, Inc. (d) |
27,390 |
$ 761,442 |
|
|
Contango Oil & Gas Co. (a) |
8,209 |
394,360 |
|
|
Delek U.S. Holdings, Inc. |
20,850 |
666,992 |
|
|
Diamondback Energy, Inc. (a)(d) |
11,986 |
862,273 |
|
|
Emerald Oil, Inc. (a)(d) |
31,206 |
220,626 |
|
|
Endeavour International Corp. (a)(d) |
26,363 |
90,689 |
|
|
Energy XXI (Bermuda) Ltd. (d) |
41,096 |
983,427 |
|
|
EPL Oil & Gas, Inc. (a)(d) |
16,717 |
654,303 |
|
|
Equal Energy Ltd. |
18,404 |
83,284 |
|
|
Evolution Petroleum Corp. |
11,107 |
131,063 |
|
|
EXCO Resources, Inc. (d) |
94,778 |
601,840 |
|
|
Forest Oil Corp. (a)(d) |
70,652 |
131,413 |
|
|
Frontline Ltd. (NY Shares) (a)(d) |
30,978 |
105,325 |
|
|
FX Energy, Inc. (a)(d) |
31,013 |
175,223 |
|
|
GasLog Ltd. (d) |
18,068 |
483,861 |
|
|
Gastar Exploration, Inc. (a) |
30,491 |
202,155 |
|
|
Goodrich Petroleum Corp. (a)(d) |
17,759 |
446,639 |
|
|
Green Plains Renewable Energy, Inc. |
14,144 |
422,906 |
|
|
Halcon Resources Corp. (a)(d) |
129,528 |
714,995 |
|
|
Hallador Energy Co. |
4,877 |
44,673 |
|
|
Isramco, Inc. (a) |
476 |
61,880 |
|
|
Jones Energy, Inc. |
6,272 |
97,028 |
|
|
KiOR, Inc. Class A (a)(d) |
23,656 |
14,433 |
|
|
Knightsbridge Tankers Ltd. |
16,828 |
201,095 |
|
|
Kodiak Oil & Gas Corp. (a) |
150,377 |
1,911,292 |
|
|
Magnum Hunter Resources Corp. (a)(d) |
96,467 |
819,970 |
|
|
Magnum Hunter Resources Corp. warrants 4/16/16 (a)(d) |
5,763 |
2,674 |
|
|
Matador Resources Co. (a)(d) |
32,909 |
945,146 |
|
|
Midstates Petroleum Co., Inc. (a)(d) |
17,622 |
103,970 |
|
|
Miller Energy Resources, Inc. (a)(d) |
17,792 |
85,757 |
|
|
Nordic American Tanker Shipping Ltd. (d) |
50,767 |
438,119 |
|
|
Northern Oil & Gas, Inc. (a)(d) |
35,672 |
550,419 |
|
|
Panhandle Royalty Co. Class A |
3,894 |
170,752 |
|
|
PDC Energy, Inc. (a)(d) |
20,166 |
1,283,969 |
|
|
Penn Virginia Corp. (a)(d) |
30,858 |
513,477 |
|
|
Petroquest Energy, Inc. (a)(d) |
31,810 |
191,496 |
|
|
Quicksilver Resources, Inc. (a)(d) |
68,769 |
224,187 |
|
|
Renewable Energy Group, Inc. (a)(d) |
11,653 |
137,156 |
|
|
Rentech, Inc. (a)(d) |
125,605 |
266,283 |
|
|
Resolute Energy Corp. (a)(d) |
37,459 |
280,943 |
|
|
Rex American Resources Corp. (a) |
3,164 |
206,799 |
|
|
Common Stocks - continued |
|||
|
Shares |
Value |
||
|
ENERGY - continued |
|||
|
Oil, Gas & Consumable Fuels - continued |
|||
|
Rex Energy Corp. (a) |
25,304 |
$ 532,902 |
|
|
Rosetta Resources, Inc. (a)(d) |
34,636 |
1,639,668 |
|
|
RSP Permian, Inc. (a) |
12,870 |
364,865 |
|
|
Sanchez Energy Corp. (a)(d) |
21,304 |
602,477 |
|
|
Scorpio Tankers, Inc. |
105,120 |
947,131 |
|
|
SemGroup Corp. Class A |
23,872 |
1,524,943 |
|
|
Ship Finance International Ltd. (NY Shares) (d) |
31,369 |
553,035 |
|
|
Solazyme, Inc. (a)(d) |
29,959 |
322,359 |
|
|
Stone Energy Corp. (a) |
28,073 |
1,376,981 |
|
|
Swift Energy Co. (a)(d) |
23,891 |
294,576 |
|
|
Synergy Resources Corp. (a)(d) |
28,029 |
326,258 |
|
|
Targa Resources Corp. |
18,555 |
2,003,754 |
|
|
Teekay Tankers Ltd. (d) |
34,491 |
120,374 |
|
|
Triangle Petroleum Corp. (a)(d) |
38,944 |
374,641 |
|
|
Ur-Energy, Inc. (a)(d) |
75,071 |
91,780 |
|
|
Uranium Energy Corp. (a)(d) |
49,082 |
52,518 |
|
|
VAALCO Energy, Inc. (a) |
32,195 |
296,838 |
|
|
W&T Offshore, Inc. |
19,838 |
380,890 |
|
|
Warren Resources, Inc. (a) |
42,069 |
213,290 |
|
|
Western Refining, Inc. |
30,650 |
1,333,275 |
|
|
Westmoreland Coal Co. (a) |
6,753 |
199,956 |
|
|
ZaZa Energy Corp. (a)(d) |
16,276 |
8,048 |
|
|
|
37,619,998 |
||
|
TOTAL ENERGY |
55,550,363 |
||
|
FINANCIALS - 23.4% |
|||
|
Banks - 7.1% |
|||
|
1st Source Corp. |
8,193 |
241,612 |
|
|
1st United Bancorp, Inc. |
18,523 |
135,588 |
|
|
Access National Corp. |
4,568 |
67,378 |
|
|
American National Bankshares, Inc. |
4,924 |
104,930 |
|
|
Ameris Bancorp (a) |
13,915 |
295,972 |
|
|
Ames National Corp. |
5,669 |
123,754 |
|
|
Arrow Financial Corp. (d) |
6,062 |
151,732 |
|
|
BancFirst Corp. |
4,111 |
239,301 |
|
|
Banco Latinoamericano de Comercio Exterior SA Series E |
16,608 |
427,158 |
|
|
Bancorp, Inc., Delaware (a) |
18,620 |
294,568 |
|
|
BancorpSouth, Inc. |
53,560 |
1,251,162 |
|
|
Bank of Kentucky Financial Corp. |
3,415 |
117,852 |
|
|
Bank of Marin Bancorp |
3,203 |
145,448 |
|
|
Common Stocks - continued |
|||
|
Shares |
Value |
||
|
FINANCIALS - continued |
|||
|
Banks - continued |
|||
|
Bank of the Ozarks, Inc. |
17,553 |
$ 1,051,425 |
|
|
Banner Bank |
11,088 |
438,420 |
|
|
Bar Harbor Bankshares |
2,054 |
77,189 |
|
|
BBCN Bancorp, Inc. |
44,746 |
689,536 |
|
|
BNC Bancorp |
10,241 |
166,928 |
|
|
Boston Private Financial Holdings, Inc. |
44,704 |
559,247 |
|
|
Bridge Bancorp, Inc. |
6,536 |
158,956 |
|
|
Bridge Capital Holdings (a) |
5,575 |
124,880 |
|
|
Bryn Mawr Bank Corp. |
7,570 |
206,510 |
|
|
C & F Financial Corp. |
1,947 |
60,844 |
|
|
Camden National Corp. |
4,508 |
172,070 |
|
|
Capital Bank Financial Corp. Series A (a) |
12,919 |
308,118 |
|
|
Capital City Bank Group, Inc. |
7,152 |
99,413 |
|
|
Cardinal Financial Corp. |
17,680 |
297,024 |
|
|
Cascade Bancorp (a) |
1,863 |
8,812 |
|
|
Cathay General Bancorp |
44,286 |
1,045,150 |
|
|
Center Bancorp, Inc. |
7,364 |
136,308 |
|
|
Centerstate Banks of Florida, Inc. |
16,895 |
185,338 |
|
|
Central Pacific Financial Corp. |
12,000 |
225,240 |
|
|
Century Bancorp, Inc. Class A (non-vtg.) |
1,896 |
63,516 |
|
|
Chemical Financial Corp. |
17,075 |
479,295 |
|
|
Chemung Financial Corp. |
2,076 |
59,353 |
|
|
Citizens & Northern Corp. |
6,464 |
121,135 |
|
|
City Holding Co. |
8,695 |
373,798 |
|
|
CNB Financial Corp., Pennsylvania |
8,347 |
137,892 |
|
|
CoBiz, Inc. |
19,921 |
200,007 |
|
|
Columbia Banking Systems, Inc. |
29,187 |
724,421 |
|
|
Community Bank System, Inc. |
22,494 |
836,552 |
|
|
Community Trust Bancorp, Inc. |
7,602 |
280,286 |
|
|
CommunityOne Bancorp (a) |
5,986 |
58,364 |
|
|
ConnectOne Bancorp, Inc. (a) |
1,131 |
54,288 |
|
|
CU Bancorp (a) |
4,920 |
89,298 |
|
|
Customers Bancorp, Inc. (a) |
11,651 |
256,672 |
|
|
CVB Financial Corp. |
51,646 |
746,801 |
|
|
Eagle Bancorp, Inc., Maryland |
12,425 |
414,871 |
|
|
Enterprise Bancorp, Inc. |
3,778 |
68,986 |
|
|
Enterprise Financial Services Corp. |
11,201 |
200,162 |
|
|
Farmers Capital Bank Corp. (a) |
4,569 |
95,446 |
|
|
Fidelity Southern Corp. |
9,404 |
124,227 |
|
|
Financial Institutions, Inc. |
7,739 |
179,158 |
|
|
First Bancorp, North Carolina |
11,001 |
189,327 |
|
|
Common Stocks - continued |
|||
|
Shares |
Value |
||
|
FINANCIALS - continued |
|||
|
Banks - continued |
|||
|
First Bancorp, Puerto Rico (a) |
41,423 |
$ 212,914 |
|
|
First Busey Corp. |
41,575 |
228,663 |
|
|
First Commonwealth Financial Corp. |
54,135 |
465,020 |
|
|
First Community Bancshares, Inc. |
8,910 |
131,957 |
|
|
First Connecticut Bancorp, Inc. |
9,085 |
143,997 |
|
|
First Financial Bancorp, Ohio |
33,805 |
547,303 |
|
|
First Financial Bankshares, Inc. (d) |
18,027 |
1,064,494 |
|
|
First Financial Corp., Indiana |
6,334 |
202,751 |
|
|
First Financial Holdings, Inc. |
13,478 |
774,581 |
|
|
First Interstate Bancsystem, Inc. |
9,750 |
242,678 |
|
|
First Merchants Corp. |
19,382 |
411,286 |
|
|
First Midwest Bancorp, Inc., Delaware |
42,140 |
689,832 |
|
|
First NBC Bank Holding Co. |
2,421 |
75,293 |
|
|
First of Long Island Corp. |
4,796 |
173,951 |
|
|
First Security Group, Inc. |
43,646 |
82,927 |
|
|
FirstMerit Corp. |
93,631 |
1,815,505 |
|
|
Flushing Financial Corp. |
17,254 |
331,622 |
|
|
FNB Corp., Pennsylvania |
87,679 |
1,090,727 |
|
|
German American Bancorp, Inc. |
7,504 |
195,404 |
|
|
Glacier Bancorp, Inc. |
40,876 |
1,048,878 |
|
|
Great Southern Bancorp, Inc. |
6,253 |
179,274 |
|
|
Guaranty Bancorp |
9,207 |
115,916 |
|
|
Hampton Roads Bankshares, Inc. (a) |
24,246 |
40,248 |
|
|
Hancock Holding Co. |
47,716 |
1,609,461 |
|
|
Hanmi Financial Corp. |
17,678 |
376,011 |
|
|
Heartland Financial U.S.A., Inc. |
8,369 |
203,367 |
|
|
Heritage Commerce Corp. |
11,429 |
92,803 |
|
|
Heritage Financial Corp., Washington |
9,751 |
157,576 |
|
|
Heritage Oaks Bancorp (a) |
11,514 |
85,319 |
|
|
Home Bancshares, Inc. |
25,650 |
813,362 |
|
|
Home Federal Bancorp, Inc. |
7,967 |
119,903 |
|
|
HomeTrust Bancshares, Inc. (a) |
11,752 |
179,453 |
|
|
Horizon Bancorp Industries |
4,435 |
88,656 |
|
|
Hudson Valley Holding Corp. |
9,516 |
174,714 |
|
|
IBERIABANK Corp. |
16,767 |
1,054,644 |
|
|
Independent Bank Corp., Massachusetts |
13,258 |
492,137 |
|
|
Independent Bank Group, Inc. |
2,070 |
101,865 |
|
|
International Bancshares Corp. |
29,879 |
686,022 |
|
|
Intervest Bancshares Corp. Class A |
10,047 |
76,056 |
|
|
Investors Bancorp, Inc. |
28,061 |
750,071 |
|
|
Lakeland Bancorp, Inc. |
20,978 |
219,010 |
|
|
Common Stocks - continued |
|||
|
Shares |
Value |
||
|
FINANCIALS - continued |
|||
|
Banks - continued |
|||
|
Lakeland Financial Corp. |
9,137 |
$ 334,414 |
|
|
LCNB Corp. (d) |
3,623 |
57,968 |
|
|
Macatawa Bank Corp. |
12,988 |
63,252 |
|
|
MainSource Financial Group, Inc. |
11,473 |
189,649 |
|
|
MB Financial, Inc. |
30,846 |
827,907 |
|
|
Mercantile Bank Corp. |
4,406 |
85,961 |
|
|
Merchants Bancshares, Inc. |
3,017 |
87,704 |
|
|
Metro Bancorp, Inc. (a) |
8,823 |
180,166 |
|
|
Middleburg Financial Corp. |
2,514 |
43,568 |
|
|
Midsouth Bancorp, Inc. |
4,086 |
68,318 |
|
|
MidWestOne Financial Group, Inc. |
3,464 |
85,318 |
|
|
National Bank Holdings Corp. |
25,926 |
496,742 |
|
|
National Bankshares, Inc. |
3,618 |
117,874 |
|
|
National Penn Bancshares, Inc. |
66,396 |
648,689 |
|
|
NBT Bancorp, Inc. |
24,409 |
552,864 |
|
|
NewBridge Bancorp (a) |
16,120 |
123,963 |
|
|
Northrim Bancorp, Inc. |
3,541 |
84,949 |
|
|
OFG Bancorp |
26,101 |
445,283 |
|
|
Old National Bancorp, Indiana |
59,576 |
841,213 |
|
|
OmniAmerican Bancorp, Inc. |
6,678 |
166,015 |
|
|
Pacific Continental Corp. |
10,538 |
138,891 |
|
|
Pacific Premier Bancorp, Inc. (a) |
9,574 |
130,685 |
|
|
PacWest Bancorp |
52,763 |
2,077,279 |
|
|
Palmetto Bancshares, Inc. (a) |
3,372 |
45,556 |
|
|
Park National Corp. (d) |
6,469 |
469,132 |
|
|
Park Sterling Corp. |
26,076 |
170,276 |
|
|
Peapack-Gladstone Financial Corp. |
6,697 |
127,310 |
|
|
Penns Woods Bancorp, Inc. |
2,699 |
118,756 |
|
|
Peoples Bancorp, Inc. |
6,015 |
156,811 |
|
|
Pinnacle Financial Partners, Inc. |
19,778 |
683,725 |
|
|
Preferred Bank, Los Angeles (a) |
7,178 |
153,968 |
|
|
PrivateBancorp, Inc. |
36,770 |
1,013,749 |
|
|
Prosperity Bancshares, Inc. |
35,713 |
2,107,067 |
|
|
Renasant Corp. |
16,918 |
460,508 |
|
|
Republic Bancorp, Inc., Kentucky Class A |
5,909 |
141,875 |
|
|
S&T Bancorp, Inc. |
16,876 |
392,536 |
|
|
Sandy Spring Bancorp, Inc. |
13,983 |
336,291 |
|
|
Seacoast Banking Corp., Florida (a) |
8,848 |
93,789 |
|
|
Sierra Bancorp |
7,619 |
118,933 |
|
|
Simmons First National Corp. Class A |
9,134 |
330,285 |
|
|
Southside Bancshares, Inc. (d) |
10,364 |
285,839 |
|
|
Common Stocks - continued |
|||
|
Shares |
Value |
||
|
FINANCIALS - continued |
|||
|
Banks - continued |
|||
|
Southwest Bancorp, Inc., Oklahoma |
10,859 |
$ 181,345 |
|
|
State Bank Financial Corp. |
17,807 |
295,240 |
|
|
Sterling Bancorp |
46,221 |
552,803 |
|
|
Stock Yards Bancorp, Inc. |
7,669 |
226,082 |
|
|
Suffolk Bancorp (a) |
6,784 |
148,773 |
|
|
Sun Bancorp, Inc., New Jersey (a) |
21,989 |
83,558 |
|
|
Susquehanna Bancshares, Inc. |
105,961 |
1,097,756 |
|
|
Talmer Bancorp, Inc. Class A |
9,956 |
133,510 |
|
|
Taylor Capital Group, Inc. (a) |
9,830 |
209,281 |
|
|
Texas Capital Bancshares, Inc. (a)(d) |
24,290 |
1,364,855 |
|
|
The First Bancorp, Inc. |
4,282 |
68,212 |
|
|
Tompkins Financial Corp. |
8,089 |
381,315 |
|
|
TowneBank (d) |
14,832 |
228,858 |
|
|
Trico Bancshares |
8,918 |
216,262 |
|
|
TriState Capital Holdings, Inc. (a) |
3,502 |
45,806 |
|
|
Trustmark Corp. |
37,924 |
867,322 |
|
|
UMB Financial Corp. |
20,178 |
1,184,650 |
|
|
Umpqua Holdings Corp. (d) |
95,431 |
1,587,018 |
|
|
Union Bankshares Corp. |
23,671 |
605,741 |
|
|
United Bankshares, Inc., West Virginia |
36,457 |
1,066,367 |
|
|
United Community Banks, Inc., Georgia (a) |
23,940 |
386,631 |
|
|
Univest Corp. of Pennsylvania |
8,621 |
169,920 |
|
|
VantageSouth Bancshares, Inc. (a) |
7,261 |
44,583 |
|
|
ViewPoint Financial Group |
22,691 |
591,554 |
|
|
Washington Banking Co., Oak Harbor |
9,233 |
158,808 |
|
|
Washington Trust Bancorp, Inc. |
8,293 |
283,621 |
|
|
Webster Financial Corp. |
50,849 |
1,532,589 |
|
|
WesBanco, Inc. |
14,394 |
435,275 |
|
|
West Bancorp., Inc. |
7,495 |
108,752 |
|
|
Westamerica Bancorp. (d) |
15,174 |
771,143 |
|
|
Western Alliance Bancorp. (a) |
41,933 |
967,394 |
|
|
Wilshire Bancorp, Inc. |
38,762 |
387,620 |
|
|
Wintrust Financial Corp. |
24,267 |
1,087,647 |
|
|
Yadkin Financial Corp. (a) |
8,043 |
154,023 |
|
|
|
65,586,761 |
||
|
Capital Markets - 2.7% |
|||
|
Apollo Investment Corp. |
126,648 |
1,011,918 |
|
|
Arlington Asset Investment Corp. |
11,034 |
291,849 |
|
|
BGC Partners, Inc. Class A |
71,261 |
510,941 |
|
|
BlackRock Kelso Capital Corp. |
41,728 |
378,890 |
|
|
Common Stocks - continued |
|||
|
Shares |
Value |
||
|
FINANCIALS - continued |
|||
|
Capital Markets - continued |
|||
|
Calamos Asset Management, Inc. Class A |
11,341 |
$ 138,133 |
|
|
Capital Southwest Corp. |
7,475 |
262,373 |
|
|
Capitala Finance Corp. |
1,956 |
35,951 |
|
|
CIFI Corp. |
3,913 |
30,169 |
|
|
Cohen & Steers, Inc. (d) |
10,705 |
433,660 |
|
|
Cowen Group, Inc. Class A (a) |
56,389 |
231,759 |
|
|
Diamond Hill Investment Group, Inc. |
1,571 |
186,509 |
|
|
Evercore Partners, Inc. Class A |
17,771 |
949,505 |
|
|
FBR & Co. (a) |
5,030 |
129,774 |
|
|
Fidus Investment Corp. (d) |
7,960 |
145,827 |
|
|
Fifth Street Finance Corp. |
75,897 |
706,601 |
|
|
Financial Engines, Inc. (d) |
27,721 |
1,226,654 |
|
|
Firsthand Technology Value Fund, Inc. (d) |
4,834 |
94,553 |
|
|
FXCM, Inc. Class A (d) |
20,773 |
321,566 |
|
|
GAMCO Investors, Inc. Class A |
3,333 |
253,075 |
|
|
Garrison Capital, Inc. (d) |
3,974 |
56,033 |
|
|
GFI Group, Inc. |
39,440 |
146,717 |
|
|
Gladstone Capital Corp. (d) |
12,032 |
116,349 |
|
|
Gladstone Investment Corp. |
15,540 |
122,144 |
|
|
Golub Capital BDC, Inc. (d) |
20,929 |
349,933 |
|
|
Greenhill & Co., Inc. |
15,800 |
792,370 |
|
|
GSV Capital Corp. (a)(d) |
10,749 |
94,376 |
|
|
Hercules Technology Growth Capital, Inc. (d) |
34,577 |
473,013 |
|
|
HFF, Inc. |
18,542 |
630,428 |
|
|
Horizon Technology Finance Corp. (d) |
5,365 |
70,282 |
|
|
ICG Group, Inc. (a) |
21,286 |
433,809 |
|
|
INTL FCStone, Inc. (a) |
8,254 |
156,166 |
|
|
Investment Technology Group, Inc. (a) |
21,122 |
435,958 |
|
|
Janus Capital Group, Inc. |
84,110 |
1,020,254 |
|
|
JMP Group, Inc. |
9,632 |
66,557 |
|
|
KCAP Financial, Inc. (d) |
16,389 |
130,620 |
|
|
KCG Holdings, Inc. Class A |
40,046 |
398,458 |
|
|
Ladenburg Thalmann Financial Services, Inc. (a) |
59,492 |
162,413 |
|
|
Main Street Capital Corp. (d) |
21,944 |
689,919 |
|
|
Manning & Napier, Inc. Class A |
8,567 |
142,384 |
|
|
Marcus & Millichap, Inc. |
4,264 |
70,484 |
|
|
MCG Capital Corp. |
39,170 |
131,611 |
|
|
Medallion Financial Corp. (d) |
11,869 |
161,418 |
|
|
Medley Capital Corp. (d) |
26,798 |
349,446 |
|
|
MVC Capital, Inc. |
12,559 |
163,769 |
|
|
New Mountain Finance Corp. (d) |
27,185 |
389,017 |
|
|
Common Stocks - continued |
|||
|
Shares |
Value |
||
|
FINANCIALS - continued |
|||
|
Capital Markets - continued |
|||
|
NGP Capital Resources Co. |
12,858 |
$ 87,563 |
|
|
Oppenheimer Holdings, Inc. Class A (non-vtg.) |
5,500 |
140,030 |
|
|
PennantPark Floating Rate Capital Ltd. (d) |
7,690 |
106,891 |
|
|
PennantPark Investment Corp. |
37,310 |
399,217 |
|
|
Piper Jaffray Companies (a)(d) |
9,333 |
409,345 |
|
|
Prospect Capital Corp. |
173,007 |
1,870,206 |
|
|
Pzena Investment Management, Inc. |
6,132 |
66,655 |
|
|
RCS Capital Corp. Class A |
1,199 |
41,246 |
|
|
Safeguard Scientifics, Inc. (a)(d) |
11,745 |
246,762 |
|
|
Silvercrest Asset Management Group Class A |
3,371 |
58,655 |
|
|
Solar Capital Ltd. |
25,162 |
551,048 |
|
|
Solar Senior Capital Ltd. |
6,316 |
104,530 |
|
|
Stellus Capital Investment Corp. (d) |
6,558 |
88,205 |
|
|
Stifel Financial Corp. (a) |
36,084 |
1,687,649 |
|
|
SWS Group, Inc. (a) |
16,160 |
119,746 |
|
|
TCP Capital Corp. (d) |
20,088 |
325,225 |
|
|
THL Credit, Inc. (d) |
18,816 |
252,699 |
|
|
TICC Capital Corp. |
29,200 |
281,196 |
|
|
Triangle Capital Corp. |
15,580 |
406,171 |
|
|
Virtus Investment Partners, Inc. (a) |
3,793 |
701,667 |
|
|
Walter Investment Management Corp. (a)(d) |
20,674 |
549,515 |
|
|
Westwood Holdings Group, Inc. |
3,995 |
232,389 |
|
|
WhiteHorse Finance, Inc. (d) |
4,535 |
61,857 |
|
|
WisdomTree Investments, Inc. (a)(d) |
56,362 |
636,327 |
|
|
|
24,518,429 |
||
|
Consumer Finance - 0.7% |
|||
|
Cash America International, Inc. |
16,055 |
699,195 |
|
|
Consumer Portfolio Services, Inc. (a) |
10,795 |
75,349 |
|
|
Credit Acceptance Corp. (a) |
3,973 |
522,529 |
|
|
DFC Global Corp. (a) |
22,238 |
207,258 |
|
|
Encore Capital Group, Inc. (a)(d) |
14,072 |
608,192 |
|
|
EZCORP, Inc. (non-vtg.) Class A (a) |
29,127 |
303,795 |
|
|
First Cash Financial Services, Inc. (a)(d) |
16,335 |
796,658 |
|
|
First Marblehead Corp. (a)(d) |
6,090 |
32,033 |
|
|
Green Dot Corp. Class A (a)(d) |
16,081 |
279,327 |
|
|
Imperial Holdings, Inc. (a)(d) |
9,628 |
64,411 |
|
|
JGWPT Holdings, Inc. |
6,365 |
90,192 |
|
|
Nelnet, Inc. Class A |
12,811 |
541,393 |
|
|
Nicholas Financial, Inc. |
5,863 |
92,166 |
|
|
Portfolio Recovery Associates, Inc. (a)(d) |
28,585 |
1,633,633 |
|
|
Common Stocks - continued |
|||
|
Shares |
Value |
||
|
FINANCIALS - continued |
|||
|
Consumer Finance - continued |
|||
|
Regional Management Corp. (a) |
2,715 |
$ 41,648 |
|
|
Springleaf Holdings, Inc. |
13,817 |
317,515 |
|
|
World Acceptance Corp. (a)(d) |
4,839 |
351,311 |
|
|
|
6,656,605 |
||
|
Diversified Financial Services - 0.3% |
|||
|
California First National Bancorp |
699 |
10,366 |
|
|
Gain Capital Holdings, Inc. (d) |
6,371 |
64,347 |
|
|
MarketAxess Holdings, Inc. |
21,180 |
1,141,178 |
|
|
Marlin Business Services Corp. |
4,511 |
77,454 |
|
|
NewStar Financial, Inc. (a) |
14,516 |
165,773 |
|
|
PHH Corp. (a)(d) |
32,126 |
763,635 |
|
|
PICO Holdings, Inc. (a) |
13,115 |
304,924 |
|
|
Resource America, Inc. Class A |
5,558 |
47,299 |
|
|
|
2,574,976 |
||
|
Insurance - 2.4% |
|||
|
AMBAC Financial Group, Inc. (a) |
25,534 |
770,616 |
|
|
American Equity Investment Life Holding Co. (d) |
38,290 |
892,923 |
|
|
Amerisafe, Inc. |
10,383 |
442,835 |
|
|
Amtrust Financial Services, Inc. (d) |
17,507 |
676,996 |
|
|
Argo Group International Holdings, Ltd. |
15,081 |
669,898 |
|
|
Baldwin & Lyons, Inc. Class B |
5,128 |
133,379 |
|
|
Blue Capital Reinsurance Holdings Ltd. |
3,712 |
68,895 |
|
|
Citizens, Inc. Class A (a)(d) |
25,249 |
165,886 |
|
|
CNO Financial Group, Inc. |
125,574 |
2,166,152 |
|
|
Crawford & Co. Class B |
14,623 |
166,995 |
|
|
Donegal Group, Inc. Class A |
3,498 |
51,630 |
|
|
eHealth, Inc. (a)(d) |
10,311 |
431,928 |
|
|
EMC Insurance Group |
2,503 |
82,574 |
|
|
Employers Holdings, Inc. |
17,546 |
357,061 |
|
|
Enstar Group Ltd. (a) |
5,308 |
685,263 |
|
|
FBL Financial Group, Inc. Class A |
5,084 |
227,306 |
|
|
Fidelity & Guaranty Life |
6,392 |
137,044 |
|
|
First American Financial Corp. |
61,120 |
1,625,792 |
|
|
Fortegra Financial Corp. (a) |
2,204 |
15,913 |
|
|
Global Indemnity PLC (a) |
4,951 |
132,687 |
|
|
Greenlight Capital Re, Ltd. (a) |
15,833 |
503,964 |
|
|
Hallmark Financial Services, Inc. (a) |
6,436 |
54,062 |
|
|
HCI Group, Inc. |
5,371 |
207,750 |
|
|
Health Insurance Innovations (a)(d) |
2,655 |
26,789 |
|
|
Hilltop Holdings, Inc. (a) |
37,674 |
841,637 |
|
|
Common Stocks - continued |
|||
|
Shares |
Value |
||
|
FINANCIALS - continued |
|||
|
Insurance - continued |
|||
|
Horace Mann Educators Corp. |
22,258 |
$ 669,298 |
|
|
Independence Holding Co. |
4,663 |
60,899 |
|
|
Infinity Property & Casualty Corp. |
6,345 |
407,159 |
|
|
Investors Title Co. |
948 |
67,080 |
|
|
Kansas City Life Insurance Co. |
2,061 |
85,696 |
|
|
Maiden Holdings Ltd. |
28,399 |
335,108 |
|
|
Meadowbrook Insurance Group, Inc. |
30,540 |
171,024 |
|
|
Montpelier Re Holdings Ltd. (d) |
24,888 |
761,075 |
|
|
National Interstate Corp. |
3,701 |
103,702 |
|
|
National Western Life Insurance Co. Class A |
1,225 |
285,731 |
|
|
Navigators Group, Inc. (a) |
5,715 |
325,584 |
|
|
OneBeacon Insurance Group Ltd. |
12,746 |
196,798 |
|
|
Phoenix Companies, Inc. (a)(d) |
3,134 |
137,959 |
|
|
Platinum Underwriters Holdings Ltd. |
16,256 |
1,019,414 |
|
|
Primerica, Inc. |
32,191 |
1,477,245 |
|
|
RLI Corp. |
23,919 |
1,029,952 |
|
|
Safety Insurance Group, Inc. |
7,115 |
382,147 |
|
|
Selective Insurance Group, Inc. |
31,536 |
723,436 |
|
|
State Auto Financial Corp. |
8,780 |
179,639 |
|
|
Stewart Information Services Corp. (d) |
11,935 |
364,018 |
|
|
Symetra Financial Corp. |
45,735 |
944,885 |
|
|
Third Point Reinsurance Ltd. |
14,093 |
220,415 |
|
|
Tower Group International Ltd. |
32,976 |
81,121 |
|
|
United Fire Group, Inc. |
11,337 |
315,395 |
|
|
Universal Insurance Holdings, Inc. |
14,220 |
208,039 |
|
|
|
22,088,794 |
||
|
Real Estate Investment Trusts - 8.3% |
|||
|
Acadia Realty Trust (SBI) |
30,939 |
839,375 |
|
|
AG Mortgage Investment Trust, Inc. |
15,510 |
274,372 |
|
|
Agree Realty Corp. |
8,386 |
250,490 |
|
|
Alexanders, Inc. |
1,196 |
413,529 |
|
|
Altisource Residential Corp. Class B |
32,043 |
901,049 |
|
|
American Assets Trust, Inc. |
18,762 |
636,970 |
|
|
American Capital Mortgage Investment Corp. |
30,088 |
595,742 |
|
|
American Realty Capital Properties, Inc. |
265,625 |
3,476,989 |
|
|
American Residential Properties, Inc. (a)(d) |
8,183 |
147,049 |
|
|
AmREIT, Inc. Class B |
10,957 |
182,544 |
|
|
Anworth Mortgage Asset Corp. |
79,161 |
427,469 |
|
|
Apollo Commercial Real Estate Finance, Inc. |
20,963 |
356,581 |
|
|
Apollo Residential Mortgage, Inc. |
18,616 |
300,648 |
|
|
Common Stocks - continued |
|||
|
Shares |
Value |
||
|
FINANCIALS - continued |
|||
|
Real Estate Investment Trusts - continued |
|||
|
Ares Commercial Real Estate Corp. |
11,943 |
$ 152,393 |
|
|
Armada Hoffler Properties, Inc. |
12,064 |
116,780 |
|
|
Armour Residential REIT, Inc. |
209,747 |
889,327 |
|
|
Ashford Hospitality Prime, Inc. |
10,200 |
156,468 |
|
|
Ashford Hospitality Trust, Inc. |
38,710 |
397,165 |
|
|
Associated Estates Realty Corp. |
32,208 |
540,450 |
|
|
Aviv REIT, Inc. |
8,214 |
216,767 |
|
|
Campus Crest Communities, Inc. |
37,114 |
319,552 |
|
|
Capstead Mortgage Corp. (d) |
53,281 |
680,931 |
|
|
CatchMark Timber Trust, Inc. |
6,861 |
92,486 |
|
|
Cedar Shopping Centers, Inc. |
40,627 |
251,481 |
|
|
Chambers Street Properties |
132,645 |
1,033,305 |
|
|
Chatham Lodging Trust |
14,474 |
294,256 |
|
|
Chesapeake Lodging Trust |
27,459 |
741,118 |
|
|
Colony Financial, Inc. |
51,903 |
1,128,890 |
|
|
Coresite Realty Corp. |
11,898 |
361,937 |
|
|
Cousins Properties, Inc. |
95,146 |
1,106,548 |
|
|
CubeSmart |
79,085 |
1,470,981 |
|
|
CyrusOne, Inc. |
10,529 |
210,580 |
|
|
CYS Investments, Inc. |
90,996 |
782,566 |
|
|
DCT Industrial Trust, Inc. |
178,199 |
1,393,516 |
|
|
DiamondRock Hospitality Co. |
111,207 |
1,364,510 |
|
|
DuPont Fabros Technology, Inc. (d) |
34,986 |
847,711 |
|
|
Dynex Capital, Inc. |
30,278 |
259,785 |
|
|
EastGroup Properties, Inc. (d) |
16,985 |
1,074,301 |
|
|
Education Realty Trust, Inc. |
64,632 |
659,246 |
|
|
Ellington Residential Mortgage REIT |
3,908 |
63,857 |
|
|
Empire State Realty Trust, Inc. (d) |
46,724 |
714,877 |
|
|
EPR Properties |
28,812 |
1,544,611 |
|
|
Equity One, Inc. |
34,148 |
769,354 |
|
|
Excel Trust, Inc. |
26,343 |
332,449 |
|
|
FelCor Lodging Trust, Inc. |
69,440 |
640,931 |
|
|
First Industrial Realty Trust, Inc. |
61,173 |
1,123,748 |
|
|
First Potomac Realty Trust |
32,537 |
423,957 |
|
|
Franklin Street Properties Corp. |
52,055 |
634,030 |
|
|
Getty Realty Corp. |
13,972 |
264,350 |
|
|
Gladstone Commercial Corp. |
8,128 |
143,378 |
|
|
Glimcher Realty Trust |
81,477 |
830,251 |
|
|
Government Properties Income Trust |
30,970 |
788,187 |
|
|
Gramercy Property Trust, Inc. (d) |
32,864 |
171,550 |
|
|
Hannon Armstrong Sustainable Infrastructure Capital, Inc. |
8,613 |
113,864 |
|
|
Common Stocks - continued |
|||
|
Shares |
Value |
||
|
FINANCIALS - continued |
|||
|
Real Estate Investment Trusts - continued |
|||
|
Healthcare Realty Trust, Inc. |
53,913 |
$ 1,355,912 |
|
|
Hersha Hospitality Trust |
113,125 |
657,256 |
|
|
Highwoods Properties, Inc. (SBI) |
50,196 |
2,025,409 |
|
|
Hudson Pacific Properties, Inc. |
28,333 |
667,242 |
|
|
Inland Real Estate Corp. |
47,693 |
498,392 |
|
|
Invesco Mortgage Capital, Inc. |
70,498 |
1,175,202 |
|
|
Investors Real Estate Trust |
59,131 |
515,622 |
|
|
iStar Financial, Inc. (a) |
47,773 |
709,907 |
|
|
JAVELIN Mortgage Investment Corp. |
6,969 |
92,060 |
|
|
Kite Realty Group Trust |
74,992 |
464,950 |
|
|
LaSalle Hotel Properties (SBI) |
58,823 |
1,945,865 |
|
|
Lexington Corporate Properties Trust |
101,979 |
1,097,294 |
|
|
LTC Properties, Inc. |
19,378 |
748,572 |
|
|
Medical Properties Trust, Inc. |
96,556 |
1,303,506 |
|
|
Monmouth Real Estate Investment Corp. Class A |
24,565 |
230,665 |
|
|
National Health Investors, Inc. |
16,385 |
1,010,791 |
|
|
New Residential Investment Corp. |
143,909 |
877,845 |
|
|
New York Mortgage Trust, Inc. |
52,341 |
385,753 |
|
|
NorthStar Realty Finance Corp. |
184,560 |
2,956,651 |
|
|
One Liberty Properties, Inc. |
6,800 |
150,484 |
|
|
Parkway Properties, Inc. |
33,018 |
622,719 |
|
|
Pebblebrook Hotel Trust |
34,919 |
1,202,610 |
|
|
Pennsylvania Real Estate Investment Trust (SBI) |
38,184 |
631,945 |
|
|
PennyMac Mortgage Investment Trust |
39,525 |
926,466 |
|
|
Physicians Realty Trust |
11,242 |
154,240 |
|
|
Potlatch Corp. |
22,754 |
869,885 |
|
|
PS Business Parks, Inc. |
10,918 |
936,437 |
|
|
QTS Realty Trust, Inc. Class A |
8,201 |
223,477 |
|
|
RAIT Financial Trust (d) |
46,898 |
383,626 |
|
|
Ramco-Gershenson Properties Trust (SBI) |
38,090 |
627,723 |
|
|
Redwood Trust, Inc. |
46,496 |
1,013,613 |
|
|
Resource Capital Corp. |
72,066 |
396,363 |
|
|
Retail Opportunity Investments Corp. |
40,116 |
627,414 |
|
|
Rexford Industrial Realty, Inc. |
9,198 |
130,796 |
|
|
RLJ Lodging Trust |
69,974 |
1,866,207 |
|
|
Rouse Properties, Inc. |
14,367 |
241,222 |
|
|
Ryman Hospitality Properties, Inc. (d) |
24,837 |
1,131,325 |
|
|
Sabra Health Care REIT, Inc. (d) |
20,791 |
623,106 |
|
|
Saul Centers, Inc. |
4,567 |
209,580 |
|
|
Select Income (REIT) |
12,205 |
375,670 |
|
|
Silver Bay Realty Trust Corp. |
8,513 |
127,525 |
|
|
Common Stocks - continued |
|||
|
Shares |
Value |
||
|
FINANCIALS - continued |
|||
|
Real Estate Investment Trusts - continued |
|||
|
Sovran Self Storage, Inc. |
17,621 |
$ 1,337,434 |
|
|
Stag Industrial, Inc. |
24,832 |
584,297 |
|
|
Strategic Hotel & Resorts, Inc. (a) |
102,656 |
1,107,658 |
|
|
Summit Hotel Properties, Inc. |
44,662 |
404,638 |
|
|
Sun Communities, Inc. |
22,853 |
1,041,411 |
|
|
Sunstone Hotel Investors, Inc. |
103,654 |
1,483,289 |
|
|
Terreno Realty Corp. |
14,088 |
257,388 |
|
|
The Geo Group, Inc. |
40,515 |
1,358,468 |
|
|
UMH Properties, Inc. |
10,828 |
106,656 |
|
|
Universal Health Realty Income Trust (SBI) |
6,830 |
289,797 |
|
|
Urstadt Biddle Properties, Inc. Class A |
14,094 |
287,659 |
|
|
Washington REIT (SBI) |
37,467 |
916,443 |
|
|
Western Asset Mortgage Capital Corp. |
23,074 |
340,803 |
|
|
Whitestone REIT Class B |
12,367 |
173,509 |
|
|
Winthrop Realty Trust |
18,162 |
252,452 |
|
|
ZAIS Financial Corp. |
3,054 |
50,360 |
|
|
|
76,088,840 |
||
|
Real Estate Management & Development - 0.3% |
|||
|
Alexander & Baldwin, Inc. |
24,471 |
913,013 |
|
|
AV Homes, Inc. (a) |
5,335 |
91,389 |
|
|
Consolidated-Tomoka Land Co. |
3,517 |
139,027 |
|
|
Forestar Group, Inc. (a)(d) |
19,080 |
325,314 |
|
|
Kennedy-Wilson Holdings, Inc. |
36,865 |
805,132 |
|
|
RE/MAX Holdings, Inc. |
6,764 |
190,880 |
|
|
Tejon Ranch Co. (a) |
7,772 |
241,010 |
|
|
|
2,705,765 |
||
|
Thrifts & Mortgage Finance - 1.6% |
|||
|
Astoria Financial Corp. |
49,572 |
657,325 |
|
|
Banc of California, Inc. |
10,380 |
130,477 |
|
|
Bank Mutual Corp. |
26,289 |
158,260 |
|
|
BankFinancial Corp. |
12,766 |
125,617 |
|
|
BBX Capital Corp. (a) |
3,728 |
69,825 |
|
|
Beneficial Mutual Bancorp, Inc. (a) |
17,516 |
228,409 |
|
|
Berkshire Hills Bancorp, Inc. |
13,855 |
324,623 |
|
|
BofI Holding, Inc. (a)(d) |
6,859 |
552,904 |
|
|
Brookline Bancorp, Inc., Delaware |
40,971 |
372,017 |
|
|
Capitol Federal Financial, Inc. |
82,801 |
996,924 |
|
|
Charter Financial Corp. |
12,027 |
132,297 |
|
|
Clifton Bancorp, Inc. |
4,484 |
51,970 |
|
|
Dime Community Bancshares, Inc. |
17,454 |
284,500 |
|
|
Common Stocks - continued |
|||
|
Shares |
Value |
||
|
FINANCIALS - continued |
|||
|
Thrifts & Mortgage Finance - continued |
|||
|
Doral Financial Corp. (a) |
3,119 |
$ 29,818 |
|
|
ESB Financial Corp. |
7,090 |
89,476 |
|
|
ESSA Bancorp, Inc. |
4,382 |
45,529 |
|
|
Essent Group Ltd. |
13,023 |
245,484 |
|
|
EverBank Financial Corp. |
45,568 |
853,033 |
|
|
Farmer Mac Class C (non-vtg.) |
6,105 |
217,216 |
|
|
First Defiance Financial Corp. |
5,526 |
149,313 |
|
|
First Federal Bancshares of Arkansas, Inc. (a) |
780 |
6,919 |
|
|
First Financial Northwest, Inc. |
8,299 |
84,650 |
|
|
Flagstar Bancorp, Inc. (a) |
11,435 |
201,256 |
|
|
Fox Chase Bancorp, Inc. |
6,459 |
107,736 |
|
|
Franklin Financial Corp./VA (a) |
6,409 |
127,924 |
|
|
Hingham Institution for Savings |
624 |
43,374 |
|
|
Home Bancorp, Inc. (a) |
4,891 |
99,043 |
|
|
Home Loan Servicing Solutions Ltd. (d) |
40,226 |
891,006 |
|
|
HomeStreet, Inc. |
7,559 |
137,271 |
|
|
Kearny Financial Corp. (a) |
8,202 |
119,585 |
|
|
Ladder Capital Corp. Class A |
8,535 |
152,691 |
|
|
Meridian Interstate Bancorp, Inc. (a) |
5,096 |
128,776 |
|
|
Meta Financial Group, Inc. |
3,367 |
141,111 |
|
|
MGIC Investment Corp. (a)(d) |
183,750 |
1,580,250 |
|
|
NASB Financial, Inc. |
1,946 |
46,432 |
|
|
Northfield Bancorp, Inc. |
32,634 |
423,263 |
|
|
Northwest Bancshares, Inc. |
52,717 |
700,609 |
|
|
OceanFirst Financial Corp. |
7,879 |
127,797 |
|
|
Oritani Financial Corp. |
25,269 |
374,739 |
|
|
PennyMac Financial Services, Inc. |
7,170 |
113,788 |
|
|
Provident Financial Holdings, Inc. |
4,390 |
61,767 |
|
|
Provident Financial Services, Inc. |
33,404 |
580,562 |
|
|
Radian Group, Inc. (d) |
97,949 |
1,369,327 |
|
|
Rockville Financial, Inc. |
15,085 |
198,519 |
|
|
Stonegate Mortgage Corp. (a)(d) |
5,171 |
65,413 |
|
|
Territorial Bancorp, Inc. |
5,715 |
116,929 |
|
|
Tree.com, Inc. (a) |
3,603 |
104,775 |
|
|
Trustco Bank Corp., New York |
51,772 |
342,213 |
|
|
United Community Financial Corp. (a) |
28,315 |
94,289 |
|
|
United Financial Bancorp, Inc. |
10,717 |
189,048 |
|
|
Walker & Dunlop, Inc. (a) |
9,575 |
150,136 |
|
|
Waterstone Financial, Inc. Maryland |
3,923 |
40,838 |
|
|
Common Stocks - continued |
|||
|
Shares |
Value |
||
|
FINANCIALS - continued |
|||
|
Thrifts & Mortgage Finance - continued |
|||
|
Westfield Financial, Inc. |
11,150 |
$ 76,378 |
|
|
WSFS Financial Corp. |
4,315 |
291,780 |
|
|
|
15,005,211 |
||
|
TOTAL FINANCIALS |
215,225,381 |
||
|
HEALTH CARE - 12.8% |
|||
|
Biotechnology - 4.1% |
|||
|
ACADIA Pharmaceuticals, Inc. (a)(d) |
43,487 |
875,393 |
|
|
Acceleron Pharma, Inc. (d) |
3,913 |
134,412 |
|
|
Achillion Pharmaceuticals, Inc. (a)(d) |
53,646 |
152,891 |
|
|
Acorda Therapeutics, Inc. (a) |
22,966 |
814,145 |
|
|
Aegerion Pharmaceuticals, Inc. (a)(d) |
16,186 |
716,392 |
|
|
Agios Pharmaceuticals, Inc. |
3,757 |
158,019 |
|
|
Alnylam Pharmaceuticals, Inc. (a)(d) |
33,132 |
1,641,028 |
|
|
AMAG Pharmaceuticals, Inc. (a)(d) |
11,893 |
217,166 |
|
|
Amicus Therapeutics, Inc. (a)(d) |
15,682 |
34,814 |
|
|
Anacor Pharmaceuticals, Inc. (a)(d) |
13,936 |
229,526 |
|
|
Arena Pharmaceuticals, Inc. (a)(d) |
122,402 |
783,373 |
|
|
Argos Therapeutics, Inc. (a) |
2,141 |
19,012 |
|
|
ArQule, Inc. (a) |
27,969 |
45,310 |
|
|
Array BioPharma, Inc. (a) |
68,181 |
271,360 |
|
|
Auspex Pharmaceuticals, Inc. |
4,662 |
99,953 |
|
|
AVEO Pharmaceuticals, Inc. (a)(d) |
26,099 |
32,102 |
|
|
BIND Therapeutics, Inc. (d) |
3,389 |
31,958 |
|
|
BioTime, Inc. (a)(d) |
22,836 |
59,145 |
|
|
Bluebird Bio, Inc. |
4,103 |
81,239 |
|
|
Cara Therapeutics, Inc. (d) |
2,953 |
42,494 |
|
|
Cell Therapeutics, Inc. (a)(d) |
71,138 |
209,857 |
|
|
Celladon Corp. (a) |
3,422 |
40,209 |
|
|
Celldex Therapeutics, Inc. (a)(d) |
49,883 |
748,245 |
|
|
Cellular Dynamics International, Inc. (d) |
2,038 |
24,354 |
|
|
Cepheid, Inc. (a) |
37,716 |
1,639,892 |
|
|
Chelsea Therapeutics International Ltd. (a)(d) |
43,113 |
210,391 |
|
|
ChemoCentryx, Inc. (a)(d) |
12,853 |
70,434 |
|
|
Chimerix, Inc. |
4,539 |
87,693 |
|
|
Clovis Oncology, Inc. (a) |
10,069 |
544,431 |
|
|
Conatus Pharmaceuticals, Inc. (d) |
3,132 |
19,262 |
|
|
Concert Pharmaceuticals, Inc. |
3,219 |
28,778 |
|
|
Coronado Biosciences, Inc. (a)(d) |
18,649 |
32,449 |
|
|
Curis, Inc. (a)(d) |
46,833 |
105,843 |
|
|
Common Stocks - continued |
|||
|
Shares |
Value |
||
|
HEALTH CARE - continued |
|||
|
Biotechnology - continued |
|||
|
Cytokinetics, Inc. (a)(d) |
17,796 |
$ 80,972 |
|
|
Cytori Therapeutics, Inc. (a)(d) |
34,377 |
77,692 |
|
|
Dendreon Corp. (a)(d) |
87,107 |
224,736 |
|
|
Dicerna Pharmaceuticals, Inc. |
1,909 |
35,832 |
|
|
Durata Therapeutics, Inc. (a)(d) |
7,826 |
105,964 |
|
|
Dyax Corp. (a) |
75,705 |
500,410 |
|
|
Dynavax Technologies Corp. (a)(d) |
145,144 |
236,585 |
|
|
Eagle Pharmaceuticals, Inc. |
1,617 |
15,944 |
|
|
Eleven Biotherapeutics, Inc. |
2,422 |
32,673 |
|
|
Emergent BioSolutions, Inc. (a) |
15,197 |
400,593 |
|
|
Enanta Pharmaceuticals, Inc. (a)(d) |
2,107 |
78,401 |
|
|
Enzon Pharmaceuticals, Inc. |
19,100 |
17,001 |
|
|
Epizyme, Inc. (d) |
3,614 |
78,857 |
|
|
Esperion Therapeutics, Inc. (d) |
2,518 |
34,723 |
|
|
Exact Sciences Corp. (a)(d) |
48,063 |
576,756 |
|
|
Exelixis, Inc. (a)(d) |
109,532 |
387,743 |
|
|
Fibrocell Science, Inc. (a)(d) |
13,879 |
52,740 |
|
|
Five Prime Therapeutics, Inc. |
3,730 |
52,108 |
|
|
Flexion Therapeutics, Inc. |
2,394 |
28,369 |
|
|
Foundation Medicine, Inc. (d) |
3,792 |
110,575 |
|
|
Galena Biopharma, Inc. (a)(d) |
65,322 |
160,039 |
|
|
Genocea Biosciences, Inc. |
2,070 |
40,158 |
|
|
Genomic Health, Inc. (a)(d) |
9,366 |
245,764 |
|
|
Geron Corp. (a)(d) |
84,599 |
167,506 |
|
|
GlycoMimetics, Inc. |
4,322 |
57,353 |
|
|
GTx, Inc. (a)(d) |
13,506 |
20,799 |
|
|
Halozyme Therapeutics, Inc. (a)(d) |
54,288 |
404,446 |
|
|
Harvard Apparatus (a) |
3,500 |
30,275 |
|
|
Hyperion Therapeutics, Inc. (a)(d) |
4,515 |
111,250 |
|
|
Idenix Pharmaceuticals, Inc. (a)(d) |
62,043 |
341,857 |
|
|
ImmunoGen, Inc. (a)(d) |
47,935 |
620,279 |
|
|
Immunomedics, Inc. (a)(d) |
40,647 |
171,124 |
|
|
Infinity Pharmaceuticals, Inc. (a) |
26,312 |
257,068 |
|
|
Insmed, Inc. (a) |
20,146 |
280,835 |
|
|
Insys Therapeutics, Inc. (a) |
4,749 |
194,994 |
|
|
Intercept Pharmaceuticals, Inc. (a) |
4,063 |
1,073,120 |
|
|
InterMune, Inc. (a)(d) |
55,658 |
1,785,509 |
|
|
Intrexon Corp. (d) |
6,379 |
120,436 |
|
|
Ironwood Pharmaceuticals, Inc. Class A (a) |
60,087 |
662,159 |
|
|
Isis Pharmaceuticals, Inc. (a)(d) |
63,817 |
1,698,170 |
|
|
KaloBios Pharmaceuticals, Inc. (a) |
6,513 |
14,785 |
|
|
Common Stocks - continued |
|||
|
Shares |
Value |
||
|
HEALTH CARE - continued |
|||
|
Biotechnology - continued |
|||
|
Karyopharm Therapeutics, Inc. |
4,318 |
$ 115,852 |
|
|
Keryx Biopharmaceuticals, Inc. (a)(d) |
50,031 |
738,958 |
|
|
Kindred Biosciences, Inc. |
6,306 |
100,202 |
|
|
KYTHERA Biopharmaceuticals, Inc. (a)(d) |
6,520 |
212,617 |
|
|
Lexicon Pharmaceuticals, Inc. (a)(d) |
134,583 |
207,258 |
|
|
Ligand Pharmaceuticals, Inc. Class B (a)(d) |
10,019 |
632,900 |
|
|
Macrogenics, Inc. |
3,685 |
73,479 |
|
|
MannKind Corp. (a)(d) |
83,487 |
546,840 |
|
|
MEI Pharma, Inc. (a) |
7,273 |
56,875 |
|
|
Merrimack Pharmaceuticals, Inc. (a)(d) |
53,087 |
233,052 |
|
|
MiMedx Group, Inc. (a) |
53,769 |
310,785 |
|
|
Momenta Pharmaceuticals, Inc. (a) |
26,076 |
297,788 |
|
|
Nanosphere, Inc. (a) |
29,094 |
49,751 |
|
|
Navidea Biopharmaceuticals, Inc. (a)(d) |
68,459 |
114,327 |
|
|
Neurocrine Biosciences, Inc. (a) |
42,940 |
602,019 |
|
|
NewLink Genetics Corp. (a)(d) |
10,148 |
223,256 |
|
|
Novavax, Inc. (a)(d) |
106,823 |
467,885 |
|
|
NPS Pharmaceuticals, Inc. (a)(d) |
57,128 |
1,520,747 |
|
|
OncoGenex Pharmaceuticals, Inc. (a)(d) |
8,519 |
33,054 |
|
|
OncoMed Pharmaceuticals, Inc. (d) |
2,542 |
66,956 |
|
|
Onconova Therapeutics, Inc. |
2,824 |
15,758 |
|
|
Ophthotech Corp. |
5,374 |
182,662 |
|
|
Opko Health, Inc. (a)(d) |
108,138 |
894,301 |
|
|
Orexigen Therapeutics, Inc. (a)(d) |
63,518 |
356,971 |
|
|
Osiris Therapeutics, Inc. (a)(d) |
9,321 |
132,638 |
|
|
OvaScience, Inc. (a)(d) |
6,138 |
49,841 |
|
|
PDL BioPharma, Inc. (d) |
90,654 |
769,652 |
|
|
Peregrine Pharmaceuticals, Inc. (a)(d) |
96,660 |
168,188 |
|
|
Portola Pharmaceuticals, Inc. (d) |
6,084 |
142,731 |
|
|
Progenics Pharmaceuticals, Inc. (a)(d) |
39,891 |
140,815 |
|
|
Prothena Corp. PLC (a) |
7,821 |
172,062 |
|
|
PTC Therapeutics, Inc. (a)(d) |
6,237 |
121,871 |
|
|
Puma Biotechnology, Inc. (a) |
13,207 |
997,657 |
|
|
Raptor Pharmaceutical Corp. (a)(d) |
32,815 |
271,380 |
|
|
Receptos, Inc. |
4,005 |
135,329 |
|
|
Regulus Therapeutics, Inc. (a)(d) |
5,746 |
40,969 |
|
|
Repligen Corp. (a)(d) |
17,509 |
277,518 |
|
|
Retrophin, Inc. (a) |
10,364 |
148,102 |
|
|
Rigel Pharmaceuticals, Inc. (a) |
48,278 |
154,490 |
|
|
Sangamo Biosciences, Inc. (a) |
37,611 |
520,536 |
|
|
Sarepta Therapeutics, Inc. (a)(d) |
21,171 |
786,079 |
|
|
Common Stocks - continued |
|||
|
Shares |
Value |
||
|
HEALTH CARE - continued |
|||
|
Biotechnology - continued |
|||
|
SIGA Technologies, Inc. (a)(d) |
31,627 |
$ 90,769 |
|
|
Spectrum Pharmaceuticals, Inc. (a) |
35,441 |
243,480 |
|
|
Stemline Therapeutics, Inc. (a)(d) |
5,475 |
83,822 |
|
|
Sunesis Pharmaceuticals, Inc. (a)(d) |
20,004 |
102,621 |
|
|
Synageva BioPharma Corp. (a)(d) |
11,594 |
1,001,374 |
|
|
Synergy Pharmaceuticals, Inc. (a)(d) |
45,023 |
202,153 |
|
|
Synta Pharmaceuticals Corp. (a)(d) |
27,682 |
116,541 |
|
|
Targacept, Inc. (a) |
15,030 |
66,733 |
|
|
TESARO, Inc. (a)(d) |
8,161 |
203,699 |
|
|
TetraLogic Pharmaceuticals Corp. |
1,975 |
11,258 |
|
|
Tetraphase Pharmaceuticals, Inc. (a) |
8,555 |
91,881 |
|
|
TG Therapeutics, Inc. (a)(d) |
9,767 |
52,058 |
|
|
Threshold Pharmaceuticals, Inc. (a) |
28,110 |
115,251 |
|
|
Trevena, Inc. |
3,901 |
19,544 |
|
|
Ultragenyx Pharmaceutical, Inc. (d) |
3,616 |
140,228 |
|
|
Vanda Pharmaceuticals, Inc. (a)(d) |
19,240 |
268,013 |
|
|
Verastem, Inc. (a)(d) |
9,467 |
79,049 |
|
|
Vical, Inc. (a)(d) |
40,381 |
45,631 |
|
|
Xencor, Inc. |
7,906 |
78,269 |
|
|
XOMA Corp. (a)(d) |
42,338 |
187,981 |
|
|
ZIOPHARM Oncology, Inc. (a)(d) |
44,576 |
160,474 |
|
|
|
38,233,150 |
||
|
Health Care Equipment & Supplies - 3.3% |
|||
|
Abaxis, Inc. (d) |
12,357 |
501,818 |
|
|
Abiomed, Inc. (a)(d) |
21,635 |
512,533 |
|
|
Accuray, Inc. (a)(d) |
41,570 |
349,188 |
|
|
Align Technology, Inc. (a) |
41,325 |
2,082,367 |
|
|
Alphatec Holdings, Inc. (a) |
36,216 |
48,892 |
|
|
Analogic Corp. |
6,842 |
513,697 |
|
|
Angiodynamics, Inc. (a) |
14,169 |
190,431 |
|
|
Anika Therapeutics, Inc. (a) |
6,840 |
292,342 |
|
|
Antares Pharma, Inc. (a)(d) |
62,164 |
172,816 |
|
|
ArthroCare Corp. (a) |
15,789 |
766,240 |
|
|
Atricure, Inc. (a) |
13,264 |
204,266 |
|
|
Atrion Corp. |
875 |
252,289 |
|
|
BioLase Technology, Inc. (d) |
17,685 |
34,132 |
|
|
Cantel Medical Corp. |
18,311 |
607,193 |
|
|
Cardiovascular Systems, Inc. (a) |
14,633 |
420,699 |
|
|
Cerus Corp. (a)(d) |
38,350 |
166,056 |
|
|
CONMED Corp. |
15,594 |
722,470 |
|
|
Common Stocks - continued |
|||
|
Shares |
Value |
||
|
HEALTH CARE - continued |
|||
|
Health Care Equipment & Supplies - continued |
|||
|
Cryolife, Inc. |
15,929 |
$ 144,635 |
|
|
Cutera, Inc. (a) |
8,934 |
92,110 |
|
|
Cyberonics, Inc. (a)(d) |
15,474 |
915,442 |
|
|
Cynosure, Inc. Class A (a) |
11,126 |
273,032 |
|
|
Derma Sciences, Inc. (a) |
10,892 |
112,623 |
|
|
DexCom, Inc. (a) |
40,057 |
1,299,449 |
|
|
Endologix, Inc. (a)(d) |
35,195 |
446,273 |
|
|
Exactech, Inc. (a) |
4,853 |
107,834 |
|
|
Genmark Diagnostics, Inc. (a)(d) |
20,108 |
179,967 |
|
|
Globus Medical, Inc. (a) |
30,918 |
755,018 |
|
|
Greatbatch, Inc. (a) |
13,317 |
612,982 |
|
|
Haemonetics Corp. (a)(d) |
28,924 |
878,133 |
|
|
HeartWare International, Inc. (a)(d) |
9,137 |
776,280 |
|
|
ICU Medical, Inc. (a)(d) |
7,237 |
403,680 |
|
|
Inogen, Inc. |
2,960 |
41,766 |
|
|
Insulet Corp. (a)(d) |
30,249 |
1,138,270 |
|
|
Integra LifeSciences Holdings Corp. (a)(d) |
12,855 |
585,931 |
|
|
Invacare Corp. |
17,670 |
279,186 |
|
|
Ldr Holding Corp. |
3,115 |
77,626 |
|
|
Masimo Corp. (a)(d) |
27,344 |
731,725 |
|
|
Medical Action Industries, Inc. (a) |
8,309 |
53,261 |
|
|
Meridian Bioscience, Inc. |
23,725 |
473,788 |
|
|
Merit Medical Systems, Inc. (a) |
23,378 |
300,875 |
|
|
Natus Medical, Inc. (a) |
18,327 |
455,059 |
|
|
Neogen Corp. (a)(d) |
20,381 |
851,416 |
|
|
NuVasive, Inc. (a) |
26,336 |
887,787 |
|
|
NxStage Medical, Inc. (a) |
33,480 |
383,011 |
|
|
OraSure Technologies, Inc. (a) |
31,361 |
205,415 |
|
|
Orthofix International NV (a) |
10,934 |
330,207 |
|
|
Oxford Immunotec Global PLC (a) |
3,769 |
67,465 |
|
|
PhotoMedex, Inc. (a)(d) |
7,142 |
107,916 |
|
|
Quidel Corp. (a)(d) |
16,064 |
344,573 |
|
|
Rockwell Medical Technologies, Inc. (a)(d) |
22,474 |
228,336 |
|
|
RTI Biologics, Inc. (a) |
33,063 |
142,171 |
|
|
Staar Surgical Co. (a) |
20,863 |
354,880 |
|
|
Steris Corp. |
33,171 |
1,593,867 |
|
|
SurModics, Inc. (a) |
8,192 |
178,258 |
|
|
Symmetry Medical, Inc. (a) |
20,901 |
172,642 |
|
|
Tandem Diabetes Care, Inc. (d) |
5,291 |
92,963 |
|
|
TearLab Corp. (a)(d) |
16,041 |
69,297 |
|
|
The Spectranetics Corp. (a) |
22,513 |
478,626 |
|
|
Common Stocks - continued |
|||
|
Shares |
Value |
||
|
HEALTH CARE - continued |
|||
|
Health Care Equipment & Supplies - continued |
|||
|
Thoratec Corp. (a) |
32,510 |
$ 1,065,678 |
|
|
Tornier NV (a) |
14,954 |
253,769 |
|
|
Unilife Corp. (a)(d) |
56,423 |
183,375 |
|
|
Utah Medical Products, Inc. |
2,059 |
104,577 |
|
|
Vascular Solutions, Inc. (a) |
9,619 |
210,752 |
|
|
Veracyte, Inc. |
2,913 |
37,316 |
|
|
Volcano Corp. (a)(d) |
30,491 |
535,422 |
|
|
West Pharmaceutical Services, Inc. |
39,137 |
1,697,763 |
|
|
Wright Medical Group, Inc. (a) |
22,574 |
617,399 |
|
|
Zeltiq Aesthetics, Inc. (a) |
9,981 |
182,552 |
|
|
|
30,349,807 |
||
|
Health Care Providers & Services - 2.6% |
|||
|
Acadia Healthcare Co., Inc. (a)(d) |
20,056 |
842,753 |
|
|
Addus HomeCare Corp. (a) |
2,800 |
60,536 |
|
|
Air Methods Corp. (a)(d) |
21,953 |
1,222,124 |
|
|
Alliance Healthcare Services, Inc. (a) |
2,887 |
82,164 |
|
|
Almost Family, Inc. (a) |
4,916 |
105,547 |
|
|
Amedisys, Inc. (a)(d) |
17,256 |
235,199 |
|
|
AMN Healthcare Services, Inc. (a) |
26,420 |
329,722 |
|
|
AmSurg Corp. (a) |
18,159 |
786,466 |
|
|
Bio-Reference Laboratories, Inc. (a)(d) |
13,897 |
352,984 |
|
|
BioScrip, Inc. (a)(d) |
31,952 |
221,108 |
|
|
Capital Senior Living Corp. (a) |
16,375 |
404,954 |
|
|
Centene Corp. (a) |
30,717 |
2,039,609 |
|
|
Chemed Corp. (d) |
9,961 |
829,452 |
|
|
Chindex International, Inc. (a) |
7,272 |
173,292 |
|
|
Corvel Corp. (a) |
6,277 |
285,855 |
|
|
Cross Country Healthcare, Inc. (a) |
15,086 |
106,960 |
|
|
Emeritus Corp. (a) |
22,495 |
671,026 |
|
|
ExamWorks Group, Inc. (a) |
17,998 |
662,326 |
|
|
Five Star Quality Care, Inc. (a) |
24,289 |
117,316 |
|
|
Gentiva Health Services, Inc. (a) |
18,144 |
136,624 |
|
|
Hanger, Inc. (a) |
19,487 |
675,614 |
|
|
HealthSouth Corp. |
49,215 |
1,704,808 |
|
|
Healthways, Inc. (a)(d) |
19,387 |
348,966 |
|
|
IPC The Hospitalist Co., Inc. (a)(d) |
9,393 |
380,417 |
|
|
Kindred Healthcare, Inc. |
30,496 |
765,450 |
|
|
Landauer, Inc. |
5,350 |
231,334 |
|
|
LHC Group, Inc. (a) |
6,782 |
140,930 |
|
|
Magellan Health Services, Inc. (a) |
15,210 |
877,921 |
|
|
Common Stocks - continued |
|||
|
Shares |
Value |
||
|
HEALTH CARE - continued |
|||
|
Health Care Providers & Services - continued |
|||
|
Molina Healthcare, Inc. (a)(d) |
15,903 |
$ 594,772 |
|
|
MWI Veterinary Supply, Inc. (a)(d) |
7,240 |
1,134,074 |
|
|
National Healthcare Corp. |
6,017 |
329,310 |
|
|
National Research Corp. Class A (a) |
5,251 |
82,756 |
|
|
Owens & Minor, Inc. (d) |
35,692 |
1,197,110 |
|
|
PharMerica Corp. (a) |
16,639 |
452,414 |
|
|
Providence Service Corp. (a) |
5,964 |
242,198 |
|
|
Select Medical Holdings Corp. |
27,174 |
379,349 |
|
|
Skilled Healthcare Group, Inc. (a) |
12,905 |
66,590 |
|
|
Surgical Care Affiliates, Inc. |
6,206 |
182,332 |
|
|
Team Health Holdings, Inc. (a)(d) |
38,720 |
1,877,146 |
|
|
The Ensign Group, Inc. |
11,057 |
469,923 |
|
|
Triple-S Management Corp. (a) |
13,272 |
198,815 |
|
|
U.S. Physical Therapy, Inc. |
6,790 |
209,472 |
|
|
Universal American Spin Corp. |
22,214 |
159,274 |
|
|
USMD Holdings, Inc. (a) |
367 |
4,624 |
|
|
Wellcare Health Plans, Inc. (a) |
24,561 |
1,657,131 |
|
|
|
24,028,747 |
||
|
Health Care Technology - 0.8% |
|||
|
athenahealth, Inc. (a)(d) |
20,764 |
2,567,261 |
|
|
Computer Programs & Systems, Inc. |
6,235 |
393,616 |
|
|
HealthStream, Inc. (a) |
11,111 |
251,664 |
|
|
HMS Holdings Corp. (a)(d) |
49,733 |
804,183 |
|
|
MedAssets, Inc. (a) |
34,476 |
787,087 |
|
|
Medidata Solutions, Inc. (a)(d) |
30,136 |
1,094,238 |
|
|
Merge Healthcare, Inc. (a) |
34,849 |
79,456 |
|
|
Omnicell, Inc. (a) |
20,369 |
539,371 |
|
|
Quality Systems, Inc. |
22,810 |
336,904 |
|
|
Vocera Communications, Inc. (a)(d) |
12,346 |
188,277 |
|
|
|
7,042,057 |
||
|
Life Sciences Tools & Services - 0.5% |
|||
|
Accelerate Diagnostics, Inc. (a)(d) |
6,691 |
123,315 |
|
|
Affymetrix, Inc. (a)(d) |
40,480 |
300,766 |
|
|
Albany Molecular Research, Inc. (a)(d) |
13,343 |
214,289 |
|
|
Cambrex Corp. (a) |
16,819 |
344,621 |
|
|
Fluidigm Corp. (a)(d) |
14,197 |
533,239 |
|
|
Furiex Pharmaceuticals, Inc. (a) |
4,026 |
416,168 |
|
|
Harvard Bioscience, Inc. (a) |
15,254 |
64,372 |
|
|
Luminex Corp. (a)(d) |
21,036 |
404,102 |
|
|
NeoGenomics, Inc. (a) |
18,707 |
61,920 |
|
|
Common Stocks - continued |
|||
|
Shares |
Value |
||
|
HEALTH CARE - continued |
|||
|
Life Sciences Tools & Services - continued |
|||
|
Pacific Biosciences of California, Inc. (a) |
29,145 |
$ 128,821 |
|
|
PAREXEL International Corp. (a) |
32,155 |
1,458,229 |
|
|
Sequenom, Inc. (a)(d) |
63,571 |
173,549 |
|
|
|
4,223,391 |
||
|
Pharmaceuticals - 1.5% |
|||
|
AcelRx Pharmaceuticals, Inc. (a)(d) |
12,868 |
139,232 |
|
|
Aerie Pharmaceuticals, Inc. |
4,496 |
70,407 |
|
|
Akorn, Inc. (a)(d) |
32,705 |
824,820 |
|
|
Alimera Sciences, Inc. (a)(d) |
12,750 |
77,520 |
|
|
Ampio Pharmaceuticals, Inc. (a)(d) |
21,996 |
133,956 |
|
|
Aratana Therapeutics, Inc. |
4,508 |
62,120 |
|
|
AstraZeneca PLC rights (a) |
1,000 |
0 |
|
|
Auxilium Pharmaceuticals, Inc. (a)(d) |
27,583 |
620,893 |
|
|
AVANIR Pharmaceuticals Class A (a)(d) |
83,078 |
413,728 |
|
|
Biodelivery Sciences International, Inc. (a)(d) |
21,351 |
190,237 |
|
|
Cempra, Inc. (a)(d) |
11,086 |
101,104 |
|
|
Corcept Therapeutics, Inc. (a) |
30,681 |
135,610 |
|
|
DepoMed, Inc. (a) |
31,680 |
443,837 |
|
|
Egalet Corp. |
1,375 |
15,895 |
|
|
Endocyte, Inc. (a)(d) |
19,978 |
361,802 |
|
|
Horizon Pharma, Inc. (a) |
31,131 |
441,438 |
|
|
Impax Laboratories, Inc. (a) |
38,490 |
1,006,514 |
|
|
Lannett Co., Inc. (a) |
10,505 |
362,738 |
|
|
Nektar Therapeutics (a)(d) |
70,037 |
824,335 |
|
|
Omeros Corp. (a)(d) |
19,060 |
235,963 |
|
|
Pacira Pharmaceuticals, Inc. (a) |
16,870 |
1,155,426 |
|
|
Pernix Therapeutics Holdings, Inc. (a)(d) |
9,246 |
44,473 |
|
|
Pozen, Inc. |
15,266 |
127,624 |
|
|
Prestige Brands Holdings, Inc. (a) |
28,743 |
963,465 |
|
|
Questcor Pharmaceuticals, Inc. (d) |
29,309 |
2,408,614 |
|
|
Relypsa, Inc. (d) |
4,009 |
89,521 |
|
|
Repros Therapeutics, Inc. (a)(d) |
12,604 |
212,629 |
|
|
Revance Therapeutics, Inc. |
3,949 |
135,372 |
|
|
Sagent Pharmaceuticals, Inc. (a) |
10,833 |
224,135 |
|
|
SciClone Pharmaceuticals, Inc. (a) |
31,052 |
148,429 |
|
|
Sucampo Pharmaceuticals, Inc. Class A (a)(d) |
7,294 |
50,402 |
|
|
Supernus Pharmaceuticals, Inc. (a)(d) |
11,477 |
94,226 |
|
|
The Medicines Company (a)(d) |
35,429 |
942,411 |
|
|
TherapeuticsMD, Inc. (a)(d) |
47,125 |
197,925 |
|
|
VIVUS, Inc. (a)(d) |
58,217 |
302,728 |
|
|
Common Stocks - continued |
|||
|
Shares |
Value |
||
|
HEALTH CARE - continued |
|||
|
Pharmaceuticals - continued |
|||
|
XenoPort, Inc. (a) |
30,689 |
$ 124,597 |
|
|
Zogenix, Inc. (a)(d) |
53,949 |
131,636 |
|
|
|
13,815,762 |
||
|
TOTAL HEALTH CARE |
117,692,914 |
||
|
INDUSTRIALS - 14.5% |
|||
|
Aerospace & Defense - 1.8% |
|||
|
AAR Corp. |
22,357 |
579,046 |
|
|
AeroVironment, Inc. (a) |
10,360 |
349,857 |
|
|
American Science & Engineering, Inc. |
4,479 |
300,989 |
|
|
API Technologies Corp. (a) |
21,295 |
48,553 |
|
|
Astronics Corp. (a) |
8,431 |
481,579 |
|
|
Cubic Corp. (d) |
11,038 |
523,532 |
|
|
Curtiss-Wright Corp. |
26,412 |
1,688,783 |
|
|
DigitalGlobe, Inc. (a) |
42,130 |
1,254,631 |
|
|
Ducommun, Inc. (a) |
5,893 |
143,023 |
|
|
Engility Holdings, Inc. (a) |
9,690 |
422,872 |
|
|
Erickson Air-Crane, Inc. (a)(d) |
2,460 |
38,893 |
|
|
Esterline Technologies Corp. (a) |
17,636 |
1,922,677 |
|
|
GenCorp, Inc. (non-vtg.) (a)(d) |
33,802 |
593,563 |
|
|
HEICO Corp. (d) |
37,554 |
2,077,487 |
|
|
Innovative Solutions & Support, Inc. (a) |
8,173 |
55,004 |
|
|
KEYW Holding Corp. (a)(d) |
18,267 |
234,731 |
|
|
Kratos Defense & Security Solutions, Inc. (a)(d) |
24,323 |
175,612 |
|
|
LMI Aerospace, Inc. (a)(d) |
5,921 |
80,762 |
|
|
Moog, Inc. Class A (a) |
25,621 |
1,676,894 |
|
|
National Presto Industries, Inc. (d) |
2,738 |
197,848 |
|
|
Orbital Sciences Corp. (a) |
33,714 |
991,192 |
|
|
Sparton Corp. (a) |
5,876 |
159,592 |
|
|
Taser International, Inc. (a)(d) |
28,659 |
462,843 |
|
|
Teledyne Technologies, Inc. (a) |
21,061 |
1,955,724 |
|
|
|
16,415,687 |
||
|
Air Freight & Logistics - 0.5% |
|||
|
Air Transport Services Group, Inc. (a) |
29,089 |
227,767 |
|
|
Atlas Air Worldwide Holdings, Inc. (a)(d) |
14,430 |
504,906 |
|
|
Echo Global Logistics, Inc. (a)(d) |
9,970 |
195,013 |
|
|
Forward Air Corp. |
17,152 |
758,633 |
|
|
Hub Group, Inc. Class A (a) |
20,685 |
923,585 |
|
|
Park-Ohio Holdings Corp. (a) |
4,827 |
281,849 |
|
|
Common Stocks - continued |
|||
|
Shares |
Value |
||
|
INDUSTRIALS - continued |
|||
|
Air Freight & Logistics - continued |
|||
|
UTi Worldwide, Inc. (d) |
50,953 |
$ 498,830 |
|
|
XPO Logistics, Inc. (a)(d) |
29,335 |
796,152 |
|
|
|
4,186,735 |
||
|
Airlines - 0.6% |
|||
|
Allegiant Travel Co. |
8,461 |
993,744 |
|
|
CHC Group Ltd. (a) |
20,139 |
135,938 |
|
|
Hawaiian Holdings, Inc. (a)(d) |
29,176 |
421,593 |
|
|
JetBlue Airways Corp. (a)(d) |
138,425 |
1,094,250 |
|
|
Republic Airways Holdings, Inc. (a) |
27,032 |
224,636 |
|
|
SkyWest, Inc. |
30,037 |
348,429 |
|
|
Spirit Airlines, Inc. (a) |
34,036 |
1,934,606 |
|
|
|
5,153,196 |
||
|
Building Products - 0.8% |
|||
|
AAON, Inc. |
16,096 |
456,322 |
|
|
American Woodmark Corp. (a) |
5,878 |
176,399 |
|
|
Apogee Enterprises, Inc. |
16,136 |
512,641 |
|
|
Builders FirstSource, Inc. (a) |
24,714 |
194,005 |
|
|
Continental Building Products, Inc. (a) |
7,595 |
129,115 |
|
|
Gibraltar Industries, Inc. (a) |
17,063 |
291,436 |
|
|
Griffon Corp. |
24,116 |
256,594 |
|
|
Insteel Industries, Inc. |
10,115 |
208,167 |
|
|
NCI Building Systems, Inc. (a) |
11,451 |
179,094 |
|
|
Norcraft Companies, Inc. |
4,100 |
65,108 |
|
|
Nortek, Inc. (a) |
4,959 |
407,431 |
|
|
Patrick Industries, Inc. (a) |
3,654 |
146,416 |
|
|
PGT, Inc. (a) |
18,227 |
181,359 |
|
|
Ply Gem Holdings, Inc. |
9,441 |
120,373 |
|
|
Quanex Building Products Corp. |
21,575 |
406,473 |
|
|
Simpson Manufacturing Co. Ltd. |
23,021 |
754,859 |
|
|
Trex Co., Inc. (a)(d) |
9,610 |
754,577 |
|
|
Universal Forest Products, Inc. |
11,133 |
562,105 |
|
|
USG Corp. (a)(d) |
43,488 |
1,298,552 |
|
|
|
7,101,026 |
||
|
Commercial Services & Supplies - 2.0% |
|||
|
ABM Industries, Inc. |
30,795 |
834,237 |
|
|
ACCO Brands Corp. (a)(d) |
65,065 |
398,848 |
|
|
Acorn Energy, Inc. (a)(d) |
12,828 |
29,761 |
|
|
ARC Document Solutions, Inc. (a) |
20,773 |
132,947 |
|
|
Casella Waste Systems, Inc. Class A (a) |
20,576 |
104,938 |
|
|
CECO Environmental Corp. (d) |
9,716 |
154,387 |
|
|
Common Stocks - continued |
|||
|
Shares |
Value |
||
|
INDUSTRIALS - continued |
|||
|
Commercial Services & Supplies - continued |
|||
|
Cenveo, Inc. (a)(d) |
30,648 |
$ 94,702 |
|
|
CompX International, Inc. Class A |
453 |
4,168 |
|
|
Courier Corp. |
6,196 |
90,028 |
|
|
Deluxe Corp. (d) |
28,763 |
1,580,527 |
|
|
EnerNOC, Inc. (a) |
14,962 |
353,103 |
|
|
Ennis, Inc. |
14,490 |
216,770 |
|
|
G&K Services, Inc. Class A |
10,930 |
578,634 |
|
|
Healthcare Services Group, Inc. (d) |
38,310 |
1,114,821 |
|
|
Heritage-Crystal Clean, Inc. (a)(d) |
4,570 |
73,120 |
|
|
Herman Miller, Inc. |
32,806 |
1,011,409 |
|
|
HNI Corp. |
25,695 |
905,235 |
|
|
InnerWorkings, Inc. (a)(d) |
25,722 |
185,198 |
|
|
Interface, Inc. |
33,257 |
598,293 |
|
|
Intersections, Inc. |
5,741 |
32,264 |
|
|
Kimball International, Inc. Class B |
18,579 |
311,384 |
|
|
Knoll, Inc. |
27,543 |
501,007 |
|
|
McGrath RentCorp. |
14,516 |
458,415 |
|
|
Mobile Mini, Inc. |
21,817 |
963,875 |
|
|
Msa Safety, Inc. |
16,091 |
848,800 |
|
|
Multi-Color Corp. |
6,777 |
236,178 |
|
|
NL Industries, Inc. |
3,212 |
32,216 |
|
|
Performant Financial Corp. (a) |
13,068 |
113,822 |
|
|
Quad/Graphics, Inc. |
14,266 |
308,859 |
|
|
Schawk, Inc. Class A |
8,042 |
160,840 |
|
|
SP Plus Corp. (a)(d) |
8,592 |
209,817 |
|
|
Steelcase, Inc. Class A |
47,739 |
786,739 |
|
|
Swisher Hygiene, Inc. (Canada) (a) |
53,835 |
21,609 |
|
|
Team, Inc. (a) |
11,513 |
493,793 |
|
|
Tetra Tech, Inc. |
36,795 |
1,054,913 |
|
|
The Brink's Co. |
27,263 |
693,571 |
|
|
TRC Companies, Inc. (a) |
8,134 |
48,235 |
|
|
U.S. Ecology, Inc. |
12,012 |
536,336 |
|
|
UniFirst Corp. |
8,235 |
792,536 |
|
|
United Stationers, Inc. |
22,999 |
863,152 |
|
|
Viad Corp. |
11,410 |
263,001 |
|
|
West Corp. |
11,685 |
284,530 |
|
|
|
18,477,018 |
||
|
Construction & Engineering - 0.9% |
|||
|
Aegion Corp. (a)(d) |
21,892 |
558,027 |
|
|
Ameresco, Inc. Class A (a) |
10,340 |
66,279 |
|
|
Common Stocks - continued |
|||
|
Shares |
Value |
||
|
INDUSTRIALS - continued |
|||
|
Construction & Engineering - continued |
|||
|
Argan, Inc. |
7,664 |
$ 205,165 |
|
|
Comfort Systems U.S.A., Inc. |
21,443 |
321,645 |
|
|
Dycom Industries, Inc. (a) |
18,578 |
583,349 |
|
|
EMCOR Group, Inc. |
37,936 |
1,744,677 |
|
|
Furmanite Corp. (a) |
20,986 |
219,933 |
|
|
Granite Construction, Inc. |
21,786 |
814,361 |
|
|
Great Lakes Dredge & Dock Corp. (a) |
34,344 |
296,389 |
|
|
Layne Christensen Co. (a)(d) |
10,997 |
191,568 |
|
|
MasTec, Inc. (a)(d) |
33,630 |
1,331,075 |
|
|
MYR Group, Inc. (a) |
12,354 |
289,825 |
|
|
Northwest Pipe Co. (a) |
5,301 |
189,617 |
|
|
Orion Marine Group, Inc. (a) |
15,164 |
177,874 |
|
|
Pike Corp. (a) |
14,550 |
139,680 |
|
|
Primoris Services Corp. |
19,911 |
557,110 |
|
|
Sterling Construction Co., Inc. (a) |
8,963 |
68,836 |
|
|
Tutor Perini Corp. (a) |
20,843 |
616,953 |
|
|
|
8,372,363 |
||
|
Electrical Equipment - 1.5% |
|||
|
Acuity Brands, Inc. |
24,171 |
3,010,981 |
|
|
American Superconductor Corp. (a)(d) |
27,464 |
35,154 |
|
|
AZZ, Inc. |
14,298 |
620,819 |
|
|
Brady Corp. Class A |
25,814 |
665,743 |
|
|
Capstone Turbine Corp. (a)(d) |
170,378 |
350,979 |
|
|
Encore Wire Corp. |
11,566 |
563,611 |
|
|
EnerSys |
27,206 |
1,838,581 |
|
|
Enphase Energy, Inc. (a)(d) |
9,079 |
68,546 |
|
|
Franklin Electric Co., Inc. |
26,687 |
1,031,986 |
|
|
FuelCell Energy, Inc. (a)(d) |
112,324 |
254,975 |
|
|
Generac Holdings, Inc. (d) |
29,108 |
1,713,879 |
|
|
General Cable Corp. |
28,114 |
720,281 |
|
|
Global Power Equipment Group, Inc. |
9,905 |
173,635 |
|
|
GrafTech International Ltd. (a) |
66,145 |
741,485 |
|
|
LSI Industries, Inc. |
11,290 |
85,917 |
|
|
Polypore International, Inc. (a) |
26,429 |
916,558 |
|
|
Powell Industries, Inc. |
5,080 |
321,666 |
|
|
Power Solutions International, Inc. (a)(d) |
1,280 |
105,920 |
|
|
PowerSecure International, Inc. (a)(d) |
12,410 |
275,874 |
|
|
Preformed Line Products Co. |
1,574 |
94,062 |
|
|
Revolution Lighting Technologies, Inc. (a)(d) |
16,829 |
48,972 |
|
|
Common Stocks - continued |
|||
|
Shares |
Value |
||
|
INDUSTRIALS - continued |
|||
|
Electrical Equipment - continued |
|||
|
Thermon Group Holdings, Inc. (a) |
15,311 |
$ 364,708 |
|
|
Vicor Corp. (a) |
10,035 |
83,893 |
|
|
|
14,088,225 |
||
|
Industrial Conglomerates - 0.1% |
|||
|
Raven Industries, Inc. |
20,337 |
628,413 |
|
|
Machinery - 3.3% |
|||
|
Accuride Corp. (a)(d) |
22,430 |
126,505 |
|
|
Actuant Corp. Class A |
41,525 |
1,406,037 |
|
|
Alamo Group, Inc. |
3,955 |
210,090 |
|
|
Albany International Corp. Class A |
15,576 |
560,424 |
|
|
Altra Industrial Motion Corp. |
15,046 |
513,971 |
|
|
American Railcar Industries, Inc. (d) |
5,288 |
367,199 |
|
|
Ampco-Pittsburgh Corp. |
4,644 |
93,019 |
|
|
Astec Industries, Inc. |
11,359 |
453,792 |
|
|
Barnes Group, Inc. |
30,543 |
1,176,516 |
|
|
Blount International, Inc. (a) |
28,743 |
321,059 |
|
|
Briggs & Stratton Corp. (d) |
26,851 |
573,806 |
|
|
Chart Industries, Inc. (a)(d) |
17,166 |
1,171,065 |
|
|
CIRCOR International, Inc. |
9,820 |
797,482 |
|
|
CLARCOR, Inc. |
28,044 |
1,619,821 |
|
|
Columbus McKinnon Corp. (NY Shares) |
10,742 |
284,556 |
|
|
Commercial Vehicle Group, Inc. (a) |
14,299 |
138,843 |
|
|
Douglas Dynamics, Inc. |
12,240 |
206,489 |
|
|
Dynamic Materials Corp. |
7,676 |
155,055 |
|
|
Energy Recovery, Inc. (a)(d) |
24,333 |
124,342 |
|
|
EnPro Industries, Inc. (a) |
11,793 |
839,780 |
|
|
ESCO Technologies, Inc. |
14,730 |
492,277 |
|
|
ExOne Co. (a)(d) |
3,616 |
124,897 |
|
|
Federal Signal Corp. |
34,795 |
528,188 |
|
|
FreightCar America, Inc. |
6,675 |
175,286 |
|
|
Global Brass & Copper Holdings, Inc. |
5,183 |
82,202 |
|
|
Gorman-Rupp Co. |
10,413 |
323,324 |
|
|
Graham Corp. |
5,664 |
169,014 |
|
|
Greenbrier Companies, Inc. (a)(d) |
13,847 |
726,137 |
|
|
Hardinge, Inc. |
7,135 |
95,324 |
|
|
Hurco Companies, Inc. |
3,393 |
90,457 |
|
|
Hyster-Yale Materials Handling Class A |
5,924 |
571,014 |
|
|
John Bean Technologies Corp. |
16,738 |
485,235 |
|
|
Kadant, Inc. |
6,298 |
218,856 |
|
|
L.B. Foster Co. Class A |
5,731 |
271,363 |
|
|
Common Stocks - continued |
|||
|
Shares |
Value |
||
|
INDUSTRIALS - continued |
|||
|
Machinery - continued |
|||
|
Lindsay Corp. (d) |
7,219 |
$ 636,210 |
|
|
Lydall, Inc. (a) |
9,485 |
222,044 |
|
|
Manitex International, Inc. (a) |
7,680 |
126,413 |
|
|
Meritor, Inc. (a) |
54,495 |
646,856 |
|
|
Middleby Corp. (a) |
10,612 |
2,679,318 |
|
|
Miller Industries, Inc. |
5,929 |
114,845 |
|
|
Mueller Industries, Inc. |
31,564 |
913,462 |
|
|
Mueller Water Products, Inc. Class A |
88,317 |
805,451 |
|
|
NN, Inc. |
10,243 |
200,456 |
|
|
Omega Flex, Inc. |
1,499 |
30,235 |
|
|
PMFG, Inc. (a) |
11,184 |
63,413 |
|
|
Proto Labs, Inc. (a)(d) |
9,568 |
579,247 |
|
|
RBC Bearings, Inc. (a) |
13,064 |
813,365 |
|
|
Rexnord Corp. (a) |
17,060 |
456,184 |
|
|
Standex International Corp. |
6,999 |
415,531 |
|
|
Sun Hydraulics Corp. |
12,002 |
490,642 |
|
|
Tecumseh Products Co. Class A (non-vtg.) |
10,357 |
62,246 |
|
|
Tennant Co. |
10,272 |
655,251 |
|
|
Titan International, Inc. (d) |
29,946 |
524,354 |
|
|
TriMas Corp. (a) |
25,298 |
907,186 |
|
|
Twin Disc, Inc. |
4,685 |
135,537 |
|
|
Wabash National Corp. (a)(d) |
38,287 |
511,514 |
|
|
Watts Water Technologies, Inc. Class A |
16,124 |
857,797 |
|
|
Woodward, Inc. |
38,860 |
1,742,094 |
|
|
Xerium Technologies, Inc. (a) |
5,706 |
77,031 |
|
|
|
30,160,107 |
||
|
Marine - 0.1% |
|||
|
International Shipholding Corp. |
3,046 |
82,059 |
|
|
Matson, Inc. |
23,822 |
564,343 |
|
|
Scorpio Bulkers, Inc. (a) |
74,858 |
669,979 |
|
|
Ultrapetrol (Bahamas) Ltd. (a) |
16,969 |
48,022 |
|
|
|
1,364,403 |
||
|
Professional Services - 1.3% |
|||
|
Acacia Research Corp. |
27,475 |
440,699 |
|
|
Advisory Board Co. (a)(d) |
20,130 |
1,152,644 |
|
|
Barrett Business Services, Inc. |
3,861 |
194,633 |
|
|
CBIZ, Inc. (a)(d) |
19,439 |
166,592 |
|
|
CDI Corp. |
8,083 |
123,832 |
|
|
Corporate Executive Board Co. |
19,060 |
1,315,521 |
|
|
CRA International, Inc. (a) |
6,165 |
134,212 |
|
|
Common Stocks - continued |
|||
|
Shares |
Value |
||
|
INDUSTRIALS - continued |
|||
|
Professional Services - continued |
|||
|
Exponent, Inc. |
7,566 |
$ 532,798 |
|
|
Franklin Covey Co. (a) |
5,018 |
101,715 |
|
|
FTI Consulting, Inc. (a)(d) |
22,804 |
782,177 |
|
|
GP Strategies Corp. (a) |
8,824 |
231,895 |
|
|
Heidrick & Struggles International, Inc. |
10,260 |
193,401 |
|
|
Huron Consulting Group, Inc. (a) |
13,013 |
926,526 |
|
|
ICF International, Inc. (a) |
11,014 |
429,216 |
|
|
Insperity, Inc. |
12,502 |
400,814 |
|
|
Kelly Services, Inc. Class A (non-vtg.) |
15,837 |
333,527 |
|
|
Kforce, Inc. |
15,407 |
356,210 |
|
|
Korn/Ferry International (a) |
27,619 |
802,332 |
|
|
MISTRAS Group, Inc. (a) |
8,928 |
202,755 |
|
|
Navigant Consulting, Inc. (a) |
28,779 |
483,487 |
|
|
Odyssey Marine Exploration, Inc. (a)(d) |
44,753 |
98,009 |
|
|
On Assignment, Inc. (a) |
25,605 |
896,175 |
|
|
Pendrell Corp. (a) |
90,658 |
149,586 |
|
|
Resources Connection, Inc. |
22,686 |
308,756 |
|
|
RPX Corp. (a) |
18,544 |
303,751 |
|
|
TrueBlue, Inc. (a) |
22,812 |
610,221 |
|
|
VSE Corp. |
2,515 |
157,112 |
|
|
WageWorks, Inc. (a) |
13,931 |
590,256 |
|
|
|
12,418,852 |
||
|
Road & Rail - 0.6% |
|||
|
Arkansas Best Corp. |
14,395 |
567,451 |
|
|
Celadon Group, Inc. |
11,051 |
254,284 |
|
|
Heartland Express, Inc. (d) |
25,995 |
565,651 |
|
|
Knight Transportation, Inc. (d) |
33,014 |
783,422 |
|
|
Marten Transport Ltd. |
13,111 |
307,584 |
|
|
Patriot Transportation Holding, Inc. (a) |
3,870 |
134,986 |
|
|
Quality Distribution, Inc. (a) |
11,700 |
147,069 |
|
|
Roadrunner Transportation Systems, Inc. (a)(d) |
10,648 |
262,260 |
|
|
Saia, Inc. (a) |
13,609 |
560,283 |
|
|
Swift Transporation Co. (a) |
47,394 |
1,139,826 |
|
|
Universal Truckload Services, Inc. |
3,023 |
74,547 |
|
|
Werner Enterprises, Inc. |
25,782 |
660,019 |
|
|
YRC Worldwide, Inc. (a) |
17,485 |
392,189 |
|
|
|
5,849,571 |
||
|
Trading Companies & Distributors - 1.0% |
|||
|
Aceto Corp. |
15,519 |
339,556 |
|
|
Aircastle Ltd. |
38,368 |
674,126 |
|
|
Common Stocks - continued |
|||
|
Shares |
Value |
||
|
INDUSTRIALS - continued |
|||
|
Trading Companies & Distributors - continued |
|||
|
Applied Industrial Technologies, Inc. |
23,801 |
$ 1,140,544 |
|
|
Beacon Roofing Supply, Inc. (a)(d) |
27,850 |
990,903 |
|
|
BlueLinx Corp. (a) |
12,863 |
16,851 |
|
|
CAI International, Inc. (a)(d) |
9,460 |
205,755 |
|
|
DXP Enterprises, Inc. (a) |
5,297 |
599,673 |
|
|
H&E Equipment Services, Inc. (a) |
16,838 |
649,105 |
|
|
Houston Wire & Cable Co. |
9,647 |
120,202 |
|
|
Kaman Corp. |
15,305 |
642,351 |
|
|
Rush Enterprises, Inc. Class A (a)(d) |
19,844 |
636,992 |
|
|
Stock Building Supply Holdings, Inc. |
4,795 |
83,001 |
|
|
TAL International Group, Inc. (d) |
19,015 |
802,053 |
|
|
Textainer Group Holdings Ltd. (d) |
11,885 |
467,081 |
|
|
Titan Machinery, Inc. (a)(d) |
9,601 |
169,362 |
|
|
Watsco, Inc. |
14,495 |
1,491,680 |
|
|
|
9,029,235 |
||
|
Transportation Infrastructure - 0.0% |
|||
|
Wesco Aircraft Holdings, Inc. (a) |
23,038 |
466,750 |
|
|
TOTAL INDUSTRIALS |
133,711,581 |
||
|
INFORMATION TECHNOLOGY - 17.1% |
|||
|
Communications Equipment - 1.7% |
|||
|
ADTRAN, Inc. |
33,522 |
751,898 |
|
|
Alliance Fiber Optic Products, Inc. (d) |
6,675 |
128,294 |
|
|
Applied Optoelectronics, Inc. |
2,603 |
58,568 |
|
|
Arris Group, Inc. (a) |
65,748 |
1,715,365 |
|
|
Aruba Networks, Inc. (a)(d) |
63,013 |
1,245,767 |
|
|
Aviat Networks, Inc. (a) |
35,973 |
54,319 |
|
|
Bel Fuse, Inc. Class B (non-vtg.) |
6,196 |
134,825 |
|
|
Black Box Corp. |
9,015 |
191,659 |
|
|
CalAmp Corp. (a)(d) |
19,628 |
348,397 |
|
|
Calix Networks, Inc. (a) |
22,183 |
195,432 |
|
|
Ciena Corp. (a)(d) |
57,370 |
1,134,205 |
|
|
Comtech Telecommunications Corp. |
9,171 |
291,179 |
|
|
Digi International, Inc. (a) |
14,676 |
130,029 |
|
|
Emulex Corp. (a) |
44,515 |
318,282 |
|
|
Extreme Networks, Inc. (a) |
50,928 |
291,308 |
|
|
Finisar Corp. (a)(d) |
52,733 |
1,378,968 |
|
|
Harmonic, Inc. (a) |
56,070 |
394,172 |
|
|
Infinera Corp. (a)(d) |
68,403 |
612,891 |
|
|
InterDigital, Inc. (d) |
23,040 |
799,949 |
|
|
Common Stocks - continued |
|||
|
Shares |
Value |
||
|
INFORMATION TECHNOLOGY - continued |
|||
|
Communications Equipment - continued |
|||
|
Ixia (a) |
31,987 |
$ 397,279 |
|
|
KVH Industries, Inc. (a) |
8,924 |
120,563 |
|
|
NETGEAR, Inc. (a)(d) |
21,804 |
704,269 |
|
|
NumereX Corp. Class A (a)(d) |
7,299 |
74,815 |
|
|
Oplink Communications, Inc. (a) |
11,274 |
193,236 |
|
|
Parkervision, Inc. (a)(d) |
48,332 |
220,394 |
|
|
PC-Tel, Inc. |
9,005 |
74,291 |
|
|
Plantronics, Inc. |
24,181 |
1,053,566 |
|
|
Procera Networks, Inc. (a)(d) |
11,639 |
107,777 |
|
|
Ruckus Wireless, Inc. (a) |
25,340 |
264,803 |
|
|
ShoreTel, Inc. (a) |
32,372 |
244,409 |
|
|
Sonus Networks, Inc. (a) |
111,278 |
363,879 |
|
|
Tessco Technologies, Inc. |
3,016 |
99,196 |
|
|
Ubiquiti Networks, Inc. (a) |
7,041 |
272,698 |
|
|
ViaSat, Inc. (a)(d) |
22,363 |
1,435,928 |
|
|
Westell Technologies, Inc. Class A (a) |
26,559 |
86,582 |
|
|
|
15,889,192 |
||
|
Electronic Equipment & Components - 2.7% |
|||
|
Aeroflex Holding Corp. (a) |
11,850 |
90,653 |
|
|
Agilysys, Inc. (a) |
8,101 |
101,587 |
|
|
Anixter International, Inc. |
15,314 |
1,500,466 |
|
|
Audience, Inc. (a) |
5,601 |
64,412 |
|
|
Badger Meter, Inc. |
8,568 |
424,544 |
|
|
Belden, Inc. |
24,865 |
1,835,286 |
|
|
Benchmark Electronics, Inc. (a) |
30,751 |
712,808 |
|
|
Checkpoint Systems, Inc. (a) |
22,636 |
289,062 |
|
|
Cognex Corp. (a) |
49,104 |
1,690,651 |
|
|
Coherent, Inc. (a) |
13,729 |
819,759 |
|
|
Control4 Corp. |
2,265 |
40,000 |
|
|
CTS Corp. |
18,465 |
328,492 |
|
|
Daktronics, Inc. |
20,185 |
262,809 |
|
|
DTS, Inc. (a) |
10,494 |
195,293 |
|
|
Electro Rent Corp. |
10,709 |
172,950 |
|
|
Electro Scientific Industries, Inc. |
13,432 |
113,903 |
|
|
Fabrinet (a) |
16,146 |
348,754 |
|
|
FARO Technologies, Inc. (a) |
9,560 |
381,444 |
|
|
FEI Co. |
23,550 |
1,872,696 |
|
|
GSI Group, Inc. (a) |
16,975 |
206,077 |
|
|
II-VI, Inc. (a) |
29,132 |
419,501 |
|
|
Insight Enterprises, Inc. (a) |
24,228 |
632,835 |
|
|
Common Stocks - continued |
|||
|
Shares |
Value |
||
|
INFORMATION TECHNOLOGY - continued |
|||
|
Electronic Equipment & Components - continued |
|||
|
InvenSense, Inc. (a)(d) |
32,175 |
$ 692,728 |
|
|
Itron, Inc. (a) |
22,310 |
847,780 |
|
|
KEMET Corp. (a) |
26,550 |
133,016 |
|
|
Littelfuse, Inc. |
12,476 |
1,129,702 |
|
|
Maxwell Technologies, Inc. (a)(d) |
16,337 |
246,035 |
|
|
Measurement Specialties, Inc. (a) |
8,723 |
561,325 |
|
|
Mercury Systems, Inc. (a) |
19,020 |
265,519 |
|
|
Mesa Laboratories, Inc. |
1,457 |
124,865 |
|
|
Methode Electronics, Inc. Class A |
20,718 |
574,717 |
|
|
MTS Systems Corp. |
8,778 |
565,918 |
|
|
Multi-Fineline Electronix, Inc. (a) |
5,253 |
65,032 |
|
|
Neonode, Inc. (a)(d) |
14,682 |
78,549 |
|
|
Newport Corp. (a) |
21,770 |
406,664 |
|
|
OSI Systems, Inc. (a) |
11,246 |
627,639 |
|
|
Park Electrochemical Corp. |
11,518 |
307,070 |
|
|
PC Connection, Inc. |
5,206 |
104,172 |
|
|
Plexus Corp. (a) |
19,333 |
810,439 |
|
|
RadiSys Corp. (a) |
16,147 |
51,670 |
|
|
RealD, Inc. (a)(d) |
22,188 |
243,180 |
|
|
Richardson Electronics Ltd. |
5,874 |
58,857 |
|
|
Rofin-Sinar Technologies, Inc. (a) |
15,596 |
346,231 |
|
|
Rogers Corp. (a) |
10,092 |
605,722 |
|
|
Sanmina Corp. (a) |
46,711 |
945,898 |
|
|
ScanSource, Inc. (a) |
15,855 |
608,991 |
|
|
Speed Commerce, Inc. (a) |
27,080 |
89,364 |
|
|
SYNNEX Corp. (a) |
14,902 |
1,004,097 |
|
|
TTM Technologies, Inc. (a) |
29,060 |
229,283 |
|
|
Uni-Pixel, Inc. (a)(d) |
4,811 |
26,316 |
|
|
Universal Display Corp. (a)(d) |
22,805 |
594,070 |
|
|
Viasystems Group, Inc. (a) |
1,488 |
17,886 |
|
|
Vishay Precision Group, Inc. (a) |
6,542 |
106,177 |
|
|
Zygo Corp. (a) |
9,356 |
180,009 |
|
|
|
25,152,903 |
||
|
Internet Software & Services - 2.7% |
|||
|
Angie's List, Inc. (a)(d) |
23,228 |
262,709 |
|
|
Bankrate, Inc. (a)(d) |
25,915 |
454,031 |
|
|
Bazaarvoice, Inc. (a)(d) |
27,586 |
185,378 |
|
|
Benefitfocus, Inc. (d) |
2,899 |
93,928 |
|
|
Blucora, Inc. (a)(d) |
22,953 |
441,845 |
|
|
Brightcove, Inc. (a) |
16,380 |
141,196 |
|
|
Common Stocks - continued |
|||
|
Shares |
Value |
||
|
INFORMATION TECHNOLOGY - continued |
|||
|
Internet Software & Services - continued |
|||
|
Carbonite, Inc. (a) |
6,426 |
$ 63,553 |
|
|
Care.com, Inc. (d) |
4,015 |
49,184 |
|
|
ChannelAdvisor Corp. (a)(d) |
3,502 |
91,892 |
|
|
Chegg, Inc. (d) |
8,440 |
44,479 |
|
|
comScore, Inc. (a) |
19,935 |
624,564 |
|
|
Constant Contact, Inc. (a) |
17,230 |
445,568 |
|
|
Conversant, Inc. (a)(d) |
37,781 |
923,368 |
|
|
Cornerstone OnDemand, Inc. (a) |
22,621 |
831,548 |
|
|
CoStar Group, Inc. (a) |
16,142 |
2,597,086 |
|
|
Cvent, Inc. (d) |
3,735 |
102,825 |
|
|
DealerTrack Holdings, Inc. (a)(d) |
24,611 |
1,124,477 |
|
|
Demand Media, Inc. (a)(d) |
20,840 |
86,694 |
|
|
Demandware, Inc. (a) |
10,312 |
511,785 |
|
|
Dice Holdings, Inc. (a) |
22,881 |
175,040 |
|
|
Digital River, Inc. (a) |
18,641 |
285,021 |
|
|
E2open, Inc. (a)(d) |
9,044 |
156,190 |
|
|
EarthLink Holdings Corp. |
58,039 |
197,913 |
|
|
eGain Communications Corp. (a)(d) |
6,208 |
40,600 |
|
|
Endurance International Group Holdings, Inc. (d) |
12,507 |
158,214 |
|
|
Envestnet, Inc. (a) |
13,328 |
491,137 |
|
|
Global Eagle Entertainment, Inc. (a) |
15,443 |
170,336 |
|
|
Gogo, Inc. (d) |
6,028 |
81,499 |
|
|
Internap Network Services Corp. (a) |
30,416 |
204,396 |
|
|
IntraLinks Holdings, Inc. (a) |
22,610 |
206,882 |
|
|
j2 Global, Inc. (d) |
26,024 |
1,206,473 |
|
|
Limelight Networks, Inc. (a) |
35,565 |
73,620 |
|
|
Liquidity Services, Inc. (a)(d) |
14,189 |
244,760 |
|
|
LivePerson, Inc. (a)(d) |
30,325 |
300,218 |
|
|
LogMeIn, Inc. (a) |
14,633 |
665,070 |
|
|
Marchex, Inc. Class B |
14,646 |
135,476 |
|
|
Marin Software, Inc. (a)(d) |
5,699 |
53,457 |
|
|
Marketo, Inc. (d) |
4,254 |
115,454 |
|
|
Millennial Media, Inc. (a)(d) |
20,175 |
128,918 |
|
|
Monster Worldwide, Inc. (a) |
54,777 |
377,414 |
|
|
Move, Inc. (a) |
22,329 |
238,697 |
|
|
Net Element International, Inc. (a)(d) |
971 |
2,165 |
|
|
NIC, Inc. |
36,328 |
666,256 |
|
|
OpenTable, Inc. (a) |
12,778 |
858,170 |
|
|
Perficient, Inc. (a) |
18,464 |
337,337 |
|
|
QuinStreet, Inc. (a) |
17,893 |
109,147 |
|
|
RealNetworks, Inc. (a) |
14,031 |
105,794 |
|
|
Common Stocks - continued |
|||
|
Shares |
Value |
||
|
INFORMATION TECHNOLOGY - continued |
|||
|
Internet Software & Services - continued |
|||
|
Reis, Inc. (a)(d) |
5,185 |
$ 85,345 |
|
|
Rocket Fuel, Inc. (d) |
2,974 |
95,376 |
|
|
SciQuest, Inc. (a)(d) |
14,664 |
351,643 |
|
|
Shutterstock, Inc. (a)(d) |
4,235 |
307,080 |
|
|
Spark Networks, Inc. (a)(d) |
11,704 |
53,019 |
|
|
SPS Commerce, Inc. (a) |
9,011 |
466,770 |
|
|
Stamps.com, Inc. (a) |
7,720 |
267,961 |
|
|
Support.com, Inc. (a) |
31,762 |
78,452 |
|
|
TechTarget, Inc. (a) |
5,541 |
35,573 |
|
|
Textura Corp. (d) |
3,213 |
57,224 |
|
|
Travelzoo, Inc. (a) |
4,378 |
78,541 |
|
|
Tremor Video, Inc. (d) |
2,761 |
12,452 |
|
|
Trulia, Inc. (a)(d) |
15,497 |
526,898 |
|
|
United Online, Inc. |
7,442 |
88,188 |
|
|
Unwired Planet, Inc. (d) |
57,390 |
130,849 |
|
|
VistaPrint Ltd. (a)(d) |
18,259 |
720,683 |
|
|
Vocus, Inc. (a)(d) |
10,670 |
191,847 |
|
|
Web.com Group, Inc. (a)(d) |
23,521 |
722,330 |
|
|
WebMD Health Corp. (a)(d) |
15,914 |
701,648 |
|
|
Wix.com Ltd. (a) |
4,587 |
93,988 |
|
|
XO Group, Inc. (a) |
14,620 |
155,264 |
|
|
Xoom Corp. (a)(d) |
4,827 |
107,690 |
|
|
Yelp, Inc. (a) |
18,403 |
1,073,263 |
|
|
YuMe, Inc. |
1,983 |
13,266 |
|
|
Zillow, Inc. (a)(d) |
13,174 |
1,432,014 |
|
|
Zix Corp. (a) |
36,518 |
119,779 |
|
|
|
24,828,907 |
||
|
IT Services - 2.1% |
|||
|
Acxiom Corp. (a) |
41,918 |
1,183,764 |
|
|
Blackhawk Network Holdings, Inc. (d) |
28,865 |
692,471 |
|
|
CACI International, Inc. Class A (a)(d) |
12,977 |
903,848 |
|
|
Cardtronics, Inc. (a) |
25,181 |
843,060 |
|
|
Cass Information Systems, Inc. |
5,682 |
286,998 |
|
|
Ciber, Inc. (a) |
41,869 |
180,874 |
|
|
Computer Task Group, Inc. |
8,177 |
129,278 |
|
|
Convergys Corp. |
58,933 |
1,269,417 |
|
|
CSG Systems International, Inc. |
18,991 |
500,603 |
|
|
Datalink Corp. (a) |
10,689 |
137,247 |
|
|
EPAM Systems, Inc. (a) |
12,279 |
382,245 |
|
|
Euronet Worldwide, Inc. (a) |
28,154 |
1,294,802 |
|
|
Common Stocks - continued |
|||
|
Shares |
Value |
||
|
INFORMATION TECHNOLOGY - continued |
|||
|
IT Services - continued |
|||
|
EVERTEC, Inc. |
16,536 |
$ 389,257 |
|
|
ExlService Holdings, Inc. (a) |
18,347 |
519,128 |
|
|
Forrester Research, Inc. |
6,988 |
247,585 |
|
|
Global Cash Access Holdings, Inc. (a) |
36,922 |
243,685 |
|
|
Hackett Group, Inc. |
16,117 |
96,702 |
|
|
Heartland Payment Systems, Inc. (d) |
20,559 |
841,685 |
|
|
Higher One Holdings, Inc. (a) |
17,318 |
103,735 |
|
|
iGATE Corp. (a) |
19,543 |
715,274 |
|
|
Lionbridge Technologies, Inc. (a) |
31,978 |
188,031 |
|
|
Luxoft Holding, Inc. |
2,426 |
65,478 |
|
|
ManTech International Corp. Class A (d) |
13,801 |
411,684 |
|
|
Maximus, Inc. |
38,580 |
1,642,351 |
|
|
ModusLink Global Solutions, Inc. (a)(d) |
20,772 |
83,919 |
|
|
MoneyGram International, Inc. (a) |
11,710 |
154,572 |
|
|
Planet Payment, Inc. (a) |
25,064 |
65,918 |
|
|
PRG-Schultz International, Inc. (a) |
15,349 |
98,694 |
|
|
Sapient Corp. (a) |
62,622 |
1,018,860 |
|
|
ServiceSource International, Inc. (a)(d) |
33,400 |
208,416 |
|
|
Sykes Enterprises, Inc. (a) |
21,880 |
433,005 |
|
|
Syntel, Inc. (a) |
8,805 |
707,218 |
|
|
Teletech Holdings, Inc. (a) |
11,281 |
272,211 |
|
|
Unisys Corp. (a)(d) |
28,590 |
696,738 |
|
|
Virtusa Corp. (a) |
12,778 |
421,291 |
|
|
WEX, Inc. (a) |
21,928 |
2,104,430 |
|
|
|
19,534,474 |
||
|
Semiconductors & Semiconductor Equipment - 3.8% |
|||
|
Advanced Energy Industries, Inc. (a) |
21,959 |
480,463 |
|
|
Alpha & Omega Semiconductor Ltd. (a) |
9,856 |
70,963 |
|
|
Ambarella, Inc. (a)(d) |
11,080 |
275,338 |
|
|
Amkor Technology, Inc. (a) |
39,595 |
314,780 |
|
|
ANADIGICS, Inc. (a)(d) |
42,417 |
53,021 |
|
|
Applied Micro Circuits Corp. (a)(d) |
40,937 |
397,498 |
|
|
ATMI, Inc. |
17,640 |
599,760 |
|
|
Axcelis Technologies, Inc. (a) |
60,635 |
108,537 |
|
|
Brooks Automation, Inc. |
36,579 |
374,203 |
|
|
Cabot Microelectronics Corp. (a) |
13,610 |
590,266 |
|
|
Cavium, Inc. (a)(d) |
29,020 |
1,229,577 |
|
|
Ceva, Inc. (a) |
12,205 |
198,087 |
|
|
Cirrus Logic, Inc. (a)(d) |
35,755 |
797,337 |
|
|
Cohu, Inc. |
15,198 |
156,539 |
|
|
Common Stocks - continued |
|||
|
Shares |
Value |
||
|
INFORMATION TECHNOLOGY - continued |
|||
|
Semiconductors & Semiconductor Equipment - continued |
|||
|
Cypress Semiconductor Corp. (d) |
89,216 |
$ 844,876 |
|
|
Diodes, Inc. (a) |
20,325 |
535,970 |
|
|
DSP Group, Inc. (a) |
11,041 |
87,886 |
|
|
Entegris, Inc. (a) |
79,075 |
876,942 |
|
|
Entropic Communications, Inc. (a) |
49,565 |
182,895 |
|
|
Exar Corp. (a) |
21,200 |
229,384 |
|
|
FormFactor, Inc. (a) |
31,100 |
178,825 |
|
|
GSI Technology, Inc. (a) |
13,089 |
83,115 |
|
|
GT Advanced Technologies, Inc. (a)(d) |
75,845 |
1,259,785 |
|
|
Hittite Microwave Corp. |
17,792 |
1,056,133 |
|
|
Inphi Corp. (a) |
15,310 |
226,435 |
|
|
Integrated Device Technology, Inc. (a) |
74,596 |
870,535 |
|
|
Integrated Silicon Solution, Inc. (a) |
16,646 |
240,701 |
|
|
Intermolecular, Inc. (a)(d) |
9,580 |
26,058 |
|
|
International Rectifier Corp. (a) |
39,291 |
1,023,138 |
|
|
Intersil Corp. Class A |
71,229 |
878,966 |
|
|
IXYS Corp. |
14,171 |
152,905 |
|
|
Kopin Corp. (a) |
37,324 |
121,676 |
|
|
Lattice Semiconductor Corp. (a) |
64,537 |
543,402 |
|
|
LTX-Credence Corp. (a) |
26,083 |
251,179 |
|
|
M/A-COM Technology Solutions, Inc. (a) |
6,355 |
111,276 |
|
|
MaxLinear, Inc. Class A (a) |
13,846 |
108,968 |
|
|
Micrel, Inc. |
26,916 |
268,083 |
|
|
Microsemi Corp. (a) |
52,751 |
1,240,704 |
|
|
MKS Instruments, Inc. |
29,600 |
833,240 |
|
|
Monolithic Power Systems, Inc. (a) |
21,942 |
814,048 |
|
|
MoSys, Inc. (a)(d) |
26,406 |
103,247 |
|
|
Nanometrics, Inc. (a) |
12,756 |
207,413 |
|
|
NeoPhotonics Corp. (a) |
12,001 |
69,246 |
|
|
NVE Corp. (a) |
2,930 |
153,854 |
|
|
Omnivision Technologies, Inc. (a) |
30,145 |
588,732 |
|
|
PDF Solutions, Inc. (a) |
13,922 |
261,316 |
|
|
Peregrine Semiconductor Corp. (a)(d) |
15,663 |
84,110 |
|
|
Pericom Semiconductor Corp. (a) |
12,823 |
103,482 |
|
|
Photronics, Inc. (a) |
33,515 |
290,910 |
|
|
PLX Technology, Inc. (a) |
24,917 |
144,519 |
|
|
PMC-Sierra, Inc. (a) |
113,994 |
779,719 |
|
|
Power Integrations, Inc. (d) |
16,427 |
775,847 |
|
|
Rambus, Inc. (a)(d) |
63,007 |
761,755 |
|
|
RF Micro Devices, Inc. (a) |
158,860 |
1,340,778 |
|
|
Rubicon Technology, Inc. (a) |
11,629 |
117,802 |
|
|
Common Stocks - continued |
|||
|
Shares |
Value |
||
|
INFORMATION TECHNOLOGY - continued |
|||
|
Semiconductors & Semiconductor Equipment - continued |
|||
|
Rudolph Technologies, Inc. (a)(d) |
18,163 |
$ 165,465 |
|
|
Semtech Corp. (a) |
38,205 |
916,156 |
|
|
Sigma Designs, Inc. (a) |
15,370 |
57,945 |
|
|
Silicon Image, Inc. (a) |
44,653 |
250,503 |
|
|
Spansion, Inc. Class A (a) |
26,293 |
468,804 |
|
|
SunEdison, Inc. (a)(d) |
150,396 |
2,892,115 |
|
|
SunPower Corp. (a) |
23,281 |
778,051 |
|
|
Synaptics, Inc. (a)(d) |
18,366 |
1,141,447 |
|
|
Tessera Technologies, Inc. |
29,880 |
655,268 |
|
|
TriQuint Semiconductor, Inc. (a) |
92,213 |
1,307,580 |
|
|
Ultra Clean Holdings, Inc. (a) |
13,619 |
116,034 |
|
|
Ultratech, Inc. (a)(d) |
15,816 |
421,022 |
|
|
Veeco Instruments, Inc. (a)(d) |
22,207 |
820,993 |
|
|
|
34,467,607 |
||
|
Software - 3.7% |
|||
|
ACI Worldwide, Inc. (a)(d) |
22,505 |
1,286,161 |
|
|
Actuate Corp. (a) |
26,413 |
148,705 |
|
|
Advent Software, Inc. |
18,647 |
537,407 |
|
|
American Software, Inc. Class A |
14,017 |
135,124 |
|
|
Aspen Technology, Inc. (a) |
52,921 |
2,275,074 |
|
|
AVG Technologies NV (a)(d) |
13,670 |
256,039 |
|
|
Barracuda Networks, Inc. (d) |
2,368 |
61,165 |
|
|
Blackbaud, Inc. |
25,749 |
784,057 |
|
|
Bottomline Technologies, Inc. (a)(d) |
21,268 |
672,920 |
|
|
BroadSoft, Inc. (a)(d) |
15,712 |
398,771 |
|
|
Callidus Software, Inc. (a)(d) |
22,106 |
211,002 |
|
|
CommVault Systems, Inc. (a)(d) |
26,272 |
1,271,565 |
|
|
Comverse, Inc. (a) |
12,270 |
306,014 |
|
|
Covisint Corp. (d) |
4,607 |
32,525 |
|
|
Cyan, Inc. (d) |
4,496 |
18,793 |
|
|
Digimarc Corp. |
3,342 |
110,353 |
|
|
Ebix, Inc. (d) |
17,865 |
281,910 |
|
|
Ellie Mae, Inc. (a)(d) |
15,656 |
381,850 |
|
|
EPIQ Systems, Inc. |
17,744 |
226,946 |
|
|
ePlus, Inc. (a) |
2,289 |
114,542 |
|
|
Fair Isaac Corp. |
20,103 |
1,149,892 |
|
|
Fleetmatics Group PLC (a)(d) |
9,898 |
297,237 |
|
|
Gigamon, Inc. (a)(d) |
4,295 |
67,732 |
|
|
Glu Mobile, Inc. (a) |
35,203 |
140,812 |
|
|
Guidance Software, Inc. (a) |
9,629 |
88,683 |
|
|
Common Stocks - continued |
|||
|
Shares |
Value |
||
|
INFORMATION TECHNOLOGY - continued |
|||
|
Software - continued |
|||
|
Guidewire Software, Inc. (a) |
27,837 |
$ 1,051,125 |
|
|
Imperva, Inc. (a) |
11,287 |
258,247 |
|
|
Infoblox, Inc. (a) |
29,655 |
581,831 |
|
|
Interactive Intelligence Group, Inc. (a) |
8,655 |
541,543 |
|
|
Jive Software, Inc. (a)(d) |
22,797 |
170,522 |
|
|
Manhattan Associates, Inc. (a) |
44,000 |
1,387,320 |
|
|
Mavenir Systems, Inc. (d) |
3,037 |
45,312 |
|
|
Mentor Graphics Corp. |
54,179 |
1,121,505 |
|
|
MicroStrategy, Inc. Class A (a) |
5,088 |
617,836 |
|
|
Mitek Systems, Inc. (a)(d) |
11,851 |
38,634 |
|
|
Model N, Inc. (a) |
4,220 |
38,022 |
|
|
Monotype Imaging Holdings, Inc. |
21,886 |
578,009 |
|
|
NetScout Systems, Inc. (a) |
20,413 |
795,290 |
|
|
Parametric Technology Corp. (a) |
67,450 |
2,385,707 |
|
|
Pegasystems, Inc. |
19,940 |
330,406 |
|
|
Progress Software Corp. (a) |
29,025 |
622,877 |
|
|
Proofpoint, Inc. (a) |
12,894 |
328,023 |
|
|
PROS Holdings, Inc. (a) |
13,556 |
371,434 |
|
|
QAD, Inc. Class A |
3,767 |
71,761 |
|
|
Qlik Technologies, Inc. (a) |
48,815 |
1,072,954 |
|
|
Qualys, Inc. (a) |
8,198 |
158,139 |
|
|
Rally Software Development Corp. (d) |
3,579 |
46,813 |
|
|
RealPage, Inc. (a)(d) |
26,055 |
462,476 |
|
|
Rosetta Stone, Inc. (a) |
6,563 |
78,165 |
|
|
Sapiens International Corp. NV (a) |
12,007 |
94,495 |
|
|
SeaChange International, Inc. (a) |
18,036 |
168,997 |
|
|
Silver Spring Networks, Inc. (a)(d) |
3,067 |
45,944 |
|
|
SS&C Technologies Holdings, Inc. (a) |
32,970 |
1,283,192 |
|
|
Synchronoss Technologies, Inc. (a)(d) |
16,327 |
496,994 |
|
|
Take-Two Interactive Software, Inc. (a)(d) |
45,802 |
933,445 |
|
|
Tangoe, Inc. (a)(d) |
17,760 |
267,110 |
|
|
TeleCommunication Systems, Inc. Class A (a) |
30,163 |
76,916 |
|
|
TeleNav, Inc. (a) |
8,481 |
51,989 |
|
|
TiVo, Inc. (a) |
71,353 |
846,247 |
|
|
Tyler Technologies, Inc. (a) |
17,801 |
1,453,452 |
|
|
Ultimate Software Group, Inc. (a) |
15,669 |
1,874,482 |
|
|
Varonis Systems, Inc. |
3,028 |
76,518 |
|
|
Vasco Data Security International, Inc. (a) |
16,463 |
187,843 |
|
|
Verint Systems, Inc. (a) |
29,788 |
1,303,821 |
|
|
Common Stocks - continued |
|||
|
Shares |
Value |
||
|
INFORMATION TECHNOLOGY - continued |
|||
|
Software - continued |
|||
|
VirnetX Holding Corp. (a)(d) |
24,013 |
$ 378,205 |
|
|
Vringo, Inc. (a)(d) |
37,308 |
152,590 |
|
|
|
34,101,470 |
||
|
Technology Hardware, Storage & Peripherals - 0.4% |
|||
|
Cray, Inc. (a)(d) |
22,461 |
644,855 |
|
|
Electronics for Imaging, Inc. (a) |
26,291 |
993,537 |
|
|
Fusion-io, Inc. (a) |
45,673 |
394,158 |
|
|
Hutchinson Technology, Inc. (a) |
11,017 |
30,627 |
|
|
Imation Corp. (a) |
18,567 |
80,209 |
|
|
Immersion Corp. (a) |
15,630 |
177,244 |
|
|
QLogic Corp. (a) |
49,423 |
572,318 |
|
|
Quantum Corp. (a)(d) |
128,204 |
138,460 |
|
|
Silicon Graphics International Corp. (a)(d) |
18,592 |
224,591 |
|
|
Super Micro Computer, Inc. (a) |
18,061 |
367,722 |
|
|
Violin Memory, Inc. (d) |
11,578 |
41,681 |
|
|
|
3,665,402 |
||
|
TOTAL INFORMATION TECHNOLOGY |
157,639,955 |
||
|
MATERIALS - 4.9% |
|||
|
Chemicals - 2.3% |
|||
|
A. Schulman, Inc. |
16,296 |
585,352 |
|
|
Advanced Emissions Solutions, Inc. (a) |
12,050 |
276,307 |
|
|
American Vanguard Corp. (d) |
16,351 |
291,211 |
|
|
Arabian American Development Co. (a) |
11,184 |
122,241 |
|
|
Axiall Corp. |
39,440 |
1,837,904 |
|
|
Balchem Corp. |
16,752 |
1,037,786 |
|
|
Calgon Carbon Corp. (a) |
30,305 |
607,009 |
|
|
Chase Corp. |
4,102 |
127,736 |
|
|
Chemtura Corp. (a) |
55,689 |
1,241,865 |
|
|
Ferro Corp. (a) |
40,297 |
523,055 |
|
|
Flotek Industries, Inc. (a)(d) |
26,695 |
747,727 |
|
|
FutureFuel Corp. |
11,923 |
239,295 |
|
|
H.B. Fuller Co. |
28,468 |
1,318,922 |
|
|
Hawkins, Inc. |
4,989 |
180,602 |
|
|
Innophos Holdings, Inc. |
12,400 |
699,856 |
|
|
Innospec, Inc. |
13,156 |
566,497 |
|
|
Intrepid Potash, Inc. (a)(d) |
30,635 |
499,351 |
|
|
KMG Chemicals, Inc. |
4,704 |
73,429 |
|
|
Koppers Holdings, Inc. |
11,534 |
492,502 |
|
|
Common Stocks - continued |
|||
|
Shares |
Value |
||
|
MATERIALS - continued |
|||
|
Chemicals - continued |
|||
|
Kraton Performance Polymers, Inc. (a) |
18,147 |
$ 472,729 |
|
|
Landec Corp. (a) |
14,497 |
171,934 |
|
|
LSB Industries, Inc. (a) |
10,672 |
407,564 |
|
|
Marrone Bio Innovations, Inc. (d) |
3,449 |
42,009 |
|
|
Minerals Technologies, Inc. |
19,694 |
1,171,596 |
|
|
Olin Corp. |
45,304 |
1,273,042 |
|
|
OM Group, Inc. |
17,934 |
525,287 |
|
|
OMNOVA Solutions, Inc. (a) |
26,431 |
241,051 |
|
|
Penford Corp. (a) |
5,329 |
67,145 |
|
|
PolyOne Corp. |
55,438 |
2,077,262 |
|
|
Quaker Chemical Corp. |
7,356 |
547,507 |
|
|
Sensient Technologies Corp. |
28,202 |
1,524,318 |
|
|
Stepan Co. |
10,573 |
611,437 |
|
|
Taminco Corp. |
9,242 |
185,672 |
|
|
Tredegar Corp. |
13,592 |
282,850 |
|
|
Zep, Inc. |
12,689 |
219,393 |
|
|
|
21,289,443 |
||
|
Construction Materials - 0.2% |
|||
|
Headwaters, Inc. (a) |
40,902 |
510,457 |
|
|
Texas Industries, Inc. (a) |
12,303 |
1,066,670 |
|
|
U.S. Concrete, Inc. (a) |
8,227 |
202,549 |
|
|
United States Lime & Minerals, Inc. |
1,211 |
65,467 |
|
|
|
1,845,143 |
||
|
Containers & Packaging - 0.3% |
|||
|
AEP Industries, Inc. (a) |
2,664 |
94,892 |
|
|
Berry Plastics Group, Inc. (a) |
31,473 |
707,828 |
|
|
Graphic Packaging Holding Co. (a) |
110,387 |
1,132,571 |
|
|
Myers Industries, Inc. |
15,985 |
298,920 |
|
|
UFP Technologies, Inc. (a) |
3,123 |
79,199 |
|
|
|
2,313,410 |
||
|
Metals & Mining - 1.4% |
|||
|
A.M. Castle & Co. (a)(d) |
9,827 |
120,676 |
|
|
AK Steel Holding Corp. (a)(d) |
76,113 |
532,791 |
|
|
Allied Nevada Gold Corp. (a)(d) |
56,849 |
192,718 |
|
|
Amcol International Corp. |
15,689 |
719,341 |
|
|
Century Aluminum Co. (a)(d) |
28,751 |
395,326 |
|
|
Coeur d'Alene Mines Corp. (a) |
57,086 |
494,365 |
|
|
Commercial Metals Co. |
65,685 |
1,261,152 |
|
|
General Moly, Inc. (a)(d) |
27,264 |
29,990 |
|
|
Globe Specialty Metals, Inc. |
36,559 |
708,513 |
|
|
Common Stocks - continued |
|||
|
Shares |
Value |
||
|
MATERIALS - continued |
|||
|
Metals & Mining - continued |
|||
|
Gold Resource Corp. |
18,888 |
$ 87,074 |
|
|
Handy & Harman Ltd. (a) |
2,980 |
67,378 |
|
|
Haynes International, Inc. |
7,115 |
377,451 |
|
|
Hecla Mining Co. (d) |
186,892 |
573,758 |
|
|
Horsehead Holding Corp. (a)(d) |
28,211 |
439,809 |
|
|
Kaiser Aluminum Corp. |
10,724 |
754,970 |
|
|
Materion Corp. |
11,858 |
399,022 |
|
|
Midway Gold Corp. (a)(d) |
67,274 |
61,522 |
|
|
Molycorp, Inc. (a)(d) |
83,308 |
395,713 |
|
|
Noranda Aluminium Holding Corp. |
20,161 |
71,572 |
|
|
Olympic Steel, Inc. |
5,209 |
137,309 |
|
|
Paramount Gold & Silver Corp. (a)(d) |
73,166 |
73,898 |
|
|
RTI International Metals, Inc. (a)(d) |
17,948 |
505,416 |
|
|
Schnitzer Steel Industries, Inc. Class A (d) |
14,278 |
400,783 |
|
|
Stillwater Mining Co. (a)(d) |
66,612 |
1,051,137 |
|
|
SunCoke Energy, Inc. (a) |
39,377 |
821,798 |
|
|
U.S. Silica Holdings, Inc. |
11,965 |
540,459 |
|
|
Universal Stainless & Alloy Products, Inc. (a) |
3,943 |
141,514 |
|
|
Walter Energy, Inc. (d) |
35,936 |
258,739 |
|
|
Worthington Industries, Inc. |
30,012 |
1,104,442 |
|
|
|
12,718,636 |
||
|
Paper & Forest Products - 0.7% |
|||
|
Boise Cascade Co. (a) |
6,767 |
169,310 |
|
|
Clearwater Paper Corp. (a) |
11,827 |
726,060 |
|
|
Deltic Timber Corp. |
6,201 |
376,711 |
|
|
Kapstone Paper & Packaging Corp. (a) |
46,304 |
1,221,500 |
|
|
Louisiana-Pacific Corp. (a)(d) |
79,146 |
1,297,203 |
|
|
Neenah Paper, Inc. |
9,056 |
456,151 |
|
|
P.H. Glatfelter Co. |
24,074 |
614,368 |
|
|
Resolute Forest Products (a) |
39,284 |
700,827 |
|
|
Schweitzer-Mauduit International, Inc. |
17,594 |
767,802 |
|
|
Wausau-Mosinee Paper Corp. |
28,474 |
340,549 |
|
|
|
6,670,481 |
||
|
TOTAL MATERIALS |
44,837,113 |
||
|
TELECOMMUNICATION SERVICES - 0.7% |
|||
|
Diversified Telecommunication Services - 0.6% |
|||
|
8x8, Inc. (a)(d) |
49,021 |
475,504 |
|
|
Atlantic Tele-Network, Inc. |
5,405 |
319,814 |
|
|
Common Stocks - continued |
|||
|
Shares |
Value |
||
|
TELECOMMUNICATION SERVICES - continued |
|||
|
Diversified Telecommunication Services - continued |
|||
|
Cbeyond, Inc. (a) |
15,094 |
$ 149,280 |
|
|
Cincinnati Bell, Inc. (a) |
119,079 |
398,915 |
|
|
Cogent Communications Group, Inc. |
26,451 |
911,766 |
|
|
Consolidated Communications Holdings, Inc. |
22,655 |
451,288 |
|
|
FairPoint Communications, Inc. (a) |
12,515 |
170,705 |
|
|
General Communications, Inc. Class A (a) |
17,701 |
184,798 |
|
|
Hawaiian Telcom Holdco, Inc. (a)(d) |
5,841 |
155,487 |
|
|
HickoryTech Corp. |
7,160 |
84,989 |
|
|
IDT Corp. Class B |
8,133 |
128,827 |
|
|
inContact, Inc. (a)(d) |
29,634 |
244,481 |
|
|
Inteliquent, Inc. |
17,875 |
243,815 |
|
|
Iridium Communications, Inc. (a)(d) |
36,728 |
244,976 |
|
|
Lumos Networks Corp. |
8,610 |
113,738 |
|
|
ORBCOMM, Inc. (a) |
23,098 |
144,824 |
|
|
Premiere Global Services, Inc. (a) |
26,679 |
339,357 |
|
|
Straight Path Communications, Inc. Class B (a) |
3,271 |
22,897 |
|
|
Towerstream Corp. (a)(d) |
35,146 |
65,020 |
|
|
VocalTec Communications Ltd. (a)(d) |
10,503 |
185,693 |
|
|
Vonage Holdings Corp. (a) |
89,110 |
342,182 |
|
|
|
5,378,356 |
||
|
Wireless Telecommunication Services - 0.1% |
|||
|
Boingo Wireless, Inc. (a) |
11,471 |
75,709 |
|
|
Leap Wireless International, Inc. rights |
29,000 |
73,080 |
|
|
NII Holdings, Inc. (a)(d) |
97,129 |
83,521 |
|
|
NTELOS Holdings Corp. (d) |
8,669 |
119,546 |
|
|
RingCentral, Inc. (d) |
4,846 |
73,465 |
|
|
Shenandoah Telecommunications Co. |
13,670 |
383,170 |
|
|
U.S.A. Mobility, Inc. |
12,798 |
219,230 |
|
|
|
1,027,721 |
||
|
TOTAL TELECOMMUNICATION SERVICES |
6,406,077 |
||
|
UTILITIES - 3.3% |
|||
|
Electric Utilities - 1.5% |
|||
|
Allete, Inc. |
23,908 |
1,237,478 |
|
|
Cleco Corp. |
33,787 |
1,775,507 |
|
|
El Paso Electric Co. |
22,974 |
868,877 |
|
|
Empire District Electric Co. |
24,596 |
598,175 |
|
|
Genie Energy Ltd. Class B (a) |
7,450 |
60,345 |
|
|
IDACORP, Inc. |
28,264 |
1,586,741 |
|
|
Common Stocks - continued |
|||
|
Shares |
Value |
||
|
UTILITIES - continued |
|||
|
Electric Utilities - continued |
|||
|
MGE Energy, Inc. |
19,397 |
$ 741,353 |
|
|
NRG Yield, Inc. Class A (d) |
12,534 |
536,957 |
|
|
Otter Tail Corp. |
20,946 |
613,718 |
|
|
PNM Resources, Inc. |
45,118 |
1,248,866 |
|
|
Portland General Electric Co. |
42,797 |
1,432,416 |
|
|
UIL Holdings Corp. |
31,798 |
1,167,941 |
|
|
Unitil Corp. |
7,982 |
265,002 |
|
|
UNS Energy Corp. |
23,200 |
1,393,392 |
|
|
|
13,526,768 |
||
|
Gas Utilities - 0.9% |
|||
|
Chesapeake Utilities Corp. |
5,667 |
358,494 |
|
|
Delta Natural Gas Co., Inc. |
3,938 |
75,098 |
|
|
Laclede Group, Inc. |
18,343 |
869,642 |
|
|
New Jersey Resources Corp. |
23,676 |
1,177,407 |
|
|
Northwest Natural Gas Co. |
15,250 |
675,118 |
|
|
Piedmont Natural Gas Co., Inc. (d) |
42,327 |
1,514,883 |
|
|
South Jersey Industries, Inc. |
18,211 |
1,046,222 |
|
|
Southwest Gas Corp. |
26,181 |
1,440,217 |
|
|
WGL Holdings, Inc. |
29,240 |
1,163,460 |
|
|
|
8,320,541 |
||
|
Independent Power and Renewabl - 0.1% |
|||
|
Ormat Technologies, Inc. |
9,703 |
258,876 |
|
|
Pattern Energy Group, Inc. |
10,117 |
271,136 |
|
|
|
530,012 |
||
|
Independent Power Producers & Energy Traders - 0.4% |
|||
|
Atlantic Power Corp. (d) |
65,847 |
196,451 |
|
|
Black Hills Corp. |
25,158 |
1,452,875 |
|
|
Dynegy, Inc. (a)(d) |
56,428 |
1,605,377 |
|
|
|
3,254,703 |
||
|
Multi-Utilities - 0.2% |
|||
|
Avista Corp. |
33,608 |
1,080,497 |
|
|
NorthWestern Energy Corp. |
21,132 |
1,022,366 |
|
|
|
2,102,863 |
||
|
Water Utilities - 0.2% |
|||
|
American States Water Co. |
21,645 |
657,142 |
|
|
Artesian Resources Corp. Class A |
3,895 |
85,768 |
|
|
California Water Service Group |
27,742 |
624,195 |
|
|
Connecticut Water Service, Inc. |
6,097 |
198,153 |
|
|
Consolidated Water Co., Inc. |
7,709 |
89,579 |
|
|
Common Stocks - continued |
|||
|
Shares |
Value |
||
|
UTILITIES - continued |
|||
|
Water Utilities - continued |
|||
|
Middlesex Water Co. |
9,145 |
$ 185,918 |
|
|
Pure Cycle Corp. (a) |
9,178 |
51,489 |
|
|
SJW Corp. |
8,826 |
240,332 |
|
|
York Water Co. |
6,609 |
132,246 |
|
|
|
2,264,822 |
||
|
TOTAL UTILITIES |
29,999,709 |
||
|
TOTAL COMMON STOCKS (Cost $837,655,989) |
|
||
|
U.S. Treasury Obligations - 0.0% |
||||
|
|
Principal Amount |
|
||
|
U.S. Treasury Bills, yield at date of purchase 0.09% 7/24/14 (e) |
|
$ 200,000 |
|
|
|
Money Market Funds - 25.2% |
|||
|
Shares |
|
||
|
Fidelity Cash Central Fund, 0.11% (b) |
14,765,102 |
14,765,102 |
|
|
Fidelity Securities Lending Cash Central Fund, 0.10% (b)(c) |
216,753,425 |
216,753,425 |
|
|
TOTAL MONEY MARKET FUNDS (Cost $231,518,527) |
|
||
|
TOTAL INVESTMENT PORTFOLIO - 124.5% (Cost $1,069,374,476) |
1,146,103,440 |
||
|
NET OTHER ASSETS (LIABILITIES) - (24.5)% |
(225,633,910) |
||
|
NET ASSETS - 100% |
$ 920,469,530 |
||
|
Futures Contracts |
|||||
|
|
Expiration Date |
Underlying Face Amount at Value |
Unrealized Appreciation/ |
||
|
Purchased |
|||||
|
Equity Index Contracts |
|||||
|
60 ICE Russell 2000 Index Contracts (United States) |
June 2014 |
$ 6,741,600 |
$ 22,907 |
||
|
|
|
The face value of futures purchased as a percentage of net assets is 0.7% |
|
Legend |
|
(a) Non-income producing |
|
(b) Affiliated fund that is generally available only to investment companies and other accounts managed by Fidelity Investments. The rate quoted is the annualized seven-day yield of the fund at period end. A complete unaudited listing of the fund's holdings as of its most recent quarter end is available upon request. In addition, each Fidelity Central Fund's financial statements, which are not covered by the Fund's Report of Independent Registered Public Accounting Firm, are available on the SEC's website or upon request. |
|
(c) Investment made with cash collateral received from securities on loan. |
|
(d) Security or a portion of the security is on loan at period end. |
|
(e) Security or a portion of the security was pledged to cover margin requirements for futures contracts. At period end, the value of securities pledged amounted to $199,993. |
|
Affiliated Central Funds |
|
Information regarding fiscal year to date income earned by the Fund from investments in Fidelity Central Funds is as follows: |
|
Fund |
Income earned |
|
Fidelity Cash Central Fund |
$ 10,890 |
|
Fidelity Securities Lending Cash Central Fund |
1,127,689 |
|
Total |
$ 1,138,579 |
|
Other Information |
|
The following is a summary of the inputs used, as of April 30, 2014, involving the Fund's assets and liabilities carried at fair value. The inputs or methodology used for valuing securities may not be an indication of the risk associated with investing in those securities. For more information on valuation inputs, and their aggregation into the levels used in the table below, please refer to the Investment Valuation section in the accompanying Notes to Financial Statements. |
|
Valuation Inputs at Reporting Date: |
||||
|
Description |
Total |
Level 1 |
Level 2 |
Level 3 |
|
Investments in Securities: |
||||
|
Equities: |
||||
|
Consumer Discretionary |
$ 118,347,373 |
$ 118,347,373 |
$ - |
$ - |
|
Consumer Staples |
34,974,454 |
34,974,454 |
- |
- |
|
Energy |
55,550,363 |
55,547,689 |
- |
2,674 |
|
Financials |
215,225,381 |
215,225,381 |
- |
- |
|
Health Care |
117,692,914 |
117,692,914 |
- |
- |
|
Industrials |
133,711,581 |
133,711,581 |
- |
- |
|
Information Technology |
157,639,955 |
157,639,955 |
- |
- |
|
Materials |
44,837,113 |
44,837,113 |
- |
- |
|
Telecommunication Services |
6,406,077 |
6,332,997 |
- |
73,080 |
|
Utilities |
29,999,709 |
29,999,709 |
- |
- |
|
U.S. Government and Government Agency Obligations |
199,993 |
- |
199,993 |
- |
|
Money Market Funds |
231,518,527 |
231,518,527 |
- |
- |
|
Total Investments in Securities: |
$ 1,146,103,440 |
$ 1,145,827,693 |
$ 199,993 |
$ 75,754 |
|
Derivative Instruments: |
||||
|
Assets |
||||
|
Futures Contracts |
$ 22,907 |
$ 22,907 |
$ - |
$ - |
|
Value of Derivative Instruments |
|
The following table is a summary of the Fund's value of derivative instruments by primary risk exposure as of April 30, 2014. For additional information on derivative instruments, please refer to the Derivative Instruments section in the accompanying Notes to Financial Statements. |
|
Primary Risk Exposure / |
Value |
|
|
|
Asset |
Liability |
|
Equity Risk |
||
|
Futures Contracts (a) |
$ 22,907 |
$ - |
|
Total Value of Derivatives |
$ 22,907 |
$ - |
|
(a) Reflects gross cumulative appreciation (depreciation) on futures contracts as presented in the Schedule of Investments. Only the period end receivable or payable for daily variation margin and net unrealized appreciation (depreciation) are presented in the Statement of Assets and Liabilities. |
See accompanying notes which are an integral part of the financial statements.
Annual Report
Spartan Small Cap Index Fund
Financial Statements
Statement of Assets and Liabilities
|
|
April 30, 2014 |
|
|
|
|
|
|
Assets |
|
|
|
Investment in securities, at value (including securities loaned of $211,467,006) - See accompanying schedule: Unaffiliated issuers (cost $837,855,949) |
$ 914,584,913 |
|
|
Fidelity Central Funds (cost $231,518,527) |
231,518,527 |
|
|
Total Investments (cost $1,069,374,476) |
|
$ 1,146,103,440 |
|
Segregated cash with brokers for derivative instruments |
|
554,609 |
|
Receivable for investments sold |
|
565,333 |
|
Receivable for fund shares sold |
|
1,516,665 |
|
Dividends receivable |
|
364,361 |
|
Distributions receivable from Fidelity Central Funds |
|
153,644 |
|
Receivable for daily variation margin for derivative instruments |
|
111,420 |
|
Receivable from investment adviser for expense reductions |
|
99,254 |
|
Other receivables |
|
2,481 |
|
Total assets |
|
1,149,471,207 |
|
|
|
|
|
Liabilities |
|
|
|
Payable for investments purchased |
$ 10,066,175 |
|
|
Payable for fund shares redeemed |
2,015,727 |
|
|
Accrued management fee |
115,840 |
|
|
Other affiliated payables |
50,510 |
|
|
Collateral on securities loaned, at value |
216,753,425 |
|
|
Total liabilities |
|
229,001,677 |
|
|
|
|
|
Net Assets |
|
$ 920,469,530 |
|
Net Assets consist of: |
|
|
|
Paid in capital |
|
$ 836,418,711 |
|
Undistributed net investment income |
|
3,307,629 |
|
Accumulated undistributed net realized gain (loss) on investments and foreign currency transactions |
|
3,991,309 |
|
Net unrealized appreciation (depreciation) on investments and assets and liabilities in foreign currencies |
|
76,751,881 |
|
Net Assets |
|
$ 920,469,530 |
See accompanying notes which are an integral part of the financial statements.
Annual Report
Spartan Small Cap Index Fund
Financial Statements - continued
Statement of Assets and Liabilities - continued
|
|
April 30, 2014 |
|
|
|
|
|
|
Investor Class: |
|
$ 16.06 |
|
|
|
|
|
Fidelity Advantage Class: |
|
$ 16.08 |
|
|
|
|
|
Institutional Class: |
|
$ 16.09 |
|
|
|
|
|
Fidelity Advantage Institutional Class: |
|
$ 16.09 |
See accompanying notes which are an integral part of the financial statements.
Annual Report
Statement of Operations
|
|
Year ended April 30, 2014 |
|
|
|
|
|
|
Investment Income |
|
|
|
Dividends |
|
$ 7,314,195 |
|
Interest |
|
503 |
|
Income from Fidelity Central Funds (including $1,127,689 from security lending) |
|
1,138,579 |
|
Total income |
|
8,453,277 |
|
|
|
|
|
Expenses |
|
|
|
Management fee |
$ 902,157 |
|
|
Transfer agent fees |
411,582 |
|
|
Independent trustees' compensation |
2,076 |
|
|
Miscellaneous |
980 |
|
|
Total expenses before reductions |
1,316,795 |
|
|
Expense reductions |
(788,122) |
528,673 |
|
Net investment income (loss) |
|
7,924,604 |
|
Realized and Unrealized Gain (Loss) Net realized gain (loss) on: |
|
|
|
Investment securities: |
|
|
|
Unaffiliated issuers |
9,035,377 |
|
|
Foreign currency transactions |
(1,167) |
|
|
Futures contracts |
902,444 |
|
|
Total net realized gain (loss) |
|
9,936,654 |
|
Change in net unrealized appreciation (depreciation) on: Investment securities |
54,132,937 |
|
|
Assets and liabilities in foreign currencies |
(4) |
|
|
Futures contracts |
(37,971) |
|
|
Total change in net unrealized appreciation (depreciation) |
|
54,094,962 |
|
Net gain (loss) |
|
64,031,616 |
|
Net increase (decrease) in net assets resulting from operations |
|
$ 71,956,220 |
See accompanying notes which are an integral part of the financial statements.
Annual Report
Spartan Small Cap Index Fund
Financial Statements - continued
Statement of Changes in Net Assets
|
|
Year ended |
Year ended |
|
Increase (Decrease) in Net Assets |
|
|
|
Operations |
|
|
|
Net investment income (loss) |
$ 7,924,604 |
$ 1,787,862 |
|
Net realized gain (loss) |
9,936,654 |
1,165,380 |
|
Change in net unrealized appreciation (depreciation) |
54,094,962 |
20,097,144 |
|
Net increase (decrease) in net assets resulting |
71,956,220 |
23,050,386 |
|
Distributions to shareholders from net investment income |
(4,986,490) |
(1,161,877) |
|
Distributions to shareholders from net realized gain |
(6,296,385) |
(472,451) |
|
Total distributions |
(11,282,875) |
(1,634,328) |
|
Share transactions - net increase (decrease) |
623,676,829 |
177,215,771 |
|
Redemption fees |
287,609 |
85,469 |
|
Total increase (decrease) in net assets |
684,637,783 |
198,717,298 |
|
|
|
|
|
Net Assets |
|
|
|
Beginning of period |
235,831,747 |
37,114,449 |
|
End of period (including undistributed net investment income of $3,307,629 and undistributed net investment income of $701,142, respectively) |
$ 920,469,530 |
$ 235,831,747 |
See accompanying notes which are an integral part of the financial statements.
Annual Report
Financial Highlights - Investor Class
|
Years ended April 30, |
2014 |
2013 |
2012 G |
|
Selected Per-Share Data |
|
|
|
|
Net asset value, beginning of period |
$ 13.59 |
$ 11.78 |
$ 10.00 |
|
Income from Investment Operations |
|
|
|
|
Net investment income (loss) D |
.19 |
.18 |
.09 |
|
Net realized and unrealized gain (loss) |
2.56 |
1.85 |
1.73 |
|
Total from investment operations |
2.75 |
2.03 |
1.82 |
|
Distributions from net investment income |
(.12) |
(.14) |
(.04) |
|
Distributions from net realized gain |
(.18) |
(.08) |
- |
|
Total distributions |
(.29) J |
(.23) K |
(.04) |
|
Redemption fees added to paid in capital D |
.01 |
.01 |
- I |
|
Net asset value, end of period |
$ 16.06 |
$ 13.59 |
$ 11.78 |
|
Total Return B, C |
20.46% |
17.63% |
18.27% |
|
Ratios to Average Net Assets E, H |
|
|
|
|
Expenses before reductions |
.36% |
.36% |
.36% A |
|
Expenses net of fee waivers, if any |
.23% |
.29% |
.31% A |
|
Expenses net of all reductions |
.23% |
.29% |
.31% A |
|
Net investment income (loss) |
1.18% |
1.54% |
1.20% A |
|
Supplemental Data |
|
|
|
|
Net assets, end of period (000 omitted) |
$ 21,013 |
$ 8,079 |
$ 12,116 |
|
Portfolio turnover rate F |
9% |
11% |
7% A |
A Annualized
B Total returns for periods of less than one year are not annualized.
C Total returns would have been lower if certain expenses had not been reduced during the applicable periods shown.
D Calculated based on average shares outstanding during the period.
E Fees and expenses of any underlying Fidelity Central Funds are not included in the Fund's expense ratio. The Fund indirectly bears its proportionate share of the expenses of any underlying Fidelity Central Funds.
F Amount does not include the portfolio activity of any underlying Fidelity Central Funds.
G For the period September 8, 2011 (commencement of operations) to April 30, 2012.
H Expense ratios reflect operating expenses of the class. Expenses before reductions do not reflect amounts reimbursed by the investment adviser or reductions from expense offset arrangements and do not represent the amount paid by the class during periods when reimbursements or reductions occur. Expenses net of fee waivers reflect expenses after reimbursement by the investment adviser but prior to reductions from expense offset arrangements. Expenses net of all reductions represent the net expenses paid by the class.
I Amount represents less than $.01 per share.
J Total distributions of $.29 per share is comprised of distributions from net investment income of $.116 and distributions from net realized gain of $.178 per share.
K Total distributions of $.23 per share is comprised of distributions from net investment income of $.141 and distributions from net realized gain of $.084 per share.
See accompanying notes which are an integral part of the financial statements.
Annual Report
Financial Highlights - Fidelity Advantage Class
|
Years ended April 30, |
2014 |
2013 |
2012 G |
|
Selected Per-Share Data |
|
|
|
|
Net asset value, beginning of period |
$ 13.61 |
$ 11.79 |
$ 10.00 |
|
Income from Investment Operations |
|
|
|
|
Net investment income (loss) D |
.21 |
.21 |
.10 |
|
Net realized and unrealized gain (loss) |
2.57 |
1.84 |
1.73 |
|
Total from investment operations |
2.78 |
2.05 |
1.83 |
|
Distributions from net investment income |
(.14) |
(.15) |
(.04) |
|
Distributions from net realized gain |
(.18) |
(.08) |
- |
|
Total distributions |
(.32) |
(.24) J |
(.04) |
|
Redemption fees added to paid in capital D |
.01 |
.01 |
- I |
|
Net asset value, end of period |
$ 16.08 |
$ 13.61 |
$ 11.79 |
|
Total Return B, C |
20.61% |
17.81% |
18.38% |
|
Ratios to Average Net Assets E, H |
|
|
|
|
Expenses before reductions |
.23% |
.23% |
.23% A |
|
Expenses net of fee waivers, if any |
.09% |
.12% |
.17% A |
|
Expenses net of all reductions |
.09% |
.12% |
.17% A |
|
Net investment income (loss) |
1.32% |
1.71% |
1.34% A |
|
Supplemental Data |
|
|
|
|
Net assets, end of period (000 omitted) |
$ 632,741 |
$ 197,995 |
$ 23,851 |
|
Portfolio turnover rate F |
9% |
11% |
7% A |
A Annualized
B Total returns for periods of less than one year are not annualized.
C Total returns would have been lower if certain expenses had not been reduced during the applicable periods shown.
D Calculated based on average shares outstanding during the period.
E Fees and expenses of any underlying Fidelity Central Funds are not included in the Fund's expense ratio. The Fund indirectly bears its proportionate share of the expenses of any underlying Fidelity Central Funds.
F Amount does not include the portfolio activity of any underlying Fidelity Central Funds.
G For the period September 8, 2011 (commencement of operations) to April 30, 2012.
H Expense ratios reflect operating expenses of the class. Expenses before reductions do not reflect amounts reimbursed by the investment adviser or reductions from expense offset arrangements and do not represent the amount paid by the class during periods when reimbursements or reductions occur. Expenses net of fee waivers reflect expenses after reimbursement by the investment adviser but prior to reductions from expense offset arrangements. Expenses net of all reductions represent the net expenses paid by the class.
I Amount represents less than $.01 per share.
J Total distributions of $.24 per share is comprised of distributions from net investment income of $.151 and distributions from net realized gain of $.084 per share.
See accompanying notes which are an integral part of the financial statements.
Annual Report
Financial Highlights - Institutional Class
|
Years ended April 30, |
2014 |
2013 |
2012 G |
|
Selected Per-Share Data |
|
|
|
|
Net asset value, beginning of period |
$ 13.61 |
$ 11.80 |
$ 10.00 |
|
Income from Investment Operations |
|
|
|
|
Net investment income (loss) D |
.21 |
.22 |
.10 |
|
Net realized and unrealized gain (loss) |
2.58 |
1.82 |
1.74 |
|
Total from investment operations |
2.79 |
2.04 |
1.84 |
|
Distributions from net investment income |
(.14) |
(.15) |
(.04) |
|
Distributions from net realized gain |
(.18) |
(.08) |
- |
|
Total distributions |
(.32) |
(.24) J |
(.04) |
|
Redemption fees added to paid in capital D |
.01 |
.01 |
- I |
|
Net asset value, end of period |
$ 16.09 |
$ 13.61 |
$ 11.80 |
|
Total Return B, C |
20.71% |
17.74% |
18.49% |
|
Ratios to Average Net Assets E, H |
|
|
|
|
Expenses before reductions |
.17% |
.17% |
.17% A |
|
Expenses net of fee waivers, if any |
.07% |
.10% |
.13% A |
|
Expenses net of all reductions |
.07% |
.10% |
.13% A |
|
Net investment income (loss) |
1.34% |
1.73% |
1.38% A |
|
Supplemental Data |
|
|
|
|
Net assets, end of period (000 omitted) |
$ 263,061 |
$ 27,675 |
$ 574 |
|
Portfolio turnover rate F |
9% |
11% |
7% A |
A Annualized
B Total returns for periods of less than one year are not annualized.
C Total returns would have been lower if certain expenses had not been reduced during the applicable periods shown.
D Calculated based on average shares outstanding during the period.
E Fees and expenses of any underlying Fidelity Central Funds are not included in the Fund's expense ratio. The Fund indirectly bears its proportionate share of the expenses of any underlying Fidelity Central Funds.
F Amount does not include the portfolio activity of any underlying Fidelity Central Funds.
G For the period September 8, 2011 (commencement of operations) to April 30, 2012.
H Expense ratios reflect operating expenses of the class. Expenses before reductions do not reflect amounts reimbursed by the investment adviser or reductions from expense offset arrangements and do not represent the amount paid by the class during periods when reimbursements or reductions occur. Expenses net of fee waivers reflect expenses after reimbursement by the investment adviser but prior to reductions from expense offset arrangements. Expenses net of all reductions represent the net expenses paid by the class.
I Amount represents less than $.01 per share.
J Total distributions of $.24 per share is comprised of distributions from net investment income of $.155 and distributions from net realized gain of $.084 per share.
See accompanying notes which are an integral part of the financial statements.
Annual Report
Financial Highlights - Fidelity Advantage Institutional Class
|
Years ended April 30, |
2014 |
2013 |
2012 G |
|
Selected Per-Share Data |
|
|
|
|
Net asset value, beginning of period |
$ 13.61 |
$ 11.80 |
$ 10.00 |
|
Income from Investment Operations |
|
|
|
|
Net investment income (loss) D |
.21 |
.23 |
.10 |
|
Net realized and unrealized gain (loss) |
2.58 |
1.81 |
1.75 |
|
Total from investment operations |
2.79 |
2.04 |
1.85 |
|
Distributions from net investment income |
(.14) |
(.16) |
(.05) |
|
Distributions from net realized gain |
(.18) |
(.08) |
- |
|
Total distributions |
(.32) |
(.24) |
(.05) |
|
Redemption fees added to paid in capital D |
.01 |
.01 |
- I |
|
Net asset value, end of period |
$ 16.09 |
$ 13.61 |
$ 11.80 |
|
Total Return B, C |
20.73% |
17.77% |
18.50% |
|
Ratios to Average Net Assets E, H |
|
|
|
|
Expenses before reductions |
.15% |
.15% |
.15% A |
|
Expenses net of fee waivers, if any |
.05% |
.06% |
.11% A |
|
Expenses net of all reductions |
.05% |
.06% |
.11% A |
|
Net investment income (loss) |
1.36% |
1.77% |
1.40% A |
|
Supplemental Data |
|
|
|
|
Net assets, end of period (000 omitted) |
$ 3,654 |
$ 2,082 |
$ 574 |
|
Portfolio turnover rate F |
9% |
11% |
7% A |
A Annualized
B Total returns for periods of less than one year are not annualized.
C Total returns would have been lower if certain expenses had not been reduced during the applicable periods shown.
D Calculated based on average shares outstanding during the period.
E Fees and expenses of any underlying Fidelity Central Funds are not included in the Fund's expense ratio. The Fund indirectly bears its proportionate share of the expenses of any underlying Fidelity Central Funds.
F Amount does not include the portfolio activity of any underlying Fidelity Central Funds.
G For the period September 8, 2011 (commencement of operations) to April 30, 2012.
H Expense ratios reflect operating expenses of the class. Expenses before reductions do not reflect amounts reimbursed by the investment adviser or reductions from expense offset arrangements and do not represent the amount paid by the class during periods when reimbursements or reductions occur. Expenses net of fee waivers reflect expenses after reimbursement by the investment adviser but prior to reductions from expense offset arrangements. Expenses net of all reductions represent the net expenses paid by the class.
I Amount represents less than $.01 per share.
See accompanying notes which are an integral part of the financial statements.
Annual Report
Notes to Financial Statements
For the period ended April 30, 2014
1. Organization.
Spartan Mid Cap Index Fund and Spartan Small Cap Index Fund (the Funds) are funds of Fidelity Salem Street Trust (the Trust) and are authorized to issue an unlimited number of shares. The Trust is registered under the Investment Company Act of 1940, as amended (the 1940 Act), as an open-end management investment company organized as a Massachusetts business trust. Each Fund offers Investor Class, Fidelity Advantage Class, Institutional Class and Fidelity Advantage Institutional Class shares, each of which has equal rights as to assets and voting privileges. Each class has exclusive voting rights with respect to matters that affect that class. Each Fund offers conversion privileges between share classes within each Fund to eligible shareholders.
2. Investments in Fidelity Central Funds.
The Funds invest in Fidelity Central Funds, which are open-end investment companies generally available only to other investment companies and accounts managed by the investment adviser and its affiliates. The Funds' Schedules of Investments list each of the Fidelity Central Funds held as of period end, if any, as an investment of each Fund, but do not include the underlying holdings of each Fidelity Central Fund. As an Investing Fund, each Fund indirectly bears its proportionate share of the expenses of the underlying Fidelity Central Funds.
The Money Market Central Funds seek preservation of capital and current income and are managed by Fidelity Investments Money Management, Inc. (FIMM), an affiliate of the investment adviser. Annualized expenses of the Money Market Central Funds as of their most recent shareholder report date are less than .01%.
A complete unaudited list of holdings for each Fidelity Central Fund is available upon request or at the Securities and Exchange Commission (the SEC) website at www.sec.gov. In addition, the financial statements of the Fidelity Central Funds, which are not covered by the Funds' Report of Independent Registered Public Accounting Firm, are available on the SEC website or upon request.
3. Significant Accounting Policies.
The financial statements have been prepared in conformity with accounting principles generally accepted in the United States of America (GAAP), which require management to make certain estimates and assumptions at the date of the financial statements. Actual results could differ from those estimates. Subsequent events, if any, through the date that the financial statements were issued have been evaluated in the preparation of
Annual Report
3. Significant Accounting Policies - continued
the financial statements. The following summarizes the significant accounting policies of the Funds:
Investment Valuation. Investments are valued as of 4:00 p.m. Eastern time on the last calendar day of the period. In accordance with valuation policies and procedures approved by the Board of Trustees (the Board), each Fund attempts to obtain prices from one or more third party pricing vendors or brokers to value its investments. When current market prices, quotations or currency exchange rates are not readily available or reliable, investments will be fair valued in good faith by the Fidelity Management & Research Company (FMR) Fair Value Committee (the Committee), in accordance with procedures adopted by the Board. Factors used in determining fair value vary by investment type and may include market or investment specific events, changes in interest rates and credit quality. The frequency with which these procedures are used cannot be predicted and they may be utilized to a significant extent. The Committee oversees each Fund's valuation policies and procedures and is responsible for approving and reporting to the Board all fair value determinations.
Each Fund categorizes the inputs to valuation techniques used to value its investments into a disclosure hierarchy consisting of three levels as shown below:
Level 1 - quoted prices in active markets for identical investments
Level 2 - other significant observable inputs (including quoted prices for similar investments, interest rates, prepayment speeds, etc.)
Level 3 - unobservable inputs (including the Fund's own assumptions based on the best information available)
Valuation techniques used to value each Fund's investments by major category are as follows:
Equity securities, including restricted securities, for which market quotations are readily available, are valued at the last reported sale price or official closing price as reported by a third party pricing vendor on the primary market or exchange on which they are traded and are categorized as Level 1 in the hierarchy. In the event there were no sales during the day or closing prices are not available, securities are valued at the last quoted bid price or may be valued using the last available price and are generally categorized as Level 2 in the hierarchy. For foreign equity securities, when market or security specific events arise, comparisons to the valuation of American Depositary Receipts (ADRs), futures contracts, Exchange-Traded Funds (ETFs) and certain indexes as well as quoted prices for similar securities may be used and would be categorized as Level 2 in the hierarchy. Utilizing these techniques may result in transfers between Level 1 and Level 2. For equity securities, including restricted securities, where observable inputs are limited, assumptions about market activity and risk are used and these securities may be categorized as Level 3 in the hierarchy.
Annual Report
Notes to Financial Statements - continued
3. Significant Accounting Policies - continued
Investment Valuation - continued
Debt securities, including restricted securities, are valued based on evaluated prices received from third party pricing vendors or from brokers who make markets in such securities. U.S. government and government agency obligations are valued by pricing vendors who utilize matrix pricing which considers yield or price of bonds of comparable quality, coupon, maturity and type or by broker-supplied prices. When independent prices are unavailable or unreliable, debt securities may be valued utilizing pricing methodologies which consider similar factors that would be used by third party pricing vendors. Debt securities are generally categorized as Level 2 in the hierarchy but may be Level 3 depending on the circumstances.
Futures contracts are valued at the settlement price established each day by the board of trade or exchange on which they are traded and are categorized as Level 1 in the hierarchy. Investments in open-end mutual funds, including the Fidelity Central Funds, are valued at their closing net asset value (NAV) each business day and are categorized as Level 1 in the hierarchy.
Changes in valuation techniques may result in transfers in or out of an assigned level within the disclosure hierarchy. The aggregate value of investments by input level, as of April 30, 2014 is included at the end of each Fund's Schedule of Investments.
Foreign Currency. The Funds may use foreign currency contracts to facilitate transactions in foreign-denominated securities. Gains and losses from these transactions may arise from changes in the value of the foreign currency or if the counterparties do not perform under the contracts' terms.
Foreign-denominated assets, including investment securities, and liabilities are translated into U.S. dollars at the exchange rates at period end. Purchases and sales of investment securities, income and dividends received and expenses denominated in foreign currencies are translated into U.S. dollars at the exchange rate in effect on the transaction date.
The effects of exchange rate fluctuations on investments are included with the net realized and unrealized gain (loss) on investment securities. Other foreign currency transactions resulting in realized and unrealized gain (loss) are disclosed separately.
Investment Transactions and Income. For financial reporting purposes, the Funds' investment holdings and NAV include trades executed through the end of the last business day of the period. The NAV per share for processing shareholder transactions is calculated as of the close of business of the New York Stock Exchange (NYSE), normally 4:00 p.m. Eastern time and includes trades executed through the end of the prior business day. Gains and losses on securities sold are determined on the basis of identified
Annual Report
3. Significant Accounting Policies - continued
Investment Transactions and Income - continued
cost and may include proceeds received from litigation. Dividend income is recorded on the ex-dividend date, except for certain dividends from foreign securities where the ex-dividend date may have passed, which are recorded as soon as the Funds are informed of the ex-dividend date. Non-cash dividends included in dividend income, if any, are recorded at the fair market value of the securities received. Distributions received on securities that represent a return of capital or capital gain are recorded as a reduction of cost of investments and/or as a realized gain. Subsequent to ex-dividend date the Funds determine the components of these distributions, based upon receipt of tax filings or other correspondence relating to the underlying investment. Interest income and distributions from the Fidelity Central Funds are accrued as earned. Interest income includes coupon interest and amortization of premium and accretion of discount on debt securities as applicable. Investment income is recorded net of foreign taxes withheld where recovery of such taxes is uncertain.
Class Allocations and Expenses. Investment income, realized and unrealized capital gains and losses, common expenses of each Fund, and certain fund-level expense reductions, if any, are allocated daily on a pro-rata basis to each class based on the relative net assets of each class to the total net assets of each Fund. Each class differs with respect to transfer agent fees incurred. Certain expense reductions may also differ by class. For the reporting period, the allocated portion of income and expenses to each class as a percent of its average net assets may vary due to the timing of recording these transactions in relation to fluctuating net assets of the classes. Expenses directly attributable to a fund are charged to that fund. Expenses attributable to more than one fund are allocated among the respective funds on the basis of relative net assets or other appropriate methods. Expense estimates are accrued in the period to which they relate and adjustments are made when actual amounts are known.
Income Tax Information and Distributions to Shareholders. Each year, each Fund intends to qualify as a regulated investment company under Subchapter M of the Internal Revenue Code, including distributing substantially all of its taxable income and realized gains. As a result, no provision for U.S. Federal income taxes is required. As of April 30, 2014, each Fund did not have any unrecognized tax benefits in the financial statements; nor is each Fund aware of any tax positions for which it is reasonably possible that the total amounts of unrecognized tax benefits will significantly change in the next twelve months. Each Fund files a U.S. federal tax return, in addition to state and local tax returns as required. Each Fund's federal income tax returns are subject to examination by the Internal Revenue Service (IRS) for a period of three fiscal years after they are filed. State and local tax returns may be subject to examination for an additional fiscal year depending on the jurisdiction. Foreign taxes are provided for based on each Fund's
Annual Report
Notes to Financial Statements - continued
3. Significant Accounting Policies - continued
Income Tax Information and Distributions to Shareholders - continued
understanding of the tax rules and rates that exist in the foreign markets in which it invests.
Distributions are declared and recorded on the ex-dividend date. Income dividends and capital gain distributions are declared separately for each class. Income and capital gain distributions are determined in accordance with income tax regulations, which may differ from GAAP. In addition, the Funds claimed a portion of the payment made to redeeming shareholders as a distribution for income tax purposes.
Capital accounts within the financial statements are adjusted for permanent book-tax differences. These adjustments have no impact on net assets or the results of operations. Capital accounts are not adjusted for temporary book-tax differences which will reverse in a subsequent period.
Book-tax differences are primarily due to futures contracts, foreign currency transactions, passive foreign investment companies (PFIC), partnerships and losses deferred due to wash sales.
The federal tax cost of investment securities and unrealized appreciation (depreciation) as of period end were as follows for each Fund:
|
|
Tax cost |
Gross unrealized appreciation |
Gross unrealized depreciation |
Net unrealized |
|
Spartan Mid Cap Index Fund |
$ 591,230,898 |
$ 108,995,080 |
$ (12,918,295) |
$ 96,076,785 |
|
Spartan Small Cap Index Fund |
1,069,643,998 |
129,089,210 |
(52,629,768) |
76,459,442 |
The tax-based components of distributable earnings as of period end were as follows for each Fund:
|
|
Undistributed ordinary income |
Undistributed |
Net unrealized appreciation (depreciation) |
|
Spartan Mid Cap Index Fund |
$ 2,849,402 |
$ 496,049 |
$ 96,076,785 |
|
Spartan Small Cap Index Fund |
5,693,300 |
1,898,066 |
76,459,452 |
Annual Report
3. Significant Accounting Policies - continued
Income Tax Information and Distributions to Shareholders - continued
The tax character of distributions paid was as follows:
|
April 30, 2014 |
|
|
|
|
|
Ordinary Income |
Long-term |
Total |
|
Spartan Mid Cap Index Fund |
$ 5,871,823 |
$ 1,785,972 |
$ 7,657,795 |
|
Spartan Small Cap Index Fund |
8,797,191 |
2,485,684 |
11,282,875 |
|
April 30, 2013 |
|
|
|
|
|
Ordinary Income |
Long-term |
Total |
|
Spartan Mid Cap Index Fund |
$ 1,511,104 |
$ 48,083 |
$ 1,559,187 |
|
Spartan Small Cap Index Fund |
1,557,294 |
77,034 |
1,634,328 |
Short-Term Trading (Redemption) Fees. Shares held by investors in the Spartan Mid Cap Index Fund less than 30 days may be subject to a redemption fee equal to .75% of the NAV of shares redeemed. Shares held by investors in the Spartan Small Cap Index Fund less than 90 days are subject to a redemption fee equal to 1.50% of the NAV of shares redeemed. All redemption fees, which reduce the proceeds of the shareholder redemption, are retained by the Funds and accounted for as an addition to paid in capital.
4. Derivative Instruments.
Risk Exposures and the Use of Derivative Instruments. The Funds' investment objective allows the Funds to enter into various types of derivative contracts, including futures contracts. Derivatives are investments whose value is primarily derived from underlying assets, indices or reference rates and may be transacted on an exchange or over-the-counter (OTC). Derivatives may involve a future commitment to buy or sell a specified asset based on specified terms, to exchange future cash flows at periodic intervals based on a notional principal amount, or for one party to make one or more payments upon the occurrence of specified events in exchange for periodic payments from the other party.
The Funds used derivatives to increase returns and to manage exposure to certain risks as defined below. The success of any strategy involving derivatives depends on analysis of numerous economic factors, and if the strategies for investment do not work as intended, the Funds may not achieve their objectives.
Annual Report
Notes to Financial Statements - continued
4. Derivative Instruments - continued
Risk Exposures and the Use of Derivative Instruments - continued
The Funds' use of derivatives increased or decreased their exposure to the following risk:
|
Equity Risk |
Equity risk relates to the fluctuations in the value of financial instruments as a result of changes in market prices (other than those arising from interest rate risk or foreign exchange risk), whether caused by factors specific to an individual investment, its issuer, or all factors affecting all instruments traded in a market or market segment. |
The Funds are also exposed to additional risks from investing in derivatives, such as liquidity risk and counterparty credit risk. Liquidity risk is the risk that the Funds will be unable to close out the derivative in the open market in a timely manner. Counterparty credit risk is the risk that the counterparty will not be able to fulfill its obligation to the Funds. Counterparty credit risk related to exchange-traded futures contracts may be mitigated by the protection provided by the exchange on which they trade.
Investing in derivatives may involve greater risks than investing in the underlying assets directly and, to varying degrees, may involve risk of loss in excess of any initial investment and collateral received and amounts recognized in the Statement of Assets and Liabilities. In addition, there may be the risk that the change in value of the derivative contract does not correspond to the change in value of the underlying instrument.
Net Realized Gain (Loss) and Change in Net Unrealized Appreciation (Depreciation) on Derivatives. The table below, which reflects the impacts of derivatives on the financial performance of the Funds, summarizes the net realized gain (loss) and change in net unrealized appreciation (depreciation) for derivatives during the period as presented in the Statement of Operations.
|
Primary Risk Exposure / Derivative Type |
Net Realized |
Change in Net |
|
Spartan Mid Cap Index Fund |
|
|
|
Equity Risk |
|
|
|
Futures Contracts |
$ (24,891) |
$ 4,937 |
|
Totals (a) |
$ (24,891) |
$ 4,937 |
|
Spartan Small Cap Index Fund |
|
|
|
Equity Risk |
|
|
|
Futures Contracts |
$ 902,444 |
$ (37,971) |
|
Totals (a) |
$ 902,444 |
$ (37,971) |
(a) A summary of the value of derivatives by primary risk exposure as of period end, is included at the end of the Schedule of Investments.
Annual Report
4. Derivative Instruments - continued
Futures Contracts. A futures contract is an agreement between two parties to buy or sell a specified underlying instrument for a fixed price at a specified future date. The Funds used futures contracts to manage their exposure to the stock market.
Upon entering into a futures contract, a fund is required to deposit either cash or securities (initial margin) with a clearing broker in an amount equal to a certain percentage of the face value of the contract. Futures contracts are marked-to-market daily and subsequent daily payments (variation margin) are made or received by a fund depending on the daily fluctuations in the value of the futures contracts and are recorded as unrealized appreciation or (depreciation). This receivable and/or payable, if any, is included in daily variation margin for derivative instruments in the Statement of Assets and Liabilities. Realized gain or (loss) is recorded upon the expiration or closing of a futures contract.
Any open futures contracts at period end are presented in the Schedule of Investments under the caption "Futures Contracts." The underlying face amount at value reflects each contract's exposure to the underlying instrument or index at period end and is representative of volume of activity during the period. Securities deposited to meet initial margin requirements are identified in the Schedule of Investments. Cash deposited to meet initial margin requirements is presented as segregated cash with brokers for derivative instruments in the Statement of Assets and Liabilities.
5. Purchases and Sales of Investments.
Purchases and sales of securities, other than short-term securities, are noted in the table below.
|
|
Purchases ($) |
Sales ($) |
|
Spartan Mid Cap Index Fund |
340,004,523 |
32,411,476 |
|
Spartan Small Cap Index Fund |
671,095,067 |
52,597,192 |
6. Fees and Other Transactions with Affiliates.
Management Fee and Expense Contract. Fidelity Management & Research Company (FMR) (the investment adviser) and its affiliates provide the Funds with investment management related services for which the Funds pay a monthly management fee. The management fee is based on an annual rate of .12% and .15% of average net assets for Spartan Mid Cap Index Fund and Spartan Small Cap Index Fund, respectively. Under the management contract, the investment adviser pays all other fund-level expenses, except the compensation of the independent Trustees and certain other expenses such as interest expense, including commitment fees.
Annual Report
Notes to Financial Statements - continued
6. Fees and Other Transactions with Affiliates - continued
Management Fee and Expense Contract - continued
In addition, under an expense contract, the investment adviser pays class-level expenses as necessary so that the total expenses do not exceed certain amounts of each class' average net assets on an annual basis with certain exceptions, as noted in the following table:
|
|
Investor Class |
Fidelity Advantage Class |
Institutional Class |
Fidelity Advantage Institutional Class |
|
Spartan Mid Cap Index Fund |
.33% |
.20% |
.14% |
.12% |
|
Spartan Small Cap Index Fund |
.36% |
.23% |
.17% |
.15% |
Sub-Adviser. Geode Capital Management, LLC (Geode), serves as sub-adviser for the Funds. Geode provides discretionary investment advisory services to the Funds and is paid by the investment adviser for providing these services.
Transfer Agent Fees. Fidelity Investments Institutional Operations Company, Inc. (FIIOC), an affiliate of the investment adviser, is the transfer, dividend disbursing and shareholder servicing agent for each class of the Funds. FIIOC receives transfer agent fees at an annual rate of .21%, .11%, ..035% and .015% of average net assets for each Fund's Investor Class, Fidelity Advantage Class, Institutional Class and Fidelity Advantage Institutional Class, respectively. FIIOC pays for typesetting, printing and mailing of shareholder reports, except proxy statements.
Under the expense contract, each Investor Class, Fidelity Advantage Class and Institutional Class pays all or a portion of the transfer agent fees at an annual rate of .21%, .08% and .02% of average net assets, respectively. Each Fidelity Advantage Institutional Class does not pay transfer agent fees.
For the period, the total transfer agent fees paid by each applicable class were as follows:
|
Spartan Mid Cap Index Fund |
Amount |
|
Investor Class |
$ 17,226 |
|
Fidelity Advantage Class |
296,500 |
|
Institutional Class |
12,327 |
|
|
$ 326,053 |
|
Spartan Small Cap Index Fund |
|
|
Investor Class |
$ 33,623 |
|
Fidelity Advantage Class |
348,757 |
|
Institutional Class |
29,202 |
|
|
$ 411,582 |
Annual Report
7. Committed Line of Credit.
Certain Funds participate with other funds managed by the investment adviser or an affiliate in a $4.25 billion credit facility (the "line of credit") to be utilized for temporary or emergency purposes to fund shareholder redemptions or for other short-term liquidity purposes. The participating funds have agreed to pay commitment fees on their pro-rata portion of the line of credit, which are reflected in Miscellaneous expenses on the Statement of Operations, and are as follows:
|
Spartan Mid Cap Index Fund |
$ 744 |
|
Spartan Small Cap Index Fund |
980 |
During the period, there were no borrowings on this line of credit.
8. Security Lending.
Certain Funds lend portfolio securities through a lending agent from time to time in order to earn additional income. On the settlement date of the loan, each applicable Fund receives collateral (in the form of U.S. Treasury obligations, letters of credit and/or cash) against the loaned securities and maintains collateral in an amount not less than 100% of the market value of the loaned securities during the period of the loan. The market value of the loaned securities is determined at the close of business of the Funds and any additional required collateral is delivered to the Funds on the next business day. If the borrower defaults on its obligation to return the securities loaned because of insolvency or other reasons, the Funds may apply collateral received from the borrower against the obligation. The Funds may experience delays and costs in recovering the securities loaned. Any cash collateral received is invested in the Fidelity Securities Lending Cash Central Fund. The value of loaned securities and cash collateral at period end are disclosed on each applicable Fund's Statement of Assets and Liabilities. Security lending income represents the income earned on investing cash collateral, less rebates paid to borrowers and any lending agent fees associated with the loan, plus any premium payments received for lending certain types of securities. Security lending income is presented on each applicable Fund's Statement of Operations as a component of income from Fidelity Central Funds.
9. Expense Reductions.
The investment adviser contractually agreed to reimburse funds to the extent annual operating expenses exceeded certain levels of average net assets as noted in the table below. This reimbursement will remain in place through June 30, 2015. Some expenses, for example interest expense, including commitment fees, are excluded from this reimbursement.
Annual Report
Notes to Financial Statements - continued
9. Expense Reductions - continued
The following classes of each applicable Fund were in reimbursement during the period:
|
|
Expense |
Reimbursement |
|
Spartan Mid Cap Index Fund |
|
|
|
Investor Class |
.22% |
$ 9,202 |
|
Fidelity Advantage Class |
.08% |
447,736 |
|
Institutional Class |
.06% |
49,784 |
|
Fidelity Advantage Institutional Class |
.04% |
2,832 |
|
Spartan Small Cap Index Fund |
|
|
|
Investor Class |
.23% |
21,101 |
|
Fidelity Advantage Class |
.09% |
614,744 |
|
Institutional Class |
.07% |
147,422 |
|
Fidelity Advantage Institutional Class |
.05% |
3,485 |
In addition, through arrangements with each applicable Fund's custodian, credits realized as a result of uninvested cash balances were used to reduce each Fund's expenses. All of the applicable expense reductions are noted in the table below.
|
|
Custody expense |
|
Spartan Mid Cap Index Fund |
$ 15 |
|
Spartan Small Cap Index Fund |
35 |
In addition, the investment adviser reimbursed a portion of each Fund's operating expenses during the period as follows:
|
Spartan Mid Cap Index Fund |
$ 747 |
|
Spartan Small Cap Index Fund |
1,335 |
10. Distributions to Shareholders.
Distributions to shareholders of each class were as follows:
|
Years ended April 30, |
2014 |
2013 |
|
Spartan Mid Cap Index Fund |
|
|
|
From net investment income |
|
|
|
Investor Class |
$ 74,958 |
$ 181,075 |
|
Fidelity Advantage Class |
3,809,814 |
632,380 |
|
Institutional Class |
524,010 |
434,898 |
|
Fidelity Advantage Institutional Class |
38,713 |
1,556 |
|
Total |
$ 4,447,495 |
$ 1,249,909 |
|
From net realized gain |
|
|
|
Investor Class |
$ 62,107 |
$ 48,809 |
|
Fidelity Advantage Class |
2,753,728 |
153,239 |
|
Institutional Class |
367,797 |
106,819 |
|
Fidelity Advantage Institutional Class |
26,668 |
411 |
|
Total |
$ 3,210,300 |
$ 309,278 |
Annual Report
10. Distributions to Shareholders - continued
|
Years ended April 30, |
2014 |
2013 |
|
Spartan Small Cap Index Fund |
|
|
|
From net investment income |
|
|
|
Investor Class |
$ 121,693 |
$ 277,125 |
|
Fidelity Advantage Class |
3,732,923 |
634,304 |
|
Institutional Class |
1,098,983 |
249,021 |
|
Fidelity Advantage Institutional Class |
32,891 |
1,427 |
|
Total |
$ 4,986,490 |
$ 1,161,877 |
|
From net realized gain |
|
|
|
Investor Class |
$ 180,848 |
$ 131,295 |
|
Fidelity Advantage Class |
4,730,550 |
272,422 |
|
Institutional Class |
1,344,444 |
67,976 |
|
Fidelity Advantage Institutional Class |
40,543 |
758 |
|
Total |
$ 6,296,385 |
$ 472,451 |
11. Share Transactions.
Transactions for each class of shares were as follows:
|
|
Shares |
Dollars |
||
|
Years ended April 30, |
2014 |
2013 |
2014 |
2013 |
|
Spartan Mid Cap Index Fund |
|
|
|
|
|
Investor Class |
|
|
|
|
|
Shares sold |
1,975,682 |
1,525,867 |
$ 29,876,609 |
$ 18,496,025 |
|
Reinvestment of distributions |
8,979 |
19,079 |
133,800 |
221,467 |
|
Shares redeemed |
(1,432,371) |
(1,835,715) |
(21,248,784) |
(22,959,696) |
|
Net increase (decrease) |
552,290 |
(290,769) |
$ 8,761,625 |
$ (4,242,204) |
|
Fidelity Advantage Class |
|
|
|
|
|
Shares sold |
24,053,029 |
14,053,402 |
$ 363,116,725 |
$ 177,019,830 |
|
Reinvestment of distributions |
430,910 |
65,424 |
6,463,596 |
762,511 |
|
Shares redeemed |
(7,114,375) |
(1,205,869) |
(108,519,672) |
(14,930,620) |
|
Net increase (decrease) |
17,369,564 |
12,912,957 |
$ 261,060,649 |
$ 162,851,721 |
|
Institutional Class |
|
|
|
|
|
Shares sold |
2,965,195 |
1,830,971 |
$ 45,885,096 |
$ 21,586,198 |
|
Reinvestment of distributions |
59,718 |
46,616 |
891,807 |
541,717 |
|
Shares redeemed |
(720,066) |
(389,894) |
(11,097,777) |
(4,722,707) |
|
Net increase (decrease) |
2,304,847 |
1,487,693 |
$ 35,679,126 |
$ 17,405,208 |
Annual Report
Notes to Financial Statements - continued
11. Share Transactions - continued
|
|
Shares |
Dollars |
||
|
Years ended April 30, |
2014 |
2013 |
2014 |
2013 |
|
Fidelity Advantage Institutional Class |
|
|
|
|
|
Shares sold |
228,342 |
63,424 |
$ 3,279,459 |
$ 838,572 |
|
Reinvestment of distributions |
4,379 |
170 |
65,381 |
1,967 |
|
Shares redeemed |
(43,759) |
(92) |
(684,268) |
(1,227) |
|
Net increase (decrease) |
188,962 |
63,502 |
$ 2,660,572 |
$ 839,312 |
|
Spartan Small Cap Index Fund |
|
|
|
|
|
Investor Class |
|
|
|
|
|
Shares sold |
2,738,219 |
2,346,240 |
$ 42,850,558 |
$ 28,485,122 |
|
Reinvestment of distributions |
16,538 |
33,919 |
254,669 |
393,310 |
|
Shares redeemed |
(2,041,094) |
(2,813,647) |
(32,230,267) |
(35,532,992) |
|
Net increase (decrease) |
713,663 |
(433,488) |
$ 10,874,960 |
$ (6,654,560) |
|
Fidelity Advantage Class |
|
|
|
|
|
Shares sold |
31,293,380 |
14,023,492 |
$ 488,417,744 |
$ 177,473,307 |
|
Reinvestment of distributions |
525,763 |
74,690 |
8,101,146 |
868,118 |
|
Shares redeemed |
(7,029,195) |
(1,567,890) |
(111,411,379) |
(19,233,828) |
|
Net increase (decrease) |
24,789,948 |
12,530,292 |
$ 385,107,511 |
$ 159,107,597 |
|
Institutional Class |
|
|
|
|
|
Shares sold |
15,593,373 |
2,259,186 |
$ 247,126,510 |
$ 26,761,565 |
|
Reinvestment of distributions |
156,951 |
26,937 |
2,443,427 |
316,997 |
|
Shares redeemed |
(1,430,969) |
(301,107) |
(22,920,545) |
(3,776,948) |
|
Net increase (decrease) |
14,319,355 |
1,985,016 |
$ 226,649,392 |
$ 23,301,614 |
|
Fidelity Advantage Institutional Class |
|
|
|
|
|
Shares sold |
113,729 |
144,033 |
$ 1,682,596 |
$ 1,921,456 |
|
Reinvestment of distributions |
4,815 |
190 |
73,434 |
2,185 |
|
Shares redeemed |
(44,393) |
(39,867) |
(711,064) |
(462,521) |
|
Net increase (decrease) |
74,151 |
104,356 |
$ 1,044,966 |
$ 1,461,120 |
Annual Report
12. Other.
The Funds' organizational documents provide former and current trustees and officers with a limited indemnification against liabilities arising in connection with the performance of their duties to the Funds. In the normal course of business, the Funds may also enter into contracts that provide general indemnifications. The Funds' maximum exposure under these arrangements is unknown as this would be dependent on future claims that may be made against the Funds. The risk of material loss from such claims is considered remote.
Annual Report
Report of Independent Registered Public Accounting Firm
To the Trustees of Fidelity Salem Street Trust and Shareholders of Spartan Mid Cap Index Fund and Spartan Small Cap Index Fund:
We have audited the accompanying statements of assets and liabilities of Spartan Mid Cap Index Fund and Spartan Small Cap Index Fund (the Funds), each a fund of Fidelity Salem Street Trust, including the schedules of investments, as of April 30, 2014, and the related statements of operations for the year then ended, the statements of changes in net assets for each of the two years in the period then ended, and the financial highlights for each of the periods presented. These financial statements and financial highlights are the responsibility of the Funds' management. Our responsibility is to express an opinion on these financial statements and financial highlights based on our audits.
We conducted our audits in accordance with the standards of the Public Company Accounting Oversight Board (United States). Those standards require that we plan and perform the audit to obtain reasonable assurance about whether the financial statements and financial highlights are free of material misstatement. The Funds are not required to have, nor were we engaged to perform, an audit of their internal control over financial reporting. Our audits included consideration of internal control over financial reporting as a basis for designing audit procedures that are appropriate in the circumstances, but not for the purpose of expressing an opinion on the effectiveness of the Funds' internal control over financial reporting. Accordingly, we express no such opinion. An audit also includes examining, on a test basis, evidence supporting the amounts and disclosures in the financial statements, assessing the accounting principles used and significant estimates made by management, as well as evaluating the overall financial statement presentation. Our procedures included confirmation of securities owned as of April 30, 2014, by correspondence with the custodians and brokers; where replies were not received from brokers, we performed other auditing procedures. We believe that our audits provide a reasonable basis for our opinion.
In our opinion, the financial statements and financial highlights referred to above present fairly, in all material respects, the financial position of Spartan Mid Cap Index Fund and Spartan Small Cap Index Fund as of April 30, 2014, the results of their operations for the year then ended, the changes in their net assets for each of the two years in the period then ended, and the financial highlights for each of the periods presented, in conformity with accounting principles generally accepted in the United States of America.
DELOITTE & TOUCHE LLP
Boston, Massachusetts
June 20, 2014
Annual Report
Trustees and Officers
The Trustees and officers of the trust and funds, as applicable, are listed below. The Board of Trustees governs each fund and is responsible for protecting the interests of shareholders. The Trustees are experienced executives who meet periodically throughout the year to oversee each fund's activities, review contractual arrangements with companies that provide services to each fund, oversee management of the risks associated with such activities and contractual arrangements, and review each fund's performance. Except for Elizabeth S. Acton and James C. Curvey, each of the Trustees oversees 223 funds. Ms. Acton oversees 205 funds. Mr. Curvey oversees 396 funds.
The Trustees hold office without limit in time except that (a) any Trustee may resign; (b) any Trustee may be removed by written instrument, signed by at least two-thirds of the number of Trustees prior to such removal; (c) any Trustee who requests to be retired or who has become incapacitated by illness or injury may be retired by written instrument signed by a majority of the other Trustees; and (d) any Trustee may be removed at any special meeting of shareholders by a two-thirds vote of the outstanding voting securities of the trust. Each Trustee who is not an interested person (as defined in the 1940 Act) of the trust and the funds (Independent Trustee), shall retire not later than the last day of the month in which his or her 75th birthday occurs. The Independent Trustees may waive this mandatory retirement age policy with respect to individual Trustees. The officers hold office without limit in time, except that any officer may resign or may be removed by a vote of a majority of the Trustees at any regular meeting or any special meeting of the Trustees. Except as indicated, each individual has held the office shown or other offices in the same company for the past five years.
Experience, Skills, Attributes, and Qualifications of the Funds' Trustees. The Governance and Nominating Committee has adopted a statement of policy that describes the experience, qualifications, attributes, and skills that are necessary and desirable for potential Independent Trustee candidates (Statement of Policy). The Board believes that each Trustee satisfied at the time he or she was initially elected or appointed a Trustee, and continues to satisfy, the standards contemplated by the Statement of Policy. The Governance and Nominating Committee also engages professional search firms to help identify potential Independent Trustee candidates who have the experience, qualifications, attributes, and skills consistent with the Statement of Policy. From time to time, additional criteria based on the composition and skills of the current Independent Trustees, as well as experience or skills that may be appropriate in light of future changes to board composition, business conditions, and regulatory or other developments, have also been considered by the professional search firms and the Governance and Nominating Committee. In addition, the Board takes into account the Trustees' commitment and participation in Board and committee meetings, as well as their leadership of standing and ad hoc committees throughout their tenure.
In determining that a particular Trustee was and continues to be qualified to serve as a Trustee, the Board has considered a variety of criteria, none of which, in isolation, was controlling. The Board believes that, collectively, the Trustees have balanced and diverse experience, qualifications, attributes, and skills, which allow the Board to operate effectively in governing each fund and protecting the interests of shareholders. Information about the specific experience, skills, attributes, and qualifications of each Trustee, which in each case led to the Board's conclusion that the Trustee should serve (or continue to serve) as a trustee of the funds, is provided below.
Annual Report
Board Structure and Oversight Function. Abigail P. Johnson is an interested person (as defined in the 1940 Act) and currently serves as Chairman. The Trustees have determined that an interested Chairman is appropriate and benefits shareholders because an interested Chairman has a personal and professional stake in the quality and continuity of services provided to the funds. Independent Trustees exercise their informed business judgment to appoint an individual of their choosing to serve as Chairman, regardless of whether the Trustee happens to be independent or a member of management. The Independent Trustees have determined that they can act independently and effectively without having an Independent Trustee serve as Chairman and that a key structural component for assuring that they are in a position to do so is for the Independent Trustees to constitute a substantial majority for the Board. The Independent Trustees also regularly meet in executive session. Albert R. Gamper, Jr. serves as Chairman of the Independent Trustees and as such (i) acts as a liaison between the Independent Trustees and management with respect to matters important to the Independent Trustees and (ii) with management prepares agendas for Board meetings.
Fidelity funds are overseen by different Boards of Trustees. The funds' Board oversees Fidelity's investment-grade bond, money market, and asset allocation funds and another Board oversees Fidelity's equity and high income funds. The asset allocation funds may invest in Fidelity funds that are overseen by such other Board. The use of separate Boards, each with its own committee structure, allows the Trustees of each group of Fidelity funds to focus on the unique issues of the funds they oversee, including common research, investment, and operational issues. On occasion, the separate Boards establish joint committees to address issues of overlapping consequences for the Fidelity funds overseen by each Board.
The Trustees operate using a system of committees to facilitate the timely and efficient consideration of all matters of importance to the Trustees, each fund, and fund shareholders and to facilitate compliance with legal and regulatory requirements and oversight of the funds' activities and associated risks. The Board, acting through its committees, has charged FMR and its affiliates with (i) identifying events or circumstances the occurrence of which could have demonstrably adverse effects on the funds' business and/or reputation; (ii) implementing processes and controls to lessen the possibility that such events or circumstances occur or to mitigate the effects of such events or circumstances if they do occur; and (iii) creating and maintaining a system designed to evaluate continuously business and market conditions in order to facilitate the identification and implementation processes described in (i) and (ii) above. Because the day-to-day operations and activities of the funds are carried out by or through FMR, its affiliates, and other service providers, the funds' exposure to risks is mitigated but not eliminated by the processes overseen by the Trustees. While each of the Board's committees has responsibility for overseeing different aspects of the funds' activities, oversight is exercised primarily through the Operations and Audit Committees. In addition, an ad hoc Board committee of Independent Trustees has worked with FMR to enhance the Board's oversight of investment and financial risks, legal and regulatory risks, technology risks, and operational risks, including the development of additional risk reporting to the Board. Appropriate personnel, including but not limited to the funds' Chief Compliance Officer (CCO), FMR's internal auditor, the independent accountants, the funds' Treasurer and portfolio management personnel, make periodic reports to the Board's committees, as appropriate, including an annual review of FMR's risk management program for the Fidelity funds. The responsibilities of each standing committee, including their oversight responsibilities, are described further under "Standing Committees of the Funds' Trustees."
Annual Report
Trustees and Officers - continued
The funds' Statement of Additional Information (SAI) includes more information about the Trustees. To request a free copy, call Fidelity at 1-800-544-8544.
Interested Trustees*:
Correspondence intended for each Trustee who is an interested person may be sent to Fidelity Investments, 245 Summer Street, Boston, Massachusetts 02210.
|
Name, Year of Birth; Principal Occupations and Other Relevant Experience+ |
|
|
James C. Curvey (1935) |
|
|
Year of Election or Appointment: 2007 Trustee |
|
|
|
Mr. Curvey also serves as Trustee of other Fidelity funds. Mr. Curvey is a Director of Fidelity Investments Money Management, Inc. (2009-present), Director of Fidelity Research & Analysis Co. (2009-present) and Director of FMR and FMR Co., Inc. (2007-present). Mr. Curvey is also Vice Chairman (2007-present) and Director of FMR LLC. In addition, Mr. Curvey serves as an Overseer for the Boston Symphony Orchestra and a member of the Trustees of Villanova University. Previously, Mr. Curvey was the Vice Chairman (2006-2007) and Director (2000-2007) of FMR Corp. |
|
Abigail P. Johnson (1961) |
|
|
Year of Election or Appointment: 2009 Trustee Chairman of the Board of Trustees |
|
|
|
Ms. Johnson also serves as Trustee of other Fidelity funds. Ms. Johnson serves as President of FMR LLC (2013-present), President of Fidelity Financial Services (2012-present) and President of Personal, Workplace and Institutional Services (2005-present). Ms. Johnson is Chairman and Director of FMR Co., Inc. (2011-present), Chairman and Director of FMR (2011-present), and the Vice Chairman and Director (2007-present) of FMR LLC. Previously, Ms. Johnson served as President and a Director of FMR (2001-2005), a Trustee of other investment companies advised by FMR, Fidelity Investments Money Management, Inc., and FMR Co., Inc. (2001-2005), Senior Vice President of the Fidelity funds (2001-2005), and managed a number of Fidelity funds. Ms. Abigail P. Johnson and Mr. Arthur E. Johnson are not related. |
* Trustees have been determined to be "Interested Trustees" by virtue of, among other things, their affiliation with the trust or various entities under common control with FMR.
+ The information above includes each Trustee's principal occupation during the last five years and other information relating to the experience, attributes, and skills relevant to each Trustee's qualifications to serve as a Trustee, which led to the conclusion that each Trustee should serve as a Trustee for each fund.
Annual Report
Trustees and Officers - continued
Independent Trustees:
Correspondence intended for each Independent Trustee (that is, the Trustees other than the Interested Trustees) may be sent to Fidelity Investments, P.O. Box 55235, Boston, Massachusetts 02205-5235.
|
Name, Year of Birth; Principal Occupations and Other Relevant Experience+ |
|
|
Elizabeth S. Acton (1951) |
|
|
Year of Election or Appointment: 2013 Trustee |
|
|
|
Ms. Acton also serves as Trustee or Member of the Advisory Board of other Fidelity funds. Prior to her retirement in April 2012, Ms. Acton was Executive Vice President, Finance (2011-2012), Executive Vice President, Chief Financial Officer (2002-2011), and Treasurer (2004-2005) of Comerica Incorporated (financial services). Prior to joining Comerica, Ms. Acton held a variety of positions at Ford Motor Company (1983-2002), including Vice President and Treasurer (2000-2002) and Executive Vice President and Chief Financial Officer of Ford Motor Credit Company (1998-2000). Ms. Acton currently serves as a member of the Board of Directors and Audit and Finance Committees of Beazer Homes USA, Inc. (homebuilding, 2012-present). |
|
Albert R. Gamper, Jr. (1942) |
|
|
Year of Election or Appointment: 2006 Trustee Chairman of the Independent Trustees |
|
|
|
Mr. Gamper also serves as Trustee of other Fidelity funds. Prior to his retirement in December 2004, Mr. Gamper served as Chairman of the Board of CIT Group Inc. (commercial finance). During his tenure with CIT Group Inc. Mr. Gamper served in numerous senior management positions, including Chairman (1987-1989; 1999-2001; 2002-2004), Chief Executive Officer (1987-2004), and President (2002-2003). Mr. Gamper currently serves as a member of the Board of Directors of Public Service Enterprise Group (utilities, 2000-present), a member of the Board of Trustees, Rutgers University (2004-present), and Chairman of the Board of Barnabas Health Care System. Previously, Mr. Gamper served as Vice Chairman of the Independent Trustees of certain Fidelity funds (2011-2012) and as Chairman of the Board of Governors, Rutgers University (2004-2007). |
|
Robert F. Gartland (1951) |
|
|
Year of Election or Appointment: 2010 Trustee |
|
|
|
Mr. Gartland also serves as Trustee of other Fidelity funds. Mr. Gartland is Chairman and an investor in Gartland and Mellina Group Corp. (consulting, 2009-present). Previously, Mr. Gartland served as a partner and investor of Vietnam Partners LLC (investments and consulting, 2008-2011). Prior to his retirement, Mr. Gartland held a variety of positions at Morgan Stanley (financial services, 1979-2007) including Managing Director (1987-2007). |
|
Arthur E. Johnson (1947) |
|
|
Year of Election or Appointment: 2008 Trustee |
|
|
|
Mr. Johnson also serves as Trustee of other Fidelity funds. Mr. Johnson serves as a member of the Board of Directors of Eaton Corporation (diversified power management, 2009-present), AGL Resources, Inc. (holding company, 2002-present) and Booz Allen Hamilton (management consulting, 2011-present). Prior to his retirement, Mr. Johnson served as Senior Vice President of Corporate Strategic Development of Lockheed Martin Corporation (defense contractor, 1999-2009). He previously served on the Board of Directors of IKON Office Solutions, Inc. (1999-2008) and Delta Airlines (2005-2007). Mr. Arthur E. Johnson is not related to Ms. Abigail P. Johnson. |
|
Michael E. Kenneally (1954) |
|
|
Year of Election or Appointment: 2009 Trustee |
|
|
|
Mr. Kenneally also serves as Trustee of other Fidelity funds. Mr. Kenneally served as a Member of the Advisory Board for certain Fidelity funds before joining the Board of Trustees (2008-2009). Prior to his retirement, Mr. Kenneally served as Chairman and Global Chief Executive Officer of Credit Suisse Asset Management. Before joining Credit Suisse, he was an Executive Vice President and Chief Investment Officer for Bank of America Corporation. Earlier roles at Bank of America included Director of Research, Senior Portfolio Manager and Research Analyst, and Mr. Kenneally was awarded the Chartered Financial Analyst (CFA) designation in 1991. |
|
James H. Keyes (1940) |
|
|
Year of Election or Appointment: 2007 Trustee |
|
|
|
Mr. Keyes also serves as Trustee of other Fidelity funds. Mr. Keyes serves as a member of the Board and Non-Executive Chairman of Navistar International Corporation (manufacture and sale of trucks, buses, and diesel engines, since 2002). Previously, Mr. Keyes served as a member of the Board of Pitney Bowes, Inc. (integrated mail, messaging, and document management solutions, 1998-2013). Prior to his retirement, Mr. Keyes served as Chairman (1993-2002) and Chief Executive Officer (1988-2002) of Johnson Controls (automotive, building, and energy) and as a member of the Board of LSI Logic Corporation (semiconductor technologies, 1984-2008). |
|
Marie L. Knowles (1946) |
|
|
Year of Election or Appointment: 2001 Trustee Vice Chairman of the Independent Trustees |
|
|
|
Ms. Knowles also serves as Trustee of other Fidelity funds. Prior to Ms. Knowles' retirement in June 2000, she served as Executive Vice President and Chief Financial Officer of Atlantic Richfield Company (ARCO) (diversified energy, 1996-2000). From 1993 to 1996, she was a Senior Vice President of ARCO and President of ARCO Transportation Company. She served as a Director of ARCO from 1996 to 1998. Ms. Knowles currently serves as a Director and Chairman of the Audit Committee of McKesson Corporation (healthcare service, since 2002). Ms. Knowles is a member of the Board of the Catalina Island Conservancy and of the Santa Catalina Island Company (2009-present). She also serves as a member of the Advisory Board for the School of Engineering of the University of Southern California. Previously, Ms. Knowles served as a Director of Phelps Dodge Corporation (copper mining and manufacturing, 1994-2007), URS Corporation (engineering and construction, 2000-2003) and America West (airline, 1999-2002). |
|
Kenneth L. Wolfe (1939) |
|
|
Year of Election or Appointment: 2005 Trustee |
|
|
|
Mr. Wolfe also serves as Trustee of other Fidelity funds. Prior to his retirement, Mr. Wolfe served as Chairman and a Director (2007-2009) and Chairman and Chief Executive Officer (1994-2001) of Hershey Foods Corporation. He also served as a member of the Boards of Adelphia Communications Corporation (telecommunications, 2003-2006), Bausch & Lomb, Inc. (medical/pharmaceutical, 1993-2007), and Revlon, Inc. (personal care products, 2004-2009). Mr. Wolfe previously served as Chairman of the Independent Trustees of other Fidelity funds (2008-2012). |
+ The information above includes each Trustee's principal occupation during the last five years and other information relating to the experience, attributes, and skills relevant to each Trustee's qualifications to serve as a Trustee, which led to the conclusion that each Trustee should serve as a Trustee for each fund.
Officers:
Correspondence intended for each officer may be sent to Fidelity Investments, 245 Summer Street, Boston, Massachusetts 02210. Officers appear below in alphabetical order.
|
Name, Year of Birth; Principal Occupation |
|
|
Elizabeth Paige Baumann (1968) |
|
|
Year of Election or Appointment: 2012 Anti-Money Laundering (AML) Officer |
|
|
|
Ms. Baumann also serves as AML Officer of other funds. She is Chief AML Officer of FMR LLC (2012-present) and is an employee of Fidelity Investments. Previously, Ms. Baumann served as Vice President and Deputy Anti-Money Laundering Officer (2007-2012). |
|
Marc Bryant (1966) |
|
|
Year of Election or Appointment: 2013 Assistant Secretary |
|
|
|
Mr. Bryant also serves as an officer of other funds. He is Senior Vice President and Deputy General Counsel of FMR LLC. Prior to joining Fidelity Investments, Mr. Bryant served as a Senior Vice President and the Head of Global Retail Legal for AllianceBernstein L.P. (2006-2010), and as the General Counsel for ProFund Advisors LLC (2001-2006). |
|
Jonathan Davis (1968) |
|
|
Year of Election or Appointment: 2010 Assistant Treasurer |
|
|
|
Mr. Davis also serves as Assistant Treasurer of other funds. Mr. Davis is an employee of Fidelity Investments. Previously, Mr. Davis served as Vice President and Associate General Counsel of FMR LLC (2003-2010). |
|
Adrien E. Deberghes (1967) |
|
|
Year of Election or Appointment: 2010 Assistant Treasurer |
|
|
|
Mr. Deberghes also serves as an officer of other funds. He is an employee of Fidelity Investments (2008-present). Prior to joining Fidelity Investments, Mr. Deberghes was Senior Vice President of Mutual Fund Administration at State Street Corporation (2007-2008), Senior Director of Mutual Fund Administration at Investors Bank & Trust (2005-2007), and Director of Finance for Dunkin' Brands (2000-2005). |
|
Stephanie J. Dorsey (1969) |
|
|
Year of Election or Appointment: 2013 President and Treasurer |
|
|
|
Ms. Dorsey also serves as an officer of other funds. She is an employee of Fidelity Investments (2008-present) and has served in other fund officer roles. Prior to joining Fidelity Investments, Ms. Dorsey served as Treasurer (2004-2008) of the JPMorgan Mutual Funds and Vice President (2004-2008) of JPMorgan Chase Bank. |
|
Scott C. Goebel (1968) |
|
|
Year of Election or Appointment: 2008 Secretary and Chief Legal Officer (CLO) |
|
|
|
Mr. Goebel serves as Secretary and CLO of other funds. Mr. Goebel also serves as Secretary of Fidelity SelectCo, LLC (2013-present), Fidelity Investments Money Management, Inc. (FIMM) (2010-present) and Fidelity Research and Analysis Company (FRAC) (2010-present); General Counsel, Secretary, and Senior Vice President of FMR (2008-present) and FMR Co., Inc. (2008-present); Chief Legal Officer of Fidelity Management & Research (Hong Kong) Limited (2008-present); and Assistant Secretary of Fidelity Management & Research (Japan) Inc. (2008-present) and Fidelity Management & Research (U.K.) Inc. (2008-present). Previously, Mr. Goebel served as Secretary and CLO of other Fidelity funds (2008-2013), Assistant Secretary of FIMM (2008-2010), FRAC (2008-2010), and certain funds (2007-2008); and as Vice President and Secretary of Fidelity Distributors Corporation (FDC) (2005-2007). Mr. Goebel has been employed by FMR LLC or an affiliate since 2001. |
|
Bruce T. Herring (1965) |
|
|
Year of Election or Appointment: 2013 Vice President of Fidelity's Asset Allocation Funds |
|
|
|
Mr. Herring also serves as Vice President of other funds. He serves as Chief Investment Officer of Fidelity Global Asset Allocation (GAA) (2013-present), Group Chief Investment Officer of FMR, and President of Fidelity Research & Analysis Company (2010-present). Previously, Mr. Herring served as Chief Investment Officer and Director of Fidelity Management & Research (U.K.) Inc. (2010-2013), Vice President (2005-2006) and Senior Vice President (2006-2007) of Fidelity Management & Research Company, Vice President of FMR Co., Inc. (2001-2007), and as a portfolio manager for Fidelity U.S. Equity Funds. |
|
Chris Maher (1972) |
|
|
Year of Election or Appointment: 2013 Assistant Treasurer |
|
|
|
Mr. Maher serves as Assistant Treasurer of other funds. Mr. Maher is Vice President of Valuation Oversight and is an employee of Fidelity Investments. Previously, Mr. Maher served as Vice President of Asset Management Compliance (2013), Vice President of FMR's Program Management Group (2010-2013), and Vice President of Valuation Oversight (2008-2010). |
|
Charles S. Morrison (1960) |
|
|
Year of Election or Appointment: 2012 Vice President |
|
|
|
Mr. Morrison also serves as Trustee or Vice President of other funds. He serves as President, Asset Management (2014-present) and is an employee of Fidelity Investments. Previously, Mr. Morrison served as President, Fixed Income (2011-2014), Vice President of Fidelity's Money Market Funds (2005-2009), President, Money Market Group Leader of FMR (2009), and Senior Vice President, Money Market Group of FMR (2004-2009). Mr. Morrison also served as Vice President of Fidelity's Bond Funds (2002-2005), certain Balanced Funds (2002-2005), and certain Asset Allocation Funds (2002-2007), and as Senior Vice President (2002-2005) of Fidelity's Bond Division. |
|
Christine Reynolds (1958) |
|
|
Year of Election or Appointment: 2008 Chief Financial Officer |
|
|
|
Ms. Reynolds also serves as Chief Financial Officer of other funds. Ms. Reynolds became President of Fidelity Pricing and Cash Management Services (FPCMS) in August 2008. Ms. Reynolds served as Chief Operating Officer of FPCMS (2007-2008). Previously, Ms. Reynolds served as President, Treasurer, and Anti-Money Laundering officer of the Fidelity funds (2004-2007). |
|
Kenneth B. Robins (1969) |
|
|
Year of Election or Appointment: 2009 Assistant Treasurer |
|
|
|
Mr. Robins also serves as an officer of other funds. Mr. Robins serves as Executive Vice President of Fidelity Investments Money Management, Inc. (FIMM) (2013-present) and is an employee of Fidelity Investments (2004-present). Previously, Mr. Robins served in other fund officer roles. |
|
Stephen Sadoski (1971) |
|
|
Year of Election or Appointment: 2013 Deputy Treasurer |
|
|
|
Mr. Sadoski also serves as Deputy Treasurer of other funds. He is an employee of Fidelity Investments (2012-present) and has served in another fund officer role. Prior to joining Fidelity Investments, Mr. Sadoski served as an assistant chief accountant in the Division of Investment Management of the Securities and Exchange Commission (SEC) (2009-2012) and as a senior manager at Deloitte & Touche LLP (1997-2009). |
|
Stacie M. Smith (1974) |
|
|
Year of Election or Appointment: 2013 Assistant Treasurer |
|
|
|
Ms. Smith also serves as an officer of other funds. She is an employee of Fidelity Investments (2009-present) and has served in other fund officer roles. Prior to joining Fidelity Investments, Ms. Smith served as Senior Audit Manager of Ernst & Young LLP (1996-2009). |
|
Renee Stagnone (1975) |
|
|
Year of Election or Appointment: 2013 Deputy Treasurer |
|
|
|
Ms. Stagnone also serves as Deputy Treasurer of other funds. Ms. Stagnone is an employee of Fidelity Investments. |
|
Michael H. Whitaker (1967) |
|
|
Year of Election or Appointment: 2008 Chief Compliance Officer |
|
|
|
Mr. Whitaker also serves as Chief Compliance Officer of other funds. Mr. Whitaker is an employee of Fidelity Investments (2007-present). Prior to joining Fidelity Investments, Mr. Whitaker worked at MFS Investment Management where he served as Senior Vice President and Chief Compliance Officer (2004-2006), and Assistant General Counsel. |
|
Derek L. Young (1964) |
|
|
Year of Election or Appointment: 2009 Vice President of Fidelity's Asset Allocation Funds |
|
|
|
Mr. Young also serves as Trustee or an officer of other funds. He is President and a Director of Strategic Advisers, Inc. (2011-present), President of Fidelity Global Asset Allocation (GAA) (2011-present), and Vice Chairman of Pyramis Global Advisors, LLC (2011-present). Previously, Mr. Young served as Chief Investment Officer of GAA (2009-2011) and as a portfolio manager. |
|
Joseph F. Zambello (1957) |
|
|
Year of Election or Appointment: 2011 Deputy Treasurer |
|
|
|
Mr. Zambello also serves as Deputy Treasurer of other funds. Mr. Zambello is an employee of Fidelity Investments. Previously, Mr. Zambello served as Vice President of FMR's Program Management Group (2009-2011) and Vice President of the Transfer Agent Oversight Group (2005-2009). |
Annual Report
Distributions (Unaudited)
The Board of Trustees of each voted to pay to shareholders of record at the opening of business on record date, the following distributions per share derived from capital gains realized from sales of portfolio securities and dividends derived from net investment income:
|
Spartan Mid Cap Index Fund |
Pay Date |
Record Date |
Dividends |
Capital Gains |
|
Investor Class |
06/09/2014 |
06/06/2014 |
$0.04900 |
$0.026 |
|
Fidelity Advantage Class |
06/09/2014 |
06/06/2014 |
$0.05913 |
$0.026 |
|
Spartan Small Cap |
Pay Date |
Record Date |
Dividends |
Capital Gains |
|
Investor Class |
06/09/2014 |
06/06/2014 |
$0.04300 |
$0.072 |
|
Fidelity Advantage Class |
06/09/2014 |
06/06/2014 |
$0.05290 |
$0.072 |
The funds hereby designate as capital gain dividend the amounts noted below for the taxable year ended April 30, 2014, or, if subsequently determined to be different, the net capital gain of such year.
|
Spartan Mid Cap Index Fund |
$2,025,101 |
|
Spartan Small Cap Index Fund |
$3,982,085 |
A percentage of the dividends distributed during the fiscal year for the following funds qualify for the dividends-received deduction for corporate shareholders:
|
|
June 2013 |
December 2013 |
|
Spartan Mid Cap Index Fund |
|
|
|
Investor Class |
82% |
68% |
|
Fidelity Advantage Class |
64% |
62% |
|
Spartan Small Cap Index Fund |
|
|
|
Investor Class |
28% |
45% |
|
Fidelity Advantage Class |
24% |
42% |
A percentage of the dividends distributed during the fiscal year for the following funds may be taken into account as a dividend for purposes of the maximum rate under section 1(h)(11) of the Internal Revenue Code.
|
Spartan Mid Cap Index Fund |
June 2013 |
December 2013 |
|
Investor Class |
89% |
72% |
|
Fidelity Advantage Class |
69% |
67% |
|
Spartan Small Cap Index Fund |
|
|
|
Investor Class |
30% |
47% |
|
Fidelity Advantage Class |
26% |
44% |
The fund will notify shareholders in January 2015 of amounts for use in preparing 2014 income tax returns.
Annual Report
Investment Adviser
Fidelity Management & Research
Company
Boston, MA
Investment Sub-Advisers
FMR Co., Inc.
Geode Capital Management, LLC
General Distributor
Fidelity Distributors Corporation
Smithfield, RI
Transfer and Service Agents
Fidelity Investments Institutional
Operations Company, Inc.
Boston, MA
Fidelity Service Company, Inc.
Boston, MA
Custodian
State Street Bank and Trust Company
Boston, MA
The Fidelity Telephone Connection
Mutual Fund 24-Hour Service
Exchanges/Redemptions
and Account Assistance 1-800-544-6666
Product Information 1-800-544-6666
Retirement Accounts 1-800-544-4774 (8 a.m. - 9 p.m.)
TDD Service 1-800-544-0118
for the deaf and hearing impaired
(9 a.m. - 9 p.m. Eastern time)
Fidelity Automated Service
Telephone (FAST®) 
1-800-544-5555
Automated line for quickest service
(Fidelity Investment logo)(registered trademark)
Corporate Headquarters
245 Summer St., Boston, MA 02210
www.fidelity.com
MCX-SCX-UANN-0614
1.929311.102
Spartan® Mid Cap Index
Fund
Spartan Small Cap Index Fund
Institutional Class
Fidelity Advantage® Institutional Class
Annual Report
April 30, 2014
(Fidelity Cover Art)
Contents
|
Shareholder Expense Example |
An example of shareholder expenses. |
|
|
Spartan® Mid Cap Index Fund |
||
|
Performance |
How the fund has done over time. |
|
|
Management's Discussion of Fund Performance |
The Portfolio Manager's review of fund performance and strategy. |
|
|
Investment Changes |
A summary of major shifts in the fund's investments over the past six months. |
|
|
Investments |
A complete list of the fund's investments with their market values. |
|
|
Financial Statements |
Statements of assets and liabilities, operations, and changes in net assets, as well as financial highlights. |
|
|
Spartan Small Cap Index Fund |
||
|
Performance |
How the fund has done over time. |
|
|
Management's Discussion of Fund Performance |
The Portfolio Manager's review of fund performance and strategy. |
|
|
Investment Changes |
A summary of major shifts in the fund's investments over the past six months. |
|
|
Investments |
A complete list of the fund's investments with their market values. |
|
|
Financial Statements |
Statements of assets and liabilities, operations, and changes in net assets, as well as financial highlights. |
|
|
Notes |
Notes to the financial statements. |
|
|
Report of Independent Registered Public Accounting Firm |
|
|
|
Trustees and Officers |
|
|
|
Distributions |
|
|
To view a fund's proxy voting guidelines and proxy voting record for the 12-month period ended June 30, visit http://www.fidelity.com/proxyvotingresults or visit the Securities and Exchange Commission's (SEC) web site at http://www.sec.gov. You may also call 1-800-835-5092 to request a free copy of the proxy voting guidelines.
Annual Report
Standard & Poor's, S&P and S&P 500 are registered service marks of The McGraw-Hill Companies, Inc. and have been licensed for use by Fidelity Distributors Corporation.
Other third-party marks appearing herein are the property of their respective owners.
All other marks appearing herein are registered or unregistered trademarks or service marks of FMR LLC or an affiliated company. © 2014 FMR LLC. All rights reserved.
This report and the financial statements contained herein are submitted for the general information of the shareholders of the funds. This report is not authorized for distribution to prospective investors in the funds unless preceded or accompanied by an effective prospectus.
A fund files its complete schedule of portfolio holdings with the SEC for the first and third quarters of each fiscal year on Form N-Q. Forms N-Q are available on the SEC's web site at http://www.sec.gov. A fund's Forms N-Q may be reviewed and copied at the SEC's Public Reference Room in Washington, DC. Information regarding the operation of the SEC's Public Reference Room may be obtained by calling 1-800-SEC-0330. For a complete list of a fund's portfolio holdings, view the most recent holdings listing, semiannual report, or annual report on Fidelity's web site at http://www.fidelity.com, http://www.advisor.fidelity.com, or http://www.401k.com, as applicable.
NOT FDIC INSURED • MAY LOSE VALUE • NO BANK GUARANTEE
Neither the funds nor Fidelity Distributors Corporation is a bank.
Annual Report
Shareholder Expense Example
As a shareholder of a Fund, you incur two types of costs: (1) transaction costs, including redemption fees and (2) ongoing costs, including management fees and other Fund expenses. This Example is intended to help you understand your ongoing costs (in dollars) of investing in the Funds and to compare these costs with the ongoing costs of investing in other mutual funds.
The Example is based on an investment of $1,000 invested at the beginning of the period and held for the entire period (November 1, 2013 to April 30, 2014).
Actual Expenses
The first line of the accompanying table for each class of each fund provides information about actual account values and actual expenses. You may use the information in this line, together with the amount you invested, to estimate the expenses that you paid over the period. Simply divide your account value by $1,000.00 (for example, an $8,600 account value divided by $1,000.00 = 8.6), then multiply the result by the number in the first line for a class of the fund under the heading entitled "Expenses Paid During Period" to estimate the expenses you paid on your account during this period. A small balance maintenance fee of $12.00 that is charged once a year may apply for certain accounts with a value of less than $2,000. This fee is not included in the table below. If it was, the estimate of expenses you paid during the period would be higher, and your ending account value lower, by this amount. In addition, each Fund, as a shareholder in the underlying Fidelity Central Funds, will indirectly bear its pro-rata share of the fees and expenses incurred by the underlying Fidelity Central Funds. These fees and expenses are not included in the Fund's annualized expense ratio used to calculate the expense estimate in the table below.
Hypothetical Example for Comparison Purposes
The second line of the accompanying table for each class of each fund provides information about hypothetical account values and hypothetical expenses based on a Class' actual expense ratio and an assumed rate of return of 5% per year before expenses, which is not the Class' actual return. The hypothetical account values and expenses may not be used to estimate the actual ending account balance or expenses you paid for the period. You may use this information to compare the ongoing costs of investing in the Fund and other funds. To do so, compare this 5% hypothetical example with the 5% hypothetical examples that appear in the shareholder reports of the other funds. A small balance maintenance fee of $12.00 that is charged once a year may apply for certain accounts with a value of less than $2,000. This fee is not included in the table below. If it was, the estimate of expenses you paid during the period would be higher, and your ending account value lower, by this amount. In addition, each Fund, as a shareholder in the underlying Fidelity Central Funds, will indirectly bear its pro-rata share of the fees and expenses incurred by the underlying Fidelity Central Funds. These fees and expenses are not included in the Fund's annualized expense ratio used to calculate the expense estimate in the table below.
Please note that the expenses shown in the table are meant to highlight your ongoing costs only and do not reflect any transaction costs. Therefore, the second line of the table is useful in comparing ongoing costs only, and will not help you determine the relative total costs of owning different funds. In addition, if these transactional costs were included, your costs would have been higher.
Annual Report
|
|
Annualized |
Beginning |
Ending |
Expenses Paid |
|
Spartan Mid Cap Index Fund |
|
|
|
|
|
Investor Class |
.22% |
|
|
|
|
Actual |
|
$ 1,000.00 |
$ 1,076.10 |
$ 1.13 |
|
HypotheticalA |
|
$ 1,000.00 |
$ 1,023.70 |
$ 1.10 |
|
Fidelity Advantage Class |
.08% |
|
|
|
|
Actual |
|
$ 1,000.00 |
$ 1,076.90 |
$ .41 |
|
HypotheticalA |
|
$ 1,000.00 |
$ 1,024.40 |
$ .40 |
|
Institutional Class |
.06% |
|
|
|
|
Actual |
|
$ 1,000.00 |
$ 1,077.00 |
$ .31 |
|
HypotheticalA |
|
$ 1,000.00 |
$ 1,024.50 |
$ .30 |
|
Fidelity Advantage Institutional Class |
.04% |
|
|
|
|
Actual |
|
$ 1,000.00 |
$ 1,077.10 |
$ .21 |
|
HypotheticalA |
|
$ 1,000.00 |
$ 1,024.60 |
$ .20 |
|
Spartan Small Cap Index Fund |
|
|
|
|
|
Investor Class |
.23% |
|
|
|
|
Actual |
|
$ 1,000.00 |
$ 1,030.40 |
$ 1.16 |
|
HypotheticalA |
|
$ 1,000.00 |
$ 1,023.65 |
$ 1.15 |
|
Fidelity Advantage Class |
.09% |
|
|
|
|
Actual |
|
$ 1,000.00 |
$ 1,031.20 |
$ .45 |
|
HypotheticalA |
|
$ 1,000.00 |
$ 1,024.35 |
$ .45 |
|
Institutional Class |
.07% |
|
|
|
|
Actual |
|
$ 1,000.00 |
$ 1,032.00 |
$ .35 |
|
HypotheticalA |
|
$ 1,000.00 |
$ 1,024.45 |
$ .35 |
|
Fidelity Advantage Institutional Class |
.05% |
|
|
|
|
Actual |
|
$ 1,000.00 |
$ 1,032.10 |
$ .25 |
|
HypotheticalA |
|
$ 1,000.00 |
$ 1,024.55 |
$ .25 |
A 5% return per year before expenses
B Annualized expense ratio reflects expenses net of applicable fee waivers.
* Expenses are equal to each Class' annualized expense ratio, multiplied by the average account value over the period, multiplied by 181/ 365 (to reflect the one-half year period).
Annual Report
Spartan® Mid Cap Index Fund
Performance: The Bottom Line
Average annual total return reflects the change in the value of an investment, assuming reinvestment of the class' distributions from dividend income and capital gains (the profits earned upon the sale of securities that have grown in value, if any) and assuming a constant rate of performance each year. The $10,000 table and the fund's returns do not reflect the deduction of taxes that a shareholder would pay on fund distributions or the redemption of fund shares. During periods of reimbursement by Fidelity, a fund's total return will be greater than it would be had the reimbursement not occurred. How a fund did yesterday is no guarantee of how it will do tomorrow.
Average Annual Total Returns
|
Periods ended April 30, 2014 |
Past 1 |
Life of |
|
Institutional Class |
21.24% |
22.14% |
|
Fidelity Advantage® Institutional Class |
21.26% |
22.17% |
A From September 8, 2011.
$10,000 Over Life of Fund
Let's say hypothetically that $10,000 was invested in Spartan Mid Cap Index Fund - Institutional Class on September 8, 2011, when the fund started. The chart shows how the value of your investment would have changed, and also shows how the Russell Midcap® Index performed over the same period.

Annual Report
Spartan Mid Cap Index Fund
Management's Discussion of Fund Performance
Market Recap: U.S. stocks overcame fears of higher interest rates, slower economic growth and a volatile start to 2014 to post strong gains for the 12 months ending April 30, 2014. The S&P 500® Index returned 20.44%, finishing near its all-time high. U.S. Federal Reserve policies that balanced stimulus reductions with low interest rates contributed to a broad advance, with eight of 10 S&P 500® market sectors posting a double-digit gain. Industrials was the best-performing sector, up about 30%, as demand improved for autos and other durable goods. Health care stocks rose 25%, as new insurance programs and a favorable drug-approval environment raised earnings-growth expectations. Conversely, the typically defensive telecommunication services sector was the only group to lose ground (-3%), while utilities (+8%) lagged. Volatility increased in the first quarter amid rising tension in Ukraine, fear of a slowing economy in China and a late-January decline for momentum stocks. Still, markets finished the period on an uptrend, aided by higher consumer spending and the lowest unemployment since 2008 - both of which helped to take the sting out of weather-beaten first-quarter gross domestic product (GDP) figures. The growth-oriented Nasdaq Composite Index® rose 25.20%, the small-cap Russell 2000® Index returned 20.50% and the Russell Midcap® Index added 21.25%.
Comments from Patrick Waddell, who was named Senior Portfolio Manager of the Geode Capital Management, LLC, investment management team for Spartan® Mid Cap Index Fund on April 4, 2014: For the 12-month period ending April 30, 2014, the fund's Institutional Class and Fidelity Advantage® Institutional Class shares gained 21.24% and 21.26%, respectively, in line with the Russell Midcap® Index. Delta Air Lines was the top individual contributor, benefiting from strong financial results. Also doing very well was drugmaker Forest Laboratories; its shares more than doubled in February after the company agreed to be acquired at a premium price by Actavis, itself one of the fund's leading contributors. Tesla Motors, a maker of luxury electric vehicles, saw its share price rise more than fourfold, driven by investors' heightened optimism about the company's business prospects. The semiconductor industry provided yet another source of strength for the market. Within this group, Micron Technology and Avago Technologies both added to results. In contrast, some detractors were shares of real estate investment trusts (REITs), which lagged as investors worried about the potential financial impact of higher interest rates. Health care REITs HCP and Ventas, and mortgage REITs American Capital Agency and Annaly Capital Management, fared poorly. Another notable laggard was Catamaran, a pharmacy benefit manager; its shares dropped in February after the company gave weaker-than-expected earnings guidance.
The views expressed above reflect those of the portfolio manager(s) only through the end of the period as stated on the cover of this report and do not necessarily represent the views of Fidelity or any other person in the Fidelity organization. Any such views are subject to change at any time based upon market or other conditions and Fidelity disclaims any responsibility to update such views. These views may not be relied on as investment advice and, because investment decisions for a Fidelity fund are based on numerous factors, may not be relied on as an indication of trading intent on behalf of any Fidelity fund.
Annual Report
Spartan Mid Cap Index Fund
Investment Changes (Unaudited)
|
Top Ten Stocks as of April 30, 2014 |
||
|
|
% of fund's |
% of fund's net assets |
|
Actavis PLC |
0.6 |
0.5 |
|
Delta Air Lines, Inc. |
0.5 |
0.4 |
|
Alexion Pharmaceuticals, Inc. |
0.5 |
0.4 |
|
Micron Technology, Inc. |
0.4 |
0.3 |
|
Pioneer Natural Resources Co. |
0.4 |
0.5 |
|
Aon PLC |
0.4 |
0.4 |
|
Noble Energy, Inc. |
0.4 |
0.5 |
|
Forest Laboratories, Inc. |
0.4 |
0.2 |
|
Crown Castle International Corp. |
0.4 |
0.4 |
|
Sempra Energy |
0.4 |
0.4 |
|
|
4.4 |
|
|
Market Sectors as of April 30, 2014 |
||
|
|
% of fund's |
% of fund's net assets |
|
Financials |
20.0 |
19.6 |
|
Consumer Discretionary |
16.6 |
17.2 |
|
Industrials |
13.5 |
12.9 |
|
Information Technology |
13.3 |
13.1 |
|
Health Care |
11.0 |
10.6 |
|
Energy |
7.1 |
6.7 |
|
Utilities |
6.1 |
6.1 |
|
Materials |
5.7 |
5.5 |
|
Consumer Staples |
5.7 |
5.7 |
|
Telecommunication Services |
0.7 |
1.1 |
Annual Report
Spartan Mid Cap Index Fund
Investments April 30, 2014
Showing Percentage of Net Assets
|
Common Stocks - 99.7% |
|||
|
Shares |
Value |
||
|
CONSUMER DISCRETIONARY - 16.6% |
|||
|
Auto Components - 1.1% |
|||
|
Allison Transmission Holdings, Inc. |
3,633 |
$ 108,409 |
|
|
BorgWarner, Inc. |
24,439 |
1,518,639 |
|
|
Delphi Automotive PLC |
33,021 |
2,207,124 |
|
|
Gentex Corp. |
15,171 |
434,953 |
|
|
Lear Corp. |
8,527 |
708,253 |
|
|
The Goodyear Tire & Rubber Co. |
25,818 |
650,614 |
|
|
TRW Automotive Holdings Corp. (a) |
10,492 |
843,032 |
|
|
Visteon Corp. (a) |
5,251 |
455,839 |
|
|
|
6,926,863 |
||
|
Automobiles - 0.6% |
|||
|
Harley-Davidson, Inc. |
23,672 |
1,750,308 |
|
|
Tesla Motors, Inc. (a)(d) |
8,831 |
1,835,877 |
|
|
Thor Industries, Inc. |
4,678 |
284,750 |
|
|
|
3,870,935 |
||
|
Distributors - 0.4% |
|||
|
Genuine Parts Co. |
16,392 |
1,428,071 |
|
|
LKQ Corp. (a) |
31,360 |
913,203 |
|
|
|
2,341,274 |
||
|
Diversified Consumer Services - 0.3% |
|||
|
Apollo Ed Group, Inc. Class A (non-vtg.) (a) |
10,260 |
296,104 |
|
|
DeVry, Inc. |
6,657 |
299,765 |
|
|
Graham Holdings Co. |
462 |
310,108 |
|
|
H&R Block, Inc. |
28,619 |
813,352 |
|
|
Service Corp. International |
22,398 |
420,410 |
|
|
Weight Watchers International, Inc. (d) |
2,882 |
57,064 |
|
|
|
2,196,803 |
||
|
Hotels, Restaurants & Leisure - 2.2% |
|||
|
ARAMARK Holdings Corp. |
4,413 |
124,402 |
|
|
Bally Technologies, Inc. (a)(d) |
4,111 |
267,667 |
|
|
Brinker International, Inc. |
7,017 |
344,815 |
|
|
Burger King Worldwide, Inc. (d) |
10,540 |
275,410 |
|
|
Chipotle Mexican Grill, Inc. (a) |
3,265 |
1,627,603 |
|
|
Choice Hotels International, Inc. |
2,849 |
125,869 |
|
|
Darden Restaurants, Inc. |
13,651 |
678,591 |
|
|
Domino's Pizza, Inc. |
5,978 |
444,644 |
|
|
Dunkin' Brands Group, Inc. |
11,292 |
513,899 |
|
|
Hilton Worldwide Holdings, Inc. |
14,281 |
311,754 |
|
|
Hyatt Hotels Corp. Class A (a) |
4,819 |
271,213 |
|
|
International Game Technology |
26,012 |
326,451 |
|
|
Common Stocks - continued |
|||
|
Shares |
Value |
||
|
CONSUMER DISCRETIONARY - continued |
|||
|
Hotels, Restaurants & Leisure - continued |
|||
|
Marriott International, Inc. Class A (d) |
24,618 |
$ 1,426,121 |
|
|
MGM Mirage, Inc. (a) |
39,318 |
991,993 |
|
|
Norwegian Cruise Line Holdings Ltd. (a) |
2,879 |
94,345 |
|
|
Panera Bread Co. Class A (a)(d) |
2,794 |
427,398 |
|
|
Penn National Gaming, Inc. (a) |
7,414 |
82,740 |
|
|
Royal Caribbean Cruises Ltd. |
17,146 |
910,967 |
|
|
SeaWorld Entertainment, Inc. |
3,266 |
98,176 |
|
|
Six Flags Entertainment Corp. |
6,998 |
280,900 |
|
|
Starwood Hotels & Resorts Worldwide, Inc. |
20,571 |
1,576,767 |
|
|
Wendy's Co. |
27,496 |
228,492 |
|
|
Wyndham Worldwide Corp. |
13,479 |
961,592 |
|
|
Wynn Resorts Ltd. |
8,520 |
1,737,143 |
|
|
|
14,128,952 |
||
|
Household Durables - 1.6% |
|||
|
D.R. Horton, Inc. |
29,814 |
664,256 |
|
|
Garmin Ltd. (d) |
12,887 |
735,848 |
|
|
Harman International Industries, Inc. |
7,132 |
781,739 |
|
|
Jarden Corp. (a) |
13,396 |
765,581 |
|
|
Leggett & Platt, Inc. (d) |
15,134 |
497,303 |
|
|
Lennar Corp. Class A |
17,494 |
675,093 |
|
|
Mohawk Industries, Inc. (a) |
6,403 |
847,821 |
|
|
Newell Rubbermaid, Inc. |
30,426 |
916,127 |
|
|
NVR, Inc. (a) |
497 |
535,269 |
|
|
PulteGroup, Inc. |
41,089 |
755,627 |
|
|
Taylor Morrison Home Corp. |
3,408 |
72,284 |
|
|
Tempur Sealy International, Inc. (a) |
6,388 |
320,550 |
|
|
Toll Brothers, Inc. (a)(d) |
18,813 |
644,157 |
|
|
Tupperware Brands Corp. |
5,589 |
474,562 |
|
|
Whirlpool Corp. |
8,323 |
1,276,582 |
|
|
|
9,962,799 |
||
|
Internet & Catalog Retail - 1.0% |
|||
|
Expedia, Inc. |
11,188 |
794,236 |
|
|
Groupon, Inc. Class A (a)(d) |
44,193 |
308,909 |
|
|
HomeAway, Inc. (a) |
6,442 |
210,138 |
|
|
Lands' End, Inc. (a)(d) |
1,427 |
39,457 |
|
|
Liberty Interactive Corp.: |
|
|
|
|
(Venture Group) Series A (a) |
7,832 |
454,569 |
|
|
Series A (a) |
52,707 |
1,531,665 |
|
|
Netflix, Inc. (a) |
5,307 |
1,709,066 |
|
|
Common Stocks - continued |
|||
|
Shares |
Value |
||
|
CONSUMER DISCRETIONARY - continued |
|||
|
Internet & Catalog Retail - continued |
|||
|
TripAdvisor, Inc. (a) |
11,775 |
$ 950,714 |
|
|
zulily, Inc. (d) |
1,364 |
57,997 |
|
|
|
6,056,751 |
||
|
Leisure Products - 0.5% |
|||
|
Hasbro, Inc. |
12,140 |
670,856 |
|
|
Mattel, Inc. |
36,482 |
1,430,642 |
|
|
Polaris Industries, Inc. |
6,803 |
913,847 |
|
|
|
3,015,345 |
||
|
Media - 2.1% |
|||
|
AMC Networks, Inc. Class A (a)(d) |
6,372 |
418,449 |
|
|
Cablevision Systems Corp. - NY Group Class A (d) |
20,557 |
343,302 |
|
|
Charter Communications, Inc. Class A (a) |
6,949 |
941,798 |
|
|
Cinemark Holdings, Inc. |
12,220 |
361,956 |
|
|
Clear Channel Outdoor Holding, Inc. Class A |
4,568 |
36,635 |
|
|
Discovery Communications, Inc. Class A (a) |
25,855 |
1,962,395 |
|
|
DISH Network Corp. Class A (a) |
22,042 |
1,253,308 |
|
|
DreamWorks Animation SKG, Inc. Class A (a)(d) |
7,818 |
187,867 |
|
|
Gannett Co., Inc. |
24,258 |
659,090 |
|
|
Interpublic Group of Companies, Inc. |
45,039 |
784,579 |
|
|
John Wiley & Sons, Inc. Class A |
4,762 |
273,625 |
|
|
Lamar Advertising Co. Class A (a) |
8,354 |
417,032 |
|
|
Liberty Media Corp. Class A (a) |
10,111 |
1,311,498 |
|
|
Lions Gate Entertainment Corp. (d) |
8,554 |
226,938 |
|
|
Morningstar, Inc. |
2,211 |
162,133 |
|
|
Omnicom Group, Inc. |
27,326 |
1,849,424 |
|
|
Regal Entertainment Group Class A (d) |
8,411 |
158,127 |
|
|
Scripps Networks Interactive, Inc. Class A |
11,510 |
864,056 |
|
|
Starz - Liberty Capital Series A (a) |
11,402 |
367,943 |
|
|
The Madison Square Garden Co. Class A (a) |
6,483 |
353,972 |
|
|
|
12,934,127 |
||
|
Multiline Retail - 1.4% |
|||
|
Big Lots, Inc. (a) |
6,138 |
242,451 |
|
|
Dillard's, Inc. Class A |
2,871 |
281,157 |
|
|
Dollar General Corp. (a) |
32,744 |
1,848,071 |
|
|
Dollar Tree, Inc. (a) |
21,999 |
1,145,488 |
|
|
Family Dollar Stores, Inc. |
10,193 |
598,839 |
|
|
J.C. Penney Co., Inc. (a)(d) |
24,930 |
212,404 |
|
|
Kohl's Corp. |
22,052 |
1,208,229 |
|
|
Macy's, Inc. |
40,538 |
2,328,097 |
|
|
Common Stocks - continued |
|||
|
Shares |
Value |
||
|
CONSUMER DISCRETIONARY - continued |
|||
|
Multiline Retail - continued |
|||
|
Nordstrom, Inc. |
15,233 |
$ 933,478 |
|
|
Sears Holdings Corp. (a)(d) |
4,586 |
200,913 |
|
|
|
8,999,127 |
||
|
Specialty Retail - 3.7% |
|||
|
Aarons, Inc. Class A |
7,535 |
222,056 |
|
|
Abercrombie & Fitch Co. Class A (d) |
7,768 |
285,552 |
|
|
Advance Auto Parts, Inc. |
7,710 |
935,146 |
|
|
American Eagle Outfitters, Inc. (d) |
20,410 |
235,940 |
|
|
Ascena Retail Group, Inc. (a) |
13,532 |
232,750 |
|
|
AutoNation, Inc. (a) |
5,388 |
285,510 |
|
|
AutoZone, Inc. (a) |
3,526 |
1,882,496 |
|
|
Bed Bath & Beyond, Inc. (a) |
23,085 |
1,434,271 |
|
|
Best Buy Co., Inc. (d) |
28,631 |
742,402 |
|
|
Cabela's, Inc. Class A (a)(d) |
5,011 |
328,772 |
|
|
CarMax, Inc. (a)(d) |
23,727 |
1,038,768 |
|
|
Chico's FAS, Inc. |
16,074 |
255,255 |
|
|
CST Brands, Inc. |
6,443 |
210,235 |
|
|
Dick's Sporting Goods, Inc. |
10,457 |
550,666 |
|
|
DSW, Inc. Class A |
7,551 |
252,128 |
|
|
Foot Locker, Inc. |
15,780 |
734,243 |
|
|
GameStop Corp. Class A (d) |
12,572 |
498,857 |
|
|
Gap, Inc. |
29,501 |
1,159,389 |
|
|
GNC Holdings, Inc. |
9,636 |
433,620 |
|
|
Guess?, Inc. |
6,135 |
165,093 |
|
|
L Brands, Inc. |
25,403 |
1,376,843 |
|
|
Murphy U.S.A., Inc. (a) |
5,107 |
217,048 |
|
|
O'Reilly Automotive, Inc. (a) |
11,670 |
1,736,379 |
|
|
PetSmart, Inc. |
10,845 |
733,990 |
|
|
Ross Stores, Inc. |
23,220 |
1,580,818 |
|
|
Sally Beauty Holdings, Inc. (a) |
17,987 |
493,024 |
|
|
Signet Jewelers Ltd. |
8,543 |
865,577 |
|
|
Staples, Inc. (d) |
70,164 |
877,050 |
|
|
Tiffany & Co., Inc. |
11,812 |
1,033,432 |
|
|
Tractor Supply Co. |
14,655 |
985,402 |
|
|
Ulta Salon, Cosmetics & Fragrance, Inc. (a) |
6,676 |
585,552 |
|
|
Urban Outfitters, Inc. (a) |
11,366 |
405,255 |
|
|
Williams-Sonoma, Inc. |
10,253 |
644,093 |
|
|
|
23,417,612 |
||
|
Textiles, Apparel & Luxury Goods - 1.7% |
|||
|
Carter's, Inc. |
5,773 |
425,239 |
|
|
Common Stocks - continued |
|||
|
Shares |
Value |
||
|
CONSUMER DISCRETIONARY - continued |
|||
|
Textiles, Apparel & Luxury Goods - continued |
|||
|
Coach, Inc. |
29,669 |
$ 1,324,721 |
|
|
Deckers Outdoor Corp. (a)(d) |
3,630 |
286,589 |
|
|
Fossil Group, Inc. (a) |
5,118 |
545,835 |
|
|
Hanesbrands, Inc. |
10,413 |
854,803 |
|
|
Michael Kors Holdings Ltd. (a) |
21,280 |
1,940,736 |
|
|
PVH Corp. |
8,565 |
1,075,507 |
|
|
Ralph Lauren Corp. |
6,301 |
953,782 |
|
|
Under Armour, Inc. Class A (sub. vtg.) (a)(d) |
17,696 |
865,157 |
|
|
VF Corp. |
37,010 |
2,260,941 |
|
|
|
10,533,310 |
||
|
TOTAL CONSUMER DISCRETIONARY |
104,383,898 |
||
|
CONSUMER STAPLES - 5.7% |
|||
|
Beverages - 1.3% |
|||
|
Beam, Inc. |
16,790 |
1,401,461 |
|
|
Brown-Forman Corp. Class B (non-vtg.) |
15,974 |
1,433,187 |
|
|
Coca-Cola Enterprises, Inc. |
27,448 |
1,247,237 |
|
|
Constellation Brands, Inc. Class A (sub. vtg.) (a) |
16,243 |
1,296,841 |
|
|
Dr. Pepper Snapple Group, Inc. |
21,562 |
1,194,966 |
|
|
Molson Coors Brewing Co. Class B |
14,755 |
884,857 |
|
|
Monster Beverage Corp. (a) |
14,185 |
949,828 |
|
|
|
8,408,377 |
||
|
Food & Staples Retailing - 0.9% |
|||
|
Fresh Market, Inc. (a)(d) |
4,186 |
155,301 |
|
|
Kroger Co. |
54,943 |
2,529,576 |
|
|
Safeway, Inc. |
25,483 |
867,951 |
|
|
Sprouts Farmers Market LLC (d) |
2,090 |
66,817 |
|
|
Whole Foods Market, Inc. |
39,184 |
1,947,445 |
|
|
|
5,567,090 |
||
|
Food Products - 2.3% |
|||
|
Bunge Ltd. |
15,539 |
1,237,681 |
|
|
Campbell Soup Co. (d) |
18,517 |
842,338 |
|
|
ConAgra Foods, Inc. |
44,004 |
1,342,562 |
|
|
Dean Foods Co. |
9,909 |
156,959 |
|
|
Flowers Foods, Inc. |
18,129 |
372,007 |
|
|
Hillshire Brands Co. |
12,987 |
462,987 |
|
|
Hormel Foods Corp. |
14,070 |
670,998 |
|
|
Ingredion, Inc. |
8,188 |
576,845 |
|
|
Keurig Green Mountain, Inc. |
15,757 |
1,476,116 |
|
|
Common Stocks - continued |
|||
|
Shares |
Value |
||
|
CONSUMER STAPLES - continued |
|||
|
Food Products - continued |
|||
|
McCormick & Co., Inc. (non-vtg.) |
13,924 |
$ 991,389 |
|
|
Mead Johnson Nutrition Co. Class A |
21,387 |
1,887,617 |
|
|
Pinnacle Foods, Inc. |
3,447 |
104,789 |
|
|
The Hershey Co. |
15,836 |
1,524,057 |
|
|
The J.M. Smucker Co. |
11,327 |
1,095,094 |
|
|
Tyson Foods, Inc. Class A |
29,596 |
1,242,144 |
|
|
WhiteWave Foods Co. (a) |
14,669 |
406,185 |
|
|
|
14,389,768 |
||
|
Household Products - 0.5% |
|||
|
Church & Dwight Co., Inc. (d) |
14,589 |
1,006,787 |
|
|
Clorox Co. |
13,865 |
1,257,556 |
|
|
Energizer Holdings, Inc. |
6,575 |
734,362 |
|
|
|
2,998,705 |
||
|
Personal Products - 0.3% |
|||
|
Avon Products, Inc. |
45,485 |
695,011 |
|
|
Coty, Inc. Class A |
6,102 |
97,937 |
|
|
Herbalife Ltd. (d) |
9,012 |
540,540 |
|
|
Nu Skin Enterprises, Inc. Class A |
6,125 |
532,875 |
|
|
|
1,866,363 |
||
|
Tobacco - 0.4% |
|||
|
Lorillard, Inc. |
39,907 |
2,371,274 |
|
|
TOTAL CONSUMER STAPLES |
35,601,577 |
||
|
ENERGY - 7.1% |
|||
|
Energy Equipment & Services - 1.8% |
|||
|
Atwood Oceanics, Inc. (a) |
6,007 |
297,707 |
|
|
Cameron International Corp. (a) |
22,160 |
1,439,514 |
|
|
Diamond Offshore Drilling, Inc. (d) |
7,281 |
397,615 |
|
|
Dresser-Rand Group, Inc. (a) |
8,050 |
486,542 |
|
|
Dril-Quip, Inc. (a) |
4,293 |
485,624 |
|
|
FMC Technologies, Inc. (a) |
25,052 |
1,420,448 |
|
|
Frank's International NV (d) |
3,524 |
96,663 |
|
|
Helmerich & Payne, Inc. |
10,034 |
1,090,194 |
|
|
McDermott International, Inc. (a)(d) |
25,101 |
181,480 |
|
|
Nabors Industries Ltd. |
30,912 |
788,874 |
|
|
Oceaneering International, Inc. |
11,409 |
836,052 |
|
|
Oil States International, Inc. (a) |
5,809 |
564,286 |
|
|
Patterson-UTI Energy, Inc. |
15,544 |
505,646 |
|
|
Rowan Companies PLC |
13,183 |
407,618 |
|
|
Common Stocks - continued |
|||
|
Shares |
Value |
||
|
ENERGY - continued |
|||
|
Energy Equipment & Services - continued |
|||
|
RPC, Inc. |
6,455 |
$ 143,495 |
|
|
Seadrill Ltd. (d) |
37,327 |
1,314,657 |
|
|
Superior Energy Services, Inc. |
16,915 |
556,842 |
|
|
Tidewater, Inc. |
5,233 |
266,517 |
|
|
Unit Corp. |
5,200 |
342,940 |
|
|
|
11,622,714 |
||
|
Oil, Gas & Consumable Fuels - 5.3% |
|||
|
Antero Resources Corp. (d) |
3,988 |
261,892 |
|
|
Cabot Oil & Gas Corp. |
44,519 |
1,748,706 |
|
|
Cheniere Energy, Inc. (a) |
25,499 |
1,439,419 |
|
|
Chesapeake Energy Corp. |
61,204 |
1,759,615 |
|
|
Cimarex Energy Co. |
9,140 |
1,088,757 |
|
|
Cobalt International Energy, Inc. (a) |
29,086 |
523,548 |
|
|
Concho Resources, Inc. (a) |
11,070 |
1,444,082 |
|
|
CONSOL Energy, Inc. |
24,027 |
1,069,442 |
|
|
Continental Resources, Inc. (a)(d) |
4,520 |
626,110 |
|
|
CVR Energy, Inc. (d) |
1,666 |
81,884 |
|
|
Denbury Resources, Inc. (d) |
37,139 |
624,678 |
|
|
Energen Corp. |
7,651 |
596,089 |
|
|
EP Energy Corp. |
3,869 |
75,175 |
|
|
EQT Corp. |
15,893 |
1,732,178 |
|
|
Golar LNG Ltd. (NASDAQ) (d) |
4,661 |
206,016 |
|
|
Gulfport Energy Corp. (a) |
8,937 |
658,389 |
|
|
HollyFrontier Corp. |
21,457 |
1,128,424 |
|
|
Kosmos Energy Ltd. (a) |
10,438 |
113,983 |
|
|
Laredo Petroleum Holdings, Inc. (a)(d) |
4,385 |
128,174 |
|
|
Murphy Oil Corp. |
18,955 |
1,202,316 |
|
|
Newfield Exploration Co. (a) |
14,255 |
482,532 |
|
|
Noble Energy, Inc. |
37,881 |
2,719,098 |
|
|
Oasis Petroleum, Inc. (a)(d) |
10,667 |
496,122 |
|
|
ONEOK, Inc. |
21,773 |
1,376,489 |
|
|
PBF Energy, Inc. Class A |
2,470 |
76,027 |
|
|
Peabody Energy Corp. (d) |
28,500 |
541,785 |
|
|
Pioneer Natural Resources Co. |
14,427 |
2,788,306 |
|
|
QEP Resources, Inc. |
18,954 |
581,698 |
|
|
Range Resources Corp. |
17,227 |
1,558,182 |
|
|
Rice Energy, Inc. |
5,276 |
156,697 |
|
|
SandRidge Energy, Inc. (a)(d) |
52,340 |
359,052 |
|
|
SM Energy Co. |
7,007 |
519,429 |
|
|
Southwestern Energy Co. (a) |
37,128 |
1,777,689 |
|
|
Common Stocks - continued |
|||
|
Shares |
Value |
||
|
ENERGY - continued |
|||
|
Oil, Gas & Consumable Fuels - continued |
|||
|
Teekay Corp. |
4,036 |
$ 226,460 |
|
|
Tesoro Corp. |
14,262 |
802,808 |
|
|
Ultra Petroleum Corp. (a)(d) |
16,116 |
480,257 |
|
|
Whiting Petroleum Corp. (a) |
12,392 |
913,538 |
|
|
World Fuel Services Corp. |
7,675 |
349,520 |
|
|
WPX Energy, Inc. (a) |
21,106 |
449,136 |
|
|
|
33,163,702 |
||
|
TOTAL ENERGY |
44,786,416 |
||
|
FINANCIALS - 20.0% |
|||
|
Banks - 3.0% |
|||
|
Associated Banc-Corp. |
17,854 |
313,338 |
|
|
Bank of Hawaii Corp. |
4,789 |
264,209 |
|
|
BankUnited, Inc. |
6,833 |
225,421 |
|
|
BOK Financial Corp. |
2,810 |
183,830 |
|
|
CIT Group, Inc. |
21,146 |
910,335 |
|
|
City National Corp. |
4,888 |
354,722 |
|
|
Comerica, Inc. |
19,685 |
949,604 |
|
|
Commerce Bancshares, Inc. |
8,588 |
373,406 |
|
|
Cullen/Frost Bankers, Inc. (d) |
5,455 |
416,817 |
|
|
East West Bancorp, Inc. |
14,959 |
516,235 |
|
|
Fifth Third Bancorp |
92,382 |
1,903,993 |
|
|
First Citizen Bancshares, Inc. |
781 |
175,639 |
|
|
First Horizon National Corp. |
25,433 |
292,225 |
|
|
First Niagara Financial Group, Inc. |
37,380 |
333,430 |
|
|
First Republic Bank |
12,325 |
625,617 |
|
|
Fulton Financial Corp. |
20,328 |
247,798 |
|
|
Huntington Bancshares, Inc. |
88,825 |
813,637 |
|
|
KeyCorp |
96,797 |
1,320,311 |
|
|
M&T Bank Corp. (d) |
13,616 |
1,661,288 |
|
|
Popular, Inc. (a) |
10,917 |
337,335 |
|
|
Regions Financial Corp. |
149,412 |
1,515,038 |
|
|
Signature Bank (a) |
4,964 |
589,822 |
|
|
SunTrust Banks, Inc. |
57,065 |
2,183,307 |
|
|
SVB Financial Group (a) |
4,779 |
509,872 |
|
|
Synovus Financial Corp. |
103,757 |
333,060 |
|
|
TCF Financial Corp. |
17,388 |
272,992 |
|
|
Common Stocks - continued |
|||
|
Shares |
Value |
||
|
FINANCIALS - continued |
|||
|
Banks - continued |
|||
|
Valley National Bancorp (d) |
20,890 |
$ 209,318 |
|
|
Zions Bancorporation |
19,499 |
563,911 |
|
|
|
18,396,510 |
||
|
Capital Markets - 2.4% |
|||
|
Affiliated Managers Group, Inc. (a) |
5,574 |
1,104,767 |
|
|
American Capital Ltd. (a) |
29,839 |
447,287 |
|
|
Ameriprise Financial, Inc. |
20,142 |
2,248,451 |
|
|
Ares Capital Corp. |
30,947 |
531,360 |
|
|
Artisan Partners Asset Management, Inc. |
1,466 |
85,131 |
|
|
E*TRADE Financial Corp. (a) |
30,170 |
677,317 |
|
|
Eaton Vance Corp. (non-vtg.) |
12,788 |
461,263 |
|
|
Federated Investors, Inc. Class B (non-vtg.) |
9,684 |
276,381 |
|
|
Invesco Ltd. |
46,983 |
1,654,271 |
|
|
Lazard Ltd. Class A |
13,562 |
638,092 |
|
|
Legg Mason, Inc. |
11,752 |
551,051 |
|
|
LPL Financial |
5,651 |
267,575 |
|
|
Northern Trust Corp. |
25,264 |
1,522,156 |
|
|
Raymond James Financial, Inc. |
12,909 |
641,577 |
|
|
SEI Investments Co. |
15,250 |
493,795 |
|
|
T. Rowe Price Group, Inc. |
27,388 |
2,249,376 |
|
|
TD Ameritrade Holding Corp. |
24,453 |
780,051 |
|
|
Waddell & Reed Financial, Inc. Class A |
9,123 |
615,346 |
|
|
|
15,245,247 |
||
|
Consumer Finance - 0.2% |
|||
|
Santander Consumer U.S.A. Holdings, Inc. |
8,991 |
204,455 |
|
|
SLM Corp. |
46,931 |
1,208,473 |
|
|
|
1,412,928 |
||
|
Diversified Financial Services - 1.4% |
|||
|
CBOE Holdings, Inc. |
9,245 |
493,313 |
|
|
Interactive Brokers Group, Inc. |
4,868 |
116,345 |
|
|
IntercontinentalExchange Group, Inc. |
12,058 |
2,465,138 |
|
|
Leucadia National Corp. |
31,179 |
795,688 |
|
|
McGraw Hill Financial, Inc. |
28,960 |
2,141,013 |
|
|
Moody's Corp. |
20,542 |
1,612,547 |
|
|
MSCI, Inc. Class A (a) |
12,769 |
517,655 |
|
|
The NASDAQ OMX Group, Inc. |
11,785 |
434,867 |
|
|
Voya Financial, Inc. |
7,888 |
279,156 |
|
|
|
8,855,722 |
||
|
Common Stocks - continued |
|||
|
Shares |
Value |
||
|
FINANCIALS - continued |
|||
|
Insurance - 4.4% |
|||
|
Alleghany Corp. (a) |
1,769 |
$ 721,717 |
|
|
Allied World Assurance Co. Holdings Ltd. |
3,479 |
374,654 |
|
|
American Financial Group, Inc. |
8,299 |
484,911 |
|
|
American National Insurance Co. |
754 |
84,757 |
|
|
Aon PLC |
32,664 |
2,772,520 |
|
|
Arch Capital Group Ltd. (a) |
14,049 |
805,289 |
|
|
Arthur J. Gallagher & Co. |
15,736 |
708,435 |
|
|
Aspen Insurance Holdings Ltd. |
7,089 |
324,534 |
|
|
Assurant, Inc. |
7,716 |
520,136 |
|
|
Assured Guaranty Ltd. |
17,841 |
426,578 |
|
|
Axis Capital Holdings Ltd. |
11,837 |
541,543 |
|
|
Brown & Brown, Inc. |
12,494 |
372,071 |
|
|
Cincinnati Financial Corp. |
17,270 |
841,740 |
|
|
CNA Financial Corp. |
2,693 |
110,278 |
|
|
Endurance Specialty Holdings Ltd. |
4,553 |
231,383 |
|
|
Erie Indemnity Co. Class A |
2,551 |
182,779 |
|
|
Everest Re Group Ltd. |
4,977 |
786,515 |
|
|
Fidelity National Financial, Inc. Class A |
29,041 |
934,539 |
|
|
Genworth Financial, Inc. Class A (a) |
51,792 |
924,487 |
|
|
Hanover Insurance Group, Inc. |
4,668 |
272,845 |
|
|
Hartford Financial Services Group, Inc. |
48,209 |
1,729,257 |
|
|
HCC Insurance Holdings, Inc. |
10,621 |
487,929 |
|
|
Kemper Corp. |
4,904 |
193,267 |
|
|
Lincoln National Corp. |
28,417 |
1,378,509 |
|
|
Markel Corp. (a)(d) |
1,455 |
910,714 |
|
|
MBIA, Inc. (a) |
14,554 |
176,394 |
|
|
Mercury General Corp. |
2,779 |
133,003 |
|
|
Old Republic International Corp. |
27,558 |
456,360 |
|
|
PartnerRe Ltd. |
5,408 |
570,003 |
|
|
Principal Financial Group, Inc. |
31,041 |
1,453,960 |
|
|
ProAssurance Corp. |
6,572 |
298,500 |
|
|
Progressive Corp. |
63,723 |
1,545,283 |
|
|
Protective Life Corp. |
8,383 |
428,790 |
|
|
Reinsurance Group of America, Inc. |
7,657 |
587,368 |
|
|
RenaissanceRe Holdings Ltd. (d) |
4,395 |
444,818 |
|
|
StanCorp Financial Group, Inc. |
4,731 |
289,064 |
|
|
Torchmark Corp. |
9,698 |
772,931 |
|
|
Unum Group |
28,034 |
931,289 |
|
|
Validus Holdings Ltd. |
9,845 |
364,954 |
|
|
W.R. Berkley Corp. |
10,816 |
478,500 |
|
|
Common Stocks - continued |
|||
|
Shares |
Value |
||
|
FINANCIALS - continued |
|||
|
Insurance - continued |
|||
|
White Mountains Insurance Group Ltd. |
646 |
$ 385,184 |
|
|
XL Group PLC Class A |
29,113 |
912,693 |
|
|
|
27,350,481 |
||
|
Real Estate Investment Trusts - 7.7% |
|||
|
Alexandria Real Estate Equities, Inc. |
7,565 |
558,448 |
|
|
American Campus Communities, Inc. |
11,115 |
424,593 |
|
|
American Capital Agency Corp. |
37,599 |
853,873 |
|
|
American Homes 4 Rent Class A |
5,201 |
83,476 |
|
|
Annaly Capital Management, Inc. |
99,994 |
1,154,931 |
|
|
Apartment Investment & Management Co. Class A |
15,455 |
476,478 |
|
|
AvalonBay Communities, Inc. |
13,657 |
1,864,863 |
|
|
BioMed Realty Trust, Inc. |
19,742 |
412,608 |
|
|
Boston Properties, Inc. |
16,030 |
1,877,754 |
|
|
Brandywine Realty Trust (SBI) |
16,849 |
245,153 |
|
|
Brixmor Property Group, Inc. (d) |
4,917 |
107,977 |
|
|
Camden Property Trust (SBI) |
8,966 |
614,081 |
|
|
CBL & Associates Properties, Inc. |
17,265 |
313,705 |
|
|
Chimera Investment Corp. |
108,313 |
334,687 |
|
|
CommonWealth REIT (d) |
12,506 |
317,777 |
|
|
Corporate Office Properties Trust (SBI) |
9,235 |
247,036 |
|
|
Corrections Corp. of America |
12,186 |
399,701 |
|
|
Crown Castle International Corp. |
35,284 |
2,566,205 |
|
|
DDR Corp. |
30,989 |
532,081 |
|
|
Digital Realty Trust, Inc. (d) |
13,483 |
719,992 |
|
|
Douglas Emmett, Inc. |
15,177 |
418,885 |
|
|
Duke Realty LP |
34,020 |
596,030 |
|
|
Equity Lifestyle Properties, Inc. |
8,798 |
368,372 |
|
|
Essex Property Trust, Inc. |
6,441 |
1,115,968 |
|
|
Extra Space Storage, Inc. |
11,752 |
614,982 |
|
|
Federal Realty Investment Trust (SBI) |
6,846 |
804,679 |
|
|
Gaming & Leisure Properties |
10,152 |
373,086 |
|
|
General Growth Properties, Inc. |
59,176 |
1,359,273 |
|
|
Hatteras Financial Corp. |
10,171 |
199,046 |
|
|
HCP, Inc. |
48,005 |
2,009,489 |
|
|
Health Care REIT, Inc. |
30,043 |
1,895,413 |
|
|
Healthcare Trust of America, Inc. |
12,382 |
144,746 |
|
|
Home Properties, Inc. |
6,033 |
371,633 |
|
|
Hospitality Properties Trust (SBI) |
15,850 |
476,293 |
|
|
Host Hotels & Resorts, Inc. |
78,711 |
1,688,351 |
|
|
Kilroy Realty Corp. |
8,622 |
513,613 |
|
|
Common Stocks - continued |
|||
|
Shares |
Value |
||
|
FINANCIALS - continued |
|||
|
Real Estate Investment Trusts - continued |
|||
|
Kimco Realty Corp. |
43,155 |
$ 989,113 |
|
|
Liberty Property Trust (SBI) (d) |
13,689 |
513,338 |
|
|
Mack-Cali Realty Corp. |
9,044 |
184,226 |
|
|
MFA Financial, Inc. |
38,122 |
302,307 |
|
|
Mid-America Apartment Communities, Inc. |
7,885 |
549,190 |
|
|
National Retail Properties, Inc. |
12,556 |
428,536 |
|
|
Omega Healthcare Investors, Inc. |
12,887 |
448,210 |
|
|
Piedmont Office Realty Trust, Inc. Class A (d) |
16,635 |
292,942 |
|
|
Plum Creek Timber Co., Inc. |
18,685 |
814,666 |
|
|
Post Properties, Inc. |
5,723 |
287,352 |
|
|
Prologis, Inc. |
52,606 |
2,137,382 |
|
|
Rayonier, Inc. |
13,214 |
595,951 |
|
|
Realty Income Corp. |
23,392 |
1,016,382 |
|
|
Regency Centers Corp. |
9,757 |
511,560 |
|
|
Retail Properties America, Inc. |
13,803 |
197,659 |
|
|
Senior Housing Properties Trust (SBI) |
21,559 |
505,990 |
|
|
SL Green Realty Corp. |
9,623 |
1,007,624 |
|
|
Spirit Realty Capital, Inc. |
39,189 |
422,066 |
|
|
Starwood Property Trust, Inc. |
23,387 |
562,457 |
|
|
Starwood Waypoint Residential (a) |
3,973 |
107,946 |
|
|
Tanger Factory Outlet Centers, Inc. |
10,019 |
357,478 |
|
|
Taubman Centers, Inc. |
6,752 |
491,816 |
|
|
The Macerich Co. |
14,442 |
937,430 |
|
|
Two Harbors Investment Corp. |
38,411 |
398,706 |
|
|
UDR, Inc. |
26,516 |
685,704 |
|
|
Ventas, Inc. |
30,966 |
2,046,233 |
|
|
Vornado Realty Trust |
19,743 |
2,025,632 |
|
|
Weingarten Realty Investors (SBI) |
12,869 |
401,513 |
|
|
Weyerhaeuser Co. |
61,494 |
1,835,596 |
|
|
WP Carey, Inc. |
6,070 |
373,184 |
|
|
|
48,483,467 |
||
|
Real Estate Management & Development - 0.5% |
|||
|
CBRE Group, Inc. (a) |
29,513 |
786,226 |
|
|
Forest City Enterprises, Inc. Class A (a) |
16,639 |
314,643 |
|
|
Howard Hughes Corp. (a) |
4,183 |
597,165 |
|
|
Jones Lang LaSalle, Inc. |
4,658 |
539,816 |
|
|
Realogy Holdings Corp. (a) |
12,688 |
533,530 |
|
|
The St. Joe Co. (a)(d) |
7,054 |
125,914 |
|
|
|
2,897,294 |
||
|
Common Stocks - continued |
|||
|
Shares |
Value |
||
|
FINANCIALS - continued |
|||
|
Thrifts & Mortgage Finance - 0.4% |
|||
|
Hudson City Bancorp, Inc. |
55,848 |
$ 556,246 |
|
|
Nationstar Mortgage Holdings, Inc. (a)(d) |
2,192 |
71,744 |
|
|
New York Community Bancorp, Inc. (d) |
46,474 |
716,164 |
|
|
Ocwen Financial Corp. (a) |
10,965 |
415,574 |
|
|
People's United Financial, Inc. |
32,737 |
467,484 |
|
|
TFS Financial Corp. (a) |
8,373 |
112,114 |
|
|
Washington Federal, Inc. |
11,062 |
238,718 |
|
|
|
2,578,044 |
||
|
TOTAL FINANCIALS |
125,219,693 |
||
|
HEALTH CARE - 11.0% |
|||
|
Biotechnology - 1.6% |
|||
|
Alexion Pharmaceuticals, Inc. (a) |
20,616 |
3,261,451 |
|
|
Alkermes PLC (a) |
14,248 |
659,112 |
|
|
ARIAD Pharmaceuticals, Inc. (a)(d) |
18,883 |
137,279 |
|
|
BioMarin Pharmaceutical, Inc. (a) |
14,631 |
851,963 |
|
|
Cubist Pharmaceuticals, Inc. |
6,929 |
485,446 |
|
|
Incyte Corp. (a) |
10,819 |
525,371 |
|
|
Medivation, Inc. (a) |
7,944 |
478,308 |
|
|
Myriad Genetics, Inc. (a)(d) |
7,849 |
331,306 |
|
|
Pharmacyclics, Inc. (a)(d) |
6,139 |
580,627 |
|
|
Seattle Genetics, Inc. (a)(d) |
10,671 |
410,620 |
|
|
Theravance, Inc. (a)(d) |
8,412 |
226,451 |
|
|
United Therapeutics Corp. (a) |
4,928 |
492,849 |
|
|
Vertex Pharmaceuticals, Inc. (a) |
24,647 |
1,668,602 |
|
|
|
10,109,385 |
||
|
Health Care Equipment & Supplies - 2.3% |
|||
|
Alere, Inc. (a) |
8,611 |
287,607 |
|
|
Boston Scientific Corp. (a) |
142,572 |
1,797,833 |
|
|
C.R. Bard, Inc. |
8,066 |
1,107,704 |
|
|
CareFusion Corp. (a) |
21,932 |
856,664 |
|
|
DENTSPLY International, Inc. |
15,073 |
672,708 |
|
|
Edwards Lifesciences Corp. (a)(d) |
11,329 |
922,974 |
|
|
Hill-Rom Holdings, Inc. |
6,334 |
236,638 |
|
|
Hologic, Inc. (a)(d) |
28,481 |
597,674 |
|
|
IDEXX Laboratories, Inc. (a) |
5,674 |
717,421 |
|
|
ResMed, Inc. (d) |
14,958 |
745,656 |
|
|
Sirona Dental Systems, Inc. (a)(d) |
5,807 |
436,803 |
|
|
St. Jude Medical, Inc. |
29,960 |
1,901,561 |
|
|
Common Stocks - continued |
|||
|
Shares |
Value |
||
|
HEALTH CARE - continued |
|||
|
Health Care Equipment & Supplies - continued |
|||
|
Teleflex, Inc. |
4,353 |
$ 444,398 |
|
|
The Cooper Companies, Inc. |
5,083 |
670,499 |
|
|
Varian Medical Systems, Inc. (a)(d) |
11,458 |
911,484 |
|
|
Zimmer Holdings, Inc. |
17,785 |
1,721,588 |
|
|
|
14,029,212 |
||
|
Health Care Providers & Services - 3.1% |
|||
|
AmerisourceBergen Corp. |
24,376 |
1,588,828 |
|
|
Brookdale Senior Living, Inc. (a) |
10,516 |
334,829 |
|
|
Cardinal Health, Inc. |
36,104 |
2,509,589 |
|
|
Catamaran Corp. (a) |
21,741 |
825,962 |
|
|
Cigna Corp. |
30,133 |
2,411,845 |
|
|
Community Health Systems, Inc. (a) |
11,866 |
449,603 |
|
|
DaVita HealthCare Partners, Inc. (a) |
19,444 |
1,347,469 |
|
|
Envision Healthcare Holdings, Inc. |
5,124 |
173,140 |
|
|
HCA Holdings, Inc. (a) |
28,278 |
1,470,456 |
|
|
Health Net, Inc. (a) |
8,457 |
290,329 |
|
|
Henry Schein, Inc. (a) |
9,190 |
1,049,774 |
|
|
Humana, Inc. |
16,637 |
1,825,911 |
|
|
Laboratory Corp. of America Holdings (a)(d) |
9,228 |
910,804 |
|
|
LifePoint Hospitals, Inc. (a) |
4,702 |
262,936 |
|
|
MEDNAX, Inc. (a) |
10,614 |
628,880 |
|
|
Omnicare, Inc. |
10,472 |
620,675 |
|
|
Patterson Companies, Inc. |
9,227 |
375,539 |
|
|
Premier, Inc. |
3,334 |
100,020 |
|
|
Quest Diagnostics, Inc. |
15,355 |
858,805 |
|
|
Tenet Healthcare Corp. (a)(d) |
10,252 |
462,160 |
|
|
Universal Health Services, Inc. Class B |
9,586 |
784,039 |
|
|
VCA Antech, Inc. (a) |
9,388 |
287,554 |
|
|
|
19,569,147 |
||
|
Health Care Technology - 0.3% |
|||
|
Allscripts Healthcare Solutions, Inc. (a) |
18,849 |
286,882 |
|
|
Cerner Corp. (a) |
31,352 |
1,608,358 |
|
|
Veeva Systems, Inc. Class A (d) |
1,609 |
30,909 |
|
|
|
1,926,149 |
||
|
Life Sciences Tools & Services - 1.3% |
|||
|
Agilent Technologies, Inc. |
36,676 |
1,981,971 |
|
|
Bio-Rad Laboratories, Inc. Class A (a) |
2,193 |
270,200 |
|
|
Bruker BioSciences Corp. (a) |
11,622 |
240,111 |
|
|
Charles River Laboratories International, Inc. (a) |
5,196 |
279,129 |
|
|
Covance, Inc. (a) |
5,879 |
518,998 |
|
|
Common Stocks - continued |
|||
|
Shares |
Value |
||
|
HEALTH CARE - continued |
|||
|
Life Sciences Tools & Services - continued |
|||
|
Illumina, Inc. (a) |
13,141 |
$ 1,785,205 |
|
|
Mettler-Toledo International, Inc. (a) |
3,173 |
739,690 |
|
|
PerkinElmer, Inc. |
11,700 |
491,049 |
|
|
QIAGEN NV (a)(d) |
24,744 |
541,894 |
|
|
Quintiles Transnational Holdings, Inc. |
2,903 |
136,818 |
|
|
Techne Corp. |
3,901 |
348,398 |
|
|
Waters Corp. (a) |
9,052 |
891,984 |
|
|
|
8,225,447 |
||
|
Pharmaceuticals - 2.4% |
|||
|
Actavis PLC (a)(d) |
18,330 |
3,745,353 |
|
|
Endo International PLC (a) |
14,101 |
887,587 |
|
|
Forest Laboratories, Inc. (a) |
28,164 |
2,588,553 |
|
|
Hospira, Inc. (a) |
17,396 |
796,737 |
|
|
Jazz Pharmaceuticals PLC (a) |
5,443 |
734,261 |
|
|
Mylan, Inc. (a) |
40,280 |
2,045,418 |
|
|
Perrigo Co. PLC |
13,327 |
1,930,549 |
|
|
Salix Pharmaceuticals Ltd. (a)(d) |
6,436 |
707,960 |
|
|
Zoetis, Inc. Class A |
52,863 |
1,599,634 |
|
|
|
15,036,052 |
||
|
TOTAL HEALTH CARE |
68,895,392 |
||
|
INDUSTRIALS - 13.5% |
|||
|
Aerospace & Defense - 1.2% |
|||
|
Alliant Techsystems, Inc. |
3,403 |
490,781 |
|
|
BE Aerospace, Inc. (a) |
10,380 |
911,053 |
|
|
Exelis, Inc. |
19,933 |
369,558 |
|
|
Hexcel Corp. (a) |
10,694 |
445,833 |
|
|
Huntington Ingalls Industries, Inc. |
5,314 |
547,342 |
|
|
L-3 Communications Holdings, Inc. |
9,501 |
1,096,130 |
|
|
Rockwell Collins, Inc. |
14,302 |
1,110,550 |
|
|
Spirit AeroSystems Holdings, Inc. Class A (a) |
12,589 |
378,048 |
|
|
Textron, Inc. |
29,362 |
1,200,906 |
|
|
TransDigm Group, Inc. |
5,533 |
984,155 |
|
|
Triumph Group, Inc. |
5,453 |
353,409 |
|
|
|
7,887,765 |
||
|
Air Freight & Logistics - 0.3% |
|||
|
C.H. Robinson Worldwide, Inc. (d) |
15,923 |
937,865 |
|
|
Expeditors International of Washington, Inc. |
21,685 |
894,289 |
|
|
|
1,832,154 |
||
|
Common Stocks - continued |
|||
|
Shares |
Value |
||
|
INDUSTRIALS - continued |
|||
|
Airlines - 1.4% |
|||
|
Alaska Air Group, Inc. |
7,399 |
$ 696,098 |
|
|
American Airlines Group, Inc. |
20,648 |
724,125 |
|
|
Copa Holdings SA Class A |
3,514 |
475,374 |
|
|
Delta Air Lines, Inc. |
90,541 |
3,334,625 |
|
|
Southwest Airlines Co. |
76,350 |
1,845,380 |
|
|
United Continental Holdings, Inc. (a) |
37,597 |
1,536,589 |
|
|
|
8,612,191 |
||
|
Building Products - 0.5% |
|||
|
A.O. Smith Corp. |
8,176 |
382,310 |
|
|
Allegion PLC |
10,532 |
519,754 |
|
|
Armstrong World Industries, Inc. (a) |
2,669 |
140,283 |
|
|
Fortune Brands Home & Security, Inc. |
17,456 |
695,622 |
|
|
Lennox International, Inc. |
5,320 |
445,976 |
|
|
Masco Corp. |
37,797 |
759,342 |
|
|
Owens Corning |
12,561 |
513,117 |
|
|
|
3,456,404 |
||
|
Commercial Services & Supplies - 1.1% |
|||
|
ADT Corp. |
19,261 |
582,453 |
|
|
Cintas Corp. |
10,905 |
642,632 |
|
|
Clean Harbors, Inc. (a)(d) |
6,370 |
382,200 |
|
|
Copart, Inc. (a) |
11,887 |
431,141 |
|
|
Covanta Holding Corp. |
11,285 |
208,208 |
|
|
Iron Mountain, Inc. |
18,004 |
512,034 |
|
|
KAR Auction Services, Inc. |
7,965 |
237,198 |
|
|
Pitney Bowes, Inc. (d) |
21,290 |
570,572 |
|
|
R.R. Donnelley & Sons Co. |
20,459 |
360,078 |
|
|
Republic Services, Inc. |
28,493 |
999,819 |
|
|
Rollins, Inc. |
6,756 |
203,220 |
|
|
Stericycle, Inc. (a) |
9,096 |
1,059,138 |
|
|
Waste Connections, Inc. |
13,050 |
582,813 |
|
|
|
6,771,506 |
||
|
Construction & Engineering - 0.8% |
|||
|
AECOM Technology Corp. (a) |
10,940 |
354,675 |
|
|
Chicago Bridge & Iron Co. NV |
10,584 |
847,461 |
|
|
Fluor Corp. |
17,227 |
1,304,084 |
|
|
Jacobs Engineering Group, Inc. (a) |
13,754 |
793,606 |
|
|
KBR, Inc. |
15,629 |
396,508 |
|
|
Common Stocks - continued |
|||
|
Shares |
Value |
||
|
INDUSTRIALS - continued |
|||
|
Construction & Engineering - continued |
|||
|
Quanta Services, Inc. (a) |
21,956 |
$ 774,608 |
|
|
URS Corp. |
7,291 |
343,552 |
|
|
|
4,814,494 |
||
|
Electrical Equipment - 1.0% |
|||
|
AMETEK, Inc. |
25,633 |
1,351,372 |
|
|
Babcock & Wilcox Co. (d) |
11,889 |
413,618 |
|
|
Hubbell, Inc. Class B |
6,272 |
738,340 |
|
|
Regal-Beloit Corp. |
4,765 |
356,088 |
|
|
Rockwell Automation, Inc. |
14,754 |
1,758,382 |
|
|
Roper Industries, Inc. |
10,456 |
1,452,861 |
|
|
SolarCity Corp. (a)(d) |
2,398 |
127,694 |
|
|
|
6,198,355 |
||
|
Industrial Conglomerates - 0.1% |
|||
|
Carlisle Companies, Inc. |
6,724 |
553,049 |
|
|
Machinery - 4.2% |
|||
|
AGCO Corp. |
10,265 |
571,761 |
|
|
Colfax Corp. (a) |
10,967 |
789,405 |
|
|
Crane Co. |
5,130 |
373,105 |
|
|
Donaldson Co., Inc. |
15,475 |
651,343 |
|
|
Dover Corp. |
18,073 |
1,561,507 |
|
|
Flowserve Corp. |
15,107 |
1,103,566 |
|
|
Graco, Inc. |
6,478 |
469,655 |
|
|
Harsco Corp. |
8,603 |
205,870 |
|
|
IDEX Corp. |
8,687 |
647,790 |
|
|
Ingersoll-Rand PLC |
29,384 |
1,757,163 |
|
|
ITT Corp. |
9,497 |
409,701 |
|
|
Joy Global, Inc. (d) |
10,576 |
638,579 |
|
|
Kennametal, Inc. |
8,319 |
388,747 |
|
|
Lincoln Electric Holdings, Inc. |
8,780 |
586,592 |
|
|
Manitowoc Co., Inc. (d) |
14,116 |
448,606 |
|
|
Navistar International Corp. (a)(d) |
5,914 |
224,318 |
|
|
Nordson Corp. |
6,842 |
508,703 |
|
|
Oshkosh Truck Corp. |
9,300 |
516,243 |
|
|
PACCAR, Inc. |
37,356 |
2,390,037 |
|
|
Pall Corp. |
11,722 |
986,406 |
|
|
Parker Hannifin Corp. |
15,767 |
2,000,517 |
|
|
Pentair Ltd. |
21,583 |
1,603,401 |
|
|
Snap-On, Inc. |
6,156 |
714,096 |
|
|
SPX Corp. |
4,708 |
479,463 |
|
|
Stanley Black & Decker, Inc. |
17,094 |
1,468,204 |
|
|
Common Stocks - continued |
|||
|
Shares |
Value |
||
|
INDUSTRIALS - continued |
|||
|
Machinery - continued |
|||
|
Terex Corp. |
11,775 |
$ 509,740 |
|
|
Timken Co. |
9,136 |
576,299 |
|
|
Toro Co. |
6,103 |
387,785 |
|
|
Trinity Industries, Inc. |
8,322 |
624,649 |
|
|
Valmont Industries, Inc. |
2,835 |
422,160 |
|
|
WABCO Holdings, Inc. (a) |
6,169 |
660,145 |
|
|
Wabtec Corp. |
10,129 |
755,117 |
|
|
Xylem, Inc. |
19,459 |
731,464 |
|
|
|
26,162,137 |
||
|
Marine - 0.1% |
|||
|
Kirby Corp. (a) |
6,007 |
604,424 |
|
|
Professional Services - 1.0% |
|||
|
Dun & Bradstreet Corp. |
3,985 |
441,379 |
|
|
Equifax, Inc. |
12,696 |
899,004 |
|
|
IHS, Inc. Class A (a) |
6,911 |
833,674 |
|
|
Manpower, Inc. |
8,169 |
664,466 |
|
|
Nielsen Holdings B.V. |
23,091 |
1,084,122 |
|
|
Robert Half International, Inc. |
14,787 |
662,458 |
|
|
Towers Watson & Co. |
6,844 |
768,034 |
|
|
Verisk Analytics, Inc. (a) |
15,979 |
960,178 |
|
|
|
6,313,315 |
||
|
Road & Rail - 0.9% |
|||
|
AMERCO |
774 |
193,585 |
|
|
Avis Budget Group, Inc. (a)(d) |
11,397 |
599,368 |
|
|
Con-way, Inc. |
5,963 |
253,308 |
|
|
Genesee & Wyoming, Inc. Class A (a) |
4,596 |
455,050 |
|
|
Hertz Global Holdings, Inc. (a) |
36,589 |
1,041,689 |
|
|
J.B. Hunt Transport Services, Inc. |
9,597 |
730,332 |
|
|
Kansas City Southern |
11,638 |
1,174,041 |
|
|
Landstar System, Inc. |
4,916 |
309,659 |
|
|
Old Dominion Freight Lines, Inc. (a) |
7,512 |
455,453 |
|
|
Ryder System, Inc. |
5,528 |
454,291 |
|
|
|
5,666,776 |
||
|
Trading Companies & Distributors - 0.9% |
|||
|
Air Lease Corp. Class A |
7,424 |
266,299 |
|
|
Fastenal Co. |
31,322 |
1,568,606 |
|
|
GATX Corp. |
4,934 |
323,818 |
|
|
HD Supply Holdings, Inc. (a) |
6,519 |
168,060 |
|
|
MRC Global, Inc. (a) |
8,782 |
256,347 |
|
|
MSC Industrial Direct Co., Inc. Class A |
4,980 |
453,479 |
|
|
Common Stocks - continued |
|||
|
Shares |
Value |
||
|
INDUSTRIALS - continued |
|||
|
Trading Companies & Distributors - continued |
|||
|
United Rentals, Inc. (a)(d) |
9,911 |
$ 929,949 |
|
|
W.W. Grainger, Inc. |
6,225 |
1,583,640 |
|
|
WESCO International, Inc. (a) |
4,672 |
410,108 |
|
|
|
5,960,306 |
||
|
TOTAL INDUSTRIALS |
84,832,876 |
||
|
INFORMATION TECHNOLOGY - 13.3% |
|||
|
Communications Equipment - 1.0% |
|||
|
Brocade Communications Systems, Inc. (a) |
46,991 |
437,486 |
|
|
CommScope Holding Co., Inc. |
4,294 |
114,564 |
|
|
EchoStar Holding Corp. Class A (a) |
4,331 |
194,722 |
|
|
F5 Networks, Inc. (a)(d) |
7,951 |
836,207 |
|
|
Harris Corp. |
11,525 |
847,318 |
|
|
JDS Uniphase Corp. (a) |
24,585 |
311,492 |
|
|
Juniper Networks, Inc. (a) |
50,012 |
1,234,796 |
|
|
Motorola Solutions, Inc. |
23,884 |
1,518,545 |
|
|
Palo Alto Networks, Inc. (a) |
3,713 |
236,073 |
|
|
Polycom, Inc. (a) |
14,652 |
180,220 |
|
|
Riverbed Technology, Inc. (a) |
17,201 |
334,559 |
|
|
|
6,245,982 |
||
|
Electronic Equipment & Components - 1.1% |
|||
|
Amphenol Corp. Class A |
16,876 |
1,609,127 |
|
|
Arrow Electronics, Inc. (a)(d) |
11,082 |
628,904 |
|
|
Avnet, Inc. |
14,499 |
625,342 |
|
|
AVX Corp. |
4,775 |
63,746 |
|
|
CDW Corp. |
2,885 |
81,328 |
|
|
Dolby Laboratories, Inc. Class A (a)(d) |
4,834 |
192,635 |
|
|
FLIR Systems, Inc. |
15,013 |
511,043 |
|
|
Ingram Micro, Inc. Class A (a) |
16,116 |
434,487 |
|
|
IPG Photonics Corp. (a)(d) |
3,428 |
221,552 |
|
|
Jabil Circuit, Inc. |
21,332 |
368,190 |
|
|
Knowles Corp. (a) |
9,079 |
253,576 |
|
|
National Instruments Corp. |
10,237 |
279,572 |
|
|
Tech Data Corp. (a) |
4,008 |
250,460 |
|
|
Trimble Navigation Ltd. (a)(d) |
27,016 |
1,038,225 |
|
|
Vishay Intertechnology, Inc. |
13,934 |
198,141 |
|
|
Zebra Technologies Corp. Class A (a) |
5,350 |
371,504 |
|
|
|
7,127,832 |
||
|
Common Stocks - continued |
|||
|
Shares |
Value |
||
|
INFORMATION TECHNOLOGY - continued |
|||
|
Internet Software & Services - 0.9% |
|||
|
Akamai Technologies, Inc. (a) |
18,779 |
$ 996,602 |
|
|
AOL, Inc. (a) |
8,173 |
349,886 |
|
|
Equinix, Inc. (a)(d) |
5,199 |
976,424 |
|
|
IAC/InterActiveCorp |
7,901 |
523,678 |
|
|
LinkedIn Corp. (a) |
10,227 |
1,569,538 |
|
|
Pandora Media, Inc. (a) |
16,070 |
376,359 |
|
|
Rackspace Hosting, Inc. (a)(d) |
11,884 |
344,874 |
|
|
VeriSign, Inc. (a)(d) |
13,733 |
647,923 |
|
|
|
5,785,284 |
||
|
IT Services - 2.7% |
|||
|
Alliance Data Systems Corp. (a)(d) |
5,497 |
1,329,724 |
|
|
Amdocs Ltd. |
16,901 |
786,404 |
|
|
Booz Allen Hamilton Holding Corp. Class A |
3,223 |
74,903 |
|
|
Broadridge Financial Solutions, Inc. |
12,816 |
491,365 |
|
|
Computer Sciences Corp. |
15,875 |
939,483 |
|
|
CoreLogic, Inc. (a) |
10,125 |
283,804 |
|
|
DST Systems, Inc. |
3,592 |
331,146 |
|
|
Fidelity National Information Services, Inc. |
30,991 |
1,655,849 |
|
|
Fiserv, Inc. (a) |
26,594 |
1,616,383 |
|
|
FleetCor Technologies, Inc. (a) |
7,135 |
814,318 |
|
|
Gartner, Inc. Class A (a) |
9,922 |
684,023 |
|
|
Genpact Ltd. (a) |
17,698 |
298,388 |
|
|
Global Payments, Inc. |
7,615 |
508,910 |
|
|
Jack Henry & Associates, Inc. |
9,136 |
503,942 |
|
|
Leidos Holdings, Inc. |
7,140 |
265,894 |
|
|
Neustar, Inc. Class A (a)(d) |
6,379 |
164,068 |
|
|
Paychex, Inc. |
34,371 |
1,437,052 |
|
|
Science Applications International Corp. |
4,425 |
172,575 |
|
|
Teradata Corp. (a)(d) |
17,144 |
779,366 |
|
|
The Western Union Co. |
58,866 |
934,203 |
|
|
Total System Services, Inc. |
17,251 |
548,064 |
|
|
Vantiv, Inc. (a)(d) |
9,261 |
284,776 |
|
|
VeriFone Systems, Inc. (a) |
11,430 |
382,219 |
|
|
Xerox Corp. |
129,757 |
1,568,762 |
|
|
|
16,855,621 |
||
|
Semiconductors & Semiconductor Equipment - 3.6% |
|||
|
Advanced Micro Devices, Inc. (a)(d) |
63,743 |
260,709 |
|
|
Altera Corp. |
33,877 |
1,101,680 |
|
|
Analog Devices, Inc. |
32,595 |
1,671,798 |
|
|
Applied Materials, Inc. |
126,997 |
2,420,563 |
|
|
Common Stocks - continued |
|||
|
Shares |
Value |
||
|
INFORMATION TECHNOLOGY - continued |
|||
|
Semiconductors & Semiconductor Equipment - continued |
|||
|
Atmel Corp. (a) |
45,111 |
$ 350,512 |
|
|
Avago Technologies Ltd. |
26,011 |
1,651,699 |
|
|
Cree, Inc. (a)(d) |
12,395 |
584,672 |
|
|
Fairchild Semiconductor International, Inc. (a) |
13,083 |
166,547 |
|
|
First Solar, Inc. (a)(d) |
7,165 |
483,566 |
|
|
Freescale Semiconductor, Inc. (a)(d) |
6,794 |
149,264 |
|
|
KLA-Tencor Corp. |
17,560 |
1,123,664 |
|
|
Lam Research Corp. |
17,111 |
985,765 |
|
|
Linear Technology Corp. |
24,708 |
1,099,506 |
|
|
LSI Corp. |
57,946 |
645,518 |
|
|
Marvell Technology Group Ltd. |
41,414 |
656,826 |
|
|
Maxim Integrated Products, Inc. |
30,570 |
991,691 |
|
|
Microchip Technology, Inc. |
20,875 |
992,398 |
|
|
Micron Technology, Inc. (a) |
108,810 |
2,842,117 |
|
|
NVIDIA Corp. |
61,111 |
1,128,720 |
|
|
ON Semiconductor Corp. (a) |
47,755 |
449,375 |
|
|
Silicon Laboratories, Inc. (a) |
4,453 |
200,162 |
|
|
Skyworks Solutions, Inc. |
20,073 |
823,997 |
|
|
Teradyne, Inc. |
20,238 |
357,605 |
|
|
Xilinx, Inc. |
27,895 |
1,316,365 |
|
|
|
22,454,719 |
||
|
Software - 2.8% |
|||
|
Activision Blizzard, Inc. |
27,966 |
559,600 |
|
|
ANSYS, Inc. (a) |
9,853 |
751,882 |
|
|
Autodesk, Inc. (a) |
23,616 |
1,134,040 |
|
|
CA Technologies, Inc. |
34,619 |
1,043,417 |
|
|
Cadence Design Systems, Inc. (a)(d) |
29,964 |
466,240 |
|
|
Citrix Systems, Inc. (a) |
19,771 |
1,172,618 |
|
|
Compuware Corp. |
22,638 |
234,530 |
|
|
Concur Technologies, Inc. (a)(d) |
4,940 |
397,522 |
|
|
Electronic Arts, Inc. (a) |
31,971 |
904,779 |
|
|
FactSet Research Systems, Inc. (d) |
4,650 |
495,225 |
|
|
FireEye, Inc. (d) |
1,856 |
72,867 |
|
|
Fortinet, Inc. (a) |
14,380 |
316,072 |
|
|
Informatica Corp. (a) |
11,478 |
406,895 |
|
|
Intuit, Inc. |
31,368 |
2,376,126 |
|
|
MICROS Systems, Inc. (a) |
8,324 |
428,686 |
|
|
NetSuite, Inc. (a) |
3,724 |
287,902 |
|
|
Nuance Communications, Inc. (a)(d) |
27,639 |
444,712 |
|
|
Red Hat, Inc. (a) |
19,915 |
968,865 |
|
|
Common Stocks - continued |
|||
|
Shares |
Value |
||
|
INFORMATION TECHNOLOGY - continued |
|||
|
Software - continued |
|||
|
Rovi Corp. (a) |
10,109 |
$ 225,330 |
|
|
ServiceNow, Inc. (a)(d) |
8,784 |
436,740 |
|
|
SolarWinds, Inc. (a) |
6,946 |
280,063 |
|
|
Solera Holdings, Inc. |
7,291 |
472,311 |
|
|
Splunk, Inc. (a) |
11,864 |
647,418 |
|
|
Symantec Corp. |
73,578 |
1,492,162 |
|
|
Synopsys, Inc. (a) |
16,276 |
612,303 |
|
|
Tableau Software, Inc. |
1,120 |
61,902 |
|
|
TIBCO Software, Inc. (a) |
17,414 |
341,837 |
|
|
Workday, Inc. Class A (a)(d) |
4,277 |
312,520 |
|
|
Zynga, Inc. (a) |
63,647 |
257,770 |
|
|
|
17,602,334 |
||
|
Technology Hardware, Storage & Peripherals - 1.2% |
|||
|
3D Systems Corp. (a)(d) |
10,559 |
499,863 |
|
|
Diebold, Inc. |
6,687 |
251,498 |
|
|
Lexmark International, Inc. Class A |
6,674 |
286,982 |
|
|
NCR Corp. (a) |
17,392 |
530,630 |
|
|
NetApp, Inc. |
35,927 |
1,279,360 |
|
|
Nimble Storage, Inc. (d) |
983 |
24,231 |
|
|
SanDisk Corp. |
23,864 |
2,027,724 |
|
|
Stratasys Ltd. (a)(d) |
3,731 |
361,422 |
|
|
Western Digital Corp. |
22,320 |
1,967,062 |
|
|
|
7,228,772 |
||
|
TOTAL INFORMATION TECHNOLOGY |
83,300,544 |
||
|
MATERIALS - 5.7% |
|||
|
Chemicals - 2.5% |
|||
|
Airgas, Inc. |
6,871 |
730,112 |
|
|
Albemarle Corp. |
8,588 |
575,740 |
|
|
Ashland, Inc. |
8,298 |
801,587 |
|
|
Cabot Corp. |
6,794 |
392,693 |
|
|
Celanese Corp. Class A |
16,867 |
1,036,140 |
|
|
CF Industries Holdings, Inc. |
5,859 |
1,436,451 |
|
|
Cytec Industries, Inc. |
3,862 |
368,126 |
|
|
Eastman Chemical Co. |
16,359 |
1,426,014 |
|
|
FMC Corp. |
14,389 |
1,107,953 |
|
|
Huntsman Corp. |
20,456 |
512,423 |
|
|
International Flavors & Fragrances, Inc. |
8,560 |
843,331 |
|
|
Kronos Worldwide, Inc. (d) |
2,071 |
32,411 |
|
|
Common Stocks - continued |
|||
|
Shares |
Value |
||
|
MATERIALS - continued |
|||
|
Chemicals - continued |
|||
|
NewMarket Corp. |
1,000 |
$ 372,320 |
|
|
Rockwood Holdings, Inc. |
7,742 |
550,069 |
|
|
RPM International, Inc. |
14,034 |
598,690 |
|
|
Sherwin-Williams Co. |
9,353 |
1,869,104 |
|
|
Sigma Aldrich Corp. |
12,692 |
1,221,097 |
|
|
The Scotts Miracle-Gro Co. Class A |
4,567 |
279,546 |
|
|
Valspar Corp. |
8,946 |
653,416 |
|
|
W.R. Grace & Co. (a) |
8,021 |
738,734 |
|
|
Westlake Chemical Corp. |
4,309 |
306,801 |
|
|
|
15,852,758 |
||
|
Construction Materials - 0.3% |
|||
|
Eagle Materials, Inc. |
5,238 |
436,483 |
|
|
Martin Marietta Materials, Inc. (d) |
4,869 |
605,363 |
|
|
Vulcan Materials Co. |
13,731 |
886,061 |
|
|
|
1,927,907 |
||
|
Containers & Packaging - 1.2% |
|||
|
Aptargroup, Inc. |
7,066 |
476,390 |
|
|
Avery Dennison Corp. |
10,582 |
514,920 |
|
|
Ball Corp. |
14,879 |
836,051 |
|
|
Bemis Co., Inc. |
10,745 |
432,379 |
|
|
Crown Holdings, Inc. (a) |
15,091 |
711,842 |
|
|
Greif, Inc. Class A |
3,364 |
182,295 |
|
|
MeadWestvaco Corp. |
17,685 |
690,953 |
|
|
Owens-Illinois, Inc. (a) |
17,451 |
554,593 |
|
|
Packaging Corp. of America |
10,286 |
685,356 |
|
|
Rock-Tenn Co. Class A |
7,546 |
721,473 |
|
|
Sealed Air Corp. |
20,641 |
708,193 |
|
|
Silgan Holdings, Inc. |
4,680 |
232,830 |
|
|
Sonoco Products Co. |
10,569 |
444,744 |
|
|
|
7,192,019 |
||
|
Metals & Mining - 1.3% |
|||
|
Alcoa, Inc. |
123,667 |
1,665,794 |
|
|
Allegheny Technologies, Inc. (d) |
11,403 |
469,804 |
|
|
Carpenter Technology Corp. |
4,945 |
310,546 |
|
|
Cliffs Natural Resources, Inc. (d) |
16,172 |
286,568 |
|
|
Compass Minerals International, Inc. |
3,516 |
322,066 |
|
|
Newmont Mining Corp. |
51,987 |
1,290,837 |
|
|
Nucor Corp. |
33,520 |
1,734,660 |
|
|
Reliance Steel & Aluminum Co. |
8,112 |
574,492 |
|
|
Royal Gold, Inc. |
6,783 |
449,035 |
|
|
Common Stocks - continued |
|||
|
Shares |
Value |
||
|
MATERIALS - continued |
|||
|
Metals & Mining - continued |
|||
|
Steel Dynamics, Inc. |
23,344 |
$ 426,495 |
|
|
Tahoe Resources, Inc. (a) |
8,990 |
200,051 |
|
|
United States Steel Corp. (d) |
15,197 |
395,426 |
|
|
|
8,125,774 |
||
|
Paper & Forest Products - 0.4% |
|||
|
Domtar Corp. |
3,482 |
325,080 |
|
|
International Paper Co. |
46,984 |
2,191,804 |
|
|
|
2,516,884 |
||
|
TOTAL MATERIALS |
35,615,342 |
||
|
TELECOMMUNICATION SERVICES - 0.7% |
|||
|
Diversified Telecommunication Services - 0.4% |
|||
|
Frontier Communications Corp. (d) |
105,534 |
627,927 |
|
|
Intelsat SA (d) |
2,400 |
43,632 |
|
|
Level 3 Communications, Inc. (a) |
18,097 |
778,714 |
|
|
TW Telecom, Inc. (a) |
14,971 |
459,460 |
|
|
Windstream Holdings, Inc. (d) |
62,656 |
568,290 |
|
|
|
2,478,023 |
||
|
Wireless Telecommunication Services - 0.3% |
|||
|
SBA Communications Corp. Class A (a) |
13,498 |
1,211,580 |
|
|
T-Mobile U.S., Inc. (a) |
19,981 |
585,243 |
|
|
Telephone & Data Systems, Inc. |
10,005 |
272,036 |
|
|
U.S. Cellular Corp. (d) |
1,247 |
51,800 |
|
|
|
2,120,659 |
||
|
TOTAL TELECOMMUNICATION SERVICES |
4,598,682 |
||
|
UTILITIES - 6.1% |
|||
|
Electric Utilities - 2.2% |
|||
|
Edison International |
34,415 |
1,946,512 |
|
|
Entergy Corp. |
18,812 |
1,363,870 |
|
|
FirstEnergy Corp. |
44,172 |
1,490,805 |
|
|
Great Plains Energy, Inc. |
16,361 |
438,966 |
|
|
Hawaiian Electric Industries, Inc. (d) |
10,207 |
244,866 |
|
|
ITC Holdings Corp. |
16,536 |
611,336 |
|
|
Northeast Utilities |
33,225 |
1,570,214 |
|
|
OGE Energy Corp. |
20,854 |
778,480 |
|
|
Pepco Holdings, Inc. |
26,321 |
704,350 |
|
|
Pinnacle West Capital Corp. |
11,516 |
644,320 |
|
|
Common Stocks - continued |
|||
|
Shares |
Value |
||
|
UTILITIES - continued |
|||
|
Electric Utilities - continued |
|||
|
PPL Corp. |
66,698 |
$ 2,223,711 |
|
|
Westar Energy, Inc. |
13,489 |
483,985 |
|
|
Xcel Energy, Inc. |
52,478 |
1,672,474 |
|
|
|
14,173,889 |
||
|
Gas Utilities - 0.5% |
|||
|
AGL Resources, Inc. |
12,497 |
674,838 |
|
|
Atmos Energy Corp. |
10,473 |
534,542 |
|
|
National Fuel Gas Co. |
7,786 |
573,361 |
|
|
ONE Gas, Inc. |
5,447 |
199,251 |
|
|
Questar Corp. |
18,474 |
448,549 |
|
|
UGI Corp. |
12,000 |
560,280 |
|
|
|
2,990,821 |
||
|
Independent Power Producers & Energy Traders - 0.5% |
|||
|
Calpine Corp. (a) |
38,737 |
888,239 |
|
|
NRG Energy, Inc. |
34,065 |
1,114,607 |
|
|
The AES Corp. |
65,568 |
947,458 |
|
|
|
2,950,304 |
||
|
Multi-Utilities - 2.7% |
|||
|
Alliant Energy Corp. |
11,729 |
685,912 |
|
|
Ameren Corp. |
25,649 |
1,059,560 |
|
|
CenterPoint Energy, Inc. |
45,257 |
1,120,563 |
|
|
CMS Energy Corp. |
28,179 |
854,105 |
|
|
Consolidated Edison, Inc. |
30,928 |
1,794,752 |
|
|
DTE Energy Co. |
18,361 |
1,434,729 |
|
|
Integrys Energy Group, Inc. |
8,361 |
512,362 |
|
|
MDU Resources Group, Inc. |
19,906 |
705,071 |
|
|
NiSource, Inc. |
32,952 |
1,196,817 |
|
|
Public Service Enterprise Group, Inc. |
53,429 |
2,188,986 |
|
|
SCANA Corp. |
14,700 |
789,096 |
|
|
Sempra Energy |
25,705 |
2,534,770 |
|
|
TECO Energy, Inc. (d) |
23,025 |
413,529 |
|
|
Vectren Corp. |
8,726 |
354,014 |
|
|
Wisconsin Energy Corp. |
24,160 |
1,171,277 |
|
|
|
16,815,543 |
||
|
Common Stocks - continued |
|||
|
Shares |
Value |
||
|
UTILITIES - continued |
|||
|
Water Utilities - 0.2% |
|||
|
American Water Works Co., Inc. |
18,776 |
$ 854,871 |
|
|
Aqua America, Inc. (d) |
18,524 |
464,767 |
|
|
|
1,319,638 |
||
|
TOTAL UTILITIES |
38,250,195 |
||
|
TOTAL COMMON STOCKS (Cost $529,003,341) |
|
||
|
U.S. Treasury Obligations - 0.0% |
|||
|
|
Principal Amount |
|
|
|
U.S. Treasury Bills, yield at date of purchase 0.09% 7/24/14 (e) |
$ 300,000 |
|
|
|
Money Market Funds - 9.8% |
|||
|
Shares |
|
||
|
Fidelity Cash Central Fund, 0.11% (b) |
5,846,189 |
5,846,189 |
|
|
Fidelity Securities Lending Cash Central Fund, 0.10% (b)(c) |
55,676,889 |
55,676,889 |
|
|
TOTAL MONEY MARKET FUNDS (Cost $61,523,078) |
|
||
|
TOTAL INVESTMENT PORTFOLIO - 109.5% (Cost $590,826,360) |
687,307,683 |
||
|
NET OTHER ASSETS (LIABILITIES) - (9.5)% |
(59,904,269) |
||
|
NET ASSETS - 100% |
$ 627,403,414 |
||
|
Futures Contracts |
|||||
|
|
Expiration Date |
Underlying Face Amount at Value |
Unrealized Appreciation/ |
||
|
Purchased |
|||||
|
Equity Index Contracts |
|||||
|
21 CME E-mini S&P MidCap 400 Index Contracts (United States) |
June 2014 |
$ 2,841,510 |
$ 44,914 |
||
|
|
|
The face value of futures purchased as a percentage of net assets is 0.5% |
|
Legend |
|
(a) Non-income producing |
|
(b) Affiliated fund that is generally available only to investment companies and other accounts managed by Fidelity Investments. The rate quoted is the annualized seven-day yield of the fund at period end. A complete unaudited listing of the fund's holdings as of its most recent quarter end is available upon request. In addition, each Fidelity Central Fund's financial statements, which are not covered by the Fund's Report of Independent Registered Public Accounting Firm, are available on the SEC's website or upon request. |
|
(c) Investment made with cash collateral received from securities on loan. |
|
(d) Security or a portion of the security is on loan at period end. |
|
(e) Security or a portion of the security was pledged to cover margin requirements for futures contracts. At period end, the value of securities pledged amounted to $299,990. |
|
Affiliated Central Funds |
|
Information regarding fiscal year to date income earned by the Fund from investments in Fidelity Central Funds is as follows: |
|
Fund |
Income earned |
|
Fidelity Cash Central Fund |
$ 6,608 |
|
Fidelity Securities Lending Cash Central Fund |
131,099 |
|
Total |
$ 137,707 |
|
Other Information |
|
The following is a summary of the inputs used, as of April 30, 2014, involving the Fund's assets and liabilities carried at fair value. The inputs or methodology used for valuing securities may not be an indication of the risk associated with investing in those securities. For more information on valuation inputs, and their aggregation into the levels used in the table below, please refer to the Investment Valuation section in the accompanying Notes to Financial Statements. |
|
Valuation Inputs at Reporting Date: |
||||
|
Description |
Total |
Level 1 |
Level 2 |
Level 3 |
|
Investments in Securities: |
||||
|
Equities: |
||||
|
Consumer Discretionary |
$ 104,383,898 |
$ 104,383,898 |
$ - |
$ - |
|
Consumer Staples |
35,601,577 |
35,601,577 |
- |
- |
|
Energy |
44,786,416 |
44,786,416 |
- |
- |
|
Financials |
125,219,693 |
125,219,693 |
- |
- |
|
Health Care |
68,895,392 |
68,895,392 |
- |
- |
|
Industrials |
84,832,876 |
84,832,876 |
- |
- |
|
Information Technology |
83,300,544 |
83,300,544 |
- |
- |
|
Materials |
35,615,342 |
35,615,342 |
- |
- |
|
Telecommunication Services |
4,598,682 |
4,598,682 |
- |
- |
|
Utilities |
38,250,195 |
38,250,195 |
- |
- |
|
U.S. Government and Government Agency Obligations |
299,990 |
- |
299,990 |
- |
|
Money Market Funds |
61,523,078 |
61,523,078 |
- |
- |
|
Total Investments in Securities: |
$ 687,307,683 |
$ 687,007,693 |
$ 299,990 |
$ - |
|
Derivative Instruments: |
||||
|
Assets |
||||
|
Futures Contracts |
$ 44,914 |
$ 44,914 |
$ - |
$ - |
|
Value of Derivative Instruments |
|
The following table is a summary of the Fund's value of derivative instruments by primary risk exposure as of April 30, 2014. For additional information on derivative instruments, please refer to the Derivative Instruments section in the accompanying Notes to Financial Statements. |
|
Primary Risk Exposure / |
Value |
|
|
|
Asset |
Liability |
|
Equity Risk |
||
|
Futures Contracts (a) |
$ 44,914 |
$ - |
|
Total Value of Derivatives |
$ 44,914 |
$ - |
|
(a) Reflects gross cumulative appreciation (depreciation) on futures contracts as presented in the Schedule of Investments. Only the period end receivable or payable for daily variation margin and net unrealized appreciation (depreciation) are presented in the Statement of Assets and Liabilities. |
See accompanying notes which are an integral part of the financial statements.
Annual Report
Spartan Mid Cap Index Fund
Financial Statements
Statement of Assets and Liabilities
|
|
April 30, 2014 |
|
|
|
|
|
|
Assets |
|
|
|
Investment in securities, at value (including securities loaned of $54,781,279) - See accompanying schedule: Unaffiliated issuers (cost $529,303,282) |
$ 625,784,605 |
|
|
Fidelity Central Funds (cost $61,523,078) |
61,523,078 |
|
|
Total Investments (cost $590,826,360) |
|
$ 687,307,683 |
|
Segregated cash with brokers for derivative instruments |
|
72,014 |
|
Receivable for investments sold |
|
765,023 |
|
Receivable for fund shares sold |
|
1,783,910 |
|
Dividends receivable |
|
223,400 |
|
Distributions receivable from Fidelity Central Funds |
|
20,916 |
|
Receivable for daily variation margin for derivative instruments |
|
35,978 |
|
Receivable from investment adviser for expense reductions |
|
59,103 |
|
Other receivables |
|
71 |
|
Total assets |
|
690,268,098 |
|
|
|
|
|
Liabilities |
|
|
|
Payable for investments purchased |
$ 5,785,724 |
|
|
Payable for fund shares redeemed |
1,301,762 |
|
|
Accrued management fee |
62,043 |
|
|
Other affiliated payables |
38,266 |
|
|
Collateral on securities loaned, at value |
55,676,889 |
|
|
Total liabilities |
|
62,864,684 |
|
|
|
|
|
Net Assets |
|
$ 627,403,414 |
|
Net Assets consist of: |
|
|
|
Paid in capital |
|
$ 527,981,179 |
|
Undistributed net investment income |
|
2,402,433 |
|
Accumulated undistributed net realized gain (loss) on investments |
|
493,565 |
|
Net unrealized appreciation (depreciation) on investments |
|
96,526,237 |
|
Net Assets |
|
$ 627,403,414 |
See accompanying notes which are an integral part of the financial statements.
Annual Report
Statement of Assets and Liabilities - continued
|
|
April 30, 2014 |
|
|
|
|
|
|
Investor Class: |
|
$ 16.26 |
|
|
|
|
|
Fidelity Advantage Class: |
|
$ 16.28 |
|
|
|
|
|
Institutional Class: |
|
$ 16.29 |
|
|
|
|
|
Fidelity Advantage Institutional Class: |
|
$ 16.29 |
See accompanying notes which are an integral part of the financial statements.
Annual Report
Spartan Mid Cap Index Fund
Financial Statements - continued
Statement of Operations
|
|
Year ended April 30, 2014 |
|
|
|
|
|
|
Investment Income |
|
|
|
Dividends |
|
$ 6,790,787 |
|
Interest |
|
254 |
|
Income from Fidelity Central Funds (including $131,099 from security lending) |
|
137,707 |
|
Total income |
|
6,928,748 |
|
|
|
|
|
Expenses |
|
|
|
Management fee |
$ 532,775 |
|
|
Transfer agent fees |
326,053 |
|
|
Independent trustees' compensation |
1,570 |
|
|
Miscellaneous |
744 |
|
|
Total expenses before reductions |
861,142 |
|
|
Expense reductions |
(510,316) |
350,826 |
|
Net investment income (loss) |
|
6,577,922 |
|
Realized and Unrealized Gain (Loss) Net realized gain (loss) on: |
|
|
|
Investment securities: |
|
|
|
Unaffiliated issuers |
3,551,006 |
|
|
Futures contracts |
(24,891) |
|
|
Total net realized gain (loss) |
|
3,526,115 |
|
Change in net unrealized appreciation (depreciation) on: Investment securities |
68,893,513 |
|
|
Futures contracts |
4,937 |
|
|
Total change in net unrealized appreciation (depreciation) |
|
68,898,450 |
|
Net gain (loss) |
|
72,424,565 |
|
Net increase (decrease) in net assets resulting from operations |
|
$ 79,002,487 |
See accompanying notes which are an integral part of the financial statements.
Annual Report
Statement of Changes in Net Assets
|
|
Year ended |
Year ended |
|
Increase (Decrease) in Net Assets |
|
|
|
Operations |
|
|
|
Net investment income (loss) |
$ 6,577,922 |
$ 1,831,291 |
|
Net realized gain (loss) |
3,526,115 |
620,580 |
|
Change in net unrealized appreciation (depreciation) |
68,898,450 |
23,986,390 |
|
Net increase (decrease) in net assets resulting |
79,002,487 |
26,438,261 |
|
Distributions to shareholders from net investment income |
(4,447,495) |
(1,249,909) |
|
Distributions to shareholders from net realized gain |
(3,210,300) |
(309,278) |
|
Total distributions |
(7,657,795) |
(1,559,187) |
|
Share transactions - net increase (decrease) |
308,161,972 |
176,854,037 |
|
Redemption fees |
40,938 |
11,506 |
|
Total increase (decrease) in net assets |
379,547,602 |
201,744,617 |
|
|
|
|
|
Net Assets |
|
|
|
Beginning of period |
247,855,812 |
46,111,195 |
|
End of period (including undistributed net investment income of $2,402,433 and undistributed net investment income of $699,014, respectively) |
$ 627,403,414 |
$ 247,855,812 |
See accompanying notes which are an integral part of the financial statements.
Annual Report
Financial Highlights - Investor Class
|
Years ended April 30, |
2014 |
2013 |
2012 G |
|
Selected Per-Share Data |
|
|
|
|
Net asset value, beginning of period |
$ 13.66 |
$ 11.68 |
$ 10.00 |
|
Income from Investment Operations |
|
|
|
|
Net investment income (loss) D |
.20 |
.18 |
.09 |
|
Net realized and unrealized gain (loss) |
2.65 |
1.99 |
1.64 |
|
Total from investment operations |
2.85 |
2.17 |
1.73 |
|
Distributions from net investment income |
(.13) |
(.15) |
(.05) |
|
Distributions from net realized gain |
(.11) |
(.04) |
- |
|
Total distributions |
(.25) J |
(.19) |
(.05) |
|
Redemption fees added to paid in capital D, I |
- |
- |
- |
|
Net asset value, end of period |
$ 16.26 |
$ 13.66 |
$ 11.68 |
|
Total Return B, C |
20.99% |
18.93% |
17.37% |
|
Ratios to Average Net Assets E, H |
|
|
|
|
Expenses before reductions |
.33% |
.33% |
.33% A |
|
Expenses net of fee waivers, if any |
.22% |
.25% |
.26% A |
|
Expenses net of all reductions |
.22% |
.25% |
.26% A |
|
Net investment income (loss) |
1.35% |
1.56% |
1.24% A |
|
Supplemental Data |
|
|
|
|
Net assets, end of period (000 omitted) |
$ 15,099 |
$ 5,140 |
$ 7,794 |
|
Portfolio turnover rate F |
7% |
5% |
5% A |
A Annualized
B Total returns for periods of less than one year are not annualized.
C Total returns would have been lower if certain expenses had not been reduced during the applicable periods shown.
D Calculated based on average shares outstanding during the period.
E Fees and expenses of any underlying Fidelity Central Funds are not included in the Fund's expense ratio. The Fund indirectly bears its proportionate share of the expenses of any underlying Fidelity Central Funds.
F Amount does not include the portfolio activity of any underlying Fidelity Central Funds.
G For the period September 8, 2011 (commencement of operations) to April 30, 2012.
H Expense ratios reflect operating expenses of the class. Expenses before reductions do not reflect amounts reimbursed by the investment adviser or reductions from expense offset arrangements and do not represent the amount paid by the class during periods when reimbursements or reductions occur. Expenses net of fee waivers reflect expenses after reimbursement by the investment adviser but prior to reductions from expense offset arrangements. Expenses net of all reductions represent the net expenses paid by the class.
I Amount represents less than $.01 per share.
J Total distributions of $.25 per share is comprised of distributions from net investment income of $.134 and distributions from net realized gain of $.111 per share.
See accompanying notes which are an integral part of the financial statements.
Annual Report
Financial Highlights - Fidelity Advantage Class
|
Years ended April 30, |
2014 |
2013 |
2012 G |
|
Selected Per-Share Data |
|
|
|
|
Net asset value, beginning of period |
$ 13.68 |
$ 11.69 |
$ 10.00 |
|
Income from Investment Operations |
|
|
|
|
Net investment income (loss) D |
.23 |
.21 |
.10 |
|
Net realized and unrealized gain (loss) |
2.64 |
1.98 |
1.64 |
|
Total from investment operations |
2.87 |
2.19 |
1.74 |
|
Distributions from net investment income |
(.16) |
(.16) |
(.05) |
|
Distributions from net realized gain |
(.11) |
(.04) |
- |
|
Total distributions |
(.27) |
(.20) |
(.05) |
|
Redemption fees added to paid in capital D, I |
- |
- |
- |
|
Net asset value, end of period |
$ 16.28 |
$ 13.68 |
$ 11.69 |
|
Total Return B, C |
21.14% |
19.10% |
17.48% |
|
Ratios to Average Net Assets E, H |
|
|
|
|
Expenses before reductions |
.20% |
.20% |
.20% A |
|
Expenses net of fee waivers, if any |
.08% |
.09% |
.12% A |
|
Expenses net of all reductions |
.08% |
.09% |
.12% A |
|
Net investment income (loss) |
1.49% |
1.72% |
1.37% A |
|
Supplemental Data |
|
|
|
|
Net assets, end of period (000 omitted) |
$ 519,385 |
$ 198,767 |
$ 18,896 |
|
Portfolio turnover rate F |
7% |
5% |
5% A |
A Annualized
B Total returns for periods of less than one year are not annualized.
C Total returns would have been lower if certain expenses had not been reduced during the applicable periods shown.
D Calculated based on average shares outstanding during the period.
E Fees and expenses of any underlying Fidelity Central Funds are not included in the Fund's expense ratio. The Fund indirectly bears its proportionate share of the expenses of any underlying Fidelity Central Funds.
F Amount does not include the portfolio activity of any underlying Fidelity Central Funds.
G For the period September 8, 2011 (commencement of operations) to April 30, 2012.
H Expense ratios reflect operating expenses of the class. Expenses before reductions do not reflect amounts reimbursed by the investment adviser or reductions from expense offset arrangements and do not represent the amount paid by the class during periods when reimbursements or reductions occur. Expenses net of fee waivers reflect expenses after reimbursement by the investment adviser but prior to reductions from expense offset arrangements. Expenses net of all reductions represent the net expenses paid by the class.
I Amount represents less than $.01 per share.
See accompanying notes which are an integral part of the financial statements.
Annual Report
Financial Highlights - Institutional Class
|
Years ended April 30, |
2014 |
2013 |
2012 G |
|
Selected Per-Share Data |
|
|
|
|
Net asset value, beginning of period |
$ 13.68 |
$ 11.70 |
$ 10.00 |
|
Income from Investment Operations |
|
|
|
|
Net investment income (loss) D |
.23 |
.21 |
.10 |
|
Net realized and unrealized gain (loss) |
2.65 |
1.98 |
1.65 |
|
Total from investment operations |
2.88 |
2.19 |
1.75 |
|
Distributions from net investment income |
(.16) |
(.16) |
(.05) |
|
Distributions from net realized gain |
(.11) |
(.04) |
- |
|
Total distributions |
(.27) |
(.21) J |
(.05) |
|
Redemption fees added to paid in capital D, I |
- |
- |
- |
|
Net asset value, end of period |
$ 16.29 |
$ 13.68 |
$ 11.70 |
|
Total Return B, C |
21.24% |
19.04% |
17.59% |
|
Ratios to Average Net Assets E, H |
|
|
|
|
Expenses before reductions |
.14% |
.14% |
.14% A |
|
Expenses net of fee waivers, if any |
.06% |
.07% |
.08% A |
|
Expenses net of all reductions |
.06% |
.07% |
.08% A |
|
Net investment income (loss) |
1.51% |
1.74% |
1.41% A |
|
Supplemental Data |
|
|
|
|
Net assets, end of period (000 omitted) |
$ 88,657 |
$ 42,952 |
$ 19,312 |
|
Portfolio turnover rate F |
7% |
5% |
5% A |
A Annualized
B Total returns for periods of less than one year are not annualized.
C Total returns would have been lower if certain expenses had not been reduced during the applicable periods shown.
D Calculated based on average shares outstanding during the period.
E Fees and expenses of any underlying Fidelity Central Funds are not included in the Fund's expense ratio. The Fund indirectly bears its proportionate share of the expenses of any underlying Fidelity Central Funds.
F Amount does not include the portfolio activity of any underlying Fidelity Central Funds.
G For the period September 8, 2011 (commencement of operations) to April 30, 2012.
H Expense ratios reflect operating expenses of the class. Expenses before reductions do not reflect amounts reimbursed by the investment adviser or reductions from expense offset arrangements and do not represent the amount paid by the class during periods when reimbursements or reductions occur. Expenses net of fee waivers reflect expenses after reimbursement by the investment adviser but prior to reductions from expense offset arrangements. Expenses net of all reductions represent the net expenses paid by the class.
I Amount represents less than $.01 per share.
J Total distributions of $.21 per share is comprised of distributions from net investment income of $.1639 and distributions from net realized gain of $.044 per share.
See accompanying notes which are an integral part of the financial statements.
Annual Report
Financial Highlights - Fidelity Advantage Institutional Class
|
Years ended April 30, |
2014 |
2013 |
2012 G |
|
Selected Per-Share Data |
|
|
|
|
Net asset value, beginning of period |
$ 13.68 |
$ 11.70 |
$ 10.00 |
|
Income from Investment Operations |
|
|
|
|
Net investment income (loss) D |
.23 |
.22 |
.10 |
|
Net realized and unrealized gain (loss) |
2.65 |
1.97 |
1.65 |
|
Total from investment operations |
2.88 |
2.19 |
1.75 |
|
Distributions from net investment income |
(.16) |
(.17) |
(.05) |
|
Distributions from net realized gain |
(.11) |
(.04) |
- |
|
Total distributions |
(.27) |
(.21) |
(.05) |
|
Redemption fees added to paid in capital D, I |
- |
- |
- |
|
Net asset value, end of period |
$ 16.29 |
$ 13.68 |
$ 11.70 |
|
Total Return B, C |
21.26% |
19.06% |
17.60% |
|
Ratios to Average Net Assets E, H |
|
|
|
|
Expenses before reductions |
.12% |
.12% |
.12% A |
|
Expenses net of fee waivers, if any |
.04% |
.05% |
.06% A |
|
Expenses net of all reductions |
.04% |
.05% |
.06% A |
|
Net investment income (loss) |
1.53% |
1.77% |
1.43% A |
|
Supplemental Data |
|
|
|
|
Net assets, end of period (000 omitted) |
$ 4,263 |
$ 996 |
$ 109 |
|
Portfolio turnover rate F |
7% |
5% |
5% A |
A Annualized
B Total returns for periods of less than one year are not annualized.
C Total returns would have been lower if certain expenses had not been reduced during the applicable periods shown.
D Calculated based on average shares outstanding during the period.
E Fees and expenses of any underlying Fidelity Central Funds are not included in the Fund's expense ratio. The Fund indirectly bears its proportionate share of the expenses of any underlying Fidelity Central Funds.
F Amount does not include the portfolio activity of any underlying Fidelity Central Funds.
G For the period September 8, 2011 (commencement of operations) to April 30, 2012.
H Expense ratios reflect operating expenses of the class. Expenses before reductions do not reflect amounts reimbursed by the investment adviser or reductions from expense offset arrangements and do not represent the amount paid by the class during periods when reimbursements or reductions occur. Expenses net of fee waivers reflect expenses after reimbursement by the investment adviser but prior to reductions from expense offset arrangements. Expenses net of all reductions represent the net expenses paid by the class.
I Amount represents less than $.01 per share.
See accompanying notes which are an integral part of the financial statements.
Annual Report
Spartan Small Cap Index Fund
Performance: The Bottom Line
Average annual total return reflects the change in the value of an investment, assuming reinvestment of the class' distributions from dividend income and capital gains (the profits earned upon the sale of securities that have grown in value, if any) and assuming a constant rate of performance each year. The $10,000 table and the fund's returns do not reflect the deduction of taxes that a shareholder would pay on fund distributions or the redemption of fund shares. During periods of reimbursement by Fidelity, a fund's total return will be greater than it would be had the reimbursement not occurred. How a fund did yesterday is no guarantee of how it will do tomorrow.
Average Annual Total Returns
|
Periods ended April 30, 2014 |
Past 1 |
Life of |
|
Institutional Class |
20.71% |
21.79% |
|
Fidelity Advantage Institutional Class |
20.73% |
21.81% |
A From September 8, 2011.
$10,000 Over Life of Fund
Let's say hypothetically that $10,000 was invested in Spartan Small Cap Index Fund - Institutional Class on September 8, 2011, when the fund started. The chart shows how the value of your investment would have changed, and also shows how the Russell 2000® Index performed over the same period.
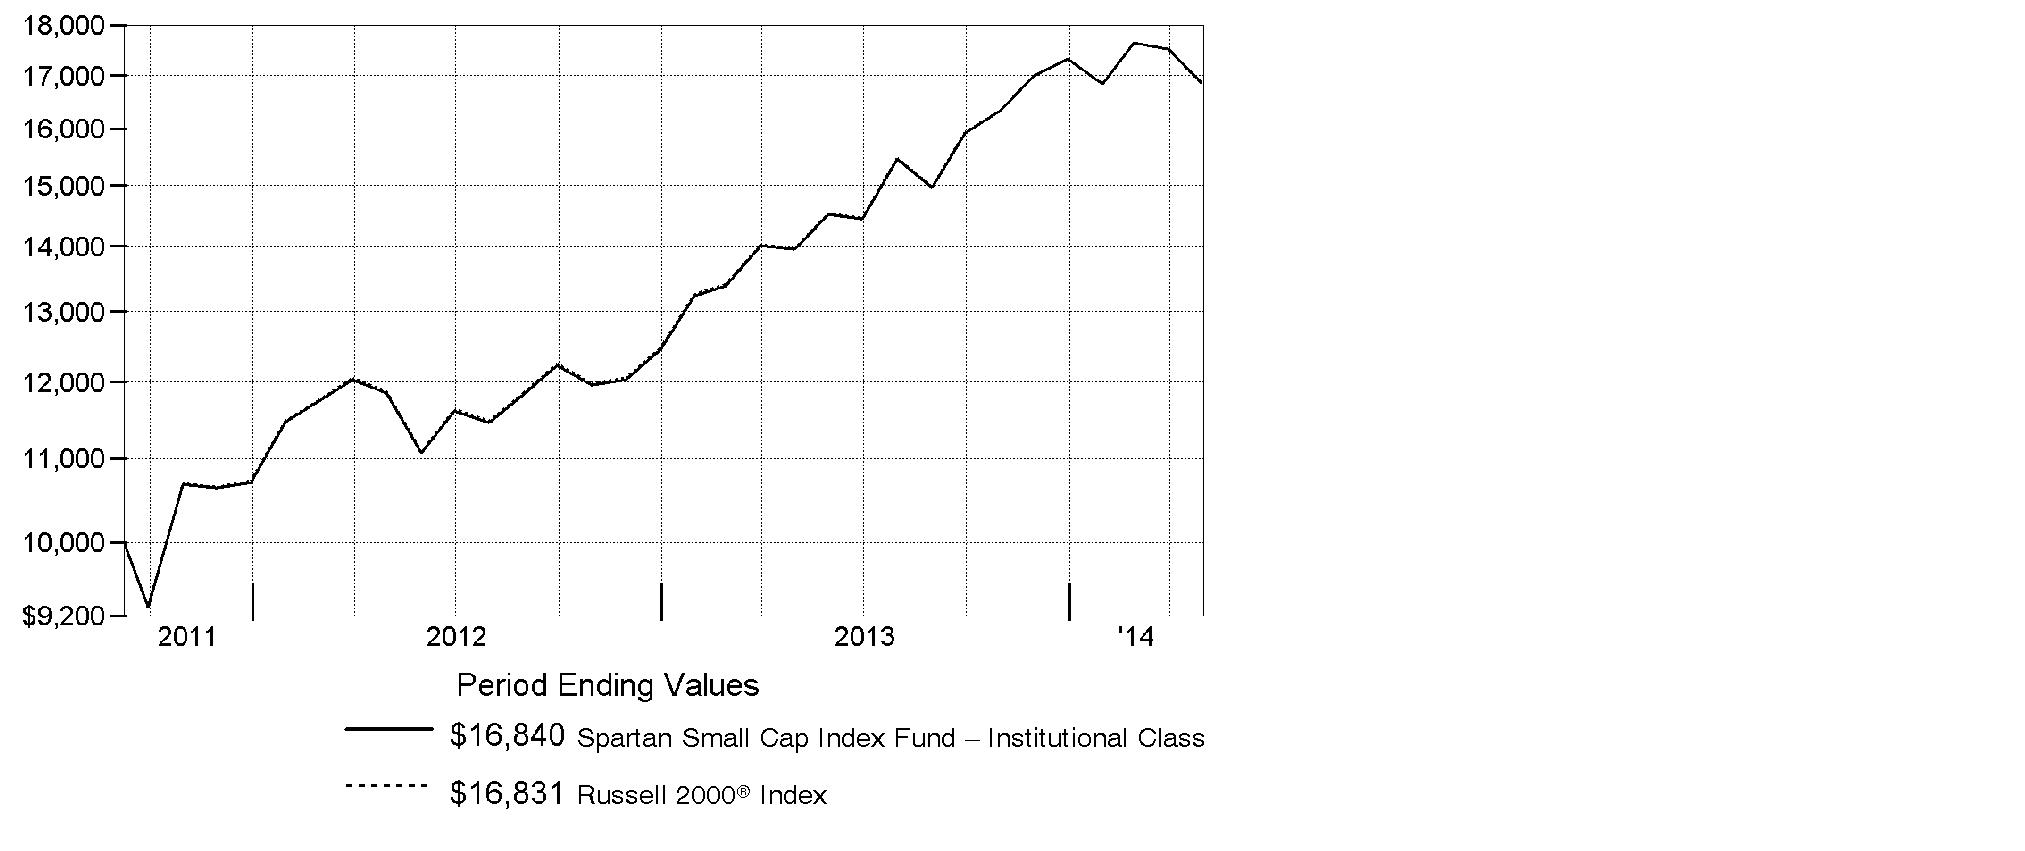
Annual Report
Spartan Small Cap Index Fund
Management's Discussion of Fund Performance
Market Recap: U.S. stocks overcame fears of higher interest rates, slower economic growth and a volatile start to 2014 to post strong gains for the 12 months ending April 30, 2014. The S&P 500® Index returned 20.44%, finishing near its all-time high. U.S. Federal Reserve policies that balanced stimulus reductions with low interest rates contributed to a broad advance, with eight of 10 S&P 500® market sectors posting a double-digit gain. Industrials was the best-performing sector, up about 30%, as demand improved for autos and other durable goods. Health care stocks rose 25%, as new insurance programs and a favorable drug-approval environment raised earnings-growth expectations. Conversely, the typically defensive telecommunication services sector was the only group to lose ground (-3%), while utilities (+8%) lagged. Volatility increased in the first quarter amid rising tension in Ukraine, fear of a slowing economy in China and a late-January decline for momentum stocks. Still, markets finished the period on an uptrend, aided by higher consumer spending and the lowest unemployment since 2008 - both of which helped to take the sting out of weather-beaten first-quarter gross domestic product (GDP) figures. The growth-oriented Nasdaq Composite Index® rose 25.20%, the small-cap Russell 2000® Index returned 20.50% and the Russell Midcap® Index added 21.25%.
Comments from Patrick Waddell, who was named Senior Portfolio Manager of the Geode Capital Management, LLC, investment management team for Spartan® Small Cap Index Fund on April 4, 2014: For the 12-month period ending April 30, 2014, the fund's Institutional Class and Fidelity Advantage® Institutional Class shares gained 20.71% and 20.73%, respectively, in line with the Russell 2000® Index. There were many more contributors than detractors in a strong market during the period, led by Rite Aid. The pharmacy company turned a long-awaited profit in April driven by cost-cutting and higher prescription sales. Its shares are now at their highest point since 2001. In the health care sector, share price of Questcor Pharmaceuticals more than doubled in the period, driven by sales of its multiple sclerosis drug Acthar to treat additional conditions. Another biotechnology company, InterMune, saw its shares more than double in February after it received positive news surrounding a trial of its treatment for idiopathic pulmonary fibrosis, a serious lung ailment. The biggest detractor was CommVault Systems, a provider of information-management software; its shares had a one-day fall of 31% late in the period on weaker-than-expected revenue. Infinity Pharmaceuticals shares also weighed on results, following an early-stage cancer drug trial last June that did not go well, as well as continued operating losses.
The views expressed above reflect those of the portfolio manager(s) only through the end of the period as stated on the cover of this report and do not necessarily represent the views of Fidelity or any other person in the Fidelity organization. Any such views are subject to change at any time based upon market or other conditions and Fidelity disclaims any responsibility to update such views. These views may not be relied on as investment advice and, because investment decisions for a Fidelity fund are based on numerous factors, may not be relied on as an indication of trading intent on behalf of any Fidelity fund.
Annual Report
Spartan Small Cap Index Fund
Investment Changes (Unaudited)
|
Top Ten Stocks as of April 30, 2014 |
||
|
|
% of fund's |
% of fund's net assets |
|
American Realty Capital Properties, Inc. |
0.4 |
0.1 |
|
Acuity Brands, Inc. |
0.3 |
0.3 |
|
Rite Aid Corp. |
0.3 |
0.3 |
|
NorthStar Realty Finance Corp. |
0.3 |
0.1 |
|
SunEdison, Inc. |
0.3 |
0.2 |
|
Middleby Corp. |
0.3 |
0.3 |
|
CoStar Group, Inc. |
0.3 |
0.3 |
|
athenahealth, Inc. |
0.3 |
0.3 |
|
Kate Spade & Co. |
0.3 |
0.2 |
|
Questcor Pharmaceuticals, Inc. |
0.3 |
0.2 |
|
|
3.1 |
|
|
Market Sectors as of April 30, 2014 |
||
|
|
% of fund's |
% of fund's net assets |
|
Financials |
23.4 |
22.6 |
|
Information Technology |
17.1 |
17.6 |
|
Industrials |
14.5 |
14.5 |
|
Consumer Discretionary |
12.8 |
13.7 |
|
Health Care |
12.8 |
12.5 |
|
Energy |
6.0 |
5.9 |
|
Materials |
4.9 |
4.8 |
|
Consumer Staples |
3.8 |
4.0 |
|
Utilities |
3.3 |
3.1 |
|
Telecommunication Services |
0.7 |
0.7 |
Annual Report
Spartan Small Cap Index Fund
Investments April 30, 2014
Showing Percentage of Net Assets
|
Common Stocks - 99.3% |
|||
|
Shares |
Value |
||
|
CONSUMER DISCRETIONARY - 12.8% |
|||
|
Auto Components - 1.1% |
|||
|
American Axle & Manufacturing Holdings, Inc. (a) |
38,057 |
$ 671,706 |
|
|
Cooper Tire & Rubber Co. |
35,841 |
901,401 |
|
|
Dana Holding Corp. |
89,209 |
1,888,555 |
|
|
Dorman Products, Inc. (a)(d) |
14,253 |
820,260 |
|
|
Drew Industries, Inc. |
12,971 |
652,701 |
|
|
Federal-Mogul Corp. Class A (a) |
10,794 |
185,873 |
|
|
Fox Factory Holding Corp. |
5,188 |
88,144 |
|
|
Fuel Systems Solutions, Inc. (a) |
7,940 |
83,211 |
|
|
Gentherm, Inc. (a) |
19,921 |
724,128 |
|
|
Modine Manufacturing Co. (a) |
26,817 |
441,944 |
|
|
Remy International, Inc. |
7,986 |
211,789 |
|
|
Shiloh Industries, Inc. (a) |
3,526 |
69,603 |
|
|
Spartan Motors, Inc. |
19,324 |
102,610 |
|
|
Standard Motor Products, Inc. |
11,012 |
418,346 |
|
|
Stoneridge, Inc. (a) |
15,929 |
170,281 |
|
|
Superior Industries International, Inc. |
12,845 |
271,543 |
|
|
Tenneco, Inc. (a) |
34,360 |
2,057,133 |
|
|
Tower International, Inc. (a) |
3,414 |
94,943 |
|
|
|
9,854,171 |
||
|
Automobiles - 0.0% |
|||
|
Winnebago Industries, Inc. (a) |
15,699 |
375,206 |
|
|
Distributors - 0.3% |
|||
|
Core-Mark Holding Co., Inc. |
6,401 |
515,537 |
|
|
Pool Corp. |
26,190 |
1,545,734 |
|
|
VOXX International Corp. (a) |
11,258 |
132,282 |
|
|
Weyco Group, Inc. |
4,006 |
100,511 |
|
|
|
2,294,064 |
||
|
Diversified Consumer Services - 1.0% |
|||
|
American Public Education, Inc. (a)(d) |
9,853 |
340,914 |
|
|
Ascent Capital Group, Inc. (a) |
7,944 |
546,309 |
|
|
Bridgepoint Education, Inc. (a) |
8,683 |
137,626 |
|
|
Bright Horizons Family Solutions, Inc. (a) |
6,785 |
276,692 |
|
|
Capella Education Co. |
6,349 |
370,528 |
|
|
Career Education Corp. (a) |
30,304 |
218,795 |
|
|
Carriage Services, Inc. |
9,525 |
153,257 |
|
|
Corinthian Colleges, Inc. (a)(d) |
46,351 |
53,304 |
|
|
Education Management Corp. (a)(d) |
13,685 |
54,329 |
|
|
Grand Canyon Education, Inc. (a) |
25,660 |
1,106,459 |
|
|
Hillenbrand, Inc. |
30,814 |
936,746 |
|
|
Houghton Mifflin Harcourt Co. |
11,560 |
236,171 |
|
|
Common Stocks - continued |
|||
|
Shares |
Value |
||
|
CONSUMER DISCRETIONARY - continued |
|||
|
Diversified Consumer Services - continued |
|||
|
ITT Educational Services, Inc. (a)(d) |
13,110 |
$ 353,970 |
|
|
JTH Holding, Inc. Class A (a) |
2,687 |
73,086 |
|
|
K12, Inc. (a)(d) |
15,510 |
367,277 |
|
|
LifeLock, Inc. (a) |
35,879 |
563,300 |
|
|
Lincoln Educational Services Corp. |
12,947 |
52,824 |
|
|
Matthews International Corp. Class A |
15,583 |
628,774 |
|
|
Regis Corp. (d) |
27,111 |
356,239 |
|
|
Sotheby's Class A (Ltd. vtg.) |
38,629 |
1,624,736 |
|
|
Steiner Leisure Ltd. (a) |
8,218 |
354,771 |
|
|
Strayer Education, Inc. (a) |
6,176 |
263,283 |
|
|
Universal Technical Institute, Inc. |
12,839 |
154,196 |
|
|
|
9,223,586 |
||
|
Hotels, Restaurants & Leisure - 2.6% |
|||
|
Biglari Holdings, Inc. |
804 |
344,932 |
|
|
BJ's Restaurants, Inc. (a)(d) |
13,797 |
393,904 |
|
|
Bloomin' Brands, Inc. (a) |
31,325 |
667,849 |
|
|
Bob Evans Farms, Inc. (d) |
14,851 |
696,066 |
|
|
Boyd Gaming Corp. (a) |
38,917 |
459,999 |
|
|
Bravo Brio Restaurant Group, Inc. (a) |
11,117 |
166,421 |
|
|
Buffalo Wild Wings, Inc. (a) |
10,596 |
1,548,288 |
|
|
Caesars Entertainment Corp. (a)(d) |
24,105 |
445,219 |
|
|
Carrols Restaurant Group, Inc. (a) |
13,351 |
89,585 |
|
|
Churchill Downs, Inc. |
7,689 |
675,325 |
|
|
Chuy's Holdings, Inc. (a)(d) |
9,276 |
333,472 |
|
|
ClubCorp Holdings, Inc. |
11,471 |
216,114 |
|
|
Cracker Barrel Old Country Store, Inc. |
11,043 |
1,046,214 |
|
|
Del Frisco's Restaurant Group, Inc. (a) |
5,902 |
153,511 |
|
|
Denny's Corp. (a) |
51,232 |
345,304 |
|
|
Diamond Resorts International, Inc. |
9,914 |
185,491 |
|
|
DineEquity, Inc. |
9,242 |
700,636 |
|
|
Diversified Restaurant Holdings, Inc. (a) |
6,865 |
34,394 |
|
|
Einstein Noah Restaurant Group, Inc. |
4,413 |
67,784 |
|
|
Fiesta Restaurant Group, Inc. (a) |
12,537 |
458,980 |
|
|
Ignite Restaurant Group, Inc. (a)(d) |
4,238 |
59,925 |
|
|
International Speedway Corp. Class A |
15,953 |
501,562 |
|
|
Interval Leisure Group, Inc. |
22,118 |
569,981 |
|
|
Intrawest Resorts Holdings, Inc. |
10,095 |
114,477 |
|
|
Isle of Capri Casinos, Inc. (a) |
10,772 |
73,250 |
|
|
Jack in the Box, Inc. (a) |
23,634 |
1,265,364 |
|
|
Jamba, Inc. (a) |
8,554 |
94,607 |
|
|
Common Stocks - continued |
|||
|
Shares |
Value |
||
|
CONSUMER DISCRETIONARY - continued |
|||
|
Hotels, Restaurants & Leisure - continued |
|||
|
Krispy Kreme Doughnuts, Inc. (a)(d) |
36,569 |
$ 641,420 |
|
|
Life Time Fitness, Inc. (a)(d) |
24,299 |
1,166,352 |
|
|
Luby's, Inc. (a) |
10,172 |
55,132 |
|
|
Marcus Corp. |
10,673 |
178,559 |
|
|
Marriott Vacations Worldwide Corp. (a) |
16,251 |
885,354 |
|
|
Monarch Casino & Resort, Inc. (a) |
4,582 |
73,495 |
|
|
Morgans Hotel Group Co. (a) |
16,393 |
122,948 |
|
|
Multimedia Games Holding Co., Inc. (a) |
16,200 |
473,040 |
|
|
Nathan's Famous, Inc. (a) |
1,709 |
84,220 |
|
|
Noodles & Co. (d) |
3,417 |
112,043 |
|
|
Orient Express Hotels Ltd. Class A (a) |
53,634 |
702,605 |
|
|
Papa John's International, Inc. |
18,063 |
792,243 |
|
|
Pinnacle Entertainment, Inc. (a)(d) |
32,691 |
760,720 |
|
|
Popeyes Louisiana Kitchen, Inc. (a) |
13,309 |
507,073 |
|
|
Potbelly Corp. |
5,089 |
86,513 |
|
|
Red Robin Gourmet Burgers, Inc. (a) |
7,912 |
537,858 |
|
|
Ruby Tuesday, Inc. (a)(d) |
35,344 |
272,502 |
|
|
Ruth's Hospitality Group, Inc. |
19,828 |
249,635 |
|
|
Scientific Games Corp. Class A (a) |
27,342 |
327,557 |
|
|
Sonic Corp. (a) |
31,638 |
602,388 |
|
|
Speedway Motorsports, Inc. |
6,492 |
118,089 |
|
|
Texas Roadhouse, Inc. Class A |
35,154 |
869,710 |
|
|
The Cheesecake Factory, Inc. (d) |
29,734 |
1,334,759 |
|
|
Town Sports International Holdings, Inc. |
14,300 |
100,243 |
|
|
Vail Resorts, Inc. |
20,195 |
1,398,100 |
|
|
|
24,161,212 |
||
|
Household Durables - 1.1% |
|||
|
Bassett Furniture Industries, Inc. |
7,031 |
96,957 |
|
|
Beazer Homes U.S.A., Inc. (a)(d) |
13,831 |
262,236 |
|
|
Blyth, Inc. (d) |
6,054 |
56,726 |
|
|
Cavco Industries, Inc. (a) |
3,832 |
298,704 |
|
|
CSS Industries, Inc. |
4,771 |
114,361 |
|
|
Ethan Allen Interiors, Inc. |
13,675 |
332,029 |
|
|
EveryWare Global, Inc. (a)(d) |
3,681 |
10,012 |
|
|
Flexsteel Industries, Inc. |
2,711 |
93,042 |
|
|
Helen of Troy Ltd. (a) |
18,048 |
1,131,610 |
|
|
Hooker Furniture Corp. |
6,516 |
90,247 |
|
|
Hovnanian Enterprises, Inc. Class A (a)(d) |
64,457 |
287,478 |
|
|
Installed Building Products, Inc. (a) |
4,859 |
67,589 |
|
|
iRobot Corp. (a)(d) |
15,748 |
527,558 |
|
|
Common Stocks - continued |
|||
|
Shares |
Value |
||
|
CONSUMER DISCRETIONARY - continued |
|||
|
Household Durables - continued |
|||
|
KB Home |
46,765 |
$ 772,090 |
|
|
La-Z-Boy, Inc. |
29,806 |
722,199 |
|
|
LGI Homes, Inc. |
5,351 |
78,767 |
|
|
Libbey, Inc. (a) |
11,519 |
307,212 |
|
|
Lifetime Brands, Inc. |
6,232 |
119,031 |
|
|
M.D.C. Holdings, Inc. (d) |
21,859 |
603,308 |
|
|
M/I Homes, Inc. (a)(d) |
13,402 |
298,463 |
|
|
Meritage Homes Corp. (a) |
21,793 |
840,774 |
|
|
NACCO Industries, Inc. Class A |
2,649 |
141,960 |
|
|
New Home Co. LLC (a) |
5,050 |
69,438 |
|
|
Ryland Group, Inc. |
26,247 |
1,007,622 |
|
|
Skullcandy, Inc. (a) |
10,425 |
80,273 |
|
|
Standard Pacific Corp. (a)(d) |
82,478 |
658,999 |
|
|
TRI Pointe Homes, Inc. (a)(d) |
8,263 |
132,786 |
|
|
UCP, Inc. |
5,101 |
72,179 |
|
|
Universal Electronics, Inc. (a) |
8,914 |
332,938 |
|
|
WCI Communities, Inc. |
3,763 |
72,137 |
|
|
William Lyon Homes, Inc. (a) |
7,531 |
196,559 |
|
|
Zagg, Inc. (a)(d) |
18,320 |
79,692 |
|
|
|
9,954,976 |
||
|
Internet & Catalog Retail - 0.4% |
|||
|
1-800-FLOWERS.com, Inc. Class A (a) |
16,880 |
91,996 |
|
|
Blue Nile, Inc. (a)(d) |
6,826 |
237,067 |
|
|
FTD Companies, Inc. (a)(d) |
10,167 |
308,467 |
|
|
HSN, Inc. |
19,130 |
1,110,305 |
|
|
NutriSystem, Inc. |
15,894 |
238,410 |
|
|
Orbitz Worldwide, Inc. (a) |
13,637 |
100,232 |
|
|
Overstock.com, Inc. (a) |
6,236 |
99,901 |
|
|
PetMed Express, Inc. (d) |
10,826 |
141,712 |
|
|
RetailMeNot, Inc. |
5,611 |
167,264 |
|
|
Shutterfly, Inc. (a)(d) |
21,542 |
881,714 |
|
|
ValueVision Media, Inc. Class A (a) |
22,083 |
103,348 |
|
|
Vitacost.com, Inc. (a) |
12,141 |
80,980 |
|
|
|
3,561,396 |
||
|
Leisure Products - 0.5% |
|||
|
Arctic Cat, Inc. |
7,392 |
302,259 |
|
|
Black Diamond, Inc. (a)(d) |
12,554 |
139,977 |
|
|
Brunswick Corp. |
51,047 |
2,051,579 |
|
|
Callaway Golf Co. (d) |
43,180 |
376,098 |
|
|
JAKKS Pacific, Inc. (d) |
11,689 |
102,396 |
|
|
Common Stocks - continued |
|||
|
Shares |
Value |
||
|
CONSUMER DISCRETIONARY - continued |
|||
|
Leisure Products - continued |
|||
|
Johnson Outdoors, Inc. Class A |
2,606 |
$ 54,544 |
|
|
Leapfrog Enterprises, Inc. Class A (a)(d) |
34,935 |
239,305 |
|
|
Malibu Boats, Inc. Class A (a) |
4,630 |
103,064 |
|
|
Marine Products Corp. |
5,268 |
37,403 |
|
|
Nautilus, Inc. (a) |
17,383 |
144,800 |
|
|
Smith & Wesson Holding Corp. (a)(d) |
31,164 |
478,367 |
|
|
Sturm, Ruger & Co., Inc. (d) |
10,800 |
694,980 |
|
|
|
4,724,772 |
||
|
Media - 1.3% |
|||
|
A.H. Belo Corp. Class A |
10,515 |
121,028 |
|
|
AMC Entertainment Hld, Inc. Class A |
11,759 |
272,103 |
|
|
Beasley Broadcast Group, Inc. Class A |
1,578 |
12,151 |
|
|
Carmike Cinemas, Inc. (a) |
12,891 |
382,347 |
|
|
Central European Media Enterprises Ltd. Class A (a)(d) |
42,117 |
115,401 |
|
|
Crown Media Holdings, Inc. Class A (a) |
20,582 |
73,684 |
|
|
Cumulus Media, Inc. Class A (a) |
51,921 |
332,814 |
|
|
Daily Journal Corp. (a) |
594 |
104,722 |
|
|
Dex Media, Inc. (a)(d) |
9,778 |
71,673 |
|
|
E.W. Scripps Co. Class A (a) |
17,884 |
306,353 |
|
|
Entercom Communications Corp. Class A (a) |
13,448 |
145,238 |
|
|
Entravision Communication Corp. Class A |
30,405 |
161,451 |
|
|
Global Sources Ltd. (a)(d) |
11,733 |
104,306 |
|
|
Gray Television, Inc. (a) |
28,653 |
322,346 |
|
|
Harte-Hanks, Inc. |
23,874 |
191,947 |
|
|
Hemisphere Media Group, Inc. (a)(d) |
4,204 |
50,868 |
|
|
Journal Communications, Inc. Class A (a) |
24,566 |
197,019 |
|
|
Live Nation Entertainment, Inc. (a) |
79,561 |
1,661,234 |
|
|
Loral Space & Communications Ltd. (a) |
7,289 |
524,735 |
|
|
Martha Stewart Living Omnimedia, Inc. Class A (a)(d) |
13,774 |
53,856 |
|
|
MDC Partners, Inc. Class A (sub. vtg.) |
22,186 |
541,782 |
|
|
Media General, Inc. Class A (a)(d) |
10,741 |
164,552 |
|
|
Meredith Corp. |
20,260 |
892,858 |
|
|
National CineMedia, Inc. |
33,649 |
511,128 |
|
|
Nexstar Broadcasting Group, Inc. Class A |
16,417 |
654,217 |
|
|
ReachLocal, Inc. (a)(d) |
5,693 |
56,930 |
|
|
Reading International, Inc. Class A (a) |
10,625 |
75,225 |
|
|
Rentrak Corp. (a) |
5,850 |
333,392 |
|
|
Saga Communications, Inc. Class A |
2,877 |
127,451 |
|
|
Salem Communications Corp. Class A |
6,805 |
59,952 |
|
|
Scholastic Corp. |
14,791 |
486,772 |
|
|
Common Stocks - continued |
|||
|
Shares |
Value |
||
|
CONSUMER DISCRETIONARY - continued |
|||
|
Media - continued |
|||
|
SFX Entertainment, Inc. (d) |
11,564 |
$ 75,860 |
|
|
Sinclair Broadcast Group, Inc. Class A (d) |
38,815 |
1,037,525 |
|
|
Sizmek, Inc. (a) |
13,347 |
127,864 |
|
|
The McClatchy Co. Class A (a) |
33,435 |
183,224 |
|
|
The New York Times Co. Class A |
73,056 |
1,174,740 |
|
|
World Wrestling Entertainment, Inc. Class A (d) |
16,107 |
314,087 |
|
|
|
12,022,835 |
||
|
Multiline Retail - 0.1% |
|||
|
Burlington Stores, Inc. |
8,486 |
220,551 |
|
|
Fred's, Inc. Class A |
20,660 |
376,425 |
|
|
Gordmans Stores, Inc. |
3,733 |
16,761 |
|
|
The Bon-Ton Stores, Inc. |
7,546 |
83,006 |
|
|
Tuesday Morning Corp. (a) |
24,324 |
340,050 |
|
|
|
1,036,793 |
||
|
Specialty Retail - 3.1% |
|||
|
Aeropostale, Inc. (a)(d) |
43,103 |
214,222 |
|
|
America's Car Mart, Inc. (a)(d) |
4,563 |
164,907 |
|
|
ANN, Inc. (a) |
26,643 |
1,044,139 |
|
|
Asbury Automotive Group, Inc. (a) |
17,583 |
1,085,574 |
|
|
Barnes & Noble, Inc. (a)(d) |
22,631 |
371,148 |
|
|
bebe stores, Inc. |
19,627 |
99,116 |
|
|
Big 5 Sporting Goods Corp. |
9,364 |
114,334 |
|
|
Body Central Corp. (a)(d) |
6,388 |
6,644 |
|
|
Brown Shoe Co., Inc. |
24,169 |
570,147 |
|
|
Christopher & Banks Corp. (a) |
20,269 |
126,479 |
|
|
Citi Trends, Inc. (a) |
8,756 |
148,764 |
|
|
Conn's, Inc. (a)(d) |
12,549 |
555,042 |
|
|
Destination Maternity Corp. |
7,644 |
188,501 |
|
|
Destination XL Group, Inc. (a) |
23,827 |
128,666 |
|
|
Express, Inc. (a) |
48,249 |
702,988 |
|
|
Finish Line, Inc. Class A |
27,366 |
753,386 |
|
|
Five Below, Inc. (a)(d) |
18,522 |
746,622 |
|
|
Francesca's Holdings Corp. (a)(d) |
24,619 |
402,767 |
|
|
Genesco, Inc. (a)(d) |
13,529 |
1,033,210 |
|
|
Group 1 Automotive, Inc. (d) |
12,130 |
874,937 |
|
|
Haverty Furniture Companies, Inc. |
10,834 |
276,700 |
|
|
hhgregg, Inc. (a)(d) |
6,822 |
58,806 |
|
|
Hibbett Sports, Inc. (a)(d) |
14,788 |
796,334 |
|
|
Jos. A. Bank Clothiers, Inc. (a)(d) |
15,699 |
1,013,370 |
|
|
Kirkland's, Inc. (a) |
8,210 |
140,473 |
|
|
Common Stocks - continued |
|||
|
Shares |
Value |
||
|
CONSUMER DISCRETIONARY - continued |
|||
|
Specialty Retail - continued |
|||
|
Lithia Motors, Inc. Class A (sub. vtg.) |
12,391 |
$ 920,403 |
|
|
Lumber Liquidators Holdings, Inc. (a)(d) |
15,512 |
1,352,026 |
|
|
MarineMax, Inc. (a) |
13,588 |
218,223 |
|
|
Mattress Firm Holding Corp. (a)(d) |
7,491 |
338,518 |
|
|
Monro Muffler Brake, Inc. |
17,659 |
995,968 |
|
|
New York & Co., Inc. (a) |
17,397 |
72,893 |
|
|
Office Depot, Inc. (a) |
271,865 |
1,111,928 |
|
|
Outerwall, Inc. (a) |
11,496 |
797,248 |
|
|
Pacific Sunwear of California, Inc. (a) |
26,931 |
77,561 |
|
|
Penske Automotive Group, Inc. |
23,873 |
1,094,816 |
|
|
Pier 1 Imports, Inc. |
52,758 |
963,361 |
|
|
RadioShack Corp. (a)(d) |
57,397 |
82,078 |
|
|
Rent-A-Center, Inc. (d) |
30,115 |
879,659 |
|
|
Restoration Hardware Holdings, Inc. (a)(d) |
9,884 |
616,663 |
|
|
Sears Hometown & Outlet Stores, Inc. (a) |
4,856 |
114,650 |
|
|
Select Comfort Corp. (a) |
31,126 |
572,718 |
|
|
Shoe Carnival, Inc. |
8,431 |
192,564 |
|
|
Sonic Automotive, Inc. Class A (sub. vtg.) |
21,799 |
530,588 |
|
|
Stage Stores, Inc. (d) |
18,325 |
351,474 |
|
|
Stein Mart, Inc. |
15,551 |
194,388 |
|
|
Systemax, Inc. (a) |
6,746 |
116,638 |
|
|
The Buckle, Inc. (d) |
15,567 |
731,493 |
|
|
The Cato Corp. Class A (sub. vtg.) |
15,596 |
444,330 |
|
|
The Children's Place Retail Stores, Inc. |
12,899 |
619,152 |
|
|
The Container Store Group, Inc. (d) |
7,874 |
217,244 |
|
|
The Men's Wearhouse, Inc. |
26,807 |
1,270,116 |
|
|
The Pep Boys - Manny, Moe & Jack (a) |
29,383 |
300,294 |
|
|
Tile Shop Holdings, Inc. (a)(d) |
10,075 |
142,007 |
|
|
Tilly's, Inc. (a) |
5,632 |
63,642 |
|
|
Trans World Entertainment Corp. |
3,959 |
12,946 |
|
|
Vitamin Shoppe, Inc. (a)(d) |
17,142 |
820,759 |
|
|
West Marine, Inc. (a) |
8,867 |
94,877 |
|
|
Wet Seal, Inc. Class A (a)(d) |
44,584 |
50,380 |
|
|
Winmark Corp. |
1,419 |
107,645 |
|
|
Zale Corp. (a)(d) |
18,115 |
387,480 |
|
|
Zumiez, Inc. (a) |
11,634 |
284,451 |
|
|
|
28,758,457 |
||
|
Textiles, Apparel & Luxury Goods - 1.3% |
|||
|
American Apparel, Inc. (a)(d) |
54,539 |
35,254 |
|
|
Columbia Sportswear Co. (d) |
7,222 |
620,948 |
|
|
Common Stocks - continued |
|||
|
Shares |
Value |
||
|
CONSUMER DISCRETIONARY - continued |
|||
|
Textiles, Apparel & Luxury Goods - continued |
|||
|
Crocs, Inc. (a) |
49,184 |
$ 744,154 |
|
|
Culp, Inc. |
4,451 |
80,341 |
|
|
G-III Apparel Group Ltd. (a) |
9,482 |
680,523 |
|
|
Iconix Brand Group, Inc. (a)(d) |
28,750 |
1,221,875 |
|
|
Kate Spade & Co. (a)(d) |
71,410 |
2,482,926 |
|
|
Movado Group, Inc. |
10,028 |
393,900 |
|
|
Oxford Industries, Inc. |
7,497 |
494,877 |
|
|
Perry Ellis International, Inc. (a) |
6,799 |
102,665 |
|
|
Quiksilver, Inc. (a)(d) |
74,291 |
476,948 |
|
|
R.G. Barry Corp. |
5,302 |
96,921 |
|
|
Skechers U.S.A., Inc. Class A (sub. vtg.) (a) |
21,817 |
894,279 |
|
|
Steven Madden Ltd. (a) |
33,862 |
1,205,826 |
|
|
Tumi Holdings, Inc. (a)(d) |
26,666 |
544,520 |
|
|
Unifi, Inc. (a) |
8,464 |
187,393 |
|
|
Vera Bradley, Inc. (a)(d) |
12,028 |
340,392 |
|
|
Vince Holding Corp. |
6,733 |
185,225 |
|
|
Wolverine World Wide, Inc. (d) |
56,617 |
1,590,938 |
|
|
|
12,379,905 |
||
|
TOTAL CONSUMER DISCRETIONARY |
118,347,373 |
||
|
CONSUMER STAPLES - 3.8% |
|||
|
Beverages - 0.2% |
|||
|
Boston Beer Co., Inc. Class A (a)(d) |
4,660 |
1,146,546 |
|
|
Coca-Cola Bottling Co. Consolidated |
2,572 |
211,496 |
|
|
Craft Brew Alliance, Inc. (a) |
5,787 |
86,631 |
|
|
National Beverage Corp. (a) |
6,515 |
125,609 |
|
|
|
1,570,282 |
||
|
Food & Staples Retailing - 1.3% |
|||
|
Andersons, Inc. |
15,719 |
979,137 |
|
|
Casey's General Stores, Inc. |
21,637 |
1,485,596 |
|
|
Chefs' Warehouse Holdings (a)(d) |
9,573 |
192,322 |
|
|
Fairway Group Holdings Corp. (d) |
9,275 |
64,276 |
|
|
Ingles Markets, Inc. Class A |
6,657 |
153,044 |
|
|
Natural Grocers by Vitamin Cottage, Inc. (a)(d) |
4,861 |
173,052 |
|
|
PriceSmart, Inc. (d) |
10,671 |
1,024,843 |
|
|
Rite Aid Corp. (a) |
411,997 |
3,007,578 |
|
|
Roundy's, Inc. |
16,781 |
113,607 |
|
|
Spartan Stores, Inc. |
20,885 |
449,863 |
|
|
SUPERVALU, Inc. (a)(d) |
114,926 |
803,333 |
|
|
Common Stocks - continued |
|||
|
Shares |
Value |
||
|
CONSUMER STAPLES - continued |
|||
|
Food & Staples Retailing - continued |
|||
|
Susser Holdings Corp. (a)(d) |
10,211 |
$ 790,127 |
|
|
The Pantry, Inc. (a) |
13,141 |
197,641 |
|
|
United Natural Foods, Inc. (a)(d) |
27,863 |
1,923,383 |
|
|
Village Super Market, Inc. Class A |
3,260 |
78,859 |
|
|
Weis Markets, Inc. |
6,224 |
286,864 |
|
|
|
11,723,525 |
||
|
Food Products - 1.7% |
|||
|
Alico, Inc. |
1,349 |
47,107 |
|
|
Annie's, Inc. (a)(d) |
7,510 |
244,150 |
|
|
B&G Foods, Inc. Class A |
29,884 |
980,195 |
|
|
Boulder Brands, Inc. (a)(d) |
33,295 |
491,434 |
|
|
Cal-Maine Foods, Inc. |
8,279 |
493,677 |
|
|
Calavo Growers, Inc. |
7,199 |
223,817 |
|
|
Chiquita Brands International, Inc. (a)(d) |
25,633 |
294,267 |
|
|
Darling International, Inc. (a) |
89,111 |
1,783,111 |
|
|
Diamond Foods, Inc. (a)(d) |
12,761 |
390,104 |
|
|
Farmer Brothers Co. (a) |
3,350 |
66,029 |
|
|
Fresh Del Monte Produce, Inc. |
21,243 |
613,710 |
|
|
Griffin Land & Nurseries, Inc. |
1,450 |
42,340 |
|
|
Inventure Foods, Inc. (a) |
7,602 |
91,376 |
|
|
J&J Snack Foods Corp. |
8,399 |
786,146 |
|
|
John B. Sanfilippo & Son, Inc. |
4,877 |
112,415 |
|
|
Lancaster Colony Corp. |
10,423 |
988,934 |
|
|
Lifeway Foods, Inc. (d) |
2,583 |
38,771 |
|
|
Limoneira Co. (d) |
6,026 |
138,417 |
|
|
Omega Protein Corp. (a) |
11,154 |
126,709 |
|
|
Pilgrims Pride Corp. (a) |
34,240 |
748,486 |
|
|
Post Holdings, Inc. (a) |
21,786 |
1,138,536 |
|
|
Sanderson Farms, Inc. |
12,998 |
1,069,345 |
|
|
Seaboard Corp. (a) |
163 |
397,394 |
|
|
Seneca Foods Corp. Class A (a) |
5,248 |
149,043 |
|
|
Snyders-Lance, Inc. |
26,585 |
706,098 |
|
|
The Hain Celestial Group, Inc. (a)(d) |
21,700 |
1,866,634 |
|
|
Tootsie Roll Industries, Inc. |
11,327 |
319,308 |
|
|
TreeHouse Foods, Inc. (a) |
20,504 |
1,534,519 |
|
|
|
15,882,072 |
||
|
Household Products - 0.2% |
|||
|
Central Garden & Pet Co. Class A (non-vtg.) (a) |
23,340 |
193,022 |
|
|
Harbinger Group, Inc. (a)(d) |
18,374 |
214,241 |
|
|
Oil-Dri Corp. of America |
2,983 |
99,960 |
|
|
Common Stocks - continued |
|||
|
Shares |
Value |
||
|
CONSUMER STAPLES - continued |
|||
|
Household Products - continued |
|||
|
Orchids Paper Products Co. |
3,353 |
$ 90,095 |
|
|
Spectrum Brands Holdings, Inc. |
12,076 |
927,799 |
|
|
WD-40 Co. |
8,609 |
627,080 |
|
|
|
2,152,197 |
||
|
Personal Products - 0.2% |
|||
|
Elizabeth Arden, Inc. (a)(d) |
14,523 |
533,575 |
|
|
Inter Parfums, Inc. |
9,138 |
334,359 |
|
|
LifeVantage Corp. (a) |
60,945 |
84,104 |
|
|
MediFast, Inc. (a)(d) |
8,071 |
255,447 |
|
|
Nature's Sunshine Products, Inc. |
5,706 |
76,232 |
|
|
Nutraceutical International Corp. (a) |
4,384 |
109,249 |
|
|
Revlon, Inc. (a) |
6,537 |
197,025 |
|
|
Star Scientific, Inc. (a)(d) |
88,721 |
58,192 |
|
|
Synutra International, Inc. (a) |
10,309 |
57,524 |
|
|
The Female Health Co. |
13,680 |
103,421 |
|
|
USANA Health Sciences, Inc. (a)(d) |
3,406 |
231,131 |
|
|
|
2,040,259 |
||
|
Tobacco - 0.2% |
|||
|
Alliance One International, Inc. (a) |
50,199 |
129,011 |
|
|
Universal Corp. (d) |
13,164 |
718,359 |
|
|
Vector Group Ltd. (d) |
35,622 |
758,749 |
|
|
|
1,606,119 |
||
|
TOTAL CONSUMER STAPLES |
34,974,454 |
||
|
ENERGY - 6.0% |
|||
|
Energy Equipment & Services - 1.9% |
|||
|
Basic Energy Services, Inc. (a) |
16,694 |
441,055 |
|
|
Bolt Technology Corp. |
5,128 |
86,561 |
|
|
Bristow Group, Inc. |
20,458 |
1,571,174 |
|
|
C&J Energy Services, Inc. (a)(d) |
25,341 |
761,750 |
|
|
Cal Dive International, Inc. (a)(d) |
52,256 |
77,339 |
|
|
Carbo Ceramics, Inc. |
11,183 |
1,564,614 |
|
|
Dawson Geophysical Co. |
4,490 |
126,887 |
|
|
Era Group, Inc. (a) |
11,553 |
329,838 |
|
|
Exterran Holdings, Inc. |
32,493 |
1,397,849 |
|
|
Forum Energy Technologies, Inc. (a) |
22,131 |
660,832 |
|
|
Geospace Technologies Corp. (a)(d) |
7,240 |
420,861 |
|
|
Gulf Island Fabrication, Inc. |
8,103 |
162,546 |
|
|
Gulfmark Offshore, Inc. Class A |
15,116 |
680,371 |
|
|
Common Stocks - continued |
|||
|
Shares |
Value |
||
|
ENERGY - continued |
|||
|
Energy Equipment & Services - continued |
|||
|
Helix Energy Solutions Group, Inc. (a) |
60,015 |
$ 1,442,761 |
|
|
Hercules Offshore, Inc. (a)(d) |
89,358 |
399,430 |
|
|
Hornbeck Offshore Services, Inc. (a)(d) |
20,183 |
836,182 |
|
|
ION Geophysical Corp. (a)(d) |
80,012 |
352,053 |
|
|
Key Energy Services, Inc. (a) |
85,863 |
862,065 |
|
|
Matrix Service Co. (a) |
14,619 |
452,750 |
|
|
Mitcham Industries, Inc. (a) |
6,757 |
93,247 |
|
|
Natural Gas Services Group, Inc. (a) |
7,207 |
221,183 |
|
|
Newpark Resources, Inc. (a)(d) |
49,362 |
594,318 |
|
|
North Atlantic Drilling Ltd. |
40,000 |
343,200 |
|
|
Nuverra Environmental Solutions, Inc. (a)(d) |
7,866 |
133,801 |
|
|
Parker Drilling Co. (a) |
66,727 |
442,400 |
|
|
PHI, Inc. (non-vtg.) (a) |
6,953 |
311,494 |
|
|
Pioneer Energy Services Corp. (a) |
34,738 |
520,028 |
|
|
RigNet, Inc. (a) |
6,745 |
315,396 |
|
|
SEACOR Holdings, Inc. (a)(d) |
11,415 |
951,897 |
|
|
Tesco Corp. (a) |
17,221 |
344,420 |
|
|
TETRA Technologies, Inc. (a) |
43,783 |
547,288 |
|
|
TGC Industries, Inc. |
8,510 |
43,061 |
|
|
Vantage Drilling Co. (a)(d) |
111,135 |
185,595 |
|
|
Willbros Group, Inc. (a) |
23,053 |
256,119 |
|
|
|
17,930,365 |
||
|
Oil, Gas & Consumable Fuels - 4.1% |
|||
|
Abraxas Petroleum Corp. (a) |
46,888 |
256,008 |
|
|
Adams Resources & Energy, Inc. |
1,089 |
78,473 |
|
|
Alon U.S.A. Energy, Inc. (d) |
12,823 |
208,887 |
|
|
Alpha Natural Resources, Inc. (a)(d) |
123,602 |
531,489 |
|
|
Amyris, Inc. (a)(d) |
14,003 |
49,291 |
|
|
APCO Oil and Gas International, Inc. (a) |
4,931 |
68,935 |
|
|
Approach Resources, Inc. (a)(d) |
19,560 |
405,870 |
|
|
Arch Coal, Inc. (d) |
118,605 |
543,211 |
|
|
Athlon Energy, Inc. |
11,823 |
477,767 |
|
|
Bill Barrett Corp. (a) |
27,351 |
647,672 |
|
|
Bonanza Creek Energy, Inc. (a)(d) |
16,500 |
802,230 |
|
|
BPZ Energy, Inc. (a)(d) |
67,015 |
180,941 |
|
|
Callon Petroleum Co. (a) |
22,303 |
204,742 |
|
|
Carrizo Oil & Gas, Inc. (a) |
25,737 |
1,416,050 |
|
|
Clayton Williams Energy, Inc. (a) |
3,289 |
475,195 |
|
|
Clean Energy Fuels Corp. (a)(d) |
39,070 |
345,770 |
|
|
Cloud Peak Energy, Inc. (a) |
34,666 |
682,574 |
|
|
Common Stocks - continued |
|||
|
Shares |
Value |
||
|
ENERGY - continued |
|||
|
Oil, Gas & Consumable Fuels - continued |
|||
|
Comstock Resources, Inc. (d) |
27,390 |
$ 761,442 |
|
|
Contango Oil & Gas Co. (a) |
8,209 |
394,360 |
|
|
Delek U.S. Holdings, Inc. |
20,850 |
666,992 |
|
|
Diamondback Energy, Inc. (a)(d) |
11,986 |
862,273 |
|
|
Emerald Oil, Inc. (a)(d) |
31,206 |
220,626 |
|
|
Endeavour International Corp. (a)(d) |
26,363 |
90,689 |
|
|
Energy XXI (Bermuda) Ltd. (d) |
41,096 |
983,427 |
|
|
EPL Oil & Gas, Inc. (a)(d) |
16,717 |
654,303 |
|
|
Equal Energy Ltd. |
18,404 |
83,284 |
|
|
Evolution Petroleum Corp. |
11,107 |
131,063 |
|
|
EXCO Resources, Inc. (d) |
94,778 |
601,840 |
|
|
Forest Oil Corp. (a)(d) |
70,652 |
131,413 |
|
|
Frontline Ltd. (NY Shares) (a)(d) |
30,978 |
105,325 |
|
|
FX Energy, Inc. (a)(d) |
31,013 |
175,223 |
|
|
GasLog Ltd. (d) |
18,068 |
483,861 |
|
|
Gastar Exploration, Inc. (a) |
30,491 |
202,155 |
|
|
Goodrich Petroleum Corp. (a)(d) |
17,759 |
446,639 |
|
|
Green Plains Renewable Energy, Inc. |
14,144 |
422,906 |
|
|
Halcon Resources Corp. (a)(d) |
129,528 |
714,995 |
|
|
Hallador Energy Co. |
4,877 |
44,673 |
|
|
Isramco, Inc. (a) |
476 |
61,880 |
|
|
Jones Energy, Inc. |
6,272 |
97,028 |
|
|
KiOR, Inc. Class A (a)(d) |
23,656 |
14,433 |
|
|
Knightsbridge Tankers Ltd. |
16,828 |
201,095 |
|
|
Kodiak Oil & Gas Corp. (a) |
150,377 |
1,911,292 |
|
|
Magnum Hunter Resources Corp. (a)(d) |
96,467 |
819,970 |
|
|
Magnum Hunter Resources Corp. warrants 4/16/16 (a)(d) |
5,763 |
2,674 |
|
|
Matador Resources Co. (a)(d) |
32,909 |
945,146 |
|
|
Midstates Petroleum Co., Inc. (a)(d) |
17,622 |
103,970 |
|
|
Miller Energy Resources, Inc. (a)(d) |
17,792 |
85,757 |
|
|
Nordic American Tanker Shipping Ltd. (d) |
50,767 |
438,119 |
|
|
Northern Oil & Gas, Inc. (a)(d) |
35,672 |
550,419 |
|
|
Panhandle Royalty Co. Class A |
3,894 |
170,752 |
|
|
PDC Energy, Inc. (a)(d) |
20,166 |
1,283,969 |
|
|
Penn Virginia Corp. (a)(d) |
30,858 |
513,477 |
|
|
Petroquest Energy, Inc. (a)(d) |
31,810 |
191,496 |
|
|
Quicksilver Resources, Inc. (a)(d) |
68,769 |
224,187 |
|
|
Renewable Energy Group, Inc. (a)(d) |
11,653 |
137,156 |
|
|
Rentech, Inc. (a)(d) |
125,605 |
266,283 |
|
|
Resolute Energy Corp. (a)(d) |
37,459 |
280,943 |
|
|
Rex American Resources Corp. (a) |
3,164 |
206,799 |
|
|
Common Stocks - continued |
|||
|
Shares |
Value |
||
|
ENERGY - continued |
|||
|
Oil, Gas & Consumable Fuels - continued |
|||
|
Rex Energy Corp. (a) |
25,304 |
$ 532,902 |
|
|
Rosetta Resources, Inc. (a)(d) |
34,636 |
1,639,668 |
|
|
RSP Permian, Inc. (a) |
12,870 |
364,865 |
|
|
Sanchez Energy Corp. (a)(d) |
21,304 |
602,477 |
|
|
Scorpio Tankers, Inc. |
105,120 |
947,131 |
|
|
SemGroup Corp. Class A |
23,872 |
1,524,943 |
|
|
Ship Finance International Ltd. (NY Shares) (d) |
31,369 |
553,035 |
|
|
Solazyme, Inc. (a)(d) |
29,959 |
322,359 |
|
|
Stone Energy Corp. (a) |
28,073 |
1,376,981 |
|
|
Swift Energy Co. (a)(d) |
23,891 |
294,576 |
|
|
Synergy Resources Corp. (a)(d) |
28,029 |
326,258 |
|
|
Targa Resources Corp. |
18,555 |
2,003,754 |
|
|
Teekay Tankers Ltd. (d) |
34,491 |
120,374 |
|
|
Triangle Petroleum Corp. (a)(d) |
38,944 |
374,641 |
|
|
Ur-Energy, Inc. (a)(d) |
75,071 |
91,780 |
|
|
Uranium Energy Corp. (a)(d) |
49,082 |
52,518 |
|
|
VAALCO Energy, Inc. (a) |
32,195 |
296,838 |
|
|
W&T Offshore, Inc. |
19,838 |
380,890 |
|
|
Warren Resources, Inc. (a) |
42,069 |
213,290 |
|
|
Western Refining, Inc. |
30,650 |
1,333,275 |
|
|
Westmoreland Coal Co. (a) |
6,753 |
199,956 |
|
|
ZaZa Energy Corp. (a)(d) |
16,276 |
8,048 |
|
|
|
37,619,998 |
||
|
TOTAL ENERGY |
55,550,363 |
||
|
FINANCIALS - 23.4% |
|||
|
Banks - 7.1% |
|||
|
1st Source Corp. |
8,193 |
241,612 |
|
|
1st United Bancorp, Inc. |
18,523 |
135,588 |
|
|
Access National Corp. |
4,568 |
67,378 |
|
|
American National Bankshares, Inc. |
4,924 |
104,930 |
|
|
Ameris Bancorp (a) |
13,915 |
295,972 |
|
|
Ames National Corp. |
5,669 |
123,754 |
|
|
Arrow Financial Corp. (d) |
6,062 |
151,732 |
|
|
BancFirst Corp. |
4,111 |
239,301 |
|
|
Banco Latinoamericano de Comercio Exterior SA Series E |
16,608 |
427,158 |
|
|
Bancorp, Inc., Delaware (a) |
18,620 |
294,568 |
|
|
BancorpSouth, Inc. |
53,560 |
1,251,162 |
|
|
Bank of Kentucky Financial Corp. |
3,415 |
117,852 |
|
|
Bank of Marin Bancorp |
3,203 |
145,448 |
|
|
Common Stocks - continued |
|||
|
Shares |
Value |
||
|
FINANCIALS - continued |
|||
|
Banks - continued |
|||
|
Bank of the Ozarks, Inc. |
17,553 |
$ 1,051,425 |
|
|
Banner Bank |
11,088 |
438,420 |
|
|
Bar Harbor Bankshares |
2,054 |
77,189 |
|
|
BBCN Bancorp, Inc. |
44,746 |
689,536 |
|
|
BNC Bancorp |
10,241 |
166,928 |
|
|
Boston Private Financial Holdings, Inc. |
44,704 |
559,247 |
|
|
Bridge Bancorp, Inc. |
6,536 |
158,956 |
|
|
Bridge Capital Holdings (a) |
5,575 |
124,880 |
|
|
Bryn Mawr Bank Corp. |
7,570 |
206,510 |
|
|
C & F Financial Corp. |
1,947 |
60,844 |
|
|
Camden National Corp. |
4,508 |
172,070 |
|
|
Capital Bank Financial Corp. Series A (a) |
12,919 |
308,118 |
|
|
Capital City Bank Group, Inc. |
7,152 |
99,413 |
|
|
Cardinal Financial Corp. |
17,680 |
297,024 |
|
|
Cascade Bancorp (a) |
1,863 |
8,812 |
|
|
Cathay General Bancorp |
44,286 |
1,045,150 |
|
|
Center Bancorp, Inc. |
7,364 |
136,308 |
|
|
Centerstate Banks of Florida, Inc. |
16,895 |
185,338 |
|
|
Central Pacific Financial Corp. |
12,000 |
225,240 |
|
|
Century Bancorp, Inc. Class A (non-vtg.) |
1,896 |
63,516 |
|
|
Chemical Financial Corp. |
17,075 |
479,295 |
|
|
Chemung Financial Corp. |
2,076 |
59,353 |
|
|
Citizens & Northern Corp. |
6,464 |
121,135 |
|
|
City Holding Co. |
8,695 |
373,798 |
|
|
CNB Financial Corp., Pennsylvania |
8,347 |
137,892 |
|
|
CoBiz, Inc. |
19,921 |
200,007 |
|
|
Columbia Banking Systems, Inc. |
29,187 |
724,421 |
|
|
Community Bank System, Inc. |
22,494 |
836,552 |
|
|
Community Trust Bancorp, Inc. |
7,602 |
280,286 |
|
|
CommunityOne Bancorp (a) |
5,986 |
58,364 |
|
|
ConnectOne Bancorp, Inc. (a) |
1,131 |
54,288 |
|
|
CU Bancorp (a) |
4,920 |
89,298 |
|
|
Customers Bancorp, Inc. (a) |
11,651 |
256,672 |
|
|
CVB Financial Corp. |
51,646 |
746,801 |
|
|
Eagle Bancorp, Inc., Maryland |
12,425 |
414,871 |
|
|
Enterprise Bancorp, Inc. |
3,778 |
68,986 |
|
|
Enterprise Financial Services Corp. |
11,201 |
200,162 |
|
|
Farmers Capital Bank Corp. (a) |
4,569 |
95,446 |
|
|
Fidelity Southern Corp. |
9,404 |
124,227 |
|
|
Financial Institutions, Inc. |
7,739 |
179,158 |
|
|
First Bancorp, North Carolina |
11,001 |
189,327 |
|
|
Common Stocks - continued |
|||
|
Shares |
Value |
||
|
FINANCIALS - continued |
|||
|
Banks - continued |
|||
|
First Bancorp, Puerto Rico (a) |
41,423 |
$ 212,914 |
|
|
First Busey Corp. |
41,575 |
228,663 |
|
|
First Commonwealth Financial Corp. |
54,135 |
465,020 |
|
|
First Community Bancshares, Inc. |
8,910 |
131,957 |
|
|
First Connecticut Bancorp, Inc. |
9,085 |
143,997 |
|
|
First Financial Bancorp, Ohio |
33,805 |
547,303 |
|
|
First Financial Bankshares, Inc. (d) |
18,027 |
1,064,494 |
|
|
First Financial Corp., Indiana |
6,334 |
202,751 |
|
|
First Financial Holdings, Inc. |
13,478 |
774,581 |
|
|
First Interstate Bancsystem, Inc. |
9,750 |
242,678 |
|
|
First Merchants Corp. |
19,382 |
411,286 |
|
|
First Midwest Bancorp, Inc., Delaware |
42,140 |
689,832 |
|
|
First NBC Bank Holding Co. |
2,421 |
75,293 |
|
|
First of Long Island Corp. |
4,796 |
173,951 |
|
|
First Security Group, Inc. |
43,646 |
82,927 |
|
|
FirstMerit Corp. |
93,631 |
1,815,505 |
|
|
Flushing Financial Corp. |
17,254 |
331,622 |
|
|
FNB Corp., Pennsylvania |
87,679 |
1,090,727 |
|
|
German American Bancorp, Inc. |
7,504 |
195,404 |
|
|
Glacier Bancorp, Inc. |
40,876 |
1,048,878 |
|
|
Great Southern Bancorp, Inc. |
6,253 |
179,274 |
|
|
Guaranty Bancorp |
9,207 |
115,916 |
|
|
Hampton Roads Bankshares, Inc. (a) |
24,246 |
40,248 |
|
|
Hancock Holding Co. |
47,716 |
1,609,461 |
|
|
Hanmi Financial Corp. |
17,678 |
376,011 |
|
|
Heartland Financial U.S.A., Inc. |
8,369 |
203,367 |
|
|
Heritage Commerce Corp. |
11,429 |
92,803 |
|
|
Heritage Financial Corp., Washington |
9,751 |
157,576 |
|
|
Heritage Oaks Bancorp (a) |
11,514 |
85,319 |
|
|
Home Bancshares, Inc. |
25,650 |
813,362 |
|
|
Home Federal Bancorp, Inc. |
7,967 |
119,903 |
|
|
HomeTrust Bancshares, Inc. (a) |
11,752 |
179,453 |
|
|
Horizon Bancorp Industries |
4,435 |
88,656 |
|
|
Hudson Valley Holding Corp. |
9,516 |
174,714 |
|
|
IBERIABANK Corp. |
16,767 |
1,054,644 |
|
|
Independent Bank Corp., Massachusetts |
13,258 |
492,137 |
|
|
Independent Bank Group, Inc. |
2,070 |
101,865 |
|
|
International Bancshares Corp. |
29,879 |
686,022 |
|
|
Intervest Bancshares Corp. Class A |
10,047 |
76,056 |
|
|
Investors Bancorp, Inc. |
28,061 |
750,071 |
|
|
Lakeland Bancorp, Inc. |
20,978 |
219,010 |
|
|
Common Stocks - continued |
|||
|
Shares |
Value |
||
|
FINANCIALS - continued |
|||
|
Banks - continued |
|||
|
Lakeland Financial Corp. |
9,137 |
$ 334,414 |
|
|
LCNB Corp. (d) |
3,623 |
57,968 |
|
|
Macatawa Bank Corp. |
12,988 |
63,252 |
|
|
MainSource Financial Group, Inc. |
11,473 |
189,649 |
|
|
MB Financial, Inc. |
30,846 |
827,907 |
|
|
Mercantile Bank Corp. |
4,406 |
85,961 |
|
|
Merchants Bancshares, Inc. |
3,017 |
87,704 |
|
|
Metro Bancorp, Inc. (a) |
8,823 |
180,166 |
|
|
Middleburg Financial Corp. |
2,514 |
43,568 |
|
|
Midsouth Bancorp, Inc. |
4,086 |
68,318 |
|
|
MidWestOne Financial Group, Inc. |
3,464 |
85,318 |
|
|
National Bank Holdings Corp. |
25,926 |
496,742 |
|
|
National Bankshares, Inc. |
3,618 |
117,874 |
|
|
National Penn Bancshares, Inc. |
66,396 |
648,689 |
|
|
NBT Bancorp, Inc. |
24,409 |
552,864 |
|
|
NewBridge Bancorp (a) |
16,120 |
123,963 |
|
|
Northrim Bancorp, Inc. |
3,541 |
84,949 |
|
|
OFG Bancorp |
26,101 |
445,283 |
|
|
Old National Bancorp, Indiana |
59,576 |
841,213 |
|
|
OmniAmerican Bancorp, Inc. |
6,678 |
166,015 |
|
|
Pacific Continental Corp. |
10,538 |
138,891 |
|
|
Pacific Premier Bancorp, Inc. (a) |
9,574 |
130,685 |
|
|
PacWest Bancorp |
52,763 |
2,077,279 |
|
|
Palmetto Bancshares, Inc. (a) |
3,372 |
45,556 |
|
|
Park National Corp. (d) |
6,469 |
469,132 |
|
|
Park Sterling Corp. |
26,076 |
170,276 |
|
|
Peapack-Gladstone Financial Corp. |
6,697 |
127,310 |
|
|
Penns Woods Bancorp, Inc. |
2,699 |
118,756 |
|
|
Peoples Bancorp, Inc. |
6,015 |
156,811 |
|
|
Pinnacle Financial Partners, Inc. |
19,778 |
683,725 |
|
|
Preferred Bank, Los Angeles (a) |
7,178 |
153,968 |
|
|
PrivateBancorp, Inc. |
36,770 |
1,013,749 |
|
|
Prosperity Bancshares, Inc. |
35,713 |
2,107,067 |
|
|
Renasant Corp. |
16,918 |
460,508 |
|
|
Republic Bancorp, Inc., Kentucky Class A |
5,909 |
141,875 |
|
|
S&T Bancorp, Inc. |
16,876 |
392,536 |
|
|
Sandy Spring Bancorp, Inc. |
13,983 |
336,291 |
|
|
Seacoast Banking Corp., Florida (a) |
8,848 |
93,789 |
|
|
Sierra Bancorp |
7,619 |
118,933 |
|
|
Simmons First National Corp. Class A |
9,134 |
330,285 |
|
|
Southside Bancshares, Inc. (d) |
10,364 |
285,839 |
|
|
Common Stocks - continued |
|||
|
Shares |
Value |
||
|
FINANCIALS - continued |
|||
|
Banks - continued |
|||
|
Southwest Bancorp, Inc., Oklahoma |
10,859 |
$ 181,345 |
|
|
State Bank Financial Corp. |
17,807 |
295,240 |
|
|
Sterling Bancorp |
46,221 |
552,803 |
|
|
Stock Yards Bancorp, Inc. |
7,669 |
226,082 |
|
|
Suffolk Bancorp (a) |
6,784 |
148,773 |
|
|
Sun Bancorp, Inc., New Jersey (a) |
21,989 |
83,558 |
|
|
Susquehanna Bancshares, Inc. |
105,961 |
1,097,756 |
|
|
Talmer Bancorp, Inc. Class A |
9,956 |
133,510 |
|
|
Taylor Capital Group, Inc. (a) |
9,830 |
209,281 |
|
|
Texas Capital Bancshares, Inc. (a)(d) |
24,290 |
1,364,855 |
|
|
The First Bancorp, Inc. |
4,282 |
68,212 |
|
|
Tompkins Financial Corp. |
8,089 |
381,315 |
|
|
TowneBank (d) |
14,832 |
228,858 |
|
|
Trico Bancshares |
8,918 |
216,262 |
|
|
TriState Capital Holdings, Inc. (a) |
3,502 |
45,806 |
|
|
Trustmark Corp. |
37,924 |
867,322 |
|
|
UMB Financial Corp. |
20,178 |
1,184,650 |
|
|
Umpqua Holdings Corp. (d) |
95,431 |
1,587,018 |
|
|
Union Bankshares Corp. |
23,671 |
605,741 |
|
|
United Bankshares, Inc., West Virginia |
36,457 |
1,066,367 |
|
|
United Community Banks, Inc., Georgia (a) |
23,940 |
386,631 |
|
|
Univest Corp. of Pennsylvania |
8,621 |
169,920 |
|
|
VantageSouth Bancshares, Inc. (a) |
7,261 |
44,583 |
|
|
ViewPoint Financial Group |
22,691 |
591,554 |
|
|
Washington Banking Co., Oak Harbor |
9,233 |
158,808 |
|
|
Washington Trust Bancorp, Inc. |
8,293 |
283,621 |
|
|
Webster Financial Corp. |
50,849 |
1,532,589 |
|
|
WesBanco, Inc. |
14,394 |
435,275 |
|
|
West Bancorp., Inc. |
7,495 |
108,752 |
|
|
Westamerica Bancorp. (d) |
15,174 |
771,143 |
|
|
Western Alliance Bancorp. (a) |
41,933 |
967,394 |
|
|
Wilshire Bancorp, Inc. |
38,762 |
387,620 |
|
|
Wintrust Financial Corp. |
24,267 |
1,087,647 |
|
|
Yadkin Financial Corp. (a) |
8,043 |
154,023 |
|
|
|
65,586,761 |
||
|
Capital Markets - 2.7% |
|||
|
Apollo Investment Corp. |
126,648 |
1,011,918 |
|
|
Arlington Asset Investment Corp. |
11,034 |
291,849 |
|
|
BGC Partners, Inc. Class A |
71,261 |
510,941 |
|
|
BlackRock Kelso Capital Corp. |
41,728 |
378,890 |
|
|
Common Stocks - continued |
|||
|
Shares |
Value |
||
|
FINANCIALS - continued |
|||
|
Capital Markets - continued |
|||
|
Calamos Asset Management, Inc. Class A |
11,341 |
$ 138,133 |
|
|
Capital Southwest Corp. |
7,475 |
262,373 |
|
|
Capitala Finance Corp. |
1,956 |
35,951 |
|
|
CIFI Corp. |
3,913 |
30,169 |
|
|
Cohen & Steers, Inc. (d) |
10,705 |
433,660 |
|
|
Cowen Group, Inc. Class A (a) |
56,389 |
231,759 |
|
|
Diamond Hill Investment Group, Inc. |
1,571 |
186,509 |
|
|
Evercore Partners, Inc. Class A |
17,771 |
949,505 |
|
|
FBR & Co. (a) |
5,030 |
129,774 |
|
|
Fidus Investment Corp. (d) |
7,960 |
145,827 |
|
|
Fifth Street Finance Corp. |
75,897 |
706,601 |
|
|
Financial Engines, Inc. (d) |
27,721 |
1,226,654 |
|
|
Firsthand Technology Value Fund, Inc. (d) |
4,834 |
94,553 |
|
|
FXCM, Inc. Class A (d) |
20,773 |
321,566 |
|
|
GAMCO Investors, Inc. Class A |
3,333 |
253,075 |
|
|
Garrison Capital, Inc. (d) |
3,974 |
56,033 |
|
|
GFI Group, Inc. |
39,440 |
146,717 |
|
|
Gladstone Capital Corp. (d) |
12,032 |
116,349 |
|
|
Gladstone Investment Corp. |
15,540 |
122,144 |
|
|
Golub Capital BDC, Inc. (d) |
20,929 |
349,933 |
|
|
Greenhill & Co., Inc. |
15,800 |
792,370 |
|
|
GSV Capital Corp. (a)(d) |
10,749 |
94,376 |
|
|
Hercules Technology Growth Capital, Inc. (d) |
34,577 |
473,013 |
|
|
HFF, Inc. |
18,542 |
630,428 |
|
|
Horizon Technology Finance Corp. (d) |
5,365 |
70,282 |
|
|
ICG Group, Inc. (a) |
21,286 |
433,809 |
|
|
INTL FCStone, Inc. (a) |
8,254 |
156,166 |
|
|
Investment Technology Group, Inc. (a) |
21,122 |
435,958 |
|
|
Janus Capital Group, Inc. |
84,110 |
1,020,254 |
|
|
JMP Group, Inc. |
9,632 |
66,557 |
|
|
KCAP Financial, Inc. (d) |
16,389 |
130,620 |
|
|
KCG Holdings, Inc. Class A |
40,046 |
398,458 |
|
|
Ladenburg Thalmann Financial Services, Inc. (a) |
59,492 |
162,413 |
|
|
Main Street Capital Corp. (d) |
21,944 |
689,919 |
|
|
Manning & Napier, Inc. Class A |
8,567 |
142,384 |
|
|
Marcus & Millichap, Inc. |
4,264 |
70,484 |
|
|
MCG Capital Corp. |
39,170 |
131,611 |
|
|
Medallion Financial Corp. (d) |
11,869 |
161,418 |
|
|
Medley Capital Corp. (d) |
26,798 |
349,446 |
|
|
MVC Capital, Inc. |
12,559 |
163,769 |
|
|
New Mountain Finance Corp. (d) |
27,185 |
389,017 |
|
|
Common Stocks - continued |
|||
|
Shares |
Value |
||
|
FINANCIALS - continued |
|||
|
Capital Markets - continued |
|||
|
NGP Capital Resources Co. |
12,858 |
$ 87,563 |
|
|
Oppenheimer Holdings, Inc. Class A (non-vtg.) |
5,500 |
140,030 |
|
|
PennantPark Floating Rate Capital Ltd. (d) |
7,690 |
106,891 |
|
|
PennantPark Investment Corp. |
37,310 |
399,217 |
|
|
Piper Jaffray Companies (a)(d) |
9,333 |
409,345 |
|
|
Prospect Capital Corp. |
173,007 |
1,870,206 |
|
|
Pzena Investment Management, Inc. |
6,132 |
66,655 |
|
|
RCS Capital Corp. Class A |
1,199 |
41,246 |
|
|
Safeguard Scientifics, Inc. (a)(d) |
11,745 |
246,762 |
|
|
Silvercrest Asset Management Group Class A |
3,371 |
58,655 |
|
|
Solar Capital Ltd. |
25,162 |
551,048 |
|
|
Solar Senior Capital Ltd. |
6,316 |
104,530 |
|
|
Stellus Capital Investment Corp. (d) |
6,558 |
88,205 |
|
|
Stifel Financial Corp. (a) |
36,084 |
1,687,649 |
|
|
SWS Group, Inc. (a) |
16,160 |
119,746 |
|
|
TCP Capital Corp. (d) |
20,088 |
325,225 |
|
|
THL Credit, Inc. (d) |
18,816 |
252,699 |
|
|
TICC Capital Corp. |
29,200 |
281,196 |
|
|
Triangle Capital Corp. |
15,580 |
406,171 |
|
|
Virtus Investment Partners, Inc. (a) |
3,793 |
701,667 |
|
|
Walter Investment Management Corp. (a)(d) |
20,674 |
549,515 |
|
|
Westwood Holdings Group, Inc. |
3,995 |
232,389 |
|
|
WhiteHorse Finance, Inc. (d) |
4,535 |
61,857 |
|
|
WisdomTree Investments, Inc. (a)(d) |
56,362 |
636,327 |
|
|
|
24,518,429 |
||
|
Consumer Finance - 0.7% |
|||
|
Cash America International, Inc. |
16,055 |
699,195 |
|
|
Consumer Portfolio Services, Inc. (a) |
10,795 |
75,349 |
|
|
Credit Acceptance Corp. (a) |
3,973 |
522,529 |
|
|
DFC Global Corp. (a) |
22,238 |
207,258 |
|
|
Encore Capital Group, Inc. (a)(d) |
14,072 |
608,192 |
|
|
EZCORP, Inc. (non-vtg.) Class A (a) |
29,127 |
303,795 |
|
|
First Cash Financial Services, Inc. (a)(d) |
16,335 |
796,658 |
|
|
First Marblehead Corp. (a)(d) |
6,090 |
32,033 |
|
|
Green Dot Corp. Class A (a)(d) |
16,081 |
279,327 |
|
|
Imperial Holdings, Inc. (a)(d) |
9,628 |
64,411 |
|
|
JGWPT Holdings, Inc. |
6,365 |
90,192 |
|
|
Nelnet, Inc. Class A |
12,811 |
541,393 |
|
|
Nicholas Financial, Inc. |
5,863 |
92,166 |
|
|
Portfolio Recovery Associates, Inc. (a)(d) |
28,585 |
1,633,633 |
|
|
Common Stocks - continued |
|||
|
Shares |
Value |
||
|
FINANCIALS - continued |
|||
|
Consumer Finance - continued |
|||
|
Regional Management Corp. (a) |
2,715 |
$ 41,648 |
|
|
Springleaf Holdings, Inc. |
13,817 |
317,515 |
|
|
World Acceptance Corp. (a)(d) |
4,839 |
351,311 |
|
|
|
6,656,605 |
||
|
Diversified Financial Services - 0.3% |
|||
|
California First National Bancorp |
699 |
10,366 |
|
|
Gain Capital Holdings, Inc. (d) |
6,371 |
64,347 |
|
|
MarketAxess Holdings, Inc. |
21,180 |
1,141,178 |
|
|
Marlin Business Services Corp. |
4,511 |
77,454 |
|
|
NewStar Financial, Inc. (a) |
14,516 |
165,773 |
|
|
PHH Corp. (a)(d) |
32,126 |
763,635 |
|
|
PICO Holdings, Inc. (a) |
13,115 |
304,924 |
|
|
Resource America, Inc. Class A |
5,558 |
47,299 |
|
|
|
2,574,976 |
||
|
Insurance - 2.4% |
|||
|
AMBAC Financial Group, Inc. (a) |
25,534 |
770,616 |
|
|
American Equity Investment Life Holding Co. (d) |
38,290 |
892,923 |
|
|
Amerisafe, Inc. |
10,383 |
442,835 |
|
|
Amtrust Financial Services, Inc. (d) |
17,507 |
676,996 |
|
|
Argo Group International Holdings, Ltd. |
15,081 |
669,898 |
|
|
Baldwin & Lyons, Inc. Class B |
5,128 |
133,379 |
|
|
Blue Capital Reinsurance Holdings Ltd. |
3,712 |
68,895 |
|
|
Citizens, Inc. Class A (a)(d) |
25,249 |
165,886 |
|
|
CNO Financial Group, Inc. |
125,574 |
2,166,152 |
|
|
Crawford & Co. Class B |
14,623 |
166,995 |
|
|
Donegal Group, Inc. Class A |
3,498 |
51,630 |
|
|
eHealth, Inc. (a)(d) |
10,311 |
431,928 |
|
|
EMC Insurance Group |
2,503 |
82,574 |
|
|
Employers Holdings, Inc. |
17,546 |
357,061 |
|
|
Enstar Group Ltd. (a) |
5,308 |
685,263 |
|
|
FBL Financial Group, Inc. Class A |
5,084 |
227,306 |
|
|
Fidelity & Guaranty Life |
6,392 |
137,044 |
|
|
First American Financial Corp. |
61,120 |
1,625,792 |
|
|
Fortegra Financial Corp. (a) |
2,204 |
15,913 |
|
|
Global Indemnity PLC (a) |
4,951 |
132,687 |
|
|
Greenlight Capital Re, Ltd. (a) |
15,833 |
503,964 |
|
|
Hallmark Financial Services, Inc. (a) |
6,436 |
54,062 |
|
|
HCI Group, Inc. |
5,371 |
207,750 |
|
|
Health Insurance Innovations (a)(d) |
2,655 |
26,789 |
|
|
Hilltop Holdings, Inc. (a) |
37,674 |
841,637 |
|
|
Common Stocks - continued |
|||
|
Shares |
Value |
||
|
FINANCIALS - continued |
|||
|
Insurance - continued |
|||
|
Horace Mann Educators Corp. |
22,258 |
$ 669,298 |
|
|
Independence Holding Co. |
4,663 |
60,899 |
|
|
Infinity Property & Casualty Corp. |
6,345 |
407,159 |
|
|
Investors Title Co. |
948 |
67,080 |
|
|
Kansas City Life Insurance Co. |
2,061 |
85,696 |
|
|
Maiden Holdings Ltd. |
28,399 |
335,108 |
|
|
Meadowbrook Insurance Group, Inc. |
30,540 |
171,024 |
|
|
Montpelier Re Holdings Ltd. (d) |
24,888 |
761,075 |
|
|
National Interstate Corp. |
3,701 |
103,702 |
|
|
National Western Life Insurance Co. Class A |
1,225 |
285,731 |
|
|
Navigators Group, Inc. (a) |
5,715 |
325,584 |
|
|
OneBeacon Insurance Group Ltd. |
12,746 |
196,798 |
|
|
Phoenix Companies, Inc. (a)(d) |
3,134 |
137,959 |
|
|
Platinum Underwriters Holdings Ltd. |
16,256 |
1,019,414 |
|
|
Primerica, Inc. |
32,191 |
1,477,245 |
|
|
RLI Corp. |
23,919 |
1,029,952 |
|
|
Safety Insurance Group, Inc. |
7,115 |
382,147 |
|
|
Selective Insurance Group, Inc. |
31,536 |
723,436 |
|
|
State Auto Financial Corp. |
8,780 |
179,639 |
|
|
Stewart Information Services Corp. (d) |
11,935 |
364,018 |
|
|
Symetra Financial Corp. |
45,735 |
944,885 |
|
|
Third Point Reinsurance Ltd. |
14,093 |
220,415 |
|
|
Tower Group International Ltd. |
32,976 |
81,121 |
|
|
United Fire Group, Inc. |
11,337 |
315,395 |
|
|
Universal Insurance Holdings, Inc. |
14,220 |
208,039 |
|
|
|
22,088,794 |
||
|
Real Estate Investment Trusts - 8.3% |
|||
|
Acadia Realty Trust (SBI) |
30,939 |
839,375 |
|
|
AG Mortgage Investment Trust, Inc. |
15,510 |
274,372 |
|
|
Agree Realty Corp. |
8,386 |
250,490 |
|
|
Alexanders, Inc. |
1,196 |
413,529 |
|
|
Altisource Residential Corp. Class B |
32,043 |
901,049 |
|
|
American Assets Trust, Inc. |
18,762 |
636,970 |
|
|
American Capital Mortgage Investment Corp. |
30,088 |
595,742 |
|
|
American Realty Capital Properties, Inc. |
265,625 |
3,476,989 |
|
|
American Residential Properties, Inc. (a)(d) |
8,183 |
147,049 |
|
|
AmREIT, Inc. Class B |
10,957 |
182,544 |
|
|
Anworth Mortgage Asset Corp. |
79,161 |
427,469 |
|
|
Apollo Commercial Real Estate Finance, Inc. |
20,963 |
356,581 |
|
|
Apollo Residential Mortgage, Inc. |
18,616 |
300,648 |
|
|
Common Stocks - continued |
|||
|
Shares |
Value |
||
|
FINANCIALS - continued |
|||
|
Real Estate Investment Trusts - continued |
|||
|
Ares Commercial Real Estate Corp. |
11,943 |
$ 152,393 |
|
|
Armada Hoffler Properties, Inc. |
12,064 |
116,780 |
|
|
Armour Residential REIT, Inc. |
209,747 |
889,327 |
|
|
Ashford Hospitality Prime, Inc. |
10,200 |
156,468 |
|
|
Ashford Hospitality Trust, Inc. |
38,710 |
397,165 |
|
|
Associated Estates Realty Corp. |
32,208 |
540,450 |
|
|
Aviv REIT, Inc. |
8,214 |
216,767 |
|
|
Campus Crest Communities, Inc. |
37,114 |
319,552 |
|
|
Capstead Mortgage Corp. (d) |
53,281 |
680,931 |
|
|
CatchMark Timber Trust, Inc. |
6,861 |
92,486 |
|
|
Cedar Shopping Centers, Inc. |
40,627 |
251,481 |
|
|
Chambers Street Properties |
132,645 |
1,033,305 |
|
|
Chatham Lodging Trust |
14,474 |
294,256 |
|
|
Chesapeake Lodging Trust |
27,459 |
741,118 |
|
|
Colony Financial, Inc. |
51,903 |
1,128,890 |
|
|
Coresite Realty Corp. |
11,898 |
361,937 |
|
|
Cousins Properties, Inc. |
95,146 |
1,106,548 |
|
|
CubeSmart |
79,085 |
1,470,981 |
|
|
CyrusOne, Inc. |
10,529 |
210,580 |
|
|
CYS Investments, Inc. |
90,996 |
782,566 |
|
|
DCT Industrial Trust, Inc. |
178,199 |
1,393,516 |
|
|
DiamondRock Hospitality Co. |
111,207 |
1,364,510 |
|
|
DuPont Fabros Technology, Inc. (d) |
34,986 |
847,711 |
|
|
Dynex Capital, Inc. |
30,278 |
259,785 |
|
|
EastGroup Properties, Inc. (d) |
16,985 |
1,074,301 |
|
|
Education Realty Trust, Inc. |
64,632 |
659,246 |
|
|
Ellington Residential Mortgage REIT |
3,908 |
63,857 |
|
|
Empire State Realty Trust, Inc. (d) |
46,724 |
714,877 |
|
|
EPR Properties |
28,812 |
1,544,611 |
|
|
Equity One, Inc. |
34,148 |
769,354 |
|
|
Excel Trust, Inc. |
26,343 |
332,449 |
|
|
FelCor Lodging Trust, Inc. |
69,440 |
640,931 |
|
|
First Industrial Realty Trust, Inc. |
61,173 |
1,123,748 |
|
|
First Potomac Realty Trust |
32,537 |
423,957 |
|
|
Franklin Street Properties Corp. |
52,055 |
634,030 |
|
|
Getty Realty Corp. |
13,972 |
264,350 |
|
|
Gladstone Commercial Corp. |
8,128 |
143,378 |
|
|
Glimcher Realty Trust |
81,477 |
830,251 |
|
|
Government Properties Income Trust |
30,970 |
788,187 |
|
|
Gramercy Property Trust, Inc. (d) |
32,864 |
171,550 |
|
|
Hannon Armstrong Sustainable Infrastructure Capital, Inc. |
8,613 |
113,864 |
|
|
Common Stocks - continued |
|||
|
Shares |
Value |
||
|
FINANCIALS - continued |
|||
|
Real Estate Investment Trusts - continued |
|||
|
Healthcare Realty Trust, Inc. |
53,913 |
$ 1,355,912 |
|
|
Hersha Hospitality Trust |
113,125 |
657,256 |
|
|
Highwoods Properties, Inc. (SBI) |
50,196 |
2,025,409 |
|
|
Hudson Pacific Properties, Inc. |
28,333 |
667,242 |
|
|
Inland Real Estate Corp. |
47,693 |
498,392 |
|
|
Invesco Mortgage Capital, Inc. |
70,498 |
1,175,202 |
|
|
Investors Real Estate Trust |
59,131 |
515,622 |
|
|
iStar Financial, Inc. (a) |
47,773 |
709,907 |
|
|
JAVELIN Mortgage Investment Corp. |
6,969 |
92,060 |
|
|
Kite Realty Group Trust |
74,992 |
464,950 |
|
|
LaSalle Hotel Properties (SBI) |
58,823 |
1,945,865 |
|
|
Lexington Corporate Properties Trust |
101,979 |
1,097,294 |
|
|
LTC Properties, Inc. |
19,378 |
748,572 |
|
|
Medical Properties Trust, Inc. |
96,556 |
1,303,506 |
|
|
Monmouth Real Estate Investment Corp. Class A |
24,565 |
230,665 |
|
|
National Health Investors, Inc. |
16,385 |
1,010,791 |
|
|
New Residential Investment Corp. |
143,909 |
877,845 |
|
|
New York Mortgage Trust, Inc. |
52,341 |
385,753 |
|
|
NorthStar Realty Finance Corp. |
184,560 |
2,956,651 |
|
|
One Liberty Properties, Inc. |
6,800 |
150,484 |
|
|
Parkway Properties, Inc. |
33,018 |
622,719 |
|
|
Pebblebrook Hotel Trust |
34,919 |
1,202,610 |
|
|
Pennsylvania Real Estate Investment Trust (SBI) |
38,184 |
631,945 |
|
|
PennyMac Mortgage Investment Trust |
39,525 |
926,466 |
|
|
Physicians Realty Trust |
11,242 |
154,240 |
|
|
Potlatch Corp. |
22,754 |
869,885 |
|
|
PS Business Parks, Inc. |
10,918 |
936,437 |
|
|
QTS Realty Trust, Inc. Class A |
8,201 |
223,477 |
|
|
RAIT Financial Trust (d) |
46,898 |
383,626 |
|
|
Ramco-Gershenson Properties Trust (SBI) |
38,090 |
627,723 |
|
|
Redwood Trust, Inc. |
46,496 |
1,013,613 |
|
|
Resource Capital Corp. |
72,066 |
396,363 |
|
|
Retail Opportunity Investments Corp. |
40,116 |
627,414 |
|
|
Rexford Industrial Realty, Inc. |
9,198 |
130,796 |
|
|
RLJ Lodging Trust |
69,974 |
1,866,207 |
|
|
Rouse Properties, Inc. |
14,367 |
241,222 |
|
|
Ryman Hospitality Properties, Inc. (d) |
24,837 |
1,131,325 |
|
|
Sabra Health Care REIT, Inc. (d) |
20,791 |
623,106 |
|
|
Saul Centers, Inc. |
4,567 |
209,580 |
|
|
Select Income (REIT) |
12,205 |
375,670 |
|
|
Silver Bay Realty Trust Corp. |
8,513 |
127,525 |
|
|
Common Stocks - continued |
|||
|
Shares |
Value |
||
|
FINANCIALS - continued |
|||
|
Real Estate Investment Trusts - continued |
|||
|
Sovran Self Storage, Inc. |
17,621 |
$ 1,337,434 |
|
|
Stag Industrial, Inc. |
24,832 |
584,297 |
|
|
Strategic Hotel & Resorts, Inc. (a) |
102,656 |
1,107,658 |
|
|
Summit Hotel Properties, Inc. |
44,662 |
404,638 |
|
|
Sun Communities, Inc. |
22,853 |
1,041,411 |
|
|
Sunstone Hotel Investors, Inc. |
103,654 |
1,483,289 |
|
|
Terreno Realty Corp. |
14,088 |
257,388 |
|
|
The Geo Group, Inc. |
40,515 |
1,358,468 |
|
|
UMH Properties, Inc. |
10,828 |
106,656 |
|
|
Universal Health Realty Income Trust (SBI) |
6,830 |
289,797 |
|
|
Urstadt Biddle Properties, Inc. Class A |
14,094 |
287,659 |
|
|
Washington REIT (SBI) |
37,467 |
916,443 |
|
|
Western Asset Mortgage Capital Corp. |
23,074 |
340,803 |
|
|
Whitestone REIT Class B |
12,367 |
173,509 |
|
|
Winthrop Realty Trust |
18,162 |
252,452 |
|
|
ZAIS Financial Corp. |
3,054 |
50,360 |
|
|
|
76,088,840 |
||
|
Real Estate Management & Development - 0.3% |
|||
|
Alexander & Baldwin, Inc. |
24,471 |
913,013 |
|
|
AV Homes, Inc. (a) |
5,335 |
91,389 |
|
|
Consolidated-Tomoka Land Co. |
3,517 |
139,027 |
|
|
Forestar Group, Inc. (a)(d) |
19,080 |
325,314 |
|
|
Kennedy-Wilson Holdings, Inc. |
36,865 |
805,132 |
|
|
RE/MAX Holdings, Inc. |
6,764 |
190,880 |
|
|
Tejon Ranch Co. (a) |
7,772 |
241,010 |
|
|
|
2,705,765 |
||
|
Thrifts & Mortgage Finance - 1.6% |
|||
|
Astoria Financial Corp. |
49,572 |
657,325 |
|
|
Banc of California, Inc. |
10,380 |
130,477 |
|
|
Bank Mutual Corp. |
26,289 |
158,260 |
|
|
BankFinancial Corp. |
12,766 |
125,617 |
|
|
BBX Capital Corp. (a) |
3,728 |
69,825 |
|
|
Beneficial Mutual Bancorp, Inc. (a) |
17,516 |
228,409 |
|
|
Berkshire Hills Bancorp, Inc. |
13,855 |
324,623 |
|
|
BofI Holding, Inc. (a)(d) |
6,859 |
552,904 |
|
|
Brookline Bancorp, Inc., Delaware |
40,971 |
372,017 |
|
|
Capitol Federal Financial, Inc. |
82,801 |
996,924 |
|
|
Charter Financial Corp. |
12,027 |
132,297 |
|
|
Clifton Bancorp, Inc. |
4,484 |
51,970 |
|
|
Dime Community Bancshares, Inc. |
17,454 |
284,500 |
|
|
Common Stocks - continued |
|||
|
Shares |
Value |
||
|
FINANCIALS - continued |
|||
|
Thrifts & Mortgage Finance - continued |
|||
|
Doral Financial Corp. (a) |
3,119 |
$ 29,818 |
|
|
ESB Financial Corp. |
7,090 |
89,476 |
|
|
ESSA Bancorp, Inc. |
4,382 |
45,529 |
|
|
Essent Group Ltd. |
13,023 |
245,484 |
|
|
EverBank Financial Corp. |
45,568 |
853,033 |
|
|
Farmer Mac Class C (non-vtg.) |
6,105 |
217,216 |
|
|
First Defiance Financial Corp. |
5,526 |
149,313 |
|
|
First Federal Bancshares of Arkansas, Inc. (a) |
780 |
6,919 |
|
|
First Financial Northwest, Inc. |
8,299 |
84,650 |
|
|
Flagstar Bancorp, Inc. (a) |
11,435 |
201,256 |
|
|
Fox Chase Bancorp, Inc. |
6,459 |
107,736 |
|
|
Franklin Financial Corp./VA (a) |
6,409 |
127,924 |
|
|
Hingham Institution for Savings |
624 |
43,374 |
|
|
Home Bancorp, Inc. (a) |
4,891 |
99,043 |
|
|
Home Loan Servicing Solutions Ltd. (d) |
40,226 |
891,006 |
|
|
HomeStreet, Inc. |
7,559 |
137,271 |
|
|
Kearny Financial Corp. (a) |
8,202 |
119,585 |
|
|
Ladder Capital Corp. Class A |
8,535 |
152,691 |
|
|
Meridian Interstate Bancorp, Inc. (a) |
5,096 |
128,776 |
|
|
Meta Financial Group, Inc. |
3,367 |
141,111 |
|
|
MGIC Investment Corp. (a)(d) |
183,750 |
1,580,250 |
|
|
NASB Financial, Inc. |
1,946 |
46,432 |
|
|
Northfield Bancorp, Inc. |
32,634 |
423,263 |
|
|
Northwest Bancshares, Inc. |
52,717 |
700,609 |
|
|
OceanFirst Financial Corp. |
7,879 |
127,797 |
|
|
Oritani Financial Corp. |
25,269 |
374,739 |
|
|
PennyMac Financial Services, Inc. |
7,170 |
113,788 |
|
|
Provident Financial Holdings, Inc. |
4,390 |
61,767 |
|
|
Provident Financial Services, Inc. |
33,404 |
580,562 |
|
|
Radian Group, Inc. (d) |
97,949 |
1,369,327 |
|
|
Rockville Financial, Inc. |
15,085 |
198,519 |
|
|
Stonegate Mortgage Corp. (a)(d) |
5,171 |
65,413 |
|
|
Territorial Bancorp, Inc. |
5,715 |
116,929 |
|
|
Tree.com, Inc. (a) |
3,603 |
104,775 |
|
|
Trustco Bank Corp., New York |
51,772 |
342,213 |
|
|
United Community Financial Corp. (a) |
28,315 |
94,289 |
|
|
United Financial Bancorp, Inc. |
10,717 |
189,048 |
|
|
Walker & Dunlop, Inc. (a) |
9,575 |
150,136 |
|
|
Waterstone Financial, Inc. Maryland |
3,923 |
40,838 |
|
|
Common Stocks - continued |
|||
|
Shares |
Value |
||
|
FINANCIALS - continued |
|||
|
Thrifts & Mortgage Finance - continued |
|||
|
Westfield Financial, Inc. |
11,150 |
$ 76,378 |
|
|
WSFS Financial Corp. |
4,315 |
291,780 |
|
|
|
15,005,211 |
||
|
TOTAL FINANCIALS |
215,225,381 |
||
|
HEALTH CARE - 12.8% |
|||
|
Biotechnology - 4.1% |
|||
|
ACADIA Pharmaceuticals, Inc. (a)(d) |
43,487 |
875,393 |
|
|
Acceleron Pharma, Inc. (d) |
3,913 |
134,412 |
|
|
Achillion Pharmaceuticals, Inc. (a)(d) |
53,646 |
152,891 |
|
|
Acorda Therapeutics, Inc. (a) |
22,966 |
814,145 |
|
|
Aegerion Pharmaceuticals, Inc. (a)(d) |
16,186 |
716,392 |
|
|
Agios Pharmaceuticals, Inc. |
3,757 |
158,019 |
|
|
Alnylam Pharmaceuticals, Inc. (a)(d) |
33,132 |
1,641,028 |
|
|
AMAG Pharmaceuticals, Inc. (a)(d) |
11,893 |
217,166 |
|
|
Amicus Therapeutics, Inc. (a)(d) |
15,682 |
34,814 |
|
|
Anacor Pharmaceuticals, Inc. (a)(d) |
13,936 |
229,526 |
|
|
Arena Pharmaceuticals, Inc. (a)(d) |
122,402 |
783,373 |
|
|
Argos Therapeutics, Inc. (a) |
2,141 |
19,012 |
|
|
ArQule, Inc. (a) |
27,969 |
45,310 |
|
|
Array BioPharma, Inc. (a) |
68,181 |
271,360 |
|
|
Auspex Pharmaceuticals, Inc. |
4,662 |
99,953 |
|
|
AVEO Pharmaceuticals, Inc. (a)(d) |
26,099 |
32,102 |
|
|
BIND Therapeutics, Inc. (d) |
3,389 |
31,958 |
|
|
BioTime, Inc. (a)(d) |
22,836 |
59,145 |
|
|
Bluebird Bio, Inc. |
4,103 |
81,239 |
|
|
Cara Therapeutics, Inc. (d) |
2,953 |
42,494 |
|
|
Cell Therapeutics, Inc. (a)(d) |
71,138 |
209,857 |
|
|
Celladon Corp. (a) |
3,422 |
40,209 |
|
|
Celldex Therapeutics, Inc. (a)(d) |
49,883 |
748,245 |
|
|
Cellular Dynamics International, Inc. (d) |
2,038 |
24,354 |
|
|
Cepheid, Inc. (a) |
37,716 |
1,639,892 |
|
|
Chelsea Therapeutics International Ltd. (a)(d) |
43,113 |
210,391 |
|
|
ChemoCentryx, Inc. (a)(d) |
12,853 |
70,434 |
|
|
Chimerix, Inc. |
4,539 |
87,693 |
|
|
Clovis Oncology, Inc. (a) |
10,069 |
544,431 |
|
|
Conatus Pharmaceuticals, Inc. (d) |
3,132 |
19,262 |
|
|
Concert Pharmaceuticals, Inc. |
3,219 |
28,778 |
|
|
Coronado Biosciences, Inc. (a)(d) |
18,649 |
32,449 |
|
|
Curis, Inc. (a)(d) |
46,833 |
105,843 |
|
|
Common Stocks - continued |
|||
|
Shares |
Value |
||
|
HEALTH CARE - continued |
|||
|
Biotechnology - continued |
|||
|
Cytokinetics, Inc. (a)(d) |
17,796 |
$ 80,972 |
|
|
Cytori Therapeutics, Inc. (a)(d) |
34,377 |
77,692 |
|
|
Dendreon Corp. (a)(d) |
87,107 |
224,736 |
|
|
Dicerna Pharmaceuticals, Inc. |
1,909 |
35,832 |
|
|
Durata Therapeutics, Inc. (a)(d) |
7,826 |
105,964 |
|
|
Dyax Corp. (a) |
75,705 |
500,410 |
|
|
Dynavax Technologies Corp. (a)(d) |
145,144 |
236,585 |
|
|
Eagle Pharmaceuticals, Inc. |
1,617 |
15,944 |
|
|
Eleven Biotherapeutics, Inc. |
2,422 |
32,673 |
|
|
Emergent BioSolutions, Inc. (a) |
15,197 |
400,593 |
|
|
Enanta Pharmaceuticals, Inc. (a)(d) |
2,107 |
78,401 |
|
|
Enzon Pharmaceuticals, Inc. |
19,100 |
17,001 |
|
|
Epizyme, Inc. (d) |
3,614 |
78,857 |
|
|
Esperion Therapeutics, Inc. (d) |
2,518 |
34,723 |
|
|
Exact Sciences Corp. (a)(d) |
48,063 |
576,756 |
|
|
Exelixis, Inc. (a)(d) |
109,532 |
387,743 |
|
|
Fibrocell Science, Inc. (a)(d) |
13,879 |
52,740 |
|
|
Five Prime Therapeutics, Inc. |
3,730 |
52,108 |
|
|
Flexion Therapeutics, Inc. |
2,394 |
28,369 |
|
|
Foundation Medicine, Inc. (d) |
3,792 |
110,575 |
|
|
Galena Biopharma, Inc. (a)(d) |
65,322 |
160,039 |
|
|
Genocea Biosciences, Inc. |
2,070 |
40,158 |
|
|
Genomic Health, Inc. (a)(d) |
9,366 |
245,764 |
|
|
Geron Corp. (a)(d) |
84,599 |
167,506 |
|
|
GlycoMimetics, Inc. |
4,322 |
57,353 |
|
|
GTx, Inc. (a)(d) |
13,506 |
20,799 |
|
|
Halozyme Therapeutics, Inc. (a)(d) |
54,288 |
404,446 |
|
|
Harvard Apparatus (a) |
3,500 |
30,275 |
|
|
Hyperion Therapeutics, Inc. (a)(d) |
4,515 |
111,250 |
|
|
Idenix Pharmaceuticals, Inc. (a)(d) |
62,043 |
341,857 |
|
|
ImmunoGen, Inc. (a)(d) |
47,935 |
620,279 |
|
|
Immunomedics, Inc. (a)(d) |
40,647 |
171,124 |
|
|
Infinity Pharmaceuticals, Inc. (a) |
26,312 |
257,068 |
|
|
Insmed, Inc. (a) |
20,146 |
280,835 |
|
|
Insys Therapeutics, Inc. (a) |
4,749 |
194,994 |
|
|
Intercept Pharmaceuticals, Inc. (a) |
4,063 |
1,073,120 |
|
|
InterMune, Inc. (a)(d) |
55,658 |
1,785,509 |
|
|
Intrexon Corp. (d) |
6,379 |
120,436 |
|
|
Ironwood Pharmaceuticals, Inc. Class A (a) |
60,087 |
662,159 |
|
|
Isis Pharmaceuticals, Inc. (a)(d) |
63,817 |
1,698,170 |
|
|
KaloBios Pharmaceuticals, Inc. (a) |
6,513 |
14,785 |
|
|
Common Stocks - continued |
|||
|
Shares |
Value |
||
|
HEALTH CARE - continued |
|||
|
Biotechnology - continued |
|||
|
Karyopharm Therapeutics, Inc. |
4,318 |
$ 115,852 |
|
|
Keryx Biopharmaceuticals, Inc. (a)(d) |
50,031 |
738,958 |
|
|
Kindred Biosciences, Inc. |
6,306 |
100,202 |
|
|
KYTHERA Biopharmaceuticals, Inc. (a)(d) |
6,520 |
212,617 |
|
|
Lexicon Pharmaceuticals, Inc. (a)(d) |
134,583 |
207,258 |
|
|
Ligand Pharmaceuticals, Inc. Class B (a)(d) |
10,019 |
632,900 |
|
|
Macrogenics, Inc. |
3,685 |
73,479 |
|
|
MannKind Corp. (a)(d) |
83,487 |
546,840 |
|
|
MEI Pharma, Inc. (a) |
7,273 |
56,875 |
|
|
Merrimack Pharmaceuticals, Inc. (a)(d) |
53,087 |
233,052 |
|
|
MiMedx Group, Inc. (a) |
53,769 |
310,785 |
|
|
Momenta Pharmaceuticals, Inc. (a) |
26,076 |
297,788 |
|
|
Nanosphere, Inc. (a) |
29,094 |
49,751 |
|
|
Navidea Biopharmaceuticals, Inc. (a)(d) |
68,459 |
114,327 |
|
|
Neurocrine Biosciences, Inc. (a) |
42,940 |
602,019 |
|
|
NewLink Genetics Corp. (a)(d) |
10,148 |
223,256 |
|
|
Novavax, Inc. (a)(d) |
106,823 |
467,885 |
|
|
NPS Pharmaceuticals, Inc. (a)(d) |
57,128 |
1,520,747 |
|
|
OncoGenex Pharmaceuticals, Inc. (a)(d) |
8,519 |
33,054 |
|
|
OncoMed Pharmaceuticals, Inc. (d) |
2,542 |
66,956 |
|
|
Onconova Therapeutics, Inc. |
2,824 |
15,758 |
|
|
Ophthotech Corp. |
5,374 |
182,662 |
|
|
Opko Health, Inc. (a)(d) |
108,138 |
894,301 |
|
|
Orexigen Therapeutics, Inc. (a)(d) |
63,518 |
356,971 |
|
|
Osiris Therapeutics, Inc. (a)(d) |
9,321 |
132,638 |
|
|
OvaScience, Inc. (a)(d) |
6,138 |
49,841 |
|
|
PDL BioPharma, Inc. (d) |
90,654 |
769,652 |
|
|
Peregrine Pharmaceuticals, Inc. (a)(d) |
96,660 |
168,188 |
|
|
Portola Pharmaceuticals, Inc. (d) |
6,084 |
142,731 |
|
|
Progenics Pharmaceuticals, Inc. (a)(d) |
39,891 |
140,815 |
|
|
Prothena Corp. PLC (a) |
7,821 |
172,062 |
|
|
PTC Therapeutics, Inc. (a)(d) |
6,237 |
121,871 |
|
|
Puma Biotechnology, Inc. (a) |
13,207 |
997,657 |
|
|
Raptor Pharmaceutical Corp. (a)(d) |
32,815 |
271,380 |
|
|
Receptos, Inc. |
4,005 |
135,329 |
|
|
Regulus Therapeutics, Inc. (a)(d) |
5,746 |
40,969 |
|
|
Repligen Corp. (a)(d) |
17,509 |
277,518 |
|
|
Retrophin, Inc. (a) |
10,364 |
148,102 |
|
|
Rigel Pharmaceuticals, Inc. (a) |
48,278 |
154,490 |
|
|
Sangamo Biosciences, Inc. (a) |
37,611 |
520,536 |
|
|
Sarepta Therapeutics, Inc. (a)(d) |
21,171 |
786,079 |
|
|
Common Stocks - continued |
|||
|
Shares |
Value |
||
|
HEALTH CARE - continued |
|||
|
Biotechnology - continued |
|||
|
SIGA Technologies, Inc. (a)(d) |
31,627 |
$ 90,769 |
|
|
Spectrum Pharmaceuticals, Inc. (a) |
35,441 |
243,480 |
|
|
Stemline Therapeutics, Inc. (a)(d) |
5,475 |
83,822 |
|
|
Sunesis Pharmaceuticals, Inc. (a)(d) |
20,004 |
102,621 |
|
|
Synageva BioPharma Corp. (a)(d) |
11,594 |
1,001,374 |
|
|
Synergy Pharmaceuticals, Inc. (a)(d) |
45,023 |
202,153 |
|
|
Synta Pharmaceuticals Corp. (a)(d) |
27,682 |
116,541 |
|
|
Targacept, Inc. (a) |
15,030 |
66,733 |
|
|
TESARO, Inc. (a)(d) |
8,161 |
203,699 |
|
|
TetraLogic Pharmaceuticals Corp. |
1,975 |
11,258 |
|
|
Tetraphase Pharmaceuticals, Inc. (a) |
8,555 |
91,881 |
|
|
TG Therapeutics, Inc. (a)(d) |
9,767 |
52,058 |
|
|
Threshold Pharmaceuticals, Inc. (a) |
28,110 |
115,251 |
|
|
Trevena, Inc. |
3,901 |
19,544 |
|
|
Ultragenyx Pharmaceutical, Inc. (d) |
3,616 |
140,228 |
|
|
Vanda Pharmaceuticals, Inc. (a)(d) |
19,240 |
268,013 |
|
|
Verastem, Inc. (a)(d) |
9,467 |
79,049 |
|
|
Vical, Inc. (a)(d) |
40,381 |
45,631 |
|
|
Xencor, Inc. |
7,906 |
78,269 |
|
|
XOMA Corp. (a)(d) |
42,338 |
187,981 |
|
|
ZIOPHARM Oncology, Inc. (a)(d) |
44,576 |
160,474 |
|
|
|
38,233,150 |
||
|
Health Care Equipment & Supplies - 3.3% |
|||
|
Abaxis, Inc. (d) |
12,357 |
501,818 |
|
|
Abiomed, Inc. (a)(d) |
21,635 |
512,533 |
|
|
Accuray, Inc. (a)(d) |
41,570 |
349,188 |
|
|
Align Technology, Inc. (a) |
41,325 |
2,082,367 |
|
|
Alphatec Holdings, Inc. (a) |
36,216 |
48,892 |
|
|
Analogic Corp. |
6,842 |
513,697 |
|
|
Angiodynamics, Inc. (a) |
14,169 |
190,431 |
|
|
Anika Therapeutics, Inc. (a) |
6,840 |
292,342 |
|
|
Antares Pharma, Inc. (a)(d) |
62,164 |
172,816 |
|
|
ArthroCare Corp. (a) |
15,789 |
766,240 |
|
|
Atricure, Inc. (a) |
13,264 |
204,266 |
|
|
Atrion Corp. |
875 |
252,289 |
|
|
BioLase Technology, Inc. (d) |
17,685 |
34,132 |
|
|
Cantel Medical Corp. |
18,311 |
607,193 |
|
|
Cardiovascular Systems, Inc. (a) |
14,633 |
420,699 |
|
|
Cerus Corp. (a)(d) |
38,350 |
166,056 |
|
|
CONMED Corp. |
15,594 |
722,470 |
|
|
Common Stocks - continued |
|||
|
Shares |
Value |
||
|
HEALTH CARE - continued |
|||
|
Health Care Equipment & Supplies - continued |
|||
|
Cryolife, Inc. |
15,929 |
$ 144,635 |
|
|
Cutera, Inc. (a) |
8,934 |
92,110 |
|
|
Cyberonics, Inc. (a)(d) |
15,474 |
915,442 |
|
|
Cynosure, Inc. Class A (a) |
11,126 |
273,032 |
|
|
Derma Sciences, Inc. (a) |
10,892 |
112,623 |
|
|
DexCom, Inc. (a) |
40,057 |
1,299,449 |
|
|
Endologix, Inc. (a)(d) |
35,195 |
446,273 |
|
|
Exactech, Inc. (a) |
4,853 |
107,834 |
|
|
Genmark Diagnostics, Inc. (a)(d) |
20,108 |
179,967 |
|
|
Globus Medical, Inc. (a) |
30,918 |
755,018 |
|
|
Greatbatch, Inc. (a) |
13,317 |
612,982 |
|
|
Haemonetics Corp. (a)(d) |
28,924 |
878,133 |
|
|
HeartWare International, Inc. (a)(d) |
9,137 |
776,280 |
|
|
ICU Medical, Inc. (a)(d) |
7,237 |
403,680 |
|
|
Inogen, Inc. |
2,960 |
41,766 |
|
|
Insulet Corp. (a)(d) |
30,249 |
1,138,270 |
|
|
Integra LifeSciences Holdings Corp. (a)(d) |
12,855 |
585,931 |
|
|
Invacare Corp. |
17,670 |
279,186 |
|
|
Ldr Holding Corp. |
3,115 |
77,626 |
|
|
Masimo Corp. (a)(d) |
27,344 |
731,725 |
|
|
Medical Action Industries, Inc. (a) |
8,309 |
53,261 |
|
|
Meridian Bioscience, Inc. |
23,725 |
473,788 |
|
|
Merit Medical Systems, Inc. (a) |
23,378 |
300,875 |
|
|
Natus Medical, Inc. (a) |
18,327 |
455,059 |
|
|
Neogen Corp. (a)(d) |
20,381 |
851,416 |
|
|
NuVasive, Inc. (a) |
26,336 |
887,787 |
|
|
NxStage Medical, Inc. (a) |
33,480 |
383,011 |
|
|
OraSure Technologies, Inc. (a) |
31,361 |
205,415 |
|
|
Orthofix International NV (a) |
10,934 |
330,207 |
|
|
Oxford Immunotec Global PLC (a) |
3,769 |
67,465 |
|
|
PhotoMedex, Inc. (a)(d) |
7,142 |
107,916 |
|
|
Quidel Corp. (a)(d) |
16,064 |
344,573 |
|
|
Rockwell Medical Technologies, Inc. (a)(d) |
22,474 |
228,336 |
|
|
RTI Biologics, Inc. (a) |
33,063 |
142,171 |
|
|
Staar Surgical Co. (a) |
20,863 |
354,880 |
|
|
Steris Corp. |
33,171 |
1,593,867 |
|
|
SurModics, Inc. (a) |
8,192 |
178,258 |
|
|
Symmetry Medical, Inc. (a) |
20,901 |
172,642 |
|
|
Tandem Diabetes Care, Inc. (d) |
5,291 |
92,963 |
|
|
TearLab Corp. (a)(d) |
16,041 |
69,297 |
|
|
The Spectranetics Corp. (a) |
22,513 |
478,626 |
|
|
Common Stocks - continued |
|||
|
Shares |
Value |
||
|
HEALTH CARE - continued |
|||
|
Health Care Equipment & Supplies - continued |
|||
|
Thoratec Corp. (a) |
32,510 |
$ 1,065,678 |
|
|
Tornier NV (a) |
14,954 |
253,769 |
|
|
Unilife Corp. (a)(d) |
56,423 |
183,375 |
|
|
Utah Medical Products, Inc. |
2,059 |
104,577 |
|
|
Vascular Solutions, Inc. (a) |
9,619 |
210,752 |
|
|
Veracyte, Inc. |
2,913 |
37,316 |
|
|
Volcano Corp. (a)(d) |
30,491 |
535,422 |
|
|
West Pharmaceutical Services, Inc. |
39,137 |
1,697,763 |
|
|
Wright Medical Group, Inc. (a) |
22,574 |
617,399 |
|
|
Zeltiq Aesthetics, Inc. (a) |
9,981 |
182,552 |
|
|
|
30,349,807 |
||
|
Health Care Providers & Services - 2.6% |
|||
|
Acadia Healthcare Co., Inc. (a)(d) |
20,056 |
842,753 |
|
|
Addus HomeCare Corp. (a) |
2,800 |
60,536 |
|
|
Air Methods Corp. (a)(d) |
21,953 |
1,222,124 |
|
|
Alliance Healthcare Services, Inc. (a) |
2,887 |
82,164 |
|
|
Almost Family, Inc. (a) |
4,916 |
105,547 |
|
|
Amedisys, Inc. (a)(d) |
17,256 |
235,199 |
|
|
AMN Healthcare Services, Inc. (a) |
26,420 |
329,722 |
|
|
AmSurg Corp. (a) |
18,159 |
786,466 |
|
|
Bio-Reference Laboratories, Inc. (a)(d) |
13,897 |
352,984 |
|
|
BioScrip, Inc. (a)(d) |
31,952 |
221,108 |
|
|
Capital Senior Living Corp. (a) |
16,375 |
404,954 |
|
|
Centene Corp. (a) |
30,717 |
2,039,609 |
|
|
Chemed Corp. (d) |
9,961 |
829,452 |
|
|
Chindex International, Inc. (a) |
7,272 |
173,292 |
|
|
Corvel Corp. (a) |
6,277 |
285,855 |
|
|
Cross Country Healthcare, Inc. (a) |
15,086 |
106,960 |
|
|
Emeritus Corp. (a) |
22,495 |
671,026 |
|
|
ExamWorks Group, Inc. (a) |
17,998 |
662,326 |
|
|
Five Star Quality Care, Inc. (a) |
24,289 |
117,316 |
|
|
Gentiva Health Services, Inc. (a) |
18,144 |
136,624 |
|
|
Hanger, Inc. (a) |
19,487 |
675,614 |
|
|
HealthSouth Corp. |
49,215 |
1,704,808 |
|
|
Healthways, Inc. (a)(d) |
19,387 |
348,966 |
|
|
IPC The Hospitalist Co., Inc. (a)(d) |
9,393 |
380,417 |
|
|
Kindred Healthcare, Inc. |
30,496 |
765,450 |
|
|
Landauer, Inc. |
5,350 |
231,334 |
|
|
LHC Group, Inc. (a) |
6,782 |
140,930 |
|
|
Magellan Health Services, Inc. (a) |
15,210 |
877,921 |
|
|
Common Stocks - continued |
|||
|
Shares |
Value |
||
|
HEALTH CARE - continued |
|||
|
Health Care Providers & Services - continued |
|||
|
Molina Healthcare, Inc. (a)(d) |
15,903 |
$ 594,772 |
|
|
MWI Veterinary Supply, Inc. (a)(d) |
7,240 |
1,134,074 |
|
|
National Healthcare Corp. |
6,017 |
329,310 |
|
|
National Research Corp. Class A (a) |
5,251 |
82,756 |
|
|
Owens & Minor, Inc. (d) |
35,692 |
1,197,110 |
|
|
PharMerica Corp. (a) |
16,639 |
452,414 |
|
|
Providence Service Corp. (a) |
5,964 |
242,198 |
|
|
Select Medical Holdings Corp. |
27,174 |
379,349 |
|
|
Skilled Healthcare Group, Inc. (a) |
12,905 |
66,590 |
|
|
Surgical Care Affiliates, Inc. |
6,206 |
182,332 |
|
|
Team Health Holdings, Inc. (a)(d) |
38,720 |
1,877,146 |
|
|
The Ensign Group, Inc. |
11,057 |
469,923 |
|
|
Triple-S Management Corp. (a) |
13,272 |
198,815 |
|
|
U.S. Physical Therapy, Inc. |
6,790 |
209,472 |
|
|
Universal American Spin Corp. |
22,214 |
159,274 |
|
|
USMD Holdings, Inc. (a) |
367 |
4,624 |
|
|
Wellcare Health Plans, Inc. (a) |
24,561 |
1,657,131 |
|
|
|
24,028,747 |
||
|
Health Care Technology - 0.8% |
|||
|
athenahealth, Inc. (a)(d) |
20,764 |
2,567,261 |
|
|
Computer Programs & Systems, Inc. |
6,235 |
393,616 |
|
|
HealthStream, Inc. (a) |
11,111 |
251,664 |
|
|
HMS Holdings Corp. (a)(d) |
49,733 |
804,183 |
|
|
MedAssets, Inc. (a) |
34,476 |
787,087 |
|
|
Medidata Solutions, Inc. (a)(d) |
30,136 |
1,094,238 |
|
|
Merge Healthcare, Inc. (a) |
34,849 |
79,456 |
|
|
Omnicell, Inc. (a) |
20,369 |
539,371 |
|
|
Quality Systems, Inc. |
22,810 |
336,904 |
|
|
Vocera Communications, Inc. (a)(d) |
12,346 |
188,277 |
|
|
|
7,042,057 |
||
|
Life Sciences Tools & Services - 0.5% |
|||
|
Accelerate Diagnostics, Inc. (a)(d) |
6,691 |
123,315 |
|
|
Affymetrix, Inc. (a)(d) |
40,480 |
300,766 |
|
|
Albany Molecular Research, Inc. (a)(d) |
13,343 |
214,289 |
|
|
Cambrex Corp. (a) |
16,819 |
344,621 |
|
|
Fluidigm Corp. (a)(d) |
14,197 |
533,239 |
|
|
Furiex Pharmaceuticals, Inc. (a) |
4,026 |
416,168 |
|
|
Harvard Bioscience, Inc. (a) |
15,254 |
64,372 |
|
|
Luminex Corp. (a)(d) |
21,036 |
404,102 |
|
|
NeoGenomics, Inc. (a) |
18,707 |
61,920 |
|
|
Common Stocks - continued |
|||
|
Shares |
Value |
||
|
HEALTH CARE - continued |
|||
|
Life Sciences Tools & Services - continued |
|||
|
Pacific Biosciences of California, Inc. (a) |
29,145 |
$ 128,821 |
|
|
PAREXEL International Corp. (a) |
32,155 |
1,458,229 |
|
|
Sequenom, Inc. (a)(d) |
63,571 |
173,549 |
|
|
|
4,223,391 |
||
|
Pharmaceuticals - 1.5% |
|||
|
AcelRx Pharmaceuticals, Inc. (a)(d) |
12,868 |
139,232 |
|
|
Aerie Pharmaceuticals, Inc. |
4,496 |
70,407 |
|
|
Akorn, Inc. (a)(d) |
32,705 |
824,820 |
|
|
Alimera Sciences, Inc. (a)(d) |
12,750 |
77,520 |
|
|
Ampio Pharmaceuticals, Inc. (a)(d) |
21,996 |
133,956 |
|
|
Aratana Therapeutics, Inc. |
4,508 |
62,120 |
|
|
AstraZeneca PLC rights (a) |
1,000 |
0 |
|
|
Auxilium Pharmaceuticals, Inc. (a)(d) |
27,583 |
620,893 |
|
|
AVANIR Pharmaceuticals Class A (a)(d) |
83,078 |
413,728 |
|
|
Biodelivery Sciences International, Inc. (a)(d) |
21,351 |
190,237 |
|
|
Cempra, Inc. (a)(d) |
11,086 |
101,104 |
|
|
Corcept Therapeutics, Inc. (a) |
30,681 |
135,610 |
|
|
DepoMed, Inc. (a) |
31,680 |
443,837 |
|
|
Egalet Corp. |
1,375 |
15,895 |
|
|
Endocyte, Inc. (a)(d) |
19,978 |
361,802 |
|
|
Horizon Pharma, Inc. (a) |
31,131 |
441,438 |
|
|
Impax Laboratories, Inc. (a) |
38,490 |
1,006,514 |
|
|
Lannett Co., Inc. (a) |
10,505 |
362,738 |
|
|
Nektar Therapeutics (a)(d) |
70,037 |
824,335 |
|
|
Omeros Corp. (a)(d) |
19,060 |
235,963 |
|
|
Pacira Pharmaceuticals, Inc. (a) |
16,870 |
1,155,426 |
|
|
Pernix Therapeutics Holdings, Inc. (a)(d) |
9,246 |
44,473 |
|
|
Pozen, Inc. |
15,266 |
127,624 |
|
|
Prestige Brands Holdings, Inc. (a) |
28,743 |
963,465 |
|
|
Questcor Pharmaceuticals, Inc. (d) |
29,309 |
2,408,614 |
|
|
Relypsa, Inc. (d) |
4,009 |
89,521 |
|
|
Repros Therapeutics, Inc. (a)(d) |
12,604 |
212,629 |
|
|
Revance Therapeutics, Inc. |
3,949 |
135,372 |
|
|
Sagent Pharmaceuticals, Inc. (a) |
10,833 |
224,135 |
|
|
SciClone Pharmaceuticals, Inc. (a) |
31,052 |
148,429 |
|
|
Sucampo Pharmaceuticals, Inc. Class A (a)(d) |
7,294 |
50,402 |
|
|
Supernus Pharmaceuticals, Inc. (a)(d) |
11,477 |
94,226 |
|
|
The Medicines Company (a)(d) |
35,429 |
942,411 |
|
|
TherapeuticsMD, Inc. (a)(d) |
47,125 |
197,925 |
|
|
VIVUS, Inc. (a)(d) |
58,217 |
302,728 |
|
|
Common Stocks - continued |
|||
|
Shares |
Value |
||
|
HEALTH CARE - continued |
|||
|
Pharmaceuticals - continued |
|||
|
XenoPort, Inc. (a) |
30,689 |
$ 124,597 |
|
|
Zogenix, Inc. (a)(d) |
53,949 |
131,636 |
|
|
|
13,815,762 |
||
|
TOTAL HEALTH CARE |
117,692,914 |
||
|
INDUSTRIALS - 14.5% |
|||
|
Aerospace & Defense - 1.8% |
|||
|
AAR Corp. |
22,357 |
579,046 |
|
|
AeroVironment, Inc. (a) |
10,360 |
349,857 |
|
|
American Science & Engineering, Inc. |
4,479 |
300,989 |
|
|
API Technologies Corp. (a) |
21,295 |
48,553 |
|
|
Astronics Corp. (a) |
8,431 |
481,579 |
|
|
Cubic Corp. (d) |
11,038 |
523,532 |
|
|
Curtiss-Wright Corp. |
26,412 |
1,688,783 |
|
|
DigitalGlobe, Inc. (a) |
42,130 |
1,254,631 |
|
|
Ducommun, Inc. (a) |
5,893 |
143,023 |
|
|
Engility Holdings, Inc. (a) |
9,690 |
422,872 |
|
|
Erickson Air-Crane, Inc. (a)(d) |
2,460 |
38,893 |
|
|
Esterline Technologies Corp. (a) |
17,636 |
1,922,677 |
|
|
GenCorp, Inc. (non-vtg.) (a)(d) |
33,802 |
593,563 |
|
|
HEICO Corp. (d) |
37,554 |
2,077,487 |
|
|
Innovative Solutions & Support, Inc. (a) |
8,173 |
55,004 |
|
|
KEYW Holding Corp. (a)(d) |
18,267 |
234,731 |
|
|
Kratos Defense & Security Solutions, Inc. (a)(d) |
24,323 |
175,612 |
|
|
LMI Aerospace, Inc. (a)(d) |
5,921 |
80,762 |
|
|
Moog, Inc. Class A (a) |
25,621 |
1,676,894 |
|
|
National Presto Industries, Inc. (d) |
2,738 |
197,848 |
|
|
Orbital Sciences Corp. (a) |
33,714 |
991,192 |
|
|
Sparton Corp. (a) |
5,876 |
159,592 |
|
|
Taser International, Inc. (a)(d) |
28,659 |
462,843 |
|
|
Teledyne Technologies, Inc. (a) |
21,061 |
1,955,724 |
|
|
|
16,415,687 |
||
|
Air Freight & Logistics - 0.5% |
|||
|
Air Transport Services Group, Inc. (a) |
29,089 |
227,767 |
|
|
Atlas Air Worldwide Holdings, Inc. (a)(d) |
14,430 |
504,906 |
|
|
Echo Global Logistics, Inc. (a)(d) |
9,970 |
195,013 |
|
|
Forward Air Corp. |
17,152 |
758,633 |
|
|
Hub Group, Inc. Class A (a) |
20,685 |
923,585 |
|
|
Park-Ohio Holdings Corp. (a) |
4,827 |
281,849 |
|
|
Common Stocks - continued |
|||
|
Shares |
Value |
||
|
INDUSTRIALS - continued |
|||
|
Air Freight & Logistics - continued |
|||
|
UTi Worldwide, Inc. (d) |
50,953 |
$ 498,830 |
|
|
XPO Logistics, Inc. (a)(d) |
29,335 |
796,152 |
|
|
|
4,186,735 |
||
|
Airlines - 0.6% |
|||
|
Allegiant Travel Co. |
8,461 |
993,744 |
|
|
CHC Group Ltd. (a) |
20,139 |
135,938 |
|
|
Hawaiian Holdings, Inc. (a)(d) |
29,176 |
421,593 |
|
|
JetBlue Airways Corp. (a)(d) |
138,425 |
1,094,250 |
|
|
Republic Airways Holdings, Inc. (a) |
27,032 |
224,636 |
|
|
SkyWest, Inc. |
30,037 |
348,429 |
|
|
Spirit Airlines, Inc. (a) |
34,036 |
1,934,606 |
|
|
|
5,153,196 |
||
|
Building Products - 0.8% |
|||
|
AAON, Inc. |
16,096 |
456,322 |
|
|
American Woodmark Corp. (a) |
5,878 |
176,399 |
|
|
Apogee Enterprises, Inc. |
16,136 |
512,641 |
|
|
Builders FirstSource, Inc. (a) |
24,714 |
194,005 |
|
|
Continental Building Products, Inc. (a) |
7,595 |
129,115 |
|
|
Gibraltar Industries, Inc. (a) |
17,063 |
291,436 |
|
|
Griffon Corp. |
24,116 |
256,594 |
|
|
Insteel Industries, Inc. |
10,115 |
208,167 |
|
|
NCI Building Systems, Inc. (a) |
11,451 |
179,094 |
|
|
Norcraft Companies, Inc. |
4,100 |
65,108 |
|
|
Nortek, Inc. (a) |
4,959 |
407,431 |
|
|
Patrick Industries, Inc. (a) |
3,654 |
146,416 |
|
|
PGT, Inc. (a) |
18,227 |
181,359 |
|
|
Ply Gem Holdings, Inc. |
9,441 |
120,373 |
|
|
Quanex Building Products Corp. |
21,575 |
406,473 |
|
|
Simpson Manufacturing Co. Ltd. |
23,021 |
754,859 |
|
|
Trex Co., Inc. (a)(d) |
9,610 |
754,577 |
|
|
Universal Forest Products, Inc. |
11,133 |
562,105 |
|
|
USG Corp. (a)(d) |
43,488 |
1,298,552 |
|
|
|
7,101,026 |
||
|
Commercial Services & Supplies - 2.0% |
|||
|
ABM Industries, Inc. |
30,795 |
834,237 |
|
|
ACCO Brands Corp. (a)(d) |
65,065 |
398,848 |
|
|
Acorn Energy, Inc. (a)(d) |
12,828 |
29,761 |
|
|
ARC Document Solutions, Inc. (a) |
20,773 |
132,947 |
|
|
Casella Waste Systems, Inc. Class A (a) |
20,576 |
104,938 |
|
|
CECO Environmental Corp. (d) |
9,716 |
154,387 |
|
|
Common Stocks - continued |
|||
|
Shares |
Value |
||
|
INDUSTRIALS - continued |
|||
|
Commercial Services & Supplies - continued |
|||
|
Cenveo, Inc. (a)(d) |
30,648 |
$ 94,702 |
|
|
CompX International, Inc. Class A |
453 |
4,168 |
|
|
Courier Corp. |
6,196 |
90,028 |
|
|
Deluxe Corp. (d) |
28,763 |
1,580,527 |
|
|
EnerNOC, Inc. (a) |
14,962 |
353,103 |
|
|
Ennis, Inc. |
14,490 |
216,770 |
|
|
G&K Services, Inc. Class A |
10,930 |
578,634 |
|
|
Healthcare Services Group, Inc. (d) |
38,310 |
1,114,821 |
|
|
Heritage-Crystal Clean, Inc. (a)(d) |
4,570 |
73,120 |
|
|
Herman Miller, Inc. |
32,806 |
1,011,409 |
|
|
HNI Corp. |
25,695 |
905,235 |
|
|
InnerWorkings, Inc. (a)(d) |
25,722 |
185,198 |
|
|
Interface, Inc. |
33,257 |
598,293 |
|
|
Intersections, Inc. |
5,741 |
32,264 |
|
|
Kimball International, Inc. Class B |
18,579 |
311,384 |
|
|
Knoll, Inc. |
27,543 |
501,007 |
|
|
McGrath RentCorp. |
14,516 |
458,415 |
|
|
Mobile Mini, Inc. |
21,817 |
963,875 |
|
|
Msa Safety, Inc. |
16,091 |
848,800 |
|
|
Multi-Color Corp. |
6,777 |
236,178 |
|
|
NL Industries, Inc. |
3,212 |
32,216 |
|
|
Performant Financial Corp. (a) |
13,068 |
113,822 |
|
|
Quad/Graphics, Inc. |
14,266 |
308,859 |
|
|
Schawk, Inc. Class A |
8,042 |
160,840 |
|
|
SP Plus Corp. (a)(d) |
8,592 |
209,817 |
|
|
Steelcase, Inc. Class A |
47,739 |
786,739 |
|
|
Swisher Hygiene, Inc. (Canada) (a) |
53,835 |
21,609 |
|
|
Team, Inc. (a) |
11,513 |
493,793 |
|
|
Tetra Tech, Inc. |
36,795 |
1,054,913 |
|
|
The Brink's Co. |
27,263 |
693,571 |
|
|
TRC Companies, Inc. (a) |
8,134 |
48,235 |
|
|
U.S. Ecology, Inc. |
12,012 |
536,336 |
|
|
UniFirst Corp. |
8,235 |
792,536 |
|
|
United Stationers, Inc. |
22,999 |
863,152 |
|
|
Viad Corp. |
11,410 |
263,001 |
|
|
West Corp. |
11,685 |
284,530 |
|
|
|
18,477,018 |
||
|
Construction & Engineering - 0.9% |
|||
|
Aegion Corp. (a)(d) |
21,892 |
558,027 |
|
|
Ameresco, Inc. Class A (a) |
10,340 |
66,279 |
|
|
Common Stocks - continued |
|||
|
Shares |
Value |
||
|
INDUSTRIALS - continued |
|||
|
Construction & Engineering - continued |
|||
|
Argan, Inc. |
7,664 |
$ 205,165 |
|
|
Comfort Systems U.S.A., Inc. |
21,443 |
321,645 |
|
|
Dycom Industries, Inc. (a) |
18,578 |
583,349 |
|
|
EMCOR Group, Inc. |
37,936 |
1,744,677 |
|
|
Furmanite Corp. (a) |
20,986 |
219,933 |
|
|
Granite Construction, Inc. |
21,786 |
814,361 |
|
|
Great Lakes Dredge & Dock Corp. (a) |
34,344 |
296,389 |
|
|
Layne Christensen Co. (a)(d) |
10,997 |
191,568 |
|
|
MasTec, Inc. (a)(d) |
33,630 |
1,331,075 |
|
|
MYR Group, Inc. (a) |
12,354 |
289,825 |
|
|
Northwest Pipe Co. (a) |
5,301 |
189,617 |
|
|
Orion Marine Group, Inc. (a) |
15,164 |
177,874 |
|
|
Pike Corp. (a) |
14,550 |
139,680 |
|
|
Primoris Services Corp. |
19,911 |
557,110 |
|
|
Sterling Construction Co., Inc. (a) |
8,963 |
68,836 |
|
|
Tutor Perini Corp. (a) |
20,843 |
616,953 |
|
|
|
8,372,363 |
||
|
Electrical Equipment - 1.5% |
|||
|
Acuity Brands, Inc. |
24,171 |
3,010,981 |
|
|
American Superconductor Corp. (a)(d) |
27,464 |
35,154 |
|
|
AZZ, Inc. |
14,298 |
620,819 |
|
|
Brady Corp. Class A |
25,814 |
665,743 |
|
|
Capstone Turbine Corp. (a)(d) |
170,378 |
350,979 |
|
|
Encore Wire Corp. |
11,566 |
563,611 |
|
|
EnerSys |
27,206 |
1,838,581 |
|
|
Enphase Energy, Inc. (a)(d) |
9,079 |
68,546 |
|
|
Franklin Electric Co., Inc. |
26,687 |
1,031,986 |
|
|
FuelCell Energy, Inc. (a)(d) |
112,324 |
254,975 |
|
|
Generac Holdings, Inc. (d) |
29,108 |
1,713,879 |
|
|
General Cable Corp. |
28,114 |
720,281 |
|
|
Global Power Equipment Group, Inc. |
9,905 |
173,635 |
|
|
GrafTech International Ltd. (a) |
66,145 |
741,485 |
|
|
LSI Industries, Inc. |
11,290 |
85,917 |
|
|
Polypore International, Inc. (a) |
26,429 |
916,558 |
|
|
Powell Industries, Inc. |
5,080 |
321,666 |
|
|
Power Solutions International, Inc. (a)(d) |
1,280 |
105,920 |
|
|
PowerSecure International, Inc. (a)(d) |
12,410 |
275,874 |
|
|
Preformed Line Products Co. |
1,574 |
94,062 |
|
|
Revolution Lighting Technologies, Inc. (a)(d) |
16,829 |
48,972 |
|
|
Common Stocks - continued |
|||
|
Shares |
Value |
||
|
INDUSTRIALS - continued |
|||
|
Electrical Equipment - continued |
|||
|
Thermon Group Holdings, Inc. (a) |
15,311 |
$ 364,708 |
|
|
Vicor Corp. (a) |
10,035 |
83,893 |
|
|
|
14,088,225 |
||
|
Industrial Conglomerates - 0.1% |
|||
|
Raven Industries, Inc. |
20,337 |
628,413 |
|
|
Machinery - 3.3% |
|||
|
Accuride Corp. (a)(d) |
22,430 |
126,505 |
|
|
Actuant Corp. Class A |
41,525 |
1,406,037 |
|
|
Alamo Group, Inc. |
3,955 |
210,090 |
|
|
Albany International Corp. Class A |
15,576 |
560,424 |
|
|
Altra Industrial Motion Corp. |
15,046 |
513,971 |
|
|
American Railcar Industries, Inc. (d) |
5,288 |
367,199 |
|
|
Ampco-Pittsburgh Corp. |
4,644 |
93,019 |
|
|
Astec Industries, Inc. |
11,359 |
453,792 |
|
|
Barnes Group, Inc. |
30,543 |
1,176,516 |
|
|
Blount International, Inc. (a) |
28,743 |
321,059 |
|
|
Briggs & Stratton Corp. (d) |
26,851 |
573,806 |
|
|
Chart Industries, Inc. (a)(d) |
17,166 |
1,171,065 |
|
|
CIRCOR International, Inc. |
9,820 |
797,482 |
|
|
CLARCOR, Inc. |
28,044 |
1,619,821 |
|
|
Columbus McKinnon Corp. (NY Shares) |
10,742 |
284,556 |
|
|
Commercial Vehicle Group, Inc. (a) |
14,299 |
138,843 |
|
|
Douglas Dynamics, Inc. |
12,240 |
206,489 |
|
|
Dynamic Materials Corp. |
7,676 |
155,055 |
|
|
Energy Recovery, Inc. (a)(d) |
24,333 |
124,342 |
|
|
EnPro Industries, Inc. (a) |
11,793 |
839,780 |
|
|
ESCO Technologies, Inc. |
14,730 |
492,277 |
|
|
ExOne Co. (a)(d) |
3,616 |
124,897 |
|
|
Federal Signal Corp. |
34,795 |
528,188 |
|
|
FreightCar America, Inc. |
6,675 |
175,286 |
|
|
Global Brass & Copper Holdings, Inc. |
5,183 |
82,202 |
|
|
Gorman-Rupp Co. |
10,413 |
323,324 |
|
|
Graham Corp. |
5,664 |
169,014 |
|
|
Greenbrier Companies, Inc. (a)(d) |
13,847 |
726,137 |
|
|
Hardinge, Inc. |
7,135 |
95,324 |
|
|
Hurco Companies, Inc. |
3,393 |
90,457 |
|
|
Hyster-Yale Materials Handling Class A |
5,924 |
571,014 |
|
|
John Bean Technologies Corp. |
16,738 |
485,235 |
|
|
Kadant, Inc. |
6,298 |
218,856 |
|
|
L.B. Foster Co. Class A |
5,731 |
271,363 |
|
|
Common Stocks - continued |
|||
|
Shares |
Value |
||
|
INDUSTRIALS - continued |
|||
|
Machinery - continued |
|||
|
Lindsay Corp. (d) |
7,219 |
$ 636,210 |
|
|
Lydall, Inc. (a) |
9,485 |
222,044 |
|
|
Manitex International, Inc. (a) |
7,680 |
126,413 |
|
|
Meritor, Inc. (a) |
54,495 |
646,856 |
|
|
Middleby Corp. (a) |
10,612 |
2,679,318 |
|
|
Miller Industries, Inc. |
5,929 |
114,845 |
|
|
Mueller Industries, Inc. |
31,564 |
913,462 |
|
|
Mueller Water Products, Inc. Class A |
88,317 |
805,451 |
|
|
NN, Inc. |
10,243 |
200,456 |
|
|
Omega Flex, Inc. |
1,499 |
30,235 |
|
|
PMFG, Inc. (a) |
11,184 |
63,413 |
|
|
Proto Labs, Inc. (a)(d) |
9,568 |
579,247 |
|
|
RBC Bearings, Inc. (a) |
13,064 |
813,365 |
|
|
Rexnord Corp. (a) |
17,060 |
456,184 |
|
|
Standex International Corp. |
6,999 |
415,531 |
|
|
Sun Hydraulics Corp. |
12,002 |
490,642 |
|
|
Tecumseh Products Co. Class A (non-vtg.) |
10,357 |
62,246 |
|
|
Tennant Co. |
10,272 |
655,251 |
|
|
Titan International, Inc. (d) |
29,946 |
524,354 |
|
|
TriMas Corp. (a) |
25,298 |
907,186 |
|
|
Twin Disc, Inc. |
4,685 |
135,537 |
|
|
Wabash National Corp. (a)(d) |
38,287 |
511,514 |
|
|
Watts Water Technologies, Inc. Class A |
16,124 |
857,797 |
|
|
Woodward, Inc. |
38,860 |
1,742,094 |
|
|
Xerium Technologies, Inc. (a) |
5,706 |
77,031 |
|
|
|
30,160,107 |
||
|
Marine - 0.1% |
|||
|
International Shipholding Corp. |
3,046 |
82,059 |
|
|
Matson, Inc. |
23,822 |
564,343 |
|
|
Scorpio Bulkers, Inc. (a) |
74,858 |
669,979 |
|
|
Ultrapetrol (Bahamas) Ltd. (a) |
16,969 |
48,022 |
|
|
|
1,364,403 |
||
|
Professional Services - 1.3% |
|||
|
Acacia Research Corp. |
27,475 |
440,699 |
|
|
Advisory Board Co. (a)(d) |
20,130 |
1,152,644 |
|
|
Barrett Business Services, Inc. |
3,861 |
194,633 |
|
|
CBIZ, Inc. (a)(d) |
19,439 |
166,592 |
|
|
CDI Corp. |
8,083 |
123,832 |
|
|
Corporate Executive Board Co. |
19,060 |
1,315,521 |
|
|
CRA International, Inc. (a) |
6,165 |
134,212 |
|
|
Common Stocks - continued |
|||
|
Shares |
Value |
||
|
INDUSTRIALS - continued |
|||
|
Professional Services - continued |
|||
|
Exponent, Inc. |
7,566 |
$ 532,798 |
|
|
Franklin Covey Co. (a) |
5,018 |
101,715 |
|
|
FTI Consulting, Inc. (a)(d) |
22,804 |
782,177 |
|
|
GP Strategies Corp. (a) |
8,824 |
231,895 |
|
|
Heidrick & Struggles International, Inc. |
10,260 |
193,401 |
|
|
Huron Consulting Group, Inc. (a) |
13,013 |
926,526 |
|
|
ICF International, Inc. (a) |
11,014 |
429,216 |
|
|
Insperity, Inc. |
12,502 |
400,814 |
|
|
Kelly Services, Inc. Class A (non-vtg.) |
15,837 |
333,527 |
|
|
Kforce, Inc. |
15,407 |
356,210 |
|
|
Korn/Ferry International (a) |
27,619 |
802,332 |
|
|
MISTRAS Group, Inc. (a) |
8,928 |
202,755 |
|
|
Navigant Consulting, Inc. (a) |
28,779 |
483,487 |
|
|
Odyssey Marine Exploration, Inc. (a)(d) |
44,753 |
98,009 |
|
|
On Assignment, Inc. (a) |
25,605 |
896,175 |
|
|
Pendrell Corp. (a) |
90,658 |
149,586 |
|
|
Resources Connection, Inc. |
22,686 |
308,756 |
|
|
RPX Corp. (a) |
18,544 |
303,751 |
|
|
TrueBlue, Inc. (a) |
22,812 |
610,221 |
|
|
VSE Corp. |
2,515 |
157,112 |
|
|
WageWorks, Inc. (a) |
13,931 |
590,256 |
|
|
|
12,418,852 |
||
|
Road & Rail - 0.6% |
|||
|
Arkansas Best Corp. |
14,395 |
567,451 |
|
|
Celadon Group, Inc. |
11,051 |
254,284 |
|
|
Heartland Express, Inc. (d) |
25,995 |
565,651 |
|
|
Knight Transportation, Inc. (d) |
33,014 |
783,422 |
|
|
Marten Transport Ltd. |
13,111 |
307,584 |
|
|
Patriot Transportation Holding, Inc. (a) |
3,870 |
134,986 |
|
|
Quality Distribution, Inc. (a) |
11,700 |
147,069 |
|
|
Roadrunner Transportation Systems, Inc. (a)(d) |
10,648 |
262,260 |
|
|
Saia, Inc. (a) |
13,609 |
560,283 |
|
|
Swift Transporation Co. (a) |
47,394 |
1,139,826 |
|
|
Universal Truckload Services, Inc. |
3,023 |
74,547 |
|
|
Werner Enterprises, Inc. |
25,782 |
660,019 |
|
|
YRC Worldwide, Inc. (a) |
17,485 |
392,189 |
|
|
|
5,849,571 |
||
|
Trading Companies & Distributors - 1.0% |
|||
|
Aceto Corp. |
15,519 |
339,556 |
|
|
Aircastle Ltd. |
38,368 |
674,126 |
|
|
Common Stocks - continued |
|||
|
Shares |
Value |
||
|
INDUSTRIALS - continued |
|||
|
Trading Companies & Distributors - continued |
|||
|
Applied Industrial Technologies, Inc. |
23,801 |
$ 1,140,544 |
|
|
Beacon Roofing Supply, Inc. (a)(d) |
27,850 |
990,903 |
|
|
BlueLinx Corp. (a) |
12,863 |
16,851 |
|
|
CAI International, Inc. (a)(d) |
9,460 |
205,755 |
|
|
DXP Enterprises, Inc. (a) |
5,297 |
599,673 |
|
|
H&E Equipment Services, Inc. (a) |
16,838 |
649,105 |
|
|
Houston Wire & Cable Co. |
9,647 |
120,202 |
|
|
Kaman Corp. |
15,305 |
642,351 |
|
|
Rush Enterprises, Inc. Class A (a)(d) |
19,844 |
636,992 |
|
|
Stock Building Supply Holdings, Inc. |
4,795 |
83,001 |
|
|
TAL International Group, Inc. (d) |
19,015 |
802,053 |
|
|
Textainer Group Holdings Ltd. (d) |
11,885 |
467,081 |
|
|
Titan Machinery, Inc. (a)(d) |
9,601 |
169,362 |
|
|
Watsco, Inc. |
14,495 |
1,491,680 |
|
|
|
9,029,235 |
||
|
Transportation Infrastructure - 0.0% |
|||
|
Wesco Aircraft Holdings, Inc. (a) |
23,038 |
466,750 |
|
|
TOTAL INDUSTRIALS |
133,711,581 |
||
|
INFORMATION TECHNOLOGY - 17.1% |
|||
|
Communications Equipment - 1.7% |
|||
|
ADTRAN, Inc. |
33,522 |
751,898 |
|
|
Alliance Fiber Optic Products, Inc. (d) |
6,675 |
128,294 |
|
|
Applied Optoelectronics, Inc. |
2,603 |
58,568 |
|
|
Arris Group, Inc. (a) |
65,748 |
1,715,365 |
|
|
Aruba Networks, Inc. (a)(d) |
63,013 |
1,245,767 |
|
|
Aviat Networks, Inc. (a) |
35,973 |
54,319 |
|
|
Bel Fuse, Inc. Class B (non-vtg.) |
6,196 |
134,825 |
|
|
Black Box Corp. |
9,015 |
191,659 |
|
|
CalAmp Corp. (a)(d) |
19,628 |
348,397 |
|
|
Calix Networks, Inc. (a) |
22,183 |
195,432 |
|
|
Ciena Corp. (a)(d) |
57,370 |
1,134,205 |
|
|
Comtech Telecommunications Corp. |
9,171 |
291,179 |
|
|
Digi International, Inc. (a) |
14,676 |
130,029 |
|
|
Emulex Corp. (a) |
44,515 |
318,282 |
|
|
Extreme Networks, Inc. (a) |
50,928 |
291,308 |
|
|
Finisar Corp. (a)(d) |
52,733 |
1,378,968 |
|
|
Harmonic, Inc. (a) |
56,070 |
394,172 |
|
|
Infinera Corp. (a)(d) |
68,403 |
612,891 |
|
|
InterDigital, Inc. (d) |
23,040 |
799,949 |
|
|
Common Stocks - continued |
|||
|
Shares |
Value |
||
|
INFORMATION TECHNOLOGY - continued |
|||
|
Communications Equipment - continued |
|||
|
Ixia (a) |
31,987 |
$ 397,279 |
|
|
KVH Industries, Inc. (a) |
8,924 |
120,563 |
|
|
NETGEAR, Inc. (a)(d) |
21,804 |
704,269 |
|
|
NumereX Corp. Class A (a)(d) |
7,299 |
74,815 |
|
|
Oplink Communications, Inc. (a) |
11,274 |
193,236 |
|
|
Parkervision, Inc. (a)(d) |
48,332 |
220,394 |
|
|
PC-Tel, Inc. |
9,005 |
74,291 |
|
|
Plantronics, Inc. |
24,181 |
1,053,566 |
|
|
Procera Networks, Inc. (a)(d) |
11,639 |
107,777 |
|
|
Ruckus Wireless, Inc. (a) |
25,340 |
264,803 |
|
|
ShoreTel, Inc. (a) |
32,372 |
244,409 |
|
|
Sonus Networks, Inc. (a) |
111,278 |
363,879 |
|
|
Tessco Technologies, Inc. |
3,016 |
99,196 |
|
|
Ubiquiti Networks, Inc. (a) |
7,041 |
272,698 |
|
|
ViaSat, Inc. (a)(d) |
22,363 |
1,435,928 |
|
|
Westell Technologies, Inc. Class A (a) |
26,559 |
86,582 |
|
|
|
15,889,192 |
||
|
Electronic Equipment & Components - 2.7% |
|||
|
Aeroflex Holding Corp. (a) |
11,850 |
90,653 |
|
|
Agilysys, Inc. (a) |
8,101 |
101,587 |
|
|
Anixter International, Inc. |
15,314 |
1,500,466 |
|
|
Audience, Inc. (a) |
5,601 |
64,412 |
|
|
Badger Meter, Inc. |
8,568 |
424,544 |
|
|
Belden, Inc. |
24,865 |
1,835,286 |
|
|
Benchmark Electronics, Inc. (a) |
30,751 |
712,808 |
|
|
Checkpoint Systems, Inc. (a) |
22,636 |
289,062 |
|
|
Cognex Corp. (a) |
49,104 |
1,690,651 |
|
|
Coherent, Inc. (a) |
13,729 |
819,759 |
|
|
Control4 Corp. |
2,265 |
40,000 |
|
|
CTS Corp. |
18,465 |
328,492 |
|
|
Daktronics, Inc. |
20,185 |
262,809 |
|
|
DTS, Inc. (a) |
10,494 |
195,293 |
|
|
Electro Rent Corp. |
10,709 |
172,950 |
|
|
Electro Scientific Industries, Inc. |
13,432 |
113,903 |
|
|
Fabrinet (a) |
16,146 |
348,754 |
|
|
FARO Technologies, Inc. (a) |
9,560 |
381,444 |
|
|
FEI Co. |
23,550 |
1,872,696 |
|
|
GSI Group, Inc. (a) |
16,975 |
206,077 |
|
|
II-VI, Inc. (a) |
29,132 |
419,501 |
|
|
Insight Enterprises, Inc. (a) |
24,228 |
632,835 |
|
|
Common Stocks - continued |
|||
|
Shares |
Value |
||
|
INFORMATION TECHNOLOGY - continued |
|||
|
Electronic Equipment & Components - continued |
|||
|
InvenSense, Inc. (a)(d) |
32,175 |
$ 692,728 |
|
|
Itron, Inc. (a) |
22,310 |
847,780 |
|
|
KEMET Corp. (a) |
26,550 |
133,016 |
|
|
Littelfuse, Inc. |
12,476 |
1,129,702 |
|
|
Maxwell Technologies, Inc. (a)(d) |
16,337 |
246,035 |
|
|
Measurement Specialties, Inc. (a) |
8,723 |
561,325 |
|
|
Mercury Systems, Inc. (a) |
19,020 |
265,519 |
|
|
Mesa Laboratories, Inc. |
1,457 |
124,865 |
|
|
Methode Electronics, Inc. Class A |
20,718 |
574,717 |
|
|
MTS Systems Corp. |
8,778 |
565,918 |
|
|
Multi-Fineline Electronix, Inc. (a) |
5,253 |
65,032 |
|
|
Neonode, Inc. (a)(d) |
14,682 |
78,549 |
|
|
Newport Corp. (a) |
21,770 |
406,664 |
|
|
OSI Systems, Inc. (a) |
11,246 |
627,639 |
|
|
Park Electrochemical Corp. |
11,518 |
307,070 |
|
|
PC Connection, Inc. |
5,206 |
104,172 |
|
|
Plexus Corp. (a) |
19,333 |
810,439 |
|
|
RadiSys Corp. (a) |
16,147 |
51,670 |
|
|
RealD, Inc. (a)(d) |
22,188 |
243,180 |
|
|
Richardson Electronics Ltd. |
5,874 |
58,857 |
|
|
Rofin-Sinar Technologies, Inc. (a) |
15,596 |
346,231 |
|
|
Rogers Corp. (a) |
10,092 |
605,722 |
|
|
Sanmina Corp. (a) |
46,711 |
945,898 |
|
|
ScanSource, Inc. (a) |
15,855 |
608,991 |
|
|
Speed Commerce, Inc. (a) |
27,080 |
89,364 |
|
|
SYNNEX Corp. (a) |
14,902 |
1,004,097 |
|
|
TTM Technologies, Inc. (a) |
29,060 |
229,283 |
|
|
Uni-Pixel, Inc. (a)(d) |
4,811 |
26,316 |
|
|
Universal Display Corp. (a)(d) |
22,805 |
594,070 |
|
|
Viasystems Group, Inc. (a) |
1,488 |
17,886 |
|
|
Vishay Precision Group, Inc. (a) |
6,542 |
106,177 |
|
|
Zygo Corp. (a) |
9,356 |
180,009 |
|
|
|
25,152,903 |
||
|
Internet Software & Services - 2.7% |
|||
|
Angie's List, Inc. (a)(d) |
23,228 |
262,709 |
|
|
Bankrate, Inc. (a)(d) |
25,915 |
454,031 |
|
|
Bazaarvoice, Inc. (a)(d) |
27,586 |
185,378 |
|
|
Benefitfocus, Inc. (d) |
2,899 |
93,928 |
|
|
Blucora, Inc. (a)(d) |
22,953 |
441,845 |
|
|
Brightcove, Inc. (a) |
16,380 |
141,196 |
|
|
Common Stocks - continued |
|||
|
Shares |
Value |
||
|
INFORMATION TECHNOLOGY - continued |
|||
|
Internet Software & Services - continued |
|||
|
Carbonite, Inc. (a) |
6,426 |
$ 63,553 |
|
|
Care.com, Inc. (d) |
4,015 |
49,184 |
|
|
ChannelAdvisor Corp. (a)(d) |
3,502 |
91,892 |
|
|
Chegg, Inc. (d) |
8,440 |
44,479 |
|
|
comScore, Inc. (a) |
19,935 |
624,564 |
|
|
Constant Contact, Inc. (a) |
17,230 |
445,568 |
|
|
Conversant, Inc. (a)(d) |
37,781 |
923,368 |
|
|
Cornerstone OnDemand, Inc. (a) |
22,621 |
831,548 |
|
|
CoStar Group, Inc. (a) |
16,142 |
2,597,086 |
|
|
Cvent, Inc. (d) |
3,735 |
102,825 |
|
|
DealerTrack Holdings, Inc. (a)(d) |
24,611 |
1,124,477 |
|
|
Demand Media, Inc. (a)(d) |
20,840 |
86,694 |
|
|
Demandware, Inc. (a) |
10,312 |
511,785 |
|
|
Dice Holdings, Inc. (a) |
22,881 |
175,040 |
|
|
Digital River, Inc. (a) |
18,641 |
285,021 |
|
|
E2open, Inc. (a)(d) |
9,044 |
156,190 |
|
|
EarthLink Holdings Corp. |
58,039 |
197,913 |
|
|
eGain Communications Corp. (a)(d) |
6,208 |
40,600 |
|
|
Endurance International Group Holdings, Inc. (d) |
12,507 |
158,214 |
|
|
Envestnet, Inc. (a) |
13,328 |
491,137 |
|
|
Global Eagle Entertainment, Inc. (a) |
15,443 |
170,336 |
|
|
Gogo, Inc. (d) |
6,028 |
81,499 |
|
|
Internap Network Services Corp. (a) |
30,416 |
204,396 |
|
|
IntraLinks Holdings, Inc. (a) |
22,610 |
206,882 |
|
|
j2 Global, Inc. (d) |
26,024 |
1,206,473 |
|
|
Limelight Networks, Inc. (a) |
35,565 |
73,620 |
|
|
Liquidity Services, Inc. (a)(d) |
14,189 |
244,760 |
|
|
LivePerson, Inc. (a)(d) |
30,325 |
300,218 |
|
|
LogMeIn, Inc. (a) |
14,633 |
665,070 |
|
|
Marchex, Inc. Class B |
14,646 |
135,476 |
|
|
Marin Software, Inc. (a)(d) |
5,699 |
53,457 |
|
|
Marketo, Inc. (d) |
4,254 |
115,454 |
|
|
Millennial Media, Inc. (a)(d) |
20,175 |
128,918 |
|
|
Monster Worldwide, Inc. (a) |
54,777 |
377,414 |
|
|
Move, Inc. (a) |
22,329 |
238,697 |
|
|
Net Element International, Inc. (a)(d) |
971 |
2,165 |
|
|
NIC, Inc. |
36,328 |
666,256 |
|
|
OpenTable, Inc. (a) |
12,778 |
858,170 |
|
|
Perficient, Inc. (a) |
18,464 |
337,337 |
|
|
QuinStreet, Inc. (a) |
17,893 |
109,147 |
|
|
RealNetworks, Inc. (a) |
14,031 |
105,794 |
|
|
Common Stocks - continued |
|||
|
Shares |
Value |
||
|
INFORMATION TECHNOLOGY - continued |
|||
|
Internet Software & Services - continued |
|||
|
Reis, Inc. (a)(d) |
5,185 |
$ 85,345 |
|
|
Rocket Fuel, Inc. (d) |
2,974 |
95,376 |
|
|
SciQuest, Inc. (a)(d) |
14,664 |
351,643 |
|
|
Shutterstock, Inc. (a)(d) |
4,235 |
307,080 |
|
|
Spark Networks, Inc. (a)(d) |
11,704 |
53,019 |
|
|
SPS Commerce, Inc. (a) |
9,011 |
466,770 |
|
|
Stamps.com, Inc. (a) |
7,720 |
267,961 |
|
|
Support.com, Inc. (a) |
31,762 |
78,452 |
|
|
TechTarget, Inc. (a) |
5,541 |
35,573 |
|
|
Textura Corp. (d) |
3,213 |
57,224 |
|
|
Travelzoo, Inc. (a) |
4,378 |
78,541 |
|
|
Tremor Video, Inc. (d) |
2,761 |
12,452 |
|
|
Trulia, Inc. (a)(d) |
15,497 |
526,898 |
|
|
United Online, Inc. |
7,442 |
88,188 |
|
|
Unwired Planet, Inc. (d) |
57,390 |
130,849 |
|
|
VistaPrint Ltd. (a)(d) |
18,259 |
720,683 |
|
|
Vocus, Inc. (a)(d) |
10,670 |
191,847 |
|
|
Web.com Group, Inc. (a)(d) |
23,521 |
722,330 |
|
|
WebMD Health Corp. (a)(d) |
15,914 |
701,648 |
|
|
Wix.com Ltd. (a) |
4,587 |
93,988 |
|
|
XO Group, Inc. (a) |
14,620 |
155,264 |
|
|
Xoom Corp. (a)(d) |
4,827 |
107,690 |
|
|
Yelp, Inc. (a) |
18,403 |
1,073,263 |
|
|
YuMe, Inc. |
1,983 |
13,266 |
|
|
Zillow, Inc. (a)(d) |
13,174 |
1,432,014 |
|
|
Zix Corp. (a) |
36,518 |
119,779 |
|
|
|
24,828,907 |
||
|
IT Services - 2.1% |
|||
|
Acxiom Corp. (a) |
41,918 |
1,183,764 |
|
|
Blackhawk Network Holdings, Inc. (d) |
28,865 |
692,471 |
|
|
CACI International, Inc. Class A (a)(d) |
12,977 |
903,848 |
|
|
Cardtronics, Inc. (a) |
25,181 |
843,060 |
|
|
Cass Information Systems, Inc. |
5,682 |
286,998 |
|
|
Ciber, Inc. (a) |
41,869 |
180,874 |
|
|
Computer Task Group, Inc. |
8,177 |
129,278 |
|
|
Convergys Corp. |
58,933 |
1,269,417 |
|
|
CSG Systems International, Inc. |
18,991 |
500,603 |
|
|
Datalink Corp. (a) |
10,689 |
137,247 |
|
|
EPAM Systems, Inc. (a) |
12,279 |
382,245 |
|
|
Euronet Worldwide, Inc. (a) |
28,154 |
1,294,802 |
|
|
Common Stocks - continued |
|||
|
Shares |
Value |
||
|
INFORMATION TECHNOLOGY - continued |
|||
|
IT Services - continued |
|||
|
EVERTEC, Inc. |
16,536 |
$ 389,257 |
|
|
ExlService Holdings, Inc. (a) |
18,347 |
519,128 |
|
|
Forrester Research, Inc. |
6,988 |
247,585 |
|
|
Global Cash Access Holdings, Inc. (a) |
36,922 |
243,685 |
|
|
Hackett Group, Inc. |
16,117 |
96,702 |
|
|
Heartland Payment Systems, Inc. (d) |
20,559 |
841,685 |
|
|
Higher One Holdings, Inc. (a) |
17,318 |
103,735 |
|
|
iGATE Corp. (a) |
19,543 |
715,274 |
|
|
Lionbridge Technologies, Inc. (a) |
31,978 |
188,031 |
|
|
Luxoft Holding, Inc. |
2,426 |
65,478 |
|
|
ManTech International Corp. Class A (d) |
13,801 |
411,684 |
|
|
Maximus, Inc. |
38,580 |
1,642,351 |
|
|
ModusLink Global Solutions, Inc. (a)(d) |
20,772 |
83,919 |
|
|
MoneyGram International, Inc. (a) |
11,710 |
154,572 |
|
|
Planet Payment, Inc. (a) |
25,064 |
65,918 |
|
|
PRG-Schultz International, Inc. (a) |
15,349 |
98,694 |
|
|
Sapient Corp. (a) |
62,622 |
1,018,860 |
|
|
ServiceSource International, Inc. (a)(d) |
33,400 |
208,416 |
|
|
Sykes Enterprises, Inc. (a) |
21,880 |
433,005 |
|
|
Syntel, Inc. (a) |
8,805 |
707,218 |
|
|
Teletech Holdings, Inc. (a) |
11,281 |
272,211 |
|
|
Unisys Corp. (a)(d) |
28,590 |
696,738 |
|
|
Virtusa Corp. (a) |
12,778 |
421,291 |
|
|
WEX, Inc. (a) |
21,928 |
2,104,430 |
|
|
|
19,534,474 |
||
|
Semiconductors & Semiconductor Equipment - 3.8% |
|||
|
Advanced Energy Industries, Inc. (a) |
21,959 |
480,463 |
|
|
Alpha & Omega Semiconductor Ltd. (a) |
9,856 |
70,963 |
|
|
Ambarella, Inc. (a)(d) |
11,080 |
275,338 |
|
|
Amkor Technology, Inc. (a) |
39,595 |
314,780 |
|
|
ANADIGICS, Inc. (a)(d) |
42,417 |
53,021 |
|
|
Applied Micro Circuits Corp. (a)(d) |
40,937 |
397,498 |
|
|
ATMI, Inc. |
17,640 |
599,760 |
|
|
Axcelis Technologies, Inc. (a) |
60,635 |
108,537 |
|
|
Brooks Automation, Inc. |
36,579 |
374,203 |
|
|
Cabot Microelectronics Corp. (a) |
13,610 |
590,266 |
|
|
Cavium, Inc. (a)(d) |
29,020 |
1,229,577 |
|
|
Ceva, Inc. (a) |
12,205 |
198,087 |
|
|
Cirrus Logic, Inc. (a)(d) |
35,755 |
797,337 |
|
|
Cohu, Inc. |
15,198 |
156,539 |
|
|
Common Stocks - continued |
|||
|
Shares |
Value |
||
|
INFORMATION TECHNOLOGY - continued |
|||
|
Semiconductors & Semiconductor Equipment - continued |
|||
|
Cypress Semiconductor Corp. (d) |
89,216 |
$ 844,876 |
|
|
Diodes, Inc. (a) |
20,325 |
535,970 |
|
|
DSP Group, Inc. (a) |
11,041 |
87,886 |
|
|
Entegris, Inc. (a) |
79,075 |
876,942 |
|
|
Entropic Communications, Inc. (a) |
49,565 |
182,895 |
|
|
Exar Corp. (a) |
21,200 |
229,384 |
|
|
FormFactor, Inc. (a) |
31,100 |
178,825 |
|
|
GSI Technology, Inc. (a) |
13,089 |
83,115 |
|
|
GT Advanced Technologies, Inc. (a)(d) |
75,845 |
1,259,785 |
|
|
Hittite Microwave Corp. |
17,792 |
1,056,133 |
|
|
Inphi Corp. (a) |
15,310 |
226,435 |
|
|
Integrated Device Technology, Inc. (a) |
74,596 |
870,535 |
|
|
Integrated Silicon Solution, Inc. (a) |
16,646 |
240,701 |
|
|
Intermolecular, Inc. (a)(d) |
9,580 |
26,058 |
|
|
International Rectifier Corp. (a) |
39,291 |
1,023,138 |
|
|
Intersil Corp. Class A |
71,229 |
878,966 |
|
|
IXYS Corp. |
14,171 |
152,905 |
|
|
Kopin Corp. (a) |
37,324 |
121,676 |
|
|
Lattice Semiconductor Corp. (a) |
64,537 |
543,402 |
|
|
LTX-Credence Corp. (a) |
26,083 |
251,179 |
|
|
M/A-COM Technology Solutions, Inc. (a) |
6,355 |
111,276 |
|
|
MaxLinear, Inc. Class A (a) |
13,846 |
108,968 |
|
|
Micrel, Inc. |
26,916 |
268,083 |
|
|
Microsemi Corp. (a) |
52,751 |
1,240,704 |
|
|
MKS Instruments, Inc. |
29,600 |
833,240 |
|
|
Monolithic Power Systems, Inc. (a) |
21,942 |
814,048 |
|
|
MoSys, Inc. (a)(d) |
26,406 |
103,247 |
|
|
Nanometrics, Inc. (a) |
12,756 |
207,413 |
|
|
NeoPhotonics Corp. (a) |
12,001 |
69,246 |
|
|
NVE Corp. (a) |
2,930 |
153,854 |
|
|
Omnivision Technologies, Inc. (a) |
30,145 |
588,732 |
|
|
PDF Solutions, Inc. (a) |
13,922 |
261,316 |
|
|
Peregrine Semiconductor Corp. (a)(d) |
15,663 |
84,110 |
|
|
Pericom Semiconductor Corp. (a) |
12,823 |
103,482 |
|
|
Photronics, Inc. (a) |
33,515 |
290,910 |
|
|
PLX Technology, Inc. (a) |
24,917 |
144,519 |
|
|
PMC-Sierra, Inc. (a) |
113,994 |
779,719 |
|
|
Power Integrations, Inc. (d) |
16,427 |
775,847 |
|
|
Rambus, Inc. (a)(d) |
63,007 |
761,755 |
|
|
RF Micro Devices, Inc. (a) |
158,860 |
1,340,778 |
|
|
Rubicon Technology, Inc. (a) |
11,629 |
117,802 |
|
|
Common Stocks - continued |
|||
|
Shares |
Value |
||
|
INFORMATION TECHNOLOGY - continued |
|||
|
Semiconductors & Semiconductor Equipment - continued |
|||
|
Rudolph Technologies, Inc. (a)(d) |
18,163 |
$ 165,465 |
|
|
Semtech Corp. (a) |
38,205 |
916,156 |
|
|
Sigma Designs, Inc. (a) |
15,370 |
57,945 |
|
|
Silicon Image, Inc. (a) |
44,653 |
250,503 |
|
|
Spansion, Inc. Class A (a) |
26,293 |
468,804 |
|
|
SunEdison, Inc. (a)(d) |
150,396 |
2,892,115 |
|
|
SunPower Corp. (a) |
23,281 |
778,051 |
|
|
Synaptics, Inc. (a)(d) |
18,366 |
1,141,447 |
|
|
Tessera Technologies, Inc. |
29,880 |
655,268 |
|
|
TriQuint Semiconductor, Inc. (a) |
92,213 |
1,307,580 |
|
|
Ultra Clean Holdings, Inc. (a) |
13,619 |
116,034 |
|
|
Ultratech, Inc. (a)(d) |
15,816 |
421,022 |
|
|
Veeco Instruments, Inc. (a)(d) |
22,207 |
820,993 |
|
|
|
34,467,607 |
||
|
Software - 3.7% |
|||
|
ACI Worldwide, Inc. (a)(d) |
22,505 |
1,286,161 |
|
|
Actuate Corp. (a) |
26,413 |
148,705 |
|
|
Advent Software, Inc. |
18,647 |
537,407 |
|
|
American Software, Inc. Class A |
14,017 |
135,124 |
|
|
Aspen Technology, Inc. (a) |
52,921 |
2,275,074 |
|
|
AVG Technologies NV (a)(d) |
13,670 |
256,039 |
|
|
Barracuda Networks, Inc. (d) |
2,368 |
61,165 |
|
|
Blackbaud, Inc. |
25,749 |
784,057 |
|
|
Bottomline Technologies, Inc. (a)(d) |
21,268 |
672,920 |
|
|
BroadSoft, Inc. (a)(d) |
15,712 |
398,771 |
|
|
Callidus Software, Inc. (a)(d) |
22,106 |
211,002 |
|
|
CommVault Systems, Inc. (a)(d) |
26,272 |
1,271,565 |
|
|
Comverse, Inc. (a) |
12,270 |
306,014 |
|
|
Covisint Corp. (d) |
4,607 |
32,525 |
|
|
Cyan, Inc. (d) |
4,496 |
18,793 |
|
|
Digimarc Corp. |
3,342 |
110,353 |
|
|
Ebix, Inc. (d) |
17,865 |
281,910 |
|
|
Ellie Mae, Inc. (a)(d) |
15,656 |
381,850 |
|
|
EPIQ Systems, Inc. |
17,744 |
226,946 |
|
|
ePlus, Inc. (a) |
2,289 |
114,542 |
|
|
Fair Isaac Corp. |
20,103 |
1,149,892 |
|
|
Fleetmatics Group PLC (a)(d) |
9,898 |
297,237 |
|
|
Gigamon, Inc. (a)(d) |
4,295 |
67,732 |
|
|
Glu Mobile, Inc. (a) |
35,203 |
140,812 |
|
|
Guidance Software, Inc. (a) |
9,629 |
88,683 |
|
|
Common Stocks - continued |
|||
|
Shares |
Value |
||
|
INFORMATION TECHNOLOGY - continued |
|||
|
Software - continued |
|||
|
Guidewire Software, Inc. (a) |
27,837 |
$ 1,051,125 |
|
|
Imperva, Inc. (a) |
11,287 |
258,247 |
|
|
Infoblox, Inc. (a) |
29,655 |
581,831 |
|
|
Interactive Intelligence Group, Inc. (a) |
8,655 |
541,543 |
|
|
Jive Software, Inc. (a)(d) |
22,797 |
170,522 |
|
|
Manhattan Associates, Inc. (a) |
44,000 |
1,387,320 |
|
|
Mavenir Systems, Inc. (d) |
3,037 |
45,312 |
|
|
Mentor Graphics Corp. |
54,179 |
1,121,505 |
|
|
MicroStrategy, Inc. Class A (a) |
5,088 |
617,836 |
|
|
Mitek Systems, Inc. (a)(d) |
11,851 |
38,634 |
|
|
Model N, Inc. (a) |
4,220 |
38,022 |
|
|
Monotype Imaging Holdings, Inc. |
21,886 |
578,009 |
|
|
NetScout Systems, Inc. (a) |
20,413 |
795,290 |
|
|
Parametric Technology Corp. (a) |
67,450 |
2,385,707 |
|
|
Pegasystems, Inc. |
19,940 |
330,406 |
|
|
Progress Software Corp. (a) |
29,025 |
622,877 |
|
|
Proofpoint, Inc. (a) |
12,894 |
328,023 |
|
|
PROS Holdings, Inc. (a) |
13,556 |
371,434 |
|
|
QAD, Inc. Class A |
3,767 |
71,761 |
|
|
Qlik Technologies, Inc. (a) |
48,815 |
1,072,954 |
|
|
Qualys, Inc. (a) |
8,198 |
158,139 |
|
|
Rally Software Development Corp. (d) |
3,579 |
46,813 |
|
|
RealPage, Inc. (a)(d) |
26,055 |
462,476 |
|
|
Rosetta Stone, Inc. (a) |
6,563 |
78,165 |
|
|
Sapiens International Corp. NV (a) |
12,007 |
94,495 |
|
|
SeaChange International, Inc. (a) |
18,036 |
168,997 |
|
|
Silver Spring Networks, Inc. (a)(d) |
3,067 |
45,944 |
|
|
SS&C Technologies Holdings, Inc. (a) |
32,970 |
1,283,192 |
|
|
Synchronoss Technologies, Inc. (a)(d) |
16,327 |
496,994 |
|
|
Take-Two Interactive Software, Inc. (a)(d) |
45,802 |
933,445 |
|
|
Tangoe, Inc. (a)(d) |
17,760 |
267,110 |
|
|
TeleCommunication Systems, Inc. Class A (a) |
30,163 |
76,916 |
|
|
TeleNav, Inc. (a) |
8,481 |
51,989 |
|
|
TiVo, Inc. (a) |
71,353 |
846,247 |
|
|
Tyler Technologies, Inc. (a) |
17,801 |
1,453,452 |
|
|
Ultimate Software Group, Inc. (a) |
15,669 |
1,874,482 |
|
|
Varonis Systems, Inc. |
3,028 |
76,518 |
|
|
Vasco Data Security International, Inc. (a) |
16,463 |
187,843 |
|
|
Verint Systems, Inc. (a) |
29,788 |
1,303,821 |
|
|
Common Stocks - continued |
|||
|
Shares |
Value |
||
|
INFORMATION TECHNOLOGY - continued |
|||
|
Software - continued |
|||
|
VirnetX Holding Corp. (a)(d) |
24,013 |
$ 378,205 |
|
|
Vringo, Inc. (a)(d) |
37,308 |
152,590 |
|
|
|
34,101,470 |
||
|
Technology Hardware, Storage & Peripherals - 0.4% |
|||
|
Cray, Inc. (a)(d) |
22,461 |
644,855 |
|
|
Electronics for Imaging, Inc. (a) |
26,291 |
993,537 |
|
|
Fusion-io, Inc. (a) |
45,673 |
394,158 |
|
|
Hutchinson Technology, Inc. (a) |
11,017 |
30,627 |
|
|
Imation Corp. (a) |
18,567 |
80,209 |
|
|
Immersion Corp. (a) |
15,630 |
177,244 |
|
|
QLogic Corp. (a) |
49,423 |
572,318 |
|
|
Quantum Corp. (a)(d) |
128,204 |
138,460 |
|
|
Silicon Graphics International Corp. (a)(d) |
18,592 |
224,591 |
|
|
Super Micro Computer, Inc. (a) |
18,061 |
367,722 |
|
|
Violin Memory, Inc. (d) |
11,578 |
41,681 |
|
|
|
3,665,402 |
||
|
TOTAL INFORMATION TECHNOLOGY |
157,639,955 |
||
|
MATERIALS - 4.9% |
|||
|
Chemicals - 2.3% |
|||
|
A. Schulman, Inc. |
16,296 |
585,352 |
|
|
Advanced Emissions Solutions, Inc. (a) |
12,050 |
276,307 |
|
|
American Vanguard Corp. (d) |
16,351 |
291,211 |
|
|
Arabian American Development Co. (a) |
11,184 |
122,241 |
|
|
Axiall Corp. |
39,440 |
1,837,904 |
|
|
Balchem Corp. |
16,752 |
1,037,786 |
|
|
Calgon Carbon Corp. (a) |
30,305 |
607,009 |
|
|
Chase Corp. |
4,102 |
127,736 |
|
|
Chemtura Corp. (a) |
55,689 |
1,241,865 |
|
|
Ferro Corp. (a) |
40,297 |
523,055 |
|
|
Flotek Industries, Inc. (a)(d) |
26,695 |
747,727 |
|
|
FutureFuel Corp. |
11,923 |
239,295 |
|
|
H.B. Fuller Co. |
28,468 |
1,318,922 |
|
|
Hawkins, Inc. |
4,989 |
180,602 |
|
|
Innophos Holdings, Inc. |
12,400 |
699,856 |
|
|
Innospec, Inc. |
13,156 |
566,497 |
|
|
Intrepid Potash, Inc. (a)(d) |
30,635 |
499,351 |
|
|
KMG Chemicals, Inc. |
4,704 |
73,429 |
|
|
Koppers Holdings, Inc. |
11,534 |
492,502 |
|
|
Common Stocks - continued |
|||
|
Shares |
Value |
||
|
MATERIALS - continued |
|||
|
Chemicals - continued |
|||
|
Kraton Performance Polymers, Inc. (a) |
18,147 |
$ 472,729 |
|
|
Landec Corp. (a) |
14,497 |
171,934 |
|
|
LSB Industries, Inc. (a) |
10,672 |
407,564 |
|
|
Marrone Bio Innovations, Inc. (d) |
3,449 |
42,009 |
|
|
Minerals Technologies, Inc. |
19,694 |
1,171,596 |
|
|
Olin Corp. |
45,304 |
1,273,042 |
|
|
OM Group, Inc. |
17,934 |
525,287 |
|
|
OMNOVA Solutions, Inc. (a) |
26,431 |
241,051 |
|
|
Penford Corp. (a) |
5,329 |
67,145 |
|
|
PolyOne Corp. |
55,438 |
2,077,262 |
|
|
Quaker Chemical Corp. |
7,356 |
547,507 |
|
|
Sensient Technologies Corp. |
28,202 |
1,524,318 |
|
|
Stepan Co. |
10,573 |
611,437 |
|
|
Taminco Corp. |
9,242 |
185,672 |
|
|
Tredegar Corp. |
13,592 |
282,850 |
|
|
Zep, Inc. |
12,689 |
219,393 |
|
|
|
21,289,443 |
||
|
Construction Materials - 0.2% |
|||
|
Headwaters, Inc. (a) |
40,902 |
510,457 |
|
|
Texas Industries, Inc. (a) |
12,303 |
1,066,670 |
|
|
U.S. Concrete, Inc. (a) |
8,227 |
202,549 |
|
|
United States Lime & Minerals, Inc. |
1,211 |
65,467 |
|
|
|
1,845,143 |
||
|
Containers & Packaging - 0.3% |
|||
|
AEP Industries, Inc. (a) |
2,664 |
94,892 |
|
|
Berry Plastics Group, Inc. (a) |
31,473 |
707,828 |
|
|
Graphic Packaging Holding Co. (a) |
110,387 |
1,132,571 |
|
|
Myers Industries, Inc. |
15,985 |
298,920 |
|
|
UFP Technologies, Inc. (a) |
3,123 |
79,199 |
|
|
|
2,313,410 |
||
|
Metals & Mining - 1.4% |
|||
|
A.M. Castle & Co. (a)(d) |
9,827 |
120,676 |
|
|
AK Steel Holding Corp. (a)(d) |
76,113 |
532,791 |
|
|
Allied Nevada Gold Corp. (a)(d) |
56,849 |
192,718 |
|
|
Amcol International Corp. |
15,689 |
719,341 |
|
|
Century Aluminum Co. (a)(d) |
28,751 |
395,326 |
|
|
Coeur d'Alene Mines Corp. (a) |
57,086 |
494,365 |
|
|
Commercial Metals Co. |
65,685 |
1,261,152 |
|
|
General Moly, Inc. (a)(d) |
27,264 |
29,990 |
|
|
Globe Specialty Metals, Inc. |
36,559 |
708,513 |
|
|
Common Stocks - continued |
|||
|
Shares |
Value |
||
|
MATERIALS - continued |
|||
|
Metals & Mining - continued |
|||
|
Gold Resource Corp. |
18,888 |
$ 87,074 |
|
|
Handy & Harman Ltd. (a) |
2,980 |
67,378 |
|
|
Haynes International, Inc. |
7,115 |
377,451 |
|
|
Hecla Mining Co. (d) |
186,892 |
573,758 |
|
|
Horsehead Holding Corp. (a)(d) |
28,211 |
439,809 |
|
|
Kaiser Aluminum Corp. |
10,724 |
754,970 |
|
|
Materion Corp. |
11,858 |
399,022 |
|
|
Midway Gold Corp. (a)(d) |
67,274 |
61,522 |
|
|
Molycorp, Inc. (a)(d) |
83,308 |
395,713 |
|
|
Noranda Aluminium Holding Corp. |
20,161 |
71,572 |
|
|
Olympic Steel, Inc. |
5,209 |
137,309 |
|
|
Paramount Gold & Silver Corp. (a)(d) |
73,166 |
73,898 |
|
|
RTI International Metals, Inc. (a)(d) |
17,948 |
505,416 |
|
|
Schnitzer Steel Industries, Inc. Class A (d) |
14,278 |
400,783 |
|
|
Stillwater Mining Co. (a)(d) |
66,612 |
1,051,137 |
|
|
SunCoke Energy, Inc. (a) |
39,377 |
821,798 |
|
|
U.S. Silica Holdings, Inc. |
11,965 |
540,459 |
|
|
Universal Stainless & Alloy Products, Inc. (a) |
3,943 |
141,514 |
|
|
Walter Energy, Inc. (d) |
35,936 |
258,739 |
|
|
Worthington Industries, Inc. |
30,012 |
1,104,442 |
|
|
|
12,718,636 |
||
|
Paper & Forest Products - 0.7% |
|||
|
Boise Cascade Co. (a) |
6,767 |
169,310 |
|
|
Clearwater Paper Corp. (a) |
11,827 |
726,060 |
|
|
Deltic Timber Corp. |
6,201 |
376,711 |
|
|
Kapstone Paper & Packaging Corp. (a) |
46,304 |
1,221,500 |
|
|
Louisiana-Pacific Corp. (a)(d) |
79,146 |
1,297,203 |
|
|
Neenah Paper, Inc. |
9,056 |
456,151 |
|
|
P.H. Glatfelter Co. |
24,074 |
614,368 |
|
|
Resolute Forest Products (a) |
39,284 |
700,827 |
|
|
Schweitzer-Mauduit International, Inc. |
17,594 |
767,802 |
|
|
Wausau-Mosinee Paper Corp. |
28,474 |
340,549 |
|
|
|
6,670,481 |
||
|
TOTAL MATERIALS |
44,837,113 |
||
|
TELECOMMUNICATION SERVICES - 0.7% |
|||
|
Diversified Telecommunication Services - 0.6% |
|||
|
8x8, Inc. (a)(d) |
49,021 |
475,504 |
|
|
Atlantic Tele-Network, Inc. |
5,405 |
319,814 |
|
|
Common Stocks - continued |
|||
|
Shares |
Value |
||
|
TELECOMMUNICATION SERVICES - continued |
|||
|
Diversified Telecommunication Services - continued |
|||
|
Cbeyond, Inc. (a) |
15,094 |
$ 149,280 |
|
|
Cincinnati Bell, Inc. (a) |
119,079 |
398,915 |
|
|
Cogent Communications Group, Inc. |
26,451 |
911,766 |
|
|
Consolidated Communications Holdings, Inc. |
22,655 |
451,288 |
|
|
FairPoint Communications, Inc. (a) |
12,515 |
170,705 |
|
|
General Communications, Inc. Class A (a) |
17,701 |
184,798 |
|
|
Hawaiian Telcom Holdco, Inc. (a)(d) |
5,841 |
155,487 |
|
|
HickoryTech Corp. |
7,160 |
84,989 |
|
|
IDT Corp. Class B |
8,133 |
128,827 |
|
|
inContact, Inc. (a)(d) |
29,634 |
244,481 |
|
|
Inteliquent, Inc. |
17,875 |
243,815 |
|
|
Iridium Communications, Inc. (a)(d) |
36,728 |
244,976 |
|
|
Lumos Networks Corp. |
8,610 |
113,738 |
|
|
ORBCOMM, Inc. (a) |
23,098 |
144,824 |
|
|
Premiere Global Services, Inc. (a) |
26,679 |
339,357 |
|
|
Straight Path Communications, Inc. Class B (a) |
3,271 |
22,897 |
|
|
Towerstream Corp. (a)(d) |
35,146 |
65,020 |
|
|
VocalTec Communications Ltd. (a)(d) |
10,503 |
185,693 |
|
|
Vonage Holdings Corp. (a) |
89,110 |
342,182 |
|
|
|
5,378,356 |
||
|
Wireless Telecommunication Services - 0.1% |
|||
|
Boingo Wireless, Inc. (a) |
11,471 |
75,709 |
|
|
Leap Wireless International, Inc. rights |
29,000 |
73,080 |
|
|
NII Holdings, Inc. (a)(d) |
97,129 |
83,521 |
|
|
NTELOS Holdings Corp. (d) |
8,669 |
119,546 |
|
|
RingCentral, Inc. (d) |
4,846 |
73,465 |
|
|
Shenandoah Telecommunications Co. |
13,670 |
383,170 |
|
|
U.S.A. Mobility, Inc. |
12,798 |
219,230 |
|
|
|
1,027,721 |
||
|
TOTAL TELECOMMUNICATION SERVICES |
6,406,077 |
||
|
UTILITIES - 3.3% |
|||
|
Electric Utilities - 1.5% |
|||
|
Allete, Inc. |
23,908 |
1,237,478 |
|
|
Cleco Corp. |
33,787 |
1,775,507 |
|
|
El Paso Electric Co. |
22,974 |
868,877 |
|
|
Empire District Electric Co. |
24,596 |
598,175 |
|
|
Genie Energy Ltd. Class B (a) |
7,450 |
60,345 |
|
|
IDACORP, Inc. |
28,264 |
1,586,741 |
|
|
Common Stocks - continued |
|||
|
Shares |
Value |
||
|
UTILITIES - continued |
|||
|
Electric Utilities - continued |
|||
|
MGE Energy, Inc. |
19,397 |
$ 741,353 |
|
|
NRG Yield, Inc. Class A (d) |
12,534 |
536,957 |
|
|
Otter Tail Corp. |
20,946 |
613,718 |
|
|
PNM Resources, Inc. |
45,118 |
1,248,866 |
|
|
Portland General Electric Co. |
42,797 |
1,432,416 |
|
|
UIL Holdings Corp. |
31,798 |
1,167,941 |
|
|
Unitil Corp. |
7,982 |
265,002 |
|
|
UNS Energy Corp. |
23,200 |
1,393,392 |
|
|
|
13,526,768 |
||
|
Gas Utilities - 0.9% |
|||
|
Chesapeake Utilities Corp. |
5,667 |
358,494 |
|
|
Delta Natural Gas Co., Inc. |
3,938 |
75,098 |
|
|
Laclede Group, Inc. |
18,343 |
869,642 |
|
|
New Jersey Resources Corp. |
23,676 |
1,177,407 |
|
|
Northwest Natural Gas Co. |
15,250 |
675,118 |
|
|
Piedmont Natural Gas Co., Inc. (d) |
42,327 |
1,514,883 |
|
|
South Jersey Industries, Inc. |
18,211 |
1,046,222 |
|
|
Southwest Gas Corp. |
26,181 |
1,440,217 |
|
|
WGL Holdings, Inc. |
29,240 |
1,163,460 |
|
|
|
8,320,541 |
||
|
Independent Power and Renewabl - 0.1% |
|||
|
Ormat Technologies, Inc. |
9,703 |
258,876 |
|
|
Pattern Energy Group, Inc. |
10,117 |
271,136 |
|
|
|
530,012 |
||
|
Independent Power Producers & Energy Traders - 0.4% |
|||
|
Atlantic Power Corp. (d) |
65,847 |
196,451 |
|
|
Black Hills Corp. |
25,158 |
1,452,875 |
|
|
Dynegy, Inc. (a)(d) |
56,428 |
1,605,377 |
|
|
|
3,254,703 |
||
|
Multi-Utilities - 0.2% |
|||
|
Avista Corp. |
33,608 |
1,080,497 |
|
|
NorthWestern Energy Corp. |
21,132 |
1,022,366 |
|
|
|
2,102,863 |
||
|
Water Utilities - 0.2% |
|||
|
American States Water Co. |
21,645 |
657,142 |
|
|
Artesian Resources Corp. Class A |
3,895 |
85,768 |
|
|
California Water Service Group |
27,742 |
624,195 |
|
|
Connecticut Water Service, Inc. |
6,097 |
198,153 |
|
|
Consolidated Water Co., Inc. |
7,709 |
89,579 |
|
|
Common Stocks - continued |
|||
|
Shares |
Value |
||
|
UTILITIES - continued |
|||
|
Water Utilities - continued |
|||
|
Middlesex Water Co. |
9,145 |
$ 185,918 |
|
|
Pure Cycle Corp. (a) |
9,178 |
51,489 |
|
|
SJW Corp. |
8,826 |
240,332 |
|
|
York Water Co. |
6,609 |
132,246 |
|
|
|
2,264,822 |
||
|
TOTAL UTILITIES |
29,999,709 |
||
|
TOTAL COMMON STOCKS (Cost $837,655,989) |
|
||
|
U.S. Treasury Obligations - 0.0% |
||||
|
|
Principal Amount |
|
||
|
U.S. Treasury Bills, yield at date of purchase 0.09% 7/24/14 (e) |
|
$ 200,000 |
|
|
|
Money Market Funds - 25.2% |
|||
|
Shares |
|
||
|
Fidelity Cash Central Fund, 0.11% (b) |
14,765,102 |
14,765,102 |
|
|
Fidelity Securities Lending Cash Central Fund, 0.10% (b)(c) |
216,753,425 |
216,753,425 |
|
|
TOTAL MONEY MARKET FUNDS (Cost $231,518,527) |
|
||
|
TOTAL INVESTMENT PORTFOLIO - 124.5% (Cost $1,069,374,476) |
1,146,103,440 |
||
|
NET OTHER ASSETS (LIABILITIES) - (24.5)% |
(225,633,910) |
||
|
NET ASSETS - 100% |
$ 920,469,530 |
||
|
Futures Contracts |
|||||
|
|
Expiration Date |
Underlying Face Amount at Value |
Unrealized Appreciation/ |
||
|
Purchased |
|||||
|
Equity Index Contracts |
|||||
|
60 ICE Russell 2000 Index Contracts (United States) |
June 2014 |
$ 6,741,600 |
$ 22,907 |
||
|
|
|
The face value of futures purchased as a percentage of net assets is 0.7% |
|
Legend |
|
(a) Non-income producing |
|
(b) Affiliated fund that is generally available only to investment companies and other accounts managed by Fidelity Investments. The rate quoted is the annualized seven-day yield of the fund at period end. A complete unaudited listing of the fund's holdings as of its most recent quarter end is available upon request. In addition, each Fidelity Central Fund's financial statements, which are not covered by the Fund's Report of Independent Registered Public Accounting Firm, are available on the SEC's website or upon request. |
|
(c) Investment made with cash collateral received from securities on loan. |
|
(d) Security or a portion of the security is on loan at period end. |
|
(e) Security or a portion of the security was pledged to cover margin requirements for futures contracts. At period end, the value of securities pledged amounted to $199,993. |
|
Affiliated Central Funds |
|
Information regarding fiscal year to date income earned by the Fund from investments in Fidelity Central Funds is as follows: |
|
Fund |
Income earned |
|
Fidelity Cash Central Fund |
$ 10,890 |
|
Fidelity Securities Lending Cash Central Fund |
1,127,689 |
|
Total |
$ 1,138,579 |
|
Other Information |
|
The following is a summary of the inputs used, as of April 30, 2014, involving the Fund's assets and liabilities carried at fair value. The inputs or methodology used for valuing securities may not be an indication of the risk associated with investing in those securities. For more information on valuation inputs, and their aggregation into the levels used in the table below, please refer to the Investment Valuation section in the accompanying Notes to Financial Statements. |
|
Valuation Inputs at Reporting Date: |
||||
|
Description |
Total |
Level 1 |
Level 2 |
Level 3 |
|
Investments in Securities: |
||||
|
Equities: |
||||
|
Consumer Discretionary |
$ 118,347,373 |
$ 118,347,373 |
$ - |
$ - |
|
Consumer Staples |
34,974,454 |
34,974,454 |
- |
- |
|
Energy |
55,550,363 |
55,547,689 |
- |
2,674 |
|
Financials |
215,225,381 |
215,225,381 |
- |
- |
|
Health Care |
117,692,914 |
117,692,914 |
- |
- |
|
Industrials |
133,711,581 |
133,711,581 |
- |
- |
|
Information Technology |
157,639,955 |
157,639,955 |
- |
- |
|
Materials |
44,837,113 |
44,837,113 |
- |
- |
|
Telecommunication Services |
6,406,077 |
6,332,997 |
- |
73,080 |
|
Utilities |
29,999,709 |
29,999,709 |
- |
- |
|
U.S. Government and Government Agency Obligations |
199,993 |
- |
199,993 |
- |
|
Money Market Funds |
231,518,527 |
231,518,527 |
- |
- |
|
Total Investments in Securities: |
$ 1,146,103,440 |
$ 1,145,827,693 |
$ 199,993 |
$ 75,754 |
|
Derivative Instruments: |
||||
|
Assets |
||||
|
Futures Contracts |
$ 22,907 |
$ 22,907 |
$ - |
$ - |
|
Value of Derivative Instruments |
|
The following table is a summary of the Fund's value of derivative instruments by primary risk exposure as of April 30, 2014. For additional information on derivative instruments, please refer to the Derivative Instruments section in the accompanying Notes to Financial Statements. |
|
Primary Risk Exposure / |
Value |
|
|
|
Asset |
Liability |
|
Equity Risk |
||
|
Futures Contracts (a) |
$ 22,907 |
$ - |
|
Total Value of Derivatives |
$ 22,907 |
$ - |
|
(a) Reflects gross cumulative appreciation (depreciation) on futures contracts as presented in the Schedule of Investments. Only the period end receivable or payable for daily variation margin and net unrealized appreciation (depreciation) are presented in the Statement of Assets and Liabilities. |
See accompanying notes which are an integral part of the financial statements.
Annual Report
Spartan Small Cap Index Fund
Financial Statements
Statement of Assets and Liabilities
|
|
April 30, 2014 |
|
|
|
|
|
|
Assets |
|
|
|
Investment in securities, at value (including securities loaned of $211,467,006) - See accompanying schedule: Unaffiliated issuers (cost $837,855,949) |
$ 914,584,913 |
|
|
Fidelity Central Funds (cost $231,518,527) |
231,518,527 |
|
|
Total Investments (cost $1,069,374,476) |
|
$ 1,146,103,440 |
|
Segregated cash with brokers for derivative instruments |
|
554,609 |
|
Receivable for investments sold |
|
565,333 |
|
Receivable for fund shares sold |
|
1,516,665 |
|
Dividends receivable |
|
364,361 |
|
Distributions receivable from Fidelity Central Funds |
|
153,644 |
|
Receivable for daily variation margin for derivative instruments |
|
111,420 |
|
Receivable from investment adviser for expense reductions |
|
99,254 |
|
Other receivables |
|
2,481 |
|
Total assets |
|
1,149,471,207 |
|
|
|
|
|
Liabilities |
|
|
|
Payable for investments purchased |
$ 10,066,175 |
|
|
Payable for fund shares redeemed |
2,015,727 |
|
|
Accrued management fee |
115,840 |
|
|
Other affiliated payables |
50,510 |
|
|
Collateral on securities loaned, at value |
216,753,425 |
|
|
Total liabilities |
|
229,001,677 |
|
|
|
|
|
Net Assets |
|
$ 920,469,530 |
|
Net Assets consist of: |
|
|
|
Paid in capital |
|
$ 836,418,711 |
|
Undistributed net investment income |
|
3,307,629 |
|
Accumulated undistributed net realized gain (loss) on investments and foreign currency transactions |
|
3,991,309 |
|
Net unrealized appreciation (depreciation) on investments and assets and liabilities in foreign currencies |
|
76,751,881 |
|
Net Assets |
|
$ 920,469,530 |
See accompanying notes which are an integral part of the financial statements.
Annual Report
Spartan Small Cap Index Fund
Financial Statements - continued
Statement of Assets and Liabilities - continued
|
|
April 30, 2014 |
|
|
|
|
|
|
Investor Class: |
|
$ 16.06 |
|
|
|
|
|
Fidelity Advantage Class: |
|
$ 16.08 |
|
|
|
|
|
Institutional Class: |
|
$ 16.09 |
|
|
|
|
|
Fidelity Advantage Institutional Class: |
|
$ 16.09 |
See accompanying notes which are an integral part of the financial statements.
Annual Report
Statement of Operations
|
|
Year ended April 30, 2014 |
|
|
|
|
|
|
Investment Income |
|
|
|
Dividends |
|
$ 7,314,195 |
|
Interest |
|
503 |
|
Income from Fidelity Central Funds (including $1,127,689 from security lending) |
|
1,138,579 |
|
Total income |
|
8,453,277 |
|
|
|
|
|
Expenses |
|
|
|
Management fee |
$ 902,157 |
|
|
Transfer agent fees |
411,582 |
|
|
Independent trustees' compensation |
2,076 |
|
|
Miscellaneous |
980 |
|
|
Total expenses before reductions |
1,316,795 |
|
|
Expense reductions |
(788,122) |
528,673 |
|
Net investment income (loss) |
|
7,924,604 |
|
Realized and Unrealized Gain (Loss) Net realized gain (loss) on: |
|
|
|
Investment securities: |
|
|
|
Unaffiliated issuers |
9,035,377 |
|
|
Foreign currency transactions |
(1,167) |
|
|
Futures contracts |
902,444 |
|
|
Total net realized gain (loss) |
|
9,936,654 |
|
Change in net unrealized appreciation (depreciation) on: Investment securities |
54,132,937 |
|
|
Assets and liabilities in foreign currencies |
(4) |
|
|
Futures contracts |
(37,971) |
|
|
Total change in net unrealized appreciation (depreciation) |
|
54,094,962 |
|
Net gain (loss) |
|
64,031,616 |
|
Net increase (decrease) in net assets resulting from operations |
|
$ 71,956,220 |
See accompanying notes which are an integral part of the financial statements.
Annual Report
Spartan Small Cap Index Fund
Financial Statements - continued
Statement of Changes in Net Assets
|
|
Year ended |
Year ended |
|
Increase (Decrease) in Net Assets |
|
|
|
Operations |
|
|
|
Net investment income (loss) |
$ 7,924,604 |
$ 1,787,862 |
|
Net realized gain (loss) |
9,936,654 |
1,165,380 |
|
Change in net unrealized appreciation (depreciation) |
54,094,962 |
20,097,144 |
|
Net increase (decrease) in net assets resulting |
71,956,220 |
23,050,386 |
|
Distributions to shareholders from net investment income |
(4,986,490) |
(1,161,877) |
|
Distributions to shareholders from net realized gain |
(6,296,385) |
(472,451) |
|
Total distributions |
(11,282,875) |
(1,634,328) |
|
Share transactions - net increase (decrease) |
623,676,829 |
177,215,771 |
|
Redemption fees |
287,609 |
85,469 |
|
Total increase (decrease) in net assets |
684,637,783 |
198,717,298 |
|
|
|
|
|
Net Assets |
|
|
|
Beginning of period |
235,831,747 |
37,114,449 |
|
End of period (including undistributed net investment income of $3,307,629 and undistributed net investment income of $701,142, respectively) |
$ 920,469,530 |
$ 235,831,747 |
See accompanying notes which are an integral part of the financial statements.
Annual Report
Financial Highlights - Investor Class
|
Years ended April 30, |
2014 |
2013 |
2012 G |
|
Selected Per-Share Data |
|
|
|
|
Net asset value, beginning of period |
$ 13.59 |
$ 11.78 |
$ 10.00 |
|
Income from Investment Operations |
|
|
|
|
Net investment income (loss) D |
.19 |
.18 |
.09 |
|
Net realized and unrealized gain (loss) |
2.56 |
1.85 |
1.73 |
|
Total from investment operations |
2.75 |
2.03 |
1.82 |
|
Distributions from net investment income |
(.12) |
(.14) |
(.04) |
|
Distributions from net realized gain |
(.18) |
(.08) |
- |
|
Total distributions |
(.29) J |
(.23) K |
(.04) |
|
Redemption fees added to paid in capital D |
.01 |
.01 |
- I |
|
Net asset value, end of period |
$ 16.06 |
$ 13.59 |
$ 11.78 |
|
Total Return B, C |
20.46% |
17.63% |
18.27% |
|
Ratios to Average Net Assets E, H |
|
|
|
|
Expenses before reductions |
.36% |
.36% |
.36% A |
|
Expenses net of fee waivers, if any |
.23% |
.29% |
.31% A |
|
Expenses net of all reductions |
.23% |
.29% |
.31% A |
|
Net investment income (loss) |
1.18% |
1.54% |
1.20% A |
|
Supplemental Data |
|
|
|
|
Net assets, end of period (000 omitted) |
$ 21,013 |
$ 8,079 |
$ 12,116 |
|
Portfolio turnover rate F |
9% |
11% |
7% A |
A Annualized
B Total returns for periods of less than one year are not annualized.
C Total returns would have been lower if certain expenses had not been reduced during the applicable periods shown.
D Calculated based on average shares outstanding during the period.
E Fees and expenses of any underlying Fidelity Central Funds are not included in the Fund's expense ratio. The Fund indirectly bears its proportionate share of the expenses of any underlying Fidelity Central Funds.
F Amount does not include the portfolio activity of any underlying Fidelity Central Funds.
G For the period September 8, 2011 (commencement of operations) to April 30, 2012.
H Expense ratios reflect operating expenses of the class. Expenses before reductions do not reflect amounts reimbursed by the investment adviser or reductions from expense offset arrangements and do not represent the amount paid by the class during periods when reimbursements or reductions occur. Expenses net of fee waivers reflect expenses after reimbursement by the investment adviser but prior to reductions from expense offset arrangements. Expenses net of all reductions represent the net expenses paid by the class.
I Amount represents less than $.01 per share.
J Total distributions of $.29 per share is comprised of distributions from net investment income of $.116 and distributions from net realized gain of $.178 per share.
K Total distributions of $.23 per share is comprised of distributions from net investment income of $.141 and distributions from net realized gain of $.084 per share.
See accompanying notes which are an integral part of the financial statements.
Annual Report
Financial Highlights - Fidelity Advantage Class
|
Years ended April 30, |
2014 |
2013 |
2012 G |
|
Selected Per-Share Data |
|
|
|
|
Net asset value, beginning of period |
$ 13.61 |
$ 11.79 |
$ 10.00 |
|
Income from Investment Operations |
|
|
|
|
Net investment income (loss) D |
.21 |
.21 |
.10 |
|
Net realized and unrealized gain (loss) |
2.57 |
1.84 |
1.73 |
|
Total from investment operations |
2.78 |
2.05 |
1.83 |
|
Distributions from net investment income |
(.14) |
(.15) |
(.04) |
|
Distributions from net realized gain |
(.18) |
(.08) |
- |
|
Total distributions |
(.32) |
(.24) J |
(.04) |
|
Redemption fees added to paid in capital D |
.01 |
.01 |
- I |
|
Net asset value, end of period |
$ 16.08 |
$ 13.61 |
$ 11.79 |
|
Total Return B, C |
20.61% |
17.81% |
18.38% |
|
Ratios to Average Net Assets E, H |
|
|
|
|
Expenses before reductions |
.23% |
.23% |
.23% A |
|
Expenses net of fee waivers, if any |
.09% |
.12% |
.17% A |
|
Expenses net of all reductions |
.09% |
.12% |
.17% A |
|
Net investment income (loss) |
1.32% |
1.71% |
1.34% A |
|
Supplemental Data |
|
|
|
|
Net assets, end of period (000 omitted) |
$ 632,741 |
$ 197,995 |
$ 23,851 |
|
Portfolio turnover rate F |
9% |
11% |
7% A |
A Annualized
B Total returns for periods of less than one year are not annualized.
C Total returns would have been lower if certain expenses had not been reduced during the applicable periods shown.
D Calculated based on average shares outstanding during the period.
E Fees and expenses of any underlying Fidelity Central Funds are not included in the Fund's expense ratio. The Fund indirectly bears its proportionate share of the expenses of any underlying Fidelity Central Funds.
F Amount does not include the portfolio activity of any underlying Fidelity Central Funds.
G For the period September 8, 2011 (commencement of operations) to April 30, 2012.
H Expense ratios reflect operating expenses of the class. Expenses before reductions do not reflect amounts reimbursed by the investment adviser or reductions from expense offset arrangements and do not represent the amount paid by the class during periods when reimbursements or reductions occur. Expenses net of fee waivers reflect expenses after reimbursement by the investment adviser but prior to reductions from expense offset arrangements. Expenses net of all reductions represent the net expenses paid by the class.
I Amount represents less than $.01 per share.
J Total distributions of $.24 per share is comprised of distributions from net investment income of $.151 and distributions from net realized gain of $.084 per share.
See accompanying notes which are an integral part of the financial statements.
Annual Report
Financial Highlights - Institutional Class
|
Years ended April 30, |
2014 |
2013 |
2012 G |
|
Selected Per-Share Data |
|
|
|
|
Net asset value, beginning of period |
$ 13.61 |
$ 11.80 |
$ 10.00 |
|
Income from Investment Operations |
|
|
|
|
Net investment income (loss) D |
.21 |
.22 |
.10 |
|
Net realized and unrealized gain (loss) |
2.58 |
1.82 |
1.74 |
|
Total from investment operations |
2.79 |
2.04 |
1.84 |
|
Distributions from net investment income |
(.14) |
(.15) |
(.04) |
|
Distributions from net realized gain |
(.18) |
(.08) |
- |
|
Total distributions |
(.32) |
(.24) J |
(.04) |
|
Redemption fees added to paid in capital D |
.01 |
.01 |
- I |
|
Net asset value, end of period |
$ 16.09 |
$ 13.61 |
$ 11.80 |
|
Total Return B, C |
20.71% |
17.74% |
18.49% |
|
Ratios to Average Net Assets E, H |
|
|
|
|
Expenses before reductions |
.17% |
.17% |
.17% A |
|
Expenses net of fee waivers, if any |
.07% |
.10% |
.13% A |
|
Expenses net of all reductions |
.07% |
.10% |
.13% A |
|
Net investment income (loss) |
1.34% |
1.73% |
1.38% A |
|
Supplemental Data |
|
|
|
|
Net assets, end of period (000 omitted) |
$ 263,061 |
$ 27,675 |
$ 574 |
|
Portfolio turnover rate F |
9% |
11% |
7% A |
A Annualized
B Total returns for periods of less than one year are not annualized.
C Total returns would have been lower if certain expenses had not been reduced during the applicable periods shown.
D Calculated based on average shares outstanding during the period.
E Fees and expenses of any underlying Fidelity Central Funds are not included in the Fund's expense ratio. The Fund indirectly bears its proportionate share of the expenses of any underlying Fidelity Central Funds.
F Amount does not include the portfolio activity of any underlying Fidelity Central Funds.
G For the period September 8, 2011 (commencement of operations) to April 30, 2012.
H Expense ratios reflect operating expenses of the class. Expenses before reductions do not reflect amounts reimbursed by the investment adviser or reductions from expense offset arrangements and do not represent the amount paid by the class during periods when reimbursements or reductions occur. Expenses net of fee waivers reflect expenses after reimbursement by the investment adviser but prior to reductions from expense offset arrangements. Expenses net of all reductions represent the net expenses paid by the class.
I Amount represents less than $.01 per share.
J Total distributions of $.24 per share is comprised of distributions from net investment income of $.155 and distributions from net realized gain of $.084 per share.
See accompanying notes which are an integral part of the financial statements.
Annual Report
Financial Highlights - Fidelity Advantage Institutional Class
|
Years ended April 30, |
2014 |
2013 |
2012 G |
|
Selected Per-Share Data |
|
|
|
|
Net asset value, beginning of period |
$ 13.61 |
$ 11.80 |
$ 10.00 |
|
Income from Investment Operations |
|
|
|
|
Net investment income (loss) D |
.21 |
.23 |
.10 |
|
Net realized and unrealized gain (loss) |
2.58 |
1.81 |
1.75 |
|
Total from investment operations |
2.79 |
2.04 |
1.85 |
|
Distributions from net investment income |
(.14) |
(.16) |
(.05) |
|
Distributions from net realized gain |
(.18) |
(.08) |
- |
|
Total distributions |
(.32) |
(.24) |
(.05) |
|
Redemption fees added to paid in capital D |
.01 |
.01 |
- I |
|
Net asset value, end of period |
$ 16.09 |
$ 13.61 |
$ 11.80 |
|
Total Return B, C |
20.73% |
17.77% |
18.50% |
|
Ratios to Average Net Assets E, H |
|
|
|
|
Expenses before reductions |
.15% |
.15% |
.15% A |
|
Expenses net of fee waivers, if any |
.05% |
.06% |
.11% A |
|
Expenses net of all reductions |
.05% |
.06% |
.11% A |
|
Net investment income (loss) |
1.36% |
1.77% |
1.40% A |
|
Supplemental Data |
|
|
|
|
Net assets, end of period (000 omitted) |
$ 3,654 |
$ 2,082 |
$ 574 |
|
Portfolio turnover rate F |
9% |
11% |
7% A |
A Annualized
B Total returns for periods of less than one year are not annualized.
C Total returns would have been lower if certain expenses had not been reduced during the applicable periods shown.
D Calculated based on average shares outstanding during the period.
E Fees and expenses of any underlying Fidelity Central Funds are not included in the Fund's expense ratio. The Fund indirectly bears its proportionate share of the expenses of any underlying Fidelity Central Funds.
F Amount does not include the portfolio activity of any underlying Fidelity Central Funds.
G For the period September 8, 2011 (commencement of operations) to April 30, 2012.
H Expense ratios reflect operating expenses of the class. Expenses before reductions do not reflect amounts reimbursed by the investment adviser or reductions from expense offset arrangements and do not represent the amount paid by the class during periods when reimbursements or reductions occur. Expenses net of fee waivers reflect expenses after reimbursement by the investment adviser but prior to reductions from expense offset arrangements. Expenses net of all reductions represent the net expenses paid by the class.
I Amount represents less than $.01 per share.
See accompanying notes which are an integral part of the financial statements.
Annual Report
Notes to Financial Statements
For the period ended April 30, 2014
1. Organization.
Spartan Mid Cap Index Fund and Spartan Small Cap Index Fund (the Funds) are funds of Fidelity Salem Street Trust (the Trust) and are authorized to issue an unlimited number of shares. The Trust is registered under the Investment Company Act of 1940, as amended (the 1940 Act), as an open-end management investment company organized as a Massachusetts business trust. Each Fund offers Investor Class, Fidelity Advantage Class, Institutional Class and Fidelity Advantage Institutional Class shares, each of which has equal rights as to assets and voting privileges. Each class has exclusive voting rights with respect to matters that affect that class. Each Fund offers conversion privileges between share classes within each Fund to eligible shareholders.
2. Investments in Fidelity Central Funds.
The Funds invest in Fidelity Central Funds, which are open-end investment companies generally available only to other investment companies and accounts managed by the investment adviser and its affiliates. The Funds' Schedules of Investments list each of the Fidelity Central Funds held as of period end, if any, as an investment of each Fund, but do not include the underlying holdings of each Fidelity Central Fund. As an Investing Fund, each Fund indirectly bears its proportionate share of the expenses of the underlying Fidelity Central Funds.
The Money Market Central Funds seek preservation of capital and current income and are managed by Fidelity Investments Money Management, Inc. (FIMM), an affiliate of the investment adviser. Annualized expenses of the Money Market Central Funds as of their most recent shareholder report date are less than .01%.
A complete unaudited list of holdings for each Fidelity Central Fund is available upon request or at the Securities and Exchange Commission (the SEC) website at www.sec.gov. In addition, the financial statements of the Fidelity Central Funds, which are not covered by the Funds' Report of Independent Registered Public Accounting Firm, are available on the SEC website or upon request.
3. Significant Accounting Policies.
The financial statements have been prepared in conformity with accounting principles generally accepted in the United States of America (GAAP), which require management to make certain estimates and assumptions at the date of the financial statements. Actual results could differ from those estimates. Subsequent events, if any, through the date that the financial statements were issued have been evaluated in the preparation of
Annual Report
3. Significant Accounting Policies - continued
the financial statements. The following summarizes the significant accounting policies of the Funds:
Investment Valuation. Investments are valued as of 4:00 p.m. Eastern time on the last calendar day of the period. In accordance with valuation policies and procedures approved by the Board of Trustees (the Board), each Fund attempts to obtain prices from one or more third party pricing vendors or brokers to value its investments. When current market prices, quotations or currency exchange rates are not readily available or reliable, investments will be fair valued in good faith by the Fidelity Management & Research Company (FMR) Fair Value Committee (the Committee), in accordance with procedures adopted by the Board. Factors used in determining fair value vary by investment type and may include market or investment specific events, changes in interest rates and credit quality. The frequency with which these procedures are used cannot be predicted and they may be utilized to a significant extent. The Committee oversees each Fund's valuation policies and procedures and is responsible for approving and reporting to the Board all fair value determinations.
Each Fund categorizes the inputs to valuation techniques used to value its investments into a disclosure hierarchy consisting of three levels as shown below:
Level 1 - quoted prices in active markets for identical investments
Level 2 - other significant observable inputs (including quoted prices for similar investments, interest rates, prepayment speeds, etc.)
Level 3 - unobservable inputs (including the Fund's own assumptions based on the best information available)
Valuation techniques used to value each Fund's investments by major category are as follows:
Equity securities, including restricted securities, for which market quotations are readily available, are valued at the last reported sale price or official closing price as reported by a third party pricing vendor on the primary market or exchange on which they are traded and are categorized as Level 1 in the hierarchy. In the event there were no sales during the day or closing prices are not available, securities are valued at the last quoted bid price or may be valued using the last available price and are generally categorized as Level 2 in the hierarchy. For foreign equity securities, when market or security specific events arise, comparisons to the valuation of American Depositary Receipts (ADRs), futures contracts, Exchange-Traded Funds (ETFs) and certain indexes as well as quoted prices for similar securities may be used and would be categorized as Level 2 in the hierarchy. Utilizing these techniques may result in transfers between Level 1 and Level 2. For equity securities, including restricted securities, where observable inputs are limited, assumptions about market activity and risk are used and these securities may be categorized as Level 3 in the hierarchy.
Annual Report
Notes to Financial Statements - continued
3. Significant Accounting Policies - continued
Investment Valuation - continued
Debt securities, including restricted securities, are valued based on evaluated prices received from third party pricing vendors or from brokers who make markets in such securities. U.S. government and government agency obligations are valued by pricing vendors who utilize matrix pricing which considers yield or price of bonds of comparable quality, coupon, maturity and type or by broker-supplied prices. When independent prices are unavailable or unreliable, debt securities may be valued utilizing pricing methodologies which consider similar factors that would be used by third party pricing vendors. Debt securities are generally categorized as Level 2 in the hierarchy but may be Level 3 depending on the circumstances.
Futures contracts are valued at the settlement price established each day by the board of trade or exchange on which they are traded and are categorized as Level 1 in the hierarchy. Investments in open-end mutual funds, including the Fidelity Central Funds, are valued at their closing net asset value (NAV) each business day and are categorized as Level 1 in the hierarchy.
Changes in valuation techniques may result in transfers in or out of an assigned level within the disclosure hierarchy. The aggregate value of investments by input level, as of April 30, 2014 is included at the end of each Fund's Schedule of Investments.
Foreign Currency. The Funds may use foreign currency contracts to facilitate transactions in foreign-denominated securities. Gains and losses from these transactions may arise from changes in the value of the foreign currency or if the counterparties do not perform under the contracts' terms.
Foreign-denominated assets, including investment securities, and liabilities are translated into U.S. dollars at the exchange rates at period end. Purchases and sales of investment securities, income and dividends received and expenses denominated in foreign currencies are translated into U.S. dollars at the exchange rate in effect on the transaction date.
The effects of exchange rate fluctuations on investments are included with the net realized and unrealized gain (loss) on investment securities. Other foreign currency transactions resulting in realized and unrealized gain (loss) are disclosed separately.
Investment Transactions and Income. For financial reporting purposes, the Funds' investment holdings and NAV include trades executed through the end of the last business day of the period. The NAV per share for processing shareholder transactions is calculated as of the close of business of the New York Stock Exchange (NYSE), normally 4:00 p.m. Eastern time and includes trades executed through the end of the prior business day. Gains and losses on securities sold are determined on the basis of identified
Annual Report
3. Significant Accounting Policies - continued
Investment Transactions and Income - continued
cost and may include proceeds received from litigation. Dividend income is recorded on the ex-dividend date, except for certain dividends from foreign securities where the ex-dividend date may have passed, which are recorded as soon as the Funds are informed of the ex-dividend date. Non-cash dividends included in dividend income, if any, are recorded at the fair market value of the securities received. Distributions received on securities that represent a return of capital or capital gain are recorded as a reduction of cost of investments and/or as a realized gain. Subsequent to ex-dividend date the Funds determine the components of these distributions, based upon receipt of tax filings or other correspondence relating to the underlying investment. Interest income and distributions from the Fidelity Central Funds are accrued as earned. Interest income includes coupon interest and amortization of premium and accretion of discount on debt securities as applicable. Investment income is recorded net of foreign taxes withheld where recovery of such taxes is uncertain.
Class Allocations and Expenses. Investment income, realized and unrealized capital gains and losses, common expenses of each Fund, and certain fund-level expense reductions, if any, are allocated daily on a pro-rata basis to each class based on the relative net assets of each class to the total net assets of each Fund. Each class differs with respect to transfer agent fees incurred. Certain expense reductions may also differ by class. For the reporting period, the allocated portion of income and expenses to each class as a percent of its average net assets may vary due to the timing of recording these transactions in relation to fluctuating net assets of the classes. Expenses directly attributable to a fund are charged to that fund. Expenses attributable to more than one fund are allocated among the respective funds on the basis of relative net assets or other appropriate methods. Expense estimates are accrued in the period to which they relate and adjustments are made when actual amounts are known.
Income Tax Information and Distributions to Shareholders. Each year, each Fund intends to qualify as a regulated investment company under Subchapter M of the Internal Revenue Code, including distributing substantially all of its taxable income and realized gains. As a result, no provision for U.S. Federal income taxes is required. As of April 30, 2014, each Fund did not have any unrecognized tax benefits in the financial statements; nor is each Fund aware of any tax positions for which it is reasonably possible that the total amounts of unrecognized tax benefits will significantly change in the next twelve months. Each Fund files a U.S. federal tax return, in addition to state and local tax returns as required. Each Fund's federal income tax returns are subject to examination by the Internal Revenue Service (IRS) for a period of three fiscal years after they are filed. State and local tax returns may be subject to examination for an additional fiscal year depending on the jurisdiction. Foreign taxes are provided for based on each Fund's
Annual Report
Notes to Financial Statements - continued
3. Significant Accounting Policies - continued
Income Tax Information and Distributions to Shareholders - continued
understanding of the tax rules and rates that exist in the foreign markets in which it invests.
Distributions are declared and recorded on the ex-dividend date. Income dividends and capital gain distributions are declared separately for each class. Income and capital gain distributions are determined in accordance with income tax regulations, which may differ from GAAP. In addition, the Funds claimed a portion of the payment made to redeeming shareholders as a distribution for income tax purposes.
Capital accounts within the financial statements are adjusted for permanent book-tax differences. These adjustments have no impact on net assets or the results of operations. Capital accounts are not adjusted for temporary book-tax differences which will reverse in a subsequent period.
Book-tax differences are primarily due to futures contracts, foreign currency transactions, passive foreign investment companies (PFIC), partnerships and losses deferred due to wash sales.
The federal tax cost of investment securities and unrealized appreciation (depreciation) as of period end were as follows for each Fund:
|
|
Tax cost |
Gross unrealized appreciation |
Gross unrealized depreciation |
Net unrealized |
|
Spartan Mid Cap Index Fund |
$ 591,230,898 |
$ 108,995,080 |
$ (12,918,295) |
$ 96,076,785 |
|
Spartan Small Cap Index Fund |
1,069,643,998 |
129,089,210 |
(52,629,768) |
76,459,442 |
The tax-based components of distributable earnings as of period end were as follows for each Fund:
|
|
Undistributed ordinary income |
Undistributed |
Net unrealized appreciation (depreciation) |
|
Spartan Mid Cap Index Fund |
$ 2,849,402 |
$ 496,049 |
$ 96,076,785 |
|
Spartan Small Cap Index Fund |
5,693,300 |
1,898,066 |
76,459,452 |
Annual Report
3. Significant Accounting Policies - continued
Income Tax Information and Distributions to Shareholders - continued
The tax character of distributions paid was as follows:
|
April 30, 2014 |
|
|
|
|
|
Ordinary Income |
Long-term |
Total |
|
Spartan Mid Cap Index Fund |
$ 5,871,823 |
$ 1,785,972 |
$ 7,657,795 |
|
Spartan Small Cap Index Fund |
8,797,191 |
2,485,684 |
11,282,875 |
|
April 30, 2013 |
|
|
|
|
|
Ordinary Income |
Long-term |
Total |
|
Spartan Mid Cap Index Fund |
$ 1,511,104 |
$ 48,083 |
$ 1,559,187 |
|
Spartan Small Cap Index Fund |
1,557,294 |
77,034 |
1,634,328 |
Short-Term Trading (Redemption) Fees. Shares held by investors in the Spartan Mid Cap Index Fund less than 30 days may be subject to a redemption fee equal to .75% of the NAV of shares redeemed. Shares held by investors in the Spartan Small Cap Index Fund less than 90 days are subject to a redemption fee equal to 1.50% of the NAV of shares redeemed. All redemption fees, which reduce the proceeds of the shareholder redemption, are retained by the Funds and accounted for as an addition to paid in capital.
4. Derivative Instruments.
Risk Exposures and the Use of Derivative Instruments. The Funds' investment objective allows the Funds to enter into various types of derivative contracts, including futures contracts. Derivatives are investments whose value is primarily derived from underlying assets, indices or reference rates and may be transacted on an exchange or over-the-counter (OTC). Derivatives may involve a future commitment to buy or sell a specified asset based on specified terms, to exchange future cash flows at periodic intervals based on a notional principal amount, or for one party to make one or more payments upon the occurrence of specified events in exchange for periodic payments from the other party.
The Funds used derivatives to increase returns and to manage exposure to certain risks as defined below. The success of any strategy involving derivatives depends on analysis of numerous economic factors, and if the strategies for investment do not work as intended, the Funds may not achieve their objectives.
Annual Report
Notes to Financial Statements - continued
4. Derivative Instruments - continued
Risk Exposures and the Use of Derivative Instruments - continued
The Funds' use of derivatives increased or decreased their exposure to the following risk:
|
Equity Risk |
Equity risk relates to the fluctuations in the value of financial instruments as a result of changes in market prices (other than those arising from interest rate risk or foreign exchange risk), whether caused by factors specific to an individual investment, its issuer, or all factors affecting all instruments traded in a market or market segment. |
The Funds are also exposed to additional risks from investing in derivatives, such as liquidity risk and counterparty credit risk. Liquidity risk is the risk that the Funds will be unable to close out the derivative in the open market in a timely manner. Counterparty credit risk is the risk that the counterparty will not be able to fulfill its obligation to the Funds. Counterparty credit risk related to exchange-traded futures contracts may be mitigated by the protection provided by the exchange on which they trade.
Investing in derivatives may involve greater risks than investing in the underlying assets directly and, to varying degrees, may involve risk of loss in excess of any initial investment and collateral received and amounts recognized in the Statement of Assets and Liabilities. In addition, there may be the risk that the change in value of the derivative contract does not correspond to the change in value of the underlying instrument.
Net Realized Gain (Loss) and Change in Net Unrealized Appreciation (Depreciation) on Derivatives. The table below, which reflects the impacts of derivatives on the financial performance of the Funds, summarizes the net realized gain (loss) and change in net unrealized appreciation (depreciation) for derivatives during the period as presented in the Statement of Operations.
|
Primary Risk Exposure / Derivative Type |
Net Realized |
Change in Net |
|
Spartan Mid Cap Index Fund |
|
|
|
Equity Risk |
|
|
|
Futures Contracts |
$ (24,891) |
$ 4,937 |
|
Totals (a) |
$ (24,891) |
$ 4,937 |
|
Spartan Small Cap Index Fund |
|
|
|
Equity Risk |
|
|
|
Futures Contracts |
$ 902,444 |
$ (37,971) |
|
Totals (a) |
$ 902,444 |
$ (37,971) |
(a) A summary of the value of derivatives by primary risk exposure as of period end, is included at the end of the Schedule of Investments.
Annual Report
4. Derivative Instruments - continued
Futures Contracts. A futures contract is an agreement between two parties to buy or sell a specified underlying instrument for a fixed price at a specified future date. The Funds used futures contracts to manage their exposure to the stock market.
Upon entering into a futures contract, a fund is required to deposit either cash or securities (initial margin) with a clearing broker in an amount equal to a certain percentage of the face value of the contract. Futures contracts are marked-to-market daily and subsequent daily payments (variation margin) are made or received by a fund depending on the daily fluctuations in the value of the futures contracts and are recorded as unrealized appreciation or (depreciation). This receivable and/or payable, if any, is included in daily variation margin for derivative instruments in the Statement of Assets and Liabilities. Realized gain or (loss) is recorded upon the expiration or closing of a futures contract.
Any open futures contracts at period end are presented in the Schedule of Investments under the caption "Futures Contracts." The underlying face amount at value reflects each contract's exposure to the underlying instrument or index at period end and is representative of volume of activity during the period. Securities deposited to meet initial margin requirements are identified in the Schedule of Investments. Cash deposited to meet initial margin requirements is presented as segregated cash with brokers for derivative instruments in the Statement of Assets and Liabilities.
5. Purchases and Sales of Investments.
Purchases and sales of securities, other than short-term securities, are noted in the table below.
|
|
Purchases ($) |
Sales ($) |
|
Spartan Mid Cap Index Fund |
340,004,523 |
32,411,476 |
|
Spartan Small Cap Index Fund |
671,095,067 |
52,597,192 |
6. Fees and Other Transactions with Affiliates.
Management Fee and Expense Contract. Fidelity Management & Research Company (FMR) (the investment adviser) and its affiliates provide the Funds with investment management related services for which the Funds pay a monthly management fee. The management fee is based on an annual rate of .12% and .15% of average net assets for Spartan Mid Cap Index Fund and Spartan Small Cap Index Fund, respectively. Under the management contract, the investment adviser pays all other fund-level expenses, except the compensation of the independent Trustees and certain other expenses such as interest expense, including commitment fees.
Annual Report
Notes to Financial Statements - continued
6. Fees and Other Transactions with Affiliates - continued
Management Fee and Expense Contract - continued
In addition, under an expense contract, the investment adviser pays class-level expenses as necessary so that the total expenses do not exceed certain amounts of each class' average net assets on an annual basis with certain exceptions, as noted in the following table:
|
|
Investor Class |
Fidelity Advantage Class |
Institutional Class |
Fidelity Advantage Institutional Class |
|
Spartan Mid Cap Index Fund |
.33% |
.20% |
.14% |
.12% |
|
Spartan Small Cap Index Fund |
.36% |
.23% |
.17% |
.15% |
Sub-Adviser. Geode Capital Management, LLC (Geode), serves as sub-adviser for the Funds. Geode provides discretionary investment advisory services to the Funds and is paid by the investment adviser for providing these services.
Transfer Agent Fees. Fidelity Investments Institutional Operations Company, Inc. (FIIOC), an affiliate of the investment adviser, is the transfer, dividend disbursing and shareholder servicing agent for each class of the Funds. FIIOC receives transfer agent fees at an annual rate of .21%, .11%, ..035% and .015% of average net assets for each Fund's Investor Class, Fidelity Advantage Class, Institutional Class and Fidelity Advantage Institutional Class, respectively. FIIOC pays for typesetting, printing and mailing of shareholder reports, except proxy statements.
Under the expense contract, each Investor Class, Fidelity Advantage Class and Institutional Class pays all or a portion of the transfer agent fees at an annual rate of .21%, .08% and .02% of average net assets, respectively. Each Fidelity Advantage Institutional Class does not pay transfer agent fees.
For the period, the total transfer agent fees paid by each applicable class were as follows:
|
Spartan Mid Cap Index Fund |
Amount |
|
Investor Class |
$ 17,226 |
|
Fidelity Advantage Class |
296,500 |
|
Institutional Class |
12,327 |
|
|
$ 326,053 |
|
Spartan Small Cap Index Fund |
|
|
Investor Class |
$ 33,623 |
|
Fidelity Advantage Class |
348,757 |
|
Institutional Class |
29,202 |
|
|
$ 411,582 |
Annual Report
7. Committed Line of Credit.
Certain Funds participate with other funds managed by the investment adviser or an affiliate in a $4.25 billion credit facility (the "line of credit") to be utilized for temporary or emergency purposes to fund shareholder redemptions or for other short-term liquidity purposes. The participating funds have agreed to pay commitment fees on their pro-rata portion of the line of credit, which are reflected in Miscellaneous expenses on the Statement of Operations, and are as follows:
|
Spartan Mid Cap Index Fund |
$ 744 |
|
Spartan Small Cap Index Fund |
980 |
During the period, there were no borrowings on this line of credit.
8. Security Lending.
Certain Funds lend portfolio securities through a lending agent from time to time in order to earn additional income. On the settlement date of the loan, each applicable Fund receives collateral (in the form of U.S. Treasury obligations, letters of credit and/or cash) against the loaned securities and maintains collateral in an amount not less than 100% of the market value of the loaned securities during the period of the loan. The market value of the loaned securities is determined at the close of business of the Funds and any additional required collateral is delivered to the Funds on the next business day. If the borrower defaults on its obligation to return the securities loaned because of insolvency or other reasons, the Funds may apply collateral received from the borrower against the obligation. The Funds may experience delays and costs in recovering the securities loaned. Any cash collateral received is invested in the Fidelity Securities Lending Cash Central Fund. The value of loaned securities and cash collateral at period end are disclosed on each applicable Fund's Statement of Assets and Liabilities. Security lending income represents the income earned on investing cash collateral, less rebates paid to borrowers and any lending agent fees associated with the loan, plus any premium payments received for lending certain types of securities. Security lending income is presented on each applicable Fund's Statement of Operations as a component of income from Fidelity Central Funds.
9. Expense Reductions.
The investment adviser contractually agreed to reimburse funds to the extent annual operating expenses exceeded certain levels of average net assets as noted in the table below. This reimbursement will remain in place through June 30, 2015. Some expenses, for example interest expense, including commitment fees, are excluded from this reimbursement.
Annual Report
Notes to Financial Statements - continued
9. Expense Reductions - continued
The following classes of each applicable Fund were in reimbursement during the period:
|
|
Expense |
Reimbursement |
|
Spartan Mid Cap Index Fund |
|
|
|
Investor Class |
.22% |
$ 9,202 |
|
Fidelity Advantage Class |
.08% |
447,736 |
|
Institutional Class |
.06% |
49,784 |
|
Fidelity Advantage Institutional Class |
.04% |
2,832 |
|
Spartan Small Cap Index Fund |
|
|
|
Investor Class |
.23% |
21,101 |
|
Fidelity Advantage Class |
.09% |
614,744 |
|
Institutional Class |
.07% |
147,422 |
|
Fidelity Advantage Institutional Class |
.05% |
3,485 |
In addition, through arrangements with each applicable Fund's custodian, credits realized as a result of uninvested cash balances were used to reduce each Fund's expenses. All of the applicable expense reductions are noted in the table below.
|
|
Custody expense |
|
Spartan Mid Cap Index Fund |
$ 15 |
|
Spartan Small Cap Index Fund |
35 |
In addition, the investment adviser reimbursed a portion of each Fund's operating expenses during the period as follows:
|
Spartan Mid Cap Index Fund |
$ 747 |
|
Spartan Small Cap Index Fund |
1,335 |
10. Distributions to Shareholders.
Distributions to shareholders of each class were as follows:
|
Years ended April 30, |
2014 |
2013 |
|
Spartan Mid Cap Index Fund |
|
|
|
From net investment income |
|
|
|
Investor Class |
$ 74,958 |
$ 181,075 |
|
Fidelity Advantage Class |
3,809,814 |
632,380 |
|
Institutional Class |
524,010 |
434,898 |
|
Fidelity Advantage Institutional Class |
38,713 |
1,556 |
|
Total |
$ 4,447,495 |
$ 1,249,909 |
|
From net realized gain |
|
|
|
Investor Class |
$ 62,107 |
$ 48,809 |
|
Fidelity Advantage Class |
2,753,728 |
153,239 |
|
Institutional Class |
367,797 |
106,819 |
|
Fidelity Advantage Institutional Class |
26,668 |
411 |
|
Total |
$ 3,210,300 |
$ 309,278 |
Annual Report
10. Distributions to Shareholders - continued
|
Years ended April 30, |
2014 |
2013 |
|
Spartan Small Cap Index Fund |
|
|
|
From net investment income |
|
|
|
Investor Class |
$ 121,693 |
$ 277,125 |
|
Fidelity Advantage Class |
3,732,923 |
634,304 |
|
Institutional Class |
1,098,983 |
249,021 |
|
Fidelity Advantage Institutional Class |
32,891 |
1,427 |
|
Total |
$ 4,986,490 |
$ 1,161,877 |
|
From net realized gain |
|
|
|
Investor Class |
$ 180,848 |
$ 131,295 |
|
Fidelity Advantage Class |
4,730,550 |
272,422 |
|
Institutional Class |
1,344,444 |
67,976 |
|
Fidelity Advantage Institutional Class |
40,543 |
758 |
|
Total |
$ 6,296,385 |
$ 472,451 |
11. Share Transactions.
Transactions for each class of shares were as follows:
|
|
Shares |
Dollars |
||
|
Years ended April 30, |
2014 |
2013 |
2014 |
2013 |
|
Spartan Mid Cap Index Fund |
|
|
|
|
|
Investor Class |
|
|
|
|
|
Shares sold |
1,975,682 |
1,525,867 |
$ 29,876,609 |
$ 18,496,025 |
|
Reinvestment of distributions |
8,979 |
19,079 |
133,800 |
221,467 |
|
Shares redeemed |
(1,432,371) |
(1,835,715) |
(21,248,784) |
(22,959,696) |
|
Net increase (decrease) |
552,290 |
(290,769) |
$ 8,761,625 |
$ (4,242,204) |
|
Fidelity Advantage Class |
|
|
|
|
|
Shares sold |
24,053,029 |
14,053,402 |
$ 363,116,725 |
$ 177,019,830 |
|
Reinvestment of distributions |
430,910 |
65,424 |
6,463,596 |
762,511 |
|
Shares redeemed |
(7,114,375) |
(1,205,869) |
(108,519,672) |
(14,930,620) |
|
Net increase (decrease) |
17,369,564 |
12,912,957 |
$ 261,060,649 |
$ 162,851,721 |
|
Institutional Class |
|
|
|
|
|
Shares sold |
2,965,195 |
1,830,971 |
$ 45,885,096 |
$ 21,586,198 |
|
Reinvestment of distributions |
59,718 |
46,616 |
891,807 |
541,717 |
|
Shares redeemed |
(720,066) |
(389,894) |
(11,097,777) |
(4,722,707) |
|
Net increase (decrease) |
2,304,847 |
1,487,693 |
$ 35,679,126 |
$ 17,405,208 |
Annual Report
Notes to Financial Statements - continued
11. Share Transactions - continued
|
|
Shares |
Dollars |
||
|
Years ended April 30, |
2014 |
2013 |
2014 |
2013 |
|
Fidelity Advantage Institutional Class |
|
|
|
|
|
Shares sold |
228,342 |
63,424 |
$ 3,279,459 |
$ 838,572 |
|
Reinvestment of distributions |
4,379 |
170 |
65,381 |
1,967 |
|
Shares redeemed |
(43,759) |
(92) |
(684,268) |
(1,227) |
|
Net increase (decrease) |
188,962 |
63,502 |
$ 2,660,572 |
$ 839,312 |
|
Spartan Small Cap Index Fund |
|
|
|
|
|
Investor Class |
|
|
|
|
|
Shares sold |
2,738,219 |
2,346,240 |
$ 42,850,558 |
$ 28,485,122 |
|
Reinvestment of distributions |
16,538 |
33,919 |
254,669 |
393,310 |
|
Shares redeemed |
(2,041,094) |
(2,813,647) |
(32,230,267) |
(35,532,992) |
|
Net increase (decrease) |
713,663 |
(433,488) |
$ 10,874,960 |
$ (6,654,560) |
|
Fidelity Advantage Class |
|
|
|
|
|
Shares sold |
31,293,380 |
14,023,492 |
$ 488,417,744 |
$ 177,473,307 |
|
Reinvestment of distributions |
525,763 |
74,690 |
8,101,146 |
868,118 |
|
Shares redeemed |
(7,029,195) |
(1,567,890) |
(111,411,379) |
(19,233,828) |
|
Net increase (decrease) |
24,789,948 |
12,530,292 |
$ 385,107,511 |
$ 159,107,597 |
|
Institutional Class |
|
|
|
|
|
Shares sold |
15,593,373 |
2,259,186 |
$ 247,126,510 |
$ 26,761,565 |
|
Reinvestment of distributions |
156,951 |
26,937 |
2,443,427 |
316,997 |
|
Shares redeemed |
(1,430,969) |
(301,107) |
(22,920,545) |
(3,776,948) |
|
Net increase (decrease) |
14,319,355 |
1,985,016 |
$ 226,649,392 |
$ 23,301,614 |
|
Fidelity Advantage Institutional Class |
|
|
|
|
|
Shares sold |
113,729 |
144,033 |
$ 1,682,596 |
$ 1,921,456 |
|
Reinvestment of distributions |
4,815 |
190 |
73,434 |
2,185 |
|
Shares redeemed |
(44,393) |
(39,867) |
(711,064) |
(462,521) |
|
Net increase (decrease) |
74,151 |
104,356 |
$ 1,044,966 |
$ 1,461,120 |
Annual Report
12. Other.
The Funds' organizational documents provide former and current trustees and officers with a limited indemnification against liabilities arising in connection with the performance of their duties to the Funds. In the normal course of business, the Funds may also enter into contracts that provide general indemnifications. The Funds' maximum exposure under these arrangements is unknown as this would be dependent on future claims that may be made against the Funds. The risk of material loss from such claims is considered remote.
Annual Report
Report of Independent Registered Public Accounting Firm
To the Trustees of Fidelity Salem Street Trust and Shareholders of Spartan Mid Cap Index Fund and Spartan Small Cap Index Fund:
We have audited the accompanying statements of assets and liabilities of Spartan Mid Cap Index Fund and Spartan Small Cap Index Fund (the Funds), each a fund of Fidelity Salem Street Trust, including the schedules of investments, as of April 30, 2014, and the related statements of operations for the year then ended, the statements of changes in net assets for each of the two years in the period then ended, and the financial highlights for each of the periods presented. These financial statements and financial highlights are the responsibility of the Funds' management. Our responsibility is to express an opinion on these financial statements and financial highlights based on our audits.
We conducted our audits in accordance with the standards of the Public Company Accounting Oversight Board (United States). Those standards require that we plan and perform the audit to obtain reasonable assurance about whether the financial statements and financial highlights are free of material misstatement. The Funds are not required to have, nor were we engaged to perform, an audit of their internal control over financial reporting. Our audits included consideration of internal control over financial reporting as a basis for designing audit procedures that are appropriate in the circumstances, but not for the purpose of expressing an opinion on the effectiveness of the Funds' internal control over financial reporting. Accordingly, we express no such opinion. An audit also includes examining, on a test basis, evidence supporting the amounts and disclosures in the financial statements, assessing the accounting principles used and significant estimates made by management, as well as evaluating the overall financial statement presentation. Our procedures included confirmation of securities owned as of April 30, 2014, by correspondence with the custodians and brokers; where replies were not received from brokers, we performed other auditing procedures. We believe that our audits provide a reasonable basis for our opinion.
In our opinion, the financial statements and financial highlights referred to above present fairly, in all material respects, the financial position of Spartan Mid Cap Index Fund and Spartan Small Cap Index Fund as of April 30, 2014, the results of their operations for the year then ended, the changes in their net assets for each of the two years in the period then ended, and the financial highlights for each of the periods presented, in conformity with accounting principles generally accepted in the United States of America.
DELOITTE & TOUCHE LLP
Boston, Massachusetts
June 20, 2014
Annual Report
Trustees and Officers
The Trustees and officers of the trust and funds, as applicable, are listed below. The Board of Trustees governs each fund and is responsible for protecting the interests of shareholders. The Trustees are experienced executives who meet periodically throughout the year to oversee each fund's activities, review contractual arrangements with companies that provide services to each fund, oversee management of the risks associated with such activities and contractual arrangements, and review each fund's performance. Except for Elizabeth S. Acton and James C. Curvey, each of the Trustees oversees 223 funds. Ms. Acton oversees 205 funds. Mr. Curvey oversees 396 funds.
The Trustees hold office without limit in time except that (a) any Trustee may resign; (b) any Trustee may be removed by written instrument, signed by at least two-thirds of the number of Trustees prior to such removal; (c) any Trustee who requests to be retired or who has become incapacitated by illness or injury may be retired by written instrument signed by a majority of the other Trustees; and (d) any Trustee may be removed at any special meeting of shareholders by a two-thirds vote of the outstanding voting securities of the trust. Each Trustee who is not an interested person (as defined in the 1940 Act) of the trust and the funds (Independent Trustee), shall retire not later than the last day of the month in which his or her 75th birthday occurs. The Independent Trustees may waive this mandatory retirement age policy with respect to individual Trustees. The officers hold office without limit in time, except that any officer may resign or may be removed by a vote of a majority of the Trustees at any regular meeting or any special meeting of the Trustees. Except as indicated, each individual has held the office shown or other offices in the same company for the past five years.
Experience, Skills, Attributes, and Qualifications of the Funds' Trustees. The Governance and Nominating Committee has adopted a statement of policy that describes the experience, qualifications, attributes, and skills that are necessary and desirable for potential Independent Trustee candidates (Statement of Policy). The Board believes that each Trustee satisfied at the time he or she was initially elected or appointed a Trustee, and continues to satisfy, the standards contemplated by the Statement of Policy. The Governance and Nominating Committee also engages professional search firms to help identify potential Independent Trustee candidates who have the experience, qualifications, attributes, and skills consistent with the Statement of Policy. From time to time, additional criteria based on the composition and skills of the current Independent Trustees, as well as experience or skills that may be appropriate in light of future changes to board composition, business conditions, and regulatory or other developments, have also been considered by the professional search firms and the Governance and Nominating Committee. In addition, the Board takes into account the Trustees' commitment and participation in Board and committee meetings, as well as their leadership of standing and ad hoc committees throughout their tenure.
In determining that a particular Trustee was and continues to be qualified to serve as a Trustee, the Board has considered a variety of criteria, none of which, in isolation, was controlling. The Board believes that, collectively, the Trustees have balanced and diverse experience, qualifications, attributes, and skills, which allow the Board to operate effectively in governing each fund and protecting the interests of shareholders. Information about the specific experience, skills, attributes, and qualifications of each Trustee, which in each case led to the Board's conclusion that the Trustee should serve (or continue to serve) as a trustee of the funds, is provided below.
Annual Report
Board Structure and Oversight Function. Abigail P. Johnson is an interested person (as defined in the 1940 Act) and currently serves as Chairman. The Trustees have determined that an interested Chairman is appropriate and benefits shareholders because an interested Chairman has a personal and professional stake in the quality and continuity of services provided to the funds. Independent Trustees exercise their informed business judgment to appoint an individual of their choosing to serve as Chairman, regardless of whether the Trustee happens to be independent or a member of management. The Independent Trustees have determined that they can act independently and effectively without having an Independent Trustee serve as Chairman and that a key structural component for assuring that they are in a position to do so is for the Independent Trustees to constitute a substantial majority for the Board. The Independent Trustees also regularly meet in executive session. Albert R. Gamper, Jr. serves as Chairman of the Independent Trustees and as such (i) acts as a liaison between the Independent Trustees and management with respect to matters important to the Independent Trustees and (ii) with management prepares agendas for Board meetings.
Fidelity funds are overseen by different Boards of Trustees. The funds' Board oversees Fidelity's investment-grade bond, money market, and asset allocation funds and another Board oversees Fidelity's equity and high income funds. The asset allocation funds may invest in Fidelity funds that are overseen by such other Board. The use of separate Boards, each with its own committee structure, allows the Trustees of each group of Fidelity funds to focus on the unique issues of the funds they oversee, including common research, investment, and operational issues. On occasion, the separate Boards establish joint committees to address issues of overlapping consequences for the Fidelity funds overseen by each Board.
The Trustees operate using a system of committees to facilitate the timely and efficient consideration of all matters of importance to the Trustees, each fund, and fund shareholders and to facilitate compliance with legal and regulatory requirements and oversight of the funds' activities and associated risks. The Board, acting through its committees, has charged FMR and its affiliates with (i) identifying events or circumstances the occurrence of which could have demonstrably adverse effects on the funds' business and/or reputation; (ii) implementing processes and controls to lessen the possibility that such events or circumstances occur or to mitigate the effects of such events or circumstances if they do occur; and (iii) creating and maintaining a system designed to evaluate continuously business and market conditions in order to facilitate the identification and implementation processes described in (i) and (ii) above. Because the day-to-day operations and activities of the funds are carried out by or through FMR, its affiliates, and other service providers, the funds' exposure to risks is mitigated but not eliminated by the processes overseen by the Trustees. While each of the Board's committees has responsibility for overseeing different aspects of the funds' activities, oversight is exercised primarily through the Operations and Audit Committees. In addition, an ad hoc Board committee of Independent Trustees has worked with FMR to enhance the Board's oversight of investment and financial risks, legal and regulatory risks, technology risks, and operational risks, including the development of additional risk reporting to the Board. Appropriate personnel, including but not limited to the funds' Chief Compliance Officer (CCO), FMR's internal auditor, the independent accountants, the funds' Treasurer and portfolio management personnel, make periodic reports to the Board's committees, as appropriate, including an annual review of FMR's risk management program for the Fidelity funds. The responsibilities of each standing committee, including their oversight responsibilities, are described further under "Standing Committees of the Funds' Trustees."
Annual Report
Trustees and Officers - continued
The funds' Statement of Additional Information (SAI) includes more information about the Trustees. To request a free copy, call Fidelity at 1-800-835-5092.
Interested Trustees*:
Correspondence intended for each Trustee who is an interested person may be sent to Fidelity Investments, 245 Summer Street, Boston, Massachusetts 02210.
|
Name, Year of Birth; Principal Occupations and Other Relevant Experience+ |
|
|
James C. Curvey (1935) |
|
|
Year of Election or Appointment: 2007 Trustee |
|
|
|
Mr. Curvey also serves as Trustee of other Fidelity funds. Mr. Curvey is a Director of Fidelity Investments Money Management, Inc. (2009-present), Director of Fidelity Research & Analysis Co. (2009-present) and Director of FMR and FMR Co., Inc. (2007-present). Mr. Curvey is also Vice Chairman (2007-present) and Director of FMR LLC. In addition, Mr. Curvey serves as an Overseer for the Boston Symphony Orchestra and a member of the Trustees of Villanova University. Previously, Mr. Curvey was the Vice Chairman (2006-2007) and Director (2000-2007) of FMR Corp. |
|
Abigail P. Johnson (1961) |
|
|
Year of Election or Appointment: 2009 Trustee Chairman of the Board of Trustees |
|
|
|
Ms. Johnson also serves as Trustee of other Fidelity funds. Ms. Johnson serves as President of FMR LLC (2013-present), President of Fidelity Financial Services (2012-present) and President of Personal, Workplace and Institutional Services (2005-present). Ms. Johnson is Chairman and Director of FMR Co., Inc. (2011-present), Chairman and Director of FMR (2011-present), and the Vice Chairman and Director (2007-present) of FMR LLC. Previously, Ms. Johnson served as President and a Director of FMR (2001-2005), a Trustee of other investment companies advised by FMR, Fidelity Investments Money Management, Inc., and FMR Co., Inc. (2001-2005), Senior Vice President of the Fidelity funds (2001-2005), and managed a number of Fidelity funds. Ms. Abigail P. Johnson and Mr. Arthur E. Johnson are not related. |
* Trustees have been determined to be "Interested Trustees" by virtue of, among other things, their affiliation with the trust or various entities under common control with FMR.
+ The information above includes each Trustee's principal occupation during the last five years and other information relating to the experience, attributes, and skills relevant to each Trustee's qualifications to serve as a Trustee, which led to the conclusion that each Trustee should serve as a Trustee for each fund.
Annual Report
Trustees and Officers - continued
Independent Trustees:
Correspondence intended for each Independent Trustee (that is, the Trustees other than the Interested Trustees) may be sent to Fidelity Investments, P.O. Box 55235, Boston, Massachusetts 02205-5235.
|
Name, Year of Birth; Principal Occupations and Other Relevant Experience+ |
|
|
Elizabeth S. Acton (1951) |
|
|
Year of Election or Appointment: 2013 Trustee |
|
|
|
Ms. Acton also serves as Trustee or Member of the Advisory Board of other Fidelity funds. Prior to her retirement in April 2012, Ms. Acton was Executive Vice President, Finance (2011-2012), Executive Vice President, Chief Financial Officer (2002-2011), and Treasurer (2004-2005) of Comerica Incorporated (financial services). Prior to joining Comerica, Ms. Acton held a variety of positions at Ford Motor Company (1983-2002), including Vice President and Treasurer (2000-2002) and Executive Vice President and Chief Financial Officer of Ford Motor Credit Company (1998-2000). Ms. Acton currently serves as a member of the Board of Directors and Audit and Finance Committees of Beazer Homes USA, Inc. (homebuilding, 2012-present). |
|
Albert R. Gamper, Jr. (1942) |
|
|
Year of Election or Appointment: 2006 Trustee Chairman of the Independent Trustees |
|
|
|
Mr. Gamper also serves as Trustee of other Fidelity funds. Prior to his retirement in December 2004, Mr. Gamper served as Chairman of the Board of CIT Group Inc. (commercial finance). During his tenure with CIT Group Inc. Mr. Gamper served in numerous senior management positions, including Chairman (1987-1989; 1999-2001; 2002-2004), Chief Executive Officer (1987-2004), and President (2002-2003). Mr. Gamper currently serves as a member of the Board of Directors of Public Service Enterprise Group (utilities, 2000-present), a member of the Board of Trustees, Rutgers University (2004-present), and Chairman of the Board of Barnabas Health Care System. Previously, Mr. Gamper served as Vice Chairman of the Independent Trustees of certain Fidelity funds (2011-2012) and as Chairman of the Board of Governors, Rutgers University (2004-2007). |
|
Robert F. Gartland (1951) |
|
|
Year of Election or Appointment: 2010 Trustee |
|
|
|
Mr. Gartland also serves as Trustee of other Fidelity funds. Mr. Gartland is Chairman and an investor in Gartland and Mellina Group Corp. (consulting, 2009-present). Previously, Mr. Gartland served as a partner and investor of Vietnam Partners LLC (investments and consulting, 2008-2011). Prior to his retirement, Mr. Gartland held a variety of positions at Morgan Stanley (financial services, 1979-2007) including Managing Director (1987-2007). |
|
Arthur E. Johnson (1947) |
|
|
Year of Election or Appointment: 2008 Trustee |
|
|
|
Mr. Johnson also serves as Trustee of other Fidelity funds. Mr. Johnson serves as a member of the Board of Directors of Eaton Corporation (diversified power management, 2009-present), AGL Resources, Inc. (holding company, 2002-present) and Booz Allen Hamilton (management consulting, 2011-present). Prior to his retirement, Mr. Johnson served as Senior Vice President of Corporate Strategic Development of Lockheed Martin Corporation (defense contractor, 1999-2009). He previously served on the Board of Directors of IKON Office Solutions, Inc. (1999-2008) and Delta Airlines (2005-2007). Mr. Arthur E. Johnson is not related to Ms. Abigail P. Johnson. |
|
Michael E. Kenneally (1954) |
|
|
Year of Election or Appointment: 2009 Trustee |
|
|
|
Mr. Kenneally also serves as Trustee of other Fidelity funds. Mr. Kenneally served as a Member of the Advisory Board for certain Fidelity funds before joining the Board of Trustees (2008-2009). Prior to his retirement, Mr. Kenneally served as Chairman and Global Chief Executive Officer of Credit Suisse Asset Management. Before joining Credit Suisse, he was an Executive Vice President and Chief Investment Officer for Bank of America Corporation. Earlier roles at Bank of America included Director of Research, Senior Portfolio Manager and Research Analyst, and Mr. Kenneally was awarded the Chartered Financial Analyst (CFA) designation in 1991. |
|
James H. Keyes (1940) |
|
|
Year of Election or Appointment: 2007 Trustee |
|
|
|
Mr. Keyes also serves as Trustee of other Fidelity funds. Mr. Keyes serves as a member of the Board and Non-Executive Chairman of Navistar International Corporation (manufacture and sale of trucks, buses, and diesel engines, since 2002). Previously, Mr. Keyes served as a member of the Board of Pitney Bowes, Inc. (integrated mail, messaging, and document management solutions, 1998-2013). Prior to his retirement, Mr. Keyes served as Chairman (1993-2002) and Chief Executive Officer (1988-2002) of Johnson Controls (automotive, building, and energy) and as a member of the Board of LSI Logic Corporation (semiconductor technologies, 1984-2008). |
|
Marie L. Knowles (1946) |
|
|
Year of Election or Appointment: 2001 Trustee Vice Chairman of the Independent Trustees |
|
|
|
Ms. Knowles also serves as Trustee of other Fidelity funds. Prior to Ms. Knowles' retirement in June 2000, she served as Executive Vice President and Chief Financial Officer of Atlantic Richfield Company (ARCO) (diversified energy, 1996-2000). From 1993 to 1996, she was a Senior Vice President of ARCO and President of ARCO Transportation Company. She served as a Director of ARCO from 1996 to 1998. Ms. Knowles currently serves as a Director and Chairman of the Audit Committee of McKesson Corporation (healthcare service, since 2002). Ms. Knowles is a member of the Board of the Catalina Island Conservancy and of the Santa Catalina Island Company (2009-present). She also serves as a member of the Advisory Board for the School of Engineering of the University of Southern California. Previously, Ms. Knowles served as a Director of Phelps Dodge Corporation (copper mining and manufacturing, 1994-2007), URS Corporation (engineering and construction, 2000-2003) and America West (airline, 1999-2002). |
|
Kenneth L. Wolfe (1939) |
|
|
Year of Election or Appointment: 2005 Trustee |
|
|
|
Mr. Wolfe also serves as Trustee of other Fidelity funds. Prior to his retirement, Mr. Wolfe served as Chairman and a Director (2007-2009) and Chairman and Chief Executive Officer (1994-2001) of Hershey Foods Corporation. He also served as a member of the Boards of Adelphia Communications Corporation (telecommunications, 2003-2006), Bausch & Lomb, Inc. (medical/pharmaceutical, 1993-2007), and Revlon, Inc. (personal care products, 2004-2009). Mr. Wolfe previously served as Chairman of the Independent Trustees of other Fidelity funds (2008-2012). |
+ The information above includes each Trustee's principal occupation during the last five years and other information relating to the experience, attributes, and skills relevant to each Trustee's qualifications to serve as a Trustee, which led to the conclusion that each Trustee should serve as a Trustee for each fund.
Officers:
Correspondence intended for each officer may be sent to Fidelity Investments, 245 Summer Street, Boston, Massachusetts 02210. Officers appear below in alphabetical order.
|
Name, Year of Birth; Principal Occupation |
|
|
Elizabeth Paige Baumann (1968) |
|
|
Year of Election or Appointment: 2012 Anti-Money Laundering (AML) Officer |
|
|
|
Ms. Baumann also serves as AML Officer of other funds. She is Chief AML Officer of FMR LLC (2012-present) and is an employee of Fidelity Investments. Previously, Ms. Baumann served as Vice President and Deputy Anti-Money Laundering Officer (2007-2012). |
|
Marc Bryant (1966) |
|
|
Year of Election or Appointment: 2013 Assistant Secretary |
|
|
|
Mr. Bryant also serves as an officer of other funds. He is Senior Vice President and Deputy General Counsel of FMR LLC. Prior to joining Fidelity Investments, Mr. Bryant served as a Senior Vice President and the Head of Global Retail Legal for AllianceBernstein L.P. (2006-2010), and as the General Counsel for ProFund Advisors LLC (2001-2006). |
|
Jonathan Davis (1968) |
|
|
Year of Election or Appointment: 2010 Assistant Treasurer |
|
|
|
Mr. Davis also serves as Assistant Treasurer of other funds. Mr. Davis is an employee of Fidelity Investments. Previously, Mr. Davis served as Vice President and Associate General Counsel of FMR LLC (2003-2010). |
|
Adrien E. Deberghes (1967) |
|
|
Year of Election or Appointment: 2010 Assistant Treasurer |
|
|
|
Mr. Deberghes also serves as an officer of other funds. He is an employee of Fidelity Investments (2008-present). Prior to joining Fidelity Investments, Mr. Deberghes was Senior Vice President of Mutual Fund Administration at State Street Corporation (2007-2008), Senior Director of Mutual Fund Administration at Investors Bank & Trust (2005-2007), and Director of Finance for Dunkin' Brands (2000-2005). |
|
Stephanie J. Dorsey (1969) |
|
|
Year of Election or Appointment: 2013 President and Treasurer |
|
|
|
Ms. Dorsey also serves as an officer of other funds. She is an employee of Fidelity Investments (2008-present) and has served in other fund officer roles. Prior to joining Fidelity Investments, Ms. Dorsey served as Treasurer (2004-2008) of the JPMorgan Mutual Funds and Vice President (2004-2008) of JPMorgan Chase Bank. |
|
Scott C. Goebel (1968) |
|
|
Year of Election or Appointment: 2008 Secretary and Chief Legal Officer (CLO) |
|
|
|
Mr. Goebel serves as Secretary and CLO of other funds. Mr. Goebel also serves as Secretary of Fidelity SelectCo, LLC (2013-present), Fidelity Investments Money Management, Inc. (FIMM) (2010-present) and Fidelity Research and Analysis Company (FRAC) (2010-present); General Counsel, Secretary, and Senior Vice President of FMR (2008-present) and FMR Co., Inc. (2008-present); Chief Legal Officer of Fidelity Management & Research (Hong Kong) Limited (2008-present); and Assistant Secretary of Fidelity Management & Research (Japan) Inc. (2008-present) and Fidelity Management & Research (U.K.) Inc. (2008-present). Previously, Mr. Goebel served as Secretary and CLO of other Fidelity funds (2008-2013), Assistant Secretary of FIMM (2008-2010), FRAC (2008-2010), and certain funds (2007-2008); and as Vice President and Secretary of Fidelity Distributors Corporation (FDC) (2005-2007). Mr. Goebel has been employed by FMR LLC or an affiliate since 2001. |
|
Bruce T. Herring (1965) |
|
|
Year of Election or Appointment: 2013 Vice President of Fidelity's Asset Allocation Funds |
|
|
|
Mr. Herring also serves as Vice President of other funds. He serves as Chief Investment Officer of Fidelity Global Asset Allocation (GAA) (2013-present), Group Chief Investment Officer of FMR, and President of Fidelity Research & Analysis Company (2010-present). Previously, Mr. Herring served as Chief Investment Officer and Director of Fidelity Management & Research (U.K.) Inc. (2010-2013), Vice President (2005-2006) and Senior Vice President (2006-2007) of Fidelity Management & Research Company, Vice President of FMR Co., Inc. (2001-2007), and as a portfolio manager for Fidelity U.S. Equity Funds. |
|
Chris Maher (1972) |
|
|
Year of Election or Appointment: 2013 Assistant Treasurer |
|
|
|
Mr. Maher serves as Assistant Treasurer of other funds. Mr. Maher is Vice President of Valuation Oversight and is an employee of Fidelity Investments. Previously, Mr. Maher served as Vice President of Asset Management Compliance (2013), Vice President of FMR's Program Management Group (2010-2013), and Vice President of Valuation Oversight (2008-2010). |
|
Charles S. Morrison (1960) |
|
|
Year of Election or Appointment: 2012 Vice President |
|
|
|
Mr. Morrison also serves as Trustee or Vice President of other funds. He serves as President, Asset Management (2014-present) and is an employee of Fidelity Investments. Previously, Mr. Morrison served as President, Fixed Income (2011-2014), Vice President of Fidelity's Money Market Funds (2005-2009), President, Money Market Group Leader of FMR (2009), and Senior Vice President, Money Market Group of FMR (2004-2009). Mr. Morrison also served as Vice President of Fidelity's Bond Funds (2002-2005), certain Balanced Funds (2002-2005), and certain Asset Allocation Funds (2002-2007), and as Senior Vice President (2002-2005) of Fidelity's Bond Division. |
|
Christine Reynolds (1958) |
|
|
Year of Election or Appointment: 2008 Chief Financial Officer |
|
|
|
Ms. Reynolds also serves as Chief Financial Officer of other funds. Ms. Reynolds became President of Fidelity Pricing and Cash Management Services (FPCMS) in August 2008. Ms. Reynolds served as Chief Operating Officer of FPCMS (2007-2008). Previously, Ms. Reynolds served as President, Treasurer, and Anti-Money Laundering officer of the Fidelity funds (2004-2007). |
|
Kenneth B. Robins (1969) |
|
|
Year of Election or Appointment: 2009 Assistant Treasurer |
|
|
|
Mr. Robins also serves as an officer of other funds. Mr. Robins serves as Executive Vice President of Fidelity Investments Money Management, Inc. (FIMM) (2013-present) and is an employee of Fidelity Investments (2004-present). Previously, Mr. Robins served in other fund officer roles. |
|
Stephen Sadoski (1971) |
|
|
Year of Election or Appointment: 2013 Deputy Treasurer |
|
|
|
Mr. Sadoski also serves as Deputy Treasurer of other funds. He is an employee of Fidelity Investments (2012-present) and has served in another fund officer role. Prior to joining Fidelity Investments, Mr. Sadoski served as an assistant chief accountant in the Division of Investment Management of the Securities and Exchange Commission (SEC) (2009-2012) and as a senior manager at Deloitte & Touche LLP (1997-2009). |
|
Stacie M. Smith (1974) |
|
|
Year of Election or Appointment: 2013 Assistant Treasurer |
|
|
|
Ms. Smith also serves as an officer of other funds. She is an employee of Fidelity Investments (2009-present) and has served in other fund officer roles. Prior to joining Fidelity Investments, Ms. Smith served as Senior Audit Manager of Ernst & Young LLP (1996-2009). |
|
Renee Stagnone (1975) |
|
|
Year of Election or Appointment: 2013 Deputy Treasurer |
|
|
|
Ms. Stagnone also serves as Deputy Treasurer of other funds. Ms. Stagnone is an employee of Fidelity Investments. |
|
Michael H. Whitaker (1967) |
|
|
Year of Election or Appointment: 2008 Chief Compliance Officer |
|
|
|
Mr. Whitaker also serves as Chief Compliance Officer of other funds. Mr. Whitaker is an employee of Fidelity Investments (2007-present). Prior to joining Fidelity Investments, Mr. Whitaker worked at MFS Investment Management where he served as Senior Vice President and Chief Compliance Officer (2004-2006), and Assistant General Counsel. |
|
Derek L. Young (1964) |
|
|
Year of Election or Appointment: 2009 Vice President of Fidelity's Asset Allocation Funds |
|
|
|
Mr. Young also serves as Trustee or an officer of other funds. He is President and a Director of Strategic Advisers, Inc. (2011-present), President of Fidelity Global Asset Allocation (GAA) (2011-present), and Vice Chairman of Pyramis Global Advisors, LLC (2011-present). Previously, Mr. Young served as Chief Investment Officer of GAA (2009-2011) and as a portfolio manager. |
|
Joseph F. Zambello (1957) |
|
|
Year of Election or Appointment: 2011 Deputy Treasurer |
|
|
|
Mr. Zambello also serves as Deputy Treasurer of other funds. Mr. Zambello is an employee of Fidelity Investments. Previously, Mr. Zambello served as Vice President of FMR's Program Management Group (2009-2011) and Vice President of the Transfer Agent Oversight Group (2005-2009). |
Annual Report
Distributions (Unaudited)
The Board of Trustees of each voted to pay to shareholders of record at the opening of business on record date, the following distributions per share derived from capital gains realized from sales of portfolio securities and dividends derived from net investment income:
|
Spartan Mid Cap |
Pay Date |
Record Date |
Dividends |
Capital Gains |
|
Institutional Class |
06/09/2014 |
06/06/2014 |
$0.06058 |
$0.026 |
|
Fidelity Advantage |
06/09/2014 |
06/06/2014 |
$0.06202 |
$0.026 |
|
Spartan Small Cap |
Pay Date |
Record Date |
Dividends |
Capital Gains |
|
Institutional Class |
06/09/2014 |
06/06/2014 |
$0.05431 |
$0.072 |
|
Fidelity Advantage |
06/09/2014 |
06/06/2014 |
$0.05573 |
$0.072 |
The funds hereby designate as capital gain dividend the amounts noted below for the taxable year ended April 30, 2014, or, if subsequently determined to be different, the net capital gain of such year.
|
Spartan Mid Cap Index Fund |
$2,025,101 |
|
Spartan Small Cap Index Fund |
$3,982,085 |
A percentage of the dividends distributed during the fiscal year for the following funds qualify for the dividends-received deduction for corporate shareholders:
|
|
June 2013 |
December 2013 |
|
Spartan Mid Cap Index Fund |
|
|
|
Institutional Class |
62% |
62% |
|
Fidelity Advantage Institutional Class |
60% |
61% |
|
Spartan Small Cap Index Fund |
|
|
|
Institutional Class |
24% |
41% |
|
Fidelity Advantage Institutional Class |
24% |
41% |
A percentage of the dividends distributed during the fiscal year for the following funds may be taken into account as a dividend for purposes of the maximum rate under section 1(h)(11) of the Internal Revenue Code.
|
Spartan Mid Cap Index Fund |
June 2013 |
December 2013 |
|
Institutional Class |
67% |
66% |
|
Fidelity Advantage Institutional Class |
65% |
66% |
|
Spartan Small Cap Index Fund |
|
|
|
Institutional Class |
25% |
43% |
|
Fidelity Advantage Institutional Class |
25% |
43% |
The fund will notify shareholders in January 2015 of amounts for use in preparing 2014 income tax returns.
Annual Report
Investment Adviser
Fidelity Management & Research
Company
Boston, MA
Investment Sub-Advisers
FMR Co., Inc.
Geode Capital Management, LLC
General Distributor
Fidelity Distributors Corporation
Smithfield, RI
Transfer and Service Agents
Fidelity Investments Institutional
Operations Company, Inc.
Boston, MA
Fidelity Service Company, Inc.
Boston, MA
Custodian
State Street Bank and Trust Company
Boston, MA
(Fidelity Investment logo)(registered trademark)
Corporate Headquarters
245 Summer St., Boston, MA 02210
www.fidelity.com
MCX-I-SCX-I-UANN-0614
1.929319.102
Item 2. Code of Ethics
As of the end of the period, April 30, 2014, Fidelity Salem Street Trust (the trust) has adopted a code of ethics, as defined in Item 2 of Form N-CSR, that applies to its President and Treasurer and its Chief Financial Officer. A copy of the code of ethics is filed as an exhibit to this Form N-CSR.
Item 3. Audit Committee Financial Expert
The Board of Trustees of the trust has determined that James H. Keyes is an audit committee financial expert, as defined in Item 3 of Form N-CSR. Mr. Keyes is independent for purposes of Item 3 of Form N-CSR.
Item 4. Principal Accountant Fees and Services
Fees and Services
The following table presents fees billed by Deloitte & Touche LLP, the member firms of Deloitte Touche Tohmatsu, and their respective affiliates (collectively, "Deloitte Entities") in each of the last two fiscal years for services rendered to Spartan Mid Cap Index Fund and Spartan Small Cap Index Fund (the "Funds"):
Services Billed by Deloitte Entities
April 30, 2014 FeesA
|
|
Audit Fees |
Audit-Related Fees |
Tax Fees |
All Other Fees |
|
Spartan Mid Cap Index Fund |
$41,000 |
$- |
$4,700 |
$600 |
|
Spartan Small Cap Index Fund |
$45,000 |
$- |
$4,700 |
$700 |
April 30, 2013 FeesA
|
|
Audit Fees |
Audit-Related Fees |
Tax Fees |
All Other Fees |
|
Spartan Mid Cap Index Fund |
$41,000 |
$- |
$4,700 |
$400 |
|
Spartan Small Cap Index Fund |
$46,000 |
$- |
$4,700 |
$400 |
A Amounts may reflect rounding.
The following table presents fees billed by Deloitte Entities that were required to be approved by the Audit Committee for services that relate directly to the operations and financial reporting of the Funds and that are rendered on behalf of Fidelity Management & Research Company ("FMR") and entities controlling, controlled by, or under common control with FMR (not including any sub-adviser whose role is primarily portfolio management and is subcontracted with or overseen by another investment adviser) that provide ongoing services to the Funds ("Fund Service Providers"):
Services Billed by Deloitte Entities
|
|
April 30, 2014A |
April 30, 2013A
|
|
Audit-Related Fees |
$765,000 |
$910,000 |
|
Tax Fees |
$- |
$- |
|
All Other Fees |
$695,000 |
$1,270,000 |
A Amounts may reflect rounding.
"Audit-Related Fees" represent fees billed for assurance and related services that are reasonably related to the performance of the fund audit or the review of the fund's financial statements and that are not reported under Audit Fees.
"Tax Fees" represent fees billed for tax compliance, tax advice or tax planning that relate directly to the operations and financial reporting of the fund.
"All Other Fees" represent fees billed for services provided to the fund or Fund Service Provider, a significant portion of which are assurance related, that relate directly to the operations and financial reporting of the fund, excluding those services that are reported under Audit Fees, Audit-Related Fees or Tax Fees.
Assurance services must be performed by an independent public accountant.
* * *
The aggregate non-audit fees billed by Deloitte Entities for services rendered to the Funds, FMR (not including any sub-adviser whose role is primarily portfolio management and is subcontracted with or overseen by another investment adviser), and any Fund Service Provider for each of the last two fiscal years of the Funds are as follows:
|
Billed By |
April 30, 2014 A |
April 30, 2013 A |
|
Deloitte Entities |
$1,585,000 |
$2,280,000 |
A Amounts may reflect rounding.
The trust's Audit Committee has considered non-audit services that were not pre-approved that were provided by Deloitte Entities to Fund Service Providers to be compatible with maintaining the independence of Deloitte Entities in their audits of the Funds, taking into account representations from Deloitte Entities, in accordance with Public Company Accounting Oversight Board rules, regarding their independence from the Funds and their related entities and FMR's review of the appropriateness and permissibility under applicable law of such non-audit services prior to their provision to the Fund Service Providers.
Audit Committee Pre-Approval Policies and Procedures
The trust's Audit Committee must pre-approve all audit and non-audit services provided by a fund's independent registered public accounting firm relating to the operations or financial reporting of the fund. Prior to the commencement of any audit or non-audit services to a fund, the Audit Committee reviews the services to determine whether they are appropriate and permissible under applicable law.
The Audit Committee has adopted policies and procedures to, among other purposes, provide a framework for the Committee's consideration of non-audit services by the audit firms that audit the Fidelity funds. The policies and procedures require that any non-audit service provided by a fund audit firm to a Fidelity fund and any non-audit service provided by a fund auditor to a Fund Service Provider that relates directly to the operations and financial reporting of a Fidelity fund ("Covered Service") are subject to approval by the Audit Committee before such service is provided.
All Covered Services must be approved in advance of provision of the service either: (i) by formal resolution of the Audit Committee, or (ii) by oral or written approval of the service by the Chair of the Audit Committee (or if the Chair is unavailable, such other member of the Audit Committee as may be designated by the Chair to act in the Chair's absence). The approval contemplated by (ii) above is permitted where the Treasurer determines that action on such an engagement is necessary before the next meeting of the Audit Committee.
Non-audit services provided by a fund audit firm to a Fund Service Provider that do not relate directly to the operations and financial reporting of a Fidelity fund are reported to the Audit Committee on a periodic basis.
Non-Audit Services Approved Pursuant to Rule 2-01(c)(7)(i)(C) and (ii) of Regulation S-X ("De Minimis Exception")
There were no non-audit services approved or required to be approved by the Audit Committee pursuant to the De Minimis Exception during the Funds' last two fiscal years relating to services provided to (i) the Funds or (ii) any Fund Service Provider that relate directly to the operations and financial reporting of the Funds.
Item 5. Audit Committee of Listed Registrants
Not applicable.
Item 6. Investments
(a) Not applicable.
(b) Not applicable
Item 7. Disclosure of Proxy Voting Policies and Procedures for Closed-End Management Investment Companies
Not applicable.
Item 8. Portfolio Managers of Closed-End Management Investment Companies
Not applicable.
Item 9. Purchase of Equity Securities by Closed-End Management Investment Company and Affiliated Purchasers
Not applicable.
Item 10. Submission of Matters to a Vote of Security Holders
There were no material changes to the procedures by which shareholders may recommend nominees to the trust's Board of Trustees.
Item 11. Controls and Procedures
(a)(i) The President and Treasurer and the Chief Financial Officer have concluded that the trust's disclosure controls and procedures (as defined in Rule 30a-3(c) under the Investment Company Act) provide reasonable assurances that material information relating to the trust is made known to them by the appropriate persons, based on their evaluation of these controls and procedures as of a date within 90 days of the filing date of this report.
(a)(ii) There was no change in the trust's internal control over financial reporting (as defined in Rule 30a-3(d) under the Investment Company Act) that occurred during the second fiscal quarter of the period covered by this report that has materially affected, or is reasonably likely to materially affect, the trust's internal control over financial reporting.
Item 12. Exhibits
|
(a) |
(1) |
Code of Ethics pursuant to Item 2 of Form N-CSR is filed and attached hereto as EX-99.CODE ETH. |
|
(a) |
(2) |
Certification pursuant to Rule 30a-2(a) under the Investment Company Act of 1940 (17 CFR 270.30a-2(a)) is filed and attached hereto as Exhibit 99.CERT. |
|
(a) |
(3) |
Not applicable. |
|
(b) |
|
Certification pursuant to Rule 30a-2(b) under the Investment Company Act of 1940 (17 CFR 270.30a-2(b)) is furnished and attached hereto as Exhibit 99.906CERT. |
SIGNATURES
Pursuant to the requirements of the Securities Exchange Act of 1934 and the Investment Company Act of 1940, the registrant has duly caused this report to be signed on its behalf by the undersigned, thereunto duly authorized.
Fidelity Salem Street Trust
|
By: |
/s/Stephanie J. Dorsey |
|
|
Stephanie J. Dorsey |
|
|
President and Treasurer |
|
|
|
|
Date: |
June 26, 2014 |
Pursuant to the requirements of the Securities Exchange Act of 1934 and the Investment Company Act of 1940, this report has been signed below by the following persons on behalf of the registrant and in the capacities and on the dates indicated.
|
By: |
/s/Stephanie J. Dorsey |
|
|
Stephanie J. Dorsey |
|
|
President and Treasurer |
|
|
|
|
Date: |
June 26, 2014 |
|
By: |
/s/Christine Reynolds |
|
|
Christine Reynolds |
|
|
Chief Financial Officer |
|
|
|
|
Date: |
June 26, 2014 |