UNITED STATES
SECURITIES AND EXCHANGE COMMISSION
WASHINGTON, D.C. 20549
FORM 10-K
|
[X]
|
ANNUAL REPORT PURSUANT TO SECTION 13 OR 15(d) OF THE SECURITIES EXCHANGE ACT OF 1934 (NO FEE REQUIRED)
|
|
For the fiscal year ended December 31, 2018
|
|
|
Or
|
|
|
[ ]
|
TRANSITION REPORT PURSUANT TO SECTION 13 OR 15(d) OF THE SECURITIES EXCHANGE ACT OF 1934 (NO FEE REQUIRED)
|
|
For the transition period from _____________ to _____________
|
Commission file number 0-11129
COMMUNITY TRUST BANCORP, INC.
(Exact Name of Registrant as Specified in its Charter)
|
Kentucky
|
61-0979818
|
|
(State or Other Jurisdiction of Incorporation or Organization)
|
(IRS Employer Identification No.)
|
|
346 North Mayo Trail
Pikeville, Kentucky
(Address of Principal Executive Offices)
|
41501
(Zip Code)
|
(606) 432-1414
(Registrant’s Telephone Number)
Securities registered pursuant to Section 12(b) of the Act:
|
Common Stock, $5.00 par value
|
The NASDAQ Stock Market LLC
|
|
(Title of Class)
|
(Name of Exchange on Which Registered)
|
Securities registered pursuant to Section 12(g) of the Act:
None
Indicate by check mark if the registrant is a well-known seasoned issuer, as defined in Rule 405 of the
Securities Act.
|
Yes ✓
|
No
|
Indicate by check mark if the registrant is not required to file reports pursuant to Section 13 or Section
15(d) of the Act.
|
Yes
|
No ✓
|
Indicate by check mark whether the registrant (1) has filed all reports required to be filed by Section 13 or
15(d) of the Securities Exchange Act of 1934 during the preceding 12 months (or for such shorter period that the registrant was required to file such reports) and (2) has been subject to such filing requirements for the past 90 days.
|
Yes ✓
|
No
|
Indicate by check mark whether the registrant has submitted electronically every interactive data file
required to be submitted pursuant to Rule 405 of Regulation S-T during the preceding 12 months (or for such shorter period that the registrant was required to submit such files.)
|
Yes ✓
|
No
|
Indicate by check mark if disclosure of delinquent filers pursuant to Item 405 of Regulation S-K is not
contained herein, and will not be contained, to the best of registrant’s knowledge, in definitive proxy or information statements incorporated by reference in Part III of this Form 10-K or any amendment to this Form 10-K. [ ]
Indicate by check mark whether the registrant is a large accelerated filer, an accelerated filer, a
non-accelerated filer, a smaller reporting company, or an emerging growth company. See definition of “large accelerated filer,” “accelerated filer,” “smaller reporting company,” and “emerging growth company” in Rule 12b-2 of the Exchange Act.
|
Large accelerated filer ✓
|
Accelerated filer ☐
|
Non-accelerated filer ☐
|
|
(Do not check if a smaller reporting company)
|
||
|
Smaller reporting company ☐
|
Emerging growth company ☐
|
If an emerging growth company, indicate by check mark if the
registrant has elected not to use the extended transition period for complying with any new or revised financial accounting standards provided pursuant to Section 13(a) of the Exchange Act.☐
Indicate by check mark whether the registrant is a shell company (as defined in Rule 12b-2 of the Exchange
Act).
|
Yes
|
No ✓
|
Based upon the closing price of the Common Shares of the Registrant on the NASDAQ-Stock Market LLC – Global
Select Market, the aggregate market value of voting stock held by non-affiliates of the Registrant as of June 30, 2018 was $842.4 million. For the purpose of the foregoing calculation only, all directors and executive officers of the Registrant have
been deemed affiliates. The number of shares outstanding of the Registrant’s Common Stock as of January 31, 2019 was 17,767,653.
DOCUMENTS INCORPORATED BY REFERENCE
Part III of this Form 10-K incorporates by reference certain information from Registrant’s Proxy Statement
for the Annual Meeting of Shareholders to be held on April 23, 2019.
TABLE OF CONTENTS
REGARDING FORWARD LOOKING STATEMENTS
Certain of the statements contained herein that are not historical facts are forward-looking statements
within the meaning of the Private Securities Litigation Reform Act. Community Trust Bancorp, Inc.’s (“CTBI”) actual results may differ materially from those included in the forward-looking statements. Forward-looking statements are typically
identified by words or phrases such as “believe,” “expect,” “anticipate,” “intend,” “estimate,” “may increase,” “may fluctuate,” and similar expressions or future or conditional verbs such as “will,” “should,” “would,” and “could.” These
forward-looking statements involve risks and uncertainties including, but not limited to, economic conditions, portfolio growth, the credit performance of the portfolios, including bankruptcies, and seasonal factors; changes in general economic
conditions including the performance of financial markets, prevailing inflation and interest rates, realized gains from sales of investments, gains from asset sales, and losses on commercial lending activities; results of various investment
activities; the effects of competitors’ pricing policies, changes in laws and regulations, competition, and demographic changes on target market populations’ savings and financial planning needs; industry changes in information technology systems on
which we are highly dependent; failure of acquisitions to produce revenue enhancements or cost savings at levels or within the time frames originally anticipated or unforeseen integration difficulties; and the resolution of legal proceedings and
related matters. In addition, the banking industry in general is subject to various monetary, operational, and fiscal policies and regulations, which include, but are not limited to, those determined by the Federal Reserve Board, the Federal Deposit
Insurance Corporation, the Consumer Financial Protection Bureau, and state regulators, whose policies, regulations, and enforcement actions could affect CTBI’s results. These statements are representative only on the date hereof, and CTBI undertakes
no obligation to update any forward-looking statements made.
Community Trust Bancorp, Inc. (“CTBI”) is a bank holding company registered with the Board of Governors of
the Federal Reserve System pursuant to Section 5(a) of the Bank Holding Company Act of 1956, as amended. CTBI was incorporated August 12, 1980, under the laws of the Commonwealth of Kentucky for the purpose of becoming a bank holding company.
Currently, CTBI owns all the capital stock of one commercial bank and one trust company, serving small and mid-sized communities in eastern, northeastern, central, and south central Kentucky, southern West Virginia, and northeastern Tennessee. The
commercial bank is Community Trust Bank, Inc., Pikeville, Kentucky (“CTB”) and the trust company is Community Trust and Investment Company, Lexington, Kentucky.
At December 31, 2018, CTBI had total consolidated assets of $4.2 billion and total consolidated deposits,
including repurchase agreements, of $3.5 billion. Total shareholders’ equity at December 31, 2018 was $564.2 million. Trust assets under management at December 31, 2018 were $2.0 billion, including CTB’s investment portfolio totaling $0.6 billion.
Through its subsidiaries, CTBI engages in a wide range of commercial and personal banking and trust and
wealth management activities, which include accepting time and demand deposits; making secured and unsecured loans to corporations, individuals and others; providing cash management services to corporate and individual customers; issuing letters of
credit; renting safe deposit boxes; and providing funds transfer services. The lending activities of CTB include making commercial, construction, mortgage, and personal loans. Lease-financing, lines of credit, revolving lines of credit, term loans,
and other specialized loans, including asset-based financing, are also available. Our corporate subsidiaries act as trustees of personal trusts, as executors of estates, as trustees for employee benefit trusts, as paying agents for bond and stock
issues, as investment agent, as depositories for securities, and as providers of full service brokerage and insurance services.
COMPETITION
CTBI’s subsidiaries face substantial competition for deposit, credit, trust, wealth management, and brokerage
relationships in the communities we serve. Competing providers include state banks, national banks, thrifts, trust companies, insurance companies, mortgage banking operations, credit unions, finance companies, brokerage companies, and other
financial and non-financial companies which may offer products functionally equivalent to those offered by our subsidiaries. As financial services become increasingly dependent on technology, permitting transactions to be conducted by telephone,
mobile banking, and the internet, non-bank institutions are able to attract funds and provide lending and other financial services without offices located in our market areas. Many of our nonbank competitors have fewer regulatory constraints,
broader geographic service areas, greater capital and, in some cases, lower cost structures. In addition, competition for quality customers has intensified as a result of changes in regulation, consolidation among financial service providers, and
advances in technology and product delivery systems. Many of these providers offer services within and outside the market areas served by our subsidiaries. We strive to offer competitively priced products along with quality customer service to
build customer relationships in the communities we serve.
The United States and global markets, as well as general economic conditions, have been volatile. Larger
financial institutions could strengthen their competitive position as a result of ongoing consolidation within the financial services industry.
Banking legislation in Kentucky places no limits on the number of banks or bank holding companies that a bank
holding company may acquire. Interstate acquisitions are allowed where reciprocity exists between the laws of Kentucky and the home state of the bank or bank holding company to be acquired. Bank holding companies continue to be limited to control
of less than 15% of deposits held by federally insured depository institutions in Kentucky (exclusive of inter-bank and foreign deposits). Competition for deposits may be increasing as a consequence of FDIC assessments shifting from deposits to an
asset based formula, as larger banks may move away from non-deposit funding sources.
No material portion of our business is seasonal. We are not dependent upon any one customer or a few
customers, and the loss of any one or a few customers would not have a material adverse effect on us. See note 19 to the consolidated financial statements for additional information regarding concentrations of credit.
We do not engage in any operations in foreign countries.
EMPLOYEES
As of December 31, 2018, CTBI and subsidiaries had 978 full-time equivalent employees. Our employees are
provided with a variety of employee benefits. A retirement plan, an employee stock ownership plan, group life insurance, major medical insurance, a cafeteria plan, and management and employee incentive compensation plans are available to all
eligible personnel.
SUPERVISION AND REGULATION
General
We, as a registered bank holding company, are restricted to those activities permissible under the Bank
Holding Company Act of 1956, as amended, and are subject to actions of the Board of Governors of the Federal Reserve System thereunder. We are required to file an annual report with the Federal Reserve Board and are subject to an annual examination
by the Board.
Community Trust Bank, Inc. is a state-chartered bank subject to state and federal banking laws and
regulations and periodic examination by the Kentucky Department of Financial Institutions and the restrictions, including dividend restrictions, thereunder. CTB is also a member of the Federal Reserve System and is subject to certain restrictions
imposed by and to examination and supervision under the Federal Reserve Act. Community Trust and Investment Company is also regulated by the Kentucky Department of Financial Institutions and the Federal Reserve.
Deposits of CTB are insured up to applicable limits by the Federal Deposit Insurance Corporation (FDIC),
which subjects banks to regulation and examination under the provisions of the Federal Deposit Insurance Act.
The operations of CTBI and our subsidiaries are also affected by other banking legislation and policies and
practices of various regulatory authorities. Such legislation and policies include statutory maximum rates on some loans, reserve requirements, domestic monetary and fiscal policy, and limitations on the kinds of services that may be offered.
CTBI’s annual reports on Form 10-K, quarterly reports on Form 10-Q, current reports on Form 8-K, and all
amendments to those reports are available free of charge on our website at www.ctbi.com as soon as reasonably practicable after such materials are electronically filed with
or furnished to the Securities and Exchange Commission. CTBI’s Code of Business Conduct and Ethics and other corporate governance documents are also available on our website. Copies of our annual report will be made available free of charge upon
written request to:
Community Trust Bancorp, Inc.
Jean R. Hale
Chairman, President and CEO
P.O. Box 2947
Pikeville, KY 41502-2947
The SEC maintains an internet site (http://www.sec.gov)
that contains reports, proxy and information statements, and other information regarding CTBI and other issuers that file electronically with the SEC.
Basel III
On July 2, 2013, the Federal Reserve approved final rules that substantially amended the regulatory
risk-based capital rules applicable to CTBI and CTB. The FDIC subsequently approved these rules. The final rules implemented the “Basel III” regulatory capital reforms and changes required by the Dodd-Frank Act.
The rules included new risk-based capital and leverage ratios, which were phased in from 2015 to January
2019, and refined the definition of what constitutes “capital” for purposes of calculating those ratios. The minimum capital level requirements applicable to CTBI and CTB under the final rules are: (i) a common equity Tier 1 capital ratio of 4.5%;
(ii) a Tier 1 capital ratio of 6%; (iii) a total capital ratio of 8%; and (iv) a Tier 1 leverage ratio of 4% for all institutions. The final rules also established a “capital conservation buffer” above the new regulatory minimum capital
requirements, which must consist entirely of common equity Tier 1 capital. The capital conservation buffer began to be phased in on January 1, 2016 at 0.625% of risk-weighted assets increased by 0.625% annually until fully implemented in January
2019. An institution is subject to limitations on certain activities including payment of dividends, share repurchases, and discretionary bonuses to executive officers if its capital level is below the total capital plus capital conservation buffer
amount.
The final rules also contain revisions to the prompt corrective action framework, which is designed to place
restrictions on insured depository institutions, including CTB, if their capital levels begin to show signs of weakness. These revisions took effect January 1, 2015. Under the prompt corrective action requirements, which are designed to complement
the capital conservation buffer, insured depository institutions are required to meet the following capital level requirements in order to qualify as “well capitalized:” (i) a common equity Tier 1 capital ratio of 6.5%; (ii) a Tier 1 capital ratio of
8%; (iii) a total capital ratio of 10%; and (iv) a Tier 1 leverage ratio of 5%. We currently satisfy the well-capitalized and the capital conservation standards, and based on our current capital composition and levels, we anticipate that our capital
ratios, on a Basel III basis, will continue to exceed the well-capitalized minimum capital requirements and capital conservation buffer standards.
As of December 31, 2018, CTBI had a common equity Tier 1 capital ratio of 16.27%, a Tier 1 capital ratio of
18.12%, a total capital ratio of 19.29%, and a Tier 1 leverage ratio of 13.51%. Our capital conservation buffer at December 31, 2018 was 11.29%.
In December 2017, the Basel Committee on Banking Supervision unveiled the latest round of its regulatory
framework, commonly referred to as Basel IV. The framework makes changes to the capital framework of Basel III and is targeted for a timeframe of 2022-2027 for implementation. The new framework appears designed to limit the flexibility of financial
institutions using advanced approaches to calculate credit and other risks and also makes significant amendments to the standardized approaches to credit risk, credit valuation adjustment risk, and operational risk. The manner and the form in which
the Basel IV framework will be implemented in the U.S. are uncertain.
An investment in our common stock is subject to risks inherent to our business. The material risks and
uncertainties that management believes affect us are described below. Before making an investment decision, you should carefully consider the risks and uncertainties described below, together with all of the other information included or
incorporated by reference herein. The risks and uncertainties described below are not the only ones facing us. Additional risks and uncertainties that management is not aware of or focused on or that management currently deems immaterial may also
impair our business operations. This report is qualified in its entirety by these risk factors. See also, “Cautionary Statement Regarding Forward-Looking Statements.” If any of the following risks actually occur, our financial condition and
results of operations could be materially and adversely affected. If this were to happen, the value of our common stock could decline significantly, and you could lose all or part of your investment.
Economic Risk
CTBI may continue to be adversely affected by economic and market conditions.
Beginning in 2008, the U.S. economy faced a severe economic crisis including a major recession from which
recovery was slow and uneven. Commerce and business growth in certain regions in the U.S. remains reduced and local governments and many businesses continue to experience financial difficulty. In some areas of the U.S., including certain parts of
our service area, unemployment levels remain elevated. There can be no assurance that these conditions will continue to improve and these conditions could worsen. In addition, the level of U.S. debt, the Federal Open Market Committee’s monetary
policy, potential volatility in oil prices, recent U.S. tax law modifications, and trade policies may have a destabilizing effect on financial markets or a negative effect on the economy.
Our financial performance generally, and in particular the ability of borrowers to pay interest on and repay
principal of outstanding loans and the value of collateral securing those loans, as well as demand for loans and other products and services we offer, is highly dependent upon the business environment in the markets where we operate, in the states of
Kentucky, West Virginia, and Tennessee and in the United States as a whole. While unemployment rates have improved in all of the markets in which we operate, unemployment rates in our markets remain high compared to the national average. A
favorable business environment is generally characterized by, among other factors, economic growth, efficient capital markets, low inflation, low unemployment, high business and investor confidence, and strong business earnings. Unfavorable or
uncertain economic and market conditions can be caused by declines in economic growth, business activity, or investor or business confidence; limitations on the availability or increases in the cost of credit and capital; increases in inflation or
interest rates; high unemployment; natural disasters; or a combination of these or other factors.
While economic conditions in the United States and worldwide have improved since the recession, there can be
no assurance that this improvement will continue or that another recession will not occur. Economic pressure on consumers and uncertainty regarding continuing economic improvement may result in changes in consumer and business spending, borrowing,
and savings habits. Such conditions could adversely affect the credit quality of our loans and our business, financial condition, and results of operations.
Economy of Our Markets
Our business may continue to be adversely affected by ongoing weaknesses in the local economies on which we
depend.
Our loan portfolio is concentrated primarily in eastern, northeastern, central, and south central Kentucky,
southern West Virginia, and northeastern Tennessee. Our profits depend on providing products and services to clients in these local regions. While unemployment rates have improved in all of the markets in which we operate, unemployment rates in our
markets remain high compared to the national average. Increases in unemployment, decreases in real estate values, or increases in interest rates could weaken the local economies in which we operate. These economic indicators typically affect
certain industries, such as real estate and financial services, more significantly. High levels of unemployment and depressed real estate asset values in certain of the markets we serve would likely prolong the economic recovery period in our market
area. Also, our growth within certain of our markets may be adversely affected by inconsistent access to high speed internet, and the lack of population and business growth in such markets in recent years. Weakness in our market area could depress
our earnings and consequently our financial condition because:
|
·
|
Clients may not want, need, or qualify for our products and services;
|
|
·
|
Borrowers may not be able to repay their loans;
|
|
·
|
The value of the collateral securing our loans to borrowers may decline; and
|
|
·
|
The quality of our loan portfolio may decline.
|
Interest Rate Risk
Changes in interest rates could adversely affect our earnings and financial condition.
Our earnings and financial condition are dependent to a large degree upon net interest income, which is the
difference between interest earned from loans and investments and interest paid on deposits and borrowings. The narrowing of interest-rate spreads, meaning the difference between the interest rates earned on loans and investments and the interest
rates paid on deposits and borrowings, could adversely affect our earnings and financial condition. Interest rates are highly sensitive to many factors, including:
|
·
|
The rate of inflation;
|
|
·
|
The rate of economic growth;
|
|
·
|
Employment levels;
|
|
·
|
Monetary policies; and
|
|
·
|
Instability in domestic and foreign financial markets.
|
Changes in market interest rates will also affect the level of voluntary prepayments on our loans and the
receipt of payments on our mortgage-backed securities resulting in the receipt of proceeds that may be reinvested at a lower rate than the loan or mortgage-backed security being prepaid.
We originate residential loans for sale and for our portfolio. The origination of loans for sale is designed
to meet client financing needs and earn fee income. The origination of loans for sale is highly dependent upon the local real estate market and the level and trend of interest rates. Increasing interest rates may reduce the origination of loans for
sale and consequently the fee income we earn. While our commercial banking, construction, and income property business lines remain a significant portion of our activities, high interest rates may reduce our mortgage-banking activities and thereby
our income. In contrast, decreasing interest rates have the effect of causing clients to refinance mortgage loans faster than anticipated. This causes the value of assets related to the servicing rights on loans sold to be lower than originally
anticipated. If this happens, we may need to write down our servicing assets faster, which would accelerate our expense and lower our earnings.
We consider interest rate risk one of our most significant market risks. Interest rate risk is the exposure
to adverse changes in net interest income due to changes in interest rates. Consistency of our net interest revenue is largely dependent upon the effective management of interest rate risk. We employ a variety of measurement techniques to identify
and manage our interest rate risk including the use of an earnings simulation model to analyze net interest income sensitivity to changing interest rates. The model is based on actual cash flows and repricing characteristics for on and off-balance
sheet instruments and incorporates market-based assumptions regarding the effect of changing interest rates on the prepayment rates of certain financial assets and liabilities. Assumptions based on the historical behavior of deposit rates and
balances in relation to changes in interest rates are also incorporated into the model. These assumptions are inherently uncertain, and as a result, the model cannot precisely measure net interest income or precisely predict the impact of
fluctuations in interest rates on net interest income. Actual results will differ from simulated results due to timing, magnitude, and frequency of interest rate changes as well as changes in market conditions and management strategies.
Liquidity Risk
CTBI is subject to liquidity risk.
CTBI requires liquidity to meet its deposit and debt obligations as they come due and to fund loan demands.
CTBI’s access to funding sources in amounts adequate to finance its activities or on terms that are acceptable to it could be impaired by factors that affect it specifically or the financial services industry or economy in general. Factors that
could reduce its access to liquidity sources include a downturn in the market, difficult credit markets, or adverse regulatory actions against CTBI. CTBI’s access to deposits may also be affected by the liquidity needs of its depositors. In
particular, a substantial majority of CTBI’s liabilities are demand, savings, interest checking, and money market deposits, which are payable on demand or upon several days’ notice, while by comparison, a substantial portion of its assets are loans,
which cannot be called or sold in the same time frame. To the extent that consumer confidence in other investment vehicles, such as the stock market, increases, customers may move funds from bank deposits and products into such other investment
vehicles. Although CTBI historically has been able to replace maturing deposits and advances as necessary, it might not be able to replace such funds in the future, especially if a large number of its depositors sought to withdraw their accounts,
regardless of the reason. As of December 31, 2018, we had wholesale brokered deposits outstanding of $42.3 million (less than 2% of total deposits) with a
weighted average maturity of 1.58 years. If CTBI ceases to be categorized as “well-capitalized” under banking regulations, it would be prohibited from accepting,
renewing, or rolling over brokered deposits without a regulatory waiver. The cost of funds associated with brokered deposits is generally higher than locally generated deposits and may be a less stable funding source. A failure to
maintain adequate liquidity could have a material adverse effect on our financial condition and results of operations.
Banking Reform
Our business may be adversely affected by “banking reform” legislation.
On July 2, 2013, the Federal Reserve approved final rules that substantially amended the regulatory
risk-based capital rules applicable to CTBI and CTB. The FDIC subsequently approved these rules. The final rules implemented the “Basel III” regulatory capital reforms and changes required by the Dodd-Frank Act.
The rules included new risk-based capital and leverage ratios, which were phased in from 2015 to January
2019, and refined the definition of what constitutes “capital” for purposes of calculating those ratios. The minimum capital level requirements applicable to CTBI and CTB under the final rules are: (i) a common equity Tier 1 capital ratio of 4.5%;
(ii) a Tier 1 capital ratio of 6%; (iii) a total capital ratio of 8%; and (iv) a Tier 1 leverage ratio of 4% for all institutions. The final rules also established a “capital conservation buffer” above the new regulatory minimum capital
requirements, which must consist entirely of common equity Tier 1 capital. The capital conservation buffer began to be phased in on January 1, 2016 at 0.625% of risk-weighted assets increased by 0.625% annually until fully implemented in January
2019. An institution is subject to limitations on certain activities including payment of dividends, share repurchases, and discretionary bonuses to executive officers if its capital level is below the total capital plus capital conservation buffer
amount.
The final rules also contain revisions to the prompt corrective action framework, which is designed to place
restrictions on insured depository institutions, including CTB, if their capital levels begin to show signs of weakness. These revisions took effect January 1, 2015. Under the prompt corrective action requirements, which are designed to complement
the capital conservation buffer, insured depository institutions are required to meet the following capital level requirements in order to qualify as “well capitalized:” (i) a common equity Tier 1 capital ratio of 6.5%; (ii) a Tier 1 capital ratio of
8%; (iii) a total capital ratio of 10%; and (iv) a Tier 1 leverage ratio of 5%.
In December 2017, the Basel Committee on Banking Supervision unveiled the latest round of its regulatory
framework, commonly referred to as Basel IV. The framework makes changes to the capital framework of Basel III and is targeted for a timeframe of 2022-2027 for implementation. The new framework appears designed to limit the flexibility of financial
institutions using advanced approaches to calculate credit and other risks and also makes significant amendments to the standardized approaches to credit risk, credit valuation adjustment risk, and operational risk. The manner and the form in which
the Basel IV framework will be implemented in the U.S. are uncertain.
Government Policies and Oversight
Our business may be adversely affected by legislation or changes in government policies and oversight.
The earnings of banks and bank holding companies such as ours are affected by the policies of regulatory
authorities, including the Federal Reserve Board, which regulates the money supply. Among the methods employed by the Federal Reserve Board are open market operations in U.S. Government securities, changes in the discount rate on member bank
borrowings, and changes in reserve requirements against member bank deposits. These methods are used in varying combinations to influence overall growth and distribution of bank loans, investments and deposits, and their use may also affect interest
rates charged on loans or paid on deposits. The monetary policies of the Federal Reserve Board have had a significant effect on the operating results of commercial and savings banks in the past and are expected to continue to do so in the future.
Many states and municipalities are experiencing financial stress. As a result, various levels of government
have sought to increase their tax revenues through increased tax levies, which could have an adverse impact on our results of operations.
In recent years, federal banking regulators have increased regulatory scrutiny, and additional limitations
(including those contained in the Dodd-Frank Act) on financial institutions have been proposed or adopted by regulators and by Congress. Moreover, banking regulatory agencies have increasingly over the last few years used authority under Section 5
of the Federal Trade Commission Act to take supervisory or enforcement action with respect to alleged unfair or deceptive acts or practices by banks to address practices that may not necessarily fall within the scope of a specific banking or consumer
finance law. The banking industry is highly regulated and changes in federal and state banking regulations as well as policies and administration guidelines may affect our practices, growth prospects, and earnings. In particular, there is no
assurance that governmental actions designed to stabilize the economy and banking system will not adversely affect the financial position or results of operations of CTBI.
From time to time, CTBI and/or its subsidiaries may be involved in information requests, reviews,
investigations, and proceedings (both formal and informal) by various governmental agencies and law enforcement authorities regarding our respective businesses. Any of these matters may result in material adverse consequences to CTBI and its
subsidiaries, including adverse judgements, findings, limitations on merger and acquisition activity, settlements, fines, penalties, orders, injunctions, and other actions. Such adverse consequences may be material to the financial position of CTBI
or its results of operations.
In particular, consumer products and services are subject to increasing regulatory oversight and scrutiny
with respect to compliance with consumer laws and regulations. We may face a greater number or wider scope of investigations, enforcement actions, and litigation in the future related to consumer practices. In addition, any required changes to our
business operations resulting from these developments could result in a significant loss of revenue, require remuneration to customers, trigger fines or penalties, limit the products or services we offer, require us to increase certain prices and
therefore reduce demand for our products, impose additional compliance costs on us, cause harm to our reputation, or otherwise adversely affect our consumer business. As previously disclosed in a Form 8-K dated July 25, 2018, CTB entered into a
consent order regarding two deposit add-on products.
The financial services industry has experienced leadership changes at federal banking agencies, which may
impact regulations and government policy applicable to us. For example, in 2017 and early 2018, Congress confirmed a new Chairman of the Federal Reserve and a new Vice Chairman for Supervision at the Federal Reserve. New appointments to the Board
of Governors of the Federal Reserve could affect monetary policy and interest rates. The President, certain members of Congress, and others in the President’s leadership group have advocated for significant reduction of financial services
regulation. Any regulatory relief is uncertain and, even if adopted, may not result in a meaningful reduction of our regulatory requirements and related costs.
Climate Change Risk
Our business may be adversely impacted by climate change initiatives and issues.
Climate change and other emissions-related laws, regulations, and agreements have been
proposed and, in some cases adopted, on the international, federal, state, and local levels. These final and proposed initiatives take the form of restrictions, caps, taxes, or other controls on emissions. Our markets include areas where the coal
industry was historically a significant part of the local economy. The importance of the coal industry to such areas has, however, continued to decline substantially and the economies of our markets have become more diversified. Nevertheless, to
the extent that existing or new climate change laws, regulations, or agreements further impact production, purchase, or use of coal, the economies of certain areas within our markets, the demand for financing, the value of collateral securing our
coal-related loans, and our financial condition and results of operations may be adversely affected.
We, like all businesses, as well as our market areas, borrowers, and customers, may be adversely impacted to
the extent that weather-related events cause damage or disruption to properties or businesses.
Credit Risk
Our earnings and reputation may be adversely affected if we fail to effectively manage our credit risk.
Originating and underwriting loans are integral to the success of our business. This business requires us to
take “credit risk,” which is the risk of losing principal and interest income because borrowers fail to repay loans. Collateral values and the ability of borrowers to repay their loans may be affected at any time by factors such as:
|
·
|
The length and severity of downturns in the local economies in which we operate or the national economy;
|
|
·
|
The length and severity of downturns in one or more of the business sectors in which our customers operate,
particularly the automobile, hotel/motel, coal, and residential development industries; or
|
|
·
|
A rapid increase in interest rates.
|
Our loan portfolio includes loans with a higher risk of loss.
We originate commercial real estate loans, construction and development loans, consumer loans, and
residential mortgage loans, primarily within our market area. Commercial real estate, commercial, and construction and development loans tend to involve larger loan balances to a single borrower or groups of related borrowers and are most
susceptible to a risk of loss during a downturn in the business cycle. These loans also have historically had a greater credit risk than other loans for the following reasons:
|
·
|
Commercial Real Estate
Loans. Repayment is dependent on income being generated in amounts sufficient to cover operating expenses and debt service. As of December 31, 2018, commercial real estate loans, including multi-family loans, comprised
approximately 39% of our total loan portfolio.
|
|
·
|
Other Commercial Loans. Repayment
is generally dependent upon the successful operation of the borrower’s business. In addition, the collateral securing the loans may depreciate over time, be difficult to appraise, be illiquid, or fluctuate in value based on the success of
the business. As of December 31, 2018, other commercial loans comprised approximately 12% of our total loan portfolio.
|
|
·
|
Construction and Development
Loans. The risk of loss is largely dependent on our initial estimate of whether the property’s value at completion equals or exceeds the cost of property construction and the availability of take-out financing. During the
construction phase, a number of factors can result in delays or cost overruns. If our estimate is inaccurate or if actual construction costs exceed estimates, the value of the property securing our loan may be insufficient to ensure full
repayment when completed through a permanent loan, sale of the property, or by seizure of collateral. As of December 31, 2018, construction and development loans comprised approximately 4% of our total loan portfolio.
|
Consumer loans may carry a higher degree of repayment risk than residential mortgage loans, particularly when
the consumer loan is unsecured. Repayment of a consumer loan typically depends on the borrower’s financial stability, and it is more likely to be affected adversely by job loss, illness, or personal bankruptcy. In addition, federal and state
bankruptcy, insolvency, and other laws may limit the amount we can recover when a consumer client defaults. As of December 31, 2018, consumer loans comprised approximately 21% of our total loan portfolio.
As of December 31, 2018, approximately 79% of our consumer loans and 17% of our total loan portfolio were
consumer indirect loans. Consumer indirect loans are fixed rate loans secured by new and used automobiles, trucks, vans, and recreational vehicles originated at selling dealerships which are purchased by us following our review and approval of such
loans. These loans generally have a greater risk of loss in the event of default than, for example, one-to-four family residential mortgage loans due to the rapid depreciation of vehicles securing the loans. We face the risk that the collateral for
a defaulted loan may not provide an adequate source of repayment of the outstanding loan balance. We also assume the risk that the dealership administering the lending process complies with applicable consumer protection law and regulations.
A significant part of our lending business is focused on small to medium-sized business which may be
impacted more severely during periods of economic weakness.
A significant portion of our commercial loan portfolio is tied to small to medium-sized businesses in our
markets. During periods of economic weakness, small to medium-sized businesses may be impacted more severely than larger businesses. As a result, the ability of smaller businesses to repay their loans may deteriorate, particularly if economic
challenges persist over a period of time, and such deterioration would adversely impact our results of operations and financial condition.
A large percentage of our loan portfolio is secured by real estate, in particular commercial real estate.
Weakness in the real estate market or other segments of our loan portfolio would lead to additional losses, which could have a material adverse effect on our business, financial condition, and results of operations.
As of December 31, 2018, approximately 67% of our loan portfolio was secured by real estate, 39% of which is
commercial real estate. High levels of commercial and consumer delinquencies or declines in real estate market values could require increased net charge-offs and increases in the allowance for loan and lease losses, which could have a material
adverse effect on our business, financial condition, and results of operations and prospects.
Our level of other real estate owned remains above our historical norm, primarily as a result of
foreclosures. To the extent that we continue to hold a higher level of other real estate owned, related real estate expense will likely remain high. In addition, our ability to hold foreclosed property is subject to time limitations under
applicable regulations.
During the economic downturn which began in 2008, we experienced an increase in nonperforming real estate
loans. As a result, we have experienced, and we continue to experience, an increased level of foreclosed properties. Foreclosed real estate expense consists of maintenance costs, taxes, valuation adjustments to appraisal values, and gains or losses
on disposition. The amount that we may realize after a default is dependent upon factors outside of our control, including but not limited to: (i) general and local economic conditions; (ii) neighborhood values; (iii) interest rates; (iv) real
estate tax rates; (v) operating expenses of the properties; (vi) environmental remediation liabilities; (vii) ability to obtain and maintain occupancy of the properties; (viii) zoning laws; (ix) governmental rules, regulations, and fiscal policies;
(x) potential vandalism; and (xi) acts of God. Expenditures associated with the ownership of real estate, such as real estate taxes, insurance, and maintenance costs, may adversely affect income from the real estate. The cost of operating real
property may exceed the income earned from the property, and we may need to advance funds in order to protect our investment in the property, or we may be required to dispose of the property at a loss. If our levels of other real estate owned increase or are sustained and local real estate values decline, our foreclosed real estate expense will increase, which would adversely impact our results of operations.
As of December 31, 2018, approximately 44% (based on book value) of our foreclosed properties had been held
by us for over five years. Regulatory approval is required and has been obtained to hold these properties beyond the initial period of five years. Additional approval may be required to continue to hold these properties should they not be
liquidated during the extension period, which is typically one year. While we have previously received regulatory approval to continue to hold foreclosed properties for over five years, to the extent such approval is not obtained in the future with
respect to a foreclosed property, we might be forced to liquidate such property at a price less than its appraised value. To the extent we are not able to sell a foreclosed property in 10 years, we will be required to relinquish ownership of that
property.
As of December 31, 2018, foreclosed property with a total book value of $2.4 million, representing 8.6% of
our foreclosed property (based on book value), had been held by us for at least nine years. As a result, we expect to sell these properties in 2019. While the book value of $2.4 million at December 31, 2018 is our best estimate of realizable value,
the actual amount realized may be substantially below book value, or properties may be relinquished for no consideration.
Environmental Liability Risk
We are subject to environmental liability risk associated with lending activity.
A significant portion of our loan portfolio is secured by real property. During the ordinary course of
business, we may foreclose on and take title to properties securing loans. In doing so, there is a risk that hazardous or toxic substances could be found on these properties. If hazardous or toxic substances are found, we may be liable for
remediation costs, as well as for personal injury and property damage. Environmental laws may require us to incur substantial expenses and may materially reduce the affected property’s value or limit our ability to use or sell the affected
property. In addition, future laws or more stringent interpretations or enforcement policies with respect to existing laws may increase our exposure to environmental liability. Although we have policies and procedures to perform an environmental
review before initiating any foreclosure action on real property, these reviews may not be sufficient to detect all potential environmental hazards. The remediation costs and any other financial liabilities associated with an environmental hazard
could have a material adverse effect on our financial condition and results of operations.
Competition
Strong competition within our market area may reduce our ability to attract and retain deposits and
originate loans.
We face competition both in originating loans and in attracting deposits. Competition in the financial
services industry is intense. We compete for clients by offering excellent service and competitive rates on our loans and deposit products. The type of institutions we compete with include commercial banks, savings institutions, mortgage banking
firms, credit unions, finance companies, mutual funds, insurance companies and brokerage and investment banking firms. Competition arises from institutions located within and outside our market areas. As financial services become increasingly
dependent on technology, permitting transactions to be conducted by telephone, mobile banking, and the internet, non-bank institutions are able to attract funds and provide lending and other financial services without offices located in our market
areas. As a result of their size and ability to achieve economies of scale, certain of our competitors offer a broader range of products and services than we offer. With the increased consolidation in the financial industry, larger financial
institutions may strengthen their competitive positions. In addition, to stay competitive in our markets we may need to adjust the interest rates on our products to match the rates offered by our competitors, which could adversely affect our net
interest margin. As a result, our profitability depends upon our continued ability to successfully compete in our market areas while achieving our investment objectives.
Technology and other changes are allowing consumers to complete financial transactions through alternative
methods to those which historically involved banks. For example, consumers can now hold funds that would have been held as bank deposits in mutual funds, brokerage accounts, general purpose reloadable prepaid cards, or cyber currency. In addition,
consumers can complete transactions, such as paying bills or transferring funds, directly without utilizing the services of a bank. The process of eliminating banks as intermediaries (known as disintermediation), could result in the loss of fee
income, as well as the loss of deposits and the income that might be generated from those deposits. The related revenue reduction could adversely affect our financial condition, cash flows, and results of operations.
Acquisition Risk
We may have difficulty in the future continuing to grow through acquisitions.
We may experience difficulty in making acquisitions on acceptable terms due to the decreasing number of
suitable acquisition targets, competition for attractive acquisitions, regulatory impediments, and certain limitations on interstate acquisitions.
Any future acquisitions or mergers by CTBI or its banking subsidiary are subject to approval by the
appropriate federal and state banking regulators. The banking regulators evaluate a number of criteria in making their approval decisions, such as:
|
·
|
Safety and soundness guidelines;
|
|
·
|
Compliance with all laws including the USA Patriot Act, the International Money Laundering Abatement and
Anti-Terrorist Financing Act, the Sarbanes-Oxley Act and the related rules and regulations promulgated under such Act or the Exchange Act, the Equal Credit Opportunity Act, the Fair Housing Act, the Community Reinvestment Act, the Home
Mortgage Disclosure Act, and all other applicable fair lending and consumer protection laws and other laws relating to discriminatory business practices; and
|
|
·
|
Anti-competitive concerns with the proposed transaction.
|
If the banking regulators or a commenter on our regulatory application raise concerns about any of these
criteria at the time a regulatory application is filed, the banking regulators may deny, delay, or condition their approval of a proposed transaction. A Federal Reserve investigation begun in 2014 resulted in a 2018 consent order related to two
deposit add-on products, which created impediments to CTBI’s merger and acquisition activity for an unspecified period of time.
We have grown, and, subject to regulatory approval, intend to continue to grow, through acquisitions of banks
and other financial institutions. After these acquisitions, we may experience adverse changes in results of operations of acquired entities, unforeseen liabilities, asset quality problems of acquired entities, loss of key personnel, loss of clients
because of change of identity, difficulties in integrating data processing and operational procedures, and deterioration in local economic conditions. These various acquisition risks can be heightened in larger transactions.
Integration Risk
We may not be able to achieve the expected integration and cost savings from our bank acquisition
activities.
We have a long history of acquiring financial institutions and, subject to regulatory approval, we expect
this acquisition activity to resume in the future. Difficulties may arise in the integration of the business and operations of the financial institutions that agree to merge with and into CTBI and, as a result, we may not be able to achieve the cost
savings and synergies that we expect will result from the merger activities. Achieving cost savings is dependent on consolidating certain operational and functional areas, eliminating duplicative positions and terminating certain agreements for
outside services. Additional operational savings are dependent upon the integration of the banking businesses of the acquired financial institution with that of CTBI, including the conversion of the acquired entity’s core operating systems, data
systems and products to those of CTBI and the standardization of business practices. Complications or difficulties in the conversion of the core operating systems, data systems, and products of these other banks to those of CTBI may result in the
loss of clients, damage to our reputation within the financial services industry, operational problems, one-time costs currently not anticipated by us, and/or reduced cost savings resulting from the merger activities.
Operational Risk
An extended disruption of vital infrastructure or a security breach could negatively impact our business,
results of operations, and financial condition.
Our operations depend upon, among other things, our infrastructure, including equipment and facilities.
Extended disruption of vital infrastructure by fire, power loss, natural disaster, telecommunications failure, computer hacking or viruses, terrorist activity or the domestic and foreign response to such activity, or other events outside of our
control could have a material adverse impact on the financial services industry as a whole and on our business, results of operations, cash flows, and financial condition in particular. Our business recovery plan may not work as intended or may not
prevent significant interruption of our operations. The occurrence of any failures, interruptions, or security breaches of our information systems could damage our reputation, result in the loss of customer business, subject us to additional
regulatory scrutiny, or expose us to civil litigation and possible financial liability, any of which could have an adverse effect on our financial condition and results of operation.
Our information technology systems and networks may experience interruptions, delays, or
cessations of service or produce errors due to regular maintenance efforts, such as systems integration or migration work that takes place from time to time. We may not be successful in implementing new systems and transitioning data, which could
cause business disruptions and be more expensive, time-consuming, disruptive, and resource intensive. Such disruptions could damage our reputation and otherwise adversely impact our business and results of operations.
Third party vendors provide key components of our business infrastructure, such as processing, internet
connections, and network access. While CTBI has selected these third party vendors carefully through its vendor management process, it does not control their actions and generally is not able to obtain satisfactory indemnification provisions in its
third party vendor written contracts. Any problems caused by third parties or arising from their services, such as disruption in service, negligence in the performance of services or a breach of customer data security with regard to the third
parties’ systems, could adversely affect our ability to deliver services, negatively impact our business reputation, cause a loss of customers, or result in increased expenses, regulatory fines and sanctions, or litigation.
Claims and litigation may arise pertaining to fiduciary responsibility.
Customers may, from time to time, make a claim and take legal action pertaining to our
performance of fiduciary responsibilities. Whether customer claims and legal action related to our performance of fiduciary responsibilities are founded or unfounded, if such claims and legal actions are not resolved in a manner favorable to us,
they may result in significant financial liability, adversely affect the market perception of us and our products and services, and impact customer demand for those products and services. Any such financial liability or reputational damage could
have an adverse effect on our business, financial condition, and results of operations.
Significant legal actions could subject us to uninsured liabilities.
From time to time, we may be subject to claims related to our operations. These claims and
legal actions, including supervisory actions by our regulators, could involve significant amounts. We maintain insurance coverage in amounts and with deductibles we believe are appropriate for our operations. However, our insurance coverage may not
cover all claims against us and related costs, and further insurance coverage may not continue to be available at a reasonable cost. As a result, CTBI could be exposed to uninsured liabilities, which could adversely affect CTBI’s business, financial
condition, or results of operations.
Market Risk
Community Trust Bancorp, Inc.’s stock price is volatile.
Our stock price has been volatile in the past, and several factors could cause the price to fluctuate
substantially in the future. These factors include:
|
·
|
Actual or anticipated variations in earnings;
|
|
·
|
Changes in analysts’ recommendations or projections;
|
|
·
|
CTBI’s announcements of developments related to our businesses;
|
|
·
|
Operating and stock performance of other companies deemed to be peers;
|
|
·
|
New technology used or services offered by traditional and non-traditional competitors;
|
|
·
|
News reports of trends, concerns, and other issues related to the financial services industry; and
|
|
·
|
Additional governmental policies and enforcement of current laws.
|
Our stock price may fluctuate significantly in the future, and these fluctuations may be unrelated to CTBI’s
performance. Although investor confidence in financial institutions has strengthened, the financial crisis adversely impacted investor confidence in the financial institutions sector. General market price declines or market volatility in the future
could adversely affect the price of our common stock, and the current market price may not be indicative of future market prices.
Technology Risk
CTBI continually encounters technological change.
The financial services industry is continually undergoing rapid technological change with frequent
introductions of new technology-driven products and services. The effective use of technology increases efficiency and enables financial institutions to better serve customers and to reduce costs. Our future success depends, in part, upon our
ability to address the needs of our customers by using technology to provide products and services that will satisfy customer demands, as well as to create additional efficiencies in our operations. Many of our competitors have substantially greater
resources to invest in technological improvements. We may not be able to effectively implement new technology-driven products and services or be successful in marketing these products and services to our customers. Failure to successfully keep pace
with technological change affecting the financial services industry could have a material adverse impact on our business and, in turn, our financial condition and results of operations.
Cyber Risk
A breach in the security of our systems could disrupt our business, result in the disclosure of confidential
information, damage our reputation, and create significant financial and legal exposure for us.
Our businesses are dependent on our ability and the ability of our third party service providers to process,
record, and monitor a large number of transactions. If the financial, accounting, data processing, or other operating systems and facilities fail to operate properly, become disabled, experience security breaches, or have other significant
shortcomings, our results of operations could be materially adversely affected.
Although we and our third party service providers devote significant resources to maintain and upgrade our
systems and processes that are designed to protect the security of computer systems, software, networks, and other technology assets and the confidentiality, integrity, and availability of information belonging to us and our customers, there is no
assurance that our security systems and those of our third party service providers will provide absolute security. Financial services institutions and companies engaged in data processing have reported breaches in the security of their websites or
other systems, some of which have involved sophisticated and targeted attacks intended to obtain unauthorized access to confidential information, destroy data, disable or degrade service, or sabotage systems, often through the introduction of
computer viruses or malware, cyber-attacks, and other means. Despite our efforts and those of our third party service providers to ensure the integrity of these systems, it is possible that we or our third party service providers may not be able to
anticipate or to implement effective preventive measures against all security breaches of these types, especially because techniques used change frequently or are not recognized until launched, and because security attacks can originate from a wide
variety of sources.
A successful breach of the security of our systems or those of our third party service providers could cause
serious negative consequences to us, including significant disruption of our operations, misappropriation of our confidential information or the confidential information of our customers, or damage to our computers or operating systems, and could
result in violations of applicable privacy and other laws, financial loss to us or to our customers, loss in confidence in our security measures, customer dissatisfaction, litigation exposure, and harm to our reputation, all of which could have a
material adverse effect on us. While we maintain insurance coverage that should, subject to policy terms and conditions, cover certain aspects of our cyber risks, this insurance coverage may be insufficient to cover all losses we could experience
resulting from a cyber security breach. Moreover, the cost of insurance sufficient to cover substantially all, or a reasonable portion, of losses related to cyber security breaches is expected to increase and such increases are likely to be
material.
Banking customers and employees have been, and will likely continue to be, targeted by
parties using fraudulent e-mails and other communications in attempts to misappropriate passwords, account information, or other personal information, or to introduce viruses or other malware to bank information systems or customers’ computers.
Though we endeavor to lessen the success of such threats through the use of authentication technology and employee education, such cyber attacks remain a serious issue. Publicity concerning security and cyber-related problems could inhibit the use
or growth of electronic or web-based applications as a means of conducting banking and other commercial transactions.
We could incur increased costs or reductions in revenue or suffer reputational damage in the event of misuse
of information.
Our operations rely on the secure processing, transmission and storage of confidential information in our
computer systems and networks regarding our customers and their accounts. To provide these products and services, we use information systems and infrastructure that we and third party service providers operate. As a financial institution, we also
are subject to and examined for compliance with an array of data protection laws, regulations, and guidance, as well as to our own internal privacy and information security policies and programs.
Information security risks for financial institutions like us have generally increased in recent years in
part because of the proliferation of new technologies, the use of the Internet and telecommunications technologies to conduct financial transactions, and the increased sophistication and activities of organized crime, hackers, and other external
parties. Our technologies and systems may become the target of cyber-attacks or other attacks that could result in the misuse or destruction of our or our customers’ confidential, proprietary, or other information or that could result in disruptions
to the business operations of us or our customers or other third parties. Also, our customers, in order to access some of our products and services, may use personal computers, smart mobile phones, tablet PCs, and other devices that are beyond our
controls and security systems. Further, a breach or attack affecting one of our third-party service providers or partners could impact us through no fault of our own. In addition, because the methods and techniques employed by perpetrators of fraud
and others to attack systems and applications change frequently and often are not fully recognized or understood until after they have been launched, we and our third-party service providers and partners may be unable to anticipate certain attack
methods in order to implement effective preventative measures.
While we have policies and procedures designed to prevent or limit the effect of the possible security breach
of our information systems, if unauthorized persons were somehow to get access to confidential or proprietary information in our possession or to our proprietary information, it could result in litigation and regulatory investigations, significant
legal and financial exposure, damage to our reputation, or a loss of confidence in the security of our systems that could materially adversely affect our business.
Counterparty Risk
The soundness of other financial institutions could adversely affect CTBI.
Our ability to engage in routine funding transactions could be adversely affected by the actions and
commercial soundness of other financial institutions. Financial services companies are interrelated as a result of trading, clearing, counterparty, or other relationships. We have exposure to many different industries and counterparties, and we
routinely execute transactions with counterparties in the financial services industry, including brokers and dealers, commercial banks, investment banks, mutual and hedge funds, and other institutional counterparties. As a result, defaults by, or
even rumors or questions about, one or more financial services companies, or the financial services industry generally, have led to market-wide liquidity problems and could lead to losses or defaults by us or by other institutions. Many of these
transactions expose us to credit risk in the event of default of our counterparty or client. In addition, our credit risk may be exacerbated when the collateral held by us cannot be realized or is liquidated at prices not sufficient to recover the
full amount of the loan due us. There is no assurance that any such losses would not materially and adversely affect our businesses, financial condition, or results of operations.
None.
The following tables set forth certain statistical information relating to CTBI and subsidiaries on a
consolidated basis and should be read together with our consolidated financial statements.
Consolidated Average Balance Sheets and
Taxable Equivalent Income/Expense and Yields/Rates
|
2018
|
2017
|
2016
|
||||||||||||||||||||||||||||||||||
|
(in thousands)
|
Average
Balances
|
Interest
|
Average
Rate
|
Average
Balances
|
Interest
|
Average
Rate
|
Average
Balances
|
Interest
|
Average
Rate
|
|||||||||||||||||||||||||||
|
Earning assets:
|
||||||||||||||||||||||||||||||||||||
|
Loans (1)(2)(3)
|
$
|
3,150,878
|
$
|
154,613
|
4.91
|
%
|
$
|
3,048,879
|
$
|
141,821
|
4.65
|
%
|
$
|
2,916,031
|
$
|
134,455
|
4.61
|
%
|
||||||||||||||||||
|
Loans held for sale
|
684
|
98
|
14.33
|
709
|
81
|
11.42
|
728
|
101
|
13.87
|
|||||||||||||||||||||||||||
|
Securities:
|
||||||||||||||||||||||||||||||||||||
|
U.S. Treasury and agencies
|
459,204
|
9,019
|
1.96
|
449,339
|
7,263
|
1.62
|
445,500
|
6,669
|
1.50
|
|||||||||||||||||||||||||||
|
Tax exempt state and political subdivisions (3)
|
102,396
|
3,539
|
3.46
|
110,393
|
4,632
|
4.20
|
99,086
|
4,182
|
4.22
|
|||||||||||||||||||||||||||
|
Other securities
|
29,299
|
996
|
3.40
|
49,981
|
1,452
|
2.91
|
53,492
|
1,596
|
2.98
|
|||||||||||||||||||||||||||
|
Federal Reserve Bank and Federal Home Loan Bank stock
|
21,264
|
1,303
|
6.13
|
22,814
|
1,189
|
5.21
|
22,814
|
1,011
|
4.43
|
|||||||||||||||||||||||||||
|
Federal funds sold
|
2,795
|
59
|
2.11
|
3,139
|
41
|
1.31
|
3,121
|
19
|
0.61
|
|||||||||||||||||||||||||||
|
Interest bearing deposits
|
138,794
|
2,567
|
1.85
|
103,066
|
1,084
|
1.05
|
108,546
|
538
|
0.50
|
|||||||||||||||||||||||||||
|
Other investments
|
6,432
|
88
|
1.37
|
8,961
|
107
|
1.19
|
1,550
|
17
|
1.10
|
|||||||||||||||||||||||||||
|
Investment in unconsolidated subsidiaries
|
1,850
|
70
|
3.78
|
1,847
|
52
|
2.82
|
1,846
|
43
|
2.33
|
|||||||||||||||||||||||||||
|
Total earning assets
|
3,913,596
|
$
|
172,352
|
4.40
|
%
|
3,799,128
|
$
|
157,722
|
4.15
|
%
|
3,652,714
|
$
|
148,631
|
4.07
|
%
|
|||||||||||||||||||||
|
Allowance for loan and lease losses
|
(35,711
|
)
|
(36,507
|
)
|
(36,681
|
)
|
||||||||||||||||||||||||||||||
|
3,877,885
|
3,762,621
|
3,616,033
|
||||||||||||||||||||||||||||||||||
|
Nonearning assets:
|
||||||||||||||||||||||||||||||||||||
|
Cash and due from banks
|
52,286
|
52,321
|
50,946
|
|||||||||||||||||||||||||||||||||
|
Premises and equipment, net
|
45,970
|
47,129
|
48,138
|
|||||||||||||||||||||||||||||||||
|
Other assets
|
211,256
|
206,899
|
205,140
|
|||||||||||||||||||||||||||||||||
|
Total assets
|
$
|
4,187,397
|
$
|
4,068,970
|
$
|
3,920,257
|
||||||||||||||||||||||||||||||
|
Interest bearing liabilities:
|
||||||||||||||||||||||||||||||||||||
|
Deposits:
|
||||||||||||||||||||||||||||||||||||
|
Savings and demand deposits
|
$
|
1,234,562
|
$
|
8,443
|
0.68
|
%
|
$
|
1,134,147
|
$
|
3,863
|
0.34
|
%
|
$
|
1,088,291
|
$
|
2,566
|
0.24
|
%
|
||||||||||||||||||
|
Time deposits
|
1,256,030
|
15,271
|
1.22
|
1,243,181
|
10,487
|
0.84
|
1,203,081
|
8,355
|
0.69
|
|||||||||||||||||||||||||||
|
Repurchase agreements and federal funds purchased
|
244,647
|
3,312
|
1.35
|
258,419
|
1,832
|
0.71
|
262,361
|
1,155
|
0.44
|
|||||||||||||||||||||||||||
|
Advances from Federal Home Loan Bank
|
1,512
|
27
|
1.79
|
38,287
|
427
|
1.12
|
14,410
|
62
|
0.43
|
|||||||||||||||||||||||||||
|
Long-term debt
|
59,341
|
2,242
|
3.78
|
60,042
|
1,685
|
2.81
|
61,341
|
1,417
|
2.31
|
|||||||||||||||||||||||||||
|
Total interest bearing liabilities
|
2,796,092
|
$
|
29,295
|
1.05
|
%
|
2,734,076
|
$
|
18,294
|
0.67
|
%
|
2,629,484
|
$
|
13,555
|
0.52
|
%
|
|||||||||||||||||||||
|
Noninterest bearing liabilities:
|
||||||||||||||||||||||||||||||||||||
|
Demand deposits
|
810,270
|
778,304
|
758,555
|
|||||||||||||||||||||||||||||||||
|
Other liabilities
|
34,394
|
37,823
|
37,820
|
|||||||||||||||||||||||||||||||||
|
Total liabilities
|
3,640,756
|
3,550,203
|
3,425,859
|
|||||||||||||||||||||||||||||||||
|
Shareholders’ equity
|
546,641
|
518,767
|
494,398
|
|||||||||||||||||||||||||||||||||
|
Total liabilities and shareholders’ equity
|
$
|
4,187,397
|
$
|
4,068,970
|
$
|
3,920,257
|
||||||||||||||||||||||||||||||
|
Net interest income, tax equivalent
|
$
|
143,057
|
$
|
139,428
|
$
|
135,076
|
||||||||||||||||||||||||||||||
|
Less tax equivalent interest income
|
902
|
2,026
|
2,055
|
|||||||||||||||||||||||||||||||||
|
Net interest income
|
$
|
142,155
|
$
|
137,402
|
$
|
133,021
|
||||||||||||||||||||||||||||||
|
Net interest spread
|
3.35
|
%
|
3.48
|
%
|
3.55
|
%
|
||||||||||||||||||||||||||||||
|
Benefit of interest free funding
|
0.31
|
0.19
|
0.15
|
|||||||||||||||||||||||||||||||||
|
Net interest margin
|
3.66
|
%
|
3.67
|
%
|
3.70
|
%
|
||||||||||||||||||||||||||||||
(1) Interest includes fees on loans of $1,762, $1,808, and $1,717 in 2018, 2017, and 2016, respectively.
(2) Loan balances include deferred loan origination costs and principal balances on nonaccrual loans.
(3) Tax exempt income on securities and loans is reported on a fully taxable equivalent basis using a 21% rate in 2018, and a 35%
rate in 2017 and 2016.
Net Interest Differential
The following table illustrates the approximate effect of volume and rate changes on net interest
differentials between 2018 and 2017 and also between 2017 and 2016.
|
Total Change
|
Change Due to
|
Total Change
|
Change Due to
|
|||||||||||||||||||||
|
(in thousands)
|
2018/2017
|
Volume
|
Rate
|
2017/2016
|
Volume
|
Rate
|
||||||||||||||||||
|
Interest income:
|
||||||||||||||||||||||||
|
Loans
|
$
|
12,792
|
$
|
4,843
|
$
|
7,949
|
$
|
7,366
|
$
|
6,171
|
$
|
1,195
|
||||||||||||
|
Loans held for sale
|
17
|
(3
|
)
|
20
|
(20
|
)
|
(3
|
)
|
(17
|
)
|
||||||||||||||
|
U.S. Treasury and agencies
|
1,756
|
163
|
1,593
|
594
|
58
|
536
|
||||||||||||||||||
|
Tax exempt state and political subdivisions
|
(1,093
|
)
|
(353
|
)
|
(740
|
)
|
450
|
475
|
(25
|
)
|
||||||||||||||
|
Other securities
|
(456
|
)
|
(528
|
)
|
72
|
(144
|
)
|
(107
|
)
|
(37
|
)
|
|||||||||||||
|
Federal Reserve Bank and Federal Home Loan Bank stock
|
114
|
(77
|
)
|
191
|
178
|
0
|
178
|
|||||||||||||||||
|
Federal funds sold
|
18
|
(4
|
)
|
22
|
22
|
0
|
22
|
|||||||||||||||||
|
Interest bearing deposits
|
1,483
|
465
|
1,018
|
546
|
(26
|
)
|
572
|
|||||||||||||||||
|
Other investments
|
(19
|
)
|
(27
|
)
|
8
|
90
|
88
|
2
|
||||||||||||||||
|
Investment in unconsolidated subsidiaries
|
18
|
0
|
18
|
9
|
0
|
9
|
||||||||||||||||||
|
Total interest income
|
14,630
|
4,479
|
10,151
|
9,091
|
6,656
|
2,435
|
||||||||||||||||||
|
Interest expense:
|
||||||||||||||||||||||||
|
Savings and demand deposits
|
4,580
|
370
|
4,210
|
1,297
|
112
|
1,185
|
||||||||||||||||||
|
Time deposits
|
4,784
|
109
|
4,675
|
2,132
|
287
|
1,845
|
||||||||||||||||||
|
Repurchase agreements and federal funds purchased
|
1,480
|
(93
|
)
|
1,573
|
677
|
(17
|
)
|
694
|
||||||||||||||||
|
Advances from Federal Home Loan Bank
|
(400
|
)
|
(258
|
)
|
(142
|
)
|
365
|
186
|
179
|
|||||||||||||||
|
Long-term debt
|
557
|
(19
|
)
|
576
|
268
|
(29
|
)
|
297
|
||||||||||||||||
|
Total interest expense
|
11,001
|
109
|
10,892
|
4,739
|
539
|
4,200
|
||||||||||||||||||
|
Net interest income
|
$
|
3,629
|
$
|
4,370
|
$
|
(741
|
)
|
$
|
4,352
|
$
|
6,117
|
$
|
(1,765
|
)
|
||||||||||
For purposes of the above table, changes which are due to both rate and volume are allocated based on a
percentage basis, using the absolute values of rate and volume variance as a basis for percentages. Income is stated at a fully taxable equivalent basis, using a 21% tax rate in 2018, and a 35% tax rate in 2017 and 2016.
Investment Portfolio
The maturity distribution and weighted average interest rates of debt securities at December 31, 2018 are as
follows:
Available-for-sale
|
Estimated Maturity at December 31, 2018
|
||||||||||||||||||||||||||||||||||||||||||||
|
Within 1 Year
|
1-5 Years
|
5-10 Years
|
After 10 Years
|
Total Fair Value
|
Amortized Cost
|
|||||||||||||||||||||||||||||||||||||||
|
(in thousands)
|
Amount
|
Yield
|
Amount
|
Yield
|
Amount
|
Yield
|
Amount
|
Yield
|
Amount
|
Yield
|
Amount
|
|||||||||||||||||||||||||||||||||
|
U.S. Treasury, government agencies, and government sponsored agency mortgage-backed
securities
|
$
|
61,726
|
2.05
|
%
|
$
|
107,269
|
1.96
|
%
|
$
|
86,257
|
3.38
|
%
|
$
|
213,505
|
3.00
|
%
|
$
|
468,757
|
2.71
|
%
|
$
|
475,327
|
||||||||||||||||||||||
|
State and political subdivisions
|
3,673
|
3.62
|
33,299
|
3.24
|
27,465
|
3.34
|
60,051
|
3.63
|
124,488
|
3.46
|
126,280
|
|||||||||||||||||||||||||||||||||
|
Other securities
|
0
|
0.00
|
0
|
0.00
|
0
|
0.00
|
501
|
3.18
|
501
|
3.18
|
507
|
|||||||||||||||||||||||||||||||||
|
Total
|
$
|
65,399
|
2.13
|
%
|
$
|
140,568
|
2.26
|
%
|
$
|
113,722
|
3.37
|
%
|
$
|
274,057
|
3.14
|
%
|
$
|
593,746
|
2.87
|
%
|
$
|
602,114
|
||||||||||||||||||||||
Held-to-maturity
|
Estimated Maturity at December 31, 2018
|
||||||||||||||||||||||||||||||||||||||||||||
|
Within 1 Year
|
1-5 Years
|
5-10 Years
|
After 10 Years
|
Total
Amortized Cost
|
Fair
Value
|
|||||||||||||||||||||||||||||||||||||||
|
(in thousands)
|
Amount
|
Yield
|
Amount
|
Yield
|
Amount
|
Yield
|
Amount
|
Yield
|
Amount
|
Yield
|
Amount
|
|||||||||||||||||||||||||||||||||
|
State and political subdivisions
|
$
|
0
|
0.00
|
%
|
$
|
649
|
3.64
|
%
|
$
|
0
|
0.00
|
%
|
$
|
0
|
0.00
|
%
|
$
|
649
|
3.64
|
%
|
$
|
649
|
||||||||||||||||||||||
|
Total
|
$
|
0
|
0.00
|
%
|
$
|
649
|
3.64
|
%
|
$
|
0
|
0.00
|
%
|
$
|
0
|
0.00
|
%
|
$
|
649
|
3.64
|
%
|
$
|
649
|
||||||||||||||||||||||
Total Debt Securities
|
Estimated Maturity at December 31, 2018
|
||||||||||||||||||||||||||||||||||||||||||||
|
Within 1 Year
|
1-5 Years
|
5-10 Years
|
After 10 Years
|
Total
Book Value
|
Fair
Value
|
|||||||||||||||||||||||||||||||||||||||
|
(in thousands)
|
Amount
|
Yield
|
Amount
|
Yield
|
Amount
|
Yield
|
Amount
|
Yield
|
Amount
|
Yield
|
Amount
|
|||||||||||||||||||||||||||||||||
|
Total
|
$
|
65,399
|
2.13
|
%
|
$
|
141,217
|
2.27
|
%
|
$
|
113,722
|
3.37
|
%
|
$
|
274,057
|
3.14
|
%
|
$
|
594,395
|
2.87
|
%
|
$
|
594,395
|
||||||||||||||||||||||
The calculations of the weighted average interest rates for each maturity category are based upon yield
weighted by the respective costs of the securities. The weighted average rates on state and political subdivisions are computed on a taxable equivalent basis using a 21% tax rate.
Excluding those holdings of the investment portfolio in U.S. Treasury securities, government agencies, and
government sponsored agency mortgage-backed securities, there were no securities of any one issuer that exceeded 10% of our shareholders’ equity at December 31, 2018.
The book values of securities available-for-sale and securities held-to-maturity as of December 31, 2018 and
2017 are presented in note 3 to the consolidated financial statements.
The book value of securities at December 31, 2016 is presented below:
|
(in thousands)
|
Available-for-Sale
|
Held-to-Maturity
|
||||||
|
U.S. Treasury and government agencies
|
$
|
223,014
|
$
|
0
|
||||
|
State and political subdivisions
|
133,351
|
866
|
||||||
|
U.S. government sponsored agency mortgage-backed securities
|
227,574
|
0
|
||||||
|
Total debt securities
|
583,939
|
866
|
||||||
|
CRA investment funds
|
25,000
|
0
|
||||||
|
Total securities
|
$
|
608,939
|
$
|
866
|
||||
Loan Portfolio
|
(in thousands)
|
2018
|
2017
|
2016
|
2015
|
2014
|
|||||||||||||||
|
Commercial:
|
||||||||||||||||||||
|
Construction
|
$
|
82,715
|
$
|
76,479
|
$
|
66,998
|
$
|
78,020
|
$
|
121,942
|
||||||||||
|
Secured by real estate
|
1,183,093
|
1,188,680
|
1,085,428
|
1,052,919
|
948,626
|
|||||||||||||||
|
Equipment lease financing
|
1,740
|
3,042
|
5,512
|
8,514
|
10,344
|
|||||||||||||||
|
Commercial other
|
377,198
|
351,034
|
350,159
|
358,898
|
352,048
|
|||||||||||||||
|
Total commercial
|
1,644,746
|
1,619,235
|
1,508,097
|
1,498,351
|
1,432,960
|
|||||||||||||||
|
Residential:
|
||||||||||||||||||||
|
Real estate construction
|
57,160
|
67,358
|
57,966
|
61,750
|
62,412
|
|||||||||||||||
|
Real estate mortgage
|
722,417
|
709,570
|
702,969
|
707,874
|
712,465
|
|||||||||||||||
|
Home equity
|
106,299
|
99,356
|
91,511
|
89,450
|
88,335
|
|||||||||||||||
|
Total residential
|
885,876
|
876,284
|
852,446
|
859,074
|
863,212
|
|||||||||||||||
|
Consumer:
|
||||||||||||||||||||
|
Consumer direct
|
144,289
|
137,754
|
133,093
|
126,406
|
122,136
|
|||||||||||||||
|
Consumer indirect
|
533,727
|
489,667
|
444,735
|
390,130
|
315,516
|
|||||||||||||||
|
Total consumer
|
678,016
|
627,421
|
577,828
|
516,536
|
437,652
|
|||||||||||||||
|
Total loans
|
$
|
3,208,638
|
$
|
3,122,940
|
$
|
2,938,371
|
$
|
2,873,961
|
$
|
2,733,824
|
||||||||||
|
Percent of total year-end loans
|
||||||||||||||||||||
|
Commercial:
|
||||||||||||||||||||
|
Construction
|
2.58
|
%
|
2.45
|
%
|
2.28
|
%
|
2.71
|
%
|
4.46
|
%
|
||||||||||
|
Secured by real estate
|
36.87
|
38.06
|
36.94
|
36.64
|
34.70
|
|||||||||||||||
|
Equipment lease financing
|
0.05
|
0.10
|
0.18
|
0.30
|
0.38
|
|||||||||||||||
|
Commercial other
|
11.76
|
11.24
|
11.92
|
12.49
|
12.88
|
|||||||||||||||
|
Total commercial
|
51.26
|
51.85
|
51.32
|
52.14
|
52.42
|
|||||||||||||||
|
Residential:
|
||||||||||||||||||||
|
Real estate construction
|
1.78
|
2.16
|
1.97
|
2.15
|
2.28
|
|||||||||||||||
|
Real estate mortgage
|
22.52
|
22.72
|
23.93
|
24.63
|
26.06
|
|||||||||||||||
|
Home equity
|
3.31
|
3.18
|
3.11
|
3.11
|
3.23
|
|||||||||||||||
|
Total residential
|
27.61
|
28.06
|
29.01
|
29.89
|
31.57
|
|||||||||||||||
|
Consumer:
|
||||||||||||||||||||
|
Consumer direct
|
4.50
|
4.41
|
4.53
|
4.40
|
4.47
|
|||||||||||||||
|
Consumer indirect
|
16.63
|
15.68
|
15.14
|
13.57
|
11.54
|
|||||||||||||||
|
Total consumer
|
21.13
|
20.09
|
19.67
|
17.97
|
16.01
|
|||||||||||||||
|
Total loans
|
100.00
|
%
|
100.00
|
%
|
100.00
|
%
|
100.00
|
%
|
100.00
|
%
|
||||||||||
The total loans above are net of deferred loan fees and costs.
The following table shows the amounts of loans (excluding residential mortgages of 1-4 family residences,
consumer loans and lease financing) which, based on the remaining scheduled repayments of principal are due in the periods indicated. Also, the amounts are classified according to sensitivity to changes in interest rates (fixed, variable).
|
Maturity at December 31, 2018
|
||||||||||||||||
|
(in thousands)
|
Within One Year
|
After One but Within Five Years
|
After Five Years
|
Total
|
||||||||||||
|
Commercial secured by real estate and commercial other
|
$
|
233,489
|
$
|
250,181
|
$
|
1,076,621
|
$
|
1,560,291
|
||||||||
|
Commercial and real estate construction
|
92,674
|
19,376
|
27,825
|
139,875
|
||||||||||||
|
$
|
326,163
|
$
|
269,557
|
$
|
1,104,446
|
$
|
1,700,166
|
|||||||||
|
Rate sensitivity:
|
||||||||||||||||
|
Fixed rate
|
$
|
78,004
|
$
|
67,569
|
$
|
32,263
|
$
|
177,836
|
||||||||
|
Adjustable rate
|
248,159
|
201,988
|
1,072,183
|
1,522,330
|
||||||||||||
|
$
|
326,163
|
$
|
269,557
|
$
|
1,104,446
|
$
|
1,700,166
|
|||||||||
Nonperforming Assets
|
(in thousands)
|
2018
|
2017
|
2016
|
2015
|
2014
|
|||||||||||||||
|
Nonaccrual loans
|
$
|
11,867
|
$
|
18,119
|
$
|
16,623
|
$
|
16,563
|
$
|
20,971
|
||||||||||
|
90 days or more past due and still accruing interest
|
10,198
|
10,176
|
10,847
|
12,046
|
17,985
|
|||||||||||||||
|
Total nonperforming loans
|
22,065
|
28,295
|
27,470
|
28,609
|
38,956
|
|||||||||||||||
|
Other repossessed assets
|
42
|
155
|
103
|
183
|
90
|
|||||||||||||||
|
Foreclosed properties
|
27,273
|
31,996
|
35,856
|
40,674
|
36,776
|
|||||||||||||||
|
Total nonperforming assets
|
$
|
49,380
|
$
|
60,446
|
$
|
63,429
|
$
|
69,466
|
$
|
75,822
|
||||||||||
|
Nonperforming assets to total loans and foreclosed properties
|
1.53
|
%
|
1.92
|
%
|
2.13
|
%
|
2.38
|
%
|
2.74
|
%
|
||||||||||
|
Allowance to nonperforming loans
|
162.73
|
%
|
127.76
|
%
|
130.81
|
%
|
126.16
|
%
|
88.43
|
%
|
||||||||||
Nonaccrual and Past Due Loans
|
(in thousands)
|
Nonaccrual loans
|
As a % of Loan Balances by Category
|
Accruing Loans Past Due 90 Days or More
|
As a % of Loan Balances by Category
|
Balances
|
|||||||||||||||
|
December 31, 2018
|
||||||||||||||||||||
|
Commercial construction
|
$
|
639
|
0.77
|
%
|
$
|
58
|
0.07
|
%
|
$
|
82,715
|
||||||||||
|
Commercial secured by real estate
|
4,537
|
0.38
|
4,632
|
0.39
|
1,183,093
|
|||||||||||||||
|
Equipment lease financing
|
0
|
0.00
|
0
|
0.00
|
1,740
|
|||||||||||||||
|
Commercial other
|
797
|
0.21
|
581
|
0.15
|
377,198
|
|||||||||||||||
|
Real estate construction
|
22
|
0.04
|
6
|
0.01
|
57,160
|
|||||||||||||||
|
Real estate mortgage
|
5,395
|
0.75
|
4,095
|
0.57
|
722,417
|
|||||||||||||||
|
Home equity
|
477
|
0.45
|
246
|
0.23
|
106,299
|
|||||||||||||||
|
Consumer direct
|
0
|
0.00
|
74
|
0.05
|
144,289
|
|||||||||||||||
|
Consumer indirect
|
0
|
0.00
|
506
|
0.09
|
533,727
|
|||||||||||||||
|
Total
|
$
|
11,867
|
0.37
|
%
|
$
|
10,198
|
0.32
|
%
|
$
|
3,208,638
|
||||||||||
|
December 31, 2017
|
||||||||||||||||||||
|
Commercial construction
|
$
|
1,207
|
1.58
|
%
|
$
|
31
|
0.04
|
%
|
$
|
76,479
|
||||||||||
|
Commercial secured by real estate
|
7,028
|
0.59
|
2,665
|
0.22
|
1,188,680
|
|||||||||||||||
|
Equipment lease financing
|
0
|
0.00
|
0
|
0.00
|
3,042
|
|||||||||||||||
|
Commercial other
|
934
|
0.27
|
87
|
0.02
|
351,034
|
|||||||||||||||
|
Real estate construction
|
318
|
0.47
|
223
|
0.33
|
67,358
|
|||||||||||||||
|
Real estate mortgage
|
8,243
|
1.16
|
6,293
|
0.89
|
709,570
|
|||||||||||||||
|
Home equity
|
389
|
0.39
|
167
|
0.17
|
99,356
|
|||||||||||||||
|
Consumer direct
|
0
|
0.00
|
62
|
0.05
|
137,754
|
|||||||||||||||
|
Consumer indirect
|
0
|
0.00
|
648
|
0.13
|
489,667
|
|||||||||||||||
|
Total
|
$
|
18,119
|
0.58
|
%
|
$
|
10,176
|
0.33
|
%
|
$
|
3,122,940
|
||||||||||
Discussion of the Nonaccrual Policy
The accrual of interest income on loans is discontinued when management believes, after considering economic
and business conditions, collateral value, and collection efforts, that the borrower’s financial condition is such that the collection of interest is doubtful. Cash payments received on nonaccrual loans generally are applied against principal, and
interest income is only recorded once principal recovery is reasonably assured. Any loans greater than 90 days past due must be well secured and in the process of collection to continue accruing interest. See note 1 for further discussion on our
nonaccrual policy.
Potential Problem Loans
Interest accrual is discontinued when we believe, after considering economic and business conditions,
collateral value, and collection efforts, that the borrower’s financial condition is such that collection of interest is doubtful.
Foreign Outstandings
None
Loan Concentrations
We had no concentration of loans exceeding 10% of total loans at December 31, 2018. See note 19 to the
consolidated financial statements for further information.
Analysis of the Allowance for Loan
and Lease Losses
|
(in thousands)
|
2018
|
2017
|
2016
|
2015
|
2014
|
|||||||||||||||
|
Allowance for loan and lease losses, beginning of year
|
$
|
36,151
|
$
|
35,933
|
$
|
36,094
|
$
|
34,447
|
$
|
34,008
|
||||||||||
|
Loans charged off:
|
||||||||||||||||||||
|
Commercial construction
|
0
|
(10
|
)
|
(316
|
)
|
(3
|
)
|
(15
|
)
|
|||||||||||
|
Commercial secured by real estate
|
(988
|
)
|
(2,038
|
)
|
(1,641
|
)
|
(1,379
|
)
|
(2,163
|
)
|
||||||||||
|
Commercial other
|
(1,513
|
)
|
(1,893
|
)
|
(2,136
|
)
|
(1,961
|
)
|
(3,141
|
)
|
||||||||||
|
Real estate construction
|
(33
|
)
|
0
|
(192
|
)
|
(135
|
)
|
(123
|
)
|
|||||||||||
|
Real estate mortgage
|
(1,004
|
)
|
(615
|
)
|
(1,043
|
)
|
(1,421
|
)
|
(1,058
|
)
|
||||||||||
|
Home equity
|
(69
|
)
|
(178
|
)
|
(54
|
)
|
(129
|
)
|
(115
|
)
|
||||||||||
|
Consumer direct
|
(997
|
)
|
(965
|
)
|
(1,236
|
)
|
(1,306
|
)
|
(1,326
|
)
|
||||||||||
|
Consumer indirect
|
(6,394
|
)
|
(5,386
|
)
|
(5,050
|
)
|
(3,536
|
)
|
(3,495
|
)
|
||||||||||
|
Total charge-offs
|
(10,998
|
)
|
(11,085
|
)
|
(11,668
|
)
|
(9,870
|
)
|
(11,436
|
)
|
||||||||||
|
Recoveries of loans previously charged off:
|
||||||||||||||||||||
|
Commercial construction
|
61
|
49
|
36
|
13
|
28
|
|||||||||||||||
|
Commercial secured by real estate
|
224
|
75
|
178
|
60
|
305
|
|||||||||||||||
|
Commercial other
|
643
|
532
|
439
|
585
|
621
|
|||||||||||||||
|
Real estate construction
|
0
|
0
|
7
|
4
|
2
|
|||||||||||||||
|
Real estate mortgage
|
85
|
87
|
101
|
117
|
40
|
|||||||||||||||
|
Home equity
|
14
|
4
|
9
|
54
|
5
|
|||||||||||||||
|
Consumer direct
|
445
|
525
|
615
|
435
|
566
|
|||||||||||||||
|
Consumer indirect
|
3,116
|
2,510
|
2,250
|
1,599
|
1,553
|
|||||||||||||||
|
Total recoveries
|
4,588
|
3,782
|
3,635
|
2,867
|
3,120
|
|||||||||||||||
|
Net charge-offs:
|
||||||||||||||||||||
|
Commercial construction
|
61
|
39
|
(280
|
)
|
10
|
13
|
||||||||||||||
|
Commercial secured by real estate
|
(764
|
)
|
(1,963
|
)
|
(1,463
|
)
|
(1,319
|
)
|
(1,858
|
)
|
||||||||||
|
Commercial other
|
(870
|
)
|
(1,361
|
)
|
(1,697
|
)
|
(1,376
|
)
|
(2,520
|
)
|
||||||||||
|
Real estate construction
|
(33
|
)
|
0
|
(185
|
)
|
(131
|
)
|
(121
|
)
|
|||||||||||
|
Real estate mortgage
|
(919
|
)
|
(528
|
)
|
(942
|
)
|
(1,304
|
)
|
(1,018
|
)
|
||||||||||
|
Home equity
|
(55
|
)
|
(174
|
)
|
(45
|
)
|
(75
|
)
|
(110
|
)
|
||||||||||
|
Consumer direct
|
(552
|
)
|
(440
|
)
|
(621
|
)
|
(871
|
)
|
(760
|
)
|
||||||||||
|
Consumer indirect
|
(3,278
|
)
|
(2,876
|
)
|
(2,800
|
)
|
(1,937
|
)
|
(1,942
|
)
|
||||||||||
|
Total net charge-offs
|
(6,410
|
)
|
(7,303
|
)
|
(8,033
|
)
|
(7,003
|
)
|
(8,316
|
)
|
||||||||||
|
Provisions charged against operations
|
6,167
|
7,521
|
7,872
|
8,650
|
8,755
|
|||||||||||||||
|
Balance, end of year
|
$
|
35,908
|
$
|
36,151
|
$
|
35,933
|
$
|
36,094
|
$
|
34,447
|
||||||||||
|
Allocation of allowance, end of year:
|
||||||||||||||||||||
|
Commercial construction
|
$
|
862
|
$
|
686
|
$
|
884
|
$
|
2,199
|
$
|
2,896
|
||||||||||
|
Commercial secured by real estate
|
14,531
|
14,509
|
14,191
|
14,434
|
13,618
|
|||||||||||||||
|
Equipment lease financing
|
12
|
18
|
42
|
79
|
119
|
|||||||||||||||
|
Commercial other
|
4,993
|
5,039
|
4,656
|
4,225
|
4,263
|
|||||||||||||||
|
Real estate construction
|
512
|
660
|
629
|
550
|
534
|
|||||||||||||||
|
Real estate mortgage
|
4,433
|
5,688
|
6,027
|
6,678
|
6,094
|
|||||||||||||||
|
Home equity
|
841
|
857
|
774
|
839
|
756
|
|||||||||||||||
|
Consumer direct
|
1,883
|
1,863
|
1,885
|
1,594
|
1,574
|
|||||||||||||||
|
Consumer indirect
|
7,841
|
6,831
|
6,845
|
5,496
|
4,593
|
|||||||||||||||
|
Balance, end of year
|
$
|
35,908
|
$
|
36,151
|
$
|
35,933
|
$
|
36,094
|
$
|
34,447
|
||||||||||
|
Average loans outstanding, net of deferred loan costs and fees
|
$
|
3,150,878
|
$
|
3,048,879
|
$
|
2,916,031
|
$
|
2,791,871
|
$
|
2,642,231
|
||||||||||
|
Loans outstanding at end of year, net of deferred loan costs and fees
|
$
|
3,208,638
|
$
|
3,122,940
|
$
|
2,938,371
|
$
|
2,873,961
|
$
|
2,733,824
|
||||||||||
|
Net charge-offs to average loan type:
|
||||||||||||||||||||
|
Commercial construction
|
(0.08
|
)%
|
(0.05
|
)%
|
0.40
|
%
|
(0.01
|
)%
|
(0.01
|
)%
|
||||||||||
|
Commercial secured by real estate
|
0.06
|
0.17
|
0.14
|
0.13
|
0.21
|
|||||||||||||||
|
Commercial other
|
0.25
|
0.39
|
0.47
|
0.39
|
0.70
|
|||||||||||||||
|
Real estate construction
|
0.05
|
0.00
|
0.32
|
0.21
|
0.20
|
|||||||||||||||
|
Real estate mortgage
|
0.13
|
0.07
|
0.13
|
0.18
|
0.15
|
|||||||||||||||
|
Home equity
|
0.05
|
0.18
|
0.05
|
0.08
|
0.13
|
|||||||||||||||
|
Consumer direct
|
0.39
|
0.33
|
0.48
|
0.71
|
0.63
|
|||||||||||||||
|
Consumer indirect
|
0.64
|
0.61
|
0.67
|
0.55
|
0.67
|
|||||||||||||||
|
Total
|
0.20
|
%
|
0.24
|
%
|
0.28
|
%
|
0.25
|
%
|
0.31
|
%
|
||||||||||
|
Other ratios:
|
||||||||||||||||||||
|
Allowance to net loans, end of year
|
1.12
|
%
|
1.16
|
%
|
1.22
|
%
|
1.26
|
%
|
1.26
|
%
|
||||||||||
|
Provision for loan losses to average loans
|
0.20
|
%
|
0.25
|
%
|
0.27
|
%
|
0.31
|
%
|
0.33
|
%
|
||||||||||
The allowance for loan and lease losses balance is maintained at a level considered adequate to cover
anticipated probable losses based on past loss experience, general economic conditions, information about specific borrower situations including their financial position and collateral values, and other factors and estimates which are subject to
change over time. This analysis is completed quarterly and forms the basis for allocation of the loan loss reserve and what charges to the provision may be required. See notes 1, 4, and 7 to the consolidated financial statements for further
information.
Average Deposits and Other Borrowed
Funds
|
(in thousands)
|
2018
|
2017
|
2016
|
|||||||||
|
Deposits:
|
||||||||||||
|
Noninterest bearing deposits
|
$
|
810,270
|
$
|
778,304
|
$
|
758,555
|
||||||
|
NOW accounts
|
57,166
|
49,975
|
49,037
|
|||||||||
|
Money market accounts
|
755,970
|
668,609
|
640,297
|
|||||||||
|
Savings accounts
|
421,426
|
415,563
|
398,957
|
|||||||||
|
Certificates of deposit of $100,000 or more
|
669,386
|
628,165
|
578,669
|
|||||||||
|
Certificates of deposit < $100,000 and other time deposits
|
586,644
|
615,016
|
624,412
|
|||||||||
|
Total deposits
|
3,300,862
|
3,155,632
|
3,049,927
|
|||||||||
|
Other borrowed funds:
|
||||||||||||
|
Repurchase agreements and federal funds purchased
|
244,647
|
258,419
|
262,361
|
|||||||||
|
Advances from Federal Home Loan Bank
|
1,512
|
38,287
|
14,410
|
|||||||||
|
Long-term debt
|
59,341
|
60,042
|
61,341
|
|||||||||
|
Total other borrowed funds
|
305,500
|
356,748
|
338,112
|
|||||||||
|
Total deposits and other borrowed funds
|
$
|
3,606,362
|
$
|
3,512,380
|
$
|
3,388,039
|
||||||
The maximum balance for federal funds purchased and repurchase agreements at any month-end during 2018
occurred at June 30, 2018, with a month-end balance of $256.8 million. The maximum balance for federal funds purchased and repurchase agreements at any month-end during 2017 occurred at March 31, 2017, with a month-end balance of $268.9 million.
The maximum balance for federal funds purchased and repurchase agreements at any month-end during 2016 occurred at October 31, 2016, with a month-end balance of $269.3 million.
Maturities and/or repricing of time deposits of $100,000 or more outstanding at December 31, 2018 are summarized
as follows:
|
(in thousands)
|
Certificates of Deposit
|
Other Time Deposits
|
Total
|
|||||||||
|
Three months or less
|
$
|
95,613
|
$
|
7,133
|
$
|
102,746
|
||||||
|
Over three through six months
|
69,640
|
8,168
|
77,808
|
|||||||||
|
Over six through twelve months
|
244,631
|
13,652
|
258,283
|
|||||||||
|
Over twelve through sixty months
|
188,241
|
24,889
|
213,130
|
|||||||||
|
$
|
598,125
|
$
|
53,842
|
$
|
651,967
|
|||||||
Our main office, which is owned by Community Trust Bank, Inc., is located at 346 North Mayo Trail, Pikeville,
Kentucky 41501. Following is a schedule of properties owned and leased by CTBI and its subsidiaries as of December 31, 2018:
|
Location
|
Owned
|
Leased
|
Total
|
||
|
Banking locations:
|
|||||
|
Community Trust Bank, Inc.
|
|||||
|
*
|
Pikeville Market (lease land at 3 owned locations)
|
9
|
1
|
10
|
|
|
10 locations in Pike County, Kentucky
|
|||||
|
Floyd/Knott/Johnson Market (lease land at 1 owned location)
|
3
|
1
|
4
|
||
|
2 locations in Floyd County, Kentucky, 1 location in Knott County, Kentucky, and 1 location in Johnson County, Kentucky
|
|||||
|
Tug Valley Market (lease land at 1 owned location)
|
2
|
0
|
2
|
||
|
1 location in Pike County, Kentucky, 1 location in Mingo County, West Virginia
|
|||||
|
Whitesburg Market (lease land at 1 owned location)
|
4
|
1
|
5
|
||
|
5 locations in Letcher County, Kentucky
|
|||||
|
Hazard Market (lease land at 2 owned locations)
|
3
|
0
|
3
|
||
|
3 locations in Perry County, Kentucky
|
|||||
|
*
|
Lexington Market (lease land at 3 owned locations)
|
4
|
2
|
6
|
|
|
6 locations in Fayette County, Kentucky
|
|||||
|
Winchester Market
|
2
|
0
|
2
|
||
|
2 locations in Clark County, Kentucky
|
|||||
|
Richmond Market (lease land at 1 owned location)
|
3
|
0
|
3
|
||
|
3 locations in Madison County, Kentucky
|
|||||
|
Mt. Sterling Market
|
2
|
0
|
2
|
||
|
2 locations in Montgomery County, Kentucky
|
|||||
|
*
|
Versailles Market (lease land at 1 owned location)
|
2
|
3
|
5
|
|
|
2 locations in Woodford County, Kentucky, 2 locations in Franklin County, Kentucky, and 1 location in Scott County, Kentucky
|
|||||
|
Danville Market (lease land at 1 owned location)
|
3
|
0
|
3
|
||
|
2 locations in Boyle County, Kentucky and 1 location in Mercer County, Kentucky
|
|||||
|
*
|
Ashland Market (lease land at 1 owned location)
|
5
|
0
|
5
|
|
|
4 locations in Boyd County, Kentucky and 1 location in Greenup County, Kentucky
|
|||||
|
Flemingsburg Market
|
3
|
0
|
3
|
||
|
3 locations in Fleming County, Kentucky
|
|||||
|
Advantage Valley Market
|
3
|
1
|
4
|
||
|
2 locations in Lincoln County, West Virginia, 1 location in Wayne County, West Virginia, and 1 location in Cabell County,
West Virginia
|
|||||
|
Summersville Market
|
1
|
0
|
1
|
||
|
1 location in Nicholas County, West Virginia
|
|||||
|
Middlesboro Market (lease land at 1 owned location)
|
3
|
0
|
3
|
||
|
3 locations in Bell County, Kentucky
|
|||||
|
Williamsburg Market
|
5
|
0
|
5
|
||
|
2 locations in Whitley County, Kentucky and 3 locations in Laurel County, Kentucky
|
|||||
|
Campbellsville Market (lease land at 2 owned locations)
|
8
|
0
|
8
|
||
|
2 locations in Taylor County, Kentucky, 2 locations in Pulaski County, Kentucky, 1 location in Adair County, Kentucky, 1
location in Green County, Kentucky, 1 location in Russell County, Kentucky, and 1 location in Marion County, Kentucky
|
|||||
|
Mt. Vernon Market
|
2
|
0
|
2
|
||
|
2 locations in Rockcastle County, Kentucky
|
|||||
|
*
|
LaFollette Market
|
3
|
0
|
3
|
|
|
2 locations in Campbell County, Tennessee and 1 location in Anderson County, Tennessee
|
|||||
|
Total banking locations
|
70
|
9
|
79
|
||
|
Operational locations:
|
|||||
|
Community Trust Bank, Inc.
|
|||||
|
Pikeville (Pike County, Kentucky) (lease land at 1 owned location)
|
1
|
0
|
1
|
||
|
Total operational locations
|
1
|
0
|
1
|
||
|
Total locations
|
71
|
9
|
80
|
||
*Community Trust and Investment Company has leased offices in the main office locations in these markets.
See notes 8 and 16 to the consolidated financial statements included herein for the year ended December 31,
2018, for additional information relating to lease commitments and amounts invested in premises and equipment.
CTBI and subsidiaries, and from time to time, our officers, are named defendants in legal actions arising
from ordinary business activities. Management, after consultation with legal counsel, believes any pending actions are without merit or that the ultimate liability, if any, will not materially affect our consolidated financial position or results of
operations.
Not applicable.
Item 5. Market for the Registrant’s Common Equity,
Related Shareholder Matters, and Issuer Purchases of Equity Securities
Our common stock is listed on The NASDAQ-Stock Market LLC – Global Select Market under the symbol CTBI. As
of January 31, 2019, there were approximately 4,800 holders of record of our outstanding common shares.
Dividends
The annual dividend paid to our stockholders was increased from $1.30 per share to $1.38 per share during
2018. We have adopted a conservative policy of cash dividends by generally maintaining an average annual cash dividend ratio of approximately 45%, with periodic stock dividends. The current year cash dividend ratio was 41.2%. Dividends are
typically paid on a quarterly basis. Future dividends are subject to the discretion of CTBI’s Board of Directors, cash needs, general business conditions, dividends from our subsidiaries, and applicable governmental regulations and policies. For
information concerning restrictions on dividends from the subsidiary bank to CTBI, see note 21 to the consolidated financial statements included herein for the year ended December 31, 2018.
Stock Repurchases
CTBI did not acquire any shares of common stock through the stock repurchase program during the years 2018
and 2017. There are 67,371 shares remaining under CTBI’s current repurchase authorization. For further information, see the Stock Repurchase Program section of Item 7. Management’s Discussion and Analysis of Financial Condition and Results of Operations.
Securities Authorized for Issuance Under Equity Compensation Plans
For information concerning securities authorized for issuance under CTBI’s equity compensation plans, see
Part III, Item 12. Security Ownership of Certain Beneficial Owners and Management and Related Shareholder Matters.
Common Stock Performance
The following graph shows the cumulative total return experienced by CTBI’s shareholders during the last five
years compared to the NASDAQ Stock Market (U.S.) and the NASDAQ Bank Stock Index. The graph assumes the investment of $100 on December 31, 2013 in CTBI’s common stock and in each index and the reinvestment of all dividends paid during the five-year
period.
Comparison of 5 Year Cumulative Total Return
among Community Trust Bancorp, Inc., NASDAQ Stock Market (U.S.),
and NASDAQ Bank Stocks
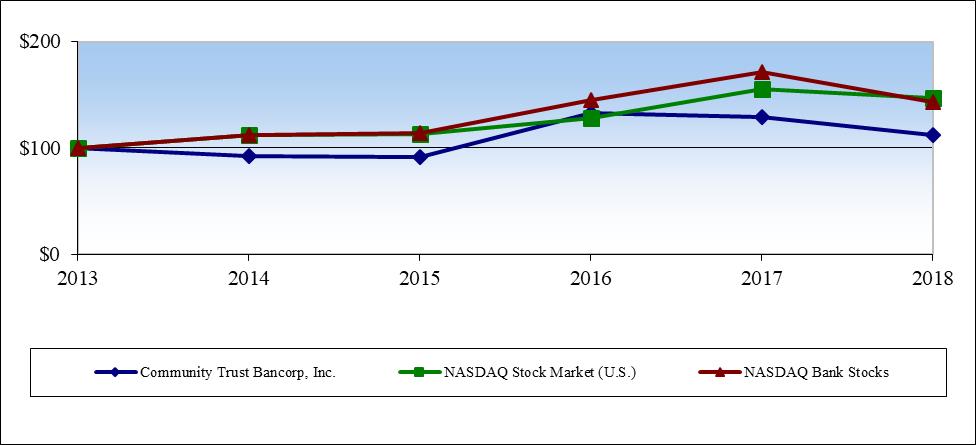
|
Fiscal Year Ending December 31 ($)
|
||||||
|
|
2013
|
2014
|
2015
|
2016
|
2017
|
2018
|
|
Community Trust Bancorp, Inc.
|
100.00
|
92.06
|
90.98
|
132.36
|
129.16
|
112.40
|
|
NASDAQ Stock Market (U.S.)
|
100.00
|
112.46
|
113.00
|
127.70
|
155.01
|
146.57
|
|
NASDAQ Bank Stocks
|
100.00
|
111.83
|
114.30
|
144.63
|
171.24
|
143.15
|
(in thousands except ratios, per share amounts and # of employees)
|
Year Ended December 31
|
2018
|
2017
|
2016
|
2015
|
2014
|
|||||||||||||||
|
Interest income
|
$
|
171,450
|
$
|
155,696
|
$
|
146,576
|
$
|
144,020
|
$
|
143,867
|
||||||||||
|
Interest expense
|
29,295
|
18,294
|
13,555
|
11,773
|
11,797
|
|||||||||||||||
|
Net interest income
|
142,155
|
137,402
|
133,021
|
132,247
|
132,070
|
|||||||||||||||
|
Provision for loan losses
|
6,167
|
7,521
|
7,872
|
8,650
|
8,755
|
|||||||||||||||
|
Noninterest income
|
51,952
|
48,508
|
48,441
|
46,809
|
45,081
|
|||||||||||||||
|
Noninterest expense
|
117,398
|
109,878
|
107,126
|
105,443
|
105,999
|
|||||||||||||||
|
Income before income taxes
|
70,542
|
68,511
|
66,464
|
64,963
|
62,397
|
|||||||||||||||
|
Income taxes
|
11,314
|
17,018
|
19,118
|
18,531
|
19,146
|
|||||||||||||||
|
Net income
|
$
|
59,228
|
$
|
51,493
|
$
|
47,346
|
$
|
46,432
|
$
|
43,251
|
||||||||||
|
Per common share:
|
||||||||||||||||||||
|
Basic earnings per share
|
$
|
3.35
|
$
|
2.92
|
$
|
2.70
|
$
|
2.66
|
$
|
2.50
|
||||||||||
|
Diluted earnings per share
|
$
|
3.35
|
$
|
2.92
|
$
|
2.70
|
$
|
2.66
|
$
|
2.49
|
||||||||||
|
Cash dividends declared-
|
$
|
1.380
|
$
|
1.300
|
$
|
1.260
|
$
|
1.220
|
$
|
1.181
|
||||||||||
|
as a % of net income
|
41.19
|
%
|
44.52
|
%
|
46.67
|
%
|
45.86
|
%
|
47.24
|
%
|
||||||||||
|
Book value, end of year
|
$
|
31.81
|
$
|
30.00
|
$
|
28.40
|
$
|
27.12
|
$
|
25.64
|
||||||||||
|
Market price, end of year
|
$
|
39.61
|
$
|
47.10
|
$
|
49.60
|
$
|
34.96
|
$
|
36.61
|
||||||||||
|
Market to book value, end of year
|
1.25
|
x
|
1.57
|
x
|
1.75
|
x
|
1.29
|
x
|
1.43
|
x
|
||||||||||
|
Price/earnings ratio, end of year
|
11.82
|
x
|
16.13
|
x
|
18.37
|
x
|
13.14
|
x
|
14.64
|
x
|
||||||||||
|
Cash dividend yield, for the year
|
3.48
|
%
|
2.76
|
%
|
2.54
|
%
|
3.49
|
%
|
3.23
|
%
|
||||||||||
|
At year-end:
|
||||||||||||||||||||
|
Total assets
|
$
|
4,201,616
|
$
|
4,136,231
|
$
|
3,932,169
|
$
|
3,903,934
|
$
|
3,723,765
|
||||||||||
|
Long-term debt
|
59,341
|
59,341
|
61,341
|
61,341
|
61,341
|
|||||||||||||||
|
Shareholders’ equity
|
564,150
|
530,699
|
500,615
|
475,583
|
447,877
|
|||||||||||||||
|
Averages:
|
||||||||||||||||||||
|
Assets
|
$
|
4,187,397
|
$
|
4,068,970
|
$
|
3,920,257
|
$
|
3,790,282
|
$
|
3,679,531
|
||||||||||
|
Deposits, including repurchase agreements
|
3,540,717
|
3,406,627
|
3,306,550
|
3,201,545
|
3,130,338
|
|||||||||||||||
|
Earning assets
|
3,913,596
|
3,799,128
|
3,652,714
|
3,524,506
|
3,422,450
|
|||||||||||||||
|
Loans
|
3,150,878
|
3,048,879
|
2,916,031
|
2,791,871
|
2,642,231
|
|||||||||||||||
|
Shareholders’ equity
|
546,641
|
518,767
|
494,398
|
465,682
|
435,290
|
|||||||||||||||
|
Profitability ratios:
|
||||||||||||||||||||
|
Return on average assets
|
1.41
|
%
|
1.27
|
%
|
1.21
|
%
|
1.23
|
%
|
1.18
|
%
|
||||||||||
|
Return on average equity
|
10.83
|
9.93
|
9.58
|
9.97
|
9.94
|
|||||||||||||||
|
Capital ratios:
|
||||||||||||||||||||
|
Equity to assets, end of year
|
13.43
|
%
|
12.83
|
%
|
12.73
|
%
|
12.18
|
%
|
12.03
|
%
|
||||||||||
|
Average equity to average assets
|
13.05
|
12.75
|
12.61
|
12.29
|
11.83
|
|||||||||||||||
|
Risk based capital ratios:
|
||||||||||||||||||||
|
Tier 1 leverage
|
13.51
|
%
|
12.89
|
%
|
12.75
|
%
|
12.40
|
%
|
12.04
|
%
|
||||||||||
|
Common equity Tier 1 capital
|
16.27
|
15.33
|
15.18
|
14.58
|
--
|
|||||||||||||||
|
Tier 1 capital
|
18.12
|
17.22
|
17.25
|
16.70
|
16.51
|
|||||||||||||||
|
Total capital
|
19.29
|
18.41
|
18.50
|
17.95
|
17.76
|
|||||||||||||||
|
Other significant ratios:
|
||||||||||||||||||||
|
Allowance to net loans, end of year
|
1.12
|
%
|
1.16
|
%
|
1.22
|
%
|
1.26
|
%
|
1.26
|
%
|
||||||||||
|
Allowance to nonperforming loans, end of year
|
162.73
|
127.76
|
130.81
|
126.16
|
88.43
|
|||||||||||||||
|
Nonperforming assets to loans and foreclosed properties, end of year
|
1.53
|
1.92
|
2.13
|
2.38
|
2.74
|
|||||||||||||||
|
Net interest margin,
tax equivalent
|
3.66
|
3.67
|
3.70
|
3.81
|
3.92
|
|||||||||||||||
|
Efficiency ratio*
|
60.17
|
58.66
|
58.54
|
58.20
|
59.12
|
|||||||||||||||
|
Other statistics:
|
||||||||||||||||||||
|
Average common shares outstanding
|
17,687
|
17,631
|
17,548
|
17,431
|
17,326
|
|||||||||||||||
|
Number of full-time equivalent employees, end of year
|
978
|
990
|
996
|
984
|
1,012
|
|||||||||||||||
* Efficiency ratio is calculated by dividing noninterest expense by net interest income (tax equivalent) plus noninterest income
minus securities gains (losses).
Quarterly Financial Data
(Unaudited)
(in thousands except ratios and per share amounts)
|
Three Months Ended
|
December 31
|
September 30
|
June 30
|
March 31
|
||||||||||||
|
2018
|
||||||||||||||||
|
Net interest income
|
$
|
36,280
|
$
|
36,136
|
$
|
35,148
|
$
|
34,591
|
||||||||
|
Net interest income, taxable equivalent basis
|
36,504
|
36,362
|
35,376
|
34,815
|
||||||||||||
|
Provision for loan losses
|
1,749
|
1,543
|
1,929
|
946
|
||||||||||||
|
Noninterest income
|
12,239
|
12,663
|
13,740
|
13,310
|
||||||||||||
|
Noninterest expense
|
28,172
|
28,106
|
32,439
|
28,681
|
||||||||||||
|
Net income
|
15,709
|
16,106
|
11,599
|
15,814
|
||||||||||||
|
Per common share:
|
||||||||||||||||
|
Basic earnings per share
|
$
|
0.89
|
$
|
0.91
|
$
|
0.66
|
$
|
0.89
|
||||||||
|
Diluted earnings per share
|
0.89
|
0.91
|
0.66
|
0.89
|
||||||||||||
|
Dividends declared
|
0.36
|
0.36
|
0.33
|
0.33
|
||||||||||||
|
Selected ratios:
|
||||||||||||||||
|
Return on average assets, annualized
|
1.48
|
%
|
1.52
|
%
|
1.11
|
%
|
1.55
|
%
|
||||||||
|
Return on average common equity, annualized
|
11.16
|
11.62
|
8.56
|
12.00
|
||||||||||||
|
Net interest margin, annualized
|
3.68
|
3.68
|
3.61
|
3.65
|
||||||||||||
|
Three Months Ended
|
December 31
|
September 30
|
June 30
|
March 31
|
||||||||||||
|
2017
|
||||||||||||||||
|
Net interest income
|
$
|
35,102
|
$
|
34,970
|
$
|
34,240
|
$
|
33,090
|
||||||||
|
Net interest income, taxable equivalent basis
|
35,615
|
35,475
|
34,739
|
33,599
|
||||||||||||
|
Provision for loan losses
|
2,862
|
666
|
2,764
|
1,229
|
||||||||||||
|
Noninterest income
|
12,416
|
12,202
|
12,311
|
11,579
|
||||||||||||
|
Noninterest expense
|
27,736
|
26,932
|
27,566
|
27,644
|
||||||||||||
|
Net income
|
14,912
|
13,763
|
11,541
|
11,277
|
||||||||||||
|
Per common share:
|
||||||||||||||||
|
Basic earnings per share
|
$
|
0.84
|
$
|
0.78
|
$
|
0.65
|
$
|
0.64
|
||||||||
|
Diluted earnings per share
|
0.84
|
0.78
|
0.65
|
0.64
|
||||||||||||
|
Dividends declared
|
0.33
|
0.33
|
0.32
|
0.32
|
||||||||||||
|
Selected ratios:
|
||||||||||||||||
|
Return on average assets, annualized
|
1.43
|
%
|
1.33
|
%
|
1.14
|
%
|
1.15
|
%
|
||||||||
|
Return on average common equity, annualized
|
11.18
|
10.45
|
8.97
|
9.02
|
||||||||||||
|
Net interest margin, annualized
|
3.65
|
3.67
|
3.68
|
3.68
|
||||||||||||
Overview
The following Management’s Discussion and Analysis of Financial Condition and Results of Operations
(“MD&A”) is intended to help the reader understand Community Trust Bancorp, Inc., our operations, and our present business environment. The MD&A is provided as a supplement to—and should be read in conjunction with—our consolidated financial
statements and the accompanying notes thereto contained in Item 8 of this annual report. The MD&A includes the following sections:
| ● |
Our Business
|
| ● |
Financial Goals and Performance
|
| ● |
Results of Operations and Financial Condition
|
| ● |
Contractual Obligations and Commitments
|
| ● |
Liquidity and Market Risk
|
| ● |
Interest Rate Risk
|
| ● |
Capital Resources
|
| ● |
Impact of Inflation, Changing Prices, and Economic Conditions
|
| ● |
Stock Repurchase Program
|
| ● |
Critical Accounting Policies and Estimates
|
Our Business
Community Trust Bancorp, Inc. (“CTBI”) is a bank holding company headquartered in Pikeville, Kentucky.
Currently, we own one commercial bank, Community Trust Bank, Inc. (“CTB”) and one trust company, Community Trust and Investment Company. Through our subsidiaries, we have seventy-nine banking locations in eastern, northeastern, central, and south
central Kentucky, southern West Virginia, and northeastern Tennessee, four trust offices across Kentucky, and one trust office in northeastern Tennessee. At December 31, 2018, we had total consolidated assets of $4.2 billion and total consolidated
deposits, including repurchase agreements, of $3.5 billion. Total shareholders’ equity at December 31, 2018 was $564.2 million. Trust assets under management, which are excluded from CTBI’s total consolidated assets, at December 31, 2018, were $2.0
billion. Trust assets under management include CTB’s investment portfolio totaling $0.6 billion.
Through its subsidiaries, CTBI engages in a wide range of commercial and personal banking and trust and
wealth management activities, which include accepting time and demand deposits; making secured and unsecured loans to corporations, individuals and others; providing cash management services to corporate and individual customers; issuing letters of
credit; renting safe deposit boxes; and providing funds transfer services. The lending activities of CTB include making commercial, construction, mortgage, and personal loans. Lease-financing, lines of credit, revolving lines of credit, term loans,
and other specialized loans, including asset-based financing, are also available. Our corporate subsidiaries act as trustees of personal trusts, as executors of estates, as trustees for employee benefit trusts, as paying agents for bond and stock
issues, as investment agent, as depositories for securities, and as providers of full service brokerage and insurance services. For further information, see Item 1 of this annual report.
Financial Goals and Performance
The following table shows the primary measurements used by management to assess annual performance. The
goals in the table below should not be viewed as a forecast of our performance for 2019. Rather, the goals represent a range of target performance for 2019. There is no assurance that any or all of these goals will be achieved. See “Cautionary
Statement Regarding Forward Looking Statements.
|
2018 Goals
|
2018 Performance
|
2019 Goals
|
|
|
Basic earnings per share
|
$3.32 - $3.40
|
$3.35
|
$3.45 - $3.52
|
| Net income | $58.8 - $60.2 million | $59.2 million | $61.3 - $62.6 million |
|
ROAA
|
1.41% - 1.44%
|
1.41%
|
1.44% - 1.47%
|
|
ROAE
|
10.72% - 10.97%
|
10.83%
|
10.57% - 10.79%
|
| Revenues | $188.9 - $194.6 million | $194.1 million | $189.0 - $194.7 million |
|
Noninterest revenue as of % of total revenue
|
25.00% - 27.00%
|
26.80%
|
23.00% - 26.00%
|
|
Assets
|
$4.15 - $4.32 billion
|
$4.20 billion
|
$4.20 - $4.46 billion
|
|
Loans
|
$3.15 - $3.35 billion
|
$3.21 billion
|
$3.31 - $3.45 billion
|
|
Deposits, including repurchase agreements
|
$3.47 - $3.61 billion
|
$3.54 billion
|
$3.56 - $3.71 billion
|
|
Shareholders’ equity
|
$552.6 - $575.2 million
|
$564.2 million
|
$584.0 - $607.8 million
|
We reported record earnings of $59.2 million, or $3.35 per basic share, for the year ended December 31, 2018
compared to $51.5 million, or $2.92 per basic share, for the year ended December 31, 2017 and $47.3 million, or $2.70 per basic share, for the year ended December 31, 2016.
2018 Highlights
| ● |
Net interest income for the year ended December 31, 2018 increased $4.8 million, or 3.5%, from December 31, 2017 with
a 1 basis point decrease in our net interest margin and a $114.5 million increase in average earning assets.
|
| ● |
Provision for loan losses for the year ended December 31, 2018 decreased $1.4 million, or 18.0%, from December 31,
2017.
|
| ● |
Our loan portfolio increased $85.7 million, or 2.7%, from December 31, 2017.
|
| ● |
Net loan charge-offs for the year ended December 31, 2018 were $6.4 million, or 0.20% of average loans annualized,
compared to $7.3 million, or 0.24%, experienced for the year 2017.
|
| ● |
Nonperforming loans at $22.1 million decreased $6.2 million, or 22.0%, from December 31, 2017. Nonperforming assets
at $49.4 million decreased $11.1 million, or 18.3%, from December 31, 2017.
|
| ● |
Deposits, including repurchase agreements, increased $31.0 million, or 0.9%, from December 31, 2017.
|
| ● |
Noninterest income for the year ended December 31, 2018 was a $3.4 million, or 7.1%, increase from prior year. Year
over year noninterest income was positively impacted by increases in deposit service charges, trust revenue, and bank owned life insurance income.
|
| ● |
Noninterest expense for the year ended December 31, 2018 was $117.4 million, a $7.5 million, or 6.8%, increase over
the year 2017. The year over year increase included increases in personnel expense and taxes other than income, property, and payroll, in addition to a $3.6 million customer reimbursement expense discussed further in the noninterest
expense section below.
|
Income Statement Review
|
(dollars in thousands)
|
Change 2018 vs. 2017
|
|||||||||||||||||||
|
Year Ended December 31
|
2018
|
2017
|
2016
|
Amount
|
Percent
|
|||||||||||||||
|
Net interest income
|
$
|
142,155
|
$
|
137,402
|
$
|
133,021
|
$
|
4,753
|
3.5
|
%
|
||||||||||
|
Provision for loan losses
|
6,167
|
7,521
|
7,872
|
(1,354
|
)
|
(18.0
|
)
|
|||||||||||||
|
Noninterest income
|
51,952
|
48,508
|
48,441
|
3,444
|
7.1
|
|||||||||||||||
|
Noninterest expense
|
117,398
|
109,878
|
107,126
|
7,520
|
6.8
|
|||||||||||||||
|
Income taxes
|
11,314
|
17,018
|
19,118
|
(5,704
|
)
|
(33.5
|
)
|
|||||||||||||
|
Net income
|
$
|
59,228
|
$
|
51,493
|
$
|
47,346
|
$
|
7,735
|
15.0
|
%
|
||||||||||
|
Average earning assets
|
$
|
3,913,596
|
$
|
3,799,128
|
$
|
3,652,714
|
$
|
114,468
|
3.0
|
%
|
||||||||||
|
Yield on average earnings assets, tax equivalent*
|
4.40
|
%
|
4.15
|
%
|
4.07
|
%
|
0.25
|
%
|
6.0
|
%
|
||||||||||
|
Cost of interest bearing funds
|
1.05
|
%
|
0.67
|
%
|
0.52
|
%
|
0.38
|
%
|
56.7
|
%
|
||||||||||
|
Net interest margin, tax equivalent*
|
3.66
|
%
|
3.67
|
%
|
3.70
|
%
|
(0.01
|
)%
|
(0.3
|
)%
|
||||||||||
*Yield on average earning assets and net interest margin are computed on a taxable equivalent basis using a 21% tax rate for 2018
and a 35% tax rate for the years 2017 and 2016.
Net Interest Income
Net interest income for the year ended December 31, 2018 of $142.2 million increased $4.8 million, or 3.5%,
from prior year. Average earning assets increased $114.5 million over prior year. Our yield on average earning assets increased 25 basis points from prior year, while our cost of interest bearing funds increased 38 basis points, largely due to
market forces. Our net interest margin for the year 2018 declined 1 basis point from 2017 to 3.66%. Average loans to deposits, including repurchase agreements, for the year ended December 31, 2018 were 89.0% compared to 89.5% for the year ended
December 31, 2017.
Net interest income for the year ended December 31, 2017 of $137.4 million increased $4.4 million, or 3.3%,
from 2016. Average earning assets for the year 2017 increased $146.4 million over 2016. Our yield on average earning assets for 2017 increased 8 basis points from 2016, while our cost of interest bearing funds increased 15 basis points. Average
loans to deposits, including repurchase agreements, for the year ended December 31, 2017 were 89.5% compared to 88.2% for the year ended December 31, 2016.
Provision for Loan Losses
The provision for loan losses added to the allowance for 2018 of $6.2 million was a $1.4 million decrease
from prior year. This provision represented a charge against current earnings in order to maintain the allowance at an appropriate level determined using the accounting estimates described in the Critical Accounting Policies and Estimates section.
The provision for loan losses added to the allowance for 2017 of $7.5 million was a $0.4 million decrease
from 2016.
Noninterest Income
Noninterest income for the year ended December 31, 2018 was a $3.4 million, or 7.1%, increase from prior
year. Year over year noninterest income was positively impacted by increases in deposit service charges ($0.9 million), trust revenue ($0.9 million), and bank owned life insurance income ($1.5 million).
Noninterest income for the year ended December 31, 2017 of $48.5 million was a $0.1 million, or 0.1%
increase, from the year ended December 31, 2016.
Noninterest Expense
Noninterest expense for the year ended December 31, 2018 was $117.4 million, a $7.5 million, or 6.8%,
increase over the year 2017. The year over year increase included a $2.7 million increase in personnel expense and a $1.1 million increase in taxes other than income, property, and payroll, in addition to the $3.6 million customer reimbursement
expense, discussed below, related to two deposit add-on products. The increase in personnel expense included increases in salaries ($0.7 million), bonuses ($0.2 million), and the cost of group medical and life insurance ($1.4 million).
As CTBI previously disclosed in a Form 8-K filed on June 14, 2018, CTB entered into a
Consent Order with the Board of Governors of the Federal Reserve System. The Consent Order required CTB to deposit an amount of not less than $4.75 million in a segregated account for the purpose of funding restitution. As a result, CTBI
increased its related accrual in the second quarter 2018 by $3.6 million.
Noninterest expense for the year ended December 31, 2017 increased $2.8 million, or 2.6%, compared to the
year ended December 31, 2016, as a result of a $1.8 million increase in personnel expense and a $1.6 million increase in net other real estate owned expense, partially offset by a $0.6 million decrease in FDIC insurance. The increase year over year
in personnel expense included a $1.1 million increase in salaries, a $0.5 million increase in bonuses and incentives, and a $0.4 million increase in the cost of group medical and life insurance.
Balance Sheet Review
CTBI’s total assets at $4.2 billion increased $65.4 million, or 1.6%, from December 31, 2017. Loans
outstanding at December 31, 2018 were $3.2 billion, increasing $85.7 million, or 2.7%, year over year. We experienced growth during the year of $25.5 million in the commercial loan portfolio, $9.6 million in the residential loan portfolio, $44.1
million in the indirect loan portfolio, and $6.5 million in the consumer direct loan portfolio. CTBI’s investment portfolio increased $9.1 million, or 1.6%, from December 31, 2017. Deposits in other banks decreased $57.9 million from December 31,
2017. Deposits, including repurchase agreements, at $3.5 billion increased $31.0 million, or 0.9%, from December 31, 2017.
Shareholders’ equity at December 31, 2018 was $564.2 million, a 6.3% increase from the $530.7 million at
December 31, 2017. CTBI’s annualized dividend yield to shareholders as of December 31, 2018 was 3.64%.
Loans
|
(in thousands)
|
December 31, 2018
|
|||||||||||||||||||
|
Loan Category
|
Balance
|
Variance from Prior Year
|
Net Charge-Offs
|
Nonperforming
|
ALLL
|
|||||||||||||||
|
Commercial:
|
||||||||||||||||||||
|
Construction
|
$
|
82,715
|
8.2
|
%
|
$
|
61
|
$
|
697
|
$
|
862
|
||||||||||
|
Secured by real estate
|
1,183,093
|
(0.5
|
)
|
(764
|
)
|
9,169
|
14,531
|
|||||||||||||
|
Equipment lease financing
|
1,740
|
(42.8
|
)
|
0
|
0
|
12
|
||||||||||||||
|
Other commercial
|
377,198
|
7.5
|
(870
|
)
|
1,378
|
4,993
|
||||||||||||||
|
Total commercial
|
1,644,746
|
1.6
|
(1,573
|
)
|
11,244
|
20,398
|
||||||||||||||
|
Residential:
|
||||||||||||||||||||
|
Real estate construction
|
57,160
|
(15.1
|
)
|
(33
|
)
|
28
|
512
|
|||||||||||||
|
Real estate mortgage
|
722,417
|
1.8
|
(919
|
)
|
9,490
|
4,433
|
||||||||||||||
|
Home equity
|
106,299
|
7.0
|
(55
|
)
|
723
|
841
|
||||||||||||||
|
Total residential
|
885,876
|
1.1
|
(1,007
|
)
|
10,241
|
5,786
|
||||||||||||||
|
Consumer:
|
||||||||||||||||||||
|
Consumer direct
|
144,289
|
4.7
|
(552
|
)
|
74
|
1,883
|
||||||||||||||
|
Consumer indirect
|
533,727
|
9.0
|
(3,278
|
)
|
506
|
7,841
|
||||||||||||||
|
Total consumer
|
678,016
|
8.1
|
(3,830
|
)
|
580
|
9,724
|
||||||||||||||
|
Total loans
|
$
|
3,208,638
|
2.7
|
%
|
$
|
(6,410
|
)
|
$
|
22,065
|
$
|
35,908
|
|||||||||
Asset Quality
CTBI’s total nonperforming loans, not including troubled debt restructurings, were $22.1 million, or 0.69% of
total loans, at December 31, 2018 compared to $28.3 million, or 0.91% of total loans, at December 31, 2017. Accruing loans 90+ days past due remained relatively flat compared to December 31, 2017. Nonaccrual loans decreased $6.3 million from
December 31, 2017. Accruing loans 30-89 days past due at $22.7 million was an increase of $3.3 million from December 31, 2017. Our loan portfolio management processes focus on the immediate identification, management, and resolution of problem
loans to maximize recovery and minimize loss. Our loan portfolio risk management processes include weekly delinquent loan review meetings at the market levels and
monthly delinquent loan review meetings involving senior corporate management to review all nonaccrual loans and loans 30 days or more past due. Any activity regarding a criticized/classified loan (i.e. problem loan) must be approved by CTB’s
Watch List Asset Committee (i.e. Problem Loan Committee). CTB’s Watch List Asset Committee also meets on a quarterly basis and reviews every criticized/classified loan of $100,000 or greater. We also have a Loan Review Department that reviews
every market within CTB annually and performs extensive testing of the loan portfolio to assure the accuracy of loan grades and classifications for delinquency, troubled debt restructuring, impaired status, impairment, nonaccrual status, and
adequate loan loss reserves. The Loan Review Department has annually reviewed on average 95% of the outstanding commercial loan portfolio for the past three years. The average annual review percentage of the consumer and residential loan
portfolio for the past three years was 85% based on the loan production during the number of months included in the review scope. The review scope is generally four to six months of production.
Impaired loans, loans not expected to meet contractual principal and interest payments, at December 31, 2018
totaled $46.4 million compared to $47.4 million at December 31, 2017. Included in certain loan categories of impaired loans are troubled debt restructurings that were classified as impaired. At December 31, 2018, CTBI had $31.5 million in
commercial loans secured by real estate, $4.2 million in commercial real estate construction loans, $8.8 million in commercial other loans, and $1.9 million in real estate mortgage loans that were modified in troubled debt restructurings and/or
impaired. Management evaluates all impaired loans for impairment and records a direct charge-off or provides specific reserves when necessary.
For further information regarding nonperforming and impaired loans, see note 4 to the consolidated financial
statements.
CTBI generally does not offer high risk loans such as option ARM products, high loan to value ratio
mortgages, interest-only loans, loans with initial teaser rates, or loans with negative amortizations, and therefore, CTBI would have no significant exposure to these products.
Our level of foreclosed properties at $27.3 million at December 31, 2018 was a decrease of $4.7 million from
the $32.0 million at December 31, 2017. Sales of foreclosed properties for the year ended December 31, 2018 totaled $7.7 million while new foreclosed properties totaled $5.5 million. At December 31, 2018, the book value of properties under
contracts to sell was $3.3 million; however, the closings had not occurred at year-end.
When foreclosed properties are acquired, appraisals are obtained and the properties are booked at the current
market value less expected sales costs. Additionally, periodic updated appraisals are obtained on unsold foreclosed properties. When an updated appraisal reflects a market value below the current book value, a charge is booked to current earnings
to reduce the property to its new market value less expected sales costs. Charges to earnings in 2018 to reflect the decrease in current market values of foreclosed properties totaled $2.5 million. There were 63 properties reappraised during 2018.
Of these, 40 were written down by a total of $0.9 million. Charges during the year ended December 31, 2017 were $3.0 million. Our policy for determining the frequency of periodic reviews is based upon consideration of the specific properties and
the known or perceived market fluctuations in a particular market and is typically between 12 and 18 months but generally not more than 24 months. Approximately ninety-three percent of our OREO properties have appraisals dated within the past 18
months. Management anticipates that our foreclosed properties will remain elevated as we work through current market conditions.
The appraisal aging analysis of foreclosed properties, as well as the holding period, at December 31, 2018 is
shown below:
|
(in thousands)
|
|||||||||||||
|
Appraisal Aging Analysis
|
Holding Period Analysis
|
||||||||||||
|
Days Since Last Appraisal
|
Number of Properties
|
Current Book Value
|
Holding Period
|
Current Book Value
|
|||||||||
|
Up to 3 months
|
9
|
$
|
556
|
Less than one year
|
$
|
3,549
|
|||||||
|
3 to 6 months
|
43
|
3,200
|
1 year
|
1,541
|
|||||||||
|
6 to 9 months
|
22
|
5,488
|
2 years
|
1,114
|
|||||||||
|
9 to 12 months
|
30
|
3,629
|
3 years
|
7,272
|
|||||||||
|
12 to 18 months
|
17
|
5,380
|
4 years
|
1,780
|
|||||||||
|
18 to 24 months
|
6
|
8,888
|
5 years
|
96
|
|||||||||
|
Over 24 months
|
3
|
132
|
6 years*
|
1,071
|
|||||||||
|
Total
|
130
|
$
|
27,273
|
7 years*
|
8,492
|
||||||||
|
8 years*
|
0
|
||||||||||||
|
9 years*
|
2,358
|
||||||||||||
|
Total
|
$
|
27,273
|
|||||||||||
* Regulatory approval is required and has
been obtained to hold these properties beyond the initial period of 5 years. Additional approval may be required to continue to hold these properties should they not be liquidated during the extension period, which is typically one year.
To the extent we are not able to sell a foreclosed property in 10 years, we will be required to relinquish ownership of that property. As of December 31, 2018, foreclosed property with a total book value of $2.4 million, representing 8.6% of our
foreclosed properties (based on book value), had been held by us for at least nine years. The book value at December 31, 2018 represents management’s best estimate of realizable value of the properties.
Net loan charge-offs for the year were $6.4 million, or 0.20% of average loans annualized, a decrease from
prior year’s $7.3 million, or 0.24% of average loans annualized. Of the total net charge-offs, $1.6 million were in commercial loans, $3.3 million were in indirect auto loans, $1.0 million were in residential real estate mortgage loans, and $0.5
million were in direct consumer loans.
Our loan loss reserve as a percentage of total loans outstanding at December 31, 2018 decreased to 1.12% from
the 1.16% at December 31, 2017. Our reserve coverage (allowance for loan and lease loss reserve to nonperforming loans) was 162.7% at December 31, 2018 compared to 127.8% at December 31, 2017.
Contractual Obligations and Commitments
As disclosed in the notes to the consolidated financial statements, we have certain obligations and
commitments to make future payments under contracts. At December 31, 2018, the aggregate contractual obligations and commitments are:
|
Contractual Obligations:
|
Payments Due by Period
|
|||||||||||||||
|
(in thousands)
|
Total
|
1 Year
|
2-5 Years
|
After 5 Years
|
||||||||||||
|
Deposits without stated maturity
|
$
|
2,154,317
|
$
|
2,154,317
|
$
|
0
|
$
|
0
|
||||||||
|
Certificates of deposit and other time deposits
|
1,151,633
|
840,592
|
310,783
|
258
|
||||||||||||
|
Repurchase agreements and federal funds purchased
|
233,892
|
233,892
|
0
|
0
|
||||||||||||
|
Advances from Federal Home Loan Bank
|
436
|
22
|
82
|
332
|
||||||||||||
|
Interest on advances from Federal Home Loan Bank*
|
2
|
0
|
1
|
1
|
||||||||||||
|
Long-term debt
|
59,341
|
0
|
0
|
59,341
|
||||||||||||
|
Interest on long-term debt*
|
48,023
|
2,705
|
10,427
|
34,891
|
||||||||||||
|
Annual rental commitments under leases
|
21,933
|
1,999
|
6,903
|
13,031
|
||||||||||||
|
Total contractual obligations
|
$
|
3,669,577
|
$
|
3,233,527
|
$
|
328,196
|
$
|
107,854
|
||||||||
*The amounts provided as interest on advances from Federal Home Loan Bank and interest on long-term debt assume the liabilities
will not be prepaid and interest is calculated to their individual maturities.
The interest on $59.3 million in long-term debt is calculated based on the three-month LIBOR plus 1.59% until
its maturity of June 1, 2037. The three-month LIBOR rate is projected using the most likely rate forecast from assumptions incorporated in the interest rate risk model and is determined two business days prior to the interest payment date. These
assumptions are uncertain, and as a result, the actual payments will differ from the projection due to changes in economic conditions.
|
Other Commitments:
|
Amount of Commitment - Expiration by Period
|
|||||||||||||||
|
(in thousands)
|
Total
|
1 Year
|
2-5 Years
|
After 5 Years
|
||||||||||||
|
Standby letters of credit
|
$
|
29,410
|
$
|
28,431
|
$
|
970
|
$
|
9
|
||||||||
|
Commitments to extend credit
|
510,513
|
422,140
|
52,670
|
35,703
|
||||||||||||
|
Total other commitments
|
$
|
539,923
|
$
|
450,571
|
$
|
53,640
|
$
|
35,712
|
||||||||
Commitments to extend credit and standby letters of credit do not necessarily represent future cash
requirements in that these commitments often expire without being drawn upon. Refer to note 18 to the consolidated financial statements for additional information regarding other commitments.
Liquidity and Market Risk
The objective of CTBI’s Asset/Liability management function is to maintain consistent growth in net interest
income within our policy limits. This objective is accomplished through management of our consolidated balance sheet composition, liquidity, and interest rate risk exposures arising from changing economic conditions, interest rates, and customer
preferences. The goal of liquidity management is to provide adequate funds to meet changes in loan and lease demand or deposit withdrawals. This is accomplished by maintaining liquid assets in the form of cash and cash equivalents and investment
securities, sufficient unused borrowing capacity, and growth in core deposits and wholesale funding (including the use of wholesale brokered deposits). As of December 31, 2018, we had approximately $141.5 million in cash and cash equivalents and
approximately $593.7 million in securities valued at estimated fair value designated as available-for-sale and available to meet liquidity needs on a continuing basis compared to $175.3 million and $585.8 million at December 31, 2017. Additional
asset-driven liquidity is provided by the remainder of the securities portfolio and the repayment of loans. In addition to core deposit funding, we also have a variety of other short-term and long-term funding sources available. As of December 31,
2018, we had wholesale brokered deposits outstanding of $42.3 million with a weighted average maturity of 1.58 years compared to $82.3 million with a weighted average maturity of maturity of 1.67 years at December 31, 2017. We also rely on Federal
Home Loan Bank advances for both liquidity and management of our asset/liability position. Federal Home Loan Bank advances were $0.4 million at December 31, 2018 compared to $0.8 million at December 31, 2017. As of December 31, 2018, we had a
$312.2 million available borrowing position with the Federal Home Loan Bank compared to $295.5 million at December 31, 2017. We generally rely upon net inflows of cash from financing activities, supplemented by net inflows of cash from operating
activities, to provide cash for our investing activities. As is typical of many financial institutions, significant financing activities include deposit gathering, use of short-term borrowing facilities such as repurchase agreements and federal
funds purchased, use of wholesale brokered deposits, and issuance of long-term debt. At December 31, 2018 we had $45 million in lines of credit with various correspondent banks available to meet any future cash needs compared to $57 million at
December 31, 2017. Included in December 31, 2017, was a $12 million line of credit which CTBI did not renew when it expired in November 2018. Our primary investing activities include purchases of securities and loan originations. We do not rely on
any one source of liquidity and manage availability in response to changing consolidated balance sheet needs. Included in our cash and cash equivalents at December 31, 2018 were deposits with the Federal Reserve of $73.5 million compared to $124.3
million at December 31, 2017. At December 31, 2018, cash and cash equivalents included federal funds sold of $1.1 million. Additionally, we project cash flows from our investment portfolio to generate additional liquidity over the next 90 days.
The investment portfolio consists of investment grade short-term issues suitable for bank investments. The
majority of the investment portfolio is in U.S. government and government sponsored agency issuances. At the end of 2018, available-for-sale (“AFS”) securities comprised substantially all of the total investment portfolio, and the AFS portfolio was approximately 105% of equity capital. Ninety-three
percent of the pledge eligible portfolio was pledged.
Interest Rate Risk
We consider interest rate risk one of our most significant market risks. Interest rate risk is the exposure
to adverse changes in net interest income due to changes in interest rates. Consistency of our net interest revenue is largely dependent upon the effective management of interest rate risk. We employ a variety of measurement techniques to identify
and manage our interest rate risk including the use of an earnings simulation model to analyze net interest income sensitivity to changing interest rates. The model is based on actual cash flows and repricing characteristics for on and off-balance
sheet instruments and incorporates market-based assumptions regarding the effect of changing interest rates on the prepayment rates of certain assets and liabilities. Assumptions based on the historical behavior of deposit rates and balances in
relation to changes in interest rates are also incorporated into the model. These assumptions are inherently uncertain, and as a result, the model cannot precisely measure net interest income or precisely predict the impact of fluctuations in
interest rates on net interest income. Actual results will differ from simulated results due to timing, magnitude, and frequency of interest rate changes as well as changes in market conditions and management strategies.
CTBI’s Asset/Liability Management Committee (ALCO), which includes executive and senior management
representatives and reports to the Board of Directors, monitors and manages interest rate risk within Board-approved policy limits. Our current exposure to interest rate risks is determined by measuring the anticipated change in net interest income
spread evenly over the twelve-month period.
The following table shows our estimated earnings sensitivity profile as of December 31, 2018:
|
Change in Interest Rates
(basis points)
|
Percentage Change in Net Interest Income
(12 Months)
|
|
+400
|
10.26%
|
|
+300
|
7.89%
|
|
+200
|
5.43%
|
|
+100
|
2.80%
|
|
-100
|
(2.73)%
|
|
-200
|
(4.90)%
|
The following table shows our estimated earnings sensitivity profile as of December 31, 2017:
|
Change in Interest Rates
(basis points)
|
Percentage Change in Net Interest Income
(12 Months)
|
|
+400
|
7.49%
|
|
+300
|
5.70%
|
|
+200
|
3.86%
|
|
+100
|
1.92%
|
|
-25
|
(0.29)%
|
The simulation model used the yield curve spread evenly over a twelve-month period. The measurement at
December 31, 2018 estimates that our net interest income in an up-rate environment would increase by 10.26% at a 400 basis point change, 7.89% increase at a 300 basis point change, 5.43% increase at a 200 basis point change, and a 2.80% increase at a
100 basis point change. In a down-rate environment, net interest income would decrease 2.73% at a 100 basis point change and decrease 4.90% at a 200 basis point change over one year. In order to reduce the exposure to interest rate fluctuations and
to manage liquidity, we have developed sale procedures for several types of interest-sensitive assets. Primarily all long-term, fixed rate single family residential mortgage loans underwritten according to Federal Home Loan Mortgage Corporation
guidelines are sold for cash upon origination or originated under terms where they could be sold. Periodically, additional assets such as commercial loans are also sold. In 2018 and 2017, $56.7 million and $59.4 million, respectively, were realized
on the sale of fixed rate residential mortgages. We focus our efforts on consistent net interest revenue and net interest margin growth through each of the retail and wholesale business lines. We do not currently engage in trading activities.
The preceding analysis was prepared using a rate ramp analysis which attempts to spread changes evenly over a
specified time period as opposed to a rate shock which measures the impact of an immediate change. Had these measurements been prepared using the rate shock method, the results would vary.
Our static repricing GAP as of December 31, 2018 is presented below. In the 12 month cumulative repricing
GAP, rate sensitive liabilities (“RSL”) exceeded rate sensitive assets (“RSA”) by $421.9 million.
|
(dollars in thousands)
|
1-3 Months
|
4-6 Months
|
7-9 Months
|
10-12 Months
|
2-3
Years
|
4-5
Years
|
> 5
Years
|
|||||||||||||||||||||
|
Assets
|
$
|
1,442,808
|
$
|
247,213
|
$
|
195,957
|
$
|
170,672
|
$
|
1,075,065
|
$
|
433,675
|
$
|
636,227
|
||||||||||||||
|
Liabilities and
Equity
|
1,737,168
|
136,270
|
229,694
|
375,371
|
236,259
|
80,535
|
1,406,319
|
|||||||||||||||||||||
|
Periodic repricing GAP
|
(294,360
|
)
|
110,942
|
(33,737
|
)
|
(204,699
|
)
|
838,806
|
353,140
|
(770,092
|
)
|
|||||||||||||||||
|
Cumulative GAP
|
(294,360
|
)
|
(183,418
|
)
|
(217,154
|
)
|
(421,854
|
)
|
416,952
|
770,092
|
0
|
|||||||||||||||||
|
RSA/RSL
|
0.83
|
x
|
1.81
|
x
|
0.85
|
x
|
0.45
|
x
|
4.55
|
x
|
5.38
|
x
|
0.45
|
x
|
||||||||||||||
|
Cumulative GAP to total assets
|
(7.01
|
)%
|
(4.37
|
)%
|
(5.17
|
)%
|
(10.04
|
)%
|
9.92
|
%
|
18.33
|
%
|
0.00
|
%
|
||||||||||||||
Capital Resources
We continue to grow our shareholders’ equity while also providing an annual dividend yield for the year 2018
of 3.48% to shareholders. Shareholders’ equity increased 6.3% from December 31, 2017 to $564.2 million at December 31, 2018. Our primary source of capital growth is the retention of earnings. Cash dividends were $1.38 per share for 2018 and $1.30
per share for 2017. We retained 58.8% of our earnings in 2018 compared to 55.5% in 2017.
Basel III
On July 2, 2013, the Federal Reserve approved final rules that substantially amended the regulatory
risk-based capital rules applicable to CTBI and CTB. The FDIC subsequently approved these rules. The final rules implemented the “Basel III” regulatory capital reforms and changes required by the Dodd-Frank Act.
The rules included new risk-based capital and leverage ratios, which were phased in from 2015 to January
2019, and refined the definition of what constitutes “capital” for purposes of calculating those ratios. The minimum capital level requirements applicable to CTBI and CTB under the final rules are: (i) a common equity Tier 1 capital ratio of 4.5%;
(ii) a Tier 1 capital ratio of 6%; (iii) a total capital ratio of 8%; and (iv) a Tier 1 leverage ratio of 4% for all institutions. The final rules also established a “capital conservation buffer” above the new regulatory minimum capital
requirements, which must consist entirely of common equity Tier 1 capital. The capital conservation buffer began to be phased in on January 1, 2016 at 0.625% of risk-weighted assets increased by 0.625% annually until fully implemented in January
2019. An institution is subject to limitations on certain activities including payment of dividends, share repurchases, and discretionary bonuses to executive officers if its capital level is below the total capital plus capital conservation buffer
amount.
The final rules also contain revisions to the prompt corrective action framework, which is designed to place
restrictions on insured depository institutions, including CTB, if their capital levels begin to show signs of weakness. These revisions took effect January 1, 2015. Under the prompt corrective action requirements, which are designed to complement
the capital conservation buffer, insured depository institutions are required to meet the following capital level requirements in order to qualify as “well capitalized:” (i) a common equity Tier 1 capital ratio of 6.5%; (ii) a Tier 1 capital ratio of
8%; (iii) a total capital ratio of 10%; and (iv) a Tier 1 leverage ratio of 5%. We currently satisfy the well-capitalized and the capital conservation standards, and based on our current capital composition and levels, we anticipate that our capital
ratios, on a Basel III basis, will continue to exceed the well-capitalized minimum capital requirements and capital conservation buffer standards.
As of December 31, 2018, CTBI had a common equity Tier 1 capital ratio of 16.27%, a Tier 1 capital ratio of
18.12%, a total capital ratio of 19.29%, and a Tier 1 leverage ratio of 13.51%. Our capital conservation buffer at December 31, 2018 was 11.29%. See note 21 to the consolidated financial statements for further information.
In December 2017, the Basel Committee on Banking Supervision unveiled the latest round of its regulatory
framework, commonly referred to as Basel IV. The framework makes changes to the capital framework of Basel III and is targeted for a timeframe of 2022-2027 for implementation. The new framework appears designed to limit the flexibility of financial
institutions using advanced approaches to calculate credit and other risks and also makes significant amendments to the standardized approaches to credit risk, credit valuation adjustment risk, and operational risk. The manner and the form in which
the Basel IV framework will be implemented in the U.S. are uncertain.
As of December 31, 2018, we are not aware of any current recommendations by banking regulatory authorities
which, if they were to be implemented, would have, or are reasonably likely to have, a material adverse impact on our liquidity, capital resources, or operations.
Impact of Inflation, Changing Prices, and Economic Conditions
The majority of our assets and liabilities are monetary in nature. Therefore, CTBI differs greatly from most
commercial and industrial companies that have significant investment in nonmonetary assets, such as fixed assets and inventories. However, inflation does have an important impact on the growth of assets in the banking industry and on the resulting
need to increase equity capital at higher than normal rates in order to maintain an appropriate equity to assets ratio. Inflation also affects other expenses, which tend to rise during periods of general inflation.
We believe one of the most significant impacts on financial and operating results is our ability to react to
changes in interest rates. We seek to maintain an essentially balanced position between interest rate sensitive assets and liabilities in order to protect against the effects of wide interest rate fluctuations.
Beginning in 2008, the U.S. economy faced a severe economic crisis including a major recession from which
recovery was slow and uneven. Commerce and business growth in certain regions in the U.S. remains reduced and local governments and many businesses continue to experience financial difficulty. In some areas of the U.S., including certain parts of
our service area, unemployment levels remain elevated. There can be no assurance that these conditions will continue to improve and these conditions could worsen. In addition, the level of U.S. debt, the Federal Open Market Committee’s monetary
policy, potential volatility in oil prices, recent U.S. tax law modifications, political events, and trade policies may have a destabilizing effect on financial markets or a negative effect on the economy.
Our financial performance generally, and in particular the ability of borrowers to pay interest on and repay
principal of outstanding loans and the value of collateral securing those loans, as well as demand for loans and other products and services we offer, is highly dependent upon the business environment in the markets where we operate, in the states of
Kentucky, West Virginia, and Tennessee and in the United States as a whole. While unemployment rates have improved in all of the markets in which we operate, unemployment rates in our markets remain high compared to the national average. A
favorable business environment is generally characterized by, among other factors, economic growth, efficient capital markets, low inflation, low unemployment, high business and investor confidence, and strong business earnings. Unfavorable or
uncertain economic and market conditions can be caused by declines in economic growth, business activity, or investor or business confidence; limitations on the availability or increases in the cost of credit and capital; increases in inflation or
interest rates; high unemployment; natural disasters; or a combination of these or other factors.
While economic conditions in the United States and worldwide have improved since the recession, there can be
no assurance that this improvement will continue or that another recession will not occur. Economic pressure on consumers and uncertainty regarding continuing economic improvement may result in changes in consumer and business spending, borrowing,
and savings habits. Such conditions could adversely affect the credit quality of our loans and our business, financial condition, and results of operations.
Stock Repurchase Program
CTBI’s stock repurchase program began in December 1998 with the authorization to acquire up to 500,000 shares
and was increased by an additional 1,000,000 shares in both July 2000 and May 2003. We have not repurchased any shares of our common stock since February 2008. There are currently 67,371 shares remaining under CTBI’s current repurchase
authorization. As of December 31, 2018, a total of 2,432,629 shares have been repurchased through this program. The following table shows Board authorizations and repurchases made through the stock repurchase program for the years 1998 through
2018:
|
Board Authorizations
|
Repurchases*
|
Shares Available for Repurchase
|
||
|
Average Price ($)
|
# of Shares
|
|||
|
1998
|
500,000
|
-
|
0
|
|
|
1999
|
0
|
14.45
|
144,669
|
|
|
2000
|
1,000,000
|
10.25
|
763,470
|
|
|
2001
|
0
|
13.35
|
489,440
|
|
|
2002
|
0
|
17.71
|
396,316
|
|
|
2003
|
1,000,000
|
19.62
|
259,235
|
|
|
2004
|
0
|
23.14
|
60,500
|
|
|
2005
|
0
|
-
|
0
|
|
|
2006
|
0
|
-
|
0
|
|
|
2007
|
0
|
28.56
|
216,150
|
|
|
2008
|
0
|
25.53
|
102,850
|
|
|
2009-2018
|
0
|
-
|
0
|
|
|
Total
|
2,500,000
|
15.93
|
2,432,629
|
67,371
|
*Repurchased shares and average prices have been restated to reflect stock dividends that have occurred; however, board
authorized shares have not been adjusted.
Critical Accounting Policies and Estimates
The preparation of consolidated financial statements in conformity with accounting principles generally
accepted in the United States of America requires the appropriate application of certain accounting policies, many of which require us to make estimates and assumptions about future events and their impact on amounts reported in our consolidated
financial statements and related notes. Since future events and their impact cannot be determined with certainty, the actual results will inevitably differ from our estimates. Such differences could be material to the consolidated financial
statements.
We believe the application of accounting policies and the estimates required therein are reasonable. These
accounting policies and estimates are constantly reevaluated, and adjustments are made when facts and circumstances dictate a change. Historically, we have found our application of accounting policies to be appropriate, and actual results have not
differed materially from those determined using necessary estimates.
Our accounting policies are described in note 1 to the consolidated financial statements. We have identified
the following critical accounting policies:
Investments – Management determines the classification of securities at purchase. We classify debt securities into
held-to-maturity, trading, or available-for-sale categories. Held-to-maturity securities are those which we have the positive intent and ability to hold to maturity and are reported at amortized cost. In accordance with Financial Accounting
Standards Board Accounting Standards Codification (“ASC”) 320, Investments – Debt Securities, investments in debt securities that are not classified as
held-to-maturity shall be classified in one of the following categories and measured at fair value in the statement of financial position:
a. Trading securities. Securities that are bought and held principally for the purpose of selling them in the near term (thus held for only a short period of time) shall be classified as trading securities. Trading generally reflects active and frequent buying and selling, and trading securities are generally used with the objective of generating profits on
short-term differences in price.
b. Available-for-sale securities. Investments not classified as trading
securities (nor as held-to-maturity securities) shall be classified as available-for-sale securities.
We do not have any securities that are classified as trading securities.
Available-for-sale securities are reported at fair value, with unrealized gains and losses included as a separate component of shareholders’ equity, net of tax. If declines in fair value are other than temporary, the carrying value of the securities
is written down to fair value as a realized loss with a charge to income for the portion attributable to credit losses and a charge to other comprehensive income for the portion that is not credit related.
Gains or losses on disposition of debt securities are computed by specific identification for those
securities. Interest and dividend income, adjusted by amortization of purchase premium or discount, is included in earnings.
When the fair value of a security is below its amortized cost, and depending on the length of time the
condition exists and the extent the fair market value is below amortized cost, additional analysis is performed to determine whether an other than temporary impairment condition exists. Available-for-sale and held-to-maturity securities are analyzed
quarterly for possible other than temporary impairment. The analysis considers (i) whether we have the intent to sell our securities prior to recovery and/or maturity and (ii) whether it is more likely than not that we will not have to sell our
securities prior to recovery and/or maturity. Often, the information available to conduct these assessments is limited and rapidly changing, making estimates of fair value subject to judgment. If actual information or conditions are different than
estimated, the extent of the impairment of the security may be different than previously estimated, which could have a material effect on CTBI’s results of operations and financial condition.
Subsequent to the effective date of ASU 2016-01, ASC 320 applies only to debt securities and ASC 321, Investments – Equity Securities, applies to equity securities. ASC 321 requires equity investments (except those accounted for under the equity method and
those that result in the consolidation of the investee) to be measured at fair value, with changes in fair values recognized in net income.
Equity securities with a readily determinable fair value are required to be measured at fair value, with
changes in fair value recognized through net income. Equity securities without a readily determinable fair value are carried at cost, less any impairment, if any, plus or minus changes resulting from observable price changes for identical or similar
investments. An election can be made, as permitted by ASC 321-10-35-2, to subsequently measure an equity security without a readily determinable fair value, at fair value. Equity securities held by CTBI include securities without readily
determinable fair values. CTBI has elected to account for these securities at fair value. The fair value of these securities was determined by a third party service provider using Level 3 inputs as defined in ASC 820, Fair Value Measurement, and changes in fair value are recognized in income.
Loans – Loans with the ability and the intent to be held until maturity and/or payoff are reported at the carrying value of unpaid principal reduced by unearned
interest, an allowance for loan and lease losses, and unamortized deferred fees or costs. Income is recorded on the level yield basis. Interest accrual is discontinued when management believes, after considering economic and business conditions,
collateral value, and collection efforts, that the borrower’s financial condition is such that collection of interest is doubtful. Any loan greater than 90 days past due must be well secured and in the process of collection to continue accruing
interest. Cash payments received on nonaccrual loans generally are applied against principal, and interest income is only recorded once principal recovery is reasonably assured. Loans are not reclassified as accruing until principal and interest
payments remain current for a period of time, generally six months, and future payments appear reasonably certain. Included in certain loan categories of impaired loans are troubled debt restructurings that were classified as impaired. A restructuring of a debt constitutes a troubled debt restructuring if the creditor for economic or legal reasons related to the debtor’s financial difficulties grants
a concession to the debtor that it would not otherwise consider.
Loan origination and commitment fees and certain direct loan origination costs are deferred and the net
amount amortized over the estimated life of the related loans, leases, or commitments as a yield adjustment.
Allowance for Loan
and Lease Losses – We maintain an allowance for loan and lease losses (“ALLL”) at a level that is appropriate to cover estimated credit losses
on individually evaluated loans determined to be impaired, as well as estimated credit losses inherent in the remainder of the loan and lease portfolio. Credit losses are charged and recoveries are credited to the ALLL.
We utilize an internal risk grading system for commercial credits. Those larger commercial credits that
exhibit probable or observed credit weaknesses are subject to individual review. The borrower’s cash flow, adequacy of collateral coverage, and other options available to CTBI, including legal remedies, are evaluated. The review of individual loans
includes those loans that are impaired as defined by ASC 310-10-35, Impairment of a Loan. We evaluate the collectability of both principal and interest
when assessing the need for loss provision. Historical loss rates are analyzed and applied to other commercial loans not subject to specific allocations. The ALLL allocation for this pool of commercial loans is established based on the historical
average, maximum, minimum, and median loss ratios.
A loan is considered impaired when, based on current information and events, it is probable that CTBI will be
unable to collect the scheduled payments of principal or interest when due according to the contractual terms of the loan agreement. Factors considered by management in determining impairment include payment status, collateral value, and the
probability of collecting scheduled principal and interest payments when due. Loans that experience insignificant payment delays and payment shortfalls generally are not classified as impaired. Management determines the significance of payment
delays and payment shortfalls on a case-by-case basis, taking into consideration all of the circumstances surrounding the loan and the borrower, including the length of the delay, the reasons for the delay, the borrower’s prior payment record, and
the amount of the shortfall in relation to the principal and interest owed. Impairment is measured on a loan-by-loan basis for commercial and construction loans by either the present value of expected future cash flows discounted at the loan’s
effective interest rate, the loan’s obtainable market price, or the fair value of the collateral if the loan is collateral dependent.
Homogenous loans, such as consumer installment, residential mortgages, and home equity lines are not
individually risk graded. The associated ALLL for these loans is measured under ASC 450, Contingencies.
When any secured commercial loan is considered uncollectable, whether past due or not, a current assessment
of the value of the underlying collateral is made. If the balance of the loan exceeds the fair value of the collateral, the loan is placed on nonaccrual and the loan is charged down to the value of the collateral less estimated cost to sell or a
specific reserve equal to the difference between book value of the loan and the fair value assigned to the collateral is created until such time as the loan is foreclosed. When the foreclosed collateral has been legally assigned to CTBI, the
estimated fair value of the collateral less costs to sell is then transferred to other real estate owned or other repossessed assets, and a charge-off is taken for any remaining balance. When any unsecured commercial loan is considered uncollectable
the loan is charged off no later than at 90 days past due.
All closed-end consumer loans (excluding conventional 1-4 family residential loans and installment and
revolving loans secured by real estate) are charged off no later than 120 days (5 monthly payments) delinquent. If a loan is considered uncollectable, it is charged off earlier than 120 days delinquent. For conventional 1-4 family residential loans
and installment and revolving loans secured by real estate, when a loan is 90 days past due, a current assessment of the value of the real estate is made. If the balance of the loan exceeds the fair value of the property, the loan is placed on
nonaccrual. Foreclosure proceedings are normally initiated after 120 days. When the foreclosed property has been legally assigned to CTBI, the fair value less estimated costs to sell is transferred to other real estate owned and the remaining
balance is taken as a charge-off.
Historical loss rates for loans are adjusted for significant factors that, in management’s judgment, reflect
the impact of any current conditions on loss recognition. We use twelve rolling quarters for our historical loss rate analysis. Factors that we consider include delinquency trends, current economic conditions and trends, strength of supervision and
administration of the loan portfolio, levels of underperforming loans, level of recoveries to prior year’s charge-offs, trends in loan losses, industry concentrations and their relative strengths, amount of unsecured loans, and underwriting
exceptions. Management continually reevaluates the other subjective factors included in its ALLL analysis.
Other Real Estate
Owned – When foreclosed properties are acquired, appraisals are obtained and the properties are booked at the current fair market value less expected sales costs. Additionally, periodic updated appraisals are obtained on unsold foreclosed
properties. When an updated appraisal reflects a fair market value below the current book value, a charge is booked to current earnings to reduce the property to its new fair market value less expected sales costs. Our policy for determining the
frequency of periodic reviews is based upon consideration of the specific properties and the known or perceived market fluctuations in a particular market and is typically between 12 and 18 months but generally not more than 24 months. All revenues and expenses related to the carrying of other real estate owned are recognized through the income statement.
Income Taxes
– Income tax expense is based on the taxes due on the consolidated tax return plus deferred taxes based on the expected future tax benefits and consequences of temporary differences between carrying amounts and tax bases of assets and liabilities,
using enacted tax rates. Any interest and penalties incurred in connection with income taxes are recorded as a component of income tax expense in the consolidated financial statements. During the years ended December 31, 2018, 2017, and 2016, CTBI
has not recognized a significant amount of interest expense or penalties in connection with income taxes.
CTBI currently does not engage in any hedging activity or any derivative activity which management considers
material. Analysis of CTBI’s interest rate sensitivity can be found in the Interest Rate Risk section of Item 7. Management’s Discussion and Analysis of Financial Condition and Results of Operations.
Community Trust Bancorp, Inc.
Consolidated Balance Sheets
|
(dollars in thousands)
December 31
|
2018
|
2017
|
||||||
|
Assets:
|
||||||||
|
Cash and due from banks
|
$
|
64,632
|
$
|
47,528
|
||||
|
Interest bearing deposits
|
75,718
|
127,746
|
||||||
|
Federal funds sold
|
1,100
|
0
|
||||||
|
Cash and cash equivalents
|
141,450
|
175,274
|
||||||
|
Certificates of deposit in other banks
|
3,920
|
9,800
|
||||||
|
Securities available-for-sale at fair value (amortized cost of $602,114 and $590,199, respectively)
|
593,746
|
585,761
|
||||||
|
Securities held-to-maturity at amortized cost (fair value of $649 and $660, respectively)
|
649
|
659
|
||||||
|
Equity securities at fair value
|
1,173
|
0
|
||||||
|
Loans held for sale
|
2,461
|
1,033
|
||||||
|
Loans
|
3,208,638
|
3,122,940
|
||||||
|
Allowance for loan and lease losses
|
(35,908
|
)
|
(36,151
|
)
|
||||
|
Net loans
|
3,172,730
|
3,086,789
|
||||||
|
Premises and equipment, net
|
45,291
|
46,318
|
||||||
|
Federal Home Loan Bank stock
|
14,713
|
17,927
|
||||||
|
Federal Reserve Bank stock
|
4,887
|
4,887
|
||||||
|
Goodwill
|
65,490
|
65,490
|
||||||
|
Bank owned life insurance
|
67,076
|
65,354
|
||||||
|
Mortgage servicing rights
|
3,607
|
3,484
|
||||||
|
Other real estate owned
|
27,273
|
31,996
|
||||||
|
Other assets
|
57,150
|
41,459
|
||||||
|
Total assets
|
$
|
4,201,616
|
$
|
4,136,231
|
||||
|
Liabilities and shareholders’ equity:
|
||||||||
|
Deposits:
|
||||||||
|
Noninterest bearing
|
$
|
803,316
|
$
|
790,930
|
||||
|
Interest bearing
|
2,502,634
|
2,472,933
|
||||||
|
Total deposits
|
3,305,950
|
3,263,863
|
||||||
|
Repurchase agreements
|
232,712
|
243,814
|
||||||
|
Federal funds purchased
|
1,180
|
7,312
|
||||||
|
Advances from Federal Home Loan Bank
|
436
|
845
|
||||||
|
Long-term debt
|
59,341
|
59,341
|
||||||
|
Deferred taxes
|
3,363
|
4,434
|
||||||
|
Other liabilities
|
34,484
|
25,923
|
||||||
|
Total liabilities
|
3,637,466
|
3,605,532
|
||||||
|
Commitments and contingencies (notes 18 and 20)
|
||||||||
|
Shareholders’ equity:
|
||||||||
|
Preferred stock, 300,000 shares authorized and unissued
|
-
|
-
|
||||||
|
Common stock, $5 par value, shares authorized 25,000,000; shares outstanding 2018 – 17,732,853; 2017 – 17,692,912
|
88,665
|
88,465
|
||||||
|
Capital surplus
|
223,161
|
221,472
|
||||||
|
Retained earnings
|
258,935
|
224,268
|
||||||
|
Accumulated other comprehensive loss, net of tax
|
(6,611
|
)
|
(3,506
|
)
|
||||
|
Total shareholders’ equity
|
564,150
|
530,699
|
||||||
|
Total liabilities and shareholders’ equity
|
$
|
4,201,616
|
$
|
4,136,231
|
||||
Consolidated Statements of Income and Comprehensive Income
|
(in thousands except per share data)
Year Ended December 31
|
2018
|
2017
|
2016
|
|||||||||
|
Interest income:
|
||||||||||||
|
Interest and fees on loans, including loans held for sale
|
$
|
154,552
|
$
|
141,497
|
$
|
133,965
|
||||||
|
Interest and dividends on securities:
|
||||||||||||
|
Taxable
|
10,015
|
8,715
|
8,265
|
|||||||||
|
Tax exempt
|
2,796
|
3,011
|
2,718
|
|||||||||
|
Dividends on Federal Reserve Bank and Federal Home Loan Bank stock
|
1,303
|
1,189
|
1,011
|
|||||||||
|
Interest on Federal Reserve Bank deposits
|
2,525
|
1,068
|
536
|
|||||||||
|
Other, including interest on federal funds sold
|
259
|
216
|
81
|
|||||||||
|
Total interest income
|
171,450
|
155,696
|
146,576
|
|||||||||
|
Interest expense:
|
||||||||||||
|
Interest on deposits
|
23,714
|
14,350
|
10,921
|
|||||||||
|
Interest on repurchase agreements and federal funds purchased
|
3,312
|
1,832
|
1,155
|
|||||||||
|
Interest on advances from Federal Home Loan Bank
|
27
|
427
|
62
|
|||||||||
|
Interest on long-term debt
|
2,242
|
1,685
|
1,417
|
|||||||||
|
Total interest expense
|
29,295
|
18,294
|
13,555
|
|||||||||
|
Net interest income
|
142,155
|
137,402
|
133,021
|
|||||||||
|
Provision for loan losses
|
6,167
|
7,521
|
7,872
|
|||||||||
|
Net interest income after provision for loan losses
|
135,988
|
129,881
|
125,149
|
|||||||||
|
Noninterest income:
|
||||||||||||
|
Service charges on deposit accounts
|
25,974
|
25,121
|
24,966
|
|||||||||
|
Gains on sales of loans, net
|
1,288
|
1,320
|
1,831
|
|||||||||
|
Trust and wealth management income
|
11,313
|
10,453
|
9,585
|
|||||||||
|
Loan related fees
|
3,729
|
3,678
|
4,107
|
|||||||||
|
Bank owned life insurance
|
3,672
|
2,172
|
2,199
|
|||||||||
|
Brokerage revenue
|
1,354
|
1,324
|
1,314
|
|||||||||
|
Securities gains (losses)
|
(85
|
)
|
73
|
522
|
||||||||
|
Other noninterest income
|
4,707
|
4,367
|
3,917
|
|||||||||
|
Total noninterest income
|
51,952
|
48,508
|
48,441
|
|||||||||
|
Noninterest expense:
|
||||||||||||
|
Officer salaries and employee benefits
|
12,906
|
11,823
|
12,198
|
|||||||||
|
Other salaries and employee benefits
|
48,656
|
47,006
|
44,877
|
|||||||||
|
Occupancy, net
|
8,167
|
8,072
|
7,999
|
|||||||||
|
Equipment
|
2,878
|
3,049
|
2,950
|
|||||||||
|
Data processing
|
6,680
|
7,100
|
6,497
|
|||||||||
|
Bank franchise tax
|
6,557
|
5,478
|
5,671
|
|||||||||
|
Legal fees
|
1,637
|
1,668
|
1,906
|
|||||||||
|
Professional fees
|
2,093
|
1,991
|
1,890
|
|||||||||
|
Advertising and marketing
|
2,995
|
2,721
|
2,614
|
|||||||||
|
FDIC insurance
|
1,171
|
1,239
|
1,789
|
|||||||||
|
Other real estate owned provision and expense
|
4,324
|
4,500
|
2,879
|
|||||||||
|
Repossession expense
|
1,249
|
911
|
1,156
|
|||||||||
|
Amortization of limited partnership investments
|
2,527
|
2,419
|
2,623
|
|||||||||
|
Other noninterest expense
|
15,558
|
11,901
|
12,077
|
|||||||||
|
Total noninterest expense
|
117,398
|
109,878
|
107,126
|
|||||||||
|
Income before income taxes
|
70,542
|
68,511
|
66,464
|
|||||||||
|
Income taxes
|
11,314
|
17,018
|
19,118
|
|||||||||
|
Net income
|
$
|
59,228
|
$
|
51,493
|
$
|
47,346
|
||||||
|
Other comprehensive loss:
|
||||||||||||
|
Unrealized holding losses on securities available-for-sale:
|
||||||||||||
|
Unrealized holding losses arising during the period
|
(5,393
|
)
|
(820
|
)
|
(4,578
|
)
|
||||||
|
Less: Reclassification adjustments for realized gains (losses) included in net income
|
(821
|
)
|
73
|
522
|
||||||||
|
Tax benefit
|
(960
|
)
|
(312
|
)
|
(1,785
|
)
|
||||||
|
Other comprehensive loss, net of tax
|
(3,612
|
)
|
(581
|
)
|
(3,315
|
)
|
||||||
|
Comprehensive income
|
$
|
55,616
|
$
|
50,912
|
$
|
44,031
|
||||||
|
Basic earnings per share
|
$
|
3.35
|
$
|
2.92
|
$
|
2.70
|
||||||
|
Diluted earnings per share
|
$
|
3.35
|
$
|
2.92
|
$
|
2.70
|
||||||
|
Weighted average shares outstanding-basic
|
17,687
|
17,631
|
17,548
|
|||||||||
|
Weighted average shares outstanding-diluted
|
17,703
|
17,653
|
17,566
|
|||||||||
|
Dividends declared per share
|
$
|
1.38
|
$
|
1.30
|
$
|
1.26
|
||||||
Consolidated Statements of Changes in Shareholders’ Equity
|
(in thousands except per share and share amounts)
|
Common Shares
|
Common Stock
|
Capital Surplus
|
Retained Earnings
|
Accumulated Other Comprehensive Income (Loss), Net of Tax
|
Total
|
||||||||||||||||||
|
Balance, January 1, 2016
|
17,536,914
|
$
|
87,685
|
$
|
217,032
|
$
|
169,855
|
$
|
1,011
|
$
|
475,583
|
|||||||||||||
|
Net income
|
47,346
|
47,346
|
||||||||||||||||||||||
|
Other comprehensive loss, net of tax of $(1,785)
|
(3,315
|
)
|
(3,315
|
)
|
||||||||||||||||||||
|
Cash dividends declared ($1.26 per share)
|
(22,123
|
)
|
(22,123
|
)
|
||||||||||||||||||||
|
Issuance of common stock
|
138,605
|
693
|
2,292
|
2,985
|
||||||||||||||||||||
|
Repurchase of common stock
|
(11,574
|
)
|
(57
|
)
|
(325
|
)
|
(382
|
)
|
||||||||||||||||
|
Vesting of restricted stock
|
(52,963
|
)
|
(265
|
)
|
265
|
0
|
||||||||||||||||||
|
Issuance of restricted stock
|
18,069
|
90
|
(90
|
)
|
0
|
|||||||||||||||||||
|
Forfeiture of restricted stock
|
(356
|
)
|
(2
|
)
|
2
|
0
|
||||||||||||||||||
|
Stock-based compensation and related excess tax benefits
|
521
|
521
|
||||||||||||||||||||||
|
Balance, December 31, 2016
|
17,628,695
|
88,144
|
219,697
|
195,078
|
(2,304
|
)
|
500,615
|
|||||||||||||||||
|
Net income
|
51,493
|
51,493
|
||||||||||||||||||||||
|
Other comprehensive loss, net of tax of $(312)
|
(581
|
)
|
(581
|
)
|
||||||||||||||||||||
|
Cash dividends declared ($1.30 per share)
|
(22,924
|
)
|
(22,924
|
)
|
||||||||||||||||||||
|
Issuance of common stock
|
55,191
|
276
|
1,237
|
1,513
|
||||||||||||||||||||
|
Repurchase of common stock
|
0
|
0
|
0
|
0
|
||||||||||||||||||||
|
Vesting of restricted stock
|
(11,965
|
)
|
(60
|
)
|
60
|
0
|
||||||||||||||||||
|
Issuance of restricted stock
|
23,668
|
118
|
(118
|
)
|
0
|
|||||||||||||||||||
|
Forfeiture of restricted stock
|
(2,677
|
)
|
(13
|
)
|
13
|
0
|
||||||||||||||||||
|
Stock-based compensation and related excess tax benefits
|
583
|
583
|
||||||||||||||||||||||
|
Implementation of ASU 2018-02
|
621
|
(621
|
)
|
0
|
||||||||||||||||||||
|
Balance, December 31, 2017
|
17,692,912
|
88,465
|
221,472
|
224,268
|
(3,506
|
)
|
530,699
|
|||||||||||||||||
|
Net income
|
59,228
|
59,228
|
||||||||||||||||||||||
|
Other comprehensive loss, net of tax of $(960)
|
(3,612
|
)
|
(3,612
|
)
|
||||||||||||||||||||
|
Cash dividends declared ($1.38 per share)
|
(24,412
|
)
|
(24,412
|
)
|
||||||||||||||||||||
|
Issuance of common stock
|
42,133
|
211
|
1,019
|
1,230
|
||||||||||||||||||||
|
Vesting of restricted stock
|
(11,997
|
)
|
(60
|
)
|
60
|
0
|
||||||||||||||||||
|
Issuance of restricted stock
|
11,320
|
57
|
(57
|
)
|
0
|
|||||||||||||||||||
|
Forfeiture of restricted stock
|
(1,515
|
)
|
(8
|
)
|
8
|
0
|
||||||||||||||||||
|
Stock-based compensation
|
659
|
659
|
||||||||||||||||||||||
|
Implementation of ASU 2014-09
|
358
|
358
|
||||||||||||||||||||||
|
Implementation of ASU 2016-01
|
(507
|
)
|
507
|
0
|
||||||||||||||||||||
|
Balance, December 31, 2018
|
17,732,853
|
$
|
88,665
|
$
|
223,161
|
$
|
258,935
|
$
|
(6,611
|
)
|
$
|
564,150
|
||||||||||||
Consolidated Statements of Cash Flows
|
(in thousands)
Year Ended December 31
|
2018
|
2017
|
2016
|
|||||||||
|
Cash flows from operating activities:
|
||||||||||||
|
Net income
|
$
|
59,228
|
$
|
51,493
|
$
|
47,346
|
||||||
|
Adjustments to reconcile net income to net cash provided by operating activities:
|
||||||||||||
|
Depreciation and amortization
|
3,786
|
4,007
|
3,904
|
|||||||||
|
Deferred taxes
|
(246
|
)
|
(3,090
|
)
|
701
|
|||||||
|
Stock-based compensation
|
710
|
636
|
458
|
|||||||||
|
Excess tax benefits of stock-based compensation
|
0
|
0
|
100
|
|||||||||
|
Provision for loan losses
|
6,167
|
7,521
|
7,872
|
|||||||||
|
Write-downs of other real estate owned and other repossessed assets
|
2,530
|
3,034
|
1,214
|
|||||||||
|
Gains on sale of loans held for sale
|
(1,288
|
)
|
(1,320
|
)
|
(1,831
|
)
|
||||||
|
Securities (gains) losses
|
85
|
(73
|
)
|
(522
|
)
|
|||||||
|
Gain on debt repurchase
|
0
|
(560
|
)
|
0
|
||||||||
|
Gains (losses) on sale of assets, net
|
(175
|
)
|
40
|
46
|
||||||||
|
Proceeds from sale of mortgage loans held for sale
|
56,689
|
59,400
|
81,441
|
|||||||||
|
Funding of mortgage loans held for sale
|
(56,829
|
)
|
(57,869
|
)
|
(79,682
|
)
|
||||||
|
Amortization of securities premiums and discounts, net
|
4,679
|
3,437
|
2,452
|
|||||||||
|
Change in cash surrender value of bank owned life insurance
|
(2,924
|
)
|
(1,473
|
)
|
(1,546
|
)
|
||||||
|
Mortgage servicing rights:
|
||||||||||||
|
Fair value adjustments
|
343
|
361
|
324
|
|||||||||
|
New servicing assets created
|
(466
|
)
|
(412
|
)
|
(521
|
)
|
||||||
|
Changes in:
|
||||||||||||
|
Other assets
|
(15,788
|
)
|
(4,412
|
)
|
(3,205
|
)
|
||||||
|
Other liabilities
|
8,986
|
1,631
|
2,874
|
|||||||||
|
Net cash provided by operating activities
|
65,487
|
62,351
|
61,425
|
|||||||||
|
Cash flows from investing activities:
|
||||||||||||
|
Certificates of deposit in other banks:
|
||||||||||||
|
Purchase of certificates of deposit
|
0
|
(11,760
|
)
|
0
|
||||||||
|
Maturity of certificates of deposit
|
5,880
|
2,940
|
2,852
|
|||||||||
|
Securities available-for-sale (AFS):
|
||||||||||||
|
Purchase of AFS securities
|
(281,511
|
)
|
(231,680
|
)
|
(176,236
|
)
|
||||||
|
Proceeds from sales of AFS securities
|
153,315
|
87,472
|
54,446
|
|||||||||
|
Proceeds from prepayments, calls, and maturities of AFS securities
|
109,701
|
159,584
|
104,302
|
|||||||||
|
Securities held-to-maturity (HTM):
|
||||||||||||
|
Proceeds from prepayments and maturities of HTM securities
|
10
|
207
|
795
|
|||||||||
|
Change in loans, net
|
(93,151
|
)
|
(194,548
|
)
|
(74,379
|
)
|
||||||
|
Purchase of premises and equipment
|
(2,832
|
)
|
(2,400
|
)
|
(3,498
|
)
|
||||||
|
Proceeds from sale and retirement of premises and equipment
|
97
|
25
|
10
|
|||||||||
|
Redemption of stock by Federal Home Loan Bank
|
3,214
|
0
|
0
|
|||||||||
|
Proceeds from sale of other real estate owned and repossessed assets
|
3,485
|
3,574
|
5,601
|
|||||||||
|
Proceeds from settlement of bank owned life insurance
|
1,202
|
0
|
0
|
|||||||||
|
Net cash used in investing activities
|
(100,590
|
)
|
(186,586
|
)
|
(86,107
|
)
|
||||||
|
Cash flows from financing activities:
|
||||||||||||
|
Change in deposits, net
|
42,087
|
182,555
|
100,526
|
|||||||||
|
Change in repurchase agreements and federal funds purchased, net
|
(17,234
|
)
|
(4,755
|
)
|
1,060
|
|||||||
|
Advances from Federal Home Loan Bank
|
0
|
350,000
|
50,000
|
|||||||||
|
Payments on advances from Federal Home Loan Bank
|
(409
|
)
|
(350,099
|
)
|
(150,112
|
)
|
||||||
|
Repurchase of long-term debt
|
0
|
(1,440
|
)
|
0
|
||||||||
|
Issuance of common stock
|
1,230
|
1,513
|
2,985
|
|||||||||
|
Repurchase of common stock
|
0
|
0
|
(382
|
)
|
||||||||
|
Excess tax benefits of stock-based compensation
|
0
|
0
|
(100
|
)
|
||||||||
|
Dividends paid
|
(24,395
|
)
|
(22,981
|
)
|
(22,190
|
)
|
||||||
|
Net cash provided by (used in) financing activities
|
1,279
|
154,793
|
(18,213
|
)
|
||||||||
|
Net increase (decrease) in cash and cash equivalents
|
(33,824
|
)
|
30,558
|
(42,895
|
)
|
|||||||
|
Cash and cash equivalents at beginning of year
|
175,274
|
144,716
|
187,611
|
|||||||||
|
Cash and cash equivalents at end of year
|
$
|
141,450
|
$
|
175,274
|
$
|
144,716
|
||||||
|
Supplemental disclosures:
|
||||||||||||
|
Income taxes paid
|
$
|
9,700
|
$
|
21,400
|
$
|
19,244
|
||||||
|
Interest paid
|
28,621
|
17,266
|
13,426
|
|||||||||
|
Non-cash activities:
|
||||||||||||
|
Loans to facilitate the sale of other real estate owned and repossessed assets
|
4,385
|
2,679
|
3,964
|
|||||||||
|
Common stock dividends accrued, paid in subsequent quarter
|
221
|
205
|
209
|
|||||||||
|
Real estate acquired in settlement of loans
|
5,459
|
5,235
|
5,900
|
|||||||||
1. Accounting Policies
Basis of
Presentation – The consolidated financial statements include Community Trust Bancorp, Inc. (“CTBI”) and its subsidiaries, including its principal subsidiary, Community Trust Bank, Inc. (“CTB”). Intercompany transactions and accounts have
been eliminated in consolidation.
Nature of Operations
– Substantially all assets, liabilities, revenues, and expenses are related to banking operations, including lending, investing of funds, obtaining of deposits, trust and wealth management operations, full service brokerage operations, and other
financing activities. All of our business offices and the majority of our business are located in eastern, northeastern, central, and south central Kentucky, southern West Virginia, and northeastern Tennessee.
Use of Estimates
– In preparing the consolidated financial statements, management must make certain estimates and assumptions. These estimates and assumptions affect the amounts reported for assets, liabilities, revenues, and expenses, as well as affecting the
disclosures provided. Future results could differ from the current estimates. Such estimates include, but are not limited to, the allowance for loan and lease losses, valuation of other real estate owned, fair value of securities and mortgage
servicing rights, goodwill, and valuation of deferred tax assets.
The accompanying financial statements have been prepared using values and information currently available to
CTBI.
Given the volatility of current economic conditions, the values of assets and liabilities recorded in the
financial statements could change rapidly, resulting in material future adjustments in asset values, the allowance for loan and lease losses, and capital.
Cash and Cash
Equivalents – CTBI considers all liquid investments with original maturities of three months or less to be cash equivalents. Cash and cash equivalents include cash on hand, amounts due from banks, interest bearing deposits in other
financial institutions, and federal funds sold. Generally, federal funds are sold for one-day periods.
Certificates of
Deposit in Other Banks – Certificates of deposit in other banks generally mature within 18 months and are carried at cost.
Investments – Management determines the classification of securities at purchase. We classify debt securities into
held-to-maturity, trading, or available-for-sale categories. Held-to-maturity securities are those which we have the positive intent and ability to hold to maturity and are reported at amortized cost. In accordance with Financial Accounting
Standards Board Accounting Standards Codification (“ASC”) 320, Investments – Debt Securities, investments in debt securities that are not classified as
held-to-maturity shall be classified in one of the following categories and measured at fair value in the statement of financial position:
a. Trading securities. Securities that are bought and held principally for the purpose of selling them in the near term (thus held for only a short period of time) shall be classified as trading securities. Trading generally reflects active and frequent buying and selling, and trading securities are generally used with the objective of generating profits on
short-term differences in price.
b. Available-for-sale securities. Investments not classified as trading
securities (nor as held-to-maturity securities) shall be classified as available-for-sale securities.
We do not have any securities that are classified as trading securities.
Available-for-sale securities are reported at fair value, with unrealized gains and losses included as a separate component of shareholders’ equity, net of tax. If declines in fair value are other than temporary, the carrying value of the securities
is written down to fair value as a realized loss with a charge to income for the portion attributable to credit losses and a charge to other comprehensive income for the portion that is not credit related.
Gains or losses on disposition of debt securities are computed by specific identification for those
securities. Interest and dividend income, adjusted by amortization of purchase premium or discount, is included in earnings.
When the fair value of a security is below its amortized cost, and depending on the length of time the
condition exists and the extent the fair market value is below amortized cost, additional analysis is performed to determine whether an other than temporary impairment condition exists. Available-for-sale and held-to-maturity securities are analyzed
quarterly for possible other than temporary impairment. The analysis considers (i) whether we have the intent to sell our securities prior to recovery and/or maturity and (ii) whether it is more likely than not that we will not have to sell our
securities prior to recovery and/or maturity. Often, the information available to conduct these assessments is limited and rapidly changing, making estimates of fair value subject to judgment. If actual information or conditions are different than
estimated, the extent of the impairment of the security may be different than previously estimated, which could have a material effect on CTBI’s results of operations and financial condition.
Subsequent to the January 1, 2018 effective date of ASU 2016-01, ASC 320 applies only to debt securities and
ASC 321, Investments – Equity Securities, applies to equity securities. ASC 321 requires equity investments (except those accounted for under the
equity method and those that result in the consolidation of the investee) to be measured at fair value, with changes in fair values recognized in net income.
Equity securities with a readily determinable fair value are required to be measured at fair value, with
changes in fair value recognized through net income. Equity securities without a readily determinable fair value are carried at cost, less any impairment, if any, plus or minus changes resulting from observable price changes for identical or similar
investments. An election can be made, as permitted by ASC 321-10-35-2, to subsequently measure an equity security without a readily determinable fair value, at fair value. Equity securities held by CTBI include securities without readily
determinable fair values. CTBI has elected to account for these securities at fair value. The fair value of these securities was determined by a third party service provider using Level 3 inputs as defined in ASC 820, Fair Value Measurement, and changes in fair value are recognized in income.
Loans – Loans with the ability and the intent to be held until maturity and/or payoff are reported at the carrying value of unpaid principal reduced by unearned
interest, an allowance for loan and lease losses, and unamortized deferred fees or costs. Income is recorded on the level yield basis. Interest accrual is discontinued when management believes, after considering economic and business conditions,
collateral value, and collection efforts, that the borrower’s financial condition is such that collection of interest is doubtful. Any loan greater than 90 days past due must be well secured and in the process of collection to continue accruing
interest. Cash payments received on nonaccrual loans generally are applied against principal, and interest income is only recorded once principal recovery is reasonably assured. Loans are not reclassified as accruing until principal and interest
payments remain current for a period of time, generally six months, and future payments appear reasonably certain. Included in certain loan categories of impaired loans are troubled debt restructurings that were classified as impaired. A restructuring of a debt constitutes a troubled debt restructuring if the creditor for economic or legal reasons related to the debtor’s financial difficulties grants
a concession to the debtor that it would not otherwise consider.
Loan origination and commitment fees and certain direct loan origination costs are deferred and the net
amount amortized over the estimated life of the related loans, leases, or commitments as a yield adjustment.
Allowance for Loan
and Lease Losses – We maintain an allowance for loan and lease losses (“ALLL”) at a level that is appropriate to cover estimated credit losses
on individually evaluated loans determined to be impaired, as well as estimated credit losses inherent in the remainder of the loan and lease portfolio. Credit losses are charged and recoveries are credited to the ALLL.
We utilize an internal risk grading system for commercial credits. Those larger commercial credits that
exhibit probable or observed credit weaknesses are subject to individual review. The borrower’s cash flow, adequacy of collateral coverage, and other options available to CTBI, including legal remedies, are evaluated. The review of individual loans
includes those loans that are impaired as defined by ASC 310-10-35, Impairment of a Loan. We evaluate the collectability of both principal and interest
when assessing the need for loss provision. Historical loss rates are analyzed and applied to other commercial loans not subject to specific allocations. The ALLL allocation for this pool of commercial loans is established based on the historical
average, maximum, minimum, and median loss ratios.
A loan is considered impaired when, based on current information and events, it is probable that CTBI will be
unable to collect the scheduled payments of principal or interest when due according to the contractual terms of the loan agreement. Factors considered by management in determining impairment include payment status, collateral value, and the
probability of collecting scheduled principal and interest payments when due. Loans that experience insignificant payment delays and payment shortfalls generally are not classified as impaired. Management determines the significance of payment
delays and payment shortfalls on a case-by-case basis, taking into consideration all of the circumstances surrounding the loan and the borrower, including the length of the delay, the reasons for the delay, the borrower’s prior payment record, and
the amount of the shortfall in relation to the principal and interest owed. Impairment is measured on a loan-by-loan basis for commercial and construction loans by either the present value of expected future cash flows discounted at the loan’s
effective interest rate, the loan’s obtainable market price, or the fair value of the collateral if the loan is collateral dependent.
Homogenous loans, such as consumer installment, residential mortgages, and home equity lines are not
individually risk graded. The associated ALLL for these loans is measured under ASC 450, Contingencies.
When any secured commercial loan is considered uncollectable, whether past due or not, a current assessment
of the value of the underlying collateral is made. If the balance of the loan exceeds the fair value of the collateral, the loan is placed on nonaccrual and the loan is charged down to the value of the collateral less estimated cost to sell or a
specific reserve equal to the difference between book value of the loan and the fair value assigned to the collateral is created until such time as the loan is foreclosed. When the foreclosed collateral has been legally assigned to CTBI, the
estimated fair value of the collateral less costs to sell is then transferred to other real estate owned or other repossessed assets, and a charge-off is taken for any remaining balance. When any unsecured commercial loan is considered uncollectable
the loan is charged off no later than at 90 days past due.
All closed-end consumer loans (excluding conventional 1-4 family residential loans and installment and
revolving loans secured by real estate) are charged off no later than 120 days (5 monthly payments) delinquent. If a loan is considered uncollectable, it is charged off earlier than 120 days delinquent. For conventional 1-4 family residential loans
and installment and revolving loans secured by real estate, when a loan is 90 days past due, a current assessment of the value of the real estate is made. If the balance of the loan exceeds the fair value of the property, the loan is placed on
nonaccrual. Foreclosure proceedings are normally initiated after 120 days. When the foreclosed property has been legally assigned to CTBI, the fair value less estimated costs to sell is transferred to other real estate owned and the remaining
balance is taken as a charge-off.
Historical loss rates for loans are adjusted for significant factors that, in management’s judgment, reflect
the impact of any current conditions on loss recognition. We use twelve rolling quarters for our historical loss rate analysis. Factors that we consider include delinquency trends, current economic conditions and trends, strength of supervision and
administration of the loan portfolio, levels of underperforming loans, level of recoveries to prior year’s charge-offs, trends in loan losses, industry concentrations and their relative strengths, amount of unsecured loans, and underwriting
exceptions. Management continually reevaluates the other subjective factors included in its ALLL analysis.
Loans Held for Sale
– Mortgage loans originated and intended for sale in the secondary market are carried at the lower of cost or estimated market value in the
aggregate. Net unrealized losses, if any, are recognized by charges to income. Gains and losses on loan sales are recorded in noninterest income.
Premises and
Equipment – Premises and equipment are stated at cost less accumulated depreciation and amortization. Capital leases are included in premises and equipment at the capitalized amount less accumulated amortization. Premises and equipment are
evaluated for impairment on a quarterly basis.
Depreciation and amortization are computed primarily using the straight-line method. Estimated useful lives
range up to 40 years for buildings, 2 to 10 years for furniture, fixtures, and equipment, and up to the lease term for leasehold improvements. Capitalized leased assets are amortized on a straight-line basis over the lives of the respective leases.
Federal Home Loan
Bank and Federal Reserve Stock – CTB is a member of the Federal Home Loan Bank (“FHLB”) system. Members are required to own a certain amount of stock based on the level of borrowings and other factors and may invest additional amounts.
FHLB stock is carried at cost, classified as a restricted security, and periodically evaluated for impairment based on the ultimate recovery par value. Both cash and stock dividends are reported as income.
CTB is also a member of its regional Federal Reserve Bank. Federal Reserve Bank stock is carried at cost,
classified as a restricted security, and periodically evaluated for impairment based on the ultimate recovery par value. Both cash and stock dividends are reported as income.
Other Real Estate
Owned – When foreclosed properties are acquired, appraisals are obtained and the properties are booked at the current fair market value less expected sales costs. Additionally, periodic updated appraisals are obtained on unsold foreclosed
properties. When an updated appraisal reflects a fair market value below the current book value, a charge is booked to current earnings to reduce the property to its new fair market value less expected sales costs. Our policy for determining the
frequency of periodic reviews is based upon consideration of the specific properties and the known or perceived market fluctuations in a particular market and is typically between 12 and 18 months but generally not more than 24 months. All revenues and expenses related to the carrying of other real estate owned are recognized through the income statement.
Goodwill and Core
Deposit Intangible – We evaluate total goodwill and core deposit intangible for impairment, based upon ASC 350, Intangibles-Goodwill and Other, using fair value techniques including multiples of price/equity. Goodwill and core deposit intangible are evaluated for impairment on an annual
basis or as other events may warrant.
The balance of goodwill, at $65.5 million, has not changed since January 1, 2015. Our core deposit
intangible has been fully amortized since December 31, 2017.
Transfers of
Financial Assets – Transfers of financial assets are accounted for as sales, when control over the assets has been surrendered. Control over
transferred assets is deemed to be surrendered when (1) the assets have been isolated from CTBI—put presumptively beyond the reach of the transferor and its creditors, even in bankruptcy or other receivership, (2) the transferee obtains the right
(free of conditions that constrain it from taking advantage of that right) to pledge or exchange the transferred assets, and (3) CTBI does not maintain effective control over the transferred assets through an agreement to repurchase them before their
maturity or the ability to unilaterally cause the holder to return specific assets.
Income Taxes
– Income tax expense is based on the taxes due on the consolidated tax return plus deferred taxes based on the expected future tax benefits and consequences of temporary differences between carrying amounts and tax bases of assets and liabilities,
using enacted tax rates. Any interest and penalties incurred in connection with income taxes are recorded as a component of income tax expense in the consolidated financial statements. During the years ended December 31, 2018, 2017, and 2016, CTBI
has not recognized a significant amount of interest expense or penalties in connection with income taxes.
Earnings Per Share
(“EPS”) – Basic EPS is calculated by dividing net income available to common shareholders by the weighted average number of common shares outstanding, excluding restricted shares.
Diluted EPS adjusts the number of weighted average shares of common stock outstanding by the dilutive effect
of stock options, including restricted shares, as prescribed in ASC 718, Share-Based Payment.
Segments – Management analyzes the operation of CTBI assuming one operating segment, community banking services. CTBI, through its operating subsidiaries, offers a
wide range of consumer and commercial community banking services. These services include: (i) residential and commercial real estate loans; (ii) checking accounts; (iii) regular and term savings accounts and savings certificates; (iv) full service
securities brokerage services; (v) consumer loans; (vi) debit cards; (vii) annuity and life insurance products; (viii) Individual Retirement Accounts and Keogh plans; (ix) commercial loans; (x) trust and wealth management services; (xi) commercial demand deposit accounts; and (xii) repurchase agreements.
Bank Owned Life
Insurance – CTBI’s bank owned life insurance policies are carried at their cash surrender value. We recognize tax-free income from the periodic
increases in cash surrender value of these policies and from death benefits.
Mortgage Servicing
Rights – Mortgage servicing rights (“MSRs”) are carried at fair market value following the accounting guidance in ASC 860-50, Servicing Assets and
Liabilities. MSRs are valued using Level 3 inputs as defined in ASC 820, Fair Value Measurements. The fair value is determined quarterly
based on an independent third-party valuation using a discounted cash flow analysis and calculated using a computer pricing model. The system used in this evaluation, Compass Point, attempts to quantify loan level idiosyncratic risk by calculating a
risk derived value. As a result, each loan’s unique characteristics determine the valuation assumptions ascribed to that loan. Additionally, the computer valuation is based on key economic assumptions including the prepayment speeds of the
underlying loans generated using the Andrew Davidson Prepayment Model, FHLMC/FNMA guidelines, the weighted-average life of the loan, the discount rate, the weighted-average coupon, and the weighted-average default rate, as applicable. Along with the
gains received from the sale of loans, fees are received for servicing loans. These fees include late fees, which are recorded in interest income, and ancillary fees and monthly servicing fees, which are recorded in noninterest income. Costs of
servicing loans are charged to expense as incurred. Changes in fair market value of the MSRs are reported as an increase or decrease to mortgage banking income.
Share-Based
Compensation – CTBI has a share-based employee compensation plan, which is described more fully in note 15 to the consolidated financial statements. CTBI accounts for this plan under the recognition and measurement principles of ASC 718, Share-Based Payment.
Comprehensive Income
– Comprehensive income consists of net income and other comprehensive income, net of applicable income taxes. Other comprehensive income includes unrealized appreciation (depreciation) on available-for-sale securities and unrealized appreciation
(depreciation) on available-for-sale securities for which a portion of an other than temporary impairment has been recognized in income.
Transfers between
Fair Value Hierarchy Levels – Transfers in and out of Level 1 (quoted market prices), Level 2 (other significant observable inputs), and Level 3
(significant unobservable inputs) are recognized on the period ending date.
Reclassifications –
Certain reclassifications considered to be immaterial have been made in the prior year consolidated financial statements to conform to current year classifications. These reclassifications had no effect on net income.
New
Accounting Standards –
Ø Financial Instruments – Overall – In January 2016, the Financial
Accounting Standards Board (“FASB”) issued Accounting Standard Update (“ASU”) No. 2016-01, Financial Instruments – Overall (Subtopic 825-10).
The amendments in this Update require all equity investments to be measured at fair value with changes in the fair value recognized through net income (other than those accounted for under equity method of accounting, those that result in
consolidation of the investee, and certain other investments). The amendments in this Update also require an entity to present separately in other comprehensive income the portion of the total change in the fair value of a liability resulting from a
change in the instrument-specific credit risk when the entity has elected to measure the liability at fair value in accordance with the fair value option for financial instruments. In addition, the amendments in this Update eliminate the requirement
to disclose the method(s) and significant assumptions used to estimate the fair value that is required to be disclosed for financial instruments measured at amortized cost on the balance sheet for public business entities. Public business entities
will be required to use the exit price notion when measuring the fair value of financial instruments for disclosure purposes. For public business entities, the amendments in this Update are effective for fiscal years beginning after December 15,
2017, including interim periods within those fiscal years. The amendments should be applied by means of a cumulative-effect adjustment to the balance sheet as of the beginning of the year of adoption. The amendments related to equity securities
without readily determinable fair values (including disclosure requirements) should be applied prospectively to equity investments that exist as of the date of adoption. At December 31, 2017, we had $25 million in equity securities with a net
unrealized loss of $0.6 million. Accordingly, an adjustment has been made as a cumulative effect adjustment to our consolidated balance sheet effective January 1, 2018. Note 17 below has been modified to reflect the changes in disclosure and the
use of a notional exit price.
In February 2018, the FASB issued ASU 2018-03, Technical Corrections and Improvements to Financial Instruments—Overall (Subtopic 825-10). This ASU included a technical correction to its guidance regarding equity securities, ASC
321-10-35-2, allowing an entity to subsequently elect to record an equity security without a readily determinable fair value. In 2018, CTBI made the election permitted by ASC 321-10-35-2, to record 9,918 shares of Visa Class B restricted stock,
which was transferred to CTBI by Visa in 2008, at fair value. If an entity subsequently elects to measure an equity security at fair value, the election is irrevocable and the entity must measure all identical or similar investments of the same
issuer, including future purchases of identical or similar investments of the same issuer, at fair value. Any resulting gains or losses on the securities for which that election is made must be recorded in earnings at the time of the election. On
December 31, 2018, CTBI recorded a $1.2 million gain on the recognition of the fair value of 9,918 Visa Class B shares held in its portfolio.
Ø Leases – In February 2016, the FASB issued ASU No. 2016-02, Leases
(Topic 842). ASU 2016-02 establishes a right of use model that requires a lessee to record a right of use asset and a lease liability for all leases with terms longer than 12 months. Leases will be classified as either finance or operating, with classification
affecting the pattern of expense recognition in the income statement. For lessors, the guidance modifies the classification criteria and the accounting for sales-type and direct financing leases. A lease will be treated as a sale if it transfers
all of the risks and rewards, as well as control of the underlying asset, to the lessee. If risks and rewards are conveyed without the transfer of control, the lease is treated as a financing. If the lessor does not convey risks and rewards or
control, an operating lease results. The amendments are effective for fiscal years beginning after December 15, 2018, including interim periods within those fiscal years for public business entities. Entities are required to use a modified
retrospective approach for leases that exist or are entered into after the beginning of the earliest comparative period in the financial statements, with certain practical expedients available.
In August 2018, the FASB issued ASU 2018-11, Leases (Topic 842): Targeted
Improvements. This ASU is intended to reduce costs and ease implementation of the leases standard for financial statement preparers. ASU 2018-11 provides a new transition method and a practical expedient for separating components of a contract.
Transition:
Comparative Reporting at Adoption
The amendments in ASU 2018-11 provide entities with an additional (and optional) transition method
to adopt the new leases standard. Under this new transition method, an entity initially applies the new leases standard at the adoption date and recognizes a cumulative-effect adjustment to the opening balance of retained earnings in the period of
adoption consistent with preparers’ requests. Consequently, an entity’s reporting for the comparative periods presented in the financial statements in which it adopts the new leases standard will continue to be in accordance with current GAAP in
Topic 840, Leases. An entity that elects this additional (and optional) transition method must provide the required Topic 840 disclosures for
all periods that continue to be in accordance with Topic 840. The amendments do not change the existing disclosure requirements in Topic 840 (for example, they do not create interim disclosure requirements that entities previously were not required
to provide).
Separating
Components of a Contract
The amendments in ASU 2018-11 provide lessors with a practical expedient, by class of underlying
asset, to not separate nonlease components from the associated lease component and, instead, to account for those components as a single component if the nonlease components otherwise would be accounted for under the new revenue guidance (Topic 606)
and both of the following are met:
|
·
|
The timing and pattern of transfer of the nonlease component(s) and associated lease
component are the same.
|
|
·
|
The lease component, if accounted for separately, would be classified as an operating
lease.
|
An entity electing this practical expedient (including an entity that accounts for the combined
component entirely in Topic 606) is required to disclose certain information, by class of underlying asset, as specified in the ASU.
We elected the practical expedient in our implementation at January 1, 2019.
Based on leases outstanding at December 31, 2018, the impact of adoption on January 1, 2019 was recording a lease liability of approximately $16.4 million, a right-of-use asset of approximately $15.9 million, and a cumulative-effect adjustment to
retained earnings of approximately $0.5 million.
Ø Revenue from Contracts with Customers – In May 2014, the FASB issued
ASU No. 2014-09, Revenue from Contracts with Customers. The core principle of ASU 2014-09 is that an entity should recognize revenue to depict the transfer of promised goods or services to customers in an amount that reflects the consideration to
which the entity expects to be entitled in exchange for those goods or services. The guidance also specifies the accounting for some costs to obtain or fulfill a contract with a customer, as well as enhanced disclosure requirements. In August 2015,
the FASB issued ASU 2015-14 which deferred the effective date of ASU 2014-09 to fiscal years, and interim reporting periods within those fiscal years, beginning after December 15, 2017. In March 2016, the FASB issued ASU 2016-08 which clarified the
revenue recognition implementation guidance on principal versus agent considerations and is effective during the same period as ASU 2014-09. In April 2016, the FASB issued ASU 2016-10 which clarified the revenue recognition guidance regarding the
identification of performance obligations and the licensing implementation and is effective during the same period as ASU 2014-09. In May 2016, the FASB issued ASU 2016-12 which narrowly amended the revenue recognition guidance regarding
collectability, noncash consideration, presentation of sales tax, and transition. ASU 2016-12 is effective during the same period as ASU 2014-09. At December 31, 2017, we had $0.5 million in deferred gains on sale of other real estate owned.
Accordingly, an adjustment has been made as a cumulative effect adjustment to our consolidated balance sheet effective January 1, 2018.
Accounting Standards Codification 606, Revenue from Contracts with Customers (“ASC 606”), establishes principles for reporting information about the nature, amount, timing and uncertainty of revenue and cash flows arising from the entity’s
contracts to provide goods or services to customers. The core principle requires an entity to recognize revenue to depict the transfer of goods or services to customers in an amount that reflects the consideration that it expects to be entitled to
receive in exchange for those goods or services recognized as performance obligations are satisfied.
The majority of our revenue-generating transactions are not subject to ASC 606, including revenue
generated from financial instruments, such as our loans, letters of credit, and investment securities, as well as revenue related to our mortgage servicing activities, as these activities are subject to other generally accepted accounting principles
(“GAAP”) discussed elsewhere within our disclosures. Descriptions of our revenue-generating activities that are within the scope of ASC 606, which are presented in our income statements as components of noninterest income are as follows:
|
·
|
Service charges on deposit accounts represents general service fees for monthly account maintenance and
activity- or transaction-based fees and consist of transaction-based revenue, time-based revenue (service period), item-based revenue or some other individual attribute-based revenue. Revenue is recognized when our performance obligation
is completed which is generally monthly for account maintenance services or when a transaction has been completed. Payment for such performance obligations is generally received at the time the performance obligations are satisfied.
|
|
·
|
Trust and wealth management income represents monthly or quarterly fees due from wealth management customers
as consideration for managing the customers’ assets. Wealth management and trust services include custody of assets, investment management, escrow services, fees for trust services, and similar fiduciary activities. Revenue is recognized
when our performance obligation is completed each month or quarter, which is generally the time that payment is received.
|
|
·
|
Brokerage revenue is transaction based and collected upon the settlement of the transaction. Other sales,
such as life insurance, generate commissions from other third parties. These fees are generally collected monthly.
|
|
·
|
Other noninterest income primarily includes items such as letter of credit fees, gains on sale of loans held
for sale and servicing fees related to mortgage and commercial loans, none of which are subject to the requirements of ASC 606.
|
Ø Accounting for Credit Losses
– In June 2016, the FASB issued ASU No. 2016-13, Financial Instruments—Credit Losses (Topic 326): Measurement of Credit Losses on Financial
Instruments. The provisions of ASU 2016-13 were issued to provide financial statement users with more decision-useful information about the expected credit losses on financial instruments that are not accounted for at fair value through net
income, including loans held for investment, held-to-maturity debt securities, trade and other receivables, net investment in leases and other commitments to extend credit held by a reporting entity at each reporting date. This ASU requires that
financial assets measured at amortized cost be presented at the net amount expected to be collected, through an allowance for credit losses that is deducted from the amortized cost basis. The amendments in ASU 2016-13 eliminate the probable incurred
loss recognition in current GAAP and reflect an entity’s current estimate of all expected credit losses. The measurement of expected credit losses is based upon historical experience, current conditions, and reasonable and supportable forecasts that
affect the collectability of the financial assets.
For purchased financial assets with a more-than-insignificant amount of credit deterioration since
origination (“PCD assets”) that are measured at amortized cost, the initial allowance for credit losses is added to the purchase price rather than being reported as a credit loss expense. Subsequent changes in the allowance for credit losses on PCD
assets are recognized through the statement of income as a credit loss expense.
Credit losses relating to available-for-sale debt securities will be recorded through an allowance
for credit losses rather than as a direct write-down to the security.
ASU 2016-13 is effective for fiscal years, and interim periods within those fiscal years, beginning
after December 15, 2019. Early adoption is permitted for fiscal years, and interim periods within those fiscal years, beginning after December 15, 2018. CTBI has an implementation team working through the provisions of ASU 2016-13 including
assessing the impact on its accounting and disclosures. The team has established the historical data that will be available and has identified the potential loan segments to be analyzed. The team plans to determine the portfolio methodologies to be
utilized and to begin running parallel with its current model in the third quarter of 2019.
Ø Statement of Cash Flows – In August 2016, the FASB issued ASU No.
2016-15, Statement of Cash Flows (Topic 230): Classification of Certain Cash Receipts and Cash Payments. Stakeholders indicated that there is diversity in practice in how certain cash receipts and cash payments are presented and classified in the statement of cash flows under Topic 230,
Statement of Cash Flows, and other Topics. This ASU addresses the following eight specific cash flow issues: Debt prepayment or debt extinguishment costs; settlement of zero-coupon debt instruments or other debt instruments with coupon interest
rates that are insignificant in relation to the effective interest rate of the borrowing; contingent consideration payments made after a business combination; proceeds from the settlement of insurance claims; proceeds from the settlement of
corporate-owned life insurance policies (including bank-owned life insurance policies); distributions received from equity method investees; beneficial interests in securitization transactions; and separately identifiable cash flows and application
of the predominance principle. The amendments in this Update apply to all entities that are required to present a statement of cash flows under Topic 230. This Update is the final version of Proposed Accounting Standards Update EITF-15F—Statement of Cash Flows—Classification of Certain Cash Receipts and Cash Payments (Topic 230), which has been deleted. The amendments in this Update are effective for public business entities for fiscal years beginning after December 15, 2017, and interim periods
within those fiscal years. The amendments in this Update should be applied using a retrospective transition method to each period presented. If it is impracticable to apply the amendments retrospectively for some of the issues, the amendments for
those issues would be applied prospectively as of the earliest date practicable. We adopted this ASU effective January 1, 2018 with no material impact on CTBI’s consolidated financial statements.
Ø Simplifying the Test for Goodwill Impairment – In January 2017, the
FASB issued ASU No. 2017-04, Intangibles – Goodwill and Other (Topic 350) – Simplifying the Test for Goodwill Impairment. These amendments
eliminate Step 2 from the goodwill impairment test. The amendments also eliminate the requirements from any reporting unit with a zero or negative carrying amount to perform a qualitative assessment and, if it fails that qualitative test, to perform
Step 2 of the goodwill impairment test. An entity still has the option to perform the qualitative assessment for a reporting unit to determine if the quantitative impairment test is necessary. The guidance is effective for fiscal years beginning
after December 15, 2019, and interim periods with those fiscal years. ASU 2017-04 should be implemented on a prospective basis. Management does not expect ASU 2017-04 to have an impact on CTBI’s consolidated financial statements.
Ø Receivables – Nonrefundable Fees and Other Costs: Premium Amortization on
Purchased Callable Debt Securities – In April 2017, the FASB issued ASU No. 2017-08, Receivables—Nonrefundable Fees and Other Costs (Subtopic
310-20), Premium Amortization on Purchased Callable Debt Securities. The ASU shortens the amortization period for certain callable debt securities held at a premium to the earliest call date. However, the amendments do not require an
accounting change for securities held at a discount; the discount continues to be amortized to maturity. The amendments are effective for public business entities for fiscal periods beginning after December 15, 2018, including interim periods within
those fiscal periods. Entities are required to apply the amendments on a modified retrospective basis through a cumulative-effect adjustment directly to retained earnings as of the beginning of the period of adoption. We adopted this ASU effective
January 1, 2018 with no material impact on CTBI’s consolidated financial statements.
Ø Income Statement—Reporting Comprehensive Income – In February 2018, the
FASB issued ASU No. 2018-02, Income Statement—Reporting Comprehensive Income (Topic 220). On December 22, 2017, the U.S. federal government
enacted a tax bill, the Tax Cuts and Jobs Act of 2017. The guidance in GAAP requires deferred tax liabilities and assets to be adjusted for the effect of a change in tax laws or rates with the effect included in income from continuing operations in
the reporting period that includes the enactment date. That guidance was applicable even in situations in which the related income tax effects of items in accumulated other comprehensive income were originally recognized in other comprehensive
income (rather than in net income). Because the adjustment of deferred taxes due to the reduction of the historical corporate income tax rate to the newly enacted corporate income tax rate of 21 percent was required to be included in income from
continuing operations, the tax effects of items within accumulated other comprehensive income (referred to as stranded tax effects for purposes of this Update) did not reflect the appropriate tax rate. The amendments in this ASU require a
reclassification from accumulated other comprehensive income to retained earnings for stranded tax effects resulting from the newly enacted federal corporate income tax rate. The amount of the reclassification is the difference between the
historical corporate income tax rate and the newly enacted 21 percent corporate income tax rate. Consequently, the amendments in this Update eliminate the stranded tax effects associated with the change in the federal corporate income tax rate in
the Tax Cuts and Jobs Act of 2017 and improve the usefulness of information reported to financial statement users. The amendments in this Update are effective for all entities for fiscal years beginning after December 15, 2018, and interim periods
within those fiscal years. Early adoption is permitted for public business entities for reporting periods for which financial statements have not yet been issued by applying retrospectively to each period in which the effect of the change in the
U.S. federal corporate income tax rate in the Tax Cuts and Jobs Act of 2017 is recognized. We elected to early adopt this ASU, and therefore, have adjusted our consolidated financial statements effective December 31, 2017 with minimal effect to our
financial position.
Ø Income Taxes—Amendments to SEC Paragraphs – The FASB issued ASU
2018-05, Income Taxes (Topic 740) - Amendments to SEC Paragraphs Pursuant to SEC Staff Accounting Bulletin (SAB) No. 118 in March 2018. ASU
2018-05 amended the Accounting Standards Codification to incorporate various SEC paragraphs pursuant to the issuance of SAB 118. SAB 118 addressed the application of generally accepted accounting principles in situations when a registrant did not
have the necessary information available, prepared, or analyzed (including computations) in reasonable detail to complete the accounting for certain income tax effects of the Tax Cuts and Jobs Act. We did not have any situations where we did not
have the necessary information available, prepared, and analyzed in reasonable detail to complete the accounting for the tax effects of the Tax Cuts and Jobs Act.
Ø Changes to the Disclosure Requirements for Fair Value Measurement – In
August 2018, the FASB issued ASU 2018-13, Fair Value Measurement (Topic 820)—Disclosure Framework—Changes to the Disclosure Requirements for Fair
Value Measurement. ASU No. 2018-13 modifies the disclosure requirements on fair value measurements in Topic 820 as follows:
Removals
The following disclosure requirements were removed from Topic 820:
|
·
|
The amount of and reasons for transfers between Level 1 and Level 2 of the fair value
hierarchy
|
|
·
|
The policy for timing of transfers between levels
|
|
·
|
The valuation processes for Level 3 fair value measurements
|
Modifications
The following disclosure requirements were modified in Topic 820:
|
·
|
For investments in certain entities that calculate net asset value, an entity is
required to disclose the timing of liquidation of an investee’s assets and the date when restrictions from redemption might lapse only if the investee has communicated the timing to the entity or announced the timing publicly; and
|
|
·
|
The amendments clarify that the measurement uncertainty disclosure is to communicate
information about the uncertainty in measurement as of the reporting date.
|
Additions
The following disclosure requirements were added to Topic 820:
|
·
|
The changes in unrealized gains and losses for the period included in other
comprehensive income for recurring Level 3 fair value measurements held at the end of the reporting period; and
|
|
·
|
The range and weighted average of significant unobservable inputs used to develop Level
3 fair value measurements. For certain unobservable inputs, an entity may disclose other quantitative information (such as the median or arithmetic average) in lieu of the weighted average if the entity determines that other quantitative
information would be a more reasonable and rational method to reflect the distribution of unobservable inputs used to develop Level 3 fair value measurements.
|
In addition, the amendments eliminate at a minimum from the phrase “an entity
shall disclose at a minimum” to promote the appropriate exercise of discretion by entities when considering fair value measurement disclosures and to clarify that materiality is an appropriate consideration of entities and their auditors when
evaluating disclosure requirements.
CTBI plans to adopt ASU 2018-13 effective January 1, 2020 with minimal changes
to our current reporting.
Ø Accounting for Costs of Implementing a Cloud Computing Service Agreement–
In August 2018, the FASB issued ASU 2018-15, Intangibles—Goodwill and Other—Internal-Use Software (Subtopic 350-40): Customer’s Accounting for
Implementation Costs Incurred in a Cloud Computing Arrangement That Is a Service Contract, which reduces complexity for the accounting for costs of implementing a cloud computing service arrangement. This standard aligns the accounting for
implementation costs of hosting arrangements, regardless of whether they convey a license to the hosted software.
The ASU aligns the following requirements for capitalizing implementation
costs:
|
·
|
Those incurred in a hosting arrangement that is a service contract, and
|
|
·
|
Those incurred to develop or obtain internal-use software (and hosting arrangements that
include an internal-use software license.
|
This ASU will be effective beginning January 1, 2020. We do not anticipate a
significant impact to our consolidated financial statements.
2. Cash and Due from Banks and Interest Bearing Deposits
Included in cash and due from banks and interest bearing deposits are amounts required to be held at the
Federal Reserve or maintained in vault cash in accordance with regulatory reserve requirements. The balance requirements were $74.7 million and $73.5 million at December 31, 2018 and 2017, respectively.
At December 31, 2018, CTBI had cash accounts which exceeded federally insured limits, and therefore are not
subject to FDIC insurance, with $73.5 million in deposits with the Federal Reserve, $29.1 million in deposits with US Bank, $0.7 million in deposits with Fifth Third Bank, and $2.2 million in deposits with the Federal Home Loan Bank.
3. Securities
Securities are classified into held-to-maturity and available-for-sale categories. Held-to-maturity (HTM)
securities are those that CTBI has the positive intent and ability to hold to maturity and are reported at amortized cost. Available-for-sale (AFS) securities are those that CTBI may decide to sell if needed for liquidity, asset-liability management
or other reasons. Available-for-sale securities are reported at fair value, with unrealized gains or losses included as a separate component of equity, net of tax.
The amortized cost and fair value of debt securities at December 31, 2018 are summarized as
follows:
Available-for-Sale
|
(in thousands)
|
Amortized Cost
|
Gross Unrealized Gains
|
Gross Unrealized Losses
|
Fair Value
|
||||||||||||
|
U.S. Treasury and government agencies
|
$
|
219,358
|
$
|
48
|
$
|
(1,468
|
)
|
$
|
217,938
|
|||||||
|
State and political subdivisions
|
126,280
|
633
|
(2,425
|
)
|
124,488
|
|||||||||||
|
U.S. government sponsored agency mortgage-backed securities
|
255,969
|
397
|
(5,547
|
)
|
250,819
|
|||||||||||
|
Other debt securities
|
507
|
0
|
(6
|
)
|
501
|
|||||||||||
|
Total available-for-sale securities
|
$
|
602,114
|
$
|
1,078
|
$
|
(9,446
|
)
|
$
|
593,746
|
|||||||
Held-to-Maturity
|
(in thousands)
|
Amortized Cost
|
Gross Unrealized Gains
|
Gross Unrealized Losses
|
Fair Value
|
||||||||||||
|
State and political subdivisions
|
$
|
649
|
$
|
0
|
$
|
0
|
$
|
649
|
||||||||
|
Total held-to-maturity securities
|
$
|
649
|
$
|
0
|
$
|
0
|
$
|
649
|
||||||||
The amortized cost and fair value of securities at December 31, 2017 are summarized as
follows:
Available-for-Sale
|
(in thousands)
|
Amortized Cost
|
Gross Unrealized Gains
|
Gross Unrealized Losses
|
Fair Value
|
||||||||||||
|
U.S. Treasury and government agencies
|
$
|
211,574
|
$
|
170
|
$
|
(1,172
|
)
|
$
|
210,572
|
|||||||
|
State and political subdivisions
|
144,159
|
2,017
|
(1,161
|
)
|
145,015
|
|||||||||||
|
U.S. government sponsored agency mortgage-backed securities
|
208,959
|
357
|
(4,007
|
)
|
205,309
|
|||||||||||
|
Other debt securities
|
507
|
0
|
0
|
507
|
||||||||||||
|
Total debt securities
|
565,199
|
2,544
|
(6,340
|
)
|
561,403
|
|||||||||||
|
CRA investment funds
|
25,000
|
76
|
(718
|
)
|
24,358
|
|||||||||||
|
Total available-for-sale securities
|
$
|
590,199
|
$
|
2,620
|
$
|
(7,058
|
)
|
$
|
585,761
|
|||||||
Held-to-Maturity
|
(in thousands)
|
Amortized Cost
|
Gross Unrealized Gains
|
Gross Unrealized Losses
|
Fair Value
|
||||||||||||
|
State and political subdivisions
|
$
|
659
|
$
|
1
|
$
|
0
|
$
|
660
|
||||||||
|
Total held-to-maturity securities
|
$
|
659
|
$
|
1
|
$
|
0
|
$
|
660
|
||||||||
The amortized cost and fair value of debt securities at December 31, 2018 by contractual maturity are shown
below. Expected maturities will differ from contractual maturities because issuers may have the right to call or prepay obligations with or without call or prepayment penalties.
|
Available-for-Sale
|
Held-to-Maturity
|
|||||||||||||||
|
(in thousands)
|
Amortized Cost
|
Fair Value
|
Amortized Cost
|
Fair Value
|
||||||||||||
|
Due in one year or less
|
$
|
65,507
|
$
|
65,393
|
$
|
0
|
$
|
0
|
||||||||
|
Due after one through five years
|
93,465
|
92,943
|
649
|
649
|
||||||||||||
|
Due after five through ten years
|
84,350
|
83,231
|
0
|
0
|
||||||||||||
|
Due after ten years
|
102,316
|
100,859
|
0
|
0
|
||||||||||||
|
U.S. government sponsored agency mortgage-backed securities
|
255,969
|
250,819
|
0
|
0
|
||||||||||||
|
Other debt securities
|
507
|
501
|
0
|
0
|
||||||||||||
|
Total debt securities
|
$
|
602,114
|
$
|
593,746
|
$
|
649
|
$
|
649
|
||||||||
In 2018, we had a net securities loss of $0.1 million. There was a net loss of $1.3 million realized on
sales and calls of AFS securities, consisting of a pre-tax gain of $0.3 million and a pre-tax loss of $1.6 million. This net loss included a loss of $0.4 million from the sale of CTBI’s CRA investment funds in the first quarter of 2018. Also
included in securities gains and losses for 2018 was an unrealized gain of $1.2 million from equity securities, discussed below, in the fourth quarter of 2018. There was a net gain of $0.1 million realized in 2017 and a net gain of $0.5 million
realized in 2016.
Equity Securities at Fair Value
In 2008, Visa distributed 9,918 shares of Visa Class B restricted stock to CTBI which, upon resolution of
certain pending legal matters, will become unrestricted and convertible into Visa Class A shares. Following this distribution, significant concern existed about the ultimate realizable value of these shares, and because CTBI did not have a basis in
the stock, the shares were previously not recorded as an asset on CTBI’s balance sheet. In recent years, the concern over the realizable value has stabilized, and in late 2017 and 2018, several sales of Visa Class B shares have occurred. While not
traded in observable markets, these sales were reported by several financial institutions in various SEC 8-K and 10-K filings. In 2018, FASB issued a technical correction to its guidance regarding equity securities, ASC 321-10-35-2, allowing an
entity to subsequently elect to record an equity security without a readily determinable fair value. In 2018, CTBI made the election permitted by ASC 321-10-35-2 to record its Visa Class B shares at fair value. On December 31, 2018, CTBI recorded a
$1.2 million gain on the recognition of the fair value of 9,918 Visa Class B shares held in its portfolio.
The amortized cost of securities pledged as collateral, to secure public deposits and for other purposes,
was $258.8 million at December 31, 2018 and $225.7 million at December 31, 2017.
The amortized cost of securities sold under agreements to repurchase amounted to $289.1 million at December
31, 2018 and $296.4 million at December 31, 2017.
CTBI evaluates its investment portfolio on a quarterly basis for impairment. The analysis performed as of
December 31, 2018 indicates that all impairment is considered temporary, market and interest rate driven, and not credit-related. The percentage of total investments with unrealized losses as of December 31, 2018 was 75.7% compared to 69.5% as of
December 31, 2017. The following tables provide the amortized cost, gross unrealized losses, and fair market value, aggregated by investment category and length of time the individual securities have been in a continuous unrealized loss position as
of December 31, 2018 that are not deemed to be other-than-temporarily impaired. There were no held-to-maturity securities that were deemed to be impaired as of December 31, 2018.
Available-for-Sale
|
(in thousands)
|
Amortized Cost
|
Gross Unrealized Losses
|
Fair Value
|
|||||||||
|
Less Than 12 Months
|
||||||||||||
|
U.S. Treasury and government agencies
|
$
|
78,905
|
$
|
(271
|
)
|
$
|
78,634
|
|||||
|
State and political subdivisions
|
21,707
|
(194
|
)
|
21,513
|
||||||||
|
U.S. government sponsored agency mortgage-backed securities
|
61,940
|
(377
|
)
|
61,563
|
||||||||
|
Other debt securities
|
507
|
(6
|
)
|
501
|
||||||||
|
Total <12 months temporarily impaired AFS securities
|
163,059
|
(848
|
)
|
162,211
|
||||||||
|
12 Months or More
|
||||||||||||
|
U.S. Treasury and government agencies
|
97,955
|
(1,197
|
)
|
96,758
|
||||||||
|
State and political subdivisions
|
51,911
|
(2,231
|
)
|
49,680
|
||||||||
|
U.S. government sponsored agency mortgage-backed securities
|
147,658
|
(5,170
|
)
|
142,488
|
||||||||
|
Other debt securities
|
0
|
0
|
0
|
|||||||||
|
Total ≥12 months temporarily impaired AFS securities
|
297,524
|
(8,598
|
)
|
288,926
|
||||||||
|
Total
|
||||||||||||
|
U.S. Treasury and government agencies
|
176,860
|
(1,468
|
)
|
175,392
|
||||||||
|
State and political subdivisions
|
73,618
|
(2,425
|
)
|
71,193
|
||||||||
|
U.S. government sponsored agency mortgage-backed securities
|
209,598
|
(5,547
|
)
|
204,051
|
||||||||
|
Other debt securities
|
507
|
(6
|
)
|
501
|
||||||||
|
Total temporarily impaired AFS securities
|
$
|
460,583
|
$
|
(9,446
|
)
|
$
|
451,137
|
|||||
The analysis performed as of December 31, 2017 indicated that all impairment was considered temporary, market
and interest rate driven, and not credit-related. The following tables provide the amortized cost, gross unrealized losses, and fair market value, aggregated by investment category and length of time the individual securities have been in a
continuous unrealized loss position as of December 31, 2017 that are not deemed to be other-than-temporarily impaired. There were no held-to-maturity securities that were deemed to be impaired as of December 31, 2017.
Available-for-Sale
|
(in thousands)
|
Amortized Cost
|
Gross Unrealized Losses
|
Fair Value
|
|||||||||
|
Less Than 12 Months
|
||||||||||||
|
U.S. Treasury and government agencies
|
$
|
136,688
|
$
|
(840
|
)
|
$
|
135,848
|
|||||
|
State and political subdivisions
|
34,283
|
(416
|
)
|
33,867
|
||||||||
|
U.S. government sponsored agency mortgage-backed securities
|
62,768
|
(643
|
)
|
62,125
|
||||||||
|
Other debt securities
|
0
|
0
|
0
|
|||||||||
|
Total debt securities
|
233,739
|
(1,899
|
)
|
231,840
|
||||||||
|
CRA investment funds
|
7,500
|
(105
|
)
|
7,395
|
||||||||
|
Total <12 months temporarily impaired AFS securities
|
241,239
|
(2,004
|
)
|
239,235
|
||||||||
|
12 Months or More
|
||||||||||||
|
U.S. Treasury and government agencies
|
23,885
|
(332
|
)
|
23,553
|
||||||||
|
State and political subdivisions
|
16,930
|
(745
|
)
|
16,185
|
||||||||
|
U.S. government sponsored agency mortgage-backed securities
|
117,827
|
(3,364
|
)
|
114,463
|
||||||||
|
Other debt securities
|
0
|
0
|
0
|
|||||||||
|
Total debt securities
|
158,642
|
(4,441
|
)
|
154,201
|
||||||||
|
CRA investment funds
|
15,000
|
(613
|
)
|
14,387
|
||||||||
|
Total ≥12 months temporarily impaired AFS securities
|
173,642
|
(5,054
|
)
|
168,588
|
||||||||
|
Total
|
||||||||||||
|
U.S. Treasury and government agencies
|
160,573
|
(1,172
|
)
|
159,401
|
||||||||
|
State and political subdivisions
|
51,213
|
(1,161
|
)
|
50,052
|
||||||||
|
U.S. government sponsored agency mortgage-backed securities
|
180,595
|
(4,007
|
)
|
176,588
|
||||||||
|
Other debt securities
|
0
|
0
|
0
|
|||||||||
|
Total debt securities
|
392,381
|
(6,340
|
)
|
386,041
|
||||||||
|
CRA investment funds
|
22,500
|
(718
|
)
|
21,782
|
||||||||
|
Total temporarily impaired AFS securities
|
$
|
414,881
|
$
|
(7,058
|
)
|
$
|
407,823
|
|||||
U.S. Treasury and Government Agencies
The unrealized losses in U.S. Treasury and government agencies were caused by interest rate increases. The
contractual terms of those investments do not permit the issuer to settle the securities at a price less than par which will equal amortized cost at maturity. CTBI does not consider those investments to be other-than-temporarily impaired at December
31, 2018, because CTBI does not intend to sell the investments and it is not more likely than not that we will be required to sell the investments before recovery of their amortized cost, which may be maturity.
State and Political Subdivisions
The unrealized losses in securities of state and political subdivisions were caused by interest rate
increases. The contractual terms of those investments do not permit the issuer to settle the securities at a price less than par which will equal amortized cost at maturity. CTBI does not consider those investments to be other-than-temporarily
impaired at December 31, 2018, because CTBI does not intend to sell the investments before recovery of their amortized cost and it is not more likely than not that we will be required to sell the investments before recovery of their amortized cost,
which may be maturity.
U.S. Government Sponsored Agency Mortgage-Backed Securities
The unrealized losses in U.S. government sponsored agency mortgage-backed securities were caused by interest
rate increases. CTBI expects to recover the amortized cost basis over the term of the securities. CTBI does not consider those investments to be other-than-temporarily impaired at December 31, 2018, because (i) the decline in market value is
attributable to changes in interest rates and not credit quality, (ii) CTBI does not intend to sell the investments, and (iii) it is not more likely than not we will be required to sell the investments before recovery of their amortized cost, which
may be maturity.
Other Debt Securities
The unrealized losses in other debt securities were caused by interest rate increases. The contractual terms
of those investments do not permit the issuer to settle the securities at a price less than par which will equal amortized cost at maturity. CTBI does not consider those investments to be other-than-temporarily impaired at December 31, 2018, because
CTBI does not intend to sell the investments and it is not more likely than not that we will be required to sell the investments before recovery of their amortized cost, which may be maturity.
CRA Investment Funds
In 2017, CTBI’s CRA investment funds consisted of investments in fixed income mutual funds ($24.4 million of
the total fair value and $718 thousand of the total unrealized losses in common stock investments). The severity of the impairment (fair value is approximately 2.9% less than cost) and the duration of the impairment correlates with the decline in
long-term interest rates in 2017. CTBI evaluated the near-term prospects of these funds in relation to the severity and duration of the impairment. Based on that evaluation, CTBI does not consider those investments to be other-than-temporarily
impaired at December 31, 2017.
4. Loans
Major classifications of loans, net of unearned income, deferred loan origination costs, and
net premiums on acquired loans, are summarized as follows:
|
(in thousands)
|
December 31
2018
|
December 31
2017
|
||||||
|
Commercial construction
|
$
|
82,715
|
$
|
76,479
|
||||
|
Commercial secured by real estate
|
1,183,093
|
1,188,680
|
||||||
|
Equipment lease financing
|
1,740
|
3,042
|
||||||
|
Commercial other
|
377,198
|
351,034
|
||||||
|
Real estate construction
|
57,160
|
67,358
|
||||||
|
Real estate mortgage
|
722,417
|
709,570
|
||||||
|
Home equity
|
106,299
|
99,356
|
||||||
|
Consumer direct
|
144,289
|
137,754
|
||||||
|
Consumer indirect
|
533,727
|
489,667
|
||||||
|
Total loans
|
$
|
3,208,638
|
$
|
3,122,940
|
||||
CTBI has segregated and evaluates its loan portfolio through nine portfolio segments. CTBI serves customers
in small and mid-sized communities in eastern, northeastern, central, and south central Kentucky, southern West Virginia, and northeastern Tennessee. Therefore, CTBI’s exposure to credit risk is significantly affected by changes in these
communities.
Commercial construction loans are for the purpose of erecting or rehabilitating buildings or other structures
for commercial purposes, including any infrastructure necessary for development. Included in this category are improved property, land development, and tract development loans. The terms of these loans are generally short-term with permanent
financing upon completion.
Commercial real estate loans include loans secured by nonfarm, nonresidential properties, 1-4
family/multi-family properties, farmland, and other commercial real estate. These loans are originated based on the borrower’s ability to service the debt and secondarily based on the fair value of the underlying collateral.
Equipment lease financing loans are fixed or variable leases for commercial purposes.
Commercial other loans consist of commercial check loans, agricultural loans, receivable financing,
floorplans, loans to financial institutions, loans for purchasing or carrying securities, and other commercial purpose loans. Commercial loans are underwritten based on the borrower’s ability to service debt from the business’s underlying cash
flows. As a general practice, we obtain collateral such as real estate, equipment, or other assets, although such loans may be uncollateralized but guaranteed.
Real estate construction loans are typically for owner-occupied properties. The terms of these loans are
generally short-term with permanent financing upon completion.
Residential real estate loans are a mixture of fixed rate and adjustable rate first and second lien
residential mortgage loans. As a policy, CTBI holds adjustable rate loans and sells the majority of its fixed rate first lien mortgage loans into the secondary market. Changes in interest rates or market conditions may impact a borrower’s ability
to meet contractual principal and interest payments. Residential real estate loans are secured by real property.
Home equity lines are revolving adjustable rate credit lines secured by real property.
Consumer direct loans are a mixture of fixed rate and adjustable rate products comprised of unsecured loans,
consumer revolving credit lines, deposit secured loans, and all other consumer purpose loans.
Consumer indirect loans are fixed rate loans secured by automobiles, trucks, vans, and recreational vehicles
originated at the selling dealership underwritten and purchased by CTBI’s indirect lending department. Both new and used products are financed. Only dealers who have executed dealer agreements with CTBI participate in the indirect lending program.
Not included in
the loan balances above were loans held for sale in the amount of $2.5 million at December 31, 2018 and $1.0 million at December 31, 2017.
Refer to note 1 to the condensed consolidated financial statements for further information regarding our
nonaccrual policy. Nonaccrual loans segregated by class of loans were as follows:
|
(in thousands)
|
December 31
2018
|
December 31
2017
|
||||||
|
Commercial:
|
||||||||
|
Commercial construction
|
$
|
639
|
$
|
1,207
|
||||
|
Commercial secured by real estate
|
4,537
|
7,028
|
||||||
|
Commercial other
|
797
|
934
|
||||||
|
Residential:
|
||||||||
|
Real estate construction
|
22
|
318
|
||||||
|
Real estate mortgage
|
5,395
|
8,243
|
||||||
|
Home equity
|
477
|
389
|
||||||
|
Total nonaccrual loans
|
$
|
11,867
|
$
|
18,119
|
||||
The following tables present CTBI’s loan portfolio aging analysis, segregated by class, as of December 31,
2018 and 2017:
|
December 31, 2018
|
||||||||||||||||||||||||||||
|
(in thousands)
|
30-59 Days Past Due
|
60-89 Days Past Due
|
90+ Days Past Due
|
Total Past Due
|
Current
|
Total Loans
|
90+ and Accruing*
|
|||||||||||||||||||||
|
Commercial:
|
||||||||||||||||||||||||||||
|
Commercial construction
|
$
|
87
|
$
|
58
|
$
|
698
|
$
|
843
|
$
|
81,872
|
$
|
82,715
|
$
|
58
|
||||||||||||||
|
Commercial secured by real estate
|
6,287
|
1,204
|
8,776
|
16,267
|
1,166,826
|
1,183,093
|
4,632
|
|||||||||||||||||||||
|
Equipment lease financing
|
0
|
0
|
0
|
0
|
1,740
|
1,740
|
0
|
|||||||||||||||||||||
|
Commercial other
|
1,057
|
94
|
1,067
|
2,218
|
374,980
|
377,198
|
581
|
|||||||||||||||||||||
|
Residential:
|
||||||||||||||||||||||||||||
|
Real estate construction
|
144
|
438
|
28
|
610
|
56,550
|
57,160
|
6
|
|||||||||||||||||||||
|
Real estate mortgage
|
1,272
|
5,645
|
7,607
|
14,524
|
707,893
|
722,417
|
4,095
|
|||||||||||||||||||||
|
Home equity
|
898
|
365
|
441
|
1,704
|
104,595
|
106,299
|
246
|
|||||||||||||||||||||
|
Consumer:
|
||||||||||||||||||||||||||||
|
Consumer direct
|
918
|
191
|
74
|
1,183
|
143,106
|
144,289
|
74
|
|||||||||||||||||||||
|
Consumer indirect
|
4,715
|
975
|
507
|
6,197
|
527,530
|
533,727
|
506
|
|||||||||||||||||||||
|
Total
|
$
|
15,378
|
$
|
8,970
|
$
|
19,198
|
$
|
43,546
|
$
|
3,165,092
|
$
|
3,208,638
|
$
|
10,198
|
||||||||||||||
|
December 31, 2017
|
||||||||||||||||||||||||||||
|
(in thousands)
|
30-59 Days Past Due
|
60-89 Days Past Due
|
90+ Days Past Due
|
Total Past Due
|
Current
|
Total Loans
|
90+ and Accruing*
|
|||||||||||||||||||||
|
Commercial:
|
||||||||||||||||||||||||||||
|
Commercial construction
|
$
|
138
|
$
|
0
|
$
|
1,238
|
$
|
1,376
|
$
|
75,103
|
$
|
76,479
|
$
|
31
|
||||||||||||||
|
Commercial secured by real estate
|
4,047
|
1,599
|
8,514
|
14,160
|
1,174,520
|
1,188,680
|
2,665
|
|||||||||||||||||||||
|
Equipment lease financing
|
430
|
0
|
0
|
430
|
2,612
|
3,042
|
0
|
|||||||||||||||||||||
|
Commercial other
|
835
|
77
|
652
|
1,564
|
349,470
|
351,034
|
87
|
|||||||||||||||||||||
|
Residential:
|
||||||||||||||||||||||||||||
|
Real estate construction
|
224
|
202
|
223
|
649
|
66,709
|
67,358
|
223
|
|||||||||||||||||||||
|
Real estate mortgage
|
2,064
|
5,029
|
11,605
|
18,698
|
690,872
|
709,570
|
6,293
|
|||||||||||||||||||||
|
Home equity
|
595
|
178
|
428
|
1,201
|
98,155
|
99,356
|
167
|
|||||||||||||||||||||
|
Consumer:
|
||||||||||||||||||||||||||||
|
Consumer direct
|
983
|
148
|
62
|
1,193
|
136,561
|
137,754
|
62
|
|||||||||||||||||||||
|
Consumer indirect
|
4,085
|
1,399
|
648
|
6,132
|
483,535
|
489,667
|
648
|
|||||||||||||||||||||
|
Total
|
$
|
13,401
|
$
|
8,632
|
$
|
23,370
|
$
|
45,403
|
$
|
3,077,537
|
$
|
3,122,940
|
$
|
10,176
|
||||||||||||||
*90+ and Accruing are also included in 90+ Days Past Due column.
The risk characteristics of CTBI’s material portfolio segments are as follows:
Commercial construction loans generally are made to customers for the purpose of building income-producing
properties. Personal guarantees of the principals are generally required. Such loans are made on a projected cash flow basis and are secured by the project being constructed. Construction loan draw procedures are included in each specific loan
agreement, including required documentation items and inspection requirements. Construction loans may convert to term loans at the end of the construction period, or may be repaid by the take-out commitment from another financing source. If the
loan is to convert to a term loan, the repayment ability is based on the borrower’s projected cash flow. Risk is mitigated during the construction phase by requiring proper documentation and inspections whenever a draw is requested. Loans in
amounts greater than $500,000 generally require a performance bond to be posted by the general contractor to assure completion of the project.
Commercial real estate loans are viewed primarily as cash flow loans and secondarily as loans secured by real
estate. Commercial real estate lending typically involves higher loan principal amounts and the repayment of these loans is generally dependent on the successful operation of the property securing the loan or the business conducted on the property
securing the loan. Commercial real estate loans may be more adversely affected by conditions in the real estate markets or in the general economy. Management monitors and evaluates commercial real estate loans based on collateral and risk grade
criteria.
Equipment lease financing is underwritten by our commercial lenders using the same underwriting standards as
would be applied to a secured commercial loan requesting 100% financing. The pricing for equipment lease financing is comparable to that of borrowers with similar quality commercial credits with similar collateral. Maximum terms of equipment
leasing are determined by the type and expected life of the equipment to be leased. Residual values are determined by appraisals or opinion letters from industry experts. Leases must be in conformity with our consolidated annual tax plan. As we
underwrite our equipment lease financing in a manner similar to our commercial loan portfolio described below, the risk characteristics for this portfolio mirror that of the commercial loan portfolio.
Commercial loans are primarily based on the identified cash flows of the borrower and secondarily on the
underlying collateral provided by the borrower. The cash flows of borrowers, however, may not be as expected and the collateral securing these loans may fluctuate in value. Most commercial loans are secured by the assets being financed or other
business assets such as accounts receivable or inventory and may incorporate a personal guarantee; however, some short-term loans may be made on an unsecured basis. In the case of loans secured by accounts receivable, the availability of funds for
the repayment of these loans may be substantially dependent on the ability of the borrower to collect amounts due from its customers.
With respect to residential loans that are secured by 1-4 family residences and are generally owner occupied,
CTBI generally establishes a maximum loan-to-value ratio and requires private mortgage insurance if that ratio is exceeded. Home equity loans are typically secured by a subordinate interest in 1-4 family residences. Residential construction loans
are handled through the home mortgage area of the bank. The repayment ability of the borrower and the maximum loan-to-value ratio are calculated using the normal mortgage lending criteria. Draws are processed based on percentage of completion
stages including normal inspection procedures. Such loans generally convert to term loans after the completion of construction.
Consumer loans are secured by consumer assets such as automobiles or recreational vehicles. Some consumer
loans are unsecured such as small installment loans and certain lines of credit. Our determination of a borrower’s ability to repay these loans is primarily dependent on the personal income and credit rating of the borrowers, which can be impacted
by economic conditions in their market areas such as unemployment levels. Repayment can also be impacted by changes in property values on residential properties. Risk is mitigated by the fact that the loans are of smaller individual amounts and
spread over a large number of borrowers.
The indirect lending area of the bank generally deals with purchasing/funding consumer contracts with new and
used automobile dealers. The dealers generate consumer loan applications which are forwarded to the indirect loan processing area for approval or denial. Loan approvals or denials are based on the creditworthiness and repayment ability of the
borrower, and on the collateral value. The dealers may have limited recourse agreements with CTB.
Credit Quality Indicators:
CTBI categorizes loans into risk categories based on relevant information about the ability of borrowers to
service their debt such as: current financial information, historical payment experience, credit documentation, public information, and current economic trends, among other factors. CTBI also considers the fair value of the underlying collateral and
the strength and willingness of the guarantor(s). CTBI analyzes commercial loans individually by classifying the loans as to credit risk. Loans classified as loss, doubtful, substandard, or special mention are reviewed quarterly by CTBI for further
deterioration or improvement to determine if appropriately classified and valued if deemed impaired. All other commercial loan reviews are completed every 12 to 18 months. In addition, during the renewal process of any loan, as well as if a loan
becomes past due or if other information becomes available, CTBI will evaluate the loan grade. CTBI uses the following definitions for risk ratings:
|
Ø
|
Pass grades include
investment grade, low risk, moderate risk, and acceptable risk loans. The loans range from loans that have no chance of resulting in a loss to loans that have a limited chance of resulting in a loss. Customers in this grade have excellent
to fair credit ratings. The cash flows are adequate to meet required debt repayments.
|
|
Ø
|
Watch graded loans
are loans that warrant extra management attention but are not currently criticized. Loans on the watch list may be potential troubled credits or may warrant “watch” status for a reason not directly related to the asset quality of the
credit. The watch grade is a management tool to identify credits which may be candidates for future classification or may temporarily warrant extra management monitoring.
|
|
Ø
|
Other assets especially
mentioned (OAEM) reflects loans that are currently protected but are potentially weak. These loans constitute an undue and unwarranted credit risk but not to the point of justifying a classification of substandard. The credit
risk may be relatively minor yet constitute an unwarranted risk in light of circumstances surrounding a specific asset. Loans in this grade display potential weaknesses which may, if unchecked or uncorrected, inadequately protect CTBI’s
credit position at some future date. The loans may be adversely affected by economic or market conditions.
|
|
Ø
|
Substandard grading
indicates that the loan is inadequately protected by the current sound worth and paying capacity of the obligor or of the collateral pledged. These loans have a well-defined weakness or weaknesses that jeopardize the orderly liquidation of
the debt with the distinct possibility that CTBI will sustain some loss if the deficiencies are not corrected.
|
|
Ø
|
Doubtful graded loans
have the weaknesses inherent in the substandard grading with the added characteristic that the weaknesses make collection or liquidation in full, on the basis of currently existing facts, conditions, and values, highly questionable and
improbable. The probability of loss is extremely high, but because of certain important and reasonably specific pending factors which may work to CTBI’s advantage or strengthen the asset(s), its classification as an estimated loss is
deferred until its more exact status may be determined. Pending factors include proposed merger, acquisition, or liquidation procedures, capital injection, perfecting liens on additional collateral, and refinancing plans.
|
The following tables present the credit risk profile of CTBI’s commercial loan portfolio based on rating
category and payment activity, segregated by class of loans, as of December 31, 2018 and 2017:
|
(in thousands)
|
Commercial Construction
|
Commercial Secured by Real Estate
|
Equipment Leases
|
Commercial Other
|
Total
|
|||||||||||||||
|
December 31, 2018
|
||||||||||||||||||||
|
Pass
|
$
|
74,222
|
$
|
1,038,309
|
$
|
1,740
|
$
|
327,431
|
$
|
1,441,702
|
||||||||||
|
Watch
|
3,070
|
71,834
|
0
|
28,986
|
103,890
|
|||||||||||||||
|
OAEM
|
1,594
|
19,734
|
0
|
5,735
|
27,063
|
|||||||||||||||
|
Substandard
|
3,829
|
53,125
|
0
|
14,970
|
71,924
|
|||||||||||||||
|
Doubtful
|
0
|
91
|
0
|
76
|
167
|
|||||||||||||||
|
Total
|
$
|
82,715
|
$
|
1,183,093
|
$
|
1,740
|
$
|
377,198
|
$
|
1,644,746
|
||||||||||
|
December 31, 2017
|
||||||||||||||||||||
|
Pass
|
$
|
67,846
|
$
|
1,053,701
|
$
|
3,005
|
$
|
305,655
|
$
|
1,430,207
|
||||||||||
|
Watch
|
3,323
|
65,182
|
0
|
29,008
|
97,513
|
|||||||||||||||
|
OAEM
|
1,304
|
22,401
|
37
|
3,206
|
26,948
|
|||||||||||||||
|
Substandard
|
3,828
|
47,223
|
0
|
12,947
|
63,998
|
|||||||||||||||
|
Doubtful
|
178
|
173
|
0
|
218
|
569
|
|||||||||||||||
|
Total
|
$
|
76,479
|
$
|
1,188,680
|
$
|
3,042
|
$
|
351,034
|
$
|
1,619,235
|
||||||||||
The following tables present the credit risk profile of CTBI’s residential real estate and consumer loan
portfolios based on performing or nonperforming status, segregated by class, as of December 31, 2018 and 2017:
|
(in thousands)
|
Real Estate Construction
|
Real Estate Mortgage
|
Home Equity
|
Consumer Direct
|
Consumer
Indirect
|
Total
|
||||||||||||||||||
|
December 31, 2018
|
||||||||||||||||||||||||
|
Performing
|
$
|
57,132
|
$
|
712,927
|
$
|
105,576
|
$
|
144,215
|
$
|
533,221
|
$
|
1,553,071
|
||||||||||||
|
Nonperforming (1)
|
28
|
9,490
|
723
|
74
|
506
|
10,821
|
||||||||||||||||||
|
Total
|
$
|
57,160
|
$
|
722,417
|
$
|
106,299
|
$
|
144,289
|
$
|
533,727
|
$
|
1,563,892
|
||||||||||||
|
December 31, 2017
|
||||||||||||||||||||||||
|
Performing
|
$
|
66,817
|
$
|
695,034
|
$
|
98,800
|
$
|
137,692
|
$
|
489,019
|
$
|
1,487,362
|
||||||||||||
|
Nonperforming (1)
|
541
|
14,536
|
556
|
62
|
648
|
16,343
|
||||||||||||||||||
|
Total
|
$
|
67,358
|
$
|
709,570
|
$
|
99,356
|
$
|
137,754
|
$
|
489,667
|
$
|
1,503,705
|
||||||||||||
(1) A loan is considered nonperforming if it is 90 days or more past due and/or on nonaccrual.
The total of consumer mortgage loans secured by real estate properties for which formal foreclosure
proceedings are in process totaled $3.3 million at December 31, 2018 compared to $3.7 million at December 31, 2017.
A loan is considered impaired, in accordance with the impairment accounting guidance (ASC 310-10-35-16), when
based on current information and events, it is probable CTBI will be unable to collect all amounts due from the borrower in accordance with the contractual terms of the loan. Impaired loans include nonperforming commercial loans but also include
loans modified in troubled debt restructurings where concessions have been granted to borrowers experiencing financial difficulties. These concessions could include a reduction in the interest rate on the loan, payment extensions, forgiveness of
principal, forbearance, or other actions intended to maximize collection.
The following table presents impaired loans, the average investment in impaired loans, and interest income
recognized on impaired loans for the years ended December 31, 2018, 2017, and 2016:
|
December 31, 2018
|
||||||||||||||||||||
|
(in thousands)
|
Recorded Balance
|
Unpaid Contractual Principal Balance
|
Specific Allowance
|
Average Investment in Impaired Loans
|
*Interest Income Recognized
|
|||||||||||||||
|
Loans without a specific valuation allowance:
|
||||||||||||||||||||
|
Commercial construction
|
$
|
4,100
|
$
|
4,100
|
$
|
0
|
$
|
3,923
|
$
|
171
|
||||||||||
|
Commercial secured by real estate
|
29,645
|
31,409
|
0
|
30,250
|
1,412
|
|||||||||||||||
|
Equipment lease financing
|
0
|
0
|
0
|
0
|
0
|
|||||||||||||||
|
Commercial other
|
8,285
|
9,982
|
0
|
8,774
|
530
|
|||||||||||||||
|
Real estate construction
|
0
|
0
|
0
|
106
|
0
|
|||||||||||||||
|
Real estate mortgage
|
1,882
|
1,882
|
0
|
1,666
|
41
|
|||||||||||||||
|
Loans with a specific valuation allowance:
|
||||||||||||||||||||
|
Commercial construction
|
127
|
127
|
50
|
42
|
0
|
|||||||||||||||
|
Commercial secured by real estate
|
1,854
|
2,983
|
605
|
2,051
|
1
|
|||||||||||||||
|
Commercial other
|
473
|
473
|
146
|
285
|
16
|
|||||||||||||||
|
Totals:
|
||||||||||||||||||||
|
Commercial construction
|
4,227
|
4,227
|
50
|
3,965
|
171
|
|||||||||||||||
|
Commercial secured by real estate
|
31,499
|
34,392
|
605
|
32,301
|
1,413
|
|||||||||||||||
|
Equipment lease financing
|
0
|
0
|
0
|
0
|
0
|
|||||||||||||||
|
Commercial other
|
8,758
|
10,455
|
146
|
9,059
|
546
|
|||||||||||||||
|
Real estate construction
|
0
|
0
|
0
|
106
|
0
|
|||||||||||||||
|
Real estate mortgage
|
1,882
|
1,882
|
0
|
1,666
|
41
|
|||||||||||||||
|
Total
|
$
|
46,366
|
$
|
50,956
|
$
|
801
|
$
|
47,097
|
$
|
2,171
|
||||||||||
|
December 31, 2017
|
||||||||||||||||||||
|
(in thousands)
|
Recorded Balance
|
Unpaid Contractual Principal Balance
|
Specific Allowance
|
Average Investment in Impaired Loans
|
*Interest Income Recognized
|
|||||||||||||||
|
Loans without a specific valuation allowance:
|
||||||||||||||||||||
|
Commercial construction
|
$
|
4,431
|
$
|
4,439
|
$
|
0
|
$
|
4,835
|
$
|
200
|
||||||||||
|
Commercial secured by real estate
|
28,480
|
30,365
|
0
|
27,753
|
1,344
|
|||||||||||||||
|
Equipment lease financing
|
0
|
0
|
0
|
34
|
0
|
|||||||||||||||
|
Commercial other
|
9,481
|
11,252
|
0
|
10,444
|
539
|
|||||||||||||||
|
Real estate construction
|
318
|
318
|
0
|
534
|
0
|
|||||||||||||||
|
Real estate mortgage
|
1,564
|
1,570
|
0
|
1,591
|
36
|
|||||||||||||||
|
Loans with a specific valuation allowance:
|
||||||||||||||||||||
|
Commercial construction
|
153
|
173
|
25
|
155
|
0
|
|||||||||||||||
|
Commercial secured by real estate
|
2,985
|
4,095
|
966
|
3,932
|
8
|
|||||||||||||||
|
Commercial other
|
0
|
0
|
0
|
65
|
0
|
|||||||||||||||
|
Totals:
|
||||||||||||||||||||
|
Commercial construction
|
4,584
|
4,612
|
25
|
4,990
|
200
|
|||||||||||||||
|
Commercial secured by real estate
|
31,465
|
34,460
|
966
|
31,685
|
1,352
|
|||||||||||||||
|
Equipment lease financing
|
0
|
0
|
0
|
34
|
0
|
|||||||||||||||
|
Commercial other
|
9,481
|
11,252
|
0
|
10,509
|
539
|
|||||||||||||||
|
Real estate construction
|
318
|
318
|
0
|
534
|
0
|
|||||||||||||||
|
Real estate mortgage
|
1,564
|
1,570
|
0
|
1,591
|
36
|
|||||||||||||||
|
Total
|
$
|
47,412
|
$
|
52,212
|
$
|
991
|
$
|
49,343
|
$
|
2,127
|
||||||||||
|
December 31, 2016
|
||||||||||||||||||||
|
(in thousands)
|
Recorded Balance
|
Unpaid Contractual Principal Balance
|
Specific Allowance
|
Average Investment in Impaired Loans
|
*Interest Income Recognized
|
|||||||||||||||
|
Loans without a specific valuation allowance:
|
||||||||||||||||||||
|
Commercial construction
|
$
|
4,102
|
$
|
4,123
|
$
|
0
|
$
|
4,367
|
$
|
218
|
||||||||||
|
Commercial secured by real estate
|
29,025
|
29,594
|
0
|
31,136
|
1,609
|
|||||||||||||||
|
Equipment lease financing
|
0
|
0
|
0
|
0
|
0
|
|||||||||||||||
|
Commercial other
|
11,215
|
13,155
|
0
|
11,561
|
632
|
|||||||||||||||
|
Real estate mortgage
|
1,483
|
1,483
|
0
|
1,691
|
52
|
|||||||||||||||
|
Loans with a specific valuation allowance:
|
||||||||||||||||||||
|
Commercial construction
|
1,507
|
1,509
|
213
|
2,290
|
0
|
|||||||||||||||
|
Commercial secured by real estate
|
4,731
|
5,885
|
1,035
|
4,151
|
19
|
|||||||||||||||
|
Commercial other
|
139
|
139
|
65
|
483
|
0
|
|||||||||||||||
|
Totals:
|
||||||||||||||||||||
|
Commercial construction
|
5,609
|
5,632
|
213
|
6,657
|
218
|
|||||||||||||||
|
Commercial secured by real estate
|
33,756
|
35,479
|
1,035
|
35,287
|
1,628
|
|||||||||||||||
|
Equipment lease financing
|
0
|
0
|
0
|
0
|
0
|
|||||||||||||||
|
Commercial other
|
11,354
|
13,294
|
65
|
12,044
|
632
|
|||||||||||||||
|
Real estate mortgage
|
1,483
|
1,483
|
0
|
1,691
|
52
|
|||||||||||||||
|
Total
|
$
|
52,202
|
$
|
55,888
|
$
|
1,313
|
$
|
55,679
|
$
|
2,530
|
||||||||||
*Cash basis interest is substantially the same as interest income recognized.
Included in certain loan categories of impaired loans are certain loans that have been modified in a troubled
debt restructuring, where economic concessions have been granted to borrowers who have experienced financial difficulties. These concessions typically result from our loss mitigation activities and could include reductions in the interest rate,
payment extensions, forgiveness of principal, forbearance or other actions. Modifications of terms for our loans and their inclusion as troubled debt restructurings are based on individual facts and circumstances. Loan modifications that are
included as troubled debt restructurings may involve either an increase or reduction of the interest rate, extension of the term of the loan, or deferral of principal and/or interest payments, regardless of the period of the modification. All of the
loans identified as troubled debt restructuring were modified due to financial stress of the borrower. In order to determine if a borrower is experiencing financial difficulty, an evaluation is performed to determine the probability that the
borrower will be in payment default on any of its debt in the foreseeable future without the modification. This evaluation is performed under CTBI’s internal underwriting policy.
When we modify loans and leases in a troubled debt restructuring, we evaluate any possible impairment similar
to other impaired loans based on the present value of expected future cash flows, discounted at the contractual interest rate of the original loan agreement, or use the current fair value of the collateral, less selling costs for collateral dependent
loans. If we determined that the value of the modified loan is less than the recorded investment in the loan (net of previous charge-offs, deferred loan fees or costs and unamortized premium or discount), impairment is recognized through an allowance
estimate or a charge-off to the allowance. In periods subsequent to modification, we evaluate all troubled debt restructuring, including those that have payment defaults, for possible impairment and recognize impairment through the allowance.
Certain loans
have been modified in troubled debt restructurings, where economic concessions were granted to borrowers consisting of reductions in the interest rates, payment extensions, forgiveness of principal, and forbearances. Presented below, segregated by class of loans, are troubled debt restructurings that occurred during the years ended December 31, 2018 and 2017:
|
Year Ended
December 31, 2018
|
||||||||||||||||||||
|
(in thousands)
|
Number of Loans
|
Term Modification
|
Rate Modification
|
Combination
|
Post-Modification Outstanding Balance
|
|||||||||||||||
|
Commercial:
|
||||||||||||||||||||
|
Commercial construction
|
5
|
$
|
2,182
|
$
|
0
|
$
|
15
|
$
|
2,197
|
|||||||||||
|
Commercial secured by real estate
|
24
|
4,004
|
0
|
1,383
|
5,387
|
|||||||||||||||
|
Commercial other
|
8
|
465
|
0
|
0
|
465
|
|||||||||||||||
|
Residential:
|
||||||||||||||||||||
|
Real estate construction
|
0
|
0
|
0
|
0
|
0
|
|||||||||||||||
|
Real estate mortgage
|
3
|
264
|
0
|
704
|
968
|
|||||||||||||||
|
Total troubled debt restructurings
|
40
|
$
|
6,915
|
$
|
0
|
$
|
2,102
|
$
|
9,017
|
|||||||||||
|
Year Ended
December 31, 2017
|
||||||||||||||||||||
|
(in thousands)
|
Number of Loans
|
Term Modification
|
Rate Modification
|
Combination
|
Post-Modification Outstanding Balance
|
|||||||||||||||
|
Commercial:
|
||||||||||||||||||||
|
Commercial construction
|
2
|
$
|
0
|
$
|
0
|
$
|
114
|
$
|
114
|
|||||||||||
|
Commercial secured by real estate
|
15
|
2,199
|
0
|
192
|
2,391
|
|||||||||||||||
|
Commercial other
|
22
|
1,072
|
0
|
136
|
1,208
|
|||||||||||||||
|
Residential:
|
||||||||||||||||||||
|
Real estate construction
|
1
|
846
|
0
|
0
|
846
|
|||||||||||||||
|
Real estate mortgage
|
3
|
988
|
0
|
0
|
988
|
|||||||||||||||
|
Total troubled debt restructurings
|
43
|
$
|
5,105
|
$
|
0
|
$
|
442
|
$
|
5,547
|
|||||||||||
No charge-offs have resulted from modifications for any of the presented periods. We had
commitments to extend additional credit in the amount of $45 thousand and $213 thousand, respectively, at December 31, 2018 and 2017, on loans that were considered troubled debt restructurings.
Loans retain their accrual status at the time of their modification. As a result, if a loan is on nonaccrual
at the time it is modified, it stays as nonaccrual, and if a loan is on accrual at the time of the modification, it generally stays on accrual. Commercial and consumer loans modified in a troubled debt restructuring are closely monitored for
delinquency as an early indicator of possible future default. If loans modified in a troubled debt restructuring subsequently default, CTBI evaluates the loan for possible further impairment. The allowance for loan losses may be increased,
adjustments may be made in the allocation of the allowance, or partial charge-offs may be taken to further write-down the carrying value of the loan. Presented
below, segregated by class of loans, are loans that were modified as troubled debt restructurings within the past twelve months which have subsequently defaulted. CTBI considers a loan in default when it is 90 days or more past due or transferred
to nonaccrual.
|
(in thousands)
|
Year Ended
December 31, 2018
|
|||||||
|
Number of Loans
|
Recorded Balance
|
|||||||
|
Commercial:
|
||||||||
|
Commercial construction
|
2
|
$
|
148
|
|||||
|
Commercial secured by real estate
|
1
|
17
|
||||||
|
Commercial other
|
1
|
84
|
||||||
|
Residential:
|
||||||||
|
Real estate construction
|
0
|
0
|
||||||
|
Total defaulted restructured loans
|
4
|
$
|
249
|
|||||
|
(in thousands)
|
Year Ended
December 31, 2017
|
|||||||
|
Number of Loans
|
Recorded Balance
|
|||||||
|
Commercial:
|
||||||||
|
Commercial construction
|
0
|
$
|
0
|
|||||
|
Commercial secured by real estate
|
0
|
0
|
||||||
|
Commercial other
|
0
|
0
|
||||||
|
Residential:
|
||||||||
|
Real estate construction
|
1
|
846
|
||||||
|
Total defaulted restructured loans
|
1
|
$
|
846
|
|||||
5. Mortgage Banking and Servicing Rights
Mortgage banking activities primarily include residential mortgage originations and servicing. As discussed
in note 1 above, mortgage servicing rights (“MSRs”) are carried at fair market value. The fair value is determined quarterly based on an independent third-party valuation using a discounted cash flow analysis and calculated using a computer pricing
model. The system used in this evaluation, Compass Point, attempts to quantify loan level idiosyncratic risk by calculating a risk derived value. As a result, each loan’s unique characteristics determine the valuation assumptions ascribed to that
loan. Additionally, the computer valuation is based on key economic assumptions including the prepayment speeds of the underlying loans generated using the Andrew Davidson Prepayment Model, FHLMC/FNMA guidelines, the weighted average life of the
loan, the discount rate, the weighted average coupon, and the weighted-average default rate, as applicable. Along with the gains received from the sale of loans, fees are received for servicing loans. These fees include late fees, which are
recorded in interest income, and ancillary fees and monthly servicing fees, which are recorded in noninterest income. Costs of servicing loans are charged to expense as incurred. Changes in fair market value of the MSRs are reported as an increase
or decrease to mortgage banking income.
The following table presents the components of mortgage banking income:
|
(in thousands)
Year Ended December 31
|
2018
|
2017
|
2016
|
|||||||||
|
Net gain on sale of mortgage loans held for sale
|
$
|
1,288
|
$
|
1,232
|
$
|
1,831
|
||||||
|
Net loan servicing income (expense)
|
||||||||||||
|
Servicing fees
|
1,275
|
1,255
|
1,239
|
|||||||||
|
Late fees
|
73
|
84
|
78
|
|||||||||
|
Ancillary fees
|
282
|
239
|
322
|
|||||||||
|
Fair value adjustments
|
(343
|
)
|
(361
|
)
|
(324
|
)
|
||||||
|
Net loan servicing income
|
1,287
|
1,217
|
1,315
|
|||||||||
|
Mortgage banking income
|
$
|
2,575
|
$
|
2,449
|
$
|
3,146
|
||||||
Mortgage loans serviced for others are not included in the accompanying balance sheets. Loans serviced for
the benefit of others (primarily FHLMC) totaled $462 million, $462 million, and $466 million at December 31, 2018, 2017, and 2016, respectively. Servicing loans for others generally consists of collecting mortgage payments, maintaining escrow
accounts, disbursing payments to investors, and processing foreclosures. Custodial escrow balances maintained in connection with the foregoing loan servicing, and included in demand deposits, were approximately $1.0 million at December 31, 2018,
2017, and 2016, respectively.
Activity for capitalized mortgage servicing rights using the fair value method is as follows:
|
(in thousands)
|
2018
|
2017
|
2016
|
|||||||||
|
Fair value of MSRs, beginning of period
|
$
|
3,484
|
$
|
3,433
|
$
|
3,236
|
||||||
|
New servicing assets created
|
466
|
412
|
521
|
|||||||||
|
Change in fair value during the period due to:
|
||||||||||||
|
Time decay (1)
|
(189
|
)
|
(184
|
)
|
(175
|
)
|
||||||
|
Payoffs (2)
|
(227
|
)
|
(268
|
)
|
(313
|
)
|
||||||
|
Changes in valuation inputs or assumptions (3)
|
73
|
91
|
164
|
|||||||||
|
Fair value of MSRs, end of period
|
$
|
3,607
|
$
|
3,484
|
$
|
3,433
|
||||||
|
(1)
|
Represents decrease in value due to regularly scheduled loan principal payments and partial loan
paydowns.
|
|
(2)
|
Represents decrease in value due to loans that paid off during the period.
|
|
(3)
|
Represents change in value resulting from market-driven changes in interest rates.
|
The fair values of capitalized mortgage servicing rights were $3.6 million, $3.5 million, and $3.4 million at
December 31, 2018, 2017, and 2016, respectively. Fair values for the years ended December 31, 2018, 2017, and 2016 were determined by third-party valuations with a resulting 10.1% average discount rate over the last three years, respectively, and
weighted average default rates of 2.57%, 3.03%, and 3.02%, respectively. Prepayment speeds generated using the Andrew Davidson Prepayment Model averaged 9.5%, 10.0%, and 9.5% at December 31, 2018, 2017, and 2016, respectively. MSR values are very
sensitive to movement in interest rates as expected future net servicing income depends on the projected balance of the underlying loans, which can be greatly impacted by the level of prepayments. CTBI does not currently hedge against changes in the
fair value of its MSR portfolio.
6. Related Party Transactions
In the ordinary course of business, CTB has made extensions of credit and had transactions with certain
directors and executive officers of CTBI or our subsidiaries, including their associates (as defined by the Securities and Exchange Commission). We believe such extensions of credit and transactions were made on substantially the same terms,
including interest rate and collateral, as those prevailing at the same time for comparable transactions with other persons.
Activity for related party extensions of credit during 2018 and 2017 is as follows:
|
(in thousands)
|
2018
|
2017
|
||||||
|
Related party extensions of credit, beginning of period
|
$
|
16,832
|
$
|
27,081
|
||||
|
New loans and advances on lines of credit
|
6,425
|
522
|
||||||
|
Repayments
|
(3,794
|
)
|
(2,615
|
)
|
||||
|
Increase (decrease) due to changes in related parties
|
0
|
(8,156
|
)
|
|||||
|
Related party extensions of credit, end of period
|
$
|
19,463
|
$
|
16,832
|
||||
The aggregate balances of related party deposits at December 31, 2018 and 2017 were $16.6 million and $15.8
million, respectively.
A director of CTBI is a shareholder in a law firm that provided services to CTBI and its subsidiaries during
the years 2018, 2017, and 2016. Approximately $1.1 million in legal fees and $0.1 million in expenses paid on behalf of CTBI, $1.2 million total, were paid to this law firm during 2018. Approximately $1.1 million in legal fees and $0.1 million in
expenses, $1.2 million total, were paid during 2017, and approximately $1.0 million in legal fees and $0.1 million in expenses, $1.1 million in total, were paid during 2016.
7. Allowance for Loan and Lease Losses
The following tables present the balance in the allowance for loan and lease losses (“ALLL”)
and the recorded investment in loans based on portfolio segment and impairment method as of December 31, 2018, 2017, and 2016:
|
2018
|
||||||||||||||||||||||||||||||||||||||||
|
(in thousands)
|
Commercial Construction
|
Commercial Secured by Real Estate
|
Equipment Lease Financing
|
Commercial Other
|
Real Estate Construction
|
Real Estate Mortgage
|
Home Equity
|
Consumer Direct
|
Consumer Indirect
|
Total
|
||||||||||||||||||||||||||||||
|
ALLL
|
||||||||||||||||||||||||||||||||||||||||
|
Balance, beginning of year
|
$
|
686
|
$
|
14,509
|
$
|
18
|
$
|
5,039
|
$
|
660
|
$
|
5,688
|
$
|
857
|
$
|
1,863
|
$
|
6,831
|
$
|
36,151
|
||||||||||||||||||||
|
Provision charged to expense
|
115
|
786
|
(6
|
)
|
824
|
(115
|
)
|
(336
|
)
|
39
|
572
|
4,288
|
6,167
|
|||||||||||||||||||||||||||
|
Losses charged off
|
0
|
(988
|
)
|
0
|
(1,513
|
)
|
(33
|
)
|
(1,004
|
)
|
(69
|
)
|
(997
|
)
|
(6,394
|
)
|
(10,998
|
)
|
||||||||||||||||||||||
|
Recoveries
|
61
|
224
|
0
|
643
|
0
|
85
|
14
|
445
|
3,116
|
4,588
|
||||||||||||||||||||||||||||||
|
Balance, end of year
|
$
|
862
|
$
|
14,531
|
$
|
12
|
$
|
4,993
|
$
|
512
|
$
|
4,433
|
$
|
841
|
$
|
1,883
|
$
|
7,841
|
$
|
35,908
|
||||||||||||||||||||
|
Ending balance:
|
||||||||||||||||||||||||||||||||||||||||
|
Individually evaluated for impairment
|
$
|
50
|
$
|
605
|
$
|
0
|
$
|
146
|
$
|
0
|
$
|
0
|
$
|
0
|
$
|
0
|
$
|
0
|
$
|
801
|
||||||||||||||||||||
|
Collectively evaluated for impairment
|
$
|
812
|
$
|
13,926
|
$
|
12
|
$
|
4,847
|
$
|
512
|
$
|
4,433
|
$
|
841
|
$
|
1,883
|
$
|
7,841
|
$
|
35,107
|
||||||||||||||||||||
|
Loans
|
||||||||||||||||||||||||||||||||||||||||
|
Ending balance:
|
||||||||||||||||||||||||||||||||||||||||
|
Individually evaluated for impairment
|
$
|
4,227
|
$
|
31,499
|
$
|
0
|
$
|
8,758
|
$
|
0
|
$
|
1,882
|
$
|
0
|
$
|
0
|
$
|
0
|
$
|
46,366
|
||||||||||||||||||||
|
Collectively evaluated for impairment
|
$
|
78,488
|
$
|
1,151,594
|
$
|
1,740
|
$
|
368,440
|
$
|
57,160
|
$
|
720,535
|
$
|
106,299
|
$
|
144,289
|
$
|
533,727
|
$
|
3,162,272
|
||||||||||||||||||||
|
2017
|
||||||||||||||||||||||||||||||||||||||||
|
(in thousands)
|
Commercial Construction
|
Commercial Secured by Real Estate
|
Equipment Lease Financing
|
Commercial Other
|
Real Estate Construction
|
Real Estate Mortgage
|
Home Equity
|
Consumer Direct
|
Consumer Indirect
|
Total
|
||||||||||||||||||||||||||||||
|
ALLL
|
||||||||||||||||||||||||||||||||||||||||
|
Balance, beginning of year
|
$
|
884
|
$
|
14,191
|
$
|
42
|
$
|
4,656
|
$
|
629
|
$
|
6,027
|
$
|
774
|
$
|
1,885
|
$
|
6,845
|
$
|
35,933
|
||||||||||||||||||||
|
Provision charged to expense
|
(237
|
)
|
2,281
|
(24
|
)
|
1,744
|
31
|
189
|
257
|
418
|
2,862
|
7,521
|
||||||||||||||||||||||||||||
|
Losses charged off
|
(10
|
)
|
(2,038
|
)
|
0
|
(1,893
|
)
|
0
|
(615
|
)
|
(178
|
)
|
(965
|
)
|
(5,386
|
)
|
(11,085
|
)
|
||||||||||||||||||||||
|
Recoveries
|
49
|
75
|
0
|
532
|
0
|
87
|
4
|
525
|
2,510
|
3,782
|
||||||||||||||||||||||||||||||
|
Balance, end of year
|
$
|
686
|
$
|
14,509
|
$
|
18
|
$
|
5,039
|
$
|
660
|
$
|
5,688
|
$
|
857
|
$
|
1,863
|
$
|
6,831
|
$
|
36,151
|
||||||||||||||||||||
|
Ending balance:
|
||||||||||||||||||||||||||||||||||||||||
|
Individually evaluated for impairment
|
$
|
25
|
$
|
966
|
$
|
0
|
$
|
0
|
$
|
0
|
$
|
0
|
$
|
0
|
$
|
0
|
$
|
0
|
$
|
991
|
||||||||||||||||||||
|
Collectively evaluated for impairment
|
$
|
661
|
$
|
13,543
|
$
|
18
|
$
|
5,039
|
$
|
660
|
$
|
5,688
|
$
|
857
|
$
|
1,863
|
$
|
6,831
|
$
|
35,160
|
||||||||||||||||||||
|
Loans
|
||||||||||||||||||||||||||||||||||||||||
|
Ending balance:
|
||||||||||||||||||||||||||||||||||||||||
|
Individually evaluated for impairment
|
$
|
4,584
|
$
|
31,465
|
$
|
0
|
$
|
9,481
|
$
|
318
|
$
|
1,564
|
$
|
0
|
$
|
0
|
$
|
0
|
$
|
47,412
|
||||||||||||||||||||
|
Collectively evaluated for impairment
|
$
|
71,895
|
$
|
1,157,215
|
$
|
3,042
|
$
|
341,553
|
$
|
67,040
|
$
|
708,006
|
$
|
99,356
|
$
|
137,754
|
$
|
489,667
|
$
|
3,075,528
|
||||||||||||||||||||
|
2016
|
||||||||||||||||||||||||||||||||||||||||
|
(in thousands)
|
Commercial Construction
|
Commercial Secured by Real Estate
|
Equipment Lease Financing
|
Commercial Other
|
Real Estate Construction
|
Real Estate Mortgage
|
Home Equity
|
Consumer Direct
|
Consumer Indirect
|
Total
|
||||||||||||||||||||||||||||||
|
ALLL
|
||||||||||||||||||||||||||||||||||||||||
|
Balance, beginning of year
|
$
|
2,199
|
$
|
14,434
|
$
|
79
|
$
|
4,225
|
$
|
550
|
$
|
6,678
|
$
|
839
|
$
|
1,594
|
$
|
5,496
|
$
|
36,094
|
||||||||||||||||||||
|
Provision charged to expense
|
(1,035
|
)
|
1,220
|
(37
|
)
|
2,128
|
264
|
291
|
(20
|
)
|
912
|
4,149
|
7,872
|
|||||||||||||||||||||||||||
|
Losses charged off
|
(316
|
)
|
(1,641
|
)
|
0
|
(2,136
|
)
|
(192
|
)
|
(1,043
|
)
|
(54
|
)
|
(1,236
|
)
|
(5,050
|
)
|
(11,668
|
)
|
|||||||||||||||||||||
|
Recoveries
|
36
|
178
|
0
|
439
|
7
|
101
|
9
|
615
|
2,250
|
3,635
|
||||||||||||||||||||||||||||||
|
Balance, end of year
|
$
|
884
|
$
|
14,191
|
$
|
42
|
$
|
4,656
|
$
|
629
|
$
|
6,027
|
$
|
774
|
$
|
1,885
|
$
|
6,845
|
$
|
35,933
|
||||||||||||||||||||
|
Ending balance:
|
||||||||||||||||||||||||||||||||||||||||
|
Individually evaluated for impairment
|
$
|
213
|
$
|
1,035
|
$
|
0
|
$
|
65
|
$
|
0
|
$
|
0
|
$
|
0
|
$
|
0
|
$
|
0
|
$
|
1,313
|
||||||||||||||||||||
|
Collectively evaluated for impairment
|
$
|
671
|
$
|
13,156
|
$
|
42
|
$
|
4,591
|
$
|
629
|
$
|
6,027
|
$
|
774
|
$
|
1,885
|
$
|
6,845
|
$
|
34,620
|
||||||||||||||||||||
|
Loans
|
||||||||||||||||||||||||||||||||||||||||
|
Ending balance:
|
||||||||||||||||||||||||||||||||||||||||
|
Individually evaluated for impairment
|
$
|
5,609
|
$
|
33,756
|
$
|
0
|
$
|
11,354
|
$
|
0
|
$
|
1,483
|
$
|
0
|
$
|
0
|
$
|
0
|
$
|
52,202
|
||||||||||||||||||||
|
Collectively evaluated for impairment
|
$
|
61,389
|
$
|
1,051,672
|
$
|
5,512
|
$
|
338,805
|
$
|
57,966
|
$
|
701,486
|
$
|
91,511
|
$
|
133,093
|
$
|
444,735
|
$
|
2,886,169
|
||||||||||||||||||||
8. Premises and Equipment
Premises and equipment are summarized as follows:
|
(in thousands)
December 31
|
2018
|
2017
|
||||||
|
Land and buildings
|
$
|
79,815
|
$
|
79,173
|
||||
|
Leasehold improvements
|
4,805
|
4,894
|
||||||
|
Furniture, fixtures, and equipment
|
38,576
|
38,096
|
||||||
|
Construction in progress
|
1,396
|
80
|
||||||
|
Total premises and equipment
|
124,592
|
122,243
|
||||||
|
Less accumulated depreciation and amortization
|
(79,301
|
)
|
(75,925
|
)
|
||||
|
Premises and equipment, net
|
$
|
45,291
|
$
|
46,318
|
||||
Depreciation and amortization of premises and equipment for 2018, 2017, and 2016 was $3.8 million, $3.9
million, and $3.7 million, respectively.
9. Other Real Estate Owned
Activity for other real estate owned was as follows:
|
(in thousands)
|
2018
|
2017
|
||||||
|
Beginning balance of other real estate owned
|
$
|
31,996
|
$
|
35,856
|
||||
|
New assets acquired
|
5,459
|
5,382
|
||||||
|
Fair value adjustments
|
(2,530
|
)
|
(3,034
|
)
|
||||
|
Sale of assets
|
(7,652
|
)
|
(6,208
|
)
|
||||
|
Ending balance of other real estate owned
|
$
|
27,273
|
$
|
31,996
|
||||
Carrying costs and fair
value adjustments associated with foreclosed properties were $4.3 million, $4.5 million, and $2.9 million for 2018, 2017, and 2016, respectively. See note 1 for a description of our accounting policies relative to foreclosed properties and other
real estate owned.
The major classifications of foreclosed properties are shown in the following table:
|
(in thousands)
December 31
|
2018
|
2017
|
||||||
|
1-4 family
|
$
|
5,253
|
$
|
5,908
|
||||
|
Agricultural/farmland
|
0
|
68
|
||||||
|
Construction/land development/other
|
15,017
|
16,158
|
||||||
|
Multifamily
|
88
|
176
|
||||||
|
Non-farm/non-residential
|
6,915
|
9,686
|
||||||
|
Total foreclosed properties
|
$
|
27,273
|
$
|
31,996
|
||||
10. Deposits
Major classifications of deposits are categorized as follows:
|
(in thousands)
December 31
|
2018
|
2017
|
||||||
|
Noninterest bearing deposits
|
$
|
803,316
|
$
|
790,930
|
||||
|
NOW accounts
|
56,964
|
51,218
|
||||||
|
Money market deposits
|
887,288
|
692,021
|
||||||
|
Savings
|
406,749
|
416,551
|
||||||
|
Certificates of deposit and other time deposits of $100,000 or more
|
651,967
|
759,025
|
||||||
|
Certificates of deposit and other time deposits less than $100,000
|
499,666
|
554,118
|
||||||
|
Total deposits
|
$
|
3,305,950
|
$
|
3,263,863
|
||||
Certificates of deposit and other time deposits of $250,000 or more at December 31, 2018 and 2017 were $219.0
million and $232.5 million, respectively. Wholesale brokered deposits at December 31, 2018 and 2017 were $42.3 million and $82.3 million, respectively. The decrease in wholesale brokered deposits resulted from a $40.0 million maturity during the
third quarter 2018.
Maturities of certificates of deposits and other time deposits are presented below:
|
Maturities by Period at December 31, 2018
|
||||||||||||||||||||||||||||
|
(in thousands)
|
Total
|
Within 1 Year
|
2 Years
|
3 Years
|
4 Years
|
5 Years
|
After 5 Years
|
|||||||||||||||||||||
|
Certificates of deposit and other time deposits of $100,000 or more
|
$
|
651,967
|
$
|
438,837
|
$
|
125,420
|
$
|
40,706
|
$
|
27,135
|
$
|
19,869
|
$
|
0
|
||||||||||||||
|
Certificates of deposit and other time deposits less than $100,000
|
499,666
|
401,755
|
43,217
|
23,606
|
14,581
|
16,249
|
258
|
|||||||||||||||||||||
|
Total maturities
|
$
|
1,151,633
|
$
|
840,592
|
$
|
168,637
|
$
|
64,312
|
$
|
41,716
|
$
|
36,118
|
$
|
258
|
||||||||||||||
11. Borrowings
Short-term debt is categorized as follows:
|
(in thousands)
December 31
|
2018
|
2017
|
||||||
|
Repurchase agreements
|
$
|
232,712
|
$
|
243,814
|
||||
|
Federal funds purchased
|
1,180
|
7,312
|
||||||
|
Total short-term debt
|
$
|
233,892
|
$
|
251,126
|
||||
All federal funds purchased mature and reprice daily. See note 12 for information regarding the maturities
of our repurchase agreements. The average rates paid for federal funds purchased and repurchase agreements on December 31, 2018 were 2.18% and 2.01%, respectively.
The maximum balance for repurchase agreements at any month-end during 2018 occurred at August 31, 2018, with
a month-end balance of $253.2 million. The average balance of repurchase agreements for the year was $239.9 million.
On November 30, 2017, Community Trust Bancorp, Inc. signed an amendment to a revolving credit promissory
note, dated October 31, 2014 and last amended February 3, 2017, for a line of credit for general corporate purposes in the amount of $12 million at a floating interest rate of 2.00% in excess of the one-month LIBOR rate. This amendment extended the
maturity date to November 30, 2018 with an unused commitment fee of 0.30%. CTBI did not renew the line of credit beyond the scheduled maturity date.
Long-term debt is categorized as follows:
|
(in thousands)
December 31
|
2018
|
2017
|
||||||
|
Junior subordinated debentures, 4.33%, due 6/1/37
|
$
|
59,341
|
$
|
59,341
|
||||
On March 30, 2007, CTBI issued $61.3 million in junior subordinated debentures to a newly formed
unconsolidated Delaware statutory trust subsidiary which in turn issued $59.5 million of capital securities in a private placement to institutional investors. The debentures, which mature in 30 years but are redeemable at par at CTBI’s option after
five years, were issued at a rate of 6.52% until June 1, 2012, and thereafter at a floating rate based on the three-month LIBOR plus 1.59%. The underlying capital securities were issued at the equivalent rates and terms. The proceeds of the
debentures were used to fund the redemption on April 2, 2007 of all CTBI’s outstanding 9.0% and 8.25% junior subordinated debentures in the total amount of $61.3 million. In May 2017, CTBI was able to purchase $2.0 million of the junior subordinated debentures in the open market at a purchase price of $1.4 million, resulting in a gain of $0.6 million. The junior subordinated debentures will be
retained by CTBI until maturity, and CTBI will continue to report the junior subordinated debentures at the net amount outstanding of $59.3 million.
On November 29, 2018, the coupon rate was set at 4.33% for the March 1, 2019 distribution date, which was
based on the three-month LIBOR rate as of November 29, 2018 of 2.74% plus 1.59%.
12. Repurchase Agreements
We utilize securities sold under agreements to repurchase to facilitate the needs of our customers and
provide additional funding to our balance sheet. Repurchase agreements are transactions whereby we offer to sell to a counterparty an undivided interest in an eligible security at an agreed upon purchase price, and which obligates CTBI to repurchase
the security on an agreed upon date at an agreed upon repurchase price plus interest at an agreed upon rate. Securities sold under agreements to repurchase are recorded at the amount of cash received in connection with the transaction and are
reflected in the accompanying consolidated balance sheets.
We monitor collateral levels on a continuous basis and maintain records of each transaction specifically
describing the applicable security and the counterparty’s fractional interest in that security, and we segregate the security from its general assets in accordance with regulations governing custodial holdings of securities. The primary risk with
our repurchase agreements is market risk associated with the securities securing the transactions, as we may be required to provide additional collateral based on fair value changes of the underlying securities. Securities pledged as collateral
under repurchase agreements are maintained with our safekeeping agents. The carrying value of investment securities available for sale pledged as collateral under repurchase agreements totaled $285.2 million and $295.4 million at December 31, 2018
and December 31, 2017, respectively.
The remaining contractual maturity of the securities sold under agreements to repurchase by class of
collateral pledged included in the accompanying consolidated balance sheets as of December 31, 2018 and December 31, 2017 is presented in the following tables:
|
December 31, 2018
|
||||||||||||||||||||
|
Remaining Contractual Maturity of the Agreements
|
||||||||||||||||||||
|
(in thousands)
|
Overnight and
Continuous |
Up to 30 days
|
30-90 days
|
Greater Than
90 days |
Total
|
|||||||||||||||
|
Repurchase agreements and
repurchase-to-maturity transactions: |
||||||||||||||||||||
|
U.S. Treasury and government agencies
|
$
|
25,346
|
$
|
0
|
$
|
2,548
|
$
|
60,699
|
$
|
88,593
|
||||||||||
|
State and political subdivisions
|
58,864
|
0
|
2,995
|
10,384
|
72,243
|
|||||||||||||||
|
U.S. government sponsored agency mortgage-backed securities
|
22,076
|
0
|
1,877
|
47,923
|
71,876
|
|||||||||||||||
|
Total
|
$
|
106,286
|
$
|
0
|
$
|
7,420
|
$
|
119,006
|
$
|
232,712
|
||||||||||
|
December 31, 2017
|
||||||||||||||||||||
|
Remaining Contractual Maturity of the Agreements
|
||||||||||||||||||||
|
(in thousands)
|
Overnight and
Continuous |
Up to 30 days
|
30-90 days
|
Greater Than
90 days |
Total
|
|||||||||||||||
|
Repurchase agreements and
repurchase-to-maturity transactions: |
||||||||||||||||||||
|
U.S. Treasury and government agencies
|
$
|
24,957
|
$
|
0
|
$
|
16,771
|
$
|
67,867
|
$
|
109,595
|
||||||||||
|
State and political subdivisions
|
62,620
|
0
|
567
|
12,161
|
75,348
|
|||||||||||||||
|
U.S. government sponsored agency mortgage-backed securities
|
13,360
|
0
|
4,662
|
40,849
|
58,871
|
|||||||||||||||
|
Total
|
$
|
100,937
|
$
|
0
|
$
|
22,000
|
$
|
120,877
|
$
|
243,814
|
||||||||||
13. Advances from Federal Home Loan Bank
Federal Home Loan Bank advances consisted of the following monthly amortizing borrowings at
December 31:
|
(in thousands)
|
2018
|
2017
|
||||||
|
Monthly amortizing
|
$
|
436
|
$
|
845
|
||||
|
Total FHLB advances
|
$
|
436
|
$
|
845
|
||||
The advances from the FHLB that require monthly principal payments were due for repayment as follows:
|
Principal Payments Due by Period at December 31, 2018
|
||||||||||||||||||||||||||||
|
(in thousands)
|
Total
|
Within 1 Year
|
2 Years
|
3 Years
|
4 Years
|
5 Years
|
After 5 Years
|
|||||||||||||||||||||
|
Outstanding advances, weighted average interest rate – 0.07%
|
$
|
436
|
$
|
22
|
$
|
20
|
$
|
21
|
$
|
20
|
$
|
20
|
$
|
333
|
||||||||||||||
At December 31, 2017, CTBI had monthly amortizing FHLB advances totaling $0.8 million at a weighted average
interest rate of 1.14%.
Advances totaling $0.4 million at December 31, 2018 were collateralized by FHLB stock of $14.7 million and a
blanket lien on qualifying 1-4 family first mortgage loans. As of December 31, 2018, CTBI had a $555.6 million FHLB borrowing capacity with $0.4 million in advances and $243.0 million in letters of credit used for public fund pledging leaving $312.2
million available for additional advances. The advances had fixed interest rates of 0.00% and 2.00% with a weighted average rate of 0.07%. The advances are subject to restrictions or penalties in the event of prepayment.
14. Income Taxes
The components of the provision for income taxes, exclusive of tax effect of unrealized AFS securities gains
and losses, are as follows:
|
(in thousands)
|
2018
|
2017
|
2016
|
|||||||||
|
Current income tax expense
|
$
|
11,560
|
$
|
20,108
|
$
|
18,417
|
||||||
|
Deferred income tax expense (benefit)
|
(246
|
)
|
(259
|
)
|
701
|
|||||||
|
Effect of Tax Cuts & Jobs Act (benefit)
|
0
|
(2,831
|
)
|
0
|
||||||||
|
Total income tax expense
|
$
|
11,314
|
$
|
17,018
|
$
|
19,118
|
||||||
The Tax Cuts and Jobs Act (the “Act”) was enacted in December 2017. The Act reduced the U.S. federal
corporate tax rate from 35 percent to 21 percent. As of December 31, 2018, we have completed our accounting for the tax effects of enactment of the Act. The effect of the Tax Cuts and Jobs Act (benefit) listed above for the year 2017, reflects the
revaluation of our net deferred tax liability based on a U.S. federal tax rate of 21 percent.
A reconciliation of income tax expense at the statutory rate to our actual income tax expense is shown below:
|
(in thousands)
|
2018
|
2017
|
2016
|
|||||||||||||||||||||
|
Computed at the statutory rate
|
$
|
14,814
|
21.00
|
%
|
$
|
23,979
|
35.00
|
%
|
$
|
23,262
|
35.00
|
%
|
||||||||||||
|
Adjustments resulting from:
|
||||||||||||||||||||||||
|
Tax-exempt interest
|
(673
|
)
|
(0.95
|
)
|
(1,259
|
)
|
(1.84
|
)
|
(1,289
|
)
|
(1.94
|
)
|
||||||||||||
|
Housing and new markets credits
|
(2,635
|
)
|
(3.73
|
)
|
(2,579
|
)
|
(3.76
|
)
|
(2,680
|
)
|
(4.03
|
)
|
||||||||||||
|
Dividends received deduction
|
(9
|
)
|
(0.01
|
)
|
(129
|
)
|
(0.19
|
)
|
(136
|
)
|
(0.20
|
)
|
||||||||||||
|
Bank owned life insurance
|
(599
|
)
|
(0.85
|
)
|
(492
|
)
|
(0.72
|
)
|
(518
|
)
|
(0.78
|
)
|
||||||||||||
|
ESOP dividend deduction
|
(188
|
)
|
(0.27
|
)
|
(319
|
)
|
(0.47
|
)
|
(313
|
)
|
(0.47
|
)
|
||||||||||||
|
Stock option exercises and restricted stock vesting
|
(39
|
)
|
(0.06
|
)
|
(170
|
)
|
(0.25
|
)
|
0
|
-
|
||||||||||||||
|
Effect of Tax Cuts & Jobs Act
|
0
|
-
|
(2,831
|
)
|
(4.13
|
)
|
0
|
-
|
||||||||||||||||
|
Other, net
|
643
|
0.91
|
818
|
1.20
|
792
|
1.18
|
||||||||||||||||||
|
Total
|
$
|
11,314
|
16.04
|
%
|
$
|
17,018
|
24.84
|
%
|
$
|
19,118
|
28.76
|
%
|
||||||||||||
The components of the net deferred tax liability as of December 31 are as follows:
|
(in thousands)
|
2018
|
2017
|
||||||
|
Deferred tax assets:
|
||||||||
|
Allowance for loan and lease losses
|
$
|
7,541
|
$
|
7,592
|
||||
|
Interest on nonperforming loans
|
531
|
560
|
||||||
|
Accrued expenses
|
1,093
|
442
|
||||||
|
Allowance for other real estate owned
|
1,435
|
1,322
|
||||||
|
Limited partnership investments
|
0
|
64
|
||||||
|
Unrealized losses on AFS securities
|
1,757
|
932
|
||||||
|
Other
|
164
|
204
|
||||||
|
Total deferred tax assets
|
12,521
|
11,116
|
||||||
|
Deferred tax liabilities:
|
||||||||
|
Depreciation and amortization
|
(12,210
|
)
|
(12,270
|
)
|
||||
|
FHLB stock dividends
|
(1,704
|
)
|
(2,076
|
)
|
||||
|
Loan fee income
|
(419
|
)
|
(263
|
)
|
||||
|
Mortgage servicing rights
|
(757
|
)
|
(732
|
)
|
||||
|
Capitalized lease obligations
|
0
|
(14
|
)
|
|||||
|
Limited partnership investments
|
(257
|
)
|
0
|
|||||
|
Other
|
(537
|
)
|
(195
|
)
|
||||
|
Total deferred tax liabilities
|
(15,884
|
)
|
(15,550
|
)
|
||||
|
Net deferred tax liability
|
$
|
(3,363
|
)
|
$
|
(4,434
|
)
|
||
CTBI accounts for income taxes in accordance with income tax accounting guidance (ASC 740, Income Taxes). The income tax accounting guidance results in two components of income tax expense: current and deferred. Current income tax expense
reflects taxes to be paid or refunded for the current period by applying the provisions of the enacted tax law to the taxable income or excess of deductions over revenues. CTBI determines deferred income taxes using the liability (or balance sheet)
method. Under this method, the net deferred tax asset or liability is based on the tax effects of the differences between the book and tax bases of assets and liabilities, and enacted changes in tax rates and laws are recognized in the period in
which they occur. Deferred income tax expense results from changes in deferred tax assets and liabilities between periods. Deferred tax assets are reduced by a valuation allowance if, based on the weight of evidence available, it is more likely
than not that some portion or all of a deferred tax asset will not be realized.
Uncertain tax positions are recognized if it is more likely than not, based on the technical merits, that the
tax position will be realized or sustained upon examination. The term more likely than not means a likelihood of more than 50 percent; the terms examined and upon examination also include resolution of the related appeals or litigation processes, if
any. A tax position that meets the more-likely-than-not recognition threshold is initially and subsequently measured as the largest amount of tax benefit that has a greater than 50 percent likelihood of being realized upon settlement with a taxing
authority that has full knowledge of all relevant information. The determination of whether or not a tax position has met the more-likely-than-not recognition threshold considers the facts, circumstances, and information available at the reporting
date and is subject to management’s judgment.
With a few exceptions, CTBI is no longer subject to U.S. federal tax examinations by tax authorities for
years before 2015, and state and local income tax examinations by tax authorities for years before 2014. For federal tax purposes, CTBI recognizes interest and penalties on income taxes as a component of income tax expense.
CTBI files consolidated income tax returns with its subsidiaries.
15. Employee Benefits
CTBI maintains two separate retirement savings plans, a 401(k) Plan and an Employee Stock
Ownership Plan (“ESOP”).
The 401(k) Plan is available to all employees (age 21 and over) who are credited with one year of service (12 consecutive month period with at least 1,000 hours). Participants in the plan have the option to contribute from 1% to
20% of their annual compensation. CTBI matches 50% of participant contributions up to 8% of gross pay. CTBI may at its discretion, contribute an additional percentage of covered employees’ compensation. CTBI’s matching contributions were $1.1
million for the year ended December 31, 2018 and $1.0 million for the years ended December 31, 2017, and 2016. The 401(k) Plan owned 416,360, 406,021, and 482,426 shares of CTBI’s common stock at December 31, 2018, 2017, and 2016, respectively. Substantially all shares owned by the 401(k) were allocated to employee
accounts on those dates. The market price of the shares at the date of allocation is essentially the same as the market price at the date of purchase.
The ESOP Plan has the same entrance requirements as the 401(k) Plan above. CTBI currently contributes 4% of covered employees’ compensation to the ESOP. The ESOP uses the contributions to acquire shares of CTBI’s common stock.
CTBI’s contributions to the ESOP were $1.6 million for the year ended December 31, 2018 and 2017 and $1.5 million for the year ended December 31, 2016. The ESOP owned 726,327, 737,079, and 788,308 shares of CTBI’s common stock at December 31, 2018, 2017, and 2016, respectively. Substantially all shares owned by the ESOP were allocated to employee accounts on those dates. The market price of
the shares at the date of allocation is essentially the same as the market price at the date of purchase.
Stock-Based Compensation:
As of December 31, 2018, CTBI maintained one active and two inactive incentive stock ownership plans covering key employees. The 2015 Stock Ownership Incentive Plan (“2015 Plan”) was approved by the Board of Directors and the Shareholders in 2015. The 2006
Stock Ownership Incentive Plan (“2006 Plan”) was approved by the Board of Directors and the Shareholders in 2006. The 2006 Plan was rendered inactive as of April 28, 2015. The 1998 Stock Option Plan (“1998 Plan”) was approved by the Board of
Directors and the Shareholders in 1998. The 1998 Plan was rendered inactive as of April 26, 2006. The 2015 Plan has 550,000 shares authorized, 509,335 of which were available at December 31, 2018. Shares issuable pursuant to awards which were
granted under the prior plans on or before their respective expiration or termination dates will be issued from the remaining shares reserved for issuance under the prior plans. The shares of common stock reserved for issuance under the prior plans
in excess of the number of shares as to which options or other benefits are awarded thereunder, and any shares as to which options or other benefits granted under the prior plans may lapse, expire, terminate or be canceled, will not be reserved and
available for issuance or reissuance under the 2015 Plan. The following table provides detail of the number of shares to be issued upon exercise of outstanding stock-based awards and remaining shares available for future issuance under all of
CTBI’s equity compensation plans as of December 31, 2018:
|
Plan Category (shares in thousands)
|
Number of Shares to Be Issued Upon Exercise
|
Weighted Average Price
|
Shares Available for Future Issuance
|
|||||||||
|
Equity compensation plans approved by shareholders:
|
||||||||||||
|
Stock options
|
33
|
$
|
32.47
|
509
|
(a)
|
|||||||
|
Restricted stock
|
(c)
|
(b)
|
(a)
|
|||||||||
|
Performance units
|
(d)
|
(b)
|
(a)
|
|||||||||
|
Stock appreciation rights (“SARs”)
|
(e)
|
(b)
|
(a)
|
|||||||||
|
Total
|
509
|
|||||||||||
| (a) |
Under the 2015 Plan, 550,000 shares are authorized for issuance; 44,988 have been issued as of December 31, 2018. In January of
2016, 18,069 restricted stock shares were issued under the terms of the 2015 Plan pursuant to awards granted under the 2006 Plan. Additional shares will not be issued pursuant to awards granted from prior plans.
|
| (b) |
Not applicable
|
| (c) |
The maximum number of shares of restricted stock that may be granted is 550,000 shares, and the maximum that may be granted to a
participant during any calendar year is 75,000 shares.
|
| (d) |
No performance units payable in stock had been issued as of December 31, 2018. The maximum payment that can be made pursuant to
performance units granted to any one participant in any calendar year is $1,000,000.
|
| (e) |
No SARS have been issued. The maximum number of shares with respect to which SARs may be granted to a participant during any
calendar year is 100,000 shares.
|
The following table details the shares available for future issuance under the 2015 Plan at
December 31, 2018.
|
Plan Category
|
Shares Available for Future Issuance
|
|
Shares available at January 1, 2018
|
519,140
|
|
Stock option issuances
|
0
|
|
Restricted stock issuances
|
(11,320)
|
|
Forfeitures
|
1,515
|
|
Shares available for future issuance
|
509,335
|
There were no stock options issued in 2017 or 2018. CTBI uses a
Black-Scholes option pricing model with the following weighted average assumptions, which are evaluated and revised as necessary, in estimating the grant-date fair value of each option grant for the year end:
|
2016
|
|
|
Expected option life (in years)
|
7.5
|
|
Expected volatility
|
34.34%
|
|
Expected dividend yield
|
3.70%
|
|
Risk-free interest rate
|
1.45%
|
The expected life of
options granted is estimated from past experience activity and represents the period of time that granted options are expected to be outstanding. The expected volatility is based on historical volatility of the stock using a historical look back that approximates the expected life of the option grant. The
interest rate for periods within the contractual life of the option is based on the U.S. Treasury yield curve in effect at the time of the grant. CTBI’s stock-based compensation expense for the years 2018, 2017, and 2016 was $0.7 million, $0.6
million, and $0.5 million, respectively. Included in stock-based compensation expense were dividends paid on restricted stock shares in the amount of $51 thousand, $53 thousand, and $37 thousand, respectively, for the same periods.
The 2015 Plan:
CTBI’s stock option activity for the 2015 Plan for the years ended December 31, 2018, 2017, and 2016 is
summarized as follows:
|
December 31
|
2018
|
2017
|
2016
|
|||||||||||||||||||||
|
Options
|
Weighted Average Exercise Price
|
Options
|
Weighted Average Exercise Price
|
Options
|
Weighted Average Exercise Price
|
|||||||||||||||||||
|
Outstanding at beginning of year
|
10,000
|
$
|
33.55
|
10,000
|
$
|
33.55
|
0
|
$
|
0
|
|||||||||||||||
|
Granted
|
0
|
0
|
0
|
0
|
10,000
|
33.55
|
||||||||||||||||||
|
Exercised
|
(10,000)
|
33.55
|
0
|
0
|
0
|
0
|
||||||||||||||||||
|
Forfeited/expired
|
0
|
0
|
0
|
0
|
0
|
0
|
||||||||||||||||||
|
Outstanding at end of year
|
0
|
$
|
0
|
10,000
|
$
|
33.55
|
10,000
|
$
|
33.55
|
|||||||||||||||
|
Exercisable at end of year
|
0
|
$
|
0
|
0
|
$
|
0
|
0
|
$
|
0
|
|||||||||||||||
*Pursuant to the 2015 Plan provisions, the death of the option holder accelerated the vesting of 10,000 shares during the year.
A summary of the status of CTBI’s 2015 Plan for nonvested options as of December 31, 2018, and changes
during the year ended December 31, 2018, is presented as follows:
|
Nonvested Options
|
Options
|
Weighted Average Grant Date Fair Value
|
||||||
|
Nonvested at January 1, 2018
|
10,000
|
$
|
6.82
|
|||||
|
Granted
|
0
|
0
|
||||||
|
Vested
|
(10,000)
|
6.82
|
||||||
|
Forfeited
|
0
|
0
|
||||||
|
Nonvested at December 31, 2018
|
0
|
$
|
0
|
|||||
There were no options granted from the 2015 Plan for the year ended December 31, 2018.
The following table shows the intrinsic values of options exercised, exercisable, and outstanding for the
2015 Plan for the years ended December 31, 2018 and 2017:
|
(in thousands)
|
2018
|
2017
|
||||||
|
Options exercised
|
$
|
140
|
$
|
0
|
||||
|
Options exercisable
|
0
|
0
|
||||||
|
Outstanding options
|
0
|
136
|
||||||
The following table shows restricted stock activity for the 2015 Plan for the years ended December 31, 2018
and 2017:
|
December 31
|
2018
|
2017
|
2016
|
|||||||||||||||||||||
|
Grants
|
Weighted Average Fair
Value at Grant
|
Grants
|
Weighted Average Fair
Value at Grant
|
Grants
|
Weighted Average Fair
Value at Grant
|
|||||||||||||||||||
|
Outstanding at beginning of year
|
33,085
|
$
|
41.84
|
17,496
|
$
|
33.55
|
0
|
$
|
0
|
|||||||||||||||
|
Granted
|
11,320
|
49.30
|
23,668
|
46.45
|
18,069
|
33.55
|
||||||||||||||||||
|
Vested
|
(8,761
|
)
|
40.46
|
(5,751
|
)
|
35.79
|
(442
|
)
|
33.55
|
|||||||||||||||
|
Forfeited
|
(1,389
|
)
|
46.77
|
(2,328
|
)
|
41.31
|
(131
|
)
|
33.55
|
|||||||||||||||
|
Outstanding at end of year
|
34,255
|
$
|
44.46
|
33,085
|
$
|
41.84
|
17,496
|
$
|
33.55
|
|||||||||||||||
* Grants issued in 2016 were issued under
the terms of the 2015 Plan pursuant to awards granted and earned under the 2006 Plan.
The 2006 Plan:
CTBI’s stock option activity for the 2006 Plan for the years ended December 31, 2018, 2017, and 2016 is
summarized as follows:
|
December 31
|
2018
|
2017
|
2016
|
|||||||||||||||||||||
|
Options
|
Weighted Average Exercise Price
|
Options
|
Weighted Average Exercise Price
|
Options
|
Weighted Average Exercise Price
|
|||||||||||||||||||
|
Outstanding at beginning of year
|
35,376
|
$
|
31.90
|
61,041
|
$
|
29.84
|
118,574
|
$
|
32.36
|
|||||||||||||||
|
Granted
|
0
|
0
|
0
|
0
|
0
|
0
|
||||||||||||||||||
|
Exercised
|
(2,475
|
)
|
25.52
|
(25,665
|
)
|
27.01
|
(57,423
|
)
|
35.02
|
|||||||||||||||
|
Forfeited/expired
|
(330
|
)
|
23.79
|
0
|
0
|
(110
|
)
|
35.41
|
||||||||||||||||
|
Outstanding at end of year
|
32,571
|
$
|
32.47
|
35,376
|
$
|
31.90
|
61,041
|
$
|
29.84
|
|||||||||||||||
|
Exercisable at end of year
|
2,571
|
$
|
25.11
|
5,376
|
$
|
25.22
|
30,629
|
$
|
26.64
|
|||||||||||||||
A summary of the status of CTBI’s 2006 Plan for nonvested options as of December 31, 2018, and changes
during the year ended December 31, 2018, is presented as follows:
|
Nonvested Options
|
Options
|
Weighted Average Grant Date Fair Value
|
||||||
|
Nonvested at January 1, 2018
|
30,000
|
$
|
6.98
|
|||||
|
Granted
|
0
|
0
|
||||||
|
Vested
|
0
|
0
|
||||||
|
Forfeited
|
0
|
0
|
||||||
|
Nonvested at December 31, 2018
|
30,000
|
$
|
6.98
|
|||||
The weighted average remaining contractual term in years of the options outstanding at December 31, 2018
was 5.0 years.
There were no options granted from the 2006 Plan for the years 2018 and 2017. The weighted-average fair
value of options granted from the 2006 Plan during the year 2016 was $0.1 million or $6.60 per share.
The following table shows the intrinsic values of options exercised, exercisable, and outstanding for the
2006 Plan for the years ended December 31, 2018, 2017, and 2016:
|
(in thousands)
|
2018
|
2017
|
2016
|
|||||||||
|
Options exercised
|
$
|
56
|
$
|
537
|
$
|
139
|
||||||
|
Options exercisable
|
37
|
118
|
703
|
|||||||||
|
Outstanding options
|
233
|
538
|
1,206
|
|||||||||
The following table shows restricted stock activity for the years ended December 31, 2018, 2017, and 2016:
|
December 31
|
2018
|
2017
|
2016
|
|||||||||||||||||||||
|
Grants
|
Weighted Average Fair
Value at Grant
|
Grants
|
Weighted Average Fair
Value at Grant
|
Grants
|
Weighted Average Fair
Value at Grant
|
|||||||||||||||||||
|
Outstanding at beginning of year
|
5,426
|
$
|
33.24
|
11,989
|
$
|
32.85
|
64,735
|
$
|
28.92
|
|||||||||||||||
|
Granted
|
0
|
0
|
0
|
0
|
0
|
0
|
||||||||||||||||||
|
Vested
|
(3,236
|
)
|
33.90
|
(6,214
|
)
|
32.48
|
(52,521
|
)
|
28.01
|
|||||||||||||||
|
Forfeited
|
(126
|
)
|
32.27
|
(349
|
)
|
33.31
|
(225
|
)
|
32.52
|
|||||||||||||||
|
Outstanding at end of year
|
2,064
|
$
|
32.27
|
5,426
|
$
|
33.24
|
11,989
|
$
|
32.85
|
|||||||||||||||
The 1998 Plan:
The 1998 Plan had no outstanding options and no activity for the years ended December 31, 2018 and 2017.
CTBI’s stock option activity for the 1998 Plan for the year ended December 31, 2016 is summarized as follows:
|
December 31
|
2016
|
|||||||
|
Options
|
Weighted Average Exercise Price
|
|||||||
|
Outstanding at beginning of year
|
2,980
|
$
|
29.49
|
|||||
|
Granted
|
0
|
0
|
||||||
|
Exercised
|
(2,980
|
)
|
29.49
|
|||||
|
Forfeited/expired
|
0
|
0
|
||||||
|
Outstanding at end of year
|
0
|
$
|
0
|
|||||
|
Exercisable at end of year
|
0
|
$
|
0
|
|||||
The following table shows the intrinsic values of options exercised, exercisable, and outstanding for the
1998 Plan for the year ended December 31, 2016:
|
(in thousands)
|
2016
|
|||
|
Options exercised
|
$
|
13
|
||
|
Options exercisable
|
0
|
|||
|
Outstanding options
|
0
|
|||
There were no nonvested options in the 1998 Plan for the years December 31, 2018, 2017, and 2016.
The following table shows the unrecognized compensation cost related to nonvested share-based compensation
arrangements granted under the plans at December 31, 2018, 2017, and 2016 and the total grant-date fair value of shares vested, cash received from option exercises under all share-based payment arrangements, and the actual tax benefit realized for
the tax deductions from option exercises of the share-based payment arrangements for the years ended December 31, 2018, 2017, and 2016.
|
(in thousands)
|
2018
|
2017
|
2016
|
|||||||||
|
Unrecognized compensation cost of unvested share-based compensation arrangements granted under the plan at year-end
|
$
|
1,072
|
$
|
1,242
|
$
|
835
|
||||||
|
Grant date fair value of shares vested for the year
|
645
|
564
|
1,490
|
|||||||||
|
Cash received from option exercises under all share-based payment arrangements for the year
|
399
|
693
|
2,099
|
|||||||||
|
Tax benefit realized for the tax deductions from option exercises of the share-based payment arrangements for the year
|
49
|
138
|
3
|
|||||||||
The unrecognized compensation cost related to nonvested share-based compensation arrangements granted under
the plans at December 31, 2018 is expected to be recognized over a weighted-average period of 2.4 years.
16. Operating Leases
Certain premises and equipment are leased under operating leases. Additionally, certain
premises are leased or subleased to third parties. These leases generally contain renewal options and require CTBI to pay all executory costs, such as taxes, maintenance fees, and insurance. Minimum non-cancellable rental payments and rental
receipts are as follows:
|
(in thousands)
|
Payments
|
Receipts
|
||||||
|
2019
|
$
|
1,999
|
$
|
716
|
||||
|
2020
|
1,710
|
539
|
||||||
|
2021
|
1,737
|
440
|
||||||
|
2022
|
1,760
|
348
|
||||||
|
2023
|
1,696
|
233
|
||||||
|
Thereafter
|
13,031
|
91
|
||||||
|
Total
|
$
|
21,933
|
$
|
2,367
|
||||
Rental expense net of rental income under operating leases was $1.3 million for 2018, $1.4 million for 2017,
and $1.3 million for 2016.
17. Fair Market Value of Financial Assets and Liabilities
Fair Value Measurements
ASC 820, Fair
Value Measurements, defines fair value, establishes a framework for measuring fair value in generally accepted accounting principles and expands disclosures about fair value measurements. ASC 820 applies whenever other standards require (or
permit) assets or liabilities to be measured at fair value but does not expand the use of fair value in any new circumstances. Fair value measurements must maximize the use of observable inputs and minimize the use of unobservable inputs. In this
standard, the FASB clarifies the principle that fair value should be based on the exit price when pricing the asset or liability. In support of this principle, ASC 820 establishes a fair value hierarchy that prioritizes the information used to
develop those assumptions. The fair value hierarchy is as follows:
Level 1 Inputs – Quoted prices in active markets for identical assets or liabilities.
Level 2 Inputs - Inputs other than quoted prices included in Level 1 that are observable for the asset or liability, either
directly or indirectly. These might include quoted prices for similar assets and liabilities in active markets, and inputs other than quoted prices that are observable for the asset or liability, such as interest rates and yield curves that are
observable at commonly quoted intervals.
Level 3 Inputs - Unobservable inputs for determining the fair values of assets or liabilities that reflect an entity’s own
assumptions about the assumptions that market participants would use in determining an exit price for the assets or liabilities.
Recurring Measurements
The following tables present the fair value measurements of assets recognized in the accompanying balance
sheets measured at fair value on a recurring basis as of December 31, 2018 and December 31, 2017 and indicate the level within the fair value hierarchy of the valuation techniques.
|
(in thousands)
|
Fair Value Measurements at
December 31, 2018 Using
|
|||||||||||||||
|
Fair Value
|
Quoted Prices in Active Markets for Identical Assets
(Level 1)
|
Significant Other Observable Inputs
(Level 2)
|
Significant Unobservable Inputs
(Level 3)
|
|||||||||||||
|
Assets measured – recurring basis
|
||||||||||||||||
|
Available-for-sale securities:
|
||||||||||||||||
|
U.S. Treasury and government agencies
|
$
|
217,938
|
$
|
91,028
|
$
|
126,910
|
$
|
0
|
||||||||
|
State and political subdivisions
|
124,488
|
0
|
124,488
|
0
|
||||||||||||
|
U.S. government sponsored agency mortgage-backed securities
|
250,819
|
0
|
250,819
|
0
|
||||||||||||
|
Other debt securities
|
501
|
0
|
501
|
0
|
||||||||||||
|
Equity securities at fair value
|
1,173
|
0
|
0
|
1,173
|
||||||||||||
|
Mortgage servicing rights
|
3,607
|
0
|
0
|
3,607
|
||||||||||||
|
(in thousands)
|
Fair Value Measurements at
December 31, 2017 Using
|
|||||||||||||||
|
Fair Value
|
Quoted Prices in Active Markets for Identical Assets
(Level 1)
|
Significant Other Observable Inputs
(Level 2)
|
Significant Unobservable Inputs
(Level 3)
|
|||||||||||||
|
Assets measured – recurring basis
|
||||||||||||||||
|
Available-for-sale securities:
|
||||||||||||||||
|
U.S. Treasury and government agencies
|
$
|
210,572
|
$
|
64,598
|
$
|
145,974
|
$
|
0
|
||||||||
|
State and political subdivisions
|
145,015
|
0
|
145,015
|
0
|
||||||||||||
|
U.S. government sponsored agency mortgage-backed securities
|
205,309
|
0
|
205,309
|
0
|
||||||||||||
|
Other debt securities
|
507
|
0
|
507
|
0
|
||||||||||||
|
CRA investment funds
|
24,358
|
24,358
|
0
|
0
|
||||||||||||
|
Mortgage servicing rights
|
3,484
|
0
|
0
|
3,484
|
||||||||||||
Following is a description of the valuation methodologies and inputs used for assets measured
at fair value on a recurring basis and recognized in the accompanying balance sheets, as well as the general classification of such assets pursuant to the valuation hierarchy. These valuation methodologies were applied to all of CTBI’s financial
assets carried at fair value. CTBI had no liabilities measured and recorded at fair value as of December 31, 2018 and December 31, 2017. There have been no significant changes in the valuation techniques during the year ended December 31, 2018.
For assets classified within Level 3 of the fair value hierarchy, the process used to develop the reported fair value is described below.
Available-for-Sale Securities
Securities classified as available-for-sale are reported at fair value on a recurring basis.
U.S. Treasury and government agencies are classified as Level 1 of the valuation hierarchy where quoted market prices are available in the active market on which the individual securities are traded.
If quoted market prices are not available, CTBI obtains fair value measurements from an
independent pricing service, such as Interactive Data, which utilizes pricing models to determine fair value measurement. CTBI reviews the pricing quarterly to verify the reasonableness of the pricing. The fair value measurements consider
observable data that may include dealer quotes, market spreads, cash flows, the U.S. Treasury yield curve, live trading levels, trade execution data, market consensus prepayment speeds, credit information and the bond’s terms and conditions, among
other factors. U.S. Treasury and government agencies, state and political subdivisions, U.S. government sponsored agency mortgage-backed securities, and other debt securities are classified as Level 2 inputs.
In certain cases where Level 1 or Level 2 inputs are not available, securities are classified
within Level 3 of the hierarchy. Fair value determinations for Level 3 measurements are estimated on a quarterly basis where assumptions used are reviewed to ensure the estimated fair value complies with accounting standards generally accepted in
the United States.
Equity Securities at Fair Value
As of December 31,
2018, the only securities owned by CTBI that were valued using Level 3 criteria are Visa Class B Stock (included in equity securities at fair value). In determining fair value for Visa Class B Stock, CTBI utilizes the expertise of an independent
third party. Accordingly, fair value is determined by the independent third party using an income approach by utilizing assumptions about factors such as
quarterly common stock dividend payments, the conversion of the securities to the relevant Class A Stock shares subject to the prevailing conversion rate and conversion date. We have reviewed the assumptions, processes, and conclusions of
the third party provider. We have determined these assumptions, processes, and conclusions to be reasonable and appropriate in determining the fair value of this asset. See the table below for inputs and valuation techniques used for Level 3 equity securities.
Mortgage Servicing Rights
Mortgage servicing rights do not trade in an active, open market with readily observable
prices. CTBI reports mortgage servicing rights at fair value on a recurring basis with subsequent remeasurement of MSRs based on change in fair value.
In determining fair
value, CTBI utilizes the expertise of an independent third party. Accordingly, fair value is determined by the independent third party by utilizing assumptions about factors such as mortgage interest rates, discount rates, mortgage loan prepayment
speeds, market trends and industry demand. Due to the nature of the valuation inputs, mortgage servicing rights are classified within Level 3 of the hierarchy. Fair value determinations for Level 3 measurements of mortgage servicing rights are
tested for impairment on a quarterly basis where assumptions used are reviewed to ensure the estimated fair value complies with accounting standards generally accepted in the United States. We have reviewed the assumptions, processes, and
conclusions of the third party provider. We have determined these assumptions, processes, and conclusions to be reasonable and appropriate in determining the fair value of this asset. See the table below for inputs and valuation techniques used for Level 3 mortgage servicing rights.
Transfers between Levels
There were no transfers between Levels 1, 2, and 3 as of December 31, 2018.
Level 3 Reconciliation
Following is a reconciliation of the beginning and ending balances of recurring fair value
measurements recognized in the accompanying balance sheet using significant unobservable (Level 3) inputs:
|
(in thousands)
|
2018
|
2017
|
||||||||||||||
|
Equity Securities at Fair Value
|
Mortgage Servicing Rights
|
Equity Securities at Fair Value
|
Mortgage Servicing Rights
|
|||||||||||||
|
Beginning balance
|
$
|
0
|
$
|
3,484
|
$
|
0
|
$
|
3,433
|
||||||||
|
Total unrealized gains
|
||||||||||||||||
|
Included in net income
|
1,173
|
73
|
0
|
91
|
||||||||||||
|
Issues
|
0
|
466
|
0
|
412
|
||||||||||||
|
Settlements
|
0
|
(416
|
)
|
0
|
(452
|
)
|
||||||||||
|
Ending balance
|
$
|
1,173
|
$
|
3,607
|
$
|
0
|
$
|
3,484
|
||||||||
|
Total gains for the period included in net income attributable to the change in unrealized gains or losses related to assets
still held at the reporting date
|
$
|
1,173
|
$
|
73
|
$
|
0
|
$
|
91
|
||||||||
Realized and unrealized gains and losses for items reflected in the table above are included
in net income in the consolidated statements of income as follows:
|
Noninterest Income
|
||||||||
|
(in thousands)
|
2018
|
2017
|
||||||
|
Total gains (losses)
|
$
|
830
|
$
|
(361
|
)
|
|||
Nonrecurring
Measurements
The following tables present the fair value measurements of assets recognized in the
accompanying balance sheets measured at fair value on a nonrecurring basis as of December 31, 2018 and December 31, 2017 and indicate the level within the fair value hierarchy of the valuation techniques.
|
(in thousands)
|
Fair Value Measurements at
December 31, 2018 Using
|
|||||||||||||||
|
Fair Value
|
Quoted Prices in Active Markets for Identical Assets
(Level 1)
|
Significant Other Observable Inputs
(Level 2)
|
Significant Unobservable Inputs
(Level 3)
|
|||||||||||||
|
Assets measured – nonrecurring basis
|
||||||||||||||||
|
Impaired loans (collateral dependent)
|
$
|
747
|
$
|
0
|
$
|
0
|
$
|
747
|
||||||||
|
Other real estate owned
|
6,500
|
0
|
0
|
6,500
|
||||||||||||
|
(in thousands)
|
Fair Value Measurements at
December 31, 2017 Using
|
|||||||||||||||
|
Fair Value
|
Quoted Prices in Active Markets for Identical Assets
(Level 1)
|
Significant Other Observable Inputs
(Level 2)
|
Significant Unobservable Inputs
(Level 3)
|
|||||||||||||
|
Assets measured – nonrecurring basis
|
||||||||||||||||
|
Impaired loans (collateral dependent)
|
$
|
2,709
|
$
|
0
|
$
|
0
|
$
|
2,709
|
||||||||
|
Other real estate owned
|
18,951
|
0
|
0
|
18,951
|
||||||||||||
Following is a description of the valuation methodologies and inputs used for assets measured at fair value
on a nonrecurring basis and recognized in the accompanying balance sheet, as well as the general classification of such assets pursuant to the valuation hierarchy. For assets classified within Level 3 of the fair value hierarchy, the process used to
develop the reported fair value is described below.
Impaired Loans (Collateral Dependent)
The estimated fair value of collateral-dependent impaired loans is based on the appraised fair value of the
collateral, less estimated cost to sell. Collateral-dependent impaired loans are classified within Level 3 of the fair value hierarchy.
CTBI considers the appraisal or evaluation as the starting point for determining fair value and then
considers other factors and events in the environment that may affect the fair value. Appraisals of the collateral underlying collateral-dependent loans are obtained when the loan is determined to be collateral-dependent and subsequently as deemed
necessary by the Chief Credit Officer. Appraisals are reviewed for accuracy and consistency by the Chief Credit Officer. Appraisers are selected from the list of approved appraisers maintained by management. The appraised values are reduced by
discounts to consider lack of marketability and estimated cost to sell if repayment or satisfaction of the loan is dependent on the sale of the collateral. These discounts and estimates are developed by the Chief Credit Officer by comparison to
historical results.
Loans considered impaired under ASC 310-35, Impairment of a Loan, are loans for which, based on current information and events, it is probable that the creditor will be unable to collect all amounts due according to the contractual terms of the loan
agreement. Impaired loans are subject to nonrecurring fair value adjustments to reflect subsequent (i) partial write-downs that are based on the observable market price or current appraised value of the collateral or (ii) the full charge-off of the
loan carrying value. Fair value adjustments on impaired loans disclosed above were $0.3 million and $1.0 million for the years ended December 31, 2018 and December 31, 2017, respectively.
Other Real Estate Owned
In accordance with the provisions of ASC 360, Property, Plant, and Equipment, other real estate owned (OREO) is carried at the lower of fair value at acquisition date or current estimated fair value, less estimated cost to sell when the real estate is
acquired. Estimated fair value of OREO is based on appraisals or evaluations. OREO is classified within Level 3 of the fair value hierarchy. Long-lived assets are subject to nonrecurring fair value adjustments to reflect subsequent partial
write-downs that are based on the observable market price or current appraised value of the collateral. Fair value adjustments on other real estate/assets owned disclosed above were $1.8 million and $2.5 million for the years ended December 31, 2018
and December 31, 2017, respectively.
Our policy for determining the frequency of periodic reviews is based upon consideration of the specific
properties and the known or perceived market fluctuations in a particular market and is typically between 12 and 18 months but generally not more than 24 months. Appraisers are selected from the list of approved appraisers maintained by management.
Unobservable (Level 3) Inputs
The following tables present quantitative information about unobservable inputs used in recurring and
nonrecurring Level 3 fair value measurements at December 31, 2018 and December 31, 2017.
|
(in thousands)
|
Quantitative Information about Level 3 Fair Value Measurements
|
|||||||||
|
Fair Value at December 31, 2018
|
Valuation Technique(s)
|
Unobservable Input
|
Range (Weighted Average)
|
|||||||
|
Equity securities at fair value
|
$
|
1,173
|
Discount cash flows, computer pricing model
|
Discount rate
|
8.0% - 12.0%
(10.0
|
%)
|
||||
|
Conversion date
|
Dec 2022 – Dec 2026
(Dec 2024)
|
|||||||||
|
Mortgage servicing rights
|
$
|
3,607
|
Discount cash flows, computer pricing model
|
Constant prepayment rate
|
7.0% - 28.1%
(9.5
|
%)
|
||||
|
Probability of default
|
0.0% - 100.0%
(2.6
|
%)
|
||||||||
|
Discount rate
|
10.0% - 11.5%
(10.1
|
%)
|
||||||||
|
Impaired loans (collateral-dependent)
|
$
|
747
|
Market comparable properties
|
Marketability discount
|
0.0% - 95.1%
(41.5
|
%)
|
||||
|
Other real estate owned
|
$
|
6,500
|
Market comparable properties
|
Comparability adjustments
|
6.0% - 47.6%
(14.9
|
%)
|
||||
|
(in thousands)
|
Quantitative Information about Level 3 Fair Value Measurements
|
|||||||||
|
Fair Value at December 31, 2017
|
Valuation Technique(s)
|
Unobservable Input
|
Range (Weighted Average)
|
|||||||
|
Mortgage servicing rights
|
$
|
3,484
|
Discount cash flows, computer pricing model
|
Constant prepayment rate
|
7.0% - 45.0%
(10.0
|
%)
|
||||
|
Probability of default
|
0.0% - 100.0%
(3.0
|
%)
|
||||||||
|
Discount rate
|
10.0% - 11.5%
(10.1
|
%)
|
||||||||
|
Impaired loans (collateral-dependent)
|
$
|
2,709
|
Market comparable properties
|
Marketability discount
|
1.9% - 89.8%
(38.5
|
%)
|
||||
|
Other real estate owned
|
$
|
18,951
|
Market comparable properties
|
Comparability adjustments
|
6.0% - 58.6%
(15.0
|
%)
|
||||
Sensitivity of Significant Unobservable Inputs
The following is a discussion of the sensitivity of significant unobservable inputs, the interrelationships
between those inputs and other unobservable inputs used in recurring fair value measurement and of how those inputs might magnify or mitigate the effect of changes in the unobservable inputs on the fair value measurement.
Equity Securities at Fair Value
Fair market value for equity securities is derived based on unobservable inputs, such as the discount rate,
quarterly dividends payable to the Visa Class B common stock and the prevailing conversion rate at the conversion date. The most recent conversion rate of 1.6298 and the most recent dividend rate of 0.4074 were used to derive the fair value
estimate. Significant increases (decreases) in either of those inputs in isolation would result in a significantly lower (higher) fair value measurement. Generally, a change in the assumption used for discount rate is accompanied by a directionally
opposite change in the fair value estimate.
Mortgage Servicing Rights
Fair market value for mortgage servicing rights is derived based on unobservable inputs, such as prepayment
speeds of the underlying loans generated using the Andrew Davidson Prepayment Model, FHLMC/FNMA guidelines, the weighted-average life of the loan, the discount rate, the weighted average coupon, and the weighted average default rate. Significant
increases (decreases) in either of those inputs in isolation would result in a significantly lower (higher) fair value measurement. Generally, a change in the assumption used for prepayment speeds is accompanied by a directionally opposite change in
the assumption for interest rates.
Fair Value of Financial Instruments
The following table presents estimated fair value of CTBI’s financial instruments as of December 31, 2018 and
indicates the level within the fair value hierarchy of the valuation techniques. In accordance with the prospective adoption of ASU 2016-01, the fair values as of December 31, 2018 were measured using an exit price notion.
|
(in thousands)
|
Fair Value Measurements
at December 31, 2018 Using
|
|||||||||||||||
|
Carrying Amount
|
Quoted Prices in Active Markets for Identical Assets
(Level 1)
|
Significant Other Observable Inputs (Level 2)
|
Significant Unobservable Inputs
(Level 3)
|
|||||||||||||
|
Financial assets:
|
||||||||||||||||
|
Cash and cash equivalents
|
$
|
141,450
|
$
|
141,450
|
$
|
0
|
$
|
0
|
||||||||
|
Certificates of deposit in other banks
|
3,920
|
0
|
3,914
|
0
|
||||||||||||
|
Securities available-for-sale
|
593,746
|
91,028
|
502,718
|
0
|
||||||||||||
|
Securities held-to-maturity
|
649
|
0
|
649
|
0
|
||||||||||||
|
Equity securities at fair value
|
1,173
|
0
|
0
|
1,173
|
||||||||||||
|
Loans held for sale
|
2,461
|
2,518
|
0
|
0
|
||||||||||||
|
Loans, net
|
3,172,730
|
0
|
0
|
3,175,908
|
||||||||||||
|
Federal Home Loan Bank stock
|
14,713
|
0
|
14,713
|
0
|
||||||||||||
|
Federal Reserve Bank stock
|
4,887
|
0
|
4,887
|
0
|
||||||||||||
|
Accrued interest receivable
|
14,432
|
0
|
14,432
|
0
|
||||||||||||
|
Mortgage servicing rights
|
3,607
|
0
|
0
|
3,607
|
||||||||||||
|
Financial liabilities:
|
||||||||||||||||
|
Deposits
|
$
|
3,305,950
|
$
|
803,316
|
$
|
2,513,084
|
$
|
0
|
||||||||
|
Repurchase agreements
|
232,712
|
0
|
0
|
232,796
|
||||||||||||
|
Federal funds purchased
|
1,180
|
0
|
1,180
|
0
|
||||||||||||
|
Advances from Federal Home Loan Bank
|
436
|
0
|
468
|
0
|
||||||||||||
|
Long-term debt
|
59,341
|
0
|
0
|
44,166
|
||||||||||||
|
Accrued interest payable
|
2,902
|
0
|
2,902
|
0
|
||||||||||||
|
Unrecognized financial instruments:
|
||||||||||||||||
|
Letters of credit
|
$
|
0
|
$
|
0
|
$
|
0
|
$
|
0
|
||||||||
|
Commitments to extend credit
|
0
|
0
|
0
|
0
|
||||||||||||
|
Forward sale commitments
|
0
|
0
|
0
|
0
|
||||||||||||
The following table presents estimated fair value of CTBI’s financial instruments as of December 31, 2017 and
indicates the level within the fair value hierarchy of the valuation techniques.
|
(in thousands)
|
Fair Value Measurements
at December 31, 2017 Using
|
|||||||||||||||
|
Carrying Amount
|
Quoted Prices in Active Markets for Identical Assets
(Level 1)
|
Significant Other Observable Inputs (Level 2)
|
Significant Unobservable Inputs
(Level 3)
|
|||||||||||||
|
Financial assets:
|
||||||||||||||||
|
Cash and cash equivalents
|
$
|
175,274
|
$
|
175,274
|
$
|
0
|
$
|
0
|
||||||||
|
Certificates of deposit in other banks
|
9,800
|
0
|
9,772
|
0
|
||||||||||||
|
Securities available-for-sale
|
585,761
|
88,956
|
496,805
|
0
|
||||||||||||
|
Securities held-to-maturity
|
659
|
0
|
660
|
0
|
||||||||||||
|
Loans held for sale
|
1,033
|
1,060
|
0
|
0
|
||||||||||||
|
Loans, net
|
3,086,789
|
0
|
0
|
3,092,437
|
||||||||||||
|
Federal Home Loan Bank stock
|
17,927
|
0
|
17,927
|
0
|
||||||||||||
|
Federal Reserve Bank stock
|
4,887
|
0
|
4,887
|
0
|
||||||||||||
|
Accrued interest receivable
|
13,338
|
0
|
13,338
|
0
|
||||||||||||
|
Mortgage servicing rights
|
3,484
|
0
|
0
|
3,484
|
||||||||||||
|
Financial liabilities:
|
||||||||||||||||
|
Deposits
|
$
|
3,263,863
|
$
|
790,930
|
$
|
2,319,278
|
$
|
0
|
||||||||
|
Repurchase agreements
|
243,814
|
0
|
0
|
243,932
|
||||||||||||
|
Federal funds purchased
|
7,312
|
0
|
7,312
|
0
|
||||||||||||
|
Advances from Federal Home Loan Bank
|
845
|
0
|
841
|
0
|
||||||||||||
|
Long-term debt
|
59,341
|
0
|
0
|
44,166
|
||||||||||||
|
Accrued interest payable
|
2,228
|
0
|
2,228
|
0
|
||||||||||||
|
Unrecognized financial instruments:
|
||||||||||||||||
|
Letters of credit
|
$
|
0
|
$
|
0
|
$
|
0
|
$
|
0
|
||||||||
|
Commitments to extend credit
|
0
|
0
|
0
|
0
|
||||||||||||
|
Forward sale commitments
|
0
|
0
|
0
|
0
|
||||||||||||
18. Off-Balance Sheet Transactions and Guarantees
CTBI is a party to transactions with off-balance sheet risk in the normal course of business to meet the
financing needs of its customers. These financial instruments include standby letters of credit and commitments to extend credit in the form of unused lines of credit. CTBI uses the same credit policies in making commitments and conditional
obligations as it does for on-balance sheet instruments.
At December 31, CTBI had the following off-balance sheet financial instruments, whose approximate contract
amounts represent additional credit risk to CTBI:
|
(in thousands)
|
2018
|
2017
|
||||||
|
Standby letters of credit
|
$
|
29,410
|
$
|
29,308
|
||||
|
Commitments to extend credit
|
510,513
|
516,731
|
||||||
|
Total off-balance sheet financial instruments
|
$
|
539,923
|
$
|
546,039
|
||||
Standby letters of credit represent conditional commitments to guarantee the performance of a third party.
The credit risk involved is essentially the same as the risk involved in making loans. At December 31, 2018, we maintained a credit loss reserve recorded in other liabilities of approximately $7 thousand relating to these financial standby letters
of credit. The reserve coverage calculation was determined using essentially the same methodology as used for the allowance for loan and lease losses. Approximately 65% of the total standby letters of credit are secured, with $16.0 million of the
total $29.4 million secured by cash. Collateral for the remaining secured standby letters of credit varies but is comprised primarily of accounts receivable, inventory, property, equipment, and income-producing properties.
Commitments to extend credit are agreements to originate loans to customers as long as there is no violation
of any condition of the contract. At December 31, 2018, a credit loss reserve recorded in other liabilities of $248 thousand was maintained relating to these commitments. Commitments generally have fixed expiration dates or other termination
clauses and may require payment of a fee. Since a portion of the commitments may expire without being drawn upon, the total commitment amounts do not necessarily represent future cash requirements. Each customer’s creditworthiness is evaluated on a
case-by-case basis. The amount of collateral obtained, if deemed necessary, is based on management’s credit evaluation of the counterparty. Collateral held varies, but may include accounts receivable, inventory, property, plant and equipment,
commercial real estate, and residential real estate. A portion of the commitments is to extend credit at fixed rates. Fixed rate loan commitments at December 31, 2018 of $31.7 million had interest rates ranging predominantly from 3.75% to 5.50%,
respectively, and terms predominantly one year or less. These credit commitments were based on prevailing rates, terms, and conditions applicable to other loans being made at December 31, 2018.
Included in our commitments to extend credit are mortgage loans in the process of origination which are
intended for sale to investors in the secondary market. These forward sale commitments are on an individual loan basis that CTBI originates as part of its mortgage banking activities. CTBI commits to sell the loans at specified prices in a future
period, typically within 60 days. These commitments are acquired to reduce market risk on mortgage loans in the process of origination and mortgage loans held for sale since CTBI is exposed to interest rate risk during the period between issuing a
loan commitment and the sale of the loan into the secondary market. Total mortgage loans in the process of origination amounted to $2.8 million and $2.5 million at December 31, 2018 and 2017, respectively, and mortgage loans held for sale amounted
to $2.5 million and $1.0 million for the years ended December 31, 2018 and 2017, respectively.
19. Concentrations of Credit Risk
CTBI’s banking activities include granting commercial, residential, and consumer loans to customers primarily
located in eastern, northeastern, central, and south central Kentucky, southern West Virginia, and northeastern Tennessee. CTBI is continuing to manage all components of its portfolio mix in a manner to reduce risk from changes in economic
conditions. Concentrations of credit, as defined for regulatory purposes, are reviewed quarterly by management to ensure that internally established limits based on Tier 1 Capital plus the allowance for loan and lease losses are not exceeded. At
December 31, 2018 and 2017, our concentrations of hotel/motel industry credits were 41% and 47% of Tier 1 Capital plus the allowance for loan and lease losses, respectively. Lessors of non-residential buildings credits were 39% and 45%,
respectively. Lessors of residential buildings and dwellings were 39% and 39%, respectively. These percentages are within our internally established limits regarding concentrations of credit.
20. Commitments and Contingencies
CTBI and our subsidiaries, and from time to time, our officers, are named defendants in legal actions arising
from ordinary business activities. Management, after consultation with legal counsel, believes any pending actions at December 31, 2018 are without merit or that the ultimate liability, if any, will not materially affect our consolidated financial
position or results of operations.
21. Regulatory Matters
CTBI’s principal source of funds is dividends received from our banking subsidiary, CTB. Regulations limit
the amount of dividends that may be paid by CTB without prior approval. During 2019, approximately $63.4 million plus any 2019 net profits can be paid by CTB without prior regulatory approval.
The Federal Reserve Bank adopted quantitative measures which assign risk weightings to assets and off-balance
sheet items and also define and set minimum regulatory capital requirements (risk based capital ratios). All banks are required to have a minimum Tier 1 (core capital) leverage ratio of 4% of adjusted quarterly average assets, common equity Tier 1
capital ratio of at least 4.5% of risk-weighted assets, Tier 1 capital of at least 6% of risk-weighted assets, and total capital of at least 8% of risk-weighted assets. Tier 1 capital consists principally of shareholders’ equity including
capital-qualifying subordinated debt but excluding unrealized gains and losses on securities available-for-sale, less goodwill and certain other intangibles. Total capital consists of Tier 1 capital plus certain debt instruments and the reserve for
credit losses, subject to limitation. Failure to meet certain capital requirements can initiate certain actions by regulators that, if undertaken, could have a direct material effect on our consolidated financial statements. The regulations also
define well-capitalized levels of Tier 1 leverage, common equity Tier 1 capital, Tier 1, and total capital as 5%, 6.5%, 8%, and 10%, respectively. We had Tier 1 leverage, common equity Tier 1 capital, Tier 1, and total capital ratios above the
well-capitalized levels at December 31, 2018 and 2017. We believe, as of December 31, 2018, CTBI meets all capital adequacy requirements for which it is subject to be defined as well-capitalized under the regulatory framework for prompt corrective
action.
Under the current
Federal Reserve Board’s regulatory framework, certain capital securities offered by wholly owned unconsolidated trust preferred entities of CTBI are included as Tier 1 regulatory capital. On March 1, 2005, the Federal Reserve Board adopted a final
rule that allows the continued limited inclusion of trust preferred securities in the Tier 1 capital of bank holding companies (“BHCs”). Under the final rule, trust preferred securities and other restricted core capital elements are subject to
stricter quantitative limits. The Board’s final rule limits restricted core capital elements to 25 percent of all core capital elements, net of goodwill less any associated deferred tax liability. Amounts of restricted core capital
elements in excess of these limits generally may be included in Tier 2 capital. The final rule provided a five-year transition period, which ended March 31, 2009, for application of the quantitative limits. The requirement for trust preferred
securities to include a call option has been eliminated, and standards for the junior subordinated debt underlying trust preferred securities eligible for Tier 1 capital treatment have been clarified. The final rule addressed supervisory concerns,
competitive equity considerations, and the accounting for trust preferred securities. The final rule also strengthened the definition of regulatory capital by incorporating longstanding Board policies regarding the acceptable terms of capital
instruments included in banking organizations’ Tier 1 or Tier 2 capital. The final rule did not have a material impact on our regulatory ratios.
Consolidated Capital Ratios
|
Actual
|
For Capital Adequacy Purposes
|
|||||||||||||||
|
(in thousands)
|
Amount
|
Ratio
|
Amount
|
Ratio
|
||||||||||||
|
As of December 31, 2018:
|
||||||||||||||||
|
Tier 1 capital (to average assets)
|
$
|
562,771
|
13.51
|
%
|
$
|
166,623
|
4.00
|
%
|
||||||||
|
Common equity Tier 1 capital (to risk weighted assets)
|
505,271
|
16.27
|
139,749
|
4.50
|
||||||||||||
|
Tier 1 capital (to risk weighted assets)
|
562,771
|
18.12
|
186,348
|
6.00
|
||||||||||||
|
Total capital (to risk weighted assets)
|
598,934
|
19.29
|
248,391
|
8.00
|
||||||||||||
|
As of December 31, 2017:
|
||||||||||||||||
|
Tier 1 capital (to average assets)
|
$
|
525,707
|
12.89
|
%
|
$
|
163,136
|
4.00
|
%
|
||||||||
|
Common equity Tier 1 capital (to risk weighted assets)
|
468,207
|
15.33
|
137,438
|
4.50
|
||||||||||||
|
Tier 1 capital (to risk weighted assets)
|
525,707
|
17.22
|
183,173
|
6.00
|
||||||||||||
|
Total capital (to risk weighted assets)
|
562,114
|
18.41
|
244,265
|
8.00
|
||||||||||||
Community Trust Bank, Inc.’s Capital Ratios
|
Actual
|
For Capital Adequacy Purposes
|
To Be Well-Capitalized Under Prompt Corrective Action Provision
|
||||||||||||||||||||||
|
(in thousands)
|
Amount
|
Ratio
|
Amount
|
Ratio
|
Amount
|
Ratio
|
||||||||||||||||||
|
As of December 31, 2018:
|
||||||||||||||||||||||||
|
Tier 1 capital (to average assets)
|
$
|
536,992
|
12.94
|
%
|
$
|
165,994
|
4.00
|
%
|
$
|
207,493
|
5.00
|
%
|
||||||||||||
|
Common equity Tier 1 capital (to risk weighted assets)
|
536,992
|
17.33
|
139,438
|
4.50
|
201,411
|
6.50
|
||||||||||||||||||
|
Tier 1 capital (to risk weighted assets)
|
536,992
|
17.33
|
185,918
|
6.00
|
247,890
|
8.00
|
||||||||||||||||||
|
Total capital (to risk weighted assets)
|
573,155
|
18.50
|
247,851
|
8.00
|
309,814
|
10.00
|
||||||||||||||||||
|
As of December 31, 2017:
|
||||||||||||||||||||||||
|
Tier 1 capital (to average assets)
|
$
|
501,537
|
12.35
|
%
|
$
|
162,441
|
4.00
|
%
|
$
|
203,051
|
5.00
|
%
|
||||||||||||
|
Common equity Tier 1 capital (to risk weighted assets)
|
501,537
|
16.46
|
137,115
|
4.50
|
198,055
|
6.50
|
||||||||||||||||||
|
Tier 1 capital (to risk weighted assets)
|
501,537
|
16.46
|
182,820
|
6.00
|
243,760
|
8.00
|
||||||||||||||||||
|
Total capital (to risk weighted assets)
|
537,944
|
17.65
|
243,827
|
8.00
|
304,784
|
10.00
|
||||||||||||||||||
On July 2, 2013, the Federal Reserve approved final rules that substantially amended the regulatory
risk-based capital rules applicable to CTBI and CTB. The FDIC subsequently approved these rules. The final rules implemented the “Basel III” regulatory capital reforms and changes required by the Dodd-Frank Act.
The rules included new risk-based capital and leverage ratios, which were phased in from 2015 to January
2019, and refined the definition of what constitutes “capital” for purposes of calculating those ratios. The minimum capital level requirements applicable to CTBI and CTB under the final rules are: (i) a common equity Tier 1 capital ratio of 4.5%;
(ii) a Tier 1 capital ratio of 6%; (iii) a total capital ratio of 8%; and (iv) a Tier 1 leverage ratio of 4% for all institutions. The final rules also established a “capital conservation buffer” above the new regulatory minimum capital
requirements, which must consist entirely of common equity Tier 1 capital. The capital conservation buffer began to be phased in on January 1, 2016 at 0.625% of risk-weighted assets increased by 0.625% annually until fully implemented in January
2019. An institution is subject to limitations on certain activities including payment of dividends, share repurchases, and discretionary bonuses to executive officers if its capital level is below the total capital plus capital conservation buffer
amount.
The final rules also contain revisions to the prompt corrective action framework, which is designed to place
restrictions on insured depository institutions, including CTB, if their capital levels begin to show signs of weakness. These revisions took effect January 1, 2015. Under the prompt corrective action requirements, which are designed to complement
the capital conservation buffer, insured depository institutions are required to meet the following capital level requirements in order to qualify as “well capitalized:” (i) a common equity Tier 1 capital ratio of 6.5%; (ii) a Tier 1 capital ratio of
8%; (iii) a total capital ratio of 10%; and (iv) a Tier 1 leverage ratio of 5%. We currently satisfy the well-capitalized and the capital conservation standards, and based on our current capital composition and levels, we anticipate that our capital
ratios, on a Basel III basis, will continue to exceed the well-capitalized minimum capital requirements and capital conservation buffer standards.
22. Parent Company Financial Statements
Condensed Balance Sheets
|
(in thousands)
December 31
|
2018
|
2017
|
||||||
|
Assets:
|
||||||||
|
Cash on deposit
|
$
|
1,939
|
$
|
1,500
|
||||
|
Investment in and advances to subsidiaries
|
620,701
|
587,575
|
||||||
|
Goodwill
|
4,973
|
4,973
|
||||||
|
Premises and equipment, net
|
219
|
250
|
||||||
|
Other assets
|
238
|
200
|
||||||
|
Total assets
|
$
|
628,070
|
$
|
594,498
|
||||
|
Liabilities and shareholders’ equity:
|
||||||||
|
Long-term debt
|
$
|
61,341
|
$
|
61,341
|
||||
|
Other liabilities
|
2,579
|
2,458
|
||||||
|
Total liabilities
|
63,920
|
63,799
|
||||||
|
Shareholders’ equity
|
564,150
|
530,699
|
||||||
|
Total liabilities and shareholders’ equity
|
$
|
628,070
|
$
|
594,498
|
||||
Condensed Statements of Income and Comprehensive Income
|
(in thousands)
Year Ended December 31
|
2018
|
2017
|
2016
|
|||||||||
|
Income:
|
||||||||||||
|
Dividends from subsidiary banks
|
$
|
26,750
|
$
|
24,661
|
$
|
20,708
|
||||||
|
Other income
|
489
|
904
|
459
|
|||||||||
|
Total income
|
27,239
|
25,565
|
21,167
|
|||||||||
|
Expenses:
|
||||||||||||
|
Interest expense
|
2,318
|
1,723
|
1,417
|
|||||||||
|
Depreciation expense
|
135
|
116
|
107
|
|||||||||
|
Other expenses
|
3,156
|
2,858
|
2,256
|
|||||||||
|
Total expenses
|
5,609
|
4,697
|
3,780
|
|||||||||
|
Income before income taxes and equity in undistributed income of subsidiaries
|
21,630
|
20,868
|
17,387
|
|||||||||
|
Income tax benefit
|
(1,219
|
)
|
(1,445
|
)
|
(1,373
|
)
|
||||||
|
Income before equity in undistributed income of subsidiaries
|
22,849
|
22,313
|
18,760
|
|||||||||
|
Equity in undistributed income of subsidiaries
|
36,379
|
29,180
|
28,586
|
|||||||||
|
Net income
|
$
|
59,228
|
$
|
51,493
|
$
|
47,346
|
||||||
|
Other comprehensive loss:
|
||||||||||||
|
Unrealized holding losses on securities available-for-sale:
|
||||||||||||
|
Unrealized holding losses arising during the period
|
(5,393
|
)
|
(820
|
)
|
(4,578
|
)
|
||||||
|
Less: Reclassification adjustments for realized gains included in net income
|
(821
|
)
|
73
|
522
|
||||||||
|
Tax benefit
|
(960
|
)
|
(312
|
)
|
(1,785
|
)
|
||||||
|
Other comprehensive loss, net of tax
|
(3,612
|
)
|
(581
|
)
|
(3,315
|
)
|
||||||
|
Comprehensive income
|
$
|
55,616
|
$
|
50,912
|
$
|
44,031
|
||||||
Condensed Statements of Cash Flows
|
(in thousands)
Year Ended December 31
|
2018
|
2017
|
2016
|
|||||||||
|
Cash flows from operating activities:
|
||||||||||||
|
Net income
|
$
|
59,228
|
$
|
51,493
|
$
|
47,346
|
||||||
|
Adjustments to reconcile net income to net cash provided by operating activities:
|
||||||||||||
|
Depreciation
|
135
|
116
|
107
|
|||||||||
|
Equity in undistributed earnings of subsidiaries
|
(36,379
|
)
|
(29,180
|
)
|
(28,586
|
)
|
||||||
|
Stock-based compensation
|
710
|
636
|
458
|
|||||||||
|
Excess tax benefits of stock-based compensation
|
0
|
0
|
100
|
|||||||||
|
Gain on debt repurchase
|
0
|
(560
|
)
|
0
|
||||||||
|
Changes in:
|
||||||||||||
|
Other assets
|
(62
|
)
|
145
|
519
|
||||||||
|
Other liabilities
|
53
|
412
|
(90
|
)
|
||||||||
|
Net cash provided by operating activities
|
23,685
|
23,062
|
19,854
|
|||||||||
|
Cash flows from investing activities:
|
||||||||||||
|
Payment for investment in subsidiary
|
0
|
(1,440
|
)
|
0
|
||||||||
|
Purchase of premises and equipment
|
(81
|
)
|
(179
|
)
|
(104
|
)
|
||||||
|
Net cash used in investing activities
|
(81
|
)
|
(1,619
|
)
|
(104
|
)
|
||||||
|
Cash flows from financing activities:
|
||||||||||||
|
Issuance of common stock
|
1,230
|
1,513
|
2,985
|
|||||||||
|
Repurchase of common stock
|
0
|
0
|
(382
|
)
|
||||||||
|
Excess tax benefits of stock-based compensation
|
0
|
0
|
(100
|
)
|
||||||||
|
Dividends paid
|
(24,395
|
)
|
(22,981
|
)
|
(22,190
|
)
|
||||||
|
Net cash used in financing activities
|
(23,165
|
)
|
(21,468
|
)
|
(19,687
|
)
|
||||||
|
Net increase (decrease) in cash and cash equivalents
|
439
|
(25
|
)
|
63
|
||||||||
|
Cash and cash equivalents at beginning of year
|
1,500
|
1,525
|
1,462
|
|||||||||
|
Cash and cash equivalents at end of year
|
$
|
1,939
|
$
|
1,500
|
$
|
1,525
|
||||||
23. Earnings Per Share
The following table sets forth the computation of basic and diluted earnings per share:
|
Year Ended December 31
(in thousands except per share data)
|
2018
|
2017
|
2016
|
|||||||||
|
Numerator:
|
||||||||||||
|
Net income
|
$
|
59,228
|
$
|
51,493
|
$
|
47,346
|
||||||
|
Denominator:
|
||||||||||||
|
Basic earnings per share:
|
||||||||||||
|
Weighted average shares
|
17,687
|
17,631
|
17,548
|
|||||||||
|
Diluted earnings per share:
|
||||||||||||
|
Dilutive effect of equity grants
|
16
|
22
|
18
|
|||||||||
|
Adjusted weighted average shares
|
17,703
|
17,653
|
17,566
|
|||||||||
|
Earnings per share:
|
||||||||||||
|
Basic earnings per share
|
$
|
3.35
|
$
|
2.92
|
$
|
2.70
|
||||||
|
Diluted earnings per share
|
3.35
|
2.92
|
2.70
|
|||||||||
There were no options to purchase common shares that were excluded from the diluted calculations above for
the years ended December 31, 2018, 2017, and 2016. In addition to in-the-money stock options, unvested restricted stock grants were also used in the calculation of diluted earnings per share based on the treasury method.
24. Accumulated Other Comprehensive Income
Unrealized gains (losses) on AFS securities
Amounts reclassified from accumulated other comprehensive income (AOCI) and the affected line items in the
statements of income during the years ended December 31, 2018, 2017, and 2016 were:
|
Amounts Reclassified from AOCI
|
||||||||||||
|
Year Ended December 31
(in thousands)
|
2018
|
2017
|
2016
|
|||||||||
|
Affected line item in the statements of income
|
||||||||||||
|
Securities gains (losses)
|
$
|
(821
|
)
|
$
|
73
|
$
|
522
|
|||||
|
Tax expense (benefit)
|
(172
|
)
|
26
|
183
|
||||||||
|
Total reclassifications out of AOCI
|
$
|
(649
|
)
|
$
|
47
|
$
|
339
|
|||||
To the Shareholders, Board of Directors, and Audit Committee
Community Trust Bancorp, Inc.
Pikeville, Kentucky
Opinion on the Financial Statements
We have audited the accompanying consolidated balance sheets of Community Trust Bancorp, Inc. as of
December 31, 2018 and 2017, the related consolidated statements of income and comprehensive income, shareholders’ equity and cash flows for each of the years in the three-year period ended December 31, 2018, and the related notes (collectively
referred to as the financial statements). In our opinion, the consolidated financial statements referred to above present fairly, in all material respects, the financial position of Community Trust Bancorp, Inc. as of December 31, 2018 and 2017,
and the results of its operations and its cash flows for each of the years in the three-year period ended December 31, 2018, in conformity with accounting principles generally accepted in the United States of America.
We also have audited, in accordance with the standards of the Public Company Accounting Oversight Board
(United States), Community Trust Bancorp, Inc.’s internal control over financial reporting as of December 31, 2018, based on criteria established in Internal
Control Integrated Framework (2013) issued by the Committee of Sponsoring Organizations of the Treadway Commission (COSO) and our report dated February 28, 2019, expressed an unqualified opinion on the effectiveness of Community Trust
Bancorp, Inc.’s internal control over financial reporting.
Basis for Opinion
These financial statements are the responsibility of Community Trust Bancorp, Inc.’s management. Our
responsibility is to express an opinion on Community Trust Bancorp, Inc.’s financial statements based on our audits.
We are a public accounting firm registered with the Public Company Accounting Oversight Board (United
States) and are required to be independent with respect to Community Trust Bancorp, Inc. in accordance with the U.S. federal securities laws and the applicable rules and regulations of the U.S. Securities and Exchange Commission and the Public
Company Accounting Oversight Board (United States).
We conducted our audits in accordance with the standards of the Public Company Accounting Oversight Board
(United States). Those standards require that we plan and perform the audits to obtain reasonable assurance about whether the financial statements are free of material misstatement, whether due to error or fraud. Our audits included performing
procedures to assess the risks of material misstatement of the financial statements, whether due to error or fraud, and performing procedures that respond to those risks. Such procedures include examining, on a test basis, evidence regarding the
amounts and disclosures in the financial statements. Our audits also included evaluating the accounting principles used and significant estimates made by management, as well as evaluating the overall presentation of the financial statements. We
believe that our audits provide a reasonable basis for our opinion.
/s/ BKD, LLP
Louisville, Kentucky
February 28, 2019
REPORT OF INDEPENDENT REGISTERED PUBLIC ACCOUNTING FIRM
To the Shareholders, Board of Directors, and Audit Committee
Community Trust Bancorp, Inc.
Pikeville, Kentucky
Opinion on the Internal Control over Financial Reporting
We have audited Community Trust Bancorp, Inc.’s internal control over financial reporting as of December
31, 2018, based on criteria established in Internal Control – Integrated Framework (2013) issued by the Committee of Sponsoring Organizations of the Treadway Commission (COSO).
In our opinion, Community Trust Bancorp, Inc. maintained, in all material respects, effective internal
control over financial reporting as of December 31, 2018, based on criteria established in Internal Control – Integrated Framework (2013) issued by
COSO.
We also have audited, in accordance with the standards of the Public Company Accounting Oversight Board
(United States), the consolidated financial statements of Community Trust Bancorp, Inc. and our report dated February 28, 2019, expressed an unqualified opinion thereon.
Basis for Opinion
Community Trust Bancorp, Inc.’s management is responsible for maintaining effective internal control over
financial reporting and for its assessment of the effectiveness of internal control over financial reporting, included in the accompanying management report on internal control. Our responsibility is to express an opinion on Community Trust
Bancorp, Inc.’s internal control over financial reporting based on our audit.
We are a public accounting firm registered with the Public Company Accounting Oversight Board (United
States) and are required to be independent with respect to Community Trust Bancorp, Inc. in accordance with the U.S. federal securities laws and the applicable rules and regulations of the U.S. Securities and Exchange Commission and the Public
Company Accounting Oversight Board (United States).
We conducted our audit in accordance with the standards of the Public Company Accounting Oversight Board
(United States). Those standards require that we plan and perform the audit to obtain reasonable assurance about whether effective internal control over financial reporting was maintained in all material respects.
Our audit included obtaining an understanding of internal control over financial reporting, assessing the
risk that a material weakness exists and testing and evaluating the design and operating effectiveness of internal control based on the assessed risk. Our audit also included performing such other procedures as we considered necessary in the
circumstances. We believe that our audit provides a reasonable basis for our opinion.
Definitions and Limitations of Internal Control over Financial Reporting
A company’s internal control over financial reporting is a process designed to provide reasonable assurance
regarding the reliability of financial reporting and the preparation of financial statements for external purposes in accordance with generally accepted accounting principles. A company’s internal control over financial reporting includes those
policies and procedures that (1) pertain to the maintenance of records that, in reasonable detail, accurately and fairly reflect the transactions and dispositions of the assets of the company; (2) provide reasonable assurance that transactions are
recorded as necessary to permit preparation of financial statements in accordance with generally accepted accounting principles, and that receipts and expenditures of the company are being made only in accordance with authorizations of management
and directors of the company; and (3) provide reasonable assurance regarding prevention or timely detection of unauthorized acquisition, use or disposition of the company’s assets that could have a material effect on the financial statements.
Because of its inherent limitations, internal control over financial reporting may not prevent or detect
misstatements. Also, projections of any evaluation of effectiveness to future periods are subject to the risk that controls may become inadequate because of changes in conditions or that the degree of compliance with the policies or procedures may
deteriorate.
/s/ BKD, LLP
Louisville, Kentucky
February 28, 2019
None.
EVALUATION OF DISCLOSURE CONTROLS AND PROCEDURES
CTBI’s management is responsible for establishing and maintaining effective disclosure controls and
procedures, as defined under Rules 13a-15(e) and 15d-15(e) of the Securities Exchange Act of 1934. As of December 31, 2018, an evaluation was carried out by CTBI’s management, with the participation of our Chief Executive Officer and our Chief
Financial Officer of the effectiveness of the design and operation of our disclosure controls and procedures. Based on this evaluation, management concluded that disclosure controls and procedures as of December 31, 2018 were effective in ensuring
material information required to be disclosed in this annual report on Form 10-K was recorded, processed, summarized, and reported on a timely basis.
CHANGES IN INTERNAL CONTROL OVER FINANCIAL REPORTING
Management has evaluated the effectiveness of its internal control over financial reporting as of December
31, 2018 based on the control criteria in the 2013 COSO Framework issued by the Committee of Sponsoring Organizations (“COSO”) of the Treadway Commission. Based on such evaluation, we have concluded that CTBI’s internal control over financial
reporting is effective as of December 31, 2018.
There were no changes in CTBI’s internal control over financial reporting that occurred during the year ended
December 31, 2018 that have materially affected, or are reasonably likely to materially affect, CTBI’s internal control over financial reporting.
MANAGEMENT REPORT ON INTERNAL CONTROL
We, as management of Community Trust Bancorp, Inc. and its subsidiaries (“CTBI”), are responsible for
establishing and maintaining adequate internal control over financial reporting. Pursuant to the rules and regulations of the Securities and Exchange Commission, internal control over financial reporting is a process designed by, or under the
supervision of, the company’s principal executive and principal financial officers, or persons performing similar functions, and effected by the company’s board of directors, management and other personnel, to provide reasonable assurance regarding
the reliability of financial reporting and the preparation of financial statements for external purposes in accordance with generally accepted accounting principles and includes those policies and procedures that:
|
·
|
Pertain to the maintenance of records that in reasonable detail accurately and fairly reflect the transactions and
dispositions of the assets of the company;
|
|
·
|
Provide reasonable assurance that transactions are recorded as necessary to permit preparation of financial statements
in accordance with generally accepted accounting principles, and that receipts and expenditures of the company are being made only in accordance with authorizations of management and directors of the company; and
|
|
·
|
Provide reasonable assurance regarding prevention or timely detection of unauthorized acquisition, use or disposition
of the company’s assets that could have a material effect on the financial statements.
|
All internal control systems, no matter how well designed, have inherent limitations, including the
possibility of human error and the circumvention of overriding controls. Accordingly, even effective internal control can provide only reasonable assurance with respect to financial statement preparation. Further, because of changes in conditions,
the effectiveness of internal control may vary over time.
Because of the inherent limitations, any system of internal control over financial reporting, no matter how
well designed, may not prevent or detect misstatements due to the possibility that a control can be circumvented or overridden or that misstatements due to error or fraud may occur that are not detected. Also, projections of the effectiveness to
future periods are subject to the risk that the internal controls may become inadequate because of changes in conditions, or that the degree of compliance with the policies and procedures included in such controls may deteriorate.
Management has evaluated the effectiveness of its internal control over financial reporting as of December
31, 2018 based on the control criteria in the 2013 COSO Framework issued by the Committee of Sponsoring Organizations of the Treadway Commission. Based on such evaluation, we have concluded that CTBI’s internal control over financial reporting is
effective as of December 31, 2018.
The effectiveness of CTBI’s internal control over financial reporting as of December 31, 2018 has been
audited by BKD, LLP, an independent registered public accounting firm that audited the CTBI’s consolidated financial statements included in this annual report.
February 28, 2019 /s/ Jean R. Hale
Jean R. Hale
Chairman, President, and
Chief Executive Officer
/s/ Kevin J. Stumbo
Kevin J. Stumbo
Executive Vice President, Chief Financial Officer,
and Treasurer
None.
The information required by this item other than the information set forth below is omitted because CTBI is
filing a definitive proxy statement pursuant to Regulation 14A not later than 120 days after the end of the fiscal year covered by this report which includes the required information. The required information contained in CTBI’s proxy statement is
incorporated herein by reference.
Executive Officers of the Registrant
Set forth below are the executive officers of CTBI, their positions with CTBI, and the year in which they
first became an executive officer or director.
|
Name and Age (1)
|
Positions and Offices Currently Held
|
Date First Became
Director or
Executive Officer
|
Principal Occupation
|
|
|
Jean R. Hale; 72
|
Chairman, President and CEO
|
1992
|
Chairman, President and CEO of Community Trust Bancorp, Inc.
|
|
|
Mark A. Gooch; 60
|
Executive Vice President and Secretary
|
1997
|
President and CEO of Community Trust Bank, Inc.
|
|
|
Larry W. Jones; 72
|
Executive Vice President
|
2002
|
Executive Vice President/ Central Kentucky Region President of Community Trust Bank, Inc.
|
|
|
James B. Draughn; 59
|
Executive Vice President
|
2001
|
Executive Vice President/Operations of Community Trust Bank, Inc.
|
|
|
Kevin J. Stumbo; 58
|
Executive Vice President, Chief Financial Officer, and Treasurer
|
2002
|
Executive Vice President/ Chief Financial Officer of Community Trust Bank, Inc.
|
|
|
Ricky D. Sparkman; 56
|
Executive Vice President
|
2002
|
Executive Vice President/ South Central Region President of Community Trust Bank, Inc.
|
|
|
Richard W. Newsom; 64
|
Executive Vice President
|
2002
|
Executive Vice President/ Eastern Region President of Community Trust Bank, Inc.
|
|
|
James J. Gartner; 77
|
Executive Vice President
|
2002
|
Executive Vice President/ Chief Credit Officer of Community Trust Bank, Inc.
|
|
|
Steven E. Jameson; 62
|
Executive Vice President
|
2004
|
(2)
|
Executive Vice President/ Chief Internal Audit & Risk Officer
|
|
D. Andrew Jones; 56
|
Executive Vice President
|
2010
|
Executive Vice President/ Northeastern Region President of Community Trust Bank, Inc.
|
|
|
Andy D. Waters; 53
|
Executive Vice President
|
2011
|
President and CEO of Community Trust and Investment Company
|
|
|
C. Wayne Hancock; 44
|
Executive Vice President
|
2014
|
(3)
|
Executive Vice President/Senior Staff Attorney
|
| (1) |
The ages listed for CTBI’s executive officers are as of February 28, 2019.
|
| (2) |
Mr. Jameson is a non-voting member of the Executive Committee.
|
| (3) |
Mr. Hancock was employed as Senior Staff Attorney of Community Trust Bank, Inc. in September 2008. He was promoted to Senior Vice President in April 2009 and named
Executive Vice President in April 2014.
|
The information required by this item is omitted because CTBI is filing a definitive proxy statement pursuant
to Regulation 14A not later than 120 days after the end of the fiscal year covered by this report which includes the required information. The required information contained in CTBI’s proxy statement is incorporated herein by reference.
Item 12. Security Ownership of Certain Beneficial Owners and Management and Related Shareholder Matters
The information required by this item other than the information provided below is omitted because CTBI is
filing a definitive proxy statement pursuant to Regulation 14A not later than 120 days after the end of the fiscal year covered by this report which includes the required information. The required information contained in CTBI’s proxy statement is
incorporated herein by reference.
Equity Compensation Plan Information
The following table provides information as of December 31, 2018, with respect to compensation plans under
which common shares of CTBI are authorized for issuance to officers or employees in exchange for consideration in the form of services provided to CTBI and/or its subsidiaries. At December 31, 2018, we maintained one active and two inactive
incentive stock option plans covering key employees. The 2015 Stock Ownership Incentive Plan (“2015 Plan”) was approved by the Board of Directors and the
Shareholders in 2015. The 2006 Stock Ownership Incentive Plan (“2006 Plan”) was approved by the Board of Directors and the Shareholders in 2006. The 2006 Plan was rendered inactive as of April 28, 2015. The 1998 Stock Option Plan (“1998 Plan”)
was approved by the Board of Directors and the Shareholders in 1998. The 1998 Plan was rendered inactive as of April 26, 2006. The 2015 Plan has 550,000 shares authorized, 509,335 of which were available at December 31, 2018. Shares issuable
pursuant to awards which were granted under the prior plans on or before their respective expiration or termination dates will be issued from the remaining shares reserved for issuance under the prior plans. The shares of common stock reserved for
issuance under the prior plans in excess of the number of shares as to which options or other benefits are awarded thereunder, and any shares as to which options or other benefits granted under the prior plans may lapse, expire, terminate or be
canceled, will not be reserved and available for issuance or reissuance under the 2015 Plan.
| A |
B |
C |
||||||||||
|
Plan Category
(shares in thousands)
|
Number of Common Shares to be Issued Upon Exercise
|
Weighted Average Price
|
Number of Securities Available for Future Issuance Under Equity Compensation Plans (excluding
securities reflected in Column A)
|
|||||||||
|
Equity compensation plans approved by shareholders:
|
||||||||||||
|
Stock options
|
33
|
$
|
32.47
|
509
|
||||||||
|
Equity compensation plans not approved by shareholders
|
0
|
--
|
0
|
|||||||||
|
Total
|
509
|
|||||||||||
Additional information regarding CTBI’s stock option plans can be found in notes 1 and 15 to the consolidated
financial statements.
The information required by this item is omitted because CTBI is filing a definitive proxy statement pursuant
to Regulation 14A not later than 120 days after the end of the fiscal year covered by this report which includes the required information. The required information contained in CTBI’s proxy statement is incorporated herein by reference.
(a) 1. Financial Statements
The following financial statements of CTBI and the auditor’s report thereon are filed as
part of this Form 10-K under Item 8. Financial Statements and Supplementary Data:
Consolidated Balance Sheets
Consolidated Statements of Income and Other Comprehensive Income
Consolidated Statements of Shareholders’ Equity
Consolidated Statements of Cash Flows
Notes to Consolidated Financial Statements
Reports of Independent Registered Public Accounting Firm
2. Financial Statement Schedules
All required financial statement schedules for CTBI have been included in this Form 10-K
in the consolidated financial statements or the related footnotes.
3. Exhibits
|
Exhibit No.
|
Description of Exhibits
|
|
3.1
|
Articles of Incorporation and all amendments thereto {incorporated by reference to registration statement no. 33-35138}
|
|
By-laws of CTBI as amended July 25, 1995 {incorporated by reference to registration statement no. 33-61891}
|
|
|
By-laws of CTBI as amended January 29, 2008 {incorporated by reference to current report on Form 8-K filed January 30,
2008}
|
|
|
Community Trust Bancorp, Inc. Employee Stock Ownership Plan (effective January 1, 2007) {incorporated herein by
reference to Form 10-K for the fiscal year ended December 31, 2006 under SEC file no. 000-111-29}
|
|
|
Community Trust Bancorp, Inc. Savings and Employee Stock Ownership Plan (Amendment Number One effective January 1, 2002,
Amendment Number Two effective January 1, 2004, Amendment Number Three effective March 28, 2005, and Amendment Number Four effective January 1, 2006) {incorporated herein by reference to Form 10-K for the fiscal year ended December 31, 2006
under SEC file no. 000-111-29}
|
|
|
Community Trust Bancorp, Inc. 1998 Stock Option Plan {incorporated by reference to registration statement no. 333-74217}
|
|
|
Community Trust Bancorp, Inc. 2006 Stock Ownership Incentive Plan {incorporated by reference to Proxy Statement dated
March 24, 2006}
|
|
|
Form of Severance Agreement between Community Trust Bancorp, Inc. and executive officers (currently in effect with
respect to twelve executive officers) {incorporated herein by reference to Form 10-K for the fiscal year ended December 31, 2001 under SEC file no. 000-111-29}
|
|
|
Senior Management Incentive Compensation Plan (2019) {incorporated herein by reference to current report on Form 8-K
dated January 29, 2019}
|
|
|
Restricted Stock Agreement {incorporated herein by reference to Form 10-K for the fiscal year ended December 31, 2011
under SEC file no. 000-111-29}
|
|
|
Employee Incentive Compensation Plan (2019) {incorporated herein by reference to current report on Form 8-K dated
January 29, 2019}
|
|
|
Amendment to the Community Trust Bancorp, Inc. 2006 Stock Ownership Incentive Plan {incorporated herein by reference to
current report on Form 8-K dated January 24, 2012}
|
|
|
Community Trust Bancorp, Inc. 2015 Stock Ownership Incentive Plan {incorporated herein by reference to registration
statement no. 333-208053}
|
|
|
Community Trust Bancorp, Inc. 2016 Executive Committee Long-Term Incentive Compensation Plan {incorporated herein by
reference to current report on Form 8-K dated January 26, 2016}
|
|
|
Community Trust Bancorp, Inc. 2017 Executive Committee Long-Term Incentive Compensation Plan {incorporated herein by
reference to current report on Form 8-K dated January 24, 2017}
|
|
|
Community Trust Bancorp, Inc. 2018 Executive Committee Long-Term Incentive Compensation Plan {incorporated herein by
reference to current report on Form 8-K dated January 23, 2018}
|
|
|
Community Trust Bancorp, Inc. 2019 Executive Committee Long-Term Incentive Compensation Plan {incorporated herein by
reference to current report on Form 8-K dated January 29, 2019}
|
|
| 21 | Subsidiaries of the Registrant |
|
Consent of BKD, LLP, Independent Registered Public Accounting Firm
|
|
|
Certification of Principal Executive Officer (Jean R. Hale, Chairman, President, and Chief Executive Officer)
|
|
|
Certification of Principal Financial Officer (Kevin J. Stumbo, Executive Vice President, Chief Financial Officer, and
Treasurer)
|
|
|
Certification of Jean R. Hale, Chairman, President and CEO, pursuant to 18 U.S.C. Section 1350, as adopted pursuant to
Section 906 of the Sarbanes-Oxley Act of 2002
|
|
|
Certification of Kevin J. Stumbo, Executive Vice President, Chief Financial Officer, and Treasurer, pursuant to 18
U.S.C. Section 1350, as adopted pursuant to Section 906 of the Sarbanes-Oxley Act of 2002
|
|
|
Community Trust Bancorp, Inc. Dividend Reinvestment Plan, as amended December 20, 2013 {incorporated by reference to
registration statement no. 333-193011}
|
|
|
101.INS
|
XBRL Instance Document
|
|
101.SCH
|
XBRL Taxonomy Extension Schema
|
|
101.CAL
|
XBRL Taxonomy Extension Calculation Linkbase
|
|
101.DEF
|
XBRL Taxonomy Extension Definition Linkbase
|
|
101.LAB
|
XBRL Taxonomy Extension Label Linkbase
|
|
101.PRE
|
XBRL Taxonomy Extension Presentation Linkbase
|
(b) Exhibits
The response to this portion of Item 15 is submitted in (a) 3. above.
(c) Financial Statement Schedules
None
None
COMMUNITY TRUST BANCORP, INC. AND SUBSIDIARIES
|
Exhibit No.
|
Description of Exhibits
|
|
3.1
|
Articles of Incorporation for CTBI {incorporated herein by reference}
|
|
3.2
|
By-laws of CTBI as amended July 25, 1995 {incorporated herein by reference}
|
|
3.3
|
By-laws of CTBI as amended January 29, 2008 {incorporated herein by reference}
|
|
10.1
|
Community Trust Bancorp, Inc. Employee Stock Ownership Plan (effective January 1, 2007) {incorporated herein by
reference}
|
|
10.2
|
Community Trust Bancorp, Inc. Savings and Employee Stock Ownership Plan (Amendment Number One effective January 1, 2002,
Amendment Number Two effective January 1, 2004, Amendment Number Three effective March 28, 2005, and Amendment Number Four effective January 1, 2006) {incorporated herein by reference}
|
|
10.4
|
Community Trust Bancorp, Inc. 1998 Stock Option Plan {incorporated herein by reference}
|
|
10.5
|
Community Trust Bancorp, Inc. 2006 Stock Ownership Incentive Plan {incorporated herein by reference}
|
|
10.6
|
Form of Severance Agreement between Community Trust Bancorp, Inc. and executive officers (currently in effect with
respect to twelve executive officers) {incorporated herein by reference}
|
|
10.7
|
Senior Management Incentive Compensation Plan (2019) {incorporated herein by reference}
|
|
10.8
|
Restricted Stock Agreement{incorporated herein by reference}
|
|
10.9
|
Employee Incentive Compensation Plan (2019) {incorporated herein by reference}
|
|
10.10
|
Amendment to the Community Trust Bancorp, Inc. 2006 Stock Ownership Incentive Plan {incorporated herein by reference}
|
|
10.11
|
Community Trust Bancorp, Inc. 2015 Stock Ownership Incentive Plan {incorporated herein by reference}
|
|
10.16
|
Community Trust Bancorp, Inc. 2016 Executive Committee Long-Term Incentive Compensation Plan {incorporated herein by
reference}
|
|
10.17
|
Community Trust Bancorp, Inc. 2017 Executive Committee Long-Term Incentive Compensation Plan {incorporated herein by
reference}
|
|
10.18
|
Community Trust Bancorp, Inc. 2018 Executive Committee Long-Term Incentive Compensation Plan {incorporated herein by
reference}
|
|
10.19
|
Community Trust Bancorp, Inc. 2019 Executive Committee Long-Term Incentive Compensation Plan {incorporated herein by
reference}
|
| 21 | Subsidiaries of the Registrant |
|
23.1
|
Consent of BKD, LLP, Independent Registered Public Accounting Firm
|
|
31.1
|
Certification of Principal Executive Officer (Jean R. Hale, Chairman, President and CEO)
|
|
31.2
|
Certification of Principal Financial Officer (Kevin J. Stumbo, Executive Vice President, Chief Financial Officer, and
Treasurer)
|
|
32.1
|
Certification of Jean R. Hale, Chairman, President and CEO, pursuant to 18 U.S.C. Section 1350, as adopted pursuant to
Section 906 of the Sarbanes-Oxley Act of 2002
|
|
32.2
|
Certification of Kevin J. Stumbo, Executive Vice President, Chief Financial Officer, and Treasurer, pursuant to 18
U.S.C. Section 1350, as adopted pursuant to Section 906 of the Sarbanes-Oxley Act of 2002
|
|
99.1
|
Community Trust Bancorp, Inc. Dividend Reinvestment Plan, as amended December 20, 2013
|
|
101.INS
|
XBRL Instance Document
|
|
101.SCH
|
XBRL Taxonomy Extension Schema
|
|
101.CAL
|
XBRL Taxonomy Extension Calculation Linkbase
|
|
101.DEF
|
XBRL Taxonomy Extension Definition Linkbase
|
|
101.LAB
|
XBRL Taxonomy Extension Label Linkbase
|
|
101.PRE
|
XBRL Taxonomy Extension Presentation Linkbase
|
Pursuant to the requirements of Section 13 or 15 (d) of the Securities Exchange Act of
1934, the Registrant has duly caused this report to be signed on its behalf the undersigned, thereunto duly authorized.
| COMMUNITY TRUST BANCORP, INC. |
|||
|
Date: February 28, 2019
|
By:
|
/s/ Jean R. Hale |
|
| Jean R. Hale |
|||
| Chairman, President, and Chief Executive Officer |
|||
|
|
/s/ Kevin J. Stumbo |
||
| Kevin J. Stumbo |
|||
| Executive Vice President, Chief Financial Officer, and Treasurer |
Pursuant to the requirements of the Securities Exchange Act of 1934, this report has been signed below by the
following persons on behalf of the Registrant and in the capacities and on the date indicated.
|
February 28, 2019
|
/s/ Jean R. Hale
|
Chairman, President, and Chief Executive Officer
|
|
Jean R. Hale
|
||
|
February 28, 2019
|
/s/ Kevin J. Stumbo
|
Executive Vice President, Chief Financial Officer, and Treasurer
|
|
Kevin J. Stumbo
|
||
|
February 28, 2019
|
/s/ Charles J. Baird
|
Director
|
|
Charles J. Baird
|
||
|
February 28, 2019
|
/s/ Nick Carter
|
Director
|
|
Nick Carter
|
||
|
February 28, 2019
|
/s/ James E. McGhee, II
|
Director
|
|
James E. McGhee II
|
||
|
February 28, 2019
|
/s/ M. Lynn Parrish
|
Director
|
|
M. Lynn Parrish
|
||
|
February 28, 2019
|
/s/ James R. Ramsey
|
Director
|
|
James R. Ramsey
|
||
|
February 28, 2019
|
/s/ Anthony W. St. Charles
|
Director
|
|
Anthony W. St. Charles
|