UNITED STATES SECURITIES AND EXCHANGE COMMISSION
Washington, D.C. 20549
Form 10-K
þ | ANNUAL REPORT PURSUANT TO SECTION 13 OR 15(d) OF THE SECURITIES EXCHANGE ACT OF 1934 | |
For the fiscal year ended April 28, 2017 | ||
OR | ||
¨ | TRANSITION REPORT PURSUANT TO SECTION 13 OR 15(d) OF THE SECURITIES EXCHANGE ACT OF 1934 | |
For the transition period from to | ||
Commission file number: 0-1667
Bob Evans Farms, Inc.
(Exact name of registrant as specified in its charter)
Delaware | 31-4421866 | |
(State or other jurisdiction of incorporation or organization) | (I.R.S. Employer Identification No.) | |
8111 Smith's Mill Road, New Albany, Ohio | 43054 | |
(Address of principal executive offices) | (Zip Code) | |
(614) 491-2225
(Registrant’s telephone number, including area code)
Securities registered pursuant to Section 12(b) of the Exchange Act
Title of Each Class | Name of Each Exchange on Which Registered | |
Common Stock, $.01 par value per share | The NASDAQ Global Select Market | |
Securities registered pursuant to Section 12(g) of the Exchange Act:
None
Indicate by check mark if the registrant is a well-known seasoned issuer, as defined in Rule 405 of the Securities Act. Yes þ No ¨
Indicate by check mark if the registrant is not required to file reports pursuant to Section 13 or Section 15(d) of the Exchange Act. Yes ¨ No þ
Indicate by check mark whether the registrant (1) has filed all reports required to be filed by Section 13 or 15(d) of the Exchange Act during the preceding 12 months (or for such shorter period that the registrant was required to file such reports), and (2) has been subject to such filing requirements for the past 90 days. Yes þ No ¨
Indicate by check mark whether the registrant has submitted electronically and posted on its corporate Web site, if any, every Interactive Data File required to be submitted and posted pursuant to Rule 405 of Regulation S-T during the preceding 12 months (or for such shorter period that the registrant was required to submit and post such files). Yes þ No ¨
Indicate by check mark if disclosure of delinquent filers pursuant to Item 405 of Regulation S-K is not contained herein, and will not be contained, to the best of registrant’s knowledge, in definitive proxy or information statements incorporated by reference in Part III of this Form 10-K or any amendment to this Form 10-K. þ
Indicate by check mark whether the registrant is a large accelerated filer, an accelerated filer, a non-accelerated filer, smaller reporting company, or an emerging growth company. See the definitions of “large accelerated filer,” “accelerated filer”, “smaller reporting company” and "emerging growth company" in Rule 12b-2 of the Exchange Act.
Large accelerated filer þ | Accelerated filer ¨ | Non-accelerated filer ¨ | Smaller reporting company ¨ | |||
(Do not check if a smaller reporting company) | Emerging growth company ¨ | |||||
If an emerging growth company, indicate by check mark if the registrant has elected not to use the extended transition period for complying with any new or revised financial accounting standards provided pursuant to Section 13(a) of the Exchange Act. ¨
Indicate by check mark whether the registrant is a shell company (as defined in Rule 12b-2 of the Exchange Act). Yes ¨ No þ
As of October 28, 2016 (the last business day of the registrant’s most recently completed second fiscal quarter), the aggregate market value of the registrant’s common stock held by non-affiliates of the registrant was $797,074,534 based on the closing sale price as reported on the NASDAQ Global Select Market ®.
Indicate the number of shares outstanding of each of the registrant’s classes of common stock, as of the latest practicable date:
Class | Outstanding as of June 12, 2017 | |
Common Stock, $.01 par value per share | 19,924,672 | |
DOCUMENTS INCORPORATED BY REFERENCE
Document | Parts Into Which Incorporated | |
Portions of the registrant’s Proxy Statement for the 2017 Annual Meeting of Stockholders | Part III | |
Table of Contents | |
NOTES TO THE CONSOLIDATED FINANCIAL STATEMENTS | |
2
Forward-Looking Statements
The Securities and Exchange Commission (“SEC”) encourages companies to disclose forward-looking information so that investors can better understand a company’s future prospects and make informed investment decisions. This Annual Report on Form 10-K and other written or oral statements that we make from time-to-time in this report and in our public disclosures may contain forward-looking statements within the meaning of Section 27A of the Securities Act of 1933, as amended (the "Securities Act") and Section 21E of the Securities Exchange Act of 1934, as amended (“Exchange Act”). Statements in this Annual Report on Form 10-K, including those contained in "Management’s Discussion and Analysis of Financial Condition and Results of Operations" included in Item 7 of this Annual Report on Form 10-K, that are not historical facts are forward-looking statements. These statements are often indicated by words such as “expects,” “anticipates,” “believes,” “could,” “may,” “will,” “would,” “estimates,” “targets,” “assumes,” “continues,” “intends” and “plans,” and other similar expressions, whether in the negative or the affirmative. Forward-looking statements are not guarantees of future performance and involve various important assumptions, risks and uncertainties. Actual results may differ materially from those predicted by the forward-looking statements because of various factors and possible events. We note these factors for investors as contemplated by the Private Securities Litigation Reform Act of 1995. It is impossible to predict or identify all of the risk factors that we face. Consequently, you should not consider any such list to be a complete set of all potential assumptions, risks or uncertainties. Forward-looking statements speak only as of the date on which they are made, and we undertake no obligation to update any forward-looking statement for circumstances or events that occur after the date on which the statement is made. In addition, it is our policy generally not to endorse any projections regarding future performance that may be made by third parties.
Many important factors could affect our future results and could cause those results to differ materially from those expressed in or implied by the forward-looking statements contained herein. Such factors, all of which are difficult or impossible to predict accurately, and many of which are beyond our control, include, but are not limited to, the following:
• | consumers’ perceptions of the relative quality, variety, affordability and value of the food products we offer; |
• | food safety events, including instances of food-borne illness (such as salmonella, E. coli, listeria, etc.) involving our production plants or our supply chain; |
• | the effects of negative publicity that can occur from increased use of social media; |
• | success of operating and marketing initiatives, including advertising and promotional efforts and new product development by us and our competitors; |
• | changes in consumer tastes and preferences, and in discretionary consumer spending; |
• | changes in spending patterns and demographic trends; |
• | changes in commodity costs, labor, supply, fuel, utilities, distribution and other operating costs; |
• | development costs, including plant construction, acquisition and renovation costs; |
• | availability of qualified personnel, and the ability to retain such personnel; |
• | our ability, if necessary, to secure alternative distribution of supplies of food, equipment and other products to our production facilities at competitive rates and in adequate amounts, and the potential financial impact of any interruptions in such production or distribution; |
• | availability and cost of insurance; |
• | adverse weather conditions; |
• | availability, terms (including increases in interest rates) and deployment of capital; |
• | changes in, and our ability to comply with, legal, regulatory or similar requirements, overtime rules, minimum wage rates, wage and hour laws, government-mandated health care benefits, tax legislation, and accounting standards; |
• | the costs, uncertainties and other effects of legal, environmental and administrative proceedings; |
• | the effects of charges for impairment of goodwill or for the impairment of other long-lived assets; |
• | the effects of war or terrorist activities; |
• | the ability to generate sufficient cash flow to meet debt service obligations, compliance with operational and financial covenants, and restrictions on the Company’s ability to implement strategic plans in the future; |
• | the ability to successfully integrate the recently acquired Pineland Farms Potato Company Inc. or other potential future acquisitions into our food production business |
3
• | costs associated with the sale and separation of our Bob Evans Restaurants business, including obligations that may arise under our capacity as guarantor of payment and performance conditions for certain restaurant leases, as well as costs associated with a transition services agreement established as part of the transaction; and |
• | other risks and uncertainties affecting us and our subsidiaries referred to in this Annual Report on Form 10-K (see “Item 1A. Risk Factors” and “Item 7. Management’s Discussion and Analysis of Financial Condition and Results of Operations”) and in our other current and periodic filings with the SEC. |
Readers are cautioned not to place undue reliance on forward-looking statements made in this report, since the statements speak only as of the report’s date. Except as may be required by law, we have no obligation or intention to publicly update or revise any of these forward-looking statements to reflect events or circumstances occurring after the date of this report or to reflect the occurrence of unanticipated events. Readers are advised, however, to consult any future public disclosures that we may make on related subjects in reports that we file with or furnish to the SEC or in our other public disclosures.
4
PART I
ITEM 1. BUSINESS
In this Annual Report on Form 10-K, we use the terms “Bob Evans,” “Company,” “we,” “us” and “our” to collectively refer to Bob Evans Farms, Inc., a Delaware corporation, and its direct and indirect subsidiaries.
We maintain a website at www.bobevansgrocery.com. We make available free of charge through our website our periodic and other reports filed with or furnished to the SEC pursuant to the Exchange Act, as soon as reasonably practicable after we file such material with, or furnish it to, the SEC. Information on our website is not deemed to be incorporated by reference into this Annual Report on Form 10-K or any other filings that we make from time to time with the SEC.
The following description of our business should be read in conjunction with the information contained in Management’s Discussion and Analysis of Financial Condition and Results of Operations included in Item 7 of this Annual Report on Form 10-K and our consolidated financial statements included in Item 8 of this Annual Report on Form 10-K.
Background
We are a leading producer and distributor of a variety of home-style refrigerated side-dishes, premium pork sausage and frozen food items primarily under the Bob Evans, Owens and Country Creek brand names as well as the Pineland Farms brand name subsequent to our acquisition of the Pineland Farms Potato Company on May 1, 2017. Our food products are distributed to retail customers throughout the United States. Additionally, we manufacture and sell similar products to foodservice customers, including Bob Evans Restaurants and other restaurants and food sellers. Prior to the sale of our restaurant business on April 28, 2017, we also owned and operated 523 Bob Evans Restaurants in 18 states.
Our business started in 1948 when our founder began making sausage on his southeastern Ohio farm to serve at his 12-stool, 24-hour diner. Our business grew from there and was incorporated in Ohio in 1957. We became a publicly traded company on June 6, 1963. Our current parent company was incorporated in Delaware on November 4, 1985.
Major changes to continuing operations of the business as operated today include:
• | In 1987, we expanded our business by acquiring Owens Country Sausage, Inc. |
• | In 1991, we established the Bob Evans foodservice division, which sold food products directly to distributors and institutions. |
• | In 1997, we began selling refrigerated side-dish products to our grocery customers. |
• | In 2003, Owens Country Sausage purchased a food production plant in Sulphur Springs, Texas and began major renovations. |
• | Beginning in 2009, as part of a network optimization program, we eliminated direct store deliveries and began shipping products directly to customer warehouses. As part of this program, in 2010 we closed our fresh sausage plant in Galva, Illinois, and also formed BEF Management, Inc. to act as a management company. In 2011, we sold our distribution center in Springfield, Ohio. We also completed a restructuring of the foods segment by creating BEF Foods, Inc., which consolidated all food production and operations under one company. |
• | In 2012, we purchased a 100,000 square foot food production facility in Lima, Ohio, where we primarily produce potato and pasta-based refrigerated side-dish products. |
• | In 2013, we closed our fresh sausage plant in Richardson, Texas and our production facility in Bidwell, Ohio. We also began the first phase of an expansion at our Lima, Ohio, production facility and began an expansion at the Sulphur Springs, Texas, production facility. |
• | In October 2013, we moved into our new corporate headquarters in New Albany, Ohio. |
• | In 2014, we closed our production facility in Springfield, Ohio and also completed the expansions at the Lima, Ohio, and Sulphur Springs, Texas production facilities. |
• | In October 2015, we entered into a sale leaseback transaction on our Lima, Ohio, and Sulphur Springs, Texas, production facilities. The lease agreement includes an initial 20-year term and two ten-year renewal options. |
5
• | In August 2016, we completed a fourth production line at the Lima, Ohio, plant. |
• | In April 2017, we completed the sale of the Bob Evans Restaurants business as well as our corporate headquarters to affiliates of Golden Gate Capital Opportunity Fund, L.P. and completely divested from the restaurant segment. |
• | In May 2017, we completed the acquisition of Pineland Farms Potato Company, a Maine corporation with assets that include a state-of-the-art potato processing facility and a 900-acre potato farm. |
Our Business
We are a leading producer and distributor of home-style refrigerated side-dishes, pork sausage products and a variety of complimentary frozen food items. We offer a variety of quality, wholesome food products to retail and foodservice customers. We sell our retail food products under the Bob Evans, Owens, Country Creek and Pineland brand names, and selectively manufacture products for our retail customers' own private-label brand names. Our food products provide “farm-fresh goodness” and convenient meal solutions that uphold our commitment to premium quality. Our food products include over 100 complementary, convenience food items in the refrigerated and frozen areas of grocery stores such as mashed potatoes (different varieties in various sizes), diced and shredded breakfast potatoes, our Oven Bake Scalloped Potatoes, Oven Bake Macaroni & Cheese, Oven Bake Double Cheddar Pasta with Applewood Smoked Bacon and Oven Bake Southwest, our sides such as Homestyle Broccoli & Cheese, Seasoned Homestyle Stuffing, Six Cheese Pasta and Sliced Glazed Apples, our handheld breakfast items such as Bob Evans Sausage, Egg & Cheese Biscuits, Bob Evans Sausage Biscuits, Egg & Cheese Croissant, our Breakfast Burritos, Breakfast Bowls and Owens Kolaches, as well as our Soups (Original Chicken & Noodles and Original Sausage Chili), and Sausage Gravies. We also offer approximately 60 varieties of branded fresh, smoked and fully cooked pork and turkey sausage, ham and hickory-smoked bacon products. Varieties include Bob Evans Fresh Sausage (in rolls, patties or links), Bob Evans Sausage (including Italian, Savory Sage, Maple, as well as Naturally!), Bob Evans Fully Cooked Original Links and Fully Cooked Original Patties, Maple Links, Bob Evans Fully Cooked Turkey Sausage Patties or Fully Cooked Turkey Sausage Links, and Bob Evans Grilling Sausage (Original Bratwurst, Beer Bratwurst, Sweet Italian and Hot Italian).
Our Strategy
We believe every initiative, investment and expenditure the Company undertakes must not only deliver an acceptable financial return; it must also support and empower our team members to execute our brand promise: high quality food delivered consistently to our retailers and food service customers. Quality and customer service are hallmarks of the Bob Evans brand that will allow us to drive continued profitable sales growth. Our strategy for growth focuses on five key growth drivers, including:
• | increasing overall household penetration of the refrigerated side-dish market from 20% utilization, by 3-4x; |
• | expanding SKU penetration at current retail customers |
• | achieving new retail distribution including non-traditional grocery retailers such as food clubs and convenience stores; |
• | expansion of our food service channel; and |
• | continued product innovation including additional opportunities in vegetables, rice and pasta side-dish varieties. |
Our refrigerated mashed potatoes and pasta side-dishes continue to grow as a percentage of our food products volume. Side-dish products comprise 58% of our current sales volumes, up from 36% in 2010, and will continue to grow as a percentage of our total volumes with the recent acquisition of Pineland Farms Potato Company.
We will also continue to review our Selling, General and Administrative expenses ("S,G&A") and other cost structures to identify sustainable cost savings.
Our vision for the Company is to be the grocery products brand of choice for consumers, a desirable and engaging employer for current and prospective talent, a valued partner in the community and a sound investment for shareholders. With the successful execution of our business objectives and business strategy, we believe we will achieve our vision.
Restaurants Business Divestiture
On April 28, 2017, we completed the sale of our Bob Evans Restaurants business ("Restaurants Business") to Bob Evans Restaurants, LLC (formerly BER Acquisition, LLC), a Delaware limited liability company formed by affiliates of Golden Gate Capital Opportunity Fund, L.P. (the “Buyer”). The Buyer purchased the assets associated with our Restaurants Business, as well
6
as our corporate headquarters for an aggregate purchase price of $565.0 million in cash, before certain adjustments set forth in the Asset and Membership Interest Purchase Agreement (the "BER Sale Agreement"), for net proceeds of $539.3 million. As part of the transaction we also conveyed to the Buyer the majority of working capital liabilities associated with the Restaurants Business, including outstanding payables, accrued wages, and other accrued current liabilities, other than debt. We expect net proceeds, after tax payments, of $487.0 to $493.0 million. We used a portion of the proceeds to repay all outstanding borrowings under our $650.0 million Revolving and Restated Credit Agreement (the "Credit Agreement") on April 28, 2017. On May 1, 2017, our Board of Directors also declared a special dividend of approximately $150.0 million (or $7.50 per share) representing the majority of the net cash proceeds from the sale of the Restaurants Business after income tax payments and the settlement of outstanding borrowings under our Credit Agreement, to be paid on June 16, 2017, to existing shareholders of record on May 30, 2017.
Recent Acquisition
On May 1, 2017, we completed the acquisition of Pineland Farms Potato Company, Inc., a Maine corporation (“PFPC”). We acquired all of the equity interests of PFPC in exchange for (i) $115.0 million in cash, subject to certain adjustments set forth in the purchase agreement, and (ii) up to an additional $25.0 million in cash as potential earn-out consideration, the payment of which is subject to the achievement of certain operating EBITDA performance milestones over consecutive twelve-month periods during the 24 months following the closing.
The Acquisition increases our side-dish production capacity and provides us the capability to produce and sell diced and shredded potato products in both the retail and food service channels. The acquisition also diversifies our production capability by adding a second state-of-the-art potato processing facility with approximately 180 million pounds of capacity. PFPC also owns and operates a 900-acre potato farm and is surrounded an estimated 55,000 acres of annual potato production. The production facility's close proximity to this potato production is anticipated to reduce transportation costs. The Acquisition will also mitigate the required near term capital spending for additional capacity to meet our expected sales growth targets in side-dish products.
Production Capacity
We produce food products in five manufacturing facilities. We produce fresh sausage products at our production facilities located in Hillsdale, Michigan and Xenia, Ohio. Ready-to-eat products, such as sandwiches, soups and gravies, are produced at our Sulphur Springs, Texas plant. Our Lima, Ohio, and newly acquired Mars Hill, Maine plants produce refrigerated side-dishes. In the second quarter of fiscal 2017, we completed an additional $20.0 million expansion in production capacity to add a fourth side-dish production line at the Lima, Ohio, plant. This production line provides an additional 45 million pounds of annual side-dish production capacity. In May of 2017, we completed the acquisition of PFPC. Adding PFPC’s state-of-the-art production facility adds approximately 180 million pounds of production capacity to our plant network.
We strive to be the best at operations execution by always focusing on food safety. We follow a Hazard Analysis and Critical Control Points (“HACCP”) program at each of our manufacturing plants. HACCP is a comprehensive system developed in conjunction with government agencies to prevent food safety problems by addressing physical, chemical and biological hazards. We use HACCP to identify potential safety hazards so that key actions can be taken to reduce or eliminate risks during production. We also have a team dedicated to food safety and quality assurance. We also follow the British Retail Consortium global food safety initiatives to help ensure food safety and quality standards are practiced in our manufacturing facilities, as well as in the third party facilities that supply us.
We contract with third parties to manufacture or “co-pack” some of the Bob Evans and Owens products that are not produced in our own facilities or to supplement production during peak demand periods. These co-packed items include some of our side-dish and meat items. We used approximately 20 third parties to manufacture food products for us in fiscal 2017, representing approximately 17% of pounds produced.
Sales
The U.S. food industry has experienced significant consolidation over the last 20 years as competitors have shed non-core businesses and made strategic acquisitions to complement category positions, maximize economies of scale in raw material sourcing and production, and expand retail distribution. This consolidation is expected to continue. The importance of sustaining strong relationships with retailers has become a critical success factor for food companies because it drives category management and continuous replenishment programs. Food companies with category leadership positions and strong retail relationships have increasingly benefited from these initiatives as a way to maintain shelf space and maximize distribution efficiencies.
7
Bob Evans maintains a greater than 50% share of the national refrigerated dinner side-dish market and our refrigerated side-dish products are available in 75% of domestic retail grocery stores. Bob Evans branded mashed potatoes is the leading retail brand of refrigerated side-dish product in the United States and has been since 2007. Bob Evans sausage products also continue to have the largest market share in our core Midwest market. Our goal is to consistently drive sales growth by leveraging our strong market-share position to secure additional retail store business and gain additional market penetration. We also believe strong brand awareness is critical in maintaining and securing valuable retail shelf space and provides a strong platform for introducing product line extensions and new products.
A relatively small number of customers account for a large percentage of our sales. In fiscal 2017, Wal-mart Stores Inc. accounted for 20% of food product sales, while The Kroger Co. accounted for 14% of food product sales. We use national account teams to address the needs of our key retailers on a long-term basis.
Our retail sales force, which consists of our national account teams as well as third-party food brokers, sells our food products to the leading national and regional retail chains. Retail sales are approximately 85% of net sales, while foodservice sales account for approximately 15% of net sales. Items sold to our foodservice customers include sausage, sausage gravy, breakfast sandwiches and side-dishes. Sales to Bob Evans Restaurants (intercompany sales eliminated in consolidation in fiscal 2017) comprised approximately 40% of our food service sales in fiscal 2017. As part of the sale of our Restaurants Business, we entered into a five-year supply agreement with Bob Evans Restaurants. The supply agreement requires Bob Evans Restaurants purchase 100% of certain food products from the Company in the first year. The required percentage of purchases for those products then decreases annually, down to a required minimum of 25% in the final year of the supply agreement.
Foodservice sales provide us with incremental volume in our production plants to leverage operating efficiencies. With the additional capacity provided by the acquisition of PFPC, we expect significant expansion in our food service product line, which accounts for approximately 80% of PFPC's sales. We believe foodservice sales may grow to approximately 40% of total volumes by fiscal 2020 as we work to obtain new customers. Expanding our foodservice customer base will help to maximize the utilization at our production plants and decrease the overhead cost burden on our retail products.
Distribution
We supply our customers by shipping products directly to their warehouses for further distribution by the customers to their retail stores. We also distribute our products through food wholesalers and distributors who primarily service smaller, independent grocers and distribute to restaurant and food service operators.
At the end of fiscal 2017, Bob Evans or Owens brand products were available for purchase in grocery stores in all 50 states and the District of Columbia. Our Owens brand products were available for purchase primarily in Oklahoma, Louisiana and Texas.
We continue to work with retailers in states where there is an opportunity to distribute our products and explore expansion prospects to profitably increase points of distribution.
Sources and Availability of Raw Materials
One of the most important raw materials used in our food products business is live sows (an adult female pig), which we depend upon to produce our pork sausage products. We produce sausage using the same premium ingredients that Bob Evans used when he started the Company. Sow meat is a high-value product compared to other types of pig meat because it has a better texture when made into sausage.
We procure live sows at prevailing market prices from terminals, local auctions, country markets and corporate and family farms in various U.S. locations. The live sow market is volatile in terms of the number of sows available and market price. The live sow market is also dependent upon supply and demand for pork products, as well as corn and soybean meal prices (the major food supply for sows), weather and farmers’ access to capital. We procure sows in a variety of ways, including through supply contracts. Due to the structure of the sow market however, including the limited availability of sows, there is generally not a way to “lock” in prices contractually in advance for sows nor any commercially feasible, financial hedging products for sow prices to “fix” prices in advance, unlike the financial hedging products that are available for “lean hogs” or “pork bellies” prices.
In fiscal 2017, larger herd sizes as well as capacity expansion including new butcher hog processing plants, drove sow costs lower than the prior year. We expect sow prices in fiscal 2018 to be modestly higher than fiscal 2017 as the breeding herd stabilizes and prices fluctuate on the normal seasonal pattern.
Other important raw materials used in our food products operations are potatoes, dairy products, seasonings and packaging materials. Historically, these materials have been readily available, although some items may be in short supply
8
during certain seasons and prices fluctuate according to availability. Such shortages did not have a material impact on net sales or operating income in fiscal 2017. Generally, we purchase these items under supply contracts with periodic pricing reviews with our suppliers. We occasionally engage in commitments for certain commodity based items when market conditions indicate that taking a future position will have a favorable financial impact. We believe that these items will continue to be available from our existing suppliers or, upon short notice, can be obtained from other qualified suppliers.
With the recent acquisition of PFPC, we acquired a 900-acre potato farm in Maine that vertically integrates less than 5% of our potato supply, but more importantly provides us with information regarding the cost of growing, harvesting and storing potatoes. This information allows us to purchase with greater efficiency and credibility with potato growers. The newly acquired facility is also surrounded by more than 55,000 acres of annual potato production.
Most of our food products are perishable and require proper refrigeration. Product shelf life ranges from 18 to 60 days for refrigerated products. Due to the perishable nature and shelf life of these items, our production plants normally process only enough products to fill existing orders; however we do build inventory seasonally in-line with peak periods of customer demand. As a result, we maintain minimal inventory levels. Many of our breakfast and dinner sausage items can be frozen for shipping to warehouses. Shipping frozen product allows our retailers added flexibility to slack-out product as needed to meet consumer demand and allows us to build inventory for heavy consumption periods.
Advertising and Marketing
During fiscal 2017, we spent approximately $9.0 million advertising our food products, excluding coupons and trade promotion marketing costs. Our food products marketing programs consist of advertising, consumer promotions and trade promotions. Our advertising activities include television, newspaper and digital advertising aimed at increasing brand awareness and building consumer loyalty. Consumer promotions include the distribution of recipes featuring our products and targeted coupons designed to attract new customers and increase the frequency of purchases. Our trade promotions are aimed at providing retail display support, price discounts and securing additional shelf space. Trade promotions and discounts, which are recorded as a reduction to net sales, were $84.8 million, $79.3 million and $56.6 million in fiscal years 2017, 2016 and 2015, respectively. A decline in sow costs as compared to the last year drove the increase in fiscal 2017 trade promotions and discounts, allowing us to remain price competitive in a low sow cost environment. Trade incentives are generally more prevalent for fresh sausage than for refrigerated sides and represented approximately 64%, 62% and 53% of total trade incentives in fiscal years 2017, 2016 and 2015, respectively.
Competition
The food products business is highly competitive and is affected by changes in the public’s eating habits and preferences, as well as by local and national economic conditions affecting consumer spending habits, many of which are beyond our control. Key competitive factors in the industry are the quality, flavor and value of the food products offered, advertising and name brand awareness. We believe that we compete favorably with respect to each of these factors. Our competitors include well-established national, regional and local producers and wholesalers of similar products, many of which have substantially greater financial, marketing and other resources than we have. We also face growing competition from private label sausage products and side-dishes.
Seasonality and Quarterly Results
Our business is subject to seasonal fluctuations because third and fourth quarter sales are typically higher due to increased sales of sausage and our home-style side-dishes during the colder months from November through April and especially during the holiday season.
Our quarterly results can be significantly impacted by the cost and availability of raw materials, especially live sows. As a result, our financial results for any given quarter may not be indicative of the results that may be achieved for a full fiscal year.
Trademarks and Service Marks
We believe that brand awareness is a significant component in a consumer’s decision to purchase one product over another in highly competitive consumer products industries. In most cases, our brand, slogans, and product line names are protected by trademark applications or registrations in the United States and certain other foreign countries (“Trademarks”). While some of the Trademarks are exclusively owned by us, the majority of the Trademarks used in connection with our business were contributed in conjunction with the sale of our Restaurants Business to an entity that we control jointly with affiliates of Golden Gate Capital (“IPCo”). The sale of our Restaurants Business assets included the sale of fifty percent of the equity interests in a newly formed special purpose entity that holds specified intellectual property assets used by both the Restaurants Business and the Company’s food production business. As a result of this contribution, IPCo is the legal owner of
9
the Trademarks and certain other intellectual property contributed to IPCo, and we have a license to use the Trademarks and other intellectual property held by IPCo in connection with our business. Certain restrictions set forth in our agreement with IPCo may limit our ability to expand use of the Trademarks into certain lines of business in which we do not currently operate.
Our web content and the domain names, including www.bobevansgrocery.com, and www.owensfoods.com are owned by us and the content is copyright protected. We also rely on unpatented proprietary expertise, recipes and formulations, continuing innovation and other trade secrets to develop and maintain our competitive position.
We believe that our trademarks, service marks, websites, proprietary recipes and other proprietary rights have significant value and are important to our brand-building efforts and marketing. We have vigorously protected our proprietary rights in the past and expect to continue to do so. We cannot predict, however, whether steps taken by us to protect our proprietary rights will be adequate to prevent misappropriation of these rights or the use by others. It may be possible for unauthorized parties to copy, obtain or use certain portions of our food products or trademarks. Such unauthorized use could reduce the value of our products and brands, or have an adverse impact on our business and financial condition.
Government Regulation
We are subject to numerous federal, state and local laws affecting our businesses. However, we believe that we are in compliance in all material respects with applicable governmental regulations and, to date, we have not experienced abnormal difficulties or delays in obtaining the licenses or approvals required to open or operate any of our facilities.
Various federal and state labor laws govern our operations and our relationships with our employees, including such matters as minimum wage, meal and rest breaks, overtime, fringe benefits, safety, working conditions and citizenship requirements.
Minimum wages are governed by federal, state and local laws. There have been a number of increases in minimum wage in various states, as well as increasing legislative discussion at the federal level. Any significant changes in the level of minimum wages could affect our profitability. Federal and state legislatures have also proposed bills that would require paid time off at the hourly level.
The passage of the Affordable Care Act and ongoing changes in the governing rules have required significant effort to ensure compliance. The Company has chosen to continue to make health care available to eligible employees based on the terms set forth in the plan. Further, we are providing medical, prescription drug, dental, vision and an employee assistance program through an insurance carrier, as we attempt to manage overall health care costs. In the first years under the Affordable Care Act (calendar years 2014 and 2015) we experienced a more significant increase in costs than we had anticipated and were unable to mitigate the cost to the Company by re-distributing the cost of the coverage between the Company and employees. Continued, significant cost increases and administrative burdens will continue to affect our profitability and our ability to continue our current health care strategy.
The nature of our business requires employees to work weekends and nontraditional schedules at times. These factors make it imperative that we carefully monitor and manage the hours that nonexempt employees work to remain compliant with overtime pay and health care regulations. As the definitions and enforcement of overtime and overtime exemption regulations continue to change at the federal and state levels, we may need to consider making changes in these classifications, which could result in higher payroll costs and negatively impact profitability.
Bob Evans must comply with the applicable requirements of the Americans with Disabilities Act of 1990, as amended by the ADA Amendments Act of 2008 (“ADA”) and related state statutes. In pertinent part, the ADA prohibits discrimination on the basis of disability with respect to public accommodations and employment. Under the ADA and related state laws, when constructing or undertaking significant remodeling of existing or new facilities, we must ensure each facility meets the accessibility requirements of all applicable laws and regulations. We also must make reasonable accommodations for the employment of people with disabilities.
As a manufacturer and distributor of food products, we are subject to a number of food safety regulations, including regulations promulgated by the U.S. Department of Agriculture (“USDA”) and the Food and Drug Administration. These agencies enact and enforce regulations relating to the manufacturing, labeling, packaging, distribution and safety of food in the United States. Among other matters, these agencies: enforce statutory prohibitions against misbranded and adulterated foods; establish safety standards for food processing; establish standards for ingredients and manufacturing procedures for certain foods; establish standards for identifying certain foods; determine the safety of food additives; establish labeling standards and nutrition labeling requirements for food products; and enforce regulations to prevent the introduction, transmission or spread of communicable diseases. In addition, various states regulate our operations by: enforcing federal and state standards for selected food products; grading food products; licensing and inspecting plants and warehouses; regulating trade practices related to the
10
sale of food products; and imposing their own labeling requirements on food products. Some of the food commodities we use in our operations are also subject to governmental agricultural programs. These programs have substantial effects on prices and supplies and are subject to congressional and administrative review.
Through our sausage manufacturing operations, we are subject to the requirements of the Packers & Stockyards Act (the “P&S Act”). The general purpose of the P&S Act is to: (1) assure fair competition and fair trade practices; (2) safeguard farmers and ranchers; (3) protect consumers; and (4) protect members of the livestock, meat and poultry industries from unfair, deceptive, unjustly discriminatory and monopolistic practices. The P&S Act is administered by the Grain Inspection, Packers & Stockyards Administration (“GIPSA”), which is part of the USDA. Among other requirements, the P&S Act requires meat packers to be bonded, which provides trust protection for producers in the event they are not paid for livestock by a meat packer, and requires that livestock producers be paid promptly by meat packers for the sale of livestock. Violations of the P&S Act may be resolved through a notice of violation, a stipulation agreement with GIPSA, administrative actions and court actions.
We are subject to federal and state environmental regulations, including various laws concerning the handling, storage and disposal of hazardous materials, such as cleaning solvents. These regulations have not had a material adverse effect on our operations to date. We do not anticipate that compliance with federal, state and local provisions regulating the discharge of materials into the environment, or which otherwise relate to the protection of the environment, will have a material adverse effect upon our capital expenditures, revenues or competitive position.
U.S. federal, state and local laws and regulations are increasingly being enacted to address concerns about the effects that carbon dioxide emissions and other identified greenhouse gases (“GHG”) may have on the environment and climate worldwide. One or more of our manufacturing facilities could be covered by such new legislation. As in virtually every industry, GHG emissions occur at several points across our operations, including production, transportation and processing. Compliance with future legislation, if any, and compliance with currently evolving regulation of GHGs by the Environmental Protection Agency and states may result in increased compliance costs, capital expenditures, and operating costs. In the event that any future compliance requirements at any of our facilities require more than the sustainability measures that we are currently undertaking to monitor emissions and improve our energy efficiency, we may experience increases in our costs of operation. These regulatory changes may also lead to higher cost of goods and services, which may be passed on to us by suppliers. Based on information currently available to us, we believe that compliance with these regulations will not have a material adverse effect on us.
From time to time, we receive notices and inquiries from regulatory authorities and others asserting that we are not in compliance with particular laws and regulations. In some instances, litigation ensues. In addition, individuals may initiate litigation against us. Many of our facilities are subject to environmental permits and other regulatory requirements, violations of which are subject to civil and criminal sanction. In some cases, third parties may also have the right to sue to enforce compliance.
Employees
As of April 28, 2017, we employed approximately 1,000 employees, including approximately 200 salaried employees. None of our employees are covered by collective bargaining agreements. We consider overall relations with our employees to be satisfactory. As part of the recent acquisition of PFPC, we added approximately 200 employees, of which approximately 40 are salaried.
Available Information
We are subject to the informational requirements of the Exchange Act, and, accordingly, we file reports, proxy statements, and other information with the SEC. Such reports, proxy statements, and other information are publicly available and can be read and copied at the reference facilities maintained by the SEC at the Public Reference Room, 100 F Street, NE, Room 1580, Washington, D.C. 20549. Information regarding the operation of the Public Reference Room may be obtained by calling the SEC at 1-800-SEC-0330. The SEC maintains a website (www.sec.gov) that contains reports, proxy and information statements, and other information regarding issuers that file electronically with the SEC.
Our website is www.bobevansgrocery.com. We make available at this address, free of charge, press releases, annual reports on Form 10-K, quarterly reports on Form 10-Q, current reports on Form 8-K, reports for transactions in the Company stock by insiders on Forms 3, 4 and 5, and amendments to those reports filed or furnished pursuant to Section 13(a) or 15(d) of the Exchange Act as soon as reasonably practicable after electronically filing such material with, or furnishing it to, the SEC. In addition, we provide periodic investor relations updates and our corporate governance materials at our website.
11
Upon the written request of a stockholder, we will provide without charge a copy of this Annual Report on Form 10-K, including the financial statements and financial statement schedules included herein. In addition, upon the written request of a stockholder, we will provide a copy of any exhibit to this Annual Report on Form 10-K upon the payment of a reasonable fee. Written requests should be delivered to Bob Evans Farms, Inc., Attention: Investor Relations, 8111 Smith's Mill Road, New Albany, Ohio 43054.
ITEM 1A. RISK FACTORS.
The following are certain risk factors that could affect our business, financial condition and results of operations. These risk factors contained in this Annual Report on Form 10-K and our other filings with the SEC could cause the actual results and conditions to differ materially from those projected in forward-looking statements. Additional risks and uncertainties that are not presently known to us or are currently deemed to be immaterial also may materially adversely affect our business, financial condition, or results of operations in the future. If any of the risks actually occur, our business, financial condition or results of operations could be negatively affected.
Concerns with the safety and quality of certain food products or ingredients could cause consumers to avoid our products.
We could be adversely affected if consumers in our principal markets lose confidence in the safety and quality of certain products or ingredients. Negative publicity about these concerns, whether or not valid, may discourage consumers from buying our products or cause disruptions in production or distribution of our products and negatively impact our business and financial results.
If our products become adulterated, misbranded or mislabeled or become contaminated, we may need to recall those items and may experience product liability claims if consumers are harmed.
Selling food products involves a number of legal and other risks, including product contamination, spoilage, product tampering, allergens or other adulteration. Additionally, many of the raw materials used to make certain of our products are vulnerable to contamination by naturally occurring pathogens, such as porcine epidemic diarrhea virus and salmonella. We may need to recall some or all of our products if they become adulterated, mislabeled or misbranded, whether caused by us or someone in our supply chain. A recall could result in destruction of product inventory, negative publicity, temporary plant closings, supply chain interruption, substantial costs of compliance or remediation, fines and increased scrutiny by federal and state regulatory agencies. Should consumption of any product cause illness or injury, we may be liable for monetary damages as a result of a judgment against us. In addition, adverse publicity, including claims (whether or not valid) that our products or ingredients are unsafe or of poor quality may discourage consumers from buying our products or cause production and delivery disruptions. Any of these events, including a significant product liability claim against us, could result in a loss of consumer confidence in our food products. Although we have various insurance programs in place to protect us against matters such as these, any of these events and/or a loss of consumer confidence could have an adverse effect on our financial condition, results of operations and/or cash flows.
Our product categories face a high level of competition, which could negatively impact our sales and results of operations.
The food products business is highly competitive. Numerous brands and products compete for shelf space and sales, with competition based primarily on product quality, brand recognition and loyalty, price, trade promotion, consumer promotion, customer service, and the ability to identify and satisfy emerging consumer preferences. We compete with a significant number of companies, many of which have multiple product lines and substantially greater financial and other resources available to them. Because of their diversity, larger capitalization and greater resources, these companies may be better able to compete on the basis of input costs or selling price.
Price increases for our products that we manufacture may negatively impact our financial results if not properly implemented or accepted by our customers. Future price increases, such as those made in order to offset increased input costs, may reduce our overall sales volume, which could reduce our revenue and operating profit. In addition, because we offer moderately priced food products, we may be unable to pass along price increases to our customers sufficient to completely offset cost increases. Conversely, if market prices for certain inputs decline significantly, competitive pressure could cause us to reduce the prices for our products and thereby lower our revenue and operating profit.
In addition, we are subject to competition from companies, including some of our customers, that either currently manufacture or are developing products directly in competition with our products. These generic or store-branded products may be a less expensive option for consumers than our products, making it more difficult to sell our products that compete with them. Additionally, our customers may reduce their purchases of our products or detrimentally change the shelf placement of our products in favor of their own private-label products. Competitive pressures or other factors could cause us to lose market share, which may require us to lower prices, increase marketing and advertising expenditures, or increase the use of discounting
12
or promotional campaigns, each of which could materially and adversely affect our margins and could result in a decrease in our operating results and profitability.
Demand for our products may be adversely affected by changes in consumer preferences and tastes or if we are unable to innovate or market our products effectively.
To generate revenue and profits, we must sell products that appeal to our customers and consumers. Any significant changes in consumer preferences or any inability on our part to anticipate or react to such changes could result in reduced demand for our products and erosion of our competitive and financial position. Our success depends on our ability to respond to consumer trends, including concerns of consumers regarding health and wellness, obesity, product attributes and ingredients. In addition, changes in product category consumption or consumer demographics could result in reduced demand for our products. Consumer preferences may shift due to a variety of factors, including the aging of the general population, changes in social trends, or changes in travel, vacation or leisure activity patterns. Any of these changes may reduce consumers’ willingness to purchase our products and negatively impact our financial results.
If we are unable to accurately predict which shifts in consumer preferences will be long-lasting, or are unable to introduce new and improved products to satisfy those preferences, our sales may decline. As such, we must be successful in developing innovative products across a multitude of product categories. Our continued success is dependent on product innovation, including maintaining a robust pipeline of new products, and the effectiveness of advertising and promotional campaigns, marketing programs and product packaging. Although we devote significant resources to meet this goal, there can be no assurance as to the continued ability to develop and launch successful new products or variants of existing products, or to effectively execute advertising and promotional campaigns and marketing programs. If we are unable to rapidly develop products in faster-growing and more profitable categories, we could experience reduced demand for our products, or fail to expand margins.
If we lose one or more of our major customers, or if any of our major customers experiences significant business interruption or enacts initiatives to improve their cost structure, our results of operations could be adversely affected.
Our two largest customers, Wal-Mart Stores, Inc. and The Kroger Co., accounted for approximately 20% and 14%, respectively, of our net sales from continuing operations in fiscal 2017. If, for any reason, one of our key customers were to purchase significantly less of our products in the future or were to terminate entirely its purchases from us, or if we were unable to maintain existing relationships with key customers on terms favorable to us, our business, financial condition and our results of operations could be materially and adversely affected.
Many of our customer relationships do not require our customers to commit to any specified minimum purchase volumes. Moreover, many of our customer relationships are terminable at will by our customers following brief notice periods. As a result, we could have periods during which we have diminished orders for our products but incur costs in the short term associated with our workforce and operations that are not supportable by reduced sales volumes. In addition, our large customers may choose to purchase products from us based on a combination of factors such as price, consumer demand, customer service performance, their desired inventory levels, and other factors. Changes in any of our major customers’ strategies, including a reduction in the number of brands they carry, initiatives to improve their cost structure, or a shift of shelf space to private label products, could have a material adverse effect on our business and our results of operations. There can be no assurance that we will be able to find new customers in a timely fashion and on favorable terms, or at all, to supplement periods of diminished order volume from established customers. Periods of no or limited orders for our products could have a material adverse effect on our business, financial condition and our results of operations.
Customer consolidation, and competitive, economic and other pressures facing our customers, may in-turn put pressure on our operating margins and profitability.
A number of our customers, such as supermarkets and food distributors, have consolidated in recent years and consolidation could continue. Such consolidation could present a challenge to margin growth and profitability in that it has produced large, sophisticated customers with increased buying power who are more capable of operating with reduced inventories; resisting price increases; demanding lower pricing, increased promotional programs and specifically tailored products; and shifting shelf space currently used for our products to private label and other competitive products. The economic and competitive landscape for our customers is constantly changing, such as the emergence of new sales channels like e-commerce, and our customers' responses to those changes could impact our business. These factors and others could have an adverse impact on our business, financial condition or results of operations.
The price and availability of operating resources, and for commodities such as food, ingredients, and utilities, could adversely affect our revenues and results of operations.
13
Our business depends heavily on raw materials, such as sows, potatoes and dairy products that are used in the production of our products. Our raw materials are generally sourced from third-party suppliers, and we are not assured of continued supply, pricing, or exclusive access to raw materials from any of these suppliers. In addition, a substantial portion of our raw materials are agricultural products, which are vulnerable to adverse weather conditions and natural disasters, such as floods, droughts, frost, earthquakes, and pestilence. Adverse weather conditions and natural disasters also can lower crop yields and reduce supplies of these ingredients or increase their prices. Additionally, the increased global demand for corn, wheat and dairy products has increased feed costs for livestock from time to time. Also, the cost of commodities subject to governmental regulation, such as dairy and corn, can be even more susceptible to price fluctuation than other products. Some climatologists predict that the long-term effects of climate change may result in more severe, volatile weather, which could result in greater volatility in product supply and price. Furthermore, many of the products that we use and their costs are interrelated, which could result in compound effects from events that negatively affect our sources of supply. Other events that adversely affect our third-party suppliers and that are out of our control could also impair our ability to obtain the raw materials and other inputs that we need in the quantities and at the prices that we desire. Such events include problems with our suppliers' businesses, finances, labor relations, costs, production, insurance, and reputation.
Sows are the most important raw material used to produce our pork sausage products. We procure live sows at prevailing market prices from terminals, local auctions, country markets and corporate and family farms in many states and Canada. The live sow market is volatile in terms of the number of sows available and the current market price. The live sow market is dependent upon supply and demand for pork products, as well as such commodities as corn and soybean meal prices (the major food supply for sows), weather and farmers’ access to capital. We also use pork trimmings in certain of our products. The pork trimmings market is also volatile in terms of availability and market price. Higher sow and pork trimmings costs could adversely affect our profitability, and we cannot guarantee that we will be able to pass along any portion of the increased costs to our consumers in a timely manner, or at all.
Our ability to anticipate and respond effectively to one or more adverse changes in any of these operating costs could have a significant adverse effect on our results of operations. In addition, because we offer moderately priced food products, we may be unable to pass along price increases to our customers sufficient to completely offset cost increases.
We are vulnerable to disruptions to our food processing business because our food production business is concentrated in five manufacturing facilities.
Because the majority of our food products are produced in five manufacturing facilities, significant disruptions at any of our facilities could have a material adverse effect on our business, financial condition or results of operations. We produce fresh sausage products at our plants located in Hillsdale, Michigan and Xenia, Ohio. Ready-to-eat products, such as sandwiches, soups and gravies, are produced at our Sulphur Springs, Texas plant. Our Lima, Ohio, plant and the PFPC facility we recently acquired in Mars Hill, Maine produce refrigerated side-dishes as well as diced and shredded potatoes. If we had to close or limit production of all or part of the operations at one or more of these plants for an extended period of time, we may be unable to increase production at our other plants or with our third-party co-packers in a timely manner, which could have a material adverse effect on our results of operations.
We rely on third party co‑packers for a portion of our manufacturing capacity needs, and the inability to enter into additional or future co‑packing agreements could limit our ability to meet customer demand.
We rely upon co‑packers for a portion of our manufacturing needs. The success of our business depends, in part, on maintaining a strong sourcing and manufacturing platform. We believe that there are a limited number of competent, high‑quality co‑packers in the industry, and if we were required to obtain additional or alternative co‑packing agreements or arrangements in the future, we can provide no assurance that we would be able to do so on satisfactory terms or in a timely manner.
We outsource certain business processes and product manufacturing to third-party vendors that subjects us to risks, including disruptions in business and increased costs.
Some of our business processes and the manufacturing of certain products are currently outsourced to third parties. Such processes include distribution of food and retail products to our food service customers, employee payroll card services, health care and workers’ compensation claims processing, wage and related tax credit documentation and approval and externally hosted business software applications. We cannot ensure that all providers of outsourced services are observing proper internal control practices, such as redundant processing facilities, and there are no guarantees that failures will not occur. Failure of third parties to provide adequate services could have an adverse effect on our financial condition and results of operations.
We rely on certain technology licensed from third parties and may be required to license additional technology in the future for use in managing our Internet sites and providing services to our customers and employees. These third-party
14
technology licenses may not continue to be available to us on acceptable terms or at all. The inability to enter into and maintain these technology licenses could adversely affect our business.
Our results of operations and financial condition may be adversely affected by the failure to execute and successfully integrate business acquisitions.
We may not be able to identify and complete acquisitions in the future, and our failure to do so could limit our ability to grow our business beyond our existing products. Additionally, the process of integrating any acquired business involves risks. For example, if we are unable to successfully integrate the recently completed acquisition of PFPC with our existing food production business in an efficient and effective manner, the anticipated benefits of our acquisition of PFPC, including the expected diversification and expansion of our production capability and transportation cost savings, may not be realized fully, or at all, or may take longer to realize than expected. An inability to realize the full extent of the anticipated benefits of our acquisition of PFPC, or any delays encountered in the integration process, could have an adverse effect on the results of operations, cash flows and financial position of the Company. In addition, the actual integration of PFPC may result in additional and unforeseen expenses.
Moreover, if we pursue strategic acquisitions or joint ventures in the future, we may incur significant costs and may not be able to consummate the transactions or obtain the requisite financing. Potential risks of acquisitions, in addition to the integration risks discussed above, include: the diversion of management’s attention from other business concerns; potential loss of key employees and/or customers of acquired businesses; potential assumption of unknown liabilities; the inability to implement promptly an effective control environment; potential impairment charges if purchase assumptions are not achieved or market conditions decline; and the risks inherent in entering markets or lines of business with which we may have limited or no prior experience.
The divestiture of the Restaurants Business could adversely affect our results of operations.
In April 2017, we completed the sale of our Restaurants Business to Bob Evans Restaurants, LLC (formerly, BER Acquisition, LLC), a Delaware limited liability company formed by affiliates of Golden Gate Capital Opportunity Fund, L.P. (the “Buyer”), pursuant to an Asset and Membership Interest Purchase Agreement (the “BER Sale Agreement”) between the Company and the Buyer dated January 24, 2017. Difficulties in the separation of operations, services, products and personnel could have an adverse impact on operations of the Company.
As part of the sale of the Restaurants Business the Company also entered into a transition services agreement ("TSA"), pursuant to which both the Company and the Buyer will provide transition services to the other party at the provider’s cost for a period of 18 months following the closing. Disruptions in the services provided under the TSA, including the IT services the Company will provide the Restaurants Business, could have an adverse impact on our on-going business, as well as the Restaurants Business, which remains a significant customer of the Company. The obligation to indemnify the Buyer for certain breaches of the BER Sale Agreement and for certain other liabilities, subject to the applicable limitations in the BER Sale Agreement, could have a negative impact on our results of operations. The Company may also be negatively impacted by the departure of senior members of our corporate management team in connection with the transaction, as well as an increased potential for losses of further employees as a result of the uncertainty created by the transaction.
There is no assurance that we will be successful in managing these risks or that these risks will not adversely affect our results of operations.
15
Guarantor provisions associated with restaurant lease obligations could adversely affect our results of operations or financial condition even after completion of the sale.
Following the sale of our Restaurants Business, the Buyer assumed the lease obligations of the Restaurants Business. However, as part of the sale leaseback transaction of 143 of our restaurant properties in fiscal 2016, the Company and its wholly owned subsidiary BEF Foods, Inc. entered into payment and performance guaranties relating to the leases on such restaurant properties, which have remained in place following the completion of the sale of our Restaurants Business. Under the terms of the BER Sale Agreement, the Buyer assumed responsibility for the payment and performance obligations under the leases on these sale leaseback properties. However, while we will no longer have control over the Restaurants Business, under the terms of the guaranties we remain liable for payments due under these leases if the Buyer fails to satisfy its lease obligations. Any such unexpected expenses related to our obligations under the payment and performance guaranties could adversely affect our results of operations or financial condition.
A material disruption in our information technology, network infrastructure and telecommunication systems could adversely affect our business and results of operations.
We are a highly automated business and rely on our production facilities, our network infrastructure, the Internet, our website and mobile apps for our development, marketing, operational, support, hosted services and sales activities. Our business depends significantly on the reliability and capacity of our information technology systems to process these transactions, summarize results and manage and report on our business and our supply chain. Our information technology systems are subject to disruption, infiltration, damage, interruption or failure from power outages, computer, network, cable system, Internet and telecommunications failures, computer viruses, security breaches, catastrophic events such as fires, floods, earthquakes, tornadoes, hurricanes, acts of war or terrorism or usage errors by our employees. If our information technology and telecommunication systems are damaged or cease to function properly, we may have to make a significant investment to repair or replace them, and we could suffer loss of critical data, system interruption, delay, limitations on operations and services and disruption in our product production. Any material interruption in our information technology and telecommunication systems could adversely affect our business or results of operations.
Many of our corporate systems and processes and corporate support for operations are centralized at one Ohio location. We have disaster recovery procedures and business continuity plans in place to address most events of a crisis nature, including tornadoes and other natural disasters, and back up and off-site locations for recovery of digital and other forms of data and information. However, if we are unable to implement our disaster recovery plans, we may experience delays in recovery of data, experience inability to perform vital corporate functions, experience delays in required reporting and compliance, fail to adequately support field operations and experience other breakdowns in normal communication and operating procedures. These could have a material adverse effect on our financial condition, results of operation, and exposure to administrative and other legal claims.
A privacy breach could adversely affect our business.
The protection of customer, employee and company data is critical to us. We are subject to laws relating to information security, privacy and fraud. Additionally, an increasing number of government and industry groups have established laws and standards for the protection of personal and health information. The regulatory environment surrounding information security and privacy is increasingly demanding, with the frequent imposition of new and constantly changing requirements. We employ both internal resources and external consultants to conduct auditing and testing for weaknesses in our cyber environment to reduce the likelihood of any security incident. We have developed a multi-disciplined security incident response plan to help ensure that our executives are fully and accurately informed and managing, with the help of content experts, the discovery, investigation, auditing and recovery stages of any security incidents. However, we can provide no assurance that our security measures will be successful in the event of an attempted or actual security incident. Compliance with these requirements may result in cost increases due to necessary systems changes and the development of new administrative processes.
In addition, our customers and employees have a high expectation that we will adequately protect their personal information. Third parties may have the technology or know-how to breach the security of this confidential information, and our security measures and those of our technology vendors may not effectively prohibit others from obtaining improper access to this information. If we fail to comply with the laws and regulations regarding privacy and security or experience a security breach, we could be exposed to risks of data loss, fines, litigation, termination or diminution of our relationships with affected customers and serious disruption of our operations. Additionally, any resulting negative publicity could significantly harm our reputation.
16
We may not be able to adequately protect our intellectual property and other proprietary rights that are material to our business.
Our ability to compete effectively depends in part upon protection of our rights in trademarks, trade dress, copyrights and other intellectual property rights that we use in our business. Our use of contractual provisions, confidentiality procedures and agreements, and trademark, copyright, unfair competition, trade secret and other laws to protect our intellectual property and other proprietary rights may not be adequate. Litigation may be necessary to enforce our intellectual property rights and protect our proprietary information, or to defend against claims by third parties that our products or our use of intellectual property infringe their intellectual property rights. Any litigation or claims brought by or against us could result in substantial costs and diversion of our resources. A successful claim of trademark, copyright or other intellectual property infringement against us could prevent us from providing our products, which could harm our business, financial condition or results of operations. In addition, a breakdown in our internal policies and procedures may lead to an unintentional disclosure of our proprietary, confidential or material non-public information, which could in turn harm our business, financial condition or results of operations.
Additionally, in connection with the Restaurants Business transaction, many of the trademarks, copyrights and other intellectual property rights that we use in our business were contributed to the IPCo. As a result of this contribution, the IPCo is the legal owner of these intellectual property assets, and we hold the right to use these intellectual property assets through license agreements with the IPCo. As such, any enforcement action with respect to certain intellectual property rights we use in our business may require the active involvement or approval of the IPCo, over which we do not have sole control. If we are prevented from, or otherwise unable to, protect intellectual property rights we use in our business, our business, financial condition or results of operations could be materially and adversely affected. Furthermore, because certain of our tradenames are shared and used by a third party, negative events outside of our control, for example a privacy breach or food safety issue at Bob Evans Restaurants, could have an adverse impact on our results of operations or financial condition.
The loss of key executives or difficulties in recruiting and retaining qualified personnel could jeopardize our future growth and success.
We have assembled a senior management team that has substantial background and experience in the food products industry. Our future growth and success depends substantially on the contributions and abilities of our senior management and other key personnel. If we fail to retain senior management or other key personnel or fail to attract key personnel, our succession planning and operations could be materially and adversely affected and could jeopardize our ability to meet our business goals.
Labor organizing could harm our operations and competitive position in our industry, which could materially adversely affect our financial performance.
Our staff members and others may attempt to unionize our workforce, establish boycotts or picket lines or interrupt our supply chains which could limit our ability to manage our workforce effectively and cause disruptions to our operations, which could materially adversely affect our financial performance. A loss of our ability to effectively manage our workforce and the compensation and benefits we offer to our employees could significantly increase our labor costs, which could materially adversely affect our financial performance.
Our marketing and branding strategies may not be successful, which could negatively affect our business.
Our marketing and branding strategies continue to evolve to maximize our appeal to customers and compete effectively. We do not have any assurance that our marketing strategies will be successful. Moreover, many of our competitors have successfully used national marketing strategies in the past, including network, cable television, and social media and we may not be able to successfully compete against those established and newly developed programs.
Media campaigns related to food production and the use or misuse of social media may have an adverse effect on our business and financial results.
Media outlets, including new social media platforms, provide the opportunity for individuals or organizations to publicize inappropriate or inaccurate stories or perceptions about us or the food industry. Such practices have the ability to cause damage to our brands, the industry generally, or consumers’ perceptions of us or the food production industry and may result in negative publicity and adversely affect our financial results. In addition, our competitors are increasingly using social media networks to make and advertise products. If we are unable to compete in this environment, it could adversely affect our financial results.
Our sales and profit growth is dependent upon our ability to expand existing market penetration and enter into new markets.
17
Successful growth depends in part on our ability to add new retail customers, as well as expand the number of products sold through existing retail customers. This would include expanding the number of our items they offer for sale and product placement within the refrigerated meat and side-dish departments. The expansion of our business depends on our ability to obtain and retain large-account customers, such as grocery store chains and warehouse customers. Our failure to retain and obtain new large-account customers or maintain our relationships with existing large-account customers could have a material adverse effect on the business and results of operations.
Economic downturns could limit consumer demand for our products.
The willingness of consumers to purchase our products depends in part on general or local economic conditions. In periods of economic uncertainty, consumers may purchase less of our products and may forego certain purchases altogether. In those circumstances, we could experience a reduction in sales of our products. In addition, as a result of economic conditions or competitive actions, we may be unable to raise our prices sufficiently to protect profit margins. Any of these events could have an adverse effect on our results of operations.
Failure of our internal control over financial reporting could adversely affect our business and financial results.
Our management is responsible for establishing and maintaining effective internal control over financial reporting. Internal control over financial reporting is a process to provide reasonable assurance regarding the reliability of financial reporting for external purposes in accordance with the United States generally accepted accounting principles (“US GAAP”). Because of its inherent limitations, internal control over financial reporting is not intended to provide absolute assurance that we would prevent or detect a misstatement of our financial statements or fraud. Any failure to maintain an effective system of internal control over financial reporting could limit our ability to report our financial results accurately and timely or to detect and prevent fraud. The identification of a material weakness could indicate a lack of controls adequate to generate accurate financial statements that, in turn, could cause a loss of investor confidence and decline in the market price of our common stock.
Our current insurance programs expose us to unexpected costs, which could have a material adverse effect on our financial condition and results of operations.
Our insurance coverage is structured to include deductibles, self-insured retentions, limits of liability, stop loss limits and similar provisions that we believe prudent based on our operations. However, there are types of losses we may incur against which we cannot be insured or which we believe are not economically reasonable to insure or where the risk is considered low, such as losses due to acts of terrorism and some natural disasters, including floods. If we incur such losses, our business could suffer. In addition, we self-insure a significant portion of expected losses under our workers’ compensation, general liability and group health insurance programs. Unanticipated changes in the actuarial assumptions and management estimates underlying our reserves for these losses, including unexpected increases in medical and indemnity costs, could result in materially different amounts of expense than expected under these programs.
Our annual and quarterly operating results may fluctuate significantly and could fall below the expectations of investors and securities analysts due to a number of factors, some of which are beyond our control, resulting either in volatility or a decline in the price of our securities.
Our quarterly operating results may fluctuate as a result of any number of factors in or outside of our control. Our business is also subject to seasonal fluctuations. Accordingly, results for any one quarter are not necessarily indicative of results to be expected for any other quarter or for any fiscal year. If our annual or quarterly operating results fall below the expectations of securities analysts and investors due to the factors discussed above, this could result in the price of our securities fluctuating dramatically over time or could decrease generally.
Our actual operating and financial results in any given period may differ from guidance we provide to the public, including our most recent public guidance.
From time to time, in press releases, SEC filings, public conference calls and other contexts, we have provided guidance to the public regarding current business conditions and our expectations for our future financial results. We expect that we will provide guidance periodically in the future. Our guidance is based upon a number of assumptions, expectations and estimates that are inherently subject to significant business, economic and competitive uncertainties and contingencies, many of which are beyond our control. In providing our guidance, we also make various assumptions with respect to our future business decisions, some of which will change. Our actual financial results, therefore, may vary from our guidance due to our inability to meet the assumptions upon which our guidance is based and the impact on our business of the various risks and uncertainties described in these risk factors and in our public filings with the SEC. Variances between our actual results and our guidance may be material. To the extent that our actual financial results do not meet or exceed our guidance, the trading prices of our
18
securities may be materially adversely affected, and we may suffer associated costs related to the matter, such as legal costs associated with any claims.
Many factors, including those over which we have no control, affect the trading price of our stock.
A number of factors may significantly affect the market price of our common stock. These include, but are not limited to: actual or anticipated variations in our operating results or those of our competitors as compared to analyst expectations; changes in financial estimates by research analysts with respect to us or others in our industry; announcements of significant transactions (including mergers or acquisitions, divestitures, joint ventures or other strategic initiatives) by us or others in our industry; and actions by activist shareholders. In addition, the equity markets have experienced price and volume fluctuations that affect the stock price of companies in ways that have been unrelated to an individual company’s operating performance. The price of our common stock may continue to be volatile, based on factors specific to our company and industry, as well as factors related to the equity markets overall.
In addition to investor expectations about our prospects, trading activity in our common stock can reflect the portfolio strategies and investment allocation changes of institutional holders, as well as non-operating initiatives such as share repurchase programs. Any failure to meet market expectations for our financial performance, particularly with respect to revenues, operating margins and earnings per share, would likely cause our stock price to decline.
Our dividend program, as well as stock repurchase program (if any), requires the use of a substantial amount of our free cash flow. Assuming the authorization of either program by our Board of Directors, our ability to pay dividends over time, or repurchase stock from time to time, will depend on our ability to generate sufficient cash flows from operations and capacity to borrow funds, which may be subject to economic, financial, competitive and other factors that are beyond our control. Any failure to pay our dividends over time may negatively impact investor confidence in us, and may negatively impact our stock price.
New laws or regulations or changes in existing laws or regulations could adversely affect our business.
The food industry is subject to a variety of federal, state, local, and foreign laws and regulations, including those related to food safety, food labeling, and environmental matters. Governmental regulations also affect taxes and levies, healthcare costs, energy usage, international trade, immigration, and other labor issues, all of which may have a direct or indirect effect on our business or those of our customers or suppliers. The impact of current laws and regulations, the effect of future changes in laws or regulations that impose additional requirements and the consequences of litigation relating to current or future laws and regulations could increase our compliance and other costs of doing business and therefore have an adverse effect on our results of operations. Failure to comply with the laws and regulatory requirements of federal, state and local authorities could result in, among other things, revocation of required licenses, administrative enforcement actions, fines and civil and criminal liability. Compliance with these laws and regulations can be costly and can increase our exposure to litigation or governmental investigations or proceedings. Also, the failure to obtain and maintain required licenses, permits and approvals could adversely affect our operating results.
Increased government regulations to limit carbon dioxide and other greenhouse gas emissions as a result of concern over climate change may result in increased compliance costs, capital expenditures, and other financial obligations for us. We use natural gas, diesel fuel, and electricity in the manufacturing and distribution of our products. Legislation or regulation affecting these inputs could materially affect our profitability. In addition, climate change could affect our ability to procure needed commodities at costs and in quantities we currently experience, and may require us to make additional unplanned capital expenditures.
Healthcare reform legislation could adversely affect our results of operations.
The Patient Protection and Affordable Care Act, as amended by the Health Care and Education Reconciliation Act of 2010 (collectively, the “Health Reform Law”) serves as the primary vehicle for comprehensive healthcare reform in the United States. Among other things, the Health Reform Law contains provisions that affect employer-sponsored health plans and impose excise and other taxes and fees with respect to certain plans. We anticipate increased expenses relating to our and our company-sponsored plans over the course of the next several years. If we are not able to limit or offset future cost increases, those costs could have an adverse effect on our results of operations. The 2016 U.S. elections, which resulted in the election of a Republican president and Republican control of both houses of Congress, may lead to the repeal of the Health Reform Law or significant changes to the Health Reform Law, its implementation or its interpretation. We are unable to predict whether, when, and how the Health Reform Law will be changed, what alternative provisions, if any, will be enacted, the timing of enactment and implementation of alternative provisions, or the impact of alternative provisions on our results of operations.
19
Litigation, legal or administrative proceedings could have an adverse impact on our business, financial condition and damage our reputation.
We are party to a variety of legal claims and proceedings in the ordinary course of business, such as employee claims based on, among other things, discrimination, harassment, wage and hour disputes or wrongful termination. Since litigation is inherently uncertain, there is no guarantee that we will be successful in defending ourselves against such claims or proceedings, or that management’s assessment of the materiality or immateriality of these matters, including any reserves taken in connection with such matters, will be consistent with the ultimate outcome of such claims or proceedings. In the event that management’s assessment of the materiality or immateriality of current claims and proceedings proves inaccurate, or litigation that is material arises in the future, there may be a material adverse effect on our financial condition. Any adverse publicity resulting from allegations made in litigation claims or legal or administrative proceedings (even if untrue) may also adversely affect our reputation. These factors and others could have an adverse impact on our business, financial condition or damage our reputation.
Our Certificate of Incorporation and Bylaws, as well as Delaware law, may discourage potential acquirers of the Company.
Provisions of our Certificate of Incorporation and Bylaws may have the effect of discouraging, delaying or preventing a merger, tender offer or proxy contest, which could have an adverse effect on the market price of our common stock. In addition, certain provisions of Delaware law could also delay or make more difficult a merger, tender offer or proxy contest involving our Company. This includes Section 203 of the Delaware General Corporation Law, which prohibits a Delaware corporation from engaging in any business combination with any “interested shareholder” (as defined in the statute) for a period of three years unless certain conditions are met. These provisions, either alone or in combination with each other, give our current directors and executive officers a substantial ability to influence the outcome of a proposed acquisition of the Company. These provisions would apply even if an acquisition, or other significant corporate transaction, was considered beneficial by some of our shareholders. If a change in control or change in management is delayed or prevented by these provisions, the market price of our securities could decline.
ITEM 1B. UNRESOLVED STAFF COMMENTS
None.
ITEM 2. PROPERTIES
The following provides a brief summary of the location and general character of our principal plants and other physical properties as of April 28, 2017.
Our corporate headquarters is located at 8111 Smith’s Mill Road, New Albany, Ohio. The property was sold to the Buyer on April 28, 2017, as part of the sale of our Restaurants Business. We will remain in this location as part of a cost-sharing arrangement under the TSA executed as part of the transaction.
We also own a 30-acre property in Richardson, Texas, that is currently classified as held for sale.
As of April 28, 2017, we produced food products in four manufacturing facilities. We produce fresh sausage products at our plants located in Hillsdale, Michigan, and Xenia, Ohio. Our Sulphur Springs, Texas, plant produces ready-to-eat products, such as sandwiches, soups and gravies. We operate a 100,000 square foot food production facility in Lima, Ohio that produces refrigerated mashed potatoes and other potato-based side-dishes, macaroni and cheese and other pasta side-dishes. In fiscal 2017 we completed the process of constructing an additional production line at the facility which added an additional 45 million pounds of mashed potato production capacity.
We own the Hillsdale, Michigan and Xenia, Ohio properties. Subsequent to the sale-leaseback transaction completed in the second quarter of fiscal 2016, we lease the Sulphur Springs, Texas and Lima, Ohio production facilities. We also lease various other locations throughout our BEF Foods marketing territory, which serve as regional and divisional sales offices.
On May 1, 2017, we completed the acquisition of PFPC, which included a 125,000 square foot production facility and office in Mars Hill, Maine, a 900-acre potato farm in St. Agatha, Maine, and a 20 million pound potato store house in Westfield, Maine. We believe our facilities have adequate capacity in the near-term with our recent acquisition and capital additions, to position the Company for profitable sales growth.
20
ITEM 3. LEGAL PROCEEDINGS.
We are from time-to-time involved in ordinary and routine litigation, typically involving claims from customers, employees and others related to operational issues common to the restaurant and food manufacturing industries, and incidental to our business. Management presently believes that the ultimate outcome of these proceedings, individually or in the aggregate, will not have a material adverse effect on our financial position, cash flows or results of operations.
ITEM 4. MINE SAFETY DISCLOSURES.
Not applicable.
SUPPLEMENTAL ITEM. EXECUTIVE OFFICERS OF BOB EVANS FARMS, INC.
The following table sets forth certain information for the “executive officers” of Bob Evans Farms, Inc. for the past five years as of June 15, 2017. The following “executive officers” are the Company's “Section 16 officers,” both as defined pursuant to the Securities Exchange of 1934, as of such date.
Name | Age | Years of Service as Officer | Background | |||||
T. Alan Ashworth | 57 | 5 | Senior Vice President, Corporate Development and Finance, and Treasurer of Bob Evans Farms, Inc. since July 2015; Vice President, Corporate Development and Finance, and Treasurer of Bob Evans Farms, Inc. from June 2014 to July 2015; Chief Financial Officer (Interim) of Bob Evans Farms, Inc. from May 2014 to June 2014; Vice President, Corporate Development and Finance of Bob Evans Farms, Inc. from August 2012 to June 2014; Senior Director, Finance of Bob Evans Farms, Inc. from December 2011 to August 2012; Vice President, Finance, Convergys Corporation from 2008 to 2011. | |||||
Douglas N. Benham | 60 | 1 | Executive Chair of Bob Evans Farms, Inc. since January 2016; Executive Chair (chief executive officer) of Bob Evans Farms, Inc. from August 2015 to December 2015; President and Chief Executive Officer of DNB Advisors, LLC, since 2006. | |||||
Terrance R. Camp | 58 | Less than 1 | Senior Vice President of Operations, Bob Evans Farms, Inc. since May 2015; Vice President of Operations, Bob Evans Farms, Inc. May 2013 to May 2015; Senior Director of Operations, Bob Evans Farms, Inc. May 2011 to May 2013; Director of Operations, Bob Evans Farms, Inc. May 2006 to May 2011. | |||||
Colin M. Daly | 45 | 5 | Executive Vice President, General Counsel and Corporate Secretary of Bob Evans Farms, Inc. since December 2014; Senior Vice President, General Counsel and Corporate Secretary of Bob Evans Farms, Inc. from May 2012 to December 2014; General Counsel of O’Charley’s Inc. from February 2008 to May 2012; Secretary of O’Charley’s Inc. from March 2009 to May 2012. | |||||
Richard D. Hall | 61 | 21 | Executive Vice President, Supply Chain Management of Bob Evans Farms, Inc. since September 2008. | |||||
Mark E. Hood | 64 | 3 | Chief Financial and Administrative Officer of Bob Evans Farms, Inc., since September 2015; Member, Chief Executive Officer’s Office of Bob Evans Farms, Inc. from December 2014 to August 2015; Chief Financial Officer of Bob Evans Farms, Inc. since June 2014; Consultant from July 2012 to June 2014; Senior Vice President and Chief Financial Officer, Caleres Inc., (formerly Brown Shoe Company, Inc.) from 2006 to 2012. | |||||
Christopher J. Lambrix | 49 | Less than 1 | Senior Vice President of Retail Development, Bob Evans Farms, Inc. since June 2011; Principal, A.T. Kearney Consumer Industries and Retail Practice, May 2008 to May 2011; Vice President of Retail Price and Promotion, Sara Lee, August 2006 to August 2008. | |||||
J. Michael Townsley | 58 | 14 | President and Chief Executive Officer of Bob Evans Farms, Inc. since April 2017; President, BEF Foods, Inc. from June 2008 to March 2017; Member, Chief Executive Officer’s Office of Bob Evans Farms, Inc. from December 2014 to August 2015. | |||||
21
PART II
ITEM 5. MARKET FOR REGISTRANT’S COMMON EQUITY, RELATED STOCKHOLDER MATTERS AND ISSUER REPURCHASES OF EQUITY SECURITIES
Market Information, Holders of Common Equity and Dividends
The information required by Item 201(a) through (c) of Regulation S-K is incorporated herein by reference to Note 11 — Quarterly Financial Data (Unaudited) to our consolidated financial statements, which are included in Item 8 of this Annual Report on Form 10-K.
Comparison of Five-Year Cumulative Total Return
The following line graph compares the yearly percentage change in our cumulative total stockholder return on our common stock over our preceding five fiscal years against the cumulative total return of the Standard & Poor’s 500 Stock Index (“S&P 500”) and two peer groups, the peer group we have historically used ("Old peer group") and a new peer group we have started using this year following the sale of the Restaurants Business ("New peer group").
Our Old peer group is comprised of restaurant companies listed on The NASDAQ Stock Market (weighted 70 percent) and a group of meat producers listed on either The NASDAQ Stock Market or the New York Stock Exchange (weighted 30 percent) whose attributes closely aligned with our company prior to the sale of our Restaurants Business. Our New peer group is comprised exclusively of select small and mid-cap food and beverage manufacturing companies listed on the NASDAQ or New York Stock Exchange.
We measure cumulative stockholder return by dividing (a) the sum of (i) the cumulative amount of dividends for the measurement period, assuming dividend reinvestment, and (ii) the difference between the price of our common stock at the end and the beginning of the measurement period by (b) the price of our common stock at the beginning of the measurement period.
The subsequent performance graph is being furnished as part of this Annual Report on Form 10-K solely in accordance with the requirement under Rule 14a-3(b)(9) to furnish our stockholders with such information, and therefore, shall not be deemed to be filed or incorporated by reference into any filings by the Company under the Securities Act or the Exchange Act.
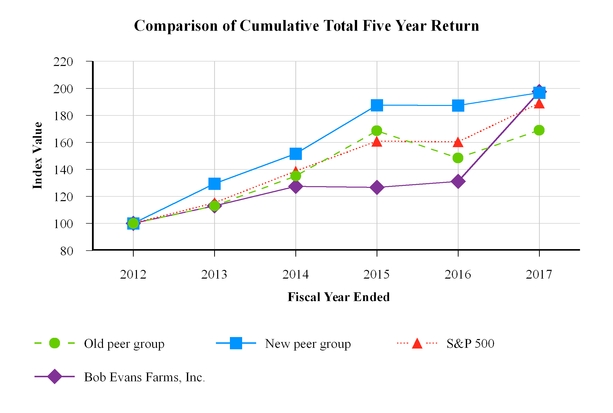
22
CUMULATIVE VALUE OF $100 INVESTMENT
2012 | 2013 | 2014 | 2015 | 2016 | 2017 | |||||||||||||
Old Peer Group (1) | $ | 100.00 | $ | 113.03 | $ | 135.10 | $ | 168.55 | $ | 148.40 | $ | 168.97 | ||||||
New Peer group (2) | $ | 100.00 | $ | 129.45 | $ | 151.64 | $ | 187.61 | $ | 187.37 | $ | 196.71 | ||||||
S&P 500 | $ | 100.00 | $ | 115.32 | $ | 138.69 | $ | 160.85 | $ | 160.35 | $ | 189.08 | ||||||
Bob Evans Farms, Inc. | $ | 100.00 | $ | 113.06 | $ | 127.48 | $ | 126.64 | $ | 131.11 | $ | 197.57 | ||||||
(1) The old peer group includes the following companies: B&G Foods Inc., Biglari Holdings Inc., BJ's Restaurants, Inc., Bloomin' Brands, Inc., Brinker International, Inc., Buffalo Wild Wings Inc., Chipotle Mexican Grill, Inc., Cracker Barrel Old Country Store, Inc., Denny's Corporation, DineEquity, Inc., Flowers Foods, Inc., Panera Bread Co., Popeyes Louisiana Kitchen, Inc. (formerly known as AFC Enterprises), Red Robin Gourmet Burgers Inc., Ruby Tuesday, Inc., Sanderson Farms, Inc., Seneca Foods Corp., Snyder's Lance, Inc., Texas Roadhouse, Inc., The Cheesecake Factory Inc., The Hain Celestial Group, Inc., The Wendy's Company and Treehouse Foods, Inc.
(2) The new peer group includes the following companies: Amplify Snack Brands, Inc., B&G Foods Inc., Blue Buffalo Pet Products, Inc., Calavo Growers, Inc., Farmer Bros. Co., Hostess Brands, Inc., J&J Snack Foods Corp., John B. Sanfilippo & Son, Inc., Lamb Weston Holdings, Inc., Lancaster Colony Corporation, Landec Corporation, Snyder's-Lance, Inc., The Hain Celestial Group, Inc. and Tootsie Roll Industries, Inc.
Issuer Repurchases of Equity Securities
On November 19, 2015, the Board of Directors increased the authorization under its stock repurchase program to $250.0 million. The program authorizes the Company to repurchase its outstanding common stock pursuant to plans approved by the Board under SEC Rules 10b-18 and 10b5-1, and in the open market or through privately negotiated transactions. In fiscal 2016 we repurchased approximately 3.9 million shares for $171.5 million. We did not repurchase any shares in fiscal 2017. On January 24, 2017, the Board of Directors increased the Company’s existing share repurchase authorization, which extends through December 31, 2017, to $100.0 million.
23
ITEM 6. SELECTED FINANCIAL DATA
Consolidated Financial Review
Bob Evans Farms, Inc. and Subsidiaries
(in thousands, except per share, shareholder and employee amounts) | 2017 | 2016 | 2015 | 2014 | 2013 | ||||||||||||||
Operating Results | |||||||||||||||||||
Net Sales from Continuing Operations | $ | 394,842 | $ | 387,616 | $ | 379,313 | $ | 371,973 | $ | 348,808 | |||||||||
Operating Income (Loss) from Continuing Operations | $ | 30,126 | $ | 33,074 | $ | (5,357 | ) | $ | (10,290 | ) | $ | (2,402 | ) | ||||||
Income (Loss) from Continuing Operations before Income Taxes | $ | 20,910 | $ | 22,647 | $ | (14,006 | ) | $ | (12,304 | ) | $ | (13,887 | ) | ||||||
Provision (Benefit) for Income Taxes from Continuing Operations | $ | 3,874 | $ | 6,439 | $ | (8,626 | ) | $ | (12,678 | ) | $ | (5,235 | ) | ||||||
Income from Continuing Operations | $ | 17,036 | $ | 16,208 | $ | (5,380 | ) | $ | 374 | $ | (8,651 | ) | |||||||
Income from Discontinued Operations, Net of Income Taxes | $ | 109,431 | $ | 8,014 | $ | 21,933 | $ | 33,311 | $ | 7,830 | |||||||||
Net Income | $ | 126,467 | $ | 24,222 | $ | 16,553 | $ | 33,685 | $ | (821 | ) | ||||||||
Earnings Per Share - Income from Continuing Operations | |||||||||||||||||||
Basic | $ | 0.86 | $ | 0.76 | $ | (0.23 | ) | $ | 0.01 | $ | (0.31 | ) | |||||||
Diluted | $ | 0.85 | $ | 0.75 | $ | (0.23 | ) | $ | 0.01 | $ | (0.30 | ) | |||||||
Earnings Per Share - Income from Discontinued Operations | |||||||||||||||||||
Basic | $ | 5.51 | $ | 0.38 | $ | 0.93 | $ | 1.26 | $ | 0.28 | |||||||||
Diluted | $ | 5.43 | $ | 0.38 | $ | 0.93 | $ | 1.25 | $ | 0.27 | |||||||||
Earnings Per Share - Net Income | |||||||||||||||||||
Basic | $ | 6.37 | $ | 1.14 | $ | 0.70 | $ | 1.27 | $ | (0.03 | ) | ||||||||
Diluted | $ | 6.28 | $ | 1.13 | $ | 0.70 | $ | 1.26 | $ | (0.03 | ) | ||||||||
EBITDA from continuing operations (1) | $ | 76,682 | $ | 57,076 | $ | 17,368 | $ | 12,398 | $ | 15,687 | |||||||||
Financial Position | |||||||||||||||||||
Working capital | $ | 176,305 | $ | (57,819 | ) | $ | (45,014 | ) | $ | (486,499 | ) | $ | (190,426 | ) | |||||
Property, plant and equipment — net (2) | $ | 134,074 | $ | 629,280 | $ | 853,721 | $ | 878,482 | $ | 797,272 | |||||||||
Total indebtedness | $ | 2,695 | $ | 339,057 | $ | 451,085 | $ | 459,733 | $ | 202,249 | |||||||||
Stockholders’ Equity | $ | 331,648 | $ | 216,444 | $ | 379,991 | $ | 389,219 | $ | 594,775 | |||||||||
Supplemental Information for the Year | |||||||||||||||||||
Capital expenditures | $ | 65,768 | $ | 65,694 | $ | 74,517 | $ | 190,995 | $ | 118,200 | |||||||||
Depreciation and amortization from continuing operations | $ | 24,031 | $ | 21,044 | $ | 18,364 | $ | 15,790 | $ | 13,776 | |||||||||
Weighted-average shares outstanding: | |||||||||||||||||||
Basic | 19,839 | 21,336 | 23,489 | 26,450 | 28,066 | ||||||||||||||
Diluted | 20,132 | 21,494 | 23,649 | 26,704 | 28,488 | ||||||||||||||
Cash dividends per share | $ | 1.360 | $ | 1.300 | $ | 1.240 | $ | 1.205 | $ | 1.075 | |||||||||
Common stock market closing prices: | |||||||||||||||||||
High | $ | 67.25 | $ | 51.88 | $ | 59.64 | $ | 58.86 | $ | 45.36 | |||||||||
Low | $ | 35.67 | $ | 37.51 | $ | 42.70 | $ | 42.60 | $ | 34.45 | |||||||||
Supplemental Information at Year-End | |||||||||||||||||||
Employees | 1,021 | 30,625 | 32,341 | 34,470 | 34,023 | ||||||||||||||
Registered stockholders | 14,744 | 15,719 | 16,578 | 17,689 | 18,927 | ||||||||||||||
Market price per share at closing | $ | 66.74 | $ | 45.54 | $ | 45.29 | $ | 46.80 | $ | 42.52 | |||||||||
Book value per share | $ | 16.75 | $ | 10.96 | $ | 16.23 | $ | 16.69 | $ | 21.68 | |||||||||
(1) | Numbers represent earnings before interest, taxes, depreciation and amortization including any stock compensation expense from continuing operations. |
(2) | On the April 29, 2016, Consolidated Balance Sheet, property, plant and equipment associated with our Restaurants Business was classified as assets held for sale. See Note 2 for additional information. |
24
On April 28, 2017, the Company completed the sale of Bob Evans Restaurants. In fiscal 2017, we adjusted our consolidated financial statements to reflect the Restaurants Business as a discontinued operation for that year and all prior periods presented. The selected financial data for fiscal 2017 and prior years reflect the Restaurants Business as a discontinued operation. Refer to the "Strategic Transactions" section in Management’s Discussion and Analysis of Financial Condition and Results of Operations for additional information regarding the sale of the Restaurants Business as well as Note 2 to the Consolidated Financial Statements.
In fiscal 2014 we adjusted our consolidated financial statements to reflect the Mimi's Café operations as a discontinued operation for that year and all prior periods presented. The selected financial data for fiscal 2014 and prior years also reflects Mimi's Café as a discontinued operation.
25
ITEM 7. MANAGEMENT’S DISCUSSION AND ANALYSIS OF FINANCIAL CONDITION AND RESULTS OF OPERATIONS
General Overview
In this Management’s Discussion and Analysis of Financial Condition and Results of Operations (“MD&A”), we use the terms “Bob Evans,” “Company,” “we,” “us” and “our” to collectively refer to Bob Evans Farms, Inc., a Delaware corporation, and its subsidiaries. This MD&A may contain forward-looking statements that set forth our expectations and anticipated results based on management’s plans and assumptions. These statements are often indicated by words such as “expects,” “anticipates,” “believes,” “estimates,” “intends” and “plans.” Actual results may differ materially from those predicted by the forward-looking statements because of various factors and possible events, including the assumptions, risks and uncertainties discussed herein. For more information, see "Forward Looking Statements" in this Annual Report on Form 10-K.
We produce and distribute a variety of complementary home-style, refrigerated side-dish convenience food items and pork sausage under the Bob Evans, Owens and Country Creek brand names. These food products are available throughout the United States. We also manufacture and sell similar products to foodservice accounts, including Bob Evans Restaurants and other restaurants.
We have a 52 or 53-week fiscal year that ends on the last Friday in April. When we refer to 2017, 2016, and 2015, or fiscal 2017, fiscal 2016 and fiscal 2015, we are referring to our fiscal years that ended on April 28, 2017, April 29, 2016, and April 24, 2015, respectively. Our fiscal 2016 year that ended on April 29, 2016, was a 53-week fiscal year. Other years presented are comprised of 52 weeks.
Strategic Transactions
Sale of Bob Evans Restaurants Business
On January 24, 2017, the Company entered into the BER Sale Agreement with the Buyer. On April 28, 2017, the Buyer completed the acquisition of the Restaurants Business, including our corporate headquarters, for an aggregate purchase price of $565.0 million in cash, subject to certain adjustments set forth in the BER Sale Agreement (the “Restaurants Transaction”).
The Restaurants Transaction was effected by (i) the sale of the Restaurants Business assets by the Company’s affiliates to Buyer and (ii) the sale by the Company of fifty percent of the equity interests in a newly formed special purpose entity that holds specified intellectual property assets used by both the Restaurants Business and the Company. As part of the Restaurants Transaction, the Company also conveyed to the Buyer the majority of working capital liabilities associated with the Restaurants Business, including outstanding payables, accrued wages, and other accrued current liabilities.
After adjusting for items set forth in the BER Sale Agreement, we received net proceeds of $539.3 million from the Buyer, and we expect net proceeds after tax payments of $487.0 to $493.0 million. We used a portion of the proceeds to repay all outstanding borrowings under our Credit Agreement on April 28, 2017. Furthermore, on May 1, 2017, our Board of Directors declared a special dividend of $7.50 per share, representing the majority of net cash proceeds from the Restaurants Transaction after income tax payments and the settlement of outstanding borrowings under our Credit Agreement. The dividend will be paid on June 16, 2017, to shareholders of record on May 30, 2017.
Acquisition of Pineland Farms Potato Company, Inc.
On January 24, 2017, the Company’s subsidiary BEF Foods, Inc. (“BEF Foods”) entered into a Stock Purchase Agreement (the “PFPC Agreement”) with Pineland Farms Potato Company, Inc., a Maine corporation (“PFPC”), the stockholders of PFPC party thereto (collectively, the “Sellers”), and Libra Foundation, as the Sellers’ Representative, and, solely for the purposes of guaranteeing the payment and performance obligations of BEF Foods thereunder, the Company. The transaction closed on May 1, 2017. Pursuant to the terms of the PFPC Agreement, BEF Foods has purchased and acquired from the Sellers all of the equity interests of PFPC outstanding immediately prior to the closing (the “Acquisition”), in exchange for (i) $115.0 million in cash at closing and up to an additional $25.0 million in cash as potential earn-out consideration, the payment of which is subject to the achievement of certain operating EBITDA performance milestones over consecutive twelve-month periods during the 24 months following the closing.
The Acquisition increases our side-dish production capacity and provides us the capability to produce and sell diced and shredded potato products in both the retail and food-service channels. The acquisition also diversifies our production capability by adding a second state-of-the-art potato processing facility with approximately 180 million pounds of capacity, 50 million pounds of which came online in April 2017. PFPC also owns and operates a 900-acre potato farm and is surrounded by an estimated 55,000 acres of annual potato production. The production facility's close proximity to tens of thousands of acres of potato production is anticipated to reduce transportation costs. The Acquisition mitigates the required near term capital spending for additional capacity to meet our expected sales growth targets in side-dish products.
26
Prior to the decision to sell our Restaurants Business, we had two reporting segments, Bob Evans Restaurants and BEF Foods. BEF Foods sells food products throughout the retail grocery and food service channels, including to Bob Evans Restaurants. Corporate and other costs related to shared services functions were not allocated to our reporting segments. As a result of selling our Restaurants Business, which is now classified as discontinued operations, we have one reporting segment. Revenues and costs related to our remaining BEF Foods business, including indirect corporate overhead costs, are reported within results from continuing operations. All revenues and costs incurred directly in support of the Restaurants Business are presented in results from discontinued operations. Prior year information has been adjusted to conform to current presentation. Unless otherwise stated, the information disclosed in Management's Discussion and Analysis refer to results from continuing operations. See Note 2 to the Consolidated Financial Statements for additional information regarding the sale of our Restaurants Business.
Bob Evans Farms, Inc. Overview from Continuing Operations
Net sales from continuing operations were $394.8 million in fiscal 2017, an increase of $7.2 million as compared to the corresponding period last year. Operating income from continuing operations was $30.1 million in fiscal 2017, a decrease of $3.0 million as compared to the corresponding period last year. Results were favorably impacted by higher sales and improved margins, offset by $6.3 million of accelerated stock compensation expense, $1.9 million of termination benefits and a $15.3 million impairment charge on a note receivable recorded during the year. Additionally, results from continuing operations in fiscal 2016 included net sales of $7.1 million from the 53rd week, which drove operating income of $1.9 million.
Pretax income from continuing operations in fiscal year 2017 was $20.9 million as compared to a $22.6 million in the corresponding period last year. The effective tax rate on income from continuing operations was 18.5% in fiscal 2017 as compared to 28.4% in the corresponding period last year. Earnings per diluted share from continuing operations was $0.85 in fiscal 2017 as compared to $0.75 in the corresponding period last year.
Refer to the sections below for analysis on our fiscal 2017 operating results as compared to fiscal 2016.
Fiscal Year Ended April 28, 2017 (“fiscal 2017” or "2017") as Compared to Fiscal Year Ended April 29, 2016 (“fiscal 2016” or "2016")
The following tables reflect data for fiscal 2017, compared to the prior year. The ratios presented reflect the underlying dollar values expressed as a percentage of the applicable net sales amounts.
Results from Continuing Operations | |||||||||||||
(in thousands) | 2017 | 2016 | |||||||||||
Net Sales | $ | 394,842 | $ | 387,616 | |||||||||
Cost of sales | 170,820 | 43.3 | % | 172,973 | 44.6 | % | |||||||
Operating wage and fringe benefit expenses | 39,964 | 10.1 | % | 42,189 | 10.9 | % | |||||||
Other operating expenses | 58,402 | 14.8 | % | 52,387 | 13.5 | % | |||||||
Selling, general and administrative expenses | 56,243 | 14.2 | % | 65,949 | 17.1 | % | |||||||
Depreciation and amortization expense | 24,031 | 6.1 | % | 21,044 | 5.4 | % | |||||||
Impairments | 15,256 | 3.9 | % | — | — | ||||||||
Operating Income | $ | 30,126 | 7.6 | % | $ | 33,074 | 8.5 | % | |||||
Sales
Net sales increased 1.9%, to $394.8 million, in fiscal 2017, compared to $387.6 million last year. Total pounds sold increased by 5.0%, including a 10.7% increase in refrigerated side-dish products and a 4.0% increase in sausage products. The increase in pounds sold was partially offset by a 3.4% decline in average net selling price per pound, driven by an increased sales mix of lower-priced, although higher-margin side-dish products, as well as reduced net sausage pricing through increased trade spending.
27
The following table summarizes pounds sold by category in fiscal 2017 and the corresponding period last year:
(in thousands) | 2017 | 2016 | |||||||||
Category | |||||||||||
Refrigerated Sides | 132,089 | 57.3 | % | 119,328 | 54.4 | % | |||||
Sausage | 57,081 | 24.7 | % | 54,864 | 25.0 | % | |||||
Food Service | 27,135 | 11.8 | % | 27,940 | 12.7 | % | |||||
Frozen | 8,021 | 3.5 | % | 9,318 | 4.3 | % | |||||
Other | 6,190 | 2.7 | % | 7,997 | 3.6 | % | |||||
Total | 230,516 | 219,447 | |||||||||
Cost of Sales
Cost of sales from continuing operations was $170.8 million, or 43.3% of net sales fiscal 2017, compared to $173.0 million, or 44.6% of net sales, last year. The 130 bps decrease in cost of sales as a percentage of net sales was primarily driven by a 100 bps impact of lower sow costs and an 80 bps impact from the increase in sales mix of higher margin refrigerated side-dish products, partially offset by increased trade spend and unfavorable plant operating variances associated with a new production line in our Lima, Ohio plant. Sow costs averaged $40.47 per hundredweight in fiscal 2017, compared to $44.31 per hundredweight last year.
Operating Wage and Fringe Benefit Expenses
Operating wage and fringe benefit expenses ("operating wages") from continuing operations were $40.0 million, or 10.1% of net sales, in fiscal 2017, compared to $42.2 million, or 10.9% of net sales, last year. The 80 bps decrease in the operating wages ratio was driven primarily by improved production wages due to plant operating efficiencies as well as lower benefit costs including workers compensation.
Other Operating Expenses
Other operating expenses from continuing operations were $58.4 million, or 14.8% of net sales, in fiscal 2017, compared to $52.4 million, or 13.5% of net sales, last year. The most significant components of other operating expenses are shipping and handling costs, advertising costs, warehousing and distribution costs, utilities and production supplies. The 130 bps increase in operating expenses as a percentage of net sales was primarily driven by a $2.3 million incremental investment in advertising costs to support and promote our brand and $1.9 million of higher rent expense associated with the sale leaseback of two of our production facilities in the second quarter of fiscal 2016. Other operating expenses were also impacted by $1.8 million of higher shipping and handling costs, utilities, production costs and other costs associated with increased production volumes.
Selling, General and Administrative Expenses
S,G&A expenses include costs of our sales organization, executive leadership, and corporate functions including information technology, finance, legal, human resources, supply chain and other corporate functions and includes costs such as ongoing IT infrastructure costs, third-party legal and professional fees and other costs. S,G&A expenses incurred directly in support of the Restaurants Business, including wage and benefit costs of corporate employees who transferred with the Restaurants Business and legal and professional fees incurred and associated with the Restaurants Transaction are included in results from discontinued operations.
S,G&A expenses from continuing operations were $56.2 million, or 14.2% of net sales, in fiscal 2017, compared to $65.9 million, or 17.1% of net sales, last year. The 290 bps decrease in S,G&A costs was driven by $6.3 million of lower legal and professional fees, which includes a $2.2 million reduction in costs associated with the settlement of litigation, $3.4 million of costs incurred in the second quarter of fiscal 2016 related to the sale leaseback of two of our production facilities and $6.4 million of lower other costs, including wages and benefits associated with headcount reductions that occurred in the prior year. These savings were partially offset by $6.4 million of severance and benefit costs associated with headcount reductions in the third quarter of fiscal 2017 and the vesting of all employee stock awards in the fourth quarter of fiscal 2017, which was the result of a decision to fully vest all outstanding and unvested employee stock awards on the closing date of the Restaurants Transaction. S,G&A costs include $31.0 million of costs related to shared services that were historically classified as corporate and other costs and were not allocated to our reporting segments. $8.8 million of those costs relate to wages and benefits of terminated associates that will no longer be in the Company's expense base in fiscal 2018.
28
Depreciation and Amortization
Depreciation and amortization expenses from continuing operations were $24.0 million, or 6.1% of net sales, in fiscal 2017, compared to $21.0 million, or 5.4% of net sales, last year. The increase is primarily driven by depreciation and amortization related to the implementation of the second phase of our ERP system which went live during the second quarter of fiscal 2017, as well as an expansion of production capacity at our Lima, Ohio facility.
Impairments
Impairments from continuing operations were $15.3 million in fiscal 2017, related to a note receivable that was settled in the third quarter. See Note 1 to the Consolidated Financial Statements for additional information.
Interest
Net interest expense from continuing operations was $9.2 million in fiscal 2017, as compared to $10.4 million last year. The decrease is primarily due to higher average borrowings on our Credit Agreement during fiscal 2016 as compared to the current year, partially offset by $2.0 million of accelerated debt amortization costs recorded in the fourth quarter of fiscal 2017 when we paid off all outstanding borrowings and terminated our revolving Credit Agreement. See Note 3 to the Consolidated Financial Statements for additional information.
Income Taxes
The provision for income taxes is based on our current estimate of the annual effective income tax rate adjusted to reflect the impact of discrete items. The Company’s effective income tax rate on continuing operations was a provision of 18.5% in fiscal 2017, as compared to 28.4%, in the corresponding period a year ago. The effective income tax rates in fiscal 2017 and 2016 were substantially different than the statutory rate due to the impact of officer’s life insurance and discrete items. In both fiscal 2017 and 2016, the effective tax rate was significantly impacted by the effect of permanent items on pretax earnings.
Results from Discontinued Operations
Results associated with the Restaurants Business are classified as income from discontinued operations, net of taxes, in our Consolidated Statements of Net Income. Prior year results have been adjusted to conform to current presentation. Below is a summary of results from discontinued operations in fiscal 2017 as compared to fiscal 2016.
Results from Discontinued Operations | |||||||
(in thousands) | 2017 | 2016 | |||||
Income from discontinued operations before gain on sale of the Restaurants Business | $ | 16,785 | $ | 2,774 | |||
Gain on sale of the Restaurants Business | 150,167 | — | |||||
Income from discontinued operations before income taxes | 166,952 | 2,774 | |||||
Provision (benefit) for income taxes | 57,521 | (5,240 | ) | ||||
Income from discontinued operations | $ | 109,431 | $ | 8,014 | |||
Pretax income from discontinued operations was impacted by the $150.2 million pretax gain, net of transaction costs, recorded on the sale of our Restaurants Business. Results were also favorably impacted by $22.5 million of lower depreciation and amortization costs. The Restaurants Business depreciation base lowered considerably after the closing of the sale leaseback of 143 restaurant properties in the four quarter of fiscal 2016. Additionally, no depreciation was recorded on assets sold in the Restaurants Transaction subsequent to those assets meeting the criteria for held-for-sale classification in the third quarter of fiscal 2017. Results from discontinued operations were negatively impacted by a 3.2% reduction in restaurant same store sales as compared to the prior year, as well as $6.9 million of accelerated stock compensation expense and $3.9 million of severance costs associated with employees who supported the Restaurants Business. Additionally, results from discontinued operations in fiscal 2016 were favorably impacted by $1.8 million of pretax income due to the 53rd week. The change in tax rates as compared to the prior year is driven primarily by the increase in pretax income, as well as the impact of tax credits related to hiring and tip wages. See Note 2 to the Consolidated Financial Statements for additional information regarding the sale of our Restaurants Business.
29
Fiscal Year Ended April 29, 2016 (“fiscal 2016” or "2016") as Compared to Fiscal Year Ended April 24, 2015 (“fiscal 2015” or "2015")
Net sales from continuing operations were $387.6 million in fiscal 2016, an increase of $8.3 million compared to fiscal 2015. Operating income from continuing operations was $33.1 million in fiscal 2016, an increase of $38.4 million as compared to the corresponding period the year before. The increase in operating income was driven by higher sales, lower costs of sales and an impairment charge recorded in fiscal 2015.
Pretax income from continuing operations was $22.6 million in fiscal 2016 as compared to a pretax loss of $14.0 million in fiscal 2015. Income tax expense from continuing operations was $6.4 million in fiscal 2016 as compared to an income tax benefit of $8.6 million in fiscal 2015. Earnings per diluted share from continuing operations were $0.75 in fiscal 2016 as compared to a loss per diluted share of $0.23 in fiscal 2015.
The following tables reflect data for fiscal 2016, compared to fiscal 2015. The ratios presented reflect the underlying dollar values expressed as a percentage of the applicable net sales amounts.
Results from Continuing Operations | |||||||||||||
(in thousands) | 2016 | 2015 | |||||||||||
Net Sales | $ | 387,616 | $ | 379,313 | |||||||||
Cost of sales | 172,973 | 44.6 | % | 199,067 | 52.5 | % | |||||||
Operating wage and fringe benefit expenses | 42,189 | 10.9 | % | 41,717 | 11.0 | % | |||||||
Other operating expenses | 52,387 | 13.5 | % | 49,381 | 13.0 | % | |||||||
Selling, general and administrative expenses | 65,949 | 17.1 | % | 73,380 | 19.4 | % | |||||||
Depreciation and amortization expense | 21,044 | 5.4 | % | 18,364 | 4.8 | % | |||||||
Impairments | — | — | % | 2,761 | 0.7 | % | |||||||
Operating Income (Loss) | $ | 33,074 | 8.5 | % | $ | (5,357 | ) | (1.4 | )% | ||||
Sales
Net sales from continuing operations increased 2.2%, to $387.6 million, in fiscal 2016, as compared to $379.3 million in fiscal 2015.
Net sales from continuing operations increased by 2.2% due to higher volumes, including a 17.3% increase in refrigerated side-dish products and an 11.8% increase in sausage products, partially offset by a 19.8% decrease in food service. The increase in pounds sold was partially offset by lower net sausage pricing due to a decline in sow costs, and the change in sales mix. Average sow costs were $44.31 in fiscal 2016 as compared to $69.41 in fiscal 2015.
The following table summarizes pounds sold by category in fiscal 2016 as compared to 2015.
(in thousands) | 2016 | 2015 | |||||||||
Category | |||||||||||
Refrigerated Sides | 119,328 | 54.4 | % | 101,746 | 50.0 | % | |||||
Sausage | 54,864 | 25.0 | % | 49,072 | 24.1 | % | |||||
Food Service | 27,940 | 12.7 | % | 34,856 | 17.1 | % | |||||
Frozen | 9,318 | 4.3 | % | 9,946 | 4.9 | % | |||||
Other | 7,997 | 3.6 | % | 7,955 | 3.9 | % | |||||
Total | 219,447 | 203,575 | |||||||||
Cost of Sales
Cost of sales from continuing operations was $173.0 million, or 44.6% of net sales, in fiscal 2016, compared to $199.1 million, or 52.5% of net sales, in fiscal 2015. The decrease in cost of sales as a percentage of sales was driven by an increase in sales of our higher margin refrigerated side-dish products as well as a decrease in cost of sales driven by lower sow costs as compared to the prior year. This favorability was largely offset by an increase in trade spending, primarily on sausage products.
30
Operating Wage and Fringe Benefit Expenses
Operating wage and fringe benefit expenses ("operating wages") from continuing operations was $42.2 million, or 10.9% of net sales, in fiscal 2016, compared to $41.7 million, or 11.0% of net sales, in fiscal 2015. Wages increased $0.5 million due to the 53rd week in fiscal 2016. Excluding the impact of the 53rd week, wages were flat. Higher net benefit costs, including incentive compensation, were incurred primarily due to increased profitability and were partially offset by lower contract labor costs.
Other Operating Expenses
Other operating expenses from continuing operations were $52.4 million, or 13.5% of net sales, in fiscal 2016, compared to $49.4 million, or 13.0% of net sales, in fiscal 2015. The increase was primarily the result of a $3.1 million increase in advertising costs and $2.2 million in rent expense attributable to the two production facilities that were sold and leased back in the second quarter of fiscal 2016. These costs were partially offset by a reduction in transportation costs, driven by lower fuel costs.
Selling, General and Administrative Expenses
S,G&A expenses from continuing operations were $65.9 million, or 17.1% of net sales, in fiscal 2016, compared to $73.4 million, or 19.4% of net sales, in fiscal 2015.
The decrease in S,G&A costs was driven by $12.6 million of lower legal and professional fees and $3.2 million of costs incurred in fiscal 2015 related to the separation of our former CEO. These savings were partially offset by $3.4 million of costs incurred in fiscal 2016 associated with the sale leaseback of two of our production facilities, higher employee benefit costs, including incentive compensation costs driven by improved performance and costs related to our deferred compensation plans, as well as service costs related to our ERP system that went live in fiscal 2016.
Depreciation and Amortization
Depreciation and amortization expenses ("D&A") from continuing operations was $21.0 million, or 5.4% of net sales, in fiscal 2016, compared to $18.4 million, or 4.8% of net sales, in fiscal 2015. The increase is primarily driven by depreciation and amortization related to our ERP system, which went live in the first quarter of fiscal 2016, partially offset by a reduction in depreciation associated with the sale leaseback of our Lima, Ohio, and Sulphur Springs, Texas, production facilities in the second quarter of fiscal 2016.
Impairments
An impairment charge of $2.8 million was recorded in 2015 related to a trade name we no longer use.
Interest
Net interest expense was $10.4 million in fiscal 2016 as compared to $8.6 million in fiscal 2015. The increase in net interest expense in fiscal 2016 was the result of higher average borrowings and higher average interest rates as compared to fiscal 2015.
Income Taxes
The effective tax rate for continuing operations in fiscal 2016 was 28.4% as compared to a benefit of 61.6% for fiscal 2015. The effective income tax rate in fiscal 2016 was different than the statutory rate due to the increase in pretax income, as well as the impact of the Company’s domestic production activities deduction.
Results from Discontinued Operations
Results associated with our Restaurants Business are classified as income from discontinued operations, net of taxes, in our Consolidated Statements of Net Income. Prior year results have been recast to conform to current presentation. Below is a summary of results for fiscal 2016, compared to fiscal 2015:
31
Results from Discontinued Operations | |||||||
(in thousands) | 2016 | 2015 | |||||
Income from discontinued operations before income taxes | $ | 2,774 | $ | 23,043 | |||
(Benefit) Provision for income taxes | (5,240 | ) | 1,110 | ||||
Income from discontinued operations | $ | 8,014 | $ | 21,933 | |||
Results from discontinued operations in fiscal 2016 as compared to fiscal 2015 were impacted by a 2.5% reduction in restaurant same store sales, a $9.6 million loss on the sale-leaseback of 143 restaurant properties and $7.8 million of impairment and severance costs related to store closings. The change in tax rates as compared to the prior year is driven primarily by the reduction in pretax income as well as the impact of tax credits related to hiring and tip wages.
Liquidity and Capital Resources
Our primary sources of liquidity are cash generated from operating activities, the borrowing capacity under our new revolving credit facility and the proceeds received from the sale of our Restaurants Business.
Historically, our working capital requirements have been minimal. This favorable working capital position resulted from the relatively short trade credit terms with our BEF Foods customers as well as most of our major suppliers and distributors and the quick turnover of our inventories.
Share Repurchase Program
On November 19, 2015, the Board of Directors increased the authorization of a stock repurchase program to $250.0 million. The program authorizes the Company to repurchase its outstanding common stock pursuant to plans approved by the Board under SEC Rules 10b-18 and 10b5-1, and in the open market or through privately negotiated transactions. In fiscal 2016 we repurchased approximately 3.9 million shares for $171.5 million. The repurchases were funded primarily through additional borrowings on our Credit Agreement, cash from operations and the net proceeds from the sale leaseback transactions of 143 restaurant properties and two production facilities. We did not repurchase any shares in fiscal 2017. On January 24, 2017, the Board of Directors increased the Company’s existing share repurchase authorization to $100.0 million and extended the authorization through December 31, 2017.
Credit Agreement and other long term debt
Utilizing proceeds from the Restaurants Transaction, on April 28, 2017, we repaid all outstanding borrowings on our $650.0 million revolving credit facility (the "Credit Agreement") and terminated the agreement. Concurrently on April 28, 2017, we entered into a new $300.0 million credit facility ("the Credit Facility"). As of April 28, 2017, there were no outstanding borrowings on the Credit Facility. We expect our fiscal 2018 target leverage ratio will be approximately 1.0x, which we believe provides considerable flexibility to continue to grow and invest in the Company. Our new Credit Facility contains financial and other various affirmative and negative covenants that are typical for financings of this type. It requires us to maintain a specified minimum coverage ratio and maximum leverage ratio. A breach of any of these covenants could result in a default under our Credit Facility, in which all amounts under our Credit Facility may become immediately due and payable, and all commitments under our Credit Facility to extend further credit, terminated. We were in compliance with the financial covenant requirements of our new Credit Facility as of April 28, 2017.
As part of the Restaurants Transaction we sold our corporate headquarters to the Buyer on a debt-free basis. This required us to pay-in-full the outstanding borrowings on our $30.0 million Mortgage Loan on our corporate headquarters prior to closing the transaction. Accordingly, in the fourth quarter of fiscal 2017, using additional borrowings from our now terminated Credit Agreement, we settled all outstanding borrowings and terminated the Mortgage Loan. See Note 3 to the Consolidated Financial Statements for additional information.
Impact from Strategic Transactions
We expect net proceeds, after tax payments, of $487 to $493 million. On May 1, 2017, our Board of Directors declared a special dividend of $7.50 per share, representing the majority of net cash proceeds from the Restaurants Transaction after income tax payments and the settlement of outstanding borrowings under our Credit Agreement. The dividend will be paid at the close of business on June 16, 2017, to shareholders of record on May 30, 2017.
Cash flows from operating activities
32
Net cash provided by operating activities was $73.6 million for fiscal 2017 as compared to $123.6 million for fiscal 2016. The change in operating cash flow was a result of lower earnings after the adjustment for non-cash items, including the gain on sale of our Restaurants Business. Net cash provided by operating activities from continuing operations was $109.4 million in fiscal 2017 as compared to $51.0 million in fiscal 2016. The change was primarily driven by higher earnings from continuing operations, adjusted for non-cash items such as impairments and stock compensation expense.
Cash flows from investing activities
Cash provided by investing activities was $491.6 million for fiscal 2017, as compared to $196.3 million for fiscal 2016. The increase was primarily due to the $539.3 million of net proceeds received from the sale of the Restaurants Business in fiscal 2017 as compared to the $241.7 million of proceeds received in fiscal 2016 from the sale leaseback of 143 restaurant properties and two of our production facilities. Capital expenditures were $65.8 million and $65.7 million, respectively, for fiscal 2017 and fiscal 2016. In fiscal 2017, capital expenditures from continuing operations were $28.5 million and primarily related to an additional refrigerated side-dish production line at our Lima, Ohio plant, and IT infrastructure projects. Refer to Note 2 to the Consolidated Financial Statements for additional information regarding cash flows from investing activities for discontinued operations. In fiscal 2018, capital expenditures are expected to approximate $25.0 million to $30.0 million.
Cash flows from financing activities
Cash used in financing activities was $367.2 million for fiscal 2017, as compared to $313.4 million for fiscal 2016. In fiscal 2017 we repaid $334.4 million of net outstanding debt, while in fiscal 2016 we repaid approximately $111.0 million of net debt, and also paid $171.5 million to repurchase shares of Company stock. During fiscal 2017 we also paid a cash dividend of $1.36 per share, as compared to $1.30 per share during the corresponding period last year. While we expect to continue paying regular quarterly cash dividends, the declaration, amount and timing of future dividends are at the discretion of our Board of Directors and subject to the restrictions in our Credit Facility.
Off-Balance Sheet Arrangements
As of April 28, 2017, we have not entered into any “off-balance sheet” arrangements with unconsolidated entities or other persons, as that term is defined in rules issued by the SEC.
Contractual Obligations
As part of the Restaurants Transaction, the Buyer assumed all operating leases associated with the Restaurants Business, including leases for 143 restaurant properties that were sold as part of a sale leaseback transaction in the fourth quarter of fiscal 2016. The Company and BEF Foods, Inc. continue to guarantee certain payment and performance obligations associated with the lease agreements for those restaurant properties. These contingent obligations are not reflected in the table below. See Note 2 to the Consolidated Financial Statements for additional information.
Future payments of our contractual obligations and outstanding indebtedness as of April 28, 2017, are as follows (in thousands):
(in thousands) | 2018 | 2019 | 2020 | 2021 | 2022 | Thereafter | Total | |||||||||||||||||||||
Operating leases (1) | $ | 3,586 | $ | 3,657 | $ | 3,731 | $ | 3,805 | $ | 3,881 | $ | 60,657 | $ | 79,317 | ||||||||||||||
Debt (2) | 428 | 428 | 428 | 517 | 1,000 | 2,801 | ||||||||||||||||||||||
Purchase obligations (3) | 45,203 | — | — | — | — | — | 45,203 | |||||||||||||||||||||
Deferred compensation (4) | 4,047 | 1,652 | 1,351 | 1,094 | 970 | 10,812 | 19,926 | |||||||||||||||||||||
Capital project obligations (5) | 5,081 | 5,081 | ||||||||||||||||||||||||||
Other (6) | 2,797 | 2,551 | 2,186 | 140 | — | — | 7,674 | |||||||||||||||||||||
Totals | $ | 61,142 | $ | 8,288 | $ | 7,696 | $ | 5,556 | $ | 5,851 | $ | 71,469 | $ | 160,002 | ||||||||||||||
(1) | Obligations for operating leases include payments through the end of current lease terms and do not include the impact of any available renewal periods. |
(2) | The balances represent principle payments on our Research and Development Investment Loans. See Note 3 to the Consolidated Financial Statements for more details. |
(3) | Purchase obligations are comprised of $45.2 million of raw material purchase commitments for BEF Foods, all of which are expected to be satisfied in the next 12 months. Many of these agreements do not obligate us to purchase any specific volumes and include provisions that would allow us to cancel such agreements with appropriate notice. For such agreements, amounts included in the table above represent our estimate of expected purchases prior to any cancellation of these contracts with appropriate notice. |
33
(4) | Deferred compensation obligations in future years may change due to additional participant deferral, returns on participant investments and changes in distribution elections by our plan participants. The obligations above exclude share based obligations, see Note 7 to the Consolidated Financial Statements for more details. |
(5) | Capital project obligations in fiscal 2018 primarily relate to purchase commitments for capital projects at our production facilities. |
(6) | Primarily relates to IT service commitments for ongoing support of our ERP system and other IT infrastructure. |
Business Outlook
Our outlook for fiscal 2018 relies on a number of assumptions, as well as the risk factors included in our SEC filings.
Guidance Metric | Fiscal 2018 Outlook (1) | |
Net sales | $464 to $476 million | |
EBITDA | $102 to $108 million | |
GAAP diluted earnings per share | $2.06 to $2.24 | |
Sow cost (per hundredweight) | $43 to $46 | |
Capital expenditures | $25 to $30 million | |
Net interest expense | $3.8 to $4.3 million | |
GAAP Tax rate | 34.5% to 35.5% | |
Diluted weighted-average share count | approximately 20.4 million shares | |
Share repurchase authorization | $100 million | |
(1) | This outlook is subject to a number of factors beyond the Company’s control, including the risk factors discussed in this Form 10‑K and other subsequent filings with the Securities and Exchange Commission. |
Critical Accounting Policies and Estimates
We prepare our consolidated financial statements in conformity with US GAAP. The preparation of these financial statements requires us to make estimates and assumptions that affect the reported amounts of assets, liabilities, revenues and expenses. We base our estimates on historical experience, current trends and conditions and various other facts and conditions that we believe to be reasonable under the circumstances.
Our significant accounting policies are described in Note 1 to the Consolidated Financial Statements. Certain significant accounting policies require complex and subjective judgment as a result of estimates surrounding uncertain outcomes. While we believe that our historical experience and other factors considered provide a meaningful basis for the accounting policies applied in the preparation of the consolidated financial statements, the judgments surrounding these critical accounting policies may result in materially different amounts under different financial conditions or by using different assumptions. We consider the following policies to be the most critical in understanding the judgments that are involved in preparing our consolidated financial statements.
BEF Foods Sales Promotions (Trade Spend)
We engage in promotional (sales incentive) programs in the form of “off-invoice” deductions, billbacks, cooperative advertising and coupons, collectively referred to as trade spend programs, with our customers. Costs associated with these programs are classified as a reduction of net sales in the period in which the sale occurs. Our trade programs may fluctuate based on sow costs trends and during peak holiday periods. As a result, we enter into promotion agreements with our customers during distinct time periods where we expect to maximize the impact of promotions on net sales and profitability. A change in actual sales volume and sow costs from our estimates will impact sales, and ultimately, profitability.
Long-Lived Asset Impairment
We evaluate the carrying amount of long-lived assets held and used in the business when events and circumstances indicate that the carrying value of the assets may not be recoverable. Recoverability of long-lived assets is measured by comparing the carrying value of the asset, or asset group, to the undiscounted future cash flows expected to be generated by the asset. A long-lived asset or asset group is considered impaired when the carrying value of the asset or asset group exceeds its fair value. The impairment loss recognized is the excess of carrying value of the asset or asset group above its fair value. The assumptions used to estimate the recoverability and fair value of long-lived assets require a high degree of judgment and may be affected by many factors, including changes in economic conditions and changes in operating performance. If these assumptions change in the future we may be required to record additional impairment charges on these assets.
34
Goodwill and Other Intangible Assets
Goodwill is not amortized and is tested for impairment during the fourth quarter each year or on a more frequent basis when indicators of impairment exist. Our goodwill is primarily the result of our acquisition of Kettle Creations in fiscal 2013.
Goodwill impairment testing involves a comparison of the estimated fair value of reporting units to the respective carrying amount. If the estimated fair value exceeds the carrying amount, then no impairment exists. If the carrying amount exceeds the estimated fair value, then a second step is performed to determine the amount of impairment, if any. We perform our impairment test using a combination of income based and market based approaches. The income based approach indicates the fair value of an asset or business based on the estimated future discounted cash flows expected to be generated by the asset or business. Significant assumptions used to determine the fair value of our business includes forecasted trends in sales, operating and allocated expenses, capital expenditures and an appropriate discount rate. Under the market-based approach, fair value is determined by using earnings multiples to compare the value of the company to similar businesses or guideline companies whose securities are actively traded in public markets. If the Company's future operating performance is materially different from the forecast we may be required to record impairment related to goodwill, however in fiscal 2017 the estimated fair value of our business significantly exceeded its carrying value.
Self-insurance Reserves
We record estimates for health, workers’ compensation and general liability insurance costs that are self-insured programs. Self-insurance reserves include actuarial estimates of both claims filed, carried at their expected ultimate settlement value, and claims incurred but not yet reported. Our liability represents an estimate of the ultimate cost of claims incurred as of the balance sheet date. We utilize stop loss insurance to limit our exposure on a per person basis for health insurance and on a per claim basis for workers’ compensation and general liability insurance. Estimates for health, workers’ compensation and general liability are calculated utilizing claims development estimates based on historical experience and other factors. Future changes from the actuarial estimates regarding the frequency and severity of claims or settlement practices may result in insurance reserves that are materially different than what is recorded today.
Taxes
We account for income taxes under the asset and liability method, which requires the recognition of deferred tax assets and liabilities for the expected future tax consequences of events that have been included in the financial statements. Under this method, deferred tax assets and liabilities are determined on the basis of differences between the financial statement and tax bases of assets and liabilities using enacted tax rates in effect for the year in which the differences are expected to reverse. The effect of a change in tax rates on deferred tax assets and liabilities is recognized in income in the period that includes the enactment date.
We recognize deferred tax assets to the extent that we believe these assets are more likely than not to be realized. In making such a determination, we consider all available positive and negative evidence, including future reversals of existing taxable temporary differences, projected future taxable income, tax-planning strategies, and results of recent operations. If we determine that we would be able to realize our deferred tax assets in the future in excess of their net recorded amount, we would make an adjustment to the deferred tax asset valuation allowance, which would reduce the provision for income taxes.
We record uncertain tax positions in accordance with Accounting Standards Codification ("ASC") 740 on the basis of a two-step process whereby (1) we determine whether it is more likely than not that the tax positions will be sustained on the basis of the technical merits of the position and (2) for those tax positions that meet the more-likely-than-not recognition threshold, we recognize the largest amount of tax benefit that is more than 50 percent likely to be realized upon ultimate settlement with the related tax authority. The Company recognizes interest and penalties related to unrecognized tax benefits within the income tax expense line in the accompanying Consolidated Statement of Net Income. Accrued interest and penalties are included within the related tax liability line in the Consolidated Balance Sheets.
We generally file our income tax returns several months after our fiscal year end. The major jurisdiction in which the Company files income tax returns includes the U.S. federal jurisdiction, and approximately 30 states in the U.S.
ITEM 7A. QUANTITATIVE AND QUALITATIVE DISCLOSURES ABOUT MARKET RISK
We do not currently use derivative financial instruments for speculative or hedging purposes. We maintain our cash and cash equivalents in financial instruments with maturities of three months or less when purchased.
Commodities Prices
35
We purchase certain commodities such as pork, potatoes and dairy products. These commodities are generally purchased based upon market prices established with suppliers. These purchase arrangements may contain contractual features that fix the price paid for certain commodities. We do not use financial instruments to hedge commodity prices because these purchase arrangements help control the ultimate cost paid and most commodity price aberrations are generally short-term in nature. Long term fluctuations in commodity prices could significantly impact the profitability of the Company.
36
ITEM 8. FINANCIAL STATEMENTS AND SUPPLEMENTAL DATA
BOB EVANS FARMS, INC.
CONSOLIDATED BALANCE SHEETS
(in thousands, except par value amounts)
April 28, 2017 | April 29, 2016 | ||||||
Assets | |||||||
Current Assets | |||||||
Cash and equivalents | $ | 210,886 | $ | 11,609 | |||
Accounts receivable, net | 28,071 | 24,613 | |||||
Inventories | 17,210 | 17,093 | |||||
Federal and state income taxes receivable | 2,895 | — | |||||
Prepaid expenses and other current assets | 6,833 | 5,716 | |||||
Current assets held for sale | 3,334 | 48,707 | |||||
Total Current Assets | 269,229 | 107,738 | |||||
Land | 291 | 330 | |||||
Buildings and improvements | 25,351 | 21,203 | |||||
Machinery and equipment | 214,366 | 176,611 | |||||
Construction in process | 4,546 | 20,959 | |||||
Total Property, Plant and Equipment | 244,554 | 219,103 | |||||
Less accumulated depreciation | 113,814 | 89,851 | |||||
Net Property, Plant and Equipment | 130,740 | 129,252 | |||||
Other Assets | |||||||
Deposits and other | 2,118 | 3,841 | |||||
Notes receivable | — | 20,886 | |||||
Rabbi trust assets | 22,353 | 20,662 | |||||
Goodwill and other intangible assets | 19,673 | 19,829 | |||||
Deferred income tax assets | 5,131 | 29,002 | |||||
Non-current assets held for sale | — | 469,164 | |||||
Total Other Assets | 49,275 | 563,384 | |||||
Total Assets | $ | 449,244 | $ | 800,374 | |||
Liabilities and Stockholders’ Equity | |||||||
Current Liabilities | |||||||
Current portion of long-term debt | $ | 428 | $ | 3,419 | |||
Accounts payable | 13,424 | 15,841 | |||||
Accrued property, plant and equipment purchases | 1,283 | 4,024 | |||||
Accrued non-income taxes | 3,353 | 890 | |||||
Accrued wages and related liabilities | 16,404 | 16,370 | |||||
Self-insurance reserves | 10,692 | 11,288 | |||||
Current taxes payable | 27,954 | 9,473 | |||||
Current reserve for uncertain tax positions | 1,481 | 1,481 | |||||
Other accrued expenses | 17,905 | 13,614 | |||||
Current liabilities held for sale | — | 89,157 | |||||
Total Current Liabilities | 92,924 | 165,557 | |||||
Non-Current Liabilities | |||||||
Deferred compensation | 17,277 | 17,761 | |||||
Reserve for uncertain tax positions | 1,795 | 2,752 | |||||
Deferred income tax liabilities | 50 | — | |||||
Deferred rent and other | 1,091 | 377 | |||||
Deferred gain on sale leaseback transactions | 2,192 | 2,432 | |||||
Credit facility borrowings and other long-term debt | 2,267 | 335,638 | |||||
Non-current liabilities held for sale | — | 59,413 | |||||
Total Non-Current Liabilities | 24,672 | 418,373 | |||||
Stockholders’ Equity | |||||||
Common stock, $.01 par value; authorized 100,000 shares; issued 42,638 shares at April 28, 2017, and April 29, 2016 | 426 | 426 | |||||
Capital in excess of par value | 260,619 | 244,304 | |||||
Retained earnings | 931,315 | 832,323 | |||||
Treasury stock, 22,842 shares at April 28, 2017, and 22,881 shares at April 29, 2016, at cost | (860,712 | ) | (860,609 | ) | |||
Total Stockholders’ Equity | 331,648 | 216,444 | |||||
Total Liabilities and Stockholders' Equity | $ | 449,244 | $ | 800,374 | |||
The accompanying Notes are an integral part of these Consolidated Financial Statements.
37
BOB EVANS FARMS, INC.
CONSOLIDATED STATEMENTS OF NET INCOME
(in thousands, except per share amounts)
2017 | 2016 | 2015 | |||||||||
Net Sales | $ | 394,842 | $ | 387,616 | $ | 379,313 | |||||
Cost of sales | 170,820 | 172,973 | 199,067 | ||||||||
Operating wage and fringe benefit expenses | 39,964 | 42,189 | 41,717 | ||||||||
Other operating expenses | 58,402 | 52,387 | 49,381 | ||||||||
Selling, general and administrative expenses | 56,243 | 65,949 | 73,380 | ||||||||
Depreciation and amortization expense | 24,031 | 21,044 | 18,364 | ||||||||
Impairments | 15,256 | — | 2,761 | ||||||||
Operating Income (Loss) | 30,126 | 33,074 | (5,357 | ) | |||||||
Net interest expense | 9,216 | 10,427 | 8,649 | ||||||||
Income (Loss) from Continuing Operations Before Income Taxes | 20,910 | 22,647 | (14,006 | ) | |||||||
Provision (Benefit) for income taxes | 3,874 | 6,439 | (8,626 | ) | |||||||
Income (Loss) from Continuing Operations | 17,036 | 16,208 | (5,380 | ) | |||||||
Income from Discontinued Operations, Net of Income Taxes | 109,431 | 8,014 | 21,933 | ||||||||
Net Income | $ | 126,467 | $ | 24,222 | $ | 16,553 | |||||
Earnings (Loss) Per Share - Income from Continuing Operations | |||||||||||
Basic | $ | 0.86 | $ | 0.76 | $ | (0.23 | ) | ||||
Diluted | $ | 0.85 | $ | 0.75 | $ | (0.23 | ) | ||||
Earnings Per Share - Income from Discontinued Operations | |||||||||||
Basic | $ | 5.51 | $ | 0.38 | $ | 0.93 | |||||
Diluted | $ | 5.43 | $ | 0.38 | $ | 0.93 | |||||
Earnings Per Share - Net Income | |||||||||||
Basic | $ | 6.37 | $ | 1.14 | $ | 0.70 | |||||
Diluted | $ | 6.28 | $ | 1.13 | $ | 0.70 | |||||
Cash Dividends Paid Per Share | $ | 1.36 | $ | 1.30 | $ | 1.24 | |||||
Weighted Average Shares Outstanding | |||||||||||
Basic | 19,839 | 21,336 | 23,489 | ||||||||
Dilutive Shares | 293 | 158 | 160 | ||||||||
Diluted | 20,132 | 21,494 | 23,649 | ||||||||
The accompanying Notes are an integral part of these Consolidated Financial Statements.
38
BOB EVANS FARMS, INC.
CONSOLIDATED STATEMENTS OF STOCKHOLDERS’ EQUITY
(in thousands)
Common Stock Shares | Common Stock Amount | Capital in Excess of Par Value | Retained Earnings | Treasury Stock | Total | |||||||||||||||||
Stockholders' Equity at April 25, 2014 | 23,319 | $ | 426 | $ | 231,933 | $ | 849,235 | $ | (692,375 | ) | $ | 389,219 | ||||||||||
Net income | — | — | — | 16,553 | — | 16,553 | ||||||||||||||||
Dividends ($1.24 per share) | — | — | — | (29,426 | ) | (29,426 | ) | |||||||||||||||
Treasury stock repurchased | — | — | — | — | — | — | ||||||||||||||||
Treasury stock reissued under compensation plans | 88 | — | 830 | — | (380 | ) | 450 | |||||||||||||||
Share-based compensation expense | — | — | 2,967 | — | — | 2,967 | ||||||||||||||||
Tax benefit — stock plans | — | — | 228 | — | — | 228 | ||||||||||||||||
Stockholders' Equity at April 24, 2015 | 23,407 | $ | 426 | $ | 235,958 | $ | 836,362 | $ | (692,755 | ) | $ | 379,991 | ||||||||||
Net income | 24,222 | 24,222 | ||||||||||||||||||||
Dividends ($1.30 per share) | (28,261 | ) | (28,261 | ) | ||||||||||||||||||
Treasury stock repurchased | (3,912 | ) | (171,513 | ) | (171,513 | ) | ||||||||||||||||
Treasury stock reissued under compensation plans | 262 | 558 | 3,659 | 4,217 | ||||||||||||||||||
Share-based compensation expense | 6,127 | 6,127 | ||||||||||||||||||||
Tax benefit — stock plans | 1,661 | 1,661 | ||||||||||||||||||||
Stockholders' Equity at April 29, 2016 | 19,757 | $ | 426 | $ | 244,304 | (2) | $ | 832,323 | $ | (860,609 | ) | $ | 216,444 | |||||||||
Net income | 126,467 | 126,467 | ||||||||||||||||||||
Dividends ($1.36 per share) | (27,475 | ) | (27,475 | ) | ||||||||||||||||||
Treasury stock repurchased | — | |||||||||||||||||||||
Treasury stock reissued under compensation plans | 39 | (383 | ) | (103 | ) | (486 | ) | |||||||||||||||
Share-based compensation expense | 17,197 | 17,197 | ||||||||||||||||||||
Tax benefit — stock plans | (499 | ) | (499 | ) | ||||||||||||||||||
Stockholders' Equity at April 28, 2017 | 19,796 | $ | 426 | $ | 260,619 | (2) | $ | 931,315 | $ | (860,712 | ) | (1) | $ | 331,648 | ||||||||
(1) | Treasury stock includes 1,160 shares held by our Rabbi Trust as of April 28, 2017 that will be used to satisfy share-based deferred compensation obligations. Refer to Note 7 for additional information. |
(2) | Capital in Excess of Par Value includes $14,356 and $9,502 of share based obligations owed to participants in our deferred compensation plans as of April 28, 2017 and April 29, 2016, respectively. Refer to Note 7 for more information. |
The accompanying Notes are an integral part of these Consolidated Financial Statements.
39
BOB EVANS FARMS, INC.
CONSOLIDATED STATEMENTS OF CASH FLOWS
(in thousands)
2017 | 2016 | 2015 | |||||||||
Operating activities: | |||||||||||
Net income | $ | 126,467 | $ | 24,222 | $ | 16,553 | |||||
Adjustments to reconcile net income to net cash provided by operating activities: | |||||||||||
Depreciation and amortization | 60,090 | 79,607 | 80,074 | ||||||||
Impairments | 15,256 | 8,384 | 8,861 | ||||||||
(Gain) Loss on disposal of fixed assets | (168,859 | ) | 4,532 | 2,204 | |||||||
(Gain) Loss on rabbi trust assets | (1,691 | ) | 1,640 | (742 | ) | ||||||
Loss (Gain) on deferred compensation | 2,514 | (765 | ) | 2,013 | |||||||
Share-based compensation | 17,197 | 6,127 | 2,967 | ||||||||
Accretion of non-current note receivable | (1,133 | ) | (2,082 | ) | (1,859 | ) | |||||
Deferred income taxes | 23,921 | (28,384 | ) | (14,791 | ) | ||||||
Amortization of deferred financing costs | 4,201 | 2,188 | 1,099 | ||||||||
Cash provided by (used for) assets and liabilities: | |||||||||||
Accounts receivable | (2,700 | ) | (2,793 | ) | 4,588 | ||||||
Inventories | (751 | ) | (377 | ) | 623 | ||||||
Prepaid expenses and other current assets | (1,377 | ) | 483 | (563 | ) | ||||||
Accounts payable | (10,281 | ) | 7,499 | 955 | |||||||
Federal and state income taxes | 14,629 | 33,067 | 1,504 | ||||||||
Accrued wages and related liabilities | (1,160 | ) | (3,101 | ) | 11,005 | ||||||
Self-insurance | (1,474 | ) | 1,269 | (974 | ) | ||||||
Accrued non-income taxes | (756 | ) | 745 | (2,892 | ) | ||||||
Deferred revenue | (337 | ) | 433 | 747 | |||||||
Other assets and liabilities | (198 | ) | (9,058 | ) | (8,267 | ) | |||||
Net cash provided by operating activities | 73,558 | 123,636 | 103,105 | ||||||||
Investing activities: | |||||||||||
Purchase of property, plant and equipment | (65,768 | ) | (65,694 | ) | (74,517 | ) | |||||
Proceeds from sale of property, plant and equipment | 557,061 | 257,246 | 10,036 | ||||||||
Proceeds from liquidation of rabbi trust assets | — | 5,245 | — | ||||||||
Deposits and other | 330 | (537 | ) | (135 | ) | ||||||
Net cash provided by (used in) investing activities | 491,623 | 196,260 | (64,616 | ) | |||||||
Financing activities: | |||||||||||
Cash dividends paid | (26,915 | ) | (27,861 | ) | (29,056 | ) | |||||
Gross proceeds from credit facility borrowings and other long-term debt | 413,268 | 672,349 | 579,895 | ||||||||
Gross repayments of credit facility borrowings and other long-term debt | (750,668 | ) | (783,339 | ) | (588,541 | ) | |||||
Payments of debt issuance costs | (1,542 | ) | (3,555 | ) | (1,279 | ) | |||||
Purchase of treasury stock | — | (171,513 | ) | — | |||||||
Proceeds from share-based compensation | 518 | 214 | 534 | ||||||||
Cash paid for taxes on share-based compensation | (1,353 | ) | (1,314 | ) | (1,738 | ) | |||||
Excess tax benefits from share-based compensation | (499 | ) | 1,661 | 228 | |||||||
Net cash (used in) financing activities | (367,191 | ) | (313,358 | ) | (39,957 | ) | |||||
Net cash provided by (used in) operations | 197,990 | 6,538 | (1,468 | ) | |||||||
Cash and equivalents at the beginning of the period | 12,896 | 6,358 | 7,826 | ||||||||
Cash and equivalents at the end of the period | $ | 210,886 | $ | 12,896 | $ | 6,358 | |||||
The accompanying Notes are an integral part of these Consolidated Financial Statements.
40
BOB EVANS FARMS, INC.
NOTES TO THE CONSOLIDATED FINANCIAL STATEMENTS
Note 1 — Summary of Significant Accounting Policies
Description of Business: We produce and distribute a variety of complementary home-style, refrigerated side-dish convenience food items and pork sausage under the Bob Evans ®, Owens ® and Country Creek ® brand names. These food products are available throughout the United States at grocery retailers. We also manufacture and sell similar products to food-service accounts, including Bob Evans Restaurants and other restaurants. The revenue from sales to Bob Evans Restaurants were eliminated in consolidation.
On January 24, 2017, we entered into an Asset and Membership Interest Purchase Agreement (the "BER Sale Agreement") with Bob Evans Restaurants, LLC (formerly BER Acquisition, LLC) a Delaware limited liability company formed by affiliates of Golden Gate Capital Opportunity Fund, L.P. ("the Buyer"). The Buyer completed the acquisition of the Company's Bob Evans Restaurants Business (the "Restaurants Business"), including our corporate headquarters, on April 28, 2017 (the "Restaurants Transaction"). For all periods presented in our Consolidated Statements of Net Income, all sales, costs, expenses, gains and income taxes attributable to our Restaurants Business as well as the Restaurants Transaction have been reported under the captions "Income from Discontinued Operations, Net of Income Taxes." Cash flows used in or provided by our Restaurants Business have been reported in the Consolidated Statements of Cash Flows under operating and investing activities. Refer to Note 2 - Discontinued Operations for additional information.
Prior to the decision to sell our Restaurants Business, we had two reporting segments, Bob Evans Restaurants and BEF Foods. BEF Foods sells food products throughout the retail grocery and food service channels, including to Bob Evans Restaurants. Corporate and other costs related to shared services functions were not allocated to our reporting segments. As a result of the decision to sell our Restaurants Business, which is now classified as discontinued operations, we have one reporting segment. Revenues and costs related to our BEF Foods business, including indirect corporate overhead costs, are reported within results from continuing operations. All revenues and costs incurred directly in support of the Bob Evans Restaurants business are presented in results from discontinued operations. Prior year information has been adjusted to conform with the current presentation. Unless otherwise stated, the information disclosed in footnotes accompanying the financial statements refer to continuing operations. See Note 2 for additional information regarding results from discontinued operations.
Principles of Consolidation: The consolidated financial statements include the accounts of Bob Evans and its subsidiaries. Intercompany accounts and transactions have been eliminated. Dollars are in thousands, except share and per share amounts.
Use of Estimates: The preparation of financial statements in conformity with US GAAP requires us to make estimates and assumptions that affect the reported amounts of assets, liabilities, revenues and expenses and disclosure of contingent assets and liabilities. Actual results could differ from the estimates and assumptions used.
Fiscal Year: Our fiscal year ends on the last Friday in April. References herein to fiscal 2017, fiscal 2016 and fiscal 2015 refer to fiscal years ended April 28, 2017, April 29, 2016, and April 24, 2015, respectively. Fiscal years 2017 and 2015 were 52 week periods, whereas fiscal year 2016 was a 53 week period.
Revenue Recognition: Revenue is recognized when products are received by our customers. We engage in promotional (sales incentives or trade spend) programs in the form of "off-invoice" deductions, billbacks, cooperative advertising and coupons with our customers. Costs associated with these programs are classified as a reduction of gross sales in the period in which the sale occurs. Promotional spending for continuing operations, primarily comprised of off-invoice deductions and billbacks, was $84,748, $79,302, and $56,618 for fiscal years 2017, 2016 and 2015, respectively.
Shipping and Handling costs: Expenditures related to shipping our BEF Foods products to our customers are expensed when incurred. Shipping and handling costs were $16,125, $14,850 and $17,025 in fiscal years 2017, 2016 and 2015, respectively, and are recorded in the other operating expenses line of the Consolidated Statements of Net Income.
Cash Equivalents: We consider all highly liquid instruments with a maturity of three months or less when purchased to be cash equivalents. We did not own any cash equivalents as of April 28, 2017, or April 29, 2016.
Accounts Receivable: Accounts receivable represents amounts owed to us through our operating activities and are presented net of allowance for doubtful accounts and promotional incentives. Accounts receivable consist primarily of trade receivables from customer sales. We evaluate the collectability of our accounts receivable based on a combination of factors.
41
In circumstances where we are aware of a specific customer’s inability to meet its financial obligations to us, we record a specific allowance for bad debts against amounts due to reduce the net recognized receivable to the amount we reasonably believe will be collected. In addition, we recognize allowances for bad debts based on the length of time receivables are past due with allowance percentages, based on our historical experiences, applied on a graduated scale relative to the age of the receivable amounts. If circumstances such as higher than expected bad debt experience or an unexpected material adverse change in a major customer’s ability to meet its financial obligations to us were to occur, the recoverability of amounts due to us could change by a material amount. We had allowances for doubtful accounts of $269 and $421 as of April 28, 2017, and April 29, 2016, respectively. Accounts receivable are reduced by $8,055 and $4,916 as of April 28, 2017, and April 29, 2016, respectively, related to promotional incentives that reduce what is owed to the Company from certain BEF Foods customers.
Concentration of Credit Risk: We maintain cash depository accounts with major banks. Accounts receivable can be potentially exposed to a concentration of credit risk with customers or in particular industries. In fiscal 2017 sales to Wal-mart comprised approximately 20% of net sales from continuing operations while sales to Kroger comprised approximately 14% of net sales from continuing operations. Reserves for credit losses have historically been within our expectations.
Notes Receivable: As a result of the sale of Mimi’s Café to Le Duff, we received a promissory note ("the Note") for $30,000. The Note had an annual interest rate of 1.5%, a term of seven years and a full principal and interest payment date of February 2020. Partial prepayments were required prior to maturity if the buyer reached certain levels of EBITDA during specified periods. No partial prepayments were received on this Note. The Note was originally valued using a discounted cash flow model and we recognized accretion income of $1,133, $2,082 and $1,859 in fiscal years 2017, 2016 and 2015, respectively.
In the third quarter of fiscal 2017, we reached an agreement with Mimi's Café and settled the Note. We received a payment of $7,000 which settled all of Mimi's Café outstanding obligations of the Note. The settlement resulted in an impairment charge of $15,256, which was recorded in the Impairments line of the Consolidated Statements of Net Income.
Inventories: Our inventories are determined on an average cost method which approximates a first in, first out basis due to the perishable nature of our inventory. Inventory includes raw materials and supplies ($6,037 in fiscal 2017 and $5,911 in fiscal 2016) and finished goods ($11,173 in fiscal 2017 and $11,182 in fiscal 2016). Inventories associated with the Restaurants Business were transferred to the Buyer as part of the Restaurants Transaction. See Note 2 for additional information.
Property, Plant and Equipment: Property, plant and equipment is recorded at cost less accumulated depreciation. The straight-line depreciation method is used for all capitalized assets. Depreciation is calculated at rates adequate to amortize costs over the estimated useful lives of buildings and improvements (5 to 25 years) and machinery and equipment (3 to 10 years). Improvements to leased properties are depreciated over the shorter of their useful lives or the initial lease terms. Total depreciation expense from continuing operations was $23,875, $20,887 and $18,207 and in fiscal years 2017, 2016 and 2015, respectively.
We capitalized internal labor costs of $605, $1,557 and $2,118 in fiscal years 2017, 2016 and 2015, respectively, primarily associated with the first and second phases of our ERP implementation and other IT projects. The first phase of our ERP system was put in service in the first quarter of fiscal 2016, and has an expected useful life of ten years. The second phase of our ERP system was put in service in the second quarter of fiscal year 2017 and also has an expected useful life of 10 years.
We evaluate property, plant and equipment held and used in the business for impairment whenever events or changes circumstances indicate that the carrying amount of a long-lived asset may not be recoverable. Impairment is determined by comparing the estimated fair value for the asset group to the carrying amount of its assets. If impairment exists, the amount of impairment is measured as the excess of the carrying amount over the estimated fair values of the assets.
Assets associated with our Richardson, Texas, location totaling $3,334 are classified as Current Assets Held for Sale in the Consolidated Balance Sheet as of April 28, 2017 and April 29, 2016.
Goodwill and Other Intangible Assets: Goodwill and other intangible assets, which primarily represents the cost in excess of fair market value of net assets acquired, were $19,673 and $19,829 as of April 28, 2017, and April 29, 2016, respectively. The majority of our goodwill was acquired as part of our fiscal 2013 acquisition of Kettle Creations. Additionally, as part of this acquisition we obtained a non-compete agreement with certain executives of the former company. The Kettle Creations non-compete agreement is amortized on a straight-line basis over its estimated economic life of five years.
Goodwill and intangible assets with indefinite lives are not amortized, but rather are tested for impairment during the fourth quarter each year or on a more frequent basis when indicators of impairment exist. Goodwill and indefinite lived intangible asset impairment testing involves a comparison of the estimated fair value of reporting units to the respective
42
carrying amount. If the estimated fair value exceeds the carrying amount, then no impairment exists. If the carrying amount exceeds the estimated fair value, then a second step is performed to determine the amount of impairment, if any. We perform our impairment test using a combination of income-based and market-based approaches. The income based approach indicates the fair value of an asset or business based on the cash flows it can be expected to generate over its remaining useful life. Under the market-based approach, fair value is determined by comparing our reporting units to similar businesses or guideline companies whose securities are actively traded in public markets. There have been no impairments to our goodwill in the current or prior years.
Accrued Non-Income Taxes: Accrued non-income taxes primarily represent obligations for real estate and personal property taxes. Accrued non-income taxes were $3,353 and $890 at April 28, 2017, and April 29, 2016, respectively. Accrued non-income taxes associated with the Restaurants Business were conveyed to the Buyer as part of the Restaurants Transaction. See Note 2 - Discontinued Operations for additional information.
Self-Insurance Reserves: We record estimates for certain health, workers’ compensation and general liability insurance costs that are self-insured programs. Self-insurance reserves include actuarial estimates of both claims filed, carried at their expected ultimate settlement value, and claims incurred but not yet reported. Our liability represents an estimate of the ultimate cost of claims incurred as of the fiscal year end balance sheet date. Self-insurance reserves were $10,692 and $11,288 at April 28, 2017, and April 29, 2016, respectively. Workers compensation reserves associated with the Restaurants Business were transferred to the Buyer as part of the Restaurants Transaction. See Note 2 for additional information.
Other Accrued Expenses: Other accrued expenses consisted of the following:
(in thousands) | April 28, 2017 | April 29, 2016 | |||||
Legal and professional fees | $ | 10,807 | $ | 4,119 | |||
Accrued customer incentives | 1,912 | 1,872 | |||||
Accrued broker fees | 945 | 957 | |||||
Accrued advertising | 515 | 727 | |||||
Accrued utilities | 492 | 449 | |||||
Accrued interest | 16 | 541 | |||||
Other | 3,218 | 4,949 | |||||
Total other accrued expenses | $ | 17,905 | $ | 13,614 | |||
Advertising Costs: Media advertising is expensed at the time the media first airs. We expense all other advertising costs as incurred. Advertising expense from continuing operations was $9,006, $6,658 and $3,607 in fiscal years 2017, 2016 and 2015, respectively. Advertising costs are classified in other operating expenses in the Consolidated Statements of Net Income.
Cost of Sales: Cost of sales represents primarily the cost of materials. Cost of sales excludes depreciation expense, which is recorded in the depreciation and amortization expense line on the Consolidated Statements of Net Income.
Comprehensive Income: Comprehensive income is the same as reported net income as we have no other comprehensive income.
Earnings Per Share: Our basic earnings per share ("EPS") computation is based on the weighted-average number of shares of common stock outstanding during the period presented. Our diluted EPS calculation reflects the assumed vesting of restricted shares and market-based performance shares, the exercise and conversion of outstanding employee stock options and the settlement of share-based obligations recorded as liabilities on the Consolidated Balance Sheets (see Note 6 for more information), net of the impact of antidilutive shares.
The numerator in calculating both basic and diluted EPS for each period is reported net income. The denominator is based on the following weighted-average shares outstanding:
(in thousands) | 2017 | 2016 | 2015 | |||||
Basic | 19,839 | 21,336 | 23,489 | |||||
Dilutive shares | 293 | 158 | 160 | |||||
Diluted | 20,132 | 21,494 | 23,649 | |||||
43
In fiscal years 2017, 2016 and 2015, respectively, there were 215,889, 207,538 and 124,766 shares of common stock excluded from the diluted earnings per share calculations because they were antidilutive.
Dividends: In fiscal 2017, we paid four quarterly dividends, each equal to $0.34 per share on our outstanding common stock. Individuals that hold awards for unvested and outstanding restricted stock units, market-based performance share units and outstanding deferred stock awards are entitled to receive dividend equivalent rights equal to the per-share cash dividends paid on outstanding units. Dividend equivalent rights are forfeitable until the underlying share units from which they were derived vest. Share-based dividend equivalents are recorded as a reduction to retained earnings, with an offsetting increase to capital in excess of par value. Refer to table below:
2017 | 2016 | ||||||
Cash dividends paid to common stock holders | $ | 26,915 | $ | 27,861 | |||
Dividend Equivalent Rights | 560 | 400 | |||||
Total dividends | $ | 27,475 | $ | 28,261 | |||
Leases: In fiscal 2016, we entered into sale leaseback transactions for two of our production facilities. The transaction included 20-year initial lease terms for each facility, with two 10-year additional renewal periods exercisable at our option, 2% annual rent increases and payment and performance guaranties. A gain of $2,305 on the sale of our Lima, Ohio, facility was deferred and is being recognized on a straight-line basis over the initial term of the lease. Rent expense is recorded on a straight-line basis. Our straight-line rent calculation does not include an assumption of lease renewal periods. We record the difference between the amount charged to expense and the rent paid as deferred rent in the Consolidated Balance Sheets. Rent expense was $4,117 and $2,202 in fiscal years 2017 and 2016, respectively. Refer to the following table for expected future minimum lease payments, which excludes the impact of any available renewal periods:
(in thousands) | 2018 | 2019 | 2020 | 2021 | 2022 | Thereafter | ||||||||||||||||||
Future operating lease payments | $ | 3,586 | $ | 3,657 | $ | 3,731 | $ | 3,805 | $ | 3,881 | $ | 60,657 | ||||||||||||
Income Taxes: We account for income taxes under the asset and liability method, which requires the recognition of deferred tax assets and liabilities for the expected future tax consequences of events that have been included in the financial statements. Under this method, deferred tax assets and liabilities are determined on the basis of differences between the financial statement and tax bases of assets and liabilities using enacted tax rates in effect for the year in which the differences are expected to reverse. The effect of a change in tax rates on deferred tax assets and liabilities is recognized in income in the period that includes the enactment date.
We recognize deferred tax assets to the extent that we believe these assets are more likely than not to be realized. In making such a determination, we consider all available positive and negative evidence, including future reversals of existing taxable temporary differences, projected future taxable income, tax-planning strategies, and results of recent operations. If we determine that we would be able to realize our deferred tax assets in the future in excess of their net recorded amount, we would make an adjustment to the deferred tax asset valuation allowance, which would reduce the provision for income taxes.
We record uncertain tax positions in accordance with the Income Taxes Topic of the Financial Accounting Standards Board ("FASB ") ASC 740 on the basis of a two-step process whereby (1) we determine whether it is more likely than not that the tax positions will be sustained on the basis of the technical merits of the position and (2) for those tax positions that meet the more-likely-than-not recognition threshold, we recognize the largest amount of tax benefit that is more than 50 percent likely to be realized upon ultimate settlement with the related tax authority. The Company recognizes interest and penalties related to unrecognized tax benefits within the income tax expense line in the accompanying Consolidated Statement of Net Income. Accrued interest and penalties are included within the related tax liability line in the Consolidated Balance Sheets. See Note 4 for additional information.
Commitments and Contingencies: We occasionally use purchase commitment contracts to stabilize the potentially volatile pricing associated with certain commodity items.
We are self-insured for most casualty losses and employee health care claims up to certain stop-loss limits per claim. We have accounted for liabilities for casualty losses, including both reported claims and incurred but not reported claims, based on information provided by independent actuaries. We have estimated our employee health care claims liability through a review of incurred and paid claims history. The Company retained liabilities for health insurance and general liability claims associated with the Restaurants Business that were incurred prior to the closing of the Restaurants Transaction. We do not believe that our calculation of casualty losses and employee health-care claims liabilities would change materially under
44
different conditions and/or different methods. However, due to the inherent volatility of actuarially determined casualty losses and employee health care claims, it is reasonably possible that we could experience changes in estimated losses, which could be material to net income.
We are from time to time involved in ordinary and routine litigation, typically involving claims from customers, employees and others related to operational issues common to the food manufacturing industry. Management believes that the ultimate outcome of these proceedings, individually or in the aggregate, will not have a material adverse effect on our financial position, cash flows or results of operations. See Note 8 for further information.
As part of the Restaurants Transaction, the Company and BEF Foods, Inc. continue to guarantee certain payment and performance obligations associated with Bob Evans Restaurants leases associated with the sale leaseback transaction that occurred in the fourth quarter of fiscal 2016. See Note 2 for additional information.
New Accounting Pronouncements: In the normal course of business, management evaluates all new accounting pronouncements issued by the FASB, the Securities and Exchange Commission (“SEC”), the Emerging Issues Task Force, the American Institute of Certified Public Accountants or any other authoritative accounting body to determine the potential impact they may have on the Company’s consolidated financial statements. The pronouncements below were either adopted by the Company in fiscal 2017 or will be effective for the Company in future years.
In May 2014, the FASB and the International Accounting Standards Board ("IASB") issued new joint guidance surrounding revenue recognition. Under US GAAP, this guidance is being introduced to the ASC as Topic 606, Revenue from Contracts with Customers ("Topic 606"), by Accounting Standards Update No. 2014-09. The new standard supersedes a majority of existing revenue recognition guidance under US GAAP, and requires companies to recognize revenue when it transfers goods or services to a customer in an amount that reflects the consideration to which a company expects to be entitled. Companies may need to use more judgment and make more estimates while recognizing revenue, which could result in additional disclosures to the financial statements. Topic 606 allows for either a "full retrospective" adoption or a "modified retrospective" adoption. The standard will become effective for us in fiscal 2019.
We are in the process of implementing the new standard, focusing on promotional arrangements with customers. We do not believe the implementation will be material to our current or historical financial statements. We are in the process of developing additional controls to ensure proper oversight of new customer relationships and promotional activity, as well as to ensure we meet all of the disclosure requirements associated with the new standard. We have not yet concluded which transition method we will elect, but anticipate we will use the modified retrospective approach.
In August 2014, the FASB issued Accounting Standards Update ("ASU") No. 2014-15, Presentation of Financial Statements - Going Concern to provide guidance about management's responsibility to evaluate whether there is substantial doubt about an entity's ability to continue as a going concern. The guidance requires management to assess whether there are conditions or events, considered in the aggregate, that raise substantial doubt about an entity's ability to continue as a going concern within one year after the date that the financial statements are issued. When management identifies such conditions or events, a footnote disclosure is required to disclose their nature, as well as management's plans to alleviate the substantial doubt to continue as a going concern. The standard became effective for our fiscal year end 2017 and did not have an impact on the consolidated financial statements.
In July 2015, the FASB issued ASU No. 2015-11, Simplifying the Measurement of Inventory. ASU 2015-11 simplifies the subsequent measurement of inventory by replacing today's lower of cost or market test with a lower of cost or net realizable test, which is the estimated selling price in the ordinary course of business, less reasonably predictable costs of completion, disposal, and transportation. The standard will become effective for us in fiscal 2018. We do not expect this update to have a material impact on the consolidated financial statements.
In February 2016, the FASB issued ASU No. 2016-02, Leases. This guidance requires companies to put most leases on their balance sheets but recognize expenses on their income statements in a manner similar to today’s accounting. The new standard also will result in enhanced quantitative and qualitative disclosures, including significant judgments made by management, to provide greater insight into the extent of revenue and expense recognized and expected to be recognized from existing leases. The standard requires modified retrospective adoption and will become effective beginning in fiscal 2020, with early adoption permitted. We are currently evaluating this standard, including the timing of adoption and the related impact on our consolidated financial statements.
In March 2016, the FASB issued ASU No. 2016-09, Improvements to Employee Share-Based Compensation Accounting. ASU 2016-09 requires that excess tax benefits are recorded on the income statement as opposed to additional paid-in-capital, and treated as an operating activity on the statement of cash flows. ASU 2016-09 also allows companies to make an accounting policy election to either estimate the number of awards that are expected to vest (current U.S. GAAP) or account for forfeitures
45
when they occur. ASU 2016-09 further requires cash paid by an employer when directly withholding shares for tax-withholding purposes to be classified as a financing activity on the statement of cash flows. The standard will become effective for us in fiscal 2018. We are currently evaluating the impact this standard will have on our consolidated financial statements.
In June 2016, FASB issued ASU No. 2016-13, Financial Instruments - Credit Losses. ASU 2016-13 introduces an approach based on expected losses to estimate credit losses on certain types of financial instruments. It also modifies the impairment model for available-for-sale (AFS) debt securities and provides for a simplified accounting model for purchased financial assets with credit deterioration since their origination. The standard will become effective for us in our fiscal 2021. We do not expect this standard to have a material impact on the consolidated financial statements.
In August 2016, FASB issued ASU No. 2016-15, Classification of Certain Cash Receipts and Cash Payments. ASU 2016-15 addresses eight specific cash flow issues with the objective of reducing the existing diversity in practice. The guidance is to be applied using a retrospective transition method to each period presented. This standard will become effective for us in our fiscal 2019. We are currently evaluating the impact this standard will have on our consolidated financial statements.
In January 2017, the FASB issued ASU 2017-04, Simplifying the Test for Goodwill Impairment." ASU 2017-04 simplifies the accounting for goodwill impairments by eliminating Step 2 from the goodwill impairment test. Under the previous guidance an impairment of goodwill exists when the carrying amount of goodwill exceeds its implied fair value, whereas under the new guidance a goodwill impairment loss would be recognized if the carrying amount of the reporting unit exceeds its fair value, limited to the total amount of goodwill allocated to that reporting unit. The ASU is effective for annual and any interim impairment tests for periods beginning after December 15, 2019. Early adoption is permitted for interim or annual goodwill impairment tests performed on testing dates after January 1, 2017. We are currently evaluating the impact this standard will have on our consolidated financial statements.
Note 2 — Discontinued Operations
On January 24, 2017, the Company entered into the BER Sale Agreement with the Buyer. On April 28, 2017, we completed the sale of the Restaurants Business for an aggregate purchase price of $565,000 in cash, subject to certain adjustments set forth in the BER Sale Agreement (the “Restaurants Transaction”). The Buyer also purchased our corporate headquarters as part of the transaction.
The Restaurants Transaction was effected by (i) the sale of the Restaurants Business assets by the Company’s affiliates to Buyer and (ii) the sale by the Company of fifty percent of the equity interests in a newly formed special purpose entity that holds specified intellectual property assets used by both the Restaurants Business and the Company’s food production business. As part of the Restaurants Transaction the Company also conveyed to the Buyer the majority of working capital liabilities associated with the Restaurants Business, including outstanding payables, accrued wages, and other accrued current liabilities, other than debt.
The Company will continue to supply Bob Evans Restaurants with certain of its products under a five-year supply agreement. The supply agreement requires Bob Evans Restaurants purchase 100% of certain food products from the Company in the first year. The required percentage of purchases for those products then decreases annually, down to 25% in the final year. In fiscal years 2017, 2016 and 2015 respectively, the Company's BEF Foods business sold $22,056, $18,769 and $19,304 of products to Bob Evans Restaurants. These sales were eliminated on our Consolidated Statements of Net Income.
Additionally, pursuant to a transition services agreement, the Company will supply certain services, primarily information technology related, to Bob Evans Restaurants and will receive certain human resource, tax and accounting services from Bob Evans Restaurants. These services will be provided at cost for a period up to 18 months, which can be further extended.
Results associated with the Restaurants Business are classified as income from discontinued operations, net of income taxes, in our Consolidated Statements of Net Income. Prior year results have been adjusted to conform with the current presentation. Income from discontinued operations is comprised of the following:
46
(in thousands) | 2017 | 2016 | 2015 | ||||||||
Net Sales | $ | 876,786 | $ | 951,211 | $ | 969,878 | |||||
Costs and expenses: | |||||||||||
Cost of sales | 226,516 | 252,612 | 258,677 | ||||||||
Operating wage and fringe benefit expenses | 359,959 | 384,959 | 381,822 | ||||||||
Operating expenses | 172,717 | 169,673 | 168,610 | ||||||||
Selling, general and administrative expenses | 62,025 | 73,873 | 69,916 | ||||||||
Depreciation and amortization expense | 36,059 | 58,562 | 61,710 | ||||||||
Impairments | 522 | 8,385 | 6,100 | ||||||||
Operating Income from discontinued operations | 18,988 | 3,147 | 23,043 | ||||||||
Gain on sale of Restaurants Business | 150,167 | — | — | ||||||||
Net interest expense | 2,203 | 373 | — | ||||||||
Income from discontinued operations before income taxes | 166,952 | 2,774 | 23,043 | ||||||||
Provision (Benefit) for income taxes | 57,521 | (5,240 | ) | 1,110 | |||||||
Income from discontinued operations | $ | 109,431 | $ | 8,014 | $ | 21,933 | |||||
Selling, general and administrative expenses recorded in discontinued operations include corporate costs incurred directly in support of the Restaurants Business. In fiscal 2017, these costs included $10,818 of severance and stock compensation costs associated with corporate employees who supported the Restaurants Business.
We sold our corporate headquarters facility to the Buyer on a debt-free basis as part of the Restaurants Transaction, which required us to pay-in-full the outstanding borrowings on our Mortgage Loan prior to closing the Transaction. In accordance with ASC 205 - Presentation of Financial Statements, interest expense associated with the Mortgage Loan, which includes $972 of debt issuance amortization charges recorded upon termination of the Mortgage Loan in the fourth quarter, was allocated to discontinued operations.
See the table below for a reconciliation of the gain recorded on the sale of our Restaurants Business:
47
Net proceeds received from Restaurant Transaction (1) | $ | 539,301 | |
Restaurants Business assets: | |||
Accounts receivable | 3,522 | ||
Inventory | 8,538 | ||
Property, plant and equipment | 480,663 | ||
Other assets | 5,693 | ||
Total Restaurants Business assets | 498,416 | ||
Restaurants Business liabilities: | |||
Accounts payable | 13,813 | ||
Accrued non income taxes | 11,587 | ||
Accrued wages and benefits | 8,794 | ||
Self-insurance reserves | 8,003 | ||
Accrued gift cards | 13,810 | ||
Accrued miscellaneous liabilities | 12,455 | ||
Deferred sale leaseback gain | 51,077 | ||
Other restaurant liabilities | 7,039 | ||
Total Restaurants Business Liabilities | 126,578 | ||
Other transaction costs incurred as part of the sale of the Restaurants Business (2) | $ | 17,296 | |
Gain on sale of the Restaurants Business before income taxes | $ | 150,167 | |
(1) The proceeds received from the Restaurants Transaction are net of certain costs paid at closing, including transfer taxes and title insurance, and other working capital adjustments outlined in the BER Sale Agreement.
(2) Costs directly incurred as a result of the sale of our Restaurants Business, including investment bank fees, legal fees, professional fees and other administrative costs.
Prior to the closing of the Restaurants Transaction, these assets and liabilities were classified as held for sale in the Consolidated Balance Sheets as of January 27, 2017, in the Form 10-Q. The Company retained certain liabilities associated with the Restaurants Business, including $7,408 of liabilities for general liability and health insurance claims incurred prior to the closing of the Restaurants Transaction. Additionally we retained all liabilities related to income taxes associated with the Restaurants Business.
Proceeds from the sale of the Restaurants Business have been presented in the Consolidated Statements of Cash Flow under investing activities for fiscal year 2017. Total operating and investing cash flows of discontinued operations for fiscal years 2017, 2016 and 2015 are comprised of the following:
(in thousands) | 2017 | 2016 | 2015 | ||||||||
Net cash (used in) provided by operating activities | $ | (35,807 | ) | $ | 72,645 | $ | 123,401 | ||||
Net cash provided by (used in) investing activities | $ | 519,833 | $ | 175,816 | $ | (49,184 | ) | ||||
Net cash provided by investing activities in fiscal year 2017 includes the proceeds from the sale of the Restaurants Business, while net cash provided by investing activities in fiscal year 2016 includes approximately $197,000 of proceeds associated with our sale leaseback of 143 restaurant properties. Net cash provided by (used in) investing activities in each year is net of capital expenditures associated with the Restaurants Business.
48
Lease Guarantee
As part of the Restaurants Transaction, the Buyer assumed all operating leases associated with the Restaurants Business, including leases for the 143 restaurant properties that were sold as part of a sale leaseback transaction in the fourth quarter of fiscal 2016. The Company and BEF Foods, Inc. continue to guarantee certain payment and performance obligations associated with the lease agreements for those restaurant properties (the "Guarantee"). In the event Bob Evans Restaurants fails to meet its payment and performance obligations under these lease agreements, the Company may be required to make rent and other payments to the landlord under the requirements of the Guarantee. Should the Company, as guarantor of the lease obligations, be required to make all lease payments due for the remaining term of the lease subsequent to April 28, 2017, the maximum amount we may be required to pay is the annual rent amount, for the remainder of the lease term. The current annual rent on these leases is approximately $13,300, and will increase up to 1.5% annually based on indexed inflation. The lease term extends for approximately 19 more years as of April 28, 2017, and the Company would remain a guarantor of the leases in the event the leases are extended for a renewal period. In the event that the Company is obligated to make payments under the guarantor obligations, we believe the exposure is limited due to contractual protections and recourse available in the master lease agreements as well as the BER Sale Agreement, including a requirement of the landlord to mitigate damages by re-letting the properties in default. Bob Evans Restaurants continues to meet its obligations under these leases and there have not been any events that would indicate that they will not continue to meet the obligations of the leases. As such, we believe the fair value of the Guarantee is immaterial as of April 28, 2017.
Note 3 — Long-Term Debt and Credit Arrangements
As of April 28, 2017, long-term debt was comprised of the long term portion of a $3,000 Research and Development Investment Loan ("R&D Loan") and an interest-free loan of $1,000, due ten years from the date of borrowing, with imputed interest.
In the fourth quarter of fiscal 2017, in conjunction with the sale of our Restaurants Business, we paid all outstanding borrowings and terminated our Revolving and Restated Credit Agreement ("Credit Agreement"). Under the terms of the Credit Agreement, we were required to use proceeds from the sale of our Restaurants Business to pay off outstanding borrowings, which occurred on the date the Restaurants Transaction closed. In the fourth quarter of fiscal 2017, we also paid off all outstanding borrowings on the mortgage credit agreement on our corporate headquarters facility (the "Mortgage Loan"). Our corporate headquarters facility was sold as part of the Restaurants Transaction and the termination of the Mortgage Loan prior to closing the Restaurants Transaction was a requirement under the BER Sale Agreement. Interest expense associated with the Mortgage Loan, including the write off of unamortized debt issuance costs of $972, was recorded in the results from discontinued operations. We expensed $2,005 of unamortized debt issuance costs in the fourth quarter of fiscal 2017 associated the termination of the Credit Agreement. Interest expense associated with the Credit Agreement, including the write off of unamortized debt issuance costs, were recorded in the Net Interest Expense line of the Consolidated Statements of Net Income.
Refer to the table below for outstanding borrowings as of April 28, 2017, and April 29, 2016, respectively:
(in thousands) | April 28, 2017 | April 29, 2016 | |||||
Credit Agreement borrowings | $ | — | $ | 307,000 | |||
Mortgage Loan | — | 28,963 | |||||
R&D Loan (1) | 1,801 | 2,219 | |||||
Interest-free loan (1) | 894 | 875 | |||||
Total borrowings | 2,695 | 339,057 | |||||
Less current portion | (428 | ) | (3,419 | ) | |||
Long term debt | $ | 2,267 | $ | 335,638 | |||
(1) | The R&D Loan and Interest-free loan mature in fiscal 2021 and 2022, respectively. |
Establishment of New Credit Facility
On April 28, 2017, the Company entered into a new $300,000 Credit Facility (the “Credit Facility”). The Credit Facility represents a syndicated secured revolving credit facility under which up to $300,000 will be available, with a letter of credit sub-facility of $20,000, and an accordion option to increase the revolving credit commitment to $400,000. All obligations under the Credit Facility are unconditionally guaranteed by the Company as well as certain wholly owned subsidiaries, and is secured by a first-priority security interest in certain property and assets of the Company, including accounts receivable,
49
inventory, equipment, intellectual property and certain other assets, including stock pledges of certain material direct subsidiaries. The Credit Facility has a maturity date of April 28, 2022. We incurred financing costs of $1,542 associated with this Credit Facility, which will be amortized over the five-year term of the facility.
The primary purposes of the Credit Facility are for stand-by letters of credit in the ordinary course of business as well as working capital, capital expenditures, acquisitions, stock repurchases, dividends, including a special dividend paid to the Company’s stockholders at the close of business on June 16, 2017, and other general corporate purposes.
Borrowings under the Credit Facility bear interest, at Borrower’s option, at a rate based on the Eurodollar Rate or the Base Rate, plus a margin based on the Consolidated Leverage Ratio, as detailed in the Credit Facility, ranging from 1.25% to 2.00% per annum for Eurodollar Rate, and ranging from 0.25% to 1.00% per annum for Base Rate. Base Rate means, for any day, a fluctuating per annum rate of interest equal to the highest of (i) the Federal Funds Rate, plus 0.50%, and (ii) Bank of America, N.A.’s “prime rate”, and (iii) the Eurodollar Rate, plus 1.0%. As of April 28, 2017, the margin on LIBOR-based loans was 1.50% per annum and the margin on Base Rate-based loans was 0.50% per annum. Commitment fees payable under the Credit Facility are also based on the Consolidated Leverage Ratio and range from 0.20% per annum to 0.30% per annum of the average unused portion of the total lender commitments then in effect.
The terms of the Credit Facility provide for customary representations and warranties and affirmative covenants. The Credit Facility contains negative covenants usual and customary for a transaction of this nature. The Credit Agreement also contains financial covenants that require us to maintain a specified minimum coverage ratio of not less than 3.00 to 1.00, and a maximum leverage ratio that may not exceed 3.50 to 1.00. As of April 28, 2017, there were no outstanding borrowings on the Credit Facility and we were in compliance with all covenants. A breach of any of these covenants could result in a default under our Credit Facility, in which all amounts under the Credit Facility may become immediately due and payable, and all commitments under our Credit Facility to extend further credit may be terminated.
At April 28, 2017, we had outstanding letters of credit that totaled approximately $12,036, of which $11,736 is utilized as part of the total amount available under our Credit Facility. If certain conditions are met under these arrangements, we would be required to satisfy the obligations in cash. Due to the nature of these arrangements and based on historical experience and future expectations, we do not expect to make any significant payment outside of the terms set forth in these arrangements. Approximately $3,300 of these letters of credit were associated with our Restaurants Business and have subsequently been canceled or released.
Our combined effective annual interest rate for the now terminated Credit Agreement and Mortgage Loan was 2.37% during the year ended April 28, 2017. Interest costs of $445, $210 and $471 incurred in fiscal years 2017, 2016 and 2015, respectively, were capitalized in connection with our ERP system implementation and other construction activities. Interest paid in fiscal years 2017, 2016 and 2015 was $9,718, $10,579 and $10,399, respectively. Net interest expense from continuing operations in fiscal years 2017, 2016 and 2015 was comprised of the following:
(in thousands) | 2017 | 2016 | 2015 | ||||||||
Interest Expense: | |||||||||||
Variable-rate debt (1) | $ | 7,817 | $ | 10,925 | $ | 10,373 | |||||
Fixed-rate debt (2) | 3,213 | 2,262 | 1,177 | ||||||||
Capitalized interest | (445 | ) | (210 | ) | (471 | ) | |||||
Total Interest Expense on outstanding borrowings | 10,585 | 12,977 | 11,079 | ||||||||
Interest Income: | |||||||||||
Accretion on note receivable (3) | (1,133 | ) | (2,082 | ) | (1,859 | ) | |||||
Other (4) | (236 | ) | (468 | ) | (571 | ) | |||||
Total Interest Income | (1,369 | ) | (2,550 | ) | (2,430 | ) | |||||
Net Interest Expense | $ | 9,216 | $ | 10,427 | $ | 8,649 | |||||
(1) | Primarily interest expense on our Credit Agreement borrowings. |
(2) | Includes the amortization of debt issuance costs |
(3) | Accretion on our $30,000 note receivable, obtained as part of the sale of Mimi’s Café to Le Duff which was settled in fiscal 2017. |
(4) | Primarily interest income on the $30,000 note receivable, obtained as part of the sale of Mimi’s Café to Le Duff which was settled in fiscal 2017. |
Note 4 — Income Taxes
50
Deferred income taxes reflect the net tax effect of temporary differences between the carrying amounts of assets and liabilities for financial reporting purposes and the amounts used for income tax purposes. The amount of the deferred tax assets considered realizable could be adjusted if estimates of future taxable income during the carryforward periods are reduced or increased, or if objective negative evidence in the form of cumulative losses is no longer present and additional weight may be given to subjective evidence, such as the Company’s projections for growth. Significant components of our deferred tax liabilities and assets as of April 28, 2017, and April 29, 2016, were as follows:
(in thousands) | April 28, 2017 | April 29, 2016 | |||||
Deferred tax assets: | |||||||
Self-insurance | $ | 2,306 | $ | 5,595 | |||
Stock and deferred compensation plans | 14,034 | 12,582 | |||||
Deferred proceeds on Mimi’s Café sale | — | 3,564 | |||||
Rebates, coupons and allowances | 2,683 | 1,067 | |||||
Inventory | 2,234 | 2,605 | |||||
Wage and related liabilities | 2,511 | 3,426 | |||||
Deferred gain from sale leaseback | 769 | 22,306 | |||||
Other | 2,392 | 7,619 | |||||
Total deferred tax assets before valuation allowances | 26,929 | 58,764 | |||||
Valuation allowance | (238 | ) | (246 | ) | |||
Net deferred tax assets | $ | 26,691 | $ | 58,518 | |||
Deferred tax liabilities: | |||||||
Property, plant and equipment | $ | 19,988 | $ | 28,111 | |||
Intangibles | 1,217 | 747 | |||||
Other | 405 | 658 | |||||
Total deferred tax liabilities | 21,610 | 29,516 | |||||
Net deferred tax assets (liabilities) | $ | 5,081 | $ | 29,002 | |||
There are $568 of state net operating loss carry forwards that will expire at various times through 2036.
As of April 28, 2017, and April 29, 2016, the valuation allowance for net operating loss carryovers totaled $238 and $246, respectively. In assessing the realizability of deferred tax assets, management considers whether it is more likely than not that some or all of the deferred tax assets will be realized. The ultimate realization of deferred tax assets is dependent upon generation of future taxable income during the periods in which those temporary differences become deductible. Management considers the scheduled reversal of deferred tax liabilities, projected future taxable income, taxable income in carryback years and tax-planning strategies when making this assessment.
Significant components of the provision (benefit) for income taxes are as follows:
(in thousands) | 2017 | 2016 | 2015 | ||||||||
Current: | |||||||||||
Federal | $ | (3,647 | ) | $ | 3,714 | $ | (5,679 | ) | |||
State | (173 | ) | 873 | (779 | ) | ||||||
Total current | (3,820 | ) | 4,587 | (6,458 | ) | ||||||
Deferred: | |||||||||||
Federal | 8,364 | 1,704 | (1,922 | ) | |||||||
State | (670 | ) | 148 | (246 | ) | ||||||
Total deferred | 7,694 | 1,852 | (2,168 | ) | |||||||
Total tax provision (benefit) | $ | 3,874 | $ | 6,439 | $ | (8,626 | ) | ||||
51
Our provision for income taxes differs from the amounts computed by applying the federal statutory rate due to the following:
2017 | 2016 | 2015 | ||||||
Statutory federal tax rate | 35.0 | % | 35.0 | % | 35.0 | % | ||
State and local income tax — net | 0.9 | 3.9 | 6.8 | |||||
Domestic production activity deduction | (13.5 | ) | (11.7 | ) | 13.4 | |||
Fixed assets | — | — | 2.2 | |||||
Officers life insurance | (2.5 | ) | 2.7 | 4.4 | ||||
Other | (1.4 | ) | (1.5 | ) | (0.2 | ) | ||
Provision for income taxes | 18.5 | % | 28.4 | % | 61.6 | % | ||
Taxes paid during fiscal 2017, fiscal 2016 and fiscal 2015 were $23,743, $7,739 and $10,543, respectively.
Uncertain Tax Positions
The following table summarizes activity of the total amounts of unrecognized tax benefits:
(in thousands) | 2017 | 2016 | 2015 | ||||||||
Balance at beginning of fiscal year | $ | 4,983 | $ | 5,202 | $ | 5,952 | |||||
Additions based on tax positions related to the current year | (23 | ) | 306 | 63 | |||||||
Additions for tax positions of prior years | 308 | 149 | 551 | ||||||||
Reductions for tax positions of prior years | (227 | ) | (188 | ) | (284 | ) | |||||
Reductions due to settlements with taxing authorities | (126 | ) | (113 | ) | (672 | ) | |||||
Reductions due to statute of limitations expiration | (903 | ) | (373 | ) | (408 | ) | |||||
Balance at end of fiscal year | $ | 4,012 | $ | 4,983 | $ | 5,202 | |||||
The total amount of unrecognized tax benefits that, if recognized, would affect the effective tax rate as of April 28, 2017, April 29, 2016, and April 24, 2015, was $4,012, $4,720 and $4,939, respectively. The remaining unrecognized tax benefits relate to tax positions for which ultimate deductibility is highly certain, but for which there is uncertainty as to the timing of such deductibility. Recognition of these tax benefits would not affect our effective tax rate.
The Company believes that it is reasonable that a decrease of up to $73 to $1,554 in unrecognized tax benefits related to state exposures may be necessary in the coming year due to settlements with taxing authorities or lapses of statutes of limitations.
We recognize interest and penalties related to unrecognized tax benefits as a component of income tax expense in the Consolidated Statements of Net Income. During fiscal 2017, fiscal 2016 and fiscal 2015, we recognized $422, $50 and $166, respectively of benefits related to the adjustment of previously assessed interest and penalties. As of April 28, 2017, and April 29, 2016, we accrued approximately $368 and $790, respectively, in interest and penalties related to unrecognized tax benefits.
We file United States federal and various state and local income tax returns. Tax returns are generally subject to examination for a period of three to five years after the filing of the respective return.
Note 5 — Restructuring and Severance Charges
In fiscal 2017, we incurred charges of $6,662 related to a reduction of personnel as part of the Company's overall strategic initiatives, including the sale of the Restaurants Business (see Note 2 for additional information). Severance charges associated with employees who work in shared service functions were recorded in the S,G&A line of the Consolidated Statements of Net Income, while charges associated with employees who supported the Restaurant Business were recorded in results from discontinued operations. Liabilities for severance charges associated with restructuring activities as of April 28, 2017, were $2,800 and are recorded in the accrued wages and related liabilities line of the Consolidated Balance Sheet and we expect these liabilities to be paid in fiscal 2018.
Additionally, in each of the fourth quarters of fiscal years 2016 and 2015, we recorded charges related to a reduction of personnel at our corporate headquarters. Restructuring costs related to employees who supported our continuing operations or
52
worked in shared service functions were recorded in the S,G&A line of the Consolidated Statements of Net Income. See the table below for additional information.
Restructuring Charges | |||
Balance April 25, 2014 | $ | 1,227 | |
Restructuring and related severance charges incurred (1) | 4,340 | ||
Amounts paid | (1,849 | ) | |
Balance Adjustments | (92 | ) | |
Balance April 24, 2015 | $ | 3,626 | |
Restructuring and related severance charges incurred (1) | 2,606 | ||
Amounts paid | (3,105 | ) | |
Adjustments | (429 | ) | |
Balance April 29, 2016 | $ | 2,698 | |
Restructuring and related severance charges incurred (1) | 6,662 | ||
Amounts paid | (5,632 | ) | |
Adjustments | (928 | ) | |
Balance April 28, 2017 | $ | 2,800 | |
(1) Restructuring charges of $2,090, $972 and $3,236 were recorded in continuing operations in fiscal years 2017, 2016 and 2015, respectively, in the S,G&A line of the Consolidated Statements of Net Income. The remaining charges were recorded in the results of discontinued operations.
Note 6 — Share-Based Compensation Plans
Shared-based Employee Compensation: The Stock Compensation Topic of the FASB ASC 718 ("ASC 718") requires that we measure the cost of employee services received in exchange for an equity award, such as stock options, restricted stock awards and restricted stock units, based on the estimated fair value of the award on the grant date. The cost is recognized in the income statement over the vesting period of the award on a straight-line basis with the exception of compensation cost related to awards for retirement eligible employees, which are recognized immediately upon grant. Compensation cost recognized is based on the grant date fair value estimated in accordance with ASC 718.
On September 13, 2010, our stockholders approved the Bob Evans Farms, Inc. 2010 Equity and Cash Incentive Plan (the “2010 Plan”). Upon approval, the 2010 Plan became our primary plan under which new stock-based compensation can be granted.
The types of awards that may be granted under the 2010 Plan include: stock options, stock appreciation rights, restricted stock, restricted stock units, cash incentive awards, performance shares, performance units, and other awards. The Compensation Committee of the Board of Directors administers the 2010 Plan, including establishing the terms and conditions of the awards. The 2010 Plan allows the Compensation Committee to make awards to any of our employees, consultants, or nonemployee directors. The 2010 Plan imposes various restrictions on awards, including a maximum life of 10 years for stock options and stock appreciation rights and a minimum exercise price equal to the grant date stock price for stock options and stock appreciation rights. The remaining shares available for issue under the 2006 Equity and Cash Incentive Plan (the “2006 Plan”) became available for issuance under the 2010 Plan effective September 13, 2010.
In fiscal 2017, we granted market-based performance share units ("PSUs") and restricted stock units ("RSUs"). The PSUs granted under the 2010 Plan have market-based vesting conditions, while RSUs granted under the 2010 Plan vest ratably over three years for employees, and one year for non-employee directors of the Company. The PSUs awarded in the first quarter of fiscal 2017 were designed to vest at the end of a three-year performance period if they achieved the market-based vesting conditions. The PSUs were valued using a Monte Carlo simulation with the number of shares that ultimately vest dependent on the Company's total stockholder return, measured against the total stockholder return of a select group of peer companies over a three-year period. During fiscal years 2017, 2016 and 2015, we issued treasury shares to satisfy the vesting of restricted awards and stock option exercises.
In the third quarter of fiscal 2017, in accordance with the authority and power granted to the Compensation Committee under the terms of the 2010 Plan, the Compensation Committee approved acceleration of the vesting of all unvested RSUs,
53
RSAs and PSUs then outstanding, contingent upon and effective at the time of the closing of the Restaurants Transaction. The Compensation Committee further determined that the performance criteria applicable to each PSU was deemed satisfied, upon the closing of the Restaurants Transaction and delivery by the participant of a written agreement with the Company containing a general release of claims and certain restrictive covenants. The Compensation Committee’s decision applied to all of the Company’s outstanding RSUs, RSAs and PSUs granted to employees that were unvested at the time of the modification.
The Compensation Committee's decision resulted in a Type III modification, defined as a change from improbable to probable vesting conditions as per ASC 718, for certain employees terminated during fiscal 2017 and for employees that left the Company as part of the Restaurants Transaction. For Type III modified stock awards, we recalculated the fair value on the modification date (January 24, 2017), and accelerated the associated unrecognized stock compensation expense. RSAs and RSUs are valued based on the stock closing price on the grant date. Total stock-based compensation expense from continuing operations in fiscal years 2017, 2016 and 2015, was $7,269, $2,958 and $1,600 respectively. The related tax benefit recognized was $2,762, $1,124 and $608 in fiscal years 2017, 2016 and 2015, respectively. Expense associated with stock-based compensation is primarily reflected in S,G&A expense.
Stock Options
The following table summarizes option-related activity for fiscal 2017:
Options | Shares Subject to Options | Weighted-Average Exercise Price | |||||
Outstanding, Beginning of Year | 38,040 | $ | 33.26 | ||||
Granted | — | — | |||||
Exercised | (15,150 | ) | 34.16 | ||||
Forfeited or expired | — | — | |||||
Outstanding, End of Year | 22,890 | $ | 32.67 | ||||
Shares | Weighted-Average Exercise Price | Weighted- Average Remaining Contractual Term | Aggregate Intrinsic Value | |||||||||
Options outstanding | 22,890 | $ | 32.67 | 1.59 | $ | 780 | ||||||
Options exercisable | 22,890 | $ | 32.37 | 1.59 | $ | 780 | ||||||
As of April 28, 2017, there was no remaining unrecognized compensation cost related to outstanding stock options. The total intrinsic value of options exercised during fiscal years 2017, 2016 and 2015 was $333, $195 and $567, respectively. Cash received from the exercise of options was $518, $214 and $534 for fiscal years 2017, 2016 and 2015, respectively.
Cash flows resulting from the tax benefits of tax deductions in excess of the compensation cost recognized for those options (excess tax benefits) are classified as financing cash flows. In fiscal years 2017, 2016 and 2015, excess tax (expense) benefits of $(499), $1,661 and $228, respectively, were classified as financing cash flows in the Consolidated Statements of Cash Flows.
Restricted Stock
A summary of the status of our non-vested restricted stock awards and restricted stock units as of April 28, 2017, and changes during fiscal 2017 is presented below:
Restricted Stock Awards | Shares | Weighted-Average Grant Date Fair Value | |||||
Non-vested, Beginning of Year | 89,655 | $ | 40.93 | ||||
Granted | — | — | |||||
Vested | (85,222 | ) | 41.25 | ||||
Forfeited | (4,433 | ) | 34.74 | ||||
Non-vested, End of Year | — | $ | — | ||||
54
Restricted Stock Units | Shares | Weighted-Average Grant Date Fair Value | |||||
Non-vested, Beginning of Year | 145,118 | $ | 45.51 | ||||
Granted | 97,862 | 39.25 | |||||
Vested | (211,743 | ) | 43.55 | ||||
Forfeited | (7,418 | ) | 43.33 | ||||
Non-vested, End of Year | 23,819 | $ | 37.91 | ||||
At April 28, 2017, there was $291 of unrecognized compensation cost related to non-vested restricted stock units for our Board of Directors. This cost is expected to be recognized over a weighted-average period of 0.33 years. The total fair value of RSAs and RSUs granted during fiscal years 2017, 2016 and 2015 was $3,841, $6,092 and $4,649, respectively. The total fair value of RSAs and RSUs that vested during fiscal years 2017, 2016 and 2015 was $9,221, $5,601 and $10,136, respectively.
In addition to the shares subject to outstanding options and unvested restricted stock units and performance share units, approximately 2.9 million shares were available for grant under the 2010 Plan at April 28, 2017.
Performance Share Units
Performance Share Units | Shares | Weighted-Average Grant Date Fair Value | |||||
Non-vested, Beginning of Year | 61,746 | $ | 54.76 | ||||
Granted | 142,124 | 34.08 | |||||
Vested | (189,959 | ) | 40.19 | ||||
Forfeited | (13,911 | ) | 42.46 | ||||
Non-vested, End of Year | — | $ | — | ||||
At April 28, 2017, there was no unrecognized stock compensation expense. The total fair value of PSU awards granted during fiscal 2017 was $4,844. The total fair value of PSU awards vested during fiscal 2017 was $7,634. The weighted-average assumptions used for PSUs in the Monte Carlo simulation during fiscal 2017 were as follows:
Fiscal 2017 PSU grants | |||
Grant date market price | $ | 39.69 | |
Fair value | $ | 34.08 | |
Assumptions: | |||
Price volatility | 30.9 | % | |
Risk-free interest rate | 0.92 | % | |
Average volatility of peer companies | 36.2 | % | |
Average correlation coefficient of peer companies | 0.774 | ||
Note 7 — Other Compensation Plans
Defined Contribution Plan: We have a defined contribution plan (401(k)) that is available to substantially all employees who have at least 1,000 hours of service. Expenses related to matching contributions to these plans for continuing operations were $1,426, $988 and $946 for fiscals 2017, 2016, and 2015 respectively, and are primarily recorded within S,G&A.
Nonqualified Deferred Compensation Plans: We have three nonqualified deferred compensation plans, the Bob Evans Executive Deferral Plans I and II (collectively referred to as “BEEDP”) and Bob Evans Directors’ Deferral Plan (“BEDDP”), which provides certain executives and Board of Directors members, respectively, the opportunity to defer a portion of their current year salary or stock compensation to future years. A third party manages the investments of employee deferrals. Expenses related to investment results of these deferrals are based on the change in quoted market prices of the underlying investments elected by plan participants.
Obligations to participants who defer stock compensation through our deferral plans are satisfied only in company stock. There is no change in the vesting term for stock awards that are deferred into these plans. Obligations related to these deferred stock awards are treated as "Plan A" instruments, as defined by ASC 710. These obligations are classified as equity instruments within the Capital in excess of par value line of the Consolidated Balance Sheets. No subsequent changes in fair value are
55
recognized in the Consolidated Financial Statements for these instruments. Participants earn share-based dividend equivalents in an amount equal to the value of per-share dividends paid to common shareholders. These dividends accumulate into additional shares of common stock, and are recorded through retained earnings in the period in which dividends are paid. Vested, deferred shares are included in the denominator of basic and diluted EPS in accordance with ASC 260 - Earnings per Share. The dilutive impact of unvested, deferred stock awards is included in the denominator of our diluted EPS calculation.
Participants who defer cash compensation into our deferral plans have a range of investment options, one of which is company stock. Obligations for participants who choose this investment election are satisfied only in shares of company stock, while all other obligations are satisfied in cash. These share-based obligations are treated as "Plan B" instruments, as defined by ASC 710. These deferred compensation obligations are recorded as liabilities on the Consolidated Balance Sheets, in the deferred compensation line. We record compensation cost for subsequent changes in fair value of these obligations. Participants earn share-based dividend equivalents in an amount equal to the value of per-share dividends paid to common shareholders. These dividends accumulate into additional shares of common stock, and are recorded as compensation cost in the period in which the dividends are paid. At April 28, 2017, our deferred compensation obligation included $1,398 of share based obligations, which represents 20,949 shares. The dilutive impact of these shares are included in the denominator of our EPS calculation. Compensation cost (benefit) recognized on the adjustment of fair value for deferred awards was immaterial in the current and prior year.
Supplemental Executive Retirement Plan: The Supplemental Executive Retirement Plan ("SERP") provides awards to a limited number of executives in the form of nonqualified deferred cash compensation. Gains and losses related to these benefits and the related investment results are recorded within the S,G&A caption in the Consolidated Statements of Net Income. The SERP is frozen and no further persons can be added, and funding was reduced to a nominal amount per year for the remaining participants.
Deferred compensation liabilities expected to be satisfied in the next 12 months are classified as current liabilities in the accrued wages and other liabilities line of the Consolidated Balance Sheets. Our deferred compensation liabilities as of April 28, 2017 and April 29, 2016, consisted of the following:
(in thousands) | April 28, 2017 | April 29, 2016 | |||||
Deferred cash obligations in BEEDP and BEDDP plans | $ | 13,986 | $ | 12,845 | |||
Deferred cash obligations in SERP plan | 5,830 | 6,271 | |||||
Deferred liability for share-based obligations in BEEDP and BEDDP plans | 1,398 | 673 | |||||
Other noncurrent compensation arrangements | 110 | 100 | |||||
Total deferred compensation liabilities | 21,324 | 19,889 | |||||
Less current portion | (4,047 | ) | (2,128 | ) | |||
Noncurrent deferred compensation liabilities | $ | 17,277 | $ | 17,761 | |||
Employees who transferred to Bob Evans Restaurants as part of the Restaurants Transaction were treated as terminated employees in our deferred compensation plans and will receive payouts based on their distribution elections.
Rabbi Trust Assets: The Rabbi Trust is intended to be used as a source of funds to match respective funding obligations in our nonqualified deferred compensation plans. Assets held by the Rabbi Trust are recorded on our Consolidated Balance Sheets, and include company owned life insurance ("COLI") policies, short-term money market securities and Bob Evans common stock. The COLI policies held by the Rabbi Trust are recorded at cash surrender value on the Rabbi Trust Assets line of Consolidated Balance Sheets and totaled $22,353 and $20,662 as of April 28, 2017, and April 29, 2016, respectively. The cash receipts and payments related to the company owned life insurance policies are included in cash flows from operating activities on the Consolidated Statements of Cash Flows and changes in the cash surrender value for these assets are reflected within the S,G&A line in the Consolidated Statements of Net Income.
The short-term securities held by the Rabbi Trust are recorded at their carrying value, which approximates fair value, on the prepaid expense and other current assets line of the Consolidated Balance Sheets and totaled $984 and $3,290 as of April 28, 2017, and April 29, 2016, respectively. All assets held by the Rabbi Trust are restricted to their use as noted above.
Net expenses associated with our nonqualified deferred compensation plans include expenses associated with investment returns of our plan participants as well as premiums and administrative fees associated with the plans and our Rabbi Trust, and are offset by the investment returns on our COLI policies. Net expenses associated with our deferred compensation plans totaled $1,031, $1,162 and $1,236 in fiscal years 2017, 2016, and 2015 respectively, and are recorded within S,G&A.
56
Note 8 — Commitments and Contingencies
We are from time-to-time involved in ordinary and routine litigation, typically involving claims from customers, employees and others related to operational issues common to the food manufacturing industries, and incidental to our business. Management presently believes that the ultimate outcome of these proceedings, individually or in the aggregate, will not have a material adverse effect on our financial position, cash flows or results of operations.
In the fourth quarter of fiscal 2016, we settled a class-action related to alleged violations of the Fair Labor Standards Act by misclassifying assistant managers as exempt employees and failing to pay overtime compensation during the period of time the employee worked as an assistant manager. In fiscal 2015, we recorded a charge of $6,000 related to the settlement of this matter. In the first quarter of fiscal 2016, we reached an agreement in principle to resolve litigation matter and recorded an additional $10,500 charge. In the fourth quarter of fiscal 2016, the Court issued a Final Approval Order on the settlement and the appeals period expired. The Company recorded a favorable adjustment of $3,344 related to the final settlement of this matter in fiscal 2016.
Note 9 — Goodwill and Other Intangible Assets
The carrying value of our goodwill and other intangible assets as of the end of fiscal 2017 and fiscal 2016 is $19,673 and $19,829, respectively, and primarily represents goodwill acquired in our fiscal 2013 acquisition of Kettle Creations. We assess the carrying value of our goodwill annually or whenever circumstances indicate that a decline in the carrying value may have occurred as required under the provisions of ASC 350. In the fourth quarter of fiscal 2017 we completed our annual impairment test. There have been no impairments to our goodwill in the current or prior years
We also have a definite-lived intangible assets recorded on the Consolidated Balance Sheets consisting of noncompetition agreements that are being amortized over a 5-year life and have an immaterial remaining unamortized balance as of April 28, 2017.
Note 10 — Acquisitions
On January 24, 2017, the Company’s subsidiary BEF Foods, Inc. (“BEF Foods”) entered into a Stock Purchase Agreement (the “PFPC Agreement”) with Pineland Farms Potato Company, Inc., a Maine corporation (“PFPC”), the stockholders of PFPC party thereto (collectively, the “Sellers”), and Libra Foundation, as the Sellers’ Representative, and, solely for the purposes of guaranteeing the payment and performance obligations of BEF Foods under the PFPC Agreement, the Company. Pursuant to the PFPC Agreement, subject to the satisfaction or waiver of certain conditions, BEF Foods has purchased and acquired from the Sellers all of the equity interests of PFPC outstanding immediately after the closing , in exchange for (i) $115,000 in cash, subject to certain adjustments set forth in the PFPC Agreement, and (ii) up to an additional $25,000 in cash as potential earn-out consideration, the payment of which is subject to the achievement of certain operating EBITDA performance milestones over a consecutive twelve-month period during the 24 months following the closing. The transaction closed in the first quarter of fiscal 2018.
Note 11 — Quarterly Financial Data (Unaudited)
Summarized unaudited quarterly financial results for Fiscal 2017 and Fiscal 2016 follows (in thousands, except per share amounts):
57
First Quarter | Second Quarter | Third Quarter | Fourth Quarter | ||||||||||||||||||||||||||||
2017 | 2016 | 2017 | 2016 | 2017 | 2016 | 2017 | 2016 | ||||||||||||||||||||||||
Net Sales from Continuing Operations | $ | 85,941 | $ | 83,044 | $ | 96,158 | $ | 94,281 | $ | 112,820 | $ | 107,897 | $ | 99,923 | $ | 102,394 | |||||||||||||||
Operating Income (Loss) from Continuing Operations | $ | 8,265 | $ | 5,986 | $ | (4,768 | ) | $ | 5,330 | $ | 17,121 | $ | 11,424 | $ | 9,508 | $ | 10,334 | ||||||||||||||
Net Income (Loss) from Continuing Operations | $ | 5,298 | $ | 2,582 | $ | (4,857 | ) | $ | 1,278 | $ | 9,838 | $ | 6,416 | $ | 6,757 | $ | 5,932 | ||||||||||||||
Net Income (Loss) from Discontinued Operations | $ | 3,864 | $ | 1,698 | $ | 5,074 | $ | 5,152 | $ | (1,617 | ) | $ | 6,515 | $ | 102,110 | $ | (5,351 | ) | |||||||||||||
Consolidated Earnings Per Share - Net Income | |||||||||||||||||||||||||||||||
Basic | $ | 0.46 | $ | 0.19 | $ | 0.01 | $ | 0.29 | $ | 0.41 | $ | 0.62 | $ | 5.47 | $ | 0.03 | |||||||||||||||
Diluted | $ | 0.46 | $ | 0.19 | $ | 0.01 | $ | 0.29 | $ | 0.41 | $ | 0.62 | $ | 5.39 | $ | 0.03 | |||||||||||||||
Common stock sale prices (1) | |||||||||||||||||||||||||||||||
High | $ | 46.83 | $ | 51.88 | $ | 41.09 | $ | 49.92 | $ | 57.94 | $ | 44.34 | $ | 67.25 | $ | 48.14 | |||||||||||||||
Low | $ | 35.67 | $ | 43.02 | $ | 35.90 | $ | 42.51 | $ | 40.05 | $ | 37.51 | $ | 55.49 | $ | 38.92 | |||||||||||||||
Cash dividends paid | $ | 0.34 | $ | 0.31 | $ | 0.34 | $ | 0.31 | $ | 0.34 | $ | 0.34 | $ | 0.34 | $ | 0.34 | |||||||||||||||
(1) | Common stock sale prices are based on the market-close prices during the respective periods. |
• | Fiscal quarters represent 13-week periods, except the fourth quarter of fiscal year 2016, which was a 14-week period. |
• | Total quarterly EPS may not equal the annual amount because EPS is calculated independently for each quarter. |
• | Stock prices are high and low sale prices for our common stock as reported on the NASDAQ Stock Market (trading symbol — BOBE), which is the principal market for our common stock. |
• | The number of registered stockholders of our common stock at June 9, 2017, was 14,648. |
58
Note 12 — Subsequent Events
On May 1, 2017, we completed the acquisition of PFPC. We acquired all of the equity interests of PFPC in exchange for (i) $115,000 in cash, subject to certain adjustments set forth in the purchase agreement, and (ii) up to an additional $25,000 in cash as potential earn-out consideration, the payment of which is subject to the achievement of certain operating EBITDA performance milestones over consecutive twelve month periods during the 24 months following the closing.
The acquisition increases our side-dish production capacity and provides us the capability to produce and sell diced and shredded potato products in both the retail and food-service channels. The acquisition also diversifies our production capability by adding a second state-of-the-art potato processing facility with approximately 180 million pounds of capacity. PFPC also owns and operates a 900-acre potato farm and is surrounded by an estimated 55,000 acres of annual potato production.
On May 1, 2017, the Company’s Board of Directors announced the declaration of a special dividend in the amount of $7.50 per share on the Company’s outstanding common stock. The dividend is payable on June 16, 2017 to stockholders of record at the close of business on May 30, 2017.
On May 31, 2017, the Company’s Board of Directors announced the declaration of a quarterly cash dividend of $0.34 per share on the Company's outstanding common stock. The dividend is payable on June 26, 2017 to stockholders of record at the close of business on June 12, 2017.
59
REPORT OF INDEPENDENT REGISTERED PUBLIC ACCOUNTING FIRM
To the Board of Directors and Stockholders of Bob Evans Farms, Inc.:
We have audited the accompanying consolidated balance sheets of Bob Evans Farms, Inc. as of April 28, 2017 and April 29, 2016, and the related consolidated statements of net income, stockholders’ equity and cash flows for each of the three years in the period ended April 28, 2017. These financial statements are the responsibility of the Company’s management. Our responsibility is to express an opinion on these financial statements based on our audits.
We conducted our audits in accordance with the standards of the Public Company Accounting Oversight Board (United States). Those standards require that we plan and perform the audit to obtain reasonable assurance about whether the financial statements are free of material misstatement. An audit includes examining, on a test basis, evidence supporting the amounts and disclosures in the financial statements. An audit also includes assessing the accounting principles used and significant estimates made by management, as well as evaluating the overall financial statement presentation. We believe that our audits provide a reasonable basis for our opinion.
In our opinion, the financial statements referred to above present fairly, in all material respects, the consolidated financial position of Bob Evans Farms, Inc. at April 28, 2017, and April 29, 2016, and the consolidated results of their operations and their cash flows for each of the three years in the period ended April 28, 2017, in conformity with U.S. generally accepted accounting principles.
We have also audited, in accordance with the standards of the Public Company Accounting Oversight Board (United States), Bob Evans Farms, Inc.’s internal control over financial reporting as of April 28, 2017, based on criteria established in Internal Control - Integrated Framework issued by the Committee of Sponsoring Organizations of the Treadway Commission (2013 framework) and our report dated June 15, 2017, expressed an unqualified opinion thereon.
/s/ Ernst & Young LLP
Grandview Heights, Ohio
June 15, 2017
60
REPORT OF INDEPENDENT REGISTERED PUBLIC ACCOUNTING FIRM
To the Board of Directors and Stockholders of Bob Evans Farms, Inc.:
We have audited Bob Evans Farms, Inc.’s internal control over financial reporting as of April 28, 2017, based on criteria established in Internal Control - Integrated Framework issued by the Committee of Sponsoring Organizations of the Treadway Commission (2013 framework) (the COSO criteria). Bob Evans Farms, Inc.’s management is responsible for maintaining effective internal control over financial reporting, and for its assessment of the effectiveness of internal control over financial reporting included in the accompanying Management’s Report on Internal Control Over Financial Reporting. Our responsibility is to express an opinion on the company’s internal control over financial reporting based on our audit.
We conducted our audit in accordance with the standards of the Public Company Accounting Oversight Board (United States). Those standards require that we plan and perform the audit to obtain reasonable assurance about whether effective internal control over financial reporting was maintained in all material respects. Our audit included obtaining an understanding of internal control over financial reporting, assessing the risk that a material weakness exists, testing and evaluating the design and operating effectiveness of internal control based on the assessed risk, and performing such other procedures as we considered necessary in the circumstances. We believe that our audit provides a reasonable basis for our opinion.
A company’s internal control over financial reporting is a process designed to provide reasonable assurance regarding the reliability of financial reporting and the preparation of financial statements for external purposes in accordance with generally accepted accounting principles. A company’s internal control over financial reporting includes those policies and procedures that (1) pertain to the maintenance of records that, in reasonable detail, accurately and fairly reflect the transactions and dispositions of the assets of the company; (2) provide reasonable assurance that transactions are recorded as necessary to permit preparation of financial statements in accordance with generally accepted accounting principles, and that receipts and expenditures of the company are being made only in accordance with authorizations of management and directors of the company; and (3) provide reasonable assurance regarding prevention or timely detection of unauthorized acquisition, use, or disposition of the company’s assets that could have a material effect on the financial statements.
Because of its inherent limitations, internal control over financial reporting may not prevent or detect misstatements. Also, projections of any evaluation of effectiveness to future periods are subject to the risk that controls may become inadequate because of changes in conditions, or that the degree of compliance with the policies or procedures may deteriorate.
In our opinion, Bob Evans Farms, Inc. maintained, in all material respects, effective internal control over financial reporting as of April 28, 2017, based on the COSO criteria.
We also have audited, in accordance with the standards of the Public Company Accounting Oversight Board (United States), the consolidated balance sheets of Bob Evans Farms, Inc. as of April 28, 2017 and April 29, 2016, and the related consolidated statements of net income, stockholders’ equity and cash flows for each of the three years in the period ended April 28, 2017 of Bob Evans Farms, Inc. and our report dated June 15, 2017, expressed an unqualified opinion thereon.
/s/ Ernst & Young LLP
Grandview Heights, Ohio
June 15, 2017
61
ITEM 9. CHANGES IN AND DISAGREEMENTS WITH ACCOUNTANTS ON ACCOUNTING AND FINANCIAL DISCLOSURES
None.
ITEM 9A. CONTROLS AND PROCEDURES
Changes in Internal Control Over Financial Reporting
In the second quarter of fiscal 2017, we implemented the second phase of our ERP system which improves the efficiency of certain financial and related transaction processes. The implementation resulted in business and operational changes, which required changes to our internal controls over financial reporting. We believe we have designed adequate controls into and around the new ERP system, which includes performing significant procedures, both within the ERP and outside the ERP, to monitor, review and reconcile financial activity for fiscal 2017 to ensure ongoing reliability of our financial reporting.
Except as described above, there has been no material change in our internal control over financial reporting (as defined in Rules 13a-15(f) under the Exchange Act) during the year ended April 28, 2017, that has materially affected, or is reasonably likely to materially affect, our internal control over financial reporting.
Evaluation of Disclosure Controls and Procedures
Our management, with the participation of chief executive officer (principal executive officer) and chief financial officer (principal financial officer), has evaluated the effectiveness of our disclosure controls and procedures (as defined in Rule 13a-15(e) under the Exchange Act as of the end of the period covered by the Annual Report on Form 10-K. Based upon that evaluation, our Chairman of the Board, Chief Executive Officer and Chief Financial Officer, have concluded that:
• | information required to be disclosed by us in this Annual Report on Form 10-K and other reports that we file or submit under the Exchange Act would be accumulated and communicated to our management, including our principal executive officers and principal financial officer, as appropriate to allow timely decisions regarding required disclosure; |
• | information required to be disclosed by us in this Annual Report on Form 10-K and the other reports that we file or submit under the Exchange Act would be recorded, processed, summarized and reported within the time periods specified in the SEC’s rules and forms; and |
• | our disclosure controls and procedures were effective as of the end of the period covered by this Annual Report on Form 10-K. |
62
MANAGEMENT’S REPORT ON INTERNAL CONTROL OVER FINANCIAL REPORTING
To the Stockholders of Bob Evans Farms, Inc.:
Our management is responsible for establishing and maintaining adequate internal control over financial reporting to provide reasonable assurance regarding the reliability of our financial reporting and the preparation of financial statements for external purposes in accordance with accounting principles generally accepted in the United States. Internal control over financial reporting includes those policies and procedures that (1) pertain to the maintenance of records that in reasonable detail accurately and fairly reflect the transactions and dispositions of the assets of the company; (2) provide reasonable assurance that transactions are recorded as necessary to permit preparation of financial statements in accordance with generally accepted accounting principles and that receipts and expenditures of the company are being made only in accordance with authorizations of management and directors of the company; and (3) provide reasonable assurance regarding prevention or timely detection of the unauthorized acquisition, use or disposition of our assets that could have a material effect on the financial statements.
Because of its inherent limitations, internal control over financial reporting may not prevent or detect misstatements. Also, projections of any evaluation of effectiveness to future periods are subject to the risk that controls may become inadequate because of changes in conditions, or that the degree of compliance with the policies or procedures may deteriorate. Accordingly, even an effective system of internal control over financial reporting will provide only reasonable assurance with respect to the reliability of financial reporting and financial statement preparation.
Management assessed our internal control over financial reporting as of April 28, 2017, the end of our fiscal year. Management based its assessment on criteria established in Internal Control -Integrated Framework issued by the Committee of Sponsoring Organizations of the Treadway Commission (2013 framework). Management’s assessment included the evaluation of such elements as the design and operating effectiveness of key financial reporting controls, process documentation, accounting policies and our overall control environment. This assessment is supported by testing and monitoring performed by our internal audit function.
Based on its assessment, management concluded that our internal control over financial reporting was effective as of the end of the fiscal year ended April 28, 2017, the period covered by this Annual Report on Form 10-K, to provide reasonable assurance regarding the reliability of financial reporting and the preparation of financial statements for external reporting purposes in accordance with accounting principles generally accepted in the United States.
We reviewed the results of management’s assessment with the Audit Committee of our Board of Directors. Additionally, our independent registered public accounting firm, Ernst & Young LLP, independently assessed our internal control over financial reporting. Ernst & Young has issued a report on our internal control over financial reporting, which is included in this annual report.
/s/ J. Michael Townsley | /s/ Mark E. Hood | |
J. Michael Townsley | Mark E. Hood | |
President and Chief Executive Officer | Chief Financial Officer and Chief Administrative Officer | |
June 15, 2017
63
ITEM 9B. OTHER INFORMATION
None.
PART III
The information required by Items 10, 11, 12, 13 and 14 will be furnished pursuant to a definitive proxy statement involving the election of directors pursuant to Regulation 14A that will contain such information. Notwithstanding the foregoing, information appearing in the sections “Compensation Committee Report” and “Audit Committee Report” shall not be deemed to be incorporated by reference in this Form 10-K.
ITEM 10. DIRECTORS, EXECUTIVE OFFICERS AND CORPORATE GOVERNANCE
The information contained in our definitive proxy statement relating to the 2017 annual meeting of stockholders (the “2017 Proxy Statement”), under “SECTION 16(a) BENEFICIAL OWNERSHIP REPORTING COMPLIANCE,” “PROPOSAL 1: ELECTION OF DIRECTORS,” and “CORPORATE GOVERNANCE” under the sub-caption “Directors Serving on Boards of Other Public Companies” is incorporated herein by reference.
The information regarding our executive officers required by Item 401(a) of Regulation S-K is included in Part I of this Form 10-K under the caption “Supplemental Item. Executive Officers of Bob Evans Farms, Inc.”
Information concerning our Audit Committee and the determination by our Board of Directors that at least one member of the Audit Committee qualifies as an “audit committee financial expert” is incorporated herein by reference to the information contained in our 2017 Proxy Statement under “CORPORATE GOVERNANCE” under the sub-captions “Board Committees and Charters” and “Board Committees and Charters — Audit Committee.”
Information regarding the procedures by which our stockholders may recommend nominees to our Board of Directors is incorporated by reference to the information contained in our 2017 Proxy Statement under “CORPORATE GOVERNANCE” under the sub-caption “Board Committees and Charters — Nominating and Corporate Governance Committee.”
Our Board of Directors has adopted a Code of Conduct that applies to all directors, officers and employees, including our principal executive officer, principal financial officer and controller. The Code of Conduct is available at our website www.bobevans.com in the “Investors” section under “Corporate Governance.” To receive a copy of the Code of Conduct at no cost, contact our Legal Department at (614) 492-7415. We intend to satisfy the disclosure requirements under Item 5.05 of Form 8-K regarding amendments to, or waivers from, certain provisions of the Code of Conduct that apply to our principal executive officer, principal financial officer, principal accounting officer or controller, or persons performing similar functions, by posting such information on our website, www.bobevansgrocery.com.
64
Set forth below is a list of our directors, and their principal occupations, as of June 1, 2017:
Name | Principal Occupation | |
Douglas N. Benham | Executive Chair, Bob Evans Farms, Inc.; President and Chief Executive Officer of DNB Advisors, LLC, a restaurant industry consulting firm since 2006 | |
Charles M. Elson | Edgar S. Woolard, Jr. Chair in Corporate Governance and Director of the John L. Weinberg Center for Corporate Governance at the University of Delaware since 2000 | |
Mary Kay Haben | Retired; President of North America for the Wm. Wrigley Jr. Company, a leading confectionery company | |
David W. Head | President and Chief Executive Officer and Board Member of Primanti, Inc., a private equity-owned restaurant chain since 2013 | |
Kathleen S. Lane | Retired Executive Vice President and Chief Information Officer of TJX Companies, Inc., a specialty apparel retailer | |
Eileen A. Mallesch | Retired; Senior Vice President, Chief Financial Officer of Nationwide Property & Casualty Insurance, Nationwide Insurance | |
Larry S. McWilliams | Co-CEO of Compass Marketing, a marketing consulting firm serving a broad range of leading brands and consumer products | |
Kevin M. Sheehan | CEO of Scientific Games Corporation | |
J. Michael Townsley | President and Chief Executive Officer, Bob Evans Farms, Inc. | |
Michael F. Weinstein | Chairman and co-founder of INOV8 Beverage Consulting Group, LLC, a beverage consulting firm since 2012 | |
Paul S. Williams | Partner of Major, Lindsey and Africa, a legal executive search firm | |
ITEM 11. EXECUTIVE COMPENSATION
Information regarding the compensation of our Board of Directors is incorporated by reference to the information contained in our 2017 Proxy Statement under “CORPORATE GOVERNANCE” under the sub-caption “Director Compensation for Fiscal 2017.”
Information regarding the compensation of our executive officers is incorporated by reference to the information contained in our 2017 Proxy Statement under “COMPENSATION DISCUSSION AND ANALYSIS,” “COMPENSATION COMMITTEE REPORT” and “EXECUTIVE COMPENSATION” (including the information appearing under the sub-captions “Summary Compensation Table for Fiscal 2017, 2016 and 2015,” “All Other Compensation Table for Fiscal 2017,” “Grants of Plan-Based Awards in Fiscal 2017,” “Outstanding Equity Awards at 2017 Fiscal Year-End,” “Option Exercises and Stock Vested in Fiscal 2017,” “Nonqualified Deferred Compensation,” “Nonqualified Deferred Compensation Table for Fiscal 2017,” “Change in Control and Severance Program,” and “Potential Payouts upon Termination or Change-in-Control”).
ITEM 12. SECURITY OWNERSHIP OF CERTAIN BENEFICIAL OWNERS AND MANAGEMENT AND RELATED STOCKHOLDER MATTERS
Stock Ownership of Certain Beneficial Owners and Management
The information required by Item 403 of Regulation S-K regarding the security ownership of certain beneficial owners and management is incorporated herein by reference to the information contained in the 2017 Proxy Statement under “STOCK OWNERSHIP OF CERTAIN BENEFICIAL OWNERS AND MANAGEMENT.”
Equity Compensation Plan Information
In September 2010, our stockholders approved the Bob Evans Farms, Inc. 2010 Equity and Cash Incentive Plan (the “2010 Plan”). Our stockholders further amended the 2010 Plan in August 2013 to add 2.6 million shares to the 2010 Plan for future grants. As of April 28, 2017, there are approximately 2.9 million shares available for grant under the 2010 Plan. Currently, the 2010 Plan is the only plan under which we may issue equity securities to our directors, officers and employees.
Our stockholders approved all of our previous equity plans. These plans were terminated as to new awards when our stockholders adopted the 2010 Plan. Any shares that were available for issuance under our previous equity plans at the time they were terminated became available for issuance under the 2010 Plan.
65
The following table shows, as of April 28, 2017, the number of shares of common stock issuable upon exercise of outstanding options, the weighted-average exercise price of those options and the number of shares of common stock remaining for future issuance under the 2010 Plan, excluding shares issuable upon exercise of outstanding options.
(a) | (b) | (c) | ||||||||
Number of Securities to be Issued Upon Exercise of Options, Warrants and Rights | Weighted-Average Exercise Price of Outstanding Options, Warrants and Rights | Number of Securities Remaining Available for Future Issuance Under Equity Compensation Plans (Excluding Securities Reflected in Column (a)) | ||||||||
Equity compensation plans approved by security holders | 308,739 | (1) | $ | 32.67 | (2) | 2,877,140 | (3) | |||
Equity compensation plans not approved by security holders | N/A | N/A | N/A | |||||||
Total | 308,739 | $ | 32.67 | 2,877,140 | ||||||
(1) | Includes 22,890 common shares issuable upon exercise of stock options granted under 2006 Stock Option Plan. Also includes 262,030 of restricted stock units deferred in our Nonqualified Deferred Compensation Plans, and 23,819 outstanding, unvested restricted stock units granted under the 2010 Plan that are expected to vest in the second quarter of fiscal 2018. |
(2) | The restricted stock units and performance share units included in column (a) are not taken into account in calculating the weighted average exercise price of outstanding options |
(3) | Represents shares available for issuance under the 2010 Plan, including 940,495 shares that were made available for issuance under the 2010 Plan when the 1992 Stock Option Plan, 1993 LTIP, the 1998 Stock Option Plan, and the 2006 Plan were suspended as well as shares that became available for issuance under the 2010 Plan when outstanding awards under the 1992 Stock Option Plan, 1993 LTIP, the 1998 Stock Option Plan and the 2006 Plan expired or were otherwise forfeited. This also includes approved, but unregistered shares available for grant. Shares available for future issuance under the 2010 Plan may be granted in the form of incentive stock options, nonqualified stock options, performance shares, performance units, restricted stock, restricted stock units, stock appreciation rights or whole shares. The Company’s practice for at least the past four years is to issue only restricted stock awards, restricted stock units and performance share units. For fungible “full” value awards, such as the grant of a share of restricted stock, 2.63 shares will be deducted from the total number of authorized shares for the Equity and Cash Incentive Plan. In the case of a grant of a stock option or SAR, the share ratio is 1-to-1, so one share will be deducted from the total number of authorized shares for the Equity and Cash Incentive Plan. This reflects the different values of these types of grants. |
ITEM 13. CERTAIN RELATIONSHIPS AND RELATED TRANSACTIONS, AND DIRECTOR INDEPENDENCE
The information contained in the 2017 Proxy Statement under the captions “TRANSACTIONS WITH RELATED PERSONS” and “CORPORATE GOVERNANCE” under the sub-caption “Director Independence” is incorporated herein by reference.
ITEM 14. PRINCIPAL ACCOUNTANT FEES AND SERVICES
The information contained in the 2017 Proxy Statement under “PROPOSAL [4]: RATIFICATION OF SELECTION OF INDEPENDENT REGISTERED PUBLIC ACCOUNTING FIRM” under the captions “Preapproval of Services Performed by the Independent Registered Public Accounting Firm” and “Fees of the Independent Registered Public Accounting Firm” is incorporated herein by reference.
ITEM 15. EXHIBITS AND FINANCIAL STATEMENT SCHEDULES
(a)(1) Financial Statements
The following consolidated financial statements of Bob Evans Farms, Inc. and subsidiaries are filed as part of this Annual Report on Form 10-K under Item 8 hereof:
• | Management’s Report on Internal Control Over Financial Reporting |
• | Report of Independent Registered Public Accounting |
• | Report of Independent Registered Public Accounting Firm |
• | Consolidated Balance Sheets at April 28, 2017, and April 29, 2016 |
• | Consolidated Statements of Net Income for the fiscal years ended April 28, 2017, April 29, 2016, and April 24, 2015 |
• | Consolidated Statements of Stockholders’ Equity for the fiscal years ended April 28, 2017, April 29, 2016, and April 24, 2015 |
• | Consolidated Statements of Cash Flows for the fiscal years ended April 28, 2017, April 29, 2016, and April 24, 2015 |
• | Notes to Consolidated Financial Statements |
(a)(2) Financial Statement Schedules
66
Financial statement schedules have been omitted because they are not required or are not applicable or because the information required to be set forth therein either is not material or is included in the financial statements or notes thereto.
(a)(3) Exhibits
The accompanying Index to Exhibits is filed as part of this Annual Report on Form 10-K. Management contracts or compensatory plans or arrangements required to be filed as exhibits to this Annual Report on Form 10-K are denoted by asterisk in the Index to Exhibits.
(b) Exhibits
The accompanying Index to Exhibits is filed as part of this Annual Report on Form 10-K.
(c) Financial Statement Schedules
Not applicable.
ITEM 16. FORM 10-K SUMMARY
Not applicable.
67
SIGNATURES
Pursuant to the requirements of the Securities Exchange Act of 1934, the Registrant has duly caused this report to be signed on its behalf by the undersigned thereunto duly authorized.
BOB EVANS FARMS, INC. | |||
Date: June 15, 2017 | By: | /s/ J. Michael Townsley | |
J. Michael Townsley President and Chief Executive Officer (Principal Executive Officer) | |||
Date: June 15, 2017 | By: | /s/ Mark E. Hood | |
Mark E. Hood Chief Financial Officer and Chief Administrative Officer (Principal Financial Officer and Principal Accounting Officer) | |||
68
Pursuant to the requirements of the Securities Exchange Act of 1934, this report has been signed below by the following persons on behalf of the registrant and in the capacities and on the dates indicated.
Signature | Title | Date | ||
/s/ J. Michael Townsley | President, Chief Executive Officer and Director (Principal Executive Officer) | June 15, 2017 | ||
J. Michael Townsley | ||||
/s/ Mark E. Hood | Chief Financial Officer and Chief Administrative Officer (Principal Financial Officer and Principal Accounting Officer) | June 15, 2017 | ||
Mark E. Hood | ||||
* | June 15, 2017 | |||
Douglas N. Benham | Director | |||
* | June 15, 2017 | |||
Charles M. Elson | Director | |||
* | June 15, 2017 | |||
Mary Kay Haben | Director | |||
* | June 15, 2017 | |||
David W. Head | Director | |||
* | June 15, 2017 | |||
Kathleen S. Lane | Director | |||
* | June 15, 2017 | |||
Eileen A. Mallesch | Director | |||
* | June 15, 2017 | |||
Larry S. McWilliams | Director | |||
* | June 15, 2017 | |||
Kevin M. Sheehan | Director | |||
* | June 15, 2017 | |||
Michael F. Weinstein | Director | |||
* | June 15, 2017 | |||
Paul S. Williams | Director | |||
* By Colin M. Daly pursuant to Powers of Attorney executed by the directors and executive officers listed above, which Powers of Attorney have been filed with the Securities and Exchange Commission. | ||||
/s/ Colin M. Daly | ||||
Colin M. Daly Executive Vice President, General Counsel and Secretary | ||||
69
EXHIBIT INDEX
Exhibit Number | Description | Location | ||
2.1 | Asset and Membership Interest Purchase Agreement, dated as of January 24, 2017, by and between Bob Evans Farms, Inc. and Bob Evans Restaurants, LLC (f.k.a. BER Acquisition, LLC) | Incorporated herein by reference to Exhibit 2.1 to Bob Evans Farms, Inc.’s Current Report on Form 8-K filed January 25, 2017 (File No. 0-01667) | ||
2.2 | First Amendment to Asset and Membership Purchase Agreement, dated as of April 28, 2017, by and between Bob Evans Farms, Inc. and Bob Evans Restaurants, LLC (f.k.a. BER Acquisition, LLC) | Filed herewith | ||
2.3 | Stock Purchase Agreement, dated as of January 24, 2017, by and among BEF Foods, Inc., Pineland Farms Potato Company, Inc., the selling stockholders party thereto, Libra Foundation, in its capacity as the Sellers’ Representative, and Bob Evans Farms, Inc. | Incorporated herein by reference to Exhibit 2.2 to Bob Evans Farms, Inc.’s Current Report on Form 8-K filed January 25, 2017 (File No. 0-01667) | ||
3.1 | Amended and Restated Certificate of Incorporation of company reflecting amendments through Aug. 20, 2014. [This document represents the Company’s Certificate of Incorporation in restated format incorporating all amendments. This compiled document has not been filed with the Delaware Secretary of State.] | Incorporated herein by reference to Exhibit 3.1 to Bob Evans Farms, Inc.’s Current Report on Form 8-K/A filed September 3, 2014 (File No. 0-1667) | ||
3.2 | Amended and Restated By-Laws of Bob Evans Farms, Inc. (Effective August 20, 2014) | Incorporated herein by reference to Exhibit 3.2 to Bob Evans Farms, Inc.’s Current Report on Form 8-K filed September 3, 2014 (File No. 0-1667) | ||
4.1 | Credit Agreement, dated as of April 28, 2017, among BEF Foods Inc., as borrower; Bob Evans Farms, Inc. and certain of its subsidiaries party thereto, as guarantors; Bank of America, N.A., as administrative agent, and the other Lenders party thereto | Incorporated herein by reference to Exhibit 10.1 to Bob Evans Farms, Inc.’s Current Report on Form 8-K filed May 1, 2017 (File No. 0-01667) | ||
10.01 | Lease Guaranty, dated as of October 23, 2015, by Bob Evans Farms, Inc. for the benefit of Broadstone BEF Portfolio, LLC | Incorporated herein by reference to Exhibit 10.2 to Bob Evans Farms, Inc.’s Quarterly Report on Form 10-Q for the fiscal quarter ended October 23, 2015, filed December 2, 2015 (File No. 0-1667) | ||
10.02 | Lease Guaranty, dated as of October 23, 2015, by Bob Evans Farms, LLC for the benefit of Broadstone BEF Portfolio, LLC | Incorporated herein by reference to Exhibit 10.3 to Bob Evans Farms, Inc.’s Quarterly Report on Form 10-Q for the fiscal quarter ended October 23, 2015, filed December 2, 2015 (File No. 0-1667) | ||
10.03 | Master Lease Agreement, dated as of October 23, 2015, by and between BEF Foods, Inc. and Broadstone BEF Portfolio, LLC | Incorporated herein by reference to Exhibit 10.4 to Bob Evans Farms, Inc.’s Quarterly Report on Form 10-Q for the fiscal quarter ended October 23, 2015, filed December 2, 2015 (File No. 0-1667) | ||
10.04 | Form of Master Lease Agreement, dated as of April 14, 2016, by and between Bob Evans Farms, LLC and National Retail Properties, LP | Incorporated herein by reference to Exhibit 10.4 to Bob Evans Farms, Inc.’s Annual Report on Form 10-K for the fiscal year ended April 29, 2016, filed June 23, 2016 (File No. 0-01667) | ||
10.05 | Master Lease Agreement, dated as of April 14, 2016, by and between Bob Evans Farms, LLC and BE Portfolio, LLC | Incorporated herein by reference to Exhibit 10.5 to Bob Evans Farms, Inc.’s Annual Report on Form 10-K for the fiscal year ended April 29, 2016, filed June 23, 2016 (File No. 0-01667) | ||
10.06 | Lease Guaranty, dated as of April 14, 2016, by Bob Evans Farms, Inc. and BEF Foods, Inc. for the benefit of BE Portfolio, LLC | Incorporated herein by reference to Exhibit 10.6 to Bob Evans Farms, Inc.’s Annual Report on Form 10-K for the fiscal year ended April 29, 2016, filed June 23, 2016 (File No. 0-01667) | ||
70
Exhibit Number | Description | Location | ||
10.07 | Form of Lease Guaranty, dated as of April 14, 2016, by Bob Evans Farms, Inc. and BEF Foods, Inc. for the benefit of National Retail Properties Trust | Incorporated herein by reference to Exhibit 10.7 to Bob Evans Farms, Inc.’s Annual Report on Form 10-K for the fiscal year ended April 29, 2016, filed June 23, 2016 (File No. 0-01667) | ||
*10.08 | Employment Agreement, dated as of August 27, 2015, by and between Bob Evans Farms, Inc. and Douglas N. Benham | Incorporated herein by reference to Exhibit 10.1 to Bob Evans Farms, Inc.’s Current Report on Form 8-K filed August 28, 2015 (File No. 0-01667) | ||
*10.09 | Employment Agreement, dated as of November 14, 2015, by and between Bob Evans Farms, Inc. and Saed Mohseni | Incorporated herein by reference to Exhibit 10.1 to Bob Evans Farms, Inc.’s Current Report on Form 8-K filed November 17, 2015 (File No. 0-01667) | ||
*10.10 | Severance Agreement and General Release, dated as of [April 1], BOBE: Please confirm execution date. 2017, by and between BEF Management, Inc. and John J. Fisher | Filed herewith | ||
*10.11 | Separation Agreement, dated as of April 27, 2017, by and between Bob Evans Farms, Inc. and Saed Mohseni | Filed herewith | ||
*10.12 | Employment Agreement, dated as of April 29, 2017, by and between Bob Evans Farms, Inc. and J. Michael Townsley | Filed herewith | ||
*10.13 | Employment Agreement, dated as of April 29, 2017, by and between Bob Evans Farms, Inc. and Mark E. Hood | Filed herewith | ||
*10.14 | Employment Agreement, dated as of April 29, 2017, by and between Bob Evans Farms, Inc. and Colin M. Daly | Filed herewith | ||
*10.15 | Amended and Restated Change In Control and Severance Plan dated November 14, 2015 | Incorporated herein by reference to Exhibit 10.2 to Bob Evans Farms, Inc.’s Current Report on Form 8-K filed November 17, 2015 (File No. 0-01667) | ||
*10.16 | Bob Evans Farms, Inc. Form of Director and Officer Indemnification Agreement | Incorporated herein by reference to Exhibit 10.5 to Bob Evans Farms, Inc.’s Annual Report on Form 10-K for the fiscal year ended April 26, 2013, filed June 21, 2013 (File No. 0-01667) | ||
*10.17 | Bob Evans Farms, Inc. and Affiliates Fourth Amended and Restated Executive Deferral Program | Incorporated herein by reference to Exhibit 10.1 to Bob Evans Farms, Inc.’s Current Report on Form 8-K filed June 2, 2010 (File No. 0-01667) | ||
*10.18 | Bob Evans Farms, Inc. and Affiliates Fourth Amended and Restated Supplemental Executive Retirement Plan | Incorporated herein by reference to Exhibit 10.14 to Bob Evans Farms, Inc.’s Annual Report on Form 10-K for the fiscal year ended April 29, 2016, filed June 23, 2016 (File No. 0-01667) | ||
*10.19 | Bob Evans Farms, Inc. Amended and Restated Executive Compensation Recoupment Policy | Incorporated herein by reference to Exhibit 10.15 to Bob Evans Farms, Inc.’s Annual Report on Form 10-K for the fiscal year ended April 29, 2016, filed June 23, 2016 (File No. 0-01667) | ||
*10.20 | Bob Evans Farms, Inc. 2010 Director Deferral Program effective May 26, 2010 | Incorporated herein by reference to Exhibit 10.2 to Bob Evans Farms, Inc.’s Current Report on Form 8-K filed June 2, 2010 (File No. 0-01667) | ||
*10.21 | Bob Evans Farms, Inc. 2006 Equity and Cash Incentive Plan | Incorporated herein by reference to Exhibit 10 to Bob Evans Farms, Inc.’s Current Report on Form 8-K filed September 14, 2006 (File No. 0-01667) | ||
*10.22 | Bob Evans Farms, Inc. Amended and Restated 2006 Equity and Cash Incentive Plan (effective as of January 1, 2008) | Incorporated herein by reference to Exhibit 10.7 to Bob Evans Farms, Inc.’s Quarterly Report on Form 10-Q for the fiscal quarter ended October 26, 2007, filed December 5, 2007 (File No. 0-01667) | ||
71
Exhibit Number | Description | Location | ||
*10.23 | First Amendment to the Bob Evans Farms, Inc. Amended and Restated 2006 Equity and Cash Incentive Plan (effective as of November 18, 2008) | Incorporated herein by reference to Exhibit 10.13 to Bob Evans Farms, Inc.’s Quarterly Report on Form 10-Q for the fiscal quarter ended January 23, 2009, filed March 4, 2009 (File No. 0-01667) | ||
*10.24 | Form of Bob Evans Farms, Inc. 2006 Equity and Cash Incentive Plan Incentive Stock Option Award Agreement (for Employees - Performance Incentive Plan Award) | Incorporated herein by reference to Exhibit 10.1 to Bob Evans Farms, Inc.’s Current Report on Form 8-K filed April 25, 2007 (File No. 0-01667) | ||
*10.25 | Form of Bob Evans Farms, Inc. 2006 Equity and Cash Incentive Plan Nonqualified Stock Option Award Agreement (for Employees - Performance Incentive Plan Award) | Incorporated herein by reference to Exhibit 10.2 to Bob Evans Farms, Inc.’s Current Report on Form 8-K filed April 25, 2007 (File No. 0-01667) | ||
*10.26 | Form of Bob Evans Farms, Inc. 2006 Equity and Cash Incentive Plan Annual Bonus Award Agreement (for Employees) | Incorporated herein by reference to Exhibit 10.7 to Bob Evans Farms, Inc.’s Current Report on Form 8-K filed April 25, 2007 (File No. 0-01667) | ||
*10.27 | Form of Bob Evans Farms, Inc. 2006 Equity and Cash Incentive Plan Whole Share Award Agreement (for Employees - Performance Incentive Plan Award) | Incorporated herein by reference to Exhibit 10.4 to Bob Evans Farms, Inc.’s Current Report on Form 8-K filed May 17, 2007 (File No. 0-01667) | ||
*10.28 | Form of Bob Evans Farms, Inc. 2006 Equity and Cash Incentive Plan Restricted Stock Award Agreement (for Employees - Performance Incentive Plan Award) | Incorporated herein by reference to Exhibit 10.1 to Bob Evans Farms, Inc.’s Current Report on Form 8-K filed May 17, 2007 (File No. 0-01667) | ||
*10.29 | Form of Bob Evans Farms, Inc. 2006 Equity and Cash Incentive Plan Whole Share Award Agreement (for Employees) | Incorporated herein by reference to Exhibit 10.3 to Bob Evans Farms, Inc.’s Current Report on Form 8-K filed May 17, 2007 (File No. 0-01667) | ||
*10.30 | Form of Bob Evans Farms, Inc. 2006 Equity and Cash Incentive Plan Cash Based Award Agreement (for Employees - Performance Incentive Plan Award) | Incorporated herein by reference to Exhibit 10.5 to Bob Evans Farms, Inc.’s Current Report on Form 8-K/A filed June 21, 2007 (File No. 0-01667) | ||
*10.31 | Bob Evans Farms, Inc. Amended and Restated 2010 Equity And Cash Incentive Plan, Amended and Restated (effective as of August 21, 2013) | Incorporated herein by reference to Exhibit 10.1 to Bob Evans Farms, Inc.’s Current Report on Form 8-K filed August 23, 2013 (File No. 0-01667) | ||
*10.32 | Form of Bob Evans Farms, Inc. 2010 Equity and Cash Incentive Plan Restricted Stock Award Agreement (for Directors) | Incorporated herein by reference to Exhibit 10.3 to Bob Evans Farms, Inc.’s Form S-8 Registration Statement filed September 13, 2010 (File No. 333-169350) | ||
*10.33 | Form of Bob Evans Farms, Inc. 2010 Equity and Cash Incentive Plan Restricted Stock and Restricted Stock Unit Award Agreement (for Employees) | Incorporated herein by reference to Exhibit 10.70 to Bob Evans Farms, Inc.’s Annual Report on Form 10-K for the fiscal year ended April 29, 2011, filed June 28, 2011 (File No. 0-01667) | ||
*10.34 | Form of Bob Evans Farms, Inc. 2010 Equity and Cash Incentive Plan Performance Share and Restricted Stock Unit Award Agreement (for Employees) | Incorporated herein by reference to Exhibit 10.30 to Bob Evans Farms, Inc.’s Annual Report on Form 10-K for the fiscal year ended April 29, 2016, filed June 23, 2016 (File No. 0-01667) | ||
*10.35 | Form of Bob Evans Farms, Inc. 2010 Equity and Cash Incentive Plan Restricted Stock Unit Award Agreement - 2016 (for Employees) | Incorporated herein by reference to Exhibit 10.31 to Bob Evans Farms, Inc.’s Annual Report on Form 10-K for the fiscal year ended April 29, 2016, filed June 23 ,2016 (File No. 0-01667) | ||
21 | Subsidiaries of Bob Evans Farms, Inc. | Filed herewith | ||
23 | Consent of Independent Registered Public Accounting Firm | Filed herewith | ||
24 | Power of Attorney | Filed herewith | ||
31.1 | Rule 13a-14(a)/15d-14(a) Certification (Principal Executive Officer) | Filed herewith | ||
31.2 | Rule 13a-14(a)/15d-14(a) Certification (Principal Financial Officer) | Filed herewith | ||
72
Exhibit Number | Description | Location | ||
32.1 | Section 1350 Certification (Principal Executive Officer) | Filed herewith | ||
32.2 | Section 1350 Certification (Principal Financial Officer) | Filed herewith | ||
101.INS | XBRL Instance Document | ** | ||
101.SCH | XBRL Taxonomy Extension Schema Document | ** | ||
101.CAL | XBRL Taxonomy Extension Calculation | ** | ||
Linkbase Document | ||||
101.LAB | XBRL Taxonomy Extension Label Linkbase | ** | ||
Document | ||||
101.PRE | XBRL Taxonomy Presentation Linkbase | ** | ||
Document | ||||
101.DEF | XBRL Taxonomy Extension Definition | ** | ||
Linkbase Document | ||||
* | Denotes management contract or compensatory plan or agreement. | |||
** | In accordance with Regulation S-T, the XBRL-related information in Exhibit 101 to this Annual Report on Form 10-K shall be deemed to be furnished and not filed herewith. | |||
73