UNITED STATES
SECURITIES AND EXCHANGE COMMISSION
Washington, D.C. 20549
FORM N-CSR
CERTIFIED SHAREHOLDER REPORT OF REGISTERED
MANAGEMENT INVESTMENT COMPANIES
Investment Company Act File number: 811-03101
Calvert Management Series
(Exact Name of Registrant as Specified in Charter)
1825 Connecticut Avenue NW, Suite 400, Washington, DC 20009
(Address of Principal Executive Offices)
Deidre E. Walsh
Two International Place, Boston, Massachusetts 02110
(Name and Address of Agent for Service)
(202) 238-2200
(Registrant’s telephone number)
September 30
Date of Fiscal Year End
March 31, 2023
Date of Reporting Period
Item 1. Report to Stockholders.


| % Average Annual Total Returns1,2 | Class
Inception Date |
Performance
Inception Date |
Six Months | One Year | Five Years | Since
Inception |
| Class A at NAV | 10/10/2017 | 10/10/2017 | 6.55% | 0.95% | 2.18% | 2.24% |
| Class A with With 3.25% Maximum Sales Charge | — | — | 3.07 | (2.30) | 1.50 | 1.62 |
| Class I at NAV | 10/10/2017 | 10/10/2017 | 6.68 | 1.19 | 2.41 | 2.46 |
| Class R6 at NAV | 10/10/2017 | 10/10/2017 | 6.68 | 1.18 | 2.40 | 2.46 |
| Morningstar ® LSTA® US Leveraged Loan IndexSM | — | — | 5.94 | 2.54 | 3.63 | 3.75 |
| % Total Annual Operating Expense Ratios3 | Class A | Class I | Class R6 |
| Gross | 2.54% | 2.29% | 2.18% |
| Net | 2.32 | 2.07 | 2.07 |
| % Total Leverage4 | |
| Borrowings | 23.42% |
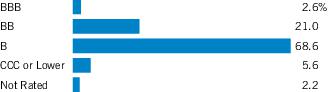
| 1 | Credit ratings are categorized using S&P Global Ratings (“S&P”). Ratings, which are subject to change, apply to the creditworthiness of the issuers of the underlying securities and not to the Fund or its shares. Credit ratings measure the quality of a bond based on the issuer’s creditworthiness, with ratings ranging from AAA, being the highest, to D, being the lowest based on S&P’s measures. Ratings of BBB or higher by S&P are considered to be investment-grade quality. Credit ratings are based largely on the ratings agency’s analysis at the time of rating. The rating assigned to any particular security is not necessarily a reflection of the issuer’s current financial condition and does not necessarily reflect its assessment of the volatility of a security’s market value or of the liquidity of an investment in the security. Holdings designated as “Not Rated” (if any) are not rated by S&P. |
| 2 | Excludes cash and cash equivalents. |
| 1 | Morningstar® LSTA® US Leveraged Loan IndexSM is an unmanaged index of the institutional leveraged loan market. Morningstar® LSTA® Leveraged Loan indices are a product of Morningstar, Inc. (“Morningstar”) and have been licensed for use. Morningstar® is a registered trademark of Morningstar licensed for certain use. Loan Syndications and Trading Association® and LSTA® are trademarks of the LSTA licensed for certain use by Morningstar, and further sublicensed by Morningstar for certain use. Neither Morningstar nor LSTA guarantees the accuracy and/or completeness of the Morningstar® LSTA® US Leveraged Loan IndexSM or any data included therein, and shall have no liability for any errors, omissions, or interruptions therein. Unless otherwise stated, index returns do not reflect the effect of any applicable sales charges, commissions, expenses, taxes or leverage, as applicable. It is not possible to invest directly in an index. |
| 2 | Total Returns at NAV do not include applicable sales charges. If sales charges were deducted, the returns would be lower. Total Returns shown with maximum sales charge reflect the stated maximum sales charge. Unless otherwise stated, performance does not reflect the deduction of taxes on Fund distributions or redemptions of Fund shares. Performance since inception for an index, if presented, is the performance since the Fund’s or oldest share class’s inception, as applicable. Due to rounding, total returns of less than 0.005% may show as 0.00%. |
| 3 | Source: Fund prospectus. Net expense ratios reflect a contractual expense reimbursement that continues through 1/31/24. The expense ratios for the current reporting period can be found in the Financial Highlights section of this report. Performance reflects expenses waived and/or reimbursed, if applicable. Without such waivers and/or reimbursements, performance would have been lower. |
| 4 | Total leverage is shown as a percentage of the Fund’s aggregate net assets plus borrowings outstanding. The Fund employs leverage through borrowings. Use of leverage creates an opportunity for income, but creates risks including greater volatility of NAV. The cost of borrowings rises and falls with changes in short-term interest rates. The Fund may be required to maintain prescribed asset coverage for its borrowings and may be required to reduce its borrowings at an inopportune time.Fund profile subject to change due to active management. |
| Beginning
Account Value (10/1/22) |
Ending
Account Value (3/31/23) |
Expenses
Paid During Period* (10/1/22 – 3/31/23) |
Annualized
Expense Ratio | |
| Actual | ||||
| Class A | $1,000.00 | $1,065.50 | $13.96 ** | 2.71% |
| Class I | $1,000.00 | $1,066.80 | $12.68 ** | 2.46% |
| Class R6 | $1,000.00 | $1,066.80 | $12.68 ** | 2.46% |
| Hypothetical | ||||
| (5% return per year before expenses) | ||||
| Class A | $1,000.00 | $1,011.42 | $13.59 ** | 2.71% |
| Class I | $1,000.00 | $1,012.67 | $12.34 ** | 2.46% |
| Class R6 | $1,000.00 | $1,012.67 | $12.34 ** | 2.46% |
| * | Expenses are equal to the Fund's annualized expense ratio for the indicated Class, multiplied by the average account value over the period, multiplied by 182/365 (to reflect the one-half year period). The Example assumes that the $1,000 was invested at the net asset value per share determined at the close of business on September 30, 2022. |
| ** | Absent a waiver and/or reimbursement of expenses by an affiliate, expenses would be higher. |
| (9) | May be deemed to be an affiliated investment company. The rate shown is the annualized seven-day yield as of March 31, 2023. |
| Abbreviations: | |
| DIP | – Debtor In Possession |
| LIBOR | – London Interbank Offered Rate |
| PIK | – Payment In Kind |
| SOFR | – Secured Overnight Financing Rate |
| Currency Abbreviations: | |
| USD | – United States Dollar |
| March 31, 2023 | |
| Assets | |
| Investments in securities of unaffiliated issuers, at value (identified cost $110,875,764) | $ 104,530,590 |
| Investments in securities of affiliated issuers, at value (identified cost $2,436,143) | 2,436,143 |
| Cash | 1,510,506 |
| Receivable for investments sold | 1,121,572 |
| Receivable for capital shares sold | 1,559,083 |
| Interest receivable | 676,007 |
| Dividends receivable - affiliated | 9,988 |
| Receivable from affiliate | 19,255 |
| Trustees' deferred compensation plan | 1,462 |
| Prepaid upfront fees on note payable | 28,606 |
| Prepaid expenses | 5,880 |
| Total assets | $111,899,092 |
| Liabilities | |
| Payable for investments purchased | $ 460,750 |
| Payable for capital shares redeemed | 121,537 |
| Distributions payable | 14,720 |
| Payable to affiliates: | |
| Investment advisory fee | 44,712 |
| Administrative fee | 8,621 |
| Distribution and service fees | 1,681 |
| Sub-transfer agency fee | 104 |
| Trustees' deferred compensation plan | 1,462 |
| Accrued expenses | 223,687 |
| Note payable | 26,000,000 |
| Total liabilities | $ 26,877,274 |
| Net Assets | $ 85,021,818 |
| Sources of Net Assets | |
| Paid-in capital | $ 95,760,585 |
| Accumulated loss | (10,738,767) |
| Net Assets | $ 85,021,818 |
| Class A Shares | |
| Net Assets | $ 7,890,804 |
| Shares Outstanding | 896,586 |
| Net
Asset Value and Redemption Price Per Share (net assets ÷ shares of beneficial interest outstanding) |
$ 8.80 |
| Maximum
Offering Price Per Share (100 ÷ 96.75 of net asset value per share) |
$ 9.10 |
| Class I Shares | |
| Net Assets | $ 47,437,399 |
| Shares Outstanding | 5,396,871 |
| Net
Asset Value, Offering Price and Redemption Price Per Share (net assets ÷ shares of beneficial interest outstanding) |
$ 8.79 |
| Class R6 Shares | |
| Net Assets | $ 29,693,615 |
| Shares Outstanding | 3,378,429 |
| Net
Asset Value, Offering Price and Redemption Price Per Share (net assets ÷ shares of beneficial interest outstanding) |
$ 8.79 |
| On sales of $50,000 or more, the offering price of Class A shares is reduced. |
| Six Months Ended | |
| March 31, 2023 | |
| Investment Income | |
| Dividend income | $ 32,760 |
| Dividend income - affiliated issuers | 58,765 |
| Interest and other income | 4,741,660 |
| Total investment income | $4,833,185 |
| Expenses | |
| Investment advisory fee | $ 277,540 |
| Administrative fee | 53,670 |
| Distribution and service fees: | |
| Class A | 9,997 |
| Trustees' fees and expenses | 3,853 |
| Custodian fees | 6,512 |
| Transfer agency fees and expenses | 26,855 |
| Accounting fees | 11,574 |
| Professional fees | 39,743 |
| Registration fees | 26,557 |
| Reports to shareholders | 3,611 |
| Interest expense and fees | 743,632 |
| Miscellaneous | 8,420 |
| Total expenses | $1,211,964 |
| Waiver and/or reimbursement of expenses by affiliate | $ (103,818) |
| Net expenses | $1,108,146 |
| Net investment income | $3,725,039 |
| Realized and Unrealized Gain (Loss) | |
| Net realized gain (loss): | |
| Investment securities | $ (747,214) |
| Net realized loss | $ (747,214) |
| Change in unrealized appreciation (depreciation): | |
| Investment securities | $ 2,916,656 |
| Net change in unrealized appreciation (depreciation) | $2,916,656 |
| Net realized and unrealized gain | $2,169,442 |
| Net increase in net assets from operations | $5,894,481 |
| Six
Months Ended March 31, 2023 (Unaudited) |
Year
Ended September 30, 2022 | |
| Increase (Decrease) in Net Assets | ||
| From operations: | ||
| Net investment income | $ 3,725,039 | $ 5,814,676 |
| Net realized loss | (747,214) | (1,639,510) |
| Net change in unrealized appreciation (depreciation) | 2,916,656 | (10,320,975) |
| Net increase (decrease) in net assets from operations | $ 5,894,481 | $ (6,145,809) |
| Distributions to shareholders: | ||
| Class A | $ (325,611) | $ (285,377) |
| Class I | (2,114,083) | (3,337,803) |
| Class R6 | (1,292,187) | (2,200,776) |
| Total distributions to shareholders | $ (3,731,881) | $ (5,823,956) |
| Capital share transactions: | ||
| Class A | $ (105,806) | $ 5,087,298 |
| Class I | (8,944,320) | (2,512,223) |
| Class R6 | (3,297,225) | (20,870,037) |
| Net decrease in net assets from capital share transactions | $(12,347,351) | $ (18,294,962) |
| Net decrease in net assets | $(10,184,751) | $ (30,264,727) |
| Net Assets | ||
| At beginning of period | $ 95,206,569 | $125,471,296 |
| At end of period | $ 85,021,818 | $ 95,206,569 |
| Six Months Ended | |
| March
31, 2023 (Unaudited) | |
| Cash Flows From Operating Activities | |
| Net increase in net assets from operations | $ 5,894,481 |
| Adjustments to reconcile net increase in net assets from operations to net cash provided by operating activities: | |
| Investments purchased | (3,088,777) |
| Investments sold and principal repayments | 18,965,530 |
| Decrease in short-term investments, net | 1,186,120 |
| Net amortization/accretion of premium (discount) | (144,047) |
| Amortization of prepaid upfront fees on note payable | 14,932 |
| Increase in interest receivable | (154,650) |
| Increase in dividends receivable - affiliated | (2,164) |
| Decrease in receivable from affiliate | 16,976 |
| Decrease in prepaid expenses | 1,858 |
| Decrease in Trustees' deferred compensation plan | 803 |
| Decrease in payable to affiliate for investment advisory fee | (7,202) |
| Decrease in payable to affiliate for administrative fee | (1,412) |
| Increase in payable to affiliate for distribution and services fees | 43 |
| Decrease in payable to affiliate for sub-transfer agency fee | (262) |
| Decrease in payable to affiliate for Trustee's deferred compensation plan | (803) |
| Increase in accrued expenses | 39,650 |
| Decrease in unfunded loan commitments | (118,224) |
| Net change in unrealized (appreciation) depreciation on investments | (2,916,656) |
| Net realized loss from investments | 747,214 |
| Net cash provided by operating activities | $ 20,433,410 |
| Cash Flows From Financing Activities | |
| Cash distributions paid to shareholders | $ (79,124) |
| Proceeds from capital shares sold | 5,731,012 |
| Capital shares redeemed | (23,151,219) |
| Prepaid upfront fees on note payable | (30,000) |
| Proceeds from note payable | 5,000,000 |
| Repayments of note payable | (9,000,000) |
| Net cash used in financing activities | $(21,529,331) |
| Net decrease in cash | $ (1,095,921) |
| Cash at beginning of period | $ 2,606,427 |
| Cash at end of period | $ 1,510,506 |
| Supplemental disclosure of cash flow information: | |
| Noncash financing activities not included herein consist of: | |
| Reinvestment of dividends and distributions | $ 3,648,247 |
| Cash paid for interest and fees on borrowings | $ 710,120 |
| Class A | ||||||
| Six
Months Ended March 31, 2023 (Unaudited) |
Year Ended September 30, | Period
Ended September 30, 2018(1) | ||||
| 2022 | 2021 | 2020 | 2019 | |||
| Net asset value — Beginning of period | $ 8.60 | $ 9.51 | $ 9.23 | $ 9.73 | $ 9.97 | $10.00 |
| Income (Loss) From Operations | ||||||
| Net investment income(2) | $ 0.35 | $ 0.43 | $ 0.35 | $ 0.39 | $ 0.47 | $ 0.38 |
| Net realized and unrealized gain (loss) | 0.21 | (0.93) | 0.29 | (0.50) | (0.24) | (0.06) |
| Total income (loss) from operations | $ 0.56 | $ (0.50) | $ 0.64 | $ (0.11) | $ 0.23 | $ 0.32 |
| Less Distributions | ||||||
| From net investment income | $ (0.36) | $ (0.41) | $ (0.36) | $ (0.39) | $ (0.47) | $ (0.35) |
| Total distributions | $ (0.36) | $ (0.41) | $ (0.36) | $ (0.39) | $ (0.47) | $ (0.35) |
| Net asset value — End of period | $ 8.80 | $ 8.60 | $ 9.51 | $ 9.23 | $ 9.73 | $ 9.97 |
| Total Return(3) | 6.55% (4) | (5.37)% | 6.99% | (1.05)% | 2.42% | 3.25% (4) |
| Ratios/Supplemental Data | ||||||
| Net assets, end of period (000’s omitted) | $7,891 | $7,809 | $3,453 | $2,329 | $3,286 | $3,090 |
| Ratios (as a percentage of average daily net assets):(5) | ||||||
| Total expenses(6) | 2.98% (7) | 1.95% | 1.51% | 1.83% | 2.29% | 2.48% (7) |
| Net expenses(6) | 2.71% (7)(8) | 1.73% (8) | 1.32% | 1.53% | 1.98% | 2.13% (7) |
| Net investment income | 8.12% (7) | 4.72% | 3.73% | 4.20% | 4.86% | 3.93% (7) |
| Portfolio Turnover | 3% (4) | 30% | 37% | 32% | 44% | 35% (4) |
| (1) | For the period from the start of business, October 10, 2017, to September 30, 2018. |
| (2) | Computed using average shares outstanding. |
| (3) | Returns are historical and are calculated by determining the percentage change in net asset value with all distributions reinvested and do not reflect the effect of sales charges, if any. |
| (4) | Not annualized. |
| (5) | Total expenses do not reflect amounts reimbursed and/or waived by the adviser and certain of its affiliates, if applicable. Net expenses are net of all reductions and represent the net expenses paid by the Fund. |
| (6) | Includes interest expense and fees and other borrowing costs of 1.66%, 0.70%, 0.31%, 0.54%, 0.96% and 1.07% for the six months ended March 31, 2023, the years ended September 30, 2022, 2021, 2020, 2019 and the period ended September 30, 2018, respectively. |
| (7) | Annualized. |
| (8) | Includes a reduction by the investment adviser of a portion of its advisory fee due to the Fund’s investment in the Liquidity Fund (equal to less than 0.01% and less than 0.005% of average daily net assets for the six months ended March 31, 2023 and the year ended September 30, 2022, respectively). |
| Class I | ||||||
| Six
Months Ended March 31, 2023 (Unaudited) |
Year Ended September 30, | Period
Ended September 30, 2018(1) | ||||
| 2022 | 2021 | 2020 | 2019 | |||
| Net asset value — Beginning of period | $ 8.59 | $ 9.50 | $ 9.22 | $ 9.73 | $ 9.97 | $ 10.00 |
| Income (Loss) From Operations | ||||||
| Net investment income(2) | $ 0.36 | $ 0.43 | $ 0.37 | $ 0.40 | $ 0.49 | $ 0.40 |
| Net realized and unrealized gain (loss) | 0.21 | (0.90) | 0.29 | (0.50) | (0.23) | (0.06) |
| Total income (loss) from operations | $ 0.57 | $ (0.47) | $ 0.66 | $ (0.10) | $ 0.26 | $ 0.34 |
| Less Distributions | ||||||
| From net investment income | $ (0.37) | $ (0.44) | $ (0.38) | $ (0.41) | $ (0.50) | $ (0.37) |
| Total distributions | $ (0.37) | $ (0.44) | $ (0.38) | $ (0.41) | $ (0.50) | $ (0.37) |
| Net asset value — End of period | $ 8.79 | $ 8.59 | $ 9.50 | $ 9.22 | $ 9.73 | $ 9.97 |
| Total Return(3) | 6.68% (4) | (5.14)% | 7.25% | (0.83)% | 2.57% | 3.48% (4) |
| Ratios/Supplemental Data | ||||||
| Net assets, end of period (000’s omitted) | $47,437 | $55,164 | $64,676 | $26,958 | $14,749 | $26,452 |
| Ratios (as a percentage of average daily net assets):(5) | ||||||
| Total expenses(6) | 2.71% (7) | 1.58% | 1.26% | 1.50% | 2.02% | 2.06% (7) |
| Net expenses(6) | 2.46% (7)(8) | 1.36% (8) | 1.07% | 1.21% | 1.70% | 1.67% (7) |
| Net investment income | 8.35% (7) | 4.69% | 3.94% | 4.34% | 5.05% | 4.10% (7) |
| Portfolio Turnover | 3% (4) | 30% | 37% | 32% | 44% | 35% (4) |
| (1) | For the period from the start of business, October 10, 2017, to September 30, 2018. |
| (2) | Computed using average shares outstanding. |
| (3) | Returns are historical and are calculated by determining the percentage change in net asset value with all distributions reinvested and do not reflect the effect of sales charges, if any. |
| (4) | Not annualized. |
| (5) | Total expenses do not reflect amounts reimbursed and/or waived by the adviser and certain of its affiliates, if applicable. Net expenses are net of all reductions and represent the net expenses paid by the Fund. |
| (6) | Includes interest expense and fees and other borrowing costs of 1.66%, 0.58%, 0.31%, 0.47%, 0.93% and 0.91% for the six months ended March 31, 2023, the years ended September 30, 2022, 2021, 2020, 2019 and the period ended September 30, 2018, respectively. |
| (7) | Annualized. |
| (8) | Includes a reduction by the investment adviser of a portion of its advisory fee due to the Fund’s investment in the Liquidity Fund (equal to less than 0.01% and less than 0.005% of average daily net assets for the six months ended March 31, 2023 and the year ended September 30, 2022, respectively). |
| Class R6 | ||||||
| Six
Months Ended March 31, 2023 (Unaudited) |
Year Ended September 30, | Period
Ended September 30, 2018(1) | ||||
| 2022 | 2021 | 2020 | 2019 | |||
| Net asset value — Beginning of period | $ 8.59 | $ 9.50 | $ 9.22 | $ 9.72 | $ 9.96 | $ 10.00 |
| Income (Loss) From Operations | ||||||
| Net investment income(2) | $ 0.36 | $ 0.42 | $ 0.38 | $ 0.41 | $ 0.50 | $ 0.37 |
| Net realized and unrealized gain (loss) | 0.21 | (0.89) | 0.28 | (0.50) | (0.24) | (0.04) |
| Total income (loss) from operations | $ 0.57 | $ (0.47) | $ 0.66 | $ (0.09) | $ 0.26 | $ 0.33 |
| Less Distributions | ||||||
| From net investment income | $ (0.37) | $ (0.44) | $ (0.38) | $ (0.41) | $ (0.50) | $ (0.37) |
| Total distributions | $ (0.37) | $ (0.44) | $ (0.38) | $ (0.41) | $ (0.50) | $ (0.37) |
| Net asset value — End of period | $ 8.79 | $ 8.59 | $ 9.50 | $ 9.22 | $ 9.72 | $ 9.96 |
| Total Return(3) | 6.68% (4) | (5.15)% | 7.26% | (0.83)% | 2.67% | 3.35% (4) |
| Ratios/Supplemental Data | ||||||
| Net assets, end of period (000’s omitted) | $29,694 | $32,233 | $57,343 | $43,899 | $32,011 | $52,592 |
| Ratios (as a percentage of average daily net assets):(5) | ||||||
| Total expenses(6) | 2.64% (7) | 1.43% | 1.19% | 1.44% | 1.99% | 1.74% (7) |
| Net expenses(6) | 2.46% (7)(8) | 1.32% (8) | 1.08% | 1.23% | 1.72% | 1.44% (7) |
| Net investment income | 8.36% (7) | 4.59% | 3.99% | 4.40% | 5.08% | 3.81% (7) |
| Portfolio Turnover | 3% (4) | 30% | 37% | 32% | 44% | 35% (4) |
| (1) | For the period from the start of business, October 10, 2017, to September 30, 2018. |
| (2) | Computed using average shares outstanding. |
| (3) | Returns are historical and are calculated by determining the percentage change in net asset value with all distributions reinvested and do not reflect the effect of sales charges, if any. |
| (4) | Not annualized. |
| (5) | Total expenses do not reflect amounts reimbursed and/or waived by the adviser and certain of its affiliates, if applicable. Net expenses are net of all reductions and represent the net expenses paid by the Fund. |
| (6) | Includes interest expense and fees and other borrowing costs of 1.66%, 0.54%, 0.32%, 0.49%, 0.95% and 0.69% for the six months ended March 31, 2023, the years ended September 30, 2022, 2021, 2020, 2019 and the period ended September 30, 2018, respectively. |
| (7) | Annualized. |
| (8) | Includes a reduction by the investment adviser of a portion of its advisory fee due to the Fund’s investment in the Liquidity Fund (equal to less than 0.01% and less than 0.005% of average daily net assets for the six months ended March 31, 2023 and the year ended September 30, 2022, respectively). |
| Asset Description | Level 1 | Level 2 | Level 3 | Total |
| Common Stocks | $ 11,962 | $ 80,949 | $ — | $ 92,911 |
| Corporate Bonds | — | 7,175,044 | — | 7,175,044 |
| Exchange-Traded Funds | 943,215 | — | — | 943,215 |
| Senior Floating-Rate Loans | — | 96,319,420 | — | 96,319,420 |
| Warrants | — | 0 | — | 0 |
| Short-Term Investments | 2,436,143 | — | — | 2,436,143 |
| Total Investments | $3,391,320 | $103,575,413 | $ — | $106,966,733 |
| Average Daily Gross Assets | Annual
Fee Rate |
| Up to and including $1 billion | 0.480% |
| In excess of $1 billion | 0.430% |
| Aggregate cost | $113,316,534 |
| Gross unrealized appreciation | $ 412,360 |
| Gross unrealized depreciation | (6,762,161) |
| Net unrealized depreciation | $ (6,349,801) |
| Name | Value,
beginning of period |
Purchases | Sales
proceeds |
Net
realized gain (loss) |
Change
in unrealized appreciation (depreciation) |
Value,
end of period |
Dividend
income |
Shares,
end of period |
| Short-Term Investments | ||||||||
| Liquidity Fund | $3,622,263 | $27,426,491 | $(28,612,611) | $ — | $ — | $2,436,143 | $58,765 | 2,436,143 |
| Six
Months Ended March 31, 2023 (Unaudited) |
Year
Ended September 30, 2022 | ||||
| Shares | Amount | Shares | Amount | ||
| Class A | |||||
| Shares sold | 75,387 | $ 655,611 | 608,355 | $ 5,661,318 | |
| Reinvestment of distributions | 35,079 | 307,061 | 30,301 | 272,944 | |
| Shares redeemed | (122,114) | (1,068,478) | (93,351) | (846,964) | |
| Net increase (decrease) | (11,648) | $ (105,806) | 545,305 | $ 5,087,298 | |
| Class I | |||||
| Shares sold | 742,293 | $ 6,482,071 | 4,863,975 | $ 45,267,890 | |
| Reinvestment of distributions | 237,702 | 2,077,701 | 360,202 | 3,279,314 | |
| Shares redeemed | (2,006,922) | (17,504,092) | (5,605,783) | (51,059,427) | |
| Net decrease | (1,026,927) | $ (8,944,320) | (381,606) | $ (2,512,223) | |
| Class R6 | |||||
| Shares sold | 104 | $ 905 | 994,285 | $ 9,309,545 | |
| Reinvestment of distributions | 144,549 | 1,263,485 | 223,961 | 2,045,111 | |
| Shares redeemed | (520,214) | (4,561,615) | (3,499,373) | (32,224,693) | |
| Net decrease | (375,561) | $ (3,297,225) | (2,281,127) | $(20,870,037) | |
| Officers |
| Hope L.
Brown Chief Compliance Officer |
| Deidre E.
Walsh Secretary, Vice President and Chief Legal Officer |
| James F.
Kirchner Treasurer |
| Trustees |
| Alice
Gresham Bullock Chairperson |
| Richard L. Baird, Jr. |
| Cari M. Dominguez |
| Theodore H. Eliopoulos*(1) |
| John G. Guffey, Jr. |
| Miles D. Harper, III |
| Joy V. Jones |
| Anthony A.
Williams |
| *Interested Trustee and President |
| (1)Mr. Eliopoulos began serving as Trustee effective December 30, 2022. |
| Privacy Notice | April 2021 |
| FACTS | WHAT
DOES EATON VANCE DO WITH YOUR PERSONAL INFORMATION? |
| Why? | Financial companies choose how they share your personal information. Federal law gives consumers the right to limit some but not all sharing. Federal law also requires us to tell you how we collect, share, and protect your personal information. Please read this notice carefully to understand what we do. |
| What? | The
types of personal information we collect and share depend on the product or service you have with us. This information can include:■ Social Security number and income ■ investment experience and risk tolerance ■ checking account number and wire transfer instructions |
| How? | All financial companies need to share customers’ personal information to run their everyday business. In the section below, we list the reasons financial companies can share their customers’ personal information; the reasons Eaton Vance chooses to share; and whether you can limit this sharing. |
| Reasons
we can share your personal information |
Does
Eaton Vance share? |
Can
you limit this sharing? |
| For our everyday business purposes — such as to process your transactions, maintain your account(s), respond to court orders and legal investigations, or report to credit bureaus | Yes | No |
| For our marketing purposes — to offer our products and services to you | Yes | No |
| For joint marketing with other financial companies | No | We don’t share |
| For our investment management affiliates’ everyday business purposes — information about your transactions, experiences, and creditworthiness | Yes | Yes |
| For our affiliates’ everyday business purposes — information about your transactions and experiences | Yes | No |
| For our affiliates’ everyday business purposes — information about your creditworthiness | No | We don’t share |
| For our investment management affiliates to market to you | Yes | Yes |
| For our affiliates to market to you | No | We don’t share |
| For nonaffiliates to market to you | No | We don’t share |
| To
limit our sharing |
Call toll-free 1-800-368-2745 or email: CRMPrivacy@calvert.comPlease note:If you are a new customer, we can begin sharing your information 30 days from the date we sent this notice. When you are no longer our customer, we continue to share your information as described in this notice. However, you can contact us at any time to limit our sharing. |
| Questions? | Call toll-free 1-800-368-2745 or email: CRMPrivacy@calvert.com |
| Privacy Notice — continued | April 2021 |
| Who we are | |
| Who is providing this notice? | Eaton Vance Management, Eaton Vance Distributors, Inc., Eaton Vance Trust Company, Eaton Vance Management (International) Limited, Eaton Vance Advisers International Ltd., Eaton Vance Global Advisors Limited, Eaton Vance Management’s Real Estate Investment Group, Boston Management and Research, Calvert Research and Management, Eaton Vance and Calvert Fund Families and our investment advisory affiliates (“Eaton Vance”) (see Investment Management Affiliates definition below) |
| What we do | |
| How
does Eaton Vance protect my personal information? |
To protect your personal information from unauthorized access and use, we use security measures that comply with federal law. These measures include computer safeguards and secured files and buildings. We have policies governing the proper handling of customer information by personnel and requiring third parties that provide support to adhere to appropriate security standards with respect to such information. |
| How
does Eaton Vance collect my personal information? |
We
collect your personal information, for example, when you■ open an account or make deposits or withdrawals from your
account ■ buy securities from us or make a wire transfer ■ give us your contact informationWe also collect your personal information from others, such as credit bureaus, affiliates, or other companies. |
| Why can’t I limit all sharing? | Federal
law gives you the right to limit only■ sharing for affiliates’ everyday business purposes — information
about your creditworthiness ■ affiliates from using your information to market to you ■ sharing for nonaffiliates to market to youState laws and individual companies may give you additional rights to limit sharing. See below for more on your rights under state law. |
| Definitions | |
| Investment
Management Affiliates |
Eaton Vance Investment Management Affiliates include registered investment advisers, registered broker- dealers, and registered and unregistered funds. Investment Management Affiliates does not include entities associated with Morgan Stanley Wealth Management, such as Morgan Stanley Smith Barney LLC and Morgan Stanley & Co. |
| Affiliates | Companies related by common ownership or control. They can be financial and nonfinancial companies.■ Our affiliates include companies with a Morgan Stanley name and financial companies such as Morgan Stanley Smith Barney LLC and Morgan Stanley & Co. |
| Nonaffiliates | Companies not related by common ownership or control. They can be financial and nonfinancial companies.■ Eaton Vance does not share with nonaffiliates so they can market to you. |
| Joint marketing | A formal agreement between nonaffiliated financial companies that together market financial products or services to you.■ Eaton Vance doesn’t jointly market. |
| Other important information | |
| Vermont: Except as permitted by law, we will not share personal information we collect about Vermont residents with Nonaffiliates unless you provide us with your written consent to share such information.California: Except as permitted by law, we will not share personal information we collect about California residents with Nonaffiliates and we will limit sharing such personal information with our Affiliates to comply with California privacy laws that apply to us. | |
Item 2. Code of Ethics.
Not required in this filing.
Item 3. Audit Committee Financial Expert.
Not required in this filing.
Item 4. Principal Accountant Fees and Services.
Not required in this filing.
Item 5. Audit Committee of Listed Registrants.
Not applicable.
Item 6. Schedule of Investments.
Please see schedule of investments contained in the Report to Shareholders included under Item 1 of this Form N-CSR.
Item 7. Disclosure of Proxy Voting Policies and Procedures for Closed-End Management Investment Companies.
Not applicable.
Item 8. Portfolio Managers of Closed-End Management Investment Companies.
Not applicable.
Item 9. Purchases of Equity Securities by Closed-End Management Investment Company and Affiliated Purchasers.
Not applicable.
Item 10. Submission of Matters to a Vote of Security Holders.
No material changes.
Item 11. Controls and Procedures.
(a) The registrant’s principal executive and principal financial officers have concluded that the registrant’s disclosure controls and procedures (as defined in Rule 30a-3(c) under the Investment Company Act of 1940 Act, as amended (the “1940 Act”) are effective, based on the evaluation of these controls and procedures required by Rule 30a-3(b) under the 1940 Act and Rules 13a-15(b) or 15d-15(b) under the Securities Exchange Act of 1934 (“Exchange Act”), as of a date within 90 days of the filing date of this report.
(b) There was no change in the registrant’s internal control over financial reporting (as defined in Rule 30a-3(d) under the 1940 Act) that occurred during the period covered by this report that has materially affected, or is reasonably likely to materially affect, the registrant’s internal control over financial reporting.
Item 12. Disclosure of Securities Lending Activities for Closed-End Management Investment Companies
Not applicable.
Item 13. Exhibits.
| (a)(1) | Registrant’s Code of Ethics- Not applicable (please see Item 2) | |
| (a)(2)(i) | President’s Section 302 certification. | |
| (a)(2)(ii) | Treasurer’s Section 302 certification. | |
| (b) | Combined Section 906 certification. |
Signatures
Pursuant to the requirements of the Securities Exchange Act of 1934 and the Investment Company Act of 1940, the registrant has duly caused this report to be signed on its behalf by the undersigned, thereunto duly authorized.
| Calvert Management Series | ||
| By: | /s/ Ted Eliopoulos | |
| Ted Eliopoulos | ||
| President | ||
Date: May 22, 2023
Pursuant to the requirements of the Securities Exchange Act of 1934 and the Investment Company Act of 1940, this report has been signed below by the following persons on behalf of the registrant and in the capacities and on the dates indicated.
| By: | /s/ Ted Eliopoulos | |
| Ted Eliopoulos | ||
| President | ||
| Date: May 22, 2023 | ||
| By: | /s/ James F. Kirchner | |
| James F. Kirchner | ||
| Treasurer | ||
| Date: May 22, 2023 | ||