UNITED STATES
SECURITIES AND EXCHANGE COMMISSION
Washington, D.C. 20549
FORM 10-K
ANNUAL REPORT PURSUANT TO SECTION 13 OR 15(d) OF THE SECURITIES EXCHANGE ACT OF 1934 | |
For the fiscal year ended December 31, 2019
or
TRANSITION REPORT PURSUANT TO SECTION 13 OR 15(d) OF THE SECURITIES EXCHANGE ACT OF 1934 | |
For the transition period from ________ to ________
Commission File Number: 1-9700
THE CHARLES SCHWAB CORPORATION
(Exact name of registrant as specified in its charter)
(State or other jurisdiction of incorporation or organization) | (I.R.S. Employer Identification No.) | ||
(Address of principal executive offices and zip code)
Registrant’s telephone number, including area code: (415 ) 667-7000
Securities registered pursuant to Section 12(b) of the Act:
Title of each class | Trading Symbol(s) | Name of each exchange on which registered |
Securities registered pursuant to Section 12(g) of the Act: None
Indicate by check mark if the registrant is a well-known seasoned issuer, as defined in Rule 405 of the Securities Act. Yes ☒ No ☐
Indicate by check mark if the registrant is not required to file reports pursuant to Section 13 or Section 15(d) of the Exchange Act. Yes ☐ No ☒
Indicate by check mark whether the registrant (1) has filed all reports required to be filed by Section 13 or 15(d) of the Securities Exchange Act of 1934 during the preceding 12 months (or for such shorter period that the registrant was required to file such reports), and (2) has been subject to such filing requirements for the past 90 days. Yes ☒ No ☐
Indicate by check mark whether the registrant has submitted electronically every Interactive Data File required to be submitted pursuant to Rule 405 of Regulation S-T during the preceding 12 months (or for such shorter period that the registrant was required to submit such files). Yes ☒ No ☐
Indicate by check mark whether the registrant is a large accelerated filer, an accelerated filer, a non-accelerated filer, a smaller reporting company, or emerging growth company. See the definitions of “large accelerated filer,” “accelerated filer,” “smaller reporting company,” and “emerging growth company” in Rule 12b-2 of the Exchange Act.
Non-accelerated filer☐ Smaller reporting company ☐
Emerging growth company ☐
If an emerging growth company, indicate by check mark if the registrant has elected not to use the extended transition period for complying with any new or revised financial accounting standards provided pursuant to Section 13(a) of the Exchange Act. ☐
Indicate by check mark whether the registrant is a shell company (as defined in Rule 12b-2 of the Exchange Act). Yes ☐ No ☒
As of June 30, 2019, the aggregate market value of the voting stock held by non-affiliates of the registrant was $47.4 billion. For purposes of this information, the outstanding shares of Common Stock owned by directors and executive officers of the registrant were deemed to be shares of the voting stock held by affiliates.
The number of shares of Common Stock outstanding as of January 31, 2020, was 1,286,215,799 .
DOCUMENTS INCORPORATED BY REFERENCE
Part III of this Form 10-K incorporates certain information contained in the registrant’s definitive proxy statement for its annual meeting of stockholders, to be held May 12, 2020, by reference to that document.
THE CHARLES SCHWAB CORPORATION
Annual Report On Form 10-K
For Fiscal Year Ended December 31, 2019
TABLE OF CONTENTS
Item 1. | ||
Item 1A. | ||
Item 1B. | ||
Item 2. | ||
Item 3. | ||
Item 4. | ||
Item 5. | ||
Item 6. | ||
Item 7. | ||
Item 7A. | ||
Item 8. | ||
Item 9. | ||
Item 9A. | ||
Item 9B. | ||
Item 10. | ||
Item 11. | ||
Item 12. | ||
Item 13. | ||
Item 14. | ||
Item 15. | ||
Item 16. | ||
THE CHARLES SCHWAB CORPORATION
PART I
Item 1. | Business |
General Corporate Overview
The Charles Schwab Corporation (CSC) is a savings and loan holding company, headquartered in San Francisco, California. CSC was incorporated in 1986 and engages, through its subsidiaries (collectively referred to as Schwab or the Company), in wealth management, securities brokerage, banking, asset management, custody, and financial advisory services. At December 31, 2019, Schwab had $4.04 trillion in client assets, 12.3 million active brokerage accounts, 1.7 million corporate retirement plan participants, and 1.4 million banking accounts.
Principal business subsidiaries of CSC include the following:
• | Charles Schwab & Co., Inc. (CS&Co), incorporated in 1971, a securities broker-dealer with over 360 domestic branch offices in 48 states, as well as a branch in the Commonwealth of Puerto Rico. In addition, Schwab serves clients through branch offices in the United Kingdom (U.K.) and Hong Kong through other subsidiaries of CSC; |
• | Charles Schwab Bank (CSB), our principal banking entity; and |
• | Charles Schwab Investment Management, Inc. (CSIM), the investment advisor for Schwab’s proprietary mutual funds (Schwab Funds®) and for Schwab’s exchange-traded funds (Schwab ETFs™). |
Schwab provides financial services to individuals and institutional clients through two segments – Investor Services and Advisor Services. The Investor Services segment provides retail brokerage and banking services to individual investors, and retirement plan services, as well as other corporate brokerage services, to businesses and their employees. The Advisor Services segment provides custodial, trading, banking, and support services, as well as retirement business services, to independent registered investment advisors (RIAs), independent retirement advisors, and recordkeepers. These services are further described in the segment discussion below.
As of December 31, 2019, Schwab had full-time, part-time, temporary employees, and persons employed on a contract basis that represented the equivalent of approximately 19,700 full-time employees.
Unless otherwise indicated, the terms “Schwab,” “the Company,” “we,” “us,” or “our” mean CSC together with its consolidated subsidiaries.
Business Acquisitions
Planned Acquisition of TD Ameritrade Holding Corporation
On November 25, 2019, CSC announced that it had entered into an Agreement and Plan of Merger (the Merger Agreement) with TD Ameritrade Holding Corporation (TD Ameritrade), pursuant to which TD Ameritrade would be acquired by CSC in an all-stock transaction. At the time of announcement, TD Ameritrade had approximately twelve million brokerage accounts and $1.3 trillion in total client assets. Under the agreement, TD Ameritrade stockholders will receive 1.0837 CSC shares for each TD Ameritrade share. Based on the closing price of CSC common stock on November 20, 2019, the merger consideration represented approximately $26 billion. The Company anticipates this transaction will add scale to help support the Company’s ongoing efforts to enhance the client experience, provide deeper resources for RIAs, and continue to improve our operating efficiency.
Upon completion of the merger, The Toronto-Dominion Bank (TD Bank), which as of January 15, 2020 beneficially-owned approximately 43.4% of TD Ameritrade’s common stock, will have an estimated aggregate ownership position of approximately 13.6% in CSC, with other TD Ameritrade stockholders and existing CSC stockholders holding approximately 17.7% and 68.7%, respectively. TD Bank’s voting stake will be capped at 9.9%, with the balance of its position held in a new, nonvoting class of Schwab common stock. Subject to certain conditions, TD Bank will have the right to designate two individuals and TD Ameritrade will have the right to designate one individual to be appointed to Schwab’s Board of Directors as of the effective time of the merger.
- 1 -
THE CHARLES SCHWAB CORPORATION
Concurrently with the execution of the merger agreement, CSC entered into the following agreements which will become effective when the merger closes:
• | Stockholder Agreement with TD Bank which governs the rights and obligations of Schwab and TD Bank with respect to the Schwab stock that will be acquired by TD Bank in the merger. The Stockholder Agreement sets out, among other things, standstill restrictions, a voting agreement and transfer restrictions. It also provides that TD Bank will have the right to designate up to two directors to be nominated for election to Schwab’s Board of Directors and be members of certain board committees, depending on TD Bank’s ownership percentage of Schwab stock. |
• | Registration Rights Agreement that provides each of TD Bank, Charles R. Schwab, and, if it elects to be a party, Schwab’s Employee Stock Ownership Plan, up to three “demand” registrations in any 12-month period and customary “piggyback” registration rights. |
• | Amended and Restated Insured Deposit Account Agreement (Amended IDA Agreement) with TD Bank USA, National Association and TD Bank, National Association (together, the Depository Institutions) which will replace the existing IDA agreement between the Depository Institutions and TD Ameritrade. Under the Amended IDA Agreement, there will be an initial period during which the amounts swept to the Depository Institutions will solely be composed of customer funds from the TD Ameritrade subsidiary broker-dealers. Following this initial period, CSC’s subsidiary broker-dealers, including the broker-dealers it will acquire from TD Ameritrade, can sweep client funds to money market deposit accounts at the Depository Institutions, subject to certain limits. |
Beginning no later than July 1, 2021, CSC’s subsidiary broker-dealers will be permitted to reduce deposit balances swept to the Depository Institutions by up to $10 billion over each rolling 12-month period, subject to the maturity of fixed-term investments and certain carry-forward and look-back requirements and a requirement to maintain an aggregate minimum required balance of $50 billion. Subject to CSC maintaining this minimum required balance at the Depository Institutions, the Amended IDA Agreement will allow CSC’s subsidiary broker-dealers to sweep their customers’ funds to CSC’s own subsidiary depository institutions, other depository institutions and other liquid investment options.
CSC will receive from the Depository Institutions an aggregate monthly fee (the Sweep Arrangement Fee) that compensates CSC for its services under the Amended IDA Agreement based on the total amount of deposits swept to the Depository Institutions each month. The Sweep Arrangement Fee will be determined by reference to certain yields based on whether the balances are fixed-term obligations or floating rate short-term obligations, less a 15 basis point service fee paid by CSC to the Depository Institutions, less FDIC deposit assessments and less interest on deposits paid to customers.
The Amended IDA Agreement will have an initial expiration date of July 1, 2031, subject to automatic renewal for a five-year term if not terminated by either CSC or the Depository Institutions two years prior to the expiration date. CSC’s subsidiary broker-dealers will be required to sweep 80% of customer balances under the Amended IDA Agreement into fixed-rate obligations until at least July 1, 2026. After July 1, 2026, they will be able to convert maturing fixed rate obligations into floating rate short-term obligations.
The obligation of the parties to consummate the merger is subject to customary closing conditions, including, among others, (i) the approval and adoption of the Merger Agreement by TD Ameritrade’s stockholders, including by the holders (other than TD Bank, certain other of TD Ameritrade stockholders who entered into voting and support agreements with CSC in connection with the merger (the Significant TD Ameritrade Stockholders) and their respective affiliates) of a majority of the outstanding shares of TD Ameritrade common stock (other than shares of TD Ameritrade common stock held by TD Bank, the Significant TD Ameritrade Stockholders and their respective affiliates), (ii) the approval by CSC’s stockholders of the issuance of CSC common shares in the transaction and an amendment to CSC’s certificate of incorporation to create CSC nonvoting common stock with 300 million shares authorized for issuance and (iii) receipt of applicable regulatory approvals. The obligation of CSC to consummate the merger is also subject to receipt of a determination or other acceptable confirmation from the Board of Governors of the Federal Reserve System (Federal Reserve) that the completion of the merger will not result in Schwab either (i) being deemed to be “controlled” by TD Bank or (ii) being deemed to be in “control” of any depository institution that may be controlled by TD Bank and to which TD Bank may cause funds to be swept under the Amended IDA Agreement, as “control” is interpreted by the Federal Reserve. With respect to the review of the transaction pursuant to the Hart-Scott-Rodino Antitrust Improvements Act of 1976, as amended (the HSR Act), on January 29, 2020, each of CSC and TD Ameritrade received a request for additional information and documentary material, often referred to as a “second request” from the Antitrust Division of the Department of Justice. CSC currently expects that the merger will be completed in the second half of 2020, subject to satisfaction of closing conditions. Under certain
- 2 -
THE CHARLES SCHWAB CORPORATION
circumstances, CSC or TD Ameritrade could be required to pay the other party a termination fee of $950 million or reimburse the other party’s fees up to $50 million.
Planned Acquisition of Assets of USAA’s Investment Management Company
On July 25, 2019, the Company announced a definitive agreement to acquire assets of USAA’s Investment Management Company (USAA-IMCO), including over one million brokerage and managed portfolio accounts with approximately $90 billion in client assets at the time of announcement, for $1.8 billion in cash. The companies have also agreed to enter into a long-term referral agreement, effective at closing of the acquisition, that would make Schwab the exclusive wealth management and brokerage provider for USAA members. The transaction is expected to close in mid-2020, subject to satisfaction of closing conditions, including regulatory approvals and the implementation of conversion plans.
Business Strategy and Competitive Environment
Schwab was founded on the belief that all Americans deserve access to a better investing experience. Although much has changed in the intervening years, our purpose remains clear – to champion every client’s goals with passion and integrity. Guided by this purpose and our vision of creating the most trusted leader in investment services, management has adopted a strategy described as “Through Clients’ Eyes.”
This strategy emphasizes placing clients’ perspectives, needs, and desires at the forefront. Because investing plays a fundamental role in building financial security, we strive to deliver a better investing experience for our clients – individual investors and the people and institutions who serve them – by disrupting longstanding industry practices on their behalf and providing superior service. We also aim to offer a broad range of products and solutions to meet client needs with a focus on transparency, value, and trust. In addition, management works to couple Schwab’s scale and resources with ongoing expense discipline to keep costs low and ensure that products and solutions are affordable as well as responsive to client needs. In combination, these are the key elements of our “no trade-offs” approach to serving investors. We believe that following this strategy is the best way to maximize our market valuation and stockholder returns over time.
Management estimates that investable wealth in the United States (U.S.) (consisting of assets in defined contribution, retail wealth management and brokerage, and registered investment advisor channels, along with bank deposits) currently exceeds $45 trillion, which means the Company’s $4.04 trillion in client assets leaves substantial opportunity for growth. Our strategy is based on the principle that developing trusted relationships will translate into more assets from both new and existing clients, ultimately driving more revenue, and along with expense discipline and thoughtful capital management, will generate earnings growth and build long-term stockholder value.
Within Investor Services, our competition in serving individual investors spans brokerage, wealth management, and asset management firms, as well as banks and trust companies. In the Advisor Services arena, we compete with institutional custodians, traditional and discount brokers, banks, and trust companies.
Across both segments, our key competitive advantages are:
• | Scale and Size of the Business – As one of the largest investment services firms in the U.S., we are able to spread operating costs and amortize new investments over a large base of clients, and harness the resources to evolve capabilities to meet client needs. |
• | Operating Efficiency – Coupled with scale, our operating efficiency and sharing of infrastructure across different businesses creates a cost advantage that enables us to competitively price products and services while profitably serving clients of various sizes across multiple channels. |
• | Operating Structure – Providing bank and asset management services to broker-dealer clients helps serve a wider array of needs, thereby deepening relationships, enhancing the stability of client assets, and enabling diversified revenue streams. |
• | Brand and Corporate Reputation – In an industry dependent on trust, Schwab’s reputation and brand across multiple constituents enable us to attract clients and employees while credibly introducing new products to the market. |
• | Service Culture – Delivering a great client experience earns the trust and loyalty of clients and increases the likelihood that those clients will refer others. |
- 3 -
THE CHARLES SCHWAB CORPORATION
• | Willingness to Disrupt – Management’s willingness to challenge the status quo, including our own business practices, to benefit clients fosters innovation and continuous improvement, which helps to attract more clients and assets. |
Sources of Net Revenues
Our three largest sources of net revenues are net interest revenue, asset management and administration fees, and trading revenue. These revenue streams are supported by the combination of bank, broker-dealer, and asset management operating subsidiaries, each of which brings specific capabilities that enable us to provide clients with the products and services they are looking for.
Net interest revenue is the difference between interest generated on interest-earning assets and interest paid on funding sources, the majority of which is derived from client cash balances awaiting investment, held by Schwab as part of clients’ overall relationship with the Company. While certain of these client cash balances are held on CS&Co’s balance sheet or swept to our money market funds, a substantial amount of existing balances – and most new inflows of cash awaiting investment – are swept to our banking subsidiaries. Interest-earning assets are primarily comprised of high-quality fixed income securities, margin loans, and bank loans.
The majority of asset management and administration fees are earned from proprietary money market mutual funds, proprietary and third-party mutual funds and exchange-traded funds (ETFs), and fee-based advisory solutions.
Trading revenue includes commissions earned for executing trades for clients in individual equities, options, futures, fixed income securities, and certain third-party mutual funds and ETFs, as well as principal transaction revenue earned primarily from actions to support client trading in fixed income securities. Effective October 7, 2019, CS&Co eliminated online trading commissions for U.S. and Canadian-listed stocks and ETFs, as well as the base charge on options. These pricing reductions are consistent with our vision of making investing accessible to all. Management believes they enhance both our value proposition and our competitive positioning, and will contribute to long-term growth in total client assets and client accounts at Schwab, thereby helping build long-term stockholder value.
Products and Services
We offer a broad range of products through intuitive end-to-end solutions, including robust digital capabilities, to address our clients’ varying investment and financial needs. Examples of these product offerings include the following:
• | Brokerage – an array of full-feature brokerage accounts with equity and fixed income trading, margin lending, options trading, and cash management capabilities including third-party certificates of deposit; |
• | Mutual funds – third-party mutual funds through the Mutual Fund Marketplace®, including non-transaction fee mutual funds through the Mutual Fund OneSource® service, which also includes proprietary mutual funds, plus mutual fund trading and clearing services to broker-dealers; |
• | Exchange-traded funds – an extensive offering of ETFs, including both proprietary and third-party ETFs; |
• | Advice solutions – managed portfolios of both proprietary and third-party mutual funds and ETFs, separately managed accounts, customized personal advice for tailored portfolios, specialized planning, and full-time portfolio management; |
• | Banking – checking and savings accounts, first lien residential real estate mortgage loans (First Mortgages), home equity lines of credit (HELOCs), and pledged asset lines (PALs); and |
• | Trust – trust custody services, personal trust reporting services, and administrative trustee services. |
These investing services are made available through two business segments – Investor Services and Advisor Services. Schwab’s major sources of revenues are generated by both of the reportable segments, based on their respective levels of client assets and activity. Revenue is attributable to a reportable segment based on which segment has the primary responsibility for serving the client. The accounting policies of the reportable segments are the same as those described in “Item 8 – Financial Statements and Supplementary Data – Notes to Consolidated Financial Statements” (Item 8) – Note 2.
Investor Services
Charles Schwab initially founded the Company over 40 years ago to provide individual investors with access to the financial markets at a reasonable cost. The Company has been expanding offerings over time in response to client needs, aiming to
- 4 -
THE CHARLES SCHWAB CORPORATION
provide a compelling and often disruptive solution in the marketplace. As products and services have evolved over the years, the Investor Services segment has expanded and now includes the Retail Investor, Retirement Plan Services, Mutual Fund Clearing Services, and Off-Platform Sales business units.
Through the Retail Investor business unit, we offer individual investors a multi-channel service delivery model, which includes online, mobile, telephone, and branch capabilities. We provide personalized service at competitive prices while giving clients the choice of where, when, and how they do business with us. Financial Consultants (FCs) in Schwab’s branches and regional telephone service centers focus on building and sustaining client relationships. We have the ability to meet client investing needs through a single ongoing point of contact, even as those needs change over time. We believe that this ability to provide those clients seeking help, guidance, or advice with an individually tailored approach – ranging from occasional consultations, to an ongoing relationship with a Schwab FC or participation in one of our advisory solutions, which include referral to an independent RIA in the Schwab Advisor Network® – is a competitive strength compared to the more fragmented or limited offerings of other firms.
Our service delivery model provides quick and efficient access to a broad lineup of information, research, tools, trade execution, and administrative services, which clients can access according to their needs. For example, clients that trade more actively can use these channels to access highly competitive pricing, expert tools, and extensive service capabilities – including experienced, knowledgeable teams of trading specialists, and integrated product offerings. Management also believes the Company is able to compete with the wide variety of financial services firms striving to attract individual client relationships by complementing these capabilities with a range of investment and banking products.
Schwab strives to educate and assist clients in reaching their financial goals. Educational tools include workshops, webcasts, podcasts, interactive courses, and online information about investing, from which Schwab does not earn revenue. Additionally, we provide various online research and analysis tools that are designed to help clients achieve better investment outcomes. As an example of such tools, Schwab Equity Ratings® is a quantitative model-based stock rating system that provides all clients with ratings on approximately 3,000 stocks, assigning each equity a single grade: A, B, C, D, or F. Schwab Equity Ratings International®, an international ranking methodology, covers stocks of approximately 4,000 foreign companies.
Clients may seek specific investment recommendations, either from time to time or on an ongoing basis. Schwab provides clients seeking advice with personalized solutions. Our approach to advice is based on long-term investment strategies and guidance on portfolio diversification and asset allocation. This approach is designed to be offered consistently across all of Schwab’s delivery channels.
Schwab Private Client™ features a personal advice relationship with a designated Private Client Advisor, supported by a team of investment professionals who provide individualized service, a customized investment strategy developed in collaboration with the client, and ongoing guidance and execution.
For clients seeking a relationship in which investment decisions are fully delegated to a financial professional, Schwab offers several alternatives. We provide investors access to professional investment management in a diversified account that is invested exclusively in either mutual funds or ETFs through the Schwab Managed Portfolios and the Windhaven Investment Management® Strategies, or equity securities and ETFs through the ThomasPartners Investment Management® Strategies. We also refer investors who want to utilize a specific third-party money manager to direct a portion of their investment assets to the Schwab Managed Account program. Schwab Intelligent Portfolios®, available since 2015, are for clients who are looking to have their assets professionally managed via a fully automated online investment advisory service. In late 2016, we introduced a hybrid advisory service, now called Schwab Intelligent Portfolios Premium™, to offer our clients an advisory service which combines unlimited guidance provided by a CERTIFIED FINANCIAL PLANNER™ and our robo-advice technology to make financial and investment planning more accessible to investors. In early 2020, we launched Schwab Intelligent Income™, a low-cost solution designed to offer a simple, modern way to generate income from existing investment portfolios. Finally, clients who want the assistance of an independent professional in managing their financial affairs may be referred to RIAs in the Schwab Advisor Network. These RIAs provide personalized portfolio management, financial planning, and wealth management solutions.
To meet the specific needs of clients who actively trade, Schwab offers integrated web- and software-based trading platforms, real-time market data, options trading, premium stock and futures research, and multi-channel access, as well as sophisticated account and trade management features, risk management and decision support tools, and dedicated personal support.
- 5 -
THE CHARLES SCHWAB CORPORATION
For U.S. clients wishing to invest in foreign equities, we offer a suite of global investing capabilities, including online access to certain foreign equity markets with the ability to trade in their local currencies. In addition, Schwab serves both foreign investors and non-English-speaking U.S. clients who wish to trade or invest in U.S. dollar-based securities. Schwab serves non-English-speaking clients, including Mandarin-, Cantonese-, Spanish-, Vietnamese-, and Portuguese-speaking clients through a combination of its branch offices, web-based and telephonic services.
We also offer equity compensation plan sponsors full-service recordkeeping for stock plans, stock options, restricted stock, performance shares, and stock appreciation rights. Specialized services for executive transactions and reporting, grant acceptance tracking, and other services are offered to employers to meet the needs of administering the reporting and compliance aspects of an equity compensation plan.
Our Retirement Plan Services business unit offers a bundled 401(k) retirement plan product that provides retirement plan sponsors with extensive investment options, trustee or custodial services, and participant-level recordkeeping. Retirement plan design features, which increase plan efficiency and achieve employer goals, are also offered, such as automatic enrollment, automatic fund mapping at conversion, and automatic contribution increases. In addition to an open architecture investment platform, we offer access to low cost index mutual funds and ETFs. Individuals investing for retirement through 401(k) plans can take advantage of bundled offerings of multiple investment choices, education, and third-party advice. This third-party advice service is delivered online, by phone, or in person, including recommendations based on the core investment fund choices in their retirement plan and specific recommended savings rates. Services also include support for Roth 401(k) accounts, profit sharing, and defined benefit plans.
Lastly, the Mutual Fund Clearing Services business unit provides open-end mutual fund trading, settlement, and related transactional services to banks, brokerage firms, and trust companies, and the Off-Platform Sales business unit offers proprietary mutual funds, ETFs, and collective trust funds outside the Company and not on the Schwab platform. They are included within the Investor Services segment given their leveraging of the products and services offered to individual investors.
Advisor Services
More than thirty years ago, Schwab supported a small group of entrepreneurial advisors who challenged the industry by creating independent firms. Through the Advisor Services segment, Schwab has become one of the largest providers of custodial, trading, banking, and support services to RIAs and their clients. We also provide retirement business services to independent retirement advisors and recordkeepers. Management believes that we can maintain our market position primarily through the efforts of our sales, support, technology, and business consulting service teams, which are dedicated to helping RIAs grow, compete, and succeed in serving their clients. In addition to focusing on superior service, we utilize technology to provide RIAs with a highly-developed, scalable platform for administering their clients’ assets easily and efficiently. Advisor Services sponsors and hosts a variety of national, regional, and local events designed to help RIAs identify and implement better ways to expand and efficiently manage their practices.
RIAs who custody client accounts at Schwab may use proprietary software that provides them with up-to-date client account information as well as trading capabilities. The Advisor Services website is the core platform for RIAs to conduct daily business activities online with Schwab, including viewing and managing client account information and accessing news and market information. The website provides account servicing capabilities for RIAs, including account opening, money movement, transfer of assets, trading, checking status, and communicating with our service team. The site provides multi-year archiving of statements, trade confirms, and tax reports, along with document search capabilities. We also provide access to integrations with third-party platforms, which support a variety of advisor needs including client relationship management, portfolio management systems, trade order management, and financial planning. In early 2019, we released Schwab Advisor Portfolio Connect®, a simplified portfolio management solution that is available free of charge to advisors to manage Schwab accounts. It delivers core capabilities and features through an intuitive modern experience, without the need to download and reconcile data.
The Advisor Services website also provides interactive tools, educational content, and thought leadership for advisors turning independent. We offer a variety of services to help RIAs grow and manage their practices, including business, technology, and operations consulting on a range of topics critical to an RIA’s success, as well as an annual RIA benchmarking study to help firms understand key business metrics relative to peers. We also offer an array of services to help advisors establish their own independent practices through a robust prospect consulting offer. To support them
- 6 -
THE CHARLES SCHWAB CORPORATION
throughout their transition, we offer access to business start-up and transition consultants, technology engineers, and dedicated service teams.
Schwab provides extensive educational materials, programs, and events to RIAs seeking to expand their knowledge of industry issues and trends, as well as sharpen their individual expertise and practice management skills. We conduct industry research on an ongoing basis, and hold a series of events and conferences every year to discuss topics of interest to RIAs, including business strategies and best practices. Schwab sponsors and hosts the annual IMPACT® conference, which provides a national forum for the Company, RIAs, and other industry participants to gather and share information and insights, as well as a multitude of smaller events across the country each year.
RIAs and their clients have access to our broad range of products and services, including individual securities, mutual funds, ETFs, fixed income products, managed accounts, cash products, bank lending, and trust services. By functioning as the custodian, Schwab earns revenue associated with the underlying client assets, predominantly through net interest revenue and asset management and administration fees. In this capacity, we do not charge the RIA or end client a custody fee.
The Advisor Services segment also includes the Retirement Business Services and Corporate Brokerage Retirement Services business units. Retirement Business Services provides trust, custody, and retirement business services to independent retirement plan advisors and independent recordkeepers. Retirement plan assets are held at the Business Trust division of CSB. The Company and independent retirement plan providers work together to serve plan sponsors, combining the consulting and administrative expertise of the administrator with our investment, technology, trust, and custodial services. Retirement Business Services also offers the Schwab Personal Choice Retirement Account®, a self-directed brokerage offering for retirement plans.
Corporate Brokerage Retirement Services serves plan sponsors, advisors, and independent recordkeepers seeking a brokerage-based account to hold retirement plan assets. Retirement plans held at Schwab are either self-trusteed or trusteed by a separate, independent trustee. Corporate Brokerage Retirement Services also offers the Schwab Personal Choice Retirement Account®, and the Company Retirement Account, both of which are self-directed brokerage-based solutions designed to hold the assets of company-sponsored retirement plans.
Regulation
As a participant in the securities, banking and financial services industries, Schwab is subject to extensive regulation under both federal and state laws by governmental agencies, supervisory authorities, and self-regulatory organizations (SROs). We are also subject to oversight by regulatory bodies in other countries in which we operate. These regulations affect our business operations and impose capital, client protection, and market conduct requirements.
Holding Company and Bank Regulation
CSC is a savings and loan holding company and is regulated, supervised, and examined by the Federal Reserve. CSC’s principal depository institution subsidiary, CSB, is a federal savings bank and is regulated, supervised, and examined by the Office of the Comptroller of the Currency (OCC), the Consumer Financial Protection Bureau (CFPB), and the Federal Deposit Insurance Corporation (FDIC). CSC and CSB are also subject to regulation and various requirements and restrictions under state and other federal laws.
This regulatory framework is designed to protect depositors and consumers, the safety and soundness of depository institutions and their holding companies, and the stability of the banking system as a whole. This framework affects the activities and investments of CSC and its subsidiaries and gives the regulatory authorities broad discretion in connection with their supervisory, examination and enforcement activities and policies. Below is a discussion of significant regulations. Also see “Item 7 – Management’s Discussion and Analysis of Financial Condition and Results of Operations – Current Regulatory Environment and Other Developments” for information regarding significant proposed rulemaking related to our regulation.
Regulatory Capital and Liquidity Framework
Banking organizations are subject to the regulatory capital rules issued by the Federal Reserve and other U.S. banking regulators, including the OCC and the FDIC. In addition to minimum risk-based capital requirements, banking organizations
- 7 -
THE CHARLES SCHWAB CORPORATION
must hold additional capital, referred to as a capital conservation buffer, to avoid being subject to limits on capital distributions and discretionary bonus payments to executive officers.
During 2019, depository institutions and their holding companies with consolidated total assets of $250 billion or more, or total on-balance-sheet foreign exposure of $10 billion or more, were required to calculate their regulatory capital and risk-weighted assets using both a “standardized approach” and an “advanced approaches” framework and to satisfy the minimum capital requirements under both approaches. Such companies were also required to maintain a minimum supplementary leverage ratio of at least 3.0%, include accumulated other comprehensive income (AOCI) in their calculation of their capital ratios, were subject to an incremental capital buffer of up to 2.5% of common equity Tier 1 capital if imposed by the banking agencies, referred to as the countercyclical capital buffer, and were subject to certain other enhanced provisions, including additional reporting requirements. The Federal Reserve, OCC, and FDIC all granted extensions and exemptions to CSC and its banking subsidiaries such that they would not be subject to the advanced approaches framework until June 30, 2020. As a result of crossing the $250 billion threshold in 2018, CSC and its banking subsidiaries in 2019 became subject to all other advanced approaches requirements – the supplementary leverage ratio, the inclusion of AOCI in the calculation of capital ratios, and the countercyclical capital buffer.
The full liquidity coverage ratio (LCR) rule required banking organizations with consolidated total assets of $250 billion or more, or total on-balance-sheet foreign exposure of $10 billion or more and their depository institution subsidiaries with $10 billion or more in total consolidated assets to hold high quality liquid assets (HQLA) in an amount equal to at least 100% of their projected net cash outflows over a prospective 30-calendar-day period of acute liquidity stress, calculated on each business day. CSC became subject to the full LCR rule in the second quarter of 2019 but until the beginning of 2020 was only required to calculate and comply with its LCR requirement as of the last business day of each calendar month.
In October 2019, the Federal Reserve, OCC, and FDIC jointly adopted a final rule which became effective on December 31, 2019 (interagency regulatory capital and liquidity rules) that revised the regulatory capital and liquidity requirements for large U.S. banking organizations with $100 billion or more in total consolidated assets. The rules established four risk-based categories for determining the regulatory capital and liquidity requirements applicable to these institutions based on their total assets, cross-jurisdictional activity, weighted short-term wholesale funding, nonbank assets, and off-balance sheet exposure. CSC is subject to the requirements under Category III based on its total consolidated assets of between $250 billion and less than $700 billion and having less than $75 billion in cross-jurisdictional activity.
Capital requirements for Category III banking organizations include the generally applicable risk-based capital and Tier 1 Leverage Ratio requirements (the “standardized approach” framework), the minimum 3.0% supplementary leverage ratio, and the countercyclical capital buffer which is currently 0%. Category III organizations are no longer subject to the “advanced approaches” regulatory capital framework and are permitted to opt out of including AOCI in their regulatory capital calculations. CSC made this opt out election, and commencing with the first quarter of 2020, now excludes AOCI from its regulatory capital.
As revised by the interagency regulatory capital and liquidity rules, Category III banking organizations with less than $75 billion in weighted short-term wholesale funding, which includes CSC, and their depository institution subsidiaries with $10 billion or more in total consolidated assets are subject to a reduced LCR rule requiring them to hold HQLA in an amount equal to at least 85% of their projected net cash outflows over a prospective 30-calendar-day period of acute liquidity stress, calculated on each business day. If an institution’s weighted short-term wholesale funding is $75 billion or more, it will be required to comply with the full LCR rule and hold HQLA in an amount equal to 100% of its projected 30-day net cash outflows and will also be subject to daily (instead of monthly) liquidity reporting.
Capital Stress Testing
During 2019, savings and loan and bank holding companies and insured depository institutions with total consolidated assets of more than $10 billion were required to conduct annual company-run stress tests using certain scenarios and prescribed stress-testing methodologies under the Dodd-Frank Act Stress Test rules. CSC reported the results to the Federal Reserve and CSB reported the results to the OCC. Both published summaries of their stress test results.
In final enhanced prudential standards rules adopted concurrently in October 2019 with the interagency regulatory capital and liquidity rules, the Federal Reserve revised the capital stress testing regime applicable to savings and loan holding companies. Under the new Federal Reserve enhanced prudential standards rules, savings and loan holding companies that are Category III banking organizations are required to conduct biennial company-run stress tests in even-numbered years
- 8 -
THE CHARLES SCHWAB CORPORATION
beginning in 2020. CSC will continue to be required to report the results of its stress testing to the Federal Reserve and publish a summary of its stress test results. In accordance with the Economic Growth, Regulatory Relief, and Consumer Protection Act enacted in May 2018, the OCC also adopted amendments to its company-run stress testing rule in October 2019, increasing the minimum threshold for Federal savings associations to conduct stress tests from $10 billion to $250 billion in consolidated assets. As a result, CSB is currently not subject to any company-run stress testing requirements.
In its enhanced prudential standards rules, the Federal Reserve also made Category III savings and loan holding companies subject to an annual supervisory stress testing requirement in which the Federal Reserve conducts its own stress testing analysis to evaluate the ability of a holding company to absorb losses in specified economic and financial conditions over a nine-quarter planning horizon using such analytical techniques as the agency determines are appropriate. This supervisory stress testing requirement will go into effect for CSC beginning with the 2022 stress testing cycle. To implement this requirement, the Federal Reserve is also expanding the reporting requirements applicable to savings and loan holding companies commencing in the second quarter of 2020. The Federal Reserve has also indicated that in the future, large savings and loan holding companies, including CSC, will become subject to an annual Comprehensive Capital Analysis and Review (CCAR) process, which requires submission of an annual capital plan to the Federal Reserve. However, to date, the Federal Reserve has not yet proposed modifications to its existing capital planning requirements to extend them to savings and loan holding companies.
Additional Enhanced Prudential Standards
In addition to the revisions to the capital stress testing regime discussed above, the Federal Reserve’s enhanced prudential standards rules will also extend the applicability of certain additional enhanced prudential standards to large savings and loan holding companies, with the specific requirements tailored based on the same four-category framework utilized in the interagency regulatory capital and liquidity rules. These additional enhanced prudential standards, which have been applicable to large U.S. bank holding companies under section 165 of the Dodd-Frank Act, include: risk management and risk committee requirements; liquidity risk management, stress testing, and buffer requirements; and single counterparty credit limits. CSC will be required to comply with the new risk management and risk committee requirements, as well as the new liquidity risk-management, stress testing, and buffer requirements commencing on January 1, 2021. The new single counterparty credit limits will go into effect for CSC on January 1, 2022.
Insured Depository Institution Resolution Plans
The FDIC requires insured depository institutions with total consolidated assets of $50 billion or more to submit to the FDIC periodic plans providing for their resolution by the FDIC in the event of failure (resolution plans or so-called “living wills”) under the receivership and liquidation provisions of the Federal Deposit Insurance Act. Under this requirement, CSB has been required to file with the FDIC a periodic resolution plan demonstrating how the bank could be resolved in an orderly and timely manner in the event of receivership such that the FDIC would be able to: ensure that the bank’s depositors receive access to their deposits within one business day; maximize the net present value of the bank’s assets when disposed of; and minimize losses incurred by the bank’s creditors. In April 2019, the FDIC approved an advance notice of proposed rulemaking seeking comment on ways to tailor and improve its insured depository institution resolution plan rule. At the same time, the FDIC announced that it would delay the next round of resolution plan submissions under the rule until this rulemaking process has been completed.
As a savings and loan holding company, CSC is not subject to any separate holding company resolution plan requirement.
Consumer Financial Protection
The CFPB has broad rulemaking, supervisory and enforcement authority for a wide range of federal consumer protection laws relating to financial products. The CFPB has examination and primary enforcement authority over depository institutions with $10 billion or more in consolidated total assets.
Deposit Insurance Assessments
The FDIC’s Deposit Insurance Fund (DIF) provides insurance coverage for certain deposits, generally up to $250,000 per depositor per account ownership type, and is funded by quarterly assessments on insured depository institutions. The FDIC uses a risk-based deposit premium assessment system that, for large insured depository institutions with at least $10 billion in total consolidated assets, uses a scorecard method based on a number of factors, including the institution’s regulatory
- 9 -
THE CHARLES SCHWAB CORPORATION
ratings, asset quality and brokered deposits. The deposit insurance assessment base is calculated as average consolidated total assets minus average tangible equity.
In July 2016, the FDIC imposed a flat-rate quarterly surcharge on insured depository institutions with total assets of $10 billion or more and certain of their bank affiliates to pay for an increase to the DIF from 1.15% to 1.35% of the assessment base. As a result, Schwab’s banking subsidiaries became subject to an additional 4.5 basis point surcharge on the amount of their aggregate assessment base in excess of $10 billion. In the third quarter of 2018, the DIF ratio exceeded 1.35%, and the FDIC eliminated the surcharge beginning in the fourth quarter of 2018.
Community Reinvestment Act
The Community Reinvestment Act of 1977 (CRA) requires the primary federal bank regulatory agency for each of Schwab’s depository institution subsidiaries to assess the subsidiary’s record in meeting the credit needs of the communities served by the bank, including low- and moderate-income neighborhoods and persons. Institutions are assigned one of four ratings (“outstanding,” “satisfactory,” “needs to improve,” or “substantial noncompliance”). The failure of an institution to receive at least a “satisfactory” rating could inhibit the institution or its holding company from undertaking certain activities, including acquisitions or opening branch offices. On January 9, 2020, the OCC and FDIC published their jointly proposed revisions to the regulations implementing the CRA. See Item 7 – Management’s Discussion and Analysis of Financial Condition and Results of Operations – Current Regulatory Environment and Other Developments.
Source of Strength
The Dodd-Frank Act codified the Federal Reserve’s long-held position that a depository institution holding company must serve as a source of financial strength for its subsidiary depository institutions, the so-called “source of strength doctrine.” In effect, the holding company may be compelled to commit resources to support the subsidiary in the event the subsidiary is in financial distress.
Broker-Dealer and Investment Advisor Regulation
Schwab’s principal broker-dealer is CS&Co. CS&Co is registered as a broker-dealer with the U.S. Securities and Exchange Commission (SEC), the fifty states, the District of Columbia, the U.S. Virgin Islands, and the Commonwealth of Puerto Rico. CS&Co and CSIM are registered as investment advisors with the SEC. Additionally, CS&Co is regulated by the Commodities Futures Trading Commission (CFTC) with respect to the commodity futures and trading activities it conducts as an introducing broker.
Much of the regulation of broker-dealers has been delegated to SROs. CS&Co is a member of the Financial Industry Regulatory Authority, Inc. (FINRA), the Municipal Securities Rulemaking Board (MSRB), Nasdaq Stock Market, and NYSE Arca. In addition to the SEC, the primary regulators of CS&Co are FINRA and, for municipal securities, the MSRB. The National Futures Association (NFA) is CS&Co’s primary regulator for futures and commodities trading activities.
The principal purpose of regulating broker-dealers and investment advisors is the protection of clients and securities markets. The regulations cover all aspects of the securities business, including, among other things, sales and trading practices, publication of research, margin lending, uses and safekeeping of clients’ funds and securities, capital adequacy, recordkeeping and reporting, fee arrangements, disclosure to clients, fiduciary duties, and the conduct of directors, officers, and employees.
CS&Co is subject to Rule 15c3-1 under the Securities Exchange Act of 1934 (the Uniform Net Capital Rule) and related SRO requirements. The CFTC and NFA also impose net capital requirements. The Uniform Net Capital Rule specifies minimum capital requirements intended to ensure the general financial soundness and liquidity of broker-dealers. CSC itself is not a registered broker-dealer and it is not subject to the Uniform Net Capital Rule. If CS&Co fails to maintain specified levels of net capital, such failure could constitute a default by CSC of certain debt covenants under its credit agreement.
The Uniform Net Capital Rule prohibits CS&Co from paying cash dividends, making unsecured advances or loans or repaying subordinated loans if such payment would result in a net capital amount of less than 5% of aggregate debit balances or less than 120% of its minimum dollar requirement of $250,000.
- 10 -
THE CHARLES SCHWAB CORPORATION
In addition to net capital requirements, as a self-clearing broker-dealer, CS&Co is subject to cash deposit and collateral requirements with clearing houses, such as the Depository Trust & Clearing Corporation and Options Clearing Corporation, which may fluctuate significantly from time to time based upon the nature and size of clients’ trading activity and market volatility.
As a result of our operations in countries outside the U.S., we are also subject to rules and regulations issued by certain foreign authorities, including the Financial Conduct Authority (FCA) in the U.K., the Securities and Futures Commission (SFC) in Hong Kong, the Monetary Authority of Singapore (MAS) in Singapore, and the Australian Securities and Investments Commission (ASIC) in Australia.
Financial Services Regulation
Bank Secrecy Act of 1970 and USA PATRIOT Act of 2001
CSC and its subsidiaries that conduct financial services activities are subject to the Bank Secrecy Act of 1970 (BSA), as amended by the USA PATRIOT Act of 2001, which requires financial institutions to develop and implement programs reasonably designed to achieve compliance with these regulations. The BSA and USA PATRIOT Act include a variety of monitoring, recordkeeping and reporting requirements (such as currency transaction reporting and suspicious activity reporting), as well as identity verification and client due diligence requirements which are intended to detect, report and/or prevent money laundering and the financing of terrorism. In addition, CSC and various subsidiaries of the Company are subject to U.S. sanctions programs administered by the Office of Foreign Assets Control.
Available Information
Schwab files annual, quarterly, and current reports, proxy statements, and other information with the SEC. The SEC filings are available to the public over the internet on the SEC’s website at https://www.sec.gov.
On our website, https://www.aboutschwab.com, we post the following filings after they are electronically filed with or furnished to the SEC: annual reports on Form 10-K, quarterly reports on Form 10-Q, current reports on Form 8-K, and any amendments to those reports filed or furnished pursuant to Section 13(a) or 15(d) of the Securities Exchange Act of 1934. In addition, the website also includes the Dodd-Frank stress test results, our regulatory capital disclosures based on Basel III, and our quarterly average LCR.
All such filings are available free of charge either on our website or by request via email (investor.relations@schwab.com), telephone (415-667-7000), or mail (Charles Schwab Investor Relations at 211 Main Street, San Francisco, CA 94105).
Item 1A. | Risk Factors |
We face a variety of risks that may affect our operations, financial results, or stock price and many of those risks are driven by factors that we cannot control or predict. The following discussion addresses those risks that management believes are the most significant, although there may be other risks that could arise, or may prove to be more significant than expected, that may affect our operations or financial results.
We also face certain risks in connection with our proposed merger with TD Ameritrade as described above in Item 1 of this Form 10-K. We encourage you to consider the risks below under the caption “Risks Related to the Proposed Merger with TD Ameritrade.” These risks and other risks associated with the proposed merger will be more fully discussed in the joint proxy statement/prospectus that will be included in the registration statement on Form S-4 that CSC will file with the SEC in connection with the merger.
For a discussion of our risk management governance and processes, including operational risk, compliance risk, credit risk, market risk, and liquidity risk, see Risk Management and Capital Management in Part II, Item 7.
- 11 -
THE CHARLES SCHWAB CORPORATION
Developments in the business, economic, and geopolitical environment could negatively impact our business.
Our business can be adversely affected by the general environment – economic, corporate, securities market, regulatory, and geopolitical developments all play a role in client asset valuations, trading activity, interest rates, and overall investor engagement, and are outside of our control. Deterioration in the housing and credit markets, reduction in short-term interest rates, and decreases in securities valuations negatively impact our results of operations and capital resources.
Extensive regulation of our businesses may subject us to significant penalties or limitations on business activities.
As a participant in the securities, banking, and financial services industries, we are subject to extensive regulation under federal, state, and foreign laws by governmental agencies, supervisory authorities and SROs. The costs and uncertainty related to complying with such regulations continue to increase. These regulations affect our business operations and impose capital, client protection, and market conduct requirements on us.
In addition to specific banking laws and regulations, our banking regulators have broad discretion in connection with their supervisory and enforcement activities and examination policies and could require CSC and/or our banking subsidiaries to hold more capital, increase liquidity, or limit their ability to pay dividends or CSC’s ability to repurchase or redeem shares. The banking regulators could also limit our ability to grow, including adding assets, launching new products, making acquisitions, and undertaking strategic investments. Other potential regulatory actions include limiting our banking subsidiaries’ ability to accept deposits swept from client brokerage accounts and brokered deposits and preventing us from pursuing our business strategy.
Despite our efforts to comply with applicable legal requirements, there are a number of risks, particularly in areas where applicable laws or regulations may be unclear or where regulators could revise their previous guidance. Any enforcement actions or other proceedings brought by our regulators against us or our affiliates, officers or employees could result in fines, penalties, cease and desist orders, enforcement actions, suspension, disqualification or expulsion, or other disciplinary sanctions, including limitations on our business activities, any of which could harm our reputation and adversely affect our results of operations and financial condition.
While we maintain systems and procedures designed to ensure that we comply with applicable laws and regulations, violations could occur. In addition, some legal/regulatory frameworks provide for the imposition of fines or penalties for noncompliance even though the noncompliance was inadvertent or unintentional and even though systems and procedures reasonably designed to prevent violations were in place at the time. There may be other negative consequences resulting from a finding of noncompliance, including restrictions on certain activities. Such a finding may also damage our reputation and our relationships with our regulators and could restrict the ability of institutional investment managers to invest in our securities.
Legislation or changes in rules and regulations could negatively affect our business and financial results.
New legislation, rules, regulations and guidance, or changes in the interpretation or enforcement of existing federal, state, foreign and SRO rules, regulations and guidance, including changes relating to mutual funds, broker-dealer fiduciary duties and regulatory treatment of deposit accounts, may directly affect the operation and profitability of Schwab or its specific business lines. Our profitability could also be affected by rules and regulations that impact the business and financial communities generally, including changes to the laws governing taxation, electronic commerce, client privacy and security of client data. In addition, the rules and regulations could result in limitations on the lines of business we conduct, modifications to our business practices, more stringent capital and liquidity requirements, increased deposit insurance assessments or additional costs and could limit our ability to return capital to stockholders. These changes may also require us to invest significant management attention and resources to evaluate and make necessary changes to our compliance, risk management, treasury and operations functions.
Failure to meet capital adequacy and liquidity guidelines could affect our financial condition.
CSC, together with its banking and broker-dealer subsidiaries, must meet certain capital and liquidity standards, subject to qualitative judgments by regulators about the adequacy of Schwab’s capital and Schwab’s internal assessment of its capital needs. The Uniform Net Capital Rule limits CS&Co’s ability to transfer capital to CSC and other affiliates. New regulatory capital, liquidity, and stress testing requirements may limit or otherwise restrict how we utilize our capital, including paying dividends, stock repurchases, and redemptions, and may require us to increase our capital and/or liquidity or to limit our
- 12 -
THE CHARLES SCHWAB CORPORATION
growth. Failure by either CSC or its banking subsidiaries to meet minimum capital requirements could result in certain mandatory and additional discretionary actions by regulators that, if undertaken, could have a negative impact on us. In addition, failure by CSC or our banking subsidiaries to maintain a sufficient amount of capital to satisfy their capital conservation buffer and countercyclical capital buffer requirements would result in restrictions on our ability to make capital distributions and discretionary cash bonus payments to executive officers. Any requirement that we increase our regulatory capital, replace certain capital instruments which presently qualify as Tier 1 Capital, or increase regulatory capital ratios or liquidity, could require us to liquidate assets, deleverage or otherwise change our business and/or investment plans, which may adversely affect our financial results. Issuing additional common stock would dilute the ownership of existing stockholders.
Effective December 31, 2019, CSC was assigned to Category III of the new tailored regulatory requirements. The Federal Reserve indicated that large savings and loan holding companies, including CSC, will become subject to the CCAR process. If CSC reaches $700 billion in total assets or $75 billion in cross-jurisdictional activity, CSC will become subject to more stringent Category II requirements, including annual stress testing, the advanced approaches framework, the inability to opt out of including AOCI in regulatory capital calculations, the full LCR rule and daily liquidity reporting. CSC will also be subject to the full LCR rule and daily liquidity reporting if its weighted short-term wholesale funding is $75 billion or more.
A significant change in client cash allocations could negatively impact our net interest revenue.
We rely heavily on bank deposits as a funding source to extend loans to clients and purchase investment securities. Our bank deposits are primarily driven by our bank sweep feature when cash awaiting investment in our client brokerage accounts is swept to our banking subsidiaries. A significant reduction in our clients’ allocation to cash, a change in the allocation of that cash, or a transfer of cash away from the Company, could reduce net interest revenue.
Significant interest rate changes could affect our profitability.
The direction and level of interest rates are important factors in our earnings. A decline in interest rates may have a negative impact on our net interest revenue. A low interest rate environment may also have a negative impact on our asset management and administration fee revenues if we have to waive a portion of our management fees for certain Schwab-sponsored money market mutual funds in order to continue providing a positive return to clients.
Although we believe we are positioned to benefit from a rising interest rate environment, a rise in interest rates may cause our funding costs to increase if market conditions or the competitive environment induces us to raise our interest rates to avoid losing deposits, or replace deposits with higher cost funding sources without offsetting increases in yields on interest-earning assets can reduce our net interest revenue.
The expected phase-out of LIBOR could negatively impact our net interest revenue and require significant operational work.
Certain securities in our investment portfolio and the floating rate loans we offer reference LIBOR as the benchmark rate to determine the applicable interest rate or payment amount. We also use LIBOR in many of our financial models, such as those used for capital stress testing, and to determine the dividend rates for certain of our series of preferred stock which begin to float in 2022 and later. If LIBOR is discontinued after 2021 as expected, there will be uncertainty or differences in the calculation of the applicable interest rate or payment amount depending on the terms of the governing instruments and there will be significant work required to transition to using the new benchmark rates and implement necessary changes to our systems and financial models. This could result in different financial performance for previously booked transactions and may impact our existing transaction data, products, systems, operations, and pricing processes. The calculation of interest rates under the replacement benchmarks could also impact our net interest revenue. In addition, LIBOR may perform differently during the phase-out period than in the past which could result in lower interest payments and a reduction in the value of certain securities in our investment portfolio.
Security breaches of our systems, or those of our clients or third parties, may subject us to significant liability and damage Schwab’s reputation.
Our business involves the secure processing, storage, and transmission of confidential information about our clients and us. Information security risks for financial institutions are increasing, in part because of the use of the internet and mobile technologies to conduct financial transactions, and the increased sophistication and activities of organized crime, activists, hackers and other external parties, including foreign state actors. Our systems and those of other financial institutions have
- 13 -
THE CHARLES SCHWAB CORPORATION
been and are likely to continue to be the target of cyber attacks, malicious code, computer viruses and denial of service attacks that could result in unauthorized access, misuse, loss or destruction of data (including confidential client information), account takeovers, unavailability of service or other events. Despite our efforts to ensure the integrity of our systems, we may not be able to anticipate or to implement effective preventive measures against all security breaches of these types, especially because the techniques used change frequently or are not recognized until launched, and because security attacks can originate from a wide variety of sources. Data security breaches may also result from non-technical means, for example, employee misconduct.
Given the high volume of transactions that we process, the large number of clients, counterparties and third-party service providers with which we do business and the increasing sophistication of cyber attacks, a cyber attack could occur and persist for an extended period of time before being detected. The extent of a particular cyber attack and the steps we may need to take to investigate the attack may not be immediately clear, and it may take a significant amount of time before an investigation is completed and full and reliable information about the attack is known. During such time we would not necessarily know the extent of the harm or how best to remediate it, and certain errors or actions could be repeated or compounded before they are discovered and remediated, all or any of which would further increase the costs and consequences of a cyber attack.
Security breaches, including breaches of our security measures or those of our third-party service providers or clients, could result in a violation of applicable privacy and other laws and could subject us to significant liability or loss that may not be covered by insurance, actions by our regulators, damage to Schwab’s reputation, or a loss of confidence in our security measures which could harm our business. We may be required to expend significant additional resources to modify our protective measures or to investigate and remediate vulnerabilities or other exposures.
We also face risk related to external fraud involving the misappropriation and use of clients’ user names, passwords or other personal information to gain access to clients’ financial accounts at Schwab. This could occur from the compromise of clients’ personal electronic devices or as a result of a data security breach at an unrelated company where clients’ personal information is taken and then made available to fraudsters. Such risk has grown in recent years due to the increased sophistication and activities of organized crime and other external parties, including foreign state-sponsored parties. Losses reimbursed to clients under our guarantee against unauthorized account activity could have a negative impact on our business, financial condition and results of operations.
Technology and operational failures or errors could subject us to losses, litigation, regulatory actions, and reputational damage.
We must process, record and monitor a large number of transactions and our operations are highly dependent on the integrity of our technology systems and our ability to make timely enhancements and additions to our systems. System interruptions, errors or downtime can result from a variety of causes, including changes in client use patterns, technological failure, changes to our systems, linkages with third-party systems and power failures and can have a significant impact on our business and operations. Our systems are vulnerable to disruptions from human error, execution errors, errors in models such as those used for asset management, capital planning and management, risk management, stress testing and compliance, employee misconduct, unauthorized trading, external fraud, computer viruses, distributed denial of service attacks, cyber attacks, terrorist attacks, natural disaster, power outage, capacity constraints, software flaws, events impacting key business partners and vendors, and similar events. For example, Schwab and other financial institutions have been the target of various denial of service attacks that have, in certain circumstances, made websites, mobile applications and email unavailable for periods of time. It could take an extended period of time to restore full functionality to our technology or other operating systems in the event of an unforeseen occurrence, which could affect our ability to process and settle client transactions. Moreover, instances of fraud or other misconduct might also negatively impact Schwab’s reputation and client confidence in the Company, in addition to any direct losses that might result from such instances. Despite our efforts to identify areas of risk, oversee operational areas involving risk, and implement policies and procedures designed to manage these risks, there can be no assurance that we will not suffer unexpected losses, reputational damage or regulatory action due to technology or other operational failures or errors, including those of our vendors or other third parties.
While we devote substantial attention and resources to the reliability, capacity and scalability of our systems, extraordinary trading volumes could cause our computer systems to operate at unacceptably slow speeds or even fail, affecting our ability to process client transactions and potentially resulting in some clients’ orders being executed at prices they did not anticipate. Disruptions in service and slower system response times could result in substantial losses and decreased client satisfaction. We are also dependent on the integrity and performance of securities exchanges, clearing houses and other
- 14 -
THE CHARLES SCHWAB CORPORATION
intermediaries to which client orders are routed for execution and settlement. System failures and constraints and transaction errors at such intermediaries could result in delays and erroneous or unanticipated execution prices, cause substantial losses for us and for our clients, and subject us to claims from our clients for damages.
Our investment management operations may subject us to fiduciary or other legal liability for client losses.
Fund and trust management and administration are complex activities and include functions such as recordkeeping and accounting, security pricing, corporate actions, compliance with investment restrictions, daily net asset value computations, account reconciliations, and required distributions to fund shareholders. Failure to properly perform operational tasks, or the misrepresentation of our services and products could subject us to regulatory sanctions, penalties or litigation and result in reputational damage, liability to clients, and the termination of investment management or administration agreements and the withdrawal of assets under our management.
In the management and administration of funds and client accounts, we use quantitative models and other tools and resources to support investment decisions and processes, including those related to risk assessment, portfolio management, trading and hedging activities and product valuations. Errors in the design, function, or underlying assumptions used in these models and tools, particularly if we fail to detect the errors over an extended period, could subject us to claims of a breach of fiduciary duty and potentially large liabilities for make-whole payments, litigation, and/or regulatory fines.
A significant decrease in our liquidity could negatively affect our business as well as reduce client confidence in Schwab.
Maintaining adequate liquidity is crucial to our business operations, including transaction settlement, custody requirements, and lending commitments, among other liquidity needs. We meet our liquidity needs primarily from working capital and cash generated by client activity, as well as external financing. Fluctuations in client cash or deposit balances, as well as market conditions or changes in regulatory treatment of client deposits, may affect our ability to meet our liquidity needs. A reduction in our liquidity position could reduce client confidence in Schwab, which could result in the transfer of client assets and accounts, or could cause us to fail to satisfy our liquidity requirements, including the LCR. In addition, if our broker-dealer or depository institution subsidiaries fail to meet regulatory capital guidelines, regulators could limit the subsidiaries’ operations or their ability to upstream funds to CSC, which could reduce CSC’s liquidity and adversely affect its ability to repay debt, pay dividends on CSC’s preferred stock, or return capital to common stockholders. In addition, CSC may need to provide additional funding to such subsidiaries.
Factors which may adversely affect our liquidity position include CS&Co having temporary liquidity demands due to timing differences between brokerage transaction settlements and the availability of segregated cash balances, fluctuations in cash held in banking or brokerage client accounts, a dramatic increase in our lending activities (including margin, mortgage-related, and personal lending), increased capital requirements, changes in regulatory guidance or interpretations, other regulatory changes, or a loss of market or client confidence in Schwab resulting in unanticipated withdrawals of client funds.
When available cash is not sufficient for our liquidity needs, we may seek external financing. During periods of disruptions in the credit and capital markets, potential sources of external financing could be reduced, and borrowing costs could increase. Although CSC and CS&Co maintain committed and uncommitted, unsecured bank credit lines and CSC has a commercial paper issuance program, as well as a universal shelf registration statement filed with the SEC which can be used to sell securities, financing may not be available on acceptable terms or at all due to market conditions or disruptions in the credit markets. In addition, a significant downgrade in the Company’s credit ratings could increase its borrowing costs and limit its access to the capital markets.
We may suffer significant losses from our credit exposures.
Our businesses are subject to the risk that a client, counterparty or issuer will fail to perform its contractual obligations, or that the value of collateral held to secure obligations will prove to be inadequate. While we have policies and procedures designed to manage this risk, the policies and procedures may not be fully effective. Our exposure mainly results from margin lending, clients’ options and futures trading, securities lending, mortgage lending, pledged asset lending, our role as a counterparty in financial contracts and investing activities, and indirectly from the investing activities of certain of the proprietary funds we sponsor.
- 15 -
THE CHARLES SCHWAB CORPORATION
When clients purchase securities on margin, borrow on lines of credit collateralized by securities, or trade options or futures, we are subject to the risk that clients may default on their obligations when the value of the securities and cash in their accounts falls below the amount of clients’ indebtedness. Abrupt changes in securities valuations and the failure of clients to meet margin calls could result in substantial losses.
We have exposure to credit risk associated with our investments. Those investments are subject to price fluctuations. Loss of value of securities can negatively affect earnings if management determines that such loss of value has resulted from a credit loss. The evaluation of whether a credit loss exists is a matter of judgment, which includes the assessment of multiple factors. If management determines that a security’s decline in fair value is the result of a credit loss, an allowance for credit losses on the security will be recorded and a corresponding loss will be recognized in current earnings. Even if a decline in fair value of a security is not determined to have resulted from a credit loss, if we were ever forced to sell the security sooner than intended prior to maturity due to liquidity needs, we would have to recognize any unrealized losses at that time.
Our bank loans primarily consist of First Mortgages, HELOCs, and PALs. Increases in delinquency and default rates, housing and stock price declines, increases in the unemployment rate, and other economic factors can result in increases in allowances for credit losses and related credit loss expense, as well as write downs on such loans.
On January 1, 2020, the Company adopted Accounting Standards Update (ASU) 2016-13, “Financial Instruments – Credit Losses (Topic 326): Measurement of Credit Losses on Financial Instruments”, which requires estimation of expected lifetime credit losses, rather than incurred losses only, as was previously required. For more information on this adoption, see Part II – Item 8 – Notes to Consolidated Financial Statements – Note 2.
Heightened credit exposures to specific counterparties or instruments can increase our risk of loss. Examples include:
• | Large positions in financial instruments collateralized by assets with similar economic characteristics or in securities of a single issuer or industry; |
• | Mortgage loans and HELOCs to banking clients which are secured by properties in the same geographic region; and |
• | Client margins, options or futures, pledged assets, and securities lending activities collateralized by or linked to securities of a single issuer, index, or industry. |
We sponsor a number of proprietary money market mutual funds and other proprietary funds. Although we have no obligation to do so, we may decide for competitive or other reasons to provide credit, liquidity or other support to our funds in the event of significant declines in valuation of fund holdings or significant redemption activity that exceeds available liquidity. Such support could cause us to take significant charges, could reduce our liquidity and, in certain situations, could, with respect to proprietary funds other than money market mutual funds, result in us having to consolidate one or more funds in our financial statements. If we choose not to provide credit, liquidity or other support in such a situation, Schwab could suffer reputational damage and its business could be adversely affected.
We are subject to litigation and regulatory investigations and proceedings and may not be successful in defending against claims or proceedings.
The financial services industry faces significant litigation and regulatory risks. We are subject to claims and lawsuits in the ordinary course of business, including arbitrations, class actions and other litigation, some of which include claims for substantial or unspecified damages. We are also the subject of inquiries, investigations, and proceedings by regulatory and other governmental agencies.
Litigation and arbitration claims include those brought by our clients and the clients of third party advisors whose assets are custodied at Schwab. Claims from clients of third party advisors may allege losses due to investment decisions made by the third party advisors or the advisors’ misconduct. Litigation claims also include claims from third parties alleging infringement of their intellectual property rights (e.g., patents). Such litigation can require the expenditure of significant company resources. If we were found to have infringed on a third-party patent, or other intellectual property rights, we could incur substantial damages, and in some circumstances could be enjoined from using certain technology, or providing certain products or services.
Actions brought against us may result in settlements, awards, injunctions, fines, penalties or other results adverse to us, including reputational harm. Even if we are successful in defending against these actions, the defense of such matters may
- 16 -
THE CHARLES SCHWAB CORPORATION
result in us incurring significant expenses. A substantial judgment, settlement, fine, or penalty could be material to our operating results or cash flows for a particular future period, depending on our results for that period. In market downturns and periods of heightened volatility, the volume of legal claims and amount of damages sought in litigation and regulatory proceedings against financial services companies have historically increased.
We rely on outsourced service providers to perform key functions.
We rely on external service providers to perform certain key technology, processing, servicing, and support functions. These service providers face technology, operating, business, and economic risks, and any significant failures by them, including the improper use or disclosure of our confidential client, employee, or company information, could cause us to incur losses and could harm Schwab’s reputation. An interruption in or the cessation of service by any external service provider as a result of systems failures, capacity constraints, financial difficulties or for any other reason, and our inability to make alternative arrangements in a timely manner could disrupt our operations, impact our ability to offer certain products and services, and result in financial losses to us. Switching to an alternative service provider may require a transition period and result in less efficient operations.
Potential strategic transactions could have a negative impact on our financial position.
We evaluate potential strategic transactions, including business combinations, acquisitions, and dispositions. Any such transaction could have a material impact on our financial position, results of operations, or cash flows. The process of evaluating, negotiating, and effecting any such strategic transaction may divert management’s attention from other business concerns, and might cause the loss of key clients, employees, and business partners. Moreover, integrating businesses and systems may result in unforeseen expenditures as well as numerous risks and uncertainties, including the need to integrate operational, financial, and management information systems and management controls, integrate relationships with clients and business partners, and manage facilities and employees in different geographic areas. In addition, an acquisition may cause us to assume liabilities or become subject to litigation or regulatory proceedings. Further, we may not realize the anticipated benefits from an acquisition (including without limitation the pending acquisitions of TD Ameritrade and assets of USAA-IMCO), and any future acquisition could be dilutive to our current stockholders’ percentage ownership or to earnings per common share (EPS).
Our acquisitions and dispositions are typically subject to closing conditions, including regulatory approvals and the absence of material adverse changes in the business, operations or financial condition of the entity being acquired or sold. To the extent we enter into an agreement to buy or sell an entity, there can be no guarantee that the transaction will close when expected, or at all. If a material transaction does not close, our stock price could decline.
Our industry is highly competitive and characterized by aggressive price competition.
We operate in a highly competitive environment with a broad array of competitors from large integrated banks to venture-capital backed private companies. We continually monitor our pricing in relation to competitors and periodically adjust interest rates on deposits and loans, fees for advisory services, expense ratios on mutual funds and ETFs, trade commission rates, and other pricing and incentives to sustain our competitive position. Increased price competition from other financial services firms to attract clients, such as reduced commissions, higher deposit rates, reduced mutual fund or ETF expense ratios, or the increased use of incentives, could impact our results of operations and financial condition.
We face competition in hiring and retaining qualified employees.
The market for qualified personnel in our business is highly competitive. At various times, different functions and roles are in especially high demand in the market, compelling us to pay more to attract talent. Our ability to continue to compete effectively will depend upon our ability to attract new employees and retain existing employees while managing compensation costs.
- 17 -
THE CHARLES SCHWAB CORPORATION
Our stock price has fluctuated historically, and may continue to fluctuate.
Our stock price can be volatile. Among the factors that may affect the volatility of our stock price are the following:
• | Our exposure to changes in interest rates; |
• | Speculation in the investment community or the press about, or actual changes in, our competitive position, organizational structure, executive team, operations, financial condition, financial reporting and results, expense discipline, or strategic transactions; |
• | The announcement of new products, services, acquisitions, or dispositions by us or our competitors; |
• | Increases or decreases in revenue or earnings, changes in earnings estimates by the investment community, and variations between estimated financial results and actual financial results; and |
• | Sales of a substantial number of shares of our common stock by large stockholders. |
Changes in the stock market generally, or as it concerns our industry, as well as geopolitical, corporate, regulatory, business, and economic factors may also affect our stock price.
Future sales of CSC’s equity securities may adversely affect the market price of CSC’s common stock and result in dilution.
CSC’s certificate of incorporation authorizes CSC’s Board of Directors, among other things, to issue additional shares of common or preferred stock or securities convertible or exchangeable into equity securities, without stockholder approval.
CSC may issue additional equity or convertible securities to raise additional capital or for other purposes. The issuance of any additional equity or convertible securities could be substantially dilutive to holders of CSC’s common stock and may adversely affect the market price of CSC’s common stock.
Risks Related to the Proposed Merger with TD Ameritrade
Completion of the merger is subject to many conditions and if these conditions are not satisfied or waived, the merger will not be completed.
The obligations of CSC and TD Ameritrade to complete the merger are subject to satisfaction (or, to the extent permitted by applicable law, waiver) of a number of conditions, including, among others:
• | the affirmative vote of (A) the holders of a majority of the outstanding shares of TD Ameritrade common stock approving and adopting the Merger Agreement and (B) the holders (other than TD Bank, the Significant TD Ameritrade Stockholders and their respective affiliates) of a majority of the outstanding shares of TD Ameritrade common stock (other than shares of TD Ameritrade common stock held by TD Bank, the Significant TD Ameritrade Stockholders and their respective affiliates) approving and adopting the Merger Agreement; |
• | the affirmative vote of (A) a majority of the votes cast by holders of outstanding shares of Schwab common stock approving the share issuance and (B) the holders of a majority of the outstanding shares of Schwab common stock approving the Schwab charter amendment; |
• | expiration or termination of any applicable waiting period (or extension thereof) under the HSR Act and certain governmental authorizations having been made or obtained and being in full force and effect; |
• | receipt of noncontrol determinations from the Federal Reserve; |
• | accuracy of the representations and warranties made in the Merger Agreement by the other party, subject to certain materiality thresholds; |
• | performance in all material respects by the other party of the obligations required to be performed by it at or prior to completion of the merger; and |
• | the absence since the date of the Merger Agreement of a material adverse effect on the other party. |
There can be no assurance that the conditions to the closing of the merger will be satisfied or waived in a timely manner or at all, and, accordingly, the merger may not be completed. If the merger is not completed for any reason, the ongoing business of CSC may be adversely affected and, without realizing the benefits of having completed the merger, we would be subject to a number of risks, including that we may receive negative reactions from our stockholders, employees, customers and regulators, and that the price of our common stock may decline to the extent that current market prices reflect a market assumption that the merger will be completed.
- 18 -
THE CHARLES SCHWAB CORPORATION
As a condition to authorization of the merger, governmental authorities may impose requirements, limitations or costs or place restrictions on the conduct of our business after completion of the merger. Such conditions or changes and the process of obtaining regulatory approvals could, among other things, have the effect of delaying completion of the merger or imposing additional material costs on or materially limiting the revenues of the combined company following the merger, or otherwise adversely affecting our businesses and results of operations after completion of the merger.
Also, if the Merger Agreement is terminated in certain circumstances, we may be required to pay a termination fee of $950 million to TD Ameritrade and we could be subject to litigation related to any failure to complete the merger or related to any enforcement proceeding commenced against us to perform our obligations under the Merger Agreement.
In addition, the Merger Agreement places certain restrictions on the conduct of our businesses prior to completion of the merger, and such restrictions, the waiver of which is subject to consent of TD Ameritrade, could prevent us from making certain acquisitions, taking certain other specified actions or otherwise pursuing business opportunities during the pendency of the merger that we would have made, taken or pursued if these restrictions were not in place.
CSC and TD Ameritrade may also be subject to lawsuits challenging the merger, and adverse rulings in these lawsuits may delay or prevent the merger from being completed or require CSC or TD Ameritrade to incur significant costs to defend or settle these lawsuits.
If any of these risks materialize, they may materially and adversely affect our businesses, financial condition, financial results, ratings, and/or stock price.
Schwab’s business relationships may be subject to disruption due to uncertainty associated with the merger.
Parties with which we do business may experience uncertainty associated with the merger, including with respect to current or future business relationships with Schwab or the combined business. Schwab’s business relationships may be subject to disruption as parties with which Schwab does business may attempt to negotiate changes in existing business relationships or consider entering into business relationships with parties other than Schwab or the combined business. These disruptions could have an adverse effect on the businesses, financial condition, results of operations or prospects of the combined business, including an adverse effect on Schwab’s ability to realize the anticipated benefits of the merger. The risk, and adverse effect, of such disruptions could be exacerbated by a delay in completion of the merger or termination of the Merger Agreement.
After completion of the merger, we may fail to realize the anticipated benefits and cost savings of the merger, which could adversely affect the value of our stock.
The success of the merger will depend, in significant part, on our ability to realize the anticipated benefits and cost savings from combining the businesses of Schwab and TD Ameritrade. Our ability to realize these anticipated benefits and cost savings is subject to certain risks. If Schwab is not able to successfully combine the businesses of Schwab and TD Ameritrade within the anticipated time frame, or at all, the anticipated cost savings and other benefits of the merger may not be realized fully or at all or may take longer to realize than expected, the combined business may not perform as expected and the value of Schwab common stock may be adversely affected.
Schwab and TD Ameritrade have operated and, until completion of the merger, will continue to operate, independently, and there can be no assurances that their businesses can be integrated successfully. It is possible that the integration process could result in the loss of key Schwab or TD Ameritrade employees, the loss of clients, the disruption of either company’s or both companies’ ongoing businesses or in unexpected integration issues, higher than expected integration costs and an overall post-completion integration process that takes longer than originally anticipated.
In addition, at times the attention of certain members of either company’s or both companies’ management and resources may be focused on completion of the merger and the integration of the businesses of the two companies and diverted from day-to-day business operations, which may disrupt each company’s ongoing business and the business of the combined company.
Schwab will incur significant transaction and merger-related costs in connection with the merger.
We expect to incur a number of non-recurring costs associated with the merger and combining the operations of the two
- 19 -
THE CHARLES SCHWAB CORPORATION
companies. Some of these costs have already been incurred or may be incurred regardless of whether the merger is completed. Schwab also will incur transaction fees and costs related to formulating and implementing integration plans with respect to the two companies, including facilities and systems consolidation costs. We continue to assess the magnitude of these costs, and additional unanticipated costs may be incurred in the merger and the integration of the two companies’ businesses. Although we expect that the elimination of duplicative costs, as well as the realization of other efficiencies related to the integration of the businesses, should allow us to offset integration-related costs over time, this net benefit may not be achieved in the near term, or at all.
Schwab and TD Ameritrade may have difficulty attracting, motivating and retaining executives and other employees in light of the merger.
Uncertainty about the effect of the merger on Schwab and TD Ameritrade employees may impair Schwab’s and TD Ameritrade’s ability to attract, retain and motivate personnel prior to and following the merger. Employee retention may be particularly challenging during the pendency of the merger, as employees of Schwab and TD Ameritrade may experience uncertainty about their future roles with the combined business. In addition, pursuant to change-in-control provisions in their respective employment agreements or term sheets with TD Ameritrade, certain employees of TD Ameritrade are entitled to receive severance payments upon a constructive termination of employment. Such TD Ameritrade employees potentially could terminate their employment following specified circumstances set forth in their employment agreements or term sheets, including certain changes in such employees’ position, compensation or benefits and collect severance. Such circumstances could occur in connection with the merger as a result of changes in roles and responsibilities. If employees of Schwab or TD Ameritrade depart, the integration of the companies may be more difficult and the combined business following the merger may be harmed. Furthermore, Schwab may have to incur significant costs in identifying, hiring and retaining replacements for departing employees and may lose significant expertise and talent relating to the businesses of Schwab or TD Ameritrade, and Schwab’s ability to realize the anticipated benefits of the merger may be adversely affected. In addition, there could be disruptions to or distractions for the workforce and management associated with integrating employees into Schwab.
The merger may not be accretive to Schwab’s earnings per share, which may negatively affect the market price of Schwab common stock following completion of the merger.
In connection with the completion of the merger, Schwab expects to issue approximately 586 million Schwab common shares. The issuance of new Schwab common shares could have the effect of depressing the market price of Schwab common shares.
Based on the anticipated synergies between Schwab and TD Ameritrade, the merger is expected to be accretive to Schwab’s earnings per share in the third year following completion of the merger. However, future events and conditions could reduce or delay the accretion that is currently projected or result in the merger being dilutive to Schwab’s earnings per share, including adverse changes in market conditions, additional transaction and integration related costs and other factors such as the failure to realize some or all of the benefits anticipated in the merger. Any dilution of, reduction in, or delay of any accretion to, Schwab’s earnings per share could cause the price of shares of Schwab common stock to decline or grow at a reduced rate.
If our pending merger with TD Ameritrade is completed, our stockholders’ ownership percentage will be diluted.
If the proposed merger is completed, we will issue to TD Ameritrade stockholders shares of our common stock. As a result of the issuance of these shares of our common stock, our stockholders will own a smaller percentage of the combined company after the merger and will therefore have a reduced voting interest. In addition, TD Bank will become our largest stockholder.
Item 1B. Unresolved Staff Comments
None.
- 20 -
THE CHARLES SCHWAB CORPORATION
Item 2. Properties
As part of our real estate energy management program, Schwab incorporates sustainable practices and procedures to guide our facilities’ design, materials, and building technologies. A summary of Schwab’s significant locations is presented in the following table.
December 31, 2019 | Square Footage | |||
(amounts in thousands) | Leased | Owned | ||
Location | ||||
Corporate headquarters: | ||||
San Francisco, CA (1) | 481 | — | ||
Service and other office space: | ||||
Phoenix, AZ | 28 | 728 | ||
Denver, CO | — | 731 | ||
Dallas, TX | 318 | 293 | ||
Austin, TX | 83 | 490 | ||
Indianapolis, IN | — | 161 | ||
Orlando, FL | 159 | — | ||
Chicago, IL | 146 | — | ||
Richfield, OH | — | 117 | ||
El Paso, TX | — | 105 | ||
(1) The Company has announced its intention to eventually relocate our corporate headquarters to the Dallas, Texas area.
The square footage amounts presented in the table above are net of space that has been subleased to third parties. Our corporate headquarters, data centers, offices, and service centers support both of our segments.
As of December 31, 2019, the Company had over 360 domestic branch offices, and substantially all are located in leased premises.
Item 3. | Legal Proceedings |
For a discussion of legal proceedings, see Item 8 – Note 14.
Item 4. | Mine Safety Disclosures |
Not applicable.
- 21 -
THE CHARLES SCHWAB CORPORATION
PART II
Item 5. Market for Registrant’s Common Equity, Related Stockholder Matters, and Issuer Purchases of Equity Securities
Market Information
CSC’s common stock is listed on The New York Stock Exchange under the ticker symbol SCHW. The number of common stockholders of record as of January 31, 2020, was 5,614. The closing market price per share on that date was $45.55.
The following graph shows a five-year comparison of cumulative total returns for CSC’s common stock, the Standard & Poor’s 500 Index, and the Dow Jones U.S. Investment Services Index, each of which assumes an initial investment of $100 and reinvestment of dividends.
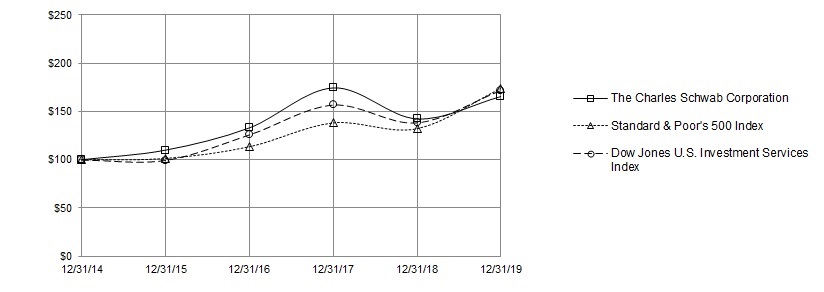
December 31, | 2014 | 2015 | 2016 | 2017 | 2018 | 2019 | |||||||||||||||||
The Charles Schwab Corporation | $ | 100 | $ | 110 | $ | 133 | $ | 174 | $ | 142 | $ | 166 | |||||||||||
Standard & Poor’s 500 Index | $ | 100 | $ | 101 | $ | 114 | $ | 138 | $ | 132 | $ | 174 | |||||||||||
Dow Jones U.S. Investment Services Index | $ | 100 | $ | 100 | $ | 126 | $ | 157 | $ | 139 | $ | 172 | |||||||||||
Securities Authorized for Issuance Under Equity Compensation Plans
For information relating to compensation plans under which our equity securities are authorized for issuance, see Item 8 – Note 19 and Part III – Item 12.
- 22 -
THE CHARLES SCHWAB CORPORATION
Issuer Purchases of Equity Securities
The following table summarizes purchases made by or on behalf of CSC of its common stock for each calendar month in the fourth quarter of 2019 (in millions, except number of shares, which are in thousands, and per share amounts):
Month | Total Number of Shares Purchased | Average Price Paid per Share | Total Number of Shares Purchased as Part of Publicly Announced Program | Approximate Dollar Value of Shares That May Yet Be Purchased Under the Publicly Announced Program | |||||||||
October: | |||||||||||||
Share repurchase program (1) | 6,357 | $ | 36.00 | 6,357 | $ | 1,780 | |||||||
Employee transactions (2) | 3 | $ | 36.85 | N/A | N/A | ||||||||
November: | |||||||||||||
Share repurchase program (1) | — | $ | — | — | $ | 1,780 | |||||||
Employee transactions (2) | 652 | $ | 41.97 | N/A | N/A | ||||||||
December: | |||||||||||||
Share repurchase program (1) | — | $ | — | — | $ | 1,780 | |||||||
Employee transactions (2) | 5 | $ | 49.77 | N/A | N/A | ||||||||
Total: | |||||||||||||
Share repurchase program (1) | 6,357 | $ | 36.00 | 6,357 | $ | 1,780 | |||||||
Employee transactions (2) | 660 | $ | 42.01 | N/A | N/A | ||||||||
(1) All shares were repurchased under an authorization approved by CSC’s Board of Directors of up to $4.0 billion of common stock publicly announced by CSC on January 30, 2019. The authorization does not have an expiration date.
(2) Includes restricted shares withheld (under the terms of grants under employee stock incentive plans) to offset tax withholding obligations that occur upon vesting and release of restricted shares. CSC may receive shares delivered or attested to pay the exercise price and/or to satisfy tax withholding obligations by employees who exercise stock options granted under employee stock incentive plans, which are commonly referred to as stock swap exercises.
N/A Not applicable.
- 23 -
THE CHARLES SCHWAB CORPORATION
Item 6. | Selected Financial Data |
Selected Financial and Operating Data | |||||||||||||||||||||||
(In Millions, Except Per Share Amounts, Ratios, or as Noted) | |||||||||||||||||||||||
Growth Rates | |||||||||||||||||||||||
Compounded 4-Year 2015-2019 (1) | Annual 1-Year 2018-2019 | 2019 | 2018 | 2017 | 2016 | 2015 | |||||||||||||||||
Results of Operations | |||||||||||||||||||||||
Net revenues | 14% | 6% | $ | 10,721 | $ | 10,132 | $ | 8,618 | $ | 7,478 | $ | 6,380 | |||||||||||
Expenses excluding interest | 9% | 5% | $ | 5,873 | $ | 5,570 | $ | 4,968 | $ | 4,485 | $ | 4,101 | |||||||||||
Net income | 26% | 6% | $ | 3,704 | $ | 3,507 | $ | 2,354 | $ | 1,889 | $ | 1,447 | |||||||||||
Net income available to common stockholders | 27% | 6% | $ | 3,526 | $ | 3,329 | $ | 2,180 | $ | 1,746 | $ | 1,364 | |||||||||||
Earnings per common share: | |||||||||||||||||||||||
Basic | 27% | 9% | $ | 2.69 | $ | 2.47 | $ | 1.63 | $ | 1.32 | $ | 1.04 | |||||||||||
Diluted | 27% | 9% | $ | 2.67 | $ | 2.45 | $ | 1.61 | $ | 1.31 | $ | 1.03 | |||||||||||
Dividends declared per common share | 30% | 48% | $ | .68 | $ | .46 | $ | .32 | $ | .27 | $ | .24 | |||||||||||
Weighted-average common shares outstanding: | |||||||||||||||||||||||
Basic | — | (3)% | 1,311 | 1,348 | 1,339 | 1,324 | 1,315 | ||||||||||||||||
Diluted | — | (3)% | 1,320 | 1,361 | 1,353 | 1,334 | 1,327 | ||||||||||||||||
Net interest revenue as a percentage of net revenues | 61 | % | 57 | % | 50 | % | 44 | % | 40 | % | |||||||||||||
Asset management and administration fees as a percentage of net revenues | 30 | % | 32 | % | 39 | % | 41 | % | 41 | % | |||||||||||||
Trading revenue as a percentage of net revenues | 6 | % | 8 | % | 8 | % | 11 | % | 14 | % | |||||||||||||
Effective income tax rate | 23.6 | % | 23.1 | % | 35.5 | % | 36.9 | % | 36.5 | % | |||||||||||||
Performance Measures | |||||||||||||||||||||||
Net revenue growth | 6 | % | 18 | % | 15 | % | 17 | % | 5 | % | |||||||||||||
Pre-tax profit margin | 45.2 | % | 45.0 | % | 42.4 | % | 40.0 | % | 35.7 | % | |||||||||||||
Return on average common stockholders’ equity | 19 | % | 19 | % | 15 | % | 14 | % | 12 | % | |||||||||||||
Financial Condition (at year end) | |||||||||||||||||||||||
Total assets | 12% | (1)% | $ | 294,005 | $ | 296,482 | $ | 243,274 | $ | 223,383 | $ | 183,705 | |||||||||||
Short-term borrowings | — | — | — | — | $ | 15,000 | — | — | |||||||||||||||
Long-term debt | 27% | 8% | $ | 7,430 | $ | 6,878 | $ | 4,753 | $ | 2,876 | $ | 2,877 | |||||||||||
Preferred stock | 18% | — | $ | 2,793 | $ | 2,793 | $ | 2,793 | $ | 2,783 | $ | 1,459 | |||||||||||
Total stockholders’ equity | 13% | 5% | $ | 21,745 | $ | 20,670 | $ | 18,525 | $ | 16,421 | $ | 13,402 | |||||||||||
Assets to stockholders’ equity ratio | 14 | 14 | 13 | 14 | 14 | ||||||||||||||||||
Debt to total capital ratio (2) | 25 | % | 25 | % | 52 | % | 15 | % | 18 | % | |||||||||||||
Employee Information | |||||||||||||||||||||||
Full-time equivalent employees (at year end, in thousands) | 7% | 1% | 19.7 | 19.5 | 17.6 | 16.2 | 15.3 | ||||||||||||||||
(1) The Compounded 4-year growth rate is computed using the formula: Compound annual growth rate = (Ending Value / Beginning Value) .25 – 1.
(2) The Debt to total capital ratio is computed using the formula: Total Debt (short and long-term) / (Total Debt + Stockholders’ Equity).
- 24 -
THE CHARLES SCHWAB CORPORATION
Management’s Discussion and Analysis of Financial Condition and Results of Operations
(Tabular Amounts in Millions, Except Ratios, or as Noted)
Item 7. | Management’s Discussion and Analysis of Financial Condition and Results of Operations |
FORWARD-LOOKING STATEMENTS
In addition to historical information, this Annual Report on Form 10-K contains “forward-looking statements” within the meaning of Section 27A of the Securities Act, and Section 21E of the Securities Exchange Act of 1934. Forward-looking statements are identified by words such as “believe,” “anticipate,” “expect,” “intend,” “plan,” “will,” “may,” “estimate,” “appear,” “could,” “would,” “expand”, “maintain,” and other similar expressions. In addition, any statements that refer to expectations, projections, or other characterizations of future events or circumstances are forward-looking statements.
These forward-looking statements, which reflect management’s beliefs, objectives, and expectations as of the date hereof, are estimates based on the best judgment of Schwab’s senior management. These statements relate to, among other things:
• | The acquisition of TD Ameritrade; the acquisition of assets of USAA-IMCO, the related funding, and entering into a referral agreement; and the expected closing dates of the acquisitions (see Business Acquisitions in Part I, Item 1; Overview and Capital Management in Part II, Item 7; Commitments and Contingencies in Part II, Item 8 – Notes to Consolidated Financial Statements (Item 8) – Note 14); |
• | Maximizing our market valuation and stockholder returns over time; our belief that developing trusted relationships will translate into more client assets which drives revenue and, along with expense discipline and thoughtful capital management, generates earnings growth and builds stockholder value; and maintaining our market position (see Business Strategy and Competitive Environment and Products and Services in Part I, Item 1); |
• | The impact of pricing reductions on our value proposition, competitive positioning and long-term growth in client assets and accounts (see Sources of Net Revenues in Part I, Item I; Overview in Part II, Item 7); |
• | The impact of legal proceedings and regulatory matters (see Legal Proceedings in Part I, Item 3 and Commitments and Contingencies in Part II, Item 8 – Note 14); |
• | Commitment to balancing long-term profitability with reinvesting for growth; business growth; meaningful capital returns; and intent to return excess capital above our long-term operating objective of 6.75% - 7.00% (see Overview in Part II, Item 7); |
• | The adjustment of rates paid on client-related liabilities; client cash sorting; reducing exposure to lower rates; and the duration difference between liabilities and assets (see Net Interest Revenue in Part II, Item 7); |
• | Capital expenditures (see Total Expenses Excluding Interest in Part II, Item 7); |
• | The phase-out of the use of LIBOR (see Expected Phase-out of LIBOR in Part II, Item 7); |
• | Sources of liquidity, capital, and level of dividends (see Liquidity Risk in Part II, Item 7); |
• | Capital ratios (see Regulatory Capital Requirements in Part II, Item 7); |
• | The expected impact of new accounting standards not yet adopted (see Summary of Significant Accounting Policies in Part II, Item 8 – Note 2); and |
• | The likelihood of indemnification and guarantee payment obligations (see Commitments and Contingencies in Part II, Item 8 – Note 14). |
Achievement of the expressed beliefs, objectives and expectations described in these statements is subject to certain risks and uncertainties that could cause actual results to differ materially from the expressed beliefs, objectives, and expectations. Readers are cautioned not to place undue reliance on these forward-looking statements, which speak only as of the date of this Annual Report on Form 10-K or, in the case of documents incorporated by reference, as of the date of those documents.
Important factors that may cause actual results to differ include, but are not limited to:
• | The timing and the ability of us and TD Ameritrade to satisfy the closing conditions in the merger agreement, including stockholder and regulatory approvals; |
• | The timing and the ability of us and USAA-IMCO to satisfy the closing conditions in the purchase agreement, including regulatory approvals and the implementation of conversion plans; |
• | The timing and extent to which we realize expected revenue, expense and other synergies from our acquisitions; |
• | General market conditions, including the level of interest rates, equity valuations, and trading activity; |
• | Our ability to attract and retain clients, develop trusted relationships, and grow client assets; |
• | Client use of our advisory solutions and other products and services; |
• | The level of client assets, including cash balances; |
- 25 -
THE CHARLES SCHWAB CORPORATION
Management’s Discussion and Analysis of Financial Condition and Results of Operations
(Tabular Amounts in Millions, Except Ratios, or as Noted)
• | Competitive pressure on pricing, including deposit rates; |
• | Client sensitivity to rates; |
• | Regulatory guidance; |
• | Capital and liquidity needs and management; |
• | Our ability to manage expenses; |
• | Our ability to develop and launch new and enhanced products, services, and capabilities, as well as implement infrastructure, in a timely and successful manner; |
• | The effect of pricing reductions on client acquisition, retention and asset levels, including cash balances; |
• | The Company’s ability to monetize client assets; |
• | The timing of campus expansion work and technology projects; |
• | Adverse developments in litigation or regulatory matters and any related charges; |
• | Potential breaches of contractual terms for which we have indemnification and guarantee obligations; and |
• | Client cash sorting and net equity sales. |
Certain of these factors, as well as general risk factors affecting the Company, are discussed in greater detail in Risk Factors in Part I, Item 1A.
- 26 -
THE CHARLES SCHWAB CORPORATION
Management’s Discussion and Analysis of Financial Condition and Results of Operations
(Tabular Amounts in Millions, Except Ratios, or as Noted)
GLOSSARY OF TERMS
Active brokerage accounts: Brokerage accounts with activity within the preceding 270 days.
Accumulated Other Comprehensive Income (AOCI): A component of stockholders’ equity which includes unrealized gains and losses on available for sale (AFS) securities and net gains or losses associated with pension obligations.
Asset-backed securities: Debt securities backed by financial assets such as loans or receivables.
Assets receiving ongoing advisory services: Market value of all client assets custodied at the Company under the guidance of an independent advisor or enrolled in one of Schwab’s advice solutions at the end of the reporting period.
Basel III: Global regulatory standards on bank capital adequacy and liquidity issued by the Basel Committee on Banking Supervision.
Basis point: One basis point equals 1/100th of 1%, or 0.01%.
Client assets: The market value, as of the end of the reporting period, of all client assets in our custody and proprietary products, which includes both cash and securities. Average client assets are the daily average client asset balance for the reporting period.
Client cash as a percentage of client assets: Calculated as the value, at the end of the reporting period, of all proprietary money market fund balances, bank deposits, Schwab One® balances, and certain cash equivalents divided by client assets.
Common Equity Tier 1 (CET1) Capital: The sum of common stock and related surplus net of treasury stock, retained earnings, AOCI and qualifying minority interests, less applicable regulatory adjustments and deductions. See Current Regulatory Environment and Other Developments for information on recently issued rules that will impact Schwab’s regulatory capital requirements.
Common Equity Tier 1 Risk-Based Capital Ratio: The ratio of CET1 Capital to total risk-weighted assets as of the end of the period.
Core net new client assets: Net new client assets before significant one-time inflows or outflows, such as acquisitions/divestitures or extraordinary flows (generally greater than $10 billion) relating to a specific client. These flows may span multiple reporting periods.
Customer Protection Rule: Refers to Rule 15c3-3 of the Securities Exchange Act of 1934.
Daily Average Revenue Trades (DARTs): Total revenue trades during a certain period, divided by the number of trading days in that period. Revenue trades include all client trades that generate trading revenue (i.e., commission revenue or principal transaction revenue).
Daily Average Trades (DATs): Includes daily average revenue trades by clients, trades by clients in asset-based pricing relationships, and all commission-free trades.
Debt to total capital ratio: Calculated as total debt divided by stockholders’ equity and total debt.
Delinquency roll rates: The rates at which loans transition through delinquency stages, ultimately resulting in a loss. Schwab considers a loan to be delinquent if it is 30 days or more past due.
Dodd-Frank Wall Street Reform and Consumer Protection Act (Dodd-Frank): Regulatory reform legislation containing numerous provisions which expanded prudential regulation of large financial services companies.
Duration: Duration is typically used to measure the expected change in value of a financial instrument for a 1% change in interest rates, expressed in years.
- 27 -
THE CHARLES SCHWAB CORPORATION
Management’s Discussion and Analysis of Financial Condition and Results of Operations
(Tabular Amounts in Millions, Except Ratios, or as Noted)
Final Regulatory Capital Rules: Refers to the regulatory capital rules issued by U.S. banking agencies which implemented Basel III and relevant provisions of Dodd-Frank, which apply to savings and loan holding companies, as well as federal savings banks.
First mortgages: Refers to first lien residential real estate mortgage loans.
Full-time equivalent employees: Represents the total number of hours worked divided by a 40-hour work week for the following categories: full-time, part-time and temporary employees and persons employed on a contract basis.
High Quality Liquid Assets (HQLA): HQLA is defined by the Federal Reserve, but includes assets with low market- and credit risk that are actively traded and readily convertible to cash in times of stress.
Interest-bearing liabilities: Includes bank deposits, payables to brokerage clients, short-term borrowings, and long-term debt on which Schwab pays interest.
Interest-earning assets: Includes cash and cash equivalents, cash and investments segregated, broker-related receivables, receivables from brokerage clients, investment securities, and bank loans on which Schwab earns interest.
Investment grade: Defined as a rating equivalent to a Moody’s Investors Service (Moody’s) rating of “Baa” or higher, or a Standard & Poor’s Rating Group (Standard & Poor’s) or Fitch Ratings, Ltd (Fitch) rating of “BBB-” or higher.
Liquidity Coverage Ratio (LCR): The ratio of HQLA to projected net cash outflows during a 30-day stress scenario.
Loan-To-Value (LTV) ratio: Calculated as the principal amount of a loan divided by the value of the collateral securing the loan.
Margin loans: Advances made to brokerage clients on a secured basis to purchase or carry securities reflected in receivables from brokerage clients on the consolidated balance sheets.
Master netting arrangement: An agreement between two counterparties that have multiple contracts with each other that provides for net settlement of all contracts through a single cash payment in the event of default or termination of any one contract.
Mortgage-backed securities: A type of asset-backed security that is secured by a mortgage or group of mortgages.
Net interest margin: Net interest revenue (annualized for interim periods) divided by average interest-earning assets.
Net new client assets: Total inflows of client cash and securities to Schwab less client outflows. Inflows include dividends and interest; outflows include commissions and fees. Capital gains distributions are excluded.
Net Stable Funding Ratio (NSFR): Measures an organization’s “available” amount of stable funding relative to its “required” amount of stable funding over a one-year time horizon.
New brokerage accounts: All brokerage accounts opened during the period, as well as any accounts added via acquisition.
Nonperforming assets: The total of nonaccrual loans and other real estate owned.
Order flow revenue: Net compensation received from markets and firms to which CS&Co sends equity and options orders. The amount reflects rebates received for certain types of orders, less fees paid for orders where exchange fees or other charges apply.
Pledged Asset Line® (PAL): A non-purpose revolving line of credit from CSB secured by eligible assets held in a separate pledged brokerage account maintained at CS&Co.
Return on average common stockholders’ equity: Calculated as net income available to common stockholders (annualized for interim periods) divided by average common stockholders’ equity.
- 28 -
THE CHARLES SCHWAB CORPORATION
Management’s Discussion and Analysis of Financial Condition and Results of Operations
(Tabular Amounts in Millions, Except Ratios, or as Noted)
Risk-weighted assets: Computed by assigning specific risk-weightings to assets and off-balance sheet instruments for capital adequacy calculations.
Tier 1 Capital: The sum of CET1 Capital and additional Tier 1 Capital instruments and related surplus, less applicable adjustments and deductions.
Tier 1 Leverage Ratio: End-of-period Tier 1 Capital divided by adjusted average total consolidated assets for the quarter.
Trading days: Days in which the markets/exchanges are open for the buying and selling of securities. Early market closures are counted as half-days.
U.S. federal banking agencies: Refers to the Federal Reserve, the OCC, the FDIC, and the CFPB.
Uniform Net Capital Rule: Refers to Rule 15c3-1 under the Securities Exchange Act of 1934, which specifies minimum capital requirements that are intended to ensure the general financial soundness and liquidity of broker-dealers at all times.
- 29 -
THE CHARLES SCHWAB CORPORATION
Management’s Discussion and Analysis of Financial Condition and Results of Operations
(Tabular Amounts in Millions, Except Ratios, or as Noted)
OVERVIEW
Management focuses on several client activity and financial metrics in evaluating Schwab’s financial position and operating performance. We believe that metrics relating to net new and total client assets, as well as client cash levels and utilization of advisory services, offer perspective on our business momentum and client engagement. Data on new and total client brokerage accounts provides additional perspective on our ability to attract and retain new business. Total net revenue growth, pre-tax profit margin, EPS, return on average common stockholders’ equity, and the Consolidated Tier 1 Leverage Ratio provide broad indicators of Schwab’s overall financial health, operating efficiency, and ability to generate acceptable returns. Total expenses, excluding interest, as a percentage of average client assets, is a measure of operating efficiency. Results for the years ended December 31, 2019, 2018, and 2017 are as follows:
Growth Rate 1-Year 2018-2019 | 2019 | 2018 | 2017 | ||||||||||
Client Metrics | |||||||||||||
Net new client assets (in billions) (1) | 66% | $ | 222.8 | $ | 133.9 | $ | 233.1 | ||||||
Core net new client assets (in billions) | (7)% | $ | 211.7 | $ | 227.8 | $ | 198.6 | ||||||
Client assets (in billions, at year end) | 24% | $ | 4,038.8 | $ | 3,252.2 | $ | 3,361.8 | ||||||
Average client assets (in billions) | 8% | $ | 3,682.0 | $ | 3,409.6 | $ | 3,060.2 | ||||||
New brokerage accounts (in thousands) | (1)% | 1,568 | 1,576 | 1,441 | |||||||||
Active brokerage accounts (in thousands, at year end) | 6% | 12,333 | 11,593 | 10,755 | |||||||||
Assets receiving ongoing advisory services (in billions, at year end) | 23% | $ | 2,106.8 | $ | 1,708.5 | $ | 1,699.8 | ||||||
Client cash as a percentage of client assets (at year end) | 11.3 | % | 12.8 | % | 10.8 | % | |||||||
Company Financial Metrics | |||||||||||||
Total net revenues | 6% | $ | 10,721 | $ | 10,132 | $ | 8,618 | ||||||
Total expenses excluding interest | 5% | 5,873 | 5,570 | 4,968 | |||||||||
Income before taxes on income | 6% | 4,848 | 4,562 | 3,650 | |||||||||
Taxes on income | 8% | 1,144 | 1,055 | 1,296 | |||||||||
Net income | 6% | $ | 3,704 | $ | 3,507 | $ | 2,354 | ||||||
Preferred stock dividends and other | — | 178 | 178 | 174 | |||||||||
Net income available to common stockholders | 6% | $ | 3,526 | $ | 3,329 | $ | 2,180 | ||||||
Earnings per common share — diluted | 9% | $ | 2.67 | $ | 2.45 | $ | 1.61 | ||||||
Net revenue growth from prior year | 6 | % | 18 | % | 15 | % | |||||||
Pre-tax profit margin | 45.2 | % | 45.0 | % | 42.4 | % | |||||||
Return on average common stockholders’ equity | 19 | % | 19 | % | 15 | % | |||||||
Expenses excluding interest as a percentage of average client assets | 0.16 | % | 0.16 | % | 0.16 | % | |||||||
Consolidated Tier 1 Leverage Ratio (at year end) | 7.3 | % | 7.1 | % | 7.6 | % | |||||||
(1) 2019 and 2017 include inflows of $11.1 billion and $34.5 billion, respectively, from certain mutual fund clearing services clients. 2018 includes outflows of $93.9 billion from certain mutual fund clearing services clients.
2019 Compared to 2018
Schwab delivered solid financial results in 2019 while taking significant steps to further enhance our offer to clients and help position the Company to build value for our stakeholders over the long-term. Throughout the year, investor sentiment reflected a complex market environment that included global trade negotiations and an uncertain domestic economic outlook. The Federal Reserve ended up cutting the federal funds target interest rate three times, in a reversal of the increases seen in 2018. At the same time, stocks continued to rise, with the S&P 500 increasing 29% during the year. Core net new assets totaled $211.7 billion for the year, representing an organic growth rate of 7% and our second consecutive year over $200 billion. Clients opened 1.6 million new brokerage accounts in 2019, while active brokerage accounts grew 6% to 12.3 million. Our success in asset gathering combined with strong market returns drove total client assets to reach $4.04 trillion at December 31, 2019, closing the year up 24%.
- 30 -
THE CHARLES SCHWAB CORPORATION
Management’s Discussion and Analysis of Financial Condition and Results of Operations
(Tabular Amounts in Millions, Except Ratios, or as Noted)
Company actions to benefit clients and build long-term value during 2019 included the elimination of online trading commissions for U.S. and Canadian-listed stocks and ETFs, as well as the base charge on options, which became effective October 7th. The Company also announced two significant acquisitions during the year. In July, the Company agreed to acquire assets of USAA-IMCO and agreed to enter into a long-term referral agreement. In late November, we entered into a definitive agreement to acquire TD Ameritrade.
Against the backdrop of the more challenging than expected macroeconomic environment and our own pricing decisions, Schwab’s net income totaled $3.7 billion in 2019, an increase of $197 million, or 6%. Diluted earnings per common share grew to $2.67, representing an increase of 9% from 2018.
Total net revenues reached $10.7 billion, up 6% in 2019. Net interest revenue increased 12% in 2019 to $6.5 billion, driven by higher average investment yields and also by an increase in client cash balances held at our bank and broker-dealer subsidiaries. While trading revenue declined 19% to $617 million due to our pricing actions, asset management and administration fees remained essentially flat with 2018 at $3.2 billion, decreasing 1%. Growing enrollment in advice solutions, along with rising balances in other third-party mutual funds, helped to largely offset declines in Mutual Fund OneSource® and lower sweep money market fund revenue due to transfers of sweep money market funds to our balance sheet in 2018 and early 2019.
Total expenses excluding interest increased 5% in 2019 to $5.9 billion, which included $62 million in severance charges associated with a 3% reduction in our workforce and $25 million in costs relating to the announced acquisitions of assets of USAA-IMCO and TD Ameritrade. Our ongoing focus on driving efficiency while managing our spending in a disciplined manner helped us maintain a ratio of expenses to client assets of 16 bps for 2019. Reflecting our commitment to balancing long-term profitability with reinvesting for growth, we achieved a 45.2% pre-tax profit margin and a 19% return on equity in 2019, representing our second consecutive year of at least 45% and 19%, respectively.
Disciplined balance sheet management remains core to our strategy as we continue to support business growth and meaningful capital returns across a range of conditions. In early 2019, the Board of Directors raised the quarterly cash dividend 31% to $0.17 per share and authorized the repurchase of up to $4.0 billion of common stock; during 2019 we repurchased 55 million shares for $2.2 billion under this authorization. As of December 31, 2019, our balance sheet assets were $294 billion, down 1% from a year ago; our Tier 1 Leverage Ratio was 7.3% at year-end. As the Company continues to grow both organically and through our pending acquisitions, our intent to return excess capital above our long-term operating objective of 6.75%-7.00% remains in place.
Planned Acquisitions
TD Ameritrade: On November 25, 2019, CSC announced a definitive agreement to acquire TD Ameritrade in an all-stock transaction. At the time of announcement, TD Ameritrade had approximately twelve million brokerage accounts and $1.3 trillion in total client assets. Under the agreement, TD Ameritrade stockholders will receive 1.0837 CSC shares for each TD Ameritrade share. Based on the closing price of CSC common stock on November 20, 2019, the merger consideration represented approximately $26 billion. The Company anticipates this transaction will add scale to help support the Company’s ongoing efforts to enhance the client experience, provide deeper resources for RIAs, and continue to improve our operating efficiency. The transaction is expected to close in the second half of 2020, subject to satisfaction of closing conditions. Under certain circumstances, CSC or TD Ameritrade could be required to pay the other party a termination fee of $950 million or reimburse the other party’s fees up to $50 million.
Assets of USAA-IMCO: On July 25, 2019, the Company announced a definitive agreement to acquire assets of USAA-IMCO, including over one million brokerage and managed portfolio accounts with approximately $90 billion in client assets at the time of announcement, for $1.8 billion in cash. The companies have also agreed to enter into a long-term referral agreement, effective at closing of the acquisition, which would make Schwab the exclusive wealth management and brokerage provider for USAA members. The transaction is expected to close in mid-2020, subject to satisfaction of closing conditions, including regulatory approvals and the implementation of conversion plans.
The Company expects to recognize significant amounts of goodwill and amortizable intangible assets as part of the planned acquisitions.
- 31 -
THE CHARLES SCHWAB CORPORATION
Management’s Discussion and Analysis of Financial Condition and Results of Operations
(Tabular Amounts in Millions, Except Ratios, or as Noted)
2018 Compared to 2017
Net income increased by $1.2 billion, or 49%, in 2018, driven primarily by business momentum, a supportive economic environment for much of the year, and lower corporate tax rates. Continued execution of our ‘Through Clients’ Eyes’ strategy helped us succeed with clients. In 2018, clients opened 1.6 million new brokerage accounts, helping bring active brokerage accounts to 11.6 million at the end of the year, and core net new assets totaled $227.8 billion, up 15% from the 2017 total. Our strong net new assets largely offset lower market valuations, and we ended 2018 at $3.25 trillion in total client assets.
Total net revenue grew by $1.5 billion, or 18%, in 2018 primarily due to an increase of $1.5 billion, or 36%, in net interest revenue. The Fed raised the federal funds target interest rate four times in 2018 for a total of 100 basis points. The growth of total net revenue resulted from higher interest rates due to the Fed’s rate increases, and also from higher interest-earning assets, which reflect both client cash allocations and the transfer of sweep money market funds to bank and broker-dealer sweep. As we progressed with these transfers, the corresponding money market fund asset management and administration fee revenue naturally declined, yet positive inflows in advice solutions, Schwab equity and bond funds and ETFs, and other third-party mutual funds and ETFs kept asset management fees at $3.2 billion, limiting the decrease to 5% from 2017. Record trading activity from our clients resulted in trading revenue reaching $763 million, an increase of 17% from the prior year.
Our increase in total expenses excluding interest of $602 million, or 12%, reflected our 2018 investments to support and fuel our business growth, including hiring additional client-facing and other employees and technology project spending, as well as an increase in marketing and a special stock award of $36 million to our employees. Even with these increases, expenses as a percentage of client assets remained consistent at 16 basis points, and pre-tax income increased 25% to $4.6 billion in 2018, resulting in a pre-tax profit margin of 45.0%. As a result of the Tax Cuts and Jobs Act of 2017 (the Tax Act), taxes on income decreased 19% in 2018, resulting in an effective tax rate of 23.1%. Overall, we generated a 19% return on equity and diluted EPS of $2.45 for the year.
During 2018, the Board of Directors raised the quarterly cash dividend 63% to $0.13 per share and authorized a $1.0 billion Share Repurchase Program, which we completed during the fourth quarter of 2018. These actions reflected the Company’s strong financial performance and our confidence in its long-term success; they also demonstrated that effective capital management at Schwab can support both healthy business growth and more meaningful capital returns to stockholders.
Subsequent Events
In October 2019, the Federal Reserve issued a final enhanced prudential standards rule, and the Federal Reserve, OCC, and the FDIC jointly issued a final regulatory capital and liquidity rule. With total consolidated assets of $294.0 billion at December 31, 2019, CSC is designated as a Category III firm pursuant to the framework established by the final rules. Accordingly, the Company opted to exclude AOCI from its regulatory capital as permitted by the regulatory capital and liquidity rule beginning January 1, 2020. In accordance with ASC 320, Investments – Debt and Equity Securities (ASC 320) and as of January 1, 2020, the Company transferred all of its investment securities designated as held to maturity (HTM) to the AFS category without tainting our intent to hold other debt securities to maturity. At the date of transfer, these securities had a total amortized cost of $134.7 billion and a total net unrealized gain of $1.4 billion.
CURRENT REGULATORY ENVIRONMENT AND OTHER DEVELOPMENTS
In December 2019, the FDIC issued a proposed rule that would modernize its brokered deposits regulations. Among other things, the proposed rule would clarify the “primary purpose” exception from the definition of a deposit broker for securities broker-dealers such as CS&Co that place deposits through brokerage sweep arrangements under certain conditions. In addition, the proposed rule would create a streamlined application process for obtaining a primary purpose exception where less than 25 percent of a broker-dealer’s customer assets are placed with a depository institution. Schwab is currently evaluating the impact of the proposed rule on its bank sweep program.
In January 2020, the OCC and the FDIC published their jointly proposed revisions to the regulations implementing the CRA. The proposed regulations (i) clarify and expand what qualifies for CRA credit; (ii) expand where CRA activity counts; (iii) provide an objective method to measure CRA activity; and (iv) revise data collection, recordkeeping, and reporting. The
- 32 -
THE CHARLES SCHWAB CORPORATION
Management’s Discussion and Analysis of Financial Condition and Results of Operations
(Tabular Amounts in Millions, Except Ratios, or as Noted)
Federal Reserve did not join the OCC and the FDIC in the proposed regulations. The comment period for the proposed regulations ends on March 9, 2020. Schwab is currently evaluating the impact of the proposed regulations.
In May 2016, the Federal Reserve, the OCC and the FDIC jointly issued a notice of proposed rulemaking that would impose a minimum NSFR on certain banking organizations, including CSC. The comment period for the proposed rule ended on August 5, 2016 and the impact to the Company cannot be assessed until the final rule is released. The agencies indicated in the October 2019 interagency regulatory capital and liquidity rule their intention to utilize the four category tiering framework when the NSFR rule is adopted.
RESULTS OF OPERATIONS
Total Net Revenues
Total net revenues of $10.7 billion and $10.1 billion for the years ended December 31, 2019 and 2018, respectively, represented growth of 6% and 18% from the prior periods, primarily due to increases in net interest revenue.
Year Ended December 31, | 2019 | 2018 | 2017 | |||||||||||||||||
Growth Rate 2018-2019 | Amount | % of Total Net Revenues | Amount | % of Total Net Revenues | Amount | % of Total Net Revenues | ||||||||||||||
Net interest revenue | ||||||||||||||||||||
Interest revenue | 13 | % | $ | 7,580 | 71 | % | $ | 6,680 | 66 | % | $ | 4,624 | 54 | % | ||||||
Interest expense | 24 | % | (1,064 | ) | (10 | )% | (857 | ) | (9 | )% | (342 | ) | (4 | )% | ||||||
Net interest revenue | 12 | % | 6,516 | 61 | % | 5,823 | 57 | % | 4,282 | 50 | % | |||||||||
Asset management and administration fees | ||||||||||||||||||||
Mutual funds, ETFs, and collective trust funds (CTFs) (1) | (5 | )% | 1,747 | 16 | % | 1,837 | 18 | % | 2,088 | 24 | % | |||||||||
Advice solutions | 5 | % | 1,198 | 11 | % | 1,139 | 11 | % | 1,043 | 12 | % | |||||||||
Other (1) | 5 | % | 266 | 3 | % | 253 | 3 | % | 261 | 3 | % | |||||||||
Asset management and administration fees | (1 | )% | 3,211 | 30 | % | 3,229 | 32 | % | 3,392 | 39 | % | |||||||||
Trading revenue | ||||||||||||||||||||
Commissions | (20 | )% | 549 | 5 | % | 685 | 7 | % | 600 | 7 | % | |||||||||
Principal transactions | (13 | )% | 68 | 1 | % | 78 | 1 | % | 54 | 1 | % | |||||||||
Trading revenue | (19 | )% | 617 | 6 | % | 763 | 8 | % | 654 | 8 | % | |||||||||
Other | 19 | % | 377 | 3 | % | 317 | 3 | % | 290 | 3 | % | |||||||||
Total net revenues | 6 | % | $ | 10,721 | 100 | % | $ | 10,132 | 100 | % | $ | 8,618 | 100 | % | ||||||
(1) Beginning in 2019, a change was made to move CTFs from other asset management and administration fees. Prior periods have been recast to reflect this change.
Net Interest Revenue
Schwab’s primary interest-earning assets include cash and cash equivalents; cash and investments segregated; margin loans, which constitute the majority of receivables from brokerage clients; investment securities; and bank loans. Revenue on interest-earning assets is affected by various factors, such as the composition of assets, prevailing interest rates and spreads at the time of origination or purchase, changes in interest rates on floating rate securities and loans, and changes in prepayment levels for mortgage-backed and other asset-backed securities and loans. Fees earned on securities borrowing and lending activities, which are conducted by CS&Co using assets held in client brokerage accounts, are primarily included in other interest revenue and expense.
Schwab’s interest-bearing liabilities include bank deposits, payables to brokerage clients, short-term borrowings (e.g., Federal Home Loan Bank (FHLB) advances), and long-term debt. Non-interest-bearing funding sources include stockholders’ equity, certain client cash balances, and other miscellaneous liabilities.
We establish the rates paid on client-related liabilities, and management expects that it will generally adjust the rates paid on these liabilities at some fraction of any movement in short-term rates. Schwab deploys the funds from these sources into the
- 33 -
THE CHARLES SCHWAB CORPORATION
Management’s Discussion and Analysis of Financial Condition and Results of Operations
(Tabular Amounts in Millions, Except Ratios, or as Noted)
assets outlined above. We do not use short-term, wholesale borrowings to support our long-term investment activity, but may use such funding, including FHLB advances, for short-term liquidity purposes or to provide temporary funding (e.g., for investment purchases) ahead of anticipated balance sheet deposit growth.
In order to keep interest-rate sensitivity within established limits, management actively monitors and adjusts interest-rate sensitivity through changes in the balance sheet, primarily by adjusting the composition of our banking subsidiaries’ investment portfolios. As Schwab builds its client base, we attract new client sweep cash, which is a primary driver of funding balance sheet growth.
Towards the end of 2018, the federal funds target interest rate increased to levels not seen in over a decade, leading us to expect some clients would shift more of their cash holdings from brokerage deposits swept to our banking subsidiaries to higher-yielding alternatives like purchased money market funds. We therefore expected brokerage deposits swept to our banking subsidiaries, excluding organic growth, to decline during the first part of 2019. As a result, we held a higher amount of short-term liquidity at our banking subsidiaries at the end of 2018 to accommodate this potential client cash sorting.
While average interest rates throughout the year in 2019 were higher than average rates in 2018, interest rates across maturities declined from December 2018 to December 2019. Lower interest rates typically result in longer durations on our client-related liabilities and shorter durations on our investment securities, especially mortgage-related securities with options to prepay without penalty. During 2019, to maintain our overall targeted interest rate risk profile, we began positioning our banking entities’ investment portfolios to include a higher percentage of fixed-rate, longer duration investments to reduce our interest rate sensitivities which would naturally increase as market rates declined. We did, however, once again hold a higher level of short-term liquidity at the end of 2019 to accommodate a typical seasonal buildup of client cash, much of which then generally moves to other assets within a few months.
We believe that the process of clients sorting between transactional cash and cash held for investment is subsiding. Aligned with market consensus, we do not expect to see a significant increase in market rates in the near term. Over the course of 2020, we expect to further reduce our exposure to lower rates primarily by adding a larger percentage of fixed-rate securities with relatively longer duration to our ongoing purchases as a result of maturities, prepayments, organic deposit growth, on-boarding of USAA-IMCO client cash to our balance sheet, and any potential asset-liability-management-driven investment portfolio re-balancing. As such, we expect the duration difference between our liabilities and assets to decline over the course of 2020.
- 34 -
THE CHARLES SCHWAB CORPORATION
Management’s Discussion and Analysis of Financial Condition and Results of Operations
(Tabular Amounts in Millions, Except Ratios, or as Noted)
The following table presents net interest revenue information corresponding to interest-earning assets and funding sources on the consolidated balance sheets:
Year Ended December 31, | 2019 | 2018 | 2017 | |||||||||||||||||||||||||||||
Average Balance | Interest Revenue/ Expense | Average Yield/ Rate | Average Balance | Interest Revenue/ Expense | Average Yield/ Rate | Average Balance | Interest Revenue/ Expense | Average Yield/ Rate | ||||||||||||||||||||||||
Interest-earning assets | ||||||||||||||||||||||||||||||||
Cash and cash equivalents | $ | 23,512 | $ | 518 | 2.17 | % | $ | 17,783 | $ | 348 | 1.93 | % | $ | 9,931 | $ | 109 | 1.10 | % | ||||||||||||||
Cash and investments segregated | 15,694 | 345 | 2.17 | % | 11,461 | 206 | 1.78 | % | 18,525 | 166 | 0.90 | % | ||||||||||||||||||||
Broker-related receivables | 376 | 7 | 1.87 | % | 303 | 6 | 2.09 | % | 430 | 3 | 0.70 | % | ||||||||||||||||||||
Receivables from brokerage clients | 19,270 | 821 | 4.20 | % | 19,870 | 830 | 4.12 | % | 16,269 | 575 | 3.53 | % | ||||||||||||||||||||
Available for sale securities (1) | 58,181 | 1,560 | 2.67 | % | 54,542 | 1,241 | 2.26 | % | 53,040 | 815 | 1.54 | % | ||||||||||||||||||||
Held to maturity securities | 134,708 | 3,591 | 2.65 | % | 131,794 | 3,348 | 2.53 | % | 103,599 | 2,354 | 2.27 | % | ||||||||||||||||||||
Bank loans | 16,832 | 584 | 3.47 | % | 16,554 | 559 | 3.37 | % | 15,919 | 472 | 2.97 | % | ||||||||||||||||||||
Total interest-earning assets | 268,573 | 7,426 | 2.75 | % | 252,307 | 6,538 | 2.57 | % | 217,713 | 4,494 | 2.06 | % | ||||||||||||||||||||
Other interest revenue | 154 | 142 | 130 | |||||||||||||||||||||||||||||
Total interest-earning assets | $ | 268,573 | $ | 7,580 | 2.80 | % | $ | 252,307 | $ | 6,680 | 2.63 | % | $ | 217,713 | $ | 4,624 | 2.12 | % | ||||||||||||||
Funding sources | ||||||||||||||||||||||||||||||||
Bank deposits | $ | 212,605 | $ | 700 | 0.33 | % | $ | 199,139 | $ | 545 | 0.27 | % | $ | 163,998 | $ | 148 | 0.09 | % | ||||||||||||||
Payables to brokerage clients | 24,353 | 79 | 0.33 | % | 21,178 | 56 | 0.27 | % | 25,403 | 16 | 0.06 | % | ||||||||||||||||||||
Short-term borrowings (2) | 17 | — | 2.36 | % | 3,359 | 54 | 1.59 | % | 3,503 | 41 | 1.17 | % | ||||||||||||||||||||
Long-term debt | 7,199 | 258 | 3.58 | % | 5,423 | 190 | 3.50 | % | 3,431 | 119 | 3.47 | % | ||||||||||||||||||||
Total interest-bearing liabilities | 244,174 | 1,037 | 0.42 | % | 229,099 | 845 | 0.37 | % | 196,335 | 324 | 0.17 | % | ||||||||||||||||||||
Non-interest-bearing funding sources | 24,399 | 23,208 | 21,378 | |||||||||||||||||||||||||||||
Other interest expense | 27 | 12 | 18 | |||||||||||||||||||||||||||||
Total funding sources | $ | 268,573 | $ | 1,064 | 0.39 | % | $ | 252,307 | $ | 857 | 0.34 | % | $ | 217,713 | $ | 342 | 0.15 | % | ||||||||||||||
Net interest revenue | $ | 6,516 | 2.41 | % | $ | 5,823 | 2.29 | % | $ | 4,282 | 1.97 | % | ||||||||||||||||||||
(1) Amounts have been calculated based on amortized cost.
(2) Interest revenue or expense was less than $500,000 in the period or periods presented.
Net interest revenue increased $693 million or 12%, in 2019 from 2018, and $1.5 billion, or 36%, in 2018 from 2017, due to higher average investment yields and growth in interest earning assets.
Our net interest margin improved 12 basis points to 2.41% in 2019, driven primarily by higher average yields received on interest-earning assets in 2019 due largely to the net impact of the Federal Reserve’s interest rate increases in 2018 and decreases in the third and fourth quarters of 2019. The increase in average yields on interest-earning assets was partially offset by higher average interest rates paid on bank deposits and other interest-bearing liabilities. The portfolio adjustments made in 2019 as described above helped to moderate the impact of the declining rate environment on our net interest margin.
Average interest-earning assets grew 6% from 2018 to 2019, primarily driven by higher bank deposits due to transfers from sweep money market funds to bank sweep, as well as higher client cash balances.
Our net interest margin improved 32 basis points to 2.29% in 2018, primarily as a result of the Federal Reserve’s 2017 and 2018 interest rate increases, partially offset by higher interest rates paid on bank deposits and other interest-bearing liabilities. Average interest earning assets grew 16% from 2017 to 2018, primarily reflecting higher bank deposits due to transfers from sweep money market funds to bank sweep, as well as changes in client cash allocations, partially offset by client purchases of other assets. In March 2017, the Company transferred $24.7 billion of debt securities from the AFS category to the HTM category. The transfer had no effect on the overall net interest margin. Short-term borrowings in 2018 and 2017 primarily included FHLB advances, which were used to provide temporary funding for investments ahead of deposit growth.
- 35 -
THE CHARLES SCHWAB CORPORATION
Management’s Discussion and Analysis of Financial Condition and Results of Operations
(Tabular Amounts in Millions, Except Ratios, or as Noted)
Asset Management and Administration Fees
Asset management and administration fees include mutual fund, ETF, and CTF service fees and fees for other asset-based financial services provided to individual and institutional clients. Schwab earns mutual fund, ETF, and CTF service fees for shareholder services, administration, and investment management provided to its proprietary funds, and recordkeeping and shareholder services provided to third-party funds. Asset management and administration fees are based upon the daily balances of client assets invested in these funds and do not include securities lending revenues earned by proprietary mutual funds, ETFs, and CTFs, as those amounts, net of program fees, are credited to the fund shareholders. Proprietary CTFs may, but generally do not, directly participate in securities lending. The fair values of client assets included in proprietary and third-party mutual funds, ETFs, and CTFs are based on quoted market prices and other observable market data.
We also earn asset management fees for advice solutions, which include managed portfolios, specialized strategies, and customized investment advice. Other asset management and administration fees include various asset-based fees such as trust fees, 401(k) recordkeeping fees, mutual fund clearing fees, and non-balance based service and transaction fees.
Asset management and administration fees vary with changes in the balances of client assets due to market fluctuations and client activity.
The following table presents asset management and administration fees, average client assets, and average fee yields:
Year Ended December 31, | 2019 | 2018 | 2017 | |||||||||||||||||||||||||||||
Average Client Assets | Revenue | Average Fee | Average Client Assets | Revenue | Average Fee | Average Client Assets | Revenue | Average Fee | ||||||||||||||||||||||||
Schwab money market funds before fee waivers | $ | 173,558 | $ | 525 | 0.30 | % | $ | 141,018 | $ | 568 | 0.40 | % | $ | 160,735 | $ | 875 | 0.54 | % | ||||||||||||||
Fee waivers | — | — | (10 | ) | ||||||||||||||||||||||||||||
Schwab money market funds | 173,558 | 525 | 0.30 | % | 141,018 | 568 | 0.40 | % | 160,735 | 865 | 0.54 | % | ||||||||||||||||||||
Schwab equity and bond funds, ETFs, and CTFs (1) | 267,213 | 298 | 0.11 | % | 222,830 | 302 | 0.14 | % | 172,809 | 266 | 0.15 | % | ||||||||||||||||||||
Mutual Fund OneSource® and other non- transaction fee funds | 191,552 | 606 | 0.32 | % | 210,429 | 680 | 0.32 | % | 215,333 | 706 | 0.33 | % | ||||||||||||||||||||
Other third-party mutual funds and ETFs (2) | 478,037 | 318 | 0.07 | % | 328,150 | 287 | 0.09 | % | 286,111 | 251 | 0.09 | % | ||||||||||||||||||||
Total mutual funds, ETFs, and CTFs (1,3) | $ | 1,110,360 | 1,747 | 0.16 | % | $ | 902,427 | 1,837 | 0.20 | % | $ | 834,988 | 2,088 | 0.25 | % | |||||||||||||||||
Advice solutions (3) | ||||||||||||||||||||||||||||||||
Fee-based | $ | 246,888 | 1,198 | 0.49 | % | $ | 227,790 | 1,139 | 0.50 | % | $ | 203,794 | 1,043 | 0.51 | % | |||||||||||||||||
Non-fee-based | 70,191 | — | — | 62,813 | — | — | 48,936 | — | — | |||||||||||||||||||||||
Total advice solutions | $ | 317,079 | 1,198 | 0.38 | % | $ | 290,603 | 1,139 | 0.39 | % | $ | 252,730 | 1,043 | 0.41 | % | |||||||||||||||||
Other balance-based fees (1,4) | 432,613 | 216 | 0.05 | % | 383,050 | 206 | 0.05 | % | 403,474 | 215 | 0.05 | % | ||||||||||||||||||||
Other (5) | 50 | 47 | 46 | |||||||||||||||||||||||||||||
Total asset management and administration fees | $ | 3,211 | $ | 3,229 | $ | 3,392 | ||||||||||||||||||||||||||
(1) Beginning in the first quarter of 2019, a change was made to move CTFs from other balance-based fees. Prior periods have been recast to reflect this change.
(2) Beginning in the fourth quarter of 2019, Schwab ETF OneSourceTM was discontinued as a result of the elimination of online trading commissions for U.S. and Canadian-listed ETFs.
(3) Average client assets for advice solutions may also include the asset balances contained in the mutual fund and/or ETF categories listed above.
(4) Includes various asset-related fees, such as trust fees, 401(k) recordkeeping fees, and mutual fund clearing fees and other service fees.
(5) Includes miscellaneous service and transaction fees relating to mutual funds and ETFs that are not balance-based.
Asset management and administration fees decreased by $18 million, or 1%, in 2019 from 2018, primarily due to lower sweep money market fund revenue as a result of transfers to bank and broker-dealer sweep in 2018 and early 2019, as well as client asset allocation choices including continued reduced usage of Mutual Fund OneSource®. Part of the decline was offset by revenue from growing asset balances in purchased money market funds, other third-party mutual funds and ETFs, and in advice solutions.
Asset management and administration fees decreased by $163 million, or 5%, in 2018 from 2017, primarily due to lower money market fund revenue as a result of transfers to bank sweep, client asset allocation choices, and lower fee rates on
- 36 -
THE CHARLES SCHWAB CORPORATION
Management’s Discussion and Analysis of Financial Condition and Results of Operations
(Tabular Amounts in Millions, Except Ratios, or as Noted)
proprietary money funds and other indexed mutual funds and ETFs due to fee reductions implemented by the Company in 2017. Part of the decline was offset by revenue from growing asset balances in advice solutions, Schwab equity and bond funds, ETFs, and CTFs, and other third-party mutual funds and ETFs.
The following table presents a roll forward of client assets for the Schwab money market funds, Schwab equity and bond funds, ETFs, and CTFs, and Mutual Fund OneSource® and other non-transaction fee (NTF) funds. The following funds generated 45%, 48%, and 54% of the asset management and administration fees earned during 2019, 2018, and 2017, respectively:
Schwab Money | Schwab Equity and | Mutual Fund OneSource® | ||||||||||||||||||||||||||||||||||
Market Funds | Bond Funds, ETFs, and CTFs (1) | and Other NTF Funds | ||||||||||||||||||||||||||||||||||
Year Ended December 31, | 2019 | 2018 | 2017 | 2019 | 2018 | 2017 | 2019 | 2018 | 2017 | |||||||||||||||||||||||||||
Balance at beginning of period | $ | 153,472 | $ | 163,650 | $ | 163,495 | $ | 209,471 | $ | 196,784 | $ | 138,524 | $ | 180,532 | $ | 225,202 | $ | 198,924 | ||||||||||||||||||
Net inflows (outflows) | 44,077 | (11,641 | ) | (486 | ) | 26,039 | 31,169 | 31,127 | (19,930 | ) | (37,513 | ) | (27,485 | ) | ||||||||||||||||||||||
Net market gains (losses) and other (2) | 3,277 | 1,463 | 641 | 50,765 | (18,482 | ) | 27,133 | 41,466 | (7,157 | ) | 53,763 | |||||||||||||||||||||||||
Balance at end of period | $ | 200,826 | $ | 153,472 | $ | 163,650 | $ | 286,275 | $ | 209,471 | $ | 196,784 | $ | 202,068 | $ | 180,532 | $ | 225,202 | ||||||||||||||||||
(1) Beginning in the first quarter of 2019, CTFs are included in these balances. Prior periods have been recast to reflect this change.
(2) Includes net inflows from other third-party mutual funds to Mutual Fund OneSource® in the second quarter of 2017.
Trading Revenue
Trading revenue includes commission and principal transaction revenues. Commission revenue is affected by the number of revenue trades executed and the average revenue earned per revenue trade. Principal transaction revenue is primarily comprised of revenue from trading activity in fixed income securities with clients. To accommodate clients’ fixed income trading activity, Schwab maintains positions in fixed income securities, including U.S. state and municipal debt obligations, U.S. Government and corporate debt, and other securities. The difference between the price at which the Company buys and sells securities to and from its clients and other broker-dealers is recognized as principal transaction revenue. Principal transaction revenue also includes adjustments to the fair value of these securities positions.
The following table presents trading revenue and the related drivers:
Year Ended December 31, | Growth Rate 2018-2019 | 2019 | 2018 | 2017 | ||||||||||
DARTs (in thousands) | (20 | )% | 338.4 | 420.9 | 321.3 | |||||||||
Daily average trades (in thousands) | (2 | )% | 748.9 | 765.4 | 608.8 | |||||||||
Number of trading days | — | 250.5 | 249.5 | 250.0 | ||||||||||
Daily average revenue per revenue trade | — | $ | 7.26 | $ | 7.23 | $ | 8.20 | |||||||
Trading revenue | (19 | )% | $ | 617 | $ | 763 | $ | 654 | ||||||
Trading revenue decreased by $146 million, or 19%, in 2019 compared to 2018. The decrease was primarily due to a 20% decrease in DART volumes in 2019 as a result of the elimination of online trading commissions for U.S. and Canadian-listed stocks and ETFs, as well as the base charge on options effective October 7, 2019.
Trading revenue increased by $109 million, or 17%, in 2018 compared to 2017. This increase was due primarily to a 31% increase in DART volumes in 2018, which more than offset Schwab’s 2017 commission pricing reductions to lower standard equity, ETF, and option trade commissions from $8.95 to $4.95 and lower the per contract option fee from $.75 to $.65.
Other Revenue
Other revenue includes order flow revenue, other service fees, software fees from our portfolio management solutions, exchange processing fees, and non-recurring gains. Other revenue increased $60 million, or 19%, in 2019 compared to 2018 due primarily to a gain from the sale of a portfolio management and reporting software solution for advisors to Tamarac Inc. in the second quarter of 2019 and a gain from the assignment of leased office space in the first quarter of 2019. Order flow revenue was $135 million during 2019, $139 million for 2018, and $114 million in 2017. The increase in 2018 from 2017 was primarily due to higher rebate rates received on certain types of orders and higher volume of trades.
- 37 -
THE CHARLES SCHWAB CORPORATION
Management’s Discussion and Analysis of Financial Condition and Results of Operations
(Tabular Amounts in Millions, Except Ratios, or as Noted)
Total Expenses Excluding Interest
The following table shows a comparison of total expenses excluding interest:
Growth Rate 2018-2019 | 2019 | 2018 | 2017 | |||||||||||
Compensation and benefits | ||||||||||||||
Salaries and wages | 16 | % | $ | 1,958 | $ | 1,692 | $ | 1,496 | ||||||
Incentive compensation | (6 | )% | 804 | 855 | 797 | |||||||||
Employee benefits and other | 9 | % | 558 | 510 | 444 | |||||||||
Total compensation and benefits | 9 | % | $ | 3,320 | $ | 3,057 | $ | 2,737 | ||||||
Professional services | 7 | % | 702 | 654 | 580 | |||||||||
Occupancy and equipment | 13 | % | 559 | 496 | 436 | |||||||||
Advertising and market development | (2 | )% | 307 | 313 | 268 | |||||||||
Communications | 5 | % | 253 | 242 | 231 | |||||||||
Depreciation and amortization | 14 | % | 349 | 306 | 269 | |||||||||
Regulatory fees and assessments | (35 | )% | 122 | 189 | 179 | |||||||||
Other | (17 | )% | 261 | 313 | 268 | |||||||||
Total expenses excluding interest | 5 | % | $ | 5,873 | $ | 5,570 | $ | 4,968 | ||||||
Expenses as a percentage of total net revenues | ||||||||||||||
Compensation and benefits | 31 | % | 30 | % | 32 | % | ||||||||
Advertising and market development | 3 | % | 3 | % | 3 | % | ||||||||
Full-time equivalent employees (in thousands) | ||||||||||||||
At year end | 1 | % | 19.7 | 19.5 | 17.6 | |||||||||
Average | 7 | % | 20.0 | 18.7 | 16.9 | |||||||||
Expenses excluding interest increased in 2019 and 2018 from the prior years by 5% and 12%, respectively. The largest driver of the increase in both years was compensation and benefits costs.
Total compensation and benefits increased in 2019 from 2018, primarily due to both an overall increase in employee headcount to support our expanding client base and higher severance costs, which included $62 million associated with a 3% reduction in our workforce in the third quarter of 2019. The increase in 2018 from 2017 was primarily due to increases in employee headcount; additionally, special stock awards were issued in 2018 to non-officer employees, totaling $36 million.
Professional services expense increased in 2019 from 2018, primarily due to overall growth in the business, investments in projects to further drive efficiency and scale, and certain costs relating to pending acquisitions. The increase in 2018 from 2017 was primarily due to higher spending on technology projects as well as an increase in asset management and administration related expenses resulting from growth in the Schwab Funds® and Schwab ETFs™.
Occupancy and equipment expense increased in 2019 and 2018 from the prior years, primarily due to increases in software maintenance expenses and additional licenses to support growth in the business.
Advertising and market development expense increased in 2018 from 2017, primarily reflecting management’s decision to increase television advertising and digital media spending in the fourth quarter of 2018.
Depreciation and amortization expenses grew in 2019 and 2018 from the prior years, primarily due to higher amortization of internally developed software associated with continued investments in software and technology enhancements.
Regulatory fees and assessments decreased in 2019 from 2018, primarily due to a decrease in FDIC insurance assessments resulting from the elimination of the FDIC surcharge in the fourth quarter of 2018. Regulatory fees and assessments
- 38 -
THE CHARLES SCHWAB CORPORATION
Management’s Discussion and Analysis of Financial Condition and Results of Operations
(Tabular Amounts in Millions, Except Ratios, or as Noted)
increased in 2018 from 2017, due to an increase in FDIC insurance assessments which rose as a result of higher average assets in deposit balances, partially offset by the elimination of the FDIC surcharge.
Other expenses decreased in 2019 from 2018, primarily due to lower travel and entertainment expense and bad debt expense. Other expenses increased in 2018 from 2017 due to travel and entertainment and miscellaneous items due to overall growth in the business.
Capital expenditures were $753 million, $576 million, and $412 million in 2019, 2018, and 2017, respectively. The increases in capital expenditures in 2019 and 2018 from the prior years were primarily due to the expansion of our campuses in the U.S., with investments in buildings totaling $397 million and $253 million in 2019 and 2018, respectively. Capitalized costs for developing internal-use software totaled $165 million, $167 million, and $157 million in 2019, 2018, and 2017, respectively.
Our capital expenditures for 2019 equaled 7% of total net revenues, within our estimated range for the year. Along with continued campus expansion, we will continue to invest further in technology projects in 2020. Excluding any potential impact of the pending acquisition of TD Ameritrade, we anticipate capital expenditures in 2020 to be approximately 5-6% of total net revenues, while our longer term expectation for capital expenditures remains in the range of 3-5% of total net revenues.
Taxes on Income
On December 22, 2017, P.L.115-97, the Tax Act, was signed into law, and became effective on January 1, 2018. Among other things, the Tax Act lowered the federal corporate income tax rate from 35% to 21% beginning in 2018. As a result of the Tax Act, Schwab recognized a $46 million one-time non-cash charge to taxes on income in the fourth quarter of 2017 associated with the remeasurement of net deferred tax assets and other tax adjustments related to the Tax Act.
Schwab’s effective income tax rate on income before taxes was 23.6% in 2019, 23.1% in 2018, and 35.5% in 2017. The change in rates in 2019 from 2018 was primarily due to a decrease in equity compensation tax deduction benefits which reduced our tax expense by approximately $23 million and $46 million in 2019 and 2018, respectively. The change in rates in 2018 from 2017 was primarily due to impacts of the Tax Act and a decrease in equity compensation tax deduction benefits, which totaled $87 million in 2017.
Segment Information
Schwab provides financial services to individuals and institutional clients through two segments – Investor Services and Advisor Services. The Investor Services segment provides retail brokerage and banking services to individual investors, and retirement plan services, as well as other corporate brokerage services to businesses and their employees. The Advisor Services segment provides custodial, trading, banking, and support services, as well as retirement business services, to independent RIAs, independent retirement advisors, and recordkeepers. Revenues and expenses are attributed to the two segments based on which segment services the client. Management evaluates the performance of the segments on a pre-tax basis. Segment assets and liabilities are not used for evaluating segment performance or in deciding how to allocate resources to segments. Net revenues in both segments are generated from the underlying client assets and trading activity; differences in the composition of net revenues between the segments are based on the composition of client assets, client trading frequency, and pricing unique to each. While both segments leverage the scale and efficiency of our platforms, segment expenses reflect the dynamics of serving millions of clients in Investor Services versus the thousands of RIAs on the advisor platform.
- 39 -
THE CHARLES SCHWAB CORPORATION
Management’s Discussion and Analysis of Financial Condition and Results of Operations
(Tabular Amounts in Millions, Except Ratios, or as Noted)
Financial information for our segments is presented in the following table:
Investor Services | Advisor Services | Total | |||||||||||||||||||||||||||||||||||||||||||
Growth Rate 2018-2019 | 2019 | 2018 | 2017 | Growth Rate 2018-2019 | 2019 | 2018 | 2017 | Growth Rate 2018-2019 | 2019 | 2018 | 2017 | ||||||||||||||||||||||||||||||||||
Year Ended December 31, | |||||||||||||||||||||||||||||||||||||||||||||
Net Revenues | |||||||||||||||||||||||||||||||||||||||||||||
Net interest revenue | 8 | % | $ | 4,685 | $ | 4,341 | $ | 3,231 | 24 | % | $ | 1,831 | $ | 1,482 | $ | 1,051 | 12 | % | $ | 6,516 | $ | 5,823 | $ | 4,282 | |||||||||||||||||||||
Asset management and administration fees | 1 | % | 2,289 | 2,260 | 2,344 | (5 | )% | 922 | 969 | 1,048 | (1 | )% | 3,211 | 3,229 | 3,392 | ||||||||||||||||||||||||||||||
Trading revenue | (20 | )% | 378 | 475 | 408 | (17 | )% | 239 | 288 | 246 | (19 | )% | 617 | 763 | 654 | ||||||||||||||||||||||||||||||
Other | 11 | % | 271 | 245 | 217 | 47 | % | 106 | 72 | 73 | 19 | % | 377 | 317 | 290 | ||||||||||||||||||||||||||||||
Total net revenues | 4 | % | 7,623 | 7,321 | 6,200 | 10 | % | 3,098 | 2,811 | 2,418 | 6 | % | 10,721 | 10,132 | 8,618 | ||||||||||||||||||||||||||||||
Expenses Excluding Interest | 3 | % | 4,284 | 4,145 | 3,725 | 12 | % | 1,589 | 1,425 | 1,243 | 5 | % | 5,873 | 5,570 | 4,968 | ||||||||||||||||||||||||||||||
Income before taxes on income | 5 | % | $ | 3,339 | $ | 3,176 | $ | 2,475 | 9 | % | $ | 1,509 | $ | 1,386 | $ | 1,175 | 6 | % | $ | 4,848 | $ | 4,562 | $ | 3,650 | |||||||||||||||||||||
Net new client assets (in billions) (1) | N/M | $ | 115.6 | $ | 19.4 | $ | 123.7 | (6 | )% | $ | 107.2 | $ | 114.5 | $ | 109.4 | 66 | % | $ | 222.8 | $ | 133.9 | $ | 233.1 | ||||||||||||||||||||||
(1) Investor Services includes inflows of $11.1 billion and $34.5 billion in 2019 and 2017, respectively, and outflows of $93.9 billion in 2018 from certain mutual fund clearing services clients.
N/M Not meaningful.
Investor Services
Total net revenues increased by 4% in 2019 from 2018 primarily due to an increase in net interest revenue and higher asset management and administrations fees, partially offset by lower trading revenue. Net interest revenue increased primarily due to higher average investment yields and higher interest-earning assets. Asset management and administration fees increased primarily due to growing asset balances in advice solutions, partially offset by lower mutual fund and ETF service fee revenue as a result of client cash allocation choices, including reduced usage of Mutual Fund OneSource®. Trading revenue decreased as a result of the elimination of online trading commissions for U.S. and Canadian-listed stocks and ETFs, as well as the base charge on options in the fourth quarter of 2019.
Expenses excluding interest increased by 3% in 2019 compared to 2018, primarily as a result of higher compensation and benefits due to increased headcount in 2019 and severance charges in the third quarter of 2019, higher occupancy and equipment expenses due to an increase in software maintenance expenses and additional licenses to support growth in the business, and higher amortization of internally developed software associated with continued investments in software and technology enhancements. These increases were partially offset by a decrease in FDIC insurance assessments due to the elimination of the FDIC surcharge in the fourth quarter of 2018 and lower travel and entertainment expenses.
Total net revenues increased by $1.1 billion, or 18%, in 2018 from 2017 primarily due to an increase in net interest revenue, partially offset by lower asset management and administration fees. Net interest revenue increased primarily due to higher net interest margins and higher balances of interest-earning assets. Asset management and administration fees decreased primarily due to lower money market fund revenue as a result of transfers to bank sweep, client asset allocation choices, and our 2017 fee reductions. Expenses excluding interest increased by $420 million, or 11%, in 2018 from 2017 primarily due to higher compensation and benefits, technology project spend, and asset management and administration related expenses to support the Company’s expanding client base.
Advisor Services
Total net revenues increased by 10%, in 2019 from 2018 primarily due to an increase in net interest revenue and other revenue, partially offset by lower asset management and administration fees and lower trading revenue. Net interest revenue increased primarily due to higher average investment yields and higher interest-earning assets. Other revenue increased primarily due to a gain from the sale of a portfolio management and reporting software solution for advisors to Tamarac Inc. in the second quarter of 2019. Asset management and administration fees decreased primarily due to lower sweep money market fund revenue as a result of transfers to bank and broker-dealer sweep, as well as client asset allocation choices, including reduced usage of Mutual Fund OneSource®, partially offset by increased revenue from growing asset balances in purchased money market funds and in other third-party mutual funds and ETFs. Trading revenue decreased as a result of the
- 40 -
THE CHARLES SCHWAB CORPORATION
Management’s Discussion and Analysis of Financial Condition and Results of Operations
(Tabular Amounts in Millions, Except Ratios, or as Noted)
elimination of online trading commissions for U.S. and Canadian-listed stocks and ETFs, as well as the base charge on options in the fourth quarter of 2019.
Expenses excluding interest increased by 12% of 2019 compared to 2018, primarily due to higher compensation and benefits due to increased headcount in 2019 and severance charges in the third quarter of 2019, higher professional services expense due to overall growth in the business and investments in projects to further drive efficiency and scale, and higher occupancy and equipment expense due to an increase in software maintenance expenses and additional licenses to support growth in the business. These increases were partially offset by a decrease in FDIC insurance assessments due to the elimination of the FDIC surcharge in the fourth quarter of 2018, lower bad debt expenses, and lower travel and entertainment expenses.
Total net revenues increased by $393 million or 16%, in 2018 from 2017 primarily due to an increase in net interest revenue, partially offset by lower asset management and administration fees. Net interest revenue increased primarily due to higher net interest margins and higher balances of interest-earning assets. Asset management and administration fees decreased primarily due to lower money market fund revenue as a result of transfers to bank sweep, client asset allocation choices, and our 2017 fee reductions. Expenses excluding interest increased by $182 million, or 15%, in 2018 from 2017 primarily due to higher compensation and benefits, technology project spend, and asset management and administration related expenses to support the Company’s expanding client base.
RISK MANAGEMENT
Schwab’s business activities expose it to a variety of risks, including operational, credit, market, liquidity, and compliance risks. The Company has a comprehensive risk management program to identify and manage these risks and their associated potential for financial and reputational impact. Despite our efforts to identify areas of risk and implement risk management policies and procedures, there can be no assurance that Schwab will not suffer unexpected losses due to these risks.
Our risk management process is comprised of risk identification and assessment, risk measurement, risk monitoring and reporting, and risk mitigation controls; we use periodic risk and control self-assessments, control testing programs, and internal audit reviews to evaluate the effectiveness of these internal controls. The activities and governance that comprise the risk management process are described below.
Culture
The Board of Directors has approved an Enterprise Risk Management (ERM) framework that incorporates our purpose, vision, and values, which form the bedrock of our corporate culture and set the tone for the organization.
We designed the ERM Framework to enable a comprehensive approach to managing risks encountered by Schwab in its business activities. The framework incorporates key concepts commensurate with the size, risk profile, complexity, and continuing growth of the Company. Risk appetite, which is defined as the amount of risk the Company is willing to accept in pursuit of its corporate strategy, is developed by executive management and approved by the Board of Directors.
Risk Governance
Senior management takes an active role in the risk management process and has developed policies and procedures under which specific business and control units are responsible for identifying, measuring, and controlling risks.
The Global Risk Committee, which is comprised of senior executives from each major business and control function, is responsible for the oversight of risk management. This includes identifying emerging risks, assessing risk management practices and the control environment, reinforcing business accountability for risk management, supervisory controls and regulatory compliance, supporting resource prioritization across the organization, and escalating significant issues to the Board of Directors.
We have established risk metrics and reporting that enable measurement of the impact of strategy execution against risk appetite. The risk metrics, with risk limits and tolerance levels, are established for key risk categories by the Global Risk Committee and its functional risk sub-committees.
- 41 -
THE CHARLES SCHWAB CORPORATION
Management’s Discussion and Analysis of Financial Condition and Results of Operations
(Tabular Amounts in Millions, Except Ratios, or as Noted)
The Chief Risk Officer regularly reports activities of the Global Risk Committee to the Risk Committee of the Board of Directors. The Board Risk Committee in turn assists the Board of Directors in fulfilling its oversight responsibilities with respect to our risk management program, including approving risk appetite statements and related key risk appetite metrics and reviewing reports relating to risk issues from functional areas of corporate risk management, legal, compliance, and internal audit.
Functional risk sub-committees focusing on specific areas of risk report to the Global Risk Committee. These sub-committees include the:
• | Operational Risk Oversight Committee – provides oversight of and approves operational risk management policies, risk tolerance levels, and operational risk governance processes, and includes sub-committees covering Information Security, Fraud, Third-Party Risk, Data, and Model Governance; |
• | Compliance Risk Committee – provides oversight of compliance risk management programs and policies providing an aggregate view of compliance risk exposure and employee conduct, including subcommittees covering Fiduciary and Conflicts of Interest Risk and International Compliance Risk; |
• | Financial Risk Oversight Committee – provides oversight of and approves credit, market, liquidity, and capital risk policies, limits, and exposures; and |
• | New Products and Services Risk Oversight Committee – provides oversight of, and approves corporate policy and procedures relating to, the risk governance of new products and services. |
Senior management has also created an Incentive Compensation Risk Oversight Committee, which establishes policy and reviews and approves the Annual Risk Assessment of incentive compensation plans, and reports directly to the Compensation Committee of the Board of Directors.
The Company’s compliance, finance, internal audit, legal, and corporate risk management departments assist management and the various risk committees in evaluating, testing, and monitoring risk management.
In addition, the Disclosure Committee is responsible for monitoring and evaluating the effectiveness of our disclosure controls and procedures and internal control over financial reporting as of the end of each fiscal quarter. The Disclosure Committee reports on this evaluation to the CEO and CFO prior to their certification required by Sections 302 and 906 of the Sarbanes Oxley Act of 2002.
Operational Risk
Operational risk arises due to potential inadequacies or failures related to people, internal processes, and systems, or from external events or relationships impacting the Company and/or any of its key business partners and third parties. While operational risk is inherent in all business activities, we rely on a system of internal controls and risk management practices designed to keep operational risk and operational losses within the Company’s risk appetite. We have specific policies and procedures to identify and manage operational risk, and use control testing programs, and internal audit reviews to evaluate the effectiveness of these internal controls. Where appropriate, we manage the impact of operational loss and litigation expense through the purchase of insurance. The insurance program is specifically designed to address our key operational risks and to maintain compliance with local laws and regulation.
Schwab’s operations are highly dependent on the integrity and resilience of our critical business functions and technology systems. To the extent Schwab experiences business or system interruptions, errors or downtime (which could result from a variety of causes, including natural disasters, terrorist attacks, technological failure, cyber attacks, changes to systems, linkages with third-party systems, and power failures), our business and operations could be negatively impacted. To minimize business interruptions and ensure the capacity to continue operations during an incident regardless of duration, Schwab maintains a backup and recovery infrastructure which includes facilities for backup and communications, a geographically dispersed workforce, and routine testing of business continuity and disaster recovery plans and a well-established incident management program.
Information Security risk is the risk of unauthorized access, use, disclosure, disruption, modification, recording or destruction of the firm’s information or systems. We have designed and implemented an information security program that knits together complementary tools, controls and technologies to protect systems, client accounts and data. We continuously
- 42 -
THE CHARLES SCHWAB CORPORATION
Management’s Discussion and Analysis of Financial Condition and Results of Operations
(Tabular Amounts in Millions, Except Ratios, or as Noted)
monitor the systems and work collaboratively with government agencies, law enforcement and other financial institutions to address potential threats. We use advanced monitoring systems to identify suspicious activity and deter unauthorized access by internal or external actors. We limit the number of employees who have access to clients’ personal information and internal authentication measures are enforced to protect against the potential for social engineering. All employees who handle sensitive information are trained in privacy and security. Schwab’s conduct and cybersecurity teams monitor activity looking for suspicious behavior. These capabilities allow us to identify and quickly act on any attempted intrusions.
Fraud risk arises from attempted or actual theft of financial assets or other property of any client or the Company. Schwab is committed to protecting the Company’s and its clients’ assets from fraud, and complying with all applicable laws and regulations to prevent, detect and report fraudulent activity. Schwab manages fraud risk through policies, procedures and controls. We also take affirmative steps to prevent and detect fraud and report, to appropriate authorities, any known or suspected acts of fraud in accordance with existing laws and requirements.
Schwab also faces operational risk when we employ the services of various third parties, including domestic and international outsourcing of certain technology, processing, servicing, and support functions. We manage the exposure to third party risk and promote a culture of resiliency through contractual provisions, control standards, ongoing monitoring of third party performance, and appropriate testing. We also maintain policies and procedures regarding the standard of care expected with all data, whether the data is internal company information, employee information, or non-public client information. We clearly define for employees, contractors, and third parties the expected standards of care for critical and confidential data. We also provide regular training on data security.
Model risk is the potential for adverse consequences from decisions based on incorrect or misused model outputs and reports. Models are owned by several business units throughout the organization, and are used for a variety of purposes. Model use includes, but is not limited to, calculating capital requirements for hypothetical stressful environments, estimating interest and credit risk for loans and other balance sheet assets, and providing guidance in the management of client portfolios. We have established a policy to describe the roles and responsibilities of all key stakeholders in model development, management, and use. All models are registered in a centralized database and classified into different risk ratings depending on their potential financial, reputational, or regulatory impact to the Company. The model risk rating determines the scope of model governance activities.
Incentive Compensation risk is the potential for adverse consequences resulting from compensation plans that do not balance the execution of our strategy with risk and financial rewards, potentially encouraging imprudent risk-taking by employees. We have implemented risk management processes, including a policy, to identify, evaluate, assess, and manage risks associated with incentive compensation plans and the activities of certain employees, defined as Covered Employees, who have the authority to expose the Company to material amounts of risk.
Compliance Risk
Schwab faces compliance risk which is the potential exposure to legal or regulatory sanctions, fines or penalties, financial loss, or damage to reputation resulting from the failure to comply with laws, regulations, rules, or other regulatory requirements. Among other things, compliance risks relate to the suitability of client investments, conflicts of interest, disclosure obligations and performance expectations for products and services, supervision of employees, and the adequacy of our controls. The Company and its affiliates are subject to extensive regulation by federal, state and foreign regulatory authorities, including SROs.
We manage compliance risk through policies, procedures and controls reasonably designed to achieve and/or monitor compliance with applicable legal and regulatory requirements. These procedures address issues such as conduct and ethics, sales and trading practices, marketing and communications, extension of credit, client funds and securities, books and records, anti-money laundering, client privacy, and employment policies.
Conduct risk arises from inappropriate, unethical, or unlawful behavior of the Company, its employees or third parties acting on the Company’s behalf that may result in detriment to the Company’s clients, financial markets, the Company, and/or the Company’s employees. We manage this risk through a policy, procedures, a system of internal controls, including personnel monitoring and surveillance. Conduct-related matters are escalated through appropriate channels by the Corporate Responsibility Officer.
- 43 -
THE CHARLES SCHWAB CORPORATION
Management’s Discussion and Analysis of Financial Condition and Results of Operations
(Tabular Amounts in Millions, Except Ratios, or as Noted)
Fiduciary risk is the potential for financial or reputational loss through breach of fiduciary duties to a client. Fiduciary activities include, but are not limited to, individual and institutional trust, investment management, custody, and cash and securities processing. We manage this risk by establishing policy and procedures to ensure that obligations to clients are discharged faithfully and in compliance with applicable legal and regulatory requirements. Business units have the primary responsibility for adherence to the policy and procedures applicable to their business. Guidance and control are provided through the creation, approval, and ongoing review of applicable policies by business units and various risk committees.
Credit Risk
Credit risk is the potential for loss due to a borrower, counterparty, or issuer failing to perform its contractual obligations. Our exposure to credit risk mainly results from investing activities in our liquidity and investment portfolios, mortgage lending, margin lending and client option and futures activities, pledged asset lending, securities lending activities, and our role as a counterparty in other financial contracts. To manage the risks of such losses, we have established policies and procedures, which include setting and reviewing credit limits, monitoring of credit limits and quality of counterparties, and adjusting margin, PAL, option, and futures requirements for certain securities and instruments.
Liquidity and Investment Portfolios
Schwab has exposure to credit risk associated with its investment portfolios, which include U.S. agency and non-agency mortgage-backed securities, asset-backed securities, corporate debt securities, U.S. agency notes, U.S. Treasury securities, certificates of deposit, U.S. state and municipal securities, commercial paper, and foreign government agency securities.
At December 31, 2019, substantially all securities in the investment portfolios were rated investment grade. U.S. agency mortgage-backed securities do not have explicit credit ratings; however, management considers these to be of the highest credit quality and rating given the guarantee of principal and interest by the U.S. government or U.S. government-sponsored enterprises.
Mortgage Lending Portfolio
The bank loan portfolio includes First Mortgages, HELOCs, and other loans. The credit risk exposure related to loans is actively managed through individual loan and portfolio reviews. Management regularly reviews asset quality, including concentrations, delinquencies, nonaccrual loans, charge-offs, and recoveries. All are factors in the determination of an appropriate allowance for loan losses.
Our residential loan underwriting guidelines include maximum LTV ratios, cash out limits, and minimum Fair Isaac Corporation (FICO) credit scores. The specific guidelines are dependent on the individual characteristics of a loan (for example, whether the property is a primary or secondary residence, whether the loan is for investment property, whether the loan is for an initial purchase of a home or refinance of an existing home, and whether the loan size is conforming or jumbo).
Schwab does not originate or purchase residential loans that allow for negative amortization and does not originate or purchase subprime loans (generally defined as extensions of credit to borrowers with a FICO score of less than 620 at origination), unless the borrower has compensating credit factors. For more information on credit quality indicators relating to Schwab’s bank loans, see Item 8 – Note 6.
Securities and Instrument-Based Lending Portfolios
Collateral arrangements relating to margin loans, PALs, option and futures positions, securities lending agreements, and securities purchased under agreements to resell (resale agreements) include provisions that require additional collateral in the event of market fluctuations. Additionally, for margin loans, PALs, options and futures positions, and securities lending agreements, collateral arrangements require that the fair value of such collateral sufficiently exceeds the credit exposure in order to maintain a fully secured position.
- 44 -
THE CHARLES SCHWAB CORPORATION
Management’s Discussion and Analysis of Financial Condition and Results of Operations
(Tabular Amounts in Millions, Except Ratios, or as Noted)
Other Counterparty Exposures
Schwab performs clearing services for all securities transactions in its client accounts. Schwab has exposure to credit risk due to its obligation to settle transactions with clearing corporations, mutual funds, and other financial institutions even if Schwab’s clients or a counterparty fail to meet their obligations to Schwab.
Market Risk
Market risk is the potential for changes in earnings or the value of financial instruments held by Schwab as a result of fluctuations in interest rates, equity prices, or market conditions. Schwab is exposed to interest rate risk primarily from changes in market interest rates on our interest-earning assets relative to changes in the costs of funding sources that finance these assets.
To manage interest rate risk, we have established policies and procedures, which include setting limits on net interest revenue risk and economic value of equity risk. To remain within these limits, we manage the maturity, repricing, and cash flow characteristics of the investment portfolios. Management monitors established guidelines to stay within the Company’s risk appetite.
Our measurement of interest rate risk involves assumptions that are inherently uncertain and, as a result, cannot precisely estimate the impact of changes in interest rates on net interest revenue or economic value of equity. Actual results may differ from simulated results due to balance growth or decline and the timing, magnitude, and frequency of interest rate changes, as well as changes in market conditions and management strategies, including changes in asset and liability mix. Financial instruments are also subject to the risk that valuations will be negatively affected by changes in demand and the underlying market for a financial instrument.
We are indirectly exposed to option, futures, and equity market fluctuations in connection with client option and futures accounts, securities collateralizing margin loans to brokerage customers, and client securities loaned out as part of the brokerage securities lending activities. Equity market valuations may also affect the level of brokerage client trading activity, margin borrowing, and overall client engagement with Schwab. Additionally, we earn mutual fund and ETF service fees and asset management fees based upon daily balances of certain client assets. Fluctuations in these client asset balances caused by changes in equity valuations directly impact the amount of fee revenue we earn.
Our market risk related to financial instruments held for trading is not material.
Net Interest Revenue Simulation
For our net interest revenue sensitivity analysis, we use net interest revenue simulation modeling techniques to evaluate and manage the effect of changing interest rates. The simulations include all interest rate-sensitive assets and liabilities. Key assumptions include the projection of interest rate scenarios with rate floors, prepayment speeds of mortgage-related investments, repricing of financial instruments, and reinvestment of matured or paid-down securities and loans.
Net interest revenue is affected by various factors, such as the distribution and composition of interest-earning assets and interest-bearing liabilities, the spread between yields earned on interest-earning assets and rates paid on interest-bearing liabilities, which may reprice at different times or by different amounts, and the spread between short and long-term interest rates. Interest-earning assets primarily include investment securities, margin loans and bank loans. These assets are sensitive to changes in interest rates and changes in prepayment levels that tend to increase in a declining rate environment and decrease in a rising rate environment. Because we establish the rates paid on certain brokerage client cash balances and bank deposits and the rates charged on certain margin and bank loans, and control the composition of our investment securities, we have some ability to manage our net interest spread, depending on competitive factors and market conditions.
- 45 -
THE CHARLES SCHWAB CORPORATION
Management’s Discussion and Analysis of Financial Condition and Results of Operations
(Tabular Amounts in Millions, Except Ratios, or as Noted)
Net interest revenue sensitivity analysis assumes the asset and liability structure of the consolidated balance sheet would not be changed as a result of the simulated changes in interest rates. As we actively manage the consolidated balance sheet and interest rate exposure, in all likelihood we would take steps to manage additional interest rate exposure that could result from changes in the interest rate environment. The following table shows the simulated net interest revenue change over the next 12 months beginning December 31, 2019 and 2018 of a gradual 100 basis point increase or decrease in market interest rates relative to prevailing market rates at the end of each reporting period:
December 31, | 2019 | 2018 | ||
Increase of 100 basis points | 4.8 | % | 4.4 | % |
Decrease of 100 basis points | (7.4 | )% | (4.9 | )% |
The year-over-year change in net interest revenue sensitivities reflects lower interest rates across the yield curve, producing higher adverse sensitivity to lower rates as funding costs more rapidly reach rate floor assumptions.
In addition to measuring the effect of a gradual 100 basis point parallel increase or decrease in current interest rates, we regularly simulate the effects of larger parallel- and non-parallel shifts in interest rates on net interest revenue.
Economic Value of Equity Simulation
Management also uses economic value of equity (EVE) simulations to measure interest rate risk. EVE sensitivity measures the long-term impact of interest rate changes on the net present value of assets and liabilities. EVE is calculated by subjecting the balance sheet to hypothetical instantaneous shifts in the level of interest rates. This analysis is highly dependent upon asset and liability assumptions based on historical behaviors as well as our expectations of the economic environment. Key assumptions in our EVE calculation include projection of interest rate scenarios with rate floors, prepayment speeds of mortgage-related investments, term structure models of interest rates, non-maturity deposit behavior, and pricing assumptions.
Expected Phase-out of LIBOR
The Company has established a firm-wide team to address the likely discontinuation of LIBOR. As part of our efforts, we have inventoried our LIBOR exposures, the largest of which are certain investment securities and loans. In purchasing new investment securities, we ensure that appropriate fall-back language is in the security’s prospectus in the event that LIBOR is unavailable or deemed unreliable. We are updating loan agreements to ensure new LIBOR-based loans adequately provide for an alternative to LIBOR. Furthermore, we plan to phase-out the use of LIBOR as a reference rate in our new lending products before December 2021. Consistent with our “Through Clients’ Eyes” strategy, our focus throughout the LIBOR transition process is to ensure clients are treated fairly and consistently as this major change is occurring in the financial markets. The market transition process has not yet progressed to a point at which the impact to the Company’s consolidated financial statements of LIBOR’s discontinuation can be estimated.
Liquidity Risk
Liquidity risk is the potential that Schwab will be unable to sell assets or meet cash flow obligations when they come due without incurring unacceptable losses.
Due to its role as a source of financial strength, CSC’s liquidity needs are primarily driven by the liquidity and capital needs of CS&Co, the capital needs of the banking subsidiaries, principal and interest due on corporate debt, dividend payments on CSC’s preferred stock, and returns of capital to common stockholders. The liquidity needs of CS&Co are primarily driven by client activity including trading and margin borrowing activities and capital expenditures. The capital needs of the banking subsidiaries are primarily driven by client deposits. We have established liquidity policies to support the successful execution of business strategies, while ensuring ongoing and sufficient liquidity to meet operational needs and satisfy applicable regulatory requirements under both normal and stressed conditions. We seek to maintain client confidence in the balance sheet and the safety of client assets by maintaining liquidity and diversity of funding sources to allow the Company to meet its obligations. To this end, we have established limits and contingency funding scenarios to support liquidity levels during both business as usual and stressed conditions.
- 46 -
THE CHARLES SCHWAB CORPORATION
Management’s Discussion and Analysis of Financial Condition and Results of Operations
(Tabular Amounts in Millions, Except Ratios, or as Noted)
We employ a variety of methodologies to monitor and manage liquidity. We conduct regular liquidity stress testing to develop a consolidated view of liquidity risk exposures and to ensure our ability to maintain sufficient liquidity during market-related or company-specific liquidity stress events. Liquidity is also tested at key subsidiaries and results are reported to the Financial Risk Oversight Committee. A number of early warning indicators are monitored to help identify emerging liquidity stresses in the market or within the organization and are reviewed with management as appropriate.
Primary Funding Sources
Schwab’s primary source of funds is cash generated by client activity which includes bank deposits and cash balances in client brokerage accounts. These funds are used to purchase investment securities and extend loans to clients.
Other sources of funds may include cash flows from operations, maturities and sales of investment securities, repayments on loans, securities lending of assets held in client brokerage accounts, repurchase agreements, and cash provided by external financing.
To meet daily funding needs, we maintain liquidity in the form of overnight cash deposits and short-term investments. For unanticipated liquidity needs, we also maintain a buffer of highly liquid investments, including U.S. Treasury securities.
Additional Funding Sources
In addition to internal sources of liquidity, Schwab has access to external funding. The need for short-term borrowings from external debt facilities arises primarily from timing differences between cash flow requirements, scheduled liquidation of interest-earning investments, movements of cash to meet regulatory brokerage client cash segregation requirements and general corporate purposes. We maintain policies and procedures necessary to access funding and test discount window borrowing procedures on a periodic basis.
The following table describes external debt facilities available at December 31, 2019:
Description | Borrower | Outstanding | Available | ||||
Federal Home Loan Bank secured credit facility (1) | Banking subsidiaries | $ | — | $ | 34,207 | ||
Federal Reserve discount window (2) | Banking subsidiaries | — | 8,536 | ||||
Uncommitted, unsecured lines of credit with various external banks | CSC, CS&Co | — | 1,642 | ||||
Unsecured commercial paper (3) | CSC | — | 750 | ||||
Committed, unsecured credit facility with various external banks (4) | CSC | — | 750 | ||||
(1) Amounts available are dependent on the amount of First Mortgages, HELOCs, and the fair value of certain investment securities that are pledged as collateral.
(2) Amounts available are dependent on the fair value of certain investment securities that are pledged as collateral.
(3) CSC has authorization from its Board of Directors to issue Commercial Paper Notes not to exceed $1.5 billion. Management has set a current limit not to exceed the amount of the committed, unsecured credit facility.
(4) Other than an overnight borrowing to test availability, this facility was unused during 2019.
Our banking subsidiaries maintain secured credit facilities with the FHLB. Amounts available under these facilities are dependent on the value of our First Mortgages, HELOCs, and the fair value of certain of our investment securities that are pledged as collateral. These credit facilities are also available as backup financing in the event the outflow of client cash from the banking subsidiaries’ respective balance sheets is greater than maturities and paydowns on investment securities and bank loans.
Our banking subsidiaries also have access to short-term secured funding through the Federal Reserve discount window. Amounts available under the Federal Reserve discount window are dependent on the fair value of certain investment securities that are pledged as collateral.
CSC has a commercial paper program of which proceeds are used for general corporate purposes. The maturities of the Commercial Paper Notes may vary, but are not to exceed 270 days from the date of issue. CSC’s ratings for these short-term borrowings were P1 by Moody’s, A1 by Standard & Poor’s, and F1 by Fitch at December 31, 2019 and 2018, and CSC had no Commercial Paper Notes outstanding at December 31, 2019 or 2018.
- 47 -
THE CHARLES SCHWAB CORPORATION
Management’s Discussion and Analysis of Financial Condition and Results of Operations
(Tabular Amounts in Millions, Except Ratios, or as Noted)
The financial covenants for the $750 million committed credit facility require CS&Co to maintain a minimum net capital ratio, all bank subsidiaries to be well capitalized, and CSC to maintain a minimum level of stockholders’ equity, adjusted to exclude AOCI. At December 31, 2019, the minimum level of stockholders’ equity required under this facility was $16.0 billion (CSC’s stockholders’ equity, excluding AOCI, at December 31, 2019 was $21.7 billion). Management believes these restrictions will not have a material effect on CSC’s ability to meet foreseeable dividend or funding requirements.
To partially satisfy the margin requirement of client option transactions with the Options Clearing Corporation, CS&Co has unsecured standby letter of credit agreements (LOCs) with several banks in favor of the Options Clearing Corporation aggregating $20 million at December 31, 2019. There were no funds drawn under any of these LOCs during 2019 or 2018. In connection with its securities lending activities, the Company is required to provide collateral to certain brokerage clients. The collateral requirements were satisfied by providing cash as collateral.
CSC has a universal automatic shelf registration statement on file with the SEC, which enables it to issue debt, equity, and other securities.
Liquidity Coverage Ratio
As Schwab’s consolidated balance sheet assets were above $250 billion at December 31, 2018, Schwab became subject to the non-modified LCR rule on April 1, 2019. The Company was in compliance with the LCR rule at December 31, 2019. See Business – Regulation in Part I, Item 1 for information on recently issued rules that impact Schwab’s LCR requirements.
The table below presents information about our average LCR:
Average for the | |||
Three Months Ended December 31, 2019 | |||
Total eligible HQLA | $ | 54,494 | |
Net cash outflows | $ | 48,135 | |
LCR | 113 | % | |
Borrowings
The Company had no short-term borrowings outstanding as of December 31, 2019 or 2018. Long-term debt outstanding was $7.4 billion and $6.9 billion at December 31, 2019 and 2018, respectively.
The following are details of the Senior Notes:
December 31, 2019 | Par Outstanding | Maturity | Weighted-Average Interest Rate | Moody’s | Standard & Poor’s | Fitch | ||||
Senior Notes | $ | 7,481 | 2020 - 2029 | 3.34% | A2 | A | A | |||
- 48 -
THE CHARLES SCHWAB CORPORATION
Management’s Discussion and Analysis of Financial Condition and Results of Operations
(Tabular Amounts in Millions, Except Ratios, or as Noted)
New Debt Issuances
All debt issuances in 2019, 2018, and 2017 were senior unsecured obligations. Additional details are as follows:
Issuance Date | Issuance Amount | Maturity Date | Interest Rate | Interest Payable | ||
March 2, 2017 | $ | 650 | 3/2/2027 | 3.200% | Semi-annually | |
December 7, 2017 | $ | 700 | 1/25/2028 | 3.200% | Semi-annually | |
December 7, 2017 | $ | 800 | 1/25/2023 | 2.650% | Semi-annually | |
May 22, 2018 | $ | 600 | 5/21/2021 | Three-month LIBOR + 0.32% | Quarterly | |
May 22, 2018 | $ | 600 | 5/21/2021 | 3.250% | Semi-annually | |
May 22, 2018 | $ | 750 | 5/21/2025 | 3.850% | Semi-annually | |
October 31, 2018 | $ | 500 | 2/1/2024 | 3.550% | Semi-annually | |
October 31, 2018 | $ | 600 | 2/1/2029 | 4.000% | Semi-annually | |
May 22, 2019 | $ | 600 | 5/22/2029 | 3.250% | Semi-annually | |
Equity Issuances and Redemptions
CSC did not issue any equity through external offerings during 2019 or 2018. CSC’s preferred stock issued and net proceeds for 2017 are as follows:
Date Issued and Sold | Net Proceeds | |||
Series F | October 31, 2017 | $ | 492 | |
On December 1, 2017, CSC redeemed all of the 485,000 outstanding shares of its 6.00% Non-Cumulative Perpetual Preferred Stock, Series B (Series B Preferred Stock), and the corresponding 19,400,000 depositary shares, each representing a 1/40th interest in a share of the Series B Preferred Stock.
For further discussion of CSC’s long-term debt and information on the equity offerings, see Item 8 – Note 12 and Note 17.
Acquisition of USAA-IMCO
We expect to utilize cash generated from operations to fund the $1.8 billion purchase of assets from USAA-IMCO. The transaction is expected to close in mid-2020, subject to satisfaction of closing conditions, including regulatory approvals and the implementation of conversion plans.
Off-Balance Sheet Arrangements
Schwab enters into various off-balance sheet arrangements in the ordinary course of business, primarily to meet the needs of our clients. These arrangements include firm commitments to extend credit. Additionally, Schwab enters into guarantees and other similar arrangements in the ordinary course of business. For information on each of these arrangements, see Item 8 – Note 6, Note 10, Note 12, Note 14, and Note 15.
- 49 -
THE CHARLES SCHWAB CORPORATION
Management’s Discussion and Analysis of Financial Condition and Results of Operations
(Tabular Amounts in Millions, Except Ratios, or as Noted)
Contractual Obligations
Schwab’s principal contractual obligations as of December 31, 2019 are shown in the following table. Excluded from this table are liabilities recorded on the consolidated balance sheets that are generally short-term in nature or without contractual payment terms (e.g., bank deposits, payables to brokerage clients, and deferred compensation). The below table also excludes the planned all-stock acquisition of TD Ameritrade and any expenses related to the acquisition.
Less than 1 Year | 1-3 Years | 3-5 Years | More than 5 Years | Total | |||||||||||||||
Credit-related financial instruments (1) | $ | 3,033 | $ | 3,495 | $ | 4,549 | $ | 1,501 | $ | 12,578 | |||||||||
Long-term debt (2) | 947 | 1,842 | 1,615 | 4,389 | 8,793 | ||||||||||||||
Purchase obligations (3) | 2,061 | 225 | 46 | 44 | 2,376 | ||||||||||||||
Leases (4) | 141 | 236 | 173 | 268 | 818 | ||||||||||||||
Total | $ | 6,182 | $ | 5,798 | $ | 6,383 | $ | 6,202 | $ | 24,565 | |||||||||
(1) Represents CSB’s commitments to extend credit to banking clients, purchase mortgage loans, and commitments to fund CRA investments.
(2) Includes estimated future interest payments through 2029 for Senior Notes. Amounts exclude unamortized discounts and premiums.
(3) Consists of purchase obligations for services such as advertising and marketing, telecommunications, professional services, and hardware- and software-related agreements. Also includes $1.8 billion for the planned acquisition of USAA-IMCO assets; other costs related to the USAA-IMCO acquisition are excluded. (See Item 8 – Note 14).
(4) Represents operating lease payments including legally-binding minimum lease payments for leases signed but not yet commenced.
CAPITAL MANAGEMENT
Schwab seeks to manage capital to a level and composition sufficient to support execution of our business strategy, including anticipated balance sheet growth, providing financial support to our subsidiaries, and sustained access to the capital markets, while at the same time meeting our regulatory capital requirements and serving as a source of financial strength to our banking subsidiaries. Schwab’s primary sources of capital are funds generated by the operations of subsidiaries and securities issuances by CSC in the capital markets. To ensure that Schwab has sufficient capital to absorb unanticipated losses or declines in asset values, we have adopted a policy to remain well capitalized even in stressed scenarios. Our capital management in coming quarters will incorporate preparations for closing the USAA-IMCO transaction, including the allocation of capital to support client cash that will be added to our balance sheet.
Internal guidelines are set, for both CSC and its regulated subsidiaries, to ensure capital levels are in line with our strategy and regulatory requirements. Capital forecasts are reviewed monthly at Asset-Liability Management and Pricing Committee and Financial Risk Oversight Committee meetings. A number of early warning indicators are monitored to help identify potential problems that could impact capital. In addition, we monitor the subsidiaries’ capital levels and requirements. Subject to regulatory capital requirements and any required approvals, any excess capital held by subsidiaries is transferred to CSC in the form of dividends and returns of capital. When subsidiaries have need of additional capital, funds are provided by CSC as equity investments and also as subordinated loans (in a form approved as regulatory capital by regulators) for CS&Co. The details and method used for each cash infusion are based on an analysis of the particular entity’s needs and financing alternatives. The amounts and structure of infusions must take into consideration maintenance of regulatory capital requirements, debt/equity ratios, and equity double leverage ratios.
Schwab conducts regular capital stress testing to assess the potential financial impacts of various adverse macroeconomic and company-specific events to which the Company could be subjected. The objective of the capital stress testing is (1) to explore various potential outcomes – including rare and extreme events and (2) to assess impacts of potential stressful outcomes on both capital and liquidity. Additionally, we have a comprehensive Capital Contingency Plan to provide action plans for certain low probability/high impact capital events that the Company might face. The Capital Contingency Plan is issued under the authority of the Financial Risk Oversight Committee and provides guidelines for sustained capital events. It does not specifically address every contingency, but is designed to provide a framework for responding to any capital stress. The results of the stress testing indicate there are two scenarios which could stress the Company’s capital: (1) inflows of balance sheet cash during a period of very low interest rates and (2) outflows of balance sheet cash when other sources of financing are not available and the Company is required to sell assets to fund the flows at a loss. The Capital Contingency Plan is reviewed annually and updated as appropriate.
- 50 -
THE CHARLES SCHWAB CORPORATION
Management’s Discussion and Analysis of Financial Condition and Results of Operations
(Tabular Amounts in Millions, Except Ratios, or as Noted)
For additional information, see Business – Regulation in Part I, Item 1.
Regulatory Capital Requirements
CSC is subject to capital requirements set by the Federal Reserve and is required to serve as a source of strength for our banking subsidiaries and to provide financial assistance if our banking subsidiaries experience financial distress. Schwab is required to maintain a Tier 1 Leverage Ratio for CSC of at least 4%; however, management seeks to maintain a ratio of at least 6%. Due to the relatively low risk of our balance sheet assets and risk-based capital ratios at CSC and CSB that are well in excess of regulatory requirements, the Tier 1 Leverage Ratio is the most restrictive capital constraint on CSC’s asset growth.
Our banking subsidiaries are subject to capital requirements set by their regulators that are substantially similar to those imposed on CSC by the Federal Reserve. Our banking subsidiaries’ failure to remain well capitalized could result in certain mandatory and possibly additional discretionary actions by the regulators that could have a direct material effect on the banks. Schwab’s principal banking subsidiary, CSB, is required to maintain a Tier 1 Leverage Ratio of at least 5% to be well capitalized, but seeks to maintain a ratio of at least 6.25%. Based on its regulatory capital ratios at December 31, 2019, CSB is considered well capitalized.
The following table details the capital ratios for CSC consolidated and CSB:
December 31, | 2019 (1) | 2018 | |||||||||||||
CSC | CSB | CSC | CSB | ||||||||||||
Total stockholders’ equity | $ | 21,745 | $ | 14,832 | $ | 20,670 | $ | 15,615 | |||||||
Less: | |||||||||||||||
Preferred Stock | 2,793 | — | 2,793 | — | |||||||||||
Common Equity Tier 1 Capital before regulatory adjustments | $ | 18,952 | $ | 14,832 | $ | 17,877 | $ | 15,615 | |||||||
Less: | |||||||||||||||
Goodwill, net of associated deferred tax liabilities | $ | 1,184 | $ | 13 | $ | 1,188 | $ | 13 | |||||||
Other intangible assets, net of associated deferred tax liabilities | 104 | — | 125 | — | |||||||||||
Deferred tax assets, net of valuation allowances and deferred tax liabilities | 4 | — | 3 | 1 | |||||||||||
AOCI adjustment (1) | — | — | (252 | ) | (231 | ) | |||||||||
Common Equity Tier 1 Capital | $ | 17,660 | $ | 14,819 | $ | 16,813 | $ | 15,832 | |||||||
Tier 1 Capital | $ | 20,453 | $ | 14,819 | $ | 19,606 | $ | 15,832 | |||||||
Total Capital | 20,472 | 14,837 | 19,628 | 15,853 | |||||||||||
Risk-Weighted Assets | 90,512 | 71,521 | 95,441 | 80,513 | |||||||||||
Total Leverage Exposure (1) | 286,813 | 216,582 | N/A | N/A | |||||||||||
Common Equity Tier 1 Capital/Risk-Weighted Assets | 19.5 | % | 20.7 | % | 17.6 | % | 19.7 | % | |||||||
Tier 1 Capital/Risk-Weighted Assets | 22.6 | % | 20.7 | % | 20.5 | % | 19.7 | % | |||||||
Total Capital/Risk-Weighted Assets | 22.6 | % | 20.7 | % | 20.6 | % | 19.7 | % | |||||||
Tier 1 Leverage Ratio | 7.3 | % | 7.1 | % | 7.1 | % | 7.2 | % | |||||||
Supplementary Leverage Ratio (1) | 7.1 | % | 6.8 | % | N/A | N/A | |||||||||
(1) Beginning in 2019, CSC and CSB were required to include all components of AOCI in regulatory capital and report our supplementary leverage ratio, which is calculated as Tier 1 capital divided by total leverage exposure. Total leverage exposure includes all on-balance sheet assets and certain off-balance sheet exposures, including unused commitments. Prior to 2019, CSC and CSB elected to opt-out of the requirement to include most components of AOCI in Common Equity Tier 1 Capital; the amounts and ratios for December 31, 2018 are presented on this basis. In the interagency regulatory capital and liquidity rules adopted in October 2019, Category III banking organizations such as CSC were given the ability to opt-out of the inclusion of AOCI in regulatory capital, and CSC made this opt-out election effective as of January 1, 2020. See Business – Regulation in Part I, Item 1 for additional information on recently issued rules that impact Schwab’s regulatory capital requirements.
N/A Not applicable.
CSB is also subject to regulatory requirements that restrict and govern the terms of affiliate transactions. In addition, CSB is required to provide notice to, and may be required to obtain approval from, the OCC and the Federal Reserve to declare dividends to CSC.
- 51 -
THE CHARLES SCHWAB CORPORATION
Management’s Discussion and Analysis of Financial Condition and Results of Operations
(Tabular Amounts in Millions, Except Ratios, or as Noted)
As a broker-dealer, CS&Co is subject to regulatory requirements of the Uniform Net Capital Rule, which is intended to ensure the general financial soundness and liquidity of broker-dealers. These regulations prohibit CS&Co from paying cash dividends, making unsecured advances and loans to the parent company and employees, and repaying subordinated borrowings from CSC if such payment would result in a net capital amount below prescribed thresholds. At December 31, 2019, CS&Co was in compliance with its net capital requirements.
In addition to the capital requirements above, Schwab’s subsidiaries are subject to other regulatory requirements intended to ensure financial soundness and liquidity. See Item 8 – Note 21 for additional information on the components of stockholders’ equity and information on the capital requirements of significant subsidiaries.
Dividends
Since the initial dividend in 1989, CSC has paid 123 consecutive quarterly dividends and has increased the quarterly dividend rate 24 times, resulting in a 21% compounded annual growth rate, excluding the special cash dividend of $1.00 per common share in 2007. While the payment and amount of dividends are at the discretion of the Board of Directors, subject to certain regulatory and other restrictions, CSC currently targets its common stock cash dividend at approximately 20% to 30% of net income.
The Board of Directors of the Company declared quarterly cash dividend increases per common share during 2018 and 2019 as shown below:
Date of Declaration | Quarterly Cash Increase Per Common Share | % Increase | New Quarterly Dividend Per Common Share | |||||||
January 25, 2018 | $ | 0.02 | 25 | % | $ | 0.10 | ||||
July 25, 2018 | 0.03 | 30 | % | 0.13 | ||||||
January 30, 2019 | 0.04 | 31 | % | 0.17 | ||||||
In addition, on January 30, 2020, the Board of Directors of the Company declared a one cent, or 6%, increase in the quarterly cash dividend to $0.18 per common share.
The following table details the CSC cash dividends paid and per share amounts:
Year Ended December 31, | 2019 | 2018 | |||||||||||
Cash Paid | Per Share Amount | Cash Paid | Per Share Amount | ||||||||||
Common Stock | $ | 898 | $ | 0.68 | $ | 623 | $ | 0.46 | |||||
Series A Preferred Stock (1) | 28 | 70.00 | 28 | 70.00 | |||||||||
Series C Preferred Stock (2) | 36 | 60.00 | 36 | 60.00 | |||||||||
Series D Preferred Stock (2) | 45 | 59.52 | 45 | 59.52 | |||||||||
Series E Preferred Stock (3) | 28 | 4,625.00 | 28 | 4,625.00 | |||||||||
Series F Preferred Stock (4) | 25 | 5,000.00 | 27 | 5,430.56 | |||||||||
(1) Dividends paid semi-annually until February 1, 2022 and quarterly thereafter.
(2) Dividends paid quarterly.
(3) Dividends paid semi-annually until March 1, 2022 and quarterly thereafter.
(4) Dividends paid semi-annually beginning on June 1, 2018 until December 1, 2027, and quarterly thereafter.
Share Repurchases
On January 30, 2019, CSC publicly announced that its Board of Directors authorized the repurchase of up to $4.0 billion of common stock. The authorization does not have an expiration date. During 2019, CSC repurchased 55 million shares of its common stock for $2.2 billion, leaving $1.8 billion remaining on our existing authorization as of December 31, 2019.
- 52 -
THE CHARLES SCHWAB CORPORATION
Management’s Discussion and Analysis of Financial Condition and Results of Operations
(Tabular Amounts in Millions, Except Ratios, or as Noted)
On October 25, 2018, CSC publicly announced that its Board of Directors terminated the existing two share repurchase authorizations and replaced them with a new authorization to repurchase up to $1.0 billion of common stock. CSC repurchased 22 million shares of its common stock for $1.0 billion in 2018, completing all repurchases under this authorization.
FOREIGN EXPOSURE
At December 31, 2019, Schwab had exposure to non-sovereign financial and non-financial institutions in foreign countries, as well as agencies of foreign governments. At December 31, 2019, the fair value of these holdings totaled $6.4 billion, with the top three exposures being to issuers and counterparties domiciled in France at $3.1 billion, the Netherlands at $845 million, and Sweden at $684 million.
In addition to the direct holdings in foreign companies and securities issued by foreign government agencies, Schwab had outstanding margin loans to foreign residents of $437 million at December 31, 2019.
FAIR VALUE OF FINANCIAL INSTRUMENTS
Schwab uses the market approach to determine the fair value of certain financial assets and liabilities recorded at fair value, and to determine fair value disclosures. See Item 8 – Notes 2 and 16 for more information on our assets and liabilities recorded at fair value.
When available, Schwab uses quoted prices in active markets to measure the fair value of assets and liabilities. Quoted prices for investments in exchange-traded securities represent end-of-day close prices published by exchanges. Quoted prices for money market funds and other mutual funds represent reported net asset values. When utilizing market data and bid-ask spread, we use the price within the bid-ask spread that best represents fair value. When quoted prices in active markets do not exist, prices are obtained from independent third-party pricing services to measure the fair value of investment assets. We generally obtain prices from three independent pricing sources for assets recorded at fair value. Our primary third-party pricing service provides prices for our fixed income investments such as commercial paper; certificates of deposits; U.S. government and agency securities; state and municipal securities; corporate debt securities; asset-backed securities; foreign government agency securities; and non-agency commercial mortgage-backed securities. Such prices are based on observable trades, broker/dealer quotes, and discounted cash flows that incorporate observable information such as yields for similar types of securities (a benchmark interest rate plus observable spreads) and weighted-average maturity for the same or similar “to-be-issued” securities. We compare the prices obtained from the primary independent pricing service to the prices obtained from the additional independent pricing services to determine if the price obtained from the primary independent pricing service is reasonable. Schwab does not adjust the prices received from independent third-party pricing services unless such prices are inconsistent with the definition of fair value and result in material differences in the amounts recorded. At December 31, 2019 and 2018, we did not adjust prices received from the primary independent third-party pricing service.
CRITICAL ACCOUNTING ESTIMATES
The consolidated financial statements of Schwab have been prepared in accordance with GAAP. Item 8 – Note 2 contains more information on our significant accounting policies made in connection with its application of these accounting principles.
While the majority of the revenues, expenses, assets and liabilities are not based on estimates, there are certain accounting principles that require management to make estimates regarding matters that are uncertain and susceptible to change where such change may result in a material adverse impact on Schwab’s financial position and reported financial results. These critical accounting estimates are described below. Management regularly reviews the estimates and assumptions used in the preparation of the financial statements for reasonableness and adequacy.
- 53 -
THE CHARLES SCHWAB CORPORATION
Management’s Discussion and Analysis of Financial Condition and Results of Operations
(Tabular Amounts in Millions, Except Ratios, or as Noted)
Management has discussed the development and selection of these critical accounting estimates with the Audit Committee of the Board of Directors. Additionally, management has reviewed with the Audit Committee the Company’s significant estimates discussed in this Management’s Discussion and Analysis of Financial Condition and Results of Operations.
Income Taxes
Schwab estimates income tax expense based on amounts expected to be owed to the various tax jurisdictions in which we operate, including federal, state and local domestic jurisdictions, and immaterial amounts owed to several foreign jurisdictions. The estimated income tax expense is reported in the consolidated statements of income in taxes on income. Accrued taxes are reported in other assets or accrued expenses and other liabilities on the consolidated balance sheets and represent the net estimated amount due to or to be received from taxing jurisdictions either currently or deferred to future periods. Deferred taxes arise from differences between assets and liabilities measured for financial reporting purposes versus income tax reporting purposes. Deferred tax assets are recognized if, in management’s judgment, their realizability is determined to be more likely than not. Uncertain tax positions that meet the more likely than not recognition threshold are measured to determine the amount of benefit to recognize. An uncertain tax position is measured at the largest amount of benefit management believes is more likely than not to be realized upon settlement. In estimating accrued taxes, we assess the relative merits and risks of the appropriate tax treatment considering statutory, judicial and regulatory guidance in the context of the tax position. Because of the complexity of tax laws and regulations, interpretation can be difficult and subject to legal judgment given specific facts and circumstances.
Changes in the estimate of accrued taxes occur periodically due to changes in tax rates, interpretations of tax laws, the status of examinations being conducted by various taxing authorities, and newly enacted statutory, judicial and regulatory guidance that impacts the relative merits and risks of tax positions. These changes, when they occur, affect accrued taxes and can be significant to the operating results of the Company. See Item 8 – Note 20 for more information on the Company’s income taxes.
Legal and Regulatory Reserves
Reserves for legal and regulatory claims and proceedings reflect an estimate of probable losses for each matter, after considering, among other factors, the progress of the case, prior experience and the experience of others in similar cases, available defenses, and the opinions and views of legal counsel. In many cases, including most class action lawsuits, it is not possible to determine whether a loss will be incurred, or to estimate the range of that loss, until the matter is close to resolution, in which case no accrual is made until that time. Reserves are adjusted as more information becomes available. Significant judgment is required in making these estimates, and the actual cost of resolving a matter may ultimately differ materially from the amount reserved. See Item 8 – Note 14 for more information on the Company’s contingencies related to legal and regulatory reserves.
- 54 -
THE CHARLES SCHWAB CORPORATION
Item 7A. Quantitative and Qualitative Disclosures About Market Risk
For a discussion of the quantitative and qualitative disclosures about market risk, see Risk Management in Part II, Item 7.
- 55 -
THE CHARLES SCHWAB CORPORATION
Item 8. | Financial Statements and Supplementary Data |
TABLE OF CONTENTS
Note 1. | ||
Note 2. | ||
Note 3. | ||
Note 4. | ||
Note 5. | ||
Note 6. | ||
Note 7. | ||
Note 8. | ||
Note 9. | ||
Note 10. | ||
Note 11. | ||
Note 12. | ||
Note 13. | ||
Note 14. | ||
Note 15. | ||
Note 16. | ||
Note 17. | ||
Note 18. | ||
Note 19. | ||
Note 20. | ||
Note 21. | ||
Note 22. | ||
Note 23. | ||
Note 24. | ||
Note 25. | ||
- 56 -
THE CHARLES SCHWAB CORPORATION
Consolidated Statements of Income | |||||||||||
(In Millions, Except Per Share Amounts) | |||||||||||
Year Ended December 31, | 2019 | 2018 | 2017 | ||||||||
Net Revenues | |||||||||||
Interest revenue | $ | $ | $ | ||||||||
Interest expense | ( | ) | ( | ) | ( | ) | |||||
Net interest revenue | |||||||||||
Asset management and administration fees | |||||||||||
Trading revenue | |||||||||||
Other | |||||||||||
Total net revenues | |||||||||||
Expenses Excluding Interest | |||||||||||
Compensation and benefits | |||||||||||
Professional services | |||||||||||
Occupancy and equipment | |||||||||||
Advertising and market development | |||||||||||
Communications | |||||||||||
Depreciation and amortization | |||||||||||
Regulatory fees and assessments | |||||||||||
Other | |||||||||||
Total expenses excluding interest | |||||||||||
Income before taxes on income | |||||||||||
Taxes on income | |||||||||||
Net Income | |||||||||||
Preferred stock dividends and other (1) | |||||||||||
Net Income Available to Common Stockholders | $ | $ | $ | ||||||||
Weighted-Average Common Shares Outstanding: | |||||||||||
Basic | |||||||||||
Diluted (2) | |||||||||||
Earnings Per Common Shares Outstanding: | |||||||||||
Basic | $ | $ | $ | ||||||||
Diluted (2) | $ | $ | $ | ||||||||
(1) Includes preferred stock dividends and undistributed earnings and dividends allocated to non-vested restricted stock units.
(2) Antidilutive stock options and restricted stock units excluded from the calculation of diluted EPS totaled 21 million, 18 million, and 15 million shares in 2019, 2018, and 2017, respectively.
See Notes to Consolidated Financial Statements.
- 57 -
THE CHARLES SCHWAB CORPORATION
Consolidated Statements of Comprehensive Income | |||||||||||
(In Millions) | |||||||||||
Year Ended December 31, | 2019 | 2018 | 2017 | ||||||||
Net income | $ | $ | $ | ||||||||
Other comprehensive income (loss), before tax: | |||||||||||
Change in net unrealized gain (loss) on available for sale securities: | |||||||||||
Net unrealized gain (loss) | ( | ) | |||||||||
Reclassification of net unrealized loss transferred to held to maturity | |||||||||||
Other reclassifications included in other revenue | ( | ) | ( | ) | |||||||
Change in net unrealized gain (loss) on held to maturity securities: | |||||||||||
Reclassification of net unrealized loss transferred from available for sale | ( | ) | |||||||||
Amortization of amounts previously recorded upon transfer to held to maturity from available for sale | |||||||||||
Other | ( | ) | ( | ) | ( | ) | |||||
Other comprehensive income (loss), before tax | ( | ) | |||||||||
Income tax effect | ( | ) | ( | ) | |||||||
Other comprehensive income (loss), net of tax | ( | ) | |||||||||
Comprehensive Income | $ | $ | $ | ||||||||
See Notes to Consolidated Financial Statements.
- 58 -
THE CHARLES SCHWAB CORPORATION
Consolidated Balance Sheets | |||||||
(In Millions, Except Per Share and Share Amounts) | |||||||
December 31, | 2019 | 2018 | |||||
Assets | |||||||
Cash and cash equivalents | $ | $ | |||||
Cash and investments segregated and on deposit for regulatory purposes (including resale agreements of $9,028 and $7,195 at December 31, 2019 and 2018, respectively) | |||||||
Receivables from brokerage clients — net | |||||||
Available for sale securities | |||||||
Held to maturity securities | |||||||
Bank loans — net | |||||||
Equipment, office facilities, and property — net | |||||||
Goodwill | |||||||
Other assets | |||||||
Total assets | $ | $ | |||||
Liabilities and Stockholders’ Equity | |||||||
Bank deposits | $ | $ | |||||
Payables to brokerage clients | |||||||
Accrued expenses and other liabilities | |||||||
Long-term debt | |||||||
Total liabilities | |||||||
Stockholders’ equity: | |||||||
Preferred stock — $.01 par value per share; aggregate liquidation preference of $2,850 | |||||||
Common stock — 3 billion shares authorized; $.01 par value per share; 1,487,543,446 shares issued | |||||||
Additional paid-in capital | |||||||
Retained earnings | |||||||
Treasury stock, at cost — 201,818,100 and 155,116,695 shares at December 31, 2019 and 2018, respectively | ( | ) | ( | ) | |||
Accumulated other comprehensive income (loss) | ( | ) | |||||
Total stockholders’ equity | |||||||
Total liabilities and stockholders’ equity | $ | $ | |||||
See Notes to Consolidated Financial Statements.
- 59 -
THE CHARLES SCHWAB CORPORATION
Consolidated Statements of Stockholders’ Equity | ||||||||||||||||||||||||||||||
(In Millions) | ||||||||||||||||||||||||||||||
Additional Paid-In Capital | Accumulated Other Comprehensive Income (Loss) | |||||||||||||||||||||||||||||
Preferred Stock | Common Stock | Retained Earnings | Treasury Stock, at cost | |||||||||||||||||||||||||||
Shares | Amount | Total | ||||||||||||||||||||||||||||
Balance at December 31, 2016 | $ | $ | $ | $ | $ | ( | ) | $ | ( | ) | $ | |||||||||||||||||||
Net income | — | — | — | — | — | — | ||||||||||||||||||||||||
Other comprehensive income (loss), net of tax | — | — | — | — | — | — | ||||||||||||||||||||||||
Issuance of preferred stock, net | — | — | — | — | — | — | ||||||||||||||||||||||||
Redemption of preferred stock | ( | ) | ( | ) | ( | ) | ||||||||||||||||||||||||
Dividends declared on preferred stock | — | — | — | — | ( | ) | — | — | ( | ) | ||||||||||||||||||||
Dividends declared on common stock — $.32 per share | — | — | — | — | ( | ) | — | — | ( | ) | ||||||||||||||||||||
Stock option exercises and other | — | — | — | ( | ) | — | — | |||||||||||||||||||||||
Share-based compensation | — | — | — | — | — | — | ||||||||||||||||||||||||
Other | — | — | — | — | ( | ) | — | |||||||||||||||||||||||
Balance at December 31, 2017 | ( | ) | ( | ) | ||||||||||||||||||||||||||
Adoption of accounting standards | — | — | — | — | — | ( | ) | |||||||||||||||||||||||
Net income | — | — | — | — | — | — | ||||||||||||||||||||||||
Other comprehensive income (loss), net of tax | — | — | — | — | — | — | ( | ) | ( | ) | ||||||||||||||||||||
Dividends declared on preferred stock | — | — | — | — | ( | ) | — | — | ( | ) | ||||||||||||||||||||
Dividends declared on common stock — $.46 per share | — | — | — | — | ( | ) | — | — | ( | ) | ||||||||||||||||||||
Repurchase of common stock | — | — | — | — | — | ( | ) | — | ( | ) | ||||||||||||||||||||
Stock option exercises and other | — | — | — | ( | ) | — | — | |||||||||||||||||||||||
Share-based compensation | — | — | — | — | — | — | ||||||||||||||||||||||||
Other | — | — | — | ( | ) | — | ||||||||||||||||||||||||
Balance at December 31, 2018 | ( | ) | ( | ) | ||||||||||||||||||||||||||
Net income | — | — | — | — | — | — | ||||||||||||||||||||||||
Other comprehensive income (loss), net of tax | — | — | — | — | — | — | ||||||||||||||||||||||||
Dividends declared on preferred stock | — | — | — | — | ( | ) | — | — | ( | ) | ||||||||||||||||||||
Dividends declared on common stock — $.68 per share | — | — | — | — | ( | ) | — | — | ( | ) | ||||||||||||||||||||
Repurchase of common stock | — | — | — | — | — | ( | ) | — | ( | ) | ||||||||||||||||||||
Stock option exercises and other | — | — | — | ( | ) | — | — | |||||||||||||||||||||||
Share-based compensation | — | — | — | — | — | — | ||||||||||||||||||||||||
Other | — | — | — | ( | ) | ( | ) | — | ||||||||||||||||||||||
Balance at December 31, 2019 | $ | $ | $ | $ | $ | ( | ) | $ | $ | |||||||||||||||||||||
See Notes to Consolidated Financial Statements.
- 60 -
THE CHARLES SCHWAB CORPORATION
Consolidated Statements of Cash Flows | |||||||||
(In Millions) | |||||||||
Year Ended December 31, | 2019 | 2018 | 2017 | ||||||
Cash Flows from Operating Activities | |||||||||
Net income | $ | $ | $ | ||||||
Adjustments to reconcile net income to net cash provided by (used for) operating activities: | |||||||||
Share-based compensation | |||||||||
Depreciation and amortization | |||||||||
Provision (benefit) for deferred income taxes | |||||||||
Premium amortization, net, on available for sale and held to maturity securities | |||||||||
Other | |||||||||
Net change in: | |||||||||
Investments segregated and on deposit for regulatory purposes | ( | ) | |||||||
Receivables from brokerage clients | ( | ) | ( | ) | ( | ) | |||
Other assets | ( | ) | ( | ) | ( | ) | |||
Payables to brokerage clients | ( | ) | |||||||
Accrued expenses and other liabilities | ( | ) | ( | ) | |||||
Net cash provided by (used for) operating activities | ( | ) | |||||||
Cash Flows from Investing Activities | |||||||||
Purchases of available for sale securities | ( | ) | ( | ) | ( | ) | |||
Proceeds from sales of available for sale securities | |||||||||
Principal payments on available for sale securities | |||||||||
Purchases of held to maturity securities | ( | ) | ( | ) | ( | ) | |||
Principal payments on held to maturity securities | |||||||||
Net change in bank loans | ( | ) | ( | ) | ( | ) | |||
Purchases of equipment, office facilities, and property | ( | ) | ( | ) | ( | ) | |||
Purchases of Federal Home Loan Bank stock | ( | ) | ( | ) | ( | ) | |||
Proceeds from sales of Federal Home Loan Bank stock | |||||||||
Other investing activities | ( | ) | ( | ) | ( | ) | |||
Net cash provided by (used for) investing activities | ( | ) | ( | ) | |||||
Cash Flows from Financing Activities | |||||||||
Net change in bank deposits (1) | ( | ) | |||||||
Net change in short-term borrowings | ( | ) | |||||||
Issuance of long-term debt | |||||||||
Repayment of long-term debt | ( | ) | ( | ) | |||||
Repurchases of common stock | ( | ) | ( | ) | |||||
Net proceeds from preferred stock offerings | |||||||||
Redemption of preferred stock | ( | ) | |||||||
Dividends paid | ( | ) | ( | ) | ( | ) | |||
Proceeds from stock options exercised | |||||||||
Other financing activities | ( | ) | ( | ) | ( | ) | |||
Net cash provided by (used for) financing activities | ( | ) | |||||||
Increase (Decrease) in Cash and Cash Equivalents, including Amounts Restricted | |||||||||
Cash and Cash Equivalents, including Amounts Restricted at Beginning of Year | |||||||||
Cash and Cash Equivalents, including Amounts Restricted at End of Year | $ | $ | $ | ||||||
Continued on following page.
- 61 -
THE CHARLES SCHWAB CORPORATION
Continued from previous page.
Year Ended December 31, | 2019 | 2018 | 2017 | ||||||
Supplemental Cash Flow Information | |||||||||
Non-cash investing activity: | |||||||||
Securities transferred from held to maturity to available for sale, at fair value | $ | $ | $ | ||||||
Securities transferred from available for sale to held to maturity, at fair value | $ | $ | $ | ||||||
Securities purchased during the period but settled after period end | $ | $ | $ | ||||||
Non-cash financing activity: | |||||||||
Extinguishment of finance lease obligation through an assignment agreement | $ | $ | $ | ||||||
Other Supplemental Cash Flow Information | |||||||||
Cash paid during the period for: | |||||||||
Interest | $ | $ | $ | ||||||
Income taxes | $ | $ | $ | ||||||
Amounts included in the measurement of lease liabilities (2) | $ | N/A | N/A | ||||||
Leased assets obtained in exchange for new operating lease liabilities (2) | $ | N/A | N/A | ||||||
December 31, | 2019 | 2018 | 2017 | ||||||
Reconciliation of cash, cash equivalents and amounts reported within the balance sheet (3) | |||||||||
Cash and cash equivalents | $ | $ | $ | ||||||
Restricted cash and cash equivalents amounts included in cash and investments segregated and on deposit for regulatory purposes | |||||||||
Total cash and cash equivalents, including amounts restricted shown in the statement of cash flows | $ | $ | $ | ||||||
(1) Includes transfers from other sweep features to bank sweep of $10.3 billion, $71.9 billion and $4.9 billion for the years ended December 31, 2019, 2018 and 2017, respectively.
(2) These amounts are presented beginning in 2019 as part of the adoption of ASU 2016-02. See Notes 2 and 13 for additional information related to this adoption.
(3) For more information on the nature of restrictions on restricted cash and cash equivalents, see Note 21.
N/A Not applicable.
See Notes to Consolidated Financial Statements.
- 62 -
THE CHARLES SCHWAB CORPORATION
Notes to Consolidated Financial Statements
(Tabular Amounts in Millions, Except Per Share Data, Option Price Amounts, Ratios, or as Noted)
1. | Introduction and Basis of Presentation |
The Charles Schwab Corporation (CSC) is a savings and loan holding company, headquartered in San Francisco, California. CSC was incorporated in 1986 and engages, through its subsidiaries, in wealth management, securities brokerage, banking, asset management, custody, and financial advisory services.
Principal business subsidiaries of CSC include the following:
• | Charles Schwab & Co., Inc. (CS&Co) is a securities broker-dealer with over |
• | Charles Schwab Bank (CSB), our principal banking entity; and |
• | Charles Schwab Investment Management, Inc. (CSIM), the investment advisor for Schwab’s proprietary mutual funds (Schwab Funds®) and for Schwab’s exchange-traded funds (Schwab ETFs™). |
Unless otherwise indicated, the terms “Schwab,” “the Company,” “we,” “us,” or “our” mean CSC together with its consolidated subsidiaries.
The accompanying consolidated financial statements include CSC and its subsidiaries. Intercompany balances and transactions have been eliminated. These consolidated financial statements have been prepared in conformity with GAAP, which require management to make certain estimates and assumptions that affect the reported amounts in the accompanying financial statements and in the related disclosures. These estimates are based on information available as of the date of the consolidated financial statements. While management makes its best judgment, actual amounts or results could differ from those estimates. Certain estimates relate to taxes on income and legal and regulatory reserves.
Reclassifications: Certain prior year amounts have been reclassified to conform to the current year presentation. Amounts presented in the consolidated balance sheets in prior periods in the line items Receivables from brokers, dealers, and clearing organizations and Other securities owned are now presented as part of Other assets. Amounts presented in prior periods as Payables to brokers, dealers, and clearing organizations are now presented as part of Accrued expenses and other liabilities on the consolidated balance sheets. Corresponding presentation changes have been made to the consolidated statements of cash flows and related notes.
Principles of Consolidation
Schwab evaluates all entities in which it has financial interests for consolidation, except for money market funds, which are specifically excluded from consolidation guidance. When an entity is evaluated for consolidation, Schwab determines whether its interest in the entity constitutes a controlling financial interest under either the variable interest entity (VIE) model or the voting interest entity (VOE) model. In evaluating whether Schwab’s interest in a VIE is a controlling financial interest, we consider whether our involvement in the context of the design, purpose, and risks of the VIE, as well as any involvement of related parties, provides us with (i) the power to direct the most significant activities of the VIE, and (ii) the obligation to absorb losses or receive benefits that are significant to the VIE. If both of these conditions exist, then Schwab would be the primary beneficiary of that VIE, and consolidate it. Based upon the assessments for all of our interests in VIEs, there are no cases where the Company is the primary beneficiary; therefore, we are not required to consolidate any VIEs. See Note 10 for further information about VIEs. Schwab consolidates all VOEs in which it has majority-voting interests.
Investments in entities in which Schwab does not have a controlling financial interest are accounted for under the equity method of accounting when we have the ability to exercise significant influence over operating and financing decisions of the entity. Investments in entities for which Schwab does not have the ability to exercise significant influence are generally carried at cost and adjusted for impairment and observable price changes of the identical or similar investments of the same issuer (adjusted cost method), except for certain investments in qualified affordable housing projects which are accounted for under the proportional amortization method. All equity method, adjusted cost method, and proportional amortization method investments are included in other assets on the consolidated balance sheets.
- 63 -
THE CHARLES SCHWAB CORPORATION
Notes to Consolidated Financial Statements
(Tabular Amounts in Millions, Except Per Share Data, Option Price Amounts, Ratios, or as Noted)
2. | Summary of Significant Accounting Policies |
Revenue recognition
Net interest revenue
Net interest revenue is not within the scope of ASC 606, Revenue From Contracts With Customers (ASC 606), because it is generated from financial instruments covered by various other areas of GAAP. Net interest revenue is the difference between interest generated on interest earning assets and interest paid on funding sources. Our primary interest earning assets include cash and cash equivalents; segregated cash and investments; margin loans; investment securities; and bank loans. Fees earned and incurred on securities borrowing and lending activities, which are conducted by CS&Co on assets held in client brokerage accounts, are also included in interest revenue and expense.
Unsatisfied performance obligations
We do not have any unsatisfied performance obligations other than those that are subject to an elective practical expedient under ASC 606. The practical expedient applies to and is elected for contracts where we recognize revenue at the amount to which we have the right to invoice for services performed.
Asset management and administration fees
The majority of asset management and administration fees are generated through our proprietary and third-party mutual fund and ETF offerings, as well as fee-based advisory solutions. Mutual fund and ETF service fees are charged for investment management, shareholder, and administration services provided to Schwab Funds® and Schwab ETFs™, as well as recordkeeping, shareholder, and administration services provided to third-party funds. Advice solutions fees are charged for brokerage and asset management services provided to advice solutions clients. Both mutual fund and ETF service fees and advice solutions fees are earned and recognized over time. Fees are generally based on a percentage of the daily value of assets under management and are collected on a monthly or quarterly basis.
Trading revenue
Substantially all trading revenue is generated through commissions earned for executing trades for clients in individual equities, options, fixed income securities, and certain third-party mutual funds and ETFs. This revenue is earned when the trades are executed and collected when the trades are settled. Effective October 7, 2019, CS&Co eliminated online trading commissions for U.S. and Canadian-listed stocks and ETFs, as well as the base charge on options.
Other revenue
Other revenue includes order flow revenue, other service fees, software fees from our portfolio management solutions, exchange processing fees, and nonrecurring gains. Generally, the most significant portion of other revenue is order flow revenue, which is comprised of rebate payments received from execution venues to which CS&Co sends equity and option orders. Order flow revenue is recognized when the trades are executed and is collected on a monthly or quarterly basis.
Cash and cash equivalents
Schwab considers all highly liquid investments that mature in three months or less from the time of acquisition and that are not segregated and on deposit for regulatory purposes to be cash and cash equivalents. Cash and cash equivalents include money market funds, deposits with banks, certificates of deposit, commercial paper, and U.S. Treasury securities. Cash and cash equivalents also include balances that our banking subsidiaries maintain at the Federal Reserve.
Cash and investments segregated and on deposit for regulatory purposes
Pursuant to the SEC’s Customer Protection Rule and other applicable regulations, Schwab maintains cash or qualified securities in segregated reserve accounts for the exclusive benefit of clients. Cash and investments segregated and on deposit for regulatory purposes include resale agreements, which are collateralized by U.S. Government and agency securities. Resale agreements are accounted for as collateralized financing transactions that are recorded at their contractual amounts plus accrued interest. The Company obtains collateral with a market value equal to or in excess of the principal amount
- 64 -
THE CHARLES SCHWAB CORPORATION
Notes to Consolidated Financial Statements
(Tabular Amounts in Millions, Except Per Share Data, Option Price Amounts, Ratios, or as Noted)
loaned and accrued interest under resale agreements. Collateral is valued daily by the Company, with additional collateral obtained to ensure full collateralization. Cash and investments segregated also include certificates of deposit and U.S. Government securities. Certificates of deposit and U.S. Government securities are recorded at fair value.
Receivables from brokerage clients
Other securities owned at fair value
Investment securities
AFS securities are recorded at fair value and unrealized gains and losses are reported, net of taxes, in AOCI included in stockholders’ equity. HTM securities are recorded at amortized cost based on the Company’s positive intent and ability to hold these securities to maturity. Realized gains and losses from sales of AFS securities are determined on a specific identification basis and are included in other revenue.
Management evaluates whether investment securities are other-than-temporarily impaired (OTTI) on a quarterly basis. Debt securities with unrealized losses are considered OTTI if the Company intends to sell the security or if it is more likely than not that the Company will be required to sell such security before any anticipated recovery. If management determines that a security is OTTI under these circumstances, the impairment recognized in earnings is measured as the entire difference between amortized cost and fair value.
A security is also OTTI if management does not expect to recover all of the amortized cost of the security. In this circumstance, the impairment recognized in earnings represents the estimated credit loss, and is measured by the difference between the present value of expected cash flows and the amortized cost of the security. Where appropriate, models are utilized to estimate the credit loss on a discounted cash flow basis using the security’s effective interest rate.
The evaluation of whether we expect to recover the amortized cost of a security is inherently judgmental. The evaluation considers multiple factors including: the magnitude and duration of the unrealized loss; the financial condition of the issuer; the payment structure of the security; external credit ratings; our internal credit ratings; for asset-backed securities, the amount of credit support provided by the structure of the security to absorb credit losses on the underlying collateral; recent events specific to the issuer and the issuer’s industry; and whether all scheduled principal and interest payments have been received.
Securities borrowed and securities loaned
- 65 -
THE CHARLES SCHWAB CORPORATION
Notes to Consolidated Financial Statements
(Tabular Amounts in Millions, Except Per Share Data, Option Price Amounts, Ratios, or as Noted)
Bank loans and related allowance for loan losses
Bank loans are recorded at their contractual principal amounts and include unamortized direct origination costs or net purchase discounts or premiums. Direct origination costs and premiums and discounts are recognized in interest revenue using the effective interest method over the contractual life of the loan and are adjusted for actual prepayments. Additionally, loans are recorded net of an allowance for loan losses. The loan portfolio includes four loan types: First Mortgages, HELOCs, PALs, and other loans. We use these segments when developing and documenting our methodology for determining the allowance for loan losses.
Schwab records an allowance for loan losses through a charge to earnings based on our estimate of probable incurred losses in the existing portfolio. We review the allowance for loan losses quarterly, taking into consideration current economic conditions, the composition of the existing loan portfolio, past loss experience, and risks inherent in the portfolio to ensure that the allowance for loan losses is maintained at an appropriate level.
PALs are collateralized by marketable securities with liquid markets. Credit lines are over-collateralized dependent on the type of security pledged. Collateral market value is monitored on a daily basis and a borrower’s committed line may be reduced or collateral may be liquidated if the collateral is in danger of falling below specified levels. As such, the loss inherent within this portfolio is limited.
The methodology to establish an allowance for loan losses for First Mortgages and HELOCs utilizes statistical models that estimate prepayments, defaults, and probable losses for the loan segments based on predicted behavior of individual loans within the segments. The methodology considers the effects of borrower behavior and a variety of factors including, but not limited to, interest rates, housing price movements as measured by a housing price index, economic conditions, estimated defaults and foreclosures measured by historical and expected delinquencies, changes in prepayment speeds, LTV ratios, past loss experience, estimates of future loss severities, borrower credit risk, and the adequacy of collateral. The methodology also evaluates concentrations in the loan types, including loan products within those types, year of origination, and geographical distribution of collateral.
Probable losses are forecast using a loan-level simulation of the delinquency status of the loans over the term of the loans. The simulation starts with the current relevant risk indicators, including the current delinquent status of each loan, the estimated current LTV ratio (Estimated Current LTV) of each loan, the term and structure of each loan, current key interest rates including U.S. Treasury and LIBOR rates, and borrower FICO scores. The more significant variables in the simulation include delinquency roll rates, loss severity, housing prices, and interest rates. Delinquency roll rates (i.e., the rates at which loans transition through delinquency stages and ultimately result in a loss) are estimated from our historical loss experience adjusted for current trends and market information. Loss severity estimates are based on our historical loss experience and market trends. The estimated loss severity (i.e., loss given default) used in the allowance for loan loss methodology for HELOC loans is higher than that used in the methodology for First Mortgages. Housing price trends are derived from historical home price indices and econometric forecasts of future home values. Factors affecting the home price index include housing inventory, unemployment, interest rates, and inflation expectations. Interest rate projections are based on the current term structure of interest rates and historical volatilities to project various possible future interest rate paths. This methodology results in loss factors that are applied to the outstanding balances to determine the allowance for loan loss for each loan type.
Schwab considers loan modifications in which it makes an economic concession to a borrower experiencing financial difficulty to be troubled debt restructurings (TDRs).
Nonaccrual, Nonperforming and Impaired loans
First Mortgages, HELOCs, PALs, and other loans are placed on nonaccrual status upon becoming 90 days past due as to interest or principal (unless the loans are well-secured and in the process of collection), or when the full timely collection of interest or principal becomes uncertain, including loans to borrowers who have filed for bankruptcy. HELOC loans secured by a second lien are placed on non-accrual status if the associated first lien is 90 days or more delinquent, regardless of the payment status of the HELOC. When a loan is placed on nonaccrual status, the accrued and unpaid interest receivable is reversed and the loan is accounted for on the cash or cost recovery method until qualifying for return to accrual status. Generally, a nonaccrual loan may be returned to accrual status when all delinquent interest and principal is repaid and the borrower demonstrates a sustained period of performance, or when the loan is both well-secured and in the process of
- 66 -
THE CHARLES SCHWAB CORPORATION
Notes to Consolidated Financial Statements
(Tabular Amounts in Millions, Except Per Share Data, Option Price Amounts, Ratios, or as Noted)
collection and collectability is no longer doubtful. Loans on nonaccrual status and other real estate owned are considered nonperforming assets. Nonaccrual loans, other real estate owned, and TDRs are considered impaired assets.
Loan Charge-Offs
The Company charges off a loan in the period that it is deemed uncollectible and records a reduction in the allowance for loan losses and the loan balance. Our charge-off policy for First Mortgage and HELOC loans is to assess the value of the property when the loan has been delinquent for 180 days or has been discharged in bankruptcy proceedings, regardless of whether the property is in foreclosure, and charge-off the amount of the loan balance in excess of the estimated current value of the underlying property less estimated costs to sell. The Company’s policy for PALs is to charge off any delinquent loans no later than at 90 days past due.
Equipment, office facilities, and property
Equipment and office facilities | 3 to 10 years |
Buildings | 40 years |
Building and land improvements | 20 years |
Software | 3 to 10 years (1) |
Leasehold improvements | Lesser of useful life or lease term |
(1) Amortized over contractual term if less than three years .
Equipment, office facilities, and property are reviewed for impairment whenever events or changes in circumstances indicate that the carrying amount of such assets may not be recoverable.
Goodwill
Goodwill represents the fair value of acquired businesses in excess of the fair value of the individually identified net assets acquired. Goodwill is not amortized but is tested for impairment annually or whenever indications of impairment exist. Impairment exists when the carrying amount of goodwill exceeds its implied fair value, resulting in an impairment charge for this excess. Our annual impairment testing date is April 1st. Schwab can elect to qualitatively assess goodwill for impairment if it is more likely than not that the fair value of a reporting unit exceeds its carrying value. A qualitative assessment considers macroeconomic and other industry-specific factors, such as trends in short-term and long-term interest rates and the ability to access capital, and Company specific factors such as market capitalization in excess of net assets, trends in revenue generating activities, and merger or acquisition activity.
- 67 -
THE CHARLES SCHWAB CORPORATION
Notes to Consolidated Financial Statements
(Tabular Amounts in Millions, Except Per Share Data, Option Price Amounts, Ratios, or as Noted)
Intangible assets
Finite-lived intangible assets are amortized over their useful lives in a manner that best reflects their economic benefit. All intangible assets are reviewed for impairment whenever events or changes in circumstances indicate that the carrying amount of such assets may not be recoverable. Intangible assets other than goodwill are included in other assets on the consolidated balance sheets.
Low-Income Housing Tax Credit (LIHTC) Investments
We account for investments in qualified affordable housing projects using the proportional amortization method if the applicable requirements are met. The proportional amortization method amortizes the cost of the investment over the period in which the investor expects to receive tax credits and other tax benefits, and the resulting amortization is recognized as a component of taxes on income. The carrying value of LIHTC investments is included in other assets on the consolidated balance sheets. Unfunded commitments related to LIHTC investments are included in accrued expenses and other liabilities on the consolidated balance sheets.
Leases
The Company has operating leases for corporate offices, branch locations, and server equipment and determines if an arrangement is a lease at inception. Leases with an initial term of 12 months or less are not recorded on the balance sheet; we recognize lease expense for these leases on a straight-line basis over the lease term. Right-of-use (ROU) assets represent our right to use an underlying asset for the lease term and lease liabilities represent our obligation to make lease payments arising from the lease. Operating lease ROU assets and lease liabilities are recognized at commencement date based on the present value of lease payments over the lease term. The lease liability may include payments that depend on a rate or index (such as the Consumer Price Index), measured using the rate or index at the commencement date. Payments that vary because of changes in facts or circumstances occurring after the commencement date are considered variable. These payments are not recognized as part of the lease liability and are expensed in the period incurred. The Company’s lease agreements do not contain any material residual value guarantees or material restrictive covenants.
We have lease agreements with lease and non-lease components. For the majority of our leases (real estate leases), the Company has elected the practical expedient to account for the lease and non-lease components as a single lease component. We have not elected the practical expedient for equipment leases and account for lease and non-lease components separately for those classes of leases.
As the rates implicit in our leases are not readily determinable, we use our incremental borrowing rate based on the information available at commencement date in determining the present value of lease payments. Our lease terms may include periods covered by options to extend when it is reasonably certain that we will exercise those options. The lease terms may also include periods covered by options to terminate when it is reasonably certain that we will not exercise that option.
Lease expense for operating lease payments is recognized on a straight-line basis over the lease term.
Guarantees and indemnifications
Advertising and market development
Advertising and market development activities include the cost to produce and distribute marketing campaigns as well as client incentives and discounts. Such costs are generally expensed when incurred.
Income taxes
Schwab provides for income taxes on all transactions that have been recognized in the consolidated financial statements. Accordingly, deferred tax assets are adjusted to reflect the tax rates at which future taxable amounts will likely be settled or
- 68 -
THE CHARLES SCHWAB CORPORATION
Notes to Consolidated Financial Statements
(Tabular Amounts in Millions, Except Per Share Data, Option Price Amounts, Ratios, or as Noted)
realized. The effects of tax rate changes on future deferred tax assets and deferred tax liabilities, as well as other changes in income tax laws, are recorded in earnings in the period during which such changes are enacted. Uncertain tax positions are evaluated to determine whether they are more likely than not to be sustained upon examination. When tax positions are more likely than not to be sustained upon examination the difference between positions taken on tax return filings and estimated potential tax settlement outcomes are recognized in accrued expenses and other liabilities. If a position is not more likely than not to be sustained, then none of the tax benefit is recognized in Schwab’s financial statements. Accrued interest and penalties relating to unrecognized tax benefits is recorded in taxes on income. Schwab records amounts within AOCI net of taxes. Income tax effects are released from AOCI using the specific-identification approach.
Share-based compensation
Share-based compensation includes employee and board of director stock options and restricted stock units. Schwab measures compensation expense for these share-based payment arrangements based on their estimated fair values as of the grant date. The fair value of the share-based award is recognized over the vesting period as share-based compensation. Share-based compensation expense is based on options or units expected to vest and therefore is reduced for estimated forfeitures. Per the Company’s accounting policy election, forfeitures are estimated at the time of grant and reviewed annually based on the Company’s historical forfeiture experience. Share-based compensation expense is adjusted in subsequent periods if actual forfeitures differ from estimated forfeitures. The excess tax benefits or deficiencies from the exercise of stock options and the vesting of restricted stock units are recorded in taxes on income.
Earnings per common share
EPS is computed using the two-class method. Preferred stock dividends and undistributed earnings and dividends allocated to participating securities are subtracted from net income in determining net income available to common stockholders. Basic EPS is computed by dividing net income available to common stockholders by the weighted-average number of common shares outstanding during the period. The computation of diluted EPS is similar to the computation of basic EPS except that the denominator is increased to include the number of additional common shares that would have been outstanding if dilutive potential common shares had been issued. Dilutive potential common shares include, if dilutive, the effect of outstanding stock options and non-vested restricted stock units.
Fair values of assets and liabilities
Fair value is defined as the price that would be received to sell an asset or the price paid to transfer a liability in an orderly transaction between market participants at the measurement date. Fair value measurement accounting guidance describes the fair value hierarchy for disclosing assets and liabilities measured at fair value based on the inputs used to value them. The fair value hierarchy maximizes the use of observable inputs and minimizes the use of unobservable inputs. Observable inputs are based on market pricing data obtained from third-party sources independent of the Company. A quoted price in an active market provides the most reliable evidence of fair value and is generally used to measure fair value whenever available.
Unobservable inputs reflect management’s judgment about the assumptions market participants would use in pricing the asset or liability. Where inputs used to measure fair value of an asset or liability are from different levels of the hierarchy, the asset or liability is categorized based on the lowest level input that is significant to the fair value measurement in its entirety. Assessing the significance of a particular input requires judgment. The fair value hierarchy includes three levels based on the objectivity of the inputs as follows:
• | Level 1 inputs are quoted prices in active markets as of the measurement date for identical assets or liabilities that the Company has the ability to access. |
• | Level 2 inputs are inputs other than quoted prices included in Level 1 that are observable for the asset or liability, either directly or indirectly. Level 2 inputs include quoted prices for similar assets and liabilities in active markets, and inputs other than quoted prices that are observable for the asset or liability, such as interest rates, benchmark yields, issuer spreads, new issue data, and collateral performance. |
• | Level 3 inputs are unobservable inputs for the asset or liability, and include situations where there is little, if any, market activity for the asset or liability. |
- 69 -
THE CHARLES SCHWAB CORPORATION
Notes to Consolidated Financial Statements
(Tabular Amounts in Millions, Except Per Share Data, Option Price Amounts, Ratios, or as Noted)
Assets and liabilities measured at fair value on a recurring basis
Schwab’s assets and liabilities measured at fair value on a recurring basis include: certain cash equivalents, certain investments segregated and on deposit for regulatory purposes, AFS securities, and certain other assets. The Company uses the market approach to determine the fair value of assets and liabilities. When available, the Company uses quoted prices in active markets to measure the fair value of assets and liabilities. Quoted prices for investments in exchange-traded securities represent end-of-day close prices published by exchanges. Quoted prices for money market funds and other mutual funds represent reported net asset values. When utilizing market data and bid-ask spread, the Company uses the price within the bid-ask spread that best represents fair value. When quoted prices in active markets do not exist, the Company uses prices obtained from independent third-party pricing services to measure the fair value of investment assets. We generally obtain prices from three independent third-party pricing sources for assets recorded at fair value.
Our primary independent pricing service provides prices for our fixed income investments such as commercial paper; certificates of deposits; U.S. government and agency securities; state and municipal securities; corporate debt securities; asset-backed securities; foreign government agency securities; and non-agency commercial mortgage-backed securities. Such prices are based on observable trades, broker/dealer quotes, and discounted cash flows that incorporate observable information such as yields for similar types of securities (a benchmark interest rate plus observable spreads) and weighted-average maturity for the same or similar “to-be-issued” securities. We compare the prices obtained from the primary independent pricing service to the prices obtained from the additional independent pricing services to determine if the price obtained from the primary independent pricing service is reasonable. Schwab does not adjust the prices received from independent third-party pricing services unless such prices are inconsistent with the definition of fair value and result in material differences in the amounts recorded.
- 70 -
THE CHARLES SCHWAB CORPORATION
Notes to Consolidated Financial Statements
(Tabular Amounts in Millions, Except Per Share Data, Option Price Amounts, Ratios, or as Noted)
New Accounting Standards
Adoption of New Accounting Standards
Standard | Description | Date of Adoption | Effects on the Financial Statements or Other Significant Matters |
Accounting Standards Update (ASU) 2016-02, “Leases (Topic 842)” | Amends the accounting for leases by lessees and lessors. The primary change from the new guidance is the recognition of ROU assets and lease liabilities by lessees for those leases classified as operating leases. Additional changes include accounting for lease origination and executory costs, required lessee reassessments during the lease term due to changes in circumstances, and expanded lease disclosures. Adoption provides for modified retrospective transition as of the beginning of the earliest comparative period presented in the financial statements in which the entity first applies the new standard or, optionally, through another transition method by which a cumulative-effect adjustment is recorded to retained earnings as of the beginning of the period of adoption. Certain transition relief is permitted if elected by the entity. | January 1, 2019 | The Company adopted the new lease accounting guidance as of January 1, 2019 under the optional transition method provided electing not to recast its comparative periods. In addition, the Company elected the package of practical expedients permitted under the transition guidance within the new standard, which among other things, allowed the Company to carry forward the historical lease classification. The adoption resulted in a gross up of the consolidated balance sheet due to recognition of ROU assets and lease liabilities primarily related to the CS&Co leases of office space and branches. The amounts were based on the present value of our remaining operating lease payments. The Company’s ROU assets and related lease liabilities upon adoption were $596 million and $662 million, respectively. Further details on the impact of adoption are included below in this Note as well as in Note 13. |
ASU 2017-08, “Receivables – Nonrefundable Fees and Other Costs (Subtopic 310-20): Premium Amortization on Purchased Callable Debt Securities” | Shortens the amortization period for the premium on certain callable debt securities to the earliest call date. The amendments are applicable to any purchased individual debt security with an explicit and noncontingent call feature with a fixed price on a preset date. ASU 2017-08 does not impact the accounting for callable debt securities held at a discount. Adoption requires modified retrospective transition as of the beginning of the period of adoption through a cumulative-effect adjustment to retained earnings. | January 1, 2019 | The Company adopted this guidance as of January 1, 2019 using the modified retrospective method. Adoption resulted in an immaterial cumulative-effect adjustment to retained earnings as of the date of adoption. |
ASU 2017-12, “Derivatives and Hedging (Topic 815): Targeted Improvements to Accounting for Hedging Activities” | This ASU amends hedge accounting guidance to better align hedge accounting with risk management activities, while reducing the complexity of applying and reporting on hedge accounting. In addition, for a closed pool of prepayable financial assets, entities will be able to hedge an amount that is not expected to be affected by prepayments, defaults and other events under the “last-of-layer” method. The guidance also permits a one-time reclassification of debt securities eligible to be hedged under the “last-of-layer” method from HTM to AFS upon adoption. | January 1, 2019 | The Company adopted this guidance on January 1, 2019. As part of its adoption, the Company made a one-time election to reclassify a portion of its HTM securities eligible to be hedged under the “last-of-layer” method to AFS. As of January 1, 2019, the securities reclassified had a fair value of $8.8 billion and resulted in a net of tax increase to AOCI of $19 million. The adoption of this standard had no other impact on the Company’s financial statements. |
- 71 -
THE CHARLES SCHWAB CORPORATION
Notes to Consolidated Financial Statements
(Tabular Amounts in Millions, Except Per Share Data, Option Price Amounts, Ratios, or as Noted)
New Accounting Standards Not Yet Adopted
Standard | Description | Required Date of Adoption | Effects on the Financial Statements or Other Significant Matters |
ASU 2016-13, “Financial Instruments – Credit Losses (Topic 326): Measurement of Credit Losses on Financial Instruments” | Provides guidance for recognizing impairment of most debt instruments measured at amortized cost, including loans and HTM debt securities. Requires estimating current expected credit losses (CECL) over the remaining life of an instrument or a portfolio of instruments with similar risk characteristics based on relevant information about past events, current conditions, and reasonable forecasts. The initial estimate of, and the subsequent changes in, CECL will be recognized as credit loss expense through current earnings and will be reflected as an allowance for credit losses offsetting the carrying value of the financial instrument(s) on the balance sheet. Amends the OTTI model for AFS debt securities by requiring the use of an allowance, rather than directly reducing the carrying value of the security, and eliminating consideration of the length of time such security has been in an unrealized loss position as a factor in concluding whether a credit loss exists. Adoption requires modified retrospective transition through a cumulative-effect adjustment to retained earnings as of the beginning of the first reporting period in which the entity applies the new guidance except that a prospective transition is required for AFS debt securities for which an OTTI has been recognized prior to the effective date. | January 1, 2020 | The Company adopted CECL as of January 1, 2020 using the modified retrospective method. The adoption of CECL resulted in an immaterial increase in the Company’s allowance for credit losses and an increase in the liability for expected credit losses on commitments to extend credit, both primarily related to First Mortgages and HELOCs. The adoption impact was recorded as an adjustment to retained earnings as of the beginning of the period of adoption. The Company’s implementation work is now substantially complete. |
ASU 2018-15, “Intangibles–Goodwill and Other–Internal-Use Software (Subtopic 350-40): Customer’s Accounting for Implementation Costs Incurred in a Cloud Computing Arrangement That Is a Service Contract (a consensus of the FASB Emerging Issues Task Force)” | Aligns the criteria for capitalizing implementation costs for cloud computing arrangements (CCA) that are service contracts with internal-use software that is developed or purchased and CCAs that include an internal-use software license. This guidance requires that the capitalized implementation costs be recognized over the period of the CCA service contract, subject to impairment evaluation on an ongoing basis. The guidance prescribes the balance sheet, income statement, and statement of cash flow classification of the capitalized implementation costs and related amortization expense, and requires additional quantitative and qualitative disclosures. Adoption provides for retrospective or prospective application to all implementation costs incurred after the date of adoption. | January 1, 2020 | The Company adopted this guidance prospectively on January 1, 2020. As such, adoption had no impact on the Company’s financial statements. Historically, Schwab has expensed implementation costs as they are incurred for CCAs that are service contracts. Therefore, adopting this guidance will change the Company’s accounting treatment for these types of implementation costs going forward. This guidance is not anticipated to have a material impact on future financial statements, including EPS. |
- 72 -
THE CHARLES SCHWAB CORPORATION
Notes to Consolidated Financial Statements
(Tabular Amounts in Millions, Except Per Share Data, Option Price Amounts, Ratios, or as Noted)
The cumulative effect of the changes made to our consolidated January 1, 2019 balance sheet for the adoption of ASU 2016-02, Leases (Topic 842) were as follows:
Balance at December 31, 2018 | Adjustments Due to ASU 2016-02 | Balance at January 1, 2019 | |||||||||
Assets | |||||||||||
Other assets (1) | $ | $ | $ | ||||||||
Liabilities | |||||||||||
Accrued expenses and other liabilities (2) | $ | $ | $ | ||||||||
(1) The adoption adjustment is comprised of two parts: 1) an increase of $596 million for the recognition of the January 1, 2019 ROU asset and 2) an $8 million decrease related to prepaid rent and initial direct costs, which were reclassified to the ROU asset upon adoption of ASU 2016-02.
(2) The adoption adjustment is comprised of two parts: 1) an increase of $662 million for the recognition of the January 1, 2019 lease liability and 2) a
$74 million decrease related to deferred rent and lease incentives, which were reclassified to the ROU asset upon adoption of ASU 2016-02.
3. Revenue Recognition
Disaggregated Revenue
Disaggregation of Schwab’s revenue by major source is as follows:
Year Ended December 31, | 2019 | 2018 | 2017 | ||||||||
Net interest revenue | |||||||||||
Interest revenue | $ | $ | $ | ||||||||
Interest expense | ( | ) | ( | ) | ( | ) | |||||
Net interest revenue | |||||||||||
Asset management and administration fees | |||||||||||
Mutual funds, ETFs, and CTFs (1) | |||||||||||
Advice solutions | |||||||||||
Other (1) | |||||||||||
Asset management and administration fees | |||||||||||
Trading revenue | |||||||||||
Commissions | |||||||||||
Principal transactions | |||||||||||
Trading revenue | |||||||||||
Other | |||||||||||
Total net revenues | $ | $ | $ | ||||||||
(1) Beginning in the first quarter of 2019, a change was made to move CTFs from other asset management and administration fees. Prior periods have been recast to reflect this change.
For a summary of revenue provided by our reportable segments, see Note 22. The recognition of revenue is not impacted by the operating segment in which revenue is generated.
Contract balances
- 73 -
THE CHARLES SCHWAB CORPORATION
Notes to Consolidated Financial Statements
(Tabular Amounts in Millions, Except Per Share Data, Option Price Amounts, Ratios, or as Noted)
4. | Receivables from and Payables to Brokerage Clients |
Receivables from and payables to brokerage clients are detailed below:
December 31, | 2019 | 2018 | |||||
Receivables | |||||||
Margin loans, net of allowance for doubtful accounts | $ | $ | |||||
Other brokerage receivables | |||||||
Receivables from brokerage clients — net | $ | $ | |||||
Payables | |||||||
Interest-bearing payables | $ | $ | |||||
Non-interest-bearing payables | |||||||
Payables to brokerage clients | $ | $ | |||||
- 74 -
THE CHARLES SCHWAB CORPORATION
Notes to Consolidated Financial Statements
(Tabular Amounts in Millions, Except Per Share Data, Option Price Amounts, Ratios, or as Noted)
5. Investment Securities
The amortized cost, gross unrealized gains and losses, and fair value of AFS and HTM securities are as follows:
December 31, 2019 | Amortized Cost | Gross Unrealized Gains | Gross Unrealized Losses | Fair Value | |||||||||
Available for sale securities | |||||||||||||
U.S. agency mortgage-backed securities | $ | $ | $ | $ | |||||||||
Corporate debt securities (1) | |||||||||||||
Asset-backed securities (2) | |||||||||||||
U.S. Treasury securities | |||||||||||||
Certificates of deposit | |||||||||||||
Commercial paper (1,3) | |||||||||||||
Non-agency commercial mortgage-backed securities | |||||||||||||
Total available for sale securities | $ | $ | $ | $ | |||||||||
Held to maturity securities | |||||||||||||
U.S. agency mortgage-backed securities | $ | $ | $ | $ | |||||||||
Asset-backed securities (2) | |||||||||||||
Corporate debt securities (1) | |||||||||||||
U.S. state and municipal securities | |||||||||||||
Non-agency commercial mortgage-backed securities | |||||||||||||
U.S. Treasury securities | |||||||||||||
Certificates of deposit | |||||||||||||
Foreign government agency securities | |||||||||||||
Other | |||||||||||||
Total held to maturity securities | $ | $ | $ | $ | |||||||||
December 31, 2018 | |||||||||||||
Available for sale securities | |||||||||||||
U.S. agency mortgage-backed securities | $ | $ | $ | $ | |||||||||
U.S. Treasury securities | |||||||||||||
Asset-backed securities (2) | |||||||||||||
Corporate debt securities (1) | |||||||||||||
Certificates of deposit | |||||||||||||
U.S. agency notes | |||||||||||||
Commercial paper (1,3) | |||||||||||||
Foreign government agency securities | |||||||||||||
Non-agency commercial mortgage-backed securities | |||||||||||||
Total available for sale securities | $ | $ | $ | $ | |||||||||
Held to maturity securities | |||||||||||||
U.S. agency mortgage-backed securities | $ | $ | $ | $ | |||||||||
Asset-backed securities (2) | |||||||||||||
Corporate debt securities (1) | |||||||||||||
U.S. state and municipal securities | |||||||||||||
Non-agency commercial mortgage-backed securities | |||||||||||||
U.S. Treasury securities | |||||||||||||
Certificates of deposit | |||||||||||||
Foreign government agency securities | |||||||||||||
Other | |||||||||||||
Total held to maturity securities | $ | $ | $ | $ | |||||||||
(1) As of December 31, 2019 and 2018, approximately 32 % and 26 %, respectively, of the total AFS and HTM investments in corporate debt securities and commercial paper were issued by institutions in the financial services industry.
(2) Approximately 43 % and 36 % of asset-backed securities held as of December 31, 2019 and 2018, respectively, were Federal Family Education Loan Program Asset-Backed Securities. Asset-backed securities collateralized by credit card receivables represented approximately 42 % of the asset-backed securities held as of both December 31, 2019 and 2018.
(3) Included in cash and cash equivalents on the consolidated balance sheets, but excluded from this table is $2.5 billion and $4.9 billion of AFS commercial paper as of December 31, 2019 and 2018, respectively. These holdings have maturities of three months or less and an aggregate market value equal to amortized cost.
- 75 -
THE CHARLES SCHWAB CORPORATION
Notes to Consolidated Financial Statements
(Tabular Amounts in Millions, Except Per Share Data, Option Price Amounts, Ratios, or as Noted)
On January 1, 2019 the Company transferred certain U.S. agency mortgage-backed securities with a fair value of $8.8 billion from the HTM category to the AFS category as permitted by ASU 2017-12. For additional information see Notes 2 and 18.
At December 31, 2019, our banking subsidiaries had pledged securities with a fair value of $25.9 billion as collateral to secure borrowing capacity on secured credit facilities with the FHLB (see Note 12). Our banking subsidiaries also pledge investment securities as collateral to secure borrowing capacity at the Federal Reserve discount window, and had pledged securities with a fair value of $8.5 billion as collateral for this facility at December 31, 2019. CSB also pledges securities issued by federal agencies to secure certain trust deposits. The fair value of these pledged securities was $913 million at December 31, 2019.
See Note 25 for discussion of the transfer of all investment securities designated as HTM to the AFS category made on January 1, 2020.
- 76 -
THE CHARLES SCHWAB CORPORATION
Notes to Consolidated Financial Statements
(Tabular Amounts in Millions, Except Per Share Data, Option Price Amounts, Ratios, or as Noted)
Securities with unrealized losses, aggregated by category and period of continuous unrealized loss, are as follows:
Less than 12 months | 12 months or longer | Total | |||||||||||||||||||||
December 31, 2019 | Fair Value | Unrealized Losses | Fair Value | Unrealized Losses | Fair Value | Unrealized Losses | |||||||||||||||||
Available for sale securities | |||||||||||||||||||||||
U.S. agency mortgage-backed securities | $ | $ | $ | $ | $ | $ | |||||||||||||||||
Asset-backed securities | |||||||||||||||||||||||
U.S. Treasury securities | |||||||||||||||||||||||
Total | $ | $ | $ | $ | $ | $ | |||||||||||||||||
Held to maturity securities | |||||||||||||||||||||||
U.S. agency mortgage-backed securities | $ | $ | $ | $ | $ | $ | |||||||||||||||||
Asset-backed securities | |||||||||||||||||||||||
Total | $ | $ | $ | $ | $ | $ | |||||||||||||||||
Total securities with unrealized losses | $ | $ | $ | $ | $ | $ | |||||||||||||||||
December 31, 2018 | |||||||||||||||||||||||
Available for sale securities | |||||||||||||||||||||||
U.S. agency mortgage-backed securities | $ | $ | $ | $ | $ | $ | |||||||||||||||||
U.S. Treasury securities | |||||||||||||||||||||||
Asset-backed securities | |||||||||||||||||||||||
Corporate debt securities | |||||||||||||||||||||||
Certificates of deposit | |||||||||||||||||||||||
U.S. agency notes | |||||||||||||||||||||||
Foreign government agency securities | |||||||||||||||||||||||
Total | $ | $ | $ | $ | $ | $ | |||||||||||||||||
Held to maturity securities | |||||||||||||||||||||||
U.S. agency mortgage-backed securities | $ | $ | $ | $ | $ | $ | |||||||||||||||||
Asset-backed securities | |||||||||||||||||||||||
Corporate debt securities | |||||||||||||||||||||||
U.S. state and municipal securities | |||||||||||||||||||||||
Non-agency commercial mortgage-backed securities | |||||||||||||||||||||||
U.S. Treasury securities | |||||||||||||||||||||||
Foreign government agency securities | |||||||||||||||||||||||
Total | $ | $ | $ | $ | $ | $ | |||||||||||||||||
Total securities with unrealized losses | $ | $ | $ | $ | $ | $ | |||||||||||||||||
At December 31, 2019, substantially all rated securities in the investment portfolios were investment grade. U.S. agency mortgage-backed securities do not have explicit credit ratings; however, management considers these to be of the highest credit quality and rating given the guarantee of principal and interest by the U.S. government or U.S. government-sponsored enterprises.
Management evaluates whether investment securities are OTTI on a quarterly basis as described in Note 2. No amounts were recognized as OTTI in earnings or other comprehensive income during the years ended December 31, 2019, 2018, and 2017. As of December 31, 2019 and 2018, Schwab did not hold any securities on which OTTI was previously recognized.
- 77 -
THE CHARLES SCHWAB CORPORATION
Notes to Consolidated Financial Statements
(Tabular Amounts in Millions, Except Per Share Data, Option Price Amounts, Ratios, or as Noted)
In the table below, mortgage-backed securities and other asset-backed securities have been allocated to maturity groupings based on final contractual maturities. As borrowers may have the right to call or prepay certain obligations underlying our investment securities, actual maturities may differ from the scheduled contractual maturities presented below.
The maturities of AFS and HTM securities are as follows:
December 31, 2019 | Within 1 year | After 1 year through 5 years | After 5 years through 10 years | After 10 years | Total | ||||||||||||||
Available for sale securities | |||||||||||||||||||
U.S. agency mortgage-backed securities | $ | $ | $ | $ | $ | ||||||||||||||
Corporate debt securities | |||||||||||||||||||
Asset-backed securities | |||||||||||||||||||
U.S. Treasury securities | |||||||||||||||||||
Certificates of deposit | |||||||||||||||||||
Commercial paper | |||||||||||||||||||
Non-agency commercial mortgage-backed securities | |||||||||||||||||||
Total fair value | |||||||||||||||||||
Total amortized cost | $ | $ | $ | $ | $ | ||||||||||||||
Weighted-average yield (1) | % | % | % | % | % | ||||||||||||||
Held to maturity securities | |||||||||||||||||||
U.S. agency mortgage-backed securities | $ | $ | $ | $ | $ | ||||||||||||||
Asset-backed securities | |||||||||||||||||||
Corporate debt securities | |||||||||||||||||||
U.S. state and municipal securities | |||||||||||||||||||
Non-agency commercial mortgage-backed securities | |||||||||||||||||||
U.S. Treasury securities | |||||||||||||||||||
Certificates of deposit | |||||||||||||||||||
Foreign government agency securities | |||||||||||||||||||
Other | |||||||||||||||||||
Total fair value | |||||||||||||||||||
Total amortized cost | $ | $ | $ | $ | $ | ||||||||||||||
Weighted-average yield (1) | % | % | % | % | % | ||||||||||||||
(1) The weighted-average yield is computed using the amortized cost at December 31, 2019.
Proceeds and gross realized gains and losses from sales of AFS securities are as follows:
Year Ended December 31, | 2019 | 2018 | 2017 | ||||||||
Proceeds | $ | $ | $ | ||||||||
Gross realized gains | |||||||||||
Gross realized losses | |||||||||||
- 78 -
THE CHARLES SCHWAB CORPORATION
Notes to Consolidated Financial Statements
(Tabular Amounts in Millions, Except Per Share Data, Option Price Amounts, Ratios, or as Noted)
6. | Bank Loans and Related Allowance for Loan Losses |
The composition of bank loans and delinquency analysis by loan type is as follows:
December 31, 2019 | Current | 30-59 days past due | 60-89 days past due | >90 days past due and other nonaccrual loans (3) | Total past due and other nonaccrual loans | Total loans | Allowance for loan losses | Total bank loans – net | |||||||||||||||||||||||
First Mortgages (1,2) | $ | $ | $ | $ | $ | $ | $ | $ | |||||||||||||||||||||||
HELOCs (1,2) | |||||||||||||||||||||||||||||||
Pledged asset lines | |||||||||||||||||||||||||||||||
Other | |||||||||||||||||||||||||||||||
Total bank loans | $ | $ | $ | $ | $ | $ | $ | $ | |||||||||||||||||||||||
December 31, 2018 | |||||||||||||||||||||||||||||||
First Mortgages (1,2) | $ | $ | $ | $ | $ | $ | $ | $ | |||||||||||||||||||||||
HELOCs (1,2) | |||||||||||||||||||||||||||||||
Pledged asset lines | |||||||||||||||||||||||||||||||
Other | |||||||||||||||||||||||||||||||
Total bank loans | $ | $ | $ | $ | $ | $ | $ | $ | |||||||||||||||||||||||
(1) First Mortgages and HELOCs include unamortized premiums and discounts and direct origination costs of $74 million and $73 million at December 31, 2019 and 2018, respectively.
(2) At December 31, 2019 and 2018, 45 % and 47 %, respectively, of the First Mortgage and HELOC portfolios were concentrated in California. These loans have performed in a manner consistent with the portfolio as a whole.
(3) There were no loans accruing interest that were contractually 90 days or more past due at December 31, 2019 or 2018.
At December 31, 2019, CSB had pledged $10.5 billion of First Mortgages and HELOCs as collateral to secure borrowing capacity on a secured credit facility with the FHLB (see Note 12).
Substantially all of the bank loans were collectively evaluated for impairment at both December 31, 2019 and 2018.
Changes in the allowance for loan losses were as follows:
December 31, 2019 | December 31, 2018 | December 31, 2017 | ||||||||||||||||||||||||||||||||||||||||||||
First Mortgages | HELOCs | Other | Total (1) | First Mortgages | HELOCs | Other | Total (1) | First Mortgages | HELOCs | Other | Total (1) | |||||||||||||||||||||||||||||||||||
Balance at beginning of year | $ | $ | $ | $ | $ | $ | $ | $ | $ | $ | $ | |||||||||||||||||||||||||||||||||||
Charge-offs | ( | ) | ( | ) | ( | ) | ( | ) | ( | ) | ||||||||||||||||||||||||||||||||||||
Recoveries | ||||||||||||||||||||||||||||||||||||||||||||||
Provision for loan losses | ( | ) | ( | ) | ( | ) | ( | ) | ( | ) | ( | ) | ||||||||||||||||||||||||||||||||||
Balance at end of year | $ | $ | $ | $ | $ | $ | $ | $ | $ | $ | $ | $ | ||||||||||||||||||||||||||||||||||
(1)All PALs were fully collateralized by securities with fair values in excess of borrowings at December 31, 2019, 2018, and 2017.
A summary of impaired bank loan-related assets is as follows:
December 31, | 2019 | 2018 | |||||
Nonaccrual loans (1) | $ | $ | |||||
Other real estate owned (2) | |||||||
Total nonperforming assets | |||||||
Troubled debt restructurings | |||||||
Total impaired assets | $ | $ | |||||
(1) Nonaccrual loans include nonaccrual troubled debt restructurings.
(2) Included in other assets on the consolidated balance sheets.
- 79 -
THE CHARLES SCHWAB CORPORATION
Notes to Consolidated Financial Statements
(Tabular Amounts in Millions, Except Per Share Data, Option Price Amounts, Ratios, or as Noted)
Credit Quality
In addition to monitoring delinquency, Schwab monitors the credit quality of First Mortgages and HELOCs by stratifying the portfolios by the following:
• | Year of origination; |
• | Borrower FICO scores at origination (Origination FICO); |
• | Updated borrower FICO scores (Updated FICO); |
• | Loan-to-value (LTV) ratios at origination (Origination LTV); and |
• | Estimated Current LTV ratios. |
Borrowers’ FICO scores are provided by an independent third-party credit reporting service and updated quarterly. The Origination LTV and Estimated Current LTV for a HELOC include any first lien mortgage outstanding on the same property at the time of the HELOC’s origination. The Estimated Current LTV for each loan is updated on a monthly basis by reference to a home price appreciation index.
- 80 -
THE CHARLES SCHWAB CORPORATION
Notes to Consolidated Financial Statements
(Tabular Amounts in Millions, Except Per Share Data, Option Price Amounts, Ratios, or as Noted)
The credit quality indicators of the Company’s bank loan portfolio are detailed below:
December 31, 2019 | Balance | Weighted Average Updated FICO | Percent of Loans that are on Nonaccrual Status | ||||||
First Mortgages | |||||||||
Estimated Current LTV | |||||||||
<70% | $ | % | |||||||
>70% – <90% | % | ||||||||
>90% – <100% | % | ||||||||
>100% | |||||||||
Total | $ | % | |||||||
HELOCs | |||||||||
Estimated Current LTV (1) | |||||||||
<70% | $ | % | |||||||
>70% – <90% | % | ||||||||
>90% – <100% | % | ||||||||
>100% | % | ||||||||
Total | $ | % | |||||||
Pledged asset lines | |||||||||
Weighted-Average LTV (1) | |||||||||
=70% | $ | ||||||||
December 31, 2018 | Balance | Weighted Average Updated FICO | Percent of Loans that are on Nonaccrual Status | ||||||
First Mortgages | |||||||||
Estimated Current LTV | |||||||||
<70% | $ | % | |||||||
>70% – <90% | % | ||||||||
>90% – <100% | |||||||||
>100% | |||||||||
Total | $ | % | |||||||
HELOCs | |||||||||
Estimated Current LTV (1) | |||||||||
<70% | $ | % | |||||||
>70% – <90% | % | ||||||||
>90% – <100% | % | ||||||||
>100% | |||||||||
Total | $ | % | |||||||
Pledged asset lines | |||||||||
Weighted-Average LTV (1) | |||||||||
=70% | $ | ||||||||
(1) Represents the LTV for the full line of credit (drawn and undrawn).
- 81 -
THE CHARLES SCHWAB CORPORATION
Notes to Consolidated Financial Statements
(Tabular Amounts in Millions, Except Per Share Data, Option Price Amounts, Ratios, or as Noted)
December 31, 2019 | First Mortgages | HELOCs | |||||
Year of origination | |||||||
Pre-2015 | $ | $ | |||||
2015 | |||||||
2016 | |||||||
2017 | |||||||
2018 | |||||||
2019 | |||||||
Total | $ | $ | |||||
Origination FICO | |||||||
<620 | $ | $ | |||||
620 – 679 | |||||||
680 – 739 | |||||||
>740 | |||||||
Total | $ | $ | |||||
Origination LTV | |||||||
<70% | $ | $ | |||||
>70% – <90% | |||||||
>90% – <100% | |||||||
Total | $ | $ | |||||
December 31, 2018 | First Mortgages | HELOCs | |||||
Year of origination | |||||||
Pre-2015 | $ | $ | |||||
2015 | |||||||
2016 | |||||||
2017 | |||||||
2018 | |||||||
Total | $ | $ | |||||
Origination FICO | |||||||
<620 | $ | $ | |||||
620 – 679 | |||||||
680 – 739 | |||||||
>740 | |||||||
Total | $ | $ | |||||
Origination LTV | |||||||
<70% | $ | $ | |||||
>70% – <90% | |||||||
>90% – <100% | |||||||
Total | $ | $ | |||||
At December 31, 2019, First Mortgage loans of $10.5 billion had adjustable interest rates. Substantially all of these mortgages have initial fixed interest rates for three to ten years and interest rates that adjust annually thereafter. Approximately 26 % of the balance of these mortgages consisted of loans with interest-only payment terms. The interest rates on approximately 68 % of the balance of these interest-only loans are not scheduled to reset for three or more years. Schwab’s mortgage loans do not include interest terms described as temporary introductory rates below current market rates.
- 82 -
THE CHARLES SCHWAB CORPORATION
Notes to Consolidated Financial Statements
(Tabular Amounts in Millions, Except Per Share Data, Option Price Amounts, Ratios, or as Noted)
The HELOC product has a 30 -year loan term with an initial draw period of ten years from the date of origination. After the initial draw period, the balance outstanding at such time is converted to a 20 -year amortizing loan. The interest rate during the initial draw period and the 20 -year amortizing period is a floating rate based on the prime rate plus a margin.
The following table presents when current outstanding HELOCs will convert to amortizing loans:
December 31, 2019 | Balance | ||
Converted to an amortizing loan by period end | $ | ||
Within 1 year | |||
> 1 year – 3 years | |||
> 3 years – 5 years | |||
> 5 years | |||
Total | $ | ||
At December 31, 2019, $905 million of the HELOC portfolio was secured by second liens on the associated properties. Second lien mortgage loans typically possess a higher degree of credit risk given the subordination to the first lien holder in the event of default. In addition to the credit monitoring activities described previously, Schwab also monitors credit risk by reviewing the delinquency status of the first lien loan on the associated property. At December 31, 2019, the borrowers on approximately 52 % of HELOC loan balances outstanding only paid the minimum amount due.
7. | Equipment, Office Facilities, and Property |
Equipment, office facilities, and property are detailed below:
December 31, | 2019 | 2018 | |||||
Software | $ | $ | |||||
Buildings | |||||||
Leasehold improvements | |||||||
Construction in progress | |||||||
Information technology equipment | |||||||
Furniture and equipment | |||||||
Land | |||||||
Telecommunications equipment | |||||||
Total equipment, office facilities, and property | |||||||
Accumulated depreciation and amortization | ( | ) | ( | ) | |||
Total equipment, office facilities, and property — net | $ | $ | |||||
Depreciation and amortization expense for equipment, office facilities, and property was $322 million, $277 million, and $232 million in 2019, 2018, and 2017, respectively.
- 83 -
THE CHARLES SCHWAB CORPORATION
Notes to Consolidated Financial Statements
(Tabular Amounts in Millions, Except Per Share Data, Option Price Amounts, Ratios, or as Noted)
8. | Goodwill |
The changes in the carrying amount of goodwill, as allocated to our reportable segments, are presented in the following table:
Investor Services | Advisor Services | Total | |||||||||
Balance at December 31, 2017 | $ | $ | $ | ||||||||
Goodwill acquired and other changes during the period | |||||||||||
Balance at December 31, 2018 | |||||||||||
Goodwill acquired and other changes during the period | |||||||||||
Balance at December 31, 2019 | $ | $ | $ | ||||||||
9. Other Assets
The components of other assets are as follows:
December 31, | 2019 | 2018 | |||||
Receivables — interest, dividends, and other | $ | $ | |||||
Securities borrowed | |||||||
Other securities owned at fair value | |||||||
Other investments (1) | |||||||
Operating lease ROU assets | — | ||||||
Customer contract receivables | |||||||
Capitalized contract costs, net | |||||||
Other receivables from brokers, dealers, and clearing organizations | |||||||
Intangible assets, net of accumulated amortization of $326 and $299 (2) | |||||||
Other | |||||||
Total other assets | $ | $ | |||||
(1) Primarily CRA-related, including LIHTC investments; also includes investments in FHLB stock of $35 million and $32 million at December 31, 2019 and 2018, respectively, which can only be sold to the issuer at its par value. Any cash dividends received from investments in FHLB stock are recognized as interest revenue in the consolidated statements of income.
(2) Exclusive of indefinite-lived intangible assets of $77 million and $74 million at December 31, 2019 and 2018, respectively, future amortization over the next five years and thereafter is expected to total $51 million. Amortization expense for intangible assets was $27 million in 2019, $29 million in 2018, and $37 million in 2017.
Capitalized contract costs
Capitalized contract costs relate to sales commissions paid to employees for obtaining contracts with clients and are included in other assets on the consolidated balance sheets. These costs are amortized to expense on a straight-line basis over a period that is consistent with how the related revenue is recognized. Capitalized contract costs were $281 million and $250 million at December 31, 2019 and 2018, respectively. Amortization expense related to capitalized contract costs was $55 million and $47 million in 2019 and 2018, respectively, which was recorded in compensation and benefits expense on the consolidated statements of income.
- 84 -
THE CHARLES SCHWAB CORPORATION
Notes to Consolidated Financial Statements
(Tabular Amounts in Millions, Except Per Share Data, Option Price Amounts, Ratios, or as Noted)
10. | Variable Interest Entities |
As of December 31, 2019 and 2018, all of Schwab’s involvement with VIEs is through CSB’s CRA-related investments and most of those are related to LIHTC investments. As part of CSB’s community reinvestment initiatives, CSB invests in funds that make equity investments in multifamily affordable housing properties and receives tax credits and other tax benefits for these investments. During 2019 and 2018, CSB recorded amortization of $39 million and $32 million, respectively, and recognized tax credits and other tax benefits of $47 million and $36 million, respectively, associated with these investments. The amortization, as well as the tax credits and other tax benefits, are included in taxes on income.
Aggregate assets, liabilities and maximum exposure to loss
The aggregate assets, liabilities, and maximum exposure to loss from those VIEs in which Schwab holds a variable interest, but is not the primary beneficiary, are summarized in the table below:
December 31, 2019 | December 31, 2018 | ||||||||||||||||||||||
Aggregate assets | Aggregate liabilities | Maximum exposure to loss | Aggregate assets | Aggregate liabilities | Maximum exposure to loss | ||||||||||||||||||
LIHTC Investments (1) | $ | $ | $ | $ | $ | $ | |||||||||||||||||
Other CRA Investments (2) | |||||||||||||||||||||||
Total | $ | $ | $ | $ | $ | $ | |||||||||||||||||
(1) Aggregate assets and aggregate liabilities are included in other assets and accrued expenses and other liabilities, respectively, on the consolidated balance sheets.
(2) Other CRA investments are recorded using either the adjusted cost method, equity method, or as HTM securities. Aggregate assets are included in HTM securities, bank loans – net, or other assets on the consolidated balance sheets.
Schwab’s maximum exposure to loss would result from the loss of the investments, including any committed amounts. CSB’s funding of these remaining commitments is dependent upon the occurrence of certain conditions, and CSB expects to pay substantially all of these commitments between 2020 and 2023. During the years ended December 31, 2019 and 2018, Schwab did not provide or intend to provide financial or other support to the VIEs that it was not contractually required to provide.
11. | Bank Deposits |
Bank deposits consist of interest-bearing and non-interest-bearing deposits as follows:
December 31, | 2019 | 2018 | |||||
Interest-bearing deposits: | |||||||
Deposits swept from brokerage accounts | $ | $ | |||||
Checking | |||||||
Savings and other | |||||||
Total interest-bearing deposits | |||||||
Non-interest-bearing deposits | |||||||
Total bank deposits | $ | $ | |||||
- 85 -
THE CHARLES SCHWAB CORPORATION
Notes to Consolidated Financial Statements
(Tabular Amounts in Millions, Except Per Share Data, Option Price Amounts, Ratios, or as Noted)
12. Borrowings
CSC’s Senior Notes are unsecured obligations. CSC may redeem some or all of the Senior Notes of each series prior to their maturity, subject to certain restrictions, and the payment of an applicable make-whole premium in certain instances. Interest is payable semi-annually for the fixed-rate Senior Notes and quarterly for the floating-rate Senior Notes. The following table lists long-term debt by instrument outstanding as of December 31, 2019 and 2018.
Date of | Principal Amount Outstanding | ||||||
Issuance | 2019 | 2018 | |||||
Fixed-rate Senior Notes: | |||||||
4.450% due July 22, 2020 | 07/22/10 | $ | $ | ||||
3.250% due May 21, 2021 | 05/22/18 | ||||||
3.225% due September 1, 2022 | 08/29/12 | ||||||
2.650% due January 25, 2023 | 12/07/17 | ||||||
3.550% due February 1, 2024 | 10/31/18 | ||||||
3.000% due March 10, 2025 | 03/10/15 | ||||||
3.850% due May 21, 2025 | 05/22/18 | ||||||
3.450% due February 13, 2026 | 11/13/15 | ||||||
3.200% due March 2, 2027 | 03/02/17 | ||||||
3.200% due January 25, 2028 | 12/07/17 | ||||||
4.000% due February 1, 2029 | 10/31/18 | ||||||
3.250% due May 22, 2029 | 05/22/19 | ||||||
Floating-rate Senior Notes: | |||||||
Three-month LIBOR + 0.32% due May 21, 2021 | 05/22/18 | ||||||
Total Senior Notes | |||||||
5.450% Finance lease obligation (1) | 06/04/04 | ||||||
Unamortized discount — net | ( | ) | ( | ) | |||
Debt issuance costs | ( | ) | ( | ) | |||
Total long-term debt | $ | $ | |||||
(1) The finance lease obligation was extinguished through an assignment agreement during the first quarter of 2019.
Annual maturities on long-term debt outstanding at December 31, 2019, are as follows:
Maturities | |||
2020 | $ | ||
2021 | |||
2022 | |||
2023 | |||
2024 | |||
Thereafter | |||
Total maturities | |||
Unamortized discount — net | ( | ) | |
Debt issuance costs | ( | ) | |
Total long-term debt | $ | ||
Short-term borrowings: Our banking subsidiaries maintain secured credit facilities with the FHLB. Amounts available under these facilities are dependent on the amount of our First Mortgages, HELOCs, and the fair value of certain of their investment securities that are pledged as collateral. As of December 31, 2019 and 2018, the collateral pledged provided a total borrowing capacity of $34.2 billion and $35.5 billion, respectively, of which no amounts were outstanding at the end of either period.
- 86 -
THE CHARLES SCHWAB CORPORATION
Notes to Consolidated Financial Statements
(Tabular Amounts in Millions, Except Per Share Data, Option Price Amounts, Ratios, or as Noted)
As a condition of the FHLB borrowings, we are required to hold FHLB stock, which was recorded in other assets on the consolidated balance sheets.
Additionally, our banking subsidiaries have access to funding through the Federal Reserve discount window. Amounts available are dependent upon the fair value of certain investment securities that are pledged as collateral. As of December 31, 2019 and 2018, the collateral pledged provided total borrowing capacity of $8.5 billion and $7.9 billion, respectively, of which no amounts were outstanding at the end of either period.
13. Leases
The following table details the amounts and locations of lease assets and liabilities on the consolidated balance sheet:
Balance Sheet Classification | December 31, 2019 | |||
Lease assets: | ||||
Operating lease ROU assets | Other assets | $ | ||
Lease liabilities: | ||||
Operating lease liabilities | Accrued expenses and other liabilities | $ | ||
Lease expense for operating lease payments is recognized on a straight-line basis over the lease term. The Company does not have any finance leases and had an immaterial amount of sublease income for all periods presented.
The components of lease expense are as follows:
Lease Cost (1) | Year Ended December 31, 2019 | ||||
Operating lease cost (2) | $ | ||||
Variable lease cost (3) | |||||
(1) Rent expense related to operating leases was $146 million and $136 million in 2018 and 2017, respectively.
(2) Includes short-term leases, which are immaterial.
(3) Includes payments that are entirely variable and amounts that represent the difference between payments based on an index or rate that would be reflected in the lease liability and what is actually incurred.
The following tables present supplemental lease information as of December 31, 2019:
Lease Term and Discount Rate | ||
Weighted-average remaining lease term (years) | ||
Weighted-average discount rate | % | |
Maturity of Lease Liabilities | Operating Leases (1) | ||
2020 | $ | ||
2021 | |||
2022 | |||
2023 | |||
2024 | |||
Thereafter | |||
Total lease payments | |||
Less: Interest | |||
Present value of lease liabilities | $ | ||
(1) Operating lease payments exclude $78 million of legally binding minimum lease payments for leases signed but not yet commenced. These leases will commence between 2020 and 2021 with lease terms of one year to 21 years.
- 87 -
THE CHARLES SCHWAB CORPORATION
Notes to Consolidated Financial Statements
(Tabular Amounts in Millions, Except Per Share Data, Option Price Amounts, Ratios, or as Noted)
In accordance with the disclosure requirements for our adoption of ASU 2016-02, the Company is presenting the operating leases commitment table as of December 31, 2018. The following table is unchanged from the disclosure in Note 14 in the 2018 Form 10-K:
Operating Leases | Subleases | Net | |||||||
2019 | $ | $ | $ | ||||||
2020 | |||||||||
2021 | |||||||||
2022 | |||||||||
2023 | |||||||||
Thereafter | |||||||||
Total | $ | $ | $ | ||||||
14. | Commitments and Contingencies |
Loan Portfolio: CSB provides a co-branded loan origination program for CSB clients (the Program) with Quicken Loans, Inc. (Quicken Loans®). Pursuant to the Program, Quicken Loans originates and services First Mortgages and HELOCs for CSB clients. Under the Program, CSB purchases certain First Mortgages and HELOCs that are originated by Quicken Loans. CSB purchased First Mortgages of $4.4 billion and $2.1 billion during 2019 and 2018, respectively. CSB purchased HELOCs with commitments of $242 million and $395 million during 2019 and 2018, respectively.
The Company’s commitments to extend credit on bank lines of credit and to purchase First Mortgages are as follows:
December 31, | 2019 | 2018 | ||||
Commitments to extend credit related to unused HELOCs, PALs, and other lines of credit | $ | $ | ||||
Commitments to purchase First Mortgage loans | ||||||
Total | $ | $ | ||||
In the last six months of 2019, volume in new and refinanced First Mortgages increased as a result of lower interest rates and enhancements to customer incentives, leading to additional purchases during the last six months of 2019 and an increase in commitments to purchase First Mortgages as of December 31, 2019.
Purchase obligations: Schwab has purchase obligations for services such as advertising and marketing, telecommunications, professional services, and hardware- and software-related agreements. As of December 31, 2019, the Company has purchase obligations as follows:
2020 (1) | $ | ||
2021 | |||
2022 | |||
2023 | |||
2024 | |||
Thereafter | |||
Total | $ | ||
(1) Includes $1.8 billion for the planned acquisition of USAA-IMCO assets discussed below; other costs related to the USAA-IMCO acquisition are excluded. The table above excludes the planned all-stock acquisition of TD Ameritrade and any expenses related to the acquisition.
Guarantees and indemnifications: Schwab has clients that sell (i.e., write) listed option contracts that are cleared by the Options Clearing Corporation – a clearing house that establishes margin requirements on these transactions. We partially satisfy the margin requirements by arranging unsecured standby LOCs, in favor of the Options Clearing Corporation, which are issued by several banks. At December 31, 2019, the aggregate face amount of these LOCs totaled $20 million. There were no funds drawn under any of these LOCs at December 31, 2019. In connection with its securities lending activities,
- 88 -
THE CHARLES SCHWAB CORPORATION
Notes to Consolidated Financial Statements
(Tabular Amounts in Millions, Except Per Share Data, Option Price Amounts, Ratios, or as Noted)
Schwab is required to provide collateral to certain brokerage clients. The Company satisfies the collateral requirements by providing cash as collateral.
Schwab also provides guarantees to securities clearing houses and exchanges under standard membership agreements, which require members to guarantee the performance of other members. Under the agreements, if another member becomes unable to satisfy its obligations to the clearing houses and exchanges, other members would be required to meet shortfalls. Schwab’s liability under these arrangements is not quantifiable and may exceed the cash and securities it has posted as collateral. At December 31, 2019, amounts posted as collateral with such clearing houses and exchanges included $167 million of U.S. Treasury securities, which are included in other assets on the consolidated balance sheet. The potential requirement for the Company to make payments under these arrangements is remote. Accordingly, no liability has been recognized for these guarantees.
Acquisition of TD Ameritrade: On November 25, 2019, CSC announced a definitive agreement to acquire TD Ameritrade in an all-stock transaction. At the time of announcement, TD Ameritrade had approximately twelve million brokerage accounts and $1.3 trillion in total client assets. Under the agreement, TD Ameritrade stockholders will receive 1.0837 CSC shares for each TD Ameritrade share. Based on the closing price of CSC common stock on November 20, 2019, the merger consideration represented approximately $26 billion. The transaction is expected to close in the second half of 2020, subject to satisfaction of closing conditions. Under certain circumstances, CSC or TD Ameritrade could be required to pay the other party a termination fee of $950 million or reimburse the other party’s fees up to $50 million.
Acquisition of USAA-IMCO: On July 25, 2019, the Company announced a definitive agreement to acquire assets of USAA-IMCO, including over one million brokerage and managed portfolio accounts with approximately $90 billion in client assets at the time of announcement, for $1.8 billion in cash. The companies have also agreed to enter into a long-term referral agreement, effective at closing of the acquisition, that would make Schwab the exclusive wealth management and brokerage provider for USAA members. The transaction is expected to close in mid-2020, subject to satisfaction of closing conditions, including regulatory approvals and the implementation of conversion plans.
Legal contingencies: Schwab is subject to claims and lawsuits in the ordinary course of business, including arbitrations, class actions and other litigation, some of which include claims for substantial or unspecified damages. The Company is also the subject of inquiries, investigations, and proceedings by regulatory and other governmental agencies.
Predicting the outcome of a litigation or regulatory matter is inherently difficult, requiring significant judgment and evaluation of various factors, including the procedural status of the matter and any recent developments; prior experience and the experience of others in similar cases; available defenses, including potential opportunities to dispose of a case on the merits or procedural grounds before trial (e.g., motions to dismiss or for summary judgment); the progress of fact discovery; the opinions of counsel and experts regarding potential damages; and potential opportunities for settlement and the status of any settlement discussions. It may not be reasonably possible to estimate a range of potential liability until the matter is closer to resolution – pending, for example, further proceedings, the outcome of key motions or appeals, or discussions among the parties. Numerous issues may have to be developed, such as discovery of important factual matters and determination of threshold legal issues, which may include novel or unsettled questions of law. Reserves are established or adjusted or further disclosure and estimates of potential loss are provided as the matter progresses and more information becomes available.
Schwab believes it has strong defenses in all significant matters currently pending and is contesting liability and any damages claimed. Nevertheless, some of these matters may result in adverse judgments or awards, including penalties, injunctions or other relief, and the Company may also determine to settle a matter because of the uncertainty and risks of litigation. Described below is a matter in which there is a reasonable possibility that a material loss could be incurred or where the matter may otherwise be of significant interest to stockholders. Unless otherwise noted, the Company is unable to provide a reasonable estimate of any potential liability given the stage of proceedings in the matter. With respect to all other pending matters, based on current information and consultation with counsel, it does not appear reasonably possible that the outcome of any such matter would be material to the financial condition, operating results, or cash flows of the Company.
Crago Order Routing Litigation: On July 13, 2016, a securities class action lawsuit was filed in the U.S. District Court for the Northern District of California on behalf of a putative class of customers executing equity orders through CS&Co. The lawsuit names CS&Co and CSC as defendants and alleges that an agreement under which CS&Co routed orders to UBS Securities LLC between July 13, 2011 and December 31, 2014 violated CS&Co’s duty to seek best execution. Plaintiffs seek
- 89 -
THE CHARLES SCHWAB CORPORATION
Notes to Consolidated Financial Statements
(Tabular Amounts in Millions, Except Per Share Data, Option Price Amounts, Ratios, or as Noted)
unspecified damages, interest, injunctive and equitable relief, and attorneys’ fees and costs. After a first amended complaint was dismissed with leave to amend, plaintiffs filed a second amended complaint on August 14, 2017. Defendants again moved to dismiss, and in a decision issued December 5, 2017, the court denied the motion. Defendants have answered the complaint to deny all allegations, and are vigorously contesting the lawsuit.
15. | Financial Instruments Subject to Off-Balance Sheet Credit Risk |
Resale agreements: Schwab enters into collateralized resale agreements principally with other broker-dealers, which could result in losses in the event the counterparty fails to purchase the securities held as collateral for the cash advanced and the fair value of the securities declines. To mitigate this risk, Schwab requires that the counterparty deliver securities to a custodian, to be held as collateral, with a fair value at or in excess of the resale price. Schwab also sets standards for the credit quality of the counterparty, monitors the fair value of the underlying securities as compared to the related receivable, including accrued interest, and requires additional collateral where deemed appropriate. The collateral provided under these resale agreements is utilized to meet obligations under broker-dealer client protection rules, which place limitations on our ability to access such segregated securities. For Schwab to repledge or sell this collateral, we would be required to deposit cash and/or securities of an equal amount into our segregated reserve bank accounts in order to meet our segregated cash and investment requirement. Schwab’s resale agreements are not subject to master netting arrangements.
Securities lending: Schwab loans brokerage client securities temporarily to other brokers and clearing houses in connection with its securities lending activities and receives cash as collateral for the securities loaned. Increases in security prices may cause the fair value of the securities loaned to exceed the amount of cash received as collateral. In the event the counterparty to these transactions does not return the loaned securities or provide additional cash collateral, we may be exposed to the risk of acquiring the securities at prevailing market prices in order to satisfy our client obligations. Schwab mitigates this risk by requiring credit approvals for counterparties, monitoring the fair value of securities loaned, and requiring additional cash as collateral when necessary. We also borrow securities from other broker-dealers to fulfill short sales by brokerage clients and deliver cash to the lender in exchange for the securities. The fair value of these borrowed securities was $719 million and $99 million at December 31, 2019 and 2018, respectively. Most of our securities lending transactions are through a program with a clearing organization, which guarantees the return of cash to us. Our securities lending transactions are subject to enforceable master netting arrangements with other broker-dealers; however, we do not net securities lending transactions. Therefore, the securities loaned and securities borrowed are presented gross in the consolidated balance sheets.
- 90 -
THE CHARLES SCHWAB CORPORATION
Notes to Consolidated Financial Statements
(Tabular Amounts in Millions, Except Per Share Data, Option Price Amounts, Ratios, or as Noted)
The following table presents information about our resale agreements and securities lending activity depicting the potential effect of rights of setoff between these recognized assets and recognized liabilities.
Gross Assets/ Liabilities | Gross Amounts Offset in the Consolidated Balance Sheets | Net Amounts Presented in the Consolidated Balance Sheets | Gross Amounts Not Offset in the Consolidated Balance Sheets | Net Amount | |||||||||||||||||||||
Counterparty Offsetting | Collateral | ||||||||||||||||||||||||
December 31, 2019 | |||||||||||||||||||||||||
Assets | |||||||||||||||||||||||||
Resale agreements (1) | $ | $ | $ | $ | $ | ( | ) | (2) | $ | ||||||||||||||||
Securities borrowed (3) | ( | ) | ( | ) | |||||||||||||||||||||
Total | $ | $ | $ | $ | ( | ) | $ | ( | ) | $ | |||||||||||||||
Liabilities | |||||||||||||||||||||||||
Securities loaned (4,5) | $ | $ | $ | $ | ( | ) | $ | ( | ) | $ | |||||||||||||||
Total | $ | $ | $ | $ | ( | ) | $ | ( | ) | $ | |||||||||||||||
December 31, 2018 | |||||||||||||||||||||||||
Assets | |||||||||||||||||||||||||
Resale agreements (1) | $ | $ | $ | $ | $ | ( | ) | (2) | $ | ||||||||||||||||
Securities borrowed (3) | ( | ) | ( | ) | |||||||||||||||||||||
Total | $ | $ | $ | $ | ( | ) | $ | ( | ) | $ | |||||||||||||||
Liabilities | |||||||||||||||||||||||||
Securities loaned (4,5) | $ | $ | $ | $ | ( | ) | $ | ( | ) | $ | |||||||||||||||
Total | $ | $ | $ | $ | ( | ) | $ | ( | ) | $ | |||||||||||||||
(1) Included in cash and investments segregated and on deposit for regulatory purposes in the consolidated balance sheets.
(2) Actual collateral was greater than or equal to 102 % of the related assets. At December 31, 2019 and 2018, the fair value of collateral received in connection with resale agreements that are available to be repledged or sold was $9.2 billion and $7.4 billion, respectively.
(3) Included in other assets in the consolidated balance sheets.
(4) Included in accrued expenses and other liabilities in the consolidated balance sheets. The cash collateral received from counterparties under securities lending transactions was equal to or greater than the market value of the securities loaned at December 31, 2019 and 2018.
Client trade settlement: Schwab is obligated to settle transactions with brokers and other financial institutions even if our clients fail to meet their obligations to us. Clients are required to complete their transactions on settlement date, generally two business days after the trade date. If clients do not fulfill their contractual obligations, we may incur losses. We have established procedures to reduce this risk by requiring deposits from clients in excess of amounts prescribed by regulatory requirements for certain types of trades, and therefore the potential to make payments under these client transactions is remote. Accordingly, no liability has been recognized for these transactions.
- 91 -
THE CHARLES SCHWAB CORPORATION
Notes to Consolidated Financial Statements
(Tabular Amounts in Millions, Except Per Share Data, Option Price Amounts, Ratios, or as Noted)
Margin lending: Clients with margin loans have agreed to allow Schwab to pledge collateralized securities in their brokerage accounts in accordance with federal regulations. The following table summarizes the fair value of client securities that were available, under such regulations, that could have been used as collateral, as well as the fair value of securities that we had pledged under such regulations and from securities borrowed transactions:
December 31, | 2019 | 2018 | ||||
Fair value of client securities available to be pledged | $ | $ | ||||
Fair value of securities pledged for: | ||||||
Fulfillment of requirements with the Options Clearing Corporation (1) | $ | $ | ||||
Fulfillment of client short sales | ||||||
Securities lending to other broker-dealers | ||||||
Total collateral pledged | $ | $ | ||||
Note: Excludes amounts available and pledged for securities lending from fully-paid client securities. The fair value of fully-paid client securities available and pledged was $142 million as of December 31, 2019 and $97 million as of December 31, 2018.
(1) |
- 92 -
THE CHARLES SCHWAB CORPORATION
Notes to Consolidated Financial Statements
(Tabular Amounts in Millions, Except Per Share Data, Option Price Amounts, Ratios, or as Noted)
16. Fair Values of Assets and Liabilities
For a description of the fair value hierarchy and Schwab’s fair value methodologies, including the use of independent third-party pricing services, see Note 2. The Company did not adjust prices received from the primary independent third-party pricing service at December 31, 2019 or 2018.
Assets and Liabilities Measured at Fair Value on a Recurring Basis
The following tables present the fair value hierarchy for assets measured at fair value on a recurring basis. Liabilities recorded at fair value were not material, and therefore are not included in the following tables:
December 31, 2019 | Level 1 | Level 2 | Level 3 | Balance at Fair Value | ||||||||
Cash equivalents: | ||||||||||||
Money market funds | $ | $ | $ | $ | ||||||||
Commercial paper | ||||||||||||
Total cash equivalents | ||||||||||||
Investments segregated and on deposit for regulatory purposes: | ||||||||||||
Certificates of deposit | ||||||||||||
U.S. Government securities | ||||||||||||
Total investments segregated and on deposit for regulatory purposes | ||||||||||||
Available for sale securities: | ||||||||||||
U.S. agency mortgage-backed securities | ||||||||||||
Corporate debt securities | ||||||||||||
Asset-backed securities | ||||||||||||
U.S. Treasury securities | ||||||||||||
Certificates of deposit | ||||||||||||
Commercial paper | ||||||||||||
Non-agency commercial mortgage-backed securities | ||||||||||||
Total available for sale securities | ||||||||||||
Other assets: | ||||||||||||
Equity and bond mutual funds | ||||||||||||
U.S. Government securities | ||||||||||||
State and municipal debt obligations | ||||||||||||
Equity, corporate debt, and other securities | ||||||||||||
Total other assets | ||||||||||||
Total | $ | $ | $ | $ | ||||||||
- 93 -
THE CHARLES SCHWAB CORPORATION
Notes to Consolidated Financial Statements
(Tabular Amounts in Millions, Except Per Share Data, Option Price Amounts, Ratios, or as Noted)
December 31, 2018 | Level 1 | Level 2 | Level 3 | Balance at Fair Value | ||||||||
Cash equivalents: | ||||||||||||
Money market funds | $ | $ | $ | $ | ||||||||
Commercial paper | ||||||||||||
Total cash equivalents | ||||||||||||
Investments segregated and on deposit for regulatory purposes: | ||||||||||||
Certificates of deposit | ||||||||||||
U.S. Government securities | ||||||||||||
Total investments segregated and on deposit for regulatory purposes | ||||||||||||
Available for sale securities: | ||||||||||||
U.S. agency mortgage-backed securities | ||||||||||||
U.S. Treasury securities | ||||||||||||
Asset-backed securities | ||||||||||||
Corporate debt securities | ||||||||||||
Certificates of deposit | ||||||||||||
U.S. agency notes | ||||||||||||
Commercial paper | ||||||||||||
Foreign government agency securities | ||||||||||||
Non-agency commercial mortgage-backed securities | ||||||||||||
Total available for sale securities | ||||||||||||
Other assets: | ||||||||||||
Equity and bond mutual funds | ||||||||||||
U.S. Government securities | ||||||||||||
State and municipal debt obligations | ||||||||||||
Equity, corporate debt, and other securities | ||||||||||||
Schwab Funds® money market funds | ||||||||||||
Total other assets | ||||||||||||
Total | $ | $ | $ | $ | ||||||||
- 94 -
THE CHARLES SCHWAB CORPORATION
Notes to Consolidated Financial Statements
(Tabular Amounts in Millions, Except Per Share Data, Option Price Amounts, Ratios, or as Noted)
Fair Value of Other Financial Instruments
The following tables present the fair value hierarchy for other financial instruments:
December 31, 2019 | Carrying Amount | Level 1 | Level 2 | Level 3 | Balance at Fair Value | ||||||||||
Assets | |||||||||||||||
Cash and cash equivalents | $ | $ | $ | $ | $ | ||||||||||
Cash and investments segregated and on deposit for regulatory purposes | |||||||||||||||
Receivables from brokerage clients — net | |||||||||||||||
Held to maturity securities: | |||||||||||||||
U.S. agency mortgage-backed securities | |||||||||||||||
Asset-backed securities | |||||||||||||||
Corporate debt securities | |||||||||||||||
U.S. state and municipal securities | |||||||||||||||
Non-agency commercial mortgage-backed securities | |||||||||||||||
U.S. Treasury securities | |||||||||||||||
Certificates of deposit | |||||||||||||||
Foreign government agency securities | |||||||||||||||
Other | |||||||||||||||
Total held to maturity securities | |||||||||||||||
Bank loans — net: | |||||||||||||||
First Mortgages | |||||||||||||||
HELOCs | |||||||||||||||
Pledged asset lines | |||||||||||||||
Other | |||||||||||||||
Total bank loans — net | |||||||||||||||
Other assets | |||||||||||||||
Liabilities | |||||||||||||||
Bank deposits | $ | $ | $ | $ | $ | ||||||||||
Payables to brokerage clients | |||||||||||||||
Accrued expenses and other liabilities | |||||||||||||||
Long-term debt | |||||||||||||||
- 95 -
THE CHARLES SCHWAB CORPORATION
Notes to Consolidated Financial Statements
(Tabular Amounts in Millions, Except Per Share Data, Option Price Amounts, Ratios, or as Noted)
December 31, 2018 | Carrying Amount | Level 1 | Level 2 | Level 3 | Balance at Fair Value | ||||||||||
Assets | |||||||||||||||
Cash and cash equivalents | $ | $ | $ | $ | $ | ||||||||||
Cash and investments segregated and on deposit for regulatory purposes | |||||||||||||||
Receivables from brokerage clients — net | |||||||||||||||
Held to maturity securities: | |||||||||||||||
U.S. agency mortgage-backed securities | |||||||||||||||
Asset-backed securities | |||||||||||||||
Corporate debt securities | |||||||||||||||
U.S. state and municipal securities | |||||||||||||||
Non-agency commercial mortgage-backed securities | |||||||||||||||
U.S. Treasury securities | |||||||||||||||
Certificates of deposit | |||||||||||||||
Foreign government agency securities | |||||||||||||||
Other | |||||||||||||||
Total held to maturity securities | |||||||||||||||
Bank loans — net: | |||||||||||||||
First Mortgages | |||||||||||||||
HELOCs | |||||||||||||||
Pledged asset lines | |||||||||||||||
Other | |||||||||||||||
Total bank loans — net | |||||||||||||||
Other assets | |||||||||||||||
Liabilities | |||||||||||||||
Bank deposits | $ | $ | $ | $ | $ | ||||||||||
Payables to brokerage clients | |||||||||||||||
Accrued expenses and other liabilities | |||||||||||||||
Long-term debt | |||||||||||||||
- 96 -
THE CHARLES SCHWAB CORPORATION
Notes to Consolidated Financial Statements
(Tabular Amounts in Millions, Except Per Share Data, Option Price Amounts, Ratios, or as Noted)
17. Stockholders’ Equity
CSC did no t issue any shares of common stock through external offerings during 2019, 2018, or 2017.
On January 30, 2019, CSC publicly announced that its Board of Directors authorized a new Share Repurchase Program to repurchase up to $4.0 billion of common stock. The share repurchase authorization does not have an expiration date. During 2019, CSC repurchased 55 million shares of its common stock under this authorization for $2.2 billion.
On October 25, 2018, CSC publicly announced that its Board of Directors terminated the previous two share repurchase authorizations and replaced them with an authorization to repurchase up to $1.0 billion of common stock. CSC repurchased 22 million shares for $1.0 billion in 2018, completing all repurchases under this authorization.
CSC was authorized to issue 9,940,000 shares of preferred stock, $0.01 par value, at December 31, 2019 and 2018. The following is a summary of CSC’s non-cumulative perpetual preferred stock outstanding as of such dates:
Dividend Rate in Effect at December 31, 2019 | Date at Which Dividend Rate Becomes Floating | Floating Annual Rate of Three-Month LIBOR plus: | ||||||||||||||||||||||
Shares Issued and Outstanding (in thousands) at December 31, | Liquidation Preference Per Share | Carrying Value at December 31, | Earliest Redemption Date | |||||||||||||||||||||
2019 (1) | 2018 (1) | 2019 | 2018 | Issue Date | ||||||||||||||||||||
Fixed-rate: | ||||||||||||||||||||||||
Series C | $ | $ | $ | 08/03/15 | % | 12/01/20 | N/A | N/A | ||||||||||||||||
Series D | 03/07/16 | % | 06/01/21 | N/A | N/A | |||||||||||||||||||
Fixed-to-floating-rate: | ||||||||||||||||||||||||
Series A | 01/26/12 | % | 02/01/22 | 02/01/22 | % | |||||||||||||||||||
Series E | 10/31/16 | % | 03/01/22 | 03/01/22 | % | |||||||||||||||||||
Series F | 10/31/17 | % | 12/01/27 | 12/01/27 | % | |||||||||||||||||||
Total preferred stock | $ | $ | ||||||||||||||||||||||
(1) Represented by depositary shares, except for Series A.
N/A Not applicable.
Dividends declared on the Company’s preferred stock are as follows:
Year Ended December 31, | 2019 | 2018 | 2017 | |||||||||||||||||
Total Declared | Per Share Amount | Total Declared | Per Share Amount | Total Declared | Per Share Amount | |||||||||||||||
Series A | $ | $ | $ | |||||||||||||||||
Series B (1) | N/A | N/A | N/A | N/A | ||||||||||||||||
Series C | ||||||||||||||||||||
Series D | ||||||||||||||||||||
Series E | ||||||||||||||||||||
Series F (2) | N/A | N/A | ||||||||||||||||||
Total | $ | $ | $ | |||||||||||||||||
(1) On December 1, 2017, CSC redeemed all of the outstanding shares of its 6.00 % Non-Cumulative Perpetual Preferred Stock, Series B at their stated redemption value.
(2) Series F Preferred Stock was issued on October 31, 2017. Dividends are paid semi-annually beginning on June 1, 2018 until December 1, 2027, and quarterly thereafter.
N/A Not applicable.
- 97 -
THE CHARLES SCHWAB CORPORATION
Notes to Consolidated Financial Statements
(Tabular Amounts in Millions, Except Per Share Data, Option Price Amounts, Ratios, or as Noted)
Dividends on fixed-rate preferred stock are payable quarterly. Dividends on fixed-to-floating-rate preferred stock are payable semi-annually while at a fixed rate, and will become payable quarterly after converting to a floating rate.
Redemption Rights
Each series of CSC’s preferred stock may be redeemed at CSC’s option on any dividend payment date on or after the earliest redemption date for that series. All outstanding preferred stock series may also be redeemed following a “capital treatment event,” as described in the terms of each series set forth in the relevant certificate of designations. Any redemption of CSC’s preferred stock is subject to approval from the Federal Reserve.
18. | Accumulated Other Comprehensive Income |
AOCI represents cumulative gains and losses that are not reflected in earnings. The components of other comprehensive income (loss) are as follows:
Year Ended December 31, | 2019 | 2018 | 2017 | ||||||||||||||||||||||||||
Before Tax | Tax Effect | Net of Tax | Before Tax | Tax Effect | Net of Tax | Before Tax | Tax Effect | Net of Tax | |||||||||||||||||||||
Change in net unrealized gain (loss) on available for sale securities: | |||||||||||||||||||||||||||||
Net unrealized gain (loss) | $ | $ | ( | ) | $ | $ | ( | ) | $ | $ | ( | ) | $ | $ | ( | ) | $ | ||||||||||||
Reclassification of net unrealized loss on securities transferred to held to maturity (1) | ( | ) | |||||||||||||||||||||||||||
Other reclassifications included in other revenue | ( | ) | ( | ) | ( | ) | ( | ) | |||||||||||||||||||||
Change in net unrealized gain (loss) on held to maturity securities: | |||||||||||||||||||||||||||||
Reclassification of net unrealized loss on securities transferred from available for sale (1) | ( | ) | ( | ) | |||||||||||||||||||||||||
Amortization of amounts previously recorded upon transfer to held to maturity from available for sale | ( | ) | ( | ) | ( | ) | |||||||||||||||||||||||
Other | ( | ) | ( | ) | ( | ) | ( | ) | ( | ) | ( | ) | |||||||||||||||||
Other comprehensive income (loss) | $ | $ | ( | ) | $ | $ | ( | ) | $ | $ | ( | ) | $ | $ | ( | ) | $ | ||||||||||||
(1) During 2017, the Company transferred investment securities from the AFS category to the HTM category that had a total net unrealized loss of $227 million before income tax in AOCI on the date of the transfer.
- 98 -
THE CHARLES SCHWAB CORPORATION
Notes to Consolidated Financial Statements
(Tabular Amounts in Millions, Except Per Share Data, Option Price Amounts, Ratios, or as Noted)
AOCI balances are as follows:
Total AOCI | |||
Balance at December 31, 2016 | $ | ( | ) |
Available for sale securities: | |||
Net unrealized gain (loss) | |||
Reclassification of net unrealized loss on securities transferred to held to maturity | |||
Other reclassifications included in other revenue | ( | ) | |
Held to maturity securities: | |||
Reclassification of net unrealized loss on securities transferred from available for sale | ( | ) | |
Amortization of amounts previously recorded upon transfer to held to maturity from available for sale | |||
Other | ( | ) | |
Balance at December 31, 2017 | $ | ( | ) |
Adoption of accounting standards (1) | ( | ) | |
Available for sale securities: | |||
Net unrealized gain (loss) | ( | ) | |
Held to maturity securities: | |||
Amortization of amounts previously recorded upon transfer to held to maturity from available for sale | |||
Other | ( | ) | |
Balance at December 31, 2018 | $ | ( | ) |
Available for sale securities: | |||
Net unrealized gain (loss), excluding transfers to available for sale from held to maturity | |||
Net unrealized gain on securities transferred to available for sale from held to maturity (2) | |||
Other reclassifications included in other revenue | ( | ) | |
Held to maturity securities: | |||
Amortization of amounts previously recorded upon transfer to held to maturity from available for sale | |||
Other | ( | ) | |
Balance at December 31, 2019 | $ | ||
(1) As part of the adoption of ASU 2018-02, “Income Statement – Reporting Comprehensive Income (Topic 220): Reclassification of Certain Tax Effects from Accumulated Other Comprehensive Income” (ASU 2018-02), we elected to reclassify the income tax effects of the Tax Cuts and Jobs Act from items in AOCI into retained earnings as of January 1, 2018.
(2) As part of the adoption of ASU 2017-12, in the first quarter of 2019, the Company made a one-time election to transfer a portion of its HTM securities to AFS. The transfer resulted in a net of tax increase to AOCI of $19 million. See Notes 2 and 5 for additional discussion on the transfer of HTM securities to AFS.
- 99 -
THE CHARLES SCHWAB CORPORATION
Notes to Consolidated Financial Statements
(Tabular Amounts in Millions, Except Per Share Data, Option Price Amounts, Ratios, or as Noted)
19. | Employee Incentive, Retirement, Deferred Compensation, and Career Achievement Plans |
Schwab’s share-based incentive plans provide for granting options and restricted stock units to employees and directors. In addition, we offer retirement and employee stock purchase plans to eligible employees and sponsor deferred compensation plans for eligible officers and non-employee directors.
A summary of share-based compensation expense and related income tax benefit is as follows:
Year Ended December 31, | 2019 | 2018 | 2017 | ||||||||
Stock option expense | $ | $ | $ | ||||||||
Restricted stock unit expense (1) | |||||||||||
Employee stock purchase plan expense | |||||||||||
Total share-based compensation expense | $ | $ | $ | ||||||||
Income tax benefit on share-based compensation expense (2) | $ | ( | ) | $ | ( | ) | $ | ( | ) | ||
(1) Restricted stock unit expense in 2018 includes $36 million related to special stock awards issued to non-officer employees.
(2) Excludes income tax benefits from stock options exercised and restricted stock units vested of $23 million, $46 million, and $87 million in 2019, 2018, and 2017, respectively.
The Company issues shares for stock options and restricted stock units from treasury stock. At December 31, 2019, the Company was authorized to grant up to 65 million common shares under its existing stock incentive plans. Additionally, at December 31, 2019, the Company had 34 million shares reserved for future issuance under its employee stock purchase plan.
As of December 31, 2019, there was $290 million of total unrecognized compensation cost related to outstanding stock options and restricted stock units, which is expected to be recognized through 2023 with a remaining weighted-average service period of 1.3 years for stock options, 2.5 years for restricted stock units, and 0.3 years for performance-based stock units.
Stock Option Plan
Options are granted for the purchase of shares of common stock at an exercise price not less than market value on the date of grant, and expire ten years from the date of grant. Options generally vest annually over a one- to four-year period from the date of grant.
Stock option activity is summarized below:
Number of Options (In millions) | Weighted- Average Exercise Price per Share | Weighted- Average Remaining Contractual Life (in years) | Aggregate Intrinsic Value | |||||||||
Outstanding at December 31, 2018 | $ | $ | ||||||||||
Granted | ||||||||||||
Exercised | ( | ) | ||||||||||
Forfeited | ( | ) | ||||||||||
Expired (1) | — | |||||||||||
Outstanding at December 31, 2019 | $ | $ | ||||||||||
Vested and expected to vest at December 31, 2019 | $ | $ | ||||||||||
Vested and exercisable at December 31, 2019 | $ | $ | ||||||||||
(1) Number of options were less than 500 thousand.
The aggregate intrinsic value in the table above represents the difference between CSC’s closing stock price and the exercise price of each in-the-money option on the last trading day of the period presented.
- 100 -
THE CHARLES SCHWAB CORPORATION
Notes to Consolidated Financial Statements
(Tabular Amounts in Millions, Except Per Share Data, Option Price Amounts, Ratios, or as Noted)
Information on stock options granted and exercised is presented below:
Year Ended December 31, | 2019 | 2018 | 2017 | ||||||||
Weighted-average fair value of options granted per share | $ | $ | $ | ||||||||
Cash received from options exercised | |||||||||||
Tax benefit realized on options exercised | |||||||||||
Aggregate intrinsic value of options exercised | |||||||||||
We use an option pricing model to estimate the fair value of options granted. The model takes into account the contractual term of the stock option, expected volatility, dividend yield, and the risk-free interest rate. Expected volatility is based on the implied volatility of publicly-traded options on CSC’s stock. Dividend yield is based on the average historical CSC dividend yield. The risk-free interest rate is based on the yield of a U.S. Treasury zero-coupon issue with a remaining term similar to the contractual term of the option. We use historical option exercise data, which includes employee termination data, to estimate the probability of future option exercises. The assumptions used to value the options granted during the years presented and their expected lives were as follows:
Year Ended December 31, | 2019 | 2018 | 2017 | |||||
Weighted-average expected dividend yield | % | % | % | |||||
Weighted-average expected volatility | % | % | % | |||||
Weighted-average risk-free interest rate | % | % | % | |||||
Expected life (in years) | 4.2 - 5.9 | 4.0 - 5.2 | 4.1 - 5.3 | |||||
Restricted Stock Units
Restricted stock units are awards that entitle the holder to receive shares of CSC’s common stock following a vesting period. Restricted stock units are restricted from transfer or sale and generally vest annually over a one- to four-year period, while performance-based restricted stock units also require the Company achieve certain financial or other measures prior to vesting. The fair value of restricted stock units is based on the market price of the Company’s stock on the date of grant. The grant date fair value is amortized to compensation expense on a straight-line basis over the requisite service period. The fair value of the restricted stock units that vested during each of the years 2019, 2018, and 2017 was $123 million, $166 million, and $127 million, respectively.
The Company’s restricted stock units activity is summarized below:
Number of Units (In millions) | Weighted- Average Grant Date Fair Value per Unit | |||||
Outstanding at December 31, 2018 | $ | |||||
Granted | ||||||
Vested | ( | ) | ||||
Forfeited (1) | — | |||||
Outstanding at December 31, 2019 | $ | |||||
(1) Number of units were less than 500 thousand.
Retirement Plan
Employees can participate in Schwab’s qualified retirement plan, the SchwabPlan® Retirement Savings and Investment Plan. The Company may match certain employee contributions or make additional contributions to this plan at its discretion. The Company’s total expense was $118 million, $105 million, and $92 million in 2019, 2018, and 2017, respectively.
- 101 -
THE CHARLES SCHWAB CORPORATION
Notes to Consolidated Financial Statements
(Tabular Amounts in Millions, Except Per Share Data, Option Price Amounts, Ratios, or as Noted)
Deferred Compensation Plans
Schwab’s deferred compensation plan for officers permits participants to defer the receipt of certain cash compensation. The deferred compensation plan for non-employee directors permits participants to defer receipt of all or a portion of their director fees and to receive either a grant of stock options, or upon ceasing service as a director, the number of shares of CSC’s common stock that would have resulted from investing the deferred fee amount into CSC’s common stock. The deferred compensation liability was $164 million and $144 million at December 31, 2019 and 2018, respectively.
FC Career Achievement Plan
The FC career achievement plan is a noncontributory, unfunded, nonqualified plan for eligible FCs. An FC is eligible for earned cash payments after retirement contingent upon meeting certain performance levels, tenure, age, and client transitioning requirements. Allocations to the plan are calculated annually based on performance levels achieved and eligible compensation and are subject to general creditors of the Company. Full vesting occurs when an FC reaches 60 years of age and has at least ten years of service with the Company.
The following table presents the changes in projected benefit obligation:
December 31, | 2019 | 2018 | |||||
Projected benefit obligation at beginning of year | $ | $ | |||||
Benefit cost (1) | |||||||
Actuarial (gain)/loss (2) | |||||||
Projected benefit obligation at end of year (3) | $ | $ | |||||
(1) Includes service cost and interest cost, which are recognized in compensation and benefits expense and other expense, respectively, in the consolidated statements of income.
(2) Actuarial (gain)/loss is reflected in the consolidated statements of comprehensive income and is included in AOCI on the consolidated balance sheets.
(3) This amount is recognized as a liability on the consolidated balance sheets and also depicts the accumulated benefit obligation.
20. | Taxes on Income |
On December 22, 2017, the Tax Act was signed into law. Among other things, the Tax Act lowered the federal corporate income tax rate from 35% to 21%, effective for tax years including or commencing January 1, 2018. Schwab’s effective tax rate for the years ended December 31, 2019, 2018, and 2017 was 23.6 %, 23.1 %, and 35.5 %, respectively.
Also as a result of the Tax Act, Schwab recognized a $46 million one-time non-cash charge to taxes on income in the fourth quarter of 2017 associated with the remeasurement of net deferred tax assets and other tax adjustments related to the Tax Act. During 2018, we concluded our analysis and accounting for all remaining impacts of the Tax Act, including the state tax effect of adjustments made to federal temporary differences, resulting in no additional material impacts.
As of January 1, 2018, Schwab adopted ASU 2018-02, which resulted in a decrease to AOCI and an increase to retained earnings by $33 million for the reclassification of certain impacts of the Tax Act. Schwab also adopted ASU 2014-09, “Revenue – Revenue from Contracts with Customers” as of January 1, 2018, which resulted in recording an initial asset for capitalized contract costs of $219 million and a related deferred tax liability of $52 million. As of December 31, 2019, the deferred tax liability related to the capitalized contract costs was $68 million.
- 102 -
THE CHARLES SCHWAB CORPORATION
Notes to Consolidated Financial Statements
(Tabular Amounts in Millions, Except Per Share Data, Option Price Amounts, Ratios, or as Noted)
The components of taxes on income are as follows:
Year Ended December 31, | 2019 | 2018 | 2017 | ||||||||
Current: | |||||||||||
Federal | $ | $ | $ | ||||||||
State | |||||||||||
Total current | |||||||||||
Deferred: | |||||||||||
Federal | |||||||||||
State | ( | ) | |||||||||
Total deferred | |||||||||||
Taxes on income | $ | $ | $ | ||||||||
The temporary differences that created deferred tax assets and liabilities are detailed below:
December 31, | 2019 | 2018 | |||||
Deferred tax assets: | |||||||
Operating lease liabilities | $ | $ | — | ||||
Employee compensation, severance, and benefits | |||||||
State and local taxes | |||||||
Reserves and allowances | |||||||
Net operating loss carryforwards | |||||||
Net unrealized loss on available for sale securities | |||||||
Facilities lease commitments | |||||||
Other | |||||||
Total deferred tax assets | |||||||
Valuation allowance | ( | ) | ( | ) | |||
Deferred tax assets — net of valuation allowance | |||||||
Deferred tax liabilities: | |||||||
Operating lease ROU assets | ( | ) | — | ||||
Depreciation and amortization | ( | ) | ( | ) | |||
Capitalized internal-use software development costs | ( | ) | ( | ) | |||
Capitalized contract costs | ( | ) | ( | ) | |||
Net unrealized gain on available for sale securities | ( | ) | |||||
Other | ( | ) | |||||
Total deferred tax liabilities | ( | ) | ( | ) | |||
Deferred tax asset/(liability) — net (1) | $ | ( | ) | $ | ( | ) | |
(1) Amounts are included in accrued expenses and other liabilities and in other assets on the consolidated balance sheets at December 31, 2019 and 2018.
A reconciliation of the federal statutory income tax rate to the effective income tax rate is as follows:
Year Ended December 31, | 2019 | 2018 | 2017 | |||||
Federal statutory income tax rate | % | % | % | |||||
State income taxes, net of federal tax benefit | ||||||||
Equity compensation benefit | ( | ) | ( | ) | ( | ) | ||
Other (1) | ( | ) | ||||||
Effective income tax rate | % | % | % | |||||
(1) 2017 includes the impact of one-time charge to taxes on income associated with the Tax Act.
- 103 -
THE CHARLES SCHWAB CORPORATION
Notes to Consolidated Financial Statements
(Tabular Amounts in Millions, Except Per Share Data, Option Price Amounts, Ratios, or as Noted)
A reconciliation of the beginning and ending amount of unrecognized tax benefits is as follows:
December 31, | 2019 | 2018 | |||||
Balance at beginning of year | $ | $ | |||||
Additions for tax positions related to the current year | |||||||
Additions for tax positions related to prior years | |||||||
Reductions for tax positions related to prior years | ( | ) | ( | ) | |||
Reductions due to lapse of statute of limitations | ( | ) | |||||
Reductions for settlements with tax authorities | ( | ) | ( | ) | |||
Balance at end of year | $ | $ | |||||
Unrecognized tax benefits totaled $101 million and $112 million as of December 31, 2019 and 2018, respectively, $97 million and $108 million of which if recognized, would affect the annual effective tax rate.
Interest and penalties were accrued related to unrecognized tax benefits in tax expense. At December 31, 2019 and 2018, we had accrued approximately $11 million and $9 million, respectively, for the payment of interest and penalties.
21. Regulatory Requirements
CSC is a savings and loan holding company and CSB, CSC’s primary depository institution subsidiary, is a federal savings bank. CSC is subject to examination, supervision, and regulation by the Federal Reserve. CSB is subject to examination, supervision, and regulation by the OCC, as its primary regulator, the FDIC as its deposit insurer, and the CFPB. CSC is required to serve as a source of strength for CSB.
CSB is subject to various requirements and restrictions under federal and state laws, including regulatory capital requirements and requirements that restrict and govern the terms of affiliate transactions, such as extensions of credit to, or asset purchases from CSC or its other subsidiaries by CSB. In addition, CSB is required to provide notice to and may be required to obtain approval of the OCC and the Federal Reserve to declare dividends to CSC. The federal banking agencies have broad powers to enforce these regulations, including the power to terminate deposit insurance, impose substantial fines and other civil and criminal penalties, and appoint a conservator or receiver. Under the prompt corrective action provisions of the Federal Deposit Insurance Act, CSB could be subject to restrictive actions if it were to fall within one of the lowest three of five capital categories. CSC and CSB are required to maintain minimum capital levels as specified in federal banking regulations. Failure to meet the minimum levels could result in certain mandatory, and possibly additional discretionary actions by the regulators that, if undertaken, could have a direct material effect on CSC and CSB. At December 31, 2019, both CSC and CSB met all of their respective capital requirements.
- 104 -
THE CHARLES SCHWAB CORPORATION
Notes to Consolidated Financial Statements
(Tabular Amounts in Millions, Except Per Share Data, Option Price Amounts, Ratios, or as Noted)
The regulatory capital and ratios for CSC (consolidated) and CSB are as follows:
Actual (1) | Minimum to be Well Capitalized | Minimum Capital Requirement | ||||||||||||||||||
December 31, 2019 | Amount | Ratio | Amount | Ratio | Amount | Ratio (2) | ||||||||||||||
CSC | ||||||||||||||||||||
Common Equity Tier 1 Risk-Based Capital | $ | % | N/A | $ | % | |||||||||||||||
Tier 1 Risk-Based Capital | % | N/A | % | |||||||||||||||||
Total Risk-Based Capital | % | N/A | % | |||||||||||||||||
Tier 1 Leverage | % | N/A | % | |||||||||||||||||
Supplementary Leverage Ratio (1) | % | N/A | % | |||||||||||||||||
CSB | ||||||||||||||||||||
Common Equity Tier 1 Risk-Based Capital | $ | % | $ | % | $ | % | ||||||||||||||
Tier 1 Risk-Based Capital | % | % | % | |||||||||||||||||
Total Risk-Based Capital | % | % | % | |||||||||||||||||
Tier 1 Leverage | % | % | % | |||||||||||||||||
Supplementary Leverage Ratio (1) | % | N/A | N/A | % | ||||||||||||||||
December 31, 2018 | ||||||||||||||||||||
CSC | ||||||||||||||||||||
Common Equity Tier 1 Risk-Based Capital | $ | % | N/A | $ | % | |||||||||||||||
Tier 1 Risk-Based Capital | % | N/A | % | |||||||||||||||||
Total Risk-Based Capital | % | N/A | % | |||||||||||||||||
Tier 1 Leverage | % | N/A | % | |||||||||||||||||
CSB | ||||||||||||||||||||
Common Equity Tier 1 Risk-Based Capital | $ | % | $ | % | $ | % | ||||||||||||||
Tier 1 Risk-Based Capital | % | % | % | |||||||||||||||||
Total Risk-Based Capital | % | % | % | |||||||||||||||||
Tier 1 Leverage | % | % | % | |||||||||||||||||
(1) Beginning in 2019, CSC and CSB were required to include all components of AOCI in regulatory capital and report our supplementary leverage ratio, which is calculated as Tier 1 capital divided by total leverage exposure. Total leverage exposure includes all on-balance sheet assets and certain off-balance sheet exposures, including unused commitments. Prior to 2019, CSC and CSB elected to opt-out of the requirement to include most components of AOCI in Common Equity Tier 1 Capital; the amounts and ratios for December 31, 2018 are presented on this basis. In the interagency regulatory capital and liquidity rules adopted in October 2019, Category III banking organizations such as CSC were given the ability to opt-out of the inclusion of AOCI in regulatory capital, and CSC made this opt-out election as of January 1, 2020.
(2) Under the Basel III capital rule, CSC and CSB are also required to maintain a capital conservation buffer and, beginning in 2019, a countercyclical capital buffer above the regulatory minimum risk-based capital ratios. The capital conservation buffer became 2.5% on January 1, 2019 (1.875% at December 31, 2018). At December 31, 2019, the countercyclical capital buffer was zero. If either buffer falls below the minimum requirement, the Company would be subject to limits on capital distributions and discretionary bonus payments to executive officers. At December 31, 2019, the minimum capital requirement plus capital conservation buffer and countercyclical capital buffer for Common Equity Tier 1 Risk-Based Capital, Tier 1 Risk-Based Capital, and Total Risk-Based Capital ratios were 7.0%, 8.5%, and 10.5%, respectively.
N/A Not applicable.
Based on its regulatory capital ratios at December 31, 2019, CSB is considered well capitalized (the highest category) under its respective regulatory capital rules. There are no conditions or events since December 31, 2019 that management believes have changed CSB’s capital category.
The Federal Reserve requires CSB to maintain reserve balances at the Federal Reserve based on its deposits that are considered to be transaction accounts. CSB’s average reserve requirement was $1.5 billion and $1.6 billion in 2019 and 2018, respectively. In late 2017, Schwab acquired a federal savings bank charter which is now called Charles Schwab Premier Bank (CSPB). In 2018, the Company established Charles Schwab Trust Bank (Trust Bank) as a Nevada state-chartered savings bank to provide certain trust and custody services. At December 31, 2019, the balance sheets of CSPB and Trust Bank consisted primarily of investment securities, and the entities held total assets of $14.3 billion and $6.1 billion, respectively. Based on their regulatory capital ratios, at December 31, 2019, CSPB and Trust Bank are considered well capitalized under their respective regulatory capital rules.
- 105 -
THE CHARLES SCHWAB CORPORATION
Notes to Consolidated Financial Statements
(Tabular Amounts in Millions, Except Per Share Data, Option Price Amounts, Ratios, or as Noted)
CS&Co, a securities broker-dealer, is subject to the Uniform Net Capital Rule. CS&Co computes its net capital under the alternative method permitted by the Uniform Net Capital Rule. This method requires the maintenance of minimum net capital, as defined, of the greater of 2% of aggregate debit balances arising from client transactions or a minimum dollar requirement of $250,000, which is based on the type of business conducted by the broker-dealer. Under the alternative method, a broker-dealer may not repay subordinated borrowings, pay cash dividends, or make any unsecured advances or loans if such payment would result in a net capital amount of less than 5% of aggregate debit balances or less than 120% of its minimum dollar requirement.
Net capital and net capital requirements for CS&Co are as follows:
December 31, | 2019 | 2018 | |||||
Net capital | $ | $ | |||||
Minimum net capital required | |||||||
2% of aggregate debit balances | |||||||
Net capital in excess of required net capital | $ | $ | |||||
Pursuant to the SEC’s Customer Protection Rule and other applicable regulations, Schwab had cash and investments segregated for the exclusive benefit of clients at December 31, 2019. Amounts included in cash and investments segregated and on deposit for regulatory purposes represent actual balances on deposit, whereas cash and investments required to be segregated and on deposit for regulatory purposes at December 31, 2019 for CS&Co totaled $23.0 billion. As of January 3, 2020, CS&Co had deposited $3.1 billion of cash and qualified securities into its segregated reserve accounts. Cash and investments required to be segregated and on deposit for regulatory purposes at December 31, 2018 for CS&Co totaled $16.7 billion. As of January 3, 2019, CS&Co had deposited $3.7 billion of cash and qualified securities into its segregated reserve accounts. Cash and cash equivalents included in cash and investments segregated and on deposit for regulatory purposes are presented as part of Schwab’s cash balances in the consolidated statements of cash flows.
22. | Segment Information |
Schwab’s two reportable segments are Investor Services and Advisor Services. Schwab structures the operating segments according to its clients and the services provided to those clients. The Investor Services segment provides retail brokerage and banking services to individual investors, and retirement plan services, as well as other corporate brokerage services, to businesses and their employees. The Advisor Services segment provides custodial, trading, banking, and support services, as well as retirement business services, to independent RIAs, independent retirement advisors, and recordkeepers. Revenues and expenses are attributed to the two segments based on which segment services the client.
The accounting policies of the segments are the same as those described in Note 2. For the computation of its segment information, Schwab utilizes an activity-based costing model to allocate traditional income statement line item expenses (e.g., compensation and benefits, depreciation and amortization, and professional services) to the business activities driving segment expenses (e.g., client service, opening new accounts, or business development) and a funds transfer pricing methodology to allocate certain revenues.
Management evaluates the performance of its segments on a pre-tax basis. Segment assets and liabilities are not used for evaluating segment performance or in deciding how to allocate resources to segments. There are no revenues from transactions between the segments.
- 106 -
THE CHARLES SCHWAB CORPORATION
Notes to Consolidated Financial Statements
(Tabular Amounts in Millions, Except Per Share Data, Option Price Amounts, Ratios, or as Noted)
Financial information for the segments is presented in the following table:
Investor Services | Advisor Services | Total | |||||||||||||||||||||||||||||||||
Year Ended December 31, | 2019 | 2018 | 2017 | 2019 | 2018 | 2017 | 2019 | 2018 | 2017 | ||||||||||||||||||||||||||
Net Revenues | |||||||||||||||||||||||||||||||||||
Net interest revenue | $ | $ | $ | $ | $ | $ | $ | $ | $ | ||||||||||||||||||||||||||
Asset management and administration fees | |||||||||||||||||||||||||||||||||||
Trading revenue | |||||||||||||||||||||||||||||||||||
Other | |||||||||||||||||||||||||||||||||||
Total net revenues | |||||||||||||||||||||||||||||||||||
Expenses Excluding Interest | |||||||||||||||||||||||||||||||||||
Income before taxes on income | $ | $ | $ | $ | $ | $ | $ | $ | $ | ||||||||||||||||||||||||||
Capital expenditures | $ | $ | $ | $ | $ | $ | $ | $ | $ | ||||||||||||||||||||||||||
Depreciation and amortization | $ | $ | $ | $ | $ | $ | $ | $ | $ | ||||||||||||||||||||||||||
23. | The Charles Schwab Corporation – Parent Company Only Financial Statements |
Condensed Statements of Income
Year Ended December 31, | 2019 | 2018 | 2017 | ||||||||
Interest revenue | $ | $ | $ | ||||||||
Interest expense | ( | ) | ( | ) | ( | ) | |||||
Net interest expense | ( | ) | ( | ) | ( | ) | |||||
Other revenue | ( | ) | |||||||||
Expenses Excluding Interest: | |||||||||||
Professional services | ( | ) | ( | ) | ( | ) | |||||
Other expenses excluding interest | ( | ) | ( | ) | ( | ) | |||||
Loss before income tax benefit and equity in net income of subsidiaries | ( | ) | ( | ) | ( | ) | |||||
Income tax benefit/(expense) | ( | ) | |||||||||
Loss before equity in net income of subsidiaries | ( | ) | ( | ) | ( | ) | |||||
Equity in net income of subsidiaries: | |||||||||||
Equity in undistributed net income/(distributions in excess of net income) of subsidiaries | ( | ) | |||||||||
Dividends from bank subsidiaries | |||||||||||
Dividends from non-bank subsidiaries | |||||||||||
Net Income | |||||||||||
Preferred stock dividends and other (1) | |||||||||||
Net Income Available to Common Stockholders | $ | $ | $ | ||||||||
(1) Includes preferred stock dividends and undistributed earnings and dividends allocated to non-vested restricted stock units.
- 107 -
THE CHARLES SCHWAB CORPORATION
Notes to Consolidated Financial Statements
(Tabular Amounts in Millions, Except Per Share Data, Option Price Amounts, Ratios, or as Noted)
Condensed Balance Sheets
December 31, | 2019 | 2018 | |||||
Assets | |||||||
Cash and cash equivalents | $ | $ | |||||
Receivables from subsidiaries | |||||||
Available for sale securities | |||||||
Held to maturity securities | |||||||
Loans to non-bank subsidiaries | |||||||
Investment in non-bank subsidiaries | |||||||
Investment in bank subsidiaries | |||||||
Other assets | |||||||
Total assets | $ | $ | |||||
Liabilities and Stockholders’ Equity | |||||||
Accrued expenses and other liabilities | $ | $ | |||||
Payables to subsidiaries | |||||||
Long-term debt | |||||||
Total liabilities | |||||||
Stockholders’ equity | |||||||
Total liabilities and stockholders’ equity | $ | $ | |||||
- 108 -
THE CHARLES SCHWAB CORPORATION
Notes to Consolidated Financial Statements
(Tabular Amounts in Millions, Except Per Share Data, Option Price Amounts, Ratios, or as Noted)
Condensed Statements of Cash Flows
Year Ended December 31, | 2019 | 2018 | 2017 | ||||||||
Cash Flows from Operating Activities | |||||||||||
Net income | $ | $ | $ | ||||||||
Adjustments to reconcile net income to net cash provided by (used for) operating activities: | |||||||||||
Dividends in excess of (equity in undistributed) earnings of subsidiaries | ( | ) | ( | ) | |||||||
Other | |||||||||||
Net change in: | |||||||||||
Other assets | ( | ) | ( | ) | |||||||
Accrued expenses and other liabilities | |||||||||||
Net cash provided by (used for) operating activities | |||||||||||
Cash Flows from Investing Activities | |||||||||||
Due from (to) subsidiaries — net | ( | ) | ( | ) | |||||||
Increase in investments in subsidiaries | ( | ) | ( | ) | ( | ) | |||||
Repayments (Advances) of subordinated loan to CS&Co | ( | ) | |||||||||
Purchases of available for sale securities | ( | ) | ( | ) | ( | ) | |||||
Proceeds from sales of available for sale securities | |||||||||||
Principal payments on available for sale securities | |||||||||||
Other investing activities | ( | ) | ( | ) | |||||||
Net cash provided by (used for) investing activities | ( | ) | ( | ) | ( | ) | |||||
Cash Flows from Financing Activities | |||||||||||
Issuance of long-term debt | |||||||||||
Repayment of long-term debt | ( | ) | ( | ) | |||||||
Repurchases of common stock | ( | ) | ( | ) | |||||||
Net proceeds from preferred stock offerings | |||||||||||
Redemption of preferred stock | ( | ) | |||||||||
Dividends paid | ( | ) | ( | ) | ( | ) | |||||
Proceeds from stock options exercised and other | |||||||||||
Net cash provided by (used for) financing activities | ( | ) | |||||||||
Increase (Decrease) in Cash and Cash Equivalents | ( | ) | |||||||||
Cash and Cash Equivalents at Beginning of Year | |||||||||||
Cash and Cash Equivalents at End of Year | $ | $ | $ | ||||||||
- 109 -
THE CHARLES SCHWAB CORPORATION
Notes to Consolidated Financial Statements
(Tabular Amounts in Millions, Except Per Share Data, Option Price Amounts, Ratios, or as Noted)
24. Quarterly Financial Information (Unaudited)
Fourth Quarter | Third Quarter | Second Quarter | First Quarter | ||||||||||||
Year Ended December 31, 2019: | |||||||||||||||
Total net revenues | $ | $ | $ | $ | |||||||||||
Total expenses excluding interest | $ | $ | $ | $ | |||||||||||
Net income | $ | $ | $ | $ | |||||||||||
Net income available to common stockholders | $ | $ | $ | $ | |||||||||||
Weighted-average common shares outstanding — Basic | |||||||||||||||
Weighted-average common shares outstanding — Diluted | |||||||||||||||
Earnings per common share — Basic | $ | $ | $ | $ | |||||||||||
Earnings per common share — Diluted | $ | $ | $ | $ | |||||||||||
Dividends declared per common share | $ | $ | $ | $ | |||||||||||
Year Ended December 31, 2018: | |||||||||||||||
Total net revenues | $ | $ | $ | $ | |||||||||||
Total expenses excluding interest | $ | $ | $ | $ | |||||||||||
Net income | $ | $ | $ | $ | |||||||||||
Net income available to common stockholders | $ | $ | $ | $ | |||||||||||
Weighted-average common shares outstanding — Basic | |||||||||||||||
Weighted-average common shares outstanding — Diluted | |||||||||||||||
Earnings per common share — Basic | $ | $ | $ | $ | |||||||||||
Earnings per common share — Diluted | $ | $ | $ | $ | |||||||||||
Dividends declared per common share | $ | $ | $ | $ | |||||||||||
25. Subsequent Events
- 110 -
REPORT OF INDEPENDENT REGISTERED PUBLIC ACCOUNTING FIRM
To the Stockholders and the Board of Directors of The Charles Schwab Corporation:
Opinions on the Financial Statements and Internal Control over Financial Reporting
We have audited the accompanying consolidated balance sheets of The Charles Schwab Corporation and subsidiaries (the "Company") as of December 31, 2019 and 2018, the related consolidated statements of income, comprehensive income, stockholders' equity, and cash flows, for each of the three years in the period ended December 31, 2019, and the related notes (collectively referred to as the "financial statements"). We also have audited the Company’s internal control over financial reporting as of December 31, 2019, based on criteria established in Internal Control – Integrated Framework (2013) issued by the Committee of Sponsoring Organizations of the Treadway Commission (COSO).
In our opinion, the financial statements referred to above present fairly, in all material respects, the financial position of the Company as of December 31, 2019 and 2018, and the results of its operations and its cash flows for each of the three years in the period ended December 31, 2019, in conformity with accounting principles generally accepted in the United States of America. Also, in our opinion, the Company maintained, in all material respects, effective internal control over financial reporting as of December 31, 2019, based on criteria established in Internal Control – Integrated Framework (2013) issued by COSO.
Basis for Opinions
The Company’s management is responsible for these financial statements, for maintaining effective internal control over financial reporting, and for its assessment of the effectiveness of internal control over financial reporting included in the accompanying Management's Report on Internal Control over Financial Reporting. Our responsibility is to express an opinion on these financial statements and an opinion on the Company’s internal control over financial reporting based on our audits. We are a public accounting firm registered with the Public Company Accounting Oversight Board (United States) (PCAOB) and are required to be independent with respect to the Company in accordance with the U.S. federal securities laws and the applicable rules and regulations of the Securities and Exchange Commission and the PCAOB.
We conducted our audits in accordance with the standards of the PCAOB. Those standards require that we plan and perform the audits to obtain reasonable assurance about whether the financial statements are free of material misstatement, whether due to error or fraud, and whether effective internal control over financial reporting was maintained in all material respects.
Our audits of the financial statements included performing procedures to assess the risks of material misstatement of the financial statements, whether due to error or fraud, and performing procedures to respond to those risks. Such procedures included examining, on a test basis, evidence regarding the amounts and disclosures in the financial statements. Our audits also included evaluating the accounting principles used and significant estimates made by management, as well as evaluating the overall presentation of the financial statements. Our audit of internal control over financial reporting included obtaining an understanding of internal control over financial reporting, assessing the risk that a material weakness exists, and testing and evaluating the design and operating effectiveness of internal control based on the assessed risk. Our audits also included performing such other procedures as we considered necessary in the circumstances. We believe that our audits provide a reasonable basis for our opinions.
Definition and Limitations of Internal Control over Financial Reporting
A company’s internal control over financial reporting is a process designed to provide reasonable assurance regarding the reliability of financial reporting and the preparation of financial statements for external purposes in accordance with generally accepted accounting principles. A company’s internal control over financial reporting includes those policies and procedures that (1) pertain to the maintenance of records that, in reasonable detail, accurately and fairly reflect the transactions and dispositions of the assets of the company; (2) provide reasonable assurance that transactions are recorded as necessary to permit preparation of financial statements in accordance with generally accepted accounting principles, and that receipts and expenditures of the company are being made only in accordance with authorizations of management and directors of the company; and (3) provide reasonable assurance regarding prevention or timely detection of unauthorized acquisition, use, or disposition of the company’s assets that could have a material effect on the financial statements.
Because of its inherent limitations, internal control over financial reporting may not prevent or detect misstatements. Also, projections of any evaluation of effectiveness to future periods are subject to the risk that controls may become inadequate because of changes in conditions, or that the degree of compliance with the policies or procedures may deteriorate.
- 111 -
Critical Audit Matter
The critical audit matter communicated below is a matter arising from the current-period audit of the financial statements that was communicated or required to be communicated to the audit committee and that (1) relates to accounts or disclosures that are material to the financial statements and (2) involved our especially challenging, subjective, or complex judgments. The communication of critical audit matters does not alter in any way our opinion on the financial statements, taken as a whole, and we are not, by communicating the critical audit matter below, providing a separate opinion on the critical audit matter or on the accounts or disclosures to which it relates.
Asset Management and Administration Fees and Trading Revenue – Refer to Note 3 to the financial statements
Critical Audit Matter Description
Revenues from asset management and administrative fees (AMAF) are generated through proprietary, third-party mutual fund and exchange-traded funds (ETFs) offerings, as well as fee-based advisory solutions. Trading revenue is generated through commissions earned for executing trades for clients in individual equities, options, fixed income securities, and certain third-party mutual funds and ETFs. Both AMAF and trading revenue is made up of a significant volume of low-dollar transactions, and uses automated systems to process and record revenue from these transactions based on underlying information sourced from multiple systems. The processing and recording of revenue is highly automated and is based on contractual terms with individual investors, mutual funds and investment advisors. As of December 31, 2019, total net revenue was $10.7 billion, of which $3.8 billion is AMAF and trading revenue.
Given that the Company’s process to record revenue is highly automated and involves multiple systems, auditing these revenue streams was complex and challenging due to the extent of audit effort required and involvement of professionals with expertise in information technology (IT) which was necessary for us to identify, test, and evaluate the Company’s systems.
How the Critical Audit Matter Was Addressed in the Audit
Our audit procedures related to the Company’s systems to process the AMAF and trading revenue transactions included the following, among others:
• | With the assistance of our IT specialists, we: |
◦ | Identified the significant systems used to process revenue transactions and, using a risk-based approach, tested the relevant general IT controls over each of these systems. |
◦ | Performed testing of automated business controls and system interface controls (including batch processing) within the relevant revenue streams, as well as the controls designed to ensure the accuracy and completeness of revenue. |
• | We tested internal controls within the relevant revenue business processes, including those in place to reconcile the various systems to the Company’s general ledger. |
• | We performed testing of controls addressing the accuracy and completeness of reports used in the performance of controls. |
• | With the assistance of our data specialists, we created data visualizations to evaluate recorded revenue and evaluate trends in the revenue data. |
• | For a sample of transactions, we performed detail transaction testing by testing the mathematical accuracy of the recorded revenue and agreeing inputs to the calculation to contractual agreements. |
• | We tested the amount of client assets by obtaining quoted market prices and reconciling total positions to third-party statements. |
/s/ DELOITTE & TOUCHE LLP | |
February 26, 2020
We have served as the Company's auditor since 1976.
- 112 -
THE CHARLES SCHWAB CORPORATION
Management’s Report on Internal Control Over Financial Reporting
Management of The Charles Schwab Corporation, together with its subsidiaries (the Company), is responsible for establishing and maintaining adequate internal control over financial reporting. The Company’s internal control over financial reporting is a process designed under the supervision of and effected by the Company’s chief executive officer and chief financial officer to provide reasonable assurance regarding the reliability of financial reporting and the preparation of published financial statements in accordance with accounting principles generally accepted in the United States of America.
As of December 31, 2019, management conducted an assessment of the effectiveness of the Company’s internal control over financial reporting based on the framework established in Internal Control – Integrated Framework (2013) issued by the Committee of Sponsoring Organizations of the Treadway Commission. Based on this assessment, management has determined that the Company’s internal control over financial reporting was effective as of December 31, 2019.
The Company’s internal control over financial reporting includes policies and procedures that pertain to the maintenance of records that, in reasonable detail, accurately and fairly reflect transactions and dispositions of assets; provide reasonable assurance that transactions are recorded as necessary to permit preparation of financial statements in accordance with accounting principles generally accepted in the United States of America, and that receipts and expenditures are being made only in accordance with authorizations of management and the directors of the Company; and provide reasonable assurance regarding prevention or timely detection of unauthorized acquisition, use or disposition of the Company’s assets that could have a material effect on the Company’s financial statements.
The Company’s internal control over financial reporting as of December 31, 2019, has been audited by Deloitte & Touche LLP, an independent registered public accounting firm, as stated in their report appearing on the previous page.
- 113 -
THE CHARLES SCHWAB CORPORATION
Item 9. Changes in and Disagreements With Accountants on Accounting and Financial Disclosure
None.
Item 9A. Controls and Procedures
Evaluation of disclosure controls and procedures: The management of the Company, with the participation of the Company’s Chief Executive Officer and Chief Financial Officer, has evaluated the effectiveness of the Company’s disclosure controls and procedures (as defined in Rule 13a-15(e) under the Securities Exchange Act of 1934) as of December 31, 2019. Based on this evaluation, the Company’s Chief Executive Officer and Chief Financial Officer have concluded that the Company’s disclosure controls and procedures were effective as of December 31, 2019.
Changes in internal control over financial reporting: No change in the Company’s internal control over financial reporting (as defined in Rule 13a-15(f) under the Securities Exchange Act of 1934) was identified during the quarter ended December 31, 2019, that has materially affected, or is reasonably likely to materially affect, the Company’s internal control over financial reporting.
Management’s Report on Internal Control Over Financial Reporting and the Report of Independent Registered Public Accounting Firm are included in Item 8.
Item 9B. Other Information
None.
PART III
Item 10. | Directors, Executive Officers, and Corporate Governance |
The information relating to directors of CSC required to be furnished pursuant to this item is incorporated by reference from portions of the Company’s definitive proxy statement for its annual meeting of stockholders to be filed with the SEC pursuant to Regulation 14A by April 30, 2020 (the Proxy Statement) under “Members of the Board of Directors,” “Board Structure and Committees,” and “Director Nominations.” The Company’s Code of Conduct and Business Ethics, applicable to directors and all employees, including senior financial officers, is available on the Company’s website at https://www.aboutschwab.com/governance. If the Company makes any amendments to or grants any waivers from its Code of Conduct and Business Ethics, which are required to be disclosed pursuant to the Securities Exchange Act of 1934, the Company will make such disclosures on this website.
- 114 -
THE CHARLES SCHWAB CORPORATION
Schwab Executive Officers of the Registrant
The following table provides certain information about each of the Company’s executive officers as of December 31, 2019.
Executive Officers of the Registrant | |||
Name | Age | Title | |
Charles R. Schwab | 82 | Chairman of the Board | |
Walter W. Bettinger II | 59 | President and Chief Executive Officer | |
Bernard J. Clark | 61 | Executive Vice President – Advisor Services | |
Jonathan M. Craig | 48 | Senior Executive Vice President | |
Peter B. Crawford | 51 | Executive Vice President and Chief Financial Officer | |
Joseph R. Martinetto | 57 | Senior Executive Vice President and Chief Operating Officer | |
Peter J. Morgan III | 55 | Executive Vice President, General Counsel and Corporate Secretary | |
Nigel J. Murtagh | 56 | Executive Vice President – Corporate Risk | |
Mr. Schwab has been Chairman of the Board and a director of CSC since its incorporation in 1986. He also served as Chief Executive Officer of CSC from 1986 to 1997 and as Co-Chief Executive Officer from 1998 until 2003. He was re-appointed Chief Executive Officer in 2004 and served in that role until 2008. He served as Chairman of the Board and a director of CS&Co until 2018. Mr. Schwab is also Chairman of CSB.
Mr. Bettinger has been President and Chief Executive Officer of CSC since 2008. He serves on the Board of Directors of CSC and CSB, and is Chairman of CS&Co, as well as Chairman and trustee of The Charles Schwab Family of Funds, Schwab Investments, Schwab Capital Trust, Schwab Annuity Portfolios, Laudus Trust, and Schwab Strategic Trust, all registered investment companies and affiliates of CSC. Mr. Bettinger served as President and Chief Operating Officer of CSC from 2007 until 2008 and as Executive Vice President and President – Schwab Investor Services of CSC and CS&Co from 2005 to 2007. Mr. Bettinger joined Schwab in 1995.
Mr. Clark has been Executive Vice President – Advisor Services of CSC since 2012. Mr. Clark has served as Executive Vice President – Advisor Services of CS&Co since 2010. From 2006 until 2010, Mr. Clark served as Senior Vice President – Schwab Institutional Sales of CS&Co. Mr. Clark joined Schwab in 1998.
Mr. Craig has been Senior Executive Vice President of CSC and CS&Co since 2018. He served as Executive Vice President – Client and Marketing Solutions for CSC from 2017 until 2018 and served as Executive Vice President and Chief Marketing Officer of CS&Co from 2012 until 2018. Mr. Craig joined Schwab in 2000.
Mr. Crawford has been Executive Vice President and Chief Financial Officer of CSC and CS&Co since 2017. Prior to his appointment as Chief Financial Officer, Mr. Crawford was Executive Vice President of Finance from 2015 to 2017. He served as Senior Vice President of Schwab’s asset management and client solutions organization from 2008 to 2015. He has served on the Board of Directors of CS&Co since 2018. Mr. Crawford joined Schwab in 2001.
Mr. Martinetto has been Senior Executive Vice President of CSC and CS&Co since 2015, and Chief Operating Officer of CSC and CS&Co since 2018. He served as Chief Financial Officer of CSC and CS&Co from 2007 until 2017, and Executive Vice President of CSC and CS&Co from 2007 until 2015. He also serves on the Board of Directors of CS&Co and CSB. Additionally, Mr. Martinetto is a trustee of The Charles Schwab Family of Funds, Schwab Investments, Schwab Capital Trust, Schwab Annuity Portfolios, Laudus Trust, and Schwab Strategic Trust. Mr. Martinetto joined Schwab in 1997.
Mr. Morgan was appointed Executive Vice President, General Counsel and Corporate Secretary of CSC in October 2019. He served as Acting Head of Legal Services for CSC from April 2019 to October 2019. Mr. Morgan served as Senior Vice President and Deputy General Counsel of CS&Co from 2009. He was appointed Executive Vice President and General Counsel of CSB in December 2019, served as Senior Vice President and General Counsel of CSB in 2015, and served as General Counsel of CSB from 2009. Mr. Morgan joined Schwab in 1999.
Mr. Murtagh has been Executive Vice President – Corporate Risk and Chief Risk Officer since 2012. He served as Senior Vice President and Chief Credit Officer of CS&Co from 2002 until 2012 and of CSC from 2008 until 2012 when he was also Head of Fixed Income Research for Charles Schwab Investment Management. Mr. Murtagh joined Schwab in 2000.
- 115 -
THE CHARLES SCHWAB CORPORATION
Item 11. | Executive Compensation |
The information required to be furnished pursuant to this item is incorporated by reference from portions of the Proxy Statement under “Compensation Discussion and Analysis,” “Executive Compensation Tables – 2019 Summary Compensation Table,” “Executive Compensation Tables – 2019 Grants of Plan-Based Awards Table,” “Executive Compensation Tables – Narrative to Summary Compensation and Grants of Plan-Based Awards Tables,” “Executive Compensation Tables – 2019 Termination and Change in Control Benefits Table,” “Executive Compensation Tables – Outstanding Equity Awards as of December 31, 2019,” “Executive Compensation Tables – 2019 Option Exercises and Stock Vested Table,” “Executive Compensation Tables – 2019 Nonqualified Deferred Compensation Table,” “Director Compensation,” and “Compensation Committee Interlocks and Insider Participation.” In addition, the information from a portion of the Proxy Statement under “Compensation Committee Report,” is incorporated by reference from the Proxy Statement and furnished on this Form 10-K, and shall not be deemed “filed” for purposes of Section 18 of the Securities Exchange Act of 1934, nor shall it be deemed incorporated by reference in any filing under the Securities Act of 1933.
Item 12. | Security Ownership of Certain Beneficial Owners and Management and Related Stockholder Matters |
The information required to be furnished pursuant to this item is incorporated by reference from portions of the Proxy Statement under “Security Ownership of Certain Beneficial Owners and Management,” and “Securities Authorized for Issuance under Equity Compensation Plans.”
Item 13. | Certain Relationships and Related Transactions, and Director Independence |
The information required to be furnished pursuant to this item is incorporated by reference from portions of the Proxy Statement under “Transactions with Related Persons” and “Director Independence.”
Item 14. | Principal Accountant Fees and Services |
The information required to be furnished pursuant to this item is incorporated by reference from a portion of the Proxy Statement under “Auditor Fees.”
- 116 -
THE CHARLES SCHWAB CORPORATION
PART IV
Item 15. | Exhibits, Financial Statement Schedules |
(a) Documents filed as part of this Report
1. Financial Statements
The financial statements and independent auditors’ report are included in Item 8 and are listed below:
Consolidated Statements of Income
Consolidated Statements of Comprehensive Income
Consolidated Balance Sheets
Consolidated Statements of Stockholders’ Equity
Consolidated Statements of Cash Flows
Notes to Consolidated Financial Statements
Report of Independent Registered Public Accounting Firm
2. Financial Statement Schedules
Other financial statement schedules required pursuant to this Item are omitted because of the absence of conditions under which they are required or because the information is included in the Company’s consolidated financial statements and notes in Item 8.
- 117 -
THE CHARLES SCHWAB CORPORATION
(b) Exhibits
The exhibits listed below are filed as part of this annual report on Form 10-K.
Exhibit Number | Exhibit | |
2.1 | ||
3.11 | ||
3.14 | ||
3.15 | ||
3.17 | ||
3.18 | ||
3.19 | ||
3.20 | ||
4.2 | ||
4.3 | ||
4.4 | ||
4.5 | ||
4.6 | (1) | |
4.7 | Neither the Registrant nor its subsidiaries are parties to any instrument with respect to long-term debt for which securities authorized thereunder exceed 10% of the total assets of the Registrant and its subsidiaries on a consolidated basis. Copies of instruments with respect to long-term debt of lesser amounts will be provided to the SEC upon request. | |
10.4 | Form of Release Agreement dated as of March 31, 1987 among BAC, Registrant, Schwab Holdings, Inc., Charles Schwab & Co., Inc., and former shareholders of Schwab Holdings, Inc., filed as the identically-numbered exhibit to Registrant’s Registration Statement No. 33-16192 on Form S-1 and incorporated herein by reference. | |
- 118 -
THE CHARLES SCHWAB CORPORATION
Exhibit Number | Exhibit | |
10.57 | Registration Rights and Stock Restriction Agreement, dated as of March 31, 1987, between the Registrant and the holders of the Common Stock, filed as Exhibit 4.23 to Registrant’s Registration Statement No. 33-16192 on Form S-1 and incorporated herein by reference. | |
10.72 | ||
10.271 | (2) | |
10.272 | (2) | |
10.314 | (2) | |
10.338 | (2) | |
10.349 | (2) | |
10.362 | (2) | |
10.381 | (2) | |
10.382 | (2) | |
10.383 | (2) | |
10.384 | (2) | |
10.385 | (2) | |
10.386 | (2) | |
10.389 | (2) | |
10.390 | (2) | |
10.391 | (2) | |
- 119 -
THE CHARLES SCHWAB CORPORATION
Exhibit Number | Exhibit | |
10.392 | ||
10.393 | (2) | |
10.394 | (2) | |
10.395 | ||
10.396 | (2) | |
10.397 | (2) | |
10.398 | (2) | |
10.399 | (2) | |
10.401 | (2) | |
10.402 | (2) | |
10.403 | (2) | |
10.404 | (2) | |
10.405 | ||
10.406 | ||
10.407 | ||
- 120 -
THE CHARLES SCHWAB CORPORATION
Exhibit Number | Exhibit | |
10.408 | (1),(2) | |
10.409 | (1),(2) | |
21.1 | ||
23.1 | ||
31.1 | ||
31.2 | ||
32.1 | (1) | |
32.2 | (1) | |
101.INS | XBRL Instance Document | (3) |
101.SCH | XBRL Taxonomy Extension Schema | (3) |
101.CAL | XBRL Taxonomy Extension Calculation | (3) |
101.DEF | XBRL Extension Definition | (3) |
101.LAB | XBRL Taxonomy Extension Label | (3) |
101.PRE | XBRL Taxonomy Extension Presentation | (3) |
104 | Cover Page Interactive Data File (formatted as Inline XBRL and contained in Exhibit 101) | |
(1) | Furnished as an exhibit to this annual report on Form 10-K. | |
(2) | Management contract or compensatory plan. | |
(3) | Attached as Exhibit 101 to this Annual Report on Form 10-K for the annual period ended December 31, 2019, are the following materials formatted in XBRL (Extensible Business Reporting Language) (i) the Consolidated Statements of Income, (ii) the Consolidated Statements of Comprehensive Income, (iii) the Consolidated Balance Sheets, (iv) the Consolidated Statements of Cash Flows, (v) the Consolidated Statements of Stockholders’ Equity, and (vi) Notes to Consolidated Financial Statements. | |
* The schedules have been omitted pursuant to Item 601(b)(2) of Regulation S-K. Schwab agrees to furnish supplementally a copy of such schedules and exhibits, or any section thereof, to the SEC upon request.
** Certain confidential information contained in this agreement has been omitted because it is not material and would be competitively harmful if publicly disclosed.
- 121 -
THE CHARLES SCHWAB CORPORATION
Item 16. | Form 10-K Summary |
None.
- 122 -
THE CHARLES SCHWAB CORPORATION
SIGNATURES
Pursuant to the requirements of Section 13 or 15(d) of the Securities Exchange Act of 1934, the registrant has duly caused this report to be signed on its behalf by the undersigned, thereunto duly authorized, on February 26, 2020.
THE CHARLES SCHWAB CORPORATION | ||
(Registrant) | ||
BY: | /s/ Walter W. Bettinger II | |
Walter W. Bettinger II | ||
President and Chief Executive Officer | ||
Pursuant to the requirements of the Securities Exchange Act of 1934, this report has been signed below by the following persons on behalf of the registrant and in the capacities indicated, on February 26, 2020.
Signature / Title | Signature / Title | |
/s/ Walter W. Bettinger II | /s/ Peter Crawford | |
Walter W. Bettinger II, | Peter Crawford, | |
President and Chief Executive Officer and Director | Executive Vice President and Chief Financial Officer (principal financial and accounting officer) | |
/s/ Charles R. Schwab | /s/ John K. Adams, Jr. | |
Charles R. Schwab, Chairman of the Board | John K. Adams, Jr., Director | |
/s/ Joan T. Dea | /s/ Christopher V. Dodds | |
Joan T. Dea, Director | Christopher V. Dodds, Director | |
/s/ Stephen A. Ellis | /s/ Mark A. Goldfarb | |
Stephen A. Ellis, Director | Mark A. Goldfarb, Director | |
/s/ William S. Haraf | /s/ Frank C. Herringer | |
William S. Haraf, Director | Frank C. Herringer, Director | |
/s/ Stephen T. McLin | /s/ Charles A. Ruffel | |
Stephen T. McLin, Director | Charles A. Ruffel, Director | |
/s/ Arun Sarin | /s/ Paula A. Sneed | |
Arun Sarin, Director | Paula A. Sneed, Director | |
/s/ Roger O. Walther | ||
Roger O. Walther, Director | ||
- 123 -
THE CHARLES SCHWAB CORPORATION
STATISTICAL DISCLOSURE BY BANK HOLDING COMPANIES | ||
The following table outlines the information required by the SEC’s Industry Guide 3, “Statistical Disclosure by Bank Holding Companies,” which is presented at the consolidated holding company level. | ||
Required Disclosure | Page | |
Distribution of Assets, Liabilities and Stockholders’ Equity; Interest Rates and Interest Differential | F-2 – F-3 | |
Investment Portfolio | F-4 | |
Risk Elements – Cross-border Holdings | F-4 | |
Loan Portfolio | F-5 | |
Summary of Loan Loss Experience | F-6 | |
Deposits | F-6 | |
Return on Equity and Assets | F-6 | |
F-1
THE CHARLES SCHWAB CORPORATION
Supplemental Financial Data (Unaudited)
(Dollars in Millions)
The following supplemental financial data is consistent with the Securities Exchange Act of 1934, Industry Guide 3 – Statistical Disclosure by Bank Holding Companies (Guide 3). Other information required by Guide 3 is presented throughout this Annual Report on Form 10-K.
1. | Three-year Net Interest Revenue and Average Balances |
For the Year Ended December 31, | 2019 | 2018 | 2017 | |||||||||||||||||||||||||||||
Average | Average | Average | Average | Average | Average | |||||||||||||||||||||||||||
Balance | Interest | Rate | Balance | Interest | Rate | Balance | Interest | Rate | ||||||||||||||||||||||||
Assets: | ||||||||||||||||||||||||||||||||
Cash and cash equivalents | $ | 23,512 | $ | 518 | 2.17 | % | $ | 17,783 | $ | 348 | 1.93 | % | $ | 9,931 | $ | 109 | 1.10 | % | ||||||||||||||
Cash and investments segregated | 15,694 | 345 | 2.17 | % | 11,461 | 206 | 1.78 | % | 18,525 | 166 | 0.90 | % | ||||||||||||||||||||
Broker-related receivables | 376 | 7 | 1.87 | % | 303 | 6 | 2.09 | % | 430 | 3 | 0.70 | % | ||||||||||||||||||||
Receivables from brokerage clients | 19,270 | 821 | 4.20 | % | 19,870 | 830 | 4.12 | % | 16,269 | 575 | 3.53 | % | ||||||||||||||||||||
Available for sale securities (1) | 58,181 | 1,560 | 2.67 | % | 54,542 | 1,241 | 2.26 | % | 53,040 | 815 | 1.54 | % | ||||||||||||||||||||
Held to maturity securities | 134,708 | 3,591 | 2.65 | % | 131,794 | 3,348 | 2.53 | % | 103,599 | 2,354 | 2.27 | % | ||||||||||||||||||||
Bank loans (2) | 16,832 | 584 | 3.47 | % | 16,554 | 559 | 3.37 | % | 15,919 | 472 | 2.97 | % | ||||||||||||||||||||
Total interest-earning assets | 268,573 | 7,426 | 2.75 | % | 252,307 | 6,538 | 2.57 | % | 217,713 | 4,494 | 2.06 | % | ||||||||||||||||||||
Other interest revenue | 154 | 142 | 130 | |||||||||||||||||||||||||||||
Total interest-earning assets | 268,573 | 7,580 | 2.80 | % | 252,307 | 6,680 | 2.63 | % | 217,713 | 4,624 | 2.12 | % | ||||||||||||||||||||
Non-interest-earning assets (3,4) | 11,183 | 11,681 | 9,968 | |||||||||||||||||||||||||||||
Total assets | $ | 279,756 | $ | 263,988 | $ | 227,681 | ||||||||||||||||||||||||||
Liabilities and Stockholders’ Equity: | ||||||||||||||||||||||||||||||||
Bank deposits | $ | 212,605 | $ | 700 | 0.33 | % | $ | 199,139 | $ | 545 | 0.27 | % | $ | 163,998 | $ | 148 | 0.09 | % | ||||||||||||||
Payables to brokerage clients | 24,353 | 79 | 0.33 | % | 21,178 | 56 | 0.27 | % | 25,403 | 16 | 0.06 | % | ||||||||||||||||||||
Short-term borrowings (5) | 17 | — | 2.36 | % | 3,359 | 54 | 1.59 | % | 3,503 | 41 | 1.17 | % | ||||||||||||||||||||
Long-term debt | 7,199 | 258 | 3.58 | % | 5,423 | 190 | 3.50 | % | 3,431 | 119 | 3.47 | % | ||||||||||||||||||||
Total interest-bearing liabilities | 244,174 | 1,037 | 0.42 | % | 229,099 | 845 | 0.37 | % | 196,335 | 324 | 0.17 | % | ||||||||||||||||||||
Other interest expense | 27 | 12 | 18 | |||||||||||||||||||||||||||||
Non-interest-bearing liabilities (3,6) | 14,170 | 14,883 | 13,787 | |||||||||||||||||||||||||||||
Total liabilities (7) | 258,344 | 1,064 | 0.39 | % | 243,982 | 857 | 0.34 | % | 210,122 | 342 | 0.15 | % | ||||||||||||||||||||
Stockholders’ equity (3) | 21,412 | 20,006 | 17,559 | |||||||||||||||||||||||||||||
Total liabilities and stockholders’ equity | $ | 279,756 | $ | 263,988 | $ | 227,681 | ||||||||||||||||||||||||||
Net interest revenue | $ | 6,516 | $ | 5,823 | $ | 4,282 | ||||||||||||||||||||||||||
Net yield on interest-earning assets | 2.41 | % | 2.29 | % | 1.97 | % | ||||||||||||||||||||||||||
(1) Amounts calculated based on amortized cost.
(2) Includes average principal balances of nonaccrual loans.
(3) Average balance calculation based on month end balances.
(4) Non-interest-earning assets include equipment, office facilities, and property – net, goodwill, and other assets that do not generate interest income.
(5) Interest revenue or expense was less than $500,000 in the period or periods presented.
(6) Non-interest-bearing liabilities consist of other liabilities that do not generate interest expense.
(7) Average rate calculation based on total funding sources.
F-2
THE CHARLES SCHWAB CORPORATION
Supplemental Financial Data (Unaudited)
(Dollars in Millions)
2. | Analysis of Change in Net Interest Revenue |
An analysis of the year-to-year changes in the categories of interest revenue and interest expense resulting from changes in volume and rate is as follows:
2019 Compared to 2018 Increase (Decrease) Due to Change in: | 2018 Compared to 2017 Increase (Decrease) Due to Change in: | ||||||||||||||||||||||
Average Volume | Average Rate | Total | Average Volume | Average Rate | Total | ||||||||||||||||||
Interest-earning assets: | |||||||||||||||||||||||
Cash and cash equivalents (1) | $ | 111 | $ | 59 | $ | 170 | $ | 86 | $ | 153 | $ | 239 | |||||||||||
Cash and investments segregated | 75 | 64 | 139 | (64 | ) | 104 | 40 | ||||||||||||||||
Broker-related receivables | 2 | (1 | ) | 1 | (1 | ) | 4 | 3 | |||||||||||||||
Receivables from brokerage clients | (25 | ) | 16 | (9 | ) | 127 | 128 | 255 | |||||||||||||||
Available for sale securities (2) | 82 | 237 | 319 | 23 | 403 | 426 | |||||||||||||||||
Held to maturity securities | 74 | 169 | 243 | 640 | 354 | 994 | |||||||||||||||||
Bank loans (3) | 9 | 16 | 25 | 19 | 68 | 87 | |||||||||||||||||
Other interest revenue | — | 12 | 12 | — | 12 | 12 | |||||||||||||||||
Total interest-earning assets | $ | 328 | $ | 572 | $ | 900 | $ | 830 | $ | 1,226 | $ | 2,056 | |||||||||||
Interest-bearing sources of funds: | |||||||||||||||||||||||
Bank deposits | $ | 36 | $ | 119 | $ | 155 | $ | 32 | $ | 365 | $ | 397 | |||||||||||
Payables to brokerage clients | 9 | 14 | 23 | (3 | ) | 43 | 40 | ||||||||||||||||
Short-term borrowings | (53 | ) | (1 | ) | (54 | ) | (2 | ) | 15 | 13 | |||||||||||||
Long-term debt | 62 | 6 | 68 | 69 | 2 | 71 | |||||||||||||||||
Other interest expense | — | 15 | 15 | — | (6 | ) | (6 | ) | |||||||||||||||
Total sources on which interest is paid | 54 | 153 | 207 | 96 | 419 | 515 | |||||||||||||||||
Change in net interest revenue | $ | 274 | $ | 419 | $ | 693 | $ | 734 | $ | 807 | $ | 1,541 | |||||||||||
Changes that are not due solely to volume or rate have been allocated to rate.
(1) Includes deposits with banks and short-term investments.
(2) Amounts have been calculated based on amortized cost.
(3) Includes average principal balances of nonaccrual loans.
F-3
THE CHARLES SCHWAB CORPORATION
Supplemental Financial Data (Unaudited)
(Dollars in Millions)
3. | Investment Securities |
The amortized cost, gross unrealized gains and losses, and fair value of AFS and HTM securities for 2017 are as follows:
December 31, 2017 | Amortized Cost | Gross Unrealized Gains | Gross Unrealized Losses | Fair Value | |||||||||||
Available for sale securities: | |||||||||||||||
U.S. agency mortgage-backed securities | $ | 20,915 | $ | 53 | $ | 39 | $ | 20,929 | |||||||
U.S. Treasury securities | 9,583 | — | 83 | 9,500 | |||||||||||
Asset-backed securities | 9,019 | 34 | 6 | 9,047 | |||||||||||
Corporate debt securities | 6,154 | 16 | 1 | 6,169 | |||||||||||
Certificates of deposit | 2,040 | 2 | 1 | 2,041 | |||||||||||
U.S. agency notes | 1,914 | — | 8 | 1,906 | |||||||||||
Commercial paper | 313 | — | — | 313 | |||||||||||
Foreign government agency securities | 51 | — | 1 | 50 | |||||||||||
Non-agency commercial mortgage-backed securities | 40 | — | — | 40 | |||||||||||
Total available for sale securities | $ | 50,029 | $ | 105 | $ | 139 | $ | 49,995 | |||||||
Held to maturity securities: | |||||||||||||||
U.S. agency mortgage-backed securities | $ | 101,197 | $ | 290 | $ | 1,034 | $ | 100,453 | |||||||
Asset-backed securities | 12,937 | 127 | 2 | 13,062 | |||||||||||
Corporate debt securities | 4,078 | 13 | 5 | 4,086 | |||||||||||
U.S. state and municipal securities | 1,247 | 57 | — | 1,304 | |||||||||||
Non-agency commercial mortgage-backed securities | 994 | 10 | 5 | 999 | |||||||||||
U.S. Treasury securities | 223 | — | 3 | 220 | |||||||||||
Certificates of deposit | 200 | — | — | 200 | |||||||||||
Foreign government agency securities | 50 | — | 1 | 49 | |||||||||||
Total held to maturity securities | $ | 120,926 | $ | 497 | $ | 1,050 | $ | 120,373 | |||||||
For additional information on 2019 and 2018 investment securities, see Item 8 – Note 5.
As of December 31, 2019, with exception of holdings of securities issued by the U.S. Government and U.S. Government agencies and corporations, the Company held no investment securities from single issuers with aggregate book values in excess of ten percent of stockholders’ equity.
4. | Cross-border Holdings |
The below information describes Schwab’s cross-border holdings, based on fair value, as of December 31, 2019, 2018, and 2017. Such holdings, by country, that exceed 0.75% of total assets are disclosed separately.
December 31, 2019 | Banks and other financial institutions | Commercial and industrial institutions | Total | Exposure as a % of total assets | |||||||||
Country: | |||||||||||||
France | $ | 3,103 | $ | — | $ | 3,103 | 1.1 | % | |||||
December 31, 2018 | Banks and other financial institutions | Commercial and industrial institutions | Total | Exposure as a % of total assets | |||||||||
Country: | |||||||||||||
France | $ | 2,793 | $ | — | $ | 2,793 | 0.9 | % | |||||
There were no cross-border holdings that exceeded 0.75% of total assets at December 31, 2017.
F-4
THE CHARLES SCHWAB CORPORATION
Supplemental Financial Data (Unaudited)
(Dollars in Millions)
5. | Bank Loans and Related Allowance for Loan Losses |
The composition of the loan portfolio is as follows:
December 31, | 2019 | 2018 | 2017 | 2016 | 2015 | ||||||||||||||
First Mortgages | $ | 11,704 | $ | 10,384 | $ | 10,016 | $ | 9,134 | $ | 8,334 | |||||||||
HELOCs | 1,117 | 1,505 | 1,943 | 2,350 | 2,735 | ||||||||||||||
Pledged asset lines | 5,206 | 4,561 | 4,369 | 3,851 | 3,232 | ||||||||||||||
Other | 203 | 180 | 176 | 94 | 64 | ||||||||||||||
Total bank loans | $ | 18,230 | $ | 16,630 | $ | 16,504 | $ | 15,429 | $ | 14,365 | |||||||||
An analysis of nonaccrual loans is as follows:
December 31, | 2019 | 2018 | 2017 | 2016 | 2015 | ||||||||||||||
Nonaccrual loans | $ | 22 | $ | 21 | $ | 28 | $ | 26 | $ | 28 | |||||||||
Average nonaccrual loans | $ | 21 | $ | 25 | $ | 27 | $ | 27 | $ | 30 | |||||||||
There were no loans accruing interest that were contractually 90 days or more past due as of any period presented.
Changes in the allowance for loan losses were as follows:
December 31, | 2019 | 2018 | 2017 | 2016 | 2015 | ||||||||||||||
Balance at beginning of year | $ | 21 | $ | 26 | $ | 26 | $ | 31 | $ | 42 | |||||||||
Charge-offs | — | (1 | ) | (3 | ) | (2 | ) | (3 | ) | ||||||||||
Recoveries | 2 | 2 | 3 | 2 | 3 | ||||||||||||||
Provision for loan losses | (5 | ) | (6 | ) | — | (5 | ) | (11 | ) | ||||||||||
Balance at end of year | $ | 18 | $ | 21 | $ | 26 | $ | 26 | $ | 31 | |||||||||
The maturities of the loan portfolio are as follows:
December 31, 2019 | Within 1 year | After 1 year through 5 years | After 5 years | Total | |||||||||||
First Mortgages (1) | $ | — | $ | 1 | $ | 11,703 | $ | 11,704 | |||||||
HELOCs (2) | 551 | 236 | 330 | 1,117 | |||||||||||
Pledged asset lines | 1,832 | 3,374 | — | 5,206 | |||||||||||
Other | 7 | 192 | 4 | 203 | |||||||||||
Total | $ | 2,390 | $ | 3,803 | $ | 12,037 | $ | 18,230 | |||||||
(1) Maturities are based upon the contractual terms of the loans.
(2) Maturities are based on an initial draw period of ten years.
The interest sensitivity of loans with contractual maturities in excess of one year is as follows:
December 31, 2019 | After 1 year | ||
Loans with floating or adjustable interest rates | $ | 14,546 | |
Loans with predetermined interest rates | 1,294 | ||
Total | $ | 15,840 | |
F-5
THE CHARLES SCHWAB CORPORATION
Supplemental Financial Data (Unaudited)
(Dollars in Millions)
6. | Summary of Loan Loss on Banking Loans Experience |
December 31, | 2019 | 2018 | 2017 | 2016 | 2015 | ||||||||||||||
Average loans | $ | 16,832 | $ | 16,554 | $ | 15,919 | $ | 14,715 | $ | 13,973 | |||||||||
Allowance to year end loans | .10 | % | .13 | % | .16 | % | .17 | % | .21 | % | |||||||||
Allowance to nonperforming loans | 82 | % | 100 | % | 93 | % | 101 | % | 110 | % | |||||||||
Nonperforming assets to average loans and real estate owned | .14 | % | .14 | % | .20 | % | .21 | % | .26 | % | |||||||||
7. | Bank Deposits |
The following table presents the average amount of and the average rate paid on deposit categories that are in excess of ten percent of average total deposits from banking clients:
December 31, | 2019 | 2018 | 2017 | ||||||||||||||
Amount | Rate | Amount | Rate | Amount | Rate | ||||||||||||
Analysis of average daily deposits: | |||||||||||||||||
Money market and other savings deposits | $ | 197,788 | 0.33 | % | $ | 184,039 | 0.28 | % | $ | 148,679 | 0.09 | % | |||||
At December 31, 2019, there were no certificates of deposit of $100,000 or more included in bank deposits.
8. | Ratios |
December 31, | 2019 | 2018 | 2017 | |||
Return on average total stockholders’ equity | 17.30 | % | 17.53 | % | 13.41 | % |
Return on average total assets | 1.32 | % | 1.33 | % | 1.03 | % |
Average total stockholders’ equity as a percentage of average total assets | 7.65 | % | 7.58 | % | 7.71 | % |
Dividend payout ratio (1) | 25.47 | % | 18.78 | % | 19.88 | % |
Note: Average balance calculations based on month end balances.
(1) | Dividends declared per common share divided by diluted EPS. |
F-6