Exhibit 99.1

News Release
Investor Contact: | Media Contact: | |
Andrew Hedberg (651) 250-2185 | Roman Blahoski (651) 250-4385 | |
Cairn Clark (651) 250-2291 | | |
ECOLAB SECOND QUARTER REPORTED DILUTED EPS $1.08
ADJUSTED DILUTED EPS $1.10
EXPECT IMPROVED SECOND HALF 2022 PERFORMANCE
SECOND QUARTER HIGHLIGHTS:
| ● | Reported sales $3.6 billion, +13% versus last year. Fixed currency sales +17%. |
| ● | Acquisition adjusted fixed currency sales +13%, led by double-digit growth in Institutional & Specialty, Industrial and Other segment sales. |
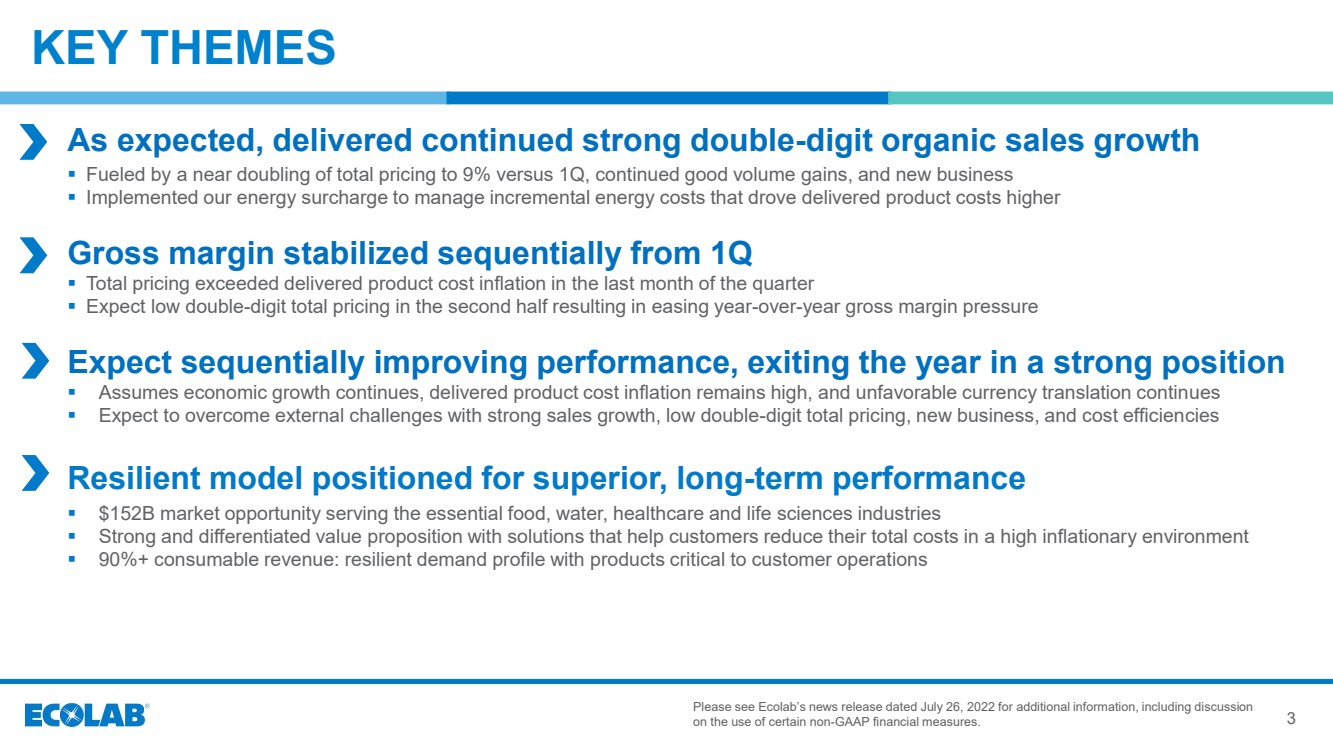
| ● | Total pricing accelerated to +9%, driven by higher structural pricing and the implementation of the energy surcharge, which together exceeded delivered product cost inflation in the last month of the quarter, helping to sequentially stabilize gross margin. |
| ● | Reported diluted EPS $1.08, flat versus last year. |
| ● | Adjusted diluted EPS, excluding special gains and charges and discrete tax items were $1.10, -10% versus last year. Adjusted diluted EPS includes $0.06 per share of unfavorable currency translation and $0.06 per share of Purolite amortization. |
| | Second Quarter Ended June 30 | ||||||||||||||||
| | Reported | | | | | Adjusted | | | | ||||||||
(unaudited) | | Public Currency Rates | | % | | Public Currency Rates | | % | ||||||||||
(millions, except per share) | | 2022 | | 2021 | | Change | | 2022 | | | 2021 | | Change | |||||
Net sales | | $3,580.6 | | | $3,162.7 | | | 13 | % | | $3,580.6 | | | $3,162.7 | | | 13 | % |
Operating income | | 425.8 | | | 447.8 | | | (5) | % | | 431.1 | | | 469.1 | | | (8) | % |
Net income attributable to Ecolab | | 308.3 | | | 310.8 | | | (1) | % | | 314.6 | | | 352.6 | | | (11) | % |
| | | | | | | | | | | | | | | | | | |
Diluted earnings per share attributable to Ecolab | | $1.08 | | | $1.08 | | | 0 | % | | $1.10 | | | $1.22 | | | (10) | % |
| | | | | | | | | | | | | | | | | | |
| | | | | | | | | | | Adjusted | | | | ||||
| | Fixed Currency Rates | | % | | Fixed Currency Rates | | % | ||||||||||
| | 2022 | | 2021 | | Change | | 2022 | | | 2021 | | Change | |||||
Net sales | | $3,616.2 | | | $3,092.6 | | | 17 | % | | $3,616.2 | | | $3,092.6 | | | 17 | % |
Operating income | | 432.2 | | | 435.0 | | | (1) | % | | 437.5 | | | 456.3 | | | (4) | % |
1
ST. PAUL, Minn., July 26, 2022: Second quarter adjusted earnings reflected double-digit sales growth, driven by very strong Institutional & Specialty, Industrial and Other segment sales, accelerating total pricing and further new business wins, which together were more than offset by continued substantial delivered product cost inflation, investments in the business, and unfavorable currency translation in a rapidly changing global operating environment.
CEO Comment
Commenting on the quarter, Christophe Beck, Ecolab’s chairman and chief executive officer, said, “We delivered the second quarter as expected, with continued, strong 13% acquisition adjusted fixed currency sales growth and adjusted diluted earnings per share reaching 90% of last year’s result. The expected decline in earnings was driven by $0.06 per share of unfavorable currency translation and $0.17 per share of net impact due to the time lag between a full quarter of incremental energy costs, following the Ukraine invasion, and the progressive implementation of the energy surcharge that started on April 1. Topline growth was driven by 9% total pricing, nearly doubling from first quarter levels, and good organic volume growth, led by further strong performance from our Institutional & Specialty segment. We entered the quarter with approximately 30% delivered product cost inflation but by accelerating structural pricing and executing our new global energy surcharge with customers around the world, our team reacted very quickly and managed to deliver total pricing that exceeded delivered product cost inflation in the last month of the quarter. This helped us to sequentially stabilize gross margin, which was our absolute priority.
“We now enter the second half of 2022 in a strong position. With the global energy surcharge mechanism implemented, total pricing is expected to accelerate further to keep us ahead of inflation, resulting in easing year-over-year margin pressure going forward. As we also prepare for a potentially more challenging macroeconomic environment, our primary focus will now shift to new business development to support our strong topline momentum. While this shift will naturally take some time to fully develop, we expect our overall performance to improve sequentially in the second half, though full year earnings will be impacted by increasing currency translation headwinds, now estimated to be $0.30 per share unfavorable for the full year, and the timing lag of the second quarter energy surcharge. We look for the third quarter to show continued strong sales growth and a sequentially narrowing decline in year-over-year adjusted diluted earnings per share comparisons, reflecting an estimated $0.10 per share impact from unfavorable currency translation and potentially softer volume growth as our team shifts their focus to new business. With total
2
pricing expected to accelerate even further, reaching the low double-digit level in the second half, further new business wins, breakthrough innovation and continued productivity benefits, we expect the fourth quarter to show accelerating earnings growth, resulting in modest gains in full year 2022 adjusted earnings per share. Importantly, we expect to exit the year in a very strong position to get back to more traditional Ecolab-like performance going forward.
“While the external environment over the past few years has been complex, the actions we have taken have made us even stronger. We launched new innovative programs to gain share and drive penetration; we enhanced our value proposition to strengthen pricing; we initiated a new global energy surcharge that helped us adjust to rapid changes; we expanded our global digital capabilities to improve service and productivity and we invested in new high growth opportunities like life sciences and data centers to expand in new growth markets. When combined with our resilient service model and a large and growing $152 billion market opportunity driven by secular trends in people and planet health, I have great confidence in Ecolab’s long-term growth trajectory and ability to deliver superior results for our customers and shareholders for years to come.”
Second Quarter 2022 Consolidated Results
Ecolab’s second quarter reported sales increased 13%, fixed currency sales increased 17% and acquisition adjusted fixed currency sales increased 13% when compared to the prior year.
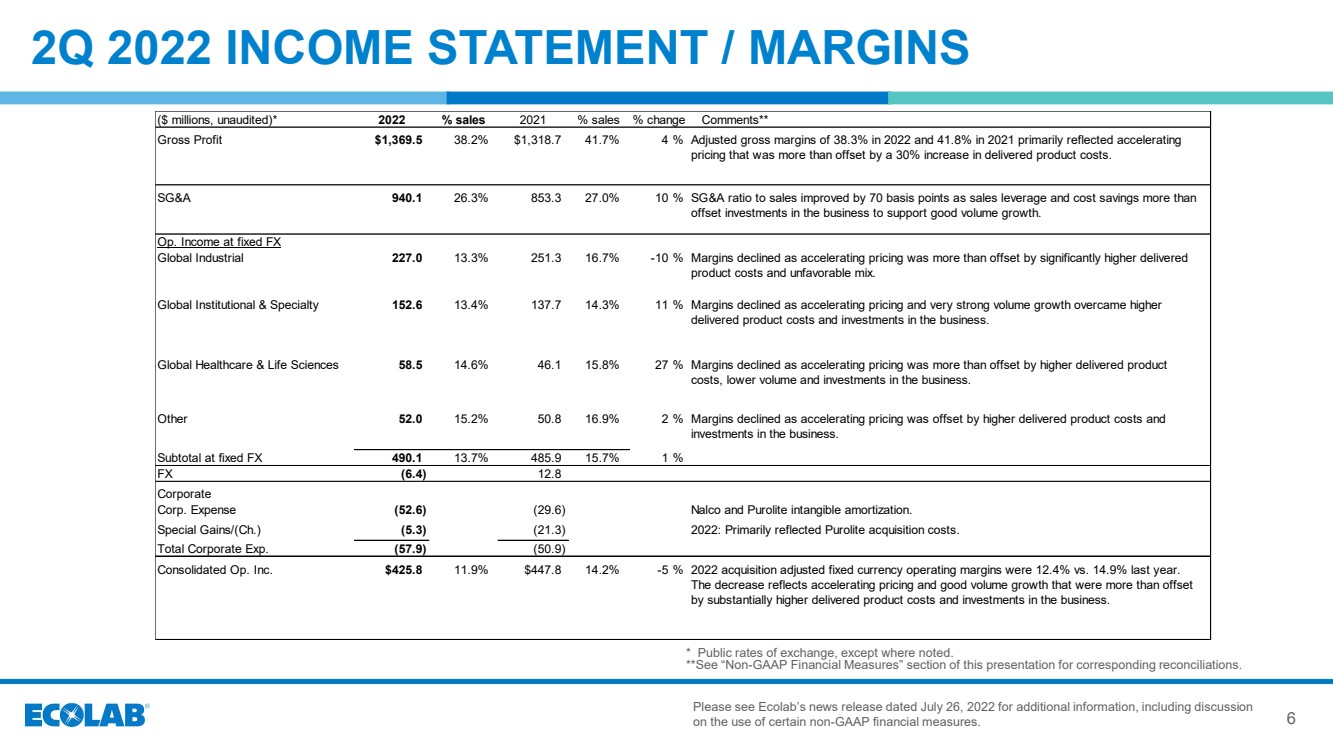
Second quarter 2022 reported operating income decreased 5% and includes the impact of special gains and charges, which were a net charge primarily related to Purolite acquisition costs. Adjusted operating income decreased 8%. Adjusted fixed currency operating income decreased 4%, as accelerating total pricing and good volume growth were more than offset by substantially higher delivered product costs and investments in the business.
Reported interest expense increased 23% as interest on new debt issued to fund the Purolite acquisition was partially offset by benefits from debt refinancing transactions completed last year.
The reported income tax rate for the second quarter of 2022 was 19.7% compared with the reported rate of 21.5% in the second quarter of 2021. Excluding special gains and charges and discrete tax items, the adjusted tax rate for the second quarter of 2022 was 19.2% compared with the adjusted tax rate of 19.3% in the second quarter of 2021.
3
Second quarter 2022 reported net income decreased 1% versus the prior year. Excluding the impact of special gains and charges and discrete tax items, adjusted net income decreased 11% versus the prior year.
Reported diluted earnings per share were flat versus the prior year. Adjusted diluted earnings per share decreased 10% when compared against the second quarter 2021. Adjusted diluted earnings per share includes $0.06 of Purolite amortization. Currency translation had a $0.06 unfavorable impact on second quarter 2022 earnings per share.
Ecolab reacquired approximately 0.7 million shares of its common stock during the second quarter of 2022 as a part of the previously announced share repurchase program.
Second Quarter 2022 Segment Review
Global Industrial | | | | | | | | | | | | |
| | | | | | | | | | | | |
(unaudited) | | Second Quarter Ended June 30 | | | | | Acq. Adj. | |||||
(millions) |
| 2022 | | 2021 | | % Change |
| % Change | ||||
| | | | | | | | | | | | |
Fixed currency | | | | | | | | | | | | |
Sales | | $1,704.1 | | | $1,502.3 | | | 13 | % | | 13 | % |
Operating income | | 227.0 | | | 251.3 | | | (10) | % | | (10) | % |
Operating income margin | | 13.3 | % | | 16.7 | % | | | | | | |
Acq. adj. operating income margin | | 13.3 | % | | 16.7 | % | | | | | | |
| | | | | | | | | | | | |
Public currency | | | | | | | | | | | | |
Sales | | $1,689.9 | | | $1,544.5 | | | 9 | % | | | |
Operating income | | 223.8 | | | 260.8 | | | (14) | % | | | |
The Industrial segment includes Water, Food & Beverage, Downstream and Paper
Acquisition adjusted fixed currency sales increased 13%. Strong double-digit growth across all divisions was driven by accelerating total pricing and new business wins. Acquisition adjusted fixed currency operating income decreased 10% as accelerating total pricing was more than offset by significantly higher delivered product costs and unfavorable mix.
4
Global Institutional & Specialty | | | | | | | | | | | | |
| | | | | | | | | | | | |
(unaudited) | | Second Quarter Ended June 30 | | | | | Acq. Adj. | |||||
(millions) |
| 2022 | | 2021 | | % Change |
| % Change | ||||
| | | | | | | | | | | | |
Fixed currency | | | | | | | | | | | | |
Sales | | $1,135.1 | | | $963.5 | | | 18 | % | | 18 | % |
Operating income | | 152.6 | | | 137.7 | | | 11 | % | | 11 | % |
Operating income margin | | 13.4 | % | | 14.3 | % | | | | | | |
Acq. adj. operating income margin | | 13.4 | % | | 14.3 | % | | | | | | |
| | | | | | | | | | | | |
Public currency | | | | | | | | | | | | |
Sales | | $1,127.2 | | | $976.0 | | | 15 | % | | | |
Operating income | | 151.3 | | | 138.5 | | | 9 | % | | | |
The Institutional & Specialty segment includes Institutional and Specialty
Acquisition adjusted fixed currency sales increased 18%. Very strong growth in the Institutional division reflected robust volume gains, accelerating total pricing, good new business wins, and innovation, which successfully leveraged global market trends that modestly improved through the quarter. Specialty sales showed good growth, driven by strong quickservice sales gains. Acquisition adjusted fixed currency operating income increased 11% as accelerating total pricing and strong volume growth overcame higher delivered product costs and investments in the business.
Global Healthcare & Life Sciences | | | | | | | | | | | | |
| | | | | | | | | | | | |
(unaudited) | | Second Quarter Ended June 30 | | | | | Acq. Adj. | |||||
(millions) |
| 2022 | | 2021 | | % Change |
| % Change | ||||
| | | | | | | | | | | | |
Fixed currency | | | | | | | | | | | | |
Sales | | $400.8 | | | $292.0 | | | 37 | % | | 0 | % |
Operating income | | 58.5 | | | 46.1 | | | 27 | % | | (38) | % |
Operating income margin | | 14.6 | % | | 15.8 | % | | | | | | |
Acq. adj. operating income margin | | 9.8 | % | | 15.8 | % | | | | | | |
| | | | | | | | | | | | |
Public currency | | | | | | | | | | | | |
Sales | | $390.9 | | | $301.8 | | | 30 | % | | | |
Operating income | | 56.8 | | | 48.0 | | | 18 | % | | | |
The Healthcare & Life Sciences segment includes Healthcare and Life Sciences
Acquisition adjusted fixed currency sales were flat as double-digit growth in Life Sciences was offset by modestly lower Healthcare sales. While Healthcare sales improved sequentially, its decline versus the prior year reflected good growth in North America that was more than offset by a slower recovery in Europe. Acquisition adjusted fixed currency operating income decreased 38%,
5
as accelerating total pricing was more than offset by higher delivered product costs, lower volume and investments in the business.
Other | | | | | | | | | | | | |
| | | | | | | | | | | | |
(unaudited) | | Second Quarter Ended June 30 | | | | | Acq. Adj. | |||||
(millions) |
| 2022 | | 2021 | | % Change |
| % Change | ||||
| | | | | | | | | | | | |
Fixed currency | | | | | | | | | | | | |
Sales | | $342.3 | | | $300.3 | | | 14 | % | | 14 | % |
Operating income | | 52.0 | | | 50.8 | | | 2 | % | | 2 | % |
Operating income margin | | 15.2 | % | | 16.9 | % | | | | | | |
Acq. adj. operating income margin | | 15.2 | % | | 16.9 | % | | | | | | |
| | | | | | | | | | | | |
Public currency | | | | | | | | | | | | |
Sales | | $338.7 | | | $305.5 | | | 11 | % | | | |
Operating income | | 51.6 | | | 51.7 | | | 0 | % | | | |
The Other segment includes Pest Elimination, Textile Care and Colloidal Technologies
Acquisition adjusted fixed currency sales increased 14%, reflecting double-digit growth in Pest Elimination, Textile Care and Colloidal Technologies. Acquisition adjusted fixed currency operating income increased 2% as accelerating total pricing and volume gains overcame higher delivered product costs and investments in the business.
Corporate | | | | | | |
| | | | | | |
(unaudited) | | Second Quarter Ended June 30 | ||||
(millions) |
| 2022 | | 2021 | ||
| | | | | | |
Public currency | | | | | | |
Sales | | $33.9 | | | $34.9 | |
| | | | | | |
Corporate operating expense | | | | | | |
Nalco and Purolite amortization | | 52.4 | | | 29.9 | |
Special (gains) and charges | | 5.3 | | | 21.3 | |
Total Corporate operating expense | | $57.7 | | | $51.2 | |
Second quarter of 2022 corporate segment includes:
| ● | sales of $34 million to ChampionX under the Master Cross Supply and Product Transfer agreements we entered into as part of the ChampionX separation |
| ● | amortization expense of $30 million related to the Nalco merger intangible assets and $23 million related to Purolite acquisition intangible assets |
| ● | special gains and charges were a net charge of $5 million, primarily related to Purolite acquisition costs |
6
Special gains and charges for the second quarter of 2021 were a net charge of $21 million and primarily included COVID-related charges and restructuring charges.
2022 Business Outlook
While the economic environment remains complex and unpredictable, we assume growth will continue, inflation will remain higher for longer and currency translation impacts become more challenging. With the global energy surcharge mechanism implemented, total pricing is expected to accelerate further to keep us ahead of inflation, resulting in easing year-over-year margin pressure going forward. As we also prepare for a potentially more challenging macroeconomic environment, our primary focus will now shift to new business development to support our strong topline momentum. While this shift will naturally take some time to fully develop, we expect our overall performance to improve sequentially in the second half, though full year earnings will be impacted by increasing currency translation headwinds, now estimated to be $0.30 per share unfavorable for the full year, and the timing lag of the second quarter energy surcharge. We look for the third quarter to show continued strong sales growth and a sequentially narrowing decline in year-over-year adjusted diluted earnings per share comparisons, reflecting an estimated $0.10 per share impact from unfavorable currency translation and potentially softer volume growth as our team shifts their focus to new business. With total pricing expected to accelerate even further, reaching the low double-digit level in the second half, further new business wins, breakthrough innovation and continued productivity benefits, we expect the fourth quarter to show accelerating earnings growth, resulting in modest gains in full year 2022 adjusted earnings per share. Importantly, we expect to exit the year in a very strong position to get back to more traditional Ecolab-like performance going forward.
About Ecolab
A trusted partner at nearly three million customer locations, Ecolab (ECL) is a global leader in water, hygiene and infection prevention solutions and services that protect people, planet and business health. With annual sales of $13 billion and more than 47,000 associates, Ecolab delivers comprehensive science-based solutions, data-driven insights and world-class service to advance food safety, maintain clean and safe environments, optimize water and energy use, and improve operational efficiencies and sustainability for customers in the food, healthcare, hospitality and industrial markets in more than 170 countries around the world. www.ecolab.com
7
Ecolab will host a live webcast to review the second quarter earnings announcement today at 1:00 p.m. Eastern Time. The webcast, along with related materials, will be available to the public on Ecolab's website at www.ecolab.com/investor. A replay of the webcast and related materials will be available at that site.
Cautionary Statements Regarding Forward-Looking Information
This news release contains certain statements relating to future events and our intentions, beliefs, expectations and predictions for the future which are forward-looking statements as that term is defined in the Private Securities Litigation Reform Act of 1995. Words or phrases such as “will likely result,” “are expected to,” “will continue,” “is anticipated,” “we believe,” “we expect,” “estimate,” “project,” “may,” “will,” “intend,” “plan,” “believe,” “target,” “forecast” (including the negative or variations thereof) or similar terminology used in connection with any discussion of future plans, actions or events generally identify forward-looking statements. These forward-looking statements include, but are not limited to, statements regarding global economic conditions, inflation and currency translation, and our financial and business performance and prospects, including sales, earnings, pricing, margins, new business, innovation and productivity. These statements are based on the current expectations of management of the company. There are a number of risks and uncertainties that could cause actual results to differ materially from the forward-looking statements included in this news release.
Additional risks and uncertainties that may affect operating results and business performance are set forth under Item 1A of our most recent Form 10-K, and our other public filings with the Securities and Exchange Commission (the "SEC"), and include the effects and duration of the COVID-19 pandemic, including the impact of vaccination mandates; difficulty in procuring raw materials or fluctuations in raw material costs; the vitality of the markets we serve; the impact of economic factors such as the worldwide economy, capital flows, interest rates, foreign currency risk, and reduced sales and earnings in our international operations resulting from the weakening of local currencies versus the U.S. dollar; information technology infrastructure failures or breaches in data security; our ability to attract, retain and develop high caliber management talent to lead our business and successfully execute organizational change and changing labor market dynamics in the wake of the COVID-19 pandemic; exposure to global economic, political and legal risks related to our international operations, including the impact of sanctions or other actions taken by the U.S.
8
or other countries, and retaliatory measures taken by Russia in response, in connection with the conflict in Ukraine; public health outbreaks, epidemics or pandemics, such as the current outbreak of COVID-19; our ability to execute key business initiatives, including restructurings and our Enterprise Resource Planning system upgrades; our ability to successfully compete with respect to value, innovation and customer support; pressure on operations from consolidation of customers or vendors; restraints on pricing flexibility due to contractual obligations and our ability to meet our contractual commitments; realization of anticipated benefits of the Purolite acquisition; our ability to acquire complementary businesses and to effectively integrate such businesses; the costs and effects of complying with laws and regulations, including those relating to the environment and to the manufacture, storage, distribution, sale and use of our products, as well as to the conduct of our business generally, including labor and employment and anti-corruption; potential chemical spill or release; potential to incur significant tax liabilities or indemnification liabilities relating to the separation and split-off of our ChampionX business; the occurrence of litigation or claims, including class action lawsuits; the loss or insolvency of a major customer or distributor; repeated or prolonged government and/or business shutdowns or similar events; acts of war or terrorism; natural or man-made disasters; water shortages; severe weather conditions; changes in tax laws and unanticipated tax liabilities; potential loss of deferred tax assets; our indebtedness, and any failure to comply with covenants that apply to our indebtedness; potential losses arising from the impairment of goodwill or other assets; and other uncertainties or risks reported from time to time in our reports to the SEC. In light of these risks, uncertainties, assumptions and factors, the forward-looking events discussed in this news release may not occur. We caution that undue reliance should not be placed on forward-looking statements, which speak only as of the date made. Ecolab does not undertake, and expressly disclaims, any duty to update any forward-looking statement whether as a result of new information, future events or changes in expectations, except as required by law.
Non-GAAP Financial Information
This news release and certain of the accompanying tables include financial measures that have not been calculated in accordance with accounting principles generally accepted in the U.S. (“GAAP”).
These non-GAAP financial measures include:
•fixed currency sales
•acquisition adjusted fixed currency sales
•adjusted cost of sales
9
•adjusted gross margin
•fixed currency operating income
•adjusted operating income
•adjusted fixed currency operating income
•adjusted fixed currency operating income margin
•acquisition adjusted fixed currency operating income
•acquisition adjusted fixed currency operating income margin
•adjusted tax rate
•adjusted net income attributable to Ecolab
•adjusted diluted earnings per share
We provide these measures as additional information regarding our operating results. We use these non-GAAP measures internally to evaluate our performance and in making financial and operational decisions, including with respect to incentive compensation. We believe that our presentation of these measures provides investors with greater transparency with respect to our results of operations and that these measures are useful for period-to-period comparison of results.
Our non-GAAP adjusted financial measures for cost of sales, gross margin, operating income, other (income) expense and interest expense exclude the impact of special (gains) and charges, and our non-GAAP measures for tax rate, net income attributable to Ecolab and diluted earnings per share further exclude the impact of discrete tax items. We include items within special (gains) and charges and discrete tax items that we believe can significantly affect the period-over-period assessment of operating results and not necessarily reflect costs associated with historical trends and future results. After tax special (gains) and charges are derived by applying the applicable local jurisdictional tax rate to the corresponding pre-tax special (gains) and charges.
We evaluate the performance of our international operations based on fixed currency rates of foreign exchange, which eliminate the translation impact of exchange rate fluctuations on our international results. Fixed currency amounts included in this release are based on translation into U.S. dollars at the fixed foreign currency exchange rates established by management at the beginning of 2022. We also provide our segment results based on public currency rates for informational purposes.
10
Our reportable segments do not include the impact of intangible asset amortization from the Nalco and Purolite mergers or the impact of special (gains) and charges as these are not allocated to the Company’s reportable segments.
Acquisition adjusted growth rates exclude the results of any acquired business from the first twelve months post acquisition and exclude the results of divested businesses from the previous twelve months prior to divestiture. In addition, as part of the separation, we also entered into a Master Cross Supply and Product Transfer agreement with ChampionX to provide, receive or transfer certain products for a period up to 36 months. Sales of product to ChampionX under this agreement are recorded in product and equipment sales in the Corporate segment along with the related cost of sales. These transactions are removed from the consolidated results as part of the calculation of the impact of acquisitions and divestitures.
These non-GAAP financial measures are not in accordance with, or an alternative to, GAAP and may be different from non-GAAP measures used by other companies. Investors should not rely on any single financial measure when evaluating our business. We recommend that investors view these measures in conjunction with the GAAP measures included in this news release. Reconciliations of our non-GAAP measures are included in the following "Supplemental Non-GAAP Reconciliations" and “Supplemental Diluted Earnings per Share Information” tables included in this news release.
We do not provide reconciliations for non-GAAP estimates on a forward-looking basis (including those contained in this news release) when we are unable to provide a meaningful or accurate calculation or estimation of reconciling items and the information is not available without unreasonable effort. This is due to the inherent difficulty of forecasting the timing and amount of various items that have not yet occurred, are out of our control and/or cannot be reasonably predicted, and that would impact reported earnings per share and the reported tax rate, the most directly comparable forward-looking GAAP financial measures to adjusted earnings per share and the adjusted tax rate. For the same reasons, we are unable to address the probable significance of the unavailable information.
###
(ECL-E) |
11
ECOLAB INC.
CONSOLIDATED STATEMENTS OF INCOME
(unaudited)
| | Second Quarter Ended | | | | Six Months Ended | |
| ||||||
| | June 30 | | % | | June 30 | | % | ||||||
(millions, except per share) | | 2022 |
| 2021 | | Change |
| 2022 |
| 2021 |
| Change | ||
| | | | | | | | | | | | | | |
Product and equipment sales | | $2,886.8 | | $2,514.4 | | | | | $5,510.9 | | $4,807.8 | | | |
Service and lease sales | | 693.8 | | 648.3 | | | | | 1,336.4 | | 1,239.9 | | | |
Net sales | | 3,580.6 | | 3,162.7 | | 13 | % | | 6,847.3 | | 6,047.7 | | 13 | % |
Product and equipment cost of sales | | 1,799.0 | | 1,464.9 | | | | | 3,494.6 | | 2,827.8 | | | |
Service and lease cost of sales | | 412.1 | | 379.1 | | | | | 789.9 | | 728.2 | | | |
Cost of sales (1) | | 2,211.1 | | 1,844.0 | | 20 | % | | 4,284.5 | | 3,556.0 | | 20 | % |
Selling, general and administrative expenses | | 940.1 | | 853.3 | | 10 | % | | 1,854.8 | | 1,716.2 | | 8 | % |
Special (gains) and charges (1) | | 3.6 | | 17.6 | | | | | 27.7 | | 30.4 | | | |
Operating income | | 425.8 | | 447.8 | | (5) | % | | 680.3 | | 745.1 | | (9) | % |
Other (income) expense (1) | | (19.5) | | 2.5 | | (880) | % | | (38.3) | | (14.5) | | 164 | % |
Interest expense, net | | 56.0 | | 45.6 | | 23 | % | | 109.0 | | 97.3 | | 12 | % |
Income before income taxes | | 389.3 | | 399.7 | | (3) | % | | 609.6 | | 662.3 | | (8) | % |
Provision for income taxes | | 76.6 | | 86.1 | | (11) | % | | 122.2 | | 152.2 | | (20) | % |
Net income including noncontrolling interest | | 312.7 | | 313.6 | | 0 | % | | 487.4 | | 510.1 | | (4) | % |
Net income attributable to noncontrolling interest | | 4.4 | | 2.8 | | | | | 7.2 | | 5.7 | | | |
Net income attributable to Ecolab | | $308.3 | | $310.8 | | (1) | % | | 480.2 | | 504.4 | | (5) | % |
| | | | | | | | | | | | | | |
Earnings attributable to Ecolab per common share | | | | | | | | | | | | | ||
Basic | | $1.08 | | $1.09 | | (1) | % | | $1.68 | | $1.76 | | (5) | % |
Diluted | | $1.08 | | $1.08 | | 0 | % | | $1.67 | | $1.75 | | (5) | % |
| | | | | | | | | | | | | | |
Weighted-average common shares outstanding | | | | | | | | | | | | | ||
Basic | | 285.1 | | 286.0 | | 0 | % | | 285.7 | | 286.0 | | 0 | % |
Diluted | | 286.6 | | 288.8 | | (1) | % | | 287.4 | | 288.9 | | (1) | % |
| | | | | | | | | | | | | | |
(1) Cost of sales, Special (gains) and charges and Other (income) expense, net in the Consolidated Statement of Income above include the following: | ||||||||||||||
| | | | | | | | | | | | | | |
| | Second Quarter Ended | | | | Six Months Ended | |
| ||||||
| | June 30 | | | | | June 30 | | | | ||||
(millions) | | 2022 | | 2021 | | | | | 2022 | | 2021 | | | |
| | | | | | | | | | | | | | |
Cost of sales | | | | | | | | | | | | | | |
Restructuring activities | | $0.8 | | $3.7 | | | | | $3.4 | | $21.9 | | | |
Acquisition and integration activities | | 0.9 | | - | | | | | 28.5 | | - | | | |
COVID-19 activities, net | | - | | - | | | | | 16.3 | | 1.1 | | | |
Russia/Ukraine activities | | - | | - | | | | | 6.4 | | - | | | |
Other | | - | | - | | | | | - | | 0.3 | | | |
Subtotal (a) | | 1.7 | | 3.7 | | | | | 54.6 | | 23.3 | | | |
| | | | | | | | | | | | | | |
Special (gains) and charges | | | | | | | | | | | | | | |
Restructuring activities | | 0.3 | | 2.5 | | | | | 1.1 | | 6.1 | | | |
Acquisition and integration activities | | 3.4 | | 1.3 | | | | | 10.9 | | 2.5 | | | |
COVID-19 activities, net | | 3.1 | | 8.3 | | | | | 4.6 | | 14.7 | | | |
Russia/Ukraine activities | | (5.7) | | - | | | | | 5.9 | | | | | |
Other | | 2.5 | | 5.5 | | | | | 5.2 | | 7.1 | | | |
Subtotal | | 3.6 | | 17.6 | | | | | 27.7 | | 30.4 | | | |
| | | | | | | | | | | | | | |
Other (income) expense | | | | | | | | | | | | | | |
Pension Settlements/Curtailments | | - | | 19.6 | | | | | - | | 19.6 | | | |
| | | | | | | | | | | | | | |
Total special (gains) and charges | | $5.3 | | $40.9 | | | | | $82.3 | | $73.3 | | | |
(a) Special charges of $1.2 million and $3.7 million in the second quarter of 2022 and 2021 respectively, and $53.2 million and $23.3 million for the first six months of 2022 and 2021, respectively, were recorded in product and equipment cost of sales. Special charges of $0.5 million in the second quarter of 2022 and $1.4 million for the first six months of 2022 were recorded in service and lease cost of sales.
12
ECOLAB INC.
REPORTABLE SEGMENT INFORMATION
(unaudited)
| | Second Quarter Ended June 30 | ||||||||||||
| | Fixed Currency Rates | | Public Currency Rates | ||||||||||
| | | | | | % | | | | | | % | ||
(millions) | | 2022 |
| 2021 |
| Change |
| 2022 |
| 2021 |
| Change | ||
Net Sales | | | | | | | | | | | | | | |
Global Industrial | | $1,704.1 | | $1,502.3 | | 13 | % | | $1,689.9 | | $1,544.5 | | 9 | % |
Global Institutional & Specialty | | 1,135.1 | | 963.5 | | 18 | % | | 1,127.2 | | 976.0 | | 15 | % |
Global Healthcare & Life Sciences | | 400.8 | | 292.0 | | 37 | % | | 390.9 | | 301.8 | | 30 | % |
Other | | 342.3 | | 300.3 | | 14 | % | | 338.7 | | 305.5 | | 11 | % |
Corporate | | 33.9 | | 34.5 | | (2) | % | | 33.9 | | 34.9 | | (3) | % |
Subtotal at fixed currency rates | | 3,616.2 | | 3,092.6 | | 17 | % | | 3,580.6 | | 3,162.7 | | 13 | % |
Currency impact | | (35.6) | | 70.1 | | * | | | - | | - | | * | |
Consolidated reported GAAP net sales | | $3,580.6 | | $3,162.7 | | 13 | % | | $3,580.6 | | $3,162.7 | | 13 | % |
| | | | | | | | | | | | | | |
Operating Income (loss) | | | | | | | | | | | | | | |
Global Industrial | | $227.0 | | $251.3 | | (10) | % | | $223.8 | | $260.8 | | (14) | % |
Global Institutional & Specialty | | 152.6 | | 137.7 | | 11 | % | | 151.3 | | 138.5 | | 9 | % |
Global Healthcare & Life Sciences | | 58.5 | | 46.1 | | 27 | % | | 56.8 | | 48.0 | | 18 | % |
Other | | 52.0 | | 50.8 | | 2 | % | | 51.6 | | 51.7 | | 0 | % |
Corporate | | (57.9) | | (50.9) | | * | | | (57.7) | | (51.2) | | * | |
Subtotal at fixed currency rates | | 432.2 | | 435.0 | | (1) | % | | 425.8 | | 447.8 | | (5) | % |
Currency impact | | (6.4) | | 12.8 | | * | | | - | | - | | * | |
Consolidated reported GAAP operating income | | $425.8 | | $447.8 | | (5) | % | | $425.8 | | $447.8 | | (5) | % |
| | | | | | | | | | | | | | |
| | Six Months Ended June 30 | ||||||||||||
| | Fixed Currency Rates | | Public Currency Rates | ||||||||||
| | | | | | % | | | | | | % | ||
(millions) | | 2022 |
| 2021 |
| Change |
| 2022 |
| 2021 |
| Change | ||
Net Sales | | | | | | | | | | | | | | |
Global Industrial | | $3,261.1 | | $2,887.2 | | 13 | % | | $3,255.6 | | $2,975.5 | | 9 | % |
Global Institutional & Specialty | | 2,140.2 | | 1,807.6 | | 18 | % | | 2,134.2 | | 1,833.4 | | 16 | % |
Global Healthcare & Life Sciences | | 763.4 | | 573.1 | | 33 | % | | 753.7 | | 594.5 | | 27 | % |
Other | | 638.3 | | 565.7 | | 13 | % | | 635.1 | | 576.2 | | 10 | % |
Corporate | | 68.6 | | 67.3 | | 2 | % | | 68.7 | | 68.1 | | 1 | % |
Subtotal at fixed currency rates | | 6,871.6 | | 5,900.9 | | 16 | % | | 6,847.3 | | 6,047.7 | | 13 | % |
Currency impact | | (24.3) | | 146.8 | | * | | | - | | - | | * | |
Consolidated reported GAAP net sales | | $6,847.3 | | $6,047.7 | | 13 | % | | $6,847.3 | | $6,047.7 | | 13 | % |
| | | | | | | | | | | | | | |
Operating Income | | | | | | | | | | | | | | |
Global Industrial | | $416.2 | | $461.1 | | (10) | % | | $415.2 | | $481.1 | | (14) | % |
Global Institutional & Specialty | | 263.4 | | 199.6 | | 32 | % | | 262.4 | | 200.5 | | 31 | % |
Global Healthcare & Life Sciences | | 102.6 | | 88.7 | | 16 | % | | 101.0 | | 93.0 | | 9 | % |
Other | | 89.2 | | 83.1 | | 7 | % | | 89.1 | | 84.6 | | 5 | % |
Corporate | | (187.5) | | (113.4) | | * | | | (187.4) | | (114.1) | | * | |
Subtotal at fixed currency rates | | 683.9 | | 719.1 | | (5) | % | | 680.3 | | 745.1 | | (9) | % |
Currency impact | | (3.6) | | 26.0 | | * | | | - | | - | | * | |
Consolidated reported GAAP operating income | | $680.3 | | $745.1 | | (9) | % | | $680.3 | | $745.1 | | (9) | % |
* Not meaningful.
As shown in the “Fixed Currency Rates” tables above, we evaluate the performance of our international operations based on fixed currency exchange rates, which eliminate the impact of exchange rate fluctuations on our international operations. Amounts shown in the “Public Currency Rates” tables above reflect amounts translated at actual public average rates of exchange prevailing during the corresponding period and are provided for informational purposes. The difference between the fixed currency exchange rates and the public currency exchange rates is reported as “Currency impact” in the “Fixed Currency Rates” tables above.
The Corporate segment includes amortization from the Nalco and Purolite merger intangible assets. The Corporate segment also includes special (gains) and charges reported on the Consolidated Statement of Income.
13
ECOLAB INC.
CONSOLIDATED BALANCE SHEETS
(unaudited)
| | June 30 | | December 31 | | June 30 | |||
(millions) | | 2022 | | 2021 | | 2021 | |||
Assets | | | | | | | | | |
Current assets | | | | | | | | | |
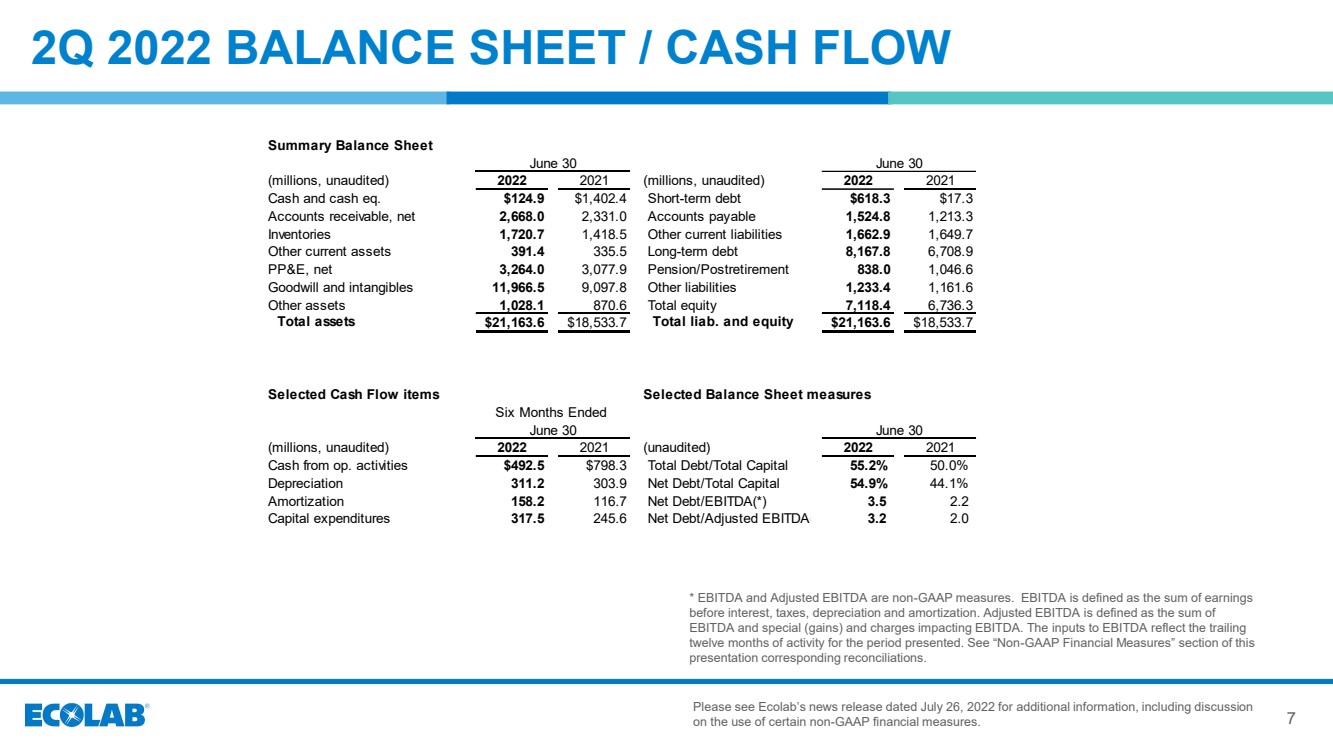
Cash and cash equivalents | | $124.9 | | | $359.9 | | | $1,402.4 | |
Accounts receivable, net | | 2,668.0 | | | 2,478.4 | | | 2,331.0 | |
Inventories | | 1,720.7 | | | 1,491.8 | | | 1,418.5 | |
Other current assets | | 391.4 | | | 357.0 | | | 335.5 | |
Total current assets | | 4,905.0 | | | 4,687.1 | | | 5,487.4 | |
| | | | | | | | | |
Property, plant and equipment, net | | 3,264.0 | | | 3,288.5 | | | 3,077.9 | |
Goodwill | | 7,935.9 | | | 8,063.9 | | | 6,172.4 | |
Other intangible assets, net | | 4,030.6 | | | 4,224.1 | | | 2,925.4 | |
Operating lease assets | | 400.8 | | | 396.8 | | | 391.5 | |
Other assets | | 627.3 | | | 546.0 | | | 479.1 | |
Total assets | | $21,163.6 | | | $21,206.4 | | | $18,533.7 | |
| | | | | | | | | |
Liabilities and Equity | | | | | | | | | |
Current liabilities | | | | | | | | | |
Short-term debt | | $618.3 | | | $411.0 | | | $17.3 | |
Accounts payable | | 1,524.8 | | | 1,384.2 | | | 1,213.3 | |
Compensation and benefits | | 434.8 | | | 509.5 | | | 430.3 | |
Income taxes | | 73.6 | | | 104.3 | | | 48.9 | |
Other current liabilities | | 1,154.5 | | | 1,144.2 | | | 1,170.5 | |
Total current liabilities | | 3,806.0 | | | 3,553.2 | | | 2,880.3 | |
| | | | | | | | | |
Long-term debt | | 8,167.8 | | | 8,347.2 | | | 6,708.9 | |
Postretirement health care and pension benefits | | 838.0 | | | 894.2 | | | 1,046.6 | |
Deferred income taxes | | 630.4 | | | 622.0 | | | 567.3 | |
Operating lease liabilities | | 291.8 | | | 282.6 | | | 273.8 | |
Other liabilities | | 311.2 | | | 254.1 | | | 320.5 | |
Total liabilities | | 14,045.2 | | | 13,953.3 | | | 11,797.4 | |
| | | | | | | | | |
Equity | | | | | | | | | |
Common stock | | 364.5 | | | 364.1 | | | 363.2 | |
Additional paid-in capital | | 6,529.8 | | | 6,464.6 | | | 6,333.3 | |
Retained earnings | | 9,003.3 | | | 8,814.5 | | | 8,472.8 | |
Accumulated other comprehensive loss | | (1,617.9) | | | (1,634.8) | | | (1,710.6) | |
Treasury stock | | (7,186.3) | | | (6,784.2) | | | (6,749.6) | |
Total Ecolab shareholders’ equity | | 7,093.4 | | | 7,224.2 | | | 6,709.1 | |
Noncontrolling interest | | 25.0 | | | 28.9 | | | 27.2 | |
Total equity | | 7,118.4 | | | 7,253.1 | | | 6,736.3 | |
Total liabilities and equity | | $21,163.6 | | | $21,206.4 | | | $18,533.7 | |
14
ECOLAB INC.
SUPPLEMENTAL NON-GAAP RECONCILIATIONS
(unaudited)
|
| Second Quarter Ended |
| Six Months Ended |
| ||||||||
| | June 30 | | June 30 | | ||||||||
(millions, except percent and per share) | | 2022 |
| 2021 | | 2022 |
| 2021 | | ||||
| | | | | | | | | | | | | |
Net sales | | | | | | | | | | | | | |
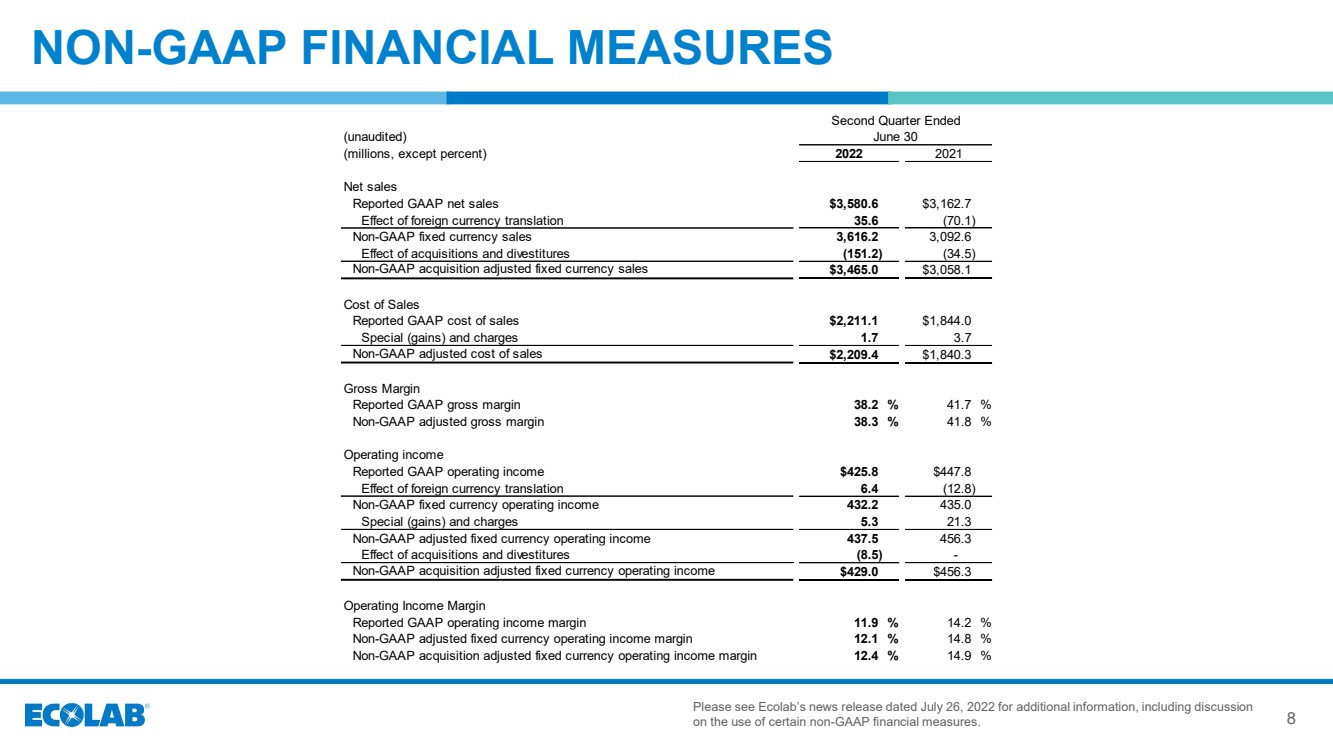
Reported GAAP net sales | | $3,580.6 | | | $3,162.7 | | | $6,847.3 | | | $6,047.7 | | |
Effect of foreign currency translation | | 35.6 | | | (70.1) | | | 24.3 | | | (146.8) | | |
Non-GAAP fixed currency sales | | 3,616.2 | | | 3,092.6 | | | 6,871.6 | | | 5,900.9 | | |
Effect of acquisitions and divestitures | | (151.2) | | | (34.5) | | | (293.7) | | | (67.3) | | |
Non-GAAP acquisition adjusted fixed currency sales | | $3,465.0 | | | $3,058.1 | | | $6,577.9 | | | $5,833.6 | | |
| | | | | | | | | | | | | |
Cost of sales | | | | | | | | | | | | | |
Reported GAAP cost of sales | | $2,211.1 | | | $1,844.0 | | | $4,284.5 | | | $3,556.0 | | |
Special (gains) and charges | | 1.7 | | | 3.7 | | | 54.6 | | | 23.3 | | |
Non-GAAP adjusted cost of sales | | $2,209.4 | | | $1,840.3 | | | $4,229.9 | | | $3,532.7 | | |
| | | | | | | | | | | | | |
Gross margin | | | | | | | | | | | | | |
Reported GAAP gross margin | | 38.2 | % | | 41.7 | % | | 37.4 | % | | 41.2 | % | |
Non-GAAP adjusted gross margin | | 38.3 | % | | 41.8 | % | | 38.2 | % | | 41.6 | % | |
| | | | | | | | | | | | | |
Operating income | | | | | | | | | | | | | |
Reported GAAP operating income | | $425.8 | | | $447.8 | | | $680.3 | | | $745.1 | | |
Effect of foreign currency translation | | 6.4 | | | (12.8) | | | 3.6 | | | (26.0) | | |
Non-GAAP fixed currency operating income | | 432.2 | | | 435.0 | | | 683.9 | | | 719.1 | | |
Special (gains) and charges | | 5.3 | | | 21.3 | | | 82.3 | | | 53.7 | | |
Non-GAAP adjusted fixed currency operating income | | 437.5 | | | 456.3 | | | 766.2 | | | 772.8 | | |
Effect of acquisitions and divestitures | | (8.5) | | | 0.0 | | | (6.0) | | | 0.0 | | |
Non-GAAP acquisition adjusted fixed currency operating income | | $429.0 | | | $456.3 | | | $760.2 | | | $772.8 | | |
| | | | | | | | | | | | | |
Operating income margin | | | | | | | | | | | | | |
Reported GAAP operating income margin | | 11.9 | % | | 14.2 | % | | 9.9 | % | | 12.3 | % | |
Non-GAAP adjusted fixed currency operating income margin | | 12.1 | % | | 14.8 | % | | 11.2 | % | | 13.1 | % | |
Non-GAAP acquisition adjusted fixed currency operating income margin | | 12.4 | % | | 14.9 | % | | 11.6 | % | | 13.2 | % | |
| | | | | | | | | | | | | |
Other (income) expense | | | | | | | | | | | | | |
Reported GAAP other (income) expense | | ($19.5) | | | $2.5 | | | ($38.3) | | | (14.5) | | |
Special (gains) and charges | | - | | | 19.6 | | | 0.0 | | | 19.6 | | |
Non-GAAP adjusted other (income) expense | | ($19.5) | | | (17.10) | | | ($38.3) | | | (34.1) | | |
15
ECOLAB INC.
SUPPLEMENTAL NON-GAAP RECONCILIATIONS
(unaudited)
|
| Second Quarter Ended |
| Six Months Ended | | ||||||||
| | June 30 | | June 30 | | ||||||||
(millions, except percent and per share) | | 2022 |
| 2021 | | 2022 |
| 2021 | | ||||
Net Income attributable to Ecolab | | | | | | | | | | | | | |
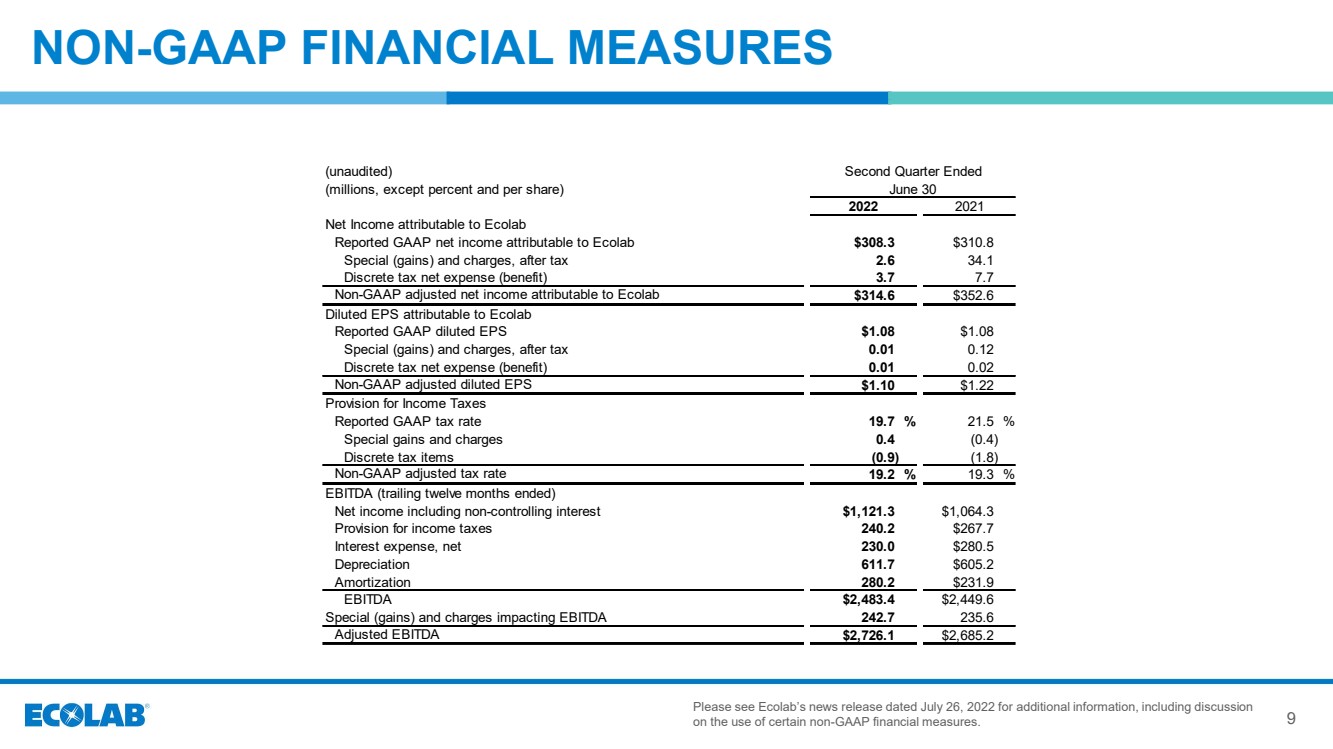
Reported GAAP net income attributable to Ecolab | | $308.3 | | | $310.8 | | | $480.2 | | | $504.4 | | |
Special (gains) and charges, after tax | | 2.6 | | | 34.1 | | | 66.2 | | | 58.3 | | |
Discrete tax net expense (benefit) | | 3.7 | | | 7.7 | | | 4.7 | | | 23.8 | | |
Non-GAAP adjusted net income attributable to Ecolab | | $314.6 | | | $352.6 | | | $551.1 | | | $586.5 | | |
| | | | | | | | | | | | | |
Diluted EPS attributable to Ecolab | | | | | | | | | | | | | |
Reported GAAP diluted EPS | | $1.08 | | | $1.08 | | | $1.67 | | | $1.75 | | |
Special (gains) and charges, after tax | | 0.01 | | | 0.12 | | | 0.23 | | | 0.20 | | |
Discrete tax net expense (benefit) | | 0.01 | | | 0.02 | | | 0.02 | | | 0.08 | | |
Non-GAAP adjusted diluted EPS | | $1.10 | | | $1.22 | | | $1.92 | | | $2.03 | | |
| | | | | | | | | | | | | |
Provision for Income Taxes | | | | | | | | | | | | | |
Reported GAAP tax rate | | 19.7 | % | | 21.5 | % | | 20.0 | % | | 23.0 | % | |
Special gains and charges | | 0.4 | | | (0.4) | | | 0.0 | | | (0.3) | | |
Discrete tax items | | (0.9) | | | (1.8) | | | (0.7) | | | (3.2) | | |
Non-GAAP adjusted tax rate | | 19.2 | % | | 19.3 | % | | 19.3 | % | | 19.5 | % | |
16
ECOLAB INC.
SUPPLEMENTAL NON-GAAP RECONCILIATIONS
| | Second Quarter Ended June 30 | ||||||||||
(unaudited) | | 2022 | | 2021 | ||||||||
(millions) | | Fixed Currency | | Impact of Acquisitions and Divestitures | | Acquisition Adjusted | | Fixed Currency | | Impact of Acquisitions and Divestitures | | Acquisition Adjusted |
Net Sales | | | | | | | | | | | | |
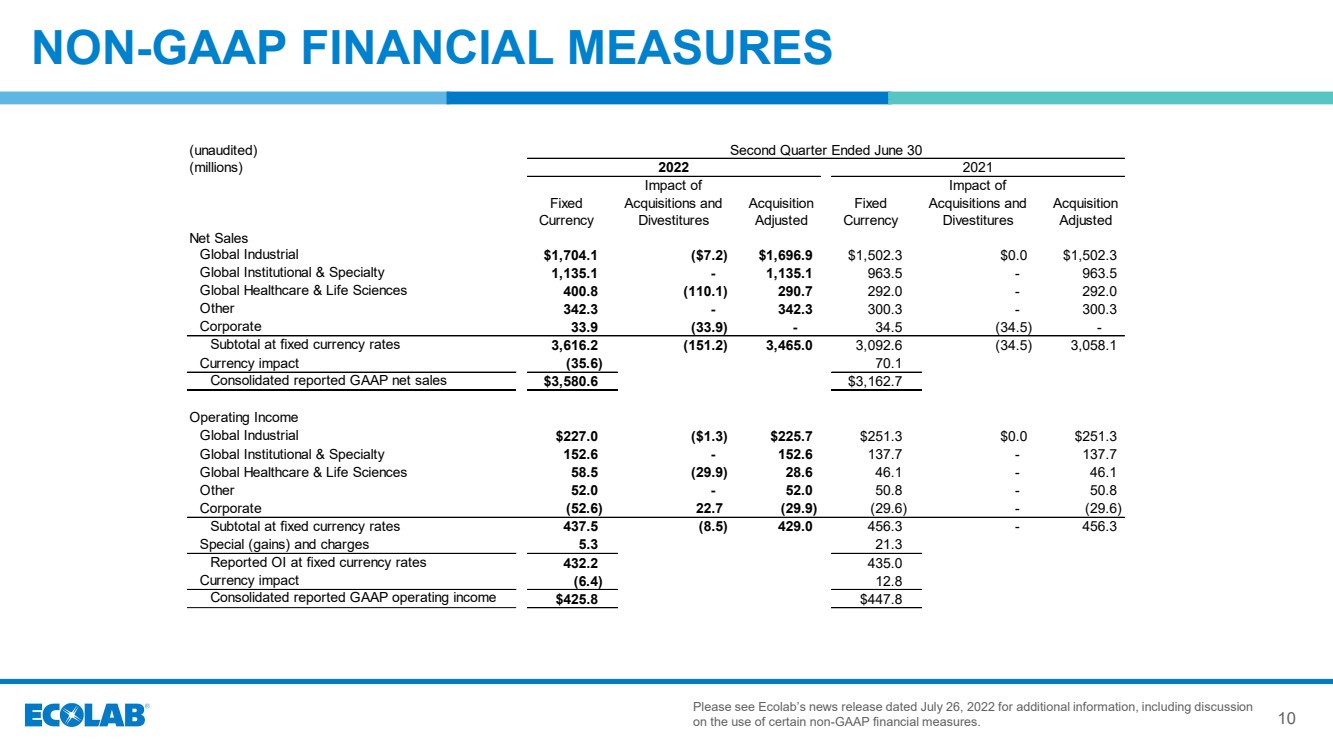
Global Industrial | | $1,704.1 | | ($7.2) | | $1,696.9 | | $1,502.3 | | - | | $1,502.3 |
Global Institutional & Specialty | | 1,135.1 | | - | | 1,135.1 | | 963.5 | | - | | 963.5 |
Global Healthcare & Life Sciences | | 400.8 | | (110.1) | | 290.7 | | 292.0 | | - | | 292.0 |
Other | | 342.3 | | - | | 342.3 | | 300.3 | | - | | 300.3 |
Corporate | | 33.9 | | (33.9) | | - | | 34.5 | | (34.5) | | - |
Subtotal at fixed currency rates | | 3,616.2 | | (151.2) | | 3,465.0 | | 3,092.6 | | (34.5) | | 3,058.1 |
Currency impact | | (35.6) | | | | | | 70.1 | | | | |
Consolidated reported GAAP net sales | | $3,580.6 | | | | | | $3,162.7 | | | | |
| | | | | | | | | | | | |
Operating Income (loss) | | | | | | | | | | | | |
Global Industrial | | $227.0 | | ($1.3) | | $225.7 | | $251.3 | | - | | $251.3 |
Global Institutional & Specialty | | 152.6 | | - | | 152.6 | | 137.7 | | - | | 137.7 |
Global Healthcare & Life Sciences | | 58.5 | | (29.9) | | 28.6 | | 46.1 | | - | | 46.1 |
Other | | 52.0 | | - | | 52.0 | | 50.8 | | - | | 50.8 |
Corporate | | (52.6) | | 22.7 | | (29.9) | | (29.6) | | - | | (29.6) |
Subtotal at fixed currency rates | | 437.5 | | (8.5) | | 429.0 | | 456.3 | | - | | 456.3 |
Special (gains) and charges | | 5.3 | | | | | | 21.3 | | | | |
Reported OI at fixed currency rates | | 432.2 | | | | | | 435.0 | | | | |
Currency impact | | (6.4) | | | | | | 12.8 | | | | |
Consolidated reported GAAP operating income | | $425.8 | | | | | | $447.8 | | | | |
| | | | | | | | | | | | |
| | Six Months Ended June 30 | ||||||||||
| | 2022 | | 2021 | ||||||||
(millions) | | Fixed Currency | | Impact of Acquisitions and Divestitures | | Acquisition Adjusted | | Fixed Currency | | Impact of Acquisitions and Divestitures | | Acquisition Adjusted |
Net Sales | | | | | | | | | | | | |
Global Industrial | | $3,261.1 | | ($13.1) | | $3,248.0 | | $2,887.2 | | - | | $2,887.2 |
Global Institutional & Specialty | | 2,140.2 | | - | | 2,140.2 | | 1,807.6 | | - | | 1,807.6 |
Global Healthcare & Life Sciences | | 763.4 | | (212.0) | | 551.4 | | 573.1 | | - | | 573.1 |
Other | | 638.3 | | - | | 638.3 | | 565.7 | | - | | 565.7 |
Corporate | | 68.6 | | (68.6) | | - | | 67.3 | | (67.3) | | - |
Subtotal at fixed currency rates | | 6,871.6 | | (293.7) | | 6,577.9 | | 5,900.9 | | (67.3) | | 5,833.6 |
Currency impact | | (24.3) | | | | | | 146.8 | | | | |
Consolidated reported GAAP net sales | | $6,847.3 | | | | | | $6,047.7 | | | | |
| | | | | | | | | | | | |
Operating Income (loss) | | | | | | | | | | | | |
Global Industrial | | $416.2 | | ($2.1) | | $414.1 | | $461.1 | | - | | $461.1 |
Global Institutional & Specialty | | 263.4 | | - | | 263.4 | | 199.6 | | - | | 199.6 |
Global Healthcare & Life Sciences | | 102.6 | | (49.5) | | 53.1 | | 88.7 | | - | | 88.7 |
Other | | 89.2 | | - | | 89.2 | | 83.1 | | - | | 83.1 |
Corporate | | (105.2) | | 45.6 | | (59.6) | | (59.7) | | - | | (59.7) |
Subtotal at fixed currency rates | | 766.2 | | (6.0) | | 760.2 | | 772.8 | | - | | 772.8 |
Special (gains) and charges | | 82.3 | | | | | | 53.7 | | | | |
Reported OI at fixed currency rates | | 683.9 | | | | | | 719.1 | | | | |
Currency impact | | (3.6) | | | | | | 26.0 | | | | |
Consolidated reported GAAP operating income | | $680.3 | | | | | | $745.1 | | | | |
17
ECOLAB INC.
SUPPLEMENTAL DILUTED EARNINGS PER SHARE INFORMATION
(unaudited)
The table below provides a reconciliation of diluted earnings per share, as reported, to the non-GAAP measure of adjusted diluted earnings per share.
|
| First |
| Second |
| Six |
| Third |
| Nine |
| Fourth |
|
| |
| | Quarter | | Quarter | | Months | | Quarter | | Months | | Quarter | | Year | |
| | Ended | | Ended | | Ended | | Ended | | Ended | | Ended | | Ended | |
| | Mar. 31 | | June 30 | | June 30 | | Sept. 30 | | Sept. 30 | | Dec. 31 | | Dec. 31 | |
| | 2021 | | 2021 | | 2021 | | 2021 | | 2021 | | 2021 | | 2021 | |
Diluted earnings per share, as reported (U.S. GAAP) | | $0.67 | | $1.08 | | $1.75 | | $1.12 | | $2.87 | | $1.04 | | $3.91 | |
Adjustments: | | | | | | | | | | | | | | | |
Special (gains) and charges (1) | | 0.08 | | 0.12 | | 0.20 | | 0.28 | | 0.48 | | 0.26 | | 0.74 | |
Discrete tax expense (benefits) (2) | | 0.06 | | 0.02 | | 0.08 | | (0.02) | | 0.06 | | (0.04) | | 0.02 | |
Impact of Purolite on diluted earnings per share | | | | | | | | | | | | 0.02 | | 0.02 | |
Adjusted diluted earnings per share (Non-GAAP) | | $0.81 | | $1.22 | | $2.03 | | $1.38 | | $3.41 | | $1.28 | | $4.69 | |
|
| First |
| Second |
| Six |
| Third |
| Nine |
| Fourth |
|
|
|
| | Quarter | | Quarter | | Months | | Quarter | | Months | | Quarter | | Year |
|
| | Ended | | Ended | | Ended | | Ended | | Ended | | Ended | | Ended |
|
| | Mar. 31 | | June 30 | | June 30 | | Sept. 30 | | Sept. 30 | | Dec. 31 | | Dec. 31 |
|
| | 2022 | | 2022 | | 2022 | | 2022 | | 2022 | | 2022 | | 2022 |
|
Diluted earnings per share, as reported (U.S. GAAP) | | $0.60 | | $1.08 | | $1.67 | | | | | | | | | |
Adjustments: | | | | | | | | | | | | | | | |
Special (gains) and charges (3) | | 0.22 | | 0.01 | | 0.23 | | | | | | | | | |
Discrete tax expense (benefits) (4) | | 0.00 | | 0.01 | | 0.02 | | | | | | | | | |
Adjusted diluted earnings per share (Non-GAAP) | | $0.82 | | $1.10 | | $1.92 | | | | | | | | | |
Per share amounts do not necessarily sum due to changes in shares outstanding and rounding.
(1) Special (gains) and charges for 2021 includes charges of $24.2 million, $34.1 million, $80.8 million and $74.4 million, net of tax, in the first, second, third and fourth quarters, respectively. Charges include COVID-19 related inventory write downs and employee-related costs (net of government subsidies), restructuring charges, debt refinancing charges, acquisition and integration charges, and litigation and other charges.
(2) Discrete tax expenses (benefits) for 2021 includes $16.1 million, $7.7 million, ($6.3) million and ($11.7) million in the first, second, third and fourth quarters, respectively. These expenses (benefits) are primarily associated with stock compensation excess tax benefits more than offset by other discrete tax expense.
(3) Special (gains) and charges for 2022 includes charges of $63.6 million and $2.6 million, net of tax, in the first and second quarters, respectively. Charges include acquisition and integration charges, reserves related to our operations in Russia, COVID-19 related inventory write downs and employee-related costs, restructuring charges, and litigation and other charges.
(4) Discrete tax expenses (benefits) for 2022 includes $1.0 million and $3.7 million in the first and second quarters, respectively. These expenses (benefits) are primarily associated with stock compensation excess tax benefits more than offset by other discrete tax expense.
18