Exhibit 99.1

News Release
| | |
| Michael J. Monahan (651) 250-2809 Nate Brochmann (651) 250-3837 | |
| Andrew C. Hedberg (651) 250-2185 | |
ECOLAB FIRST QUARTER REPORTED DILUTED CONTINUING OPERATIONS EPS $0.67
ADJUSTED DILUTED CONTINUING OPERATIONS EPS $0.81, -18%
EPS INCLUDES ESTIMATED UNFAVORABLE $0.10 (-10pp) PER SHARE IMPACT FROM TEXAS FREEZE
FIRST QUARTER HIGHLIGHTS:
| ● | First quarter results reflected underlying sequential improvement from the fourth quarter offset by supply chain and customer disruptions from the Texas freeze. |
| ● | As previously disclosed, the Texas freeze is expected to have an unfavorable impact of $0.15 per share in full year 2021; the first quarter impact was an estimated $0.10 per share. |
| ● | Reported diluted EPS from continuing operations $0.67, -33% versus last year. |
| | First Quarter Ended March 31 | ||||||||||||||||
| | Reported | | | | | Adjusted | | | | ||||||||
(unaudited) | | Public Currency Rates | | % | | Public Currency Rates | | % | ||||||||||
(millions, except per share) | | 2021 | | 2020 | | Change | | 2021 | | | 2020 | | Change | |||||
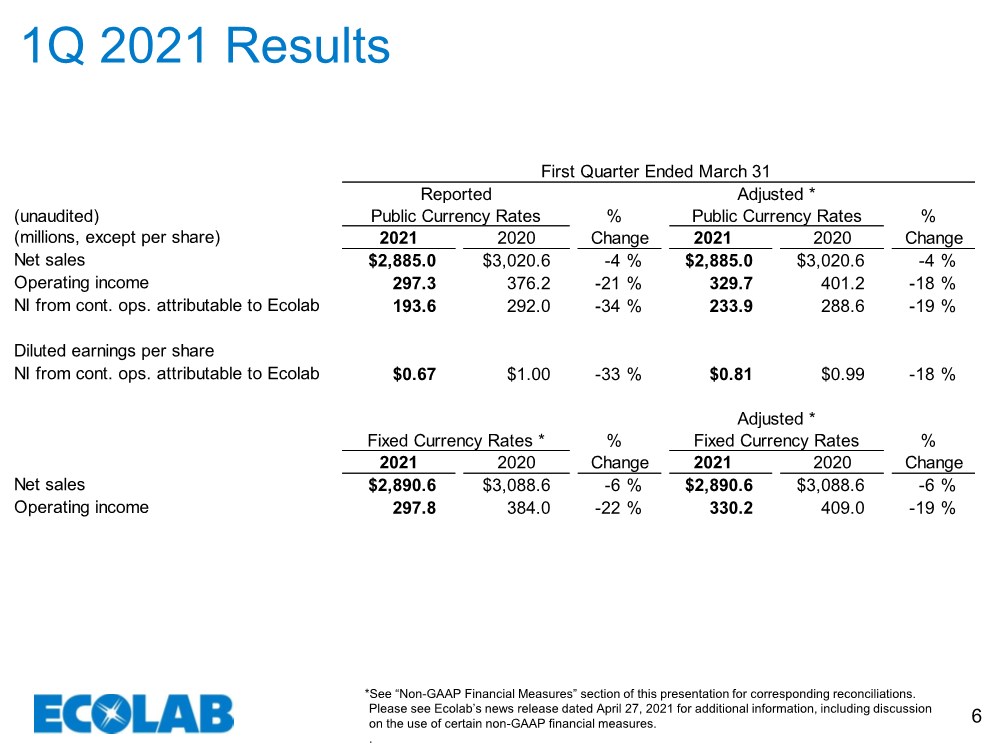
Net sales | | $2,885.0 | | | $3,020.6 | | | (4) | % | | $2,885.0 | | | $3,020.6 | | | (4) | % |
Operating income | | 297.3 | | | 376.2 | | | (21) | % | | 329.7 | | | 401.2 | | | (18) | % |
Net income from continuing operations attributable to Ecolab | | 193.6 | | | 292.0 | | | (34) | % | | 233.9 | | | 288.6 | | | (19) | % |
| | | | | | | | | | | | | | | | | | |
Diluted earnings per share | | | | | | | | | | | | | | | | | | |
Net income from continuing operations attributable to Ecolab | | $0.67 | | | $1.00 | | | (33) | % | | $0.81 | | | $0.99 | | | (18) | % |
| | | | | | | | | | | | | | | | | | |
| | | | | | | | | | | Adjusted | | | | ||||
| | Fixed Currency Rates | | % | | Fixed Currency Rates | | % | ||||||||||
| | 2021 | | 2020 | | Change | | 2021 | | | 2020 | | Change | |||||
Net sales | | $2,890.6 | | | $3,088.6 | | | (6) | % | | $2,890.6 | | | $3,088.6 | | | (6) | % |
Operating income | | 297.8 | | | 384.0 | | | (22) | % | | 330.2 | | | 409.0 | | | (19) | % |
1
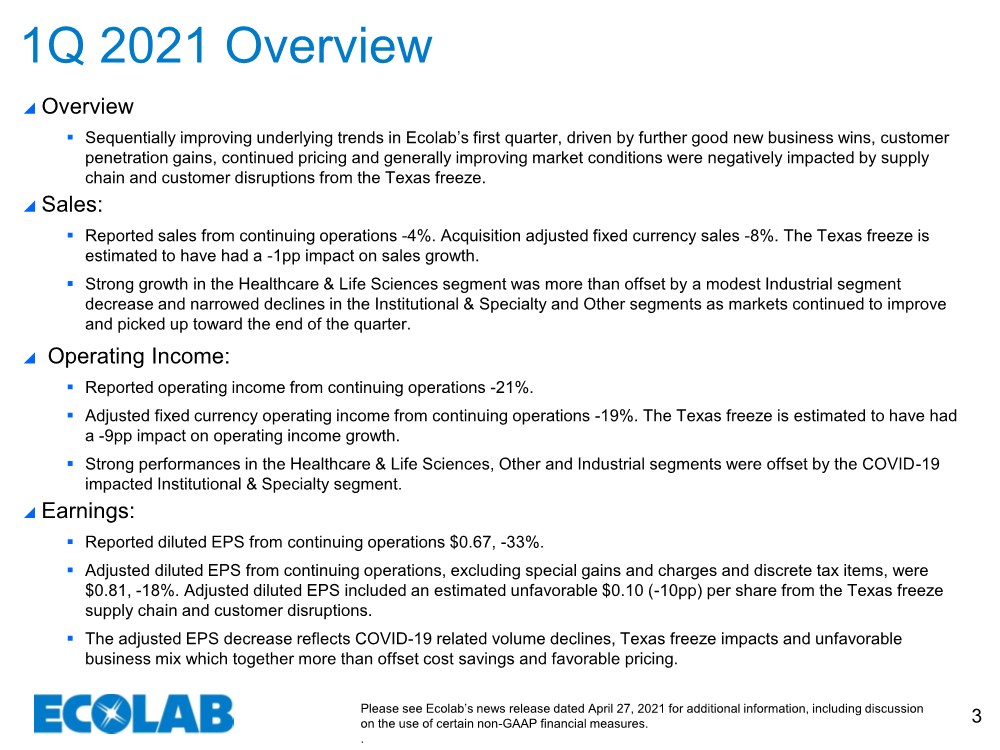
ST. PAUL, Minn., April 27, 2021: Sequentially improving underlying trends in Ecolab’s first quarter, driven by further strong new business wins, customer penetration gains, continued pricing and generally better market conditions, were negatively impacted by short-term supply chain and customer disruptions from the Texas freeze. Strong top and bottom line growth in the Healthcare & Life Sciences segment once again led results along with further income gains in the Industrial segment, while Institutional & Specialty and Other segment sales declines continued to narrow as markets further improved.
CEO comment
Commenting on the quarter, Christophe Beck, Ecolab’s president and chief executive officer said, “Our business continues to show fundamental improvement that gives us confidence in our full year outlook. First quarter results were in line with our expectations as underlying sequential sales and earnings improvement from the fourth quarter 2020 was offset by the previously discussed impact from the Texas freeze. This was a short-term event that primarily impacted our Industrial segment, as raw materials supply was sharply reduced and certain customer operations were constrained. Adjusted diluted earnings per share of $0.81 were also as expected and included an estimated unfavorable $0.10 per share impact from the Texas freeze.
“Importantly, our general market outlook remains largely unchanged. North America and China are moving ahead while Europe and several other regions remain behind as they recover from extended lockdowns and slow rates of vaccinations. We continue to believe that we are in a strong position to capitalize on the improving trends while we leverage continued new business wins, customer penetration gains and good pricing. The investments we made to further our product and service innovation, new hygiene and digital technologies and successful sales and profit initiatives are also contributing to our results. We are therefore confident that these critical efforts have expanded our global competitive advantage and uniquely position us to capture new business opportunities and drive accelerated growth for Ecolab.
“We look for significant growth in the second quarter, primarily driven by strong year-on-year growth in our Institutional division as new business as well as improving trends in early-reopening U.S. states and continued U.S. vaccination progress more than offset a softer Europe and emerging market recovery. We expect robust consolidated gains in the second half, and continue to look for strong year-on-year growth for the full year 2021 with earnings per share above 2019 earnings per
2
share from continuing operations excluding the estimated $0.15 per share impact of the Texas freeze. With rising hygiene standards, increased demand for our sustainable solutions and our unique digital capabilities, we remain confident in our long-term outlook and believe we are well-positioned for continued superior future growth.”
First Quarter 2021 Consolidated Results
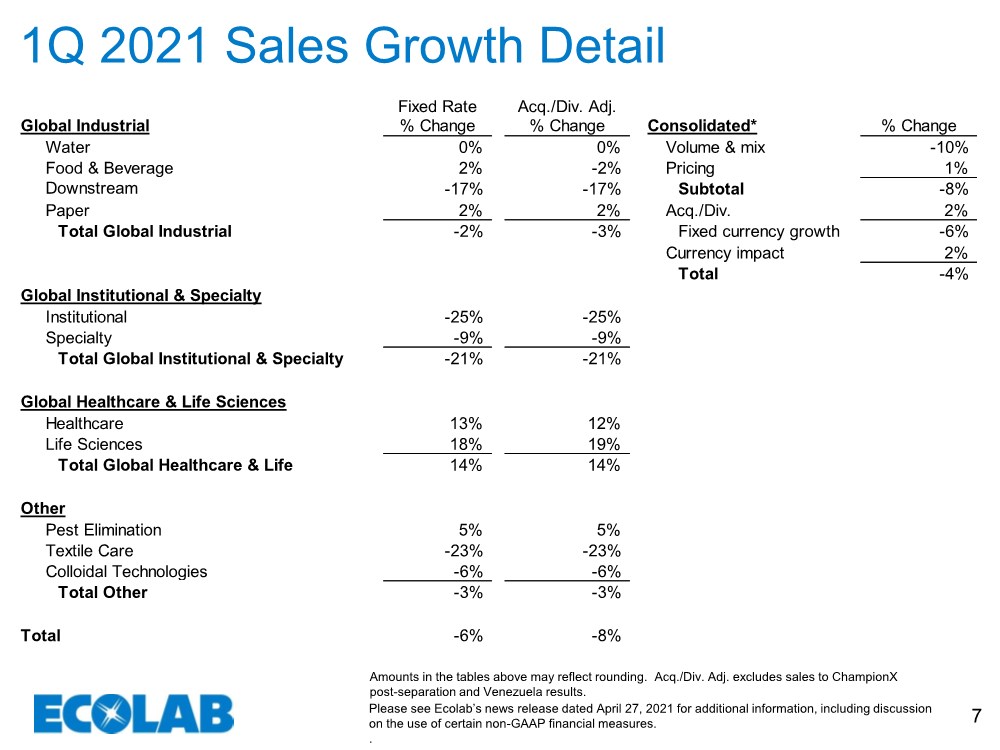
Ecolab's first quarter reported sales decreased 4%, fixed currency sales decreased 6% and acquisition adjusted fixed currency sales decreased 8% when compared to the prior year. The Texas freeze is estimated to have had a -1pp impact on overall sales growth.
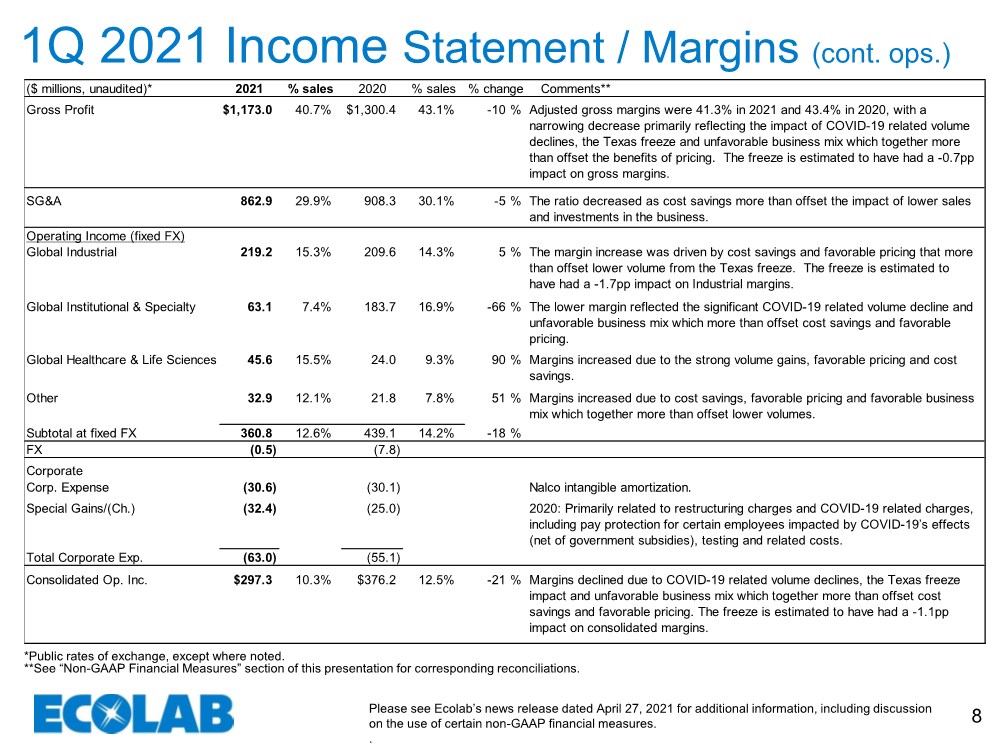
First quarter 2021 reported operating income decreased 21% and fixed currency operating income decreased 22% when compared to the prior year; both include the impact of special charges, which were primarily related to restructuring activities and pay protection for certain employees impacted by COVID-19’s effects (net of government subsidies). Adjusted fixed currency operating income decreased 19%. COVID-19 related lower volume, the Texas freeze impact and unfavorable business mix more than offset cost savings and favorable pricing. The Texas freeze is estimated to have had a -9pp impact on operating income growth.
Reported other income, which primarily consists of the return on pension assets and other non-service costs of our pension obligations, increased 10% reflecting higher returns on pension assets.
Reported interest expense increased 7% due to higher average debt levels in this year’s quarter. The increased average debt levels in 2021 incorporate the late March 2020 issuance of debt to further increase our liquidity at the beginning of the COVID-19 pandemic.
The reported income tax rate for the first quarter of 2021 was 25.2% compared with the reported rate of 13.7% in the first quarter of 2020. Excluding special gains and charges and discrete tax items, the adjusted tax rate for the first quarter of 2021 was 19.7% compared with the adjusted tax rate of 20.5% in the first quarter of 2020.
First quarter 2021 reported net income from continuing operations attributable to Ecolab decreased 34%. Excluding the impact of special gains and charges and discrete tax items, adjusted net income from continuing operations attributable to Ecolab decreased 19% versus the prior year.
3
Reported diluted earnings per share from continuing operations decreased 33%. Adjusted diluted earnings per share from continuing operations declined 18% when compared against first quarter 2020; the Texas freeze is estimated to have had a -10pp impact on adjusted diluted earnings per share from continuing operations growth. Currency translation had a $0.02 favorable impact on first quarter 2021 adjusted diluted earnings per share from continuing operations.
Ecolab reacquired approximately 0.3 million shares of its common stock during the first quarter of 2021.
First Quarter 2021 Segment Review
Segment results reflect continuing operations.
Global Industrial | | | | | | | | | | | | |
| | | | | | | | | | | | |
(unaudited) | | First Quarter Ended March 31 | | | | | Acq. Adj. | |||||
(millions) |
| 2021 | | 2020 | | % Change |
| % Change | ||||
| | | | | | | | | | | | |
Fixed currency | | | | | | | | | | | | |
Sales | | $1,433.9 | | | $1,465.0 | | | (2) | % | | (3) | % |
Operating income | | 219.2 | | | 209.6 | | | 5 | % | | 4 | % |
Operating income margin | | 15.3 | % | | 14.3 | % | | | | | | |
Acq. adj. operating income margin | | 15.6 | % | | 14.5 | % | | | | | | |
| | | | | | | | | | | | |
Public currency | | | | | | | | | | | | |
Sales | | $1,431.0 | | | $1,433.1 | | | 0 | % | | | |
Operating income | | 218.8 | | | 204.8 | | | 7 | % | | | |
The Industrial segment includes Water, Food & Beverage, Downstream and Paper
Acquisition adjusted fixed currency sales decreased 3% as modest Paper sales growth and steady Water sales were more than offset by a modest Food & Beverage decline and a significant decrease in Downstream sales. Industrial segment results reflect unfavorable impacts in all divisions from supply chain and customer operating disruptions from the Texas freeze during the quarter, most notably in Downstream; excluding those weather-related impacts, Industrial sales are estimated to have improved sequentially and would have been similar to last year. Acquisition adjusted fixed currency operating income increased 4% reflecting cost savings and favorable pricing that more than offset lower volume from the Texas freeze. The Texas freeze is estimated to have had a -14pp impact on Industrial’s acquisition adjusted fixed currency operating income growth.
4
Global Institutional & Specialty | | | | | | | | | | | | |
| | | | | | | | | | | | |
(unaudited) | | First Quarter Ended March 31 | | | | | Acq. Adj. | |||||
(millions) |
| 2021 | | 2020 | | % Change |
| % Change | ||||
| | | | | | | | | | | | |
Fixed currency | | | | | | | | | | | | |
Sales | | $858.5 | | | $1,087.2 | | | (21) | % | | (21) | % |
Operating income | | 63.1 | | | 183.7 | | | (66) | % | | (65) | % |
Operating income margin | | 7.4 | % | | 16.9 | % | | | | | | |
Acq. adj. operating income margin | | 7.5 | % | | 16.9 | % | | | | | | |
| | | | | | | | | | | | |
Public currency | | | | | | | | | | | | |
Sales | | $857.4 | | | $1,070.1 | | | (20) | % | | | |
Operating income | | 63.2 | | | 182.0 | | | (65) | % | | | |
The Institutional & Specialty segment includes Institutional and Specialty
Acquisition adjusted fixed currency sales declined 21%. Sales reflected a narrowing decline in the Institutional division and a Specialty division sales decrease versus a very strong year-ago period. Results for both divisions continued to be unfavorably impacted by the continuation of COVID-19’s second wave during most of the quarter, as increased sanitizing product sales were more than offset by global demand pressure on restaurant, lodging and entertainment facilities for other products due to the pandemic. Acquisition adjusted fixed currency operating income decreased 65% reflecting the significant COVID-19 related volume decline and unfavorable business mix which more than offset cost savings and favorable pricing.
Global Healthcare & Life Sciences | | | | | | | | | | | | |
| | | | | | | | | | | | |
(unaudited) | | First Quarter Ended March 31 | | | | | Acq. Adj. | |||||
(millions) |
| 2021 | | 2020 | | % Change |
| % Change | ||||
| | | | | | | | | | | | |
Fixed currency | | | | | | | | | | | | |
Sales | | $293.7 | | | $256.8 | | | 14 | % | | 14 | % |
Operating income | | 45.6 | | | 24.0 | | | 90 | % | | 90 | % |
Operating income margin | | 15.5 | % | | 9.3 | % | | | | | | |
Acq. adj. operating income margin | | 15.7 | % | | 9.4 | % | | | | | | |
| | | | | | | | | | | | |
Public currency | | | | | | | | | | | | |
Sales | | $292.7 | | | $244.7 | | | 20 | % | | | |
Operating income | | 45.4 | | | 22.5 | | | 102 | % | | | |
The Healthcare & Life Sciences segment includes Healthcare and Life Sciences
Acquisition adjusted fixed currency sales grew 14% led by double-digit gains in both the Healthcare and Life Sciences divisions, as both benefited from new business and continued demand due to COVID-19. Acquisition adjusted fixed currency operating income grew 90% reflecting the strong volume gains, favorable pricing and cost savings.
5
Other | | | | | | | | | | | | |
| | | | | | | | | | | | |
(unaudited) | | First Quarter Ended March 31 | | | | | Acq. Adj. | |||||
(millions) |
| 2021 | | 2020 | | % Change |
| % Change | ||||
| | | | | | | | | | | | |
Fixed currency | | | | | | | | | | | | |
Sales | | $271.3 | | | $279.6 | | | (3) | % | | (3) | % |
Operating income | | 32.9 | | | 21.8 | | | 51 | % | | 51 | % |
Operating income margin | | 12.1 | % | | 7.8 | % | | | | | | |
Acq. adj. operating income margin | | 12.1 | % | | 7.8 | % | | | | | | |
| | | | | | | | | | | | |
Public currency | | | | | | | | | | | | |
Sales | | $270.7 | | | $272.7 | | | (1) | % | | | |
Operating income | | 32.8 | | | 21.3 | | | 54 | % | | | |
The Other segment includes Pest Elimination, Textile Care and Colloidal Technologies
Acquisition adjusted fixed currency sales declined 3% as a solid increase in Pest Elimination was more than offset by declines in the remaining Other divisions. Acquisition adjusted fixed currency operating income increased 51% as cost savings, favorable pricing and favorable business mix together more than offset lower volumes.
Corporate
| ● | sales of $33 million to ChampionX in the first quarter of 2021 under the Master Cross Supply and Product Transfer agreements entered into as part of the ChampionX separation |
| ● | amortization expense of $31 million in the first quarter of 2021 related to the Nalco merger intangible assets |
| ● | net special charges of $32 million in the first quarter of 2021 primarily related to restructuring charges and COVID-19 related charges, including pay protection for certain employees impacted by COVID-19’s effects (net of government subsidies), testing and related costs |
Special gains and charges for the first quarter of 2020 were a net charge of $25 million and include restructuring charges, acquisition and integration charges, Healthcare product recall charges and litigation and other charges.
6
Business Outlook
The continued uncertain outlook regarding the timing and pace of global economic recovery from COVID-19’s impact does not yet present an adequate basis for us to provide either quarterly or annual earnings forecasts.
We expect continued recovery in the full year 2021. Healthcare & Life Sciences segment sales are expected to moderately improve over the prior year’s very strong gain, with good year-on-year sales growth from our Industrial and Other segments. We look for our Institutional & Specialty segment to show a significant year-on-year increase for the full year as it progressively recovers toward its pre-COVID peak 2019 levels.
We look for significant growth in the second quarter, primarily driven by strong year-on-year growth in our Institutional division as new business as well as improving trends in early-reopening U.S. states and continued U.S. vaccination progress more than offset a softer Europe and emerging market recovery. We expect robust consolidated gains in the second half, and continue to look for strong year-on-year growth for the full year 2021 with earnings per share above 2019 earnings per share from continuing operations excluding the estimated $0.15 per share impact of the Texas freeze.
About Ecolab
A trusted partner at nearly three million commercial customer locations, Ecolab (ECL) is the global leader in water, hygiene and infection prevention solutions and services. With annual sales of $12 billion and more than 44,000 associates, Ecolab delivers comprehensive solutions, data-driven insights and personalized service to advance food safety, maintain clean and safe environments, optimize water and energy use, and improve operational efficiencies and sustainability for customers in the food, healthcare, hospitality and industrial markets in more than 170 countries around the world. www.ecolab.com
Ecolab will host a live webcast to review the first quarter earnings announcement today at 1:00 p.m. Eastern Time. The webcast, along with related materials, will be available to the public on Ecolab's website at www.ecolab.com/investor. A replay of the webcast and related materials will be available at that site.
7
Cautionary Statements Regarding Forward-Looking Information
This communication contains certain statements relating to future events and our intentions, beliefs, expectations and predictions for the future which are forward-looking statements as that term is defined in the Private Securities Litigation Reform Act of 1995. Words or phrases such as “will likely result,” “are expected to,” “will continue,” “is anticipated,” “we believe,” “we expect,” “estimate,” “project,” “may,” “will,” “intend,” “plan,” “believe,” “target,” “forecast” (including the negative or variations thereof) or similar terminology used in connection with any discussion of future plans, actions or events generally identify forward-looking statements. These forward-looking statements include, but are not limited to, statements regarding COVID-19 pandemic trends, the global economic recovery, and our financial and business performance and prospects, including sales, earnings and new business. These statements are based on the current expectations of management of the company. There are a number of risks and uncertainties that could cause actual results to differ materially from the forward-looking statements included in this communication. With respect to the COVID-19 pandemic, numerous factors will determine the extent of the impact on our business, including the severity of the disease, the duration of the outbreak, the distribution and efficacy of vaccines, the likelihood of a resurgence of the outbreak, actions that may be taken by governmental authorities intended to minimize the spread of the pandemic or to stimulate the economy and other unintended consequences.
Additional risks and uncertainties that may affect operating results and business performance are set forth under Item 1A of our most recent Form 10-K, and our other public filings with the Securities and Exchange Commission (the "SEC"), and include the effects and duration of the COVID-19 pandemic; the vitality of the markets we serve; the impact of economic factors such as the worldwide economy, capital flows, interest rates, foreign currency risk, and reduced sales and earnings in our international operations resulting from the weakening of local currencies versus the U.S. dollar; our ability to execute key business initiatives, including restructurings and our Enterprise Resource Planning system upgrades; potential information technology infrastructure failures or breaches in data security; potential to incur significant tax liabilities or indemnification liabilities relating to the separation and split-off of our ChampionX business; our ability to attract, retain and develop high caliber management talent to lead our business and successfully execute organizational change; our ability to successfully compete with respect to value, innovation and customer support; exposure to global economic, political and legal risks related to our international operations; difficulty in procuring raw materials or fluctuations in raw material costs; pressure on
8
operations from consolidation of customers or vendors; the costs and effects of complying with laws and regulations, including those relating to the environment and to the manufacture, storage, distribution, sale and use of our products, as well as to the conduct of our business generally, including labor and employment and anti-corruption; restraints on pricing flexibility due to contractual obligations; our ability to acquire complementary businesses and to effectively integrate such businesses; changes in tax laws and unanticipated tax liabilities; potential loss of deferred tax assets; our indebtedness, and any failure to comply with covenants that apply to our indebtedness; public health outbreaks, epidemics or pandemics, such as the current outbreak of COVID-19; potential losses arising from the impairment of goodwill or other assets; potential chemical spill or release; the occurrence of litigation or claims, including class action lawsuits; the loss or insolvency of a major customer or distributor; repeated or prolonged government and/or business shutdowns or similar events; acts of war or terrorism; natural or man-made disasters; water shortages; severe weather conditions; and other uncertainties or risks reported from time to time in our reports to the SEC. In light of these risks, uncertainties, assumptions and factors, the forward-looking events discussed in this communication may not occur. We caution that undue reliance should not be placed on forward-looking statements, which speak only as of the date made. Ecolab does not undertake, and expressly disclaims, any duty to update any forward-looking statement whether as a result of new information, future events or changes in expectations, except as required by law.
Non-GAAP Financial Information
This news release and certain of the accompanying tables include financial measures that have not been calculated in accordance with accounting principles generally accepted in the U.S. (“GAAP”).
These non-GAAP financial measures (including with respect to continuing operations) include:
| ● | fixed currency sales |
| ● | acquisition adjusted fixed currency sales |
| ● | adjusted cost of sales |
| ● | adjusted gross margin |
| ● | fixed currency operating income |
| ● | fixed currency operating income margin |
| ● | adjusted operating income |
| ● | adjusted fixed currency operating income |
| ● | adjusted fixed currency operating income margin |
| ● | acquisition adjusted fixed currency operating income |
9
| ● | acquisition adjusted fixed currency operating income margin |
| ● | adjusted other income expense |
| ● | adjusted interest expense |
| ● | adjusted tax rate |
| ● | adjusted net income attributable to Ecolab |
| ● | adjusted diluted earnings per share |
We provide these measures as additional information regarding our operating results. We use these non-GAAP measures internally to evaluate our performance and in making financial and operational decisions, including with respect to incentive compensation. We believe that our presentation of these measures provides investors with greater transparency with respect to our results of operations and that these measures are useful for period-to-period comparison of results.
Our non-GAAP adjusted financial measures for cost of sales, gross margin, operating income, other (income) expense and interest expense exclude the impact of special (gains) and charges, and our non-GAAP measures for tax rate, net income attributable to Ecolab and diluted earnings per share further exclude the impact of discrete tax items. We include items within special (gains) and charges, discrete tax items and certain external factors that we believe can significantly affect the period-over-period assessment of operating results and not necessarily reflect costs associated with historical trends and future results. After tax special (gains) and charges are derived by applying the applicable local jurisdictional tax rate to the corresponding pre-tax special (gains) and charges.
We evaluate the performance of our international operations based on fixed currency rates of foreign exchange, which eliminate the translation impact of exchange rate fluctuations on our international results. Fixed currency amounts included in this release are based on translation into U.S. dollars at the fixed foreign currency exchange rates established by management at the beginning of 2021. We also provide our segment results based on public currency rates for informational purposes.
Our reportable segments do not include the impact of intangible asset amortization from the Nalco merger or the impact of special (gains) and charges as these are not allocated to the Company’s reportable segments.
10
Acquisition adjusted growth rates exclude the results of any acquired business from the first twelve months post acquisition and exclude the results of divested businesses from the previous twelve months prior to divestiture. Acquisition adjusted growth rates also exclude sales to our Venezuelan deconsolidated subsidiaries from both the current period and comparable period of the prior year.
These non-GAAP financial measures are not in accordance with, or an alternative to, GAAP and may be different from non-GAAP measures used by other companies. Investors should not rely on any single financial measure when evaluating our business. We recommend that investors view these measures in conjunction with the GAAP measures included in this news release. Reconciliations of our non-GAAP measures are included in the following "Supplemental Non-GAAP Reconciliations" and “Supplemental Diluted Earnings per Share Information” tables included in this news release.
We do not provide reconciliations for non-GAAP estimates on a forward-looking basis (including those contained in this report) when we are unable to provide a meaningful or accurate calculation or estimation of reconciling items and the information is not available without unreasonable effort. This is due to the inherent difficulty of forecasting the timing and amount of various items that have not yet occurred, are out of our control and/or cannot be reasonably predicted, and that would impact reported earnings per share and the reported tax rate, the most directly comparable forward-looking GAAP financial measures to adjusted earnings per share and the adjusted tax rate. For the same reasons, we are unable to address the probable significance of the unavailable information.
###
(ECL-E) |
11
ECOLAB INC.
CONSOLIDATED STATEMENT OF INCOME
(unaudited)
| | First Quarter Ended | | | |||
| | March 31 | | % | |||
(millions, except per share) | | 2021 |
| 2020 | | Change | |
| | | | | | | |
Product and equipment sales | | $2,293.4 | | $2,424.0 | | | |
Service and lease sales | | 591.6 | | 596.6 | | | |
Net sales | | 2,885.0 | | 3,020.6 | | (4) | % |
Product and equipment cost of sales | | 1,362.9 | | 1,364.7 | | | |
Service and lease cost of sales | | 349.1 | | 355.5 | | | |
Cost of sales (2) | | 1,712.0 | | 1,720.2 | | 0 | % |
Selling, general and administrative expenses | | 862.9 | | 908.3 | | (5) | % |
Special (gains) and charges (2) | | 12.8 | | 15.9 | | | |
Operating income | | 297.3 | | 376.2 | | (21) | % |
Other (income) expense | | (17.0) | | (15.4) | | 10 | % |
Interest expense, net | | 51.7 | | 48.3 | | 7 | % |
Income before income taxes | | 262.6 | | 343.3 | | (24) | % |
Provision for income taxes | | 66.1 | | 47.0 | | 41 | % |
Net income including noncontrolling interest | | 196.5 | | 296.3 | | (34) | % |
Net income attributable to noncontrolling interest | | 2.9 | | 4.3 | | | |
Net income from continuing operations attributable to Ecolab | | 193.6 | | 292.0 | | (34) | % |
Net income (loss) from discontinued operations, net of tax (1) | | - | | (8.6) | | | |
Net income (loss) attributable to Ecolab | | $193.6 | | $283.4 | | (32) | % |
| | | | | | | |
Earnings attributable to Ecolab per common share | | | | | | ||
Basic | | | | | | | |
Continuing operations | | $0.68 | | $1.01 | | (33) | % |
Discontinued operations | | - | | ($0.03) | | | |
Earnings attributable to Ecolab | | $0.68 | | $0.98 | | (31) | % |
Diluted | | | | | | | |
Continuing operations | | $0.67 | | $1.00 | | (33) | % |
Discontinued operations | | - | | ($0.03) | | | |
Earnings attributable to Ecolab | | $0.67 | | $0.97 | | (31) | % |
| | | | | | | |
Weighted-average common shares outstanding | | | | | | ||
Basic | | 286.0 | | 288.8 | | (1) | % |
Diluted | | 288.8 | | 292.6 | | (1) | % |
| | | | | | | |
(1) Net Income (loss) attributable to discontinued operations, net of tax, relates to the separation of ChampionX. | |||||||
(2) Cost of sales and Special (gains) and charges in the Consolidated Statement of Income above include the following: | |||||||
| | | | | | | |
| | First Quarter Ended | | | |||
| | March 31 | | | | ||
(millions) | | 2021 | | 2020 | | | |
| | | | | | | |
Cost of sales | | | | | | | |
Restructuring activities | | $18.2 | | $3.0 | | | |
Acquisition and integration activities | | - | | 0.4 | | | |
COVID-19 activities, net | | 1.1 | | - | | | |
Other | | 0.3 | | 5.7 | | | |
Subtotal (a) | | 19.6 | | 9.1 | | | |
| | | | | | | |
Special (gains) and charges | | | | | | | |
Restructuring activities | | 3.6 | | 4.2 | | | |
Acquisition and integration activities | | 1.2 | | 5.4 | | | |
Disposal and impairment charges | | - | | 1.2 | | | |
COVID-19 activities, net | | 6.4 | | - | | | |
Other | | 1.6 | | 5.1 | | | |
Subtotal | | 12.8 | | 15.9 | | | |
| | | | | | | |
Total special (gains) and charges | | $32.4 | | $25.0 | | | |
(a) Special charges of $19.6 million and $9.1 million in the first quarter of 2021 and 2020, respectively were recorded in product and equipment cost of sales.
12
ECOLAB INC.
REPORTABLE SEGMENT INFORMATION
(unaudited)
| | First Quarter Ended March 31 | ||||||||||||
| | Fixed Currency Rates | | Public Currency Rates | ||||||||||
| | | | | | % | | | | | | % | ||
(millions) | | 2021 |
| 2020 |
| Change |
| 2021 |
| 2020 |
| Change | ||
Net Sales | | | | | | | | | | | | | | |
Global Industrial | | $1,433.9 | | $1,465.0 | | (2) | % | | $1,431.0 | | $1,433.1 | | 0 | % |
Global Institutional & Specialty | | 858.5 | | 1,087.2 | | (21) | % | | 857.4 | | 1,070.1 | | (20) | % |
Global Healthcare & Life Sciences | | 293.7 | | 256.8 | | 14 | % | | 292.7 | | 244.7 | | 20 | % |
Other | | 271.3 | | 279.6 | | (3) | % | | 270.7 | | 272.7 | | (1) | % |
Corporate | | 33.2 | | - | | * | | | 33.2 | | - | | * | |
Subtotal at fixed currency rates | | 2,890.6 | | 3,088.6 | | (6) | % | | 2,885.0 | | 3,020.6 | | (4) | % |
Currency impact | | (5.6) | | (68.0) | | * | | | - | | - | | * | |
Consolidated reported GAAP net sales | | $2,885.0 | | $3,020.6 | | (4) | % | | $2,885.0 | | $3,020.6 | | (4) | % |
| | | | | | | | | | | | | | |
Operating Income | | | | | | | | | | | | | | |
Global Industrial | | $219.2 | | $209.6 | | 5 | % | | $218.8 | | $204.8 | | 7 | % |
Global Institutional & Specialty | | 63.1 | | 183.7 | | (66) | % | | 63.2 | | 182.0 | | (65) | % |
Global Healthcare & Life Sciences | | 45.6 | | 24.0 | | 90 | % | | 45.4 | | 22.5 | | 102 | % |
Other | | 32.9 | | 21.8 | | 51 | % | | 32.8 | | 21.3 | | 54 | % |
Corporate | | (63.0) | | (55.1) | | * | | | (62.9) | | (54.4) | | * | |
Subtotal at fixed currency rates | | 297.8 | | 384.0 | | (22) | % | | 297.3 | | 376.2 | | (21) | % |
Currency impact | | (0.5) | | (7.8) | | * | | | - | | - | | * | |
Consolidated reported GAAP operating income | | $297.3 | | $376.2 | | (21) | % | | $297.3 | | $376.2 | | (21) | % |
| | | | | | | | | | | | | | |
* Not meaningful.
As shown in the “Fixed Currency Rates” tables above, we evaluate the performance of our international operations based on fixed currency exchange rates, which eliminate the impact of exchange rate fluctuations on our international operations. Amounts shown in the “Public Currency Rates” tables above reflect amounts translated at actual public average rates of exchange prevailing during the corresponding period, and are provided for informational purposes. The difference between the fixed currency exchange rates and the public currency exchange rates is reported as “Currency impact” in the “Fixed Currency Rates” tables above.
The Corporate segment includes amortization from the Nalco merger intangible assets. The Corporate segment also includes special (gains) and charges reported on the Consolidated Statement of Income.
13
ECOLAB INC.
CONSOLIDATED BALANCE SHEET
(unaudited)
| | March 31 | | December 31 | | March 31 | |||
(millions) | | 2021 | | 2020 | | 2020 | |||
Assets | | | | | | | | | |
Current assets | | | | | | | | | |
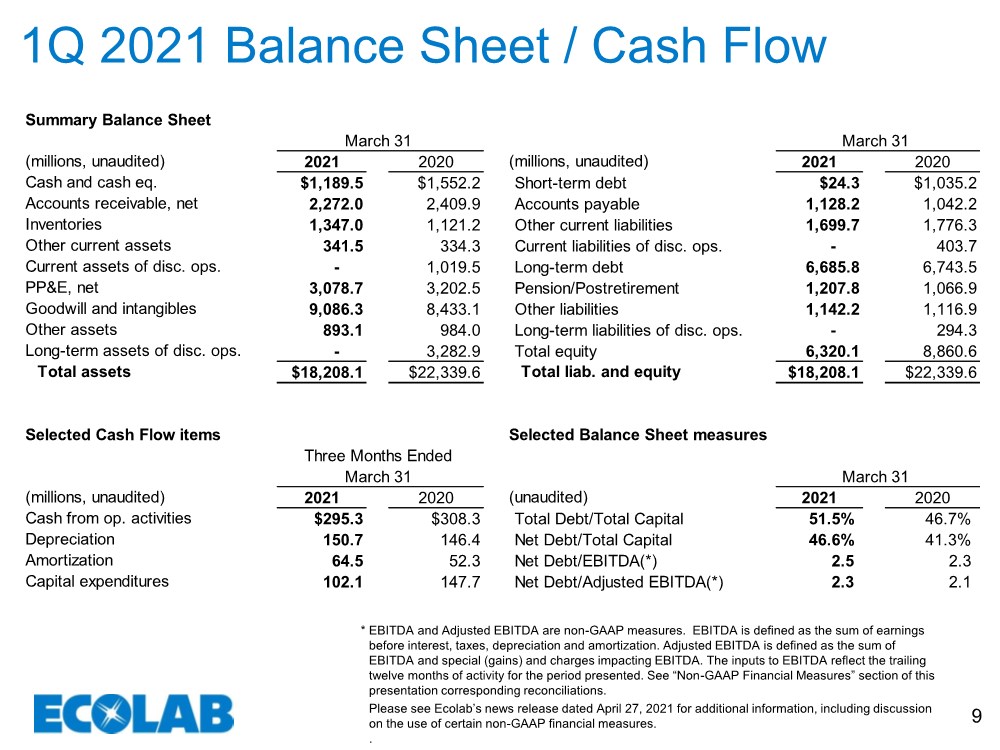
Cash and cash equivalents | | $1,189.5 | | | $1,260.2 | | | $1,552.2 | |
Accounts receivable, net | | 2,272.0 | | | 2,273.8 | | | 2,409.9 | |
Inventories | | 1,347.0 | | | 1,285.2 | | | 1,121.2 | |
Other current assets | | 341.5 | | | 298.2 | | | 334.3 | |
Current assets of discontinued operations | | - | | | - | | | 1,019.5 | |
Total current assets | | 5,150.0 | | | 5,117.4 | | | 6,437.1 | |
| | | | | | | | | |
Property, plant and equipment, net | | 3,078.7 | | | 3,124.9 | | | 3,202.5 | |
Goodwill | | 6,119.5 | | | 6,006.9 | | | 5,556.0 | |
Other intangible assets, net | | 2,966.8 | | | 2,977.0 | | | 2,877.1 | |
Operating lease assets | | 412.5 | | | 423.8 | | | 454.4 | |
Other assets | | 480.6 | | | 476.0 | | | 529.6 | |
Long-term assets of discontinued operations | | - | | | - | | | 3,282.9 | |
Total assets | | $18,208.1 | | | $18,126.0 | | | $22,339.6 | |
| | | | | | | | | |
Liabilities and Equity | | | | | | | | | |
Current liabilities | | | | | | | | | |
Short-term debt | | $24.3 | | | $17.3 | | | $1,035.2 | |
Accounts payable | | 1,128.2 | | | 1,160.6 | | | 1,042.2 | |
Compensation and benefits | | 457.6 | | | 469.3 | | | 480.6 | |
Income taxes | | 52.4 | | | 96.1 | | | 127.0 | |
Other current liabilities | | 1,189.7 | | | 1,188.9 | | | 1,168.7 | |
Current liabilities of discontinued operations | | - | | | - | | | 403.7 | |
Total current liabilities | | 2,852.2 | | | 2,932.2 | | | 4,257.4 | |
| | | | | | | | | |
Long-term debt | | 6,685.8 | | | 6,669.3 | | | 6,743.5 | |
Postretirement health care and pension benefits | | 1,207.8 | | | 1,226.2 | | | 1,066.9 | |
Deferred income taxes | | 526.8 | | | 483.9 | | | 537.6 | |
Operating lease liabilities | | 291.2 | | | 300.5 | | | 333.7 | |
Other liabilities | | 324.2 | | | 312.4 | | | 245.6 | |
Long-term liabilities of discontinued operations | | - | | | - | | | 294.3 | |
Total liabilities | | 11,888.0 | | | 11,924.5 | | | 13,479.0 | |
| | | | | | | | | |
Equity | | | | | | | | | |
Common stock | | 363.0 | | | 362.6 | | | 360.8 | |
Additional paid-in capital | | 6,285.7 | | | 6,235.0 | | | 6,018.1 | |
Retained earnings | | 8,299.3 | | | 8,243.0 | | | 10,136.9 | |
Accumulated other comprehensive loss | | (1,914.5) | | | (1,994.4) | | | (2,113.7) | |
Treasury stock | | (6,741.2) | | | (6,679.7) | | | (5,580.0) | |
Total Ecolab shareholders’ equity | | 6,292.3 | | | 6,166.5 | | | 8,822.1 | |
Noncontrolling interest | | 27.8 | | | 35.0 | | | 38.5 | |
Total equity | | 6,320.1 | | | 6,201.5 | | | 8,860.6 | |
Total liabilities and equity | | $18,208.1 | | | $18,126.0 | | | $22,339.6 | |
14
ECOLAB INC.
SUPPLEMENTAL NON-GAAP RECONCILIATIONS
(unaudited)
|
| First Quarter Ended |
| ||||
| | March 31 | | ||||
(millions, except percent and per share) | | 2021 |
| 2020 | | ||
| | | | | | | |
Net sales | | | | | | | |
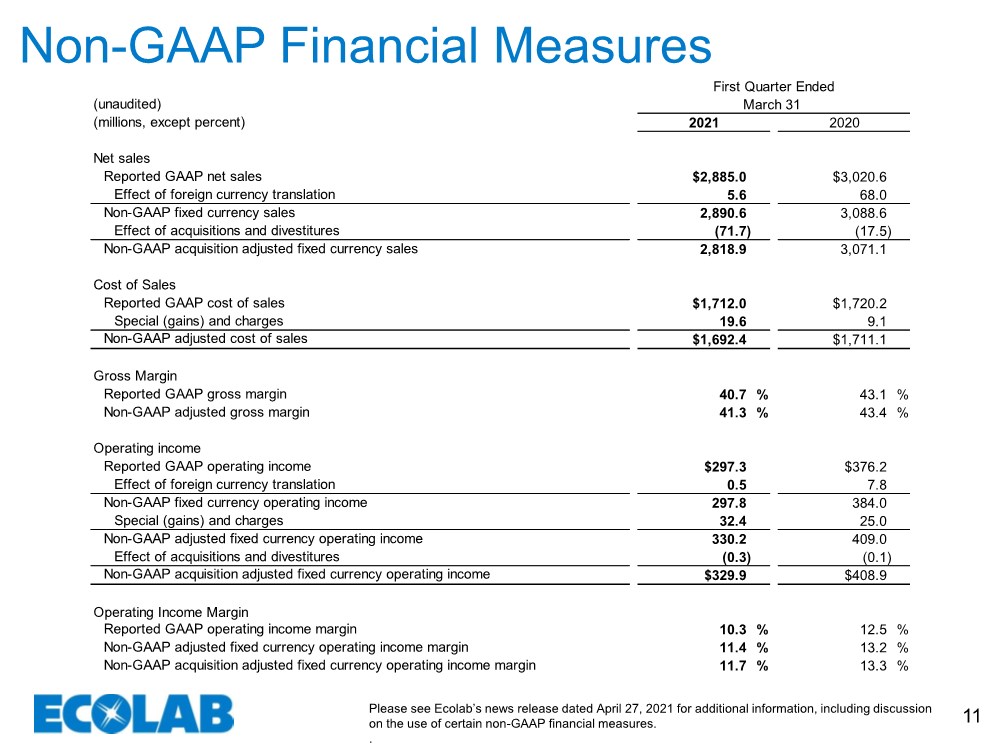
Reported GAAP net sales | | $2,885.0 | | | $3,020.6 | | |
Effect of foreign currency translation | | 5.6 | | | 68.0 | | |
Non-GAAP fixed currency sales | | 2,890.6 | | | 3,088.6 | | |
Effect of acquisitions and divestitures | | (71.7) | | | (17.5) | | |
Non-GAAP acquisition adjusted fixed currency sales | | 2,818.9 | | | 3,071.1 | | |
| | | | | | | |
Cost of sales | | | | | | | |
Reported GAAP cost of sales | | $1,712.0 | | | $1,720.2 | | |
Special (gains) and charges | | 19.6 | | | 9.1 | | |
Non-GAAP adjusted cost of sales | | $1,692.4 | | | $1,711.1 | | |
| | | | | | | |
Gross margin | | | | | | | |
Reported GAAP gross margin | | 40.7 | % | | 43.1 | % | |
Non-GAAP adjusted gross margin | | 41.3 | % | | 43.4 | % | |
| | | | | | | |
Operating income | | | | | | | |
Reported GAAP operating income | | $297.3 | | | $376.2 | | |
Effect of foreign currency translation | | 0.5 | | | 7.8 | | |
Non-GAAP fixed currency operating income | | 297.8 | | | 384.0 | | |
Special (gains) and charges | | 32.4 | | | 25.0 | | |
Non-GAAP adjusted fixed currency operating income | | 330.2 | | | 409.0 | | |
Effect of acquisitions and divestitures | | (0.3) | | | (0.1) | | |
Non-GAAP acquisition adjusted fixed currency operating income | | $329.9 | | | $408.9 | | |
| | | | | | | |
Operating income margin | | | | | | | |
Reported GAAP operating income margin | | 10.3 | % | | 12.5 | % | |
Non-GAAP adjusted fixed currency operating income margin | | 11.4 | % | | 13.2 | % | |
Non-GAAP acquisition adjusted fixed currency operating income margin | | 11.7 | % | | 13.3 | % | |
| | | | | | | |
15
ECOLAB INC.
SUPPLEMENTAL NON-GAAP RECONCILIATIONS
(unaudited)
|
| First Quarter Ended |
| ||||
| | March 31 | | ||||
(millions, except percent and per share) | | 2021 |
| 2020 | | ||
Net Income from continuing operations attributable to Ecolab | | | | | | | |
Reported GAAP net income from continuing operations attributable to Ecolab | | $193.6 | | | $292.0 | | |
Special (gains) and charges, after tax | | 24.2 | | | 18.5 | | |
Discrete tax net expense (benefit) | | 16.1 | | | (21.9) | | |
Non-GAAP adjusted net income from continuing operations attributable to Ecolab | | $233.9 | | | $288.6 | | |
| | | | | | | |
Diluted EPS from continuing operations attributable to Ecolab | | | | | | | |
Reported GAAP diluted EPS from continuing operations | | $0.67 | | | $1.00 | | |
Special (gains) and charges, after tax | | 0.08 | | | 0.06 | | |
Discrete tax net expense (benefit) | | 0.06 | | | (0.07) | | |
Non-GAAP adjusted diluted EPS from continuing operations | | $0.81 | | | $0.99 | | |
| | | | | | | |
Provision for Income Taxes | | | | | | | |
Reported GAAP tax rate | | 25.2 | % | | 13.7 | % | |
Special gains and charges | | - | | | 0.8 | | |
Discrete tax items | | (5.5) | | | 6.0 | | |
Non-GAAP adjusted tax rate | | 19.7 | % | | 20.5 | % | |
16
ECOLAB INC.
SUPPLEMENTAL NON-GAAP RECONCILIATIONS
| | First Quarter Ended March 31 | ||||||||||
(unaudited) | | 2021 | | 2020 | ||||||||
(millions) | | Fixed Currency | | Impact of Acquisitions and Divestitures | | Acquisition Adjusted | | Fixed Currency | | Impact of Acquisitions and Divestitures | | Acquisition Adjusted |
Net Sales | | | | | | | | | | | | |
Global Industrial | | $1,433.9 | | (33.1) | | $1,400.8 | | $1,465.0 | | (17.2) | | $1,447.8 |
Global Institutional & Specialty | | 858.5 | | (2.9) | | 855.6 | | 1,087.2 | | - | | 1,087.2 |
Global Healthcare & Life Sciences | | 293.7 | | (2.5) | | 291.2 | | 256.8 | | (0.3) | | 256.5 |
Other | | 271.3 | | - | | 271.3 | | 279.6 | | - | | 279.6 |
Corporate | | 33.2 | | (33.2) | | - | | - | | - | | - |
Subtotal at fixed currency rates | | 2,890.6 | | (71.7) | | 2,818.9 | | 3,088.6 | | (17.5) | | 3,071.1 |
Currency impact | | (5.6) | | | | | | (68.0) | | | | |
Consolidated reported GAAP net sales | | $2,885.0 | | | | | | $3,020.6 | | | | |
| | | | | | | | | | | | |
Operating Income | | | | | | | | | | | | |
Global Industrial | | $219.2 | | (1.3) | | $217.9 | | $209.6 | | (0.1) | | $209.5 |
Global Institutional & Specialty | | 63.1 | | 1.0 | | 64.1 | | 183.7 | | - | | 183.7 |
Global Healthcare & Life Sciences | | 45.6 | | - | | 45.6 | | 24.0 | | - | | 24.0 |
Other | | 32.9 | | - | | 32.9 | | 21.8 | | - | | 21.8 |
Corporate | | (30.6) | | - | | (30.6) | | (30.1) | | - | | (30.1) |
Adjusted at fixed currency rates | | 330.2 | | (0.3) | | 329.9 | | 409.0 | | (0.1) | | 408.9 |
Special (gains) and charges | | 32.4 | | | | | | 25.0 | | | | |
Reported OI at fixed currency rates | | 297.8 | | | | | | 384.0 | | | | |
Currency impact | | (0.5) | | | | | | (7.8) | | | | |
Consolidated reported GAAP operating income | | $297.3 | | | | | | $376.2 | | | | |
| | | | | | | | | | | | |
17
ECOLAB INC.
SUPPLEMENTAL DILUTED EARNINGS PER SHARE INFORMATION
(unaudited)
The table below provides a reconciliation of diluted earnings per share from continuing operations, as reported, to the non-GAAP measure of adjusted diluted earnings per share from continuing operations.
|
| First |
| Second |
| Six |
| Third |
| Nine |
| Fourth |
|
| |
| | Quarter | | Quarter | | Months | | Quarter | | Months | | Quarter | | Year | |
| | Ended | | Ended | | Ended | | Ended | | Ended | | Ended | | Ended | |
| | Mar. 31 | | June 30 | | June 30 | | Sept. 30 | | Sept. 30 | | Dec. 31 | | Dec. 31 | |
| | 2020 | | 2020 | | 2020 | | 2020 | | 2020 | | 2020 | | 2020 | |
Diluted earnings per share, as reported (U.S. GAAP) | | $1.00 | | $0.44 | | $1.44 | | $0.85 | | $2.29 | | $1.04 | | $3.33 | |
Adjustments: | | | | | | | | | | | | | | | |
Special (gains) and charges (1) | | 0.06 | | 0.29 | | 0.35 | | 0.34 | | 0.69 | | 0.19 | | 0.88 | |
Discrete tax expense (benefits) (2) | | (0.07) | | (0.08) | | (0.15) | | (0.04) | | (0.20) | | 0.00 | | (0.19) | |
Adjusted diluted earnings per share (Non-GAAP) | | $0.99 | | $0.65 | | $1.64 | | $1.15 | | $2.79 | | $1.23 | | $4.02 | |
|
| First |
| Second |
| Six |
| Third |
| Nine |
| Fourth |
|
|
|
| | Quarter | | Quarter | | Months | | Quarter | | Months | | Quarter | | Year |
|
| | Ended | | Ended | | Ended | | Ended | | Ended | | Ended | | Ended |
|
| | Mar. 31 | | June 30 | | June 30 | | Sept. 30 | | Sept. 30 | | Dec. 31 | | Dec. 31 |
|
| | 2021 | | 2021 | | 2021 | | 2021 | | 2021 | | 2021 | | 2021 |
|
Diluted earnings per share, as reported (U.S. GAAP) | | $0.67 | | | | | | | | | | | | | |
Adjustments: | | | | | | | | | | | | | | | |
Special (gains) and charges (3) | | 0.08 | | | | | | | | | | | | | |
Discrete tax expense (benefits) (4) | | 0.06 | | | | | | | | | | | | | |
Adjusted diluted earnings per share (Non-GAAP) | | $0.81 | | | | | | | | | | | | | |
Per share amounts do not necessarily sum due to changes in shares outstanding and rounding.
(1) Special (gains) and charges for 2020 includes charges of $18.5 million, $83.3 million, $98.5 million and $53.8 million, net of tax in the first, second, third and fourth quarters, respectively. Charges include debt refinancing charges, restructuring charges relating to the efficiency initiative, disposal and impairment charges, Healthcare product recall charges, acquisition and integration charges, charges for pay protection for certain employees impacted by COVID-19 net of government subsidies, and litigation and other charges.
(2) Discrete tax expenses (benefits) for 2020 includes ($21.9) million, ($22.5) million, ($12.4) million and $1.0 million in the first, second, third and fourth quarters, respectively. These expenses (benefits) are primarily associated with stock compensation excess tax benefits, offset by other discrete tax expense.
(3) Special (gains) and charges for 2021 includes charges of $24.2 million, net of tax in the first quarter. Charges include restructuring charges, charges for pay protection for certain employees impacted by COVID-19 net of government subsidies, acquisition and integration charges, and litigation and other charges.
(4) Discrete tax expenses (benefits) for 2021 includes $16.1 million in the first quarter. These expenses (benefits) are primarily associated with stock compensation excess tax benefits more than offset by other discrete tax expense.
18