Exhibit 99.1

News Release
Ecolab Inc.
1 Ecolab Place,
St. Paul, Minnesota 55102
| | |
| Michael J. Monahan (651) 250-2809 | |
| Andrew C. Hedberg (651) 250-2185 | |
ECOLAB SECOND QUARTER REPORTED DILUTED CONTINUING OPERATIONS EPS $0.44
ADJUSTED DILUTED CONTINUING OPERATIONS EPS $0.65, -49%
SECOND QUARTER HIGHLIGHTS:
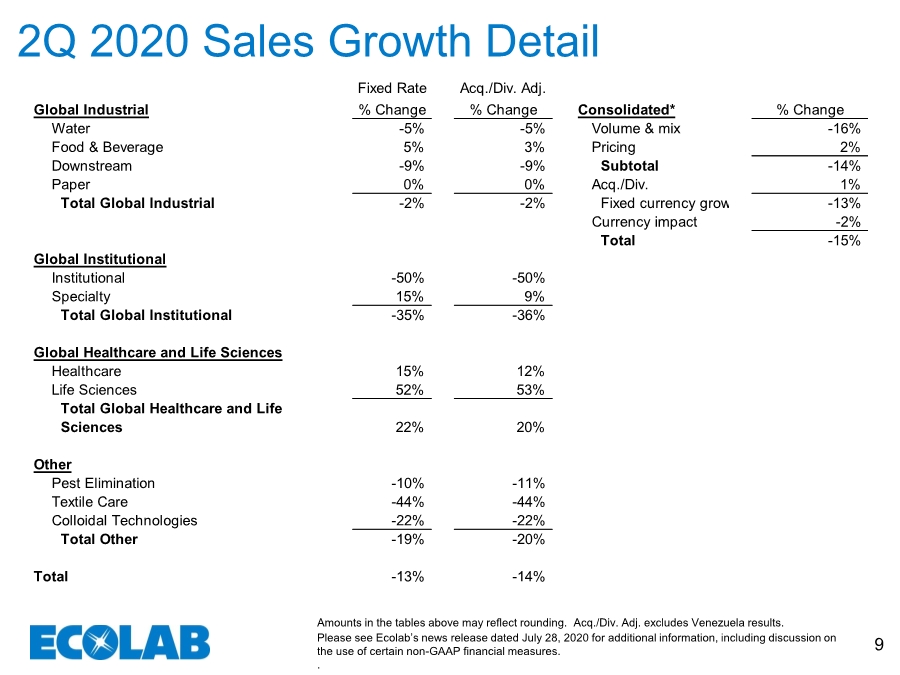
| ● | Reported sales from continuing operations -15%. Acquisition adjusted fixed currency sales -14% as strong growth in the Healthcare and Life Sciences segment was more than offset by a modest Industrial segment decrease and significant declines in the Institutional and Other segments. |
| ● | Reported diluted EPS from continuing operations $0.44, -63%. |
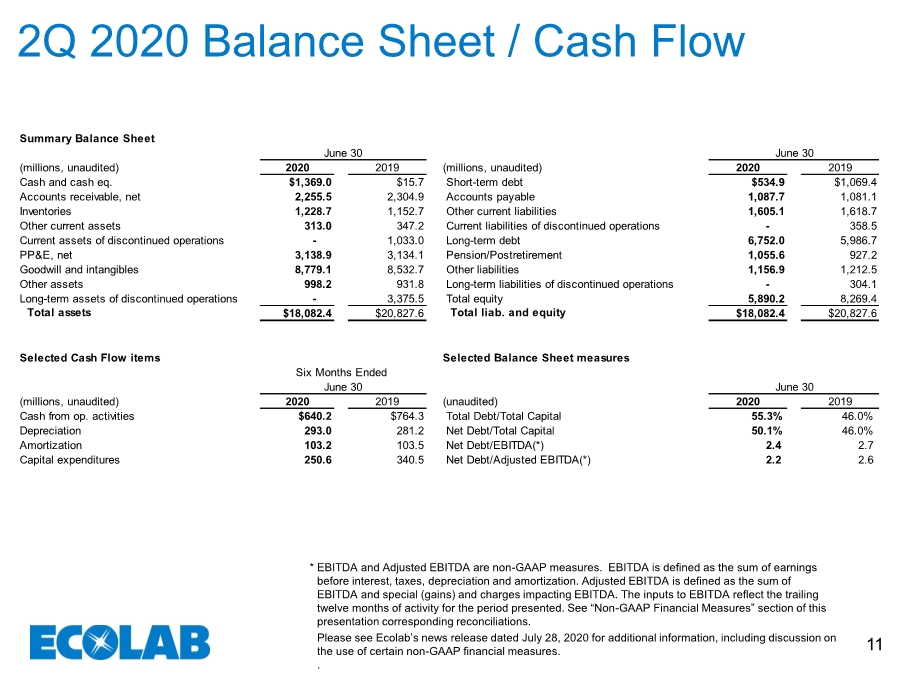
| ● | Cash flow from operating activities of $387 million (with $332 million from continuing operations). Free cash flow of $275 million (with $229 million from continuing operations). |
| | Second Quarter Ended June 30 | ||||||||||||||||
| | Reported | | | | | Adjusted | | | | ||||||||
(unaudited) | | Public Currency Rates | | % | | Public Currency Rates | | % | ||||||||||
(millions, except per share) | | 2020 | | 2019 | | Change | | 2020 | | | 2019 | | Change | |||||
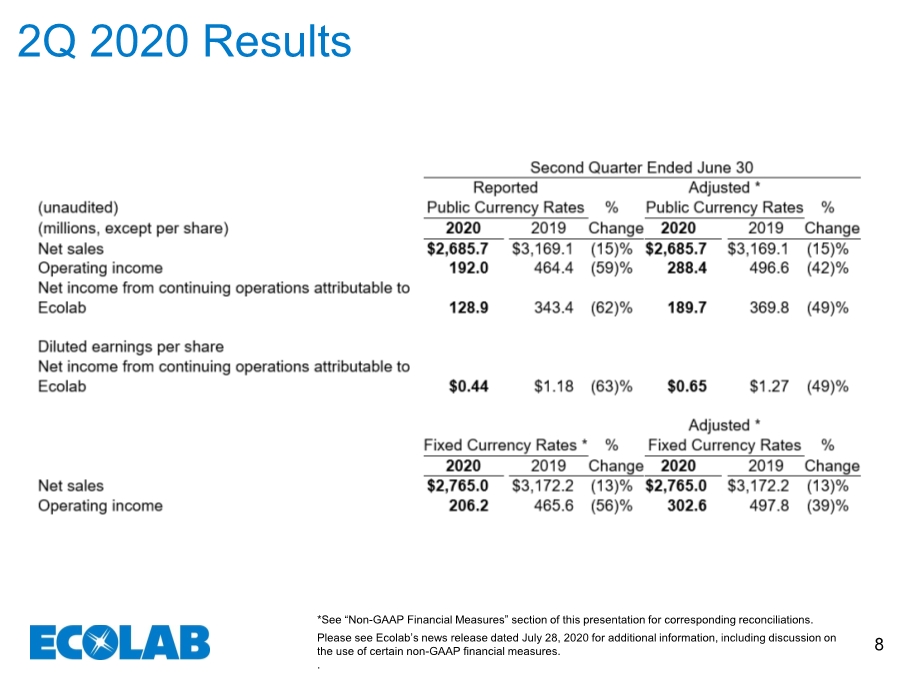
Net sales | | $2,685.7 | | | $3,169.1 | | | (15) | % | | $2,685.7 | | | $3,169.1 | | | (15) | % |
Operating income | | 192.0 | | | 464.4 | | | (59) | % | | 288.4 | | | 496.6 | | | (42) | % |
Net income from continuing operations attributable to Ecolab | | 128.9 | | | 343.4 | | | (62) | % | | 189.7 | | | 369.8 | | | (49) | % |
| | | | | | | | | | | | | | | | | | |
Diluted earnings per share | | | | | | | | | | | | | | | | | | |
Net income from continuing operations attributable to Ecolab | | $0.44 | | | $1.18 | | | (63) | % | | $0.65 | | | $1.27 | | | (49) | % |
| | | | | | | | | | | | | | | | | | |
| | | | | | | | | | | Adjusted | | | | ||||
| | Fixed Currency Rates | | % | | Fixed Currency Rates | | % | ||||||||||
| | 2020 | | 2019 | | Change | | 2020 | | | 2019 | | Change | |||||
Net sales | | $2,765.0 | | | $3,172.2 | | | (13) | % | | $2,765.0 | | | $3,172.2 | | | (13) | % |
Operating income | | 206.2 | | | 465.6 | | | (56) | % | | 302.6 | | | 497.8 | | | (39) | % |
Ecolab separated the ChampionX business, formerly the Upstream Energy Segment, on June 3, 2020. All results from ChampionX, including operating results, special charges associated with the separation and the loss on separation are reported in the line “Net income from discontinued operations, net of tax”. All sales and earnings commentary in this release, unless specifically noted, are regarding the results of our continuing operations and exclude ChampionX.
1
ST. PAUL, Minn., July 28, 2020: Results reflect the impact of COVID-19 as strong top and bottom line growth in the Healthcare and Life Sciences segment and very good income growth in the Industrial segment was more than offset by significant declines in the Institutional and Other segments. Adjusted earnings from continuing operations reflected the COVID-19 related volume declines and negative operating leverage, as well as certain COVID-19 related impacts including second quarter equipment lease billing suspensions of approximately $0.10 per share to support customers, a $0.06 per share reduction in Institutional distributor inventories and increased bad debt expense of $0.07 per share. Reported earnings from discontinued operations included the previously disclosed non-cash charge from the separation of the ChampionX business.
CEO comment
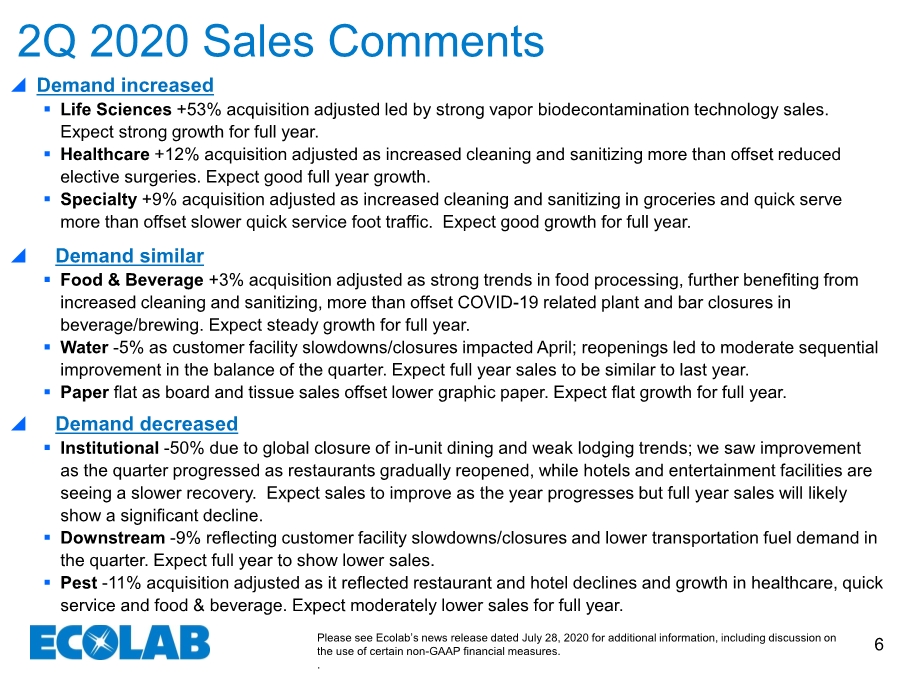
Commenting on the quarter, Douglas M. Baker, Jr., Ecolab’s chairman and chief executive officer said, “Our second quarter results were significantly impacted by COVID-19 but were in line with our expectations. The impacts were most acutely felt in our Institutional business as the rest of our businesses collectively grew both sales and income during the period:
| ● | Healthcare and Life Sciences had record growth. |
| ● | Our Industrial businesses had strong margin performance driving strong income gains. |
| ● | The Specialty portion of our Institutional segment also realized strong growth. |
“Our Institutional business was directly impacted by the COVID-19 shutdown of travel and dining early in the second quarter. This was further exacerbated by the resultant distributor inventory reductions and a decision we made to suspend second quarter dish machine lease billings as a means of supporting the restaurant and hospitality industry during this incredibly traumatic period.
“We believe the second quarter is the low point for both the Institutional business and the company, and we expect sequential quarterly improvement for both leading into 2021. We do not expect the distributor inventory reduction to repeat, and the lease billings suspension was only a second quarter event. The end markets recovered through the second quarter and the trend has continued into July. While we continue to expect both the COVID-19 and economic challenges to persist into 2021, we expect our customers’ overall consumption to be stronger in the third and fourth quarters than the second quarter.
2
“What should not get lost in the current temporary challenges is the much more significant long-term opportunities. Even in the midst of the early chaos, we were very successful in gaining share. Hygiene standards and awareness have been heightened and our expertise is in high demand. Remote capabilities, which have been a key component of our digital investments, have become an even more significant advantage. New opportunities have emerged in virtually every industry we serve, and new business generation remains at a high level.
“We are already on it. We are accelerating technology rollouts, further expanding our hygiene and hand care product capacity, and we have an aggressive respond-and-recover plan in Institutional which will accelerate the recovery, penetration and unit share gains.
“We feel confident we will emerge from 2020 in a strong position. While we have challenges to fix, we have a greater number of opportunities to chase. I am very pleased with our team’s ability to adjust where needed and to capitalize on our strengths and opportunities to continue and grow share.”
Second Quarter 2020 Consolidated Results from Continuing Operations
Ecolab's second quarter reported sales decreased 15% and fixed currency sales decreased 13%. Acquisition and divestiture adjusted fixed currency sales decreased 14% when compared to the prior year.
Second quarter 2020 reported operating income decreased 59% and fixed currency operating income decreased 56%; both include the impact of special charges, primarily related to the impairment of a minority equity investment, pay protection for certain employees impacted by the COVID-19 effects net of government subsidies, loss on disposal of Holchem Group and the previously announced Healthcare product recall in Europe. Adjusted fixed currency operating income decreased 39% as lower volume, unfavorable business mix, reduced leverage and increased bad debt expense more than offset pricing, lower discretionary spending and cost savings initiatives.
Reported other income, which primarily consists of the return on pension assets and other non-service costs of our pension obligations, decreased 28%, reflecting the amortization of prior year losses driven by the impact of lower discount rates on liabilities.
3
Reported interest expense increased 19% in the quarter primarily reflecting higher average debt levels through the quarter.
The reported income tax rate for the second quarter of 2020 was 9.5% compared with the reported rate of 20.4% in the second quarter of 2019. Excluding special gains and charges and discrete tax items, the adjusted tax rate for the second quarter of 2020 was 20.5% compared with the adjusted tax rate of 20.2% in the second quarter of 2019.
Second quarter 2020 reported net income attributable to Ecolab decreased 62%. Excluding the impact of special gains and charges and discrete tax items, adjusted net income attributable to Ecolab decreased 49%.
Reported diluted earnings per share decreased 63%. Adjusted diluted earnings per share declined 49% when compared against second quarter 2019. Currency translation had a $0.04 unfavorable impact on second quarter 2020 adjusted diluted earnings per share.
Ecolab reduced the number of shares of its common stock outstanding by 5 million shares in the second quarter of 2020 as a result of the exchange offer in connection with the ChampionX separation. The share exchange resulted in a 1.7 million weighted average share decrease to the second quarter shares outstanding.
ChampionX Separation – Discontinued Operations
During the second quarter, Ecolab completed the previously announced separation of the Upstream Energy segment (the ChampionX business) in a Reverse Morris Trust transaction, in which ChampionX was merged with a subsidiary of Apergy Corporation (following the transaction the combined company was renamed ChampionX).
Ecolab’s former ChampionX business and related special gains and charges are reflected in the
financial statements, including for periods prior to the separation, as discontinued operations.
Ecolab recorded a previously disclosed $2.1 billion non-cash charge in the second quarter. This represents the difference between the $3.7 billion net assets of ChampionX less the $0.5 billion cash consideration received and the $1.1 billion value of the 5 million Ecolab shares exchanged in the transaction. This calculation does not include the full value received by the shareholders nor
4
the cash earned by Ecolab during its ownership of the business. Discontinued operations in the second quarter also included $41 million of special charges, net of tax, primarily related to expenses associated with the separation and discrete tax items.
Second Quarter 2020 Segment Review
Segment results reflect the continuing operations of the Company.
Global Industrial | | | | | | | | | | | | |
| | | | | | | | | | | | |
(unaudited) | | Second Quarter Ended June 30 | | | | | Acq. Adj. | |||||
(millions) |
| 2020 | | 2019 | | % Change |
| % Change | ||||
| | | | | | | | | | | | |
Fixed currency | | | | | | | | | | | | |
Sales | | $1,475.6 | | | $1,500.7 | | | (2) | % | | (2) | % |
Operating income | | 283.0 | | | 220.9 | | | 28 | % | | 28 | % |
Operating income margin | | 19.2 | % | | 14.7 | % | | | | | | |
Acq. adj. operating income margin | | 19.2 | % | | 14.7 | % | | | | | | |
| | | | | | | | | | | | |
Public currency | | | | | | | | | | | | |
Sales | | $1,425.2 | | | $1,501.0 | | | (5) | % | | | |
Operating income | | 272.3 | | | 220.9 | | | 23 | % | | | |
Note: The Industrial segment includes Water, Food & Beverage, Downstream and Paper
Acquisition adjusted fixed currency sales were 2% lower as modest growth in Food & Beverage was more than offset by lower volumes in the other Industrial businesses. Acquisition adjusted fixed currency operating income increased 28% reflecting the benefits of pricing, lower discretionary spending and cost savings initiatives, which more than offset the lower volume in the quarter.
Global Institutional | | | | | | | | | | | | |
| | | | | | | | | | | | |
(unaudited) | | Second Quarter Ended June 30 | | | | | Acq. Adj. | |||||
(millions) |
| 2020 | | 2019 | | % Change |
| % Change | ||||
| | | | | | | | | | | | |
Fixed currency | | | | | | | | | | | | |
Sales | | $722.4 | | | $1,112.5 | | | (35) | % | | (36) | % |
Operating income | | (37.0) | | | 234.4 | | | (116) | % | | (116) | % |
Operating income margin | | (5.1) | % | | 21.1 | % | | | | | | |
Acq. adj. operating income margin | | (5.3) | % | | 21.1 | % | | | | | | |
| | | | | | | | | | | | |
Public currency | | | | | | | | | | | | |
Sales | | $708.1 | | | $1,110.4 | | | (36) | % | | | |
Operating income | | (37.8) | | | 233.6 | | | (116) | % | | | |
Note: The Institutional segment includes Institutional and Specialty
5
Acquisition adjusted fixed currency sales declined 36%. Very strong growth in Specialty was more than offset by a sharp decline in the Institutional business, where strong sanitizing product sales were more than offset by significantly depressed restaurant, lodging and entertainment facility demand as well as inventory reductions by distributors. Acquisition adjusted fixed currency operating income fell 116% reflecting the significant volume decline and reduced operating leverage (which include certain suspended equipment lease billings), unfavorable mix and increased bad debt expense, which more than offset lower discretionary spending and cost savings initiatives.
Global Healthcare and Life Sciences | | | | | | | | | | | | |
| | | | | | | | | | | | |
(unaudited) | | Second Quarter Ended June 30 | | | | | Acq. Adj. | |||||
(millions) |
| 2020 | | 2019 | | % Change |
| % Change | ||||
| | | | | | | | | | | | |
Fixed currency` | | | | | | | | | | | | |
Sales | | $307.6 | | | $252.8 | | | 22 | % | | 20 | % |
Operating income | | 65.6 | | | 31.2 | | | 110 | % | | 110 | % |
Operating income margin | | 21.3 | % | | 12.3 | % | | | | | | |
Acq. adj. operating income margin | | 21.7 | % | | 12.4 | % | | | | | | |
| | | | | | | | | | | | |
Public currency | | | | | | | | | | | | |
Sales | | $298.5 | | | $251.9 | | | 18 | % | | | |
Operating income | | 63.0 | | | 31.0 | | | 103 | % | | | |
Note: The Healthcare and Life Sciences segment includes Healthcare and Life Sciences
Acquisition adjusted fixed currency sales grew 20% led by strong results benefiting from increased sales due to the COVID-19 related demand in both the Healthcare and Life Sciences businesses. Acquisition adjusted fixed currency operating income grew 110% reflecting the strong volume gains, favorable mix, improved pricing and lower discretionary spending.
6
Other | | | | | | | | | | | | | |
| | | | | | | | | | | | | |
(unaudited) | | Second Quarter Ended June 30 | | | | | | Acq. Adj. | |||||
(millions) |
| 2020 | | 2019 | | | % Change |
| % Change | ||||
| | | | | | | | | | | | | |
Fixed currency | | | | | | | | | | | | | |
Sales | | $247.1 | | | $306.2 | | | | (19) | % | | (20) | % |
Operating income | | 21.3 | | | 41.8 | | | | (49) | % | | (50) | % |
Operating income margin | | 8.6 | % | | 13.7 | % | | | | | | | |
Acq. adj. operating income margin | | 8.5 | % | | 13.7 | % | | | | | | | |
| | | | | | | | | | | | | |
Public currency | | | | | | | | | | | | | |
Sales | | $241.6 | | | $305.8 | | | | (21) | % | | | |
Operating income | | 20.8 | | | 41.8 | | | | (50) | % | | | |
Note: The Other segment includes Pest Elimination, Textile Care and Colloidal Technologies
Acquisition adjusted fixed currency sales growth declined 20%, primarily reflecting the impact of partial and full customer closures along with limited vendor access due to COVID-19 related restrictions. Acquisition adjusted fixed currency operating income decreased 50% due to the impact of lower volume, reduced operating leverage and unfavorable mix, which more than offset lower discretionary spending and cost savings initiatives.
Corporate
Corporate expense includes amortization expense of $30 million in the second quarter of 2020 and $31 million in the second quarter of 2019 related to the Nalco merger intangible assets. Corporate expense also includes net special charges of $97 million ($83 million after tax) in 2020. These charges are primarily related to the impairment of a minority equity investment, pay protection for certain employees impacted by the COVID-19 effects net of government subsidies, loss on disposal of the Holchem Group and the previously announced Healthcare product recall in Europe.
Special gains and charges for the second quarter of 2019 were a net charge of $32 million ($25 million after tax) primarily related to the previously announced efficiency initiative.
Business Outlook
The continued uncertain outlook regarding the full extent of COVID-19’s impact on the global economy and its longevity do not yet provide an adequate basis for us to provide either quarterly or annual earnings forecasts.
7
Assuming a gradual, if uneven, recovery from the first half COVID-19 impact, we expect full year 2020 Healthcare and Life Sciences segment sales to show strong growth over the prior year, with modest pressure on our Industrial segment businesses and lessening but still significant pressure on sales of our Institutional and Other segments, with the COVID-19 impact on restaurant, hospitality and entertainment to result in a significant decline for the Institutional division within the Institutional segment for the full year. We expect a gradual sequential improvement from second quarter levels through the second half as our product and service innovation, investments in new hygiene and digital technologies, and successful sales initiatives augment a continuing recovery in customer activity.
About Ecolab
A trusted partner at nearly three million commercial customer locations, Ecolab (ECL) is the global leader in water, hygiene and infection prevention solutions and services. With annual sales of $13 billion and more than 45,000 associates, Ecolab delivers comprehensive solutions, data-driven insights and personalized service to advance food safety, maintain clean and safe environments, optimize water and energy use, and improve operational efficiencies and sustainability for customers in the food, healthcare, hospitality and industrial markets in more than 170 countries around the world. www.ecolab.com
Ecolab will host a live webcast to review the second quarter earnings announcement today at 1:00 p.m. Eastern Time. The webcast, along with related materials, will be available to the public on Ecolab's website at www.ecolab.com/investor. A replay of the webcast and related materials will be available at that site.
Cautionary Statements Regarding Forward-Looking Information
This communication contains certain statements relating to future events and our intentions, beliefs, expectations and predictions for the future which are forward-looking statements as that term is defined in the Private Securities Litigation Reform Act of 1995. Words or phrases such as “will likely result,” “are expected to,” “will continue,” “is anticipated,” “we believe,” “we expect,” “estimate,” “project,” “may,” “will,” “intend,” “plan,” “believe,” “target,” “forecast” (including the negative or variations thereof) or similar terminology used in connection with any discussion of future plans, actions or events generally identify forward-looking statements. These forward-looking statements include, but are not limited to, statements regarding our financial and business performance and
8
prospects, including the impact of the coronavirus outbreak on our sales, operating results and cash flows and investments in technologies. These statements are based on the current expectations of management of the company. There are a number of risks and uncertainties that could cause actual results to differ materially from the forward-looking statements included in this communication. With respect to the coronavirus, numerous factors will determine the extent of the impact on our business, including the extent to which the COVID-19 pandemic continues to spread; actions by various governments to address the COVID-19 pandemic, such as stay-at-home orders and restrictions on gatherings and travel; scientific advances to combat COVID-19; the time it takes for our key end markets to recover; the financial health of our customers and channel partners; potential supply chain disruptions; and the health and welfare of our employees.
Additional risks and uncertainties that may affect operating results and business performance are set forth under Item 1A of our most recent Form 10-K, and our other public filings with the Securities and Exchange Commission (the "SEC") and include the effects and duration of the coronavirus (COVID-19) pandemic, the vitality of the markets we serve; the impact of economic factors such as the worldwide economy, capital flows, interest rates, foreign currency risk, and reduced sales and earnings in our international operations resulting from the weakening of local currencies versus the U.S. dollar; our ability to execute key business initiatives, including restructurings and our Enterprise Resource Planning system upgrades; potential information technology infrastructure failures or breaches in data security; our ability to attract, retain and develop high caliber management talent to lead our business; our ability to successfully compete with respect to value, innovation and customer support; exposure to global economic, political and legal risks related to our international operations; difficulty in procuring raw materials or fluctuations in raw material costs; pressure on operations from consolidation of customers and vendors; the costs and effects of complying with laws and regulations, including those relating to the environment, to the manufacture, storage, distribution, sale and use of our products and to labor and employment, as well as to the conduct of our business generally; the occurrence of litigation or claims; restraints on pricing flexibility due to contractual obligations; our ability to acquire complementary businesses and to effectively integrate such businesses; changes in tax laws and unanticipated tax liabilities; potential loss of deferred tax assets; our indebtedness, and any failure to comply with covenants that apply to our indebtedness; public health outbreaks, epidemics or pandemics, such as the current outbreak of COVID-19; potential losses arising from the impairment of goodwill or other assets; potential chemical spill or release; the loss or insolvency of a major
9
customer or distributor; repeated or prolonged government and/or business shutdowns or similar events; acts of war or terrorism; natural or man-made disasters; water shortages; severe weather conditions; and other uncertainties or risks reported from time to time in our reports to the SEC. In light of these risks, uncertainties, assumptions and factors, the forward-looking events discussed in this communication may not occur. We caution that undue reliance should not be placed on forward-looking statements, which speak only as of the date made. Ecolab does not undertake, and expressly disclaims, any duty to update any forward-looking statement whether as a result of new information, future events or changes in expectations, except as required by law.
Non-GAAP Financial Information
This news release and certain of the accompanying tables include financial measures that have not been calculated in accordance with accounting principles generally accepted in the U.S. (“GAAP”).
These non-GAAP financial measures (including with respect to continuing operations) include:
| ● | fixed currency sales |
| ● | acquisition adjusted fixed currency sales |
| ● | adjusted cost of sales |
| ● | adjusted gross margin |
| ● | fixed currency operating income |
| ● | fixed currency operating income margin |
| ● | adjusted operating income |
| ● | adjusted fixed currency operating income |
| ● | adjusted fixed currency operating income margin |
| ● | acquisition adjusted fixed currency operating income |
| ● | acquisition adjusted fixed currency operating income margin |
| ● | adjusted other income expense |
| ● | adjusted interest expense |
| ● | adjusted tax rate |
| ● | adjusted net income attributable to Ecolab |
| ● | adjusted diluted earnings per share |
| ● | adjusted diluted operating earnings per share |
| ● | free cash flow |
10
We provide these measures as additional information regarding our operating results. We use these non-GAAP measures internally to evaluate our performance and in making financial and operational decisions, including with respect to incentive compensation. We believe that our presentation of these measures provides investors with greater transparency with respect to our results of operations and that these measures are useful for period-to-period comparison of results.
Our non-GAAP adjusted financial measures for cost of sales, gross margin, operating income, other (income) expense and interest expense exclude the impact of special (gains) and charges, and our non-GAAP measures for tax rate, net income attributable to Ecolab and diluted earnings per share further exclude the impact of discrete tax items. We include items within special (gains) and charges, discrete tax items and certain external factors that we believe can significantly affect the period-over-period assessment of operating results and not necessarily reflect costs associated with historical trends and future results. After tax special (gains) and charges are derived by applying the applicable local jurisdictional tax rate to the corresponding pre-tax special (gains) and charges.
We evaluate the performance of our international operations based on fixed currency rates of foreign exchange, which eliminate the translation impact of exchange rate fluctuations on our international results. Fixed currency amounts included in this release are based on translation into U.S. dollars at the fixed foreign currency exchange rates established by management at the beginning of 2020. We also provide our segment results based on public currency rates for informational purposes.
Our reportable segments do not include the impact of intangible asset amortization from the Nalco merger or the impact of special (gains) and charges as these are not allocated to the Company’s reportable segments.
Acquisition adjusted growth rates exclude the results of any acquired business from the first twelve months post acquisition and exclude the results of divested businesses from the previous twelve months prior to divestiture. Acquisition adjusted growth rates also exclude sales to our Venezuelan deconsolidated subsidiaries from both the current period and comparable period of the prior year.
11
We define free cash flow as net cash provided by operating activities less cash outlays for capital expenditures. It should not be inferred that the entire free cash flow amount is available for discretionary expenditures. It should not be considered a substitute for income or cash flow data prepared in accordance with U.S. GAAP and may not be comparable to similarly titled measures used by other companies. We believe free cash flow is meaningful to investors as it functions as a useful measure of performance and we use this measure as an indication of the strength of the Company and its ability to generate cash.
These non-GAAP financial measures are not in accordance with, or an alternative to, GAAP and may be different from non-GAAP measures used by other companies. Investors should not rely on any single financial measure when evaluating our business. We recommend that investors view these measures in conjunction with the GAAP measures included in this news release. Reconciliations of our non-GAAP measures are included in the following "Supplemental Non-GAAP Reconciliations" and “Supplemental Diluted Earnings per Share Information” tables included in this news release.
We do not provide reconciliations for non-GAAP estimates on a forward-looking basis (including those contained in this report) when we are unable to provide a meaningful or accurate calculation or estimation of reconciling items and the information is not available without unreasonable effort. This is due to the inherent difficulty of forecasting the timing and amount of various items that have not yet occurred, are out of our control and/or cannot be reasonably predicted, and that would impact reported earnings per share and the reported tax rate, the most directly comparable forward-looking GAAP financial measures to adjusted earnings per share and the adjusted tax rate. For the same reasons, we are unable to address the probable significance of the unavailable information.
###
(ECL-E) |
12
ECOLAB INC.
CONSOLIDATED STATEMENT OF INCOME
(unaudited)
| | Second Quarter Ended | | | | Six Months Ended | |
| ||||||
| | June 30 | | % | | June 30 | | % | ||||||
(millions, except per share) | | 2020 |
| 2019 | | Change |
| 2020 |
| 2019 |
| Change | ||
| | | | | | | | | | | | | | |
Product and equipment sales | | $2,167.1 | | $2,560.0 | | | | | $4,591.1 | | $4,919.8 | | | |
Service and lease sales | | 518.6 | | 609.1 | | | | | 1,115.2 | | 1,174.0 | | | |
Net sales | | 2,685.7 | | 3,169.1 | | (15) | % | | 5,706.3 | | 6,093.8 | | (6) | % |
Product and equipment cost of sales | | 1,301.5 | | 1,422.1 | | | | | 2,666.2 | | 2,762.7 | | | |
Service and lease cost of sales | | 334.2 | | 358.2 | | | | | 689.7 | | 693.1 | | | |
Cost of sales (2) | | 1,635.7 | | 1,780.3 | | (8) | % | | 3,355.9 | | 3,455.8 | | (3) | % |
Selling, general and administrative expenses | | 788.6 | | 900.0 | | (12) | % | | 1,696.9 | | 1,796.1 | | (6) | % |
Special (gains) and charges (2) | | 69.4 | | 24.4 | | | | | 85.3 | | 63.9 | | | |
Operating income | | 192.0 | | 464.4 | | (59) | % | | 568.2 | | 778.0 | | (27) | % |
Other (income) expense | | (15.1) | | (20.9) | | (28) | % | | (30.5) | | (42.1) | | (28) | % |
Interest expense, net (2) | | 58.7 | | 49.2 | | 19 | % | | 107.0 | | 98.5 | | 9 | % |
Income before income taxes | | 148.4 | | 436.1 | | (66) | % | | 491.7 | | 721.6 | | (32) | % |
Provision for income taxes | | 14.1 | | 88.8 | | (84) | % | | 61.1 | | 118.7 | | (49) | % |
Net income including noncontrolling interest | | 134.3 | | 347.3 | | (61) | % | | 430.6 | | 602.9 | | (29) | % |
Net income attributable to noncontrolling interest | | 5.4 | | 3.9 | | | | | 9.7 | | 7.9 | | | |
Net income from continuing operations attributable to Ecolab | | 128.9 | | 343.4 | | (62) | % | | 420.9 | | 595.0 | | (29) | % |
Net income from discontinued operations, net of tax (1) | | (2,163.9) | | 25.2 | | (8687) | % | | (2,172.5) | | 70.1 | | (3199) | % |
Net income attributable to Ecolab | | ($2,035.0) | | $368.6 | | (652) | % | | ($1,751.6) | | $665.1 | | (363) | % |
| | | | | | | | | | | | | | |
Earnings attributable to Ecolab per common share | | | | | | | | | | | | | ||
Basic | | | | | | | | | | | | | | |
Continuing operations | | $0.45 | | $1.19 | | (62) | % | | $1.46 | | $2.07 | | (29) | % |
Discontinued operations | | ($7.51) | | $0.09 | | (8444) | % | | ($7.53) | | $0.24 | | (3238) | % |
Earnings attributable to Ecolab | | ($7.06) | | $1.28 | | (652) | % | | ($6.07) | | $2.31 | | (363) | % |
Diluted | | | | | | | | | | | | | | |
Continuing operations | | $0.44 | | $1.18 | | (63) | % | | $1.44 | | $2.04 | | (29) | % |
Discontinued operations | | ($7.42) | | $0.08 | | (9375) | % | | ($7.44) | | $0.24 | | (3200) | % |
Earnings attributable to Ecolab | | ($6.98) | | $1.26 | | (654) | % | | ($6.00) | | $2.28 | | (363) | % |
| | | | | | | | | | | | | | |
Weighted-average common shares outstanding | | | | | | | | | | | | | ||
Basic | | 288.2 | | 287.6 | | 0 | % | | 288.5 | | 287.9 | | 0 | % |
Diluted | | 291.5 | | 292.1 | | 0 | % | | 292.0 | | 292.2 | | 0 | % |
| | | | | | | | | | | | | | |
(1) Net Income (loss) attributable to discontinued operations, net of tax, relates to the separation of ChampionX. | ||||||||||||||
(2) Cost of sales, Special (gains) and charges and Interest expense, net in the Consolidated Statement of Income above include the following: | ||||||||||||||
| | | | | | | | | | | | | | |
| | Second Quarter Ended | | | | Six Months Ended | |
| ||||||
| | June 30 | | | | | June 30 | | | | ||||
(millions) | | 2020 | | 2019 | | | | | 2020 | | 2019 | | | |
| | | | | | | | | | | | | | |
Cost of sales | | | | | | | | | | | | | | |
Restructuring activities | | $2.6 | | $6.5 | | | | | $5.6 | | $9.9 | | | |
Acquisition and integration activities | | 2.2 | | 1.3 | | | | | 2.6 | | 1.5 | | | |
Other | | 22.2 | | - | | | | | 27.9 | | - | | | |
Subtotal (a) | | 27.0 | | 7.8 | | | | | 36.1 | | 11.4 | | | |
| | | | | | | | | | | | | | |
Special (gains) and charges | | | | | | | | | | | | | | |
Restructuring activities | | 0.3 | | 19.8 | | | | | 4.5 | | 50.9 | | | |
Acquisition and integration activities | | (2.6) | | 0.4 | | | | | 2.8 | | 2.9 | | | |
Disposal and impairment charges | | 44.7 | | - | | | | | 45.9 | | - | | | |
Other | | 27.0 | | 4.2 | | | | | 32.1 | | 10.1 | | | |
Subtotal | | 69.4 | | 24.4 | | | | | 85.3 | | 63.9 | | | |
| | | | | | | | | | | | | | |
Interest expense, net | | 0.7 | | - | | | | | 0.7 | | 0.2 | | | |
| | | | | | | | | | | | | | |
Total special (gains) and charges | | $97.1 | | $32.2 | | | | | $122.1 | | $75.5 | | | |
13
(a) Special charges of $21.1 million and $7.8 million in the second quarter of 2020 and 2019, respectively, and $30.3 million and $11.4 million for the first six months of 2020 and 2019, respectively, were recorded in product and equipment cost of sales. Special charges of $5.8 million were recorded in service and lease cost of sales in the second quarter of 2020.
14
ECOLAB INC.
REPORTABLE SEGMENT INFORMATION
(unaudited)
| | Second Quarter Ended June 30 | ||||||||||||
| | Fixed Currency Rates | | Public Currency Rates | ||||||||||
| | | | | | % | | | | | | % | ||
(millions) | | 2020 |
| 2019 |
| Change |
| 2020 |
| 2019 |
| Change | ||
Net Sales | | | | | | | | | | | | | | |
Global Industrial | | $1,475.6 | | $1,500.7 | | (2) | % | | $1,425.2 | | $1,501.0 | | (5.0) | % |
Global Institutional | | 722.4 | | 1,112.5 | | (35) | % | | 708.1 | | 1,110.4 | | (36.2) | % |
Global Healthcare and Life Sciences | | 307.6 | | 252.8 | | 22 | % | | 298.5 | | 251.9 | | 18.5 | % |
Other | | 247.1 | | 306.2 | | (19) | % | | 241.6 | | 305.8 | | (21.0) | % |
Corporate | | 12.3 | | 0.0 | | * | | | 12.3 | | 0.0 | | * | |
Subtotal at fixed currency rates | | 2,765.0 | | 3,172.2 | | (13) | % | | 2,685.7 | | 3,169.1 | | (15.3) | % |
Currency impact | | (79.3) | | (3.1) | | * | | | - | | - | | * | |
Consolidated reported GAAP net sales | | $2,685.7 | | $3,169.1 | | (15) | % | | $2,685.7 | | $3,169.1 | | (15.3) | % |
| | | | | | | | | | | | | | |
Operating Income | | | | | | | | | | | | | | |
Global Industrial | | $283.0 | | $220.9 | | 28 | % | | $272.3 | | $220.9 | | 23 | % |
Global Institutional | | (37.0) | | 234.4 | | (116) | % | | (37.8) | | 233.6 | | (116) | % |
Global Healthcare and Life Sciences | | 65.6 | | 31.2 | | 110 | % | | 63.0 | | 31.0 | | 103 | % |
Other | | 21.3 | | 41.8 | | (49) | % | | 20.8 | | 41.8 | | (50) | % |
Corporate | | (126.7) | | (62.7) | | * | | | (126.3) | | (62.9) | | * | |
Subtotal at fixed currency rates | | 206.2 | | 465.6 | | (56) | % | | 192.0 | | 464.4 | | (59) | % |
Currency impact | | (14.2) | | (1.2) | | * | | | - | | - | | * | |
Consolidated reported GAAP operating income | | $192.0 | | $464.4 | | (59) | % | | $192.0 | | $464.4 | | (59) | % |
| | | | | | | | | | | | | | |
| | Six Months Ended June 30 | ||||||||||||
| | Fixed Currency Rates | | Public Currency Rates | ||||||||||
| | | | | | % | | | | | | % | ||
(millions) | | 2020 |
| 2019 |
| Change |
| 2020 |
| 2019 |
| Change | ||
Net Sales | | | | | | | | | | | | | | |
Global Industrial | | $2,919.2 | | $2,897.7 | | 1 | % | | $2,859.2 | | $2,902.2 | | (1) | % |
Global Institutional | | 1,794.5 | | 2,132.7 | | (16) | % | | 1,775.1 | | 2,131.2 | | (17) | % |
Global Healthcare and Life Sciences | | 554.1 | | 479.8 | | 15 | % | | 542.3 | | 479.4 | | 13 | % |
Other | | 524.7 | | 580.9 | | (10) | % | | 517.4 | | 581.0 | | (11) | % |
Corporate | | 12.3 | | 0.0 | | * | | | 12.3 | | 0.0 | | * | |
Subtotal at fixed currency rates | | 5,804.8 | | 6,091.1 | | (5) | % | | 5,706.3 | | 6,093.8 | | (6) | % |
Currency impact | | (98.5) | | 2.7 | | * | | | | | - | | * | |
Consolidated | | $5,706.3 | | $6,093.8 | | (6) | % | | $5,706.3 | | $6,093.8 | | (6) | % |
| | | | | | | | | | | | | | |
Operating Income | | | | | | | | | | | | | | |
Global Industrial | | $489.6 | | $382.3 | | 28 | % | | $477.1 | | $382.9 | | 25 | % |
Global Institutional | | 145.4 | | 409.2 | | (64) | % | | 143.9 | | 408.2 | | (65) | % |
Global Healthcare and Life Sciences | | 88.5 | | 56.0 | | 58 | % | | 85.5 | | 55.8 | | 53 | % |
Other | | 42.9 | | 67.5 | | (36) | % | | 42.4 | | 67.5 | | (37) | % |
Corporate | | (181.3) | | (136.1) | | * | | | (180.7) | | (136.4) | | * | |
Subtotal at fixed currency rates | | 585.1 | | 778.9 | | (25) | % | | 568.2 | | 778.0 | | (27) | % |
Currency impact | | (16.9) | | (0.9) | | * | | | | | 0 | | * | |
Consolidated | | $568.2 | | $778.0 | | (27) | % | | $568.2 | | $778.0 | | (27) | % |
* Not meaningful.
As shown in the “Fixed Currency Rates” tables above, we evaluate the performance of our international operations based on fixed currency exchange rates, which eliminate the impact of exchange rate fluctuations on our international operations. Amounts shown in the “Public Currency Rates” tables above reflect amounts translated at actual public average rates of exchange prevailing during the corresponding period, and are provided for informational purposes. The difference between the fixed currency exchange rates and the public currency exchange rates is reported as “Currency impact” in the “Fixed Currency Rates” tables above.
The Corporate segment includes amortization from the Nalco merger intangible assets. The Corporate segment also includes special (gains) and charges reported on the Consolidated Statement of Income.
15
ECOLAB INC.
CONSOLIDATED BALANCE SHEET
(unaudited)
| | June 30 | | December 31 | | June 30 | |||
(millions) | | 2020 | | 2019 | | 2019 | |||
Assets | | | | | | | | | |
Current assets | | | | | | | | | |
Cash and cash equivalents | | $1,369.0 | | | $118.8 | | | $15.7 | |
Accounts receivable, net | | 2,255.5 | | | 2,382.0 | | | 2,304.9 | |
Inventories | | 1,228.7 | | | 1,081.6 | | | 1,152.7 | |
Other current assets | | 313.0 | | | 295.2 | | | 347.2 | |
Current assets of discontinued operations | | - | | | 950.8 | | | 1,033.0 | |
Total current assets | | 5,166.2 | | | 4,828.4 | | | 4,853.5 | |
| | | | | | | | | |
Property, plant and equipment, net | | 3,138.9 | | | 3,228.3 | | | 3,134.1 | |
Goodwill | | 5,759.9 | | | 5,569.1 | | | 5,555.9 | |
Other intangible assets, net | | 3,019.2 | | | 2,927.5 | | | 2,976.8 | |
Operating lease assets | | 439.9 | | | 466.7 | | | 443.6 | |
Other assets | | 558.3 | | | 516.3 | | | 488.2 | |
Long-term assets of discontinued operations | | - | | | 3,332.8 | | | 3,375.5 | |
Total assets | | $18,082.4 | | | $20,869.1 | | | $20,827.6 | |
| | | | | | | | | |
Liabilities and Equity | | | | | | | | | |
Current liabilities | | | | | | | | | |
Short-term debt | | $534.9 | | | $380.5 | | | $1,069.4 | |
Accounts payable | | 1,087.7 | | | 1,075.3 | | | 1,081.1 | |
Compensation and benefits | | 408.0 | | | 565.7 | | | 436.0 | |
Income taxes | | 109.9 | | | 136.9 | | | 76.8 | |
Other current liabilities | | 1,087.2 | | | 1,110.7 | | | 1,105.9 | |
Current liabilities of discontinued operations | | - | | | 361.5 | | | 358.5 | |
Total current liabilities | | 3,227.7 | | | 3,630.6 | | | 4,127.7 | |
| | | | | | | | | |
Long-term debt | | 6,752.0 | | | 5,973.1 | | | 5,986.7 | |
Postretirement health care and pension benefits | | 1,055.6 | | | 1,084.4 | | | 927.2 | |
Deferred income taxes | | 577.2 | | | 537.3 | | | 578.3 | |
Operating lease liabilities | | 319.4 | | | 346.0 | | | 325.7 | |
Other liabilities | | 260.3 | | | 269.8 | | | 308.5 | |
Long-term liabilities of discontinued operations | | - | | | 302.1 | | | 304.1 | |
Total liabilities | | 12,192.2 | | | 12,143.3 | | | 12,558.2 | |
| | | | | | | | | |
Equity | | | | | | | | | |
Common stock | | 362.0 | | | 359.6 | | | 358.9 | |
Additional paid-in capital | | 6,155.0 | | | 5,907.1 | | | 5,815.7 | |
Retained earnings | | 7,967.8 | | | 9,993.7 | | | 9,368.0 | |
Accumulated other comprehensive loss | | (1,989.7) | | | (2,089.7) | | | (1,836.4) | |
Treasury stock | | (6,639.9) | | | (5,485.4) | | | (5,480.8) | |
Total Ecolab shareholders’ equity | | 5,855.2 | | | 8,685.3 | | | 8,225.4 | |
Noncontrolling interest | | 35.0 | | | 40.5 | | | 44.0 | |
Total equity | | 5,890.2 | | | 8,725.8 | | | 8,269.4 | |
Total liabilities and equity | | $18,082.4 | | | $20,869.1 | | | $20,827.6 | |
16
ECOLAB INC.
SUPPLEMENTAL NON-GAAP RECONCILIATIONS
(unaudited)
|
| Second Quarter Ended |
| Six Months Ended |
| ||||||||
| | June 30 | | June 30 | | ||||||||
(millions, except percent and per share) | | 2020 |
| 2019 | | 2020 |
| 2019 | | ||||
| | | | | | | | | | | | | |
Net sales | | | | | | | | | | | | | |
Reported GAAP net sales | | $2,685.7 | | | $3,169.1 | | | $5,706.3 | | | $6,093.8 | | |
Effect of foreign currency translation | | 79.3 | | | 3.1 | | | 98.5 | | | (2.7) | | |
Non-GAAP fixed currency sales | | 2,765.0 | | | 3,172.2 | | | 5,804.8 | | | 6,091.1 | | |
Effect of acquisitions and divestitures | | (40.4) | | | (0.6) | | | (64.7) | | | (1.2) | | |
Non-GAAP acquisition adjusted fixed currency sales | | 2,724.6 | | | 3,171.6 | | | 5,740.1 | | | 6,089.9 | | |
| | | | | | | | | | | | | |
Cost of sales | | | | | | | | | | | | | |
Reported GAAP cost of sales | | $1,635.7 | | | $1,780.3 | | | $3,355.9 | | | $3,455.8 | | |
Special (gains) and charges | | 27.0 | | | 7.8 | | | 36.1 | | | 11.4 | | |
Non-GAAP adjusted cost of sales | | $1,608.7 | | | $1,772.5 | | | $3,319.8 | | | $3,444.4 | | |
| | | | | | | | | | | | | |
Gross margin | | | | | | | | | | | | | |
Reported GAAP gross margin | | 39.1 | % | | 43.8 | % | | 41.2 | % | | 43.3 | % | |
Non-GAAP adjusted gross margin | | 40.1 | % | | 44.1 | % | | 41.8 | % | | 43.5 | % | |
| | | | | | | | | | | | | |
Operating income | | | | | | | | | | | | | |
Reported GAAP operating income | | $192.0 | | | $464.4 | | | $568.2 | | | $778.0 | | |
Effect of foreign currency translation | | 14.2 | | | 1.2 | | | 16.9 | | | 0.9 | | |
Non-GAAP fixed currency operating income | | 206.2 | | | 465.6 | | | 585.1 | | | 778.9 | | |
Special (gains) and charges | | 96.4 | | | 32.2 | | | 121.4 | | | 75.3 | | |
Non-GAAP adjusted fixed currency operating income | | 302.6 | | | 497.8 | | | 706.5 | | | 854.2 | | |
Effect of acquisitions and divestitures | | (2.3) | | | 0.3 | | | (2.0) | | | 0.2 | | |
Non-GAAP acquisition adjusted fixed currency operating income | | $300.3 | | | $498.1 | | | $704.5 | | | $854.4 | | |
| | | | | | | | | | | | | |
Operating income margin | | | | | | | | | | | | | |
Reported GAAP operating income margin | | 7.1 | % | | 14.7 | % | | 10.0 | % | | 12.8 | % | |
Non-GAAP adjusted fixed currency operating income margin | | 10.9 | % | | 15.7 | % | | 12.2 | % | | 14.0 | % | |
Non-GAAP acquisition adjusted fixed currency operating income margin | | 11.0 | % | | 15.7 | % | | 12.3 | % | | 14.0 | % | |
| | | | | | | | | | | | | |
Interest expense, net | | | | | | | | | | | | | |
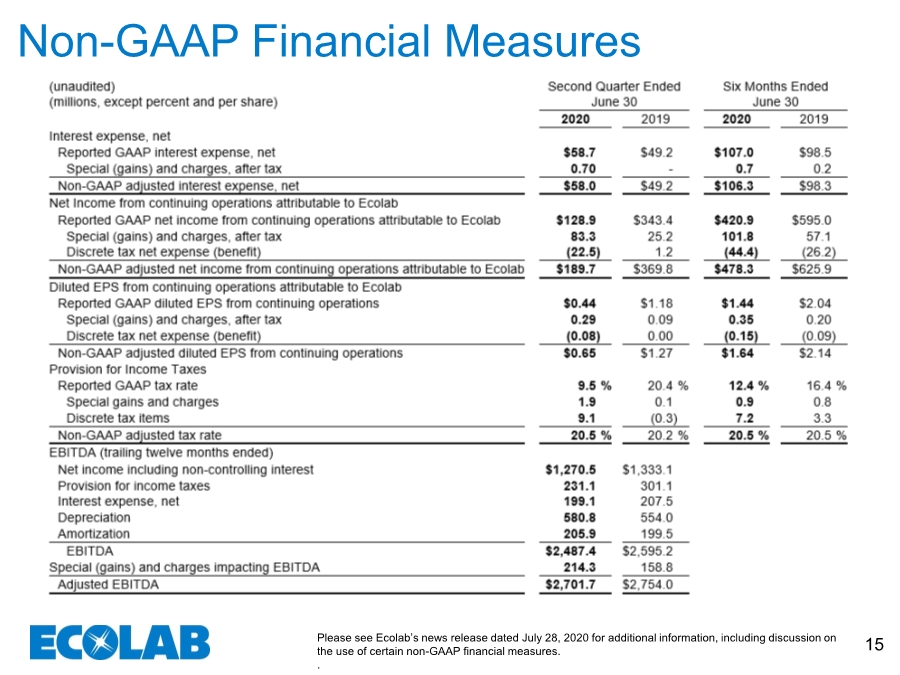
Reported GAAP interest expense, net | | $58.7 | | | $49.2 | | | $107.0 | | | $98.5 | | |
Special (gains) and charges, after tax | | 0.7 | | | 0.0 | | | 0.7 | | | 0.2 | | |
Non-GAAP adjusted interest expense, net | | $58.0 | | | $49.2 | | | $106.3 | | | $98.3 | | |
17
ECOLAB INC.
SUPPLEMENTAL NON-GAAP RECONCILIATIONS
(unaudited)
|
| Second Quarter Ended |
| Six Months Ended | | ||||||||
| | June 30 | | June 30 | | ||||||||
(millions, except percent and per share) | | 2020 |
| 2019 | | 2020 |
| 2019 | | ||||
Net Income from continuing operations attributable to Ecolab | | | | | | | | | | | | | |
Reported GAAP net income from continuing operations attributable to Ecolab | | $128.9 | | | $343.4 | | | $420.9 | | | $595.0 | | |
Special (gains) and charges, after tax | | 83.3 | | | 25.2 | | | 101.8 | | | 57.1 | | |
Discrete tax net expense (benefit) | | (22.5) | | | 1.2 | | | (44.4) | | | (26.2) | | |
Non-GAAP adjusted net income from continuing operations attributable to Ecolab | | $189.7 | | | $369.8 | | | $478.3 | | | $625.9 | | |
| | | | | | | | | | | | | |
Diluted EPS from continuing operations attributable to Ecolab | | | | | | | | | | | | | |
Reported GAAP diluted EPS from continuing operations | | $0.44 | | | $1.18 | | | $1.44 | | | $2.04 | | |
Special (gains) and charges, after tax | | 0.29 | | | 0.09 | | | 0.35 | | | 0.20 | | |
Discrete tax net expense (benefit) | | (0.08) | | | 0.00 | | | (0.15) | | | (0.09) | | |
Non-GAAP adjusted diluted EPS from continuing operations | | $0.65 | | | $1.27 | | | $1.64 | | | $2.14 | | |
| | | | | | | | | | | | | |
Provision for Income Taxes | | | | | | | | | | | | | |
Reported GAAP tax rate | | 9.5 | % | | 20.4 | % | | 12.4 | % | | 16.4 | % | |
Special gains and charges | | 1.9 | | | 0.1 | | | 0.9 | | | 0.8 | | |
Discrete tax items | | 9.1 | | | (0.3) | | | 7.2 | | | 3.3 | | |
Non-GAAP adjusted tax rate | | 20.5 | % | | 20.2 | % | | 20.5 | % | | 20.5 | % | |
Selected Cash Flow items | | Second Quarter Ended |
| Six Months Ended |
| | June 30 | | June 30 |
(millions) | | 2020 | | 2020 |
| | | | |
Cash provided by operating activities - continuing operations | | $331.9 | | $640.2 |
Cash provided by operating activities - discontinued operations | | 54.9 | | 118.4 |
Cash provided by operating activities | | 386.8 | | 758.6 |
| | | | |
Capital expenditures - continuing operations | | 102.9 | | 250.6 |
Capital expenditures - discontinued operations | | 8.6 | | 21.6 |
| | | | |
Cash provided by operating activities - continuing operations | | 331.9 | | 640.2 |
Less: Capital expenditures - continuing operations | | (102.9) | | (250.6) |
Free cash flow - continuing operations | | 229.0 | | 389.6 |
| | | | |
Cash provided by operating activities | | 386.8 | | 758.6 |
Less: Capital expenditures - continuing operations | | (102.9) | | (250.6) |
Less: Capital expenditures - discontinued operations | | (8.6) | | (21.6) |
Free cash flow | | $275.3 | | $486.4 |
18
ECOLAB INC.
SUPPLEMENTAL NON-GAAP RECONCILIATIONS
DISCONTINUED OPERATIONS
(unaudited)
Discontinued Operations | | Second Quarter Ended |
| Six Months Ended | ||||||||
| | June 30 | | June 30 | ||||||||
(millions) | | 2020 |
| 2019 | | 2020 |
| 2019 | ||||
| | | | | | | | | | | | |
Net sales | | $397.7 | | | $590.2 | | | $958.5 | | | $1,170.9 | |
Cost of sales | | 305.4 | | | 427.8 | | | 702.1 | | | 842.0 | |
Selling, general and administrative expenses | | 74.0 | | | 102.7 | | | 180.5 | | | 214.8 | |
Special (gains) and charges | | 2,185.2 | | | 25.6 | | | 2,221.7 | | | 26.4 | |
Operating income | | (2,166.9) | | | 34.1 | | | (2,145.8) | | | 87.7 | |
Other (income) expense | | 0.1 | | | - | | | 0.3 | | | - | |
Interest expense, net | | 0.3 | | | 0.1 | | | 0.2 | | | 0.3 | |
Income before income taxes | | (2,167.3) | | | 34.0 | | | (2,146.3) | | | 87.4 | |
Provision for income taxes | | (3.1) | | | 9.1 | | | 24.0 | | | 17.7 | |
Net income including noncontrolling interest | | (2,164.2) | | | 24.9 | | | (2,170.3) | | | 69.7 | |
Net income attributable to noncontrolling interest | | (0.3) | | | (0.3) | | | 2.2 | | | (0.4) | |
Net income from discontinued operations, net of tax (1) | | ($2,163.9) | | | $25.2 | | | ($2,172.5) | | | $70.1 | |
| | | | | | | | | | | | |
(1) Net income from discontinued operations, net of tax includes the following special (gains) and charges, net of tax: | ||||||||||||
| | | | | | | | | | | | |
| | Second Quarter Ended |
| Six Months Ended | ||||||||
| | June 30 | | June 30 | ||||||||
(millions) | | 2020 |
| 2019 | | 2020 |
| 2019 | ||||
| | | | | | | | | | | | |
Separation costs | | 41.2 | | | 21.8 | | | 73.0 | | | 21.3 | |
Loss on Separation | | 2,137.8 | | | - | | | 2,137.8 | | | - | |
Discrete tax items | | 3.1 | | | (0.2) | | | 22.6 | | | (0.5) | |
Total special (gains) and charges, net of tax | | 2,182.1 | | | 21.6 | | | 2,233.4 | | | 20.8 | |
| | | | | | | | | | | | |
19
ECOLAB INC.
SUPPLEMENTAL NON-GAAP RECONCILIATIONS
| | Second Quarter Ended June 30 | ||||||||||
(unaudited) | | 2020 | | 2019 | ||||||||
(millions) | | Fixed Currency | | Impact of Acquisitions and Divestitures | | Acquisition Adjusted | | Fixed Currency | | Impact of Acquisitions and Divestitures | | Acquisition Adjusted |
Net Sales | | | | | | | | | | | | |
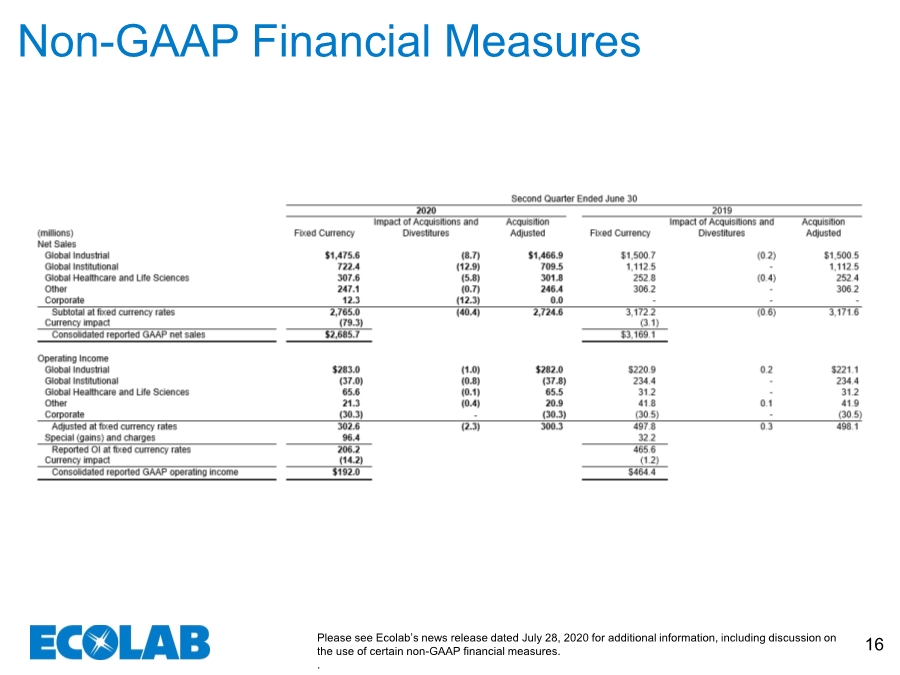
Global Industrial | | $1,475.6 | | (8.7) | | $1,466.9 | | $1,500.7 | | (0.2) | | $1,500.5 |
Global Institutional | | 722.4 | | (12.9) | | 709.5 | | 1,112.5 | | - | | 1,112.5 |
Global Healthcare and Life Sciences | | 307.6 | | (5.8) | | 301.8 | | 252.8 | | (0.4) | | 252.4 |
Other | | 247.1 | | (0.7) | | 246.4 | | 306.2 | | - | | 306.2 |
Corporate | | 12.3 | | (12.3) | | - | | - | | - | | - |
Subtotal at fixed currency rates | | 2,765.0 | | (40.4) | | 2,724.6 | | 3,172.2 | | (0.6) | | 3,171.6 |
Currency impact | | (79.3) | | | | | | (3.1) | | | | |
Consolidated reported GAAP net sales | | $2,685.7 | | | | | | $3,169.1 | | | | |
| | | | | | | | | | | | |
Operating Income | | | | | | | | | | | | |
Global Industrial | | $283.0 | | (1.0) | | $282.0 | | $220.9 | | 0.2 | | $221.1 |
Global Institutional | | (37.0) | | (0.8) | | (37.8) | | 234.4 | | - | | 234.4 |
Global Healthcare and Life Sciences | | 65.6 | | (0.1) | | 65.5 | | 31.2 | | - | | 31.2 |
Other | | 21.3 | | (0.4) | | 20.9 | | 41.8 | | 0.1 | | 41.9 |
Corporate | | (30.3) | | - | | (30.3) | | (30.5) | | - | | (30.5) |
Adjusted at fixed currency rates | | 302.6 | | (2.3) | | 300.3 | | 497.8 | | 0.3 | | 498.1 |
Special (gains) and charges | | 96.4 | | | | | | 32.2 | | | | |
Reported OI at fixed currency rates | | 206.2 | | | | | | 465.6 | | | | |
Currency impact | | (14.2) | | | | | | (1.2) | | | | |
Consolidated reported GAAP operating income | | $192.0 | | | | | | $464.4 | | | | |
| | | | | | | | | | | | |
| | Six Months Ended June 30 | ||||||||||
| | 2020 | | 2019 | ||||||||
(millions) | | Fixed Currency | | Impact of Acquisitions and Divestitures | | Acquisition Adjusted | | Fixed Currency | | Impact of Acquisitions and Divestitures | | Acquisition Adjusted |
Net Sales | | | | | | | | | | | | |
Global Industrial | | $2,919.2 | | ($8.8) | | $2,910.4 | | $2,897.7 | | ($0.7) | | $2,897.0 |
Global Institutional | | 1,794.5 | | (27.1) | | 1,767.4 | | 2,132.7 | | - | | 2,132.7 |
Global Healthcare and Life Sciences | | 554.1 | | (15.4) | | 538.7 | | 479.8 | | (0.4) | | 479.4 |
Other | | 524.7 | | (1.1) | | 523.6 | | 580.9 | | (0.1) | | 580.8 |
Corporate | | 12.3 | | (12.3) | | - | | - | | - | | - |
Subtotal at fixed currency rates | | 5,804.8 | | (64.7) | | 5,740.1 | | 6,091.1 | | (1.2) | | 6,089.9 |
Currency impact | | (98.5) | | | | | | 2.7 | | | | |
Consolidated reported GAAP net sales | | $5,706.3 | | | | | | $6,093.8 | | | | |
| | | | | | | | | | | | |
Operating Income | | | | | | | | | | | | |
Global Industrial | | $489.6 | | ($1.0) | | $488.6 | | $382.3 | | $0.1 | | $382.4 |
Global Institutional | | 145.4 | | (1.5) | | 143.9 | | 409.2 | | - | | 409.2 |
Global Healthcare and Life Sciences | | 88.5 | | 0.6 | | 89.1 | | 56.0 | | - | | 56.0 |
Other | | 42.9 | | (0.1) | | 42.8 | | 67.5 | | 0.1 | | 67.6 |
Corporate | | (59.9) | | - | | (59.9) | | (60.8) | | - | | (60.8) |
Adjusted at fixed currency rates | | 706.5 | | (2.0) | | 704.5 | | 854.2 | | 0.2 | | 854.4 |
Special (gains) and charges | | 121.4 | | | | | | 75.3 | | | | |
Reported OI at fixed currency rates | | 585.1 | | | | | | 778.9 | | | | |
Currency impact | | (16.9) | | | | | | (0.9) | | | | |
Consolidated reported GAAP operating income | | $568.2 | | | | | | $778.0 | | | | |
20
ECOLAB INC.
SUPPLEMENTAL DILUTED EARNINGS PER SHARE INFORMATION
(unaudited)
The table below provides a reconciliation of diluted earnings per share from continuing operations, as reported, to the non-GAAP measure of adjusted diluted earnings per share from continuing operations.
|
| First |
| Second |
| Six |
| Third |
| Nine |
| Fourth |
|
| |
| | Quarter | | Quarter | | Months | | Quarter | | Months | | Quarter | | Year | |
| | Ended | | Ended | | Ended | | Ended | | Ended | | Ended | | Ended | |
| | Mar. 31 | | June 30 | | June 30 | | Sept. 30 | | Sept. 30 | | Dec. 31 | | Dec. 31 | |
| | 2019 | | 2019 | | 2019 | | 2019 | | 2019 | | 2019 | | 2019 | |
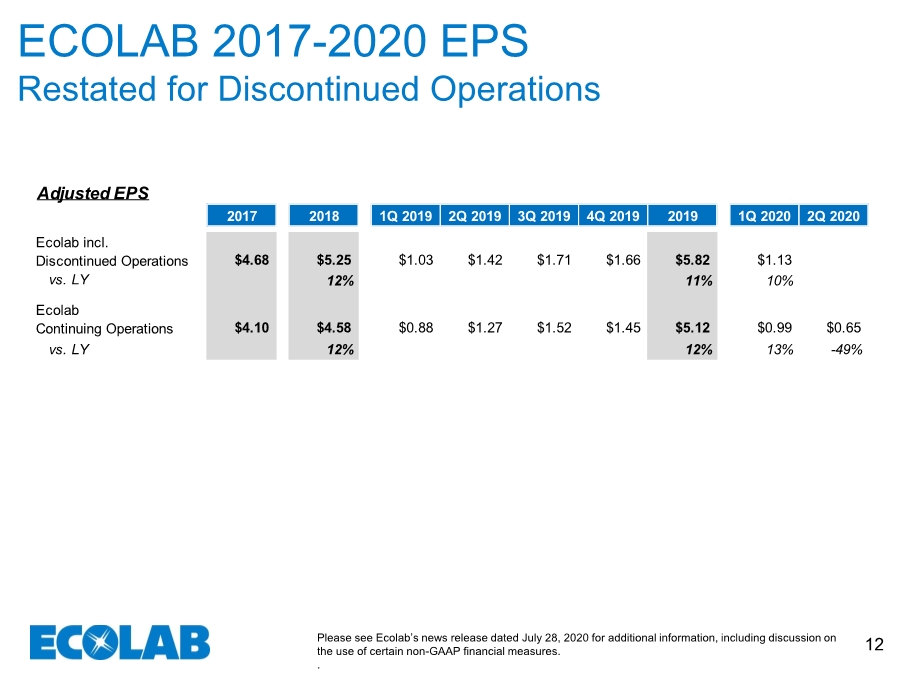
Diluted earnings per share, as reported (U.S. GAAP) | | $0.86 | | $1.18 | | $2.04 | | $1.49 | | $3.52 | | $1.35 | | $4.87 | |
Adjustments: | | | | | | | | | | | | | | | |
Special (gains) and charges (1) | | 0.11 | | 0.09 | | 0.20 | | 0.08 | | 0.28 | | 0.16 | | 0.44 | |
Discrete tax expense (benefits) (2) | | (0.09) | | 0.00 | | (0.09) | | (0.05) | | (0.14) | | (0.06) | | (0.20) | |
Adjusted diluted earnings per share (Non-GAAP) | | $0.88 | | $1.27 | | $2.14 | | $1.52 | | $3.66 | | $1.45 | | $5.12 | |
|
| First |
| Second |
| Six |
| Third |
| Nine |
| Fourth |
|
|
|
| | Quarter | | Quarter | | Months | | Quarter | | Months | | Quarter | | Year |
|
| | Ended | | Ended | | Ended | | Ended | | Ended | | Ended | | Ended |
|
| | Mar. 31 | | June 30 | | June 30 | | Sept. 30 | | Sept. 30 | | Dec. 31 | | Dec. 31 |
|
| | 2020 | | 2020 | | 2020 | | 2020 | | 2020 | | 2020 | | 2020 |
|
Diluted earnings per share, as reported (U.S. GAAP) | | $1.00 | | $0.44 | | $1.44 | | | | | | | | | |
Adjustments: | | | | | | | | | | | | | | | |
Special (gains) and charges (3) | | 0.06 | | 0.29 | | 0.35 | | | | | | | | | |
Discrete tax expense (benefits) (4) | | (0.07) | | (0.08) | | (0.15) | | | | | | | | | |
Adjusted diluted earnings per share (Non-GAAP) | | $0.99 | | $0.65 | | $1.64 | | | | | | | | | |
Per share amounts do not necessarily sum due to changes in shares outstanding and rounding.
(1) Special (gains) and charges for 2019 includes $30.4 million, $29.1 million, $21.7 million and $25.4 million, net of tax, in the first, second, third and fourth quarters, respectively. These charges include restructuring charges primarily related to the efficiency initiative, acquisition and integration charges, a Healthcare product recall charges, and litigation and other charges.
(2) Discrete tax expense (benefits) for 2019 includes ($27.4) million, 1.2 million, ($13.6) million and ($17.9) million of tax benefits in the first, second, third and fourth quarters, respectively. These benefits are primarily associated with stock compensation excess tax benefits, changes in tax laws, and reserve releases offset by finalization of audits and other discrete tax expense (benefits).
(3) Special (gains) and charges for 2020 includes charges of $18.5 million and $83.3 million, net of tax in the first and second quarters, respectively. Charges include disposal and impairment charges, charges for pay protection for certain employees impacted by COVID-19 net of government subsidies, restructuring charges relating to the efficiency initiative, acquisition and integration charges, Healthcare product recall charges, litigation and other charges.
(4) Discrete tax expense (benefits) for 2020 includes ($21.9) million and ($22.5) million in the first and second quarters, respectively. Tax benefits are primarily associated with stock compensation excess tax benefits, off-set by other discrete tax expense.
21