Sony as a whole has a higher proportion of remuneration linked to stock price which is directly linked to the corporate value. (Please see below Reference: Executive Compensation Package Design to Focus on Long-Term Management.)
Remuneration linked to business results shall be structured appropriately and based upon appropriate indicators to ensure that such remuneration effectively incentivizes Senior Executives to achieve the
mid-
to long-term and the corresponding fiscal year’s corporate targets. Specifically, the amount shall be determined based upon the level of achievements of the targets of (1) certain key performance indicators linked to consolidated or individual business results of Sony of the corresponding fiscal year, such as Return on Equity (“ROE”), Net Income attributable to Sony Corporation’s Stockholders and Operating Cash Flow (“Financial Performance KPIs”), which indicators are selected based on the areas for which each Senior Executive is responsible and (2) the individual performance of the area(s) for which the relevant Senior Executive is responsible. The amount to be paid to Senior Executives shall fluctuate, in principle, within the range from 0% to 200% of the standard payment amount (“Business Results Linked Standard Payment Amount”) based on the achievement of the above-mentioned targets. Efforts to accelerate collaboration among businesses of Sony from the viewpoint of value creation as “One Sony,” as well as sustainability initiatives related to social value creation and ESG (environment, social and governance) shall be included in the evaluation indicators of individual performance. The Business Results Linked Standard Payment Amount shall be determined so that such amount is within a certain percentage of the cash compensation (total of the fixed remuneration and the remuneration linked to business results), which percentage shall be determined in accordance with each individual’s level of responsibility.Remuneration linked to the stock price, such as stock options and restricted stock, will be used to incentivize Senior Executives to increase
mid-
to long-term shareholder value. Appropriate restrictions and conditions shall be set in order to enhance the effectiveness of such remuneration program. The amount of remuneration linked to the stock price shall be determined, so that the amount is within a certain percentage of the total cash compensation (total of the fixed remuneration and the remuneration linked to business results) and remuneration linked to the stock price.Regarding the Phantom Restricted Stock Plan, points determined every year by the Compensation Committee shall be granted to Senior Executives every year during his/her tenure in office, and at the time of resignation, the remuneration amount shall be calculated by multiplying the common stock price by the individual’s accumulated points.
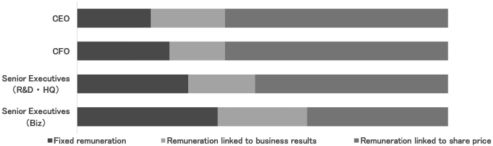
(Reference: Executive Compensation Package Design to Focus on Long-Term Management)
The following bar chart shows the composition of remuneration for Senior Executives applicable to the fiscal year ended March 31, 2020. The proportions of “Remuneration linked to business results” are based on the Business Results Linked Standard Payment Amount.
(4) Procedures to determine remuneration of Directors and Senior Executives
Based on the policy outlined above, the Compensation Committee determines the amount and content of the compensation for each Director and Senior Executive. Specifically, in principle, each year at the meeting of the Compensation Committee held after the Ordinary General Meeting of the Shareholders, the amount of basic remuneration and the content of each Director’s and Senior Executive’s compensation for the corresponding fiscal year is determined. Thereafter, at the meeting of the Compensation Committee held after the corresponding fiscal year end, the final amount of compensation of each Director and Senior Executive is determined, including the amount of remuneration linked to business results.
For determining the amount of the remuneration linked to business results for each Senior Executive, the Business Results Linked Standard Payment Amount, the targets for the Financial Performance KPIs and the targets for the individual performance of the areas(s) for which each Senior Executive is responsible are
74