Form 20-F
UNITED STATES
SECURITIES AND EXCHANGE COMMISSION
Washington, D.C. 20549
FORM 20-F
(Mark One)
| ¨ |
REGISTRATION STATEMENT PURSUANT TO SECTION 12(b) or (g) OF THE SECURITIES EXCHANGE ACT OF 1934 |
OR
| x |
ANNUAL REPORT PURSUANT TO SECTION 13 OR 15(d) OF THE SECURITIES EXCHANGE ACT OF 1934 |
For the fiscal year ended 31 December 2013
OR
| ¨ |
TRANSITION REPORT PURSUANT TO SECTION 13 OR 15(d) OF THE SECURITIES EXCHANGE ACT OF 1934 |
OR
| ¨ |
SHELL COMPANY REPORT PURSUANT TO SECTION 13 OR 15(d) OF THE SECURITIES EXCHANGE ACT OF 1934 |
Commission file number: 1-6262
BP p.l.c.
(Exact name of Registrant as specified in its charter)
England and Wales
(Jurisdiction of incorporation or organization)
1 St James’s Square, London SW1Y 4PD
United Kingdom
(Address of
principal executive offices)
Dr Brian Gilvary
BP p.l.c.
1 St
James’s Square, London SW1Y 4PD
United Kingdom
Tel +44 (0) 20 7496 5311
Fax +44 (0) 20 7496 4573
(Name, Telephone, E-mail and/or Facsimile number and Address of Company Contact Person)
Securities registered or to be registered pursuant to Section 12(b) of the Act
|
|
|
| Title of each class |
|
Name of each exchange on which registered |
| Ordinary Shares of 25c each |
|
New York Stock Exchange* |
| Floating Rate Guaranteed Notes due 2014 |
|
New York Stock Exchange |
| Floating Rate Guaranteed Notes due May 2015 |
|
New York Stock Exchange |
| Floating Rate Guaranteed Notes due November 2015 |
|
New York Stock Exchange |
| Floating Rate Guaranteed Notes due 2016 |
|
New York Stock Exchange |
| Floating Rate Guaranteed Notes due May 2018 |
|
New York Stock Exchange |
| Floating Rate Guaranteed Notes due September 2018 |
|
New York Stock Exchange |
| Floating Rate Guaranteed Notes due 2019 |
|
New York Stock Exchange |
| 3.625% Guaranteed Notes due 2014 |
|
New York Stock Exchange |
| 1.700% Guaranteed Notes due 2014 |
|
New York Stock Exchange |
| 0.700% Guaranteed Notes due 2015 |
|
New York Stock Exchange |
| 3.875% Guaranteed Notes due 2015 |
|
New York Stock Exchange |
| 3.125% Guaranteed Notes due 2015 |
|
New York Stock Exchange |
| 2.248% Guaranteed Notes due 2016 |
|
New York Stock Exchange |
| 3.200% Guaranteed Notes due 2016 |
|
New York Stock Exchange |
| 1.375% Guaranteed Notes due 2017 |
|
New York Stock Exchange |
| 1.375% Guaranteed Notes due 2018 |
|
New York Stock Exchange |
| 2.241% Guaranteed Notes due 2018 |
|
New York Stock Exchange |
| 1.846% Guaranteed Notes due 2017 |
|
New York Stock Exchange |
| 4.750% Guaranteed Notes due 2019 |
|
New York Stock Exchange |
| 2.237% Guaranteed Notes due 2019 |
|
New York Stock Exchange |
| 4.500% Guaranteed Notes due 2020 |
|
New York Stock Exchange |
| 4.742% Guaranteed Notes due 2021 |
|
New York Stock Exchange |
| 3.561% Guaranteed Notes due 2021 |
|
New York Stock Exchange |
| 2.500% Guaranteed Notes due 2022 |
|
New York Stock Exchange |
| 3.245% Guaranteed Notes due 2022 |
|
New York Stock Exchange |
| 2.750% Guaranteed Notes due 2023 |
|
New York Stock Exchange |
| 3.994% Guaranteed Notes due 2023 |
|
New York Stock Exchange |
| 3.814% Guaranteed Notes due 2024 |
|
New York Stock Exchange |
| * |
Not for trading, but only in connection with the registration of American Depositary Shares, pursuant to the requirements of the Securities and Exchange Commission |
Securities registered or to be registered pursuant to Section 12(g) of the Act.
None
Securities for which
there is a reporting obligation pursuant to Section 15(d) of the Act.
None
Indicate the number of outstanding shares of each of the issuer’s classes of capital or common stock as of the close of the period covered
by the annual report.
|
|
|
|
|
| Ordinary Shares of 25c each |
|
|
20,426,632,529 |
|
| Cumulative First Preference Shares of £1 each |
|
|
7,232,838 |
|
| Cumulative Second Preference Shares of £1 each |
|
|
5,473,414 |
|
Indicate by check mark if the registrant is a well-known seasoned issuer, as defined in Rule 405 of the
Securities Act. Yes ¨ No x
If this report is an annual or transition report, indicate by check mark if the registrant is not required to file reports pursuant to
Section 13 or 15(d) of the Securities Exchange Act of 1934. Yes ¨ No x
Note—Checking the box above will not relieve any registrant required to file reports pursuant to Section 13 or 15(d) of the
Securities Exchange Act of 1934 from their obligations under those Sections.
Indicate by check mark whether the Registrant (1) has
filed all reports required to be filed by Section 13 or 15(d) of the Securities Exchange Act of 1934 during the preceding 12 months (or for such shorter period that the Registrant was required to file such reports), and (2) has been
subject to such filing requirements for the past 90 days. Yes x No ¨
Indicate by check mark whether the registrant has submitted electronically and posted on its corporate website, if any, every Interactive Data
File required to be submitted and posted pursuant to Rule 405 of Regulation S-T (§ 232.405 of this chapter) during the preceding 12 months (or for such shorter period that the registrant was required to submit and post such
files).* Yes ¨ No ¨
| * |
This requirement does not apply to the registrant in respect of this filing. |
Indicate by check
mark whether the registrant is a large accelerated filer, an accelerated filer, or a non-accelerated filer. See definition of “accelerated filer and large accelerated filer” in Rule 12b-2 of the Exchange Act. (Check one):
Large accelerated
filer x Accelerated
filer ¨ Non-accelerated filer ¨
Indicate by check mark which basis of accounting the registrant has used to prepare the financial statements included in this filing:
International Financial Reporting
Standards as issued by the
U.S.
GAAP ¨ International Accounting Standards Board x Other ¨
If “Other” has been checked in response to the previous question, indicate by check mark which financial statement item the
registrant has elected to follow.
Item 17 ¨ Item 18 ¨
If this is an annual report, indicate by check mark whether the registrant is a shell company
(as defined in Rule 12b-2 of the Exchange Act). Yes ¨ No x
Annual Report and
Form 20-F 2013
bp.com/annualreport

Building a stronger,
safer BP

|
|
|
|
|
|
|
| Who we are
BP is one of the world’s leading integrated oil and
gas companies.a We aim to create
long-term value
for shareholders by helping to meet growing
demand for energy in a safe and responsible way.
We strive to be a world-class operator, a responsible corporate citizen and a good employer. |
|
|
|
|
|
|
| Through our work we provide customers with fuel for transportation, energy for heat and light, lubricants to keep engines moving and the petrochemicals products used to make everyday items as diverse as paints,
clothes and packaging. Our projects and operations help to generate employment, investment and tax revenues in countries and communities around the world. We employ more than 80,000 people, mostly in Europe and the US. |
|
As a global group, our interests and activities are held or operated through subsidiaries, branches, joint arrangements or associates established in – and subject to the laws and regulations of – many
different jurisdictions. The UK is a centre for trading, legal, finance, research and technology and other business functions. We have well-established operations in Europe, the US, Canada, Russia, South America, Australasia, Asia and parts of
Africa. |
|
|
|
|
|
|
|
|
|
|
a On the basis of market capitalization, proved reserves and
production. |
|
|
|
|
|
|
|
| |
|
|
|
|
|
|
|
|

|
|
|
Front cover imagery Our
second BP-operated development in Angola consists of four oil fields – Plutăo, Saturno, Vénus and Marte (PSVM).
Left image: the converted hull, floating, production, storage and offloading vessel (FPSO) has 1.6 million barrels of storage
capacity. Centre image: a PSVM mechanical technician takes part in a
site visit on board the vessel. Right image: the hawser is a 75
metre rope that we use to tie the tanker to the back of the FPSO. |
|
|
|
Your feedback
We welcome your comments and feedback on our reporting. Your views are important to us and help us shape our reporting for future years.
You can provide this at
bp.com/annualreportfeedback or by emailing or writing to the corporate reporting team. Details are on the back cover. For every survey
completed, we will make a £2 donation to the British Paralympic Association. |
BP Annual Report and Form 20-F 2013
|
|
|
| BP Annual Report and Form 20-F 2013 |
|
i |
|
|
|
| Information about this report |
|

|
|
|
|
|
|
|
|
| Frequent abbreviations
ADR American depositary receipt.
ADS American depositary share.
Barrel (bbl) 159 litres, 42 US gallons.
bcf Billion cubic feet.
bcf/d Billion cubic feet per day.
bcfe Billion cubic feet equivalent.
bcma Billion cubic metres per annum.
b/d Barrels per day.
boe Barrels of oil equivalent.
GAAP Generally accepted accounting practice.
Gas Natural gas.
Hydrocarbons Liquids and natural gas.
IFRS International Financial Reporting Standards.
Liquids Crude oil, condensate and natural gas liquids.
LNG Liquefied natural gas.
LPG Liquefied petroleum gas.
mb/d Thousand barrels per day.
mboe/d Thousand barrels of oil equivalent per day.
mmboe Million barrels of oil equivalent.
mmBtu Million British thermal units.
mmcf Million cubic feet.
mmcf/d Million cubic feet per day.
MW Megawatt.
NGLs Natural gas liquids.
PSA Production-sharing agreement.
RC Replacement cost.
SEC The United States Securities and
Exchange Commission. Therm
100,000 British thermal units. Tonne
2,204.6 pounds.

|
|
|
|
This document constitutes the Annual Report and Accounts in accordance with UK requirements and the Annual Report on Form 20-F in accordance
with the US Securities Exchange Act of 1934, for BP p.l.c. for the year ended 31 December 2013. A cross reference to Form 20-F requirements is included on page 282.
The BP Annual Report and 20-F 2013 reflects a number of significant changes in regulations in the UK. The most significant change is the requirement to produce a
new strategic report that replaces the previous business review. The regulations require certain new disclosure to be included in the strategic report including a description of company’s strategy and business model – we have included a
more focused and graphical presentation of BP’s strategy and business model in this report, compared with the 2012 report.
This document contains the Strategic report on pages 1-58 and the inside cover (Who we are section) and the Directors’ report on pages 59-80, 109-114, 116, 200-223
and 235-280. The Strategic report and the Directors’ report together include the management report required by DTR 4.1 of the UK Financial Conduct Authority’s Disclosure and Transparency Rules. The Directors’ remuneration report is on
pages 81-108. The consolidated financial statements of the group are on pages 115-199 and the corresponding reports of the auditor are on pages 120-121.
BP Annual Report and Form 20-F 2013 and BP Strategic Report 2013 (comprising the Strategic report and supplementary information) may be downloaded from
bp.com/annualreport. No material on the BP website, other than the items identified as BP Annual Report and Form 20-F 2013 or BP Strategic Report 2013 (comprising the Strategic report and supplementary information), forms any
part of those documents. References in this document to other documents on the BP website, such as the BP Energy Outlook, are included as an aid to their location and are not incorporated by reference into this document.
BP p.l.c. is the parent company of the BP group of companies. The company was incorporated in 1909 in
England and Wales and changed its name to BP p.l.c. in 2001. Where we refer to the company, we mean BP p.l.c. Unless otherwise stated, the text does not distinguish between the activities and operations of the parent company and those of its
subsidiaries, and information in this document reflects 100% of the assets and operations of the company and its subsidiaries that were consolidated at the date or for the periods indicated, including non-controlling interests.
BP’s primary share listing is the London Stock Exchange. Ordinary shares are also traded on the
Frankfurt Stock Exchange in Germany and, in the US, the company’s securities are traded on the New York Stock Exchange (NYSE) in the form of ADSs (see page 274 for more details).
The term ‘shareholder’ in this report means, unless the context otherwise requires,
investors in the equity capital of BP p.l.c., both direct and indirect. As BP shares, in the form of ADSs, are listed on the NYSE, an Annual Report on Form 20-F is filed with the US Securities and Exchange Commission (SEC). Ordinary shares are
ordinary fully paid shares in BP p.l.c. of 25 cents each. Preference shares are cumulative first preference shares and cumulative second preference shares in BP p.l.c. of £1 each.
|
| |
|
Trade marks of the BP group
appear throughout this Annual Report and Form 20-F in italics. They include: |
| |
|
Aral
ARCO BP
Castrol Castrol
EDGE Field of the Future Fluid Strength Technology Hummingbird
|
|
LoSal Project 20K SaaBre
Veba Combi-Cracking (VCC)
Permasense is a trade mark of Permasense Limited. Pick n Pay is a registered trademark of
Pick n Pay Stores Limited. |
| |
|
|
|
|
| |
|
Registered office and our worldwide
headquarters: |
|
Our agent in the US: |
| |
|
BP p.l.c. 1 St
James’s Square London SW1Y 4PD UK Tel +44 (0)20 7496 4000 |
|
BP America Inc.
501 Westlake Park Boulevard Houston,
Texas 77079 US Tel +1 281
366 2000 |
| |
|
Registered in England and Wales No. 102498.
Stock exchange symbol ‘BP’. |
|
|
| |
|
|
|
|
|
|
|
| ii |
|
BP Annual Report and Form 20-F 2013 |
BP at a glance

|
|
|
| 2 |
|
BP Annual Report and Form 20-F 2013 |
|
|
|
| BP Annual Report and Form 20-F 2013 |
|
3 |
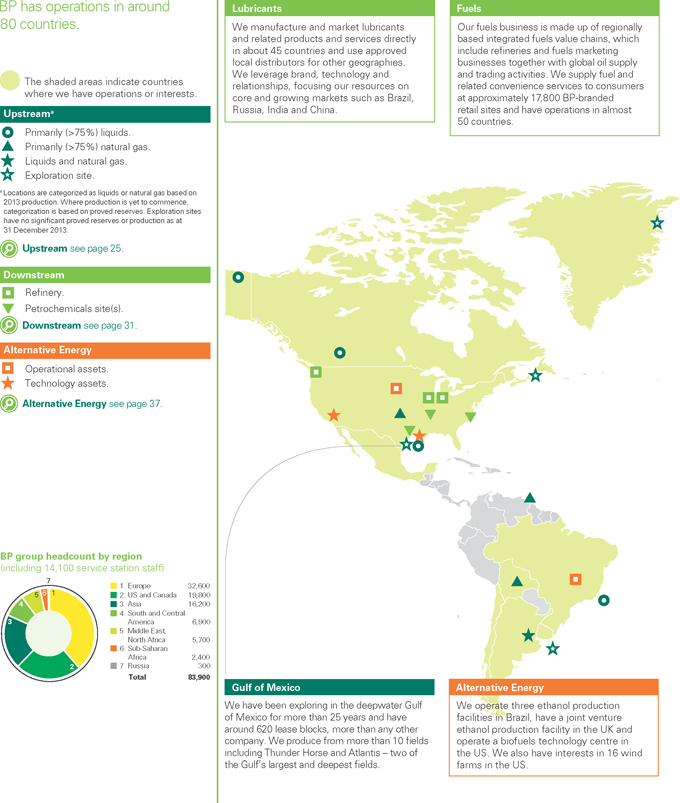
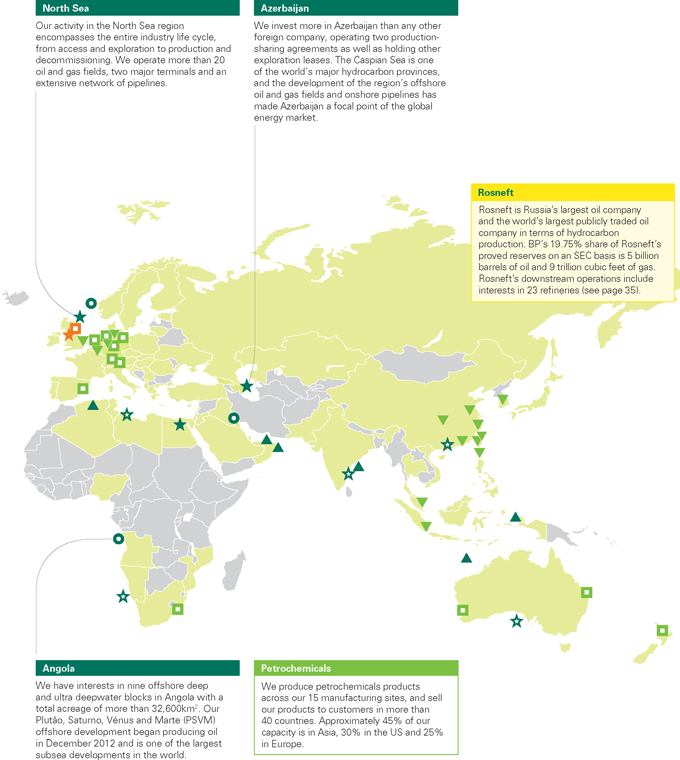
BP around the world
|
|
|
| 4 |
|
BP Annual Report and Form 20-F 2013 |
|
|
|
| BP Annual Report and Form 20-F 2013 |
|
5 |
Chairman’s letter

|
|
|
| |
|
| 10-year dividend history
UK (pence per ordinary share)
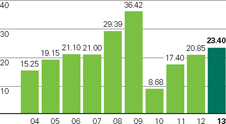
US (cents per
ADS)
One ADS represents six 25 cent ordinary shares. |
|
Dear fellow shareholder,
In 2013 BP continued the programme of renewal we began following the crisis of 2010. The measures taken to secure and reshape the group are taking hold. As this report
shows, BP is stronger and safer as a result. Change within the group has taken place against the
backdrop of a rapidly evolving world. The energy landscape is developing at pace, for example, the growth of shale gas in the US. But the long-term supply challenge has not gone away. More energy is required to meet the needs and aspirations of a
rising global population. The BP Energy Outlook projects an average increase in energy demand of 1.5% per year through to 2035. That’s like adding the needs of a country twice the size of the US over the next twenty years.
We are also seeing that society has ever higher expectations of business. This is reflected in the
increasing scrutiny placed on the commercial sector, particularly by politicians and the media. Companies must work hard to maintain people’s trust and respect.
Shareholders’ expectations are shifting too, particularly in the extractive industries sector. Some investors feel that international oil companies have spent too
much for too little return. A decade of mergers and acquisitions in our industry has generated little production growth. Capital expenditure has increased but profit margins have been squeezed. Rightly, shareholders expect better returns.
The board recognizes this changing world and the importance of our response. Throughout 2013 we gave
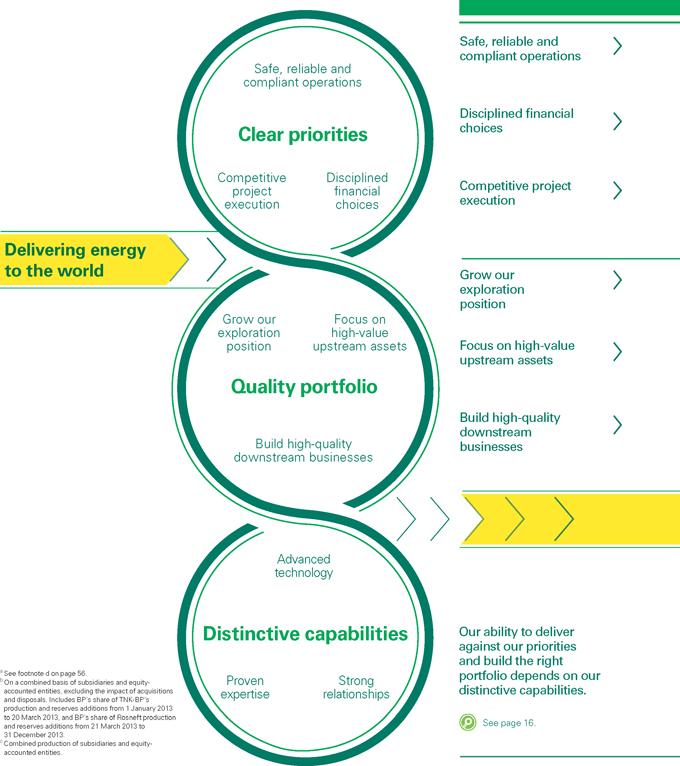
close attention to strategy, project appraisal and capital discipline, working with Bob Dudley and his team to ensure the group spends its money wisely. BP’s strategy is rooted in three imperatives: clear priorities, a quality portfolio and
distinctive capabilities. Our first clear priority is to run safe and reliable operations. We
must also make disciplined financial choices, selecting the smart options that can help meet demand and generate value. Furthermore, we must be competitive in how we execute our projects.
Our quality portfolio, which is at the core of our strategy, is the result of the choices we make. It
contains assets that enable us to play to our areas of greatest strength, from exploration to high-value upstream projects – particularly deepwater operations, giant fields and gas value chains – and high-quality downstream businesses.
To these assets and activities we apply our distinctive capabilities – the expertise of our
people, advanced technology and the ability to build the strong relationships required to access resources and deliver complex projects.
In all of this, we are focused on value before volume. In other words we don’t simply chase production for the sake of it, rather we choose projects where we can
generate the most value through our production. We know we must be disciplined, sticking to clear
limits on capital expenditure, and balancing rewards for shareholders today with the long-term capital investment required for tomorrow. Safety and strong governance must underpin everything we do.
2013 was a busy and successful year for BP, with progress in our underlying operations. Our growing
confidence was reflected in the dividend increase announced in October |
|
|
|
| 6 |
|
BP Annual Report and Form 20-F 2013 |
|
|
|
|
 Board performance
For information about the board and its
committees see page 71.
 Remuneration
 For information about
our approach to executive directors’ remuneration see
page 20.
€ Top: Members of BP’s safety, ethics and environment assurance committee (SEEAC) visited Canada to see the oil sands operations at the Sunrise project site and meet local community leaders and staff.
€ Bottom: Members of SEEAC travelled to
the Gelsenkirchen refinery in Germany to speak with apprentices and control room operators about risk management and processes.

|
|
2013 – the third increase in two years. We also returned value to shareholders through the $8-billion share repurchase programme announced in March
2013. Additional distributions are planned as we make further divestments to reshape our portfolio. The milestones set for 2014 will be an important measure of progress and your board is monitoring this closely.
I am particularly pleased that in 2013 we completed our transaction with Rosneft, closing one chapter
in Russia and opening another. This is an important investment with the potential to create substantial value for BP over the years to come.
2013 also saw the shocking attack at the In Amenas facility in Algeria. Our thoughts remain with the families and friends of those who died. The response of management to
this tragedy was strong and the board acted positively and promptly. We continue to address
uncertainty in the US. In 2013, we once again met our responsibilities to the region by paying legitimate claims arising from the 2010 accident and oil spill in the Gulf of Mexico. And we met our responsibilities to shareholders by challenging and
resisting any attempt to take advantage of BP with claims that are not legitimate. We will fight through the courts until matters are resolved properly, however long that takes. In the meantime, the board is working to ensure that BP is not
distracted from growing the business and creating shareholder value. Boards set the tone and
values that shape performance and behaviour over the long term. An effective board creates an enduring framework within which management can lead. Having been through challenging times, the BP board has grown into a strong team with experienced
non-executives drawn from relevant industries. This year, more than ever, they have been out to see BP’s operations for themselves, from India to Indiana. We continue to be assisted on geopolitical matters by the international advisory
board. Our approach to governance has enabled us to focus on critical strategic issues, with our
board committees taking on the many oversight and compliance matters that require attention.
Remuneration continues to be a board matter of particular importance to shareholders, with executive pay policy now subject to a vote at the annual general meeting. BP
has a record of ensuring there are clear links between strategy, performance and remuneration. This will continue.
I believe diversity helps to strengthen the effectiveness of a board. We plan succession well ahead and are developing a pipeline of potential board candidates. We are
committed to progress and finding the right people for our board. I would like to end by thanking
you, our shareholders, for your continued support. I also want to acknowledge the people who drive your company forward every working day. From Bob Dudley and his management team to employees across the business; our people are doing a great job of
transforming BP. Their hard work has moved us forward, with the promise of more to come.

Carl-Henric Svanberg
Chairman 6 March
2014 |
| |
|
| |
|
| |
|
| |
|
| |
|
| |
|
| |
|
|
|
|
|
|
| BP Annual Report and Form 20-F 2013 |
|
|
7 |
|
Group chief executive’s letter

|
|
|
|
|
| 95.3% 2013 refining availability. 129% Reserves
replacement ratio, excluding the impact of acquisitions and divestments. See footnote b on page 14. |
|
|
|
Dear fellow shareholder,
For BP, 2013 was a year of good progress in building a safer, stronger and better performing company.
We made new discoveries, started up new operations, strengthened our portfolio and secured a new future in Russia. We also maintained our investment in the US while standing up for what we believe to be right.
Within BP, sadly, 2013 will also be remembered for the terrorist attack in Algeria in January, when
four staff members and 36 colleagues from other companies were killed. Those who died had many friends in BP and our thoughts remain with their loved ones, and with those who survived that terrible ordeal. I was proud of the way people in BP
responded – with great compassion, but also with great fortitude. This report contains a
wealth of information on our performance. I would like to draw out a few of the year’s highlights, all of which demonstrate how we are implementing our strategy, with its emphasis on clear priorities, a quality portfolio and distinctive
capabilities. Clear priorities: safety, capital discipline, project
execution The first of our priorities is to run safe and reliable operations. In 2013 we made good progress overall, but unfortunately we also suffered two
driving-related fatalities as well as the loss of the four employees murdered at In Amenas. Our thoughts are with those who have been bereaved. We will implement the lessons learned.
In terms of general safety performance, however, we saw some encouraging progress. The number of tier
1 process safety events – the most significant incidents – fell to 20 from 43 in 2012 and 74 in 2011. We are definitely heading in the right direction, but there is always more to do and we remain vigilant.
We also saw improvements in measures that reflect the underlying health of our business. For example,
in upstream BP-operated plant efficiencya reached 88%, and refining availability in downstream averaged 95.3% – the highest level for 10 years. These numbers reinforce my view that safety and
value have the same roots: systematic, disciplined operations, undertaken by people who respect each other and work as one team.
In terms of capital discipline, in 2013 we invested $24.6 billionb, which kept us within our $25-billion limit, and
we expect to keep capital expenditure broadly the same in 2014. We know we have to invest wisely so we maintain our shareholders’ trust.
Turning to project execution, we saw three upstream major projects start up in 2013 – in the Gulf of Mexico, Angola and Australia. Three more followed closely in the
first months of 2014 – the Chirag oil project in Azerbaijan and the Mars B and Na Kika Phase 3 projects in the Gulf of Mexico.
Quality portfolio Beyond these start-ups, we
extended our portfolio as a platform for growth in several other ways. For example, we grew our
exploration position by participating in seven potentially commercial discoveries, in Angola, Brazil, Egypt, India and the Gulf of Mexico. We also drilled 17 exploration wells, more than in the previous two years put together. BP has built up great
skills in finding oil and gas and we are seeing the results of investing in our explorers. And in
the US lower 48 – which excludes Alaska and Hawaii – we intend to create a separate BP business to manage our onshore oil and gas assets, which we believe will help to unlock the significant value associated with our extensive resource
position there. |
|
|
|
| 8 |
|
BP Annual Report and Form 20-F 2013 |
|
|
|
|
Our strategy
For more on our strategic priorities and
longer-term objectives see page 13.
€ Top: Bob Dudley and Iraq Oil Minister
Abdul Karim Al Luaibi (right) being shown the first meter to be installed on one of the wells in Kirkuk. In October BP signed an agreement with the government of Iraq on providing technical assistance relating to the Kirkuk oil field.
€ Bottom: Investors see how BP manages
the risks of deepwater drilling at a field trip in Houston. They tested our well simulator which gives rig operators a better understanding of both prevention and response techniques.

a See footnote a on page 25. b Excludes acquisitions and Rosneft transaction. c See page 247 for further information. d See footnote c on page 56. e See footnote b on page 56. |
|
Our reserves replacement ratio was 129% of production. When we include the net growth in our Russian portfolio as a result of the change of our
holdings, the reserves replacement ratio on a combined basis was 199%.c
In the Downstream, we completed the commissioning of all major units for the Whiting refinery. This landmark modernization programme, our fourth major project start-up in
2013, is turning what began as a 19th century plant into a truly 21st century one. It is now able to compete strongly by processing a wide range of crudes, including heavy oil from Canada.
More generally, our Downstream business has transformed its shape over the last five years. In the
US, we have sold two facilities and we now have three modern refineries that are well configured and well connected to important markets. In lubricants, 40% of revenue now comes from our premium brands. In petrochemicals, we are also focusing on
high-growth regions and new technologies. Distinctive
capabilities New acetic acid and ethylene technologies announced by the petrochemical team in 2013 are among a series of innovations we have developed in
support of our exploration, production, refining and marketing activities. These include advanced seismic imaging capacity – using one of the world’s largest civilian supercomputers – enhanced oil recovery techniques and leading
lubricant processes. Our technologies are complemented by the capabilities of our people, which
we continue to deepen through training and development, and our experience in building and maintaining relationships.
New future in Russia Relationships have been vital
in securing a new future for BP in Russia as a 19.75% shareholder in Rosneft. Rosneft is implementing its strategy for growth across a promising portfolio and paid us a dividend of $456 million in 2013. We look forward to exploring opportunities for
BP to work with Rosneft in the years ahead. Making our case in the
US BP has continued to meet its commitment to environmental and economic restoration in the Gulf of Mexico. We have also been swift to counter illegitimate
claims and to argue for a fair resolution to compensation matters. By the end of the year the total cumulative cost to the company had reached $42.7 billion, the scale of that amount underlining once again that BP is living up to its
responsibilities in the region and to the US as a whole. The US remains vitally important to today’s BP, with around 20,000 employees across the country and we estimate that our economic activity supports a further 240,000 additional jobs.
Nearly 40% of our shares are held in the US, and we invest more there than in any other country. Looking ahead We are a smaller but stronger company, having divested $38 billion of assets over three years. In October we announced
that we would divest around a further $10 billion of assets before the end of 2015 – a decision that reflects our commitment to balancing reinvestment with rewards for our shareholders. We expect to use the proceeds predominantly for
distributions to shareholders, with a bias to share buybacks. Our unrelenting focus on capital
discipline and systematic operating is increasing the free cash flowd we have available. We are on track to meet our goal of generating more than $30 billion of operating cash flow in 2014, an
increase of more than 50% on 2011.e I’m
looking forward to 2014 with great confidence. I think you will see a re-energized and refocused BP – a company that is set to become stronger and safer in every way, as we fulfil our mission of delivering energy to customers and value to
shareholders.

Bob Dudley
Group Chief Executive 6 March
2014 |
|
|
|
|
|
| BP Annual Report and Form 20-F 2013 |
|
|
9 |
|
Our market outlook
|
|
|
|
|
| We believe that a diverse mix of fuels and technologies will
be essential to meet the growing demand for
energy
and the challenges facing our industry. |
|
|

|
|

|
| |
|
|
| Our third PTA plant in Zhuhai, China, is planned to begin production in late 2014.
It is expected to bring total capacity at the site to more than 2.7 million tonnes per year.
{
Thunder Horse in the Gulf of Mexico is one of the largest integrated offshore drilling and production platforms in the world. |
|
Population and economic growth are the main drivers of global energy demand. The world’s population is projected to increase by 1.7 billion from
2012 to 2035, with real income likely to more than double over the same period. Therefore, the
overall trend is likely to be one of increased energy demand, even with energy and climate policies and a shift towards less energy-intense activities in fast-growing economies. We expect demand for energy to increase by as much as 41% between 2012
and 2035. Challenges and opportunities
We seek energy sources that have the following attributes:
Affordability – meeting growing demand for secure and sustainable
energy presents an affordability challenge. Fossil fuels will become increasingly difficult to access and many lower-carbon resources will remain costly to produce at scale.
Security – each country knowing where its supplies will come from. More than 60% of the world’s known reserves of natural gas are
in just five countries and at least 80% of global oil reserves are located in nine countries, most of which are distant from the hubs of energy consumption. This represents a security challenge in its own right.
Sustainability – avoiding an unacceptable environmental and social
impact that ultimately negates the economic benefits. While energy is available to meet growing demand, action is needed to limit carbon dioxide (CO2) and other greenhouse gases emitted through
fossil fuel use. |
|
A diverse mix
We believe a diverse mix of fuels and technologies can enhance national and global energy security while supporting the transition to a lower-carbon economy. These are
reasons why BP’s portfolio includes oil sands, shale gas, deepwater oil and gas, and biofuels.
Oil and natural gas Oil and natural gas are likely
to play a significant part in meeting demand for several decades. We believe these energy sources
will represent about 54% of total energy consumption in 2035. Even under the International Energy Agency’s most ambitious climate policy scenario (the 450 scenario), oil and gas would still make up 47% of the energy mix in 2035.a The 450 scenario assumes governments adopt commitments to limit the long-term concentration of greenhouse gases in the atmosphere to 450 parts-per-million of CO2 equivalent. We expect oil to remain the
dominant source for transport fuels, accounting for as much as 87% of demand in 2035. Natural
gas, in particular, is likely to play an increasingly strategic role. Shale gas is expected to contribute 47% of the growth in global natural gas supplies between 2012 and 2035. The shale gas revolution has already had a significant impact on gas
prices and demand in the US and may encourage similar developments elsewhere although the scale and speed of the roll out of shale gas technology will vary between countries. When used in place of coal for power, natural gas can reduce CO2 emissions by half.
a From World Energy Outlook 2013. ©
OECD/International
Energy Agency 2013, page 573. |
| |
|
|
|
 2013 pricing
See Upstream on page 26 and
Downstream on page 32. |
|
|
|
|
|
|
|
| 10 |
|
BP Annual Report and Form 20-F 2013 |
|
|
|
|
|
|

BP Energy Outlook contains our
projections of future energy trends and factors that could affect them, based on our views of likely economic and population growth and developments in policy and technology. Available in PDF, Excel and video format.
 See bp.com/energyoutlook.
Energy consumption by region
(billion tonnes of oil equivalent)
Source: BP Energy Outlook 2035.
Energy consumption by fuel
(billion tonnes of oil equivalent)
* Includes biofuels.
Source: BP Energy Outlook 2035. |
|
New sources of hydrocarbons are more difficult to reach, extract and process. BP and others in our industry are working to improve techniques for
maximizing recovery from existing and currently inaccessible or undeveloped fields. In many cases, the extraction of these resources might be more energy intensive, which means operating costs and greenhouse gas emissions from operations may also
increase. Renewable energy
Renewables will play an increasingly important role in addressing the challenges of energy security and climate change over the long term. Renewables are already the
fastest-growing energy source, but they are starting from a low base. By 2035, we estimate
renewable energy, excluding large-scale hydro electricity, is likely to meet around 7% of total global energy demand.
Energy efficiency and innovation
Greater efficiency addresses several aspects of the energy challenge. It helps with affordability – because less energy is needed. It helps with security –
because it reduces dependence on imports. And it helps with sustainability – because it reduces emissions.
Innovation can play a key role in improving technology design, process and use of materials, bringing down cost and increasing efficiency. In transport, for example, we
believe that efficient technologies and combustion engines that use biofuels could offer the most cost-effective pathway to a secure, lower-carbon future.
Policy, prices and access
If the world’s growing demand for energy is to be met in a sustainable way, we believe that governments must set a stable and enduring framework for the private
sector to invest and for consumers to choose wisely. This includes secure access for exploration and development |
|
of energy resources, mutual benefits for resource owners and development partners, and an appropriate legal and regulatory environment.
We believe open and competitive markets are the most effective way to encourage companies to find,
produce and distribute diverse forms of energy sustainably. The US experience with shale gas shows how an open and competitive environment can drive technological innovation and unlock resources.
We also believe that putting a price on carbon – one that treats all carbon equally, whether it
comes out of a smokestack or a car exhaust – will make energy efficiency and conservation more attractive to businesses and individuals and lower-carbon energy sources more cost competitive. A global carbon price should be the long-term goal,
but regional and national approaches are a good first step, provided temporary financial relief is given to sectors that are exposed to international competition.
Beyond 2035
We expect that growing population and per capita incomes will continue to drive growing demand for energy. These dynamics will be shaped by future technology
developments, changes in tastes, and future policy choices – all of which are inherently uncertain. Concerns about energy security, affordability and environmental impacts are all likely to be important considerations. These factors may
accelerate the trend towards more diverse sources of energy supply, a lower average carbon footprint, increased efficiency and demand management.
 Strategy
 Find out how BP can help meet
energy demand for years to come on
page 13.

Air BP is one of the world’s largest aviation fuels suppliers, marketing aviation fuels and specialist products in more than 45 countries. It sells over seven billion gallons of fuel per year. |
|
|
|
|
|
| BP Annual Report and Form 20-F 2013 |
|
|
11 |
|
Our business model
|
|
|
|
|
| We aim to create shareholder value across the
hydrocarbon value chain. |
|
|

|
|
|
| |
|
|
| Toledo refinery in Ohio has been in constant operation since 1919. The facility
has the capacity to process up to 160,000 barrels of crude per day. { The redevelopment
project at Valhall was one of
BP’s most complex field expansion
developments and gives the field a further
40-year design life. |
|
A rising global population and increasing levels of prosperity are set to create growing demand for energy for years to come. We can help to meet that
demand by producing oil and gas safely and reliably. We believe that the best way to achieve
sustainable success as a group is to act in the long-term interests of our shareholders, our partners and society. We aim to create value for our investors and benefits for the communities and societies in which we operate, with the responsible
supply of energy playing a vital role in economic development. Every stage of the hydrocarbon
value chain offers opportunities for us to create value – both through the successful execution of activities that are core to our industry, and through the application of our own distinctive strengths and capabilities in performing those
activities. In renewable energy our focus is on integrating biofuels into the hydrocarbon value chain, and on wind operations in the US. |
|
Our approach spans everything from exploration to marketing. Integration across the group allows us to share functional excellence more efficiently
across areas such as safety and operational risk, environmental and social practices, procurement, technology and treasury management.
A relentless focus on safety remains the top priority for everyone at BP. Rigorous management of risk helps to protect the people at the front line, the places in which
we operate and the value we create. We understand that operating in politically complex regions and technically demanding geographies requires particular sensitivity to local environments.
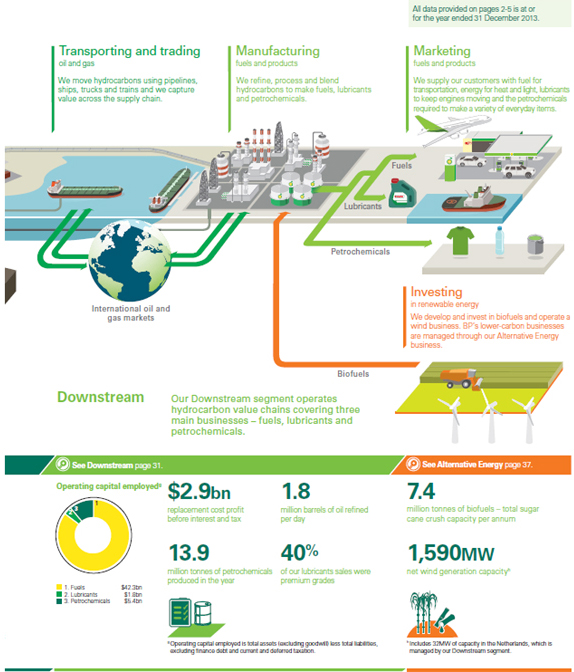
 Our businesses
 For more information on our
upstream, downstream and alternative energy
businesses, see pages 25, 31 and 37
respectively. |
Our business model
|
|
|
|
|
|
|
|
|
|
|
|
|
|
|
|
|
|
|
| Finding oil
and gas |
|
g |
|
|
|
Developing and extracting |
|
g |
|
|
|
Transporting and trading |
|
g |
|
|
|
Manufacturing and marketing |
|
|
|
|
|
|
|
| First, we acquire the rights to explore for oil and gas. Through our exploration activities we are able to renew
our portfolio, discover new resources and replenish our development options. |
|
|
|
When we find hydrocarbon resources, we create value by seeking to progress them into proved reserves or by divesting if they do not fit with our strategy. If we believe developing
and producing the reserves will be advantageous for BP, we produce the oil and gas, then sell it to the market or distribute it to our downstream facilities. |
|
|
|
We move oil and gas through pipelines and by ship, truck and train. Using our trading and supply skills and knowledge, we buy and sell at each stage in the value chain. Our
presence across major trading hubs gives us a good understanding of regional and international markets and allows us to create value through entrepreneurial trading. |
|
|
|
Using our technology and expertise, we manufacture fuels and products, creating value by seeking to operate a high-quality portfolio of well- located assets safely, reliably and efficiently.
We market our products to consumers and other end-users and add value through the strength of our brands. |
Our illustrated business model see page 2.
|
|
|
| 12 |
|
BP Annual Report and Form 20-F 2013 |
Our strategy
|
|
|
|
|
| Our goal is to be a focused oil and gas company that
delivers value over volume. |
|
|
|

a See footnote a on page 56. b Equivalent to net cash used in investing activities. c See footnote c on page 56. d See footnote h on page 24. e Excludes acquisitions and asset exchanges. f Unit cash margin is net cash provided by operating activities
by the relevant projects in our Upstream segment,
divided by the total number of barrels of oil
equivalent produced for the relevant projects.
g Assuming a constant oil price of $100 per barrel.
h See footnote b on page 56.
i See footnote d on page 56. |
|
We are pursuing our strategy by setting clear priorities, actively managing a quality portfolio and employing our distinctive capabilities. Our
financial objective is to create shareholder value by generating sustainable free cash flow (operating cash flow less net investment). This disciplined approach enables us to invest for the future while aiming to increase distributions to our
investors. Clear priorities
First, we aim to run safe, reliable and compliant operations – leading to better operational
efficiency and safety performance. We also aim to achieve competitive project execution, which is about delivering projects efficiently so they are on time and on budget. And we aim to make disciplined financial choices, so we can achieve continued
growth in operating cash from our underlying businesses and disciplined allocation of capital. Quality portfolio We undertake active portfolio management to concentrate
on areas where we can play to our strengths. This means we continue to grow our exploration position, reloading our upstream pipeline. We focus on high-value upstream assets in deepwater, giant fields and selected gas value chains. And, with our
downstream businesses, we plan to leverage our newly upgraded assets, customer relationships and technology to grow free cash flow. |
|
Our portfolio of projects and operations is focused where we can generate the most value, and not necessarily the most volume, through our
production. Distinctive capabilities
Our ability to deliver against our priorities and build the right portfolio depends on our
distinctive capabilities. We apply advanced technology across the hydrocarbon value chain, from finding resources to developing energy-efficient and high-performance products for customers. We rely on our strong relationships – with
governments, partners, civil society and others – to enable our operations in around 80 countries across the globe. And, the proven expertise of our employees comes to the fore in a wide range of disciplines.
Our strategy in action See page 14 for more
information on how we are going to measure our
progress. |
| |
10-point plan
2011-2014 In 2011 we laid out a 10-point plan designed to stabilize the company and
restore trust and value in response to the tragic Deepwater Horizon accident. Our priority was to make BP a safer, more risk-aware business. The plan included a series of milestones by which our progress could be tracked, from 2012 through to 2014.
Information on our progress during 2013 can be found in Group performance on page 22. |
| |
1 A
relentless focus on safety and managing risk through the systematic application of global standards.
2 We will play to our strengths in exploration, deep water, giant fields and gas value chains.
3 Stronger and more focused
with an asset base that is high graded and higher performing.
4 Simpler and more standardized with fewer assets and operations in fewer countries; more
streamlined internal reward and performance management processes.
5 Improved transparency through reporting TNK-BP as a separate segment and breaking out the numbers
for the three downstream businesses. |
|
6 Active
portfolio management to continue by completing $38 billion of disposals over the four years to the end of 2013, in order to focus on our strengths.
7 We expect to bring new upstream projects onstream with unit operating cash marginsf around double the 2011 average by 2014.g
8 We are aiming to generate an increase of around 50% in net cash provided by operating activities
by 2014 compared with 2011.h
9 We intend to use half our incremental operating cash for reinvestment, half for other
purposes. 10 Strong balance sheet with
intention to target our level of gearingi in the lower half of the 10-20% range over time. |
|
|
|
|
|
| BP Annual Report and Form 20-F 2013 |
|
|
13 |
|
Our strategy in action
|
|
|
| 14 |
|
BP Annual Report and Form 20-F 2013 |
|
|
|
|
|
|
|
|
|
|
|
|
|
|

|
|
|
|

|
|
|
|

|
|
|
|
|
|
|
|
| We prioritize the safety and reliability of our operations to protect the welfare of our workforce and the environment. This also helps preserve value and secure our right to operate around the
world. |
|
|
|
Recordable injury frequency, loss of primary containment, greenhouse gas emissions, tier 1 process safety events. |
|
|
|

|
|
A commitment to safe operations Toledo refinery sets a safety
record.
 See page 42.
 |
|
31 fewer
reported losses of primary containment than 2012. |
|
|
|
|
|
|
|
| We rigorously screen our investments and we work to keep our annual capital expenditure within a set range. Ongoing management of our portfolio helps ensure focus on more value-driven propositions. We
balance funds between shareholder distributions and investment for the future. |
|
|
|
Operating cash flow, gearinga, total shareholder return, replacement cost
profit (loss) per ordinary share. |
|
|
|

|
|
Maximizing value at Mad Dog Changing plans to make the best financial choices.
See page 29. |
|
$21.1bn
operating cash flow. |
|
|
|
|
|
|
|
| We seek efficient ways to deliver projects on time and on budget, from planning through to day-to-day operations. Our wide-ranging project experience makes us a
valued partner and enhances our ability to compete. |
|
|
|
Major project delivery. |
|
|
|

|
|
Increasing oil production
in Azerbaijan Local construction of BP’s
heaviest platform in the Caspian Sea.
See page 48. |
|
4
major project start-ups in
Upstream and Downstream. |
|
|
|
|
|
|
|
| We target basins and prospects with the greatest potential to create value, using our leading subsurface capabilities. This allows us to build a strong pipeline of future growth opportunities. |
|
|
|
Reserves replacement ratio.b |
|
|
|

|
|
Discovering gas in India Two
significant discoveries with Reliance Industries.
See page 30. |
|
129%
reserves replacement
ratio. |
|
|
|
|
|
|
|
| We are strengthening our portfolio of high return and longer life assets – across deep water, giant fields and gas value chains – to provide BP with momentum for decades to come. |
|
|
|
Production.c |
|
|
|

|
|
Preparing for Shah Deniz Stage 2
Largest gas sales contracts in Azerbaijan’s history.
See page 27. |
|
3.2
million barrels of oil equivalent
per day. |
|
|
|
|
|
|
|
| We benefit from our high-performing fuels, lubricants, petrochemicals and biofuels businesses. Through premium products, powerful brands and supply and trading, Downstream provides strong cash generation
for the group. |
|
|
|
Refining availability. |
|
|
|

|
|
Creating our North American advantaged refinery
Modernization project improves utilization and margin capture at Whiting.
See page 33. |
|
95.3%
refining availability. |
|
| Creating shareholder value by
generating sustainable free cash flow
|
|
|
|
|
|

|
|

|
|

|
| |
|
|
| Advanced technology |
|
Strong relationships |
|
Proven expertise |
We develop and deploy technologies
we expect to make the greatest impact on
our businesses – from enhancing the safety
and reliability of our operations to
creating
competitive advantage in energy discovery,
recovery, efficiency and products. |
|
We form enduring partnerships in the
countries in which we operate, building strong
relationships with governments, customers,
partners such as Rosneft, suppliers and
communities to
create mutual advantage.
Co-operation helps unlock resources found in
challenging locations and transforms them into
products for our customers. |
|
We attract and develop the talented people
required to drive our business forward.
They apply their diverse skills and expertise
to deliver complex projects across all areas
of our business. |
|
|
|
| BP Annual Report and Form 20-F 2013 |
|
15 |
Our distinctive capabilities

|
|
|
|
|
| We use technology to find and produce more hydrocarbons, improve our processes for converting raw materials and
develop lower-carbon products. The development of technology from
research and development through to wide-scale deployment can take several years. For example, to reach the next generation of deepwater oil reserves, where rock pressures can reach 20,000 pounds per square inch, we are developing new subsea
technologies through our Project 20K. Technology programmes
in our upstream business include advanced seismic imaging to help us find more oil and gas and enhanced oil recovery to get more from existing fields. New techniques are making recovery of unconventional oil and gas, like shale, economically
viable.
 See bp.com/technology.

The Pangbourne
technology centre is home to chemists and liquid engineers dedicated to providing products and services for Castrol’s customers. |
|
We focus our downstream technology programmes on the safety, integrity and performance of our refineries and petrochemical plants
and on creating high quality, energy efficient, cleaner fuels, lubricants and petrochemicals.
BP employs more than 2,000 scientists and technologists.
Our long-term research programmes with universities and research institutions around the world are exploring areas from reservoir fluid flow to
energy biosciences. We have a strategic approach to university relationships across our portfolio for the purposes of research, recruitment, policy insights and education.
In 2013 we invested $707 million in research and development (2012 $674
million). See Financial statements – Note 8. |
|
|
| |
 Seismic imaging
 We use our imaging expertise to
increase the productivity and quality of the data we capture on land and offshore. With 80% of future offshore oil and gas reserves thought to be under salt canopies up to 7 kilometres high, our new supercomputer in Houston helps to reduce the
completion times for imaging jobs from several months to a matter of days. |
|
 Enhanced oil recovery (EOR)
 Our
LoSal EOR technology can help develop previously unexploited resources from existing oil fields. LoSal uses water with a low salt content to release more molecules of oil from the sandstone rock where they are held.
|
| |
 Production optimization
 Our Field of the
Future technologies provide real-time information to help manage operational risk, improve plant equipment reliability and optimize production. We use these technologies to monitor more than 600 wells. |
|
 Shipping efficiency
 Our ‘virtual
arrival’ system can reduce fuel consumption and emissions by allowing vessels, ports and other parties to work together and agree an optimum arrival time for each vessel. |

|
|
|
|
|
| Our employees enable BP to deliver our strategy and meet our commitments to investors, partners and the wider world.
Our people are talented in a wide range of disciplines, from geoscience,
mechanical engineering and research technology to government affairs, trading, marketing, legal and others. And our approach to professional development programmes and training helps build individual capabilities, reducing a potential skills gap.
This is vital in a world where oil and gas companies face an increasing challenge to find and retain skilled and experienced people.
We aim to achieve a balance between building internal expertise and recruiting external professionals and graduates. We have a strong, experienced
leadership team and a pipeline of talent for the future. |
|

|
|
|
|
| 16 |
|
BP Annual Report and Form 20-F 2013 |
|
|
|
|
|
|
 Improved conversion
 Our Veba Combi-Cracking
technology converts a wide variety of raw materials, ranging from crude oil residue to mixtures of coal and oil, into fuels. Using this technology we can convert 95% or more of our hydrocarbon resources to marketable products. |
|
 Fuels and lubricants
 We focus on providing
energy-efficient and high-performance products to customers. Castrol EDGE, which is underpinned by our proprietary Fluid Strength Technology, reduces contact between engine surfaces to improve performance and reduce wear from
friction. |
|
 Biofuels
 Conversion technology allows us to produce
cellulosic ethanol using alternative raw materials such as agricultural waste and fast-growing energy grasses. At our biofuels technology centre in San Diego around 120 scientists are researching and advancing new biofuels
technologies. |
|
 Corrosion prevention
 Wireless Permasense® systems, developed in collaboration with Imperial College, London, are used across all our refineries to monitor the integrity of critical oil and gas assets. |
|
 Petrochemicals
 Our SaaBre technology converts
synthesis gas (carbon monoxide and hydrogen derived from hydrocarbons) into acetic acid. The process avoids the need to purify carbon monoxide or purchase methanol, reducing manufacturing costs and environmental impacts. |
|
|

|
|
|
|
|
| Our relationships are crucial to the success of our business. We work closely with governments, national oil companies and other
resource holders. By acting responsibly and meeting our obligations we build long-lasting relationships.
From experience we know that trust can be lost, so we place enormous importance on meeting people’s expectations. We work in partnership on big
and complex projects with everyone from other oil companies through to suppliers and |
|
contractors. Our activity creates value that benefits governments, customers, local communities and other partners.
Internally we put together collaborative teams of people with the skills and
experience needed to address complex issues, work effectively with our partners and help create shared value. |
|

|
|
|
|
| BP Annual Report and Form 20-F 2013 |
|
17 |
Our key performance indicators
|
|
|
|
|
|
|
| We assess the group’s performance according to a wide range of measures and
indicators. Our key performance indicators (KPIs) help the board and executive management measure performance against our strategic priorities and business plans. We keep these metrics under periodic review and test their relevance to our strategy
regularly. We believe non-financial measures – such as safety and an engaged and diverse workforce – have a useful role to play as leading indicators of future performance.
Changes to KPIs
This year, we introduced two new KPIs: tier 1 process safety events and major project delivery. These demonstrate two of our strategic objectives and are used as measures
for executive remuneration. We have removed the number of oil spills as a group KPI as this is
reflected within the loss of primary containment and tier 1 process safety events KPIs. We continue to report on oil spills, see Safety on page 41.
Remuneration To help align the focus of our board
and executive management with the interests of our shareholders, certain measures are reflected in the variable elements of executive remuneration.
Overall annual bonuses, deferred bonuses and performance shares are all based on performance against measures and targets linked directly to strategy and KPIs. For
details of our remuneration policy see page 96.
 KPIs used to measure
 progress against our
strategy.
 KPIs used to determine 2013
 and 2014 remuneration.

|
|
Replacement cost profit (loss) per ordinary share (cents)
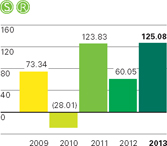
Replacement cost profit (loss) is a useful measure for investors
because it is a profitability measure BP management use to assess performance and allocate resources.
It reflects the replacement cost of supplies and is calculated by removing inventory holding gains and losses and their associated tax effect from profit. This is a
non-GAAP measure for the group. The IFRS equivalent can be found on page 236. 2013 performance The increase in replacement cost profit per ordinary share for the year compared with 2012 reflected the gain on disposal of our interest in TNK-BP. |
|
Operating cash flow ($ billion)
Operating cash flow is net cash flow provided by operating
activities, from the group cash flow statement. Operating activities are the principal revenue-generating activities of the group and other activities that are not investing or financing activities.
2013 performance Higher operating cash flow in 2013 reflected a lower
cash outflow relating to the Gulf of Mexico oil spill, partly offset by higher cash outflows as a result of working capital build. |
|
Gearing (net debt ratio) (%)
Our gearing (net debt ratio) shows investors how significant net
debt is relative to equity from shareholders in funding BP’s operations. We aim to keep our
gearing within the 10-20% range to give us the flexibility to deal with an uncertain environment.
Gearing is calculated by dividing net debt by total equity plus net debt. Net debt is equal to gross finance debt, plus associated derivative financial instruments, less
cash and cash equivalents. Net debt and net debt ratio are non-GAAP measures. See Financial statements – Note 28 for the nearest equivalent measure on an IFRS basis and for further information.
2013 performance Gearing at the end of 2013 was 16.2%, down 2.5% on 2012
and within our target band of 10-20%. |
| |
|
| |
Refining availability (%)
Refining availability represents Solomon Associates’
operational availability. The measure shows the percentage of the year that a unit is available for processing after deducting the time spent on turnaround activity and all mechanical, process and regulatory maintenance downtime.
Refining availability is an important indicator of the operational performance of our Downstream
businesses. 2013 performance Refining availability increased by 0.5%
from 2012 to 95.3% reflecting strong operations around our global refining portfolio. |
|
Reported recordable injury frequencya

Reported recordable injury frequency (RIF) measures the number of
reported work-related employee and contractor incidents that result in a fatality or injury (apart from minor first aid cases) per 200,000 hours worked.
The measure gives an indication of the personal safety of our workforce.
2013 performance Our workforce RIF, which includes employees and contractors combined, was 0.31, compared with 0.35 in 2012 and 0.36 in 2011.
These successive reductions are encouraging and we continue pursuing improvement in personal safety. |
|
Loss of primary containmenta
Loss of primary containment (LOPC) is the number of unplanned or
uncontrolled releases of oil, gas or other hazardous materials from a tank, vessel, pipe, railcar or other equipment used for containment or transfer.
By tracking these losses we can monitor the safety and efficiency of our operations as well as our progress in making improvements.
2013 performance Our reported LOPC shows 31 fewer reported incidents in
2013 than in 2012, with divestments accounting for a significant part of the reduction. We remain committed to using our operating management system to further improve our operations. |
|
|
|
| 18 |
|
BP Annual Report and Form 20-F 2013 |
|
|
|
|
|
|
|
| Total shareholder return (%)

Total shareholder return (TSR) represents the change in value of a
BP shareholding over a calendar year. It assumes that dividends are re-invested to purchase additional shares at the closing price on the ex-dividend date.
We are committed to maintaining a progressive and sustainable dividend policy.
2013 performance TSR grew as a result of increases in both the BP share price and in the dividend, with the improvement for ordinary shares
slightly offset by exchange rate effects. |
|
Reserves replacement ratio (%)
Proved reserves replacement ratio is the extent to which the
year’s production has been replaced by proved reserves added to our reserve base. The ratio
is expressed in oil-equivalent terms and includes changes resulting from discoveries, improved recovery and extensions and revisions to previous estimates, but excludes changes resulting from acquisitions and disposals. The ratio reflects both
subsidiaries and equity-accounted entities. The measure helps to demonstrate our success in
accessing, exploring and extracting resources. 2013 performance The
increase in our reserves replacement ratio included the impact of final investment decisions on two significant upstream projects in Oman and Azerbaijan. |
|
Major project delivery

Major projects are defined as large-scale projects with a high
degree of complexity and a BP net investment of at least $250 million. We monitor the progress of
our major projects to gauge whether we are delivering our core pipeline of activity. Projects take many years to complete, requiring differing amounts of resource, so a smooth or increasing trend should not be anticipated.
2013 performance In total we delivered four major projects. Three
started up in Upstream – Atlantis North expansion Phase 1 in the Gulf of Mexico; Angola LNG; and North Rankin Phase 2 in Australia, and one in Downstream – the Whiting refinery modernization project. |
|
Production (mboe/d)
We report the volume of crude oil, condensate, natural gas liquids
(NGLs) and natural gas produced by subsidiaries and equity-accounted entities. These are converted to barrels of oil equivalent (boe) at 1 barrel of NGL = 1boe and 5,800 standard cubic feet of natural gas = 1boe.
2013 performance BP’s total reported production including our
Upstream segment, and our share of TNK-BP (from 1 January to 20 March) and Rosneft (from 21 March to 31 December), was 3% lower than in 2012. This was mainly due to the effect of divestments in Upstream. |
|
|
|
|
| |
|
|
|
|
|
|
| Tier 1 process safety eventsa
We report tier 1 process safety events (PSE), which are the losses
of primary containment of greatest consequence – causing harm to a member of the workforce, costly damage to equipment or exceeding defined quantities.
2013 performance Our reduction in reported tier 1 PSEs is supported by our efforts to drive improvement in process safety. Divestments also
account for part of the reduction. We are aware there is always more to do to improve.
a This represents reported incidents occurring
within BP’s operational HSSE reporting
boundary. That boundary includes BP’s
own operated facilities and certain other
locations or situations. |
|
Greenhouse gas emissions (million tonnes of CO2 equivalent)
We report greenhouse gas (GHG) emissions material to our business
on a carbon dioxide-equivalent basis. This includes CO2 and methane for direct emissions.b Our GHG reporting encompasses all BP’s
consolidated entities as well as our share of equity-accounted entities other than BP’s share of TNK-BP and Rosneft. Rosneft’s emissions data can be found on its website.
2013 performance Our total greenhouse gas emissions decreased by 18%,
primarily due to the divestment of our Texas City and Carson refineries.
b For indirect emissions data see page 45. |
|
Group priorities engagementc (%)

We track how engaged our employees are with our strategic
priorities for building long-term value. The measure is derived from answers to 12 questions about BP as a company and how it is managed in terms of leadership and standards.
2013 performance We saw continued improvement in 2013, and there was an increase in understanding of our operating management system, an area
of focus identified the previous year. While the survey showed an increase in employee confidence in BP’s leadership, work is needed to further strengthen this.
c Relates to BP employees. |
|
Diversity and inclusionc d (%)

Each year we report the percentage of women and individuals from
countries other than the UK and US among BP’s group leaders. This means we can track
progress in building a diverse and well-balanced leadership team, helping to create a sustainable pipeline of diverse talent for the future.
2013 performance We have increased the percentage of female leaders again this year and have extended our focus on diversity and inclusion
beyond the board and group leaders to include other levels of management.
d Minor amendments have been made to
2012. |
|
|
|
| BP Annual Report and Form 20-F 2013 |
|
19 |
Our approach to executive
directors’ remuneration
Remuneration is directly linked to strategy and performance, with
particular emphasis on matching rewards to results over the long term.
|
|
|
| A simple approach |
|
|
| Total remuneration is determined by a relatively simple approach to attract and retain high calibre executives. The largest components are share based and vest over a number of years – further aligning
executives’ interests with those of our shareholders. |
|

|

Underpinned by six key principles
The remuneration policy for executive directors and the
decisions of the remuneration committee of the board
are guided by six key principles:
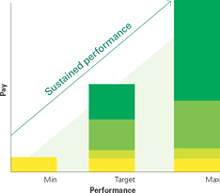
A substantial portion of executive remuneration is linked to success in implementing the
company’s strategy.
Strategic priorities and group key performance indicators (KPIs) provide key metrics for the performance shares and deferred bonus,
and are focused through the annual plan to provide the measures for annual bonus.

The major part of total remuneration varies with performance, with the largest elements share based,
further aligning interests with shareholders.
High pay requires high performance. Achieving the maximum pay requires sustained high performance over several
years.
|
|
|
| 20 |
|
BP Annual Report and Form 20-F 2013 |
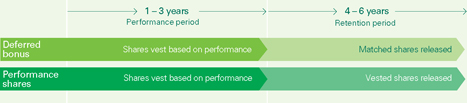
The structure of pay is designed to reflect the long-term nature of BP’s business and the
significance of safety and environmental risks.
The largest components of total remuneration are share based and vest over the longest period. The deferred
bonus plan requires sustained safety and environmental performance
over three years. The matched shares that vest under the plan have an additional three-year retention period, resulting in
a six-year time frame. Similarly, performance shares have a six-year time frame – a three-year performance period followed by an additional three-year retention period for those shares that vest.
There are quantitative and qualitative assessments of performance with the remuneration committee
making informed judgements within a framework approved by shareholders.
The committee has a preference for quantifiable targets that can be factually measured
and objectively assessed according to well understood principles and definitions. It seeks the views of other relevant committees when arriving at conclusions. It is not constrained when conditions change requiring different perspectives or when
unanticipated events, both good and bad, occur.
The remuneration committee actively seeks to understand shareholder preferences and be transparent in
explaining its policy and practice.
During 2013 the remuneration committee chairman met personally with shareholders representing nearly 15% of total
outstanding shares. A number of adjustments to policy were made in response to the feedback received (see page 82).
94%
of votes cast were in favour of the 2012 Directors’ remuneration report.
Total overall pay takes account of both the external market and company conditions to achieve a
balanced, ‘fair’ outcome.
The committee attempts to balance sometimes conflicting perspectives to arrive at total pay results that not only reflect
performance relative to strategy, but also are deemed fair by external stakeholders and employees, as well as the executive team.
|
|
|
| BP Annual Report and Form 20-F 2013 |
|
21 |
Group performance
Our progress in 2013 has set us up well to deliver our
10-point plan and forms the foundations for delivering
value in the long term.
|
|
|
|
|
|
|

|
|
|
|

|
|
|
|
|
|
| ~
In May we completed the successful commissioning of a state-of-the-art diesel hydrotreater and hydrogen plant at the Cherry Point refinery in
Washington state. { The Mad Dog field in the
Gulf of Mexico was discovered in 1998 and is one of BP’s largest discoveries in the Gulf of Mexico to date. |
|
|
|
We continued to operate within a disciplined financial framework in 2013 – with organic capital expenditurea of $24.6 billion (within
the expected $24-$25 billion range). Upstream BP-operated plant efficiencyb of 88% and strong refining availability of 95.3% in Downstream demonstrated our progress in operational efficiency. We
completed the transactions to increase our shareholding in Rosneft to 19.75%. And, we are continuing to meet our commitments in the Gulf of Mexico, while making our case in court. |
|
|
|
|
|
|
|
|
|
|
|
2013-2014 milestones set out in our 10-point plan
|
|
|
|
|
Drilling up to 25 wells per year. |
|
|
|
|
g |
|
We completed 17 exploration wells and made seven potentially commercial discoveries in 2013. It was our most
successful year for exploration drilling in almost a decade. |
|
|
|
|
A further nine major upstream project start-ups. |
|
|
|
|
g |
|
Three major projects were started up in 2013 and another three in January and February 2014. We expect a further
four major upstream projects to start up in 2014. |
|
|
|
|
Unit operating cash marginsc from new upstream projects in 2014 are expected to be double the 2011 average.d |
|
|
|
|
g |
|
We continued to bring on major projects in key regions such as Angola and the Gulf of Mexico.
|
|
|
|
|
Bringing onstream the major upgrade to the Whiting refinery in the second half of 2013. |
|
|
|
|
g |
|
We completed the commissioning of all major units for the refinery upgrade, transforming it into one of our
advantaged downstream assets in our portfolio. |
|
|
|
|
Completing our $38-billion divestment programme by the end of 2013. |
|
|
|
|
g |
|
We completed our $38-billion divestment programme in 2012 – effectively a year early. In October 2013, we
announced our plan to divest a further $10 billion before the end of 2015. |
|
|
|
|
We have a high-value, focused portfolio that plays to our strengths. |
|
 Segment performance
 For Upstream and Downstream performance see pages 25 and
31 respectively. |
|
|
|
g |
|
Our divestments have removed complexity, strengthened the balance sheet and left us with a more distinctive set
of assets that play to our strengths – deep water, gas value chains, giant fields and high-quality downstream businesses. |
| |
|
|
Increasing overall operating cash flowe by 50% in 2014 compared with
2011.f |
|
|
|
|
g |
|
We are on track to meet our goal of generating more than $30 billion of operating cash flow in 2014.
|
| a Organic capital expenditure excludes
acquisitions, asset exchanges, and other inorganic capital expenditure.
b See footnote a on page 25.
c See footnote f on page 13.
d See footnote g on page 13.
e See footnote a on page 56.
f See footnote b on page 56. |
|
|
|
We expect to use around half of the extra cash for increased investment and around half for other purposes, including increased distributions to
shareholders. |
| |
|
g |
|
As at 31 December 2013 we had bought back 753 million shares for a total amount of $5.5 billion, including fees and stamp duty, since 22 March 2013. The dividend paid in
2013 was 36.5 cents per share, up 30% compared with the dividend of 28 cents per share paid in 2011. |
|
|
|
| 22 |
|
BP Annual Report and Form 20-F 2013 |
Group performance and outlook
Financial performance
|
|
|
|
|
|
|
|
|
|
|
|
|
| |
|
|
|
|
|
|
|
|
|
|
$ million |
|
| |
|
|
2013 |
|
|
|
2012 |
|
|
|
2011 |
|
| Profit before interest and taxation |
|
|
31,769 |
|
|
|
19,769 |
|
|
|
39,815 |
|
| Finance costs and net finance expense relating to pensions and other post-retirement benefits |
|
|
(1,548 |
) |
|
|
(1,638 |
) |
|
|
(1,587 |
) |
| Taxation |
|
|
(6,463 |
) |
|
|
(6,880 |
) |
|
|
(12,619 |
) |
| Non-controlling interests |
|
|
(307 |
) |
|
|
(234 |
) |
|
|
(397 |
) |
| Profit for the yeara |
|
|
23,451 |
|
|
|
11,017 |
|
|
|
25,212 |
|
| Inventory holding (gains) losses, net of
taxb |
|
|
230 |
|
|
|
411 |
|
|
|
(1,800 |
) |
| Replacement cost profitc |
|
|
23,681 |
|
|
|
11,428 |
|
|
|
23,412 |
|
| Net charge (credit) for non-operating itemsd, net of tax |
|
|
(10,533 |
) |
|
|
5,298 |
|
|
|
(2,195 |
) |
| Net (favourable) unfavourable impact of fair value accounting effectsd, net of tax |
|
|
280 |
|
|
|
345 |
|
|
|
(47 |
) |
| Underlying replacement cost profitc |
|
|
13,428 |
|
|
|
17,071 |
|
|
|
21,170 |
|
| Capital expenditure and acquisitions |
|
|
36,612 |
|
|
|
25,204 |
|
|
|
31,959 |
|
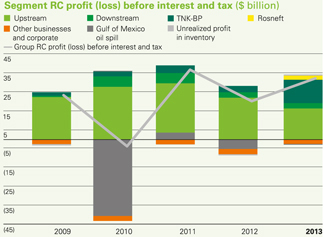
Profit for the year ended 31 December 2013 was $23,451 million. After adjusting for $230 million in respect of inventory holding
losses and their associated tax effect, replacement cost (RC) profit was $23,681 million. After further adjusting for a net credit of $10,533 million for non-operating items and unfavourable fair value accounting effects (relative to
management’s measure of performance) of $280 million, both net of tax, underlying RC profit was $13,428 million.
Non-operating items in 2013, on a pre-tax
basis, were mainly relating to the $12.5-billion gain on disposal of TNK-BP partially offset by an $845-million write-off attributable to block BM-CAL-13 offshore Brazil as a result of the Pitanga exploration well not encountering commercial
quantities of oil or
gas, impairment charges and further charges associated with the Gulf of Mexico oil spill. More information on non-operating items, and fair value accounting effects, can be found on page 237. See
Gulf of Mexico oil spill on page 38 and Financial statements – Note 2 for further information on the impact of the Gulf of Mexico oil spill on BP’s financial results.
For the year ended 31 December 2012, profit was $11,017 million, RC profit was $11,428 million and underlying RC profit was $17,071 million. There was a net post-tax
charge of $5,298 million for non-operating items, which included a $5.0-billion pre-tax charge relating to the Gulf of Mexico oil spill.
Compared with 2012,
underlying RC profit in 2013 was impacted by the absence of equity-accounted earnings from TNK-BP and lower earnings from both Downstream and Upstream, partially offset by the equity-accounted earnings from Rosneft from 21 March 2013 (when sale
and purchase agreements with Rosneft and Rosneftegaz completed).
For the year ended 31 December 2011, profit was $25,212 million, RC profit was $23,412 million
and underlying RC profit was $21,170 million. There was a net post-tax credit for non-operating items of $2,195 million, which included a $3.8-billion pre-tax credit relating to the Gulf of Mexico oil spill.
Compared with 2011, underlying RC profit in 2012 was impacted by significantly lower earnings from Upstream and the absence of equity-accounted earnings from TNK-BP from
22 October 2012 (when our investment was reclassified as an asset held for sale, as required under IFRS), partially offset by improved earnings from Downstream.
See Upstream on page 25, Downstream on page 31, Rosneft on page 35 and Other businesses and corporate on page 37 for further information on segment results.
Finance costs and net finance expense relating to pensions and other post-retirement benefits
Finance costs comprise interest payable less amounts capitalized, and interest accretion on provisions and long-term other payables.
Net finance expense relating to pensions and other post-retirement benefits in 2013 was $480 million (2012 $566 million, 2011 $400 million).
In 2013, we adopted the revised version of IAS 19 ‘Employee Benefits’, under which we apply the same expected rate of return on plan assets as we used to
discount our pension liabilities. Financial information for prior periods has been restated – see Financial statements – Note 1 for further information.
Taxation
The charge for income taxes in 2013 was $6,463 million (2012 $6,880 million, 2011 $12,619 million). The effective tax rate
was 21% in 2013 (2012 38%, 2011 33%). The decrease in the effective tax rate in 2013 compared with 2012 primarily relates to the gain on disposal of TNK-BP in 2013 for which there was no corresponding tax charge. The increase in the effective tax
rate in 2012 compared with 2011 primarily reflects the impact of the provision for the settlement with the US government relating to the Gulf of Mexico oil spill, which is not tax deductible.
| a |
Profit attributable to BP shareholders. |
| b |
Inventory holding gains and losses represent the difference between the cost of sales calculated using the average cost to BP of supplies acquired during the year and the cost of sales calculated on the first-in
first-out (FIFO) method, after adjusting for any changes in provisions where the net realizable value of the inventory is lower than its cost. BP’s management believes it is helpful to disclose this information. An analysis of inventory holding
gains and losses by segment is shown in Financial statements – Note 7 and further information on inventory holding gains and losses is provided on page 269. |
| c |
Replacement cost (RC) profit or loss reflects the replacement cost of supplies and is arrived at by excluding inventory holding gains and losses from profit or loss. RC profit or loss is the measure of profit or loss
for each operating segment that is required to be disclosed under International Financial Reporting Standards (IFRS). RC profit or loss for the group is not a recognized GAAP measure. Underlying RC profit or loss is RC profit or loss after adjusting
for non-operating items and fair value accounting effects. Underlying RC profit or loss and fair value accounting effects are not recognized GAAP measures. For further information on RC profit or loss and underlying RC profit or loss, see Certain
definitions on page 269. |
| d |
Non-operating items are charges and credits arising in consolidated entities and in TNK-BP and Rosneft that are included in the financial statements and that BP discloses separately because it considers such disclosures
to be meaningful and relevant to investors. The main categories of non-operating items included here are: impairments; gains and losses on sale of businesses and fixed assets; environmental remediation costs; restructuring, integration and
rationalization costs; and changes in the fair value of embedded derivatives. Fair value accounting effects are non-GAAP adjustments to our IFRS profit relating to certain physical inventories, pipelines and storage capacity. Management uses a
fair-value basis to value these items which, under IFRS, are accounted for on an accruals basis with the exception of trading inventories, which are valued using spot prices. The adjustments have the effect of aligning the valuation basis of the
physical positions with that of the derivative instruments, which are required to be fair valued under IFRS, in order to provide a more representative view of the ultimate economic value. See page 238 and Certain definitions on page 269 for more
information. |
|
|
|
| BP Annual Report and Form 20-F 2013 |
|
23 |

Operating cash flow
Operating cash flow is net cash provided by operating activities, as presented in the group cash flow statement on page 125. Operating cash flow in 2013 was $21.1 billion
(2012 $20.5 billion, 2011 $22.2 billion). Excluding the impact of the Gulf of Mexico oil spill, net operating cash flow in 2013 was $21.2 billion (2012 $22.9 billion, 2011 $29.0 billion).
Shareholder distributions
Total dividends paid in
2013 were 36.5 cents per share, up 11% compared with 2012 on a dollar basis and 12% in sterling terms. This equated to a total cash distribution to shareholders of $5.4 billion during the year.
Group reserves and production
|
|
|
|
|
|
|
|
|
|
|
|
|
| |
|
|
2013 |
|
|
|
2012 |
|
|
|
2011 |
|
| Estimated net proved reserves
(net of royalties)a |
|
|
|
|
|
|
|
|
|
|
|
|
| Liquidsb |
|
|
million barrels |
|
| Subsidiaries |
|
|
4,349 |
|
|
|
4,672 |
|
|
|
5,331 |
|
| Equity-accounted entitiesc |
|
|
5,721 |
|
|
|
5,378 |
|
|
|
5,234 |
|
| |
|
|
10,070 |
|
|
|
10,050 |
|
|
|
10,565 |
|
| Natural gas |
|
|
billion cubic feet |
|
| Subsidiaries |
|
|
34,187 |
|
|
|
33,264 |
|
|
|
36,381 |
|
| Equity-accounted entitiesc |
|
|
11,788 |
|
|
|
7,041 |
|
|
|
5,278 |
|
| |
|
|
45,975 |
|
|
|
40,305 |
|
|
|
41,659 |
|
| Total
hydrocarbonsd |
|
|
million barrels of oil equivalent |
|
| Subsidiaries |
|
|
10,243 |
|
|
|
10,408 |
|
|
|
11,604 |
|
| Equity-accounted entitiesc |
|
|
7,753 |
|
|
|
6,592 |
|
|
|
6,144 |
|
| |
|
|
17,996 |
|
|
|
17,000 |
|
|
|
17,748 |
|
| Production (net of
royalties)e |
|
|
|
|
|
|
|
|
|
|
|
|
| Liquidsf |
|
|
thousand barrels per day |
|
| Subsidiaries |
|
|
879 |
|
|
|
896 |
|
|
|
992 |
|
| Equity-accounted entitiesg |
|
|
1,134 |
|
|
|
1,160 |
|
|
|
1,165 |
|
| |
|
|
2,013 |
|
|
|
2,056 |
|
|
|
2,157 |
|
| Natural gas |
|
|
million cubic feet per day |
|
| Subsidiaries |
|
|
5,845 |
|
|
|
6,193 |
|
|
|
6,393 |
|
| Equity-accounted entitiesg |
|
|
1,216 |
|
|
|
1,200 |
|
|
|
1,125 |
|
|
|
|
7,060 |
|
|
|
7,393 |
|
|
|
7,518 |
|
| Total
hydrocarbonsd |
|
|
thousand barrels of oil equivalent per day |
|
| Subsidiaries |
|
|
1,887 |
|
|
|
1,963 |
|
|
|
2,094 |
|
| Equity-accounted entitiesg |
|
|
1,343 |
|
|
|
1,367 |
|
|
|
1,360 |
|
| |
|
|
3,230 |
|
|
|
3,331 |
|
|
|
3,454 |
|
| a |
Volumes of equity-accounted entities include volumes of equity-accounted investments of those entities. |
| b |
Liquids comprise crude oil, condensate, NGLs and bitumen. |
| c |
Includes BP’s share of Rosneft and TNK-BP reserves. See Rosneft on page 36 and Supplementary information on oil and natural gas on page 200 for further information. |
| d |
Natural gas is converted to oil equivalent at 5.8 billion cubic feet = 1 million barrels.
|
| e |
Because of rounding, some totals may not agree exactly with the sum of their component parts. |
| f |
Liquids comprise crude oil, condensate and NGLs. |
| g |
Includes BP’s share of Rosneft and TNK-BP production. See Rosneft on page 36 and Oil and gas disclosures for the group on page 245 for further information. |
Total hydrocarbon proved reserves, on an oil equivalent basis including equity-accounted entities, comprised 17,996mmboe (10,243mmboe for subsidiaries and 7,753mmboe for
equity-accounted entities) at 31 December 2013, an increase of 6% (decrease of 2% for subsidiaries and increase of 18% for equity-accounted entities) compared with the 31 December 2012 reserves of 17,000mmboe (10,408mmboe for subsidiaries
and 6,592mmboe for equity-accounted entities). Natural gas represented about 44% (58% for subsidiaries and 26% for equity-accounted entities) of these reserves. The change includes a net increase from acquisitions and disposals of 641mmboe (200mmboe
net decrease for subsidiaries and 841mmboe net increase for equity-accounted entities). Net divestments in our subsidiaries occurred in the UK, the US, China and Canada. We had sales and purchases, as a consequence of our divestment of TNK-BP and
investment in Rosneft.
Our total hydrocarbon production during 2013 averaged 3,230 thousand barrels of oil equivalent per day (mboe/d). This comprised
1,887mboe/d for subsidiaries and 1,343mboe/d for equity-accounted entities, a decrease of 4% (decreases of 2% for liquids and 6% for gas) and a decrease of 2% (decrease of 2% for liquids and increase of 1% for gas) respectively compared with 2012.
More information on reserves and production, see Oil and gas disclosures for the group on page 245.
Critical accounting policies
The accounting policies,
judgements, estimates and assumptions which most affect the financial statements are described in Note 1 to the financial statements.
Outlook
This discussion contains forward-looking statements, which by their nature involve risk and uncertainty because they relate to events and depend on
circumstances that will or may occur in the future and are outside the control of BP. You are urged to read Risk factors on page 51 and Cautionary statement on page 271, which describe the risks and uncertainties that may cause actual results and
developments to differ materially from those expressed or implied by these forward-looking statements.
We expect net cash
provided by operating activities of between $30-$31 billion in 2014.h
We expect capital expenditure, excluding
acquisitions and asset exchanges, to be around $24-$25 billion in 2014, and between $24-$26 billion in the years 2015 to 2018.
We will continue to target our net
debt ratio in the 10-20% range while uncertainties remain. Net debt is a non-GAAP measure.
Depreciation, depletion and amortization in 2014 is expected to be around
$1 billion higher than in 2013.
For 2014, the underlying effective tax rate (ETR) (which excludes non-operating items and fair value accounting effects) is expected
to be around 35%, which is the same as the underlying ETR in 2013.
| h |
Assumes $100/bbl oil and $5/mmBtu Henry Hub gas. The projection includes BP’s estimate of the Rosneft dividend and the impact of payments in respect of federal criminal and securities claims with the US government
and SEC where settlements have already been reached, but does not reflect any cash flows relating to other liabilities, contingent liabilities, settlements or contingent assets arising from the Gulf of Mexico oil spill, which may or may not arise at
that time. |
|
|
|
| 24 |
|
BP Annual Report and Form 20-F 2013 |
Upstream
In 2013 we continued to actively manage and simplify our portfolio, strengthening our incumbent positions to provide a platform for growing value.

~
Skarv started up in
December 2012 and produces up to 160mboe/d. The field development includes around 50 miles of gas export pipeline that allows export to markets in Europe.
Our
business model and strategy
Our Upstream segment is responsible for our activities in oil and natural gas exploration, field development and
production, and midstream transportation, storage and processing. We also market and trade natural gas, including liquefied natural gas, power and natural gas liquids. In 2013 our activities took place in 27 countries.
We deliver our exploration, development and production activities through five global technical and operating functions:
| |
• |
|
The exploration function is responsible for renewing our resource base through access, exploration and appraisal, while the reservoir development
function is responsible for the stewardship of our resource portfolio. |
| |
• |
|
The global wells organization and the global projects organization are responsible for the safe, reliable and compliant execution of wells
(drilling and completions) and major projects, respectively. |
| |
• |
|
The global operations organization is responsible for safe, reliable and compliant operations, including upstream production assets and midstream transportation and processing
activities. |
The delivery of these activities is optimized and integrated with support from global functions with specialist areas of
expertise: technology, finance, procurement and supply chain, human resources and information technology.
Technologies such as seismic imaging,
enhanced oil recovery and real-time data support our upstream strategy by helping to gain new access, increasing recovery and reserves and improving production efficiency (see Our distinctive capabilities on page 16).
We actively manage our portfolio and are placing increasing emphasis on accessing, developing and producing from fields able to
provide the greatest value (this includes those with the potential to make the highest contribution to our operating cash flow). We sell assets that we believe have more value to others. This allows us to focus our leadership, technical resources
and organizational capability on the resources we believe are likely to add the most value to our portfolio.
Our strategy is to invest to grow long-term value by continuing to build a portfolio of material, enduring positions in the world’s
key hydrocarbon basins. Our strategy is enabled by:
| |
• |
|
A continued focus on safety and the systematic management of risk. |
| |
• |
|
A simpler, more focused portfolio with strengthened incumbent positions and reduced operating complexity. |
| |
• |
|
Playing to our strengths – exploration, deep water, giant fields and gas value chains. |
| |
• |
|
An execution model that drives improvement in efficiency and reliability – through both operations and investment. |
| |
• |
|
A bias to oil with selective gas value chains focusing on where we have strong core positions, can play in premium growth markets or bring advantaged technology to bear. |
| |
• |
|
Strong relationships built on mutual advantage, deep knowledge of the basins in which we operate, and technology. |
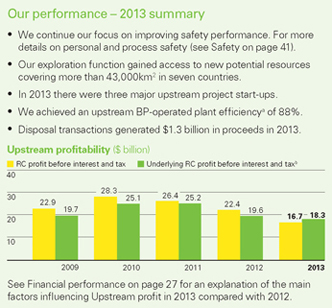
Outlook
| |
• |
|
We have announced plans to establish a separate BP business to manage our onshore oil and gas assets in the US lower 48, which we expect to be operational in early 2015. Our goal is to build a stronger, more competitive
and sustainable business that we expect to be a key component of BP’s portfolio in the future. |
| |
• |
|
We expect reported production in 2014 to be lower than 2013, mainly due to the expiration of the Abu Dhabi onshore concession, with an impact of around 140mboe/d, and divestments. After adjusting for the impacts of the
concession expiry, divestments and entitlement effects in our production-sharing agreements (PSAs), we expect underlying production to be higher in 2014. |
| |
• |
|
In addition to the Chirag oil, Mars B and Na Kika Phase 3 projects, which started up in January and February, we expect a further four major projects to come onstream in 2014, which will contribute to the group’s
plan to generate an increase of around 50% in operating cash flow in 2014 compared with 2011.c |
| |
• |
|
Capital investment in 2014 is expected to increase, largely reflecting the progression of our major projects. |
| a |
Plant efficiency is the actual production of a plant facility expressed as a percentage of the total achievable installed production capacity of the asset including the reservoir, well, plant and export systems.
|
| b |
Underlying replacement cost (RC) profit before interest and tax is not a recognized GAAP measure. See footnote c on page 23 for further information. The equivalent measure on an IFRS basis is RC profit before interest
and tax. |
| c |
See footnote b on page 56. |
|
|
|
| BP Annual Report and Form 20-F 2013 |
|
25 |
Our markets
|
|
|
|
|
|
|
|
|
|
|
|
|
| |
|
|
2013 |
|
|
|
2012 |
|
|
|
2011 |
|
| Average oil marker pricesa |
|
|
$ per barrel |
|
| Brent |
|
|
108.66 |
|
|
|
111.67 |
|
|
|
111.26 |
|
| West Texas Intermediate |
|
|
97.99 |
|
|
|
94.13 |
|
|
|
95.04 |
|
| Average natural gas marker prices |
|
|
$ per million British thermal units |
|
| Average Henry Hub gas priceb |
|
|
3.65 |
|
|
|
2.79 |
|
|
|
4.04 |
|
| |
|
|
pence per therm |
|
| Average UK National Balancing Point gas
pricea |
|
|
67.99 |
|
|
|
59.74 |
|
|
|
56.33 |
|
| a |
All traded days average. |
| b |
Henry Hub First of Month Index. |
Crude oil
benchmark prices
Brent remains an integral marker to the production portfolio, from which a significant proportion of production is priced directly or
indirectly. Certain regions use other local markers, which are derived using differentials or a lagged impact from the Brent crude oil price.
Crude oil prices, as
demonstrated by the industry benchmark of dated Brent, averaged $108.66 per barrel in 2013, compared with an average of $111.67 per barrel in 2012. This represented the third consecutive year with the dated Brent average price above $100 per barrel.
Prices weakened in early 2013 amid strong growth of light, sweet oil production in the US, but rebounded later in the year due to a range of supply disruptions and heightened market perceptions of risks to supply.
Brent ($/bbl)
Amid continued high oil prices, global oil consumption increased, rising by roughly 1.2 million barrels per day for the year
compared with 2012 (1.3%), in part boosted by cold weather early in the year.c The growth in consumption was slightly exceeded by growth in non-OPEC production, which was dominated by continued
strong growth in US output. However, OPEC crude oil production fell due to ongoing Iran sanctions and renewed outages in Libya. As a result, OECD commercial oil inventories remained relatively balanced.
Global oil consumption in 2012 grew by roughly 0.9 million barrels per day compared with 2011 (0.9%).d OPEC
production met most of the growth in consumption, driven by the recovery in Libyan production.
We expect oil price movements in 2014 to continue to be driven by the
pace of global economic growth and its resulting implications for oil consumption, by supply growth in North America, and OPEC production decisions. Risks to supply remain a key uncertainty.
| c |
From Oil Market Report 21 January 2014©, OECD/IEA 2014, page 1. |
| d |
BP Statistical Review of World Energy June 2013.
|
Natural gas prices
Natural gas prices continued to show wide differentials between regions in 2013, although widening of the differentials stagnated as US gas prices recovered from their
2012 lows. The Henry Hub First of Month Index averaged $3.65 in 2013, an increase of 31% versus 2012.
Henry Hub ($/mmBtu)

The US natural gas market saw a gradual return to balance in 2013, following the dramatic loss of heating demand in 2012 due to
unusually warm winter weather, which pushed gas prices down to 10-year lows. A return to more normal weather in 2013 restored heating demand for gas, which meant less pressure on gas to compete with coal for a share of the power generation market,
allowing gas prices to recover. US gas supply continued to expand in 2013, reaching yet another record production level, supported in particular by rising liquids-rich (wet) gas production.
In Europe, gas prices at the UK National Balancing Point increased by 14% to an average of 67.99 pence per therm for 2013. Record-low inventory levels, coming out of a
prolonged winter, coupled with declining European gas production and continued diversion of LNG to the higher-priced Asian market, caused European spot prices to climb to a five-year high. European demand remained weak, especially in power
generation where gas remained uncompetitive against coal.
Global LNG supply expanded in 2013, following a contraction in supply in 2012. However the LNG market
remained tight, with continued strong demand in Asia due to economic growth and nuclear power outages, and also in Latin America due to the impact of a drought on hydroelectric production.
In 2012 the strength of shale gas production in the US, combined with an unusually warm winter, led the average Henry Hub First of Month Index to fall by 31% to
$2.79/mmBtu. In the UK, National Balancing Point prices averaged 59.74 pence per therm, 6% above prices in 2011.
In 2014 we expect gas markets to continue to be
driven by the economy, weather, production, trade developments and continued uncertainty surrounding nuclear power generation in Japan. Futures markets indicate that the large gap between US and European gas prices is expected to persist through
2014.
|
|
|
| 26 |
|
BP Annual Report and Form 20-F 2013 |

Financial performance
|
|
|
|
|
|
|
|
|
|
|
|
|
| |
|
|
$ million |
|
| |
|
|
2013 |
|
|
|
2012 |
|
|
|
2011 |
|
| Sales and other operating revenuese |
|
|
70,374 |
|
|
|
72,225 |
|
|
|
75,754 |
|
| RC profit before interest and tax |
|
|
16,657 |
|
|
|
22,491 |
|
|
|
26,358 |
|
| Net (favourable) unfavourable impact of non-operating items and fair value accounting effectsf |
|
|
1,608 |
|
|
|
(3,055 |
) |
|
|
(1,141 |
) |
| Underlying RC profit before interest and
taxg |
|
|
18,265 |
|
|
|
19,436 |
|
|
|
25,217 |
|
| Capital expenditure and acquisitions |
|
|
19,115 |
|
|
|
18,520 |
|
|
|
25,821 |
|
| BP average realizationsh |
|
|
$ per barrel |
|
| Crude oil |
|
|
105.38 |
|
|
|
108.94 |
|
|
|
107.91 |
|
| Natural gas liquids |
|
|
38.38 |
|
|
|
42.75 |
|
|
|
51.18 |
|
| Liquidsi |
|
|
99.24 |
|
|
|
102.10 |
|
|
|
101.29 |
|
| |
|
|
$ per thousand cubic feet |
|
| Natural gas |
|
|
5.35 |
|
|
|
4.75 |
|
|
|
4.69 |
|
| US natural gas |
|
|
3.07 |
|
|
|
2.32 |
|
|
|
3.34 |
|
| |
|
|
$ per thousand barrels of oil equivalent |
|
| Total hydrocarbonsj |
|
|
63.58 |
|
|
|
61.86 |
|
|
|
62.31 |
|
| e |
Includes sales to other segments. |
| f |
Fair value accounting effects are not a recognized GAAP measure and represent the (favourable) unfavourable impact relative to management’s measure of performance (see page 238 for further details).
|
| g |
Underlying RC profit is not a recognized GAAP measure. See footnote c on page 23 for information on underlying RC profit. |
| h |
Realizations are based on sales of consolidated subsidiaries only, which excludes equity-accounted entities. |
| i |
Liquids comprise crude oil, condensate and natural gas liquids (NGLs). |
| j |
Natural gas is converted to oil equivalent at 5.8 billion cubic feet = 1 million barrels. |
Sales and other operating
revenues for 2013 were $70 billion (2012 $72 billion, 2011 $76 billion). The decrease in 2013, compared with 2012, primarily reflected lower volumes due to disposals and lower realizations, partially offset by higher gas marketing and trading
revenues. The decrease in 2012, compared with 2011, primarily reflected lower production and persistently low Henry Hub gas prices.
In 2013 replacement cost (RC)
profit before interest and tax for the segment was $16.7 billion (2012 $22.5 billion, 2011 $26.4 billion). The 2013 result included a net non-operating charge of $1,364 million, primarily related to an $845-million write-off attributable to block
BM-CAL-13 offshore Brazil as a result of the Pitanga exploration well not encountering commercial quantities of oil or gas, and impairment and other charges partly offset by fair value gains on embedded derivatives and disposal gains. In addition,
fair value accounting effects had an
unfavourable impact of $244 million relative to management’s measure of performance. The 2012 result included net non-operating gains of $3,189 million, primarily as a result of gains on
disposals being partly offset by impairment charges. In addition, fair value accounting effects had an unfavourable impact of $134 million. The 2011 result included net non-operating gains of $1,130 million, primarily as a result of gains on
disposals being partly offset by impairments, a charge associated with the termination of our agreement to sell our 60% interest in Pan American Energy LLC (PAE) to Bridas Corporation and other non-operating items. In addition, fair value accounting
effects had a favourable impact of $11 million.
After adjusting for non-operating items and fair value accounting effects, underlying RC profit before interest and
tax in 2013 was $18.3 billion (2012 $19.4 billion, 2011 $25.2 billion). Compared with 2012, the decrease in 2013 reflected lower production due to divestments, lower liquids realizations and higher costs, including exploration write-offs and higher
depreciation, depletion and amortization, partly offset by an increase in underlying volumes, a benefit from stronger gas marketing and trading activities, a one-off benefit to production taxes as a result of fiscal relief allowing immediate
deduction of past costs, a one-off benefit, mainly in respect of prior years, resulting from the US Federal Energy Regulatory Commission approval of cost pooling settlement agreements between the owners of the Trans-Alaska Pipeline System (TAPS) and
higher gas realizations. Compared with 2011, the 2012 result reflected higher costs (primarily higher depreciation, depletion and amortization, as well as ongoing sector inflation), lower production and lower realizations.
Total capital expenditure including acquisitions and asset exchanges in 2013 was $19.1 billion (2012 $18.5 billion, 2011 $25.8 billion).
Provisions for decommissioning decreased from $17.4 billion at the end of 2012 to $17.2 billion at the end of 2013. The decrease reflects primarily a reduction due to the
change in discount rate and utilization of provisions largely offset by updated estimates of the cost of future decommissioning and additions. Decommissioning costs are initially capitalized within fixed assets and are subsequently depreciated as
part of the asset.
Acquisitions and disposals
In total, disposal transactions generated $1.3 billion in proceeds during 2013, with a corresponding reduction in net proved reserves of 200mmboe, all within our
subsidiaries. There were no significant acquisitions in 2013.
Disposals
The major disposal transactions during 2013 were the sale of our interests in the Harding (BP 70%), Maclure (BP 37.04%), Braes (BP 27.7%),
|
|
|
| BP Annual Report and Form 20-F 2013 |
|
27 |
Major projects portfolio
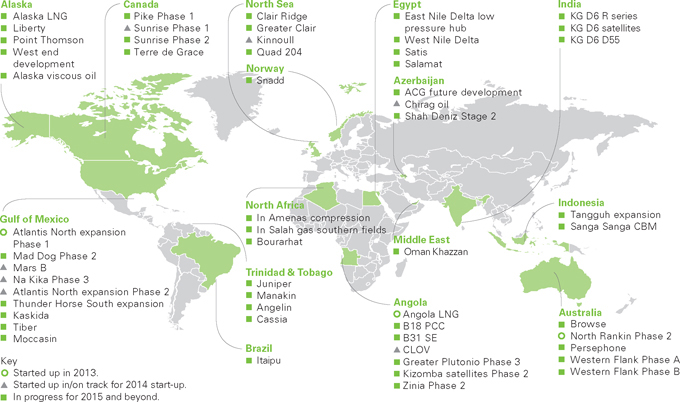
Braemar (BP 52%) and Devenick (BP 88.7%) fields in the North Sea to TAQA Bratani Ltd for $1,058 million plus future
payments which, depending on oil price and production, are currently expected to exceed $180 million after tax; and the sale of our interests in the Yacheng (BP 34.3%) field in China for $308 million, both of which are subject to post-closing
adjustments. More information on disposals is provided in Upstream analysis by region on page 239 and Financial statements – Note 5.
Exploration
The group explores for oil and natural gas
under a wide range of licensing, joint arrangement and other contractual agreements. We may do this alone or, more frequently, with partners. BP acts as operator for many of these ventures.
New access in 2013
We gained access to new potential
resources covering more than 43,000km2 in seven countries (Canada, Brazil, Greenland, Norway, Egypt, the UK and China). In addition, we entered into three farm-out agreements with Kosmos Energy,
covering around 25,000km2 over three blocks offshore Morocco, one of which is still subject to government approval.
During the year we participated in seven potentially commercial discoveries including the following that we announced: two off the east coast of India on blocks KG D6 and
CYD5; one in Egypt with the Salamat well in the East Nile Delta; one in the pre-salt play of Angola with the Lontra well in Block 20, operated by Cobalt International Energy, Inc.; one in the Paleogene play in the Gulf of Mexico with the Gila
prospect; and one in Brazil on block BM-POT-17 in the Potiguar basin, operated by Petrobras.
Exploration and appraisal costs
Exploration and appraisal costs, excluding lease acquisitions, were $4,811 million (2012 $4,356 million, 2011 $2,413 million). These costs included exploration and
appraisal drilling expenditures, which were capitalized within intangible fixed assets, and geological and geophysical exploration costs, which were charged to income as incurred. Approximately 47% of exploration
and appraisal costs were directed towards appraisal activity. We participated in 140 gross (41 net) exploration and appraisal wells in 11 countries.
Exploration expense
Total exploration expense of $3,441
million (2012 $1,475 million, 2011 $1,520 million) included the write-off of expenses related to unsuccessful drilling activities in Brazil ($388 million), the UK North Sea ($262 million), Angola ($232 million), the Gulf of Mexico ($210 million),
Jordan ($121 million) and others ($91 million). It also included an $845-million write-off associated with the value ascribed to block BM-CAL-13 offshore Brazil as part of the accounting for the acquisition of upstream assets from Devon Energy in
2011 and a $257-million write-off for costs relating to the Risha concession in Jordan. In addition, exploration expense included an $88-million credit related to a reduction in provisions for the decommissioning of idle infrastructure, which is
required by the Bureau of Ocean Energy Management Regulation and Enforcement’s Notice of Lessees 2010 G05 issued in October 2010.
Upstream reserves
|
|
|
|
|
|
|
|
|
|
|
|
|
| |
|
|
2013 |
|
|
|
2012 |
|
|
|
2011 |
|
| Estimated net proved reserves
(net of royalties) |
|
|
|
|
|
|
|
|
|
|
|
|
| Liquidsa |
|
|
million barrels |
|
| Subsidiariesb |
|
|
4,349 |
|
|
|
4,672 |
|
|
|
5,331 |
|
| Equity-accounted entitiesc |
|
|
745 |
|
|
|
838 |
|
|
|
929 |
|
| |
|
|
5,094 |
|
|
|
5,510 |
|
|
|
6,260 |
|
| Natural gas |
|
|
billion cubic feet |
|
| Subsidiariesd |
|
|
34,187 |
|
|
|
33,264 |
|
|
|
36,381 |
|
| Equity-accounted entitiesc |
|
|
2,517 |
|
|
|
2,549 |
|
|
|
2,397 |
|
| |
|
|
36,704 |
|
|
|
35,813 |
|
|
|
38,778 |
|
| Total hydrocarbons |
|
|
million barrels of oil equivalent |
|
| Subsidiaries |
|
|
10,243 |
|
|
|
10,408 |
|
|
|
11,604 |
|
| Equity-accounted entitiesc |
|
|
1,179 |
|
|
|
1,277 |
|
|
|
1,342 |
|
| |
|
|
11,422 |
|
|
|
11,685 |
|
|
|
12,946 |
|
|
|
|
| 28 |
|
BP Annual Report and Form 20-F 2013 |
| a |
Liquids comprise crude oil, condensate, NGLs and bitumen. |
| b |
Includes 21 million barrels (14 million barrels at 31 December 2012 and 20 million barrels at 31 December 2011) in respect of the 30% non-controlling interest in BP Trinidad & Tobago LLC.
|
| c |
BP’s share of reserves of equity-accounted entities in the Upstream segment. During 2013, upstream operations in Abu Dhabi, Argentina and Bolivia, as well as some of our operations in Angola and Indonesia, were
conducted through equity-accounted entities. |
| d |
Includes 2,685 billion cubic feet of natural gas (2,890 billion cubic feet at 31 December 2012 and 2,759 billion cubic feet at 31 December 2011) in respect of the 30% non-controlling interest in BP
Trinidad & Tobago LLC. |
Reserves booking
Reserves booking from new discoveries will depend on the results of ongoing technical and commercial evaluations, including appraisal drilling. The Upstream
segment’s total hydrocarbon reserves, on an oil equivalent basis including equity-accounted entities comprised 11,422mmboe (10,243mmboe for subsidiaries and 1,179mmboe for equity-accounted entities) at 31 December 2013, a decrease of 2%
(decrease of 2% for subsidiaries and decrease of 8% for equity-accounted entities) compared with the 31 December 2012 reserves of 11,685mmboe (10,408mmboe for subsidiaries and 1,277mmboe for equity-accounted entities).
Proved reserves replacement ratio
The proved reserves
replacement ratio is the extent to which production is replaced by proved reserves additions. This ratio is expressed in oil equivalent terms and includes changes resulting from revisions to previous estimates, improved recovery and extensions and
discoveries. For 2013 the proved reserves replacement ratio for the Upstream segment, excluding acquisitions and disposals, was 93% for subsidiaries and equity-accounted entities, 105% for subsidiaries alone and 30% for equity-accounted entities
alone. For more information on proved reserves replacement for the group, see page 247.
Developments
The map on page 28 shows our major development areas, which include Alaska, Angola, Australia, Azerbaijan, Canada, Egypt, the deepwater Gulf of Mexico and the UK North
Sea.
Three major project start-ups were achieved in 2013: Atlantis North expansion Phase 1 in the Gulf of Mexico; Angola LNG; and North Rankin Phase 2 in Australia.
We made good progress in the four areas we believe most likely to provide us with higher-value barrels – Angola, Azerbaijan, the North Sea and the Gulf of
Mexico.
| • |
|
Angola – we had our first LNG cargo in June and at the end of 2013 around 1 million cubic metres of LNG had been produced. The Plutão, Saturno,
Vénus and Marte (PSVM) project reached plateau
|
| |
|
production of 150mb/d and the Cravo, Lirio, Orquidea, Violeta (CLOV) floating production storage and offloading vessel (FPSO) sailed away from Angola Paenal in January 2014 to start the offshore
hook-up and commissioning campaign. |
| • |
|
Azerbaijan – the Shah Deniz consortium – a seven-member group led by BP – selected the Trans Adriatic Pipeline to deliver gas volumes from the
Shah Deniz Stage 2 project to customers in Greece, Italy and southern Europe. In August, 25-year sales agreements were concluded for over 10bcma of gas, to be produced from the Shah Deniz field as a result of Stage 2. This adds to existing
agreements to sell 6bcma in Turkey. The final investment decision on the project was made in December. |
| • |
|
North Sea – we continued to see high levels of activity, including the ramp-up of major project volumes, a significant level of turnaround activity,
progress in the major redevelopment of the west of Shetland Schiehallion and Loyal fields, the installation of the platform jackets on the Clair Ridge project, a major milestone, and the sale of a number of non-strategic assets. |
| • |
|
Gulf of Mexico – we had 10 rigs operating at the end of the year, the highest number ever. Atlantis North expansion Phase 1 started up in April. Following
our strategic divestment programme, we now have a very focused portfolio with growth potential around four operated and three non-operated hubs. |
In April the decision was taken not to move forward with the existing development plan for the Mad Dog Phase 2 project in the deepwater Gulf of Mexico,
as market conditions and industry cost inflation made the project less attractive than previously modelled. This decision resulted in an impairment of $159 million. BP and its co-owners reviewed alternative development concepts and the current
concept being considered is a single production host designed for future flexibility in evaluating how best to capture additional potential resource.
Development
expenditure of subsidiaries incurred in 2013, excluding midstream activities, was $13.6 billion (2012 $12.6 billion, 2011 $10.4 billion).
Production
Our oil and natural gas production assets are
located onshore and offshore and include wells, gathering centres, in-field flow lines, processing facilities, storage facilities, offshore platforms, export systems (e.g. transit lines), pipelines and LNG plant facilities. The principal areas of
production are Angola, Argentina, Australia, Azerbaijan, Egypt, Trinidad, the UAE, the UK and the US.
|
|
|
| BP Annual Report and Form 20-F 2013 |
|
29 |

|
|
|
|
|
|
|
|
|
|
|
|
|
| |
|
|
2013 |
|
|
|
2012 |
|
|
|
2011 |
|
| Production (net of royalties)a |
|
|
|
|
|
|
|
|
|
|
|
|
| Liquidsb |
|
|
thousand barrels per day |
|
| Subsidiaries |
|
|
879 |
|
|
|
896 |
|
|
|
992 |
|
| Equity-accounted entities |
|
|
297 |
|
|
|
284 |
|
|
|
294 |
|
| |
|
|
1,176 |
|
|
|
1,179 |
|
|
|
1,285 |
|
| Natural gas |
|
|
million cubic feet per day |
|
| Subsidiaries |
|
|
5,845 |
|
|
|
6,193 |
|
|
|
6,393 |
|
| Equity-accounted entities |
|
|
415 |
|
|
|
416 |
|
|
|
415 |
|
| |
|
|
6,259 |
|
|
|
6,609 |
|
|
|
6,807 |
|
| Total
hydrocarbonsc |
|
|
thousand barrels of oil equivalent per day |
|
| Subsidiaries |
|
|
1,887 |
|
|
|
1,963 |
|
|
|
2,094 |
|
| Equity-accounted entities |
|
|
369 |
|
|
|
355 |
|
|
|
366 |
|
| |
|
|
2,256 |
|
|
|
2,319 |
|
|
|
2,460 |
|
| a |
Includes BP’s share of production of equity-accounted entities in the Upstream segment. Because of rounding, some totals may not agree exactly with the sum of their component parts. |
| b |
Liquids comprise crude oil, condensate and NGLs. |
| c |
Natural gas is converted to oil equivalent at 5.8 billion cubic feet = 1 million barrels.
|
Our total hydrocarbon production during 2013 averaged 2,256 thousand barrels of oil equivalent per day (mboe/d). This
comprised 1,887mboe/d for subsidiaries and 369mboe/d for equity-accounted entities, a decrease of 4% (decreases of 2% for liquids and 6% for gas) and an increase of 4% (increase of 5% for liquids and no change for gas) respectively compared with
2012. More information on production can be found in Oil and gas disclosures for the group on page 245.
In aggregate, after adjusting for the impact of price
movements on our entitlement to production in our PSAs and the effect of acquisitions and disposals, underlying production was 3.2% higher compared with 2012. This primarily reflects new major project volumes in Angola, the North Sea and the Gulf of
Mexico.
The group and its equity-accounted entities have numerous long-term sales commitments in their various business activities, all of which are expected to be
sourced from supplies available to the group that are not subject to priorities, curtailments or other restrictions. No single contract or group of related contracts is material to the group.
Gas marketing and trading activities
We market and trade
natural gas, power and natural gas liquids (NGLs). This provides us with routes into liquid markets for the gas we produce. It also generates margins and fees from selling physical products and derivatives to third parties, together with income from
asset optimization and trading. The integrated supply and trading function manages the group’s trading activities in natural gas, power and NGLs. This means we have a single interface with the gas trading markets and one consistent set of
trading compliance processes, systems and controls.
Gas and power marketing and trading activity is undertaken primarily in the US, Canada and Europe to market both
BP production and third-party natural gas, to support group LNG activities and manage market price risk, as well as to create incremental trading opportunities through the use of commodity derivative contracts. Additionally, this activity generates
fee income and enhances margins from sources such as the management of price risk on behalf of third-party customers. These markets are large, liquid and historically volatile. Market conditions have become more challenging in recent years as
volatility and geographic basis/seasonal spreads have fallen to very low levels with the emergence of shale gas in the US and generally over-supplied markets in Europe. However, the traded LNG business has benefited from wide price variations
between the main gas consuming regions of North America, Europe and Asia. As part of the LNG strategy, during 2013 we entered into a 20-year gas liquefaction tolling contract for 4.4 million tons per annum capacity which is located in Texas,
US.
The gas and power marketing and trading function operates primarily from offices in Houston and London and employs around 1,200 people.
The group’s risk governance framework seeks to manage and oversee the financial risks associated with this trading activity, which is described in Financial
statements – Note 19.
In connection with its trading activities, the group uses a range of commodity derivative contracts, storage and transport contracts. The
range of contracts that the group enters into is described in Certain definitions – commodity trading contracts on page 270.
Analysis by
region
See Upstream analysis by region on page 239.
|
|
|
| 30 |
|
BP Annual Report and Form 20-F 2013 |
Downstream
2013 was a year of improved safety performance, operational improvements and delivery of significant milestones to enhance the quality of our
portfolio.

~
Cherry Point refinery
processes around 230,000 barrels of crude oil per day, primarily for transportation fuels.
Our
business model and strategy
Our Downstream segment is the product and service-led arm of BP, focused on fuels, lubricants and petrochemicals.
We have significant operations in Europe, North America and Asia, and also manufacture and market our products across Australasia, southern Africa and Central and South America.
The segment comprises three businesses:
| |
• |
|
Fuels – fuels value chains (FVCs) including refineries, fuels marketing businesses and global oil supply and trading activities. We sell refined
petroleum products including gasoline, diesel, aviation fuel and LPG. |
| |
• |
|
Lubricants – manufactures and markets lubricants and related products and services globally, adding value through brand, technology and
relationships, such as collaboration with original equipment manufacturing partners. |
| |
• |
|
Petrochemicals – manufactures products at locations around the world, using proprietary BP technology. These products are then used by others to make
vital consumer products such as paint, plastic bottles and textiles. |
We aim to operate all of our businesses as safe and reliable
value chains. We participate in multiple stages of each value chain as we believe we can deliver greater returns from integration than from owning a collection of discrete assets. These value chains, combined with our advantaged manufacturing
operations, supply and trading capability and expertise in technology, allow us to pursue long-term competitive returns and sustainable growth, serving customers and promoting BP and our brands through high quality products.
We research, develop and deploy a wide range of technologies, processes and techniques, aiming to enhance safety and risk management,
increase efficiency and reliability, improve our margins and create new market opportunities.
Our strategy focuses on four priorities executed in a systematic and disciplined way:
| |
• |
|
High-quality downstream portfolio.
|
| |
• |
|
Material and growing cash flows for the group through exposure to growth opportunities and markets. |
This
strategy is about winning sustainably in the markets where we choose to participate. We seek to outperform the best competitor in a region and do it safely; investing to strengthen our established positions while maintaining overall capital
employed, and still seeking to shift the mix of participation and capital employed from established to growing markets. We do this while operating within a stable financial framework to deliver attractive returns and growth in earnings and cash
flow.
The delivery of these activities is optimized and integrated with support from global functions with specialist areas of
expertise: technology, finance, procurement and supply chain, human resources, global business services and information technology.
Outlook
| |
• |
|
In 2014 we anticipate refining margins will remain under pressure due to high gasoline stocks and new competitor capacity additions, as well as weak demand in many markets. |
| |
• |
|
We expect the financial impact of refinery turnarounds in 2014 to be lower than in 2013. |
| |
• |
|
Whiting continues to progressively increase heavy crude processing, and we expect to reach heavy crude processing levels of 280,000 barrels per day during the second quarter 2014. |
| |
• |
|
We anticipate demand for lubricants in 2014 will be similar to 2013. |
| |
• |
|
We expect a similarly challenging environment for petrochemicals in 2014, characterized by excess supply. |
| |
• |
|
Capital expenditure is forecast to be slightly lower in 2014 than in 2013, post commissioning of all major units of the Whiting refinery modernization project. |
| a |
Underlying RC profit before interest and tax is not a recognized GAAP measure. See footnote c on page 23 for further information. The equivalent measure on an IFRS basis is RC profit before interest and tax.
|
|
|
|
| BP Annual Report and Form 20-F 2013 |
|
31 |
Our markets
Economic growth in 2013 varied widely, with certain economies shrinking and others showing some signs of recovery. OECD oil consumption was up slightly in 2013, rising
for the first time since 2010. Demand in non-OECD economies also continued to grow, but at a slower rate than 2012 partly due to reduced GDP growth, for example in India, South East Asia and the Middle East.
In oil markets in 2013, European refineries were impacted by limited economic options to process sour grades, such as Urals, and by the loss of Libyan sweet crude
supplies for much of the year. In addition, crude supplies were constrained by the loss of Iranian oil due to US and European trade embargoes and by ongoing decline in European oil production. This was partially offset by Saudi Arabia crude
production, which reached a 30-year high.
Non-OPEC oil supply increased by over 1 million barrels per day in 2013, primarily in the US due to increased
production of shale oil. North American crudes remained cheaper than waterborne crudes of a similar quality, such as European Brent and Gulf Coast LLS, due to increased production, combined with logistical constraints in transporting inland crude
production to the coast. Our refineries, particularly Toledo and Whiting in the US, benefited from a location advantage as they were able to access these discounted crudes. In addition, these refineries benefited from a wider discount of Canadian
heavy to West Texas intermediate (WTI) crude in 2013, a factor that will become increasingly important to the BP refining portfolio in 2014 with the commissioning of the Whiting refinery modernization project.
Refining marker margin
We track the margin
environment by way of a global refining marker margin (RMM). Refining margins are a measure of the difference between the price a refinery pays for its inputs (crude oil) and the market price of its products. Although refineries produce a variety of
petroleum products, we track the margin environment using a simplified indicator that reflects the margins achieved on gasoline and diesel only. The RMM may not be representative of the margin achieved by BP in any period because of BP’s
particular refinery configurations and crude and product slates. The RMM does not include estimates of fuel costs or other variable costs.
|
|
|
|
|
|
|
|
|
|
|
|
|
|
|
| |
|
$ per barrel |
|
| |
|
Crude marker |
|
|
2013 |
|
|
|
2012 |
|
|
|
2011 |
|
| Refining marker margin (RMM) |
|
|
|
|
|
|
|
|
|
|
|
|
| US North West |
|
Alaska North Slope |
|
|
15.2 |
|
|
|
18.0 |
|
|
|
14.1 |
|
| US Midwest |
|
West Texas |
|
|
|
|
|
|
|
|
|
|
|
|
|
|
Intermediate |
|
|
21.7 |
|
|
|
27.8 |
|
|
|
24.7 |
|
| Northwest Europe |
|
Brent |
|
|
12.9 |
|
|
|
16.1 |
|
|
|
11.9 |
|
| Mediterranean |
|
Azeri Light |
|
|
10.5 |
|
|
|
12.7 |
|
|
|
9.0 |
|
| Australia |
|
Brent |
|
|
13.4 |
|
|
|
14.8 |
|
|
|
12.2 |
|
| BP average RMM |
|
|
|
|
15.4 |
|
|
|
18.2 |
|
|
|
14.5 |
|
In February 2013 BP updated the RMM methodology and regions to reflect the changes to our US portfolio after the refinery divestments and
account for trends in regional crude markets since the RMM was established. The effect of this update is that the 2012 and 2011 BP average RMMs were restated from $15.0 per barrel (as originally reported) to $18.2 per barrel and from $11.6 per
barrel to $14.5 per barrel, respectively.
Global refining marker margin ($/bbl)
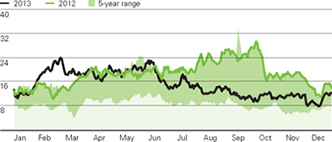
The average RMM for 2013 was $2.8 per barrel lower compared to 2012, with a slightly stronger first half and falling sharply in the
second half of the year. However, it was higher than 2011. Margins in 2013 declined primarily due to increased product and gasoline supply, high gasoline inventories, competitor capacity additions and lower seasonal turnarounds.
Financial performance
|
|
|
|
|
|
|
|
|
|
|
|
|
| |
|
|
$ million |
|
| |
|
|
2013 |
|
|
|
2012 |
|
|
|
2011 |
|
| Sale of crude oil through spot and term contracts |
|
|
79,394 |
|
|
|
56,383 |
|
|
|
57,055 |
|
| Marketing, spot and term sales of refined products |
|
|
258,015 |
|
|
|
274,666 |
|
|
|
273,940 |
|
| Other sales and operating revenues |
|
|
13,786 |
|
|
|
15,342 |
|
|
|
13,038 |
|
| Sales and other operating revenuesa |
|
|
351,195 |
|
|
|
346,391 |
|
|
|
344,033 |
|
| RC profit before interest and taxb |
|
|
|
|
|
|
|
|
|
|
|
|
| Fuels |
|
|
1,518 |
|
|
|
1,403 |
|
|
|
2,999 |
|
| Lubricants |
|
|
1,274 |
|
|
|
1,276 |
|
|
|
1,350 |
|
| Petrochemicals |
|
|
127 |
|
|
|
185 |
|
|
|
1,121 |
|
| |
|
|
2,919 |
|
|
|
2,864 |
|
|
|
5,470 |
|
| Net (favourable) unfavourable impact of non-operating items and fair value accounting
effectsc |
|
|
|
|
|
|
|
|
|
|
|
|
| Fuels |
|
|
712 |
|
|
|
3,609 |
|
|
|
640 |
|
| Lubricants |
|
|
(2 |
) |
|
|
9 |
|
|
|
(100 |
) |
| Petrochemicals |
|
|
3 |
|
|
|
(19 |
) |
|
|
(1 |
) |
| |
|
|
713 |
|
|
|
3,599 |
|
|
|
539 |
|
| Underlying RC profit before interest and taxb
d |
|
|
|
|
|
|
|
|
|
|
|
|
| Fuels |
|
|
2,230 |
|
|
|
5,012 |
|
|
|
3,639 |
|
| Lubricants |
|
|
1,272 |
|
|
|
1,285 |
|
|
|
1,250 |
|
| Petrochemicals |
|
|
130 |
|
|
|
166 |
|
|
|
1,120 |
|
| |
|
|
3,632 |
|
|
|
6,463 |
|
|
|
6,009 |
|
| Capital expenditure and acquisitions |
|
|
4,506 |
|
|
|
5,249 |
|
|
|
4,285 |
|
| a |
Includes sales to other segments. |
| b |
Income from petrochemicals produced at our Gelsenkirchen and Mülheim sites is reported within the fuels business. Segment-level overhead expenses are included within the fuels business. |
| c |
Fair value accounting effects are not a recognized GAAP measure and represent the (favourable) unfavourable impact relative to management’s measure of performance (see page 238 for further details). For Downstream,
these arise solely in the fuels business. |
| d |
Underlying RC profit is not a recognized GAAP measure. See footnote c on page 23 for information on underlying RC profit. |
Sales and other operating revenues in 2013 were $351 billion (2012 $346 billion, 2011 $344 billion). This increase in 2013, compared with 2012 reflects increased crude
sales volumes, largely offset by lower prices. The increase in 2012, compared with 2011, reflected higher prices almost offset by lower volumes and foreign exchange losses.
In 2013 RC profit before interest and tax for the segment was $2.9 billion (2012 $2.9 billion, 2011 $5.5 billion). The 2013 result included a net non-operating charge of
$535 million, primarily relating to impairment charges in our fuels business, versus charges of $3,172 million in 2012 mainly related to impairment charges and $602 million in 2011 for impairment charges associated with our disposal programme,
partially offset by gains on disposal. In addition, fair value accounting effects had an unfavourable impact of $178 million in 2013 versus an unfavourable impact of $427 million in 2012 and a favourable impact of $63 million in 2011.
|
|
|
| 32 |
|
BP Annual Report and Form 20-F 2013 |
After adjusting for non-operating items and fair value accounting effects, underlying RC profit before interest and tax was
$3.6 billion (2012 $6.5 billion, 2011 $6.0 billion).
The fuels business delivered an underlying RC profit before interest and tax of $2,230 million for the year
(2012 $5,012 million, 2011 $3,639 million). Compared with 2012, 2013 saw significantly weaker refining margins. Margins were weakened by reduced throughput due to the planned crude unit outage at our Whiting refinery and commissioning of the new
units that were part of the refinery modernization project and the absence of earnings from the divested Texas City and Carson refineries. This was partially offset by a significantly improved supply and trading contribution and lower overall
turnaround activity during the year. Compared with 2011, the 2012 result reflected strong operations that enabled us to capture the higher refining margin environment, partly offset by a lower supply and trading contribution.
The lubricants business delivered an underlying RC profit before interest and tax of $1,272 million for the year (2012 $1,285 million, 2011 $1,250 million). These results
reflect sustained underlying performance for the lubricants business.
The petrochemicals business delivered an underlying RC profit before interest and tax of $130
million for the year (2012 $166 million, 2011 $1,120 million). Compared with 2012, the 2013 result reflected weaker product margins resulting from over supply in certain markets partially offset by lower turnaround activity in the US and Europe.
Our petrochemicals productiona of 13,943 thousand tonnes (kte) in 2013 was lower than the previous two
years (2012 14,727kte, 2011 14,866kte) due to the sale of our BPCM Kuantan PTA plant in 2012 as well as reduced output in both years for commercial reasons given the low-margin environment.
A summary of our interests in petrochemicals production capacity as at 31 December 2013 is provided on page 244.
| a |
Petrochemicals production includes 1,494kte of petrochemicals produced at our Gelsenkirchen and Mülheim sites in Germany for which the income is reported in our fuels business. |
Our fuels business
The fuels strategy focuses largely on
fuels value chains (FVCs) which include large-scale, highly upgraded and feedstock advantaged refineries that are integrated with logistics and marketing as well as fuels marketing businesses primarily supplied by our global supply and trading
organization.
The FVCs seek to optimize the activities of our assets across the supply chain through: advantaged feedstock delivery to
the refineries; manufacture of high-quality fuels; distribution through pipeline and terminal infrastructure; and marketing and sales to our customers on a regional basis. This integration, together with a focus on excellent execution and cost
management as well as a strong brand, market presence and customer base, are key to our financial performance.
Refining
At 31 December 2013 we owned or had a share in 14 refineries producing refined petroleum products that we supply to retail and commercial customers. A summary of our
interests in refineries and average daily crude distillation capacities as at 31 December 2013 is provided on page 243. As part of our plan to reshape BP’s US fuels business, we completed the sales of the Texas City and Carson, California
refineries and associated logistic and marketing assets. The Texas City refinery and a portion of our retail and logistics network in the south-east US were sold to Marathon Petroleum Corporation on 1 February 2013 for consideration of up to
$2.5 billion. On 3 June 2013 we completed the sale of the Carson refinery in California, ARCO network and related regional logistics assets to Tesoro Corporation for approximately $2.4 billion.
Strategic investments in our refineries are focused on maintaining the safety and reliability of our assets while improving unit margins versus the competition. The most
important of these strategic investments in 2013 was the Whiting refinery modernization project. During the year the new coker, crude oil unit, gasoil hydrotreater, and an upgraded sulphur recovery complex were all commissioned. We plan to
progressively ramp up heavy crude processing to approximately 280,000 barrels per day during the second quarter of 2014. This major investment transforms Whiting into one of the key advantaged downstream assets in our portfolio, with the capacity to
process a greater proportion of heavy crudes, and underpins our ability to deliver increased cash flow from 2014 onwards.
Refinery operations were strong this year,
with Solomon refining availability of 95.3%. Utilization rates were at 86% principally due to the planned crude unit outage at our Whiting refinery as part of the modernization project. Overall refinery throughputs in 2013 were lower than those in
2012, mostly driven by the divestment of the Texas City and Carson refineries and associated logistics and marketing activities in 2013.

|
|
|
| BP Annual Report and Form 20-F 2013 |
|
33 |
|
|
|
|
|
|
|
|
|
|
|
|
|
| |
|
|
thousand barrels per day |
|
| Refinery throughputsa |
|
|
2013 |
|
|
|
2012 |
|
|
|
2011 |
|
| US |
|
|
726 |
|
|
|
1,310 |
|
|
|
1,277 |
|
| Europe |
|
|
766 |
|
|
|
751 |
|
|
|
771 |
|
| Rest of world |
|
|
299 |
|
|
|
293 |
|
|
|
304 |
|
| Total |
|
|
1,791 |
|
|
|
2,354 |
|
|
|
2,352 |
|
| |
|
|
|
|
|
|
|
|
|
|
% |
|
| Refining availabilityb |
|
|
95.3 |
|
|
|
94.8 |
|
|
|
94.8 |
|
| |
|
|
thousand barrels per day |
|
| Sales volumes |
|
|
|
|
|
|
|
|
|
|
|
|
| Marketing salesc |
|
|
3,084 |
|
|
|
3,213 |
|
|
|
3,311 |
|
| Trading/supply salesd |
|
|
2,485 |
|
|
|
2,444 |
|
|
|
2,465 |
|
| Total refined product sales |
|
|
5,569 |
|
|
|
5,657 |
|
|
|
5,776 |
|
| Crude oile |
|
|
2,142 |
|
|
|
1,518 |
|
|
|
1,532 |
|
| Total |
|
|
7,711 |
|
|
|
7,175 |
|
|
|
7,308 |
|
| a |
Refinery throughputs reflect crude oil and other feedstock volumes. |
| b |
Refining availability represents Solomon Associates’ operational availability, which is defined as the percentage of the year that a unit is available for processing after subtracting the annualized time lost due
to turnaround activity and all planned mechanical, process and regulatory maintenance downtime. |
| c |
Marketing sales include sales to service stations, end-consumers, bulk buyers and jobbers (i.e. third parties who own networks of a number of service stations) and small resellers. |
| d |
Trading/supply sales are sales to large unbranded resellers and other oil companies. |
| e |
Crude oil sales relate to transactions executed by our integrated supply and trading function, primarily for optimizing crude oil supplies to our refineries and in other trading. Fifty-nine thousand barrels per day
relate to revenues reported by the Upstream segment. |
Logistics and marketing
Downstream of our refineries, we operate an advantaged infrastructure and logistics network which includes pipelines, storage terminals and road or rail tankers, where we
seek to drive excellence in operational and transactional processes, and deliver compelling customer offers in the various markets in which we operate.
We blend and
market biofuels in our FVCs; almost 6.5 billion litres of biofuels were blended into finished product in 2013, mainly in Europe and the US. Biogasoline (bioethanol) and biodiesel (hydrogenated vegetable oils and fatty acid methyl esters) demand
continues to grow, primarily in Europe and the US, as regulatory requirements demand higher blending levels. In response we continue to develop blend capabilities and to work with regulators, biofuels suppliers and other stakeholders to improve the
sustainability of the biofuels we blend and supply.
We supply fuel and related convenience services to retail consumers through company-owned and franchised retail
sites, as well as other channels, including wholesalers and jobbers. In addition, we supply commercial customers within the transport and industrial sectors.
|
|
|
|
|
|
|
|
|
|
|
|
|
| Number of retail sites operated under a BP
brand |
|
| Retail
sitesf |
|
|
2013 |
|
|
|
2012 |
|
|
|
2011 |
|
| US |
|
|
7,700 |
|
|
|
10,100 |
|
|
|
11,300 |
|
| Europe |
|
|
8,000 |
|
|
|
8,300 |
|
|
|
8,200 |
|
| Rest of world |
|
|
2,100 |
|
|
|
2,300 |
|
|
|
2,300 |
|
| Total |
|
|
17,800 |
|
|
|
20,700 |
|
|
|
21,800 |
|
| f |
The number of retail sites includes sites not operated by BP but instead operated by dealers, jobbers, franchisees or brand licensees that operate under a BP brand. These may move to or from the BP brand as their fuel
supply or brand licence agreements expire and are renegotiated in the normal course of business. Retail sites are primarily branded BP, ARCO and Aral. Excludes our interests in equity-accounted entities that are dual-branded.
|
Supply and trading
BP’s
integrated supply and trading function is responsible for delivering value across the overall crude and oil products supply chain. This structure enables the optimization of BP’s FVCs to maintain a single interface with the oil trading markets
and to operate with a single set of trading compliance processes, systems and controls. The oil trading function (including support functions) has trading offices in Europe, the US and Asia and employs around 1,800 people. This enables the function
to maintain a presence in the more actively traded regions of the global oil markets in order to gain an overall understanding of the supply and demand forces across this market. It has a two-fold strategic purpose in our Downstream business.
First, it seeks to identify the best markets and prices for our crude oil, source optimal feedstocks for our refineries, and provide competitive supply for our marketing
businesses. Wherever possible, the group will
look to optimize value across the supply chain. For example, BP will often sell its own crude and purchase alternative crudes from third parties for its refineries where this will provide
incremental margin.
Second, the function seeks to create and capture incremental trading opportunities by entering into a full range of exchange-traded commodity
derivatives, over-the-counter (OTC) contracts and spot and term contracts. In order to facilitate the generation of trading margin from arbitrage, blending and storage opportunities, it also owns and contracts for storage and transport capacity.
The group’s risk governance framework seeks to manage and oversee the financial risks associated with this trading activity, which is described in Financial
statements – Note 19.
The range of contracts that the group enters into is described in Certain definitions – commodity trading contracts on page 270.
Aviation
Our global aviation business, Air BP, is
one of the world’s largest and best-known aviation fuels suppliers, serving many major commercial airlines as well as the general aviation sectors. We have marketing sales in excess of 465,000 barrels per day. Air BP’s strategic aim is to
maintain its position in the core locations of Europe and the US, while expanding its portfolio in airports that offer long-term competitive advantage in material growing markets such as Asia and South America.
LPG
We have neared completion of the sale of our
global LPG marketing business, which sells bulk and bottled LPG products. We will retain focus on LPG when it is deeply integrated in refinery operations and autogas sectors in order to optimize refinery and retail operations. As of 31 December
2013, the sales of the LPG business in six out of eight countries had been completed. The remaining two countries are expected to be completed in 2014.
Our lubricants business
Our strategy is to leverage technology, brand, and relationships, with a focus on our premium brands, to deliver
growth and sustainable returns.
Our lubricants business manufactures and markets lubricants and related products and services to the automotive, industrial, marine,
aviation and energy markets across the world. Our key brands are Castrol, BP and Aral. Castrol is a recognized brand worldwide and we believe it provides us with a significant competitive advantage. In technology, we apply our
expertise to create quality lubricants and high performance fluids for customers in on-road, off-road, air, sea and industrial applications globally. We divide our lubricants business up into five customer sectors: automotive, marine, industrial,
aviation and energy.
We are one of the largest purchasers of base oil in the market, but have chosen not to produce at scale in base oil or additives manufacturing.
Our participation in the value chain is focused on areas of competitive differentiation and strength. These fall into three main areas:
| • |
|
We develop formulation and the application of cutting-edge technologies. |
| • |
|
We create and develop product brands and clearly communicate their benefits to our customers. |
| • |
|
We build and extend our relationships with customers so we can better understand and meet their needs. |
In 2013, the
automotive sector saw signs of recovery in new passenger vehicle demand across several key markets including China, the US and certain European countries. For 2013, lubricants base oil prices averaged below 2012, which benefited margins. A
significant share of profit growth has come from emerging markets, where we are developing a strong base to capture further growth.
The global lubricants market
remained challenging in 2013 as a result of economic slowdown and low demand growth. The automotive sector saw declines in new passenger vehicle demand across Europe and India, which were partially offset with growth in North America, China and
Brazil. Industrial demand remained under pressure from a weak manufacturing sector.
We continue to increase lubricants revenues through our strategy of exposure to
growing markets, technology investments and targeted marketing programmes. More than 35% of sales revenues were from non-OECD countries in 2013.
|
|
|
| 34 |
|
BP Annual Report and Form 20-F 2013 |
Our lubricants business continued to increase the proportion of total sales resulting from premium product sales; in 2013
the percentage of premium sales was 40% compared with 39% in 2012 and 37% in 2011.
In January 2014, BP announced that it had agreed to sell its specialist global
aviation turbine oils business. The transaction, which is subject to regulatory and other approvals, is expected to be completed in the second quarter of 2014.
Our petrochemicals business
Our strategy is to own and develop petrochemical value chain businesses which are built around proprietary
technology. We apply this technology to existing businesses and to access new growth markets where we wish to build material shares. Overall, the business targets attractive absolute returns and material, increasing cash flows by satisfying demand
growth, particularly in Asia.
We manufacture and market four main product lines:
| • |
|
Purified terephthalic acid (PTA). |
| • |
|
Olefins and derivatives. |
We also produce a number of other speciality petrochemicals products.
Our portfolio is underpinned with proprietary technology and leading cost positions allowing BP assets to remain competitive against the newest world-scale units being
built in China. These capacity additions and technology advances have resulted in a sharp fall in margins leading to losses for the older, less efficient producers. New capacity additions are targeted principally in the higher-growth Asian markets.
We both own and operate assets, and have also invested in a number of joint arrangements in Asia, where our partners are leading companies within their domestic
market. For example, the construction of our new, third PTA plant with our partner, Zhuhai Port Co. in Guangdong, China is progressing well and is planned to begin production in late 2014. The retro-fit of key elements of our PTA technology to
existing plants is under way. We expect these investments to have a material impact on efficiency and reduce annual operating costs.
Our technology team develops,
deploys and optimizes chemicals technology to advance the competitiveness of the installed asset base and deliver competitively advantaged projects to access growth. We plan to continue deploying our technology in new asset platforms to access Asian
demand and advantaged feedstock sources.
In 2013 we announced two new proprietary petrochemicals technologies, SaaBre and Hummingbird. SaaBre
significantly reduces the cost of production of acetic acid from syngas and avoids the need to purify carbon monoxide or purchase methanol. SaaBre technology could also be used to produce methanol and ethanol. Hummingbird simplifies
the process of converting ethanol to ethylene, a key component for the manufacture of plastics. Hummingbird could open the way for the production of biopolymers from bioethanol. Both technologies are expected to deliver significant reductions
in variable manufacturing costs and simplify the manufacturing process.
In December 2013, we agreed to purchase all interests held by our partners, Mitsui Chemicals,
Inc. (MCI) and Mitsui & Co. Ltd. (MBK) in PT Amoco Mitsui PTA Indonesia (AMI) which produces and markets PTA in the Republic of Indonesia. This transaction completed on 28 February 2014 and is consistent with our strategy of growing
our PTA business in our chosen markets.
In September 2013, we signed a non-binding memorandum of understanding with Oman Oil Corporation to assess jointly a facility
in Oman for the manufacture of acetic acid, deploying our SaaBre technology.
The economic environment for some of our products is likely to remain under
pressure in 2014. The impact of capacity additions in Asia continues to depress margins for PTA. The environments for our acetic acid and olefins and derivative value chains are expected to improve in the latter part of 2014 as the high growth
markets absorb excess capacity.
Rosneft
In March 2013 BP completed sale and purchase agreements with Rosneft and Rosneftegaz.
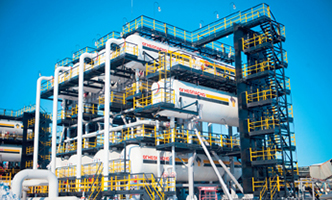
Central processing and pumping facility at the Yuganskneftegaz field, onshore Russia.
BP and Rosneft
| |
• |
|
BP sold its investment in TNK-BP in exchange for $11.8 billion in cash and an 18.5% stake in Rosneft. Together with its existing 1.25% shareholding, BP now holds a 19.75% stake in the company. |
| |
• |
|
BP’s shareholding in Rosneft allows us to benefit from a diversified set of existing and potential projects in the Russian oil and gas sector. BP considers Rosneft share price appreciation and dividend growth as
primary sources of value for its shareholders. |
| |
• |
|
Rosneft’s strategy is to pursue sustainable growth of crude oil production, develop its gas business and complete its refinery modernization programme. |
| |
• |
|
BP is positioned to contribute to Rosneft’s strategy through the sharing of technology, people, processes and best practice. We also have the potential to undertake standalone projects with Rosneft, both in Russia
and internationally. |
| |
• |
|
Bob Dudley was elected to the Rosneft board of directors in June 2013, and became a member of the Rosneft board’s strategic planning committee. |
Rosneft – 2013 summary
| |
• |
|
Rosneft announced in June 2013 that it had completed the process of integrating TNK-BP and subsequently the Rosneft board approved a modified business plan for 2013 incorporating the acquisition of TNK-BP.
|
| |
• |
|
Rosneft concluded long-term crude oil supply agreements with China National Petroleum Corporation (CNPC) and Sinopec, signalling China as an additional market for Russian crude. |
| |
• |
|
Rosneft completed the acquisition of the remaining 49% in the Itera joint venture, 51% of Sibneftegaz and agreed to buy gas assets from ALROSA. |
| |
• |
|
Rosneft made a voluntary offer in October 2013 to buy out the non-controlling shareholders of RN Holding (formerly TNK-BP Holding). By the closing date of the offer in January 2014, Rosneft had received acceptances of
its offer from over 98% of such shareholders. |
|
|
|
|
|
| BP Annual Report and Form 20-F 2013 |
|
|
35 |
|
Upstream
Rosneft is the largest oil company in Russia and the largest publicly traded oil company in the world based on hydrocarbon production volume. Rosneft also has significant
hydrocarbon reserves.
Rosneft has assets in all key hydrocarbon regions of Russia: Western Siberia, Eastern Siberia, Timan-Pechora, Volga-Urals, North Caucasus and
Far East. Internationally, Rosneft participates in exploration projects or has operations in countries including the US, Canada, Vietnam, Venezuela, Brazil, Algeria, UAE, Kazakhstan and Norway. Rosneft and Gazprom, the majority of whose shares are
owned by the Russian state, have exclusive rights to explore and develop significant hydrocarbon resources in the Russian Arctic offshore (including the Sea of Okhotsk). To progress Arctic exploration, Rosneft has concluded partnerships with
ExxonMobil, ENI, Statoil, CNPC and Inpex.
In 2013 Rosneft signed new gas sales contracts with Enel, Fortum and others to monetize produced gas. Also Russian
legislation introduced in December 2013 allows Rosneft and Novatek to export LNG for the first time.
Downstream
Rosneft has interests in 23 refineries including four in Germany through its Ruhr Oel GmbH partnership with BP. In 2013 Rosneft acquired a 21% share in the Saras S.p.A.
refinery in Italy.
Rosneft refinery throughput in 2013 amounted to 1,818mb/d. Rosneft continues to implement its refinery modernization programme which is intended
to significantly upgrade and expand its refining capacity. As at 31 December 2013, Rosneft owned and operated more than 2,400 retail service stations, representing the largest network in Russia. This included BP-branded sites acquired as part
of Rosneft’s acquisition of TNK-BP which will continue to operate under the BP brand. Rosneft’s downstream operations also include jet fuel, bunkering, bitumen and lubricants.
Rosneft segment performance
BP’s investment in
Rosneft is managed and reported as a separate segment under IFRS. The Rosneft segment result includes equity-accounted earnings from Rosneft, representing BP’s share in Rosneft and foreign currency effects on the dividends received in 2013. For
more information on the sale and purchase agreements, see Financial statements – Note 6.
|
|
|
|
|
| |
|
|
$ million |
|
| |
|
|
2013a |
|
| Profit before interest and taxb c |
|
|
2,053 |
|
| Inventory holding (gains) losses |
|
|
100 |
|
| Replacement cost profit before interest and taxc |
|
|
2,153 |
|
| Net charge (credit) for non-operating items |
|
|
45 |
|
| Underlying replacement cost profit before interest and
taxc d |
|
|
2,198 |
|
| b |
BP’s share of Rosneft’s earnings after finance costs, taxation and non-controlling interests is included in the BP group income statement within profit before interest and taxation. |
| c |
Includes $5 million of foreign exchange losses arising on the dividend received. This amount is not reflected in the following table. |
| d |
Underlying replacement cost profit is not a recognized GAAP measure. See footnote c on page 23 for information on underlying replacement cost profit. |
Replacement cost profit before interest and tax for the Rosneft segment was $2.2 billion in 2013. The result included a net non-operating charge of $45 million, primarily
relating to impairment charges. After adjusting for non-operating items, underlying replacement cost profit before interest and tax in 2013 was $2.2 billion.
BP
received a dividend from Rosneft in 2013 of $456 million, after the deduction of withholding tax.
BP completed the exercise to determine the fair value of its share
of Rosneft’s assets and liabilities as at 21 March 2013, as required under IFRS, and the results of this exercise are reflected in the 2013 reported amounts.
BP’s share of the components of Rosneft’s net income are shown in the table below.
|
|
|
|
|
| |
|
|
$ million |
|
| |
|
|
2013a |
|
| Income statement (BP share) |
|
|
|
|
| Profit before interest and tax |
|
|
2,786 |
|
| Finance costs |
|
|
(264 |
) |
| Taxation |
|
|
(422 |
) |
| Non-controlling interests |
|
|
(42 |
) |
| Net income |
|
|
2,058 |
|
| Inventory holding (gains) losses, net of tax |
|
|
100 |
|
| Net income on a replacement cost basis |
|
|
2,158 |
|
| Net charge (credit) for non-operating items, net of tax |
|
|
45 |
|
| Net income on an underlying replacement cost basis |
|
|
2,203 |
|
|
|
| Balance sheet |
|
|
|
|
| |
|
|
$ million |
|
| |
|
|
31 December
2013 |
|
| Investments in associates |
|
|
13,681 |
|
|
|
| Production and reserves |
|
|
|
|
| |
|
|
2013 |
|
| Production (net of royalties) (BP share)e f |
|
|
|
|
| Liquids (mb/d)g |
|
|
650 |
|
| Natural gas (mmcf/d) |
|
|
617 |
|
| Total hydrocarbons (mboe/d)h |
|
|
756 |
|
| Estimated net proved reserves (net of royalties)
(BP share) |
|
|
|
|
| Liquids (million barrels)g |
|
|
4,975 |
|
| Natural gas (billion cubic feet) |
|
|
9,271 |
|
| Total hydrocarbons (mmboe) |
|
|
6,574 |
|
| Average oil marker prices |
|
|
$ per barrel |
|
| Urals (Northwest Europe – CIF) |
|
|
107.38 |
|
| Russian domestic oil |
|
|
54.97 |
|
| e |
Reflects production for the period 21 March to 31 December, averaged over the full year. |
| f |
Information on BP’s share of TNK-BP’s production for comparative periods is provided on pages 248 and 250. |
| g |
Liquids comprise crude oil, condensate and natural gas liquids. |
| h |
Natural gas is converted to oil equivalent at 5.8 billion cubic feet = 1 million barrels.
|
|
|
|
| 36 |
|
BP Annual Report and Form 20-F 2013 |
Other businesses
and corporate
Other businesses and corporate comprises
the Alternative Energy business, Shipping, Treasury (which includes interest income on the group’s cash and cash equivalents), and corporate activities including centralized functions.
Financial performance
|
|
|
|
|
|
|
|
|
|
|
|
|
| |
|
|
|
|
|
|
|
|
|
|
$ million |
|
| |
|
|
2013 |
|
|
|
2012 |
|
|
|
2011 |
|
| Sales and other operating revenuesa |
|
|
1,805 |
|
|
|
1,985 |
|
|
|
2,957 |
|
| Replacement cost profit (loss) before interest and tax |
|
|
(2,319 |
) |
|
|
(2,794 |
) |
|
|
(2,468 |
) |
| Net (favourable) unfavourable impact of non-operating items |
|
|
421 |
|
|
|
798 |
|
|
|
822 |
|
| Underlying replacement cost profit (loss) before interest and taxb |
|
|
(1,898 |
) |
|
|
(1,996 |
) |
|
|
(1,646 |
) |
|
|
|
|
| Capital expenditure and acquisitions |
|
|
1,050 |
|
|
|
1,435 |
|
|
|
1,853 |
|
| a |
Includes sales to other segments. |
| b |
Underlying replacement cost profit (loss) is not a recognized GAAP measure. See footnote c on page 23 for information on underlying replacement cost profit (loss). |
The replacement cost loss before interest and tax for the year ended 31 December 2013 was $2.3 billion (2012 $2.8 billion, 2011 $2.5 billion). The 2013 result
included a net charge for non-operating items of $421 million (2012 $798 million, 2011 $822 million).
After adjusting for non-operating items, the underlying
replacement cost loss before interest and tax for the year ended 31 December 2013 was $1.9 billion (2012 $2.0 billion, 2011 $1.6 billion). This result reflected higher income on cash balances and lower corporate costs. The 2012 result was
impacted by the loss of income from the sale of the aluminium business in 2011, adverse foreign exchange effects and higher corporate costs.
Alternative Energy
BP is committed to alternative energy
and our strategy is focused on operating large scale businesses and commercializing our innovative technologies. BP continues to invest in expanding the scale of our biofuels business and in leveraging our unique capabilities and experience in
agri-business, bio-technology and bio-refining. We also have an operating wind business. As at 31 December 2013, we have invested approximately $8.3 billionc, exceeding our 2005 commitment of
$8 billion over 10 years.
| c |
The majority of costs were initially capitalized, although some were expensed under IFRS. |
Biofuels
BP believes that it has a key role to
play in enabling the transport sector to respond to the dual challenges of energy security and climate change. We have a focused programme of biofuels development based on the most efficient transformation of sustainable and low-cost sugars into a
range of fuel molecules. Our strategy is to focus on the conversion of cost-advantaged feedstocks that are materially scalable and that can be competitive in an $80/bbl crude oil environment without subsidies.
We operate three sugar cane mills in Brazil producing bioethanol and sugar, and exporting power to the grid. We continue to evaluate options to increase production at
these facilities and have already started work on expanding ethanol production capacity at one mill and this work is expected to be completed in 2014. Likewise, we are ramping up production at our Vivergo joint venture plant, which is the largest
bioethanol facility in the UK and one of the largest in Europe. Once up to full production capacity of 420 million litres per year, the Vivergo facility will represent around 20% of the UK’s total 2012-13 requirements under the Renewable
Transport Fuels Obligation (RTFO).
BP continues to invest throughout the entire biofuels value chain, from growing sustainable higher-yielding and lower-carbon
feedstocks through to the development, production and marketing of the advantaged fuel molecule biobutanol, which has higher energy content than ethanol and delivers improved fuel economy.
In conjunction with its partner DuPont, BP is undertaking leading-edge research into the production of biobutanol under the
company name Butamax.
Across our biofuels business, BP’s share of ethanol-equivalent productiond for 2013
was 521 million litres (552 million litres gross) compared with 404 million litres a year ago. The majority of this production is from BP’s sugar cane mills in Brazil. In the US, BP has made the strategic decision to focus its
biofuels business on the research, development, and commercialization of cellulosic ethanol technology at its facilities in San Diego, California, and Jennings, Louisiana.
| d |
Ethanol-equivalent production includes ethanol and sugar. |
Wind
In wind power, our business is focused onshore in the US. In 2013 we marketed our wind business for sale. Despite receiving a number of bids, we determined it was not the
right time to sell and instead are focusing on optimizing performance at our 16 wholly owned and joint-venture wind farms.
BP maintained its net wind generation
capacity in the US at 1,558MWe during 2013. BP’s net share of wind generation for 2013 was 4,203GWh (7,363GWh gross), compared with 3,587GWh (5,739GWh gross) a year ago.
| e |
BP also has 32MW of wind capacity in the Netherlands, operated by our Downstream segment. |
Emerging business and ventures
Our emerging
business and ventures unit invests in technology entrepreneurs working at the frontiers of their fields – across the entire energy spectrum. Investments focus on emerging, strategic technologies, oil and gas, downstream technologies including
fuels and chemicals, and biotech and bioenergy. The unit has made 37 separate investments, with $210 million of committed capital.
Shipping
We transport our products across oceans, around coastlines and along waterways using a combination of BP-operated, time-chartered and spot-chartered vessels.
All vessels conducting BP activities are subject to our health, safety, security and environmental requirements. The primary purpose of our shipping and chartering activities is the transportation of our hydrocarbon products. In addition, we may use
surplus capacity to transport third-party products. In December 2013, BP announced it had signed a contract with Hyundai Mipo Dockyard Co., Ltd to build 14 new product tankers in Korea. The first of these will be delivered in 2016.
Treasury
Treasury manages the financing of the group
centrally, ensuring liquidity is sufficient to meet group requirements, and manages key financial risks including interest rate, foreign exchange, pension and financial institution credit risk. From locations in the UK, the US and Singapore,
Treasury provides the interface between BP and the international financial markets and supports the financing of BP’s projects around the world. Treasury trades foreign exchange and interest rate products in the financial markets, hedging group
exposures and generating incremental value through optimizing and managing cash flows and the short-term investment of operational cash balances. Trading activities are underpinned by the compliance, control and risk management infrastructure common
to all BP trading activities. For further information, see Financial statements – Note 19.
Insurance
The group generally restricts its purchase of insurance to situations where this is required for legal or contractual reasons. Losses are borne as they arise, rather than
being spread over time through insurance premiums with attendant transaction costs. This approach is reviewed on a regular basis and if specific circumstances require such a review.
Outlook
In 2014 Other businesses and corporate annual
charges, excluding non-operating items, are expected to be in the range of $1.6-$2.0 billion.
|
|
|
|
|
| BP Annual Report and Form 20-F 2013 |
|
|
37 |
|
Gulf of Mexico oil spill
We remain committed to meeting our responsibilities to the US federal, state and local governments and communities of the Gulf Coast following the
Deepwater Horizon accident.
We have made significant progress in completing the response to the accident and supporting economic and environmental recovery efforts
in affected areas.
Completing the response
BP,
working under the direction of the US Coast Guard’s Federal On-Scene Coordinator, continued to complete the Deepwater Horizon operational response activities. By the end of 2013, operational activity continued on just 37 of the approximately
4,400 shoreline miles in the area of response. These 37 shoreline miles were all in Louisiana and were subject to patrolling and maintenance, final monitoring or inspection, or were pending final Coast Guard approval at the end of 2013. The US Coast
Guard ended active clean-up in Mississippi, Alabama and Florida in June 2013.
The US Coast Guard has indicated that if oil is later discovered in a shoreline segment
where removal actions have been deemed complete, they will follow long-standing response protocols established under the law and contact whoever it believes is the responsible party or parties.
Environmental restoration
BP is responsible for the
reasonable and necessary costs of assessing potential injury to natural resources resulting from the oil spill as well as the reasonable and necessary costs of restoration as defined under the Oil Pollution Act of 1990. In 2013 activity was focused
on natural resource damage assessment but some early restoration work has also begun.
Natural resource damage assessment
Scientists from BP, government agencies, academia and other organizations are studying a range of species and habitats to understand how wildlife populations and the
environment may have been affected by the accident and oil spill. Since May 2010, more than 240 initial and amended work plans have been developed by state and federal trustees and BP to study resources and habitat. The study data will inform an
assessment of injury to natural resources in the Gulf of Mexico and the development of a restoration plan to address the identified injuries. By the end of 2013, BP had paid approximately $1 billion to support the assessment process.
Early restoration projects
While the injury
assessment is still ongoing, restoration work has begun. In April 2011 BP committed to provide up to $1 billion in early restoration funding to expedite recovery of natural resources injured as a result of the Deepwater Horizon accident and oil
spill. BP and the trustees, as at December 2013, had reached agreement or agreement in principle on a
total of 54 early restoration projects that are expected to cost approximately $698 million, including 10 projects that are
already in place or under way.
Projects announced in 2013 include ecological projects that will restore habitat and resources, as well as projects that enhance
recreational use of natural resources. These projects will proceed through a further regulatory review and public comment process. Once that process is complete, BP and the trustees will seek to proceed with approved projects. BP will provide
project funding in exchange for restoration credit to be applied to the final assessment of natural resource damages.
Gulf of Mexico
Research Initiative
In May 2010 BP committed $500 million over 10 years to fund independent scientific research through the Gulf of Mexico Research
Initiative. The goal of the research initiative is to improve society’s ability to understand, respond to and mitigate the potential impacts of oil spills to marine and coastal ecosystems. As at 31 December 2013, the aggregate contribution
by BP was $169 million. The continued fulfilment of this commitment is one of the conditions of the US government criminal plea agreement (see below).
Economic recovery
BP continued to support economic recovery efforts in local communities through a variety of actions and programmes in 2013.
By 31 December 2013, BP had spent $12.8 billion on economic recovery, including claims, advances, settlements and other payments, such as state tourism grants and funding for state-led seafood testing and marketing. BP has committed $2.3
billion to help resolve economic loss claims related to the Gulf of Mexico seafood industry, of which $1.2 billion has been paid in to the seafood compensation fund but has not yet been distributed to final claimants.
Plaintiffs’ Steering Committee settlements
BP
reached settlements in 2012 with the Plaintiffs’ Steering Committee (PSC) to resolve the substantial majority of legitimate individual and business claims and medical claims stemming from the accident and oil spill. The PSC acts on behalf of
individual and business plaintiffs in the multi-district litigation proceedings in New Orleans (see Legal update below). During 2013, amounts paid out under the PSC settlements totalled $2.7 billion.
As part of its monitoring of payments made by the court-supervised settlement programme for the economic and property damages settlement, BP identified and disputed
multiple business economic loss claim determinations that appeared to result from an incorrect interpretation of the economic and property damages settlement agreement by the claims administrator. See further details under Legal update below. BP has
also raised issues about misconduct and inefficiency in the facility administering the settlement.
The medical benefits class action settlement provides for claims
to be paid to qualifying class members from the agreement’s effective date. Following the resolution of all appeals relating to this settlement, the agreement’s effective date was 12 February 2014. The deadline for submitting claims
under the settlement is one year from the effective date.
OPA claims programme
There is a separate BP claims programme which handles claims under the Oil Pollution Act of 1990 (OPA) by individuals and businesses who are not covered by the PSC
economic and property damages settlement, who have opted out of the settlement or who are pursuing claims separately, as permitted by the terms of the settlement. During 2013, amounts paid out in relation to the OPA claims programme totalled $31
million.
State and local claims
Several
states and local government entities have presented claims for alleged losses, including economic and property damage, under OPA. BP has provided for the current best estimate of the amount required to settle these obligations. BP considers most of
these claims to be unsubstantiated and the methodologies used to calculate them to be seriously flawed, not supported by OPA, not supported by documentation and to be substantially overstated. A total of $89 million was paid in relation to state and
local claims in 2013.
For further information on the PSC settlements and state and local claims, see Legal proceedings on page 257, Financial Statements – Note
2 and bp.com/uslegalproceedings.
|
|
|
| 38 |
|
BP Annual Report and Form 20-F 2013 |
Legal update
BP is subject to a number of different legal proceedings in connection with the Deepwater Horizon incident. These include the legal proceedings relating to the PSC
settlements; the multi-district litigation proceedings in New Orleans; a range of civil lawsuits, including claims brought by states and local government entities; other civil claims by individuals and businesses; and the multi-district litigation
proceedings in Houston in relation to alleged violations of securities legislation. In 2012, BP reached a settlement with the US Department of Justice relating to all federal criminal charges and a settlement with the SEC resolving certain civil
claims. Certain BP entities have been subject to suspension and debarment by the US Environmental Protection Agency (EPA).
PSC settlements
There have been various rulings from the district court and the US Court of Appeals for the Fifth Circuit (Fifth Circuit) on matters relating to
interpretation of the PSC economic and property damages settlement agreement, including the meaning of the causation requirements of the agreement.
In 2013 a panel
of the Fifth Circuit (the business economic loss panel) set aside the claims administrator’s interpretation of the business economic loss framework of the settlement agreement and instructed the district court in New Orleans to undertake
additional proceedings to determine the correct interpretation of the agreement. In December 2013, the district court ruled that, for the purposes of determining business economic loss claims, revenues must be matched with expenses incurred by
claimants in conducting their business even where the revenues and expenses were recorded at different times. The district court assigned the development of more detailed matching requirements to the claims administrator. The claims administrator
has issued a draft policy addressing the matching of revenue and expenses for business economic loss claims. The parties have made written submissions on the draft policy and the claims administrator will issue a final policy to which BP and the PSC
have the right to object and seek review by the district court.
The district court also ruled that the settlement agreement did not contain a causation requirement
beyond the revenue and related tests set out in an exhibit to that agreement. BP appealed the district court’s ruling on causation to the business economic loss panel, but the panel affirmed the district court’s ruling on 3 March 2014. BP
is considering its appeal options, including a potential petition that all the active judges of the Fifth Circuit review the 3 March decision. The temporary injunction on business economic loss claims offers and payments will be lifted when the case
is transferred back to the district court; the timing of this would be affected by the status of any such petition by BP.
A separate but related appeal was brought
by objectors to the economic and property damages settlement challenging the overall fairness and lawfulness of the agreement. This appeal was heard by a different panel of the Fifth Circuit, which, in January 2014, upheld the district court’s
approval of the settlement agreement and left to the business economic loss panel the question of how to interpret the agreement, including the meaning of the agreement’s causation requirements. BP and several of the objectors have filed
petitions requesting that all the active judges of the Fifth Circuit review the decision to uphold the approval of the settlement.
BP has filed a lawsuit alleging
that it relied on fraudulent representations by a former PSC lawyer when negotiating aspects of the PSC settlement relating to the $2.3-billion seafood compensation fund. The district court granted the lawyer’s motion to stay this lawsuit,
pending developments in the government’s criminal investigation and possible indictment. The district court also denied BP’s motion requesting that further payments from the seafood compensation fund be suspended on the basis that no
further payment from the fund is imminent. The district court deferred ruling on a motion by BP seeking to determine the extent of the fraud and what portion, if any, of the seafood fund should be returned as a result.
Multi-district litigation proceedings in New Orleans
The multi-district litigation trial relating to liability, limitation, exoneration and fault allocation (MDL 2179) began in the federal district court in New Orleans in
February 2013. The first phase of the trial focused on the causes of the accident and the allocation of fault among the defendants. The second phase focused on efforts to stop the flow of oil and the volume of oil spilled. BP is not aware of the
timing of the district court’s rulings in respect of these first two phases of the trial and the court could issue its decision at any time.
In a subsequent trial phase, for which no trial date has yet been set, the district court will consider the statutory
per-barrel penalty rate to be applied in determining penalties under the Clean Water Act. There is significant uncertainty about the amount of Clean Water Act penalties to be paid, and the timing of payment, as these will depend on the finding as to
negligence or gross negligence, the volume of oil spilled and the application of statutory penalty factors. The district court has wide discretion in its determination as to whether a defendant’s conduct involved negligence or gross negligence
as well as in its determinations on the volume of oil spilled and the application of statutory penalty factors.
Civil claims
BP p.l.c., BP Exploration & Production Inc. (BPXP – the BP group company that conducts exploration and production operations in the Gulf of Mexico) and
various other BP entities have been among the companies named as defendants in approximately 2,950 civil lawsuits resulting from the accident and oil spill, including the claims by several states and local government entities referred to above. The
majority of these lawsuits assert claims under OPA, as well as various other claims, including for economic loss and real property damage, and claims under maritime law and state law. These lawsuits seek various remedies including economic and
compensatory damages, punitive damages, removal costs and natural resource damages. Many of the lawsuits assert claims excluded from the PSC settlements, such as claims for recovery for losses allegedly resulting from the 2010 federal deepwater
drilling moratoria and the related permitting process. Many of these lawsuits have been consolidated with the multi-district litigation proceedings in New Orleans.
Multi-district litigation proceedings in Houston
The MDL 2185 proceedings pending in federal court in Houston, including a purported
class action on behalf of purchasers of American Depository Shares under US federal securities law, are continuing. A jury trial is scheduled to begin in October 2014.
SEC settlement
In connection with the 2012
settlement with the SEC resolving the SEC’s Deepwater Horizon-related civil claims, as of 31 December 2013, BP had completed its first two payments totalling $350 million. A final $175 million payment, plus accrued interest, is scheduled
for 2014.
US government criminal plea agreement
Under the terms of the criminal plea agreement reached with the US government in 2012 to resolve all federal criminal claims arising out of the Deepwater Horizon
incident, BP is taking additional actions, enforceable by the court, to further enhance the safety of drilling operations in the Gulf of Mexico. The first annual update on BP’s compliance with the plea agreement is expected to be available by
31 March 2014 and to be published at bpxpcompliancereports.com.
The plea agreement also provides for the US government to appoint two independent
monitors – a process safety monitor and an ethics monitor – as well as an independent third-party auditor. The process safety monitor has been retained, for a period of up to four years from February 2014, and will review and provide
recommendations concerning BPXP’s process safety and risk management procedures for deepwater drilling in the Gulf of Mexico. The ethics monitor has been retained, for a term of up to four years from 2013, and will review and provide
recommendations concerning BP’s ethics and compliance programme. The third-party auditor has also been retained and will review and report to the probation officer, the US government and BP on BPXP’s compliance with the plea
agreement’s implementation plan.
US Environmental Protection Agency (EPA) suspension and debarment
In November 2012, the EPA suspended BP p.l.c., BPXP and other BP companies from receiving new federal contracts or renewing existing ones. In 2013, the EPA debarred the
Houston headquarters of BPXP, thus effectively preventing it from entering into new contracts or leases with the US government. In November 2013, the EPA continued the suspensions of the previously suspended companies, suspended two new BP entities
and proposed discretionary debarment of all suspended BP entities. BP is challenging the EPA’s suspension and debarment decisions. Neither the suspensions nor the proposed debarments affect existing contracts BP has with the US government,
including those relating to current and ongoing drilling and production operations in the Gulf of Mexico. BP
|
|
|
|
|
| BP Annual Report and Form 20-F 2013 |
|
|
39 |
|
continues to work with the EPA in preparing an administrative agreement to resolve these suspension and debarment issues.
For further information on these matters, see Risk factors on page 51 and Legal proceedings on page 257.
Financial update
The group income statement for 2013
includes a pre-tax charge of $469 million in relation to the Gulf of Mexico oil spill. The charge for the year reflects adjustments to provisions and the ongoing costs of the Gulf Coast Restoration Organization. As at 31 December 2013, the
total cumulative charges recognized to date amount to $42.7 billion. BP has provided for spill response costs, environmental expenditure, litigation and claims and Clean Water Act penalties that can be measured reliably. At 31 December 2013,
provisions related to the Gulf of Mexico oil spill amounted to $9.3 billion (2012 $15.2 billion).
The cumulative income statement charge does not include amounts for
obligations that BP considers are not possible, at this time, to measure reliably. Nothing is currently provided for natural resource damages, except for $1 billion for early restoration projects and no provision has been made for amounts arising
from MDL 2185 (securities class action). In addition, management believes that no reliable estimate can be made of any business economic loss claims not yet received, processed and paid. This is because of the significant uncertainties which exist
currently, as noted in the Plaintiffs’ Steering Committee section above (see also Financial statements – Note 2). The additional amounts payable for these and other items (such as state and local claims) could be considerable.
The total amounts that will ultimately be paid by BP in relation to all the obligations relating to the accident and oil spill are subject to significant uncertainty. The
ultimate exposure and cost to BP will be dependent on many factors, including any new information or future developments. These could have a material impact on our consolidated financial condition, results of operations and cash flows. The risks
associated with the accident and oil spill could also heighten the impact of the other risks to which the group is exposed.
For details regarding the impacts and
uncertainties relating to the Gulf of Mexico oil spill, see Risk factors on page 51 and Financial statements – Note 2.
Deepwater
Horizon Oil Spill Trust update
BP, in agreement with the US government, set up the $20-billion Deepwater Horizon Oil Spill Trust (the Trust) to provide
confidence that funds would be available to satisfy individual and business claims, final judgments in litigation and litigation settlements, state and local response costs and claims, and natural resource damages and related costs. The Trust was
fully funded by the end of 2012.
Payments made out of the Trust during 2013 totalled $3.1 billion for individual and business claims, medical settlement programme
payments, natural resource damage assessment and early restoration, state and local government claims, costs of the court supervised settlement progamme and other resolved items. As at 31 December 2013, the aggregate cash balances in the Trust
and the associated qualified settlement funds amounted to $6.7 billion, including $1.2 billion remaining in the seafood compensation fund, which is yet to be distributed, and $0.9 billion held for natural resource damage early restoration projects.
As at 31 December 2013, the cumulative charges to the Trust amounted to $19.3 billion. Thus, a further $0.7 billion
could be charged in subsequent periods for items covered by the Trust with no net impact on the income statement. Additional liabilities in excess of this amount would be expensed to the income statement. See Legal proceedings on page 257 and
Financial statements – Note 2 for more information.

Clean Water Act penalties
BP has recognized a provision of $3.5 billion for the estimated civil penalties for strict liability under the Clean Water Act, which are based on a specified range per
barrel of oil released. The penalty rate per barrel used to calculate this provision is based upon BP’s conclusion, among other things, that it did not act with gross negligence or engage in wilful misconduct.
If BP is found to have been grossly negligent, the penalty is likely to be significantly higher than the amount currently provided. See further details under
Multi-district litigation proceedings in New Orleans above and in Financial statements – Note 2.
|
|
|
| 40 |
|
BP Annual Report and Form 20-F 2013 |
Corporate responsibility
We believe we have a positive role to play in shaping the long-term future of energy.

Fire safety training in Angola.
Safety
We continue to promote deep capability and a safe operating culture across BP.
Group safety performance
In 2013 BP reported six fatalities. These were four employees in the terrorist attack at In Amenas, Algeria and two contractors in heavy goods vehicle incidents, one in
Brazil and one in South Africa. We deeply regret the loss of these lives.
Personal safety performance
|
|
|
|
|
|
|
|
|
|
|
|
|
| |
|
|
2013 |
|
|
|
2012 |
|
|
|
2011 |
|
| Recordable injury frequency (group) –incidents per 200,000 hours worked |
|
|
0.31 |
|
|
|
0.35 |
|
|
|
0.36 |
|
| Day away from work case frequencyb (group) –
incidents per 200,000 hours worked |
|
|
0.070 |
|
|
|
0.076 |
|
|
|
0.090 |
|
| b |
Incidents that resulted in an injury where a person is unable to work for a day (shift) or more. |
Process safety performance
|
|
|
|
|
|
|
|
|
|
|
|
|
| |
|
|
2013 |
|
|
|
2012 |
|
|
|
2011 |
|
| Tier 1 process safety events |
|
|
20 |
|
|
|
43 |
|
|
|
74 |
|
| Loss of primary containment –
number of all incidentsc |
|
|
261 |
|
|
|
292 |
|
|
|
361 |
|
| Loss of primary containment –
number of oil spillsd |
|
|
185 |
|
|
|
204 |
|
|
|
228 |
|
| Number of oil spills to land and water |
|
|
74 |
|
|
|
102 |
|
|
|
102 |
|
| Volume of oil spilled (thousand litres) |
|
|
724 |
|
|
|
801 |
|
|
|
556 |
|
| Volume of oil unrecovered
(thousand litres) |
|
|
261 |
|
|
|
320 |
|
|
|
281 |
|
| c |
Does not include either small or non-hazardous releases. |
| d |
Number of spills greater than or equal to one barrel (159 litres, 42 US gallons). |
We report tier 1 process safety events
defined as the loss of primary containment from a process of greatest consequence – causing harm to a member of the workforce or costly damage to equipment, or exceeding defined quantities. We use the American Petroleum Institute (API) RP-754
standard. Our loss of primary containment (LOPC) metric includes unplanned or uncontrolled releases from a tank, vessel, pipe, rail car or equipment used for containment or transfer of materials within our operational boundary excluding
non-hazardous releases such as water. We seek to record all LOPCs regardless of the volume of the release and report on losses over a severity threshold.
Managing safety
We are working to continuously improve safety and risk management across BP. Three objectives guide our efforts:
| • |
|
To promote deep capability and a safe operating culture across BP. |
| • |
|
To embed OMS as the way BP operates. |
| • |
|
To support self-verification and independent assurance that confirms our conduct of operating. |
Within BP, operating
businesses are accountable for delivering safe, compliant and reliable operations. They are supported in this by our safety and operational risk (S&OR) function whose role is to:
| • |
|
Set clear requirements. |
| • |
|
Maintain an independent view of operating risk. |
| • |
|
Provide deep technical support to the operating businesses. |
| • |
|
Intervene and escalate as appropriate to cause corrective action. |
Governance
BP reviews risks at all levels of the organization. Each business segment has a safety and operational risk committee, chaired by the business head, to oversee the
management of safety and risk in their respective areas of the business. In addition, the group operations risk committee (GORC) reviews safety and risk management across BP.
The board’s safety, ethics and environment assurance committee (SEEAC) receives updates from the group chief executive and the head of S&OR on management plans
associated with the highest priority risks as part of its update on GORC’s work. GORC also provides SEEAC with updates on BP’s process and personal safety performance, and the monitoring of major incidents and near misses across the group.
See Our management of risk on page 49.
|
|
|
|
|
| BP Annual Report and Form 20-F 2013 |
|
|
41 |
|

Operating management system (OMS)
BP’s OMS is a group-wide framework designed to provide a basis for managing our operations in a systematic way. OMS integrates BP requirements on health, safety,
security, environment, social responsibility and operational reliability, as well as related issues such as maintenance, contractor management and organizational learning, into a common management system.
All BP businesses covered by the OMS are required to progressively align with this framework through an annual performance improvement cycle. Recently acquired operations
need to transition to the OMS as the initial step in this process. The application of a comprehensive management system such as OMS across a global company is an ongoing process. See page 44 for information about joint arrangements.
Capability development
BP’s capability
development programmes are designed to equip our staff with the skills needed to run safe and efficient operations. The programmes cover our OMS, process safety and risk and safety leadership. Our global wells institute offers courses in areas such
as applied deepwater well control, drilling engineering and well site leadership with more than 100 sessions delivered in 2013. It includes a simulator facility and an applied deepwater well control course where drilling personnel, including our
contractors, can work together and practice a variety of well control situations. Trainers include experts from both inside and outside of the oil and gas industry.
Security and crisis management
The scale and spread of BP’s operations means we must prepare for a range of potential business
disruptions and emergency events. BP monitors for and aims to guard against hostile actions that could cause harm to our people or disrupt our operations, including physical and digital threats and vulnerabilities.
We also maintain disaster recovery, crisis and business continuity management plans and work to build day-to-day response
capabilities to support local management of incidents and group-wide practices and response techniques. See page 44 for information on BP’s approach to oil spill preparedness and response.
In January 2013, the In Amenas gas plant in Algeria, which is run as a joint operation between BP, Sonatrach (the national gas company of Algeria) and Statoil, came under
armed terrorist attack. A total of 40 people from 10 countries and 10 organizations were killed in the attack. Four employees and a former employee lost their lives in the incident. BP and Statoil jointly carried out an extensive review of security
arrangements in Algeria following the attack and we are working with Sonatrach on implementing a programme of security enhancements.
Safety in
the Upstream business

In our Upstream business the recordable injury frequency for 2013 remained stable at 0.32, the same as in 2012. Our day away from work
case frequency, incidents that resulted in an injury where a person is unable to work for a day (shift) or more, was 0.068 in 2013 compared to 0.053 in 2012. The number of reported loss of primary containment (LOPC) incidents was 143, down from 151
in 2012.
Safer drilling
Our global wells
organization (GWO) is responsible for planning and executing our wells operations across the world. It brings wells expertise into a single organization to drive standardization and consistent implementation. It is also responsible for establishing
new GWO standards on compliance, risk management, contractor management, performance indicators, technology and capability.
We have been developing and finalizing
OMS conformance plans for activities which represent the highest risk areas in our wells operations. For example we have developed and applied new and revised engineering technical practices for activities such as well barriers and testing.
The Bly Report recommendations
BP’s
investigation into the Deepwater Horizon accident in 2010, the Bly Report, made 26 recommendations aimed at further reducing risk across BP’s global drilling activities. They included strengthening contractor management, improving assurance on
blowout preventers, well control, pressure-testing for well integrity, emergency systems, cement testing, rig audit and verification, and personnel competence.
At
the end of 2013, 15 of the Bly Report recommendations had been completed. All 26 recommendations have been worked on in parallel and progress has been made towards each of them. By the end of 2013, over 75% of the deliverables that make up the 26
recommendations had been completed. A recommendation is defined as complete when it has been approved by senior management in our global wells organization and submitted for internal verification.
The outstanding recommendations relate to well control and well integrity, drilling and competence, the management of risk and change, and blowout preventers.
The board’s safety, ethics and environment assurance committee monitors BP’s global implementation of the measures recommended in the Bly Report, and progress
is tracked quarterly by executive
|
|
|
| 42 |
|
BP Annual Report and Form 20-F 2013 |
management. For the full report and periodic updates on progress see bp.com/internalinvestigation.
The Bly Report – independent assessment
The
BP board appointed Carl Sandlin as independent expert to provide an objective assessment of BP’s global progress in implementing the deliverables from the Bly Report.
As part of his work, Mr Sandlin visited the regional wells teams with active operation twice in 2013. During each visit Mr Sandlin conducted reviews with their senior
management and held discussions with key wells personnel and drilling contractors onsite.
The BP board and Mr Sandlin have agreed, in principle, that his engagement,
initially scheduled to finish in June 2014, will be extended to June 2016.
Process safety monitor
Following legal settlements with the US government in 2012, BP has retained a process safety monitor for a term of up to four years from February 2014. The process safety
monitor will review and provide recommendations concerning BP Exploration & Production Inc’s process safety and risk management procedures for deepwater drilling in the Gulf of Mexico.
Sharing lessons learned
We continue to share what
we have learned to advance global deepwater capabilities and practices that enhance safety in our company and the deepwater industry. We have conducted more than 200 briefings over the past three years to share lessons learned. We have worked with a
range of industry partners including trade associations, host governments, national oil companies and regulators. For example we are working with the International Association of Oil & Gas Producers, Marine Well Containment Company, API and
the International Association of Drilling Contractors.
Safety in the Downstream business
The process safety incident index (PSII) is a weighted index that reflects both the number and severity of events per 200,000 hours
worked. In 2013 our PSII was down 60% compared to a baseline year of 2009. There were 101 LOPCs in 2013 down from 117 in 2012, with divestments accounting for a significant part of this reduction.
We measure personal safety performance through recordable injury frequency (RIF) and day away from work case frequency (DAFWCF) as well as severe vehicle accident rate
(SVAR). In 2013 our RIF was 0.25 compared to 0.33 in 2012. The 2013 DAFWCF, the number of cases where an employee misses one or more days from work per 200,000 hours worked, was 0.063 compared to 0.089 in 2012.
Our SVAR which is the number of vehicle incidents that result in death, injury, a spill, a vehicle rollover, or serious disabling vehicle damage per one million
kilometres travelled, was 0.10 in 2013 compared to 0.16 in 2012. Driving safety remains an area of focus for us.
We focus on the safe storage, handling and processing of hydrocarbons in our facilities across the Downstream business. BP
takes measures to:
| • |
|
Prevent loss of hydrocarbon containment through well designed, maintained and operated equipment. |
| • |
|
Reduce the likelihood of any hydrocarbon releases and the possibility of ignition. |
| • |
|
Provide safe locations, emergency procedures and other mitigation measures in the event of a release, fire or explosion. |
Some areas where we worked to manage risks in our refining and petrochemicals portfolio in 2013 included:
| • |
|
Corrosion: Improving the way we detect, measure and monitor corrosion with the aim of reducing the risk of leaks and increasing the reliability of our equipment. We are using industry benchmarks and technology to
improve routine detection. |
| • |
|
Coaching: Nine manufacturing facilities participated in the Exemplar programme which aims to help sites apply our operating management system using continuous improvement processes. |
| • |
|
Site occupied buildings: We moved workforce further away from higher risk processing areas at our petrochemical plant in Zhuhai, China and installed an improved evacuation alert system at our chemical plant in Hull in
the UK, as part of a multi-year programme. |
Process safety expert for our Downstream business
The board’s safety, ethics and environment assurance committee appointed Duane Wilson in May 2012 as process safety expert and assigned him to work in a global
capacity with the Downstream business. In his role as process safety expert, Mr Wilson provides an independent perspective on the progress that BP’s fuels, lubricants and petrochemicals businesses are making globally toward becoming industry
leaders in process safety performance. Mr Wilson’s contract has been extended to April 2015.
Working with partners and contractors
BP, like all our industry peers, rarely works in isolation – we need to work with suppliers, contractors and partners to carry out our operations. In
2013, 54% of the 373 million hours worked by BP were carried out by contractors.
Our ability to be a safe and responsible operator depends in part on the
conduct of our suppliers and contractors. To this end we set operational standards through legally-binding agreements. Training and dialogue also help build the capability of our contractors.
Contractors
We expect our contractors to comply
with legal and regulatory requirements and to operate consistently with the principles of our code of conduct when working on our behalf. Our OMS includes requirements

~
A contractor checks a pump in the production module on the Thunder Horse platform in the Gulf of Mexico, US.
|
|
|
|
|
| BP Annual Report and Form 20-F 2013 |
|
|
43 |
|
and practices for working with contractors and our operations are obliged to plan and execute actions to reach conformance
with OMS on contractor management.
We seek to set clear and consistent expectations of our contractors. In our Upstream business our standard model contracts
include, for example, health, safety, security and environmental requirements.
Bridging documents are necessary in some cases to define how our safety management
system and that of our contractors co-exist to manage risk on the work site.
In 2011 we undertook a review of how we manage contractors in our Upstream business,
which examined best practice in BP and other industries that use contractors to perform potentially high-consequence activities. As a result of this review, we are focusing on developing deeper, longer-term relationships with selected contractors in
our Upstream business. We have:
| • |
|
Established global agreements that help to strengthen our relationships with strategic contractors and suppliers, manage risks more effectively and leverage economies of scale. |
| • |
|
Increased the rigour of health and safety qualification and selection criteria when approving contractor and supplier capabilities. |
| • |
|
Piloted guidance for the operating line on parts of our OMS that relate to working with contractors. |
| • |
|
Continued working with our strategic contractors and suppliers to create standardized technical specifications and quality requirements for certain equipment, initially focused on new projects. |
| • |
|
Worked on incorporating safety and quality key performance metrics into contracts for potentially high-consequence activities. |
Our partners in joint arrangements
We seek to work
with companies that share our commitment to ethical, safe and sustainable working practices. However, we do not control how our co-venturers and their employees approach these issues.
Typically, our level of influence or control over a joint arrangement is linked to the size of our financial stake compared with other participants. Our code of conduct
provides that we will do everything we reasonably can to make sure joint arrangements follow similar principles to those in our code. In some joint arrangements we act as the operator. Our OMS provides that where we are the operator, and where legal
and contractual arrangements allow, OMS applies to the operations of that joint arrangement.
In other cases, one of our joint arrangement partners may be the
designated operator, or the operator may be an incorporated joint arrangement company owned by BP and other companies. In those cases our OMS does not apply as the management system to be used by the operator, but is available to our businesses as a
reference point for their engagement with operators and co-venturers.
We introduced a group policy in 2013 to provide a consistent framework for identifying and
managing BP’s exposure related to safety and operational risk, as well as bribery and corruption risk, from our participation in new and existing non-operated joint arrangements.
Environment and society
Throughout the life cycle of our projects and operations, we aim to manage the environmental and social impacts of our presence.

Managing our impacts
At a group level, we review our management of material issues such as GHG emissions, water, oil spill response, sensitive and protected areas and human rights annually.
Using our operating management system (OMS), we seek to identify emerging risks and assess methods to reduce them across the company.
Our OMS includes environmental
and social practices that set out how our major projects identify and manage environmental and social impacts. The practices also apply to projects that involve new access, projects that could affect an international protected area and some BP
acquisition negotiations.
In the early planning stages, these projects complete a screening process to identify the most significant environmental and social
impacts. Projects are required to identify mitigation measures and implement these in design, construction and operations. From April 2010 to the end of 2013, 91 projects had completed the screening process, and used outputs from the process to
implement measures to reduce negative impacts.
BP’s environmental expenditure in 2013 totalled $4,288 million (2012 $7,230 million, 2011 $8,491 million). This
figure includes a credit of $66 million relating to the Gulf of Mexico oil spill. For reference, expenditure related to the Gulf of Mexico oil spill was a charge of $919 million in 2012 and $1,838 million in 2011. See page 252 for a breakdown of
environmental expenditure. See Regulation of the group’s business – Environmental regulation on page 254.
Oil spill preparedness and
response
We issued new group-wide requirements for oil spill preparedness and response planning, and crisis management in July 2012. These incorporate what we
have learned from the Deepwater Horizon accident. All of our businesses that have the potential to spill oil have been updating oil spill planning scenarios and response strategies in line with the requirements.
Meeting the requirements is a substantial piece of work and we believe this work has already resulted in a significant increase in our oil spill
|
|
|
| 44 |
|
BP Annual Report and Form 20-F 2013 |
response capability. For example, this includes using specialized modelling techniques and the provision of response
capabilities, such as stockpiles of dispersants and planning for major offshore recovery operations.
Enhancing response capabilities
Improving our existing oil spill modelling tools helps BP to better define different oil spill scenarios and associated response plans. For example,
following modelling for exploration in the Omani desert, we modified the planned location of pipelines to reduce the impact to groundwater if a spill were to occur.
We consider the environmental and socio-economic sensitivities of a region to help inform oil spill response planning. Sensitivity mapping helps us to identify the
various types of habitats, resources and communities that could potentially be impacted by oil spills and develop appropriate response strategies. Sensitivity mapping is conducted around the world and in 2013 we updated sensitivity maps in Angola,
Australia, Azerbaijan, Egypt, Libya, Trinidad & Tobago and the UK.
The use of dispersants is an important option in oil spill response planning. We have
gained a greater understanding of dispersants and their use as a response option through scientific research programmes. We are examining topics such as the effectiveness of dispersants in the deep ocean and the efficiency of naturally occurring
marine microbes to degrade dispersed oil in the Gulf of Mexico and in the seas of Australia, Azerbaijan and Egypt.
We seek to work collaboratively with government
regulators in planning for oil spill response, with the aim of improving any potential future response. For example, in 2013 we shared lessons on dispersant use, controlled burning response strategies and oil spill modelling with government
regulators in Azerbaijan, Brazil and Libya.
See page 42 for information on progress on the recommendations of BP’s internal investigation into the Deepwater
Horizon accident.
Climate change
Climate change
represents a significant challenge for society and the energy industry, including BP. In response to the challenges and opportunities, BP is taking a number of practical steps, such as increasing energy efficiency in our operations, factoring a
carbon cost into the investment and engineering decisions for new projects, and investing in lower-carbon energy products. We also require our operations to incorporate energy use considerations in their business plans and to assess, prioritize and
implement technologies and systems to improve energy usage.
Climate change adaptation
We consider and identify risks and potential impacts of a changing climate on our facilities and operations. Where climate change impacts are identified as a risk for a
new project, our engineers seek to address them in the project design like any other physical and ecological hazard. We periodically review and adjust existing design criteria and engineering technology practices.
Greenhouse gas emissions
We report on GHG
emissions on a carbon dioxide-equivalent (CO2e) basis. This includes CO2 and methane for direct emissions and CO2 for indirect emissions, which are associated with the purchase of electricity, heat or steam into our operations. Our GHG reporting encompasses all BP’s consolidated entities as well as our
share of equity-accounted entities other than BP’s share of TNK-BP and Rosneft. Rosneft’s emissions data can be found on its website.
Our approach to
calculating GHG emissions is aligned with the Greenhouse Gas Protocol and the IPIECA/API/OGP Petroleum Industry Guidelines for Reporting GHG Emissions. We calculate emissions based on the fuel consumption and fuel properties for major sources rather
than the use of generic emission factors. We do not include nitrous oxide, hydrofluorocarbons, perfluorocarbons and sulphur hexafluoride as they are not material and therefore it is not practical to collect this data.
Greenhouse gas emissions
|
|
|
|
|
|
|
|
|
|
|
|
|
| |
|
|
2013 |
|
|
|
2012 |
|
|
|
2011 |
|
| Direct GHG emissions (Mte CO2e) |
|
|
49.2 |
|
|
|
59.8 |
|
|
|
61.8 |
|
| Indirect GHG emissions (Mte CO2e) |
|
|
6.6 |
|
|
|
8.4 |
|
|
|
9.0 |
|
The decrease in our direct GHG emissions is primarily due to the divestment of our Texas City and Carson refineries.
Intensity
The ratio of our total greenhouse gas emissions
to adjusted revenue of those entities (or share of entities) included in our GHG reporting was 0.15kte/$million in 2013. Adjusted revenue reflects total revenues and other income, less gains on sales of businesses and fixed assets. Additionally, we
publish the ratios for greenhouse gas emissions to upstream production, refining throughput and chemicals produced at bp.com/greenhousegas.
Greenhouse gas regulation
In the future, we expect that additional regulation of GHG emissions aimed at addressing climate change will have
an increasing impact on our businesses, operating costs and strategic planning, but may also offer opportunities for the development of lower-carbon technologies and businesses.
Accordingly, we require larger projects, and those for which emissions costs would be a material part of the project, to apply a standard carbon cost to the projected GHG
emissions over the life of the project. The standard cost is based on our estimate of the carbon price that might realistically be expected in particular parts of the world. In industrialized countries, our standard cost assumption is currently $40
per tonne of CO2e. We use this cost as a basis for assessing the economic value of the investment and as one consideration in optimizing the way the project is engineered with respect to
emissions.
Water
BP recognizes the importance of
access to fresh water and the need to manage water discharges at our operations. We assess risks, such as water scarcity, wastewater disposal and the long-term social and environmental pressures on water resources within the local area.
We are investing in research with several universities in the US to help understand future risks in water management, such as the allocation and use of water in the
Middle East and the impact of water policies and regulation around the world.
Unconventional gas and hydraulic fracturing
Natural gas resources, including unconventional gas, have an increasingly important role in meeting the world’s growing energy needs. New technologies are making it
possible to extract unconventional gas resources safely, responsibly and economically. BP has unconventional gas operations in Algeria, Indonesia, Oman and the US.
Some stakeholders have raised concerns about the potential environmental and community impacts of hydraulic fracturing. BP seeks to apply responsible well design and
construction, surface operation and fluid handling practices to mitigate these impacts.
Water and sand constitute on average 99.5% of the injection fluid. This is
mixed with chemicals to create the fracturing fluid that is pumped underground at high pressure to fracture the rock, with the sand propping the fractures open. The chemicals used in the fracturing process help to reduce friction and control
bacterial growth in the well. Some of these chemicals when used in certain concentrations are classified as hazardous by the relevant regulatory authorities, and each chemical used in the fracturing process is listed in the material safety data
sheets kept at each operational site. We submit data on chemicals used at our hydraulically fractured wells in the US, to the extent allowed by our suppliers who own the chemical formulas, at fracfocus.org.
We aim to minimize air pollutant and greenhouse gas emissions by using responsible practices at our operating sites. For example, at our drilling sites in the US we use a
process called green completions, whenever possible, to manage methane emissions associated with well completions following hydraulic fracturing. This process recovers natural gas for sale and minimizes the amount of natural gas either flared or
vented from our wells.
|
|
|
|
|
| BP Annual Report and Form 20-F 2013 |
|
|
45 |
|

~
Environmental monitoring at our Terre de Grace oil sands lease area in Northern Alberta,
Canada.
We seek to design and locate our equipment and manage our work patterns in ways that reduce potential impacts to communities such as increased
traffic, noise, dust and light. We also listen to suggestions or complaints from nearby local communities and try to address their concerns.
More information about
our approach to unconventional gas and hydraulic fracturing may be found at bp.com/unconventionalgas.
Canada’s oil sands
Oil sands in Canada are the third-largest proven crude oil reserves in the world, after Saudi Arabia and Venezuela. About half of the world’s total oil
reserves that are open to private sector investment are contained in Canada’s oil sands. BP is involved in three oil sands lease areas, all of which are located in the province of Alberta. We expect the Sunrise Energy Project, operated by Husky
Energy, to be the first onstream with production expected to begin in late 2014. Engineering and appraisal activities are under way to design and plan the construction of the first phase of Pike, which is operated by Devon Energy. Terre de Grace,
which is BP-operated, is currently under appraisal for development.
Our decision to invest in Canadian oil sands projects takes into consideration GHG emissions,
impacts on land, water use, local communities and commercial viability. In the case of joint arrangements in which we are not the operator, we monitor both the progress of these projects and the mitigation of risk. In the Terre de Grace project
where we are the operator, we are responsible for managing these potential impacts and the mitigation of risk.
More information on BP’s investments in
Canada’s oil sands can be found at bp.com/oilsands.
Human rights
BP’s human rights policy, published in 2013, outlines our commitment to respect internationally-recognized human rights, as set out in the International Bill of
Human Rights and the International Labour Organization’s Declaration on Fundamental Principles and Rights at Work. The policy applies to all employees and officers in BP wholly owned entities and in joint arrangements to the extent possible and
reasonable given BP’s level of participation.
The United Nations Guiding Principles on Business and Human Rights outline specific responsibilities for
businesses in relation to human rights. We are committed to working towards aligning with the Guiding Principles using a risk-based approach. In 2013 our actions included:
| • |
|
Human rights workshops for senior leaders in Indonesia and the Middle East, with plans to roll these out in other high-priority regions. |
| • |
|
Inclusion of human rights in our impact assessment for the LNG expansion project in Tangguh, Indonesia. |
| • |
|
Collaboration with industry peers on the development of good practice guidance for integrating human rights into environmental and social impact assessments.
|
| • |
|
Participation in the work of oil and gas industry organization IPIECA’s taskforce on developing shared industry approaches to managing human rights risks in the supply chain. |
We plan to monitor the effectiveness of these actions. More information about our approach to human rights may be found at bp.com/humanrights.
Business ethics
Bribery and corruption are significant
risks in the oil and gas industry. Our code of conduct requires that our employees or others working on behalf of BP do not engage in bribery or corruption in any form, whether in the public or private sector. We operate a group-wide anti-bribery
and corruption standard, which applies to all BP employees and contractor staff. The standard requires annual bribery and corruption risk assessments; risk-based due diligence on all parties with whom BP does business; appropriate anti-bribery and
corruption clauses in contracts; and the training of personnel in anti-bribery and corruption measures. Our processes are designed to enable us to choose suppliers carefully on merit, avoiding conflicts of interest and inappropriate gifts and
entertainment.
We are working to respond effectively to the standards arising from the UK Bribery Act as well as other anti-corruption legislation such as the
Foreign Corrupt Practices Act and certain regulations promulgated under the Dodd-Frank Wall Street Reform and Consumer Protection Act (Dodd-Frank) in the US.
Financial transparency
As a member of the Extractive Industries Transparency Initiative (EITI), we work with governments, non-governmental
organizations and international agencies to improve transparency and disclosure of payments to governments. BP is supporting several countries that are working towards becoming EITI compliant.
In countries that have achieved EITI compliance, including Azerbaijan and Norway, BP submits an annual report on payments to their governments.
We have taken part in consultations in relation to new or proposed revenue transparency reporting requirements in the US and EU for companies in the extractive
industries. We are awaiting the publication of the revised rules of the Dodd-Frank legislation from the SEC and are preparing to comply with the disclosure requirements.
We are contributing to the consultation process initiated by the UK government in preparation for the adoption of the EU accounting directive into UK law.
Enterprise and community development
In a number of BP
locations, we run programmes to help build the skills of businesses and to develop the local supply chain. For example, we have helped some local companies reach the standards needed to supply BP and other organizations through training and sharing
of our standards in areas such as health and safety.
BP’s social investments, the contributions we make to social and community programmes in locations where we
operate, support development activities that aim for a meaningful and sustainable impact. We look for social investment opportunities that are relevant to local needs, aligned with BP’s business, and offer partnerships with local organizations.
In 2013, we contributed $78.8 million in social investment. More information about our social contribution can be found at bp.com/society.
|
|
|
| 46 |
|
BP Annual Report and Form 20-F 2013 |
Employees
BP seeks employees who have the right skills for their roles and who understand and embody the values and expected behaviours that guide everything
we do as a group.

BP headcount
|
|
|
|
|
|
|
|
|
|
|
|
|
| Number of employees at 31 Decembera |
|
|
US |
|
|
|
Non-US |
|
|
|
Total |
|
| 2013 |
|
|
|
|
|
|
|
|
|
|
|
|
| Upstream |
|
|
9,300 |
|
|
|
15,400 |
|
|
|
24,700 |
|
| Downstream |
|
|
8,300 |
|
|
|
39,700 |
|
|
|
48,000 |
|
| Other businesses and corporate |
|
|
1,900 |
|
|
|
9,200 |
|
|
|
11,100 |
|
| Gulf Coast Restoration Organization |
|
|
100 |
|
|
|
– |
|
|
|
100 |
|
| |
|
|
19,600 |
|
|
|
64,300 |
|
|
|
83,900 |
|
| 2012 |
|
|
|
|
|
|
|
|
|
|
|
|
| Upstream |
|
|
9,500 |
|
|
|
14,700 |
|
|
|
24,200 |
|
| Downstream |
|
|
11,900 |
|
|
|
39,900 |
|
|
|
51,800 |
|
| Other businesses and corporate |
|
|
1,900 |
|
|
|
8,400 |
|
|
|
10,300 |
|
| Gulf Coast Restoration Organization |
|
|
100 |
|
|
|
– |
|
|
|
100 |
|
| |
|
|
23,400 |
|
|
|
63,000 |
|
|
|
86,400 |
|
| 2011 |
|
|
|
|
|
|
|
|
|
|
|
|
| Upstream |
|
|
8,900 |
|
|
|
13,500 |
|
|
|
22,400 |
|
| Downstream |
|
|
12,000 |
|
|
|
39,500 |
|
|
|
51,500 |
|
| Other businesses and corporate |
|
|
1,900 |
|
|
|
8,200 |
|
|
|
10,100 |
|
| Gulf Coast Restoration Organization |
|
|
100 |
|
|
|
– |
|
|
|
100 |
|
| |
|
|
22,900 |
|
|
|
61,200 |
|
|
|
84,100 |
|
| a |
Reported to the nearest 100. |
As at the end of December 2013, we had 83,900 employees. This includes 14,100 service
station staff and 4,300 agricultural, operational and seasonal workers in Brazil. The numbers for 2011 and 2012 have been restated following the adoption of IFRS 11, see Financial statements – Note 1 for further information.
During 2013, 4,300 people left BP through divestments, while there was an increase in seasonal workers in our biofuels business – resulting in an overall headcount
decrease of 3% from 2012.
Our values
Our values of
safety, respect, excellence, courage and one team align explicitly with BP’s code of conduct and translate into the responsible actions necessary for the work we do every day. Our values represent the qualities and actions we wish to see in BP,
they guide the way we do business and the decisions we make. We are embedding BP’s values into many of our group-wide systems and processes, including our recruitment, promotion and development assessments. See bp.com/values for more
information.
People policies
We are focused on protecting the safety of our employees, engaging with them, and increasing the diversity of our workforce so that it reflects the societies in which we
operate.
The group people committee, chaired by the group chief executive, has overall responsibility for key policy decisions relating to employees. The committee
is responsible for governance of BP’s people management processes. The committee discussed longer-term people priorities, reward, progress in our diversity and inclusion programme, recruitment priorities (including graduate recruitment), and
improvements to our learning and development programmes in 2013.
Attracting and retaining our people
The increasing demand for energy products and the complexity of our projects means that attracting and retaining skilled and talented people is vital to the delivery of
our strategy and plans. We want to develop the skills we need from within our existing workforce and we complement this with targeted external recruitment.
To
address increasing demand for skilled people across the globe, 44% of our graduate recruitment came from universities outside the UK and US in 2013. We invest in universities worldwide to further develop the quality of our potential recruits.
We conduct external assessments for all new hires into BP at senior levels and for internal promotions to senior level and group leader level roles. These assessments
help achieve rigour and objectivity in our hiring and talent processes. They give an in-depth analysis of leadership behaviour, intellectual capacity and the required experience and skills for the role being considered.
Building enduring capability
We provide
development opportunities for all our employees, including international assignments, mentoring, team development days, workshops, seminars and online learning.
We
continue to work to embed appropriate leadership skills throughout our organization. By 2013 our group-wide suite of leadership development programmes had been attended by employees from 32 countries and were conducted in six different languages.
We provide leading education opportunities for our people through our internal academies and institutes that deliver leadership development, technical learning and
compliance programmes.
Diversity
We are a
global company and aim for a workforce that is representative of the societies in which we operate.
We have set out our ambitions for diversity and our group people
committee reviews performance on a quarterly basis. We aim for 25% of our group leaders – the most senior managers of our businesses and functions – to be women by 2020.
Workforce by gender
|
|
|
|
|
|
|
|
|
|
|
|
|
| Numbers as at 31 December |
|
|
Male |
|
|
|
Female |
|
|
|
Female % |
|
| Board directors |
|
|
12 |
|
|
|
2 |
|
|
|
14 |
|
| Group leaders |
|
|
477 |
|
|
|
105 |
|
|
|
18 |
|
| Subsidiary directors |
|
|
494 |
|
|
|
107 |
|
|
|
18 |
|
| All employees |
|
|
58,500 |
|
|
|
25,400 |
|
|
|
30 |
|
At the end of 2013, 22% of our group leaders came from countries other than the UK and the US. We continue to increase the number of local
leaders and employees in our operations so that they reflect the communities in which we operate and this is monitored at a local, business or national level.
We
support the UK government-commissioned Lord Davies review which recommends increasing gender diversity on the boards of listed companies. See page 70 for information on our board composition.
Inclusion
Our goal is to create an environment of
inclusion and acceptance. For our employees to be motivated and to perform to their full potential, and for the business to thrive, our people need to be treated with respect and dignity, and without discrimination.
|
|
|
|
|
| BP Annual Report and Form 20-F 2013 |
|
|
47 |
|
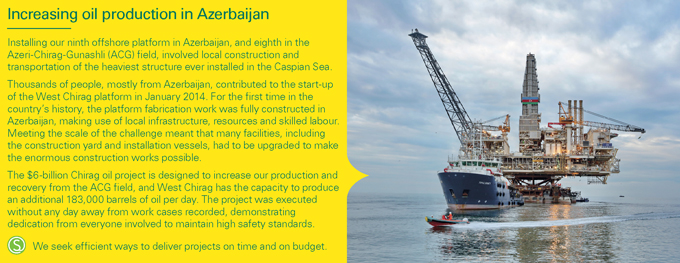
We aim to ensure equal opportunity in recruitment, career development, promotion, training and reward for all employees,
including women; ethnic minorities and different nationalities; lesbian, gay, bisexual and transgender people; those with disabilities; and people of all ages. Where existing employees become disabled, our policy is to provide continuing employment
and training wherever possible.
Employee engagement
Executive team members hold regular town hall style meetings and webcasts to communicate with our employees around the world. Team meetings and one-to-one meetings are
complemented by formal processes through works councils in parts of Europe. We seek to maintain constructive relationships with labour unions.
We conduct an annual
engagement survey among our employees. In 2013 approximately 37,000 employees in more than 70 countries gave their views on a wide range of business topics and to identify areas where we can improve.
We measure how engaged our employees are with our strategic priorities. The group priorities index is derived from 12 questions about employee perceptions of BP as a
company and how it is managed in terms of leadership and standards. We saw continued improvement in 2013 with a score of 72% (2012 71%, 2011 67%).
Business
leadership teams review the results of the survey and agree actions to address identified issues. In 2013, safety scores remained strong and there was an increase in employees’ understanding of the operating management system, an area of focus
identified in the previous year. While the survey showed an increase in employee confidence in BP’s leadership, work is needed to further strengthen this.

~
Global business services (GBS) supports BP’s business processes across the globe. Here, members of the family day organizing committee in
Malaysia prepare the registration booth.
Share ownership
We encourage employee share ownership. For example, through our ShareMatch plan, which operates in more than 50 countries, we match BP shares purchased by our employees.
We operate a single company-wide equity plan, which allows employee participation at different levels globally and is linked to the company’s performance.
The BP code of conduct
The BP code of conduct sets the standard that all BP employees are required to work to. It is based on our values and
it clarifies the ethics and compliance expectations for everyone who works at BP. The code defines what BP expects of its people in key areas such as safety, workplace behaviour, bribery and corruption and financial integrity.
Employees, contractors or other third parties who have concerns that laws, regulations or the code of conduct may be breached, can get help through OpenTalk, a helpline
operated by an independent company. The number of cases raised through OpenTalk in 2013 was 1,121 (2012 1,295, 2011 796). The increase in OpenTalk cases over the past few years is due, in part, to initiatives to promote our code of conduct and speak
up culture. This is supported by high scores in our employee engagement survey relating to employee understanding of the importance of speaking up. The most common issues raised in 2013 related to the people section of the code. This includes
treating people fairly, with dignity and giving everyone equal opportunity; creating a respectful, harassment-free workplace; and protecting privacy and confidentiality.
In the US, former district court judge Stanley Sporkin acts as an ombudsperson. Employees and contractors can contact him confidentially to report any suspected breach of
compliance, ethics or the code of conduct, including safety concerns.
We take steps to identify and correct areas of non-compliance and take disciplinary action
where appropriate. In 2013, 113 employee dismissals were reported by BP’s businesses for non-adherence to the code of conduct or unethical behaviour. This excludes dismissals of staff employed at our retail service station sites, for incidents
such as thefts of small amounts of money.
Following legal settlements with the US government in 2012, BP agreed to retain an ethics monitor for a term of up to four
years from 2013. The ethics monitor will review and provide recommendations concerning BP’s ethics and compliance programme (see page 39).
Policy on political activity
BP has a policy of not
participating directly in party political activity as a group or making any contributions to political candidates, whether in cash or in kind. Employees’ rights to participate in political activity are governed by the applicable laws in the
countries in which we operate. For example, in the US, BP supports the operation of the BP employee political action committee to facilitate employee involvement and to assess whether contributions comply with the law and are publicly disclosed.
|
|
|
| 48 |
|
BP Annual Report and Form 20-F 2013 |
Our management of risk
BP manages, monitors and reports on the principal risks and uncertainties that can impact our ability to deliver our strategy of meeting the world’s energy needs
responsibly while creating long-term shareholder value; these risks are described in the Risk factors on page 51.
Our management systems, organizational structures,
processes, standards, code of conduct and behaviours together form a system of internal control that governs how we conduct the business of BP and manage associated risks.
BP’s risk management system
BP’s risk
management system is designed to be a simple, consistent and clear framework for managing and reporting risks from the group’s operations to the board. The system seeks to avoid incidents and maximize business outcomes by allowing us to:
| • |
|
Understand the risk environment, and assess the specific risks and potential exposure for BP. |
| • |
|
Determine how best to deal with these risks to manage overall potential exposure. |
| • |
|
Manage the identified risks in appropriate ways. |
| • |
|
Monitor and seek assurance of the effectiveness of the management of these risks and intervene for improvement where necessary. |
| • |
|
Report up the management chain to the board on a periodic basis about how risks are being managed, monitored, assured and the improvements that are being made. |
Our risk management activities
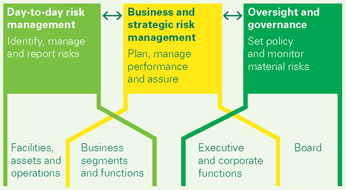
Day-to-day risk management –
management and staff at our facilities, assets and functions identify and manage risk, promoting safe, compliant and reliable operations. For example, our group-wide operating management system (OMS)
integrates BP requirements on health, safety, security, environment, social responsibility, operational reliability and related issues. These BP requirements, along with business needs and the applicable legal and regulatory requirements, underpin
the practical plans developed to help reduce risk and deliver strong, sustainable performance.
Business and
strategic risk management – our businesses and functions integrate risk into key business processes such as strategy, planning, performance management, resource and capital allocation, and project
appraisal. We do this by collating risk data, assessing risk management activities, making further improvements and planning new activities. By using a standardized risk management report, we aim for a consistent view of risks across BP.
Oversight and governance – the board, executive and functional
leadership provide oversight to identify and understand significant risks to BP. They also put in place systems of risk management, compliance and control to mitigate these risks. Executive committees set policy and oversee the management of group
risks, and dedicated board committees review and monitor certain risks throughout the year.
BP’s group risk team analyses the group’s risk profile and maintains the group risk management system. Our group
audit team provides independent assurance to the group chief executive and board, through its committees, over whether the group’s system of internal control is adequately designed and operating effectively to respond appropriately to the risks
that are significant to BP.
Risk governance and oversight
Key risk governance and oversight committees include the following:
|
|
|
| Executive committees |
| g Executive team meeting – for strategic and commercial risks.
g Group operations risk committee – for health, safety, security, environment and operations integrity risks.
g Group financial risk committee – for finance, treasury, trading and cyber risks.
g Group disclosure committee – for financial reporting risks.
g Group people committee – for employee risks.
g
Resource commitment meeting – for risks related to investment decisions.
g
Group ethics and compliance committee – for risks associated with legal and regulatory compliance and ethics. |
| Board and its committees |
| g BP board.
g
Audit committee. g Safety, ethics and environment assurance committee.
g Gulf of Mexico committee. |

|
|
Board committees |
| |
For information on the board and its committees see page 71.
|
Our risk profile
The nature of our business operations is long term, resulting in many of our identified risks being enduring in nature. Nonetheless, risks can develop and evolve over
time and their potential impact or likelihood may vary in response to internal and external events.
As part of BP’s annual planning process, we review the
principal risks and uncertainties to the group. We identify those as having a high priority for particular oversight by the board and its various committees in the coming year; the risks identified for particular review in 2014 are listed below.
These may be updated throughout the year in response to changes in internal and external circumstances. The oversight and management of the other risks is undertaken in the normal course of business – throughout the business and in executive
and board committees.
Further details of the principal risks and uncertainties we face are set out in the Risk factors on page 51. There can be no guarantee that our
risk management activities will mitigate or prevent these, or other, risks from occurring.
There is a wide range of risks arising out of the Gulf of Mexico accident and oil spill. These include legal, operational, reputational
and compliance risks.
BP’s management and mitigation of these risks is overseen by the board’s Gulf of Mexico committee, which seeks to ensure that BP
fulfils all legitimate obligations whilst protecting and defending BP’s interests.
|
|
|
|
|
| BP Annual Report and Form 20-F 2013 |
|
|
49 |
|
The committee’s responsibilities include oversight and review of the following activities: the legal strategy for
litigation; investigations and suspension and debarment actions arising from the accident and oil spill; the strategy connected with settlements and claims; the environmental work to remediate or mitigate the effects of the oil spill; management
strategy and actions to restore the group’s reputation in the US; and compliance with government settlement agreements arising out of the accident and oil spill.
See Legal proceedings page 257 and Gulf of Mexico committee page 78 for further information.
|
| Strategic and commercial risks |
10-point plan
In
2011 we set out a 10-point plan to address our priorities through 2014. Among other things, the plan aims to focus on safety and risk management, efficient investments and disposals, successful delivery of operating cashflows, renewal and
repositioning of our portfolio, and delivery of our major projects to plan. We conduct regular planning and performance monitoring activity as part of managing the risks to delivery of this plan. For an update on our progress against the plan see
page 22.
Geopolitical
The diverse locations
of our operations around the world expose us to a wide range of political developments and consequent changes to the economic and operating environment. Geopolitical risk is inherent to many regions in which we operate; heightened political or
social tensions or changes in key relationships could adversely affect the group. We seek to manage this risk actively through the development and maintenance of relationships with governments and stakeholders in each country and region. In
addition, we closely monitor events (such as the situation that arose in the Ukraine in February 2014) and implement risk mitigation plans where appropriate.
Cybersecurity
The threats to the security of our digital infrastructure continue to evolve and, like many other global organizations,
our reliance on computers and network technology is increasing. A cybersecurity breach could have a significant impact on business operations. We seek to manage this risk through cybersecurity standards, ongoing monitoring of threats, close
co-operation with authorities and awareness initiatives throughout the company. We also maintain disaster recovery, crisis and business continuity management plans.
|
| Compliance and control risks |
Ethical misconduct and legal or regulatory non-compliance
Ethical misconduct or breaches of applicable laws or regulations could damage our reputation, adversely affect operational results and shareholder value, and potentially
affect our licence to operate. Our code of conduct and our values and behaviours, applicable to all employees, are central to managing this risk. Additionally, we have various group requirements covering areas such as anti-bribery and corruption,
anti-money laundering, competition/anti-trust law and trade sanctions. We keep abreast of new regulations and legislation and plan our response to them. We also operate a range of compliance training and monitoring programmes for our employees. We
offer an independent confidential helpline, OpenTalk, for employees, contractors and other third parties. For information on our code of conduct, see page 48.
Under
the terms of the US Department of Justice settlement (see Legal proceedings on page 257), an ethics monitor will also review and provide recommendations concerning BP’s ethics and compliance programme.
Trading non-compliance
In the normal course of
business, we are subject to risks around our trading activities which could arise from shortcomings or failures in our systems, risk management methodology, internal control processes or employees. We have specific operating standards and control
processes to address these risks, including guidelines in relation to trading, and we seek to monitor compliance through our dedicated compliance teams. We also seek to maintain a positive and collaborative relationship with regulators and the
industry at large.
|
| Safety and operational risks |
Process safety, personal safety and environmental risks
The nature of the group’s operations exposes us to a wide range of significant health, safety and environmental risks such as incidents associated with releases of
hydrocarbons when drilling wells, operating facilities and transporting hydrocarbons. We apply our operating management system (OMS), including group and engineering technical practices as applicable, to address these risks. See page 41 for more
information on safety and our OMS. Activities include inspection, maintenance, testing, business continuity and crisis response planning, and competency development for our employees and contractors. In addition, we conduct our drilling activity
through a global wells organization in order to promote a consistent approach for designing, constructing and managing wells.
Security
Hostile acts such as terrorism or piracy could harm our people and disrupt our operations. We monitor for emerging threats and vulnerabilities to manage
our physical and digital security. Physical security threats tend to vary geographically and by type of business. Our central security team provides guidance and support to a network of regional security advisers who advise and conduct assurance
with respect to the management of security risks affecting our people and operations. We also maintain disaster recovery, crisis and business continuity management plans.
|
|
|
| 50 |
|
BP Annual Report and Form 20-F 2013 |
Risk factors
We urge you to consider carefully the risks described below. The potential impact of the occurrence, or recurrence, of any of the risks described below could have a
material adverse effect on BP’s business, financial position, results of operations, competitive position, cash flows, prospects, liquidity, shareholder returns and/or implementation of its strategic agenda, including the 10-point plan.
The risks are categorized against the following areas: strategic and commercial; compliance and control; and safety and operational. In addition, we have set out one
separate risk for your attention – the risk resulting from the 2010 Gulf of Mexico oil spill.
The spill has had and could continue to have a material adverse impact on BP.
There is significant uncertainty regarding the extent and timing of the remaining costs and liabilities relating to the 2010 Gulf of Mexico oil spill (the Incident), the
impact of the Incident on our reputation and the resulting possible impact on our licence to operate including our ability to access new opportunities. The amount of claims, fines and penalties that become payable by BP (including as a result of any
potential determination of BP’s negligence or gross negligence), the outcome of litigation, the terms of any further settlements including the amount and timing of any payments thereunder, and any costs arising from any longer-term
environmental consequences of the Incident, will also impact upon the ultimate cost for BP. These uncertainties are likely to continue for a significant period and may cause our costs to increase materially. Thus, the Incident has had, and could
continue to have, a material adverse impact on the group’s business, competitive position, financial performance, cash flows, prospects, liquidity, shareholder returns and/or implementation of its strategic agenda, particularly in the US. The
risks associated with the Incident could also heighten the impact of the other risks to which the group is exposed as further described below. See, in particular, Access and renewal; Liquidity, financial capacity and financial, including credit,
exposure; Insurance; US government settlements and debarment; Regulatory; Liabilities and provisions; Reporting; and Process safety, personal safety and environmental risks below.
|
| Strategic and commercial risks |
Access and renewal – BP’s future hydrocarbon production depends on our ability to renew and
reposition our portfolio. Increasing competition for access to investment opportunities and the effects of the Incident on our reputation and cash flows could result in decreased access to opportunities globally.
Successful execution of our group strategy depends on implementing activities to renew and reposition our portfolio. The challenges to renewal of our upstream portfolio
are growing due to increasing competition for access to opportunities globally among both national and international oil companies, and heightened political and economic risks in certain countries where significant hydrocarbon basins are located.
Lack of material positions could impact our future hydrocarbon production.
Moreover, the Incident has affected BP’s reputation, which may have a long-term
impact on the group’s ability to access new opportunities, both in the US and elsewhere. Adverse public, political, regulatory and industry sentiment towards BP, and towards oil and gas drilling activities generally, could damage or impair our
existing commercial relationships with counterparties, partners and host governments and could impair our access to new investment opportunities, exploration properties, operatorships or other essential commercial arrangements with potential
partners and host governments, particularly in the US. In addition, costs and liabilities relating to the Incident have placed, and will continue to place, a significant burden on our cash flow, which could impede our ability to invest in new
opportunities and deliver long-term growth.
Prices and markets – BP’s financial performance is subject to the fluctuating prices
of crude oil and gas, the volatile prices of refined products and the profitability of our refining and petrochemicals operations, as well as exchange rate fluctuations and the general macroeconomic outlook.
Oil, gas and product prices and margins can be very volatile, and are subject to international supply and demand. Political developments (including conflict situations),
increased supply from the development of new oil and gas sources, technological change, global economic conditions and the influence of OPEC can particularly affect world supply and oil prices. Previous oil price increases have resulted in increased
fiscal take, cost inflation and more onerous terms for access to resources. As a result, increased oil prices may not improve margin performance. Decreases in oil, gas or product prices are likely to have an adverse effect on revenues, margins and
profitability, and a material rapid change, or a sustained change, in oil, gas or product prices may mean investment or other decisions need to be reviewed, assets may be impaired, and the viability of projects may be affected. A prolonged period of
low oil prices may impact our cash flow, profit and ability to maintain our long-term investment programme with a consequent effect on our growth rate, and may impact shareholder returns, including dividends and share buybacks, or share price.
Refining profitability can be volatile, with both periodic over-supply and supply tightness in various regional markets, coupled with fluctuations in demand. Sectors of
the petrochemicals industry are also subject to fluctuations in supply and demand, with a consequent effect on prices and profitability.
Crude oil prices are
generally set in US dollars, while sales of refined products may be in a variety of currencies. In addition, a high proportion of our major project development costs are denominated in local currencies, which may be subject to volatile fluctuations
against the US dollar. Fluctuations in exchange rates can therefore give rise to foreign exchange exposures, with a consequent impact on underlying costs and revenues.
Periods of global recession or prolonged instability in financial markets could negatively impact parties with whom we do or may do business, the demand for our products
and the prices at which they can be sold and could affect the viability of the markets in which we operate.
Climate change and carbon
pricing – climate change and carbon pricing policies could result in higher costs and reduction in future revenue and strategic growth opportunities.
Compliance with changes in laws, regulations and obligations relating to climate change could result in substantial capital expenditure, taxes, reduced profitability from
changes in operating costs, potential restrictions on the commercial viability of, or our ability to progress, upstream resources and reserves, and impacts on revenue generation and strategic growth opportunities. In addition, the changed nature of
our participation in alternative energies could carry reputational, economic and technology risks.
Geopolitical – the diverse
nature of our operations around the world exposes us to a wide range of political developments and consequent changes to the operating environment, regulatory environment and law.
We have operations, and are seeking new opportunities, in countries and regions where political, economic and social transition is taking place. Some countries have
experienced, or may experience in the future, political instability, changes to the regulatory environment, changes in taxation, expropriation or nationalization of property, civil strife, strikes, acts of terrorism, acts of war and insurrections.
Any of these conditions occurring could disrupt or terminate our operations, causing our development activities to be curtailed or terminated in these areas, or our production to decline, could limit our ability to pursue new opportunities, could
affect the recoverability of our assets and could cause us to incur additional costs. See page 4 for information on the locations of our major areas of operation and activities.
We set ourselves high standards of corporate citizenship and aspire to contribute to a better quality of life through the products and services we provide. If it is
perceived that we are not respecting or advancing the economic and social progress of the communities in which we operate or that we have not satisfactorily addressed all relevant stakeholder concerns
|
|
|
|
|
| BP Annual Report and Form 20-F 2013 |
|
|
51 |
|
in respect of our operations, our reputation and shareholder value could be damaged and development opportunities may be
precluded.
Competition – BP’s group strategy depends upon continuous innovation and efficiency in a highly competitive market.
The oil, gas and petrochemicals industries are highly competitive. There is strong competition, both within the oil and gas industry and with other
industries, in supplying the fuel needs of commerce, industry and the home. Competition puts pressure on the terms of access to new opportunities, licence costs and product prices, affects oil products marketing and requires continuous management
focus on improving efficiency, while ensuring safety and operational risk is not compromised. The implementation of group strategy requires continued technological advances and innovation including advances in exploration, production, refining,
petrochemicals manufacturing technology and advances in technology related to energy usage. Our performance could be impeded if competitors developed or acquired intellectual property rights to technology that we require, if our innovation lagged
the industry, or if we fail to adequately protect our company brands and trade marks. Our competitive position in comparison to our peers could be adversely affected if competitors offer superior terms for access rights or licences, if we fail to
control our operating costs or manage our margins, or if we fail to sustain, develop and operate efficiently a high quality portfolio of assets.
Joint and other contractual arrangements – BP may not have full operational control and may have exposure to counterparty credit risk
and disruptions to our operations and strategic objectives due to the nature of some of its business relationships.
Many of our major projects and operations
are conducted through joint arrangements or associates and through contracting and sub-contracting arrangements. These arrangements often involve complex risk allocation, decision-making processes and indemnification arrangements, and BP has less
control of such activities than we would have if BP had full ownership and operational control. Our partners may have economic or business interests or objectives that are inconsistent with, or opposed to, those of BP and may exercise veto rights to
block certain key decisions or actions that BP believes are in its or the joint arrangement’s or associate’s best interests, or approve such matters without our consent. Additionally, our joint arrangement partners or associates or
contractual counterparties are primarily responsible for the adequacy of the human or technical competencies and capabilities which they bring to bear on the joint project and, in the event these are found to be lacking, then safety, the performance
of the project and BP’s costs may be adversely affected. Our joint arrangement partners or associates may not be able to meet their financial or other obligations to their counterparties or to the relevant project, potentially threatening the
viability of such projects. Furthermore, should accidents or incidents occur in operations in which BP participates, whether as operator or otherwise, and where it is held that our sub-contractors or joint arrangement partners are legally liable to
share any aspects of the cost of responding to such incidents, the financial capacity of these third parties may prove inadequate to fully indemnify BP against the costs we incur on behalf of the joint or contractual arrangement. Should a key
sub-contractor, such as a lessor of drilling rigs, no longer be able to make these assets available to BP, this could result in serious disruption to our operations. Where BP does not have operational control of a venture, BP may nonetheless still
be pursued by regulators or claimants in the event of an incident.
Rosneft investment – any future erosion of our relationship with Rosneft could adversely
impact our business, strategic objectives, the level of our reserves and our reputation.
On 21 March 2013, we completed the sale of our 50% interest in
TNK-BP to Rosneft and the purchase of additional shares in Rosneft. We now own a total shareholding in Rosneft of 19.75%. To the extent we fail to maintain a good commercial relationship with Rosneft in the future, or to the extent that as a
non-controlling shareholder in Rosneft we are unable in the future to exercise significant influence over our investment in Rosneft or other growth opportunities in Russia, our business and strategic objectives in Russia and our ability to recognize
our share of Rosneft’s reserves may be adversely impacted.
Investment efficiency – poor investment decisions could negatively
impact our business.
Our organic growth is dependent on creating a portfolio of quality options and investing in the best options. Ineffective group strategy,
investment selection and/or subsequent execution could lead to loss of opportunity, loss of value and higher capital expenditure.
Reserves
progression – inability to progress upstream resources in a timely manner could adversely affect our long-term replacement of reserves and negatively impact our business.
Successful execution of our group strategy depends critically on sustaining long-term reserves replacement. If upstream resources are not progressed in a timely and
efficient manner due to commercial, technical, regulatory or other reasons, we will be unable to sustain long-term replacement of reserves.
Major project delivery – our group plan depends upon successful delivery of major projects, and failure to deliver major projects
successfully could adversely affect our financial performance.
Successful execution of our group plan depends critically on implementing the activities to
deliver major projects over the plan period. Poor delivery of or operational challenges at any major project that underpins production or production growth and/or any other major programme designed to enhance shareholder value, including maintenance
turnaround programmes, could adversely affect our financial performance and our operating cash flows.
Digital infrastructure – a
breach of our digital security or a failure of our digital infrastructure could result in serious damage to business operations, personal injury, damage to assets, harm to the environment, reputational damage, breaches of regulations, litigation,
legal liabilities and reparation costs.
The reliability and security of our digital infrastructure are critical to maintaining the availability of our
business applications, including the reliable operation of technology in our various business operations and the collection and processing of financial and operational data, as well as the confidentiality of certain third-party information. A breach
of our digital security or failure of our digital infrastructure, due to intentional actions such as cyber-attacks, negligence or otherwise, could cause serious damage to business operations and, in some circumstances, could result in the loss of
data or sensitive information, injury to people, loss of control of or damage to assets, harm to the environment, reputational damage, breaches of regulations, litigation, legal liabilities and reparation costs.
Crisis management, business continuity and disaster recovery – the group must be able to respond to and recover quickly and effectively
from any disruption or incident, as failure to do so could adversely affect our business and operations.
Crisis management and contingency plans are required
to respond to, and to continue or recover operations following, a disruption or an incident. If we do not respond, or are perceived not to respond, in an appropriate manner to either an external or internal crisis, our business and operations could
be severely disrupted. Inability to restore or replace critical capacity to an agreed level within an agreed timeframe would prolong the impact of any disruption and could severely affect our business and operations.
|
|
|
| 52 |
|
BP Annual Report and Form 20-F 2013 |
People and capability – successful recruitment, development and utilization of staff is
central to our plans.
Successful recruitment of new staff, employee training, development and continuing enhancement of skills, in particular technical
capabilities such as petroleum engineers and scientists, are key to implementing our plans. Inability to develop and retain human capacity and capability, both across the organization and in specific operating locations, could jeopardize performance
delivery. The group relies on recruiting and retaining high-quality employees to execute its strategic plans and to operate its business.
In addition, significant
board and management focus continues to be required in responding to matters related to the Incident. Although BP set up the Gulf Coast Restoration Organization to manage the group’s long-term response, other key management personnel will need
to continue to devote substantial attention to addressing the associated consequences for the group, which may negatively impact our staff’s capability to address and respond to other operational matters affecting the group but unrelated to the
Incident.
Liquidity, financial capacity and financial, including credit, exposure – failure to operate within our financial
framework could impact our ability to operate and result in financial loss.
The group seeks to maintain a financial framework to ensure that it is able to
maintain an appropriate level of liquidity and financial capacity, and commercial credit risk is measured and controlled to determine the group’s total credit risk. Failure to accurately forecast, manage or maintain sufficient liquidity and
credit to meet our needs (including a failure to understand and respond to potential liabilities) could impact our ability to operate and result in a financial loss. Trade and other receivables, including overdue receivables, may not be recovered
whether an impairment provision has been recognized or not. Inability to determine adequately our credit exposure could lead to financial loss. Furthermore, a substantial and unexpected cash call or funding request could disrupt our financial
framework or overwhelm our capacity to meet our obligations.
External events could materially impact the effectiveness of the group’s financial framework. A
credit crisis or significant economic shock affecting banks and other sectors of the economy could impact the ability of counterparties to meet their financial obligations to the group. It could also affect our ability to raise capital to fund
growth, to maintain our long-term investment programme and to meet our obligations, and may impact shareholder returns, including dividends and share buybacks, or share price. Decreases in the funded levels of our pension plans may also increase our
pension funding requirements.
In addition, a significant operational incident could result in decreases in our credit ratings which, together with the assessments
published by analysts, the reputational consequences of any such incident and concerns about the group’s costs arising from any such incident, ongoing contingencies, liquidity, financial performance and credit spreads, could increase the
group’s financing costs and limit the group’s access to financing. The group’s ability to engage in both its trading activities and non-trading businesses could also be impacted in such circumstances due to counterparty concerns about
the group’s financial and business risk profile and resulting collateral demands, which could be significant. In addition, BP may be unable to make a drawdown under certain of its committed borrowing facilities in the event that we are aware
that there are pending or threatened legal, arbitration or administrative proceedings which, if determined adversely, might reasonably be expected to have a material adverse effect on our ability to meet the payment obligations under any of these
facilities. Credit rating downgrades could trigger a requirement for the company to review its funding arrangements with the BP pension trustees. Any extended constraints on the group’s ability to obtain financing and to engage in its trading
activities on acceptable terms (or at all) would put pressure on the group’s liquidity. If such constraints occur at a time when cash flows from our business operations are constrained, such as following a significant operational incident, the
group could be required to reduce planned capital expenditures and/or increase asset disposals in order to provide additional liquidity, as the group did following the Incident.
See Financial statements – Note 19 for more information on financial instruments and financial risk factors.
Insurance – The limited capacity of the insurance market and BP’s insurance strategy
could, from time to time, expose the group to material uninsured losses which could have a material adverse effect on BP’s financial condition and results of operations.
In the context of the limited capacity of the insurance market, many significant risks are retained by BP. The group generally restricts its purchase of insurance to
situations where this is required for legal or contractual reasons. This means that the group could be exposed to material uninsured losses, which could have a material adverse effect on its financial condition and results of operations. In
particular, these uninsured costs could arise at a time when BP is facing material costs arising out of some other event which could put pressure on BP’s liquidity and cash flows. For example, BP has borne and may continue to bear the entire
burden of its share of any property damage, well control, pollution clean-up and third-party liability expenses arising out of the Incident.
|
| Compliance and control risks |
US government settlements and debarment – our settlement with the US Department of Justice and the SEC
in respect of certain charges related to the Incident may expose us to further penalties, liabilities and private litigation, and may impact our operations and adversely affect our ability to quickly and efficiently access US capital markets.
On 15 November 2012, BP reached an agreement with the US government to resolve all federal criminal and securities claims arising out of the Incident and
comprising settlements with the US Department of Justice (DoJ) and the SEC. For a description of the terms of the DoJ and SEC settlements, see Legal proceedings on page 264. Under the DoJ settlement, BP has agreed to retain an independent
third-party auditor who will review and report to the probation officer, the DoJ, and BP regarding BP Exploration & Production’s (BPXP) compliance with the key terms of the settlement including the completion of safety and
environmental management systems audits, operational oversight enhancements, oil spill response training and drills and the implementation of best practices. The DoJ settlement also provides for the appointment of an ethics monitor and a process
safety monitor. See Gulf of Mexico oil spill on page 39. The DoJ criminal and SEC settlements impose significant compliance and remedial obligations on BP and its directors, officers and employees. Failure to comply with the terms of these
settlements could result in further enforcement action by the DoJ and the SEC, expose BP to severe penalties, financial or otherwise, and subject BP to further private litigation, each of which could impact our operations and have a material adverse
effect on the group’s business.
The US Environmental Protection Agency (EPA) has temporarily suspended a number of BP entities from participating in new federal
contracts and subjected BPXP to mandatory debarment at its Houston headquarters. In addition, the EPA has initiated administrative proceedings to convert the temporary suspension of these BP entities into discretionary debarment. On 26 November
2013, the EPA issued a Notice of Continued Suspensions and Proposed Debarments that continued the suspensions of the previously suspended BP entities, suspended two new BP entities (BP Alternative Energy and BP Pipelines (Alaska) Inc.), and proposed
discretionary debarment of all suspended BP entities. Both temporary suspension and mandatory debarment prevent a company from entering into new contracts or new leases with the US government that would be performed at the facility where a Clean
Water Act violation occurred. See Legal proceedings on page 264. BP has a significant amount of operations in the US. See Upstream on page 25 and Oil and gas disclosures for the group on page 245. Prolonged suspension or debarment from entering new
federal contracts, or further suspension or debarment proceedings in the future against BP and/or its subsidiaries as a result of violations of the terms of the DoJ or SEC settlements or otherwise, could have a material adverse impact on the
group’s operations in the US in the future. In particular, prolonged suspension or debarment could prevent BP from accessing and developing material new oil and gas resources located in the US, or prevent BP from engaging in certain development
arrangements with third parties that are standard in the oil and gas industry, which could make the development of certain of BP’s existing reserves located in the US less commercially attractive than if relevant BP entities were not suspended
or debarred.
|
|
|
|
|
| BP Annual Report and Form 20-F 2013 |
|
|
53 |
|
As a result of the SEC settlement, as of 5 February 2013 and for a period of three years thereafter, we are no longer
qualified as a ‘well known seasoned issuer’ (WKSI) as defined in Rule 405 of the Securities Act of 1933, as amended (Securities Act), and therefore will not be able to take advantage of the benefits available to a WKSI, including engaging
in delayed or continuous offerings of securities using an automatic shelf registration statement. In addition, as of the SEC settlement date of 10 December 2012 and for a period of five years thereafter, we are no longer able to utilize certain
registration exemptions provided by the Securities Act in connection with certain securities offerings. We also may be denied certain trading authorizations under the rules of the US Commodities Futures Trading Commission, which may prevent us in
the future from entering certain routine swap transactions for an indefinite period of time.
Regulatory – BP, and the oil industry
in general, face increased regulation in the US and elsewhere that could increase the cost of regulatory compliance, affect the adequacy of our provisions and limit our access to new exploration properties.
The oil industry in general is subject to regulation and intervention by governments throughout the world in such matters as the award of exploration and production
interests, the imposition of specific drilling obligations, environmental, health and safety controls, controls over the development and decommissioning of a field (including restrictions on production) and, possibly, nationalization, expropriation,
cancellation or non-renewal of contract rights. The oil industry is also subject to the payment of royalties and taxation, which tend to be high compared with those payable in respect of other commercial activities, and operates in certain tax
jurisdictions that have a degree of uncertainty relating to the interpretation of, and changes to, tax law. We remain exposed to changes in the regulatory and legislative environment, such as new laws and regulations (whether imposed by
international treaty or by national or local governments in the jurisdictions in which we operate), changes in tax or royalty regimes, price controls, the imposition of trade or other sanctions, government actions to cancel or renegotiate contracts
or other factors. Governments are facing greater pressure on public finances, which may increase their motivation to intervene in the fiscal and regulatory frameworks of the oil and gas industry and we remain exposed to increases in amounts payable
to governments or government agencies. Such factors could reduce our profitability from operations in certain jurisdictions, limit our opportunities for new access, require us to divest or write-down certain assets or curtail or cease certain
operations, or affect the adequacy of our provisions for pensions, tax, environmental and legal liabilities. Potential changes to pension or financial market regulation could also impact funding requirements of the group.
Due to the Incident and remedial provisions contained in or that may result from the DoJ and SEC settlements and other past events in the US, it is likely that there will
be additional oversight and more stringent regulation of BP’s oil and gas activities in the US and elsewhere, particularly relating to environmental, health and safety controls and oversight of drilling operations, as well as access to new
drilling areas. BP may be subjected to a higher number of citations and/or level of fines imposed in relation to any alleged breaches of safety or environmental regulations. New regulations and legislation, the terms of BP’s settlements with US
government authorities and future settlements or litigation outcomes related to the Incident, and/or evolving practices could increase the cost of compliance, require changes to our drilling operations, exploration, development and decommissioning
plans, impact our ability to capitalize on our assets and limit our access to new exploration properties or operatorships, particularly in the deepwater Gulf of Mexico.
We buy, sell and trade oil and gas products in certain regulated commodity markets. Failure to respond to changes in or to comply with trading regulations could result in
regulatory action and damage to our reputation.
See page 254 for more information on environmental regulation.
Ethical misconduct and non-compliance – ethical misconduct or breaches of applicable laws
by our businesses or our employees could be damaging to our reputation and shareholder value.
Incidents of ethical misconduct, non-compliance with the
recommendations of the ethics monitor appointed under the terms of the DoJ settlement or non-compliance with applicable laws and regulations, including anti-bribery, anti-corruption and anti-manipulation laws and trade or other sanctions, could be
damaging to our reputation and shareholder value and could subject us to litigation and regulatory action or penalties under the terms of the DoJ settlement or otherwise. Multiple events of non-compliance could call into question the integrity of
our operations. For example, in our trading functions, there is the risk that a determined individual could operate as a ‘rogue trader’, acting outside BP’s delegations, controls or code of conduct and in contravention of our values
in pursuit of personal objectives that could be to the detriment of BP and its shareholders.
For certain legal proceedings involving the group, see Legal proceedings
on page 257. For further information on the risks involved in BP’s trading activities, see Treasury and trading activities below.
Liabilities and provisions – BP’s potential liabilities resulting from pending and future claims, lawsuits, settlements and
enforcement actions relating to the Incident, together with the potential cost and burdens of implementing remedies sought in the various proceedings, have had and are expected to continue to have a material adverse impact on the group’s
business.
Under the Oil Pollution Act of 1990 (OPA 90), BP Exploration & Production Inc. and BP Corporation North America are among the parties
financially responsible for the clean-up of the Incident and for certain economic damages as provided for in OPA 90, as well as certain natural resource damages associated with the spill and certain costs determined by federal and state trustees
engaged in a joint assessment of such natural resource damages. BP and certain of its subsidiaries have also been named as defendants in numerous lawsuits in the US arising out of the Incident, including actions for personal injury and wrongful
death, purported class actions for commercial or economic injury, actions for breach of contract, violations of statutes, property and other environmental damage, securities law claims and various other claims, and additional lawsuits or private
claims arising out of the Incident may be brought in the future.
While significant charges have been recognized in the income statement since the Incident occurred
in 2010, the provisions recognized represent only the current best estimates of expenditures required to settle certain present obligations that can be reasonably estimated at the end of the reporting period, and there are future expenditures for
which it is not possible to measure our obligations reliably. BP’s total potential liabilities resulting from pending and future claims, lawsuits, settlements and enforcement actions relating to the Incident (including as a result of any
potential determination of BP’s negligence or gross negligence), together with the potential cost and burdens of implementing remedies sought in the various proceedings, cannot be fully estimated at this time and are subject to significant
uncertainty but they have had, and are expected to continue to have, a material adverse impact on the group’s business.
See Financial statements – Note 2
and Legal proceedings on page 257.
Reporting – failure to accurately report our data could lead to regulatory action, legal
liability and reputational damage.
External reporting of financial and non-financial data is reliant on the integrity of systems and people. Failure to report
data accurately and in compliance with external standards could result in regulatory action, legal liability and damage to our reputation.
As of the date of the SEC
settlement, 10 December 2012, and for a period of three years thereafter, we are unable to rely on the safe harbor provisions regarding forward-looking statements provided by the regulations issued under the Securities Act, and the Securities
Exchange Act of 1934, as amended. Our inability to rely on these safe harbor provisions may expose us to future litigation and liabilities in connection with forward-looking statements in our public disclosures.
|
|
|
| 54 |
|
BP Annual Report and Form 20-F 2013 |
Treasury and trading activities – control of these activities depends on our ability to
process, manage and monitor a large number of transactions. Failure to do this effectively could lead to business disruption, financial loss, regulatory intervention or damage to our reputation.
In the normal course of business, we are subject to operational risk around our treasury and trading activities. Control of these activities is highly dependent on our
ability to process, manage and monitor a large number of complex transactions across many markets and currencies. Shortcomings or failures in our systems, risk management methodology, internal control processes or people could lead to disruption of
our business, financial loss, regulatory intervention or damage to our reputation. See Legal proceedings on page 257.
|
| Safety and operational risks |
The risks inherent in our operations include a number of hazards that, although many may have a low probability of occurrence, can have
extremely serious consequences if they do occur, such as the Gulf of Mexico oil spill. The occurrence of any such risks could have a consequent material adverse impact on the group’s business, competitive position, cash flows, results of
operations, financial position, prospects, liquidity, shareholder returns and/or implementation of the group’s strategic goals.
Process
safety, personal safety and environmental risks – the nature of our operations exposes us to a wide range of significant health, safety, security and environmental risks, the occurrence of which could result in regulatory action, legal
liability and increased costs and damage to our reputation.
The nature of the group’s operations exposes us to a wide range of significant health,
safety, security and environmental risks. The scope of these risks is influenced by the geographic range, operational diversity and technical complexity of our activities. In addition, in many of our major projects and operations, risk allocation
and management is shared with third parties such as contractors, sub-contractors, joint arrangement partners and associates. See Strategic and commercial risks – Joint and other contractual arrangements above.
There are risks of technical integrity failure as well as risk of natural disasters and other adverse conditions in many of the areas in which we operate, which could
lead to loss of containment of hydrocarbons and other hazardous material, as well as the risk of fires, explosions or other incidents. In addition, inability to provide safe environments for our workforce and the public while at our facilities or
premises could lead to injuries or loss of life and could result in regulatory action, legal liability and damage to our reputation.
Our operations are often
conducted in hazardous, remote or environmentally sensitive locations, in which the consequences of a spill, explosion, fire or other incident could be greater than in other locations. These operations are subject to various environmental and safety
laws, regulations and permits and the consequences of failure to comply with these requirements can include remediation obligations, penalties, loss of operating permits and other sanctions. Accordingly, inherent in our operations is the risk that
if we fail to abide by environmental and safety and protection standards, such failure could lead to damage to the environment and could result in regulatory action, legal liability, material costs, damage to our reputation or denial of our licence
to operate.
BP’s group-wide operating management system (OMS) addresses health, safety, security, environmental and operations risks, and aims to provide a
consistent framework within which the group can analyse the performance of its activities and identify and remediate shortfalls. There can be no assurance that OMS will adequately identify all process safety, personal safety and environmental risk
or provide the correct mitigations, or that all operations will be in conformance with OMS at all times.
Under the terms of the DoJ settlement (see Legal proceedings
on page 264), a process safety monitor will review, evaluate, and provide recommendations concerning BPXP’s process safety and risk management procedures for deepwater drilling in the Gulf of Mexico. Incidents of non-compliance with the
recommendations of the process safety monitor could be damaging to our reputation and shareholder value and could subject us to further regulatory action or penalties under the terms of the DoJ settlement. Multiple events of non-compliance could
call into question the integrity of our operations.
Security – hostile acts against our staff and activities could cause harm to people and
disrupt our operations.
Security threats require continuous oversight and control. Acts of terrorism, piracy, sabotage, cyber-attacks and similar activities
directed against our operations and facilities, pipelines, transportation or computer systems could cause harm to people and could severely disrupt business and operations. Our business activities could also be severely disrupted by, among other
things, conflict, civil strife or political unrest in areas where we operate.
Product quality – failure to meet product quality
standards could lead to harm to people and the environment and loss of customers.
Supplying customers with on-specification products is critical to
maintaining our licence to operate and our reputation in the marketplace. Failure to meet product quality standards throughout the value chain could lead to harm to people and the environment and loss of customers.
Drilling and production – these activities require high levels of investment and are subject to natural hazards and other uncertainties.
Activities in challenging environments heighten many of the drilling and production risks including those of integrity failures, which could lead to curtailment, delay or cancellation of drilling operations, or inadequate returns from exploration
expenditure.
Exploration and production require high levels of investment and are subject to natural hazards and other uncertainties, including those relating
to the physical characteristics of an oil or natural gas field. Our exploration and production activities are often conducted in extremely challenging environments, which heighten the risks of technical integrity failure and natural disasters
discussed above. The cost of drilling, completing or operating wells is often uncertain. We may be required to curtail, delay or cancel drilling operations because of a variety of factors, including unexpected drilling conditions, pressure or
irregularities in geological formations, equipment failures or accidents, adverse weather conditions and compliance with governmental requirements. In addition, exploration expenditure may not yield adequate returns, for example in the case of
unproductive wells or discoveries that prove uneconomic to develop. The Gulf of Mexico oil spill illustrates the risks we face in our drilling and production activities.
Transportation – all modes of transportation of hydrocarbons involve inherent and significant risks.
All modes of transportation of hydrocarbons involve inherent risks. An explosion or fire or loss of containment of hydrocarbons or other hazardous material could occur
during transportation by road, rail, sea or pipeline. This is a significant risk due to the potential impact of a release on people and the environment and given the high volumes potentially involved.
|
|
|
|
|
| BP Annual Report and Form 20-F 2013 |
|
|
55 |
|
Liquidity and capital resources
Since the Gulf of Mexico oil spill in 2010 and the significant costs relating to the response activities and the uncertainty regarding the ultimate magnitude of its
liabilities and timing of cash outflows, the group’s situation has continued to stabilize. This has been reflected in the group’s liquidity and capital resources position, which has continued to strengthen underpinned by a prudent
financial framework.
The group’s long-term credit ratings are A (positive outlook) from Standard & Poor’s, and A2 (stable outlook) from Moody’s
Investor Services, both remaining unchanged during 2013.
We increased our financial flexibility in 2013 with the completion of the sale of BP’s 50% share in
TNK-BP to Rosneft in return for cash and shares. We received net $11.8 billion cash on completion (in addition to $0.7 billion already received as a dividend in December 2012), as well as increasing our shareholding in Rosneft from 1.25% to 19.75%.
Financial framework
We continue to refine our
financial framework to support the pursuit of value growth for shareholders, while maintaining a secure financial base. BP intends to increase operating cash flowa by around 50% in 2014 compared
with 2011b, and thereafter maintain focus on growing sustainable free cash flowc. We expect that the improvement in operating cash flow will be
delivered partly from the completion of the Deepwater Horizon Oil Spill Trust fund payments, and partly through high-margin projects coming onstream. Any growth in operating cash flow will be available to increase both organic capital expenditure
and shareholder distributions.
The financial framework remains prudent and we expect to operate within a
gearingd range of 10-20%, and to be robust to cash break-even levels in an oil price environment between $80 and $100 per barrel. We expect to continue to maintain a significant liquidity buffer
while uncertainties remain.
Dividends and other distributions to shareholders
We are committed to maintaining a progressive and sustainable dividend policy through our focus on increasing sustainable free cash flows.
Since resuming dividend payments in 2011, we have steadily increased the dividend. From the quarterly dividend of 7 cents per share paid in 2011 it has increased by 36%
to 9.5 cents per share paid in the fourth quarter of 2013. Going forward, the board will review the dividend level with the first and third quarter results each year.
The total dividend paid in cash to BP shareholders in 2013 was $5.4 billion with shareholders also having the option to receive a scrip dividend (2012 $5.3 billion cash).
The dividend is determined in US dollars, the economic currency of BP.
During 2013 we started to buy back shares as part of an $8-billion share repurchase programme,
fulfilling a commitment to offset any dilution to earnings per share from the Rosneft transaction. The total cash paid for share buybacks in 2013 was $5.5 billion (2012 nil). Details of share repurchases to satisfy the requirements of certain
employee share-based payment plans are set out on page 278.
| a |
Operating cash flow is net cash provided by operating activities, as presented in the group cash flow statement on page 125. |
| b |
Assuming an oil price of $100 per barrel and a Henry Hub gas price of $5/mmBtu in 2014. The projection assumes BP’s estimate of a Rosneft dividend. 2011 excludes BP’s share of TNK-BP dividends. The projection
includes BP’s payment commitments under the Department of Justice and SEC settlements. It does not reflect any cash flows relating to other liabilities, contingent liabilities, settlements or contingent assets arising from the Gulf of Mexico
oil spill which may or may not arise at that time. We are not able to reliably estimate the amount or timing of a number of contingent liabilities. See Financial statements – Note 2 for further information. |
| c |
Free cash flow is operating cash flow less net cash used in investing activities, as presented in the group cash flow statement on page 125. |
| d |
Gearing refers to the ratio of the group’s net debt to net debt plus equity and is a non-GAAP measure. See Financial statements – Note 28 for information on gross debt, which is the nearest equivalent measure
to net debt on an IFRS basis. |
Financing the group’s activities
The group’s principal commodity, oil, is priced internationally in US dollars. Group policy has generally been to minimize economic exposure to currency movements by
financing operations with US dollar debt. Where debt is issued in other currencies, including euros, it is generally swapped back to US dollars using derivative contracts, or else hedged by maintaining offsetting cash positions in the same currency.
The cash balances of the group are mainly held in US dollars or swapped to US dollars and holdings are well-diversified to reduce concentration risk. The group is not therefore exposed to significant currency risk regarding its borrowings. Also see
Risk factors on page 51 for further information on risks associated with prices and markets and Financial statements – Note 19.
The group’s finance debt at
31 December 2013 amounted to $48.2 billion (2012 $48.8 billion). Of the total finance debt, $7.4 billion is classified as short term at the end of 2013 (2012 $10.0 billion). The short-term balance includes $6.2 billion for amounts repayable
within the next 12 months relating to long-term borrowings (2012 $6.2 billion). Commercial paper markets in the US and Europe are a further source of short-term liquidity for the group to provide timing flexibility. At 31 December 2013,
outstanding commercial paper amounted to $1.0 billion (2012 $3.0 billion). We have a European Debt Issuance Programme (DIP) in place under which the group may raise up to $30 billion of debt for maturities of one month or longer. At 31 December
2013, the amount drawn down against the DIP was $13.9 billion (2012 $14.0 billion). Since 5 February 2013 the group has had a US shelf registration statement with a limit of $30 billion. This was converted from an unlimited shelf registration
following the approval in December 2012 of the SEC settlement in respect of Deepwater Horizon-related claims. At 31 December 2013 $6.9 billion had been drawn down since conversion. In addition, the group has an Australian Note Issuance
Programme of $5 billion Australian dollars, and as at 31 December 2013 the amount drawn down was $0.8 billion Australian dollars (2012 A$0.5 billion).
None of
the capital market bond issuances since the Gulf of Mexico oil spill contain any additional financial covenants compared with the group’s capital markets issuances prior to the incident.
BP accessed international capital markets throughout the year using its US, European and Australian issuance programmes, with bond issuances amounting to $8.6 billion in
2013.
The maturity profile and fixed/floating rate characteristics of the group’s debt are described in Financial statements – Note 19.
Net debt was $25.2 billion at the end of 2013, a reduction of $2.3 billion from the 2012 year-end position of $27.5 billion. The ratio of net debt to net debt plus equity
was 16.2% at the end of 2013 (2012 18.7%). Net debt and the ratio of net debt to net debt plus equity are non-GAAP measures. We believe that these measures provide useful information to investors. Net debt enables investors to see the economic
effect of gross debt, related hedges and cash and cash equivalents in total. The net debt ratio enables investors to see how significant net debt is relative to equity from shareholders. See Financial statements – Note 28 for gross debt, which
is the nearest equivalent measure on an IFRS basis, and for further information on net debt.
Cash and cash equivalents of $22.5 billion at 31 December 2013
(2012 $19.6 billion) are included in net debt. We manage our cash position to ensure the group has adequate cover to respond to potential short-term market illiquidity, and expect to maintain a strong cash position. Cash balances are pooled
centrally where permissible, and deployed globally as required. Cash surpluses are deposited with creditworthy banks or invested in high grade commercial paper and money market funds with short maturities to ensure availability. The group holds $2
billion of cash outside the UK and it is not expected that any significant tax will arise on repatriation. Further information on the management of liquidity risk and credit risk is provided in Financial statements – Note 19, and on the cash
position in Financial statements – Note 23.
|
|
|
| 56 |
|
BP Annual Report and Form 20-F 2013 |
The group also has access to significant sources of liquidity in the form of committed bank facilities. We renegotiated our
committed bank facilities during 2013, putting in place borrowing facilities of $7.4 billion (2012 $6.8 billion) with 26 international banking counterparties, of which $7.0 billion is available to draw and repay over a term of five years and $0.4
billion is available to draw and repay over a term of three years. In addition, the group continued to strengthen its access to commercial bank letters of credit (LC) and at the end of 2013 had in place committed LC facilities of $7.5 billion and
secured LC arrangements of $2.4 billion, to supplement its uncommitted and unsecured LC lines.
We believe that the group has sufficient working capital for
foreseeable requirements, taking into account the amounts of undrawn borrowing facilities and increased levels of cash and cash equivalents, and the ongoing ability to generate cash.
Uncertainty remains regarding the amount and timing of future expenditures relating to the Gulf of Mexico oil spill and the implications for future activities. See Risk
factors on page 51 and Financial statements – Note 2 for further information.
Off-balance sheet arrangements
At 31 December 2013, the group’s share of third-party finance debt of equity-accounted entities was $17,008 million (2012 $6,884 million). These amounts are not
reflected in the group’s debt on the balance sheet. The group has issued third-party guarantees under which amounts outstanding at 31 December 2013 were $199 million (2012 $237 million) in respect of liabilities of joint ventures and
associates and $648 million (2012 $713 million) in respect of liabilities of other third parties. Of these amounts, $115 million (2012 $166 million) of the joint ventures and associates guarantees relate to borrowings and for other third-party
guarantees, $487 million (2012 $543 million) relates to guarantees of borrowings. Details of operating lease commitments, which are not recognized on the balance sheet, are shown in the table on page 252 and provided in Financial statements –
Note 9.
Contractual obligations
The following table
summarizes the group’s contractual obligations, capital expenditure commitments for property, plant and equipment at 31 December 2013 and the proportion of that expenditure for which contracts have been placed.
|
|
|
|
|
|
|
|
|
|
|
|
|
| |
|
|
|
|
|
|
|
|
|
|
$ million |
|
|
|
|
|
|
|
|
Capital expenditure |
|
| Expected payments by period |
|
|
Contractual
obligationsa |
|
|
|
Committed |
|
|
|
of which is
contracted |
|
| 2014 |
|
|
134,075 |
|
|
|
17,973 |
|
|
|
8,676 |
|
| 2015 |
|
|
40,471 |
|
|
|
9,010 |
|
|
|
2,581 |
|
| 2016 |
|
|
29,279 |
|
|
|
5,703 |
|
|
|
1,321 |
|
| 2017 |
|
|
23,186 |
|
|
|
4,021 |
|
|
|
685 |
|
| 2018 |
|
|
20,360 |
|
|
|
2,292 |
|
|
|
189 |
|
| 2019 and thereafter |
|
|
105,377 |
|
|
|
3,443 |
|
|
|
253 |
|
| Total |
|
|
352,748 |
|
|
|
42,442 |
|
|
|
13,705 |
|
| a |
Including $100,805 million for which a liability is recognized on the balance sheet. |
The group’s principal
contractual obligations and a description of the nature of the group’s unconditional purchase obligations are provided on page 252.
Capital expenditure is
considered to be committed when the project has received the appropriate level of internal management approval. For joint operations, the net BP share is included in the amounts above.
In addition, at 31 December 2013, the group had committed to capital expenditure relating to investments in equity-accounted entities amounting to $1,458 million.
Contracts were in place for $161 million of this total.
Cash flow
The following table summarizes the group’s cash flows.
|
|
|
|
|
|
|
|
|
|
|
|
|
| |
|
|
|
|
|
|
|
|
|
|
$ million |
|
| |
|
|
2013 |
|
|
|
2012 |
|
|
|
2011 |
|
| Net cash provided by operating activities |
|
|
21,100 |
|
|
|
20,479 |
|
|
|
22,218 |
|
| Net cash used in investing activities |
|
|
(7,855 |
) |
|
|
(13,075 |
) |
|
|
(26,753 |
) |
| Net cash provided by (used in) financing activities |
|
|
(10,400 |
) |
|
|
(2,010 |
) |
|
|
477 |
|
| Currency translation differences relating to cash and cash equivalents |
|
|
40 |
|
|
|
64 |
|
|
|
(493 |
) |
| Increase (decrease) in cash and cash equivalents |
|
|
2,885 |
|
|
|
5,458 |
|
|
|
(4,551 |
) |
| Cash and cash equivalents at beginning of year |
|
|
19,635 |
|
|
|
14,177 |
|
|
|
18,728 |
|
| Cash and cash equivalents at end of year |
|
|
22,520 |
|
|
|
19,635 |
|
|
|
14,177 |
|
Net cash provided by operating activities for the year ended 31 December 2013 was $21,100 million compared with $20,479 million for
2012. The cash outflow in respect of the Gulf of Mexico oil spill reduced from $2,382 million in 2012 to $73 million in 2013. Excluding the impacts of the Gulf of Mexico oil spill, net cash provided by operating activities was $21,173 million for
2013, compared with $22,861 million for 2012, a decrease of $1,688 million. Profit before taxation excluding the impact of the Gulf of Mexico oil spill increased by $7,545 million, of which $9,163 million related to the non-cash impacts of higher
depreciation, impairments and gains and losses on disposal offset by lower earnings from joint ventures and associates. An increase in working capital requirements of $3,920 million was largely offset by lower income taxes paid.
Net cash provided by operating activities for the year ended 31 December 2012 was $20,479 million compared with $22,218 million for 2011. The cash outflow in respect
of the Gulf of Mexico oil spill reduced from $6,813 million in 2011 to $2,382 million in 2012. Excluding the impacts of the Gulf of Mexico oil spill, net cash provided by operating activities was $22,861 million for 2012, compared with $29,031
million for 2011, a decrease of $6,170 million. Profit before taxation excluding the impacts of the Gulf of Mexico oil spill decreased by $11,341 million, of which $4,730 million related to the non-cash impacts of higher depreciation, impairments
and gains and losses on disposal and lower equity-accounted earnings of joint ventures and associates. A reduction in working capital requirements of $3,667 million was largely offset by lower dividends received from joint ventures and associates,
principally TNK-BP.
Net cash used in investing activities was $7,855 million in 2013 (2012 $13,075 million and 2011 $26,753 million). The decrease in cash used in
2013 reflected an increase in disposal proceeds of $10,401 million, partly offset by an increase in our investments in equity-accounted entities, mainly relating to the completion of the sale of our interest in TNK-BP and subsequent investment in
Rosneft. There was also an increase in our other capital expenditure excluding acquisitions of $1,298 million. The decrease in cash used in 2012 reflected an absence of significant expenditure on business combinations compared with 2011 when we
spent $10,909 million, mainly for the Reliance and Devon acquisitions, as well as an increase in disposal proceeds of $8,757 million. This was partially offset by an increase in capital expenditure excluding acquisitions of $5,914 million.
The group has had significant levels of capital investment for many years. Cash flow in respect of capital investment, excluding acquisitions, was $30 billion in 2013
(2012 $24.8 billion and 2011 $18.9 billion). Sources of funding are fungible, but the majority of the group’s funding requirements for new investment come from cash generated by existing operations.
|
|
|
|
|
| BP Annual Report and Form 20-F 2013 |
|
|
57 |
|
Net cash used in financing activities was $10,400 million in 2013 (2012 $2,010 million and 2011 $477 million net cash
provided by financing activities). The increase in net cash used in 2013 primarily reflected the buyback of shares of $5.5 billion as part of our $8-billion share repurchase programme, lower net proceeds of $1,055 million from long-term financing
and an increase in the net repayment of short-term debt of $1,353 million. The increase in net cash used in 2012 primarily reflected a net decrease in short-term debt of $2,888 million and an increase in dividends paid of $1,222 million, partly
offset by an increase in net proceeds from long-term financing of $1,412 million.
During the period 2011 to 2013, our total sources of cash amounted to $101 billion,
and our total uses of cash amounted to $106 billion. The increase in cash and cash equivalents held of $4 billion was financed by an increase in finance debt of $9 billion over the three-year period. During this period, the price of Brent crude oil
has averaged $110.53 per barrel. Sources and uses of cash over the three-year period as a whole, are analysed in the table below.
|
|
|
|
|
| |
|
|
$ billion |
|
| Sources of cash: |
|
|
|
|
| Net cash provided by operating activities |
|
|
64 |
|
| Disposals |
|
|
37 |
|
| |
|
|
101 |
|
| Uses of cash: |
|
|
|
|
| Capital expenditure |
|
|
74 |
|
| Acquisitions |
|
|
11 |
|
| Net repurchase of shares |
|
|
5 |
|
| Dividends paid to BP shareholders |
|
|
15 |
|
| Dividends paid to non-controlling interests |
|
|
1 |
|
| |
|
|
106 |
|
| Net use of cash |
|
|
(5 |
) |
| Increase in finance debt |
|
|
9 |
|
| Increase in cash and cash equivalents |
|
|
4 |
|
Disposal proceeds received in cash during the three-year period exceeded cash used for acquisitions, as a result in particular of our
ongoing disposal programme started in 2010 and the disposal of our interest in TNK-BP in 2013. Net investment (capital expenditure and acquisitions less disposal proceeds) during this period averaged $16 billion per year. Dividends paid to BP
shareholders totalled $15 billion during the three-year period. In the past three years, $4 billion has been contributed to funded pension plans. This is reflected in net cash provided by operating activities in the table above.
Acquisitions and disposals
There were no significant acquisitions in 2013 and 2012.
In 2011, we acquired a 30%
interest in each of 21 oil and gas production-sharing agreements operated by Reliance Industries Limited in India for $7.0 billion. We also completed the purchase, for $3.6 billion, of 10 exploration and production blocks in Brazil, which was the
final part of a $7-billion transaction with Devon Energy that had been announced in March 2010.
During 2013 BP completed sale and purchase agreements for the sale of
BP’s 50% interest in TNK-BP to Rosneft, and for BP’s further investment in Rosneft. For more information on this transaction see Financial statements – Note 6.
Total cash disposal proceeds received during 2013 were $22 billion. This included $16.7 billion for the disposal of BP’s interest in TNK-BP, $1.4 billion for the
disposal of our Texas City refinery and a portion of its retail and logistics network in the south-eastern US to Marathon Petroleum Corporation and $2.2 billion for the sale of the Carson refinery in California, and related assets in the region to
Tesoro Corporation. We also completed the sale of our interests in a number of central North Sea oil and gas fields to TAQA.
Total disposal proceeds received during
2012 were $11.6 billion. This included $5.55 billion for the disposal of BP’s interests in the Marlin hub, Horn Mountain, Holstein, Ram Powell and Diana Hoover fields in the Gulf of Mexico, $1.5 billion for the sale of the Canadian natural gas
liquids (NGL) business to Plains Midstream Canada ULC and $1.025 billion for the sale of BP’s interest in the Jonah and Pinedale upstream operations in Wyoming, to LINN Energy, LLC.
Total disposal proceeds received during 2011, after the repayment of the disposal deposit relating to Pan American Energy LLC (PAE), were $2.8 billion.
See Financial statements – Note 3 and Note 4 for further details of business combinations and non-current assets held for sale.
The Strategic report was approved by the board and signed on its behalf by David J Jackson, Company Secretary on 6 March 2014.
|
|
|
| 58 |
|
BP Annual Report and Form 20-F 2013 |
Board of directorsa
As at 6 March 2014
|
|
|
|
|
|
|

|
|
|
|
|
| Key to portraits |
|
|
|
|
|
|
|
|
|
|
| 1 Carl-Henric Svanberg |
|
2 Bob Dudley |
|
3 Paul Anderson |
|
4 Admiral Frank Bowman |
| 5 Antony Burgmans |
|
6 Cynthia Carroll |
|
7 Iain Conn |
|
8 George David |
| 9 Ian Davis |
|
10 Professor Dame Ann Dowling |
|
11 Dr Brian Gilvary |
|
12 Brendan Nelson |
| 13 Phuthuma Nhleko |
|
14 Andrew Shilston |
|
|
|
|
| a |
The ages of the board are correct as at 31 December 2013. |
|
|
|
| 60 |
|
BP Annual Report and Form 20-F 2013 |
Carl-Henric Svanberg
Chairman
Tenure
Appointed to the
board 1 September 2009 (4 years)
Board and committee activities
Chairman
Chairman of the
chairman’s committee
Chairman of the nomination committee
Attends the safety, ethics and environment assurance committee (SEEAC)
Attends the Gulf of Mexico committee
Attends the remuneration committee
Outside interests
Chairman
of AB Volvo
Age
61
Nationality
Swedish
Career
Carl-Henric Svanberg became chairman of the BP
board on 1 January 2010.
He spent his early career at Asea Brown Boveri and the Securitas Group, before moving to the Assa Abloy Group as president and chief
executive officer.
From 2003 until 31 December 2009, when he left to join BP, he was president and chief executive officer of Ericsson, also serving as the
chairman of Sony Ericsson Mobile Communications AB. He was a non-executive director of Ericsson between 2009 and 2012.
He was appointed chairman and a member of the
board of AB Volvo on 4 April 2012.
He is a member of the External Advisory Board of the Earth Institute at Columbia University, a member of the Advisory Board
of Harvard Kennedy School and on the Leadership Council of the United Nations Sustainable Development Solutions Network. He is also the recipient of the King of Sweden’s medal for his contribution to Swedish industry.
Relevant experience and skills
Carl-Henric
Svanberg’s career in global business, latterly as chief executive officer of Ericsson, is particularly relevant to BP as has been demonstrated during his tenure as chairman. In leading the board, he has focused on the development of the
group’s strategy and its communication to shareholders. He has also concentrated on the work of the nomination committee in endeavouring to ensure that the board has a strong list of candidates to secure its stewardship of the company.
Carl-Henric Svanberg’s performance during the year has been evaluated by the chairman’s committee, led by Antony Burgmans.
Bob Dudley
Group chief executive
Tenure
Appointed to the
board 6 April 2009 (4 years)
Outside interests
Non-executive director of Rosneft
Member of Tsinghua Management University Advisory Board, Beijing, China
Member of BritishAmerican Business International Advisory Board
Member of UAE/UK CEO Forum
Member
of Turkish/British CEO Forum
Member of Russian Geographical Society
Age
58
Nationality
American
Career
Bob Dudley became group chief executive on 1 October 2010.
Bob joined Amoco
Corporation in 1979, working in a variety of engineering and commercial posts. Between 1994 and 1997, he worked on corporate development in Russia.
In 1997, he
became general manager for strategy for Amoco and in 1999, following the merger between BP and Amoco, was appointed to a similar role in BP.
Between 1999 and 2000,
he was executive assistant to the group chief executive, subsequently becoming group vice president for BP’s renewables and alternative energy activities. In 2002, he became group vice president responsible for BP’s upstream businesses in
Russia, the Caspian region, Angola, Algeria and Egypt.
From 2003 to 2008, he was president and chief executive officer of TNK-BP in Moscow. On his return to BP in
2009 he was appointed to the BP board and oversaw the group’s activities in the Americas and Asia. Between 23 June and 30 September 2010, he served as the president and chief executive officer of BP’s Gulf Coast Restoration
Organization in the US. He was appointed a director of Rosneft in March 2013 following BP’s acquisition of a stake in Rosneft.
Relevant
experience and skills
Bob Dudley has spent his entire career in the oil and gas industry. His broad range of roles with Amoco and BP has given him substantial
global experience.
Since his appointment as group chief executive in 2010, Bob has re-organized the operations of the group and has moved its focus to value not
volume; all without any compromise on safety. During the year he has successfully completed the disposal of the group’s interest in TNK-BP and the acquisition of a significant stake in Rosneft.
Bob Dudley’s performance has been considered and evaluated by the chairman’s committee.
|
|
|
|
|
| BP Annual Report and Form 20-F 2013 |
|
|
61 |
|
Paul Anderson
Independent non-executive director
Tenure
Appointed 1 February 2010 (4 years)
Board and committee activities
Chairman of the SEEAC
Member of the chairman’s committee
Member of the nomination committee
Member of the Gulf of Mexico committee
Outside interests
Non-executive director of BAE Systems PLC.
Age
68
Nationality
American
Career
Paul Anderson was formerly chief executive at BHP Billiton and Duke Energy, where he also served as chairman of the board. Having previously been chief executive officer
and managing director of BHP Limited and then BHP Billiton Limited and BHP Billiton Plc, he rejoined these latter two boards in 2006 as a non-executive director, retiring on 31 January 2010. He also served as a non-executive director on a
number of boards in the US and Australia and as chief executive officer of Pan Energy Corp.
Relevant experience and skills
Paul Anderson became a board member in early 2010, joining the SEEAC. He was a member of the Gulf of Mexico committee from its formation in August 2010. He took the chair
of the SEEAC in December 2012. As chair he has continued the committee’s focus on safety matters. His broad experience of the global oil and gas industry and of the US business environment has benefited the board, the SEEAC and the Gulf of
Mexico committee. He has actively supported the work of the BP Massachusetts Institute of Technology (MIT) academy.
He has led the SEEAC on several visits to the
company’s operations and has commenced a dialogue with the company’s socially responsible investors.
Admiral Frank Bowman
Independent
non-executive director
Tenure
Appointed 8 November 2010 (3 years)
Board and committee activities
Member of the SEEAC
Member of the
chairman’s committee
Member of the Gulf of Mexico committee
Outside interests
President
of Strategic Decisions, LLC.
Director of Morgan Stanley Mutual Funds
Director of the American Shipbuilding Suppliers Association
Director of Naval and Nuclear Technologies, LLP.
Age
69
Nationality
American
Career
Frank Bowman joined the United States Navy in 1966. During his naval service, he commanded the nuclear submarine USS City of Corpus Christi and the USS
Holland. He served as a flag officer: as the Navy’s chief of personnel; on the joint staff as director of Political-Military Affairs; and as a director of the naval nuclear propulsion programme in the Department of the Navy and the
Department of Energy for over eight years. He also completed two masters degrees in engineering at the Massachusetts Institute of Technology in 1973.
After his retirement as an Admiral in 2004, he was president and chief executive officer of the Nuclear Energy Institute
until 2008. He served on the BP Independent Safety Review Panel and was a member of the BP America external advisory council. He was appointed Honorary Knight Commander of the British Empire in 2005 by Queen Elizabeth II. He was elected to the US
National Academy of Engineering in 2009.
Relevant experience and skills
Frank Bowman has a deep knowledge of engineering coupled with exceptional experience in process safety arising from his time with the US Navy and, later, the Nuclear
Energy Institute. His service on the BP Independent Safety Review Panel gave him direct experience of BP’s safety aims and requirements, which has been important for his work on the SEEAC. He has made a significant contribution to the work of
the Gulf of Mexico committee.
Antony Burgmans
Independent non-executive director
Tenure
Appointed 5 February 2004 (10 years)
Board and committee activities
Chairman of the remuneration committee
Member of the SEEAC
Member of the
chairman’s committee
Member of nomination committee
Outside interests
Member of
the supervisory boards of Akzo Nobel N.V., AEGON N.V. and SHV Holdings N.V.
Chairman of the supervisory board of TNT Express
Age
66
Nationality
Dutch
Career
Antony Burgmans joined Unilever in 1972, holding a succession of marketing and sales posts, including the chairmanship of PT Unilever Indonesia from 1988 until 1991.
In 1991, he was appointed to the board of Unilever, becoming business group president, ice cream and frozen foods, Europe in 1994, and chairman of Unilever’s Europe
committee, co-ordinating its European activities. In 1998, he became vice chairman of Unilever NV and in 1999, chairman of Unilever NV and vice chairman of Unilever PLC. In 2005, he became non-executive chairman of Unilever NV and Unilever PLC until
his retirement in 2007. During his career he has lived and worked in London, Hamburg, Jakarta, Stockholm and Rotterdam.
Antony Burgmans has been nominated chairman
of Akzo Nobel’s supervisory board from April 2014.
Relevant experience and skills
Antony Burgmans’ executive career has been in the fields of international production, distribution and marketing. Over the years he has made a significant
contribution to the work of the board, adding insight to the areas of reputation, brand and culture. His global perspective has particular value as chairman of the remuneration committee and also to his work on the SEEAC, on whose behalf he has made
several visits to operations of the group.
He led the remuneration committee in its task of preparing a formal remuneration policy for adoption by shareholders. In
this role he has had extensive dialogue with shareholders. He continues to provide wise counsel to the board and leads the evaluation of the chairman.
|
|
|
| 62 |
|
BP Annual Report and Form 20-F 2013 |
Cynthia Carroll
Independent non-executive director
Tenure
Appointed 6 June 2007 (6 years)
Board and committee activities
Member of the SEEAC
Member of the chairman’s committee
Member of nomination committee
Outside interests
Non-executive director of Hitachi Ltd.
Age
57
Nationality
American
Career
Early in her career in 1989, Cynthia Carroll joined Alcan (Aluminum Company of Canada) and ran a packaging company, led a global bauxite, alumina and speciality chemicals
business and later was president and chief executive officer of the Primary Metal Group, responsible for operations in more than 20 countries. In 2007 she became the chief executive of Anglo American plc, the global mining group, operating in 45
countries with 150,000 employees, and was chairman of Anglo Platinum Limited and of De Beers s.a. She stepped down from these roles in April 2013.
Relevant experience and skills
Cynthia Carroll’s leadership of global businesses, particularly in the extractive industry sector has
enabled her to make a strong contribution to the work of the BP board and the SEEAC. She has been a leader in working to enhance safety performance in the mining industry, and her geo-political experience has been valuable during the course of the
year, as has her work on the nomination committee.
She recently visited BP’s operations in Alaska on behalf of the SEEAC.
Iain Conn
Chief executive, Downstream
Tenure
Appointed to the
board 1 July 2004 (9 years)
Group responsibilities
Manufacturing, logistics, marketing operations of BP’s fuels, petrochemicals and lubricants businesses
Group regional responsibility for Europe, southern Africa and Asia BP brand and related matters
Outside interests
Non-executive director and senior independent director of Rolls-Royce Holdings plc.
Chairman of the advisory board of Imperial College Business School
Member of the council of Imperial College
Age
51
Nationality
British
Career
Iain Conn was appointed chief executive, Downstream on 1 June 2007.
He joined BP
Oil International in 1986, working in a variety of roles in oil trading, commercial refining and exploration before becoming, on the merger between BP and Amoco in 1999, vice president of BP Amoco Exploration’s mid-continent business unit.
At the end of 2000, he returned to London as group vice president and a member of the Refining and Marketing segment’s
executive committee, taking over responsibility in 2001 for BP’s marketing operations in Europe. In 2002 he was appointed chief executive of BP Petrochemicals. Following his appointment to the board in 2004, he served for three years as group
executive officer, strategic resources, with responsibility for a number of group functions and regions.
Relevant experience and skills
Iain Conn’s career has given him extensive knowledge of a broad range of BP’s businesses, particularly in the Downstream, which he has led since
2007. In this last period he has successfully remodelled BP’s downstream business. He has deep knowledge of safety, manufacturing, energy markets and technology. He has continued to refocus the group’s downstream operations whilst growing
the contribution of that segment.
Iain Conn’s performance has been evaluated by the group chief executive and considered by the chairman’s committee.
George David
Independent non-executive director
Tenure
Appointed 11 February 2008 (6 years)
Board and committee activities
Member of the audit committee
Member of the remuneration committee
Member of the Gulf of Mexico committee
Member of the chairman’s committee
Outside interests
Vice-Chairman of the Peterson Institute for International Economics
Age
71
Nationality
American
Career
George David began his career in The Boston Consulting Group before joining the Otis Elevator Company in 1975. He held various roles in Otis and later in United
Technologies Corporation (UTC), following Otis’s merger with UTC in 1976. In 1992, he became UTC’s chief operating officer. He served as UTC’s chief executive officer from 1994 until 2008 and as chairman from 1997 until his retirement
in 2009.
Relevant experience and skills
George David
has substantial global business and financial experience through his long career with UTC, a business with significant reliance on safety and technology. He previously chaired BP’s technology advisory council and has brought insights from that
task to the board.
He is an active member of the audit, remuneration and Gulf of Mexico committees, bringing a strong US and global view to their deliberations.
|
|
|
|
|
| BP Annual Report and Form 20-F 2013 |
|
|
63 |
|
Ian Davis
Independent non-executive director
Tenure
Appointed 2 April 2010 (3 years)
Board and committee activities
Chairman of the Gulf of Mexico committee
Member of the remuneration committee
Member of the chairman’s committee
Member of the nomination committee
Outside interests
Chairman of Rolls-Royce Holdings plc.
Non-executive member of the UK Cabinet Office
Non-executive director of Johnson & Johnson, Inc.
Senior adviser to Apax Partners LLP.
Age
62
Nationality
British
Career
Ian Davis spent his early career at Bowater, moving to McKinsey & Company in 1979. He was managing partner of McKinsey’s practice in the UK and Ireland from
1996 to 2003. In 2003, he was appointed as chairman and worldwide managing director of McKinsey, serving in this capacity until 2009. During his career with McKinsey, he served as a consultant to a range of global organizations across the private,
public and not-for-profit sectors. He retired as senior partner on 30 July 2010.
Relevant experience and skills
Ian Davis brings significant financial and strategic experience to the board. He has had a lengthy career working with and advising global organizations and companies in
the oil and gas industry. This experience has been recognized by the board in his membership of the remuneration committee and chairmanship of the Gulf of Mexico committee.
As chairman of the Gulf of Mexico committee he has led the board’s oversight of the response in the Gulf and guided their consideration of the various legal issues
which continue to arise following the Deepwater Horizon accident.
Professor Dame Ann Dowling
Independent non-executive director
Tenure
Appointed 3 February 2012 (2 years)
Board and committee activities
Member of the SEEAC
Member of the remuneration committee
Member of the chairman’s committee
Outside interests
Professor of Mechanical Engineering, head of the Department of Engineering and Deputy
Vice-Chancellor at the University of Cambridge
Chair of the Physical Sciences, Engineering and Mathematics Panel in the Research
Excellence Framework – the UK Government’s review of research in universities
Non-executive director of the Department for
Business, Innovation & Skills (BIS)
Age
61
Nationality
British
Career
Dame Ann Dowling was appointed a Professor of
Mechanical Engineering in the Department of Engineering at the University of Cambridge in 1993 (the Department of Engineering is one of the leading centres for engineering research worldwide). Between 1999 and 2000 she was the Jerome C Hunsaker
Visiting Professor at MIT,
subsequently becoming a Moore distinguished scholar at Caltech in 2001. When she returned to the University of Cambridge, she became Head of the Division of Energy, Fluid Mechanics and
Turbomachinery in the Department of Engineering, becoming UK lead of the Silent Aircraft Initiative in 2003 – a collaboration between researchers at Cambridge and MIT. She became head of the Department of Engineering at the University of
Cambridge in 2009. She was appointed director of the University Gas Turbine Partnership with Rolls-Royce in 2001 and chairman in 2009.
Between 2003 and 2008 she
chaired the Rolls-Royce Propulsion and Power Advisory Board. She chaired the Royal Society/Royal Academy of Engineering study on nanotechnology. She is a Fellow of the Royal Society and the Royal Academy of Engineering and is a foreign associate of
the US National Academy of Engineering and of the French Academy of Sciences.
She has been nominated President of the Royal Academy of Engineering from September
2014.
Relevant experience and skills
Dame Ann
Dowling has a strong academic and engineering background.
Having initially been a member of the SEEAC, she joined the remuneration committee in 2012. Her
contributions on both of these committees are valued, as is her work with the BP technology advisory council, which she also joined during 2012 and which she now chairs.
Dr Brian Gilvary
Group chief financial officer
Tenure
Appointed to the
board 1 January 2012 (2 years)
Group responsibilities
Finance, tax, planning, treasury, mergers and acquisitions, investor relations, audit, procurement and information technology activities Chairs the
group financial risk committee
Outside interests
Visiting professor at Manchester University
Age
51
Nationality
British
Career
Dr Brian Gilvary was appointed chief financial officer on 1 January 2012.
He
joined BP in 1986 after obtaining a PhD in mathematics from the University of Manchester. Following a variety of roles in the upstream, downstream and trading in Europe and the United States, he became the downstream’s chief financial officer
and commercial director from 2002 to 2005.
He was a director of TNK-BP over two periods, from 2003 to 2005 and from 2010 until the sale of the business and
acquisition of Rosneft equity in 2013. From 2005 until 2009 he was chief executive of the integrated supply and trading function, BP’s commodity trading arm. In 2010 he was appointed deputy group chief financial officer with responsibility for
the finance function.
Relevant experience and skills
Dr Brian Gilvary has 27 years of experience within BP, gaining a strong knowledge of finance and trading, and a deep understanding of BP’s assets and businesses,
including its interests in Russia through his time on the board of TNK-BP.
Brian has consistently worked to further strengthen the finance function. He has also
developed the company’s engagement with shareholders and continues to focus on financial efficiency.
Brian Gilvary’s performance has been evaluated by the
group chief executive and considered by the chairman’s committee.
|
|
|
| 64 |
|
BP Annual Report and Form 20-F 2013 |
Brendan Nelson
Independent non-executive director
Tenure
Appointed 8 November 2010 (3 years)
Board and committee activities
Chairman of the audit committee
Member of the nomination committee
Member of the chairman’s committee
Outside interests
Non-executive director and chairman of the group audit committee of The Royal Bank of Scotland
Group plc.
President of the Institute of Chartered Accountants of Scotland Member of the Financial Reporting Review Panel
Age
64
Nationality
British
Career
Brendan Nelson is a chartered accountant. He was made a partner of KPMG in 1984. He served as a member of the UK board of KPMG from 2000 to 2006, subsequently being
appointed vice chairman until his retirement in 2010. At KPMG International he held a number of senior positions including global chairman, banking and global chairman, financial services.
He served six years as a member of the Financial Services Practitioner Panel.
Relevant experience and skills
Brendan Nelson has had a long career in finance and auditing, particularly in the areas of financial services
and trading which qualifies him to chair the audit committee and to act as its financial expert.
This is complemented by his broader business experience and his role
as the chair of the audit committee of a major bank. During the year he has led the audit committee in meeting the many challenges from increased changes to regulation.
Phuthuma Nhleko
Independent non-executive director
Tenure
Appointed 1 February 2011 (3 years)
Board and committee activities
Member of the audit committee
Member of the chairman’s committee
Outside interests
Non-executive director of Anglo American plc
Non-executive director and chairman of MTN Group Ltd.
Age
53
Nationality
South African
Career
Phuthuma Nhleko began his career as a civil
engineer in the US and as a project manager for infrastructure developments in southern Africa. Following this he became a senior executive of the Standard Corporate and Merchant Bank in South Africa. He later held a succession of directorships
before joining MTN Group, a pan-African and Middle Eastern telephony group represented in 21 countries, as group president and chief executive officer in 2002. During his tenure at the MTN Group he led a number of substantial mergers and
acquisitions transactions.
He stepped down as group chief executive of MTN Group at the end of March 2011. He was formerly a director of a number of
listed South African companies, including Johnnic Holdings (formerly a subsidiary of the Anglo American group of companies), Nedbank Group, Bidvest Group and Alexander Forbes.
Relevant experience and skills
Phuthuma Nhleko’s
background in engineering and his broad experience as a chief executive of a multi-national company enables him to contribute to the board, particularly in the areas of emerging market economies and the evolution of the group’s strategy. His
financial and commercial experience is particularly relevant to his work on the audit committee.
Andrew Shilston
Independent non-executive director
Tenure
Appointed 1 January 2012 (2 years)
Board and committee activities
Senior independent director
Member of the audit committee
Member of the chairman’s committee
Attends the nomination committee
Outside interests
Non-executive director of Circle Holdings plc.
Chairman of Morgan Advanced Materials plc.
Age
58
Nationality
British
Career
Andrew Shilston trained as a chartered accountant
before joining BP as a management accountant. He subsequently joined Abbott Laboratories before moving to Enterprise Oil plc in 1984 at the time of flotation. In 1989 he became treasurer of Enterprise Oil and was appointed finance director in 1993.
After the sale of Enterprise Oil to Shell in 2002, in 2003 he became finance director of Rolls-Royce plc until his retirement on 31 December 2011.
He has served
as a non-executive director on the board of Cairn Energy plc where he chaired the audit committee.
Relevant experience and skills
Andrew Shilston has had a long career in finance within the oil and gas industry. His knowledge and experience as a chief financial officer, firstly in Enterprise Oil and
then Rolls-Royce, and as audit committee chairman at Cairn Energy makes him well suited as a member of BP’s audit committee.
His experience of the oil and gas
industry has been important in assisting the board in their evaluation of projects and capital expenditure. As senior independent director he has attended meetings of the nomination committee.
|
|
|
|
|
| BP Annual Report and Form 20-F 2013 |
|
|
65 |
|
|
|
|
|
|
|
|
| Executive
teama
As at 6 March 2014 |
|
The executive team represents the principal executive leadership of the BP group. Its membership includes BP’s executive directors (Bob Dudley, Iain Conn and Dr Brian Gilvary whose biographies appear on pages 61-64)
and the senior management listed below. |
|

|
|
|
|
|
| Key to portraits |
|
|
|
|
|
|
|
|
|
|
| 1 Rupert Bondy |
|
2 Bob Fryar |
|
3 Andy Hopwood |
|
4 Katrina Landis |
| 5 Bernard Looney |
|
6 Lamar McKay |
|
7 Dev Sanyal |
|
8 Helmut Schuster |
Rupert Bondy
Current position
Group general counsel
Executive
team tenure
Appointed 1 May 2008 (5 years)
Outside interests
No
external appointments
Age
52
Nationality
British
Career
Rupert Bondy is responsible for legal and
compliance matters across the BP group.
Rupert began his career as a lawyer in private practice. In 1989 he joined US law firm Morrison & Foerster, working
in San Francisco and London, and from 1994 he worked for UK law firm Lovells in London. In 1995 he joined SmithKline Beecham as senior counsel for mergers and acquisitions and other corporate matters. He subsequently held positions of increasing
responsibility and, following the merger of SmithKline Beecham and GlaxoWellcome to form GlaxoSmithKline, he was appointed senior vice president and general counsel of GlaxoSmithKline in 2001.
In April 2008 he joined the BP group, and he became the group general counsel on 1 May 2008.
| a |
The ages of the executive team are correct as at 31 December 2013.
|
Bob Fryar
Current position
Executive vice president, safety and operational risk
Executive team tenure
Appointed 1 October 2010 (3 years)
Outside interests
No
external appointments
Age
50
Nationality
American
Career
Bob Fryar is responsible for strengthening safety,
operational risk management, and the systematic management of operations across the BP corporate group. He is group head of safety and operational risk, with accountability for group-level disciplines including engineering, health, safety, security,
and environment. In this capacity, he looks after the group-wide operating management system implementation and capability programmes.
Bob has 28 years’
experience in the oil and gas industry having joined Amoco Production Company in 1985. From October 2010 to February 2013 Bob was executive vice president of the production division and was accountable for safe and compliant exploration and
production operations and stewardship of resources across all regions. In addition, he was also responsible for local government and stakeholder management and regional integration of all exploration and production activities.
Prior to February 2013, Bob held several management positions in Trinidad, including chief operating officer for Atlantic LNG, and vice president of operations.
Prior to that, Bob served in a variety of engineering and management positions in onshore US and deepwater Gulf of Mexico including petroleum engineer, field manager,
operations manager, resource manager, and asset manager. In addition, he worked on the Vastar integration team.
|
|
|
| 66 |
|
BP Annual Report and Form 20-F 2013 |
Andy Hopwood
Current position
Chief operating officer, strategy and regions, Upstream
Executive team tenure
Appointed 1 November 2010 (3 years)
Outside interests
Chair of
the BP Foundation
Age
55
Nationality
British
Career
Andy Hopwood is responsible for BP’s upstream
strategy, including changes to its portfolio and investment planning. He is also responsible for the upstream regional footprint through leadership of its regional presidents, who are the upstream’s senior leaders in the regions where the
upstream operates.
After joining BP in 1980 as a petroleum engineer, Andy gained ten years of operating experience in the North Sea, Wytch Farm, and Indonesia, and
developing expertise in reservoir engineering in BP’s London headquarters.
In 1989 Andy joined the corporate planning team supporting the formulation of
BP’s exploration strategy, and the subsequent rationalization of BP’s portfolio. Following this corporate work, his international endeavours led to positions in South America, first in Mexico and then as commercial manager for BP’s
Venezuela business, prior to a return to London as the exploration and production planning manager.
In 1999, following the BP-Amoco merger, he was appointed business
unit leader in Azerbaijan, before returning to London in 2001 as the Upstream chief of staff. He was then appointed business unit leader for BP’s interests in Trinidad & Tobago until 2005, when he moved to Houston to become strategic
performance unit leader for the North American gas business.
In 2009, he joined the Upstream executive as head of portfolio and technology and in October 2010 was
appointed executive vice president, exploration and production.
Katrina Landis
Current position
Executive vice president, corporate business activities
Executive team tenure
Appointed 1 May 2013
Outside interests
Independent director of Alstom SA
Founding member of Alstom’s Ethics, Compliance and Sustainability Committee
Member of Earth Day Network’s Global Advisory Committee Ambassador to the U.S. Department of Energy’s U.S. Clean Energy
Education & Empowerment program
Age
54
Nationality
American
Career
Katrina Landis is responsible for BP’s
integrated supply and trading activities, Alternative Energy, shipping, technology and remediation management.
Katrina began her career with BP in 1992 in Anchorage,
Alaska and held a variety of senior roles. She was chief executive officer of BP’s integrated supply and trading – Oil Americas – from 2003 to 2006, group vice president of BP’s integrated supply and trading from 2007 to 2008 and
chief operating officer of BP Alternative Energy from 2008 to 2009. She was then appointed chief executive officer of BP Alternative Energy in 2009. On 1 May 2013, she became executive vice president, corporate business activities.
Bernard Looney
Current position
Chief
operating officer, production
Executive team tenure
Appointed 1 November 2010 (3 years)
Outside interests
Member of the Stanford University Graduate School of Business Advisory Council
Fellow of the Energy Institute
Age
43
Nationality
Irish
Career
Bernard Looney is responsible for production operations, drilling, engineering, procurement and supply-chain management, as well as health, safety and environment in the
upstream.
Bernard joined BP in 1991 as a drilling engineer, working in the North Sea, Vietnam and the Gulf of Mexico. In 2001 Bernard took on responsibility for
drilling operations on Thunder Horse in the Deepwater Gulf of Mexico.
In 2005 Bernard became senior vice president within BP Alaska, before moving in 2007 to be head
of the group chief executive’s office.
In 2009 he became the managing director of BP’s North Sea business in the UK and Norway.
Bernard became executive vice president, developments, in October 2010. He took up his current role in February 2013.
|
|
|
|
|
| BP Annual Report and Form 20-F 2013 |
|
|
67 |
|
Lamar McKay
Current position
Chief executive, Upstream
Executive team tenure
Appointed 16 June 2008 (5 years)
Outside interests
Member of Mississippi State University Dean’s Advisory Council
Age
55
Nationality
American
Career
Lamar McKay is responsible for the combined Upstream business which consists of exploration, development and production.
Lamar started his career in 1980 with Amoco and has held a broad range of positions. In 1993, he became general manager for the Arkoma Basin, and in 1997 moved into the
role of business unit leader for the Gulf of Mexico Shelf.
During 1998-2000, he worked on the BP-Amoco merger and served as head of strategy and planning for the
worldwide exploration and production business in London. In 2000, he became business unit leader for the Central North Sea in Aberdeen, Scotland. In 2001, Lamar became chief of staff for the worldwide exploration and production business, and
subsequently served as chief of staff to BP’s deputy group chief executive.
Lamar became group vice president, Russia and Kazakhstan in 2003 where he was
responsible for BP’s Upstream businesses, including BP’s interest in the TNK-BP joint venture. He served as a member of the board of directors of TNK-BP from February 2004 to May 2007.
In May 2007, Lamar moved to Houston to assume the role of senior group vice president, BP p.l.c. and executive vice president, BP America where he led BP’s efforts
to resolve various issues involving the Texas City refinery, Prudhoe Bay field and US trading function. In June 2008, he became executive vice president, special projects focusing on Russia where he led BP’s efforts to restructure the
governance framework for TNK-BP.
In February 2009, Lamar was appointed chairman and president of BP America Inc, serving as BP’s chief representative in the US.
In October 2010, he additionally assumed the role of chief executive officer and president for the Gulf Coast Restoration Organization.
On 1 January 2013, he
became chief executive, Upstream.
Dev Sanyal
Current position
Executive vice president, and group chief of staff
Executive team tenure
Appointed 1 January 2012 (2 years)
Outside interests
Non-executive director of Man Group plc
Member of the Accenture Global Energy Board
Member of the International Business Leaders Group of The Duke of
Edinburgh’s International Award Foundation
Trustee of the Career Academy Foundation
Age
48
Nationality
British and
Indian
Career
Dev Sanyal is the accountable executive for all of BP’s corporate activities in strategy and long-term planning, risk, economics, competitor intelligence, government
and political affairs, policy and group integration and governance.
Dev joined BP in 1989 and has held a variety of international roles in London, Athens, Istanbul,
Vienna and Dubai. He was appointed chief executive, BP Eastern Mediterranean Fuels in 1999. In 2002, he moved to London as chief of staff of BP’s worldwide downstream businesses. In November 2003, he was appointed chief executive officer of Air
BP. In June 2006, he was appointed head of the group chief executive’s office. He was appointed group vice president and group treasurer in 2007. During this period, he was also chairman of BP Investment Management Ltd and accountable for the
group’s aluminium interests. In January 2012, he became executive vice president, and group chief of staff.
Helmut Schuster
Current position
Executive vice president, group human resources director
Executive team tenure
Appointed 1 March 2011 (3 years)
Outside interests
No external appointments
Age
52
Nationality
Austrian
Career
Helmut Schuster became group human resources director on 1 March 2011. In this role he holds accountabilities for the BP human resources function.
Helmut began his career working for Henkel in a marketing capacity. Since joining BP in 1989 Helmut has held a number of major leadership roles. He has worked in BP in
the US, UK and continental Europe and within most parts of refining, marketing, trading and gas and power. Before taking on his current role his portfolio of responsibilities as a vice president, human resources included the refining and marketing
segment of BP, and corporate and functions. This role saw him leading the people agenda for roughly 60,000 people across the globe and includes businesses such as petrochemicals, fuels value chains, lubricants and functional experts across the
corporation.
|
|
|
| 68 |
|
BP Annual Report and Form 20-F 2013 |
Governance overview

Introduction from the chairman
I am pleased to describe the work of the BP board and its committees in 2013. This is the end of the fourth year in which I have had the privilege to chair the board of
BP.
In this time I have been fortunate to work with a group of directors who, through the board and its committees, have made a significant contribution to the
rebuilding of the company. While we have made good progress, we still have work to do.
In 2013, with some of the areas of uncertainty from 2012 behind us, we began
to determine how the board would function in the future. Shareholders will see that the number of meetings of the board and the committees has appropriately decreased since 2012. We are moving to what we hope will be a more established rhythm.
During the year, the nomination committee carried out a detailed review of current board skills and the needs of the board in terms of knowledge, expertise and diversity over the coming years. As part of this review directors were asked how the
board should operate in future. In January, as part of the 2013 board evaluation, we reviewed this work in the context of the results of the evaluations over the past three years.
In looking at the past year I would like to highlight just some of the areas upon which we have focused. In 2011 the board agreed the 10-point plan, setting a clear
strategy for the company and determined the measures by which that strategy should be evaluated. We want to be judged on the value we generate for our shareholders and not the volume of hydrocarbons that we produce. To do this we have to invest our
capital wisely and be clear on how we will execute our projects so that value is maximized. All of this needs to be done without compromising on safety. So safety, strategy, project selection and project execution have been at the forefront of our
discussions as a board.
I believe that we use our committees effectively to carry out the required oversight and governance of risk. The Gulf of
Mexico committee has continued to work to cover the wide range of litigation in which we remain involved as a result of the Deepwater Horizon accident. This allows the board to focus on key areas of strategy. The SEEAC visited several operations to
evaluate our safety culture and implementation of operational standards.
As a board we focus on the delivery of long-term value to our shareholders, but given the
nature of our business we must do so in a way that is sensitive to the societies in which we work. This means setting values and standards of behaviour both inside and outside the company.
Fair, balanced and understandable
During the year, the
board considered the changes to the UK Corporate Governance Code in the context of BP’s governance practices. One of these changes has been the requirement for directors to make a statement that they consider the annual report and accounts,
taken as a whole, to be fair, balanced and understandable.
As part of our considerations, we received an early draft of the annual report to enable time for review
and comment. The audit committee and the SEEAC then met jointly to consider the criteria for a fair, balanced and understandable annual report and to review the processes underpinning the compilation and assurance of the report, in relation to
financial and non-financial management information.
Following the joint meeting of the committees, the board then considered the annual report and accounts as a
whole and discussed the tone, balance and language of the document, being mindful of new UK reporting requirements and consistency between the narrative sections and the financial statements. In evaluating whether the report is fair, balanced and
understandable, the board reviewed the internal processes that form the group’s reporting governance framework, including the role of the corporate reporting steering group, the use of content owners, and legal and auditor review.
It has been another challenging year, but one where the board has continued to work well and learn. I look forward to 2014.
Carl-Henric Svanberg
Chairman
|
|
|
|
|
| BP Annual Report and Form 20-F 2013 |
|
|
69 |
|
Board and committee attendance in 2013
|
|
|
|
|
|
|
|
|
|
|
|
|
|
|
|
|
|
|
|
|
|
|
|
|
|
|
|
|
|
|
|
|
|
|
|
|
|
|
|
|
|
|
|
|
|
|
|
|
|
|
|
|
|
|
|
|
| |
|
|
Board |
|
|
|
Audit committee |
|
|
|
SEEAC |
|
|
|
Remuneration
committee |
|
|
|
Gulf of Mexico
committee |
|
|
|
Nomination
committee |
|
|
|
Chairman’s
committee |
|
| |
|
|
A |
|
|
|
B |
|
|
|
A* |
|
|
|
B |
|
|
|
A* |
|
|
|
B |
|
|
|
A |
|
|
|
B |
|
|
|
A |
|
|
|
B |
|
|
|
A |
|
|
|
B |
|
|
|
A |
|
|
|
B |
|
| Non-executive directors |
|
|
|
|
|
|
|
|
|
|
|
|
|
|
|
|
|
|
|
|
|
|
|
|
|
|
|
|
|
|
|
|
|
|
|
|
|
|
|
|
|
|
|
|
|
|
|
|
|
|
|
|
|
|
|
|
| Carl-Henric Svanberg |
|
|
11 |
|
|
|
11 |
|
|
|
|
|
|
|
|
|
|
|
|
|
|
|
|
|
|
|
|
|
|
|
|
|
|
|
|
|
|
|
|
|
|
|
4 |
c |
|
|
4 |
|
|
|
6 |
c |
|
|
6 |
|
| Paul Anderson1 |
|
|
11 |
|
|
|
11 |
|
|
|
|
|
|
|
|
|
|
|
7 |
c |
|
|
7 |
|
|
|
|
|
|
|
|
|
|
|
13 |
|
|
|
12 |
|
|
|
4 |
|
|
|
4 |
|
|
|
6 |
|
|
|
6 |
|
| Frank Bowman |
|
|
11 |
|
|
|
11 |
|
|
|
|
|
|
|
|
|
|
|
7 |
|
|
|
7 |
|
|
|
|
|
|
|
|
|
|
|
13 |
|
|
|
13 |
|
|
|
|
|
|
|
|
|
|
|
6 |
|
|
|
6 |
|
| Antony Burgmans |
|
|
11 |
|
|
|
11 |
|
|
|
|
|
|
|
|
|
|
|
7 |
|
|
|
7 |
|
|
|
6 |
c |
|
|
6 |
|
|
|
|
|
|
|
|
|
|
|
4 |
|
|
|
3 |
|
|
|
6 |
|
|
|
6 |
|
| Cynthia Carroll2 |
|
|
11 |
|
|
|
11 |
|
|
|
|
|
|
|
|
|
|
|
7 |
|
|
|
7 |
|
|
|
|
|
|
|
|
|
|
|
|
|
|
|
|
|
|
|
4 |
|
|
|
4 |
|
|
|
6 |
|
|
|
5 |
|
| George David3 |
|
|
11 |
|
|
|
11 |
|
|
|
12 |
|
|
|
12 |
|
|
|
|
|
|
|
|
|
|
|
6 |
|
|
|
6 |
|
|
|
13 |
|
|
|
12 |
|
|
|
|
|
|
|
|
|
|
|
6 |
|
|
|
5 |
|
| Ian Davis4 |
|
|
11 |
|
|
|
11 |
|
|
|
|
|
|
|
|
|
|
|
|
|
|
|
|
|
|
|
6 |
|
|
|
5 |
|
|
|
13 |
c |
|
|
13 |
|
|
|
4 |
|
|
|
3 |
|
|
|
6 |
|
|
|
5 |
|
| Ann Dowling |
|
|
11 |
|
|
|
11 |
|
|
|
|
|
|
|
|
|
|
|
7 |
|
|
|
7 |
|
|
|
6 |
|
|
|
6 |
|
|
|
|
|
|
|
|
|
|
|
|
|
|
|
|
|
|
|
6 |
|
|
|
6 |
|
| Brendan Nelson5 |
|
|
11 |
|
|
|
10 |
|
|
|
12 |
c |
|
|
12 |
|
|
|
|
|
|
|
|
|
|
|
|
|
|
|
|
|
|
|
|
|
|
|
|
|
|
|
4 |
|
|
|
4 |
|
|
|
6 |
|
|
|
6 |
|
| Phuthuma Nhleko6 |
|
|
11 |
|
|
|
10 |
|
|
|
12 |
|
|
|
12 |
|
|
|
|
|
|
|
|
|
|
|
|
|
|
|
|
|
|
|
|
|
|
|
|
|
|
|
|
|
|
|
|
|
|
|
6 |
|
|
|
5 |
|
| Andrew Shilston7 |
|
|
11 |
|
|
|
9 |
|
|
|
12 |
|
|
|
11 |
|
|
|
|
|
|
|
|
|
|
|
|
|
|
|
|
|
|
|
|
|
|
|
|
|
|
|
|
|
|
|
|
|
|
|
6 |
|
|
|
6 |
|
| Executive directors |
|
|
|
|
|
|
|
|
|
|
|
|
|
|
|
|
|
|
|
|
|
|
|
|
|
|
|
|
|
|
|
|
|
|
|
|
|
|
|
|
|
|
|
|
|
|
|
|
|
|
|
|
|
|
|
|
| Bob Dudley |
|
|
11 |
|
|
|
11 |
|
|
|
|
|
|
|
|
|
|
|
|
|
|
|
|
|
|
|
|
|
|
|
|
|
|
|
|
|
|
|
|
|
|
|
|
|
|
|
|
|
|
|
|
|
|
|
|
|
| Iain Conn |
|
|
11 |
|
|
|
11 |
|
|
|
|
|
|
|
|
|
|
|
|
|
|
|
|
|
|
|
|
|
|
|
|
|
|
|
|
|
|
|
|
|
|
|
|
|
|
|
|
|
|
|
|
|
|
|
|
|
| Brian Gilvary |
|
|
11 |
|
|
|
11 |
|
|
|
|
|
|
|
|
|
|
|
|
|
|
|
|
|
|
|
|
|
|
|
|
|
|
|
|
|
|
|
|
|
|
|
|
|
|
|
|
|
|
|
|
|
|
|
|
|
| Byron Grote |
|
|
5 |
|
|
|
5 |
|
|
|
|
|
|
|
|
|
|
|
|
|
|
|
|
|
|
|
|
|
|
|
|
|
|
|
|
|
|
|
|
|
|
|
|
|
|
|
|
|
|
|
|
|
|
|
|
|
A = Total number of meetings the director was eligible to attend.
B = Total number of meetings the director did attend.
| * |
Includes a joint Audit Committee-SEEAC meeting to review BP’s system of internal control and risk management. |
| 1 |
Paul Anderson was unable to attend the Gulf of Mexico committee meeting on 25 September 2013 due to a late change in the timing of the meeting. |
| 2 |
Cynthia Carroll was unable to attend the chairman’s committee on 5 December 2013 due to personal commitments. |
| 3 |
George David was unable to attend the Gulf of Mexico committee meeting on 8 March 2013 due to a clash with travel arrangements; he was unable to attend the chairman’s committee meeting on 24 July 2013 due
to a late change in the timing of the meeting. |
| 4 |
Ian Davis was unable to attend the meetings of the nomination and remuneration committees on 24 July 2013 due to a conflicting board meeting. |
| 5 |
Brendan Nelson attended all scheduled board meetings in 2013, however he was unable to attend the board teleconference on 21 February 2013 that was called at short notice due to a prior commitment with the Royal
Bank of Scotland plc. |
| 6 |
Phuthuma Nhleko was unable to attend the chairman’s committee meeting on 24 July 2013 and the board meeting on 25 July 2013 due to unforeseen urgent family commitments. |
| 7 |
Andrew Shilston attended all scheduled board meetings in 2013, however he was unable to attend the two board teleconferences called at short notice on 16 January 2013 and 21 February 2013 due to prior
commitments; he was unable to attend the audit committee meeting on 28 October 2013 due to major storms in the UK disrupting travel. |
Board diversity
BP recognizes the importance of diversity, including gender diversity, at all levels of the company as well as the board. The company is committed to increasing diversity
across our operations and has in place a wide range of activities to support the development and promotion of talented individuals, regardless of gender and ethnic background.
The board operates a diversity policy which aims to promote diversity in the composition of the board. Under this policy, director appointments are evaluated against the
existing balance of skills, knowledge and experience on the board, with directors asked to be mindful of diversity, inclusiveness and meritocracy considerations when examining nominations to the board.
The implementation of this policy and the diversity mix of the board is monitored through agreed metrics. The board also
considered diversity as part of the annual review of its performance and effectiveness.
The board is supportive of the recommendations contained in Lord Davies’
report Women on Boards for female board representation to increase to 15% by end 2013 and 25% by end 2015. Accordingly, the board set a goal to increase the number of female board members by two (to a total of three female directors) by the
end of 2013. However, at the end of 2013 there were two female directors on the board (equating to 14%). The nomination committee has identified potential candidates with a diverse background and it is anticipated that an appointment is likely to be
made in 2014.
|
|
|
| 70 |
|
BP Annual Report and Form 20-F 2013 |
How the board works
Board governance in BP
The
system of governance within which the BP board operates is set out in the BP board governance principles. These define the role of the board, its processes and its relationship with executive management. This system is reflected in the governance of
the group’s subsidiaries. The board governance principles can be found at bp.com/governance.
Role of
the board
The board is responsible for the overall conduct of the group’s business and the directors have duties under both UK company law and BP’s
articles of association.
|
| The primary tasks of the board include: |
|
g
Active consideration and direction of long-term strategy, and approval of the annual plan.
g
Monitoring of BP’s performance against the strategy and plan.
g
Obtaining assurance that the material risks to BP are identified and that systems of risk management and control are in place to mitigate such risk.
g Board and executive management succession.
|
Specific tasks are delegated to the board committees (see the reports of the committees on page 74). The board seeks to set the ‘tone
from the top’ for BP by working with management to agree the values of the company and considering specific issues, including health, safety, the environment and reputation.
Board composition
On
31 December 2013 the board had 14 directors – the chairman, three executive directors and 10 independent, non-executive directors (NEDs).
The nomination
committee keeps the balance and independence of the board under review (see the report of the nomination committee on page 79).
Key roles and responsibilities
The chairman
Carl-Henric Svanberg
| |
• |
|
Provides leadership of the board. |
| |
• |
|
Acts as main point of contact between the board and management. |
| |
• |
|
Speaks on board matters to shareholders and other parties. |
| |
• |
|
Ensures that systems are in place to provide directors with accurate, timely and clear information to enable the board to operate effectively. |
| |
• |
|
Is responsible for the integrity and effectiveness of the BP board’s system of governance. |
The group chief executive
Bob Dudley
| |
• |
|
Is responsible for day-to-day management of the group. |
| |
• |
|
Chairs the executive team (ET), the membership of which is set out on page 66. |
The senior
independent director
Andrew Shilston
| |
• |
|
Is available to shareholders if they have concerns that cannot be addressed through normal channels. |
Antony
Burgmans, BP’s longest serving non-executive director, acts as an internal sounding board for the chairman and serves as intermediary for the other directors with the chairman when necessary.
Neither the chairman nor the senior independent director is employed as an executive of the group. The nomination committee keeps succession plans for the chairman,
senior independent director, group chief executive and senior management under review.
Appointment and time commitment
The chairman and NEDs have letters of appointment; there is no term limit on a director’s service as BP proposes all directors for annual re-election by shareholders
(a practice followed since 2004). While the chairman’s appointment letter sets out the time commitment expected of him, the letters of appointment for NEDs do not set a fixed time commitment as it is anticipated that the time required of
directors may fluctuate depending on demands of BP business and other events. It is expected that directors will allocate sufficient time to the company to perform their duties effectively.
Executive directors are permitted to take up one external board appointment, subject to the agreement of the chairman. Fees received for an external appointment may be
retained by the executive director and are reported in the annual report on remuneration (see page 106).
Independence and conflicts of interest
NEDs are expected to be independent in character and judgement and free from any business or other relationship which could materially interfere with the exercise of that
judgement.
Antony Burgmans joined the board in February 2004 and by the time of the 2014 AGM will have served ten years as a director. In 2012, the board asked him
to remain as a director until the 2016 AGM as it considered that his experience as the longest serving board member provides valuable insight, knowledge and continuity. The board has determined that he continues to meet the board’s criteria for
independence and will keep this under review.
The board is satisfied that there is no compromise to the independence of, and nothing to give rise to conflicts of
interest for those directors who serve together as directors on the boards of outside entities or who have other appointments in outside entities. The nomination committee keeps under review the other interests of the NEDs to ensure that the
effectiveness of the board is not compromised.
Succession
Dr Byron Grote, an executive director, retired from the board at the AGM in 2013. There were no other changes to the board or committee membership during the year.
|
|
|
|
|
| BP Annual Report and Form 20-F 2013 |
|
|
71 |
|
Board activity
The board’s activities are structured to enable the directors to fulfil their role, in particular with respect to strategy, monitoring, assurance and succession. The
diagram below shows the main areas of focus by the board during 2013.
Board activities
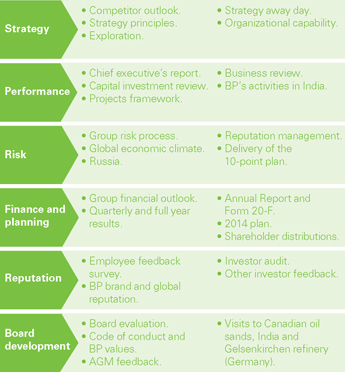
Risk and assurance
During the year the board through its committees, regularly reviewed the processes whereby risks are identified, evaluated and managed. The effectiveness of the
group’s system of internal control and risk management were also assessed (see Internal Control Revised Guidance for Directors (Turnbull) on page 110).
The
annual plan and the group strategy are central to BP’s risk management programme. They provide a framework in which the board can consider significant risks, manage the group’s overall risk exposure and underpin the delegation and
assurance model for the board in its oversight of executive management and other activities. The board and its committees (principally audit, SEEAC and Gulf of Mexico committees) monitored the group risks which had been allocated following the
board’s review of the annual plan at the end of 2012.
Those group risks reviewed during 2013 included risks associated with the global economic climate, the
delivery of BP’s 10-point plan, the group’s exposure to Russia and reputation management. The board considered at the half year whether any changes were required to the allocation of group risks and confirmed the schedule for oversight of
these risks.
The group risks allocated for review by the board in 2014 include delivery of BP’s 10-point plan and geopolitical risk associated with BP’s
operations around the world. The board’s monitoring committees (audit, safety, ethics and environment assurance and Gulf of Mexico committees) were also allocated a number of group risks for review over the year: these are outlined in the
reports of the committees on page 74. Further information on BP’s system of risk management is outlined in Our management of risk on page 49.
International advisory board
BP’s international advisory board (IAB) advises the chairman, group chief
executive and the board on geopolitical and strategic issues relating to the company. This group has an advisory role and meets twice a year – although its members are on hand to provide advice and counsel when needed.
The IAB is chaired by BP’s previous chairman, Peter Sutherland. Its membership in 2013 included Kofi Annan, Lord
Patten of Barnes, Josh Bolten, President Romano Prodi, Dr Ernesto Zedillo and Dr Javier Solana. The chairman and chief executive attend meetings of the IAB. Issues discussed during the year included events in the Middle East, the US budget deficit
and BP’s activities in Azerbaijan and North Africa.
Board effectiveness
Induction and board learning
On joining BP, non-executive directors are given a tailored induction programme. This includes one-to-one meetings with management, the external auditors and site visits
to operations. The induction also covers governance, duties of directors and the board committees that a director will join.
To help develop an understanding of
BP’s business, the board continues its learning through briefings and site visits. In 2013, the board received briefings on BP’s code of conduct, the group’s values and key business developments including legal updates, the economic
outlook and the BP Energy Outlook. At its board meetings in Houston and India, the board met local management.
Non-executive directors are expected to attend
at least one site visit per year. During 2013, the board made a number of visits, including to Canadian oil sands operations, India and the Gelsenkirchen refinery in Germany. Members of the SEEAC made site visits to BP’s operations in Alaska
and Tangguh. The chairman and Iain Conn, chief executive of BP’s Downstream segment, visited the Whiting Refinery in the US. After each site visit, the board or appropriate committee is briefed on the impressions gained by the directors
attending the visit.

|
|
|
| 72 |
|
BP Annual Report and Form 20-F 2013 |
Board evaluation
Each year BP undertakes a review of the board, its committees and individual directors. The chairman’s own performance is evaluated by the chairman’s committee
(led by Antony Burgmans).
In 2013 the nomination committee undertook a review of board skills, activities and time commitment with a view to informing the succession
profile of future board appointments. This was undertaken to ensure that the board was well positioned to challenge and develop BP’s strategy. This review included a discussion on how the board should approach its work in future.
Given this review of board skills and the use of external facilitation in prior years, an internally designed board evaluation has been carried out for 2013 using an
external facilitator (Lintstock), which tested key areas of the board’s work, including strategy, assurance, risk and governance processes. The output of the review were discussed at the board and individually at each committee in January 2014.
Key conclusions from the evaluation
The
evaluation concluded that progress had been made in improving the rhythm of board meetings and the timeliness of board paper distribution through the introduction of an online portal.
Good progress had been made during the year on the development of strategy and the governance around capital projects. Further work in both these areas was agreed for
2014. In addition, greater focus on technology and capability would be included as part of the board’s considerations on strategy. The board also expressed a desire to look outwards when considering the rapidly evolving global energy market.
Follow up from our previous evaluation
After
the 2012 evaluation, the board revised its agenda to increase the focus on strategic issues and introduced the regular use of forward agenda planning to enable this to be realized. The board also asked for greater interaction with the international
advisory board, and a joint meeting has been scheduled for 2014. The number of board meetings reduced from 19 in 2012 to 11 in 2013, enabling the board to move back to a more steady state of operation.
Shareholder engagement
The company operates an active investor relations programme and the board receives feedback on shareholder views through results of an anonymous investor audit and
reports from management and directors who interacted with shareholders over the year.
Institutional investors
Executive directors and senior management regularly meet with institutional investors through roadshows, group and one-to-one meetings and events for socially
responsible investors.
During the year the chairman, senior independent director and chairs of the SEEAC and remuneration committee held investor meetings to discuss
strategy, the board’s view on the company’s performance, governance and remuneration. An annual investor event was held in March 2013 with the chairman and chairs of the board committees. This meeting enables BP’s largest shareholders
to hear about the work of the board and its committees, and for non-executive directors to engage with investors.
Materials from investor presentations, including
our financial results and information on the work of the board and its committees can be downloaded at bp.com/investors.
Private investors
Following a successful meeting in 2012, BP repeated an event for private investors in conjunction with the UK Shareholders’
Association (UKSA). A group of 50 private shareholders listened to presentations from the chairman and head of investor relations on BP’s annual results, strategy and the work of the board. The event gave shareholders the opportunity to ask
questions on BP’s activities and for the company to receive direct private shareholder feedback.
As part of the further development of BP’s retail
shareholder strategy, we commenced a ‘lost shareholder’ programme in 2013 to trace and confirm shareholders’ contact details in order to successfully reunite them with their unclaimed dividends. Funds returned to shareholders as at
31 January 2014 amounted to £1,512,882.
AGM
The voting levels for the 2013 AGM saw an increase over the previous year to 64.2% (versus 63.2% in 2012). A webcast, speeches and presentations from the AGM are
available on the BP website after the meeting, together with the outcome of voting on each resolution. Each year the board receives a report after the AGM giving a breakdown of the vote and investor feedback on their voting decisions for the
meeting, informing the board on any issues arising.
UK Corporate Governance Code compliance
BP complied throughout 2013 with the provisions of the UK Corporate Governance Code, except in the following aspects:
| B.3.2 |
Letters of appointment do not set out fixed-time commitments since the schedule of board and committee meetings is subject to change according to the demands of business and other events. All directors are expected to
demonstrate their commitment to the work of the board on an ongoing basis. This is reviewed by the nomination committee in recommending candidates for annual re-election. |
| D.2.2 |
The remuneration of the chairman is not set by the remuneration committee. Instead the chairman’s remuneration is reviewed by the remuneration committee which makes a recommendation to the board as a whole for
final approval, within the limits set by shareholders. This wider process enables all board members to discuss and approve the chairman’s remuneration (rather than solely the members of the remuneration committee). |
| E.2.4 |
Printed copies of the BP Annual Report and Form 20-F 2012 completed mailing outside of the Governance Code period of 20 working days before the AGM (but within the UK Companies Act notice period). This was due to
printing being delayed following developments in the company’s legal proceedings in the US. |
|
|
|
|
|
| BP Annual Report and Form 20-F 2013 |
|
|
73 |
|
Committee reports
Audit committee

Chairman’s introduction
The work of the audit committee in 2013 has been focused on three key themes. Firstly, financial reporting and accounting judgements, particularly with respect to
assessing BP’s financial responsibilities arising from the Deepwater Horizon accident. Secondly, reviews of key group-level risks and BP’s system of controls and risk management. Thirdly, regular reports which assist the committee in
maintaining assurance over the management of financial risk and in overseeing the performance of the external auditor. These have been supplemented by private meetings of the committee with key constituents, including our group audit function, the
group ethics and compliance officer and lead external audit partners.
The monitoring committees of the audit, SEEA and Gulf of Mexico have continued to operate
according to agreed areas of oversight that enable them to inform the wider board’s view. As chair of the audit committee, I reported after each meeting to the board on the main matters discussed in our meeting to ensure all directors were
informed of the committee’s work. I believe the mix of skills and experience amongst the committee’s members, together with the ability to discuss issues directly with management has led to an effective performance from the committee over
the year.
Brendan Nelson
Committee chair
Role of the
committee
The committee monitors the effectiveness of the group’s financial reporting and systems of internal control and risk management.
Key responsibilities
| • |
|
Monitoring and obtaining assurance that the management or mitigation of financial risks are appropriately addressed by the group chief executive and that the internal control system is designed and implemented
effectively in support of the limits imposed by the board (‘Executive Limitations’) as set out in the BP board governance principles; |
| • |
|
Reviewing financial statements and other financial disclosures and monitoring compliance with relevant legal and listing requirements; |
| • |
|
Reviewing the effectiveness of the group audit function and BP’s internal financial controls and systems of internal control and risk management; |
| • |
|
Overseeing the appointment, remuneration, independence and performance of the external auditor and the integrity of the audit process as a whole, including the engagement of the external auditor to supply non-audit
services to BP; |
| • |
|
Reviewing the systems in place to enable those who work for BP to raise concerns about possible improprieties in financial reporting or other issues and for those matters to be investigated.
|
Members
|
|
|
| Name |
|
Membership status |
|
|
| Brendan Nelson
(chairman) |
|
Member since November 2010; chairman since April 2011 |
|
|
| George David |
|
Member since February 2008 |
|
|
| Phuthuma Nhleko |
|
Member since February 2011 |
|
|
| Andrew Shilston |
|
Member since February 2012 |
Brendan Nelson is chair of the audit committee. He was formerly vice chairman of KPMG, is chairman of the group audit committee of The
Royal Bank of Scotland Group plc, a member of the Financial Reporting Review Panel and president of the Institute of Chartered Accountants of Scotland. The board is satisfied that Mr Nelson is the audit committee member with recent and relevant
financial experience as outlined in the UK Corporate Governance Code. It considers that the committee as a whole has an appropriate and experienced blend of commercial, financial and audit expertise to assess the issues it is required to address.
The board also determined that the audit committee meets the independence criteria provisions of Rule 10A-3 of the US Securities Exchange Act of 1934 and that Mr Nelson may be regarded as an audit committee financial expert as defined in
Item 16A of Form 20-F.
Meetings are also attended by the chief financial officer, group controller, chief accounting officer, group auditor (head of group
audit) and external auditor.
Activities during the year
Training
The committee received technical updates
from the chief accounting officer on developments in financial reporting and accounting policy. Externally facilitated learning sessions were held on the UK government programme on cyber-security, global trends in fraud and corruption and
developments in oil and gas accounting.
Financial disclosure
The committee reviewed the quarterly, half-year and annual financial statements with management, focusing on the integrity and clarity of disclosure, compliance with
relevant legal and financial reporting standards and the application of critical accounting policies and judgements.
In conjunction with the SEEAC, the committee
examined whether the BP Annual Report 2013 was fair, balanced and understandable and provided the information necessary for shareholders to assess the group’s performance, business model and strategy. The process the two committees and
then the full board undertook as part of this examination is outlined in the introduction from the chairman in the Governance overview (see page 69).
Accounting judgements and estimates
Areas of significant judgement considered by the committee during the year and how these were
addressed included:
| • |
|
Oil and natural gas accounting |
BP uses judgement and estimations when
accounting for oil and gas exploration, appraisal and development expenditure and determining the group’s estimated oil and gas reserves. The committee reviewed judgemental aspects of oil and gas accounting as part of the company’s
quarterly due diligence process. It also examined the governance framework for the oil and gas reserves process, training for staff and developments in regulations and controls.
| • |
|
Recoverability of asset carrying values |
Determination as to whether and how
much an asset is impaired involves management judgement and estimates on highly uncertain matters such as future pricing or discount rates. Judgements are also required in assessing the recoverability of overdue receivables and deciding whether a
provision is required.
The committee reviewed the discount rates for impairment testing as part of its annual process and examined the assumptions
for long-term oil and gas prices and refining margins. Following political and economic developments in Egypt, the committee reviewed at each quarter with management whether the group’s financial assets were impaired.
|
|
|
| 74 |
|
BP Annual Report and Form 20-F 2013 |
Audit committee focus in 2013

| * |
Undertaken jointly with the SEEAC. |
| • |
|
Acquisitions of interests in other entities |
BP exercises judgement when
assessing the level of control obtained in a transaction to acquire an interest in another entity and when determining the fair value of assets acquired and liabilities assumed. The committee examined the accounting for BP’s transaction with
Rosneft and the judgement on whether the group has significant influence over Rosneft, as where such influence exists, equity accounting is applied – resulting in the recognition of BP’s share of Rosneft’s results each quarter and the
reporting of BP’s share of production and hydrocarbon reserves. During the year the committee received reports from management and the external auditor which assessed the extent of significant influence, including BP’s participation in
decision making through director election to the Rosneft board and other factors.
Computation of the group’s tax expense and liability, the
provisioning for potential tax liabilities and the level of deferred tax asset recognition in relation to accumulated tax losses are underpinned by management judgement. The committee reviewed the judgements exercised on tax provisioning as part of
its annual review of key provisions.
| • |
|
Derivative financial instruments |
BP uses judgement when estimating the fair
value of some derivative instruments in cases where there is an absence of liquid market pricing information – for example, long-term gas contracts which have a lengthy duration. This approach is taken for the group’s longer-term,
structured derivative products, natural gas embedded derivatives and the forward contracts entered into in 2012 to purchase shares in Rosneft. The committee received reports from the external auditor on the valuation models developed for these
contracts and reviewed disclosures relating to these instruments in the notes to the financial statements.
| • |
|
Provisions and contingencies |
The group holds provisions for the future
decommissioning of oil and natural gas production facilities and pipelines at the end of their economic lives. Most of these decommissioning events are in the long term and the requirements that will have to be met when a removal event occurs are
uncertain. Judgement is applied by the company when estimating issues such as settlement dates, technology and legal requirements. The committee received briefings on the group’s decommissioning, environmental remediation and litigation
provisioning, including key assumptions used, the governance framework applied (covering accountabilities and controls), discount rates and the movement in provisions over time.
| • |
|
Gulf of Mexico oil spill |
Judgement was applied during the year to the
significant uncertainties over the provisions and contingencies relating to the incident.
The committee regularly discussed the provisioning for and
the disclosure of contingent liabilities relating to the Gulf of Mexico oil spill with management and the external auditors, including as part of the review of BP’s stock exchange announcement at each quarter end.
The committee examined developments relating to the interpretation of the business economic loss claims
element of the company’s settlement with the Plaintiffs’ Steering Committee, including US court rulings and monitored legal developments whilst considering the impacts on the financial statements and other disclosures.
| • |
|
Pensions and other post-retirement benefits |
Accounting for pensions and
other post-retirement benefits involves judgement about uncertain events, including discount rates, inflation and life expectancy. The committee examined the assumptions used by management as part of its annual reporting process.
Risk reviews
The group risks allocated to the
audit committee for monitoring in 2013 included risks associated with trading activities, compliance with applicable laws and regulations and security threats against BP’s digital infrastructure. For 2014, the board has agreed that the
committee will maintain monitoring of the same group risks. The committee held in-depth reviews of these group risks over the year, examined succession planning and capability development in the finance function and reviewed the effectiveness and
efficiency of the capital investment of a number of BP’s major projects.
Internal control and risk management
The committee reviewed the group’s system of internal control and risk management over the year, holding a joint meeting with the SEEAC to discuss key audit findings
and management’s actions to remedy significant issues. The committee reviews the scope, activity and effectiveness of the group audit function and met privately with the general auditor and his segment and functional heads during the year.
The committee received quarterly reports on the findings of group audit, on identified fraud and misconduct and on key ethics and compliance issues. A further joint
meeting with the SEEAC was held to discuss the annual certification report of compliance with the BP code of conduct. The two committees also met to discuss the group audit and ethics and compliance programmes for 2013. The committee held a private
meeting with the group ethics and compliance officer during the year.
External audit
The external auditors started the audit cycle with their plan which identified key audit risks to be monitored during the year – including exposures relating to the
Gulf of Mexico oil spill, estimation of oil and gas reserves, estimation of pension liabilities, recoverability of the group’s financial assets in Egypt and future commodity prices and their impact on the carrying value of the group’s
assets. The committee received updates during the year on the audit process, including how the auditors had challenged the group’s assumptions on these issues.
|
|
|
| BP Annual Report and Form 20-F 2013 |
|
75 |
The audit committee annually reviews the fee structure, resourcing and terms of engagement for the external auditor. Fees
paid to the external auditor for the year were $53 million, of which 9% was for non-assurance work (see Financial statements – Note 37). Non-audit or non-audit related assurance fees were $5 million (2012 $7 million). The $2-million reduction
in non-audit fees relates primarily to reduced corporate finance transactions and lower tax advisory services. Non-audit or non-audit related assurance services consisted of tax compliance services, tax advisory services and services relating to
corporate finance transactions. The audit committee is satisfied that this level of fee is appropriate in respect of the audit services provided and that an effective audit can be conducted for this fee.
The effectiveness of the audit process was evaluated through a committee review and a survey of employees in the group’s finance function. The 2013 evaluations
concluded that there was a good quality audit process and that the external auditors were regarded as knowledgeable and capable, with an ability to challenge the BP team constructively and to ensure balanced reporting. There was also support for the
independence of the external auditors and feedback that they should continue sharing good industry practice.
The committee held private meetings with the external
auditors during the year and the committee chair met privately with the external auditor before each meeting.
Auditor appointment and
independence
The committee considers the reappointment of the external auditor each year before making a recommendation to the board and shareholders. The
committee assesses the independence of the external auditor on an ongoing basis and the external auditor is required to rotate the lead audit partner every five years and other senior audit staff every seven years. No
partners or senior staff associated with the BP audit may transfer to the group. The current lead partner has been in place
since the start of 2013.
Audit tendering
During the year the committee considered the group’s position on its audit services contract following changes to the UK Corporate Governance Code and proposed
European Union regulations concerning the audit market. The committee examined a number of options regarding the timing of tendering for BP’s external audit, including the mandatory rotation of the group’s audit firm envisaged by proposed
European regulations.
In view of the uncertainty regarding the form and impact of these regulations, the committee concluded that the best interests of the group and
its shareholders would be served by utilizing the transition arrangements outlined by the FRC and retaining BP’s existing audit firm until the conclusion of the term of its current lead partner. Accordingly the committee intends that the audit
contract will be put out to tender in 2016, in order that a decision can be taken and communicated to shareholders at BP’s AGM in 2017; the new audit services contract would then be effective from 2018.
Non-audit services
Audit objectivity and independence is
safeguarded through the limitation of non-audit services to tax and audit-related work which falls within defined categories. BP’s policy on non-audit services states that the auditors may not perform non-audit services that are prohibited by
the SEC, Public Company Accounting Oversight Board (PCAOB) and UK Auditing Practices Board (APB). The categories of approved and prohibited services are outlined below.
The audit committee approves the terms of all audit services as well as permitted audit-related and non-audit services in advance. The external
|
|
|
| Permitted and non-permitted audit services |
|
Permitted services |
| Audit related |
|
|
g Advice on accounting, auditing and financial reporting. |
|
|
g Internal accounting and risk management control reviews. |
|
|
g Non-statutory audit. |
|
|
g Project assurance/advice on business and accounting process improvement. |
|
|
g Due diligence (acquisition, disposals, joint arrangements). |
| Tax services |
|
|
g Tax compliance. |
|
|
g Direct and indirect tax advisory services. |
|
|
g Transaction tax advisory services. |
|
|
g Assistance with tax audits and appeals. |
|
|
g Tax compliance/advisory relating to human capital and performance/reward. |
|
|
g Transfer pricing advisory services. |
|
|
g Tax legislative monitoring. |
|
|
g Tax performance advisory. |
| Other services |
|
|
g Workshops, seminars and training on an arm’s length basis. |
|
|
g Assistance on non-financial regulatory requirements. |
| |
|
g Provision of independent third-party audit on
BP’s Conflict Minerals Report. |
| Prohibited services |
| SEC principles of auditor independence |
|
|
g Book keeping/other services related to financial records. |
|
|
g Financial information systems design and implementation. |
|
|
g Appraisal, valuation, fairness opinions, contribution in-kind. |
|
|
g Actuarial services. |
|
|
g Internal audit outsourcing. |
|
|
g Management functions. |
|
|
g HR functions. |
|
|
g Broker-dealer, investment advisor, banking services. |
|
|
g Legal services. |
|
|
g Expert services unrelated to audit. |
| PCAOB ethics and independence rules |
|
|
g Contingent fees. |
|
|
g Confidential or aggressive tax position transactions. |
| |
|
g Tax services for persons in financial reporting oversight
roles. |
|
|
|
| 76 |
|
BP Annual Report and Form 20-F 2013 |
auditor is only considered for permitted non-audit services when its expertise and experience of the company is important.
A two-tier system for approval of audit-related and non-audit work operates. For services relating to accounting, auditing and financial reporting matters, internal accounting and risk management control reviews or non-statutory audit, the committee
has agreed to pre-approve these services up to an annual, aggregate level. For all other services which fall under the ‘permitted services’ categories, approval above a certain financial amount must be sought on an individual engagement
basis. Any proposed service not included in the permitted services categories must be approved in advance either by the audit committee chairman or the audit committee before engagement commences. The audit committee, chief financial officer and
group controller monitor overall compliance with BP’s policy on audit-related and non-audit services, including whether the necessary pre-approvals have been obtained.
Committee review
The audit committee undertakes an
annual evaluation of its performance and effectiveness. In 2013 the committee used an online survey which examined governance processes such as the mix of experience and skills amongst members, meeting content, information, training and resources.
Areas of focus for 2014 arising from the evaluation included monitoring the length of committee papers, the inclusion of broader business topics on the agenda and suggestions for further committee training.
Safety, ethics and environment assurance committee (SEEAC)

Chairman’s introduction
The SEEAC has continued to monitor closely and provide constructive challenge to management in the drive for safe and reliable operations at all times. This has included
the committee receiving specific reports on the company’s management of high priority risks in shipping, wells, pipelines, facilities and non-operated joint arrangements. The committee has also undertaken a number of field visits as described
in more detail below as well as maintained its schedule of regular meetings with executive management.
The SEEAC has continued to receive regular reports from the
independent experts that it has engaged in both the Upstream (Carl Sandlin) and in the Downstream (Duane Wilson). They have provided valuable insights and advice on many aspects of process safety and we are grateful to them for their work.
Paul Anderson
Committee
chair
Role of the committee
The role of the
SEEAC is to look at the processes adopted by BP’s executive management to identify and mitigate significant non-financial risk. This includes the committee monitoring the management of personal and process safety and receiving assurance that
processes to identify and mitigate such non-financial risk are appropriate in design and effective in implementation.
Key responsibilities
The committee receives specific reports from the business segments but also receives cross-business information from the functions. These include, but are not limited to,
the safety and operational risk function, group audit, group ethics and compliance and group security. The SEEAC can access any other independent advice and counsel if it requires, on an unrestricted basis.
The committee met seven times in 2013, including joint meetings with the audit committee. At one of the joint meetings the committee reviewed the general auditor’s
report on the system of internal control and risk management for the year in preparation for the board’s report to shareholders in the annual report (see ‘Internal Control Revised Guidance for Directors’ (Turnbull) on page 110). In
that joint meeting the committees also reviewed the general auditor’s audit programme for the year ahead to ensure both committees endorsed the coverage. The SEEAC and audit committee worked together, through their chairs and secretaries, to
ensure that the agendas did not overlap or omit coverage of any key risks during the year.
In addition to the committee membership, all of the SEEAC meetings were
attended by the group chief executive, the executive vice president for safety and operational risk (S&OR) and the general auditor or his delegate. The external auditor also attended some of the meetings (and was briefed on the other meetings by
the chair and secretary to the committee). The group general counsel and the group ethics and compliance officer also attended certain meetings. The committee scheduled private sessions for the committee members only (without the presence of
executive management) at the conclusion of each meeting to discuss any issues arising and the quality of the meeting.
Members
|
|
|
| Name |
|
Membership status |
|
|
| Paul Anderson
(chairman) |
|
Member since February 2010; chairman since December 2012 |
|
|
| Frank Bowman |
|
Member since November 2010 |
|
|
| Antony Burgmans |
|
Member since February 2004 |
|
|
| Cynthia Carroll |
|
Member since June 2007 |
|
|
| Ann Dowling |
|
Member since February 2012 |
Activities during the year
Safety, operations and environment
The committee
received regular reports from the S&OR function, including quarterly reports prepared for executive management on the group’s health, safety and environmental performance and operational integrity. These included quarter-by-quarter measures
of personal and process safety, environmental and regulatory compliance and audit findings. Operational risk and performance forms a large part of the committee’s agenda.
During the year the committee received specific reports on the company’s management of risks in shipping, wells, pipelines, facilities and non-operated joint
arrangements. The committee reviewed these risks, and risk management and mitigation, in depth with the relevant executive management.
Independent expert – Upstream
Mr Carl Sandlin
continued in his role as an independent expert to provide further oversight and assurance regarding the implementation of the Bly Report recommendations. He has twice reported directly to the SEEAC in 2013, and presented detailed reports on his
work, including reporting on a number of visits he has made to company operations around the world. He will again report to SEEAC in early 2014.
|
|
|
|
|
| BP Annual Report and Form 20-F 2013 |
|
|
77 |
|
SEEAC focus in 2013
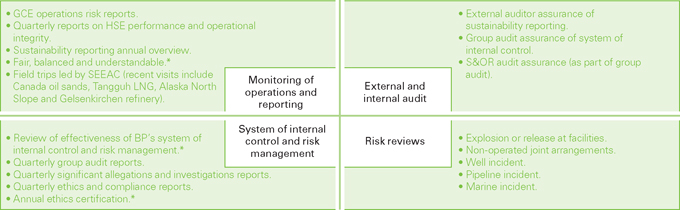
| * |
Undertaken jointly with the audit committee. |
Process safety expert – Downstream
Mr Duane Wilson continued to report to the committee in his role as process safety expert for the Downstream segment. In this role he continues to work with segment
management on a worldwide basis (having previously focused on US refineries) to monitor and advise on the process safety culture and learnings across the segment. He twice reported directly to the SEEAC in 2013 and presented detailed reports on his
work (including reporting on a number of visits he has made to refineries and other downstream facilities).
Reports from group audit and
group ethics & compliance
The committee received quarterly reports from both of these functions. These included summaries of investigations into
significant alleged fraud or misconduct. In addition, both the general auditor and the group ethics and compliance officer met in private with the chairman and other members of the committee.
Field trips
In April the chairman and all other
members of the committee visited Alberta, Canada to examine the oil sands being developed there by the group and third parties. In October a committee member visited operations at the Tangguh LNG facility in West Papua in Indonesia while another
committee member travelled to Alaska and visited operations on the North Slope. In addition, three members of the committee visited the Gelsenkirchen refinery in Germany. In all cases, the visiting committee members received briefings on operations
and the status of local operating management system (OMS) implementation and risk management and mitigation. For each visit, committee members then reported back in detail to the committee and subsequently to the full board.
Committee review
For its 2013 evaluation, the SEEAC used
a questionnaire administered by external consultants to examine the committee’s performance and effectiveness. The committee responded to the same questions used in 2012 so that any change trends could be discerned. The topics covered included
the balance of skills and experience among its membership, the quality and timeliness of the information the committee receives, the level of challenge between committee members and management and how well the committee communicates its activities
and findings to the board.
The evaluation results were generally positive. Committee members considered that the committee possessed the right mix of skills and
background, had an appropriate level of support and had received open and transparent briefings from management. The committee considered that the field trips made by its members had become an important element in the work of the committee, in
particular through such trips giving committee members the ability to examine how risk management is being embedded in businesses and facilities.
Gulf of Mexico committee

Introduction from committee chairman
The Gulf of Mexico committee continues to oversee the group’s response to the Deepwater Horizon accident, ensuring that the company fulfils all of its legitimate
obligations whilst protecting and defending the interests of the group. In the past year, the focus has been on the review of ongoing proceedings in multi-district litigation 2179 and 2185; of the assessment of natural resource damages; and of a
number of other legal proceedings in relation to the Deepwater Horizon accident.
I believe the committee has been thorough in the execution of its duties. The high
frequency of meetings and long tenure of committee membership has enabled members to review an evolving and complex spectrum of issues.
Ian
Davis
Committee chair
Role of the committee
The Gulf of Mexico committee was formed in July 2010 to oversee the management and mitigation of legal and
licence-to-operate risks arising out of the Deepwater Horizon accident and oil spill. The committee’s work is integrated with that of the board, which retains ultimate accountability for oversight of the group’s response to the accident.
|
|
|
| 78 |
|
BP Annual Report and Form 20-F 2013 |
GoM committee focus in 2013
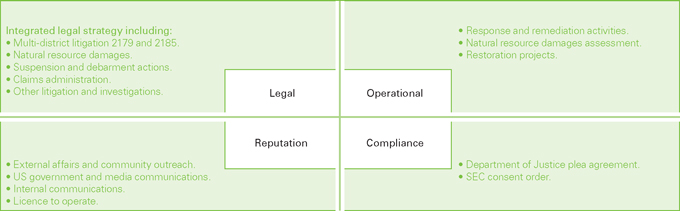
Key responsibilities
| • |
|
Oversee the legal strategy for litigation, investigations and suspension/ debarment actions arising from the accident and its aftermath, including the strategy connected with settlements and claims. |
| • |
|
Review the environmental work to remediate or mitigate the effects of the oil spill in the waters of the Gulf of Mexico and on the affected shorelines. |
| • |
|
Oversee management strategy and actions to restore the group’s reputation in the United States. |
| • |
|
Review compliance with government settlement agreements arising out of the Deepwater Horizon accident and oil spill, including the SEC Consent Order and the Department of Justice Plea Agreement, in coordination with
other committee and board oversight. |
Members
|
|
|
| Name |
|
Membership status |
|
|
| Ian Davis (chair) |
|
Member since July 2010; committee chair since July 2010 |
|
|
| Paul Anderson |
|
Member since July 2010 |
|
|
| Frank Bowman |
|
Member since February 2012 |
|
|
| George David |
|
Member since July 2010 |
Activities during the year
The committee reviewed plans and progress in moving Gulf Coast shoreline response activities through to completion and sign-off by the US Coast Guard. Activities are now
complete in all states with the exception of Louisiana.
The committee continued to oversee numerous legal matters relating to the Deepwater Horizon accident,
including the company’s appeals to the US Court of Appeals for the Fifth Circuit relating to the Court-Supervised Settlement Program and the first two phases of trial in MDL-2179.
The committee met thirteen times in 2013.
Committee review
Each year the Gulf of Mexico committee evaluates its performance and effectiveness. In 2013, the committee again used a questionnaire administered by external
consultants covering the same questions used in 2012 in order to identify trends. Key areas covered included the balance of skills and experience among its membership, quality and timeliness of information and support received by the committee, the
appropriateness of committee tasks and how well the committee communicates its activities and findings to the board. The results of the evaluation were positive. Specific areas identified for focus in 2014 included maintaining constructive and
challenging engagement with management and of continuing timely and effective communication of its activities and findings to the board.
Nomination and chairman’s committees

Chairman’s introduction
I am pleased to report on the two board committees which I chair. Both have been active during the year in seeking to develop the membership of the board and its
governance.
Nomination committee
Role of the committee
The committee ensures an orderly succession of candidates for directors and company secretary.
Key tasks
| • |
|
Identify, evaluate and recommend candidates for appointment or reappointment as directors. |
| • |
|
Identify, evaluate and recommend candidates for appointment as company secretary. |
| • |
|
Keep under review the mix of knowledge, skills and experience of the board to ensure the orderly succession of directors. |
| • |
|
Review the outside directorship/commitments of the non-executive directors. |
|
|
|
| BP Annual Report and Form 20-F 2013 |
|
79 |
Members
|
|
|
| Name |
|
Membership status |
|
|
| Carl-Henric Svanberg (chair) |
|
Member since September 2009;
committee chair since January 2010 |
|
|
| Paul Anderson |
|
Member since April 2012 |
|
|
| Antony Burgmans |
|
Member since May 2011 |
|
|
| Cynthia Carroll |
|
Member since May 2011 |
|
|
| Ian Davis |
|
Member since August 2010 |
|
|
| Brendan Nelson |
|
Member since April 2012 |
Andrew Shilston, as the senior independent director, attends all meetings of the committee.
Activities during the year
The committee met four times
during the year. At the start of the year, the committee reflected on the output of the annual evaluation and determined a rhythm for their meetings during the year. This would include one longer meeting which would review board composition and
skills in the light of the company strategy.
The committee considered the time commitment required from non-executive directors and in particular chairs of
committees in discharging their responsibilities. The committee determined that the time commitment of directors had increased and this should be made clear to those who may join the board.
The membership of the board had been substantially refreshed over the previous three years which has resulted in no director now being scheduled to retire earlier than
the 2016 AGM. Therefore the committee during the year reviewed the current skills of the board and those required by the board over the coming years as the company’s strategy is implemented.
In conducting this review the committee initiated interviews with all directors. The conclusion of the review was that whilst the current board’s skills matched
those presently required, in seeking future candidates there should be a greater focus on the business of BP, US government relations and, possibly, Russia. All of this was against the background of the board’s clear aspirations on diversity
and the work of the international advisory board in supporting the chairman and the chief executive on geo-political issues.
As part of the review, directors were
asked to comment on how the board should work in future given that the company had substantially emerged from the crisis in the Gulf of Mexico. The main conclusions were:
| • |
|
The board was moving towards a more normal rhythm. Its operation had improved over the past three years. The goal should be simplification and clarity in materials and discussion. Substantial progress had been made.
|
| • |
|
The board should continue its focus on strategy and performance, with the committees taking the lead on monitoring. Tasks of the board and committees and their agendas should be reviewed to ensure that the board was
addressing the relevant strategic challenges and the committees were complete in their monitoring task. |
| • |
|
There should be further focus on major projects and capital investment to ensure that value was being created. |
Against
this background, the committee continued to work with an executive search firm to identify potential candidates and to engage with them as appropriate. The committee was aware of the board’s aspirations on gender diversity. It is important, in
the committee’s view, that any candidates have the requisite skills to join the board. Potential candidates with a diverse background have been identified, and it is anticipated that an appointment will now likely be made in 2014.
Finally, the committee reviewed the current composition of the board and independence of non-executive directors, and
recommended to shareholders all directors for re-election at the 2013 AGM.
Committee review
The committee undertook an annual evaluation of its effectiveness and performance, using a questionnaire. The review concluded that there had been an improvement in the
timeliness of distribution of pre-read and that the longer session focusing on board composition, skills and the fit with the group’s strategy had been valuable and should be repeated annually.
Chairman’s committee
Role
To provide a forum for matters to be discussed
amongst the non-executive directors.
Tasks
| • |
|
Evaluate the performance and the effectiveness of the group chief executive (GCE). |
| • |
|
Review the structure and effectiveness of the business organization of BP. |
| • |
|
Review the systems for senior executive development and determine the succession plan for the GCE, the executive directors and other senior members of executive management. |
| • |
|
Determine any other matter which is appropriate to be considered by all of the non-executive directors. |
| • |
|
Opine on any matter referred to it by the chairman of any committees comprised solely of non-executive directors. |
Members
The committee comprises all the non-executive directors who join the committee at the date of their appointment to the board. The
chief executive attends the committee when requested.
Activities
The committee met six times during the year.
The committee reviewed:
| • |
|
The performance of the chairman and the chief executive early in the year. Parameters were set for evaluations in 2014. |
| • |
|
The developing position in the US Courts in respect of the implementation of the settlement with the Plaintiffs Steering Committee, including the business economic loss claims and the activities of the Claims
Administrator, the federal judge and the appeals court. The work of Judge Freeh was also considered. |
| • |
|
A number of issues relating to the company’s strategy in the light of the views of shareholders and the market more generally. |
| • |
|
The chief executive’s succession plans for the executive team and senior leaders. The committee also considered the organization and operation of the executive team.
|
|
|
|
| 80 |
|
BP Annual Report and Form 20-F 2013 |
Chairman’s annual statement

Dear shareholder
BP continued the disciplined and systematic execution of its strategy during 2013, focusing on safety and operational risk management, and on restoring value. As in 2012,
there were many positive steps in the recovery journey during 2013 including improved safety, a strengthened portfolio and a new future in Russia. I encourage you to read about these in more detail elsewhere in this annual report.
Remuneration for executive directors continues to be tied closely to this overall recovery of the group. The vast majority of potential remuneration is based on outcomes
relative to measures related directly to the company’s strategy and key performance indicators. In addition to a direct link to strategy, our remuneration system has a strong bias towards sustained long-term performance, and our decisions
regarding remuneration are guided by key principles of informed judgement, fair treatment and alignment with shareholders. My meetings with shareholders this year have again been helpful in understanding perspectives and have led to a few
modifications to our policy.
Our report this year reflects the new UK regulations on directors’ remuneration and so is divided into an annual report on
remuneration and a separate policy report. The annual report on remuneration sets out and explains the outcomes of the various elements that make up 2013 total remuneration. The policy report explains our proposed remuneration policy for the next
three years which, subject to approval by shareholders, will come into effect from the AGM. For both sections the information relating to executive directors (whose remuneration is determined by the remuneration committee) is presented separately
from that relating to non-executive directors (whose remuneration is determined by the full board).
2013 outcomes
I am pleased to report that remuneration for 2013, as summarized on page 85, increased after several years where pay was significantly depressed by the aftermath of the
Deepwater Horizon incident. It is particularly encouraging that a moderate portion of shares in the long-term performance share plan has vested this year. These outcomes reflect strong and sustained performance with safety steadily improving,
operations performing well and a portfolio of assets growing through capital discipline and strong project management. The significant divestments of the last few years have made the company smaller but stronger, with improved potential to grow
value.
Annual bonus
It was a good year for BP with improved safety, new discoveries and operations, a strengthened portfolio and benefits already accruing from the company’s new
relationship in Russia. Overall group performance exceeded annual plan levels and resulted in a score of 1.32 times target. Performance was assessed relative to metrics set at the start of the year and reflecting the company’s strategy and key
performance indicators.
Safety and operational risk management accounted for 30% of annual bonus. Led strongly from the top, this continued to show encouraging
progress with particularly significant reductions in tier 1 process safety events and loss of primary containment – both important measures of process safety. Results this year confirm that it remains a constant priority throughout the
business.
The company also made good gains in restoring value, which accounted for 70% of annual bonus. Underlying replacement cost profit and total cash costs were
both better than plan targets, while operating cash flow achieved target levels. Key operating performance was also positive with important major projects commissioned and a significant improvement in unplanned Upstream deferrals. Downstream
operations demonstrated high availability and good safety results but profitability was impacted by a difficult business environment affecting refinery margins.
Deferred bonus
The first of the deferred bonus share awards, implemented in 2010, became eligible for vesting at the end of 2013.
Vesting was dependent on safety and environmental sustainability performance over the period from 2011 through 2013. Our review confirmed very positive results during this period with consistent improvements in key metrics and no major incidents.
Based on this positive result, the deferred and matched shares for this period vested fully.
Performance shares
The 2011-2013 performance share plan, the first plan commencing after the Deepwater Horizon incident, focused on value creation, reinforcing safety and risk management
and rebuilding trust. 50% of the award was dependent on total shareholder return which failed to make the threshold required for vesting. Reserves replacement, accounting for 20% of the award, is expected to be very positive and progress relative to
the strategic imperatives, accounting for the remaining 30%, was very encouraging. Overall, we expect nearly 40% of shares will vest, the highest in over 10 years.
Other elements
Salaries were increased by just under 3% for Bob Dudley, Iain Conn and Dr Brian Gilvary mid-year. Pension increases
reflect normal plan rules and valuation according to UK regulations. The increased value reported for Bob Dudley reflects his promotion to group chief executive in 2010 which, because his defined benefit pension is based on three-year average
remuneration, takes a number of years to reach a steady state. In addition, the reported value is calculated according to UK regulations and the committee has been informed by the company’s consulting actuaries that these significantly
overstate the value of his US pension increase.
Remuneration policy
Attracting and retaining top talent is a key objective of our approach to remuneration. Our proposed policy, as summarized on page 98, remains largely unchanged from that
which has applied for a number of years and its continuity has been a stabilizing force during a period of company turbulence. The core elements of salary, annual bonus, deferred bonus, performance shares and pension continue to provide an
effective, relatively simple, performance-based system that fits well with the long-term nature of BP’s business and strategy.
Three modifications have been
included in our proposed policy as a result of our dialogue with investors. First, we have added a three-year retention period in the deferred bonus element for those matched shares that vest in the plan. Second, we have made the vesting of
performance shares more stringent for those metrics based on performance relative to other oil majors. Finally, we have added a specific review of performance share vesting to ensure that high levels of vesting are consistent with shareholder
benefits.
All of the above are explained in more detail in the policy report.
|
|
|
| 82 |
|
BP Annual Report and Form 20-F 2013 |
EDIP renewal
The executive directors’ incentive plan (EDIP) has provided the umbrella framework for share-based remuneration for BP executive directors since it was first
approved by shareholders in April 2000. It was renewed both in 2005 and 2010 and will expire in April 2015 according to its current mandate. The UK Listing Rules require a separate approval for this plan despite it largely being a duplication of
what is included in the new policy report governed by a different regulatory regime. Given that the EDIP is an important vehicle to implement the remuneration policy, we concluded that it was appropriate to bring its renewal forward to coincide with
the first
policy vote. Details appear under resolution 19 in the Notice of Meeting, and are consistent with those included in the policy report.
It is reassuring to see momentum building in the business, led by a talented top team with resolve and commitment. Our remuneration system has worked appropriately during
difficult times, and I am confident it will continue to do so as and when performance returns to healthy sustained levels.
Antony Burgmans
Chairman of the remuneration committee
6 March 2014
|
|
| Remuneration – the big picture
|
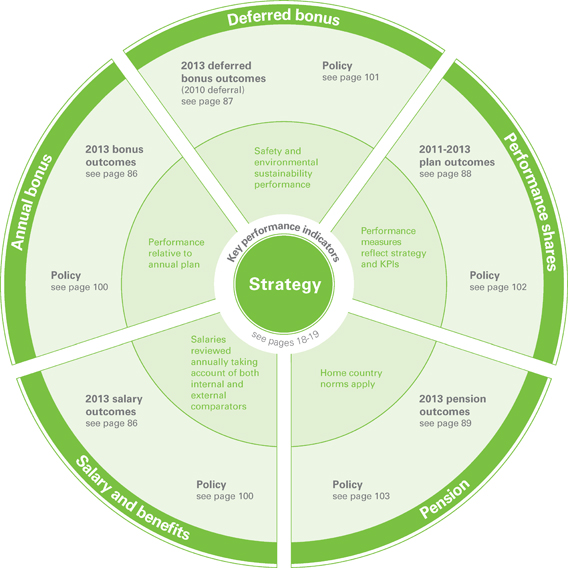
|
|
|
|
|
| BP Annual Report and Form 20-F 2013 |
|
|
83 |
|
2013 annual report on remuneration
This section reports on the remuneration outcomes for 2013 and is divided into separate sections for executive and non-executive
directors.
The remuneration of the executive directors is set by the remuneration committee (the committee) under delegated powers
from the board. The committee makes a recommendation to the board for the remuneration of the chairman. The remuneration of the non-executive directors is set by the board based on a recommendation from the chairman, the group chief executive and
the company secretary.
(a) Executive directors
Total remuneration summary
Strategy > Key performance indicators > Performance > Pay
The clear link from strategy through to pay continues. For several years the company’s strategy has centred on enhancing safety and risk management, rebuilding trust
and restoring value. This strategy has provided focus for key performance indicators (KPIs) and in turn the measures for annual bonus, deferred bonus and performance share plans.
2013 summary of outcomes
These are shown in the table
opposite and represent the following:
| • |
|
Salary – reviewed mid-year and increased just under 3% for all except Dr Byron Grote who retired mid-year. |
| • |
|
Annual bonus – overall group bonus was based 30% on safety and operational risk (S&OR) management and 70% on restoring value. S&OR results were good both in terms of
improvement and overall standard. Similarly, performance relative to value measures was overall better than the annual plan. Overall group outcome was 1.32 times target level. |
The resulting cash bonuses are shown in the table opposite with total deferred bonuses reflected in the ‘Conditional equity’ table as required
by UK regulations. Dr Byron Grote, given his retirement, was not eligible for any deferral, and his bonus (prorated to reflect his service) was paid in cash.
| • |
|
Deferred bonus – the 2010 deferred bonus was contingent on safety and environmental sustainability performance over the period 2011 through 2013. Overall assessment was very
positive based on continually improving safety and risk management performance and strong evidence of ingrained safety culture and systems throughout the organization. Based on this, 2010 deferred and matched shares
vested. |
| • |
|
Performance shares – the 2011-2013 plan was based 50% on total shareholder return (TSR) and 20% on reserves replacement, both relative to the other oil majors, and reflecting the
key strategic focus on restoring value. The final 30% was based on strategic imperatives made up equally of safety and risk management, external reputation and staff alignment and morale – all key strategic priorities in the period after the
Deepwater Horizon incident in 2010. 39.5% of shares in the plan are expected to vest based on strong reserves replacement performance and good progress against all three strategic imperatives. TSR performance did
not achieve the minimum level required for any vesting. |
| • |
|
Pension – pension figures reflect the UK requirements to show 20 times the increase in pension value for defined benefit schemes, as well as any cash paid in lieu. In the case of
Bob Dudley’s reported figures, this UK requirement overstates the increase in the actuarial value of his US pension by several million dollars.
|
|
|
|
| 84 |
|
BP Annual Report and Form 20-F 2013 |
Single figure table of remuneration of executive directors in 2013 (audited)
|
|
|
|
|
|
|
|
|
|
|
|
|
|
|
|
|
|
|
|
|
|
|
|
|
|
|
|
|
|
|
|
|
| Remuneration is reported in the currency received
by the individual |
|
| |
|
|
Bob Dudley
thousand |
|
|
|
Iain Conn
thousand |
|
|
|
Dr Brian Gilvary
thousand |
|
|
|
Dr Byron Grote
thousand |
|
| Annual remuneration 2013 |
|
|
2013 |
|
|
|
2012 |
|
|
|
2013 |
|
|
|
2012 |
|
|
|
2013 |
|
|
|
2012 |
|
|
|
2013 |
|
|
|
2012 |
|
| Salary |
|
|
$1,776 |
|
|
|
$1,726 |
|
|
|
£763 |
|
|
|
£741 |
|
|
|
£700 |
|
|
|
£690 |
|
|
|
$743 |
|
|
|
$1,464 |
|
| Annual cash bonusa |
|
|
$2,344 |
|
|
|
$837 |
|
|
|
£961 |
|
|
|
£374 |
|
|
|
£924 |
|
|
|
£366 |
|
|
|
$1,470 |
|
|
|
$710 |
|
| Benefits |
|
|
$90 |
|
|
|
$86 |
|
|
|
£59 |
|
|
|
£39 |
|
|
|
£45 |
|
|
|
£13 |
|
|
|
$10 |
|
|
|
$15 |
|
| Total |
|
|
$4,210 |
|
|
|
$2,649 |
|
|
|
£1,783 |
|
|
|
£1,154 |
|
|
|
£1,669 |
|
|
|
£1,069 |
|
|
|
$2,223 |
|
|
|
$2,189 |
|
| |
|
|
|
|
|
|
|
|
|
|
|
|
|
|
|
|
|
|
|
|
|
|
|
|
|
|
|
|
|
|
|
|
| Vested equity |
|
|
|
|
|
|
|
|
|
|
|
|
|
|
|
|
|
|
|
|
|
|
|
|
|
|
|
|
|
|
|
|
| Deferred bonus and matchb |
|
|
$0 |
|
|
|
$0 |
|
|
|
£242 |
|
|
|
£0 |
|
|
|
£0 |
|
|
|
£0 |
|
|
|
$893 |
|
|
|
$0 |
|
| Performance shares |
|
|
$4,522 |
c |
|
|
$0 |
|
|
|
£1,332 |
c |
|
|
£666 |
|
|
|
£505 |
c |
|
|
£299 |
|
|
|
$2,225 |
c |
|
|
$0 |
|
| Total |
|
|
$4,522 |
|
|
|
$0 |
|
|
|
£1,574 |
|
|
|
£666 |
|
|
|
£505 |
|
|
|
£299 |
|
|
|
$3,118 |
|
|
|
$0 |
|
| |
|
|
|
|
|
|
|
|
|
|
|
|
|
|
|
|
|
|
|
|
|
|
|
|
|
|
|
|
|
|
|
|
| Total remuneration |
|
|
$8,732 |
|
|
|
$2,649 |
|
|
|
£3,357 |
|
|
|
£1,820 |
|
|
|
£2,174 |
|
|
|
£1,368 |
|
|
|
$5,341 |
|
|
|
$2,189 |
|
| Pension |
|
|
|
|
|
|
|
|
|
|
|
|
|
|
|
|
|
|
|
|
|
|
|
|
|
|
|
|
|
|
|
|
| Pension value increased |
|
|
$4,447 |
|
|
|
$6,535 |
e |
|
|
£46 |
|
|
|
£0 |
|
|
|
£44 |
|
|
|
£1,024 |
|
|
|
$141 |
|
|
|
$747 |
|
| Cash in lieu of future accrualf |
|
|
N/A |
|
|
|
N/A |
|
|
|
£267 |
|
|
|
£259 |
|
|
|
£245 |
|
|
|
£242 |
|
|
|
N/A |
|
|
|
N/A |
|
| Total including pension |
|
|
$13,179 |
|
|
|
$9,184 |
|
|
|
£3,670 |
|
|
|
£2,079 |
|
|
|
£2,463 |
|
|
|
£2,634 |
|
|
|
$5,482 |
|
|
|
$2,936 |
|
| a |
This reflects the amount of total overall bonus paid in cash with the deferred portion set out in the conditional equity table below. The relevant portions are two-thirds cash and one-third deferred. |
| b |
This relates to the deferred bonus from prior years that vests. |
| c |
Represents the assumed vesting of shares in 2014 following the end of the relevant performance period, based on anticipated performance achieved under the rules of the plan and includes re-invested dividends on shares
vested. In accordance with UK regulations, the vesting price of the assumed vesting is the average market price for the fourth quarter of 2013 which was £4.69 for ordinary shares and $45.52 for ADSs. |
| d |
Represents the annual increase in accrued pension multiplied by 20 as prescribed by UK regulations. For Bob Dudley the increase in actuarial value of $1,319,000 is considered to be a more accurate reflection of the
increase. |
| e |
The figure for 2012 has been restated on the same basis as 2013 to be consistent with the finalized UK regulations. |
| f |
As for all employees affected by UK pension tax limits and who wished to remain within these limits, with effect from April 2011, Iain Conn and Dr Brian Gilvary received a cash supplement of 35% of basic salary in lieu
of future service pension accrual. |
Conditional equity – to vest in future years, subject to performance
|
|
|
|
|
|
|
|
|
|
|
|
|
|
|
|
|
|
|
|
|
|
|
|
|
|
|
|
|
|
|
|
|
|
|
|
|
| |
|
|
|
|
|
|
Bob Dudley |
|
|
|
Iain Conn |
|
|
|
Dr Brian Gilvary |
|
|
|
Dr Byron Grote |
|
| Deferred bonus in respect of bonus year |
|
|
|
2013 |
|
|
|
2012 |
|
|
|
2013 |
|
|
|
2012 |
|
|
|
2013 |
|
|
|
2012 |
|
|
|
2013 |
|
|
|
2012 |
|
| Total deferred bonus |
|
|
Value (thousand) |
|
|
|
$1,172 |
|
|
|
$1,674 |
|
|
|
£481 |
|
|
|
£748 |
|
|
|
£462 |
|
|
|
£732 |
|
|
|
$0 |
|
|
|
$1,420 |
|
| Total deferred converted to shares |
|
|
Shares |
|
|
|
149,628 |
|
|
|
229,380 |
|
|
|
100,563 |
|
|
|
161,296 |
|
|
|
96,653 |
|
|
|
157,630 |
|
|
|
0 |
|
|
|
194,556 |
|
| Total matched shares |
|
|
Shares |
|
|
|
149,628 |
|
|
|
229,380 |
|
|
|
100,563 |
|
|
|
161,296 |
|
|
|
96,653 |
|
|
|
157,630 |
|
|
|
0 |
|
|
|
32,424 |
|
| Vesting date |
|
|
|
|
|
|
Feb 2017 |
|
|
|
Feb 2016 |
|
|
|
Feb 2017 |
|
|
|
Feb 2016 |
|
|
|
Feb 2017 |
|
|
|
Feb 2016 |
|
|
|
Feb 2017 |
|
|
|
Feb 2016 |
|
| |
|
|
|
|
|
|
|
|
|
|
|
|
|
|
|
|
|
|
|
|
|
|
|
|
|
|
|
|
|
|
|
|
|
|
|
|
| Performance share element |
|
|
|
2013-2015 |
|
|
|
2012-2014 |
|
|
|
2013-2015 |
|
|
|
2012-2014 |
|
|
|
2013-2015 |
|
|
|
2012-2014 |
|
|
|
2013-2015 |
|
|
|
2012-2014 |
|
| Potential maximum shares |
|
|
|
|
|
|
1,384,026 |
|
|
|
1,343,712 |
|
|
|
694,688 |
|
|
|
660,633 |
|
|
|
637,413 |
|
|
|
624,434 |
|
|
|
142,278 |
|
|
|
414,468 |
|
| Vesting date |
|
|
|
|
|
|
Feb 2016 |
|
|
|
Feb 2015 |
|
|
|
Feb 2016 |
|
|
|
Feb 2015 |
|
|
|
Feb 2016 |
|
|
|
Feb 2015 |
|
|
|
Feb 2016 |
|
|
|
Feb 2015 |
|
|
|
|
|
|
| BP Annual Report and Form 20-F 2013 |
|
|
85 |
|
Total remuneration in more depth
2013 outcomes
Salaries were reviewed in May 2013 using a number of internal and external comparisons. Externally, the competitiveness of
salaries and of overall packages relative to other oil majors, other large UK and Europe-based international companies and related US companies were considered. Internally the committee reviewed three distinct groups – the overall level of
increases for all employees in both the UK and the US, the distribution and average level of increases for ‘group leaders’ comprising around 500 top executives in the company, and finally the individual and average increases for the top
executive team.
Based on this review, salaries were increased by 2.8% for Bob Dudley (to $1,800,000), 2.9% for Iain Conn (to
£774,000) and 2.9% for Dr Brian Gilvary (to £710,000) effective 1 July 2013.
Total benefits received by executive directors included car-related
benefits, security assistance, insurance and medical benefits. The total value of taxable benefits is included in the summary table on page 85.
2014 implementation
The remuneration committee
intends to review salaries in May 2014 and will again consider both internal and external comparisons. Benefits will continue unchanged.
Framework
All executive directors were eligible for an overall annual bonus, including deferral, of 150% of salary at target and 225%
of salary at maximum – unchanged since 2010.
Bob Dudley’s annual bonus was based entirely on group results, as was Dr Brian Gilvary’s and Dr Byron
Grote’s. Iain Conn’s was based 70% on group results and 30% on his Downstream segment results.
Measures and targets for the annual bonus were set at the
start of the year and were derived from the company’s annual plan which, in turn, reflected the company’s strategy and KPIs. Measures were grouped under the dominant themes of S&OR management, and restoring value. Targets were set so
that meeting the plan equates to on-target bonus.
At group level, S&OR was set to account for 30% of total bonus and included targets for loss of primary containment,
process safety tier 1 events and recordable injury frequency. Value measures were set to account for 70% of total bonus and included targets for operating cash flow, underlying replacement cost profit, total cash costs, Upstream unplanned deferrals,
major project delivery and Downstream net income per barrel.
Additional measures and targets were set for Iain Conn’s Downstream segment. These focused on
safety, operating efficiency and profitability.
As well as the specific measures set out, the committee considers any other results or factors it deems relevant and
applies its overall judgement in determining final bonus outcomes.
2013 annual bonus outcomes

2013 outcomes
Overall group performance outcomes for the year are summarized in the table above.
S&OR management performance, weighted at 30%, was positive. Process safety events declined significantly to amongst the lowest of the oil majors. Loss of primary
containment did not meet its target but still showed an improvement of more than 10% over 2012. Recordable injury frequency continued to show marked improvement.
Performance related to value measures were similarly positive. Underlying replacement cost profit and total cash costs both came in better than plan targets while
operating cash flow met its plan level. Major projects met plan with one exception and Upstream unplanned deferrals exceeded target with a 30% improvement compared to 2012. Finally, Downstream net income per barrel was below target reflecting
difficult trading conditions.
Based on these results, the group performance factor is calculated at 1.32 times target. The committee, as is its normal practice,
considered this result in the context of the underlying performance of the group, competitors’ results, shareholder feedback and input from the board and other committees. After review, it concluded that this represented fairly the overall
performance of the business during the year and confirmed the
score for group purposes.
In the Downstream segment, safety results were good with improvement in most areas of
process and personal safety. Performance related to value measures was negatively impacted by compression of fuel margins and so operating cash flow was below plan level, but other operating measures were at or better than plan. A performance score
of 1.13 times target was achieved.
Overall bonus is determined by multiplying the group score of 1.32 times target by the on-target bonus level of 150% of salary.
Bob Dudley’s total overall bonus therefore was 198% of salary (1.32x150%). The same score was applied to each of the other executive directors for group outcomes resulting in both Dr Brian Gilvary and Dr Byron Grote also receiving an overall
bonus of 198% of salary. Combined with the results for his segment (accounting for 30% of his bonus), Iain Conn’s total overall score was 1.26 times target, resulting in a bonus of 189% of salary.
Of the total bonuses referred to above, one-third is paid in cash, one-third is deferred on a mandatory basis, and one-third is paid either in cash or voluntarily
deferred at the individual’s election. Dr Byron Grote, who retired mid-year, was not eligible for deferral and so his entire bonus (reflecting his six months of service) was paid in cash.
|
|
|
| 86 |
|
BP Annual Report and Form 20-F 2013 |
2013 overall bonus outcome
|
|
|
|
|
|
|
|
|
| |
|
|
Paid
in cash |
|
|
|
Total
deferred |
|
| Bob Dudley |
|
|
$2,343,660 |
|
|
|
$1,171,830 |
|
| Iain Conn |
|
|
£961,380 |
|
|
|
£480,690 |
|
| Dr Brian Gilvary |
|
|
£924,000 |
|
|
|
£462,000 |
|
| Dr Byron Grote |
|
|
$1,470,150 |
|
|
|
$0 |
|
2014 implementation
For 2014, 100% of Bob Dudley’s and Dr Brian Gilvary’s bonus will be based on group results. Iain Conn will again have 70% of his bonus determined on group
results and 30% on his Downstream segment results.
The committee determines specific measures and targets each year that reflect the priorities in the group’s annual
plan and KPIs, both of which are derived from the company’s strategy. For 2014 there will be no change from the measures and weightings used in 2013 other than a minor change to the treatment of cost management. The table below shows the group
measures that will be used, the weight attached to each and the alignment with KPIs and group strategy.
Targets have been agreed for each of the measures based on
the annual plan. In addition the committee uses its judgement to set the range of bonus payouts from minimum acceptable at threshold to very stretching but achievable at maximum.
2014 annual bonus measures

Framework
One-third of the total bonus awarded to the executive directors is required to be paid in shares under the terms of the deferred bonus element. Deferred shares are
matched on a one-for-one basis and, after three years, vesting for both deferred and matched shares is contingent on an assessment of safety and environmental sustainability over the three-year deferral period.
Individuals may elect to defer up to an additional one-third of total bonus into shares on the same basis and subject to the same contingency as the mandatory deferral.
2013 outcomes
No bonuses were paid for group
results in 2010, however both Iain Conn and Dr Byron Grote received a limited bonus related to their segment results that year. Deferrals from these were converted to shares, matched one-for-one, and deferred for three years from the start of 2011.
The three-year performance period concluded at the end of 2013 and vesting was subject to a review of safety and environmental sustainability performance over the three-year deferral period. The committee reviewed safety and environmental
sustainability performance over this period and, as part of this review, sought the input of the safety, ethics and environment assurance committee (SEEAC). Over the three-year period 2011-2013 safety measures showed a steady improvement, there were
no major incidents, and the group-wide operating management system showed good signs of driving improvement in environmental as well as safety areas.
Based on their
review, the committee approved full vesting of the deferred and matched shares for the 2010 deferred bonus as shown in the following table (as well as in the total remuneration summary chart on page 85).
2010 deferred bonus vesting
|
|
|
|
|
|
|
|
|
|
|
|
|
|
|
|
|
| Name |
|
|
Shares
deferred |
|
|
|
Vesting
agreed |
|
|
|
Total shares
including
dividends |
|
|
|
Total
value
at vesting |
|
| Iain Conn |
|
|
42,768 |
|
|
|
100% |
|
|
|
49,340 |
|
|
|
£241,766 |
|
| Dr Byron Grote |
|
|
97,548 |
|
|
|
100% |
|
|
|
110,640 |
|
|
|
$892,680 |
|
Dr Byron Grote’s vesting reflected a prorating of the matched shares component to reflect his service. Dr Brian Gilvary participated
in a separate deferred bonus plan prior to his appointment as an executive director and details of this are provided in the table on page 93.
Information on the
deferred bonus awards made in early 2013, and pertaining to 2012 bonuses, was set out in last year’s report and a summary is included in the table on page 85.
2014 implementation
The remuneration committee has determined that the safety and environmental sustainability performance hurdle will
continue to apply to shares deferred from the 2013 bonus and that there will be no change to these measures. It has also proposed that in future all matched shares that vest will, after sufficient shares have been sold to pay tax, be subject to an
additional three-year retention period before being released to the individual, further reinforcing our long-term orientation. These features are described in more detail in the policy section of the report and have been implemented for shares
deferred from the 2013 bonus.
|
|
|
|
|
| BP Annual Report and Form 20-F 2013 |
|
|
87 |
|
Framework
Performance shares were awarded to each executive director in early 2011 with vesting after three years dependent on performance relative to measures reflecting the
company’s strategic priorities in the period after the Deepwater Horizon accident. For the 2011-2013 plan, vesting was based 50% on TSR compared to the peer group, 20% on reserves replacement ratio, also relative to the peer group, and 30% on a
set of strategic imperatives for rebuilding trust. These centred on S&OR
management, rebuilding BP’s external reputation, and reinforcing staff alignment and morale.
The peer
group includes ExxonMobil, Shell, Chevron and Total. ConocoPhillips was originally included as part of the peer group but was removed following its demerger (with no impact on outcome in any case). Vesting was set at 100%, 70% and 35% for
performance equivalent to first, second and third rank respectively and none for fourth or fifth place of the peer group.
2011-2013 performance shares
outcome
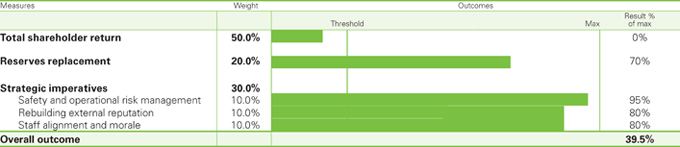
2013 outcomes
Overall, 39.5% of the shares awarded in the 2011-2013 plan are expected to vest, based on results as shown in the table above.
Relative TSR was weighted heaviest, reflecting the high strategic priority on restoring value. Outcomes failed to meet the threshold required and so no shares vested for
this measure.
Reserves replacement has been very positive and we expect that BP will be in second place amongst the oil majors. Since the actual results of the other
majors are not publicly available until their respective annual reports are published, the committee will review the outcomes when all information is confirmed and decide then on the final vesting. For the purposes of this report, and in accordance
with UK regulations, second place has been assumed. Any adjustment to this will be reported in next year’s annual report on remuneration.
The committee’s
review also concluded that progress against the three strategic imperatives has been positive. S&OR management culture has shown steady improvement and its high importance increasingly embedded in the minds of employees, as demonstrated by our
internal surveys. Moreover the S&OR performance metrics have consistently improved including against those of our peers. BP’s external reputation has similarly shown steady improvement as measured by external surveys assessing reputation
amongst different groups in key countries. Finally, staff alignment and morale has been reassuringly positive in the aftermath of the Deepwater Horizon accident, with internal surveys demonstrating improvements and a high scoring of measures related
to group priorities including safety and trust.
As in past years, the committee also considers the overall performance of the company during the period and whether any
other relevant factors should be taken into account. Following this review, the committee concluded that a 39.5% vesting was a fair reflection of overall performance pending confirmation of the reserves replacement result. This will result in the
vesting as shown in the table below.
2011-2013 performance shares outcome
|
|
|
|
|
|
|
|
|
|
|
|
|
| |
|
|
Shares
awarded |
|
|
|
Shares vested
inc
dividends |
|
|
|
Value of
vested shares |
|
| Bob Dudley |
|
|
1,330,332 |
|
|
|
596,028 |
|
|
|
$4,521,866 |
|
| Iain Conn |
|
|
623,025 |
|
|
|
283,920 |
|
|
|
£1,331,585 |
|
| Dr Brian Gilvary |
|
|
90,000 |
|
|
|
102,550 |
|
|
|
£504,509 |
|
| Dr Byron Grote |
|
|
654,498 |
|
|
|
293,232 |
|
|
|
$2,224,653 |
|
Dr Brian Gilvary’s vesting reflects awards granted prior to him joining the board under equivalent plans below board level which have
vested in early 2014. Dr Byron Grote’s award has been prorated to reflect his service prior to retirement.
Information on performance shares awarded in early
2013, relating to the 2013-2015 period, was set out in last year’s report and a summary is included in the table on page 85.
|
|
|
| 88 |
|
BP Annual Report and Form 20-F 2013 |
2014 implementation
Shares were awarded in early 2014 to a value of five and a half times salary to Bob Dudley and four times salary to Iain Conn and Dr Brian Gilvary (details of which are
shown in the table on page 85). These have been awarded under the performance share element of the executive directors’ incentive plan (EDIP) and are subject to a three-year performance period, and for those shares that vest are subject, after
tax, to an additional three-year retention period.
The 2014-2016 performance share plan will be based on the same measures as used last year and remain aligned directly with
the company’s strategic priorities and KPIs.
2014-2016 performance shares

TSR and reserves replacement ratio will be assessed on a relative basis compared with the other oil majors – Chevron,
ExxonMobil, Shell and Total. As set out in the policy report, commencing with the 2014-2016 plan, vesting will be 100%, 80% and 25% for first, second and third place respectively amongst the oil majors and no vesting for fourth or fifth place. The
committee has agreed targets and ranges for the other measures that
will be used to assess performance at the end of the three-year performance period. As part of its overall assessment it also considers whether, in the event of high levels of vesting, the result
is consistent with benefits achieved by shareholders. Full details are included in the policy report.
Framework
Executive directors are eligible to participate in company pension schemes that apply in their home countries which follow national norms in terms of structure and
levels. Bob Dudley participates in the US plans (as did Dr Byron Grote), and Iain Conn and Dr Brian Gilvary in the UK plan. Full details on these plans are set out in the policy section of this report (page 103).
|
|
|
|
|
|
|
|
|
|
|
|
|
|
|
|
|
|
|
|
|
| |
|
|
Service at
31 Dec 2013 |
|
|
|
Total accrued
pension
at 31 Dec 2013 |
|
|
|
Additional
pension earned during 2013
(net of inflation) |
|
|
|
Actuarial value
of
increase earned during 2013 |
|
|
|
20 times
increase
earned during 2013 |
|
| |
|
|
|
|
(thousand) |
|
| Bob Dudley (US) |
|
|
34 |
|
|
|
$2,050 |
|
|
|
$222 |
|
|
|
$1,319 |
|
|
|
$4,447 |
|
| Iain Conn (UK) |
|
|
28 |
|
|
|
£326 |
|
|
|
£2 |
|
|
|
£0 |
|
|
|
£46 |
|
| Brian Gilvary (UK) |
|
|
27 |
|
|
|
£326 |
|
|
|
£2 |
|
|
|
£0 |
|
|
|
£44 |
|
| Byron Grote (US) |
|
|
n/a |
|
|
|
$1,416 |
|
|
|
$7 |
|
|
|
-$93 |
|
|
|
$141 |
|
2013 outcomes
The table above sets out the change in pension for each of the executive directors for 2013.
Bob Dudley’s pension increase is largely due to his promotion to group chief executive in late 2010. Since his pension is based on three-year average salary and
bonus, the impact of a promotion takes a number of years to be fully reflected in his pension. He is entitled, as all former Amoco heritage employees, to receive the greater of the BP or Amoco plans that apply. As part of the transition agreed at
the time of merger, the Amoco plan stopped accruing at the end of 2012, and therefore the BP plan applicable to senior US executives will now determine his overall accrued benefit. His total benefit under this plan is calculated as 1.3% of final
average earnings (including, for this purpose, base salary plus cash bonus and bonus deferred into a compulsory or voluntary award under the deferred matching element) for each year of service (without regard for tax limits) which may be paid from
various qualified and non-qualified plans as described in the policy section of this report. The calculations in the above table reflect this transition. The calculations also incorporate the latest bonus reported on when determining the average of
the best three successive years’ bonus in the final average earnings calculation. Last year’s numbers have been updated to be on a consistent basis.
Iain Conn and Dr Brian Gilvary participate in UK pension arrangements. The disclosure of total pension includes any cash in
lieu of additional accrual that is paid to individuals in the UK scheme who have exceeded the annual allowance or lifetime allowance under UK regulations. Both Iain Conn and Dr Brian Gilvary fall into this category and in 2013 received cash
supplements of 35% of salary in lieu of future service accrual.
In terms of calculating the increase in pension value both a column on 20 times additional pension
earned during the year as required by the new UK regulations, as well as the actuarial value increase as previously stipulated have been included in the table above. The summary table on page 85 uses the 20 times additional pension earned figure and
the cash supplements are separately identified.
In Bob Dudley’s case, the committee has been informed by the company’s consulting actuaries, Mercer, that
the factor of 20 substantially overstates the increase in value of his pension benefits primarily because his US pension benefits are not subject to cost of living adjustments after retirement, as they are in the UK. They have indicated that a
typical annuity factor for such US benefits is around 12, as compared to a UK plan where a factor of 20 is often taken to reflect the increase in value of pension benefits (as well as being required by UK regulations). Therefore the committee
considers that the actuarial value of increase identified in the table above more accurately reflects the value of his pension increase.
|
|
|
|
|
| BP Annual Report and Form 20-F 2013 |
|
|
89 |
|
Remuneration committee
The committee was made up of the following independent non-executive directors:
|
|
Members
|
| Antony Burgmans (chairman) |
|
| George David |
|
| Ian Davis |
|
| Professor Dame Ann Dowling |
|
| Carl-Henric Svanberg normally attends the meetings
|
Committee role
The
committee’s tasks are formally set out in the board governance principles as follows:
| • |
|
To determine, on behalf of the board, the terms of engagement and remuneration of the group chief executive and the executive directors and to report on these to shareholders. |
| • |
|
To determine, on behalf of the board, matters of policy over which the company has authority regarding the establishment or operation of the company’s pension schemes of which the executive directors are members.
|
| • |
|
To nominate, on behalf of the board, any trustees (or directors of corporate trustees) of such schemes. |
| • |
|
To review and approve the policies and actions being applied by the group chief executive in remunerating senior executives other than executive directors to ensure alignment and proportionality. |
| • |
|
To recommend to the board the quantum and structure of remuneration for the chairman of the board. |
Committee activities
During the year, the committee met
six times. Key discussions and decision items are shown in the table below.
Remuneration committee 2013 meetings
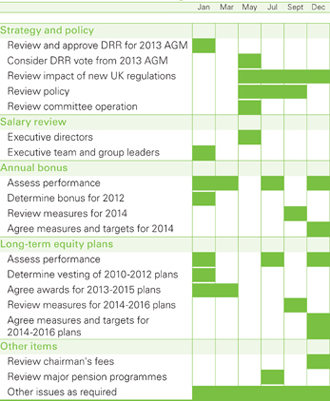
The board’s overall evaluation process included a separate questionnaire on the work of the remuneration committee.
The results were analyzed by an external consultant and discussed at the committee’s meeting in January 2014. Processes continued to be rated as good to excellent and a number of topics for more in-depth discussion were identified.
Independence and advice
Independence
The committee operates with a high
level of independence. The board considers all committee members to be independent with no personal financial interest, other than as shareholders, in the committee’s decisions.
Consultation
The group chief executive is
consulted on the remuneration of the other executive directors and senior executives and on matters relating to the performance of the company; neither he nor the chairman of the board participate in decisions on their own remuneration. Both the
group human resources director and head of group reward may attend relevant sections of meetings to ensure appropriate input on matters related to executives below board level.
The committee consults other relevant committees of the board, for example the SEEAC, on issues relating to the exercise of its judgement or discretion.
Advice
Gerrit Aronson, an independent consultant,
is the committee’s independent adviser. He is engaged directly by the committee. Mr Aronson acts as the secretary to the remuneration committee and advises the chairman, the board and the nomination committee on a variety of governance issues.
During 2013, advice to the committee was received from David Jackson, the company secretary, who is employed by the company and who reports to the chairman of the
board. The company secretary periodically reviews the independence of the advisers. Advice and services on particular remuneration matters was received from other external advisers appointed by the committee.
Towers Watson provided information on the global remuneration market, principally for benchmarking purposes. Freshfields Bruckhaus Deringer LLP provided legal advice on
specific compliance matters to the committee. Both firms provide other advice in their respective areas to the group.
Total fees or other charges (based on an hourly
rate) paid in 2013 to the above advisers for the provision of remuneration advice to the committee as set out above (save in respect of legal advice) is as follows:
Gerrit Aronson £150,000
Towers Watson £85,000
Shareholder engagement
The committee values its dialogue
with major shareholders on remuneration matters. During the year the committee’s chairman and the committee’s independent adviser held individual meetings with shareholders holding in aggregate more than 20% of the company’s shares to
ascertain their views and discuss important aspects of the committee’s policy. They also met key proxy advisers. These meetings supplemented a group meeting of shareholders with all committee chairs and the chairman, as well as an investor
relations programme including a regular ongoing dialogue between the chairman and shareholders. This engagement provides the committee with an important and direct perspective of shareholder interests and, together with the voting results on the
Directors’ remuneration report at the AGM, is considered when making decisions.
The committee reviewed remuneration policy during 2013 and, following dialogue
with shareholders, made three adjustments to further reinforce our bias towards the long term and sustained performance.
First, a three-year retention period has
been introduced to the matched shares that vest in the deferred bonus element.
|
|
|
| 90 |
|
BP Annual Report and Form 20-F 2013 |
Second, a more stringent vesting schedule has been introduced for those metrics in the performance share plan that are
based on performance relative to the other oil majors.
Third, a specific review of performance share plan outcomes will take place to ensure high levels of vesting
are consistent with shareholder benefits. These are explained in more detail in the policy report.
The shareholder vote from the 2013 AGM is shown below. Total votes
withheld represent less than 1% of total shares outstanding.
2013 AGM directors’ remuneration report vote results
|
|
|
|
|
|
|
|
|
|
|
|
|
| Year |
|
|
% vote ‘for’ |
|
|
|
% vote ‘against’ |
|
|
|
Votes withheld |
|
| 2013 |
|
|
94.1% |
|
|
|
5.9% |
|
|
|
108,843,360 |
|
Directors’ shareholdings
Executive directors are required to develop a personal shareholding of five times salary within a reasonable period of time from appointment. It is the stated intention
of the policy that executive directors build this level of personal shareholding primarily by retaining those shares that vest in the deferred bonus and performance share plans which are part of the EDIP. In assessing whether the requirement has
been met, the committee takes account of the factors it considers appropriate, including promotions and vesting levels of these share plans, as well as any abnormal share price fluctuations. The table below shows the status of each of the executive
directors in developing this level. These figures include the value as at 24 February 2014 from the directors’ interests shown below plus the assumed vesting of the 2011-2013 performance shares and is consistent with the figures reported
in the single figure table on page 85.
|
|
|
|
|
|
|
|
|
|
|
|
|
| |
|
|
Appointment date |
|
|
|
Value of current
shareholding |
|
|
|
% of policy
achieved |
|
| Bob Dudley |
|
|
October 2010 |
|
|
|
$5,477,092 |
|
|
|
61% |
|
| Iain Conn |
|
|
July 2004 |
|
|
|
£3,888,423 |
|
|
|
101% |
|
| Dr Brian Gilvary |
|
|
January 2012 |
|
|
|
£2,502,388 |
|
|
|
71% |
|
The committee is satisfied that all executive directors comply with the policy by building the required personal shareholding in a
reasonable period of time following their appointment. Importantly, none of the existing executive directors has sold shares that vested from the EDIP.
Directors’ interests
The figures below indicate and include all the beneficial and non-beneficial interests of each executive director
of the company in shares of BP (or calculated equivalents) that have been disclosed to the company under the Disclosure and Transparency Rules (DTRs) as at the applicable dates.
|
|
|
|
|
|
|
|
|
|
|
|
|
|
|
|
|
| |
|
|
Ordinary
shares or
equivalents at 1 Jan 2013 |
|
|
|
Ordinary
shares or
equivalents at 31 Dec 2013 |
|
|
|
Change from
31 Dec
2013 to 24 Feb 2014 |
|
|
|
Ordinary
shares or
equivalents
total at
24 Feb 2014 |
|
| Bob Dudley |
|
|
346,008 |
a |
|
|
355,707 |
a |
|
|
– |
|
|
|
355,707 |
a |
| Iain Conn |
|
|
509,729 |
b |
|
|
600,272 |
b |
|
|
26,231 |
|
|
|
626,503 |
b |
| Dr Brian Gilvary |
|
|
331,977 |
|
|
|
412,973 |
|
|
|
81,570 |
|
|
|
494,543 |
|
| Former executive director |
|
|
At 1 Jan 2013 |
|
|
|
At retirement |
|
|
|
|
|
|
|
|
|
| Dr Byron Grote |
|
|
1,512,616 |
c |
|
|
1,512,616 |
d |
|
|
– |
|
|
|
– |
|
| b |
Includes 48,024 shares held as ADSs. |
| c |
Held as ADSs, except for 94 shares held as ordinary shares. |
| d |
On retirement at 11 April 2013. |
The following table shows both the performance shares and the deferred bonus element
awarded under the EDIP. These figures represent the maximum possible vesting levels. The actual number of shares/ADSs that vest will depend on the extent to which performance conditions have been satisfied over a three-year period. Additional
details regarding the deferred bonus and performance shares elements of the EDIP awarded can be found on pages 93 and 94.
|
|
|
|
|
|
|
|
|
|
|
|
|
|
|
|
|
| |
|
|
Performance
shares at
1 Jan 2013 |
|
|
|
Performance
shares at
31 Dec 2013 |
|
|
|
Change from
31 Dec 2013
to
24 Feb 2014 |
|
|
|
Performance
shares total at 24 Feb 2014 |
|
| Bob Dudleya |
|
|
3,691,950 |
|
|
|
4,953,654 |
|
|
|
1,604,178 |
|
|
|
6,557,832 |
|
| Iain Conn |
|
|
2,305,847 |
|
|
|
2,666,314 |
|
|
|
818,486 |
|
|
|
3,484,800 |
|
| Dr Brian Gilvaryb |
|
|
669,434 |
|
|
|
1,599,607 |
|
|
|
776,350 |
|
|
|
2,375,957 |
|
| Former executive director |
|
|
Performance
shares at
1 Jan
2013 |
|
|
|
Performance
shares at
31
Dec 2013 |
|
|
|
Change from
31 Dec 2013
to
24 Feb 2014 |
|
|
|
Performance
shares total at
24 Feb 2014 |
|
| Dr Byron Grotea |
|
|
2,889,192 |
|
|
|
1,810,686 |
c |
|
|
– |
|
|
|
– |
|
| b |
This includes conditionally awarded shares made under the competitive performance plan prior to his appointment as a director. The vesting of these shares is subject to performance conditions. |
| c |
On retirement at 11 April 2013. |
At 24 February 2014, the following directors held the numbers of options under
the BP group share option schemes over ordinary shares or their calculated equivalent, and the number of restricted shares as set out below. None of these are subject to performance conditions. Additional details regarding these options can be found
on page 94.
|
|
|
|
|
|
|
|
|
| |
|
|
Options |
|
|
|
Restricted
shares |
|
| Bob Dudley |
|
|
– |
|
|
|
– |
|
| Iain Conn |
|
|
3,814 |
|
|
|
– |
|
| Dr Brian Gilvary |
|
|
504,191 |
|
|
|
80,335 |
|
| Former executive director |
|
|
Options |
|
|
|
Restricted
shares |
|
| Dr Byron Grote |
|
|
– |
|
|
|
– |
|
No director has any interest in the preference shares or debentures of the company or in the shares or loan stock of any subsidiary
company.
There are no directors or members of senior management who own more than 1% of the ordinary shares in issue. At 24 February 2014, all directors and
senior management as a group held interests of 9,632,638 ordinary shares or their calculated equivalent, 12,418,589 performance shares or their calculated equivalent and 6,058,172 options over ordinary shares or their calculated equivalent under the
BP group share option schemes.
Executive director leaving the board
Dr Byron Grote retired from the board at the 2013 AGM and after a transition period, retired from the company at the end of June 2013. The terms of his departure were
reported last year but are reiterated here for completeness. Under the rules of the EDIP, his outstanding performance share awards pertaining to 2011-2013, 2012-2014, and 2013-2015 performance periods, as well as the matching share awards in respect
of the 2010, 2011 and 2012 deferred bonus have been prorated to reflect actual service during the applicable three-year performance periods. These share awards will vest at the normal time to the extent the performance targets or hurdles have been
met. His 2013 bonus eligibility was likewise prorated to reflect his service and based on group results for the year. He has not received any termination payments on leaving service.
|
|
|
|
|
| BP Annual Report and Form 20-F 2013 |
|
|
91 |
|
Remuneration statistics and comparisons
The information below is provided according to the requirements and definitions included in UK regulations.
Historical TSR performance

This graph shows the growth in value of a hypothetical £100 holding in BP p.l.c. ordinary shares over five years, relative to the
FTSE 100 Index of which the company is a constituent. The values of the hypothetical £100 holdings at the end of the five-year period were £117.33 and £188.41 respectively.
History of CEO remuneration
|
|
|
|
|
|
|
|
|
|
|
|
|
| Year |
|
CEO |
|
Total
remuneration (thousand)a |
|
|
Annual bonus
% of
maximum |
|
|
|
Performance
share vesting
% of maximum |
|
| 2009 |
|
Hayward |
|
£6,753 |
|
|
89% |
b |
|
|
17.5% |
|
| 2010c |
|
Hayward |
|
£3,890 |
|
|
0% |
|
|
|
0% |
|
|
|
Dudley |
|
$7,722 |
|
|
0% |
|
|
|
0% |
|
| 2011 |
|
Dudley |
|
$8,312 |
|
|
67% |
|
|
|
16.7% |
|
| 2012 |
|
Dudley |
|
$9,184 |
|
|
65% |
|
|
|
0% |
|
| 2013 |
|
Dudley |
|
$13,179 |
|
|
88% |
|
|
|
39.5% |
|
| a |
Total remuneration figures include pension and are shown as reported each year in the respective directors’ remuneration report with the exception of 2012 which is restated in line with the figure reported in the
single figure table in this report. |
| b |
2009 annual bonus did not have an absolute maximum and so is shown as a percentage of the maximum established in 2010. |
| c |
2010 figures show full year total remuneration for both Hayward and Dudley, although Dudley did not become CEO until October 2010.
|
Relative importance of spend on pay
|
|
|
|
|
|
|
|
|
|
|
|
|
| Key expenditure areas |
|
|
2013
(million) |
|
|
|
2012
(million) |
|
|
|
% change |
|
| Remuneration paid to all employeesa |
|
|
$13,654 |
|
|
|
$13,448 |
|
|
|
1.5% |
|
| Distributions to shareholders (total) |
|
|
$12,404 |
|
|
|
$6,276 |
|
|
|
97.6% |
|
| Dividendsb |
|
|
$6,911 |
|
|
|
$6,276 |
|
|
|
|
|
| Buybacksc |
|
|
$5,463 |
|
|
|
$0 |
|
|
|
|
|
| Capital investmentd |
|
|
$24,600 |
|
|
|
$23,950 |
|
|
|
2.7% |
|
| a |
Total remuneration reflects overall employee costs. See Financial statements – Note 33 for further information. |
| b |
Dividends includes both scrip dividends as well as those paid in cash. See Financial statements – Note 12 for further information. |
| c |
See Financial statements – Note 31 for further information. |
| d |
Capital investment reflects organic capital expenditure. See footnote d on page 236 for further information. |
Percentage change in CEO remuneration
|
|
|
|
|
|
|
|
|
|
|
|
|
| Comparing 2013 to 2012 |
|
|
Salary |
|
|
|
Benefits |
|
|
|
Bonus |
|
| % Change in CEO remuneration |
|
|
2.8% |
|
|
|
4.7% |
|
|
|
40% |
|
|
|
|
|
|
|
|
|
|
|
|
|
|
| % Change in comparator group remunerationa |
|
|
3.3% |
|
|
|
0% |
b |
|
|
30% |
|
| a |
The comparator group comprises some 40% of BP’s global employee population being professional/managerial grades of employees based in the UK and US and employed on more readily comparable terms. |
| b |
There was no change in employee benefits level overall. Those benefits that are linked to salary have changed in line with base salary increases.
|
|
|
|
| 92 |
|
BP Annual Report and Form 20-F 2013 |
Further details
Deferred shares (audited)a
|
|
|
|
|
|
|
|
|
|
|
|
|
|
|
|
|
|
|
|
|
|
|
|
|
|
|
|
|
|
|
|
|
|
|
|
|
|
|
|
|
|
|
|
|
|
|
| |
|
|
|
|
|
|
|
|
|
|
|
|
|
|
|
|
|
|
|
|
Deferred share element interests |
|
|
|
Interests vested in 2013 and 2014 |
|
|
|
|
|
|
Bonus year |
|
|
|
Type |
|
|
|
Performance
period |
|
|
|
Date of award of
deferred shares |
|
|
|
Potential maximum deferred shares |
|
|
|
Number of
ordinary |
|
|
|
Vesting date |
|
|
|
Face Value
of the award
at date of grant £ |
|
| |
|
|
|
|
|
|
|
|
At 1 Jan
2013 |
|
|
|
Awarded
2013 |
|
|
|
At 31 Dec
2013 |
|
|
|
Awarded
2014 |
|
|
|
shares
vested |
|
|
|
| Bob Dudleyb |
|
|
|
|
2011 |
c |
|
|
Comp |
|
|
|
2012-2014 |
|
|
|
08 Mar 2012 |
|
|
|
109,206 |
|
|
|
– |
|
|
|
109,206 |
|
|
|
– |
|
|
|
– |
|
|
|
– |
|
|
|
539,478 |
|
|
|
|
|
|
|
|
|
|
Vol |
|
|
|
2012-2014 |
|
|
|
08 Mar 2012 |
|
|
|
109,206 |
|
|
|
– |
|
|
|
109,206 |
|
|
|
– |
|
|
|
– |
|
|
|
– |
|
|
|
539,478 |
|
|
|
|
|
|
|
|
|
|
Mat |
|
|
|
2012-2014 |
|
|
|
08 Mar 2012 |
|
|
|
218,412 |
|
|
|
– |
|
|
|
218,412 |
|
|
|
– |
|
|
|
– |
|
|
|
– |
|
|
|
1,078,955 |
|
|
|
|
|
|
2012 |
d |
|
|
Comp |
|
|
|
2013-2015 |
|
|
|
11 Feb 2013 |
|
|
|
– |
|
|
|
114,690 |
|
|
|
114,690 |
|
|
|
– |
|
|
|
– |
|
|
|
– |
|
|
|
521,840 |
|
|
|
|
|
|
|
|
|
|
Vol |
|
|
|
2013-2015 |
|
|
|
11 Feb 2013 |
|
|
|
– |
|
|
|
114,690 |
|
|
|
114,690 |
|
|
|
– |
|
|
|
– |
|
|
|
– |
|
|
|
521,840 |
|
|
|
|
|
|
|
|
|
|
Mat |
|
|
|
2013-2015 |
|
|
|
11 Feb 2013 |
|
|
|
– |
|
|
|
229,380 |
|
|
|
229,380 |
|
|
|
– |
|
|
|
– |
|
|
|
– |
|
|
|
1,043,679 |
|
|
|
|
|
|
2013 |
d |
|
|
Comp |
|
|
|
2014-2016 |
|
|
|
12 Feb 2014 |
|
|
|
– |
|
|
|
– |
|
|
|
– |
|
|
|
149,628 |
|
|
|
– |
|
|
|
– |
|
|
|
728,688 |
|
| |
|
|
|
|
|
|
|
|
Mat |
|
|
|
2014-2016 |
|
|
|
12 Feb 2014 |
|
|
|
– |
|
|
|
– |
|
|
|
– |
|
|
|
149,628 |
|
|
|
– |
|
|
|
– |
|
|
|
728,688 |
|
| Iain Conn |
|
|
|
|
2010 |
|
|
|
Comp |
|
|
|
2011-2013 |
|
|
|
09 Mar 2011 |
|
|
|
21,384 |
|
|
|
– |
|
|
|
21,384 |
|
|
|
– |
|
|
|
24,670 |
f |
|
|
12 Feb 2014 |
|
|
|
– |
|
|
|
|
|
|
|
|
|
|
Mat |
|
|
|
2011-2013 |
|
|
|
09 Mar 2011 |
|
|
|
21,384 |
|
|
|
– |
|
|
|
21,384 |
|
|
|
– |
|
|
|
24,670 |
f |
|
|
12 Feb 2014 |
|
|
|
– |
|
|
|
|
|
|
2011 |
c |
|
|
Comp |
|
|
|
2012-2014 |
|
|
|
08 Mar 2012 |
|
|
|
80,652 |
|
|
|
– |
|
|
|
80,652 |
|
|
|
– |
|
|
|
– |
|
|
|
– |
|
|
|
398,421 |
|
|
|
|
|
|
|
|
|
|
Vol |
|
|
|
2012-2014 |
|
|
|
08 Mar 2012 |
|
|
|
80,652 |
|
|
|
– |
|
|
|
80,652 |
|
|
|
– |
|
|
|
– |
|
|
|
– |
|
|
|
398,421 |
|
|
|
|
|
|
|
|
|
|
Mat |
|
|
|
2012-2014 |
|
|
|
08 Mar 2012 |
|
|
|
161,304 |
|
|
|
– |
|
|
|
161,304 |
|
|
|
– |
|
|
|
– |
|
|
|
– |
|
|
|
796,842 |
|
|
|
|
|
|
2012 |
d |
|
|
Comp |
|
|
|
2013-2015 |
|
|
|
11 Feb 2013 |
|
|
|
– |
|
|
|
80,648 |
|
|
|
80,648 |
|
|
|
– |
|
|
|
– |
|
|
|
– |
|
|
|
366,948 |
|
|
|
|
|
|
|
|
|
|
Vol |
|
|
|
2013-2015 |
|
|
|
11 Feb 2013 |
|
|
|
– |
|
|
|
80,648 |
|
|
|
80,648 |
|
|
|
– |
|
|
|
– |
|
|
|
– |
|
|
|
366,948 |
|
|
|
|
|
|
|
|
|
|
Mat |
|
|
|
2013-2015 |
|
|
|
11 Feb 2013 |
|
|
|
– |
|
|
|
161,296 |
|
|
|
161,296 |
|
|
|
– |
|
|
|
– |
|
|
|
– |
|
|
|
733,897 |
|
|
|
|
|
|
2013 |
d |
|
|
Comp |
|
|
|
2014-2016 |
|
|
|
12 Feb 2014 |
|
|
|
– |
|
|
|
– |
|
|
|
– |
|
|
|
100,563 |
|
|
|
– |
|
|
|
– |
|
|
|
489,742 |
|
| |
|
|
|
|
|
|
|
|
Mat |
|
|
|
2014-2016 |
|
|
|
12 Feb 2014 |
|
|
|
– |
|
|
|
– |
|
|
|
– |
|
|
|
100,563 |
|
|
|
– |
|
|
|
– |
|
|
|
489,742 |
|
| Dr Brian Gilvary |
|
|
|
|
2009 |
|
|
|
DAB |
e |
|
|
2010-2012 |
|
|
|
15 Mar 2010 |
|
|
|
87,394 |
|
|
|
– |
|
|
|
– |
|
|
|
– |
|
|
|
95,279 |
f |
|
|
15 Jan 2013 |
|
|
|
– |
|
|
|
|
|
|
2010 |
|
|
|
DAB |
e |
|
|
2011-2013 |
|
|
|
14 Mar 2011 |
|
|
|
44,971 |
|
|
|
– |
|
|
|
44,971 |
|
|
|
– |
|
|
|
51,118 |
f |
|
|
09 Jan 2014 |
|
|
|
– |
|
|
|
|
|
|
2011 |
h |
|
|
DAB |
e |
|
|
2012-2014 |
|
|
|
15 Mar 2012 |
|
|
|
73,624 |
|
|
|
– |
|
|
|
73,624 |
|
|
|
– |
|
|
|
– |
|
|
|
– |
|
|
|
362,966 |
|
|
|
|
|
|
2012 |
d |
|
|
Comp |
|
|
|
2013-2015 |
|
|
|
11 Feb 2013 |
|
|
|
– |
|
|
|
78,815 |
|
|
|
78,815 |
|
|
|
– |
|
|
|
– |
|
|
|
– |
|
|
|
358,608 |
|
|
|
|
|
|
|
|
|
|
Vol |
|
|
|
2013-2015 |
|
|
|
11 Feb 2013 |
|
|
|
– |
|
|
|
78,815 |
|
|
|
78,815 |
|
|
|
– |
|
|
|
– |
|
|
|
– |
|
|
|
358,608 |
|
|
|
|
|
|
|
|
|
|
Mat |
|
|
|
2013-2015 |
|
|
|
11 Feb 2013 |
|
|
|
– |
|
|
|
157,630 |
|
|
|
157,630 |
|
|
|
– |
|
|
|
– |
|
|
|
– |
|
|
|
717,217 |
|
|
|
|
|
|
2013 |
d |
|
|
Comp |
|
|
|
2014-2016 |
|
|
|
12 Feb 2014 |
|
|
|
– |
|
|
|
– |
|
|
|
– |
|
|
|
96,653 |
|
|
|
– |
|
|
|
– |
|
|
|
470,700 |
|
| |
|
|
|
|
|
|
|
|
Mat |
|
|
|
2014-2016 |
|
|
|
12 Feb 2014 |
|
|
|
– |
|
|
|
– |
|
|
|
– |
|
|
|
96,653 |
|
|
|
– |
|
|
|
– |
|
|
|
470,700 |
|
| Former executive director |
|
|
|
|
|
|
|
|
|
|
|
|
|
|
|
|
|
|
|
|
|
|
|
|
|
|
|
|
|
|
|
|
|
| Dr Byron Groteb |
|
|
|
|
2010 |
|
|
|
Comp |
|
|
|
2011-2013 |
|
|
|
09 Mar 2011 |
|
|
|
26,604 |
|
|
|
– |
|
|
|
26,604 |
|
|
|
– |
|
|
|
30,174 |
f |
|
|
12 Feb 2014 |
|
|
|
– |
|
|
|
|
|
|
|
|
|
|
Vol |
|
|
|
2011-2013 |
|
|
|
09 Mar 2011 |
|
|
|
26,604 |
|
|
|
– |
|
|
|
26,604 |
|
|
|
– |
|
|
|
30,174 |
f |
|
|
12 Feb 2014 |
|
|
|
– |
|
|
|
|
|
|
|
|
|
|
Mat |
|
|
|
2011-2013 |
|
|
|
09 Mar 2011 |
|
|
|
53,208 |
|
|
|
– |
|
|
|
44,340 |
i |
|
|
– |
|
|
|
50,292 |
f |
|
|
12 Feb 2014 |
|
|
|
– |
|
|
|
|
|
|
2011 |
c |
|
|
Comp |
|
|
|
2012-2014 |
|
|
|
08 Mar 2012 |
|
|
|
91,638 |
|
|
|
– |
|
|
|
91,638 |
|
|
|
– |
|
|
|
– |
|
|
|
– |
|
|
|
452,692 |
|
|
|
|
|
|
|
|
|
|
Vol |
|
|
|
2012-2014 |
|
|
|
08 Mar 2012 |
|
|
|
91,638 |
|
|
|
– |
|
|
|
91,638 |
|
|
|
– |
|
|
|
– |
|
|
|
– |
|
|
|
452,692 |
|
|
|
|
|
|
|
|
|
|
Mat |
|
|
|
2012-2014 |
|
|
|
08 Mar 2012 |
|
|
|
183,276 |
|
|
|
– |
|
|
|
91,638 |
i |
|
|
– |
|
|
|
– |
|
|
|
– |
|
|
|
452,692 |
|
|
|
|
|
|
2012 |
d |
|
|
Comp |
|
|
|
2013-2015 |
|
|
|
11 Feb 2013 |
|
|
|
– |
|
|
|
97,278 |
|
|
|
97,278 |
|
|
|
– |
|
|
|
– |
|
|
|
– |
|
|
|
442,615 |
|
|
|
|
|
|
|
|
|
|
Vol |
|
|
|
2013-2015 |
|
|
|
11 Feb 2013 |
|
|
|
– |
|
|
|
97,278 |
|
|
|
97,278 |
|
|
|
– |
|
|
|
– |
|
|
|
– |
|
|
|
442,615 |
|
| |
|
|
|
|
|
|
|
|
Mat |
|
|
|
2013-2015 |
|
|
|
11 Feb 2013 |
|
|
|
– |
|
|
|
194,556 |
|
|
|
32,424 |
i |
|
|
– |
|
|
|
– |
|
|
|
– |
|
|
|
147,529 |
|
Comp = Compulsory.
Vol = Voluntary.
Mat = Matching.
DAB = Deferred annual bonus plan.
| a |
Since 2010, vesting of the deferred shares has been subject to a safety and environmental sustainability hurdle, and this will continue. If the committee assesses that there has been a material deterioration in safety
and environmental performance, or there have been major incidents, either of which reveal underlying weaknesses in safety and environmental management, then it may conclude that shares should vest only in part, or not at all. In reaching its
conclusion, the committee will obtain advice from the SEEAC. There is no identified minimum vesting threshold level. |
| b |
Bob Dudley and Dr Byron Grote received awards in the form of ADSs. The above numbers reflect calculated equivalents in ordinary shares. One ADS is equivalent to six ordinary shares. |
| c |
The face value has been calculated using the market price of ordinary shares on 8 March 2012 of £4.94. |
| d |
The market price at closing of ordinary shares on 11 February 2013 was £4.55 and for ADSs was $43.01 and on 12 February 2014 was £4.87 and for ADSs was $48.38. The sterling value has been used to
calculate the face value. |
| e |
Dr Brian Gilvary was granted the shares under the DAB prior to his appointment as a director. The vesting of these shares is not subject to further performance conditions and he receives deferred shares at each scrip
payment date as part of his election choice. |
| f |
The market price of each share used to determine the total value at vesting on the vesting dates of 15 January 2013, 9 January 2014 and 12 February 2014 were £4.58, £4.97 and £4.90
respectively and for ADSs on 12 February 2014 was $48.41. |
| h |
The face value has been calculated using the market price of ordinary shares on 15 March 2012 of £4.93. |
| i |
All deferred and matched shares have been prorated to reflect actual service during the performance period and these figures have been used to calculate the face value. |
|
|
|
|
|
| BP Annual Report and Form 20-F 2013 |
|
|
93 |
|
Performance shares (audited)
|
|
|
|
|
|
|
|
|
|
|
|
|
|
|
|
|
|
|
|
|
|
|
|
|
|
|
|
|
|
|
|
|
|
|
|
|
|
|
| |
|
|
|
|
|
|
|
|
|
|
|
|
Share element interests |
|
|
|
Interests vested in 2013 and 2014 |
|
|
|
|
|
|
Performance
period |
|
|
|
Date of award of
performance shares |
|
|
|
Potential maximum performance sharesa |
|
|
|
Number of
ordinary |
|
|
|
Vesting date |
|
|
|
Face Value
of the
award
£ |
|
| |
|
|
|
|
|
|
At 1 Jan
2013 |
|
|
|
Awarded
2013 |
|
|
|
At 31 Dec
2013 |
|
|
|
Awarded
2014 |
|
|
|
shares
vested |
|
|
|
| Bob Dudleyb |
|
|
|
|
2010-2012 |
|
|
|
09 Feb 2010 |
|
|
|
581,082 |
|
|
|
– |
|
|
|
– |
|
|
|
– |
|
|
|
0 |
|
|
|
– |
|
|
|
– |
|
|
|
|
|
|
2011-2013 |
|
|
|
09 Mar 2011 |
|
|
|
1,330,332 |
|
|
|
– |
|
|
|
1,330,332 |
|
|
|
– |
|
|
|
596,028 |
c |
|
|
March 2014 |
|
|
|
– |
|
|
|
|
|
|
2012-2014 |
d |
|
|
08 Mar 2012 |
|
|
|
1,343,712 |
|
|
|
– |
|
|
|
1,343,712 |
|
|
|
– |
|
|
|
– |
|
|
|
– |
|
|
|
6,637,937 |
|
|
|
|
|
|
2013-2015 |
d |
|
|
11 Feb 2013 |
|
|
|
– |
|
|
|
1,384,026 |
|
|
|
1,384,026 |
|
|
|
– |
|
|
|
– |
|
|
|
– |
|
|
|
6,297,318 |
|
| |
|
|
|
|
2014-2016 |
d |
|
|
12 Feb 2014 |
|
|
|
– |
|
|
|
– |
|
|
|
– |
|
|
|
1,304,922 |
|
|
|
– |
|
|
|
– |
|
|
|
6,354,970 |
|
| Iain Conn |
|
|
|
|
2008-2013 |
e |
|
|
13 Feb 2008 |
|
|
|
133,452 |
|
|
|
– |
|
|
|
– |
|
|
|
– |
|
|
|
145,489 |
|
|
|
07 Feb 2013 |
|
|
|
– |
|
|
|
|
|
|
2010-2012 |
|
|
|
09 Feb 2010 |
|
|
|
656,813 |
|
|
|
– |
|
|
|
– |
|
|
|
– |
|
|
|
0 |
|
|
|
– |
|
|
|
– |
|
|
|
|
|
|
2011-2013 |
|
|
|
09 Mar 2011 |
|
|
|
623,025 |
|
|
|
– |
|
|
|
623,025 |
|
|
|
– |
|
|
|
283,920 |
|
|
|
March 2014 |
|
|
|
– |
|
|
|
|
|
|
2012-2014 |
d |
|
|
08 Mar 2012 |
|
|
|
660,633 |
|
|
|
– |
|
|
|
660,633 |
|
|
|
– |
|
|
|
– |
|
|
|
– |
|
|
|
3,263,527 |
|
|
|
|
|
|
2013-2015 |
d |
|
|
11 Feb 2013 |
|
|
|
– |
|
|
|
694,688 |
|
|
|
694,688 |
|
|
|
– |
|
|
|
– |
|
|
|
– |
|
|
|
3,160,830 |
|
| |
|
|
|
|
2014-2016 |
d |
|
|
12 Feb 2014 |
|
|
|
– |
|
|
|
– |
|
|
|
– |
|
|
|
660,128 |
|
|
|
– |
|
|
|
– |
|
|
|
3,214,823 |
|
| Dr Brian Gilvary |
|
|
|
|
2010-2012 |
f |
|
|
15 Mar 2010 |
|
|
|
60,000 |
|
|
|
– |
|
|
|
– |
|
|
|
– |
|
|
|
65,414 |
c |
|
|
15 Jan 2013 |
|
|
|
– |
|
|
|
|
|
|
2011-2013 |
f |
|
|
14 Mar 2011 |
|
|
|
67,500 |
|
|
|
– |
|
|
|
67,500 |
|
|
|
– |
|
|
|
76,726 |
c |
|
|
09 Jan 2014 |
|
|
|
– |
|
|
|
|
|
|
2010-2012 |
g |
|
|
15 Mar 2010 |
|
|
|
22,500 |
|
|
|
– |
|
|
|
– |
|
|
|
– |
|
|
|
0 |
|
|
|
– |
|
|
|
– |
|
|
|
|
|
|
2011-2013 |
g |
|
|
14 Mar 2011 |
|
|
|
22,500 |
|
|
|
– |
|
|
|
22,500 |
|
|
|
– |
|
|
|
25,824 |
c |
|
|
06 Feb 2014 |
|
|
|
– |
|
|
|
|
|
|
2012-2014 |
d |
|
|
08 Mar 2012 |
|
|
|
624,434 |
|
|
|
– |
|
|
|
624,434 |
|
|
|
– |
|
|
|
– |
|
|
|
– |
|
|
|
3,084,704 |
|
|
|
|
|
|
2013-2015 |
d |
|
|
11 Feb 2013 |
|
|
|
– |
|
|
|
637,413 |
|
|
|
637,413 |
|
|
|
– |
|
|
|
– |
|
|
|
– |
|
|
|
2,900,229 |
|
| |
|
|
|
|
2014-2016 |
d |
|
|
12 Feb 2014 |
|
|
|
– |
|
|
|
– |
|
|
|
– |
|
|
|
605,544 |
|
|
|
– |
|
|
|
– |
|
|
|
2,948,999 |
|
| Former executive directors |
|
|
|
|
|
|
|
|
|
|
|
|
|
|
|
|
|
|
|
|
|
|
|
|
|
|
|
|
|
| Dr Anthony Hayward |
|
|
|
|
2010-2012 |
|
|
|
09 Feb 2010 |
|
|
|
303,948 |
h |
|
|
– |
|
|
|
– |
|
|
|
– |
|
|
|
0 |
|
|
|
– |
|
|
|
– |
|
| Andrew Inglis |
|
|
|
|
2010-2012 |
|
|
|
09 Feb 2010 |
|
|
|
218,938 |
h |
|
|
– |
|
|
|
– |
|
|
|
– |
|
|
|
0 |
|
|
|
– |
|
|
|
– |
|
| Dr Byron Groteb |
|
|
|
|
2010-2012 |
|
|
|
09 Feb 2010 |
|
|
|
801,894 |
|
|
|
– |
|
|
|
– |
|
|
|
– |
|
|
|
0 |
|
|
|
– |
|
|
|
– |
|
|
|
|
|
|
2011-2013 |
|
|
|
09 Mar 2011 |
|
|
|
785,394 |
|
|
|
– |
|
|
|
654,498 |
h |
|
|
– |
|
|
|
293,232 |
c |
|
|
March 2014 |
|
|
|
– |
|
|
|
|
|
|
2012-2014 |
d |
|
|
08 Mar 2012 |
|
|
|
828,936 |
|
|
|
– |
|
|
|
414,468 |
h |
|
|
– |
|
|
|
– |
|
|
|
– |
|
|
|
2,047,472 |
|
| |
|
|
|
|
2013-2015 |
d |
|
|
11 Feb 2013 |
|
|
|
– |
|
|
|
853,650 |
|
|
|
142,278 |
h |
|
|
– |
|
|
|
– |
|
|
|
– |
|
|
|
647,365 |
|
| a |
For awards under the 2010-2012 plan, performance conditions were measured one-third on TSR against ExxonMobil, Shell, Total, ConocoPhillips and Chevron and two-thirds on a balanced scorecard of underlying performance.
For awards under the 2011-2013 plan, performance conditions are measured 50% on TSR against ExxonMobil, Shell, Total and Chevron; 20% on reserves replacement against the same peer group; and 30% against a balanced scorecard of strategic imperatives.
For awards under the 2012-2014, 2013-2015 and 2014-2016 plans, performance conditions are measured one-third on TSR against ExxonMobil, Shell, Total and Chevron; one-third on operating cash flow; and one-third on a balanced scorecard of strategic
imperatives. Each performance period ends on 31 December of the third year. There is no identified overall minimum vesting threshold level but to comply with UK regulations a value of 30%, which is conditional on the TSR, reserves replacement
ratio and one of the strategic imperatives reaching the minimum threshold, has been calculated. |
| b |
Bob Dudley and Dr Byron Grote received awards in the form of ADSs. The above numbers reflect calculated equivalents in ordinary shares. One ADS is equivalent to six ordinary shares. |
| c |
Represents vestings of shares made at the end of the relevant performance period based on performance achieved under rules of the plan and includes reinvested dividends on the shares vested. The market price of each
share at the vesting date of 15 January 2013 was £4.58, at 9 January 2014 was £4.97 and at 6 February 2014 was £4.77. For the assumed vestings dated March 2014 a
price of £4.69 per ordinary share and $45.52 per ADS has been used. These are the average prices from the fourth quarter of 2013. |
| d |
The market price at closing of ordinary shares on 8 March 2012 was £4.94, on 11 February 2013 was £4.55 and for ADSs was $43.01 and on 12 February 2014 was £4.87 and for ADSs was $48.38.
The sterling value has been used to calculate the face value. |
| e |
Restricted award under share element of EDIP. As reported in the 2007 directors’ remuneration report in February 2008, the committee awarded Iain Conn restricted shares, in two tranches of 133,452 shares each and
on vesting include re-invested dividends on the shares vested. The total vesting of the first tranche was 155,695 shares at £4.91 on 22 February 2011. The remaining award, noted above, vested on 7 February 2013, the fifth anniversary
of the award at £4.58. |
| f |
Dr Brian Gilvary was conditionally awarded shares under the Executive Performance Plan prior to his appointment as a director. The vesting of these shares is not subject to further performance conditions.
|
| g |
Dr Brian Gilvary was conditionally awarded shares under the Competitive Performance Plan prior to his appointment as a director. The vesting of these shares is subject to performance conditions. |
| h |
Potential maximum of performance shares element have been pro-rated to reflect actual service during the performance period and these figures have been used to calculate the face value as appropriate. |
Share interests in share option plans (audited)
|
|
|
|
|
|
|
|
|
|
|
|
|
|
|
|
|
|
|
|
|
|
|
|
|
|
|
|
|
|
|
|
|
|
|
|
|
| |
|
|
Option type |
|
|
|
At 1 Jan 2013 |
|
|
|
Granted |
|
|
|
Exercised |
|
|
|
At 31 Dec 2013 |
|
|
|
Option price |
|
|
|
Market price at
date of exercise |
|
|
|
Date from which
first exercisable |
|
|
|
Expiry date |
|
| Bob Dudleya |
|
|
BP SOP |
|
|
|
17,835 |
|
|
|
– |
|
|
|
17,835 |
b |
|
|
– |
|
|
|
$38.10 |
|
|
|
$43.99 |
|
|
|
17 Feb 2006 |
|
|
|
16 Feb 2013 |
|
| Iain Conn |
|
|
SAYE |
|
|
|
605 |
|
|
|
– |
|
|
|
605 |
c |
|
|
– |
|
|
|
£4.20 |
|
|
|
£4.54 |
|
|
|
01 Sep 2012 |
|
|
|
28 Feb 2013 |
|
|
|
|
SAYE |
|
|
|
3,017 |
|
|
|
– |
|
|
|
– |
|
|
|
3,017 |
|
|
|
£3.68 |
|
|
|
– |
|
|
|
01 Sep 2016 |
|
|
|
28 Feb 2017 |
|
|
|
|
SAYE |
|
|
|
797 |
|
|
|
– |
|
|
|
– |
|
|
|
797 |
|
|
|
£3.16 |
|
|
|
– |
|
|
|
01 Sep 2015 |
|
|
|
28 Feb 2016 |
|
| Dr Brian Gilvary |
|
|
BP 2011 |
|
|
|
500,000 |
|
|
|
– |
|
|
|
– |
|
|
|
500,000 |
|
|
|
£3.72 |
|
|
|
– |
|
|
|
07 Sep 2014 |
|
|
|
07 Sep 2021 |
|
| |
|
|
SAYE |
|
|
|
4,191 |
|
|
|
– |
|
|
|
– |
|
|
|
4,191 |
|
|
|
£3.68 |
|
|
|
– |
|
|
|
01 Sep 2016 |
|
|
|
28 Feb 2017 |
|
The closing market prices of an ordinary share and of an ADS on 31 December 2013 were £4.88 and $48.61 respectively.
During 2013 the highest market prices were £4.93 and $48.61 respectively and the lowest market prices were £4.31 and $40.19 respectively.
BP SOP = BP Share Option Plan. These options were granted to Bob Dudley prior to his appointment as a director and are not subject to performance conditions.
BP 2011 = BP 2011 Plan. These options were granted to Dr Brian Gilvary prior to his appointment as a director and are not subject to performance conditions.
SAYE = Save As You Earn all employee share scheme.
| a |
Numbers shown are ADSs under option. One ADS is equivalent to six ordinary shares. |
| b |
Options exercised on 6 February 2013. Market price at closing for information. Shares were sold in tranches after the exercise of options at an average price of $43.62 per ADS. |
| c |
Options exercised on 13 February 2013. Market price at closing for information. Shares were retained after the exercise of options. |
|
|
|
| 94 |
|
BP Annual Report and Form 20-F 2013 |
(b) Non-executive directors
This section of the directors’ remuneration report completes the directors’ annual report on remuneration with details for non-executive directors.
There were no changes following the review of non-executive remuneration undertaken in 2012 which benchmarked the structure and fees of BP non-executive directors against
the 10 largest companies by market capitalization in the FTSE100. In March 2013 it was agreed that the chairman’s fee would be increased from 1 May 2013. There are no changes proposed to the implementation of the policy for non-executive
directors and the chairman for 2014.
Fee structure
The table below shows the fee structure for non-executive directors from 1 May 2013:
|
|
|
|
|
| |
|
|
Fee level
£ thousand |
|
| Chairmana |
|
|
785 |
|
| Senior independent directorb |
|
|
120 |
|
| Board member |
|
|
90 |
|
| Audit, Gulf of Mexico, remuneration
and SEEA chairmanship feesc |
|
|
30 |
|
| Committee membership feed |
|
|
20 |
|
| Intercontinental travel allowance |
|
|
5 |
|
| a |
The chairman is ineligible for committee chairmanship and membership fees or intercontinental travel allowance. He has the use of a fully maintained office for company business, a chauffeured car and security advice in
London. He receives secretarial support as appropriate to his needs in Sweden. |
| b |
The senior independent director is eligible for committee chairmanship fees and intercontinental travel allowance plus any committee membership fees. |
| c |
Committee chairmen do not receive an additional membership fee for the committee they chair. |
| d |
For members of the audit, Gulf of Mexico, SEEA and remuneration committees. |
The table below shows the fees paid for non-executive directors for the years ended 31 December 2012 and
31 December 2013:
2013 remuneration (audited)
|
|
|
|
|
|
|
|
|
| All fees in £ thousand |
|
2013 |
|
|
Total fees
2012 |
|
| Carl-Henric Svanberg |
|
|
773 |
a |
|
|
750 |
|
| Paul Anderson |
|
|
175 |
|
|
|
149 |
|
| Admiral Frank Bowman |
|
|
165 |
|
|
|
126 |
|
| Antony Burgmans |
|
|
145 |
|
|
|
120 |
|
| Cynthia Carroll |
|
|
120 |
|
|
|
98 |
|
| George Davidb |
|
|
185 |
|
|
|
135 |
|
| Ian Davis |
|
|
150 |
|
|
|
128 |
|
| Professor Dame Ann Dowlingc |
|
|
140 |
|
|
|
97 |
|
| Brendan Nelson |
|
|
130 |
|
|
|
119 |
|
| Phuthuma Nhleko |
|
|
150 |
|
|
|
123 |
|
| Andrew Shilston |
|
|
150 |
|
|
|
125 |
|
| a |
The chairman received a further £49,000 by way of taxable benefits. |
| b |
In addition, George David received £12,500 for chairing the BP technology advisory council until 1 July 2013. |
| c |
In addition, Professor Dowling received £25,000 for chairing and being a member of the BP technology advisory council and £3,000 for an ad hoc technology advisory council meeting fee.
|
Non-executive director interests
The figures below indicate and include all the beneficial and non-beneficial interests of each non-executive director of the company in shares of BP (or calculated
equivalents) that have been disclosed to the company under the DTRs as at the applicable dates.
|
|
|
|
|
|
|
|
|
|
|
|
|
|
|
|
|
|
|
|
|
|
|
|
|
| Current non-executive directors |
|
|
Ordinary shares
or equivalents at
1 Jan 2013 |
|
|
|
Ordinary shares
or equivalents at
31 Dec 2013 |
|
|
|
Change from
31 Dec 2013 to
24 Feb 2014 |
|
|
|
Ordinary shares
or equivalents
total at 24 Feb
2014 |
|
|
|
Value of current
shareholding |
|
|
|
% of policy
achieved |
|
| Carl-Henric Svanberg |
|
|
988,077 |
|
|
|
1,039,276 |
|
|
|
– |
|
|
|
1,039,276 |
|
|
|
£5,258,737 |
|
|
|
670 |
|
| Paul Anderson |
|
|
6,000 |
a |
|
|
30,000 |
a |
|
|
– |
|
|
|
30,000 |
a |
|
|
$251,350 |
|
|
|
168 |
|
| Admiral Frank Bowman |
|
|
16,320 |
a |
|
|
16,320 |
a |
|
|
– |
|
|
|
16,320 |
a |
|
|
$136,734 |
|
|
|
91 |
|
| Antony Burgmans |
|
|
10,156 |
|
|
|
10,156 |
|
|
|
– |
|
|
|
10,156 |
|
|
|
£51,389 |
|
|
|
57 |
|
| Cynthia Carroll |
|
|
10,500 |
a |
|
|
10,500 |
a |
|
|
– |
|
|
|
10,500 |
a |
|
|
$87,973 |
|
|
|
59 |
|
| George David |
|
|
579,000 |
a |
|
|
579,000 |
a |
|
|
– |
|
|
|
579,000 |
a |
|
|
$4,851,055 |
|
|
|
3,241 |
|
| Ian Davis |
|
|
10,866 |
|
|
|
11,449 |
|
|
|
– |
|
|
|
11,449 |
|
|
|
£57,932 |
|
|
|
64 |
|
| Professor Dame Ann Dowling |
|
|
11,630 |
|
|
|
22,320 |
|
|
|
– |
|
|
|
22,320 |
|
|
|
£112,939 |
|
|
|
125 |
|
| Brendan Nelson |
|
|
11,040 |
|
|
|
11,040 |
|
|
|
– |
|
|
|
11,040 |
|
|
|
£55,862 |
|
|
|
62 |
|
| Phuthuma Nhleko |
|
|
– |
|
|
|
– |
|
|
|
– |
|
|
|
– |
|
|
|
– |
|
|
|
0 |
|
| Andrew Shilston |
|
|
15,000 |
|
|
|
15,000 |
|
|
|
– |
|
|
|
15,000 |
|
|
|
£75,900 |
|
|
|
63 |
|
| a Held as ADSs. |
|
|
|
|
|
|
|
|
|
|
|
|
|
|
|
|
|
|
|
|
|
|
|
|
Past directors
Sir Ian Prosser (who retired as a non-executive director of BP in April 2010) was appointed as a director and non-executive chairman of BP Pension Trustees Limited on
1 October 2010. During 2013, he received £100,000 for this role.
Peter Sutherland (who was chairman of BP until 31 December 2009) continued his membership of the BP international
advisory board after his retirement from the board of BP p.l.c. During 2013, he received €100,000 for this role.
|
|
|
|
|
| BP Annual Report and Form 20-F 2013 |
|
|
95 |
|
Directors’ remuneration policy
The following pages set out the remuneration policy for directors of BP p.l.c., which, if approved by shareholders at the AGM on
10 April 2014, will take effect from the date of that meeting.
The policy is divided into separate sections for executive and
non-executive directors. The remuneration of the executive directors is set by the remuneration committee (the committee) under delegated powers from the board. The committee makes a recommendation to the board for the remuneration of the chairman.
The remuneration of the non-executive directors is set by the board based on a recommendation from the chairman, the group chief executive and the company secretary.
(a) Executive directors
Introduction
The remuneration policy for the executive directors and the decisions of the remuneration committee have been consistently guided by six key principles. These principles
were introduced more than 10 years ago and have been described in all remuneration reports to shareholders since then.
Key principles
The principles represent the overarching approach of the board and the committee to the remuneration of the executive directors.
Linked to strategy: A substantial proportion of executive director
remuneration is linked to success in implementing the company’s strategy.
Performance related: The major part of total remuneration varies with
performance, with the largest elements being share based, further aligning with shareholders’ interests.
Long term: The structure of pay is designed to reflect the long-term nature
of BP’s business and the significance of safety and environmental risks.
Informed judgement: There are quantitative and qualitative assessments of
performance with the remuneration committee making informed judgement within a framework approved by shareholders.
Fair treatment: Total overall
pay takes account of both the external market and company conditions to achieve a balanced, ‘fair’ outcome.
Shareholder engagement: The remuneration committee actively seeks to
understand shareholder preferences and be transparent in explaining its policy and decisions.
The aim of this policy is to ensure that executive directors are remunerated in a way that reflects the company’s long-term strategy. Consistent with this, a high
proportion of directors’ total potential remuneration has been, and will be, strongly linked to the company’s long-term performance.
|
|
|
| 96 |
|
BP Annual Report and Form 20-F 2013 |
Flexibility, judgement and discretion
The committee is empowered to undertake quantitative and qualitative assessments of performance in reaching its decisions. This involves the use of judgement and
discretion within a framework that is approved by, and transparent to, shareholders.
The committee considers that the powers of flexibility, judgement and discretion
are critical to successful design and implementation of the remuneration policy. This approach is supported in the UK by the ABI’s principles of remuneration and the GC100 and Investor Group’s guidance on directors’ remuneration
reporting.
In framing this policy, the committee has therefore taken care to ensure that these existing and important powers are continued in the future.
| • |
|
The committee considers that an effective remuneration policy needs to be sufficiently flexible to take account of future changes in the industry environment facing BP and in remuneration practice generally. The policy
is therefore sufficiently flexible so that the committee can react to changed circumstances (for example in applying particular performance measures within schemes which may need to evolve with the strategy of the company), without the need for a
specific shareholder approval. |
| • |
|
The policy preserves the committee’s long-standing power to exercise judgement in making a qualitative assessment in certain circumstances. For annual or long-term bonus awards a number of metrics are used. Many
are numerical in nature and require a quantitative assessment. Some will be qualitative, for example the maintenance or improvement in the company’s reputation. Here an impartial assessment will be required. |
| • |
|
This policy sets out various areas where the committee has discretion, mainly where it is desirable to vary a formulaic outcome that would otherwise arise from the policy’s implementation. The committee considers
that the ability to exercise discretion, upwards or downwards, is important to ensure that a particular outcome is fair in light of the director’s own performance and the company’s overall performance and positioning under particular
performance metrics. In accordance with UK regulations, areas where the remuneration policy provides for the exercise of discretion are identified in the report. |
This policy sets out the areas where the committee wishes to have flexibility or use discretion in its implementation. Each year, the committee will report to
shareholders on the use of these powers.
Key considerations
The committee considers a wide range of factors when developing the remuneration policy for executive directors. The competitive market for top executives both within the
oil sector and broader industrial corporations provides an important context. The committee believes that it has a duty to shareholders to ensure that the company is competitive so as to attract and retain the high calibre executives required to
lead the company.
The committee also considers employment conditions within the company when establishing and implementing policy for executive directors to ensure
alignment of principles and approach. In particular the committee reviews the policy for the group leaders of around 500 top executives to ensure that policy for both groups is aligned and reflects consistent standards and approach.
Decisions regarding remuneration for employees outside the group leaders are the responsibility of the group chief executive. Employees are not consulted directly by the
committee when making policy decisions although feedback from employee surveys provide views on a wide range of points including pay which are regularly reported to the board.
The committee has a long-standing and active programme of engaging with key shareholders that includes one-on-one meetings with them each year. This engagement programme
complements the overall investor relations and board engagement efforts of the company, and focuses mainly on our largest shareholders and main proxy advisers. Feedback from shareholders on executive director remuneration forms an important
component of the committee’s considerations when establishing policy.
Implementation matters
This policy is a forward-looking document, but it is a requirement of the regulations that, if obligations under the company’s previous remuneration policy are to
remain in force, these must be stated and certain information must be provided. In view of the long-term nature of BP’s remuneration structures – including obligations under service contracts, pension arrangements, the executive
directors’ incentive plan (EDIP) and other incentive awards – a substantial number of pre-existing obligations will remain outstanding at the time that this policy is approved, including obligations that are ‘grandfathered’ by
virtue of being in force at 27 June 2012. It is the company’s policy to honour in full any pre-existing obligations that have been entered into prior to the effective date of this policy.
Finally the new regulations require detailed information on performance measures and targets to be included in the report unless the directors consider that information
to be commercially sensitive. The directors are committed to full and transparent disclosure to shareholders and will seek to provide the information wherever possible. However, the directors have determined that the current targets for short- and
long-term incentives are commercially sensitive and should not be disclosed at the commencement of any relevant performance period as they believe this is not in the interests of the company. The directors will review such targets at the end of each
relevant performance period and determine whether any target may be disclosed.
Executive directors’ incentive plan
The EDIP was first approved by shareholders in April 2000 and has since provided the umbrella framework for share based remuneration for executive directors. With the
introduction of the new UK regulations on pay reporting, the prime shareholder approval for all elements of remuneration policy, including share based elements, will now be via the policy report. The EDIP will continue to provide the vehicle to
implement the share based elements of policy that have been approved by shareholders, the EDIP will continue to require a separate shareholder approval under UK Listing Rules, and its renewal has been brought forward to the 2014 AGM to coincide with
the approval of this remuneration policy. Given the duplication of the two regulatory regimes, the remuneration committee will ensure that any actions taken in future under the EDIP will be consistent with the policy approved by shareholders.
|
|
|
|
|
| BP Annual Report and Form 20-F 2013 |
|
|
97 |
|
Remuneration policy table
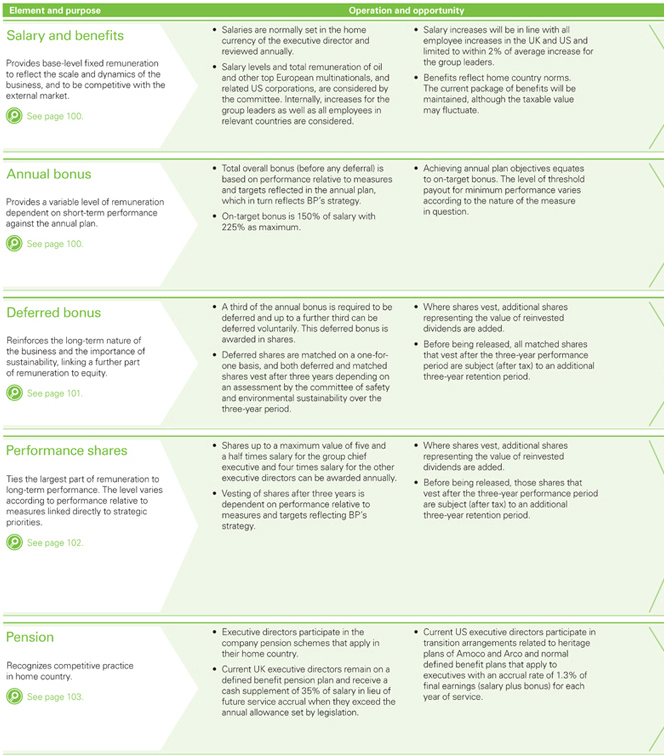
Note: Further information is set out in the accompanying notes which follow this table.
|
|
|
| 98 |
|
BP Annual Report and Form 20-F 2013 |
|
|
|
|
|
| BP Annual Report and Form 20-F 2013 |
|
|
99 |
|
Remuneration policy in more depth
At 1 January 2014, the annual salaries for executive directors were as follows: Bob Dudley $1,800,000, Iain Conn
£774,000 and Dr Brian Gilvary £710,000.
Most components of total remuneration are determined as multiples of salary and so the committee reviews
salaries, normally annually. These reviews consider both external competitiveness and internal consistency when determining if any increases should be applied.
Salaries are compared against other oil majors, but the committee also monitors market practice among European and US companies of a similar size, geographic spread and
business dynamic to BP.
Salaries are normally set in the home currency of the executive director. The levels of increase for all our employees in relevant countries,
as well as the profile of increases for group leaders, are reviewed and considered when assessing executive director salary increases.
The committee would expect
annual increases to be in line with all employee increases in the UK and US, unless there are promotions or significant changes in responsibilities, in which case they would retain the flexibility to recognize these with appropriate salary increases
but will be limited to within 2% of average increase for the group leaders.
The committee will make a balanced judgement of what, if any, increase should be applied to each executive director’s
salary. These decisions, and the reasons for them, form part of the annual report of remuneration.
Benefits and other emoluments
Executive directors are entitled to receive those benefits which are made available to employees generally in accordance with their applicable terms, for
example sharesave plans, sickness policy, relocation assistance and maternity pay. Benefits are not pensionable.
In addition, executive directors may receive other
benefits that are judged to be cost effective and prudent in terms of the individual’s time and/or security. These include car-related benefits, security assistance, tax preparation assistance, insurance and medical benefits. The costs of these
are treated as taxable benefits to the individuals and are included in the single figure table of the annual report on remuneration. The company would meet any tax charges arising in respect of benefits provided to directors that it considers relate
to its business (for example security assistance).
The committee expects to maintain benefits at their current level for the duration of this policy but notes that
the taxable value may fluctuate depending on, amongst other things, insurance premiums, and a director’s personal circumstances.
Operation
|
| Highlights |
| 150% of salary on target, 225% maximum. |
| Metrics focused on safety and operational risk, and on value creation. |
| Details on performance measures will be explained each year in annual report on remuneration. |
Executive directors are eligible for an annual bonus (before any deferral) of 150% of salary at target and 225% at maximum. Bonuses for
the group chief executive and the chief financial officer will be based entirely on group measures. Executive directors with large operating responsibilities may have up to 50% of their bonus based on their respective business segment, with the
balance based on group measures.
The strategy provides the overall context for the company’s key performance indicators and the focus for the annual plan. From
this, measures and targets to reflect the key priorities of the business are selected at the start of the year for senior managers, including executive directors. Measures typically include a range of financial and operating ones as well as those
relating to safety and the environment.
Where possible, the committee uses quantifiable, hard targets that can be factually measured and objectively assessed. Where
it is appropriate to use qualitative measures, the information used to make assessments will be established at the start of or early in the year. Targets are set so that achieving plan levels of performance results in on-target bonus. For maximum
levels, targets reflect performance levels that the committee judges are very stretching but nonetheless achievable.
At the end of each year, performance is assessed
relative to the measures and targets established at the start of the year, adjusted for any material changes in the market environment (predominantly oil prices).
In
addition to the specific bonus metrics, the committee also reviews the underlying performance of the group in light of the annual plan, competitors’ results and analysts’ reports, and seeks input from other committees on relevant aspects.
When appropriate, the committee may make adjustments, up or down, to a straight formulaic result based on this fuller information. The committee considers that this informed judgement is important to establishing a fair overall assessment.
The rigorous process followed by the committee has resulted in bonus levels varying considerably over a number of years, reflecting the changing circumstances of the
company during the period. The following chart shows the average annual bonus result (before any deferral) relative to an on-target level for executive directors.
History of annual bonus results
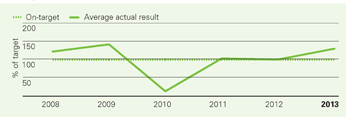
Performance measures
The measures used to determine bonus results will derive from the annual plan and support the strategic priorities of safety and operational risk (S&OR) management
and reinforcing value creation.
The committee determines specific measures, weightings and targets each year to reflect the group’s strategy, key performance
indicators (KPIs) and the priorities in the annual plan. These measures will be reported each year in the annual report on remuneration.
For safety and operational
risk management the measures may include established ones such as loss of primary containment, tier 1 process safety events, recordable injury frequency, and/or days away from work frequency. The measures selected will typically track both process
and personal safety and give an overall perspective on performance. The committee will also seek the input of the safety, ethics and environmental assurance committee (SEEAC) to determine if there are any other factors or metrics that should be
considered in arriving at a final assessment at year end.
Value creation will form the principal measures and include both financial and operating metrics that track
performance relative to value creation. Financial measures for value creation may include operating cash flow, underlying replacement cost profit, and cost management or other similar measures tracking the financial outcome of the company’s
pursuit of strategic goals. Additional operating metrics may include major project delivery, Upstream unplanned deferrals, and Downstream net income per barrel or other similar measures that track key operating aspects of the strategy.
Where segment metrics are applied, they will typically include specific safety metrics for the segment as well as value metrics such as availability, efficiency,
profitability and major project delivery.
|
|
|
| 100 |
|
BP Annual Report and Form 20-F 2013 |
The structure of deferred bonus, awarded in shares, focuses on long-term alignment with shareholder interests and
reinforces the critical importance of maintaining high safety and environmental standards. It translates the outcome of a portion of the annual bonus into a long-term plan with
additional performance hurdles. As shown below, the deferred bonus is converted to shares, matched and deferred for three
years. Half the total that vests will then normally have an additional three-year retention period before release.
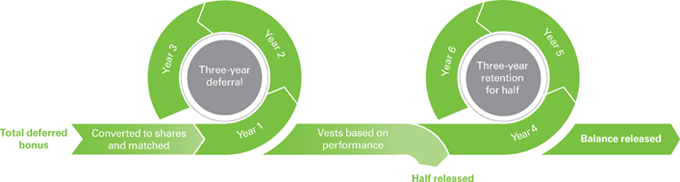
Operation
|
| Highlights |
| A third mandatory and up to a third voluntary
deferral. |
| Converted to shares, matched one-for-one and deferred for three
years. |
| Vesting of all conditional on safety and environmental sustainability
hurdle. |
| Matched shares subject to additional three-year retention period post
vesting. |
A third of the annual bonus is required to be deferred for three years. Under the rules of the plan, the average share price over the
three days following the announcement of full-year results is used to determine the number of shares awarded. Deferred shares are matched on a one-for-one basis.
Executive directors may elect, with the committee’s agreement, to take up to a further third of their annual bonus in shares, which will vest and will qualify for
matching on the same basis as above.
Both deferred and matched shares vest after three years depending on the committee’s assessment of safety and environmental
sustainability over the three-year deferral period. Where shares vest, the executive director will also receive additional shares representing the value of the reinvested dividends on those shares.
Beginning with the 2013 bonus deferral, matched shares that vest (half of the total that vests) will normally be subject to a compulsory retention period of a further
three years. Sufficient shares may be sold to discharge tax liabilities at the vesting date.
Performance measures
The safety and environmental sustainability hurdle, in place since 2010, will continue to be applied to all deferred shares. If the committee assesses that there has been
a material deterioration in safety and environmental metrics, or there have been major incidents either of which reveal underlying weaknesses in safety and environmental management, then it may conclude that shares vest in part, or not at all. In
reaching its conclusion, the committee will obtain advice from the SEEAC.
The committee believes that this safety and environmental hurdle is appropriate for several
reasons:
| • |
|
High standards in this area are an important priority of BP’s strategy. |
| • |
|
Maintaining safety and environmental standards over the long term is a good qualitative reflection of the sustainability of the business. |
| • |
|
This non-financial hurdle complements the financial and operational performance conditions applicable to performance share awards.
|
|
|
|
|
|
| BP Annual Report and Form 20-F 2013 |
|
|
101 |
|
The performance share element reflects the committee’s policy that a large proportion of remuneration is tied to
long-term performance. This three-year performance period, combined with a further three-year
retention period for those shares that vest, creates a six-year incentive plan designed to ensure executive interests are
aligned with those of shareholders.

Operation
|
| Highlights |
| Shares awarded to five and a half times salary for the group chief
executive and four times for other executive directors. |
| Three-year performance period. |
| Performance measures reflect strategy and KPIs. |
| Three-year retention period for those shares that
vest. |
Performance shares may be awarded conditionally at the start of each year to a value of up to five and a half times salary for the group
chief executive and up to four times salary for the other executive directors (the maximum allowed under the EDIP). Under the rules of the EDIP, the average share price over the final quarter before the start of the performance period is used to
determine the number of shares awarded. Performance shares will only vest to the extent that performance conditions are met.
Where shares vest, the executive
director will receive additional shares representing the value of the reinvested dividends on those shares. Sufficient shares may be sold at vesting to discharge tax liabilities. The remaining vested shares will normally be subject to a compulsory
retention period of a further three years.
A history of vesting of the share element is shown below, reflecting both demanding performance conditions and poor
company performance during this period.
History of performance share vesting

Performance measures
Performance measures will be aligned to BP’s strategy that focuses on value creation and reinforcing safety and operational risk management. Vesting of a portion of
shares will be based on our total shareholder return (TSR) compared to other oil majors, reflecting the central importance of restoring and maintaining the value of the company. A further portion will be based on the operating cash flow of the
company, reflecting a central element of value creation. The final portion will be based on a set of strategic imperatives such as reserves replacement ratio, S&OR management, and major project delivery.
For the TSR and the reserves replacement ratio measures, the comparator group will continue to consist of ExxonMobil, Shell, Total and Chevron. This group can be altered
by the committee if circumstances change, for example, if there is significant consolidation in the industry. While a narrow group, it continues to represent the comparators that both shareholders and management use in assessing relative
performance.
TSR will be calculated by taking the share price performance over the three-year performance period, assuming dividends are reinvested. All share prices
will be averaged over the three-month period before the beginning and end of the performance period. They will be measured in US dollars.
The methodology used for
the relative measures will rank each of the five oil majors on each measure. Performance shares for each component will vest at levels of 100%, 80% and 25% respectively, for performance equivalent to first, second and third place. No shares will
vest for fourth or fifth place.
Operating cash flow has been identified as a core measure of strategic performance of the company. Targets will reflect agreed plans
and normal operating assumptions.
The committee will determine the weightings, specific measures and targets for each year to reflect the strategic priorities for
that year and the committee’s judgement of where the focus should be for the upcoming period. These will be explained in the annual report on remuneration.
The
committee considers that a combination of quantitative and qualitative measures reflects the long-term value creation priorities and the factors underpinning business sustainability.
The committee may exercise its judgement, in a reasonable and informed manner, to adjust vesting levels upwards or downwards if it concludes that this approach does not
reflect the reality of the health and performance of the business relative to its peers. In addition the committee will review whether the level of vesting is consistent with shareholder interests. Any adjustments are explained in the annual report
on remuneration following vesting, in line with its commitment to transparency.
|
|
|
| 102 |
|
BP Annual Report and Form 20-F 2013 |
Executive directors are eligible to participate in the pension schemes that apply in their home country and which follow
the national norms for structure and levels.
US executive directors
|
| Highlights |
| Defined benefit core schemes. |
| Annual accrual of 1.3% of average annual earnings generally provides
overall benefit. |
| Average earnings include salary and bonus. |
Pension benefits in the US are provided through a combination of tax-qualified and non-qualified benefit plans, consistent with
applicable US tax regulations.
The BP retirement accumulation plan (US pension plan) is a US tax-qualified plan that features a cash balance formula and includes
grandfathering provisions under final average pay formulae for certain employees of companies acquired by BP (including Amoco and Arco) who participated in these predecessor company pension plans.
The TNK-BP supplemental retirement plan is a lump sum benefit based on the same calculation as the benefit under the US pension plan but reflecting service and earnings
at TNK-BP.
The BP excess compensation (retirement) plan (excess compensation plan) provides a supplemental benefit which is the difference between (a) the
benefit accrual under the US pension plan and the TNK-BP supplemental retirement plan without regard to the IRS compensation limit (including for this purpose base salary, cash bonus and bonus deferred into a compulsory or voluntary award under the
deferred matching element of the EDIP), and (b) the actual benefit payable under the US pension plan and the TNK-BP supplemental retirement plan, applying the IRS compensation limit. The benefit calculation under the Amoco formula includes a
reduction of 5% per year if taken before age 60.
The BP supplemental executive retirement benefit plan (SERB) is a supplemental plan based on a target of 1.3%
of final average earnings (including, for this purpose, base salary plus cash bonus and bonus deferred into a compulsory or voluntary award under the deferred matching element of the EDIP) for each year of service (without regard for tax limits)
less benefits paid under all other BP (US) qualified and non-qualified pension arrangements. The benefit payable under SERB is unreduced at age 60 but reduced by 5% per year if separation occurs before age 60. Benefits payable under this plan
are unfunded and therefore paid from corporate assets.
UK executive directors
|
| Highlights |
| Defined benefit core schemes. |
| One sixtieth annual accrual to a maximum of two-thirds final salary. |
| 35% cash supplement in lieu of future service accrual for those in excess of UK government limits. |
UK executive directors are members of the BP pension scheme in respect of service prior to 1 April 2011. The core benefits under
this scheme are non-contributory. The benefits include a pension accrual of one sixtieth of basic salary for each year of service, up to a maximum of two-thirds of final basic salary and a dependant’s benefit of two-thirds of the member’s
pension. The scheme pension is not integrated with state pension benefits. Higher accrual rules are offered to employees on the payment of personal contributions.
Since 1 April 2011, participants may receive a cash supplement in lieu of future service pension accrual in the BP pension scheme. This follows the reduction in the
annual allowance applicable to plans such as the BP pension scheme in 2011. Some participants ceased pension accrual for future service to remain within the new annual allowance. For these employees the cash supplement is equal to 35% of basic
salary.
Until the end of March 2011, pension benefits in excess of the individual lifetime allowance set by legislation were paid via an unapproved, unfunded pension
arrangement provided directly by the company. From April 2011 only increases in accrued benefits due to increases in salary in excess of the individual lifetime allowance are covered by the arrangements.
The rules of the BP pension scheme were amended in 2006 to reflect the normal retirement age of 65. Prior to 1 December 2006, scheme members could retire on or after
age 60 without reduction.
Special early retirement terms apply to executives in service on 1 December 2006. If they retire between 60 and 65, they are entitled
to an immediate unreduced pension. If they retire between 55 and 60, they are entitled to an immediate unreduced pension in respect of the proportion of their benefit for service up to 30 November 2006, and are subject to such reduction as the
scheme actuary certifies in respect of the period of service after 1 December 2006. For retirees leaving in circumstances approved by the committee, the scheme actuary has to date applied a reduction of 3% per annum in respect of the
period of service from 1 December 2006 up to the leaving date; however a greater reduction can be applied in other circumstances. Those leaving before 55 are entitled to a deferred pension that becomes payable from 55 or later, on the basis set
out above. Irrespective of this, an individual leaving in circumstances of total incapacity is entitled to an immediate unreduced pension as from their leaving date.
|
|
|
|
|
| BP Annual Report and Form 20-F 2013 |
|
|
103 |
|
Scenario charts
The total remuneration opportunity for executive directors is strongly performance based and weighted to the long term. The charts below provide scenarios for the total
remuneration of executive directors at different levels of performance and are calculated as prescribed in UK regulations. The fixed component in each chart includes current salary, taxable benefits and pension. The annual component reflects cash
bonus, and in the case of Bob Dudley the pension accruing on his bonus. The long term includes both the deferred bonus and the performance shares. Detailed calculation assumptions are noted to the right of the charts.
Calculation assumptions
Minimum
Fixed components
only
| • |
|
Current salary and taxable benefits. |
| • |
|
Pension value of one year’s service using current salary for US and cash in lieu for UK. |
Target
Fixed
| • |
|
Current salary and taxable benefits. |
| • |
|
Pension value of one year’s service using current salary for US and cash in lieu for UK. |
Annual
| • |
|
Cash bonus reflecting on-target level of 150% of salary of which two thirds are paid in cash. |
| • |
|
For Bob Dudley, pension value of one year’s service based on target bonus times 20 (1.3% x 150% x salary x 20). |
Long term
| • |
|
Deferred bonus reflecting one third of target bonus of 150% of salary and one-for-one match. |
| • |
|
Performance shares that vest to half maximum amounting to 2.75 times salary for Bob Dudley and two times salary for Iain Conn and Dr Brian Gilvary. |
Maximum
Fixed
| • |
|
Current salary and taxable benefits. |
| • |
|
Pension value of one year’s service using current salary for US and cash in lieu for UK. |
Annual
| • |
|
Cash bonus reflecting maximum of 225% of salary of which one third is paid in cash. |
| • |
|
For Bob Dudley, pension value of one year’s service based on maximum bonus times 20 (1.3% x 225% x salary x 20). |
Long term
| • |
|
Deferred bonus reflecting two thirds of maximum bonus of 225% of salary and one-for-one match. |
| • |
|
Performance shares that fully vest amounting to five and a half times salary for Bob Dudley and four times salary for Iain Conn and Dr Brian Gilvary.
|
|
|
|
| 104 |
|
BP Annual Report and Form 20-F 2013 |
Recruitment
The committee expects any new executive directors to be engaged on terms that are consistent with the policy as described on the preceding pages. The committee recognizes
that it cannot always predict accurately the circumstances in which any new directors may be recruited. The committee may determine that it is in the interests of the company and shareholders to secure the services of a particular individual which
may require the committee to take account of the terms of that individual’s existing employment and/or their personal circumstances. Accordingly, the committee will ensure that:
| • |
|
Salary level of any new director is competitive relative to the peer group. |
| • |
|
Variable remuneration will be awarded within the parameters outlined on pages 98-99, save that the committee may provide that an initial award under the EDIP (within the salary multiple limits on page 98) is subject to
a requirement of continued service over a specified period, rather than a corporate performance condition. |
| • |
|
Where an existing employee of BP is promoted to the board, the company will honour all existing contractual commitments including any outstanding share awards or pension entitlements. |
| • |
|
Where an individual is relocating in order to take up the role, the company may provide certain one-off benefits such as reasonable relocation expenses, accommodation for a period following appointment and assistance
with visa applications or other immigration issues and ongoing arrangements such as tax equalization, annual flights home, and housing allowance. |
| • |
|
Where an individual would be forfeiting valuable remuneration in order to join the company, the committee may award appropriate compensation. The committee would require reasonable evidence of the nature and value of
any forfeited award and would, to the extent practicable, ensure any compensation was no more valuable than the forfeited award and that it was paid in the form of shares in the company. |
The committee would expect any new recruit to participate in the company pension and benefit schemes that are open to senior employees in his home country but would have
due regard to the recruit’s existing arrangements and market norms.
In making any decision on any aspect of the remuneration package for a new recruit, the
committee would balance shareholder expectations, current best practice and the requirements of any new recruit and would strive not to pay more than is necessary to achieve the recruitment. The committee would give full details of the terms of the
package of any new recruit in the next remuneration report.
Service contracts
Summary details of each executive director’s service agreement are as follows:
|
|
|
|
|
|
|
|
|
| |
|
|
Service
agreement date |
|
|
|
Salary as at
1 Jan 2014 |
|
| Bob Dudley |
|
|
6 Apr 2009 |
|
|
|
$1,800,000 |
|
| Iain Conn |
|
|
22 Jul 2004 |
|
|
|
£774,000 |
|
| Dr Brian Gilvary |
|
|
22 Feb 2012 |
|
|
|
£710,000 |
|
Bob Dudley’s contract is with BP Corporation North America Inc. He is seconded to BP p.l.c. under a secondment agreement dated
15 April 2009, which has been further extended to 15 April 2019. His secondment can be terminated with one month’s notice by either party and terminates automatically on the termination of his service agreement. Iain Conn’s and
Dr Brian Gilvary’s service agreements are with BP p.l.c.
Each executive director is entitled to pension provision, details of which are summarized on page 103.
Each executive director is entitled to the following contractual benefits:
| • |
|
A company car and chauffeur for business and private use, on terms that the company bear all normal servicing, insurance and running costs. Alternatively, the executive director is entitled to a car allowance in lieu.
|
| • |
|
Medical and dental benefits, sick pay during periods of absence and tax preparation assistance. |
| • |
|
Indemnification in accordance with applicable law. |
| • |
|
Each executive director participates in bonus or incentive arrangements at the committee’s sole discretion. Currently, each participates in the discretionary bonus scheme and the deferred bonus and performance
share plans as described on pages 100, 101 and 102 respectively. |
Each executive director may terminate his employment by giving his employer 12
months’ written notice. In this event, for business reasons, the employer would not necessarily hold the executive director to his full notice period.
Other
than in the case of Dr Brian Gilvary (who became a director on 1 January 2012), the service agreements are expressed to expire at a normal retirement age of 60; however, such executive directors could not, under UK law, be required to retire at
this (or any other) age following abolition of the default retirement age.
The employer may lawfully terminate the executive director’s employment in the
following ways:
| • |
|
By giving the director 12 months’ written notice. |
| • |
|
Without compensation, in circumstances where the employer is entitled to terminate for cause, as defined for the purposes of his service agreement. |
Additionally, in the case of Iain Conn and Dr Brian Gilvary, the company may lawfully terminate employment by making a lump sum payment in lieu of notice equal to 12
months’ base salary. The company may elect to pay this sum in monthly instalments rather than as a lump sum.
The lawful termination mechanisms described above
are without prejudice to the employer’s ability in appropriate circumstances to terminate in breach of the notice period referred to above, and thereby to be liable for damages to the executive director.
In the event of termination by the company, each executive director may have an entitlement to compensation in respect of his statutory rights under employment protection
legislation in the UK and potentially elsewhere.
Where appropriate the company may also meet a director’s reasonable legal expenses in connection with either
his appointment or termination of his appointment.
The committee considers that its policy on termination payments arising from the contractual provisions summarized
above provides an appropriate degree of protection to the director in the event of termination and is consistent with UK market practice.
Exit payments
Should it become necessary to terminate an executive director’s employment, and therefore to determine a termination payment, the
committee’s policy would be as follows:
| • |
|
The director’s primary entitlement would be to a termination payment in respect of his service agreement, as set out above. The committee will consider mitigation to reduce the termination payment to a leaving
director when appropriate to do so, taking into account the circumstances and the law governing the agreement. Mitigation would not be applicable where a contractual payment in lieu of notice is made. In addition, the director may be entitled to a
payment in respect of his statutory rights. Other potential elements are as follows: |
| |
– |
First, the committee would consider whether the director should be entitled to an annual bonus in respect of the financial year in which the termination occurs. Normally, any such bonus would be restricted to the
director’s actual period of service in that financial year. |
| |
– |
Second, the committee would consider whether conditional share awards held by the director under the EDIP should lapse on leaving or should, at the committee’s discretion, be preserved (in which event the award
would normally continue until the normal vesting date and be treated in the manner described on pages 101-102 of this report). Any such determination will be made in accordance with the rules of the EDIP, as approved by shareholders.
|
|
|
|
|
|
| BP Annual Report and Form 20-F 2013 |
|
|
105 |
|
| |
– |
Third, if the departing director is eligible for an early retirement pension, the committee would consider, if relevant under the terms of the plan in which the director participates, the extent of any actuarial
reduction that should be applied. |
| • |
|
In determining the overall termination arrangements, the committee would have regard to all relevant circumstances, and would therefore distinguish between types of leaver and the circumstances under which the director
left the company. This mainly relates to consideration of how discretion would be exercised in relation to conditional share awards under the EDIP. It is also relevant where a departing director has a right to an early retirement pension. UK
directors who leave in circumstances approved by the committee may have a favourable actuarial reduction applied to their pensions (which has to date been 3%). Departing directors who leave in other circumstances are subject to a greater reduction.
|
| • |
|
The performance of the leaving director would be taken into account in various respects. In particular, in deciding whether to exercise discretion to preserve EDIP awards, the committee would have regard to the
director’s performance during the performance cycle of the relevant awards, as well as a range of other relevant factors, including the proximity of the award to its maturity date. |
| • |
|
The committee would also have regard to all other relevant factors, including consideration of whether a contractual provision in the director’s arrangements complied with best practice at the time the
director’s employment was terminated, as well as at the time the provision was agreed to. |
| • |
|
A shorter vesting period for any share awards may apply on change of control. |
External appointments
The board supports executive directors taking up appointments outside the company to broaden their knowledge and experience.
Each executive director is permitted to accept one non-executive appointment, from which they may retain any fee. External appointments are subject to agreement by the chairman and reported to the board. Any external appointment must not conflict
with a director’s duties and commitments to BP. Details of appointments during 2013 are shown below.
|
|
|
|
|
|
|
|
|
|
|
|
|
| Director |
|
|
Appointee
company |
|
|
|
Additional
position
held at
appointee
company |
|
|
|
Total
fees |
|
| Bob Dudleya |
|
|
Rosneft |
|
|
|
Director |
|
|
|
0 |
|
| Iain Conn |
|
|
Rolls-Royce plc |
|
|
|
Senior
independent
director and
chairman of
the ethics
committee |
|
|
|
£82,000 |
|
| Dr Byron Groteb |
|
|
Unilever |
|
|
|
Audit
committee
member |
|
|
|
Unilever PLC
£19,375
Unilever NV
€22,990 |
|
| a |
Bob Dudley holds this appointment as a result of the company’s shareholding in Rosneft. |
| b |
On retirement at 11 April 2013.
|
|
|
|
| 106 |
|
BP Annual Report and Form 20-F 2013 |
(b) Non-executive directors
This section of the directors’ remuneration report describes the separate policies of the BP board for the
remuneration of the chairman and the non-executive directors (NEDs).
Key principles
The principles which underpin the board’s policies for the remuneration of the chairman and the NEDs are as follows:
| • |
|
Remuneration should be sufficient to attract, motivate and retain world-class non-executive talent. |
| • |
|
Remuneration practice should be consistent with recognized best practice standards for chairman and NED remuneration. |
| • |
|
The aggregate annual remuneration payable to the chairman and NEDs is determined by shareholder resolution in accordance with the company’s Articles of Association. The aggregate limit will be increased
|
| |
|
to £5 million if resolution 20 at the 2014 AGM is duly passed. |
| • |
|
NEDs should not receive share options, bonuses or retirement benefits from the company. |
| • |
|
NEDs are encouraged to establish a holding in BP shares of the equivalent value of one year’s base fee. |
NEDs are
supported through the company secretary’s office. This support includes assistance with travel and transport, security advice (when needed) and administrative services.
NEDs have letters of appointment that recognize that, subject to the Articles of Association, their service is at the discretion of shareholders. All directors stand for
re-election at each AGM.
Board remuneration policy for
the chairman
The chairman is non-executive and, in accordance with the Governance Code, independent on appointment. The
quantum and structure of the chairman’s remuneration is set by the board based upon a recommendation from the remuneration committee. The chairman is not involved in setting his own remuneration.
This policy reflects the approach adopted by the board over the years and which has previously been described to
shareholders.

|
| The maximum remuneration for non-executive directors is set in accordance with the Articles of Association. |
|
|
|
|
|
| BP Annual Report and Form 20-F 2013 |
|
|
107 |
|
Board remuneration policy for non-executive directors

|
| The maximum remuneration for non-executive directors is set in accordance with the Articles of Association. |
This directors’ remuneration report was approved by the board and signed on its behalf by David J Jackson, company secretary on
6 March 2014.
|
|
|
| 108 |
|
BP Annual Report and Form 20-F 2013 |
Internal Control Revised Guidance for
Directors (Turnbull)
In discharging its responsibility for the company’s risk management and internal control systems under the UK Corporate
Governance Code, the board, through its governance principles, requires the group chief executive to operate with a comprehensive system of controls and internal audit to identify and manage the risks that are material to BP. The governance
principles are reviewed periodically by the board and are consistent with the requirements of the UK Corporate Governance Code including principle C.2 (risk management and internal control).
The board has an established process by which the effectiveness of the system of internal control (which includes the risk management system) is reviewed as required by
provision C.2.1 of the UK Corporate Governance Code. This process enables the board and its committees to consider the system of internal control being operated for managing significant risks, including strategic, safety and operational and
compliance and control risks, throughout the year. Material joint ventures and associates have not been dealt with as part of the group in this process, although the board has reviewed the exposure the group has to risk within joint arrangements.
As part of this process, the board and the audit, Gulf of Mexico and safety, ethics and environment assurance committees requested, received and reviewed reports
from executive management, including management of the business segments, corporate activities and functions, at their regular meetings.
In considering the systems,
the board noted that such systems are designed to manage, rather than eliminate, the risk of failure to achieve business objectives and can only provide reasonable, and not absolute, assurance against material misstatement or loss.
During the year, the board through its committees regularly reviewed with executive management processes whereby risks are identified, evaluated and managed. These
processes were in place for the year under review, remain current at the date of this report and accord with the guidance on the UK Corporate Governance Code provided by the Financial Reporting Council. In December 2013, the board considered the
group’s significant risks within the context of the annual plan presented by the group chief executive.
A joint meeting of the audit and safety, ethics and
environment assurance committees in January 2014 reviewed a report from the general auditor as part of the board’s annual review of the risk management and internal control systems. The report described the annual summary of internal
audit’s consideration of the design and operation of elements of BP’s system of internal control over significant risks arising in the categories of strategic and commercial, safety and operational and compliance and control and considered
the control environment for the group. The report also highlighted the results of audit work conducted during the year and the remedial actions taken by management in response to significant failings and weaknesses identified.
During the year, these committees engaged with management, the general auditor and other monitoring and assurance providers (such as the group ethics and compliance
officer, head of safety and operational risk and the external auditor) on a regular basis to monitor the management of risks. Significant incidents that occurred and management’s response to them were considered by the appropriate committee and
reported to the board.
In the board’s view, the information it received was sufficient to enable it to review the effectiveness of the company’s system of
internal control in accordance with the Internal Control Revised Guidance for Directors (Turnbull).
Subject to determining any additional appropriate actions arising from items still in process, the board is satisfied that,
where significant failings or weaknesses in internal controls were identified during the year, appropriate remedial actions were taken or are being taken.
Corporate governance practices
In the US, BP ADSs are listed on the New York
Stock Exchange (NYSE). The significant differences between BP’s corporate governance practices as a UK company and those required by NYSE listing standards for US companies are listed as follows:
Independence
BP has adopted a robust set of board
governance principles, which reflect the UK Corporate Governance Code and its principles-based approach to corporate governance. As such, the way in which BP makes determinations of directors’ independence differs from the NYSE rules.
BP’s board governance principles require that all non-executive directors be determined by the board to be ‘independent in character and judgement and free from
any business or other relationship which could materially interfere with the exercise of their judgement’. The BP board has determined that, in its judgement, all of the non-executive directors are independent. In doing so, however, the board
did not explicitly take into consideration the independence requirements outlined in the NYSE’s listing standards.
Committees
BP has a number of board committees that are broadly comparable in purpose and composition to those required by NYSE rules for domestic US companies. For
instance, BP has a chairman’s (rather than executive) committee, nomination (rather than nominating/corporate governance) committee and remuneration (rather than compensation) committee. BP also has an audit committee, which NYSE rules require
for both US companies and foreign private issuers. These committees are composed solely of non-executive directors whom the board has determined to be independent, in the manner described above.
The BP board governance principles prescribe the composition, main tasks and requirements of each of the committees (see the board committee reports on page 74). BP has
not, therefore, adopted separate charters for each committee.
Under US securities law and the listing standards of the NYSE, BP is required to have an audit
committee that satisfies the requirements of Rule 10A-3 under the Exchange Act and Section 303A.06 of the NYSE Listed Company Manual. BP’s audit committee complies with these requirements. The BP audit committee does not have direct
responsibility for the appointment, re-appointment or removal of the independent auditors – instead, it follows the UK Companies Act 2006 by making recommendations to the board on these matters for it to put forward for shareholder approval at
the AGM.
One of the NYSE’s additional requirements for the audit committee states that at least one member of the audit committee is to have ‘accounting or
related financial management expertise’. The board determined that Brendan Nelson possessed such expertise and also possesses the financial and audit committee experiences set forth in both the UK Corporate Governance Code and SEC rules (see
Audit committee report on page 74). Mr Nelson is the audit committee financial expert as defined in Item 16A of Form 20-F.
|
|
|
| 110 |
|
BP Annual Report and Form 20-F 2013 |
Shareholder approval of equity compensation plans
The NYSE rules for US companies require that shareholders must be given the opportunity to vote on all equity-compensation plans and material revisions to those plans. BP
complies with UK requirements that are similar to the NYSE rules. The board, however, does not explicitly take into consideration the NYSE’s detailed definition of what are considered ‘material revisions’.
Code of ethics
The NYSE rules require that US companies
adopt and disclose a code of business conduct and ethics for directors, officers and employees. BP has adopted a code of conduct, which applies to all employees, and has board governance principles that address the conduct of directors. In addition
BP has adopted a code of ethics for senior financial officers as required by the SEC. BP considers that these codes and policies address the matters specified in the NYSE rules for US companies.
Code of ethics
The company has adopted a code of ethics for its group chief executive, chief financial officer, group controller, general auditor and chief accounting officer as
required by the provisions of Section 406 of the Sarbanes-Oxley Act of 2002 and the rules issued by the SEC. There have been no waivers from the code of ethics relating to any officers.
BP also has a code of conduct, which is applicable to all employees. This was updated (and published) on 1 January 2012.
Controls and procedures
Evaluation of disclosure controls and procedures
The company maintains ‘disclosure controls and procedures’, as such term is defined in Exchange Act Rule 13a-15(e), that are designed to ensure that information
required to be disclosed in reports the company files or submits under the Exchange Act is recorded, processed, summarized and reported within the time periods specified in the Securities and Exchange Commission rules and forms, and that such
information is accumulated and communicated to management, including the company’s group chief executive and chief financial officer, as appropriate, to allow timely decisions regarding required disclosure.
In designing and evaluating our disclosure controls and procedures, our management, including the group chief executive and chief financial officer, recognize that any
controls and procedures, no matter how well designed and operated, can provide only reasonable, not absolute, assurance that the objectives of the disclosure controls and procedures are met. Because of the inherent limitations in all control
systems, no evaluation of controls can provide absolute assurance that all control issues and instances of fraud, if any, within the company have been detected. Further, in the design and evaluation of our disclosure controls and procedures our
management necessarily was required to apply its judgement in evaluating the cost-benefit relationship of possible controls and procedures. Also, we have investments in certain unconsolidated entities. As we do not control these entities, our
disclosure controls and procedures with respect to such entities are necessarily substantially more limited than those we maintain with respect to our consolidated subsidiaries. Because of the inherent limitations in a cost-effective control system,
misstatements due to error or fraud may occur and not be detected. The company’s disclosure controls and procedures have been designed to meet, and management believes that they meet, reasonable assurance standards.
The company’s management, with the participation of the company’s group chief executive and chief financial
officer, has evaluated the effectiveness of the company’s disclosure controls and procedures pursuant to Exchange Act Rule 13a-15(b) as of the end of the period covered by this annual report. Based on that evaluation, the group chief executive
and chief financial officer have concluded that the company’s disclosure controls and procedures were effective at a reasonable assurance level.
Management’s report on internal control over financial reporting
Management of BP is responsible for establishing and maintaining
adequate internal control over financial reporting. BP’s internal control over financial reporting is a process designed under the supervision of the principal executive and financial officers to provide reasonable assurance regarding the
reliability of financial reporting and the preparation of BP’s financial statements for external reporting purposes in accordance with IFRS.
As of the end of
the 2013 fiscal year, management conducted an assessment of the effectiveness of internal control over financial reporting in accordance with the Internal Control Revised Guidance for Directors (Turnbull). Based on this assessment, management has
determined that BP’s internal control over financial reporting as of 31 December 2013 was effective.
The company’s internal control over
financial reporting includes policies and procedures that pertain to the maintenance of records that, in reasonable detail, accurately and fairly reflect transactions and dispositions of assets; provide reasonable assurances that transactions are
recorded as necessary to permit preparation of financial statements in accordance with IFRS and that receipts and expenditures are being made only in accordance with authorizations of management and the directors of BP; and provide reasonable
assurance regarding prevention or timely detection of unauthorized acquisition, use or disposition of BP’s assets that could have a material effect on our financial statements. BP’s internal control over financial reporting as of
31 December 2013 has been audited by Ernst & Young, an independent registered public accounting firm, as stated in their report appearing on page 121 of BP Annual Report and Form 20-F 2013.
Changes in internal control over financial reporting
There were no changes in the group’s internal controls over financial reporting that occurred during the period covered by the Form 20-F that have materially
affected or are reasonably likely to materially affect our internal controls over financial reporting.
Principal accountants’ fees and services
The audit committee has established policies and procedures for the engagement of the independent
registered public accounting firm, Ernst & Young LLP, to render audit and certain assurance and tax services. The policies provide for pre-approval by the audit committee of specifically defined audit, audit-related, tax and other services
that are not prohibited by regulatory or other professional requirements. Ernst & Young are engaged for these services when its expertise and experience of BP are important. Most of this work is of an audit nature. Tax services were awarded
either through a full competitive tender process or following an assessment of the expertise of Ernst & Young relative to that of other potential service providers. These services are for a fixed term.
|
|
|
|
|
| BP Annual Report and Form 20-F 2013 |
|
|
111 |
|
Under the policy, pre-approval is given for specific services within the following categories: advice on accounting,
auditing and financial reporting matters; internal accounting and risk management control reviews (excluding any services relating to information systems design and implementation); non-statutory audit; project assurance and advice on business and
accounting process improvement (excluding any services relating to information systems design and implementation relating to BP’s financial statements or accounting records); due diligence in connection with acquisitions, disposals and joint
arrangements (excluding valuation or involvement in prospective financial information); income tax and indirect tax compliance and advisory services; employee tax services (excluding tax services that could impair independence); provision of, or
access to, Ernst & Young publications, workshops, seminars and other training materials; provision of reports from data gathered on non-financial policies and information; and assistance with understanding non-financial regulatory
requirements. BP operates a two-tier system for audit and non-audit services. For audit related services, the audit committee has a pre-approved aggregate level, within which specific work may be approved by management. Non-audit services, including
tax services, are pre-approved for management to authorize per individual engagement, but above a defined level must be approved by the chairman of the audit committee or the full committee. The audit committee has delegated to the chairman of the
audit committee authority to approve permitted services provided that the chairman reports any decisions to the committee at its next scheduled meeting. Any proposed service not included in the approved service list must be approved in advance by
the audit committee chairman and reported to the committee, or approved by the full audit committee in advance of commencement of the engagement.
The audit committee
evaluates the performance of the auditors each year. The audit fees payable to Ernst & Young are reviewed by the committee in the context of other global companies for cost effectiveness. The committee keeps under review the scope and
results of audit work and the independence and objectivity of the auditors. External regulation and BP policy requires the auditors to rotate their lead audit partner every five years. (See Financial statements – Note 37 and Audit committee
report on page 76 for details of audit fees.)
Memorandum and Articles of
Association
The following summarizes certain provisions of the company’s Memorandum and Articles of Association and applicable English law. This
summary is qualified in its entirety by reference to the UK Companies Act 2006 (Act) and the company’s Memorandum and Articles of Association. For information on where investors can obtain copies of the Memorandum and Articles of Association
see Documents on display on page 279.
At the AGM held on 17 April 2008 shareholders voted to adopt new Articles of Association, largely to take account of
changes in UK company law brought about by the Act. Further amendments to the Articles of Association were approved by shareholders at the AGM held on 15 April 2010. There have been no further amendments to the Articles of Association.
The Articles of Association may be amended by a special resolution.
Objects and purposes
BP is incorporated under the name BP p.l.c. and is registered in England and Wales with the registered number 102498. The provisions regulating the operations of the
company, known as its ‘objects’, were historically stated in a company’s memorandum. The Act abolished the need to have object provisions and so at the AGM held on 15 April 2010 shareholders approved the removal of its objects
clause together with all other provisions of its Memorandum that, by virtue of the Act, are treated as forming part of the company’s Articles of Association.
Directors
The business and affairs of BP shall be managed by the directors. The company’s Articles of Association provide that directors
may be appointed by the existing directors or by the shareholders in a general meeting. Any person appointed by the directors will hold office only until the next general meeting and will then be eligible for re-election by the shareholders. A
director may be removed by BP as provided for by applicable law and shall vacate office in certain circumstances as set out in the Articles of Association. There is no requirement for a director to retire on reaching any age.
The Articles of Association place a general prohibition on a director voting in respect of any contract or arrangement in which the director has a material interest other
than by virtue of such director’s interest in shares in the company. However, in the absence of some other material interest not indicated below, a director is entitled to vote and to be counted in a quorum for the purpose of any vote relating
to a resolution concerning the following matters:
| • |
|
The giving of security or indemnity with respect to any money lent or obligation taken by the director at the request or benefit of the company or any of its subsidiaries. |
| • |
|
Any proposal in which the director is interested, concerning the underwriting of company securities or debentures or the giving of any security to a third party for a debt or obligation of the company or any of its
subsidiaries. |
| • |
|
Any proposal concerning any other company in which the director is interested, directly or indirectly (whether as an officer or shareholder or otherwise) provided that the director and persons connected with such
director are not the holder or holders of 1% or more of the voting interest in the shares of such company. |
| • |
|
Any proposal concerning the purchase or maintenance of any insurance policy under which the director may benefit. |
The Act
requires a director of a company who is in any way interested in a contract or proposed contract with the company to declare the nature of the director’s interest at a meeting of the directors of the company. The definition of
‘interest’ includes the interests of spouses, children, companies and trusts. The Act also requires that a director must avoid a situation where a director has, or could have, a direct or indirect interest that conflicts, or possibly may
conflict, with the company’s interests. The Act allows directors of public companies to authorize such conflicts where appropriate, if a company’s Articles of Association so permit. BP’s Articles of Association permit the
authorization of such conflicts. The directors may exercise all the powers of the company to borrow money, except that the amount remaining undischarged of all moneys borrowed by the company shall not, without approval of the shareholders, exceed
the amount paid up on the share capital plus the aggregate of the amount of the capital and revenue reserves of the company. Variation of the borrowing power of the board may only be affected by amending the Articles of Association.
|
|
|
| 112 |
|
BP Annual Report and Form 20-F 2013 |
Remuneration of non-executive directors shall be determined in the aggregate by resolution of the shareholders.
Remuneration of executive directors is determined by the remuneration committee. This committee is made up of non-executive directors only. There is no requirement of share ownership for a director’s qualification.
Dividend rights; other rights to share in company profits; capital calls
If recommended by the directors of BP, BP shareholders may, by resolution, declare dividends but no such dividend may be declared in excess of the amount recommended by
the directors. The directors may also pay interim dividends without obtaining shareholder approval. No dividend may be paid other than out of profits available for distribution, as determined under IFRS and the Act. Dividends on ordinary shares are
payable only after payment of dividends on BP preference shares. Any dividend unclaimed after a period of 12 years from the date of declaration of such dividend shall be forfeited and reverts to BP.
The directors have the power to declare and pay dividends in any currency provided that a sterling equivalent is announced. It is not the company’s intention to
change its current policy of paying dividends in US dollars. At the company’s AGM held on 15 April 2010, shareholders approved the introduction of a Scrip Dividend Programme (Programme) and to include provisions in the Articles of
Association to enable the company to operate the Programme. The Programme enables ordinary shareholders and BP ADS holders to elect to receive new fully paid ordinary shares (or BP ADSs in the case of BP ADS holders) instead of cash. The operation
of the Programme is always subject to the directors’ decision to make the scrip offer available in respect of any particular dividend. Should the directors decide not to offer the scrip in respect of any particular dividend, cash will
automatically be paid instead.
Apart from shareholders’ rights to share in BP’s profits by dividend (if any is declared or announced), the Articles of
Association provide that the directors may set aside:
| • |
|
A special reserve fund out of the balance of profits each year to make up any deficit of cumulative dividend on the BP preference shares. |
| • |
|
A general reserve out of the balance of profits each year, which shall be applicable for any purpose to which the profits of the company may properly be applied. This may include capitalization of such sum, pursuant to
an ordinary shareholders’ resolution, and distribution to shareholders as if it were distributed by way of a dividend on the ordinary shares or in paying up in full unissued ordinary shares for allotment and distribution as bonus shares.
|
Any such sums so deposited may be distributed in accordance with the manner of distribution of dividends as described above.
Holders of shares are not subject to calls on capital by the company, provided that the amounts required to be paid on issue have been paid off. All shares are fully
paid.
Voting rights
The Articles of Association of the company provide that voting on resolutions at a shareholders’ meeting will be decided on a poll other than resolutions of a
procedural nature, which may be decided on a show of hands. If voting is on a poll, every shareholder who is present in person or by proxy has one vote for every ordinary share held and two votes for every £5 in nominal amount of BP preference
shares held. If voting is on a show of hands, each shareholder who is present at the meeting in person or whose duly appointed proxy is present in person will have one vote, regardless of the number of shares held, unless a poll is requested.
Shareholders do not have cumulative voting rights.
Holders of record of ordinary
shares may appoint a proxy, including a beneficial owner of those shares, to attend, speak and vote on their behalf at any shareholders’ meeting.
Record holders
of BP ADSs are also entitled to attend, speak and vote at any shareholders’ meeting of BP by the appointment by the approved depositary, JPMorgan Chase Bank N.A., of them as proxies in respect of the ordinary shares represented by their ADSs.
Each such proxy may also appoint a proxy. Alternatively, holders of BP ADSs are entitled to vote by supplying their voting instructions to the depositary, who will vote the ordinary shares represented by their ADSs in accordance with their
instructions.
Proxies may be delivered electronically.
Matters are transacted at
shareholders’ meetings by the proposing and passing of resolutions, of which there are two types: ordinary or special. An annual general meeting must be held once in every year.
An ordinary resolution requires the affirmative vote of a majority of the votes of those persons voting at a meeting at which there is a quorum. A special resolution
requires the affirmative vote of not less than three-fourths of the persons voting at a meeting at which there is a quorum. Any AGM requires 21 days’ notice. The notice period for a general meeting is 14 days subject to the company obtaining
annual shareholder approval, failing which, a 21-day notice period will apply.
Liquidation rights; redemption provisions
In the event of a liquidation of BP, after payment of all liabilities and applicable deductions under UK laws and subject to the payment of secured creditors, the holders
of BP preference shares would be entitled to the sum of (i) the capital paid up on such shares plus, (ii) accrued and unpaid dividends and (iii) a premium equal to the higher of (a) 10% of the capital paid up on the BP preference
shares and (b) the excess of the average market price over par value of such shares on the LSE during the previous six months. The remaining assets (if any) would be divided pro rata among the holders of ordinary shares.
Without prejudice to any special rights previously conferred on the holders of any class of shares, BP may issue any share with such preferred, deferred or other special
rights, or subject to such restrictions as the shareholders by resolution determine (or, in the absence of any such resolutions, by determination of the directors), and may issue shares that are to be or may be redeemed.
|
|
|
|
|
| BP Annual Report and Form 20-F 2013 |
|
|
113 |
|
Variation of rights
The rights attached to any class of shares may be varied with the consent in writing of holders of 75% of the shares of that class or on the adoption of a special
resolution passed at a separate meeting of the holders of the shares of that class. At every such separate meeting, all of the provisions of the Articles of Association relating to proceedings at a general meeting apply, except that the quorum with
respect to a meeting to change the rights attached to the preference shares is 10% or more of the shares of that class, and the quorum to change the rights attached to the ordinary shares is one-third or more of the shares of that class.
Shareholders’ meetings and notices
Shareholders
must provide BP with a postal or electronic address in the UK to be entitled to receive notice of shareholders’ meetings. Holders of BP ADSs are entitled to receive notices under the terms of the deposit agreement relating to BP ADSs. The
substance and timing of notices are described on page 113 under the heading Voting rights.
Under the Act, the AGM of shareholders must be held within the six-month
period once every year. All general meetings shall be held at a time and place determined by the directors within the UK. If any shareholders’ meeting is adjourned for lack of quorum, notice of the time and place of the meeting may be given in
any lawful manner, including electronically. Powers exist for action to be taken either before or at the meeting by authorized officers to ensure its orderly conduct and safety of those attending.
Limitations on voting and shareholding
There are no
limitations imposed by English law or the company’s Memorandum or Articles of Association on the right of non-residents or foreign persons to hold or vote the company’s ordinary shares or BP ADSs, other than limitations that would
generally apply to all of the shareholders and limitations applicable to certain countries and persons subject to EU economic sanctions.
Disclosure of interests in shares
The Act permits a
public company to give notice to any person whom the company believes to be or, at any time during the three years prior to the issue of the notice, to have been interested in its voting shares requiring them to disclose certain information with
respect to those interests. Failure to supply the information required may lead to disenfranchisement of the relevant shares and a prohibition on their transfer and receipt of dividends and other payments in respect of those shares. In this context
the term ‘interest’ is widely defined and will generally include an interest of any kind whatsoever in voting shares, including any interest of a holder of BP ADSs.
|
|
|
| 114 |
|
BP Annual Report and Form 20-F 2013 |
|
|
|
|
|
| BP Annual Report and Form 20-F 2013 |
|
|
115 |
|
THIS PAGE INTENTIONALLY LEFT BLANK
This page does not form part of BP’s Annual Report on Form 20-F as filed with the SEC.
|
|
|
| 116 |
|
BP Annual Report and Form 20-F 2013 |
THIS PAGE INTENTIONALLY LEFT BLANK
This page does not form part of BP’s Annual Report on Form 20-F as filed with the SEC.
|
|
|
|
|
| BP Annual Report and Form 20-F 2013 |
|
|
117 |
|
THIS PAGE INTENTIONALLY LEFT BLANK
This page does not form part of BP’s Annual Report on Form 20-F as filed with the SEC.
|
|
|
| 118 |
|
BP Annual Report and Form 20-F 2013 |
THIS PAGE INTENTIONALLY LEFT BLANK
This page does not form part of BP’s Annual Report on Form 20-F as filed with the SEC.
|
|
|
|
|
| BP Annual Report and Form 20-F 2013 |
|
|
119 |
|
Consolidated financial statements of the BP group
Report of Independent Registered Public Accounting Firm on the Annual Report on Form 20-F
The Board of Directors and Shareholders of BP p.l.c.
We have audited the accompanying group balance sheets of BP p.l.c. as of 31 December 2013, 31 December 2012 and 1 January 2012, and the related group income
statement, group statement of comprehensive income, group statement of changes in equity and group cash flow statement for each of the three years in the period ended 31 December 2013. These financial statements are the responsibility of the
Company’s management. Our responsibility is to express an opinion on these financial statements based on our audits.
We conducted our audits in accordance with
the standards of the Public Company Accounting Oversight Board (United States). Those standards require that we plan and perform the audit to obtain reasonable assurance about whether the financial statements are free of material misstatement. An
audit includes examining, on a test basis, evidence supporting the amounts and disclosures in the financial statements. An audit also includes assessing the accounting principles used and significant estimates made by management, as well as
evaluating the overall financial statement presentation. We believe that our audits provide a reasonable basis for our opinion.
In our opinion, the financial
statements referred to above present fairly, in all material respects, the group financial position of BP p.l.c. at 31 December 2013, 31 December 2012 and 1 January 2012 and the group results of its operations and its cash flows for each of the
three years in the period ended 31 December 2013, in accordance with International Financial Reporting Standards as adopted by the European Union and International Financial Reporting Standards as issued by the International Accounting
Standards Board.
In forming our opinion we have considered the adequacy of the disclosures made in Note 2 to the financial statements concerning the provisions,
future expenditures for which reliable estimates cannot be made and other contingencies related to the Gulf of Mexico oil spill significant event. The total amounts that will ultimately be paid by BP in relation to all obligations relating to the
incident are subject to significant uncertainty and the ultimate exposure and cost to BP will be dependent on many factors. Furthermore, significant uncertainty exists in relation to the amount of claims that will become payable by BP, the amount of
fines that will ultimately be levied on BP (including any determination of BP’s culpability based on any findings of negligence, gross negligence or wilful misconduct), the outcome of litigation and arbitration proceedings, and any costs
arising from any longer-term environmental consequences of the oil spill, which will also impact upon the ultimate cost for BP. Our opinion is not qualified in respect of these matters.
As discussed in Note 1 to the consolidated financial statements, the group has changed its accounting policies for employee benefits and interests in joint arrangements,
including related disclosures, as a result of adopting new and revised International Financial Reporting Standards.
We also have audited, in accordance with the
standards of the Public Company Accounting Oversight Board (United States), BP p.l.c.’s internal control over financial reporting as of 31 December 2013, based on criteria established in Internal Control: Revised Guidance for Directors on
the Combined Code as issued by the Institute of Chartered Accountants in England and Wales (the Turnbull guidance) and our report dated 6 March 2014 expressed an unqualified opinion.
/s/ Ernst & Young LLP
London, England
6 March 2014
|
|
|
| 120 |
|
BP Annual Report and Form 20-F 2013 |
Consolidated financial statements of the BP group
Report of Independent Registered Public Accounting Firm on the Annual Report on Form 20-F
The Board of Directors and Shareholders of BP p.l.c.
We have audited BP p.l.c.’s internal control over financial reporting as of 31 December 2013, based on criteria established in Internal Control: Revised
Guidance for Directors on the Combined Code as issued by the Institute of Chartered Accountants in England and Wales (the Turnbull guidance). BP p.l.c.’s management is responsible for maintaining effective internal control over financial
reporting, and for its assessment of the effectiveness of internal control over financial reporting included in the accompanying Management’s report on internal control on page 111. Our responsibility is to express an opinion on the
company’s internal control over financial reporting based on our audit.
We conducted our audit in accordance with the standards of the Public Company Accounting
Oversight Board (United States). Those standards require that we plan and perform the audit to obtain reasonable assurance about whether effective internal control over financial reporting was maintained in all material respects. Our audit included
obtaining an understanding of internal control over financial reporting, assessing the risk that a material weakness exists, testing and evaluating the design and operating effectiveness of internal control based on the assessed risk, and performing
such other procedures as we considered necessary in the circumstances. We believe that our audit provides a reasonable basis for our opinion.
A company’s
internal control over financial reporting is a process designed to provide reasonable assurance regarding the reliability of financial reporting and the preparation of financial statements for external purposes in accordance with generally accepted
accounting principles. A company’s internal control over financial reporting includes those policies and procedures that (1) pertain to the maintenance of records that, in reasonable detail, accurately and fairly reflect the transactions
and dispositions of the assets of the company; (2) provide reasonable assurance that transactions are recorded as necessary to permit preparation of financial statements in accordance with generally accepted accounting principles, and that
receipts and expenditures of the company are being made only in accordance with authorizations of management and directors of the company; and (3) provide reasonable assurance regarding prevention or timely detection of unauthorized
acquisition, use or disposition of the company’s assets that could have a material effect on the financial statements.
Because of its inherent limitations,
internal control over financial reporting may not prevent or detect misstatements. Also, projections of any evaluation of effectiveness to future periods are subject to the risk that controls may become inadequate because of changes in conditions,
or that the degree of compliance with the policies or procedures may deteriorate.
In our opinion, BP p.l.c. maintained, in all material respects, effective internal
control over financial reporting as of 31 December 2013, based on the Turnbull guidance.
We also have audited, in accordance with the standards of the
Public Company Accounting Oversight Board (United States), the group balance sheets of BP p.l.c. as of 31 December 2013 and 2012, and the related group income statement, group statement of comprehensive income, group statement of changes in
equity and group cash flow statement for each of the three years in the period ended 31 December 2013, and our report dated 6 March 2014 expressed an unqualified opinion thereon.
/s/ Ernst & Young LLP
London, England
6 March 2014
Consent of
independent registered public accounting firm
We consent to the incorporation by reference of our reports dated 6 March 2014, with respect to the group
financial statements of BP p.l.c., and the effectiveness of internal control over financial reporting of BP p.l.c., included in this Annual Report and Form 20-F for the year ended 31 December 2013 in the following Registration Statements:
Registration Statement on Form F-3 (File No. 333-179953) of BP Capital Markets p.l.c. and BP p.l.c.; and
Registration Statements on Form S-8 (File Nos. 333-149778, 333-79399, 333-67206, 333-103924, 333-123482,
333-123483, 333-131583, 333-146868, 333-146870, 333-146873, 333-131584, 333-132619, 333-173136, 333-177423, 333-179406, 333-186463 and 333-186462) of BP p.l.c.
/s/ Ernst & Young LLP
London, England
6 March 2014
|
|
|
|
|
| BP Annual Report and Form 20-F 2013 |
|
|
121 |
|
Group income statement
|
|
|
|
|
|
|
|
|
|
|
|
|
|
|
|
|
|
|
| For the year ended 31 December |
|
|
|
|
|
|
|
|
|
|
|
|
$ million |
|
| |
|
|
|
Note |
|
|
2013 |
|
|
2012a |
|
|
2011a |
|
| Sales and other operating revenues |
|
|
|
|
7 |
|
|
|
379,136 |
|
|
|
375,765 |
|
|
|
375,713 |
|
| Earnings from joint ventures – after interest and tax |
|
|
|
|
17 |
|
|
|
447 |
|
|
|
260 |
|
|
|
767 |
|
| Earnings from associates – after interest and tax |
|
|
|
|
18 |
|
|
|
2,742 |
|
|
|
3,675 |
|
|
|
4,916 |
|
| Interest and other income |
|
|
|
|
8 |
|
|
|
777 |
|
|
|
1,677 |
|
|
|
688 |
|
| Gains on sale of businesses and fixed assets |
|
|
|
|
5 |
|
|
|
13,115 |
|
|
|
6,697 |
|
|
|
4,132 |
|
| Total revenues and other income |
|
|
|
|
|
|
|
|
396,217 |
|
|
|
388,074 |
|
|
|
386,216 |
|
| Purchases |
|
|
|
|
21 |
|
|
|
298,351 |
|
|
|
292,774 |
|
|
|
285,133 |
|
| Production and manufacturing expensesb |
|
|
|
|
|
|
|
|
27,527 |
|
|
|
33,926 |
|
|
|
24,163 |
|
| Production and similar taxes |
|
|
|
|
7 |
|
|
|
7,047 |
|
|
|
8,158 |
|
|
|
8,280 |
|
| Depreciation, depletion and amortization |
|
|
|
|
7 |
|
|
|
13,510 |
|
|
|
12,687 |
|
|
|
11,357 |
|
| Impairment and losses on sale of businesses and fixed assets |
|
|
|
|
5 |
|
|
|
1,961 |
|
|
|
6,275 |
|
|
|
2,058 |
|
| Exploration expense |
|
|
|
|
10 |
|
|
|
3,441 |
|
|
|
1,475 |
|
|
|
1,520 |
|
| Distribution and administration expenses |
|
|
|
|
|
|
|
|
13,070 |
|
|
|
13,357 |
|
|
|
13,958 |
|
| Fair value gain on embedded derivatives |
|
|
|
|
26 |
|
|
|
(459 |
) |
|
|
(347 |
) |
|
|
(68 |
) |
| Profit before interest and taxation |
|
|
|
|
|
|
|
|
31,769 |
|
|
|
19,769 |
|
|
|
39,815 |
|
| Finance costsb |
|
|
|
|
8 |
|
|
|
1,068 |
|
|
|
1,072 |
|
|
|
1,187 |
|
| Net finance expense relating to pensions and other post-retirement benefits |
|
|
|
|
30 |
|
|
|
480 |
|
|
|
566 |
|
|
|
400 |
|
| Profit before taxation |
|
|
|
|
|
|
|
|
30,221 |
|
|
|
18,131 |
|
|
|
38,228 |
|
| Taxationb |
|
|
|
|
11 |
|
|
|
6,463 |
|
|
|
6,880 |
|
|
|
12,619 |
|
| Profit for the year |
|
|
|
|
|
|
|
|
23,758 |
|
|
|
11,251 |
|
|
|
25,609 |
|
| Attributable to |
|
|
|
|
|
|
|
|
|
|
|
|
|
|
|
|
|
|
| BP shareholders |
|
|
|
|
32 |
|
|
|
23,451 |
|
|
|
11,017 |
|
|
|
25,212 |
|
| Non-controlling interests |
|
|
|
|
32 |
|
|
|
307 |
|
|
|
234 |
|
|
|
397 |
|
| |
|
|
|
|
|
|
|
|
23,758 |
|
|
|
11,251 |
|
|
|
25,609 |
|
| Earnings per share – cents |
|
|
|
|
|
|
|
|
|
|
|
|
|
|
|
|
|
|
| Profit for the year attributable to BP shareholders |
|
|
|
|
|
|
|
|
|
|
|
|
|
|
|
|
|
|
| Basic |
|
|
|
|
13 |
|
|
|
123.87 |
|
|
|
57.89 |
|
|
|
133.35 |
|
| Diluted |
|
|
|
|
13 |
|
|
|
123.12 |
|
|
|
57.50 |
|
|
|
131.74 |
|
| a |
See Note 1 for information on the restatement of comparative amounts as a result of the adoption of IFRS 11 ‘Joint Arrangements’ and the amended IAS 19 ‘Employee Benefits’. |
| b |
See Note 2 for information on the impact of the Gulf of Mexico oil spill on these income statement line items. |
|
|
|
| 122 |
|
BP Annual Report and Form 20-F 2013 |
Group statement of comprehensive income
|
|
|
|
|
|
|
|
|
|
|
|
|
|
|
|
|
|
|
| For the year ended 31 December |
|
|
|
|
|
|
|
|
|
|
|
|
$ million |
|
| |
|
|
|
Note |
|
|
2013 |
|
|
2012a |
|
|
2011a |
|
| Profit for the year |
|
|
|
|
|
|
|
|
23,758 |
|
|
|
11,251 |
|
|
|
25,609 |
|
| Other comprehensive income |
|
|
|
|
|
|
|
|
|
|
|
|
|
|
|
|
|
|
| Items that may be reclassified subsequently to profit or loss |
|
|
|
|
|
|
|
|
|
|
|
|
|
|
|
|
|
|
| Currency translation differences |
|
|
|
|
|
|
|
|
(1,608 |
) |
|
|
485 |
|
|
|
(543 |
) |
| Exchange gains (losses) on translation of foreign operations reclassified to gain or loss on sale of businesses and fixed assets |
|
|
|
|
|
|
|
|
22 |
|
|
|
(15 |
) |
|
|
19 |
|
| Available-for-sale investments marked to market |
|
|
|
|
|
|
|
|
(172 |
) |
|
|
306 |
|
|
|
(71 |
) |
| Available-for-sale investments reclassified to the income statement |
|
|
|
|
|
|
|
|
(523 |
) |
|
|
(1 |
) |
|
|
(3 |
) |
| Cash flow hedges marked to market |
|
|
|
|
26 |
|
|
|
(2,000 |
) |
|
|
1,466 |
|
|
|
44 |
|
| Cash flow hedges reclassified to the income statement |
|
|
|
|
26 |
|
|
|
4 |
|
|
|
62 |
|
|
|
(195 |
) |
| Cash flow hedges reclassified to the balance sheet |
|
|
|
|
26 |
|
|
|
17 |
|
|
|
19 |
|
|
|
(13 |
) |
| Share of items relating to equity-accounted entities, net of tax |
|
|
|
|
|
|
|
|
(24 |
) |
|
|
(39 |
) |
|
|
(39 |
) |
| Income tax relating to items that may be reclassified |
|
|
|
|
11,32 |
|
|
|
147 |
|
|
|
(170 |
) |
|
|
23 |
|
| |
|
|
|
|
|
|
|
|
(4,137 |
) |
|
|
2,113 |
|
|
|
(778 |
) |
| Items that will not be reclassified to profit or loss |
|
|
|
|
|
|
|
|
|
|
|
|
|
|
|
|
|
|
| Remeasurements of the net pension and other post-retirement benefit liability or asset |
|
|
|
|
30 |
|
|
|
4,764 |
|
|
|
(1,572 |
) |
|
|
(5,301 |
) |
| Share of items relating to equity-accounted entities, net of tax |
|
|
|
|
|
|
|
|
2 |
|
|
|
(6 |
) |
|
|
– |
|
| Income tax relating to items that will not be reclassified |
|
|
|
|
11,32 |
|
|
|
(1,521 |
) |
|
|
440 |
|
|
|
1,467 |
|
| |
|
|
|
|
|
|
|
|
3,245 |
|
|
|
(1,138 |
) |
|
|
(3,834 |
) |
| Other comprehensive income |
|
|
|
|
|
|
|
|
(892 |
) |
|
|
975 |
|
|
|
(4,612 |
) |
| Total comprehensive income |
|
|
|
|
|
|
|
|
22,866 |
|
|
|
12,226 |
|
|
|
20,997 |
|
| Attributable to |
|
|
|
|
|
|
|
|
|
|
|
|
|
|
|
|
|
|
| BP shareholders |
|
|
|
|
32 |
|
|
|
22,574 |
|
|
|
11,988 |
|
|
|
20,613 |
|
| Non-controlling interests |
|
|
|
|
32 |
|
|
|
292 |
|
|
|
238 |
|
|
|
384 |
|
| |
|
|
|
|
|
|
|
|
22,866 |
|
|
|
12,226 |
|
|
|
20,997 |
|
| a |
See Note 1 for information on the restatement of comparative amounts as a result of the adoption of IFRS 11 ‘Joint Arrangements’, the amended IAS 19 ‘Employee Benefits’ and the amended IAS 1
‘Presentation of Financial Statements’. |
Group statement of changes in equitya b
|
|
|
|
|
|
|
|
|
|
|
|
|
|
|
|
|
|
|
|
|
|
|
|
|
|
|
|
|
|
|
|
|
|
|
|
|
|
|
| |
|
|
|
|
|
|
|
|
|
|
|
|
|
|
|
|
|
|
|
|
|
|
|
|
|
|
|
$ million |
|
| |
|
|
|
Share
capital
and
capital
reserves |
|
|
Own
shares
and
treasury
shares |
|
|
Foreign
currency
translation
reserve |
|
|
Fair
value
reserve |
|
|
Share-
based
payment
reserve |
|
|
Profit
and loss
account |
|
|
BP
shareholders’
equity |
|
|
Non-
controlling
interests |
|
|
Total
equity |
|
| At 1 January 2013 |
|
|
|
|
43,513 |
|
|
|
(21,054 |
) |
|
|
5,128 |
|
|
|
1,775 |
|
|
|
1,608 |
|
|
|
87,576 |
|
|
|
118,546 |
|
|
|
1,206 |
|
|
|
119,752 |
|
| Profit for the year |
|
|
|
|
– |
|
|
|
– |
|
|
|
– |
|
|
|
– |
|
|
|
– |
|
|
|
23,451 |
|
|
|
23,451 |
|
|
|
307 |
|
|
|
23,758 |
|
| Other comprehensive income |
|
|
|
|
– |
|
|
|
– |
|
|
|
(1,603 |
) |
|
|
(2,470 |
) |
|
|
– |
|
|
|
3,196 |
|
|
|
(877 |
) |
|
|
(15 |
) |
|
|
(892 |
) |
| Total comprehensive income |
|
|
|
|
– |
|
|
|
– |
|
|
|
(1,603 |
) |
|
|
(2,470 |
) |
|
|
– |
|
|
|
26,647 |
|
|
|
22,574 |
|
|
|
292 |
|
|
|
22,866 |
|
| Dividends |
|
|
|
|
– |
|
|
|
– |
|
|
|
– |
|
|
|
– |
|
|
|
– |
|
|
|
(5,441 |
) |
|
|
(5,441 |
) |
|
|
(469 |
) |
|
|
(5,910 |
) |
| Repurchases of ordinary share capital |
|
|
|
|
– |
|
|
|
– |
|
|
|
– |
|
|
|
– |
|
|
|
– |
|
|
|
(6,923 |
) |
|
|
(6,923 |
) |
|
|
– |
|
|
|
(6,923 |
) |
| Share-based payments, net of tax |
|
|
|
|
143 |
|
|
|
83 |
|
|
|
– |
|
|
|
– |
|
|
|
97 |
|
|
|
150 |
|
|
|
473 |
|
|
|
– |
|
|
|
473 |
|
| Share of equity-accounted entities’ changes in equity, net of tax |
|
|
|
|
– |
|
|
|
– |
|
|
|
– |
|
|
|
– |
|
|
|
– |
|
|
|
73 |
|
|
|
73 |
|
|
|
– |
|
|
|
73 |
|
| Transactions involving non-controlling interests |
|
|
|
|
– |
|
|
|
– |
|
|
|
– |
|
|
|
– |
|
|
|
– |
|
|
|
– |
|
|
|
– |
|
|
|
76 |
|
|
|
76 |
|
| At 31 December 2013 |
|
|
|
|
43,656 |
|
|
|
(20,971 |
) |
|
|
3,525 |
|
|
|
(695 |
) |
|
|
1,705 |
|
|
|
102,082 |
|
|
|
129,302 |
|
|
|
1,105 |
|
|
|
130,407 |
|
|
|
|
|
|
|
|
|
|
|
|
| At 1 January 2012 |
|
|
|
|
43,454 |
|
|
|
(21,323 |
) |
|
|
4,509 |
|
|
|
267 |
|
|
|
1,582 |
|
|
|
83,079 |
|
|
|
111,568 |
|
|
|
1,017 |
|
|
|
112,585 |
|
| Profit for the year |
|
|
|
|
– |
|
|
|
– |
|
|
|
– |
|
|
|
– |
|
|
|
– |
|
|
|
11,017 |
|
|
|
11,017 |
|
|
|
234 |
|
|
|
11,251 |
|
| Other comprehensive income |
|
|
|
|
– |
|
|
|
– |
|
|
|
619 |
|
|
|
1,508 |
|
|
|
– |
|
|
|
(1,156 |
) |
|
|
971 |
|
|
|
4 |
|
|
|
975 |
|
| Total comprehensive income |
|
|
|
|
– |
|
|
|
– |
|
|
|
619 |
|
|
|
1,508 |
|
|
|
– |
|
|
|
9,861 |
|
|
|
11,988 |
|
|
|
238 |
|
|
|
12,226 |
|
| Dividends |
|
|
|
|
– |
|
|
|
– |
|
|
|
– |
|
|
|
– |
|
|
|
– |
|
|
|
(5,294 |
) |
|
|
(5,294 |
) |
|
|
(82 |
) |
|
|
(5,376 |
) |
| Share-based payments, net of tax |
|
|
|
|
59 |
|
|
|
269 |
|
|
|
– |
|
|
|
– |
|
|
|
26 |
|
|
|
(70 |
) |
|
|
284 |
|
|
|
– |
|
|
|
284 |
|
| Transactions involving non-controlling interests |
|
|
|
|
– |
|
|
|
– |
|
|
|
– |
|
|
|
– |
|
|
|
– |
|
|
|
– |
|
|
|
– |
|
|
|
33 |
|
|
|
33 |
|
| At 31 December 2012 |
|
|
|
|
43,513 |
|
|
|
(21,054 |
) |
|
|
5,128 |
|
|
|
1,775 |
|
|
|
1,608 |
|
|
|
87,576 |
|
|
|
118,546 |
|
|
|
1,206 |
|
|
|
119,752 |
|
|
|
|
|
|
|
|
|
|
|
|
| At 1 January 2011 |
|
|
|
|
43,448 |
|
|
|
(21,211 |
) |
|
|
5,036 |
|
|
|
469 |
|
|
|
1,586 |
|
|
|
65,754 |
|
|
|
95,082 |
|
|
|
904 |
|
|
|
95,986 |
|
| Profit for the year |
|
|
|
|
– |
|
|
|
– |
|
|
|
– |
|
|
|
– |
|
|
|
– |
|
|
|
25,212 |
|
|
|
25,212 |
|
|
|
397 |
|
|
|
25,609 |
|
| Other comprehensive income |
|
|
|
|
– |
|
|
|
– |
|
|
|
(527 |
) |
|
|
(202 |
) |
|
|
– |
|
|
|
(3,870 |
) |
|
|
(4,599 |
) |
|
|
(13 |
) |
|
|
(4,612 |
) |
| Total comprehensive income |
|
|
|
|
– |
|
|
|
– |
|
|
|
(527 |
) |
|
|
(202 |
) |
|
|
– |
|
|
|
21,342 |
|
|
|
20,613 |
|
|
|
384 |
|
|
|
20,997 |
|
| Dividends |
|
|
|
|
– |
|
|
|
– |
|
|
|
– |
|
|
|
– |
|
|
|
– |
|
|
|
(4,072 |
) |
|
|
(4,072 |
) |
|
|
(245 |
) |
|
|
(4,317 |
) |
| Share-based payments, net of tax |
|
|
|
|
6 |
|
|
|
(112 |
) |
|
|
– |
|
|
|
– |
|
|
|
(4 |
) |
|
|
102 |
|
|
|
(8 |
) |
|
|
– |
|
|
|
(8 |
) |
| Transactions involving non-controlling interests |
|
|
|
|
– |
|
|
|
– |
|
|
|
– |
|
|
|
– |
|
|
|
– |
|
|
|
(47 |
) |
|
|
(47 |
) |
|
|
(26 |
) |
|
|
(73 |
) |
| At 31 December 2011 |
|
|
|
|
43,454 |
|
|
|
(21,323 |
) |
|
|
4,509 |
|
|
|
267 |
|
|
|
1,582 |
|
|
|
83,079 |
|
|
|
111,568 |
|
|
|
1,017 |
|
|
|
112,585 |
|
| a |
See Note 32 for further information. |
| b |
See Note 1 for information on the restatement of comparative amounts as a result of the adoption of IFRS 11 ‘Joint Arrangements’ and the amended IAS 19 ‘Employee Benefits’. |
|
|
|
|
|
| BP Annual Report and Form 20-F 2013 |
|
|
123 |
|
Group balance sheet
|
|
|
|
|
|
|
|
|
|
|
|
|
|
|
|
|
|
|
| |
|
|
|
|
|
|
|
|
|
|
|
|
$ million |
|
| |
|
|
|
Note |
|
|
31 December
2013 |
|
|
31 December
2012a |
|
|
1 January
2012a |
|
| Non-current assets |
|
|
|
|
|
|
|
|
|
|
|
|
|
|
|
|
|
|
| Property, plant and equipment |
|
|
|
|
14 |
|
|
|
133,690 |
|
|
|
125,331 |
|
|
|
123,431 |
|
| Goodwill |
|
|
|
|
15 |
|
|
|
12,181 |
|
|
|
12,190 |
|
|
|
12,429 |
|
| Intangible assets |
|
|
|
|
16 |
|
|
|
22,039 |
|
|
|
24,632 |
|
|
|
21,653 |
|
| Investments in joint ventures |
|
|
|
|
17 |
|
|
|
9,199 |
|
|
|
8,614 |
|
|
|
8,303 |
|
| Investments in associates |
|
|
|
|
18 |
|
|
|
16,636 |
|
|
|
2,998 |
|
|
|
13,291 |
|
| Other investments |
|
|
|
|
20 |
|
|
|
1,565 |
|
|
|
2,704 |
|
|
|
2,635 |
|
| Fixed assets |
|
|
|
|
|
|
|
|
195,310 |
|
|
|
176,469 |
|
|
|
181,742 |
|
| Loans |
|
|
|
|
|
|
|
|
763 |
|
|
|
642 |
|
|
|
824 |
|
| Trade and other receivables |
|
|
|
|
22 |
|
|
|
5,985 |
|
|
|
5,961 |
|
|
|
5,738 |
|
| Derivative financial instruments |
|
|
|
|
26 |
|
|
|
3,509 |
|
|
|
4,294 |
|
|
|
5,038 |
|
| Prepayments |
|
|
|
|
|
|
|
|
922 |
|
|
|
830 |
|
|
|
739 |
|
| Deferred tax assets |
|
|
|
|
11 |
|
|
|
985 |
|
|
|
874 |
|
|
|
611 |
|
| Defined benefit pension plan surpluses |
|
|
|
|
30 |
|
|
|
1,376 |
|
|
|
12 |
|
|
|
17 |
|
| |
|
|
|
|
|
|
|
|
208,850 |
|
|
|
189,082 |
|
|
|
194,709 |
|
| Current assets |
|
|
|
|
|
|
|
|
|
|
|
|
|
|
|
|
|
|
| Loans |
|
|
|
|
|
|
|
|
216 |
|
|
|
247 |
|
|
|
244 |
|
| Inventories |
|
|
|
|
21 |
|
|
|
29,231 |
|
|
|
28,203 |
|
|
|
26,073 |
|
| Trade and other receivables |
|
|
|
|
22 |
|
|
|
39,831 |
|
|
|
37,611 |
|
|
|
43,589 |
|
| Derivative financial instruments |
|
|
|
|
26 |
|
|
|
2,675 |
|
|
|
4,507 |
|
|
|
3,857 |
|
| Prepayments |
|
|
|
|
|
|
|
|
1,388 |
|
|
|
1,091 |
|
|
|
1,315 |
|
| Current tax receivable |
|
|
|
|
|
|
|
|
512 |
|
|
|
456 |
|
|
|
235 |
|
| Other investments |
|
|
|
|
20 |
|
|
|
467 |
|
|
|
319 |
|
|
|
288 |
|
| Cash and cash equivalents |
|
|
|
|
23 |
|
|
|
22,520 |
|
|
|
19,635 |
|
|
|
14,177 |
|
|
|
|
|
|
|
|
|
|
96,840 |
|
|
|
92,069 |
|
|
|
89,778 |
|
| Assets classified as held for sale |
|
|
|
|
4 |
|
|
|
– |
|
|
|
19,315 |
|
|
|
8,420 |
|
| |
|
|
|
|
|
|
|
|
96,840 |
|
|
|
111,384 |
|
|
|
98,198 |
|
| Total assets |
|
|
|
|
|
|
|
|
305,690 |
|
|
|
300,466 |
|
|
|
292,907 |
|
| Current liabilities |
|
|
|
|
|
|
|
|
|
|
|
|
|
|
|
|
|
|
| Trade and other payables |
|
|
|
|
25 |
|
|
|
47,159 |
|
|
|
46,673 |
|
|
|
52,000 |
|
| Derivative financial instruments |
|
|
|
|
26 |
|
|
|
2,322 |
|
|
|
2,658 |
|
|
|
3,220 |
|
| Accruals |
|
|
|
|
|
|
|
|
8,960 |
|
|
|
6,875 |
|
|
|
6,016 |
|
| Finance debt |
|
|
|
|
27 |
|
|
|
7,381 |
|
|
|
10,033 |
|
|
|
9,039 |
|
| Current tax payable |
|
|
|
|
|
|
|
|
1,945 |
|
|
|
2,503 |
|
|
|
1,943 |
|
| Provisions |
|
|
|
|
29 |
|
|
|
5,045 |
|
|
|
7,587 |
|
|
|
11,238 |
|
|
|
|
|
|
|
|
|
|
72,812 |
|
|
|
76,329 |
|
|
|
83,456 |
|
| Liabilities directly associated with assets classified as held for sale |
|
|
|
|
4 |
|
|
|
– |
|
|
|
846 |
|
|
|
538 |
|
| |
|
|
|
|
|
|
|
|
72,812 |
|
|
|
77,175 |
|
|
|
83,994 |
|
| Non-current liabilities |
|
|
|
|
|
|
|
|
|
|
|
|
|
|
|
|
|
|
| Other payables |
|
|
|
|
25 |
|
|
|
4,756 |
|
|
|
2,292 |
|
|
|
3,214 |
|
| Derivative financial instruments |
|
|
|
|
26 |
|
|
|
2,225 |
|
|
|
2,723 |
|
|
|
3,773 |
|
| Accruals |
|
|
|
|
|
|
|
|
547 |
|
|
|
491 |
|
|
|
400 |
|
| Finance debt |
|
|
|
|
27 |
|
|
|
40,811 |
|
|
|
38,767 |
|
|
|
35,169 |
|
| Deferred tax liabilities |
|
|
|
|
11 |
|
|
|
17,439 |
|
|
|
15,243 |
|
|
|
15,220 |
|
| Provisions |
|
|
|
|
29 |
|
|
|
26,915 |
|
|
|
30,396 |
|
|
|
26,462 |
|
| Defined benefit pension plan and other post-retirement benefit plan deficits |
|
|
|
|
30 |
|
|
|
9,778 |
|
|
|
13,627 |
|
|
|
12,090 |
|
| |
|
|
|
|
|
|
|
|
102,471 |
|
|
|
103,539 |
|
|
|
96,328 |
|
| Total liabilities |
|
|
|
|
|
|
|
|
175,283 |
|
|
|
180,714 |
|
|
|
180,322 |
|
| Net assets |
|
|
|
|
|
|
|
|
130,407 |
|
|
|
119,752 |
|
|
|
112,585 |
|
| Equity |
|
|
|
|
|
|
|
|
|
|
|
|
|
|
|
|
|
|
| BP shareholders’ equity |
|
|
|
|
32 |
|
|
|
129,302 |
|
|
|
118,546 |
|
|
|
111,568 |
|
| Non-controlling interests |
|
|
|
|
32 |
|
|
|
1,105 |
|
|
|
1,206 |
|
|
|
1,017 |
|
| Total equity |
|
|
|
|
32 |
|
|
|
130,407 |
|
|
|
119,752 |
|
|
|
112,585 |
|
| a |
See Note 1 for information on the restatement of comparative amounts as a result of the adoption of IFRS 11 ‘Joint Arrangements’ and the amended IAS 19 ‘Employee Benefits’. |
C-H Svanberg Chairman
R W Dudley Group Chief Executive
6 March 2014
|
|
|
| 124 |
|
BP Annual Report and Form 20-F 2013 |
Group cash flow statement
|
|
|
|
|
|
|
|
|
|
|
|
|
|
|
|
|
|
|
| For the year ended 31 December |
|
|
|
|
|
|
|
|
|
|
|
|
$ million |
|
| |
|
|
|
Note |
|
|
2013 |
|
|
2012a |
|
|
2011a |
|
| Operating activities |
|
|
|
|
|
|
|
|
|
|
|
|
|
|
|
|
|
|
| Profit before taxationb |
|
|
|
|
|
|
|
|
30,221 |
|
|
|
18,131 |
|
|
|
38,228 |
|
| Adjustments to reconcile profit before taxation to net cash provided by operating activities |
|
|
|
|
|
|
|
|
|
|
|
|
|
|
|
|
|
|
| Exploration expenditure written off |
|
|
|
|
10 |
|
|
|
2,710 |
|
|
|
745 |
|
|
|
1,024 |
|
| Depreciation, depletion and amortization |
|
|
|
|
7 |
|
|
|
13,510 |
|
|
|
12,687 |
|
|
|
11,357 |
|
| Impairment and (gain) loss on sale of businesses and fixed assets |
|
|
|
|
5 |
|
|
|
(11,154 |
) |
|
|
(422 |
) |
|
|
(2,074 |
) |
| Earnings from joint ventures and associates |
|
|
|
|
|
|
|
|
(3,189 |
) |
|
|
(3,935 |
) |
|
|
(5,683 |
) |
| Dividends received from joint ventures and associates |
|
|
|
|
|
|
|
|
1,391 |
|
|
|
1,763 |
|
|
|
5,040 |
|
| Interest receivable |
|
|
|
|
|
|
|
|
(314 |
) |
|
|
(379 |
) |
|
|
(284 |
) |
| Interest received |
|
|
|
|
|
|
|
|
173 |
|
|
|
175 |
|
|
|
210 |
|
| Finance costs |
|
|
|
|
8 |
|
|
|
1,068 |
|
|
|
1,072 |
|
|
|
1,187 |
|
| Interest paid |
|
|
|
|
|
|
|
|
(1,084 |
) |
|
|
(1,166 |
) |
|
|
(1,125 |
) |
| Net finance expense relating to pensions and other post-retirement benefits |
|
|
|
|
30 |
|
|
|
480 |
|
|
|
566 |
|
|
|
400 |
|
| Share-based payments |
|
|
|
|
|
|
|
|
297 |
|
|
|
156 |
|
|
|
(88 |
) |
| Net operating charge for pensions and other post-retirement benefits, less contributions and benefit payments for unfunded plans |
|
|
|
|
30 |
|
|
|
(920 |
) |
|
|
(858 |
) |
|
|
(1,003 |
) |
| Net charge for provisions, less payments |
|
|
|
|
|
|
|
|
1,061 |
|
|
|
5,338 |
|
|
|
2,988 |
|
| (Increase) decrease in inventories |
|
|
|
|
|
|
|
|
(1,193 |
) |
|
|
(1,720 |
) |
|
|
(4,079 |
) |
| (Increase) decrease in other current and non-current assets |
|
|
|
|
|
|
|
|
(2,718 |
) |
|
|
2,933 |
|
|
|
(9,860 |
) |
| Increase (decrease) in other current and non-current liabilities |
|
|
|
|
|
|
|
|
(2,932 |
) |
|
|
(8,125 |
) |
|
|
(5,957 |
) |
| Income taxes paid |
|
|
|
|
|
|
|
|
(6,307 |
) |
|
|
(6,482 |
) |
|
|
(8,063 |
) |
| Net cash provided by operating activities |
|
|
|
|
|
|
|
|
21,100 |
|
|
|
20,479 |
|
|
|
22,218 |
|
| Investing activities |
|
|
|
|
|
|
|
|
|
|
|
|
|
|
|
|
|
|
| Capital expenditure |
|
|
|
|
|
|
|
|
(24,520 |
) |
|
|
(23,222 |
) |
|
|
(17,978 |
) |
| Acquisitions, net of cash acquired |
|
|
|
|
3 |
|
|
|
(67 |
) |
|
|
(116 |
) |
|
|
(10,909 |
) |
| Investment in joint ventures |
|
|
|
|
|
|
|
|
(451 |
) |
|
|
(1,526 |
) |
|
|
(855 |
) |
| Investment in associates |
|
|
|
|
|
|
|
|
(4,994 |
) |
|
|
(54 |
) |
|
|
(55 |
) |
| Proceeds from disposals of fixed assets |
|
|
|
|
5 |
|
|
|
18,115 |
|
|
|
9,992 |
|
|
|
3,504 |
|
| Proceeds from disposals of businesses, net of cash disposedc |
|
|
|
|
5 |
|
|
|
3,884 |
|
|
|
1,606 |
|
|
|
(663 |
) |
| Proceeds from loan repayments |
|
|
|
|
|
|
|
|
178 |
|
|
|
245 |
|
|
|
203 |
|
| Net cash used in investing activities |
|
|
|
|
|
|
|
|
(7,855 |
) |
|
|
(13,075 |
) |
|
|
(26,753 |
) |
| Financing activities |
|
|
|
|
|
|
|
|
|
|
|
|
|
|
|
|
|
|
| Net issue (repurchase) of shares |
|
|
|
|
|
|
|
|
(5,358 |
) |
|
|
122 |
|
|
|
74 |
|
| Proceeds from long-term financing |
|
|
|
|
|
|
|
|
8,814 |
|
|
|
11,087 |
|
|
|
11,600 |
|
| Repayments of long-term financing |
|
|
|
|
|
|
|
|
(5,959 |
) |
|
|
(7,177 |
) |
|
|
(9,102 |
) |
| Net increase (decrease) in short-term debt |
|
|
|
|
|
|
|
|
(2,019 |
) |
|
|
(666 |
) |
|
|
2,222 |
|
| Net increase (decrease) in non-controlling interests |
|
|
|
|
|
|
|
|
32 |
|
|
|
– |
|
|
|
– |
|
| Dividends paid |
|
|
|
|
|
|
|
|
|
|
|
|
|
|
|
|
|
|
| BP shareholders |
|
|
|
|
12 |
|
|
|
(5,441 |
) |
|
|
(5,294 |
) |
|
|
(4,072 |
) |
| Non-controlling interests |
|
|
|
|
|
|
|
|
(469 |
) |
|
|
(82 |
) |
|
|
(245 |
) |
| Net cash provided by (used in) financing activities |
|
|
|
|
|
|
|
|
(10,400 |
) |
|
|
(2,010 |
) |
|
|
477 |
|
| Currency translation differences relating to cash and cash equivalents |
|
|
|
|
|
|
|
|
40 |
|
|
|
64 |
|
|
|
(493 |
) |
| Increase (decrease) in cash and cash equivalents |
|
|
|
|
|
|
|
|
2,885 |
|
|
|
5,458 |
|
|
|
(4,551 |
) |
| Cash and cash equivalents at beginning of year |
|
|
|
|
|
|
|
|
19,635 |
|
|
|
14,177 |
|
|
|
18,728 |
|
| Cash and cash equivalents at end of year |
|
|
|
|
|
|
|
|
22,520 |
|
|
|
19,635 |
|
|
|
14,177 |
|
| a |
See Note 1 for information on the restatement of comparative amounts as a result of the adoption of IFRS 11 ‘Joint Arrangements’ and the amended IAS 19 ‘Employee Benefits’. |
| b |
2012 included $709 million of dividends received from TNK-BP. See Note 6 for further information. |
| c |
2011 included the repayment of a deposit received in advance of $3,530 million following the termination of an agreement in respect of the expected sale of our interest in Pan American Energy LLC. |
|
|
|
|
|
| BP Annual Report and Form 20-F 2013 |
|
|
125 |
|
Notes on financial statements
Changes
to the 2013 financial statements
BP aims for the highest standard of financial reporting and supports the initiatives of the UK Financial
Reporting Council and the US Securities and Exchange Commission to improve understandability and transparency by cutting immaterial ‘clutter’ from financial statements. We continually review the structure and content of our financial
reports. For the 2013 financial statements, to increase their understandability and navigability, we have changed the grouping of certain notes, and have also sought to remove immaterial disclosures. In applying materiality to the financial
statement disclosures, we consider both the amount and the nature of each item. The main changes compared with the financial statements included in the BP Annual Report and Form 20-F 2012 are as follows:
| • |
|
Note 1 Significant accounting policies, judgements, estimates and assumptions – this note includes the critical accounting estimates and judgements in boxed text following the relevant accounting policy. Last year
this information was shown under Critical accounting policies in the Additional disclosures section of the Directors’ Report. |
| • |
|
Note 2 Significant event – Gulf of Mexico oil spill now contains all of our financial statement note disclosures in respect of the 2010 oil spill. Last year we also included information in the Provisions and
Contingent liabilities notes to the financial statements. |
| • |
|
Note 7 Segmental analysis now includes analysis of depreciation, depletion and amortization and production and similar taxes, previously provided in separate notes. |
| • |
|
Note 8 Income statement analysis now combines a number of notes previously provided separately, simplifying the presentation while retaining materially the same content. |
| • |
|
Note 15 Goodwill and impairment review of goodwill now contains the disclosures related to impairment testing of goodwill, which were provided in a separate note last year. |
| • |
|
Note 19 Financial instruments and financial risk factors and Note 26 Derivative financial instruments have been rationalized to focus only on the material matters. |
| • |
|
Note 38 Subsidiaries, joint arrangements and associates now lists only the most significant entities. |
| • |
|
A separate share-based payment note is no longer presented. The share-based payment expense for the year is included in Note 33 Employee costs and numbers and information on the dilutive impact of employee share plans
is included in Note 13 Earnings per ordinary share. |
1. Significant accounting policies,
judgements, estimates and assumptions
Authorization of financial statements and statement of compliance with International Financial
Reporting Standards
The consolidated financial statements of the BP group for the year ended 31 December 2013 were approved and signed by the group
chief executive and chairman on 6 March 2014 having been duly authorized to do so by the board of directors. BP p.l.c. is a public limited company incorporated and domiciled in England and Wales. The consolidated financial statements have been
prepared in accordance with International Financial Reporting Standards (IFRS) as issued by the International Accounting Standards Board (IASB), IFRS as adopted by the European Union (EU) and in accordance with the provisions of the UK Companies Act
2006. IFRS as adopted by the EU differs in certain respects from IFRS as issued by the IASB, however, the differences have no impact on the group’s consolidated financial statements for the years presented. The significant accounting policies
and critical accounting judgements, estimates and assumptions of the group are set out below.
Basis of preparation
The consolidated financial statements have been prepared in accordance with IFRS and IFRS Interpretations Committee (IFRIC) interpretations issued and effective for the
year ended 31 December 2013. The standards and interpretations adopted in the year, and the corresponding impact on the financial statements, are described further on page 137.
The accounting policies that follow have been consistently applied to all years presented. Where retrospective restatements were required as a result of the
implementation of new accounting standards or changes to existing accounting standards, these have been applied to all comparative years presented.
Subsequent to
releasing our unaudited fourth quarter and full year 2013 results announcement dated 4 February 2014, a minor amendment has been made to the split of the Upstream replacement cost profit before interest and tax between US and non-US. The amount
reported for US for the year has been reduced by $0.2 billion to $3.1 billion and the amount reported for non-US has been increased by $0.2 billion to $28.9 billion. Similarly, amendments have also been made to the geographical analysis for revenues
and capital expenditure and acquisitions. There was no impact on the group’s profit or loss, net assets or cash flows for the year.
The consolidated financial
statements are presented in US dollars and all values are rounded to the nearest million dollars ($ million), except where otherwise indicated.
Critical accounting policies: use of judgements, estimates and assumptions
Inherent in the application of many of the accounting policies used in preparing the financial statements is the need for BP management to make judgements, estimates and
assumptions that affect the reported amounts of assets and liabilities and the disclosure of contingent assets and liabilities at the date of the financial statements and the reported amounts of revenues and expenses during the period. Actual
outcomes could differ from the estimates and assumptions used. The critical accounting judgements and estimates that could have a significant impact on the results of the group are set out in boxed text below, and should be read in conjunction with
the information provided in the Notes on financial statements. The areas requiring the most significant judgement and estimation in the preparation of the consolidated financial statements are in relation to acquisitions of interests in other
entities, oil and natural gas accounting, including the estimation of reserves, the recoverability of asset carrying values, derivative financial instruments, including the application of hedge accounting, provisions and contingencies, in particular
provisions and contingencies related to the Gulf of Mexico oil spill, pensions and other post-retirement benefits and taxation.
Basis of
consolidation
The group financial statements consolidate the financial statements of BP p.l.c. and the entities it controls (its subsidiaries) drawn up to
31 December each year. Control of an investee exists when the investor is exposed, or has rights, to variable returns from its involvement with the investee and has the ability to affect those returns through its power over the investee. To
have power over an investee, the investor must have existing rights that give it the current ability to direct the relevant activities of the investee. Subsidiaries are consolidated from the date of their acquisition, being the date on which the
group obtains control, and continue to be consolidated until the date that such control ceases. The financial statements of subsidiaries are prepared for the same reporting year as the parent company, using consistent accounting policies.
Intercompany balances and transactions, including unrealized profits arising from intragroup transactions, have been eliminated. Unrealized losses are eliminated unless the transaction provides evidence of an impairment of the asset transferred.
Non-controlling interests represent the equity in subsidiaries that is not attributable, directly or indirectly, to the group.
|
|
|
| 126 |
|
BP Annual Report and Form 20-F 2013 |
1. Significant accounting policies, judgements, estimates and assumptions –
continued
Interests in other entities
Business combinations and goodwill
A business combination
is a transaction or other event in which an acquirer obtains control of one or more businesses. A business is an integrated set of activities and assets that is capable of being conducted and managed for the purpose of providing a return in the form
of dividends or lower costs or other economic benefits directly to investors or other owners or participants. A business consists of inputs and processes applied to those inputs that have the ability to create outputs.
Business combinations are accounted for using the acquisition method. The identifiable assets acquired and liabilities assumed are measured at their fair values at the
acquisition date. The cost of an acquisition is measured as the aggregate of the consideration transferred, measured at acquisition-date fair value, and the amount of any non-controlling interest in the acquiree. Non-controlling interests are stated
either at fair value or at the proportionate share of the recognized amounts of the acquiree’s identifiable net assets. Acquisition costs incurred are expensed and included in distribution and administration expenses.
Goodwill is initially measured as the excess of the aggregate of the consideration transferred, the amount recognized for any non-controlling interest and the
acquisition-date fair values of any previously held interest in the acquiree over the fair value of the identifiable assets acquired and liabilities assumed at the acquisition date.
At the acquisition date, any goodwill acquired is allocated to each of the cash-generating units, or groups of cash-generating units, expected to benefit from the
combination’s synergies.
Following initial recognition, goodwill is measured at cost less any accumulated impairment losses. Goodwill is reviewed for impairment
annually or more frequently if events or changes in circumstances indicate the recoverable amount of the cash-generating unit to which the goodwill relates should be assessed. Where the recoverable amount of the cash-generating unit is less than the
carrying amount, an impairment loss is recognized. An impairment loss recognized for goodwill is not reversed in a subsequent period.
Goodwill arising on business
combinations prior to 1 January 2003 is stated at the previous carrying amount, less subsequent impairments, under UK generally accepted accounting practice.
Goodwill may also arise upon investments in joint ventures and associates, being the surplus of the cost of investment over the group’s share of the net fair value
of the identifiable assets and liabilities. Such goodwill is recorded within the corresponding investment in joint ventures and associates, and any impairment of the investment is included within the group’s share of earnings from joint
ventures and associates.
Interests in joint arrangements
A joint arrangement is an arrangement of which two or more parties have joint control. Joint control is the contractually agreed sharing of control of an arrangement,
which exists only when decisions about the relevant activities require the unanimous consent of the parties sharing control.
A joint venture is a joint arrangement
whereby the parties that have joint control of the arrangement have rights to the net assets of the arrangement. The results, assets and liabilities of a joint venture are incorporated in these financial statements using the equity method of
accounting as described below.
Certain of the group’s activities, particularly in the Upstream segment, are conducted through joint operations, which are joint
arrangements whereby the parties that have joint control of the arrangement have rights to the assets, and obligations for the liabilities, relating to the arrangement. BP recognizes, on a line-by-line basis in the consolidated financial statements,
its share of the assets, liabilities and expenses of these joint operations incurred jointly with the other partners, along with the group’s income from the sale of its share of the output and any liabilities and expenses that the group has
incurred in relation to the joint operation.
Interests in associates
An associate is an entity over which the group has significant influence, through the power to participate in the financial and operating policy decisions of the
investee, but which is not a subsidiary or a joint arrangement. The results, assets and liabilities of an associate are incorporated in these financial statements using the equity method of accounting as described below.
Significant estimate or judgement
Judgement is required in assessing the level of control obtained in a transaction to acquire an interest in another entity: depending upon the facts and
circumstances in each case, BP may obtain control, joint control or significant influence over the entity or arrangement. Transactions which give BP control of a business are business combinations. If BP obtains joint control of an arrangement,
judgement is also required to assess whether the arrangement is a joint operation or a joint venture. If BP has neither control nor joint control, it may be in a position to exercise significant influence over the entity, which is then accounted for
as an associate.
Accounting for business combinations and acquisitions of investments in equity-accounted joint ventures and associates requires
judgements and estimates to be made in order to determine the fair value of the consideration transferred, together with the fair values of the assets acquired and the liabilities assumed in a business combination, or the identifiable assets and
liabilities of the equity-accounted entity at the acquisition date. The group uses all available information, including external valuations and appraisals where appropriate, to determine these fair values. If necessary, the group has up to one year
from the acquisition date to finalize the determinations of fair value for business combinations.
At 31 December 2013, and
since the transaction described in Note 6 concluded on 21 March 2013, BP owned 19.75% of the voting shares of OJSC Oil Company Rosneft (Rosneft), a Russian oil and gas company. The Russian federal government, through its investment company OJSC
Rosneftegaz, owned 69.5% of the voting shares of Rosneft at 31 December 2013. BP uses the equity method of accounting for its investment in Rosneft because under IFRS it is considered to have significant influence. Significant influence is
defined as the power to participate in the financial and operating policy decisions of the investee but is not control or joint control. IFRS identifies several indicators that may provide evidence of significant influence, including representation
on the board of directors of the investee and participation in policy-making processes. BP’s group chief executive, Bob Dudley, has been elected to the board of directors of Rosneft, he is a member of the Rosneft board’s Strategic Planning
Committee and he participated in Rosneft’s steering committee to integrate TNK-BP. Furthermore, under the Rosneft Charter BP has the right to nominate a second director to Rosneft’s nine-person board of directors for election at a general
meeting of shareholders should it choose to do so in the future. In addition, BP holds the voting rights at general meetings of shareholders conferred by its 19.75% stake in Rosneft. In management’s judgement, the group has significant
influence over Rosneft, as defined by the relevant accounting standard, and the investment is therefore accounted for as an associate. BP’s share of Rosneft’s oil and natural gas reserves is included in the estimated net proved reserves of
equity-accounted entities.
|
|
|
|
|
| BP Annual Report and Form 20-F 2013 |
|
|
127 |
|
1. Significant accounting policies, judgements, estimates and assumptions – continued
The equity method of accounting
Under the equity method, the investment in an equity-accounted entity (joint venture or associate) is carried on the balance sheet at cost plus post-acquisition changes
in the group’s share of net assets of the equity-accounted entity, less distributions received and less any impairment in value of the investment. Loans advanced to equity-accounted entities that have the characteristics of equity financing are
also included in the investment on the group balance sheet. The group income statement reflects the group’s share of the results after tax of the equity-accounted entity, adjusted to account for depreciation, amortization and any impairment of
the equity-accounted entity’s assets based on their fair values at the date of acquisition.
The group statement of comprehensive income includes the
group’s share of the equity-accounted entity’s other comprehensive income. The group’s share of amounts recognized directly in equity by an equity-accounted entity is recognized directly in the group’s statement of changes in
equity.
Financial statements of equity-accounted entities are prepared for the same reporting year as the group. Where material differences arise, adjustments are
made to those financial statements to bring the accounting policies used into line with those of the group.
Unrealized gains on transactions between the group and
its equity-accounted entities are eliminated to the extent of the group’s interest in the equity-accounted entity. Unrealized losses are also eliminated unless the transaction provides evidence of an impairment of the asset transferred.
The group assesses investments in equity-accounted entities for impairment whenever events or changes in circumstances indicate that the carrying value may not be
recoverable. If any such indication of impairment exists, the carrying amount of the investment is compared with its recoverable amount, being the higher of its fair value less costs to sell and value in use. Where the carrying amount exceeds the
recoverable amount, the investment is written down to its recoverable amount.
The group ceases to use the equity method of accounting on the date from which it no
longer has joint control over the joint venture or significant influence over the associate, or when the interest becomes classified as an asset held for sale.
Segmental reporting
The group’s operating segments are established on the basis of those components of the group that are
evaluated regularly by the chief operating decision maker in deciding how to allocate resources and in assessing performance.
On 22 October 2012, BP announced
that it had signed heads of terms for a proposed transaction to sell its 50% share in TNK-BP to Rosneft. Following this agreement, BP’s investment in TNK-BP met the criteria to be classified as held for sale. On 21 March 2013, the disposal
of BP’s investment in TNK-BP completed and BP increased its investment in Rosneft. See Note 6 for further information. BP’s investment in Rosneft is reported as a separate operating segment since that date, reflecting the way in which the
investment is managed.
A separate organization within the group deals with the ongoing response to the Gulf of Mexico oil spill. This organization reports directly
to the group chief executive and its costs are excluded from the results of the operating segments. Under IFRS its costs are presented as a reconciling item between the sum of the results of the reportable segments and the group results.
The accounting policies of the operating segments are the same as the group’s accounting policies described in this note, except that IFRS requires that the measure
of profit or loss disclosed for each operating segment is the measure that is provided regularly to the chief operating decision maker. For BP, this measure of profit or loss is replacement cost profit before interest and tax which reflects the
replacement cost of supplies by excluding from profit inventory holding gains and losses. Replacement cost profit for the group is not a recognized measure under IFRS. For further information see Note 7.
Foreign currency translation
The functional
currency is the currency of the primary economic environment in which an entity operates and is normally the currency in which the entity primarily generates and expends cash.
In individual subsidiaries, joint ventures and associates, transactions in foreign currencies are initially recorded in the functional currency by applying the rate of
exchange ruling at the date of the transaction. Monetary assets and liabilities denominated in foreign currencies are retranslated into the functional currency at the rate of exchange ruling at the balance sheet date. Any resulting exchange
differences are included in the income statement. Non-monetary assets and liabilities, other than those measured at fair value, are not retranslated subsequent to initial recognition.
In the consolidated financial statements, the assets and liabilities of non-US dollar functional currency subsidiaries, joint ventures and associates, including related
goodwill, are translated into US dollars at the rate of exchange ruling at the balance sheet date. The results and cash flows of non-US dollar functional currency subsidiaries, joint ventures and associates are translated into US dollars using
average rates of exchange. Exchange adjustments arising when the opening net assets and the profits for the year retained by non-US dollar functional currency subsidiaries, joint ventures and associates are translated into US dollars are taken to a
separate component of equity and reported in the statement of comprehensive income. Exchange gains and losses arising on long-term intragroup foreign currency borrowings used to finance the group’s non-US dollar investments are also taken to
other comprehensive income. On disposal or partial disposal of a non-US dollar functional currency subsidiary, joint venture or associate, the deferred cumulative amount of exchange gains and losses recognized in equity relating to that particular
non-US dollar operation is reclassified to the income statement.
Non-current assets held for sale
Non-current assets and disposal groups classified as held for sale are measured at the lower of carrying amount and fair value less costs to sell.
Non-current assets and disposal groups are classified as held for sale if their carrying amounts will be recovered through a sale transaction rather than through
continuing use. This condition is regarded as met only when the sale is highly probable and the asset or disposal group is available for immediate sale in its present condition subject only to terms that are usual and customary for sales of such
assets. Management must be committed to the sale, which should be expected to qualify for recognition as a completed sale within one year from the date of classification as held for sale.
Property, plant and equipment and intangible assets are not depreciated once classified as held for sale. The group ceases to use the equity method of accounting from the
date on which an interest in a joint venture or associate becomes held for sale. If a non-current asset or disposal group has been classified as held for sale, but subsequently ceases to meet the criteria to be classified as held for sale, the group
ceases to classify the asset or disposal group as held for sale. Non-current assets and disposal groups that cease to be classified as held for sale are measured at the lower of the carrying amount before the asset or disposal group was classified
as held for sale (adjusted for any depreciation, amortization or revaluation that would have been recognized had the asset or disposal group not been classified as held for sale) and its recoverable amount at the date of the subsequent decision not
to sell. Except for any interests in equity-accounted entities that cease to be classified as held for sale, any adjustment to the carrying amount is recognized in profit or loss in the period in which the asset ceases to be classified as held for
sale. When an interest in an equity-accounted entity ceases to be classified as held for sale, it is accounted for using the equity method as from the date of its classification as held for sale and the financial statements for the periods since
classification as held for sale are amended accordingly.
|
|
|
| 128 |
|
BP Annual Report and Form 20-F 2013 |
1. Significant accounting policies, judgements, estimates and assumptions –
continued
Intangible assets
Intangible assets, other than goodwill, include expenditure on the exploration for and evaluation of oil and natural gas resources, computer software, patents, licences
and trademarks and are stated at the amount initially recognized, less accumulated amortization and accumulated impairment losses. For information on accounting for expenditures on the exploration for and evaluation of oil and natural gas resources,
see the accounting policy for oil and natural gas exploration, appraisal and development expenditure below.
Intangible assets acquired separately from a business are
carried initially at cost. The initial cost is the aggregate amount paid and the fair value of any other consideration given to acquire the asset. An intangible asset acquired as part of a business combination is measured at fair value at the date
of acquisition and is recognized separately from goodwill if the asset is separable or arises from contractual or other legal rights.
Intangible assets with a finite
life are amortized on a straight-line basis over their expected useful lives. For patents, licences and trademarks, expected useful life is the shorter of the duration of the legal agreement and economic useful life, and can range from three to 15
years. Computer software costs generally have a useful life of three to five years.
The expected useful lives of assets are reviewed on an annual basis and, if
necessary, changes in useful lives are accounted for prospectively.
The carrying value of intangible assets is reviewed for impairment whenever events or changes in
circumstances indicate the carrying value may not be recoverable.
Oil and natural gas exploration, appraisal and development expenditure
Oil and natural gas exploration, appraisal and development expenditure is accounted for using the principles of the successful efforts method of accounting.
Licence and property acquisition costs
Exploration
licence and leasehold property acquisition costs are capitalized within intangible assets and are reviewed at each reporting date to confirm that there is no indication that the carrying amount exceeds the recoverable amount. This review includes
confirming that exploration drilling is still under way or firmly planned or that it has been determined, or work is under way to determine, that the discovery is economically viable based on a range of technical and commercial considerations and
sufficient progress is being made on establishing development plans and timing. If no future activity is planned, the remaining balance of the licence and property acquisition costs is written off. Lower value licences are pooled and amortized on a
straight-line basis over the estimated period of exploration. Upon recognition of proved reserves and internal approval for development, the relevant expenditure is transferred to property, plant and equipment.
Exploration and appraisal expenditure
Geological and
geophysical exploration costs are charged against income as incurred. Costs directly associated with an exploration well are initially capitalized as an intangible asset until the drilling of the well is complete and the results have been evaluated.
These costs include employee remuneration, materials and fuel used, rig costs and payments made to contractors. If potentially commercial quantities of hydrocarbons are not found, the exploration well is written off as a dry hole. If hydrocarbons
are found and, subject to further appraisal activity, are likely to be capable of commercial development, the costs continue to be carried as an asset.
Costs
directly associated with appraisal activity, undertaken to determine the size, characteristics and commercial potential of a reservoir following the initial discovery of hydrocarbons, including the costs of appraisal wells where hydrocarbons were
not found, are initially capitalized as an intangible asset. When proved reserves of oil and natural gas are determined and development is approved by management, the relevant expenditure is transferred to property, plant and equipment.
Development expenditure
Expenditure on the construction,
installation and completion of infrastructure facilities such as platforms, pipelines and the drilling of development wells, including service and unsuccessful development or delineation wells, is capitalized within property, plant and equipment and
is depreciated from the commencement of production as described below in the accounting policy for property, plant and equipment.
Significant estimate or judgement
The determination of whether potentially economic oil and natural gas reserves have been discovered by an exploration well is usually made within one year
after well completion, but can take longer, depending on the complexity of the geological structure. Exploration wells that discover potentially economic quantities of oil and natural gas and are in areas where major capital expenditure (e.g.
offshore platform or a pipeline) would be required before production could begin, and where the economic viability of that major capital expenditure depends on the successful completion of further exploration work in the area, remain capitalized on
the balance sheet as long as additional exploration appraisal work is under way or firmly planned.
It is not unusual to have
exploration wells and exploratory-type stratigraphic test wells remaining suspended on the balance sheet for several years while additional appraisal drilling and seismic work on the potential oil and natural gas field is performed or while the
optimum development plans and timing are established. All such carried costs are subject to regular technical, commercial and management review on at least an annual basis to confirm the continued intent to develop, or otherwise extract value from,
the discovery. Where this is no longer the case, the costs are immediately expensed.
Property, plant and equipment
Property, plant and equipment is stated at cost, less accumulated depreciation and accumulated impairment losses. The initial cost of an asset comprises its purchase
price or construction cost, any costs directly attributable to bringing the asset into the location and condition necessary for it to be capable of operating in the manner intended by management, the initial estimate of any decommissioning
obligation, if any, and, for assets that necessarily take a substantial period of time to get ready for their intended use, borrowing costs. The purchase price or construction cost is the aggregate amount paid and the fair value of any other
consideration given to acquire the asset. The capitalized value of a finance lease is also included within property, plant and equipment. Exchanges of assets are measured at fair value unless the exchange transaction lacks commercial substance or
the fair value of neither the asset received nor the asset given up is reliably measurable. The cost of the acquired asset is measured at the fair value of the asset given up, unless the fair value of the asset received is more clearly evident.
Where fair value is not used, the cost of the acquired asset is measured at the carrying amount of the asset given up. The gain or loss on derecognition of the asset given up is recognized in profit or loss.
Expenditure on major maintenance refits or repairs comprises the cost of replacement assets or parts of assets, inspection costs and overhaul costs. Where an asset or
part of an asset that was separately depreciated is replaced and it is probable that future economic benefits associated with the item will flow to the group, the expenditure is capitalized and the carrying amount of the replaced asset is
derecognized. Inspection costs associated with major maintenance programmes are capitalized and amortized over the period to the next inspection. Overhaul costs for major maintenance programmes, and all other maintenance costs are expensed as
incurred.
|
|
|
|
|
| BP Annual Report and Form 20-F 2013 |
|
|
129 |
|
1. Significant accounting policies, judgements, estimates and assumptions – continued
Oil and natural gas properties, including related pipelines, are depreciated using a
unit-of-production method. The cost of producing wells is amortized over proved developed reserves. Licence acquisition, common facilities and future decommissioning costs are amortized over total proved reserves. The unit-of-production rate for the
depreciation of common facilities takes into account expenditures incurred to date, together with estimated future capital expenditure expected to be incurred relating to as yet undeveloped reserves expected to be processed through these common
facilities.
Other property, plant and equipment is depreciated on a straight-line basis over its expected useful life. The typical useful lives of the group’s
other property, plant and equipment are as follows:
|
|
|
| Land improvements |
|
15 to 25 years |
| Buildings |
|
20 to 50 years |
| Refineries |
|
20 to 30 years |
| Petrochemicals plants |
|
20 to 30 years |
| Pipelines |
|
10 to 50 years |
| Service stations |
|
15 years |
| Office equipment |
|
3 to 7 years |
| Fixtures and fittings |
|
5 to 15 years |
The expected useful lives of property, plant and equipment are reviewed on an annual basis and, if necessary, changes in useful lives are
accounted for prospectively.
The carrying amount of property, plant and equipment is reviewed for impairment whenever events or changes in circumstances indicate the
carrying value may not be recoverable.
An item of property, plant and equipment is derecognized upon disposal or when no future economic benefits are expected to
arise from the continued use of the asset. Any gain or loss arising on derecognition of the asset (calculated as the difference between the net disposal proceeds and the carrying amount of the item) is included in the income statement in the period
in which the item is derecognized.
Significant estimate or judgement
The determination of the group’s estimated oil and natural gas reserves requires significant judgements and estimates to be applied and these are
regularly reviewed and updated. Factors such as the availability of geological and engineering data, reservoir performance data, acquisition and divestment activity, drilling of new wells and commodity prices all impact on the determination of the
group’s estimates of its oil and natural gas reserves. BP bases its proved reserves estimates on the requirement of reasonable certainty with rigorous technical and commercial assessments based on conventional industry practice and regulatory
requirements.
The estimation of oil and natural gas reserves and BP’s process to manage reserves bookings is described in Supplementary
information on oil and natural gas on page 200, which is unaudited. Details on BP’s proved reserves and production compliance and governance processes are provided on page 245.
Estimates of oil and natural gas reserves are used to calculate depreciation, depletion and amortization charges for the group’s oil and gas
properties. The impact of changes in estimated proved reserves is dealt with prospectively by amortizing the remaining carrying value of the asset over the expected future production. Oil and natural gas reserves also have a direct impact on the
assessment of the recoverability of asset carrying values reported in the financial statements. If proved reserves estimates are revised downwards, earnings could be affected by higher depreciation expense or an immediate write-down of the
property’s carrying value.
The 2013 movements in proved reserves are reflected in the tables showing movements in oil and
natural gas reserves by region in Supplementary information on oil and natural gas (unaudited) on page 200. Information on the carrying amounts of the group’s oil and natural gas properties, together with the amounts recognized in the income
statement as depreciation, depletion and amortization is contained in Note 10 and Note 7 respectively.
Impairment of intangible assets
and property, plant and equipment
The group assesses assets or groups of assets for impairment whenever events or changes in circumstances indicate that
the carrying amount of an asset may not be recoverable, for example, changes in the group’s business plans, changes in commodity prices leading to sustained unprofitable performance, low plant utilization, evidence of physical damage or, for
oil and gas assets, significant downward revisions of estimated reserves or increases in estimated future development expenditure. If any such indication of impairment exists, the group makes an estimate of the asset’s recoverable amount.
Individual assets are grouped for impairment assessment purposes at the lowest level at which there are identifiable cash flows that are largely independent of the cash flows of other groups of assets. An asset group’s recoverable amount is the
higher of its fair value less costs to sell and its value in use. Where the carrying amount of an asset group exceeds its recoverable amount, the asset group is considered impaired and is written down to its recoverable amount. In assessing value in
use, the estimated future cash flows are adjusted for the risks specific to the asset group and are discounted to their present value using a pre-tax discount rate that reflects current market assessments of the time value of money. Fair value less
costs to sell is identified as the price that would be received to sell the asset in an orderly transaction between market participants and does not reflect the effects of factors that may be specific to the entity and not applicable to entities in
general.
An assessment is made at each reporting date as to whether there is any indication that previously recognized impairment losses may no longer exist or may
have decreased. If such an indication exists, the recoverable amount is estimated. A previously recognized impairment loss is reversed only if there has been a change in the estimates used to determine the asset’s recoverable amount since the
last impairment loss was recognized. If that is the case, the carrying amount of the asset is increased to its recoverable amount. That increased amount cannot exceed the carrying amount that would have been determined, net of depreciation, had no
impairment loss been recognized for the asset in prior years. Such reversal is recognized in profit or loss. After such a reversal, the depreciation charge is adjusted in future periods to allocate the asset’s revised carrying amount, less any
residual value, on a systematic basis over its remaining useful life.
|
|
|
| 130 |
|
BP Annual Report and Form 20-F 2013 |
1. Significant accounting policies, judgements, estimates and assumptions –
continued
Significant estimate or judgement
Determination as to whether, and how much, an asset is impaired involves management estimates on highly uncertain matters such as future commodity prices,
the effects of inflation on operating expenses, discount rates, production profiles and the outlook for global or regional market supply-and-demand conditions for crude oil, natural gas and refined products.
For oil and natural gas properties, the expected future cash flows are estimated using management’s best estimate of future oil and natural gas
prices and reserves volumes. Prices for oil and natural gas used for future cash flow calculations are based on market prices for the first five years and the group’s long-term price assumptions thereafter. As at 31 December 2013, the
group’s long-term price assumptions were $90 per barrel for Brent and $6.50/mmBtu for Henry Hub (2012 $90 per barrel and $6.50/mmBtu). These long-term price assumptions are subject to periodic review and revision. The estimated future level of
production is based on assumptions about future commodity prices, production and development costs, field decline rates, current fiscal regimes and other factors.
For value in use calculations, future cash flows are adjusted for risks specific to the cash-generating unit and are discounted using a pre-tax discount
rate. The discount rate is derived from the group’s post-tax weighted average cost of capital and is adjusted where applicable to take into account any specific risks relating to the country where the cash-generating unit is located, although
other rates may be used if appropriate to the specific circumstances. In 2013 the rates ranged from 12% to 14% nominal (2012 12% to 14% nominal). The discount rates applied in assessments of impairment are reassessed each year. In cases where fair
value less costs to sell is used to determine the recoverable amount of an asset, where recent market transactions for the asset are not available for reference, accounting judgements are made about the assumptions market participants would use when
pricing the asset. Fair value less costs to sell may be determined based on similar recent market transaction data or using discounted cash flow techniques. Where discounted cash flow analyses are used to calculate fair value less costs to sell, the
discount rate used is the group’s post-tax weighted average cost of capital.
Irrespective of whether there is any indication of impairment, BP
is required to test annually for impairment of goodwill acquired in a business combination. The group carries goodwill of approximately $12.2 billion on its balance sheet (2012 $12.2 billion), principally relating to the Atlantic Richfield, Burmah
Castrol, Devon Energy and Reliance transactions. In testing goodwill for impairment, the group uses a similar approach to that described above for asset impairment. If there are low oil or natural gas prices or refining margins or marketing margins
for an extended period, the group may need to recognize significant goodwill impairment charges.
The recoverability of intangible exploration and
appraisal expenditure is covered under Oil and natural gas exploration, appraisal and development expenditure above.
Details of
impairment charges recognized in the income statement are provided in Note 5 and details on the carrying amounts of assets are shown in Note 14, Note 15 and Note 16.
Inventories
Inventories, other than inventory held
for trading purposes, are stated at the lower of cost and net realizable value. Cost is determined by the first-in first-out method and comprises direct purchase costs, cost of production, transportation and manufacturing expenses. Net realizable
value is determined by reference to prices existing at the balance sheet date.
Inventories held for trading purposes are stated at fair value less costs to sell and
any changes in fair value are recognized in the income statement.
Supplies are valued at cost to the group mainly using the average method or net realizable value,
whichever is the lower.
Leases
Finance
leases, which transfer to the group substantially all the risks and benefits incidental to ownership of the leased item, are capitalized at the commencement of the lease term at the fair value of the leased item or, if lower, at the present value of
the minimum lease payments. Finance charges are allocated to each period so as to achieve a constant rate of interest on the remaining balance of the liability and are charged directly against income.
Capitalized leased assets are depreciated over the shorter of the estimated useful life of the asset or the lease term. Operating lease payments are recognized as an
expense in the income statement on a straight-line basis over the lease term. For both finance and operating leases, contingent rents are recognized in the income statement in the period in which they are incurred.
Financial assets
Financial assets are classified
as loans and receivables; financial assets at fair value through profit or loss; derivatives designated as hedging instruments in an effective hedge; held-to-maturity financial assets; or as available-for-sale financial assets, as appropriate.
Financial assets include cash and cash equivalents, trade receivables, other receivables, loans, other investments, and derivative financial instruments. The group determines the classification of its financial assets at initial recognition.
Financial assets are recognized initially at fair value, normally being the transaction price plus, in the case of financial assets not at fair value through profit or loss, directly attributable transaction costs.
The subsequent measurement of financial assets depends on their classification, as follows:
Loans and receivables
Loans and receivables are
non-derivative financial assets with fixed or determinable payments that are not quoted in an active market. Such assets are carried at amortized cost using the effective interest method if the time value of money is significant. Gains and losses
are recognized in income when the loans and receivables are derecognized or impaired, as well as through the amortization process. This category of financial assets includes trade and other receivables. Cash and cash equivalents are short-term
highly liquid investments that are readily convertible to known amounts of cash, are subject to insignificant risk of changes in value and have a maturity of three months or less from the date of acquisition.
Financial assets at fair value through profit or loss
Financial assets at fair value through profit or loss are carried on the balance sheet at fair value with gains or losses recognized in the income statement. Derivatives,
other than those designated as effective hedging instruments, are classified as held for trading and are included in this category.
Derivatives
designated as hedging instruments in an effective hedge
Such derivatives are carried on the balance sheet at fair value. The treatment of gains and losses
arising from revaluation is described below in the accounting policy for derivative financial instruments and hedging activities.
Held-to-maturity financial assets
Held-to-maturity
financial assets are non-derivative financial assets with fixed or determinable payments and fixed maturity that management has the positive intention and ability to hold to maturity. They are measured at amortized cost using the effective interest
method, less any impairment.
|
|
|
|
|
| BP Annual Report and Form 20-F 2013 |
|
|
131 |
|
1. Significant accounting policies, judgements, estimates and assumptions – continued
Available-for-sale financial assets
Available-for-sale financial assets are those non-derivative financial assets that are not classified as loans and receivables, financial assets at fair value through
profit or loss, or held-to-maturity financial assets. After initial recognition, available-for-sale financial assets are measured at fair value, with gains or losses recognized within other comprehensive income, except for impairment losses, foreign
exchange gains or losses and any changes in fair value arising from revised estimates of future cash flows, which are recognized in profit or loss.
Impairment of financial assets
The group assesses at each balance sheet date whether a financial asset or group of financial assets is
impaired.
Loans and receivables
If there is
objective evidence that an impairment loss on loans and receivables carried at amortized cost has been incurred, the amount of the loss is measured as the difference between the asset’s carrying amount and the present value of estimated future
cash flows discounted at the financial asset’s original effective interest rate. The carrying amount of the asset is reduced, with the amount of the loss recognized in the income statement.
Significant estimate or judgement
Judgements are required in assessing the recoverability of overdue trade receivables, such as those in Egypt (see Note 19 for further
details), and determining whether a provision against the future recoverability of those receivables is required. Factors considered include the credit rating of the counterparty, the amount and timing of anticipated future payments and any possible
actions that can be taken to mitigate the risk of non-payment. See Note 19 for information on overdue receivables.
Financial
liabilities
Financial liabilities are classified as financial liabilities at fair value through profit or loss; derivatives designated as hedging
instruments in an effective hedge; or as financial liabilities measured at amortized cost, as appropriate. Financial liabilities include trade and other payables, accruals, most items of finance debt and derivative financial instruments. The group
determines the classification of its financial liabilities at initial recognition. The measurement of financial liabilities depends on their classification, as follows:
Financial liabilities at fair value through profit or loss
Financial liabilities at fair value through profit or loss are carried on the balance sheet at fair value with gains or losses recognized in the income statement.
Derivatives, other than those designated as effective hedging instruments, are classified as held for trading and are included in this category.
Derivatives designated as hedging instruments in an effective hedge
Such derivatives are carried on the balance sheet at fair value. The treatment of gains and losses arising from revaluation is described below in the accounting policy
for derivative financial instruments and hedging activities.
Financial liabilities measured at amortized cost
All other financial liabilities are initially recognized at fair value. For interest-bearing loans and borrowings this is the fair value of the proceeds received net of
issue costs associated with the borrowing.
After initial recognition, other financial liabilities are subsequently measured at amortized cost using the effective
interest method. Amortized cost is calculated by taking into account any issue costs, and any discount or premium on settlement. Gains and losses arising on the repurchase, settlement or cancellation of liabilities are recognized respectively in
interest and other income and finance costs.
This category of financial liabilities includes trade and other payables and finance debt.
Derivative financial instruments and hedging activities
The group uses derivative financial instruments to manage certain exposures to fluctuations in foreign currency exchange rates, interest rates and commodity prices as
well as for trading purposes. Such derivative financial instruments are initially recognized at fair value on the date on which a derivative contract is entered into and are subsequently remeasured at fair value. Derivatives relating to unquoted
equity instruments are carried at cost where it is not possible to reliably measure their fair value subsequent to initial recognition. Derivatives are carried as assets when the fair value is positive and as liabilities when the fair value is
negative.
Contracts to buy or sell a non-financial item that can be settled net in cash or another financial instrument, or by exchanging financial instruments as if
the contracts were financial instruments, with the exception of contracts that were entered into and continue to be held for the purpose of the receipt or delivery of a non-financial item in accordance with the group’s expected purchase, sale
or usage requirements, are accounted for as financial instruments. Contracts to buy or sell equity investments, including investments in associates, are also financial instruments. Gains or losses arising from changes in the fair value of
derivatives that are not designated as effective hedging instruments are recognized in the income statement.
If, at inception of a contract, the valuation cannot be
supported by observable market data, any gain or loss determined by the valuation methodology is not recognized in the income statement but is deferred on the balance sheet and is commonly known as ‘day-one profit or loss’. This deferred
gain or loss is recognized in the income statement over the life of the contract until substantially all the remaining contract term can be valued using observable market data at which point any remaining deferred gain or loss is recognized in the
income statement. Changes in valuation from the initial valuation are recognized immediately through the income statement.
For the purpose of hedge accounting,
hedges are classified as:
| • |
|
Fair value hedges when hedging exposure to changes in the fair value of a recognized asset or liability. |
| • |
|
Cash flow hedges when hedging exposure to variability in cash flows that is either attributable to a particular risk associated with a recognized asset or liability or a highly probable forecast transaction.
|
Hedge relationships are formally designated and documented at inception, together with the risk management objective and strategy for undertaking the
hedge. The documentation includes identification of the hedging instrument, the hedged item or transaction, the nature of the risk being hedged, and how the entity will assess the hedging instrument effectiveness in offsetting the exposure to
changes in the hedged item’s fair value or cash flows attributable to the hedged risk. Such hedges are expected at inception to be highly effective in achieving offsetting changes in fair value or cash flows. Hedges meeting the criteria for
hedge accounting are accounted for as follows:
Fair value hedges
The change in fair value of a hedging derivative is recognized in profit or loss. The change in the fair value of the hedged item attributable to the risk being hedged is
recorded as part of the carrying value of the hedged item and is also recognized in profit or loss.
|
|
|
| 132 |
|
BP Annual Report and Form 20-F 2013 |
1. Significant accounting policies, judgements, estimates and assumptions –
continued
The group applies fair value hedge accounting for hedging fixed interest rate risk on borrowings. The gain or loss
relating to the effective portion of the interest rate swap is recognized in the income statement within finance costs, offsetting the amortization of the interest on the underlying borrowings.
If the criteria for hedge accounting are no longer met, or if the group revokes the designation, the adjustment to the carrying amount of a hedged item for which the
effective interest method is used is amortized to profit or loss over the period to maturity.
Cash flow hedges
For cash flow hedges, the effective portion of the gain or loss on the hedging instrument is recognized within other comprehensive income, while the ineffective portion
is recognized in profit or loss. Amounts taken to other comprehensive income are transferred to the income statement when the hedged transaction affects profit or loss. The gain or loss relating to the effective portion of interest rate swaps
hedging variable rate borrowings is recognized in the income statement within finance costs.
Where the hedged item is the cost of a non-financial asset or liability,
such as a forecast transaction for the purchase of property, plant and equipment, the amounts recognized within other comprehensive income are transferred to the initial carrying amount of the non-financial asset or liability. Where the hedged item
is an equity investment, such as an investment in an associate, the amounts recognized in other comprehensive income remain in the separate component of equity until the investment is sold or impaired.
If the hedging instrument expires or is sold, terminated or exercised without replacement or rollover, or if its designation as a hedge is revoked, amounts previously
recognized within other comprehensive income remain in equity until the forecast transaction occurs and are transferred to the income statement or to the initial carrying amount of a non-financial asset or liability as above.
Significant estimate or judgement
The decision as to whether to apply hedge accounting or not can have a significant impact on the group’s financial statements.
Cash flow and fair value hedge accounting is applied to certain of the group’s finance debt-related derivatives in the normal course of business. In addition, the financial statements reflect the application of cash flow hedge accounting to
certain of the contracts signed in October 2012 for BP to sell its investment in TNK-BP and obtain an additional shareholding in Rosneft, which were accounted for as derivatives under IFRS. We applied ‘all-in-one’ cash flow hedge
accounting to the contracts to acquire shares in Rosneft, resulting in a pre-tax loss of $2,061 million being recognized in other comprehensive income for the year (2012 pre-tax gain of $1,410 million). See Note 26 for further information.
Embedded derivatives
Derivatives
embedded in other financial instruments or other host contracts are treated as separate derivatives when their risks and characteristics are not closely related to those of the host contract. Contracts are assessed for embedded derivatives when the
group becomes a party to them, including at the date of a business combination. Embedded derivatives are measured at fair value at each balance sheet date. Any gains or losses arising from changes in fair value are taken directly to the income
statement.
Fair value measurement
Fair value
is the price that would be received to sell an asset or paid to transfer a liability in an orderly transaction between market participants. The group categorizes assets and liabilities measured at fair value into one of three levels depending on the
ability to observe inputs employed in their measurement. Level 1 inputs are quoted prices in active markets for identical assets or liabilities. Level 2 inputs are inputs that are observable, either directly or indirectly, other than quoted prices
included within level 1 for the asset or liability. Level 3 inputs are unobservable inputs for the asset or liability reflecting significant modifications to observable related market data or BP’s assumptions about pricing by market
participants.
Significant estimate or judgement
In some cases the fair values of derivatives are estimated using internal models due to the absence of quoted prices or other observable,
market-corroborated data. This applies to the group’s longer-term derivative contracts and certain options, and to the forward contracts entered into in 2012 to purchase shares in Rosneft, as well as to the majority of the group’s natural
gas embedded contracts. The group’s embedded derivatives arise primarily from long-term UK gas contracts that use pricing formulae not related to gas prices, for example, oil product and power prices. These contracts are valued using models
with inputs that include price curves for each of the different products that are built up from active market pricing data and extrapolated to the expiry of the contracts using the maximum available external pricing information. Additionally, where
limited data exists for certain products, prices are interpolated using historic and long-term pricing relationships. Price volatility is also an input for the models.
Changes in the key assumptions could have a material impact on the fair value gains and losses on derivatives and embedded derivatives
recognized in the income statement. For more information see Note 26.
Offsetting of financial assets and liabilities
Financial assets and liabilities are presented gross in the balance sheet unless both of the following criteria are met: the group currently has a legally enforceable
right to set off the recognized amounts; and the group intends to either settle on a net basis or realize the asset and settle the liability simultaneously. If both of the criteria are met, the amounts are set off and presented net.
Provisions, contingencies and reimbursement assets
Provisions are recognized when the group has a present obligation (legal or constructive) as a result of a past event, it is probable that an outflow of resources
embodying economic benefits will be required to settle the obligation and a reliable estimate can be made of the amount of the obligation. Where appropriate, the future cash flow estimates are adjusted to reflect risks specific to the liability.
If the effect of the time value of money is material, provisions are determined by discounting the expected future cash flows at a pre-tax risk-free rate that
reflects current market assessments of the time value of money. Where discounting is used, the increase in the provision due to the passage of time is recognized within finance costs. Provisions are split between amounts expected to be settled
within 12 months of the balance sheet date (current) and amounts expected to be settled later (non-current). Contingent liabilities are possible obligations whose existence will only be confirmed by future events not wholly within the control of the
group, or present obligations where it is not probable that an outflow of resources will be required or the amount of the obligation cannot be measured with sufficient reliability.
Contingent liabilities are not recognized in the financial statements but are disclosed unless the possibility of an outflow of economic resources is considered remote.
Where the group makes contributions into a separately administered fund for restoration, environmental or other obligations, which it does not control, and the
group’s right to the assets in the fund is restricted, the obligation to contribute to the fund is recognized as a liability where it is probable that
|
|
|
|
|
| BP Annual Report and Form 20-F 2013 |
|
|
133 |
|
1. Significant accounting policies, judgements, estimates and assumptions – continued
such additional contributions will be made. The group recognizes a reimbursement asset separately, being the lower of the amount of the associated restoration, environmental or other provision
and the group’s share of the fair value of the net assets of the fund available to contributors.
Significant estimate or
judgement
Detailed information on the Gulf of Mexico oil spill, including the financial impacts, is provided in Note 2.
The provision recognized is the best reliable estimate of expenditures required to settle certain present obligations at the end of the reporting period,
however there are future expenditures for which it is not possible to measure the obligation reliably. These are not provided for and are disclosed as contingent liabilities. Accounting judgement is required to identify when a provision can be
measured reliably, which can be especially challenging when complex litigation activities are ongoing.
In addition, for those provisions which are
recognized, there is significant estimation uncertainty about the amounts that will ultimately be paid, especially with regard to amounts payable under the Deepwater Horizon Court Supervised Settlement Program (DHCSSP). A provision is made for these
costs when the amount can be measured reliably; this requires an analysis of claims received and processed and consideration of the status of ongoing legal activity.
The provision for penalties under the US Clean Water Act is based on the estimated civil penalty for strict liability. This provision
is calculated based on estimates as to the volume of oil spilled, as well as the assumption that BP did not act with gross negligence or engage in wilful misconduct, each of which will eventually be determined by the court on the basis of the trial
proceedings.
Decommissioning
Liabilities for
decommissioning costs are recognized when the group has an obligation to plug and abandon a well, dismantle and remove a facility or an item of plant and to restore the site on which it is located, and when a reliable estimate of that liability can
be made. Where an obligation exists for a new facility or item of plant, such as oil and natural gas production or transportation facilities, this liability will be recognized on construction or installation. Similarly, where an obligation exists
for a well, this liability is recognized when it is drilled. An obligation for decommissioning may also crystallize during the period of operation of a well, facility or item of plant through a change in legislation or through a decision to
terminate operations; an obligation may also arise in cases where an asset has been sold but the subsequent owner is no longer able to fulfil its decommissioning obligations, for example due to bankruptcy. The amount recognized is the present value
of the estimated future expenditure determined in accordance with local conditions and requirements.
A corresponding intangible asset (in the case of an exploration
or appraisal well) or item of property, plant and equipment of an amount equivalent to the provision is also recognized. The item of property, plant and equipment is subsequently depreciated as part of the asset.
Other than the unwinding of discount on the provision, any change in the present value of the estimated expenditure is reflected as an adjustment to the provision and the
corresponding asset. Such changes include foreign exchange gains and losses arising on the retranslation of the liability into the functional currency of the reporting entity, when it is known that the liability will be settled in a foreign
currency.
Environmental expenditures and liabilities
Environmental expenditures that relate to future revenues are capitalized. Expenditures that relate to an existing condition caused by past operations that do not
contribute to future earnings are expensed.
Liabilities for environmental costs are recognized when a clean-up is probable and the associated costs can be reliably
estimated. Generally, the timing of recognition of these provisions coincides with the commitment to a formal plan of action or, if earlier, on divestment or on closure of inactive sites.
The amount recognized is the best estimate of the expenditure required. Where the liability will not be settled for a number of years, the amount recognized is the
present value of the estimated future expenditure.
Significant estimate or judgement
The group holds provisions for the future decommissioning of oil and natural gas production facilities and pipelines at the end of their economic lives.
The largest decommissioning obligations facing BP relate to the plugging and abandonment of wells and the removal and disposal of oil and natural gas platforms and pipelines around the world. Most of these decommissioning events are many years in
the future and the precise requirements that will have to be met when the removal event actually occurs are uncertain. Decommissioning technologies and costs are constantly changing, as well as political, environmental, safety and public
expectations. If oil and natural gas production facilities and pipelines are sold to third parties and the subsequent owner is unable to meet their decommissioning obligations, judgement must be used to determine whether BP is then responsible for
decommissioning, and if so the extent of that responsibility. Consequently, the timing and amounts of future cash flows are subject to significant uncertainty. Any changes in the expected future costs are reflected in both the provision and the
asset.
Decommissioning provisions associated with downstream and petrochemicals facilities are generally not recognized, as such potential
obligations cannot be measured, given their indeterminate settlement dates. The group performs periodic reviews of its downstream and petrochemicals long-lived assets for any changes in facts and circumstances that might require the recognition of a
decommissioning provision.
The provision for environmental liabilities is estimated based on current legal and constructive requirements, technology,
price levels and expected plans for remediation. Actual costs and cash outflows can differ from estimates because of changes in laws and regulations, public expectations, prices, discovery and analysis of site conditions and changes in clean-up
technology.
Other provisions and liabilities are recognized in the period when it becomes probable that there will be a future outflow of funds
resulting from past operations or events and the amount of cash outflow can be reliably estimated. The timing of recognition and quantification of the liability require the application of judgement to existing facts and circumstances, which can be
subject to change. Since the actual cash outflows can take place many years in the future, the carrying amounts of provisions and liabilities are reviewed regularly and adjusted to take account of changing facts and circumstances.
The timing and amount of future expenditures are reviewed annually, together with the interest rate used in discounting the cash flows. The interest rate
used to determine the balance sheet obligation at the end of 2013 was a real rate of 1.0% (2012 0.5%), which was based on long-dated government bonds.
Provisions and contingent liabilities in relation to the Gulf of Mexico oil spill are discussed in Note 2. Information about the
group’s other provisions is provided in Note 29. As further described in Note 35, the group is subject to claims and actions. The facts and circumstances relating to particular cases are evaluated regularly in determining whether it is probable
that there will be a future outflow of funds and, once established, whether a provision relating to a specific litigation should be established or revised. Accordingly, significant management judgement relating to provisions and contingent
liabilities is required, since the outcome of litigation is difficult to predict.
|
|
|
| 134 |
|
BP Annual Report and Form 20-F 2013 |
1. Significant accounting policies, judgements, estimates and assumptions –
continued
Employee benefits
Wages, salaries, bonuses, social security contributions, paid annual leave and sick leave are accrued in the period in which the associated services are rendered by
employees of the group. Deferred bonus arrangements that have a vesting date more than 12 months after the period end are valued on an actuarial basis using the projected unit credit method and amortized on a straight-line basis over the service
period until the award vests. The accounting policies for share-based payments and for pensions and other post-retirement benefits are described below.
Share-based payments
Equity-settled transactions
The cost of equity-settled transactions with employees is measured by reference to the fair value at the date at which equity instruments are granted and is recognized as
an expense over the vesting period, which ends on the date on which the employees become fully entitled to the award. Fair value is determined by using an appropriate valuation model. In valuing equity-settled transactions, no account is taken of
any vesting conditions, other than conditions linked to the price of the shares of the company (market conditions). Non-vesting conditions, such as the condition that employees contribute to a savings-related plan, are taken into account in the
grant-date fair value, and failure to meet a non-vesting condition, where this is within the control of the employee is treated as a cancellation and expensed.
Cash-settled transactions
The cost of cash-settled transactions is measured at fair value at each balance sheet date and recognized as an
expense over the vesting period, with a corresponding liability for the cumulative expense recognized on the balance sheet.
Pensions and
other post-retirement benefits
The cost of providing benefits under the defined benefit plans is determined separately for each plan using the projected
unit credit method, which attributes entitlement to benefits to the current period (to determine current service cost) and to the current and prior periods (to determine the present value of the defined benefit obligation). Past service costs,
resulting from either a plan amendment or a curtailment (a reduction in future obligations as a result of a material reduction in the plan membership), are recognized immediately when the company becomes committed to a change.
Net interest expense relating to pensions and other post-retirement benefits represents the net change in present value of plan obligations and the value of plan assets
resulting from the passage of time, and is determined by applying the discount rate to the present value of the benefit obligation at the start of the year, and to the fair value of plan assets at the start of the year, taking into account expected
changes in the obligation or plan assets during the year. Net interest expense relating to pensions and other post-retirement benefits is recognized in the income statement.
Remeasurements of the net defined benefit liability or asset, comprising actuarial gains and losses, and the return on plan assets (excluding amounts included in net
interest described above) are recognized within other comprehensive income in the period in which they occur.
The defined benefit pension plan surplus or deficit in
the balance sheet comprises the total for each plan of the present value of the defined benefit obligation (using a discount rate based on high quality corporate bonds), less the fair value of plan assets out of which the obligations are to be
settled directly. Fair value is based on market price information and, in the case of quoted securities, is the published bid price.
Contributions to defined
contribution plans are recognized in the income statement in the period in which they become payable.
Significant estimate or judgement
Accounting for pensions and other post-retirement benefits involves judgement about uncertain events, including estimated retirement dates, salary levels
at retirement, mortality rates, determination of discount rates for measuring plan obligations and net interest expense, assumptions for inflation rates, US healthcare cost trend rates and rates of utilization of healthcare services by US retirees.
These assumptions are based on the environment in each country. The assumptions used may vary from year to year, which would affect future net income
and net assets. Any differences between these assumptions and the actual outcome also affect future net income and net assets.
Pension and other
post-retirement benefit assumptions are reviewed by management at the end of each year. These assumptions are used to determine the projected benefit obligation at the year end and hence the surpluses and deficits recorded on the group’s
balance sheet, and pension and other post-retirement benefit expense for the following year. In 2013, we adopted the revised version of IAS 19 ‘Employee Benefits’ (see below for further information), and we now apply the same rate of
return on plan assets as we use to discount our pension liabilities. The impact of this change on key financial statement line items is shown at the end of this note.
The pension and other post-retirement benefit assumptions at 31 December 2013, 2012 and 2011 are provided in Note 30.
The discount rate, inflation rate and the US healthcare cost trend rate have a significant effect on the amounts reported. A sensitivity analysis of the
impact of changes in these assumptions on the benefit expense and obligation is provided in Note 30.
In addition to the financial
assumptions, we regularly review the demographic and mortality assumptions. Mortality assumptions reflect best practice in the countries in which we provide pensions and have been chosen with regard to the latest available published tables adjusted
where appropriate to reflect the experience of the group and an extrapolation of past longevity improvements into the future. A sensitivity analysis of the impact of changes in the mortality assumptions on the benefit expense and obligation is
provided in Note 30.
Income taxes
Income tax expense represents the sum of current tax and deferred tax. Interest and penalties relating to income tax are also included in the income tax expense.
Income tax is recognized in the income statement, except to the extent that it relates to items recognized in other comprehensive income or directly in equity, in which
case the related tax is recognized in other comprehensive income or directly in equity.
Current tax is based on the taxable profit for the period. Taxable profit
differs from net profit as reported in the income statement because it is determined in accordance with the rules established by the applicable taxation authorities. It therefore excludes items of income or expense that are taxable or deductible in
other periods as well as items that are never taxable or deductible. The group’s liability for current tax is calculated using tax rates and laws that have been enacted or substantively enacted by the balance sheet date.
Deferred tax is provided, using the liability method, on all temporary differences at the balance sheet date between the tax bases of assets and liabilities and their
carrying amounts for financial reporting purposes.
|
|
|
|
|
| BP Annual Report and Form 20-F 2013 |
|
|
135 |
|
1. Significant accounting policies, judgements, estimates and assumptions – continued
Deferred tax liabilities are recognized for all taxable temporary differences except:
| • |
|
Where the deferred tax liability arises on the initial recognition of goodwill; or |
| • |
|
Where the deferred tax liability arises on the initial recognition of an asset or liability in a transaction that is not a business combination and, at the time of the transaction, affects neither accounting profit nor
taxable profit or loss; or |
| • |
|
In respect of taxable temporary differences associated with investments in subsidiaries, joint ventures and associates, where the group is able to control the timing of the reversal of the temporary differences and it
is probable that the temporary differences will not reverse in the foreseeable future. |
Deferred tax assets are recognized for all deductible temporary
differences, carry-forward of unused tax credits and unused tax losses, to the extent that it is probable that taxable profit will be available against which the deductible temporary differences and the carry-forward of unused tax credits and unused
tax losses can be utilized:
| • |
|
Except where the deferred tax asset relating to the deductible temporary difference arises from the initial recognition of an asset or liability in a transaction that is not a business combination and, at the time of
the transaction, affects neither accounting profit nor taxable profit or loss. |
| • |
|
In respect of deductible temporary differences associated with investments in subsidiaries, joint ventures and associates, deferred tax assets are recognized only to the extent that it is probable that the temporary
differences will reverse in the foreseeable future and taxable profit will be available against which the temporary differences can be utilized. |
The
carrying amount of deferred tax assets is reviewed at each balance sheet date and reduced to the extent that it is no longer probable that sufficient taxable profit will be available to allow all or part of the deferred tax asset to be utilized.
Deferred tax assets and liabilities are measured at the tax rates that are expected to apply in the period when the asset is realized or the liability is settled,
based on tax rates (and tax laws) that have been enacted or substantively enacted at the balance sheet date. Deferred tax assets and liabilities are not discounted.
Deferred tax assets and liabilities are offset only when there is a legally enforceable right to set off current tax assets against current tax liabilities and when the
deferred tax assets and liabilities relate to income taxes levied by the same taxation authority on either the same taxable entity or different taxable entities where there is an intention to settle the current tax assets and liabilities on a net
basis or to realize the assets and settle the liabilities simultaneously.
Significant estimate or judgement
The computation of the group’s income tax expense and liability involves the interpretation of applicable tax laws and regulations in many
jurisdictions throughout the world. The resolution of tax positions taken by the group, through negotiations with relevant tax authorities or through litigation, can take several years to complete and in some cases it is difficult to predict the
ultimate outcome. Therefore, judgement is required to determine provisions for income taxes.
In addition, the group has carry-forward tax losses and
tax credits in certain taxing jurisdictions that are available to offset against future taxable profit. However, deferred tax assets are recognized only to the extent that it is probable that taxable profit will be available against which the unused
tax losses or tax credits can be utilized. Management judgement is exercised in assessing whether this is the case.
To the extent that actual
outcomes differ from management’s estimates, income tax charges or credits, and changes in current and deferred tax assets or liabilities, may arise in future periods. For more information see Note 35.
Judgement is also required when determining whether a particular tax is an income tax or another type of tax (for example a production
tax). Accounting for deferred tax is applied to income taxes as described above, but is not applied to other types of taxes; rather such taxes are recognized in the income statement on an appropriate basis.
Customs duties and sales taxes
Customs duties and
sales taxes which are passed on to customers are excluded from revenues and expenses. Assets and liabilities are recognized net of the amount of customs duties or sales tax except:
| • |
|
Where the customs duty or sales tax incurred on a purchase of goods and services is not recoverable from the taxation authority, in which case the customs duty or sales tax is recognized as part of the cost of
acquisition of the asset. |
| • |
|
Receivables and payables are stated with the amount of customs duty or sales tax included. |
The net amount of sales tax
recoverable from, or payable to, the taxation authority is included within receivables or payables in the balance sheet.
Own equity
instruments
The group’s holdings in its own equity instruments, including ordinary shares held by Employee Share Ownership Plans (ESOPs), are
classified as ‘treasury shares’, or ‘own shares’ for the ESOPs, and are shown as deductions from shareholders’ equity at cost. Consideration received for the sale of such shares is also recognized in equity, with any
difference between the proceeds from sale and the original cost being taken to the profit and loss account reserve. No gain or loss is recognized in the income statement on the purchase, sale, issue or cancellation of equity shares. Shares
repurchased under the share buy-back programme which are immediately cancelled are not shown as treasury shares or own shares, but are shown as a deduction from the profit and loss reserve in the group statement of changes in equity.
Revenue
Revenue arising from the sale of goods is
recognized when the significant risks and rewards of ownership have passed to the buyer, which is typically at the point that title passes, and the revenue can be reliably measured.
Revenue is measured at the fair value of the consideration received or receivable and represents amounts receivable for goods provided in the normal course of business,
net of discounts, customs duties and sales taxes.
Physical exchanges are reported net, as are sales and purchases made with a common counterparty, as part of an
arrangement similar to a physical exchange. Similarly, where the group acts as agent on behalf of a third party to procure or market energy commodities, any associated fee income is recognized but no purchase or sale is recorded. Additionally, where
forward sale and purchase contracts for oil, natural gas or power have been determined to be for trading purposes, the associated sales and purchases are reported net within sales and other operating revenues whether or not physical delivery has
occurred.
|
|
|
| 136 |
|
BP Annual Report and Form 20-F 2013 |
1. Significant accounting policies, judgements, estimates and assumptions –
continued
Generally, revenues from the production of oil and natural gas properties in which the group has an interest with joint
operation partners are recognized on the basis of the group’s working interest in those properties (the entitlement method). Differences between the production sold and the group’s share of production are not significant.
Interest income is recognized as the interest accrues (using the effective interest rate that is the rate that exactly discounts estimated future cash receipts through
the expected life of the financial instrument to the net carrying amount of the financial asset).
Dividend income from investments is recognized when the
shareholders’ right to receive the payment is established.
Research
Research costs are expensed as incurred.
Finance costs
Finance costs directly attributable to the acquisition, construction or production of qualifying assets, which are assets that necessarily take a
substantial period of time to get ready for their intended use, are added to the cost of those assets until such time as the assets are substantially ready for their intended use. All other finance costs are recognized in the income statement in the
period in which they are incurred.
Impact of new International Financial Reporting Standards
Adopted for 2013
BP adopted several new and amended
standards issued by the IASB with effect from 1 January 2013. Of these the following two standards have a significant effect on the group’s consolidated financial statements:
IFRS 11 ‘Joint Arrangements’
In May
2011, the IASB issued IFRS 11 ‘Joint Arrangements’, one of a suite of standards relating to interests in other entities and related disclosures. IFRS 11 establishes a principle that applies to the accounting for all joint arrangements,
whereby parties to the arrangement account for their underlying contractual rights and obligations relating to the joint arrangement. IFRS 11 identifies two types of joint arrangements. A ‘joint venture’ is a joint arrangement whereby the
parties that have joint control of the arrangement have rights to the net assets of the arrangement. A ‘joint operation’ is a joint arrangement whereby the parties that have joint control of the arrangement have rights to the assets, and
obligations for the liabilities, relating to the arrangement. Investments in joint ventures are accounted for using the equity method. Investments in joint operations are accounted for by recognizing the group’s assets, liabilities, revenue and
expenses relating to the joint operation.
The main impact of IFRS 11 is that certain of the group’s former jointly controlled entities, which were equity
accounted, now fall under the definition of a joint operation under IFRS 11. Whilst the effect of the new requirements on the group’s reported income and net assets is not material, the change does impact certain of the component lines of the
group’s financial statements, as shown in the table below. We have derecognized approximately $7 billion of investments and we now recognize the group’s assets, liabilities, revenue and expenses relating to these arrangements. BP’s
share of oil and natural gas reserves associated with former jointly controlled entities that were previously equity-accounted, and are now classified as joint operations, have been reclassified from ‘equity-accounted entities’ to
‘subsidiaries’ in the Supplementary information on oil and natural gas.
Amendments to IAS 19 ‘Employee Benefits’
In June 2011, the IASB issued an amended version of IAS 19 ‘Employee Benefits’, which brings in various changes relating to the recognition and
measurement of post-retirement defined benefit expense and termination benefits, and to the disclosures for all employee benefits. The main impact for BP is that the expense for defined benefit pension and other post-retirement benefit plans now
includes a net interest income or expense, which is calculated by taking the discount rate used for measuring the obligation and applying that to the net defined benefit asset or liability. This means that the expected return on assets credited to
profit or loss (previously calculated based on the expected long-term return on pension assets) is now based on a lower corporate bond rate, the same rate that is used to discount the pension liability. The impact was to decrease profit before tax
by $1,001 million for the year ended 31 December 2013 (2012 $763 million, 2011 $659 million) with other comprehensive income being increased by the same amount. There was no impact on the balance sheet at 31 December or on cash flows.
Adjustments made to certain selected financial statement line items
The following table sets out the adjustments made to certain selected financial statement line items of the previously reported comparative amounts as a result of the
adoption of the amended IAS 19 ‘Employee Benefits’ and the new standard IFRS 11 ‘Joint Arrangements’.
|
|
|
|
|
|
|
|
|
|
|
|
|
|
|
|
|
|
|
|
|
|
|
|
|
|
|
|
|
|
|
|
|
|
|
| |
|
|
|
|
|
|
|
|
|
|
|
|
|
|
|
$ million (except per share amounts) |
|
| Selected lines only |
|
|
|
As reported |
|
|
IFRS 11 |
|
|
IAS 19 |
|
|
2012
As restated |
|
|
As reported |
|
|
IFRS 11 |
|
|
IAS 19 |
|
|
2011
As restateda |
|
| Income statement |
|
|
|
|
|
|
|
|
|
|
|
|
|
|
|
|
|
|
|
|
|
|
|
|
|
|
|
|
|
|
|
|
|
|
| Earnings from joint ventures – after interest and tax |
|
|
|
|
744 |
|
|
|
(484 |
) |
|
|
– |
|
|
|
260 |
|
|
|
1,304 |
|
|
|
(537 |
) |
|
|
– |
|
|
|
767 |
|
| Net finance income (expense) relating to pensions and other post-retirement benefits |
|
|
|
|
201 |
|
|
|
(4 |
) |
|
|
(763 |
) |
|
|
(566 |
) |
|
|
263 |
|
|
|
(4 |
) |
|
|
(659 |
) |
|
|
(400 |
) |
| Profit for the year |
|
|
|
|
11,816 |
|
|
|
22 |
|
|
|
(587 |
) |
|
|
11,251 |
|
|
|
26,097 |
|
|
|
2 |
|
|
|
(490 |
) |
|
|
25,609 |
|
| Earnings per share – cents |
|
|
|
|
|
|
|
|
|
|
|
|
|
|
|
|
|
|
|
|
|
|
|
|
|
|
|
|
|
|
|
|
|
|
| Profit for the year attributable to BP shareholders |
|
|
|
|
|
|
|
|
|
|
|
|
|
|
|
|
|
|
|
|
|
|
|
|
|
|
|
|
|
|
|
|
|
|
| Basic |
|
|
|
|
60.86 |
|
|
|
0.12 |
|
|
|
(3.09 |
) |
|
|
57.89 |
|
|
|
135.93 |
|
|
|
0.01 |
|
|
|
(2.59 |
) |
|
|
133.35 |
|
| Diluted |
|
|
|
|
60.45 |
|
|
|
0.11 |
|
|
|
(3.06 |
) |
|
|
57.50 |
|
|
|
134.29 |
|
|
|
0.01 |
|
|
|
(2.56 |
) |
|
|
131.74 |
|
| Balance sheet |
|
|
|
|
|
|
|
|
|
|
|
|
|
|
|
|
|
|
|
|
|
|
|
|
|
|
|
|
|
|
|
|
|
|
| Property, plant and equipment |
|
|
|
|
120,448 |
|
|
|
4,883 |
|
|
|
– |
|
|
|
125,331 |
|
|
|
119,214 |
|
|
|
4,217 |
|
|
|
– |
|
|
|
123,431 |
|
| Intangible assets |
|
|
|
|
24,041 |
|
|
|
591 |
|
|
|
– |
|
|
|
24,632 |
|
|
|
21,102 |
|
|
|
551 |
|
|
|
– |
|
|
|
21,653 |
|
| Investments in joint ventures |
|
|
|
|
15,724 |
|
|
|
(7,110 |
) |
|
|
– |
|
|
|
8,614 |
|
|
|
15,518 |
|
|
|
(7,215 |
) |
|
|
– |
|
|
|
8,303 |
|
| Net assets |
|
|
|
|
119,620 |
|
|
|
132 |
|
|
|
– |
|
|
|
119,752 |
|
|
|
112,482 |
|
|
|
103 |
|
|
|
– |
|
|
|
112,585 |
|
| Cash flow statement |
|
|
|
|
|
|
|
|
|
|
|
|
|
|
|
|
|
|
|
|
|
|
|
|
|
|
|
|
|
|
|
|
|
|
| Profit (loss) before taxation |
|
|
|
|
18,809 |
|
|
|
85 |
|
|
|
(763 |
) |
|
|
18,131 |
|
|
|
38,834 |
|
|
|
53 |
|
|
|
(659 |
) |
|
|
38,228 |
|
| Net cash provided by operating activities |
|
|
|
|
20,397 |
|
|
|
82 |
|
|
|
– |
|
|
|
20,479 |
|
|
|
22,154 |
|
|
|
64 |
|
|
|
– |
|
|
|
22,218 |
|
| Net cash used in investing activities |
|
|
|
|
(12,962 |
) |
|
|
(113 |
) |
|
|
– |
|
|
|
(13,075 |
) |
|
|
(26,633 |
) |
|
|
(120 |
) |
|
|
– |
|
|
|
(26,753 |
) |
| Increase (decrease) in cash and cash equivalents |
|
|
|
|
5,481 |
|
|
|
(23 |
) |
|
|
– |
|
|
|
5,458 |
|
|
|
(4,489 |
) |
|
|
(62 |
) |
|
|
– |
|
|
|
(4,551 |
) |
| a |
Balance sheet amounts presented are as at 1 January 2012. |
|
|
|
|
|
| BP Annual Report and Form 20-F 2013 |
|
|
137 |
|
1. Significant accounting policies, judgements, estimates and assumptions – continued
Detailed restated financial information for 2012 and 2011 is shown in BP Financial
and Operating Information 2008-2012 available on bp.com/investors.
Other standards
A number of other new or amended standards have been adopted by the group with effect from 1 January 2013 but do not have a significant impact on the financial
statements. These include:
IFRS 10 ‘Consolidated Financial Statements’ introduces a single consolidation model that identifies control as the basis for
consolidation. The new model applies to all types of entities, including structured entities. Under the new model, an investor controls an investee when it is exposed, or has rights, to variable returns from its involvement with the investee and has
the ability to affect those returns through its power over the investee. There was no effect on the group’s reported income or net assets as a result of the adoption of IFRS 10.
IFRS 12 ‘Disclosures of Interests in Other Entities’ combines all the disclosure requirements for an entity’s interests in subsidiaries, joint
arrangements, associates and structured entities into one comprehensive disclosure standard. There was no effect on the group’s reported income or net assets as a result of the adoption of IFRS 12. The disclosures required by the standard are
included in this report.
In May 2011, the IASB issued a new standard, IFRS 13 ‘Fair Value Measurement’. The new standard defines fair value, sets out a
framework for measuring fair value and contains the required disclosures about fair value measurements. IFRS 13 does not require fair value measurements in addition to those already required or permitted by other standards, rather it prescribes how
fair value should be measured if another standard requires it. Fair value is defined as the price that would be received to sell an asset or paid to transfer a liability in an orderly transaction between market participants at the measurement date
i.e. it is an exit price. There was no significant impact on the group’s reported income or net assets as a result of the adoption of IFRS 13. The disclosures required by the new standard are included in this report.
In December 2011, the IASB issued an amendment to IFRS 7 ‘Disclosures – Offsetting Financial Assets and Financial Liabilities’. This amendment introduces
new disclosure requirements about the effects of offsetting financial assets and financial liabilities and related arrangements on an entity’s balance sheet. The new disclosures are included in this report.
In June 2011, the IASB issued amendments to IAS 1 ‘Presentation of Financial Statements’ on the presentation of other comprehensive income (OCI). The amendments
require that those items of OCI that might be reclassified to profit or loss at a future date be presented separately from those items that will never be reclassified to profit or loss. The adoption of the amended standard has a presentational
impact on the group’s statement of comprehensive income, with no effect on the reported income, total comprehensive income, or net assets of the group. The presentation required by the amended standard is included in this report.
In May 2013, the IASB issued an amendment to IAS 36 ‘Impairment of Assets’ in relation to the disclosure of recoverable amounts for non-financial assets. The
amendment addressed certain unintended consequences arising from consequential amendments made to IAS 36 when IFRS 13 was issued. Although the mandatory effective date for application of the amendment is for annual periods beginning on or after
1 January 2014, the group has early-adopted it in these financial statements.
In addition, a number of other standards and interpretations were adopted in the
year which had no significant impact on the group’s reported income and net assets.
Not yet adopted
The following pronouncements from the IASB will become effective for future financial reporting periods and have not yet been adopted by the group.
As part of the IASB’s project to replace IAS 39 ‘Financial Instruments: Recognition and Measurement’, in November 2009 the IASB issued the first phase of
IFRS 9 ‘Financial Instruments’, dealing with the classification and measurement of financial assets. In October 2010, the IASB updated IFRS 9 by incorporating the requirements for the accounting for financial liabilities and in November
2013 the IASB published revised guidance for hedge accounting. The remaining phase of IFRS 9, dealing with impairment, and further changes to the classification and measurement requirements, are still to be completed. In November 2013, the IASB also
removed the effective date from IFRS 9 and will decide on an effective date when the entire IFRS 9 project is closer to completion. BP has not yet decided the date of adoption for the group and has not yet completed its evaluation of the effect of
adoption. The EU has not yet adopted IFRS 9.
In December 2011, the IASB issued an amendment to IAS 32 ‘Offsetting Financial Assets and Financial
Liabilities’. This amendment clarifies the presentation requirements in relation to offsetting financial assets and financial liabilities on an entity’s balance sheet. The amendment to IAS 32 is effective for annual periods beginning on or
after 1 January 2014. BP’s evaluation of the effect of adoption of the amendment to IAS 32 is substantially complete, and is not expected to result in any significant changes to the offsetting of financial assets and liabilities on the
group’s balance sheet.
There are no other standards and interpretations in issue but not yet adopted that the directors anticipate will have a material effect
on the reported income or net assets of the group.
|
|
|
| 138 |
|
BP Annual Report and Form 20-F 2013 |
2. Significant event – Gulf of Mexico oil spill
As a consequence of the Gulf of Mexico oil spill in April 2010, BP continues to incur costs and has also recognized
liabilities for certain future costs. Liabilities of uncertain timing or amount, for which no provision has been made, have been disclosed as contingent liabilities.
The cumulative pre-tax income statement charge since the incident amounts to $42.7 billion. For more information on the types of expenditure included in the
cumulative income statement charge, see Impact upon the group income statement below. The cumulative income statement charge does not include amounts for obligations that BP considers are not possible, at this time, to measure reliably. For further
information, including developments in relation to the interpretation of business economic loss claims under the Plaintiffs’ Steering Committee (PSC) settlement, see Provisions and contingent liabilities below.
The total amounts that will ultimately be paid by BP in relation to all the obligations relating to the incident are subject to significant uncertainty and the ultimate
exposure and cost to BP will be dependent on many factors, as discussed under Provisions and contingent liabilities below, including in relation to any new information or future developments. These could have a material impact on our consolidated
financial position, results of operations and cash flows. The risks associated with the incident could also heighten the impact of the other risks to which the group is exposed as further described under Risk factors on page 51 and Legal proceedings
on page 257.
The impacts of the Gulf of Mexico oil spill on the income statement, balance sheet and cash flow statement of the group are included within the relevant
line items in those statements and are shown in the table below.
|
|
|
|
|
|
|
|
|
|
|
|
|
|
|
|
|
|
|
|
|
|
|
|
|
|
|
| |
|
|
|
|
|
|
|
|
|
|
|
|
|
|
|
|
|
|
$ million |
|
| |
|
|
|
|
|
|
2013 |
|
|
|
|
|
2012 |
|
|
|
|
|
2011 |
|
| |
|
|
|
Total |
|
|
Of which:
amount related
to the trust
fund |
|
|
Total |
|
|
Of which:
amount related
to the trust
fund |
|
|
Total |
|
|
Of which:
amount related to the trust
fund |
|
| Income statement |
|
|
|
|
|
|
|
|
|
|
|
|
|
|
|
|
|
|
|
|
|
|
|
|
|
|
| Production and manufacturing expenses |
|
|
|
|
430 |
|
|
|
(1,542 |
) |
|
|
4,995 |
|
|
|
(1,191 |
) |
|
|
(3,800 |
) |
|
|
(3,995 |
) |
| Profit (loss) before interest and taxation |
|
|
|
|
(430 |
) |
|
|
1,542 |
|
|
|
(4,995 |
) |
|
|
1,191 |
|
|
|
3,800 |
|
|
|
3,995 |
|
| Finance costs |
|
|
|
|
39 |
|
|
|
– |
|
|
|
19 |
|
|
|
12 |
|
|
|
58 |
|
|
|
52 |
|
| Profit (loss) before taxation |
|
|
|
|
(469 |
) |
|
|
1,542 |
|
|
|
(5,014 |
) |
|
|
1,179 |
|
|
|
3,742 |
|
|
|
3,943 |
|
| Less: Taxation |
|
|
|
|
73 |
|
|
|
– |
|
|
|
94 |
|
|
|
– |
|
|
|
(1,387 |
) |
|
|
– |
|
| Profit (loss) for the period |
|
|
|
|
(396 |
) |
|
|
1,542 |
|
|
|
(4,920 |
) |
|
|
1,179 |
|
|
|
2,355 |
|
|
|
3,943 |
|
| Balance sheet |
|
|
|
|
|
|
|
|
|
|
|
|
|
|
|
|
|
|
|
|
|
|
|
|
|
|
| Current assets |
|
|
|
|
|
|
|
|
|
|
|
|
|
|
|
|
|
|
|
|
|
|
|
|
|
|
| Trade and other receivables |
|
|
|
|
2,457 |
|
|
|
2,457 |
|
|
|
4,239 |
|
|
|
4,178 |
|
|
|
|
|
|
|
|
|
| Current liabilities |
|
|
|
|
|
|
|
|
|
|
|
|
|
|
|
|
|
|
|
|
|
|
|
|
|
|
| Trade and other payables |
|
|
|
|
(1,030 |
) |
|
|
(1 |
) |
|
|
(522 |
) |
|
|
(22 |
) |
|
|
|
|
|
|
|
|
| Provisions |
|
|
|
|
(2,951 |
) |
|
|
– |
|
|
|
(5,449 |
) |
|
|
– |
|
|
|
|
|
|
|
|
|
| Net current assets (liabilities) |
|
|
|
|
(1,524 |
) |
|
|
2,456 |
|
|
|
(1,732 |
) |
|
|
4,156 |
|
|
|
|
|
|
|
|
|
| Non-current assets |
|
|
|
|
|
|
|
|
|
|
|
|
|
|
|
|
|
|
|
|
|
|
|
|
|
|
| Other receivables |
|
|
|
|
2,442 |
|
|
|
2,442 |
|
|
|
2,264 |
|
|
|
2,264 |
|
|
|
|
|
|
|
|
|
| Non-current liabilities |
|
|
|
|
|
|
|
|
|
|
|
|
|
|
|
|
|
|
|
|
|
|
|
|
|
|
| Other payables |
|
|
|
|
(2,986 |
) |
|
|
– |
|
|
|
(175 |
) |
|
|
– |
|
|
|
|
|
|
|
|
|
| Provisions |
|
|
|
|
(6,395 |
) |
|
|
– |
|
|
|
(9,751 |
) |
|
|
– |
|
|
|
|
|
|
|
|
|
| Deferred tax |
|
|
|
|
2,748 |
|
|
|
– |
|
|
|
4,002 |
|
|
|
– |
|
|
|
|
|
|
|
|
|
| Net non-current assets (liabilities) |
|
|
|
|
(4,191 |
) |
|
|
2,442 |
|
|
|
(3,660 |
) |
|
|
2,264 |
|
|
|
|
|
|
|
|
|
| Net assets (liabilities) |
|
|
|
|
(5,715 |
) |
|
|
4,898 |
|
|
|
(5,392 |
) |
|
|
6,420 |
|
|
|
|
|
|
|
|
|
| Cash flow statement |
|
|
|
|
|
|
|
|
|
|
|
|
|
|
|
|
|
|
|
|
|
|
|
|
|
|
| Profit (loss) before taxation |
|
|
|
|
(469 |
) |
|
|
1,542 |
|
|
|
(5,014 |
) |
|
|
1,179 |
|
|
|
3,742 |
|
|
|
3,943 |
|
| Finance costs |
|
|
|
|
39 |
|
|
|
– |
|
|
|
19 |
|
|
|
12 |
|
|
|
58 |
|
|
|
52 |
|
| Net charge for provisions, less payments |
|
|
|
|
1,129 |
|
|
|
– |
|
|
|
4,834 |
|
|
|
– |
|
|
|
2,699 |
|
|
|
– |
|
| (Increase) decrease in other current and non-current assets |
|
|
|
|
(1,481 |
) |
|
|
(1,542 |
) |
|
|
(998 |
) |
|
|
(1,191 |
) |
|
|
(4,292 |
) |
|
|
(4,038 |
) |
| Increase (decrease) in other current and non-current liabilities |
|
|
|
|
(618 |
) |
|
|
– |
|
|
|
(5,090 |
) |
|
|
(4,860 |
) |
|
|
(11,113 |
) |
|
|
(10,097 |
) |
| Pre-tax cash flows |
|
|
|
|
(1,400 |
) |
|
|
– |
|
|
|
(6,249 |
) |
|
|
(4,860 |
) |
|
|
(8,906 |
) |
|
|
(10,140 |
) |
The impact on net cash provided by operating activities, on a post-tax basis, amounted to an outflow of $73 million (2012 outflow of
$2,382 million and 2011 outflow of $6,813 million).
Trust fund
BP established the Deepwater Horizon Oil Spill Trust (the Trust) in 2010, to be funded in the amount of $20 billion, to satisfy legitimate individual and business
claims, state and local government claims resolved by BP, final judgments and settlements, state and local response costs, and natural resource damages and related costs. The Trust is available to fund the qualified settlement funds (QSFs)
established under the terms of the settlement agreements (comprising the Economic and Property Damages (EPD) Settlement Agreement and the Medical Benefits Class Action Settlement) with the PSC administered through the Deepwater Horizon Court
Supervised Settlement Program (DHCSSP), and the separate BP claims programme – see Provisions and contingent liabilities below for further information. Fines and penalties are not covered by the trust fund.
The funding of the Trust was completed in the fourth quarter of 2012. The obligation to fund the $20-billion trust fund, adjusted to take account of the time value of
money, was recognized in full in 2010 and charged to the income statement.
BP’s rights and obligations in relation to the $20-billion trust fund are accounted
for in accordance with IFRIC 5 ‘Rights to Interests Arising from Decommissioning, Restoration and Environmental Rehabilitation Funds’. An asset has been recognized representing BP’s right to receive reimbursement from the trust fund.
This is the portion of the estimated future expenditure provided for that will be settled by payments from the trust fund. We use the term ‘reimbursement asset’ to describe this asset. BP will not actually receive any reimbursements from
the trust fund, instead payments will be made directly from the trust fund, and BP will be released from its corresponding obligation. The reimbursement asset is recorded within other receivables on the balance sheet apportioned between current and
non-current elements. The table below shows movements in the
|
|
|
|
|
| BP Annual Report and Form 20-F 2013 |
|
|
139 |
|
2. Significant event – Gulf of Mexico oil spill – continued
reimbursement asset during the period to 31 December 2013. The net increase in the provision of $1,542 million for the full year relates principally to business economic loss
claims processed by the DHCSSP subsequent to finalization of the BP Annual Report and Form 20-F 2012 that have been paid as well as increases in the provision for claims administration costs. The amount of the reimbursement asset at
31 December 2013 is equal to the amount of provisions and payables recognized at that date that will be covered by the trust fund – see below.
|
|
|
|
|
|
|
|
|
|
|
|
|
|
|
| |
|
|
|
|
|
|
|
|
|
$ million |
|
| |
|
|
|
2013 |
|
|
2012 |
|
|
Cumulative since the
incident |
|
| At 1 January |
|
|
|
|
6,442 |
|
|
|
9,875 |
|
|
|
– |
|
| Increase in provision for items covered by the trust fund |
|
|
|
|
1,921 |
|
|
|
1,985 |
|
|
|
20,511 |
|
| Derecognition of provision for items that cannot be reliably estimated |
|
|
|
|
(379 |
) |
|
|
(794 |
) |
|
|
(1,173 |
) |
| Amounts paid directly by the trust fund |
|
|
|
|
(3,085 |
) |
|
|
(4,624 |
) |
|
|
(14,439 |
) |
| At 31 December |
|
|
|
|
4,899 |
|
|
|
6,442 |
|
|
|
4,899 |
|
| Of which – current |
|
|
|
|
2,457 |
|
|
|
4,178 |
|
|
|
2,457 |
|
| –
non-current |
|
|
|
|
2,442 |
|
|
|
2,264 |
|
|
|
2,442 |
|
Any increases in estimated future expenditure that will be covered by the trust fund (up to an aggregate of $20 billion) have no net
income statement effect as a reimbursement asset is also recognized, as described above. As at 31 December 2013, the cumulative charges, and the associated reimbursement asset recognized, amounted to $19,338 million. Thus, a further
$662 million could be charged in subsequent periods for items covered by the trust fund with no net impact on the income statement. Additional liabilities in excess of this amount regarding claims under the Oil Pollution Act of 1990 (OPA 90),
claims that are currently administered by the DHCSSP, or otherwise, including the various claims described in Legal proceedings on page 257, would be expensed to the income statement. Information on those items that currently cannot be estimated
reliably is provided under Provisions and contingent liabilities below.
Under the terms of the EPD Settlement Agreement with the PSC, several QSFs were established
in 2012. These QSFs each relate to specific elements of the agreement, have been and will continue to be funded through payments from the Trust, and are available to make payments to claimants in accordance with those elements of the agreement.
As at 31 December 2013, the aggregate cash balances in the Trust and the QSFs amounted to $6.7 billion, including $1.2 billion remaining in the seafood
compensation fund which has yet to be distributed and $0.9 billion held for natural resource damage early restoration. Should the cash balances in the trust fund not be sufficient, payments in respect of legitimate claims and other costs will
be made directly by BP.
The EPD Settlement Agreement with the PSC provides for a court-supervised settlement programme which commenced operation on 4 June 2012. See
Provisions below for further information on the current status of the EPD Settlement Agreement. In addition, a separate BP claims programme began processing claims from claimants not in the Economic and Property Damages class as determined by the
EPD Settlement Agreement or who have requested to opt out of that settlement. Payments made to claimants through the BP claims programme are paid directly from the Trust. A separate claims administrator has been appointed to pay medical claims and
to implement other aspects of the Medical Benefits Class Action Settlement. For further information on the PSC settlements, see Legal proceedings on page 257.
Other payables
BP reached an agreement with the US
government in 2012, which was approved by the court in 2013, to resolve all federal criminal claims arising from the incident. Under the agreement, BP will pay $4 billion over a period of five years. At 31 December 2013, the remaining payable
was $3,525 million, of which $565 million falls due in 2014.
BP also reached a settlement with the US Securities and Exchange Commission (SEC) in 2012, resolving the
SEC’s Gulf of Mexico oil spill-related civil claims. As part of the settlement, BP agreed to a civil penalty of $525 million. At 31 December 2013 the remaining payable, due in 2014, was $175 million plus accrued interest.
The amounts described above were reclassified from provisions to other payables upon court approval of the agreement with the US government and settlement with the SEC.
Provisions and contingent liabilities
Provisions
BP has recorded provisions relating to the Gulf of Mexico oil spill in relation to environmental expenditure, spill response
costs, litigation and claims, and Clean Water Act penalties that can be measured reliably at this time.
Movements in each class of provision during the year and
cumulatively since the incident are presented in the tables below.
|
|
|
|
|
|
|
|
|
|
|
|
|
|
|
|
|
|
|
|
|
|
|
| |
|
|
|
|
|
|
|
|
|
|
|
|
|
|
|
$ million |
|
| |
|
|
|
|
|
|
|
|
|
|
|
|
|
|
|
2013 |
|
| |
|
|
|
Environmental |
|
|
Spill
response |
|
|
Litigation
and claims |
|
|
Clean Water
Act |
|
|
Total |
|
| At 1 January |
|
|
|
|
1,862 |
|
|
|
345 |
|
|
|
9,483 |
|
|
|
3,510 |
|
|
|
15,200 |
|
| Increase (decrease) in provision – items not covered by the trust fund |
|
|
|
|
(24 |
) |
|
|
(66 |
) |
|
|
408 |
|
|
|
– |
|
|
|
318 |
|
|
– items covered by the trust fund |
|
|
|
|
24 |
|
|
|
– |
|
|
|
1,897 |
|
|
|
– |
|
|
|
1,921 |
|
| Derecognition of provision for items that cannot be reliably estimateda |
|
|
|
|
– |
|
|
|
– |
|
|
|
(379 |
) |
|
|
– |
|
|
|
(379 |
) |
| Reclassification of amounts between categories of provision |
|
|
|
|
47 |
|
|
|
(47 |
) |
|
|
– |
|
|
|
– |
|
|
|
– |
|
| Unwinding of discount |
|
|
|
|
1 |
|
|
|
– |
|
|
|
– |
|
|
|
– |
|
|
|
1 |
|
| Change in discount rate |
|
|
|
|
(5 |
) |
|
|
– |
|
|
|
– |
|
|
|
– |
|
|
|
(5 |
) |
| Reclassified to other payables – items covered by the trust fund |
|
|
|
|
– |
|
|
|
– |
|
|
|
(84 |
) |
|
|
– |
|
|
|
(84 |
) |
|
– items not covered by the trust fund |
|
|
|
|
– |
|
|
|
– |
|
|
|
(3,849 |
) |
|
|
– |
|
|
|
(3,849 |
) |
| Utilization – paid by BP |
|
|
|
|
(60 |
) |
|
|
(143 |
) |
|
|
(523 |
) |
|
|
– |
|
|
|
(726 |
) |
| –
paid by the trust fund |
|
|
|
|
(255 |
) |
|
|
– |
|
|
|
(2,796 |
) |
|
|
– |
|
|
|
(3,051 |
) |
| At 31 December |
|
|
|
|
1,590 |
|
|
|
89 |
|
|
|
4,157 |
|
|
|
3,510 |
|
|
|
9,346 |
|
| Of which – current |
|
|
|
|
389 |
|
|
|
84 |
|
|
|
2,478 |
|
|
|
– |
|
|
|
2,951 |
|
| –
non-current |
|
|
|
|
1,201 |
|
|
|
5 |
|
|
|
1,679 |
|
|
|
3,510 |
|
|
|
6,395 |
|
| Of which – payable from the trust fund |
|
|
|
|
1,253 |
|
|
|
– |
|
|
|
3,595 |
|
|
|
– |
|
|
|
4,848 |
|
| a |
Relates to items covered by the trust fund. |
|
|
|
| 140 |
|
BP Annual Report and Form 20-F 2013 |
2. Significant event – Gulf of Mexico oil spill – continued
|
|
|
|
|
|
|
|
|
|
|
|
|
|
|
|
|
|
|
|
|
|
|
| |
|
|
|
|
|
|
|
|
|
|
|
|
|
|
|
$ million |
|
| |
|
|
|
|
|
|
|
|
|
Cumulative since the incident |
|
| |
|
|
|
Environmental |
|
|
Spill
response |
|
|
Litigation
and claims |
|
|
Clean Water
Act |
|
|
Total |
|
| Increase in provision – items not covered by the trust fund |
|
|
|
|
544 |
|
|
|
11,456 |
|
|
|
8,529 |
|
|
|
3,510 |
|
|
|
24,039 |
|
|
– items covered by the trust fund |
|
|
|
|
2,353 |
|
|
|
56 |
|
|
|
18,102 |
|
|
|
– |
|
|
|
20,511 |
|
| Derecognition of provision for items that cannot be reliably estimateda |
|
|
|
|
– |
|
|
|
– |
|
|
|
(1,173 |
) |
|
|
– |
|
|
|
(1,173 |
) |
| Reclassification of amounts between categories of provision |
|
|
|
|
47 |
|
|
|
(47 |
) |
|
|
– |
|
|
|
– |
|
|
|
– |
|
| Unwinding of discount |
|
|
|
|
12 |
|
|
|
– |
|
|
|
6 |
|
|
|
– |
|
|
|
18 |
|
| Change in discount rate |
|
|
|
|
17 |
|
|
|
– |
|
|
|
– |
|
|
|
– |
|
|
|
17 |
|
| Reclassified to other payables – items covered by the trust fund |
|
|
|
|
– |
|
|
|
– |
|
|
|
(84 |
) |
|
|
– |
|
|
|
(84 |
) |
|
– items not covered by the trust fund |
|
|
|
|
– |
|
|
|
– |
|
|
|
(4,199 |
) |
|
|
– |
|
|
|
(4,199 |
) |
| Utilization – paid by BP |
|
|
|
|
(237 |
) |
|
|
(11,367 |
) |
|
|
(3,773 |
) |
|
|
– |
|
|
|
(15,377 |
) |
| –
paid by the trust fund |
|
|
|
|
(1,146 |
) |
|
|
(9 |
) |
|
|
(13,251 |
) |
|
|
– |
|
|
|
(14,406 |
) |
| At 31 December 2013 |
|
|
|
|
1,590 |
|
|
|
89 |
|
|
|
4,157 |
|
|
|
3,510 |
|
|
|
9,346 |
|
| a |
Relates to items covered by the trust fund. |
Environmental
The environmental provision includes $320 million for BP’s commitment to fund the Gulf of Mexico Research Initiative, which is a 10-year research programme to study
the impact of the incident on the marine and shoreline environment of the Gulf of Mexico. In addition, BP faces claims under the Oil Pollution Act of 1990 (OPA 90) for natural resource damages. These damages include, among other things, the
reasonable costs of assessing the injury to natural resources. During 2011, BP entered a framework agreement with natural resource trustees for the United States and five Gulf-coast states, providing for up to $1 billion to be spent on early
restoration projects to address natural resource injuries resulting from the oil spill, to be funded from the $20-billion trust fund. In 2012, work began on the initial set of early restoration projects identified under this framework. At
31 December 2013 the amount provided for natural resource damage assessment costs and early restoration projects was $1,224 million. Until the size, location and duration of the impact is assessed, it is not possible to estimate reliably either
the amounts or timing of the remaining natural resource damages claims other than the assessment and early restoration costs noted above, therefore no additional amounts have been provided for these items and they are disclosed as a contingent
liability.
Spill response
The spill response
provision relates primarily to ongoing shoreline operational activity.
Litigation and claims
The litigation and claims provision includes amounts that can be estimated reliably for the future cost of settling claims by individuals and businesses for damage to
real or personal property, lost profits or impairment of earning capacity and loss of subsistence use of natural resources (‘Individual and Business Claims’), and claims by state and local government entities for removal costs, damage to
real or personal property, loss of government revenue and increased public services costs (‘State and Local Claims’), under OPA 90 and other legislation, except as described under Contingent liabilities below. Claims administration costs
and legal costs have also been provided for. The timing of payment of litigation and claims provisions classified as non-current is dependent on on-going legal activity and is therefore uncertain.
BP has provided for its best estimate of the cost associated with the PSC settlement agreements with the exception of the cost of business economic loss claims. As part
of its monitoring of payments made by the DHCSSP, BP identified multiple business economic loss claim determinations that appeared to result from an interpretation of the EPD Settlement Agreement by the claims administrator that BP believes was
incorrect.
Between March 2013 and March 2014, there were various rulings from both the federal District Court in New Orleans (the District Court) and a panel of the
US Court of Appeals for the Fifth Circuit (the business economic loss panel) on matters relating to the interpretation of the EPD Settlement Agreement, in particular on the issue of matching revenue and expenses as well as causation requirements of
the EPD Settlement Agreement.
As reported in BP Annual Report and Form 20-F 2012, the estimated cost of the PSC settlement for Individual and Business Claims
was $7.7 billion at 31 December 2012. This estimate increased during the year to $9.6 billion to reflect all claims processed by the DHCSSP for which eligibility notices had been issued and increases in claims administration costs. As a
result of the District Court’s preliminary injunction issued on 18 October 2013 that, amongst other things, required the claims administrator to temporarily suspend payments of business economic loss claims other than those claims
supported by sufficiently matched accrual-basis accounting or any other business economic loss claim for which the claims administrator determines that the matching of revenue and expenses is not an issue, the provision for $0.4 billion of claims
for which eligibility notices had been issued but had not yet been paid was derecognized as BP considered and continues to consider that no reliable estimate can be made for these claims. At 31 December 2013, the total costs of the PSC
settlement that BP considers can be reliably estimated is therefore $9.2 billion.
On 5 December 2013, the District Court amended its earlier preliminary
injunction and temporarily suspended the issuance of final determination notices and payments of business economic loss claims, until the business economic loss issues have been resolved. On 24 December 2013, the District Court ruled on the
issues in relation to the matching of revenue and expenses and causation that were remanded to it by the business economic loss panel. Regarding matching, the District Court reversed its earlier decision and ruled that the claims administrator, in
administering business economic loss claims, must match revenue with the variable expenses incurred by claimants in conducting their business, even where the revenues and expenses were recorded at different times. The District Court assigned to the
claims administrator the development of more detailed matching requirements. On 12 February 2014, the claims administrator issued a draft policy addressing the matching of revenue and expenses for business economic loss claims. The parties have
made written submissions on the draft policy and the claims administrator will issue a final policy to which BP and the PSC have the right to object and seek review by the District Court. Regarding causation, the District Court ruled that the EPD
Settlement Agreement contained no causation requirement beyond the revenue and related tests set out in an exhibit to that agreement. BP appealed the District Court’s ruling on causation to the business economic loss panel and moved for a
permanent injunction that would prevent the claims administrator from making awards to claimants whose alleged injuries are not traceable to the spill. On 3 March 2014, the business economic loss panel affirmed the District Court’s ruling on
causation and denied BP’s motion for a permanent injunction. BP is considering its appeal options, including a potential petition that all the active judges of the Fifth Circuit review the 3 March decision. Under the terms of the business
economic loss panel’s ruling, the injunction temporarily suspending issuance of final determination notices and payments of business economic loss claims will be lifted when the matter is transferred back to the District Court; the timing of
this would be affected by the status of any such petition by BP.
|
|
|
|
|
| BP Annual Report and Form 20-F 2013 |
|
|
141 |
|
2. Significant event – Gulf of Mexico oil spill – continued
In addition to the proceedings in relation to the interpretation of the EPD Settlement Agreement,
following the District Court’s final order and judgment approving the EPD Settlement in January 2013, groups of purported members of the Economic and Property Damages Settlement Class (the Appellants) appealed from the District Court’s
approval of that settlement to a different panel of the Fifth Circuit. On 10 January 2014, that other panel
of the Fifth Circuit affirmed the District
Court’s approval of the EPD Settlement but left to the business economic loss panel of the Fifth Circuit the question of how to interpret the EPD Settlement Agreement, including the meaning of the causation requirements of that agreement (see
above). BP and several Appellants have filed petitions requesting that all the active judges of the Fifth Circuit review the decision to uphold approval of the EPD Settlement.
See Legal proceedings on page 257 for further details on the settlements with the PSC and related matters.
Until the uncertainties described below are resolved, management is unable to estimate reliably the value and volume of future business economic loss claims and whether
and to what extent received or processed but unpaid business economic loss claims will be paid. Firstly, the inherent uncertainty as to the interpretation of the EPD Settlement Agreement in respect of matching and causation issues will continue
until the more detailed matching requirements are finalized by the claims administrator and are implemented by the DHCSSP; the issue of causation and the requirements for class membership under the EPD Settlement Agreement are resolved on appeal;
and the impact of any new policies and procedures in response to these issues on the value and volume of business economic loss claims becomes clear. Furthermore, the Fifth Circuit has yet to decide whether to grant the petitions seeking review of
its decision affirming approval of the EPD Settlement and, if granted, whether to alter its decision in that appeal. Secondly, uncertainty arises from the lack of sufficient claims data under the DHCSSP from which to extrapolate any reliable
trends – the number of business economic loss claims received and the average amounts paid in respect of such claims prior to the District Court’s injunction were higher than previously assumed by BP. This inability to
extrapolate any reliable trends may or may not continue once the uncertainties concerning the interpretation of the EPD Settlement Agreement described above have been resolved. Thirdly, there is uncertainty as to the ultimate deadline for filing
business economic loss claims, which is dependent on the date on which all relevant appeals are concluded. Management believes, therefore, that no reliable estimate can currently be made of any business economic loss claims not yet received,
processed and paid by the DHCSSP. A provision for business economic loss claims will be established when a reliable estimate can be made of the liability.
The total
cost of the PSC settlement is likely to be significantly higher than the amount recognized to date of $9.2 billion because the current estimate does not reflect business economic loss claims not yet received, processed and paid. The DHCSSP has
issued eligibility notices, disputed by BP, in respect of business economic loss claims of $1,019 million which have not yet been paid. Furthermore, a significant number of business economic loss claims have been received but have not yet been
processed, and further claims are likely to be received.
The provision recognized for litigation and claims includes an estimate for State and Local Claims. Although
the provision recognized is BP’s current reliable best estimate of the amount required to settle these obligations, significant uncertainty exists in relation to the outcome of any litigation proceedings and the amount of claims that will
become payable by BP. See Legal proceedings on page 257 and Contingent liabilities below for further details.
Clean Water Act
penalties
A charge for potential Clean Water Act Section 311 penalties was first included in BP’s second-quarter 2010 interim financial statements.
At the time that charge was taken, the latest estimate from the intra-agency Flow Rate Technical Group created by the National Incident Commander in charge of the spill response was between 35,000 and 60,000 barrels per day. The mid-point of that
range, 47,500 barrels per day, was used for the purposes of calculating the charge. For the purposes of calculating the amount of the oil flow that was discharged into the Gulf of Mexico, the amount of oil that had been or was projected to be
captured in vessels on the surface was subtracted from the total estimated flow up until when the well was capped on 15 July 2010. The result of this calculation was an estimate that approximately 3.2 million barrels of oil had been discharged into
the Gulf. This estimate of 3.2 million barrels was calculated using a total flow of 47,500 barrels per day multiplied by the 85 days from 22 April 2010 to 15 July 2010 less an estimate of the amount captured on the surface (approximately 850,000
barrels).
This estimated discharge volume was then multiplied by $1,100 per barrel – the maximum amount the statute allows in the absence of gross negligence or
wilful misconduct – for the purposes of estimating a potential penalty. This resulted in a provision of $3,510 million for potential penalties under Section 311.
BP intends to argue for a penalty lower than $1,100 per barrel. The actual penalty a court may impose could be lower than $1,100 per barrel if it were determined that
such a lower penalty was appropriate based on the factors a court is directed to consider in assessing a penalty. In particular, in determining the amount of a civil penalty, Section 311 directs a court to consider a number of enumerated factors,
including “the seriousness of the violation or violations, the economic benefit to the violator, if any, resulting from the violation, the degree of culpability involved, any other penalty for the same incident, any history of prior violations,
the nature, extent, and degree of success of any efforts of the violator to minimize or mitigate the effects of the discharge, the economic impact of the penalty on the violator, and any other matters as justice may require”. Civil penalties
above $1,100 per barrel up to a statutory maximum of $4,300 per barrel of oil discharged would only be imposed if alleged gross negligence or wilful misconduct were proven. The $1,100 per-barrel rate has been utilized for the purposes of calculating
the provision after considering and weighing all possible outcomes and in light of: (i) the company’s conclusion that it did not act with gross negligence or engage in wilful misconduct; and (ii) the uncertainty as to whether a court would
assess a penalty below the $1,100 statutory maximum.
On 2 August 2010, the United States Department of Energy and the Flow Rate Technical Group had issued an
estimate that 4.9 million barrels of oil had flowed from the Macondo well, and 4.05 million barrels had been discharged into the Gulf (the difference being the amount of oil captured by vessels on the surface as part of BP’s well containment
efforts).
It was and remains BP’s view, based on the analysis of available data by its experts, that the 2 August 2010 Government estimate is not reliable. BP
believes that the 2 August 2010 discharge estimate is overstated by at least 20%. If the flow rate were 20% lower than the 2 August 2010 estimate, then the amount of oil that flowed from the Macondo well would be approximately 3.9 million barrels
and the amount discharged into the Gulf would be approximately 3.1 million barrels (using a current estimate of barrels captured by vessels on the surface of 810,000 in line with the stipulation entered with the US government – see Legal
proceedings), which is not materially different from the amount we used for our original estimate at the end of the second quarter 2010.
For the purposes of
calculating a provision for fines and penalties under Section 311 of the Clean Water Act, BP has continued to use an estimate of 3.2 million barrels of oil discharged to the Gulf of Mexico and a penalty of $1,100 per barrel, as its current best
estimate, as defined in paragraphs 36-40 of IAS 37 ‘Provisions, Contingent Liabilities and Contingent Assets’, of the amounts which may be used in calculating the penalty under Section 311 of the Clean Water Act and as a result, the
provision at the end of the year was $3,510 million.
The amount and timing of the amount to be paid ultimately is subject to significant uncertainty since it will
depend on what is determined by the court in the federal multi-district litigation proceedings in New Orleans (MDL 2179) as to negligence, gross negligence or wilful misconduct, the volume of oil spilled and the application of statutory penalty
factors. The trial court could issue its decision on the first two phases of the trial (which considered the issues of negligence or gross negligence in phase one, and source control efforts and the volume of oil spilled in phase two) at any time
and has not yet scheduled a hearing on the subsequent phase regarding the application of statutory penalty factors. The court has wide discretion in its determination as to whether a defendant’s conduct involved negligence or gross negligence
as well as in its determinations on the volume of oil spilled and the application of statutory penalty factors.
|
|
|
| 142 |
|
BP Annual Report and Form 20-F 2013 |
2. Significant event – Gulf of Mexico oil spill – continued
See Legal proceedings on page 257 for further details on all litigation and claims activity.
Provision movements
The total amount recognized as an
increase in provisions during the year was $2,239 million, including $1,921 million for items covered by the trust fund and $318 million for other items (2012 $6,868 million, including $1,985 million for items covered by the trust fund and $4,883
million for other items). In addition, $379 million (2012 $794 million) was derecognized relating to items that will be covered by the trust fund but which can no longer be reliably estimated. After deducting amounts utilized during the year
totalling $3,777 million, including payments from the trust fund of $3,051 million and payments made directly by BP of $726 million (2012 $5,864 million, including payments from the trust fund of $4,624 million and payments made directly by BP of
$1,240 million), and after reclassifications and adjustments for discounting, the remaining provision as at 31 December 2013 was $9,346 million (2012 $15,200 million).
The total amounts that will ultimately be paid by BP in relation to all obligations relating to the incident are subject to significant uncertainty and the ultimate
exposure and cost to BP will be dependent on many factors. Furthermore, significant uncertainty exists in relation to the amount of claims that will become payable by BP, the amount of fines that will ultimately be levied on BP (including any
determination of BP’s culpability based on any findings of negligence, gross negligence or wilful misconduct), the outcome of litigation and arbitration proceedings, and any costs arising from any longer-term environmental consequences of the
oil spill, which will also impact upon the ultimate cost for BP. The amount and timing of any amounts payable could also be impacted by any further settlements which may or may not occur. Although the provision recognized is the current best
reliable estimate of expenditures required to settle certain present obligations at the end of the reporting period, there are future expenditures for which it is not possible to measure the obligation reliably.
Contingent liabilities
BP has provided for its
best estimate of amounts expected to be paid from the trust fund that can be measured reliably. This includes certain amounts expected to be paid pursuant to the Oil Pollution Act of 1990 (OPA 90). It is not possible, at this time, to measure
reliably other obligations arising from the incident that are under the terms of the trust fund, namely any obligation in relation to natural resource damages claims or associated legal costs (except for the estimated costs of the assessment phase
and costs relating to early restoration agreements under the $1-billion framework agreement referred to above), claims asserted in civil litigation including any further litigation through excluded parties from the PSC settlement including as set
out in Legal proceedings, the cost of business economic loss claims under the PSC settlement not yet received, processed and paid by the DHCSSP, any further obligation that may arise from state and local government submissions under OPA 90 and any
obligation in relation to other potential private or governmental litigation, nor is it practicable to estimate their magnitude or possible timing of payment. Therefore, no amounts have been provided for these obligations as at 31 December
2013.
Natural resource damages resulting from the oil spill are currently being assessed. BP and the federal and state trustees are collecting extensive data in
order to assess the extent of damage to wildlife, shoreline, near shore and deepwater habitats, and recreational uses, among other things. The study data will inform an assessment of injury to the Gulf Coast natural resources and the development of
a restoration plan to address the identified injuries.
Detailed analysis and interpretation continue on the data that have been collected. Any early restoration
projects undertaken pursuant to the $1-billion framework agreement could mitigate the total damages resulting from the incident. Accordingly, until the size, location and duration of the impact is assessed, it is not possible to estimate reliably
either the amounts or timing of the remaining natural resource damages claims, therefore no such amounts have been provided as at 31 December 2013.
As described
under Provisions above, BP has identified multiple business economic loss claim determinations under the PSC settlement that appeared to result from an interpretation of the EPD Settlement Agreement by the claims administrator that BP believes was
incorrect. Uncertainty as to the interpretation of the EPD Settlement Agreement will continue until the effects of the implementation of new policies and procedures are known, the issue of causation and the requirements for class membership under
the EPD Settlement Agreement are resolved on appeal and the courts have ruled on the appeals in relation to the final order and judgment approving the EPD Settlement. Therefore the potential cost of business economic loss claims not yet received,
processed and paid is not provided for and is disclosed as a contingent liability. A significant number of business economic loss claims have been received but have not yet been processed and paid, and further claims are likely to be received.
As described above in Provisions, a provision has been made for State and Local claims that can be measured reliably. In January 2013, the States of Alabama, Mississippi
and Florida submitted or asserted claims to BP under OPA 90 for alleged losses including economic losses and property damage as a result of the Gulf of Mexico oil spill. BP is evaluating these claims. The States of Louisiana and Texas have also
asserted similar claims. The amounts claimed, certain of which include punitive damages or other multipliers, are very substantial. However BP considers these claims unsubstantiated and the methodologies used to calculate these claims to be
seriously flawed, not supported by OPA 90, not supported by documentation, and to substantially overstate the claims. Similar claims have also been submitted by various local government entities and a foreign government under OPA 90, and more claims
are expected to be submitted. The amounts alleged in the submissions for these State and Local Claims total approximately $35 billion. BP will defend vigorously against these claims if adjudicated at trial.
Proceedings relating to securities class actions (MDL 2185) pending in federal court in Texas, including a purported class action on behalf of purchasers of American
Depository Shares under US federal securities law, are continuing. A jury trial is scheduled to begin in October 2014. No reliable estimate can be made of the amounts that may be payable in relation to these proceedings, if any, so no provision has
been recognized at 31 December 2013.
In addition to the State and Local claims and securities class actions described above, BP is named as a defendant in
approximately 2,950 other civil lawsuits brought by individuals, corporations and government entities in US federal and state courts, as well as certain foreign jurisdictions, resulting from the Deepwater Horizon accident, the Gulf of Mexico oil
spill, and the spill response efforts. Further actions are likely to be brought. Among other claims, these lawsuits assert claims for personal injury or wrongful death in connection with the accident and the spill response, commercial and economic
injury, damage to real and personal property, breach of contract and violations of statutes, including, but not limited, to alleged violations of US securities and environmental statutes. Until further fact and expert disclosures occur, court
rulings clarify the issues in dispute, liability and damage trial activity nears or progresses, or other actions such as further possible settlements occur, it is not possible given these uncertainties to arrive at a range of outcomes or a reliable
estimate of the liabilities that may accrue to BP in connection with or as a result of these lawsuits. Therefore no amounts have been provided for these items as at 31 December 2013. See Legal proceedings on page 257 for further information.
For those items not covered by the trust fund it is not possible to measure reliably any obligation in relation to other litigation or potential fines and penalties
except, subject to certain assumptions detailed above, for those relating to the Clean Water Act. There are a number of federal and state environmental and other provisions of law, other than the Clean Water Act, under which one or more governmental
agencies could seek civil fines and penalties from BP. For example, a complaint filed by the United States sought to reserve the ability to seek penalties and other relief under a number of other laws. Given the unsubstantiated nature of certain
claims that may be asserted, it is not possible at this time to determine whether and to what extent any such claims would be successful or what penalties or fines would be assessed. Therefore no amounts have been provided for these items.
|
|
|
|
|
| BP Annual Report and Form 20-F 2013 |
|
|
143 |
|
2. Significant event – Gulf of Mexico oil spill – continued
Under the settlement agreements with Anadarko and MOEX, and with Cameron International, the
designer and manufacturer of the Deepwater Horizon blowout preventer, with M-I L.L.C. (M-I), the mud contractor, and with Weatherford, the designer and manufacturer of the float collar used on the Macondo well, BP has agreed to indemnify Anadarko,
MOEX, Cameron, M-I and Weatherford for certain claims arising from the accident. It is therefore possible that BP may face claims under these indemnities, but it is not currently possible to reliably measure any obligation in relation to such claims
and therefore no amount has been provided as at 31 December 2013.
The magnitude and timing of all possible obligations in relation to the Gulf of Mexico oil
spill continue to be subject to a very high degree of uncertainty as described further in Risk factors on page 51. Any such possible obligations are therefore contingent liabilities and, at present, it is not practicable to estimate their magnitude
or possible timing of payment. Furthermore, other material unanticipated obligations may arise in future in relation to the incident.
Impact
upon the group income statement
The amount of the provision recognized during the year can be reconciled to the charge to the income statement as follows:
|
|
|
|
|
|
|
|
|
|
|
|
|
|
|
|
|
|
|
| |
|
|
|
|
|
|
|
|
|
|
|
|
$ million |
|
| |
|
|
|
2013 |
|
|
2012 |
|
|
2011 |
|
|
Cumulative since
the incident |
|
| Net increase in provision |
|
|
|
|
2,239 |
|
|
|
6,868 |
|
|
|
5,183 |
|
|
|
44,551 |
|
| Derecognition of provision for items that cannot be reliably estimated |
|
|
|
|
(379 |
) |
|
|
(794 |
) |
|
|
– |
|
|
|
(1,173 |
) |
| Change in discount rate relating to provisions |
|
|
|
|
(5 |
) |
|
|
– |
|
|
|
17 |
|
|
|
17 |
|
| Costs charged directly to the income statement |
|
|
|
|
136 |
|
|
|
257 |
|
|
|
512 |
|
|
|
4,244 |
|
| Trust fund liability – discounted |
|
|
|
|
– |
|
|
|
– |
|
|
|
– |
|
|
|
19,580 |
|
| Change in discounting relating to trust fund liability |
|
|
|
|
– |
|
|
|
– |
|
|
|
43 |
|
|
|
283 |
|
| Recognition of reimbursement asset, net |
|
|
|
|
(1,542 |
) |
|
|
(1,191 |
) |
|
|
(4,038 |
) |
|
|
(19,338 |
) |
| Settlements credited to the income statement |
|
|
|
|
(19 |
) |
|
|
(145 |
) |
|
|
(5,517 |
) |
|
|
(5,681 |
) |
| (Profit) loss before interest and taxation |
|
|
|
|
430 |
|
|
|
4,995 |
|
|
|
(3,800 |
) |
|
|
42,483 |
|
| Finance costs |
|
|
|
|
39 |
|
|
|
19 |
|
|
|
58 |
|
|
|
193 |
|
| (Profit) loss before taxation |
|
|
|
|
469 |
|
|
|
5,014 |
|
|
|
(3,742 |
) |
|
|
42,676 |
|
The group income statement for 2013 includes a pre-tax charge of $469 million (2012 pre-tax charge of $5,014 million) in relation to the
Gulf of Mexico oil spill. The costs charged in 2013 relate primarily to the ongoing costs of operating the Gulf Coast Restoration Organization (GCRO) and increases in legal costs. Finance costs of $39 million (2012 $19 million) reflect the unwinding
of the discount on payables and provisions. The cumulative amount charged to the income statement to date comprises spill response costs arising in the aftermath of the incident, GCRO operating costs, amounts charged upon initial recognition of the
trust obligation, litigation, claims, environmental and legal costs not paid through the Trust, estimated obligations for future costs that can be estimated reliably at this time and rights and obligations relating to the trust fund, net of
settlements agreed with the co-owners of the Macondo well and other third parties.
The total amount recognized in the income
statement is analysed in the table below.
|
|
|
|
|
|
|
|
|
|
|
|
|
|
|
|
|
|
|
| |
|
|
|
|
|
|
|
|
|
|
|
|
$ million |
|
| |
|
|
|
2013 |
|
|
2012 |
|
|
2011 |
|
|
Cumulative since
the incident |
|
| Trust fund liability – discounted |
|
|
|
|
– |
|
|
|
– |
|
|
|
– |
|
|
|
19,580 |
|
| Change in discounting relating to trust fund liability |
|
|
|
|
– |
|
|
|
– |
|
|
|
43 |
|
|
|
283 |
|
| Recognition of reimbursement asset |
|
|
|
|
(1,542 |
) |
|
|
(1,191 |
) |
|
|
(4,038 |
) |
|
|
(19,338 |
) |
| Other |
|
|
|
|
– |
|
|
|
– |
|
|
|
– |
|
|
|
8 |
|
| Total (credit) charge relating to the trust fund |
|
|
|
|
(1,542 |
) |
|
|
(1,191 |
) |
|
|
(3,995 |
) |
|
|
533 |
|
| Environmental – amount provided |
|
|
|
|
47 |
|
|
|
801 |
|
|
|
1,167 |
|
|
|
2,944 |
|
| – change in discount rate relating to provisions |
|
|
|
|
(5 |
) |
|
|
– |
|
|
|
17 |
|
|
|
17 |
|
| – costs charged directly to the income statement |
|
|
|
|
– |
|
|
|
– |
|
|
|
– |
|
|
|
70 |
|
| Total (credit) charge relating to environmental |
|
|
|
|
42 |
|
|
|
801 |
|
|
|
1,184 |
|
|
|
3,031 |
|
| Spill response – amount provided |
|
|
|
|
(113 |
) |
|
|
109 |
|
|
|
586 |
|
|
|
11,465 |
|
| – costs charged directly to the income statement |
|
|
|
|
– |
|
|
|
9 |
|
|
|
85 |
|
|
|
2,839 |
|
| Total (credit) charge relating to spill response |
|
|
|
|
(113 |
) |
|
|
118 |
|
|
|
671 |
|
|
|
14,304 |
|
| Litigation and claims – amount provided, net of provision derecognized |
|
|
|
|
1,926 |
|
|
|
5,164 |
|
|
|
3,430 |
|
|
|
25,459 |
|
| – costs charged directly to the income statement |
|
|
|
|
– |
|
|
|
– |
|
|
|
– |
|
|
|
184 |
|
| Total charge relating to litigation and claims |
|
|
|
|
1,926 |
|
|
|
5,164 |
|
|
|
3,430 |
|
|
|
25,643 |
|
| Clean Water Act penalties – amount provided |
|
|
|
|
– |
|
|
|
– |
|
|
|
– |
|
|
|
3,510 |
|
| Other costs charged directly to the income statement |
|
|
|
|
136 |
|
|
|
248 |
|
|
|
427 |
|
|
|
1,143 |
|
| Settlements credited to the income statement |
|
|
|
|
(19 |
) |
|
|
(145 |
) |
|
|
(5,517 |
) |
|
|
(5,681 |
) |
| (Profit) loss before interest and taxation |
|
|
|
|
430 |
|
|
|
4,995 |
|
|
|
(3,800 |
) |
|
|
42,483 |
|
| Finance costs |
|
|
|
|
39 |
|
|
|
19 |
|
|
|
58 |
|
|
|
193 |
|
| (Profit) loss before taxation |
|
|
|
|
469 |
|
|
|
5,014 |
|
|
|
(3,742 |
) |
|
|
42,676 |
|
The total amounts that will ultimately be paid by BP in relation to all obligations relating to the incident are subject to significant
uncertainty as described under Provisions and contingent liabilities above.
|
|
|
| 144 |
|
BP Annual Report and Form 20-F 2013 |
3. Business combinations
BP undertook a number of minor business combinations in 2013 and 2012 for a total consideration of $67 million and $116 million in cash respectively.
In 2011, BP undertook a number of business combinations with total consideration paid in cash amounting to $11.3 billion, offset by cash acquired of $0.4 billion. The
fair value of contingent consideration payable amounted to $0.1 billion. BP acquired from Reliance Industries Limited (Reliance) a 30% interest in 21 oil and gas production-sharing agreements (PSAs) operated by Reliance in India for $7,026 million.
In addition, we completed the final part of the transaction with Devon Energy (Devon) for the acquisition of Devon’s equity stake in a number of assets in Brazil for consideration of $3.6 billion and BP’s Alternative Energy business
acquired Companhia Nacional de Açúcar e Álcool (CNAA) in Brazil for consideration of $0.7 billion. There were a number of other individually insignificant business combinations.
4. Non-current assets held for sale
There were no assets or associated liabilities classified as held for sale as at 31 December 2013. The disposal of the assets and associated liabilities classified
as held for sale at 31 December 2012 completed during 2013.
Impairment losses amounting to $186 million (2012 $2,594 million) were recognized relating
to certain assets that were classified as held for sale at 31 December 2012, of which $137 million related to the Carson refinery and associated assets. See Note 5 for further information.
Non-current assets classified as held for sale are not depreciated. It is estimated that the benefit arising from the absence of depreciation for the assets held for sale
at 31 December 2012 until their disposal in 2013 amounted to approximately $201 million (2012 $435 million). In addition, profits of approximately $738 million (2012 $731 million) were not recognized as a result of the discontinuance
of equity accounting for our interest in TNK-BP.
Non-current assets held for sale at 31 December 2012
At 31 December 2012 assets classified as held for sale included property, plant and equipment of $3,663 million, investments in associates of $12,322 million and
inventories of $2,377 million.
Within the Upstream segment, BP’s interests in the BP-operated Maclure, Harding and Devenick fields and non-operated interests in
the Brae complex of fields and the Braemar field in the central North Sea were classified as held for sale. In the Downstream segment, the Texas City refinery and related assets, and the southern part of the US West Coast fuels value chain,
including the Carson refinery, were classified as held for sale at 31 December 2012. BP’s investment in TNK-BP was classified as an asset held for sale at 31 December 2012. All of the assets classified as held for sale at
31 December 2012 were sold during 2013. See Notes 5 and 6 for further information.
5. Disposals and
impairment
The following amounts were recognized in the income statement in respect of disposals and impairments.
|
|
|
|
|
|
|
|
|
|
|
|
|
|
|
| |
|
|
|
|
|
|
|
|
|
$ million |
|
| |
|
|
|
2013 |
|
|
2012 |
|
|
2011 |
|
| Gains on sale of businesses and fixed assets |
|
|
|
|
|
|
|
|
|
|
|
|
|
|
| Upstream |
|
|
|
|
371 |
|
|
|
6,504 |
|
|
|
3,477 |
|
| Downstream |
|
|
|
|
214 |
|
|
|
152 |
|
|
|
319 |
|
| TNK-BP |
|
|
|
|
12,500 |
|
|
|
– |
|
|
|
– |
|
| Other businesses and corporate |
|
|
|
|
30 |
|
|
|
41 |
|
|
|
336 |
|
| |
|
|
|
|
13,115 |
|
|
|
6,697 |
|
|
|
4,132 |
|
|
|
|
|
|
|
|
|
|
|
|
|
|
|
|
| |
|
|
|
|
|
|
|
|
|
$ million |
|
| |
|
|
|
2013 |
|
|
2012 |
|
|
2011 |
|
| Losses on sale of businesses and fixed assets |
|
|
|
|
|
|
|
|
|
|
|
|
|
|
| Upstream |
|
|
|
|
144 |
|
|
|
109 |
|
|
|
49 |
|
| Downstream |
|
|
|
|
78 |
|
|
|
195 |
|
|
|
52 |
|
| Other businesses and corporate |
|
|
|
|
8 |
|
|
|
6 |
|
|
|
3 |
|
| |
|
|
|
|
230 |
|
|
|
310 |
|
|
|
104 |
|
| Impairment losses |
|
|
|
|
|
|
|
|
|
|
|
|
|
|
| Upstream |
|
|
|
|
1,255 |
|
|
|
3,046 |
|
|
|
1,443 |
|
| Downstream |
|
|
|
|
484 |
|
|
|
2,892 |
|
|
|
599 |
|
| Other businesses and corporate |
|
|
|
|
218 |
|
|
|
320 |
|
|
|
58 |
|
| |
|
|
|
|
1,957 |
|
|
|
6,258 |
|
|
|
2,100 |
|
| Impairment reversals |
|
|
|
|
|
|
|
|
|
|
|
|
|
|
| Upstream |
|
|
|
|
(226 |
) |
|
|
(289 |
) |
|
|
(146 |
) |
| Downstream |
|
|
|
|
– |
|
|
|
(1 |
) |
|
|
– |
|
| Other businesses and corporate |
|
|
|
|
– |
|
|
|
(3 |
) |
|
|
– |
|
| |
|
|
|
|
(226 |
) |
|
|
(293 |
) |
|
|
(146 |
) |
| Impairment and losses on sale of businesses and fixed assets |
|
|
|
|
1,961 |
|
|
|
6,275 |
|
|
|
2,058 |
|
|
|
|
|
|
| BP Annual Report and Form 20-F 2013 |
|
|
145 |
|
5. Disposals and impairment – continued
Disposals
As part of the response to the consequences of the Gulf of Mexico oil spill in 2010, the group announced plans to deliver up to $38 billion of disposal proceeds by the
end of 2013. This target was reached during 2012; as at 31 December 2012, BP had announced disposals of $38 billion, and in addition, the sale of our 50% investment in TNK-BP. During 2013 the group announced that it expects to divest a further
$10 billion of assets before the end of 2015.
|
|
|
|
|
|
|
|
|
|
|
|
|
|
|
| |
|
|
|
|
|
|
|
|
|
$ million |
|
| |
|
|
|
2013 |
|
|
2012 |
|
|
2011 |
|
| Proceeds from disposals of fixed assets |
|
|
|
|
18,115 |
|
|
|
9,992 |
|
|
|
3,504 |
|
| Proceeds from disposals of businesses, net of cash disposed |
|
|
|
|
3,884 |
|
|
|
1,606 |
|
|
|
(663 |
) |
| |
|
|
|
|
21,999 |
|
|
|
11,598 |
|
|
|
2,841 |
|
| By segment |
|
|
|
|
|
|
|
|
|
|
|
|
|
|
| Upstream |
|
|
|
|
1,288 |
|
|
|
10,667 |
|
|
|
1,080 |
|
| Downstream |
|
|
|
|
3,991 |
|
|
|
637 |
|
|
|
830 |
|
| TNK-BP |
|
|
|
|
16,646 |
|
|
|
– |
|
|
|
– |
|
| Other businesses and corporate |
|
|
|
|
74 |
|
|
|
294 |
|
|
|
931 |
|
| |
|
|
|
|
21,999 |
|
|
|
11,598 |
|
|
|
2,841 |
|
Proceeds from disposals for 2012 included a deposit of $632 million received in respect of the disposal in 2013 of interests in a number
of central North Sea oil and gas fields. Disposal proceeds for 2011 included the repayment of a deposit of $3,530 million received in 2010 in advance of the expected sale of our interest in Pan American Energy LLC, which did not complete.
At 31 December 2013, deferred consideration relating to disposals amounted to $23 million receivable within one year (2012 $24 million and 2011 $117 million) and
$1,374 million receivable after one year (2012 $1,433 million and 2011 $1,524 million). In addition, contingent consideration relating to the disposals of the Devenick field and the Texas City refinery amounted to $953 million at 31 December
2013 – see Notes 20 and 26 for further information.
Upstream
In 2013, the major disposal transaction in the segment was the sale of our interests in the BP-operated Maclure, Harding and Devenick fields and non-operated interests in
the Brae complex of fields and the Braemar field in the central North Sea to TAQA. In addition, we sold our interests in the Yacheng field in China to Kuwait Foreign Petroleum Exploration Company, as well as other interests in the North Sea and the
US.
In 2012, the major disposal transactions were the sale of our interests in the Marlin, Horn Mountain, Holstein, Ram Powell and Diana Hoover fields in the Gulf of
Mexico to Plains Exploration and Production Company, the sale of our interests in the Hugoton and Jayhawk gas production and processing assets in Kansas, and our interest in the Jonah and Pinedale upstream operations in Wyoming, to LINN Energy, LLC,
and the sale of our interests in our Canadian natural gas liquids (NGL) business to Plains Midstream Canada ULC. In addition, we sold a number of interests in the North Sea, including the disposal of our Southern Gas Assets to Perenco UK Ltd.
In 2011, the major disposal transactions were the sale of our interests in Colombia to Ecopetrol and Talisman, the sale of our upstream and midstream assets in Vietnam
and our investments in equity-accounted entities in Venezuela to TNK-BP, and the sale of our assets in Pakistan to United Energy Group. In addition, we completed the disposal of half of the 3.29% interest in the Azeri-Chirag-Gunashli development in
Azerbaijan to SOCAR and a number of interests in the Gulf of Mexico to Marubeni Group.
Downstream
In 2013, gains resulted from the disposal of our global LPG business and closing adjustments on the sales of the Texas City and Carson refineries with their associated
marketing and logistics assets. Losses principally resulted from the disposal of a number of assets, principally in our global fuels portfolio.
In 2012, gains on
disposal resulted from the disposal of our interests in purified terephthalic acid production in Malaysia to Reliance Global Holdings Pte. Ltd., retail churn in the US and a number of other assets in the segment. Losses resulted from the ongoing
costs associated with our US refinery divestments and the disposal of a number of assets in the segment portfolio.
In 2011, gains on disposal resulted from our
disposal of the fuels marketing business in Namibia, Malawi, Zambia and Tanzania to Puma Energy, certain non-strategic pipelines and terminals in the US and other assets in the segment. Losses resulted from the disposal of a number of assets in the
segment portfolio.
TNK-BP
In 2013, BP disposed of
its 50% interest in TNK-BP. See Note 6 for further information.
Other businesses and corporate
In 2011, we disposed of our aluminium business in the US which resulted in a gain.
|
|
|
| 146 |
|
BP Annual Report and Form 20-F 2013 |
5. Disposals and impairment – continued
Summarized financial information relating to the sale of businesses is shown in the table below. The principal
transactions categorized as business disposals in 2013 were the sales of the Texas City and Carson refineries with their associated marketing and logistics assets. Information relating to sales of fixed assets is excluded from the table.
|
|
|
|
|
|
|
|
|
|
|
|
|
|
|
| |
|
|
|
|
|
|
|
|
|
$ million |
|
| |
|
|
|
2013 |
|
|
2012 |
|
|
2011 |
|
| Non-current assets |
|
|
|
|
2,124 |
|
|
|
610 |
|
|
|
2,085 |
|
| Current assets |
|
|
|
|
2,371 |
|
|
|
570 |
|
|
|
1,008 |
|
| Non-current liabilities |
|
|
|
|
(94 |
) |
|
|
(263 |
) |
|
|
(212 |
) |
| Current liabilities |
|
|
|
|
(62 |
) |
|
|
(232 |
) |
|
|
(611 |
) |
| Total carrying amount of net assets disposed |
|
|
|
|
4,339 |
|
|
|
685 |
|
|
|
2,270 |
|
| Recycling of foreign exchange on disposal |
|
|
|
|
23 |
|
|
|
(15 |
) |
|
|
8 |
|
| Costs on disposala |
|
|
|
|
13 |
|
|
|
39 |
|
|
|
17 |
|
|
|
|
|
|
4,375 |
|
|
|
709 |
|
|
|
2,295 |
|
| Profit on sale of businessesb |
|
|
|
|
69 |
|
|
|
675 |
|
|
|
2,232 |
|
| Total consideration |
|
|
|
|
4,444 |
|
|
|
1,384 |
|
|
|
4,527 |
|
| Consideration received (receivable)c |
|
|
|
|
(414 |
) |
|
|
76 |
|
|
|
116 |
|
| Proceeds from the sale of businesses related to completed transactions |
|
|
|
|
4,030 |
|
|
|
1,460 |
|
|
|
4,643 |
|
| Deposits received (repaid) related to assets classified as held for saled |
|
|
|
|
– |
|
|
|
146 |
|
|
|
(3,530 |
) |
| Disposals completed in relation to which deposits had been received in prior year |
|
|
|
|
(146 |
) |
|
|
– |
|
|
|
(1,776 |
) |
| Proceeds from the sale of
businessese |
|
|
|
|
3,884 |
|
|
|
1,606 |
|
|
|
(663 |
) |
| a |
2013 includes pension and other post-retirement benefit plan curtailment gains of $109 million. |
| b |
In 2011 a $278-million gain was not recognized in the income statement as it represented an unrealized gain on the sale of business assets in Vietnam to our former associate TNK-BP. |
| c |
Consideration received from prior year business disposals or to be received from current year disposals. 2013 includes contingent consideration of $475 million relating to the disposal of the Texas City refinery.
|
| d |
2011 relates to the repayment of a deposit received in advance of $3,530 million following the termination of the sale agreement in respect of the expected sale of our interest in Pan American Energy LLC.
|
| e |
Substantially all of the consideration received was in the form of cash and cash equivalents. Proceeds are stated net of cash and cash equivalents disposed of $42 million (2012 $4 million and 2011 $14 million).
|
Impairment
Upstream
During 2013, the Upstream segment recognized
impairment losses of $1,255 million. The main elements were impairment losses of $251 million and $159 million relating to the Browse project in Australia and the Mad Dog Phase 2 project in the Gulf of Mexico respectively, resulting from the
selection of alternative development scenarios for both projects; write-downs of a number of assets in the North Sea, caused by increases in expected decommissioning costs, amounting to $253 million in aggregate; a $134-million write-down of
pipelines in the North Sea due to cost increases; a $122-million write-down to fair value less costs to sell based on expected proceeds resulting from a decision to divest our interest in the Polvo field in
Brazil; and other impairment losses amounting to $335 million in total that were not individually significant. These impairment losses were partly offset by reversals of impairment of certain of our interests in Alaska, the Gulf of Mexico, and the
North Sea amounting to $226 million in total, triggered by reductions in expected decommissioning costs, partly as a result of an increase in the discount rate for provisions.
During 2012, the Upstream segment recognized impairment losses of $3,046 million. The main elements were a $1,082-million write-down of our interests in the Fayetteville
and Woodford shale gas assets in the US, due to reserves revisions, lower values being attributed to recent market transactions and a fall in the gas price; a $999-million impairment loss relating to the decision to suspend the Liberty project in
Alaska; a $706-million aggregate write-down of a number of assets, primarily in the Gulf of Mexico and North Sea, caused by increases in the decommissioning provision resulting from continued review of the expected decommissioning costs; a
$144-million write-down of certain gas storage assets in Europe due to changes to the European gas market; and other impairment losses amounting to $116 million in total that were not individually significant. These impairment losses were partly
offset by reversals of impairment of certain of our interests in the Gulf of Mexico amounting to $222 million, triggered by a decision to divest assets; and other reversals of impairment amounting to $67 million in total that were not individually
significant.
During 2011, the Upstream segment recognized impairment losses of $1,443 million. The main elements were a $555-million impairment loss relating to a
number of our interests in the Gulf of Mexico, caused by an increase in the decommissioning provision as a result of further assessments of the regulations relating to idle infrastructure and a decrease in our assumption of the discount rate for
provisions; the $393-million write-down of our interest in the Fayetteville shale gas asset in the US, triggered by a decrease in value by reference to a sale transaction by a partner of its interest in the same asset; and the $153-million
write-down of our interest in the proposed Denali gas pipeline in Alaska, resulting from a decision not to proceed with the project. There were several other impairment losses amounting to $342 million in total that were not individually
significant. These impairment losses were partly offset by reversals of impairment of certain of our interests in the Gulf of Mexico and Egypt amounting to $146 million in total, triggered by an increase in our assumption of long-term oil prices.
Downstream
During 2013, the Downstream segment
recognized impairment losses of $484 million which mainly relates to impairments of certain refineries in the US and elsewhere in our global fuels portfolio.
During
2012, the Downstream segment recognized impairment losses of $2,892 million largely related to assets held for sale for which sales prices had been agreed, see Note 4 for further information. This impairment loss included $1,552 million
relating to the Texas City refinery and associated assets and $1,042 million relating to the Carson refinery and associated assets.
During 2011, the Downstream
segment recognized impairment losses of $599 million, of which $398 million related to assets classified as held for sale. Other impairment losses, related to retail churn in Europe and other minor asset disposals, amounted to $201 million in total.
Other businesses and corporate
Impairment losses
totalling $218 million, $320 million and $58 million were recognized in 2013, 2012 and 2011 respectively related to various assets in the Alternative Energy business. The amount for 2013 is principally in respect of our US wind business. The amount
for 2012 includes $258 million in respect of the decision not to proceed with an investment in a biofuels production facility under development in the US.
|
|
|
|
|
| BP Annual Report and Form 20-F 2013 |
|
|
147 |
|
6. Disposal of TNK-BP and investment in Rosneft
Disposal of TNK-BP
BP announced on
22 November 2012 that it, Rosneft and Rosneftegaz – the Russian state-owned parent company of Rosneft – had signed definitive and binding sale and purchase agreements (SPAs) for the sale of BP’s 50% interest in TNK-BP to Rosneft,
and for BP’s further investment in Rosneft. The transaction would consist of three tranches:
| • |
|
BP to sell its 50% shareholding in TNK-BP to Rosneft for cash consideration of $25.4 billion (which included a dividend of $0.7 billion received from TNK-BP in December 2012) and Rosneft shares representing a 3.04%
stake in Rosneft. |
| • |
|
BP would use $4.8 billion of the cash consideration to acquire a further 5.66% stake in Rosneft from the Russian government at a price of $8 per share (representing a premium of 12% to the Rosneft share price on the bid
date of 18 October 2012). |
| • |
|
BP would use $8.3 billion of the cash consideration to acquire a further 9.8% stake in Rosneft from a Rosneft subsidiary at a price of $8 per share. |
The net result of the overall transaction was that BP would receive $12.3 billion in cash (including $0.7 billion of TNK-BP dividends received by BP in December 2012) and
acquire an 18.5% shareholding in Rosneft. Combined with BP’s existing 1.25% shareholding, this would result in BP owning 19.75% of Rosneft.
On completion, the
transactions between BP, Rosneft and the Rosneft subsidiary were instead settled on a net basis, so that BP received the 9.80% stake in Rosneft directly rather than receiving and immediately paying $8.3 billion in cash; however, the net result was
the same.
BP accounts for its investment in Rosneft as an associate, and so equity accounts for its share of Rosneft’s earnings, production and reserves. See
Note 18 for more information on BP’s investment in Rosneft.
The gain on disposal of BP’s investment in TNK-BP, recognized in the TNK-BP segment in 2013,
was $12.5 billion as shown in the table below.
|
|
|
|
|
|
|
| |
|
|
|
$ million |
|
| Agreed cash disposal proceeds |
|
|
|
|
25,425 |
|
| Amount settled net in Rosneft shares (9.80% stake) |
|
|
|
|
(8,309 |
) |
| TNK-BP dividend received by BP in December 2012 |
|
|
|
|
(709 |
) |
| Interest on cash proceeds |
|
|
|
|
239 |
|
| Disposal proceeds received in cash |
|
|
|
|
16,646 |
|
| Shares in Rosneft received (9.80% and 3.04% stake) |
|
|
|
|
10,755 |
|
| Consideration received |
|
|
|
|
27,401 |
|
| Less: carrying value of investment in TNK-BP |
|
|
|
|
(12,393 |
) |
|
|
|
|
|
15,008 |
|
| Deferral of gain |
|
|
|
|
(2,959 |
) |
| Gain on existing 1.25% investment in Rosneft |
|
|
|
|
523 |
|
| Other |
|
|
|
|
(72 |
) |
| Gain on disposal of investment in TNK-BP |
|
|
|
|
12,500 |
|
Disposal proceeds of $4.9 billion were used to purchase the 5.66% stake in Rosneft from Rosneftegaz ($4.8 billion described above plus
$0.1 billion of interest). The net cash inflow relating to the transaction included in net cash flow from investing activities in the cash flow statement was $11.8 billion.
Part of the gain arising on the disposal, amounting to $3.0 billion, was deferred due to BP selling its investment in TNK-BP to Rosneft, which in turn is now accounted
for by BP as an associate. The deferred gain will be released to BP’s income statement over time as the TNK-BP assets are depreciated or amortized.
Investment in Rosneft
BP’s investment in Rosneft is included in the group balance sheet within investments in associates, as
described in Note 1. The investment is measured at cost less the deferred gain described above, plus post-acquisition changes in BP’s share of Rosneft’s net assets. The amount recognized as BP’s initial investment in Rosneft was
determined as shown in the table below.
|
|
|
|
|
|
|
| |
|
|
|
$ million |
|
| Shares in Rosneft received |
|
|
|
|
10,755 |
|
| Shares purchased from Rosneftegaz |
|
|
|
|
4,871 |
|
| Value of agreements to purchase Rosneft shares accounted for as derivatives (see Note 26) |
|
|
|
|
(726 |
) |
| Deferred gain |
|
|
|
|
(2,959 |
) |
| Amount included in capital expenditure |
|
|
|
|
11,941 |
|
| Value of existing 1.25% investment in Rosneft |
|
|
|
|
1,006 |
|
| Investment in Rosneft on completion |
|
|
|
|
12,947 |
|
The exercise to determine BP’s share of the fair value of Rosneft’s identifiable net assets and the consequent impact recognized
via equity accounting in BP’s income statement has been completed and the results are reflected in these financial statements.
|
|
|
| 148 |
|
BP Annual Report and Form 20-F 2013 |
7. Segmental analysis
The group’s organizational structure reflects the various activities in which BP is engaged. At 31 December 2013, BP had three reportable segments: Upstream,
Downstream and Rosneft.
Upstream’s activities include oil and natural gas exploration, field development and production; midstream transportation, storage and
processing; and the marketing and trading of natural gas, including liquefied natural gas (LNG), together with power and natural gas liquids (NGLs).
Downstream’s activities include the refining, manufacturing, marketing, transportation, and supply and trading of crude oil, petroleum, petrochemicals products and
related services to wholesale and retail customers.
During 2013, BP completed transactions for the sale of BP’s interest in TNK-BP to Rosneft, and for BP’s
further investment in Rosneft. BP’s interest in Rosneft is accounted for using the equity method and is reported as a separate operating segment, reflecting the way in which the investment is managed.
Other businesses and corporate comprises the Alternative Energy business, the group’s shipping and treasury functions, and corporate activities worldwide. The
Alternative Energy business is an operating segment which is reported within Other businesses and corporate as it does not meet the materiality thresholds for separate segment reporting.
The Gulf Coast Restoration Organization (GCRO), which manages all aspects of our response to the 2010 Gulf of Mexico incident, reports directly to the group chief
executive and is overseen by a board committee, however it is not an operating segment.
The accounting policies of the operating segments are the same as the
group’s accounting policies described in Note 1. However, IFRS requires that the measure of profit or loss disclosed for each operating segment is the measure that is provided regularly to the chief operating decision maker for the purposes of
performance assessment and resource allocation. For BP, this measure of profit or loss is replacement cost profit or loss before interest and tax which reflects the replacement cost of supplies by excluding from profit or loss inventory holding
gains and lossesa. Replacement cost profit or loss for the group is not a recognized measure under IFRS.
Sales
between segments are made at prices that approximate market prices, taking into account the volumes involved. Segment revenues and segment results include transactions between business segments. These transactions and any unrealized profits and
losses are eliminated on consolidation, unless unrealized losses provide evidence of an impairment of the asset transferred. Sales to external customers by region are based on the location of the seller. The UK region includes the UK-based
international activities of Downstream.
All surpluses and deficits recognized on the group balance sheet in respect of pension and other post-retirement benefit
plans are allocated to Other businesses and corporate. However, the periodic expense relating to these plans is allocated to the other operating segments based upon the business in which the employees work.
Certain financial information is provided separately for the US as this is an individually material country for BP, and for the UK as this is BP’s country of
domicile.
| a |
Inventory holding gains and losses represent the difference between the cost of sales calculated using the average cost to BP of supplies acquired during the period and the cost of sales calculated on the first-in
first-out (FIFO) method after adjusting for any changes in provisions where the net realizable value of the inventory is lower than its cost. Under the FIFO method, which we use for IFRS reporting, the cost of inventory charged to the income
statement is based on its historic cost of purchase, or manufacture, rather than its replacement cost. In volatile energy markets, this can have a significant distorting effect on reported income. The amounts disclosed represent the difference
between the charge (to the income statement) for inventory on a FIFO basis (after adjusting for any related movements in net realizable value provisions) and the charge that would have arisen if an average cost of supplies was used for the period.
For this purpose, the average cost of supplies during the period is principally calculated on a monthly basis by dividing the total cost of inventory acquired in the period by the number of barrels acquired. The amounts disclosed are not separately
reflected in the financial statements as a gain or loss. No adjustment is made in respect of the cost of inventories held as part of a trading position and certain other temporary inventory positions. |
|
|
|
|
|
| BP Annual Report and Form 20-F 2013 |
|
|
149 |
|
7. Segmental analysis – continued
|
|
|
|
|
|
|
|
|
|
|
|
|
|
|
|
|
|
|
|
|
|
|
|
|
|
|
|
|
|
|
|
|
|
|
| |
|
|
|
|
|
|
|
|
|
|
|
|
|
|
|
|
|
|
|
|
|
|
|
|
$ million |
|
| |
|
|
|
|
|
|
|
|
|
|
|
|
|
|
|
|
|
|
|
|
|
|
|
|
2013 |
|
| By segment |
|
|
|
Upstream |
|
|
Downstream |
|
|
Rosneft |
|
|
TNK-BP |
|
|
Other
businesses
and
corporate |
|
|
Gulf of
Mexico
oil spill
response |
|
|
Consolidation
adjustment
and
eliminations |
|
|
Total
group |
|
| Segment revenues |
|
|
|
|
|
|
|
|
|
|
|
|
|
|
|
|
|
|
|
|
|
|
|
|
|
|
|
|
|
|
|
|
|
|
| Sales and other operating revenues |
|
|
|
|
70,374 |
|
|
|
351,195 |
|
|
|
– |
|
|
|
– |
|
|
|
1,805 |
|
|
|
– |
|
|
|
(44,238 |
) |
|
|
379,136 |
|
| Less: sales and other operating revenues between segments |
|
|
|
|
(42,327 |
) |
|
|
(1,045 |
) |
|
|
– |
|
|
|
– |
|
|
|
(866 |
) |
|
|
– |
|
|
|
44,238 |
|
|
|
– |
|
| Third party sales and other operating revenues |
|
|
|
|
28,047 |
|
|
|
350,150 |
|
|
|
– |
|
|
|
– |
|
|
|
939 |
|
|
|
– |
|
|
|
– |
|
|
|
379,136 |
|
| Equity-accounted earnings |
|
|
|
|
1,027 |
|
|
|
195 |
|
|
|
2,058 |
|
|
|
– |
|
|
|
(91 |
) |
|
|
– |
|
|
|
– |
|
|
|
3,189 |
|
| Interest income |
|
|
|
|
76 |
|
|
|
93 |
|
|
|
– |
|
|
|
– |
|
|
|
113 |
|
|
|
– |
|
|
|
– |
|
|
|
282 |
|
| Segment results |
|
|
|
|
|
|
|
|
|
|
|
|
|
|
|
|
|
|
|
|
|
|
|
|
|
|
|
|
|
|
|
|
|
|
| Replacement cost profit (loss) before interest and taxation |
|
|
|
|
16,657 |
|
|
|
2,919 |
|
|
|
2,153 |
|
|
|
12,500 |
|
|
|
(2,319 |
) |
|
|
(430 |
) |
|
|
579 |
|
|
|
32,059 |
|
| Inventory holding gains (losses)a |
|
|
|
|
4 |
|
|
|
(194 |
) |
|
|
(100 |
) |
|
|
– |
|
|
|
– |
|
|
|
– |
|
|
|
– |
|
|
|
(290 |
) |
| Profit (loss) before interest and taxation |
|
|
|
|
16,661 |
|
|
|
2,725 |
|
|
|
2,053 |
|
|
|
12,500 |
|
|
|
(2,319 |
) |
|
|
(430 |
) |
|
|
579 |
|
|
|
31,769 |
|
| Finance costs |
|
|
|
|
|
|
|
|
|
|
|
|
|
|
|
|
|
|
|
|
|
|
|
|
|
|
|
|
|
|
|
|
(1,068 |
) |
| Net finance expense relating to pensions and other post-retirement benefits |
|
|
|
|
|
|
|
|
|
|
|
|
|
|
|
|
|
|
|
|
|
|
|
|
|
|
|
|
|
|
|
|
(480 |
) |
| Profit before taxation |
|
|
|
|
|
|
|
|
|
|
|
|
|
|
|
|
|
|
|
|
|
|
|
|
|
|
|
|
|
|
|
|
30,221 |
|
| Other income statement items |
|
|
|
|
|
|
|
|
|
|
|
|
|
|
|
|
|
|
|
|
|
|
|
|
|
|
|
|
|
|
|
|
|
|
| Depreciation, depletion and amortization |
|
|
|
|
|
|
|
|
|
|
|
|
|
|
|
|
|
|
|
|
|
|
|
|
|
|
|
|
|
|
|
|
|
|
| US |
|
|
|
|
3,538 |
|
|
|
747 |
|
|
|
– |
|
|
|
– |
|
|
|
181 |
|
|
|
– |
|
|
|
– |
|
|
|
4,466 |
|
| Non-US |
|
|
|
|
7,514 |
|
|
|
1,343 |
|
|
|
– |
|
|
|
– |
|
|
|
187 |
|
|
|
– |
|
|
|
– |
|
|
|
9,044 |
|
| Impairment losses |
|
|
|
|
1,255 |
|
|
|
484 |
|
|
|
– |
|
|
|
– |
|
|
|
218 |
|
|
|
– |
|
|
|
– |
|
|
|
1,957 |
|
| Impairment reversals |
|
|
|
|
(226 |
) |
|
|
– |
|
|
|
– |
|
|
|
– |
|
|
|
– |
|
|
|
– |
|
|
|
– |
|
|
|
(226 |
) |
| Fair value (gain) loss on embedded derivatives |
|
|
|
|
(459 |
) |
|
|
– |
|
|
|
– |
|
|
|
– |
|
|
|
– |
|
|
|
– |
|
|
|
– |
|
|
|
(459 |
) |
| Charges for provisions, net of write-back of unused provisions, including change in discount rate |
|
|
|
|
161 |
|
|
|
270 |
|
|
|
– |
|
|
|
– |
|
|
|
295 |
|
|
|
1,855 |
|
|
|
– |
|
|
|
2,581 |
|
| Segment assets |
|
|
|
|
|
|
|
|
|
|
|
|
|
|
|
|
|
|
|
|
|
|
|
|
|
|
|
|
|
|
|
|
|
|
| Equity-accounted investments |
|
|
|
|
7,780 |
|
|
|
3,302 |
|
|
|
13,681 |
|
|
|
– |
|
|
|
1,072 |
|
|
|
– |
|
|
|
– |
|
|
|
25,835 |
|
| Additions to non-current assets |
|
|
|
|
19,499 |
|
|
|
4,449 |
|
|
|
11,941 |
|
|
|
– |
|
|
|
1,027 |
|
|
|
– |
|
|
|
– |
|
|
|
36,916 |
|
| Additions to other investments |
|
|
|
|
|
|
|
|
|
|
|
|
|
|
|
|
|
|
|
|
|
|
|
|
|
|
|
|
|
|
|
|
41 |
|
| Element of acquisitions not related to non-current assets |
|
|
|
|
|
|
|
|
|
|
|
|
|
|
|
|
|
|
|
|
|
|
|
|
|
|
|
|
|
|
|
|
39 |
|
| Additions to decommissioning asset |
|
|
|
|
|
|
|
|
|
|
|
|
|
|
|
|
|
|
|
|
|
|
|
|
|
|
|
|
|
|
|
|
(384 |
) |
| Capital expenditure and acquisitions |
|
|
|
|
19,115 |
|
|
|
4,506 |
|
|
|
11,941 |
|
|
|
– |
|
|
|
1,050 |
|
|
|
– |
|
|
|
– |
|
|
|
36,612 |
|
| a |
See explanation of inventory holding gains and losses on page 149. |
|
|
|
| 150 |
|
BP Annual Report and Form 20-F 2013 |
7. Segmental analysis – continued
|
|
|
|
|
|
|
|
|
|
|
|
|
|
|
|
|
|
|
|
|
|
|
|
|
|
|
|
|
|
|
| |
|
|
|
|
|
|
|
|
|
|
|
|
|
|
|
|
|
|
|
|
|
$ million |
|
| |
|
|
|
|
|
|
|
|
|
|
|
|
|
|
|
|
|
|
|
|
|
2012 |
|
| By segment |
|
|
|
Upstream |
|
|
Downstream |
|
|
TNK-BP |
|
|
Other
businesses
and
corporate |
|
|
Gulf of
Mexico
oil spill
response |
|
|
Consolidation
adjustment
and
eliminations |
|
|
Total
group |
|
| Segment revenues |
|
|
|
|
|
|
|
|
|
|
|
|
|
|
|
|
|
|
|
|
|
|
|
|
|
|
|
|
|
|
| Sales and other operating revenues |
|
|
|
|
72,225 |
|
|
|
346,391 |
|
|
|
– |
|
|
|
1,985 |
|
|
|
– |
|
|
|
(44,836 |
) |
|
|
375,765 |
|
| Less: sales and other operating revenues between segments |
|
|
|
|
(42,572 |
) |
|
|
(1,365 |
) |
|
|
– |
|
|
|
(899 |
) |
|
|
– |
|
|
|
44,836 |
|
|
|
– |
|
| Third party sales and other operating revenues |
|
|
|
|
29,653 |
|
|
|
345,026 |
|
|
|
– |
|
|
|
1,086 |
|
|
|
– |
|
|
|
– |
|
|
|
375,765 |
|
| Equity-accounted earnings |
|
|
|
|
915 |
|
|
|
101 |
|
|
|
2,986 |
|
|
|
(67 |
) |
|
|
– |
|
|
|
– |
|
|
|
3,935 |
|
| Interest income |
|
|
|
|
107 |
|
|
|
108 |
|
|
|
– |
|
|
|
104 |
|
|
|
– |
|
|
|
– |
|
|
|
319 |
|
| Segment results |
|
|
|
|
|
|
|
|
|
|
|
|
|
|
|
|
|
|
|
|
|
|
|
|
|
|
|
|
|
|
| Replacement cost profit (loss) before interest and taxation |
|
|
|
|
22,491 |
|
|
|
2,864 |
|
|
|
3,373 |
|
|
|
(2,794 |
) |
|
|
(4,995 |
) |
|
|
(576 |
) |
|
|
20,363 |
|
| Inventory holding gains (losses)a |
|
|
|
|
(104 |
) |
|
|
(487 |
) |
|
|
(3 |
) |
|
|
– |
|
|
|
– |
|
|
|
– |
|
|
|
(594 |
) |
| Profit (loss) before interest and taxation |
|
|
|
|
22,387 |
|
|
|
2,377 |
|
|
|
3,370 |
|
|
|
(2,794 |
) |
|
|
(4,995 |
) |
|
|
(576 |
) |
|
|
19,769 |
|
| Finance costs |
|
|
|
|
|
|
|
|
|
|
|
|
|
|
|
|
|
|
|
|
|
|
|
|
|
|
|
|
(1,072 |
) |
| Net finance expense relating to pensions and other post-retirement benefits |
|
|
|
|
|
|
|
|
|
|
|
|
|
|
|
|
|
|
|
|
|
|
|
|
|
|
|
|
(566 |
) |
| Profit before taxation |
|
|
|
|
|
|
|
|
|
|
|
|
|
|
|
|
|
|
|
|
|
|
|
|
|
|
|
|
18,131 |
|
| Other income statement items |
|
|
|
|
|
|
|
|
|
|
|
|
|
|
|
|
|
|
|
|
|
|
|
|
|
|
|
|
|
|
| Depreciation, depletion and amortization |
|
|
|
|
|
|
|
|
|
|
|
|
|
|
|
|
|
|
|
|
|
|
|
|
|
|
|
|
|
|
| US |
|
|
|
|
3,437 |
|
|
|
586 |
|
|
|
– |
|
|
|
213 |
|
|
|
– |
|
|
|
– |
|
|
|
4,236 |
|
| Non-US |
|
|
|
|
6,918 |
|
|
|
1,343 |
|
|
|
– |
|
|
|
190 |
|
|
|
– |
|
|
|
– |
|
|
|
8,451 |
|
| Impairment losses |
|
|
|
|
3,046 |
|
|
|
2,892 |
|
|
|
– |
|
|
|
320 |
|
|
|
– |
|
|
|
– |
|
|
|
6,258 |
|
| Impairment reversals |
|
|
|
|
(289 |
) |
|
|
(1 |
) |
|
|
– |
|
|
|
(3 |
) |
|
|
– |
|
|
|
– |
|
|
|
(293 |
) |
| Fair value (gain) loss on embedded derivatives |
|
|
|
|
(347 |
) |
|
|
– |
|
|
|
– |
|
|
|
– |
|
|
|
– |
|
|
|
– |
|
|
|
(347 |
) |
| Charges for provisions, net of write-back of unused provisions, including change in discount rate |
|
|
|
|
897 |
|
|
|
141 |
|
|
|
– |
|
|
|
505 |
|
|
|
6,074 |
|
|
|
– |
|
|
|
7,617 |
|
| Segment assets |
|
|
|
|
|
|
|
|
|
|
|
|
|
|
|
|
|
|
|
|
|
|
|
|
|
|
|
|
|
|
| Equity-accounted investments |
|
|
|
|
7,329 |
|
|
|
3,212 |
|
|
|
– |
|
|
|
1,071 |
|
|
|
– |
|
|
|
– |
|
|
|
11,612 |
|
| Additions to non-current assets |
|
|
|
|
22,603 |
|
|
|
5,246 |
|
|
|
– |
|
|
|
1,419 |
|
|
|
– |
|
|
|
– |
|
|
|
29,268 |
|
| Additions to other investments |
|
|
|
|
|
|
|
|
|
|
|
|
|
|
|
|
|
|
|
|
|
|
|
|
|
|
|
|
33 |
|
| Element of acquisitions not related to non-current assets |
|
|
|
|
|
|
|
|
|
|
|
|
|
|
|
|
|
|
|
|
|
|
|
|
|
|
|
|
(72 |
) |
| Additions to decommissioning asset |
|
|
|
|
|
|
|
|
|
|
|
|
|
|
|
|
|
|
|
|
|
|
|
|
|
|
|
|
(4,025 |
) |
| Capital expenditure and acquisitions |
|
|
|
|
18,520 |
|
|
|
5,249 |
|
|
|
– |
|
|
|
1,435 |
|
|
|
– |
|
|
|
– |
|
|
|
25,204 |
|
| a |
See explanation of inventory holding gains and losses on page 149. |
|
|
|
|
|
| BP Annual Report and Form 20-F 2013 |
|
|
151 |
|
7. Segmental analysis – continued
|
|
|
|
|
|
|
|
|
|
|
|
|
|
|
|
|
|
|
|
|
|
|
|
|
|
|
|
|
|
|
| |
|
|
|
|
|
|
|
|
|
|
|
|
|
|
|
|
|
|
|
|
|
$ million |
|
| |
|
|
|
|
|
|
|
|
|
|
|
|
|
|
|
|
|
|
|
|
|
2011 |
|
| By segment |
|
|
|
Upstream |
|
|
Downstream |
|
|
TNK-BP |
|
|
Other
businesses
and
corporate |
|
|
Gulf of
Mexico
oil spill
response |
|
|
Consolidation
adjustment
and
eliminations |
|
|
Total
group |
|
| Segment revenues |
|
|
|
|
|
|
|
|
|
|
|
|
|
|
|
|
|
|
|
|
|
|
|
|
|
|
|
|
|
|
| Sales and other operating revenues |
|
|
|
|
75,754 |
|
|
|
344,033 |
|
|
|
– |
|
|
|
2,957 |
|
|
|
– |
|
|
|
(47,031 |
) |
|
|
375,713 |
|
| Less: sales and other operating revenues between segments |
|
|
|
|
(44,766 |
) |
|
|
(1,396 |
) |
|
|
– |
|
|
|
(869 |
) |
|
|
– |
|
|
|
47,031 |
|
|
|
– |
|
| Third party sales and other operating revenues |
|
|
|
|
30,988 |
|
|
|
342,637 |
|
|
|
– |
|
|
|
2,088 |
|
|
|
– |
|
|
|
– |
|
|
|
375,713 |
|
| Equity-accounted earnings |
|
|
|
|
1,150 |
|
|
|
381 |
|
|
|
4,185 |
|
|
|
(33 |
) |
|
|
– |
|
|
|
– |
|
|
|
5,683 |
|
| Interest income |
|
|
|
|
(10 |
) |
|
|
108 |
|
|
|
– |
|
|
|
146 |
|
|
|
– |
|
|
|
– |
|
|
|
244 |
|
| Segment results |
|
|
|
|
|
|
|
|
|
|
|
|
|
|
|
|
|
|
|
|
|
|
|
|
|
|
|
|
|
|
| Replacement cost profit (loss) before interest and taxation |
|
|
|
|
26,358 |
|
|
|
5,470 |
|
|
|
4,134 |
|
|
|
(2,468 |
) |
|
|
3,800 |
|
|
|
(113 |
) |
|
|
37,181 |
|
| Inventory holding gains (losses)a |
|
|
|
|
81 |
|
|
|
2,487 |
|
|
|
51 |
|
|
|
15 |
|
|
|
– |
|
|
|
– |
|
|
|
2,634 |
|
| Profit (loss) before interest and taxation |
|
|
|
|
26,439 |
|
|
|
7,957 |
|
|
|
4,185 |
|
|
|
(2,453 |
) |
|
|
3,800 |
|
|
|
(113 |
) |
|
|
39,815 |
|
| Finance costs |
|
|
|
|
|
|
|
|
|
|
|
|
|
|
|
|
|
|
|
|
|
|
|
|
|
|
|
|
(1,187 |
) |
| Net finance expense relating to pensions and other post-retirement benefits |
|
|
|
|
|
|
|
|
|
|
|
|
|
|
|
|
|
|
|
|
|
|
|
|
|
|
|
|
(400 |
) |
| Profit before taxation |
|
|
|
|
|
|
|
|
|
|
|
|
|
|
|
|
|
|
|
|
|
|
|
|
|
|
|
|
38,228 |
|
| Other income statement items |
|
|
|
|
|
|
|
|
|
|
|
|
|
|
|
|
|
|
|
|
|
|
|
|
|
|
|
|
|
|
| Depreciation, depletion and amortization |
|
|
|
|
|
|
|
|
|
|
|
|
|
|
|
|
|
|
|
|
|
|
|
|
|
|
|
|
|
|
| US |
|
|
|
|
3,201 |
|
|
|
860 |
|
|
|
– |
|
|
|
151 |
|
|
|
– |
|
|
|
– |
|
|
|
4,212 |
|
| Non-US |
|
|
|
|
5,540 |
|
|
|
1,431 |
|
|
|
– |
|
|
|
174 |
|
|
|
– |
|
|
|
– |
|
|
|
7,145 |
|
| Impairment losses |
|
|
|
|
1,443 |
|
|
|
599 |
|
|
|
– |
|
|
|
58 |
|
|
|
– |
|
|
|
– |
|
|
|
2,100 |
|
| Impairment reversals |
|
|
|
|
(146 |
) |
|
|
– |
|
|
|
– |
|
|
|
– |
|
|
|
– |
|
|
|
– |
|
|
|
(146 |
) |
| Fair value (gain) loss on embedded derivatives |
|
|
|
|
(191 |
) |
|
|
– |
|
|
|
– |
|
|
|
123 |
|
|
|
– |
|
|
|
– |
|
|
|
(68 |
) |
| Charges for provisions, net of write-back of unused provisions, including change in discount rate |
|
|
|
|
213 |
|
|
|
373 |
|
|
|
– |
|
|
|
942 |
|
|
|
5,200 |
|
|
|
– |
|
|
|
6,728 |
|
| Segment assets |
|
|
|
|
|
|
|
|
|
|
|
|
|
|
|
|
|
|
|
|
|
|
|
|
|
|
|
|
|
|
| Equity-accounted investments |
|
|
|
|
7,301 |
|
|
|
3,256 |
|
|
|
10,013 |
|
|
|
1,024 |
|
|
|
– |
|
|
|
– |
|
|
|
21,594 |
|
| Additions to non-current assets |
|
|
|
|
34,813 |
|
|
|
4,281 |
|
|
|
– |
|
|
|
1,864 |
|
|
|
– |
|
|
|
– |
|
|
|
40,958 |
|
| Additions to other investments |
|
|
|
|
|
|
|
|
|
|
|
|
|
|
|
|
|
|
|
|
|
|
|
|
|
|
|
|
27 |
|
| Element of acquisitions not related to non-current assets |
|
|
|
|
|
|
|
|
|
|
|
|
|
|
|
|
|
|
|
|
|
|
|
|
|
|
|
|
(1,089 |
) |
| Additions to decommissioning asset |
|
|
|
|
|
|
|
|
|
|
|
|
|
|
|
|
|
|
|
|
|
|
|
|
|
|
|
|
(7,937 |
) |
| Capital expenditure and acquisitions |
|
|
|
|
25,821 |
|
|
|
4,285 |
|
|
|
– |
|
|
|
1,853 |
|
|
|
– |
|
|
|
– |
|
|
|
31,959 |
|
| a |
See explanation of inventory holding gains and losses on page 149. |
|
|
|
| 152 |
|
BP Annual Report and Form 20-F 2013 |
7. Segmental analysis – continued
|
|
|
|
|
|
|
|
|
|
|
|
|
|
|
| |
|
|
|
|
|
|
|
|
|
$ million |
|
| |
|
|
|
|
|
|
|
|
|
2013 |
|
| By geographical area |
|
|
|
US |
|
|
Non-US |
|
|
Total |
|
| Revenues |
|
|
|
|
|
|
|
|
|
|
|
|
|
|
| Third party sales and other operating
revenuesa |
|
|
|
|
128,764 |
|
|
|
250,372 |
|
|
|
379,136 |
|
| Other income statement items |
|
|
|
|
|
|
|
|
|
|
|
|
|
|
| Production and similar taxes |
|
|
|
|
1,112 |
|
|
|
5,935 |
|
|
|
7,047 |
|
| Results |
|
|
|
|
|
|
|
|
|
|
|
|
|
|
| Replacement cost profit before interest and taxation |
|
|
|
|
3,114 |
|
|
|
28,945 |
|
|
|
32,059 |
|
| Non-current assets |
|
|
|
|
|
|
|
|
|
|
|
|
|
|
| Other non-current assetsb c |
|
|
|
|
70,228 |
|
|
|
124,439 |
|
|
|
194,667 |
|
| Other investments |
|
|
|
|
|
|
|
|
|
|
|
|
1,565 |
|
| Loans |
|
|
|
|
|
|
|
|
|
|
|
|
763 |
|
| Trade and other receivables |
|
|
|
|
|
|
|
|
|
|
|
|
5,985 |
|
| Derivative financial instruments |
|
|
|
|
|
|
|
|
|
|
|
|
3,509 |
|
| Deferred tax assets |
|
|
|
|
|
|
|
|
|
|
|
|
985 |
|
| Defined benefit pension plan surpluses |
|
|
|
|
|
|
|
|
|
|
|
|
1,376 |
|
| Total non-current assets |
|
|
|
|
|
|
|
|
|
|
|
|
208,850 |
|
| Capital expenditure and acquisitions |
|
|
|
|
9,176 |
|
|
|
27,436 |
|
|
|
36,612 |
|
| a |
Non-US region includes UK $82,381 million. |
| b |
Non-US region includes UK $18,967 million. |
| c |
Excluding financial instruments, deferred tax assets and defined benefit pension plan surpluses. |
|
|
|
|
|
|
|
|
|
|
|
|
|
|
|
| |
|
|
|
|
|
|
|
|
|
$ million |
|
| |
|
|
|
|
|
|
|
|
|
2012 |
|
| By geographical area |
|
|
|
US |
|
|
Non-US |
|
|
Total |
|
| Revenues |
|
|
|
|
|
|
|
|
|
|
|
|
|
|
| Third party sales and other operating
revenuesa |
|
|
|
|
130,940 |
|
|
|
244,825 |
|
|
|
375,765 |
|
| Other income statement items |
|
|
|
|
|
|
|
|
|
|
|
|
|
|
| Production and similar taxes |
|
|
|
|
1,472 |
|
|
|
6,686 |
|
|
|
8,158 |
|
| Results |
|
|
|
|
|
|
|
|
|
|
|
|
|
|
| Replacement cost profit before interest and taxation |
|
|
|
|
180 |
|
|
|
20,183 |
|
|
|
20,363 |
|
| Non-current assets |
|
|
|
|
|
|
|
|
|
|
|
|
|
|
| Other non-current assetsb c |
|
|
|
|
66,751 |
|
|
|
107,844 |
|
|
|
174,595 |
|
| Other investments |
|
|
|
|
|
|
|
|
|
|
|
|
2,704 |
|
| Loans |
|
|
|
|
|
|
|
|
|
|
|
|
642 |
|
| Trade and other receivables |
|
|
|
|
|
|
|
|
|
|
|
|
5,961 |
|
| Derivative financial instruments |
|
|
|
|
|
|
|
|
|
|
|
|
4,294 |
|
| Deferred tax assets |
|
|
|
|
|
|
|
|
|
|
|
|
874 |
|
| Defined benefit pension plan surpluses |
|
|
|
|
|
|
|
|
|
|
|
|
12 |
|
| Total non-current assets |
|
|
|
|
|
|
|
|
|
|
|
|
189,082 |
|
| Capital expenditure and acquisitions |
|
|
|
|
10,541 |
|
|
|
14,663 |
|
|
|
25,204 |
|
| a |
Non-US region includes UK $75,364 million. |
| b |
Non-US region includes UK $17,545 million. |
| c |
Excluding financial instruments, deferred tax assets and defined benefit pension plan surpluses. |
|
|
|
|
|
| BP Annual Report and Form 20-F 2013 |
|
|
153 |
|
7. Segmental analysis – continued
|
|
|
|
|
|
|
|
|
|
|
|
|
|
|
| |
|
|
|
|
|
|
|
|
|
$ million |
|
| |
|
|
|
|
|
|
|
|
|
2011 |
|
| By geographical area |
|
|
|
US |
|
|
Non-US |
|
|
Total |
|
| Revenues |
|
|
|
|
|
|
|
|
|
|
|
|
|
|
| Third party sales and other operating
revenuesa |
|
|
|
|
131,488 |
|
|
|
244,225 |
|
|
|
375,713 |
|
| Other income statement items |
|
|
|
|
|
|
|
|
|
|
|
|
|
|
| Production and similar taxes |
|
|
|
|
1,854 |
|
|
|
6,426 |
|
|
|
8,280 |
|
| Results |
|
|
|
|
|
|
|
|
|
|
|
|
|
|
| Replacement cost profit before interest and taxation |
|
|
|
|
10,202 |
|
|
|
26,979 |
|
|
|
37,181 |
|
| Non-current assets |
|
|
|
|
|
|
|
|
|
|
|
|
|
|
| Other non-current assetsb c |
|
|
|
|
66,523 |
|
|
|
113,323 |
|
|
|
179,846 |
|
| Other investments |
|
|
|
|
|
|
|
|
|
|
|
|
2,635 |
|
| Loans |
|
|
|
|
|
|
|
|
|
|
|
|
824 |
|
| Trade and other receivables |
|
|
|
|
|
|
|
|
|
|
|
|
5,738 |
|
| Derivative financial instruments |
|
|
|
|
|
|
|
|
|
|
|
|
5,038 |
|
| Deferred tax assets |
|
|
|
|
|
|
|
|
|
|
|
|
611 |
|
| Defined benefit pension plan surpluses |
|
|
|
|
|
|
|
|
|
|
|
|
17 |
|
| Total non-current assets |
|
|
|
|
|
|
|
|
|
|
|
|
194,709 |
|
| Capital expenditure and acquisitions |
|
|
|
|
8,931 |
|
|
|
23,028 |
|
|
|
31,959 |
|
| a |
Non-US region includes UK $75,816 million. |
| b |
Non-US region includes UK $18,363 million. |
| c |
Excluding financial instruments, deferred tax assets and defined benefit pension plan surpluses. |
8. Income statement analysis
|
|
|
|
|
|
|
|
|
|
|
|
|
|
|
| |
|
|
|
|
|
|
|
|
|
$ million |
|
| |
|
|
|
2013 |
|
|
2012 |
|
|
2011 |
|
| Interest and other income |
|
|
|
|
|
|
|
|
|
|
|
|
|
|
| Interest income |
|
|
|
|
282 |
|
|
|
319 |
|
|
|
244 |
|
| Other incomea |
|
|
|
|
495 |
|
|
|
1,358 |
|
|
|
444 |
|
| |
|
|
|
|
777 |
|
|
|
1,677 |
|
|
|
688 |
|
| Currency exchange losses (gains) charged (credited) to the income statementb |
|
|
|
|
180 |
|
|
|
106 |
|
|
|
(69 |
) |
| Expenditure on research and development |
|
|
|
|
707 |
|
|
|
674 |
|
|
|
636 |
|
| Finance costs |
|
|
|
|
|
|
|
|
|
|
|
|
|
|
| Interest payable |
|
|
|
|
1,082 |
|
|
|
1,234 |
|
|
|
1,151 |
|
| Capitalized at 2% (2012 2.25% and 2011 2.63%)c |
|
|
|
|
(238 |
) |
|
|
(390 |
) |
|
|
(349 |
) |
| Unwinding of discount on provisionsd |
|
|
|
|
147 |
|
|
|
140 |
|
|
|
244 |
|
| Unwinding of discount on other payablesd |
|
|
|
|
77 |
|
|
|
88 |
|
|
|
141 |
|
| |
|
|
|
|
1,068 |
|
|
|
1,072 |
|
|
|
1,187 |
|
| a |
2012 includes $709 million of dividends received from TNK-BP. See Note 6 for further information. |
| b |
Excludes exchange gains and losses arising on financial instruments measured at fair value through profit or loss. |
| c |
Tax relief on capitalized interest is approximately $62 million (2012 $93 million and 2011 $107 million). |
| d |
Unwinding of discount on provisions relating to the Gulf of Mexico oil spill was $1 million (2012 $7 million and 2011 $6 million) and unwinding of discount on other payables relating to the Gulf of Mexico oil spill was
$38 million (2012 $12 million and 2011 $52 million). See Note 2 for further information on the financial impacts of the Gulf of Mexico oil spill. |
9. Operating leases
In the case of an operating lease entered into by BP as the operator of a joint
operation, the amounts shown in the tables below represent the net operating lease expense and net future minimum lease payments. These net amounts are after deducting amounts reimbursed, or to be reimbursed, by joint operators, whether the joint
operators have co-signed the lease or not. Where BP is not the operator of a joint operation, BP’s share of the lease expense and future minimum lease payments is included in the amounts shown, whether BP has co-signed the lease or not.
The table below shows the expense for the year in respect of operating leases.
|
|
|
|
|
|
|
|
|
|
|
|
|
|
|
| |
|
|
|
|
|
|
|
|
|
$ million |
|
| |
|
|
|
2013 |
|
|
2012 |
|
|
2011 |
|
| Minimum lease payments |
|
|
|
|
5,961 |
|
|
|
5,257 |
|
|
|
4,868 |
|
| Contingent rentals |
|
|
|
|
(50 |
) |
|
|
(79 |
) |
|
|
(97 |
) |
| Sub-lease rentals |
|
|
|
|
(88 |
) |
|
|
(228 |
) |
|
|
(153 |
) |
| |
|
|
|
|
5,823 |
|
|
|
4,950 |
|
|
|
4,618 |
|
|
|
|
| 154 |
|
BP Annual Report and Form 20-F 2013 |
9. Operating leases – continued
The future minimum lease payments at 31 December 2013, before deducting related rental income from operating
sub-leases of $223 million (2012 $271 million), are shown in the table below. This does not include future contingent rentals. Where the lease rentals are dependent on a variable factor, the future minimum lease payments are based on the factor as
at inception of the lease.
|
|
|
|
|
|
|
|
|
|
|
| |
|
|
|
|
|
|
$ million |
|
| Future minimum lease payments |
|
|
|
2013 |
|
|
2012 |
|
| Payable within |
|
|
|
|
|
|
|
|
|
|
| 1 year |
|
|
|
|
5,188 |
|
|
|
4,533 |
|
| 2 to 5 years |
|
|
|
|
10,408 |
|
|
|
9,735 |
|
| Thereafter |
|
|
|
|
3,590 |
|
|
|
4,195 |
|
| |
|
|
|
|
19,186 |
|
|
|
18,463 |
|
The group enters into operating leases of ships, plant and machinery, commercial vehicles and land and buildings. Typical durations of the
leases are as follows:
|
|
|
|
|
|
|
| |
|
|
|
Years |
|
| Ships |
|
|
|
|
up to 15 |
|
| Plant and machinery |
|
|
|
|
up to 10 |
|
| Commercial vehicles |
|
|
|
|
up to 15 |
|
| Land and buildings |
|
|
|
|
up to 40 |
|
The group has entered into a number of structured operating leases for ships and in most cases the lease rental payments vary with market
interest rates. The variable portion of the lease payments above or below the amount based on the market interest rate prevailing at inception of the lease is treated as contingent rental expense. The group also routinely enters into bareboat
charters, time-charters and voyage-charters for ships on standard industry terms.
The most significant items of plant and machinery hired under operating leases are
drilling rigs used in the Upstream segment. At 31 December 2013, the future minimum lease payments relating to drilling rigs amounted to $8,776 million (2012 $8,527 million).
Commercial vehicles hired under operating leases are primarily railcars. Retail service station sites and office accommodation are the main items in the land and
buildings category.
The terms and conditions of these operating leases do not impose any significant financial restrictions on the group. Some of the leases of ships
and buildings allow for renewals at BP’s option, and some of the group’s operating leases contain escalation clauses.
10.
Exploration for and evaluation of oil and natural gas resources
The following financial information represents the amounts included within the group
totals relating to activity associated with the exploration for and evaluation of oil and natural gas resources. All such activity is recorded within the Upstream segment.
|
|
|
|
|
|
|
|
|
|
|
|
|
|
|
| |
|
|
|
|
|
|
|
|
|
$ million |
|
| |
|
|
|
2013 |
|
|
2012 |
|
|
2011 |
|
| Exploration and evaluation costs |
|
|
|
|
|
|
|
|
|
|
|
|
|
|
| Exploration expenditure written offa |
|
|
|
|
2,710 |
|
|
|
745 |
|
|
|
1,024 |
|
| Other exploration costs |
|
|
|
|
731 |
|
|
|
730 |
|
|
|
496 |
|
| Exploration expense for the year |
|
|
|
|
3,441 |
|
|
|
1,475 |
|
|
|
1,520 |
|
| Impairment losses |
|
|
|
|
253 |
|
|
|
– |
|
|
|
7 |
|
| Impairment reversals |
|
|
|
|
– |
|
|
|
(42 |
) |
|
|
– |
|
| Intangible assets – exploration and appraisal expenditure |
|
|
|
|
20,865 |
|
|
|
23,434 |
|
|
|
20,433 |
|
| Liabilities |
|
|
|
|
212 |
|
|
|
287 |
|
|
|
306 |
|
| Net assets |
|
|
|
|
20,653 |
|
|
|
23,147 |
|
|
|
20,127 |
|
| Capital expenditure |
|
|
|
|
4,464 |
|
|
|
5,176 |
|
|
|
8,926 |
|
| Net cash used in operating activities |
|
|
|
|
731 |
|
|
|
730 |
|
|
|
496 |
|
| Net cash used in investing activities |
|
|
|
|
4,275 |
|
|
|
5,010 |
|
|
|
8,571 |
|
| a |
2013 included an $845-million write-off relating to the value ascribed to block BM-CAL-13 offshore Brazil as a result of the Pitanga exploration well not encountering commercial quantities of oil or gas and a
$257-million write-off of costs relating to the Risha concession in Jordan as our exploration activities did not establish the technical basis for a development project in the concession. For further information see
Upstream – Exploration on page 28. |
The carrying amount, by location, of exploration and appraisal expenditure capitalized as intangible
assets at 31 December 2013 is shown in the table below.
|
|
|
|
|
|
|
| Carrying amount |
|
|
|
Location |
|
| $1-2 billion |
|
|
|
|
Angola; US – North America gas |
|
| $2-3 billion |
|
|
|
|
Canada; Egypt; India |
|
| $3-4 billion |
|
|
|
|
Brazil |
|
| $4-5 billion |
|
|
|
|
US – Gulf of Mexico |
|
|
|
|
|
|
| BP Annual Report and Form 20-F 2013 |
|
|
155 |
|
11. Taxation
Tax on profit
|
|
|
|
|
|
|
|
|
|
|
|
|
|
|
| |
|
|
|
|
|
|
|
|
|
$ million |
|
| |
|
|
|
2013 |
|
|
2012 |
|
|
2011 |
|
| Current tax |
|
|
|
|
|
|
|
|
|
|
|
|
|
|
| Charge for the year |
|
|
|
|
5,724 |
|
|
|
6,664 |
|
|
|
7,500 |
|
| Adjustment in respect of prior years |
|
|
|
|
61 |
|
|
|
252 |
|
|
|
111 |
|
| |
|
|
|
|
5,785 |
|
|
|
6,916 |
|
|
|
7,611 |
|
| Deferred tax |
|
|
|
|
|
|
|
|
|
|
|
|
|
|
| Origination and reversal of temporary differences in the current year |
|
|
|
|
529 |
|
|
|
67 |
|
|
|
5,523 |
|
| Adjustment in respect of prior years |
|
|
|
|
149 |
|
|
|
(103 |
) |
|
|
(515 |
) |
| |
|
|
|
|
678 |
|
|
|
(36 |
) |
|
|
5,008 |
|
| Tax charge on profit |
|
|
|
|
6,463 |
|
|
|
6,880 |
|
|
|
12,619 |
|
In 2013, the total tax charge recognized within other comprehensive income was $1,374 million (2012 $270 million credit and 2011 $1,490
million credit), and the total tax credit recognized directly in equity was $33 million (2012 $6 million credit and 2011 $7 million credit). See Note 32 for further information.
Reconciliation of the effective tax rate
The
following table provides a reconciliation of the UK statutory corporation tax rate to the effective tax rate of the group on profit before taxation. With effect from 1 April 2013 the UK statutory corporation tax rate reduced from 24% to 23% on
profits arising from activities outside the North Sea.
|
|
|
|
|
|
|
|
|
|
|
|
|
|
|
| |
|
|
|
|
|
|
|
|
|
$ million |
|
| |
|
|
|
2013 |
|
|
2012 |
|
|
2011 |
|
| Profit before taxation |
|
|
|
|
30,221 |
|
|
|
18,131 |
|
|
|
38,228 |
|
| Tax charge on profit |
|
|
|
|
6,463 |
|
|
|
6,880 |
|
|
|
12,619 |
|
| Effective tax rate |
|
|
|
|
21% |
|
|
|
38% |
|
|
|
33% |
|
|
|
|
|
|
|
|
|
|
|
|
|
|
|
|
| |
|
|
|
|
% of profit before taxation |
|
| UK statutory corporation tax rate |
|
|
|
|
23 |
|
|
|
24 |
|
|
|
26 |
|
| Increase (decrease) resulting from |
|
|
|
|
|
|
|
|
|
|
|
|
|
|
| UK supplementary and overseas taxes at higher or lower ratesa |
|
|
|
|
4 |
|
|
|
12 |
|
|
|
14 |
|
| Tax reported in equity-accounted entities |
|
|
|
|
(2 |
) |
|
|
(5 |
) |
|
|
(3 |
) |
| Adjustments in respect of prior years |
|
|
|
|
1 |
|
|
|
1 |
|
|
|
(1 |
) |
| Movement in deferred tax not recognized |
|
|
|
|
2 |
|
|
|
2 |
|
|
|
– |
|
| Tax incentives for investment |
|
|
|
|
(2 |
) |
|
|
(2 |
) |
|
|
(1 |
) |
| Gulf of Mexico oil spill non-deductible costs |
|
|
|
|
– |
|
|
|
8 |
|
|
|
– |
|
| Permanent differences relating to disposalsb |
|
|
|
|
(8 |
) |
|
|
– |
|
|
|
(2 |
) |
| Foreign exchange |
|
|
|
|
2 |
|
|
|
(1 |
) |
|
|
1 |
|
| Other |
|
|
|
|
1 |
|
|
|
(1 |
) |
|
|
(1 |
) |
| Effective tax rate |
|
|
|
|
21 |
|
|
|
38 |
|
|
|
33 |
|
| a |
Jurisdictions which contribute significantly to this item are Angola, with an applicable statutory tax rate of 50%, the UK, currently with an applicable statutory tax
rate of 62% for North Sea activities, and Trinidad and Tobago, with an applicable statutory tax rate of 55%. |
| b |
For 2013, this relates to the non-taxable gain on disposal of our investment in TNK-BP; for 2011, this mainly relates to the sale of our Upstream interests in
Columbia. |
|
|
|
| 156 |
|
BP Annual Report and Form 20-F 2013 |
11. Taxation – continued
Deferred tax
|
|
|
|
|
|
|
|
|
|
|
|
|
|
|
|
|
|
|
|
|
|
|
| |
|
|
|
|
|
|
|
|
|
|
|
|
|
|
|
$ million |
|
| |
|
|
|
|
|
|
Income statement |
|
|
|
|
|
Balance sheet |
|
| |
|
|
|
2013 |
|
|
2012 |
|
|
2011 |
|
|
2013 |
|
|
2012 |
|
| Deferred tax liability |
|
|
|
|
|
|
|
|
|
|
|
|
|
|
|
|
|
|
|
|
|
|
| Depreciation |
|
|
|
|
(474 |
) |
|
|
(75 |
) |
|
|
4,774 |
|
|
|
31,551 |
|
|
|
32,065 |
|
| Pension plan surpluses |
|
|
|
|
(691 |
) |
|
|
– |
|
|
|
– |
|
|
|
284 |
|
|
|
– |
|
| Other taxable temporary differences |
|
|
|
|
(199 |
) |
|
|
(2,239 |
) |
|
|
141 |
|
|
|
3,653 |
|
|
|
3,671 |
|
| |
|
|
|
|
(1,364 |
) |
|
|
(2,314 |
) |
|
|
4,915 |
|
|
|
35,488 |
|
|
|
35,736 |
|
| Deferred tax asset |
|
|
|
|
|
|
|
|
|
|
|
|
|
|
|
|
|
|
|
|
|
|
| Pension plan and other post-retirement benefit plan deficits |
|
|
|
|
787 |
|
|
|
(33 |
) |
|
|
224 |
|
|
|
(2,026 |
) |
|
|
(3,421 |
) |
| Decommissioning, environmental and other provisions |
|
|
|
|
1,385 |
|
|
|
1,872 |
|
|
|
(1,443 |
) |
|
|
(11,301 |
) |
|
|
(12,705 |
) |
| Derivative financial instruments |
|
|
|
|
30 |
|
|
|
(7 |
) |
|
|
24 |
|
|
|
(579 |
) |
|
|
(281 |
) |
| Tax credits |
|
|
|
|
(174 |
) |
|
|
1,802 |
|
|
|
(401 |
) |
|
|
(888 |
) |
|
|
(714 |
) |
| Loss carry forward |
|
|
|
|
(343 |
) |
|
|
(911 |
) |
|
|
(223 |
) |
|
|
(2,585 |
) |
|
|
(2,214 |
) |
| Other deductible temporary differences |
|
|
|
|
357 |
|
|
|
(445 |
) |
|
|
1,912 |
|
|
|
(1,655 |
) |
|
|
(2,032 |
) |
| |
|
|
|
|
2,042 |
|
|
|
2,278 |
|
|
|
93 |
|
|
|
(19,034 |
) |
|
|
(21,367 |
) |
| Net deferred tax charge (credit) and net deferred tax liability |
|
|
|
|
678 |
|
|
|
(36 |
) |
|
|
5,008 |
|
|
|
16,454 |
|
|
|
14,369 |
|
| Of which – deferred tax liabilities |
|
|
|
|
|
|
|
|
|
|
|
|
|
|
|
|
17,439 |
|
|
|
15,243 |
|
| –
deferred tax assets |
|
|
|
|
|
|
|
|
|
|
|
|
|
|
|
|
985 |
|
|
|
874 |
|
|
|
|
|
|
|
|
|
|
|
|
| |
|
|
|
|
|
|
$ million |
|
| Analysis of movements during the year in the net deferred tax liability |
|
|
|
2013 |
|
|
2012 |
|
| At 1 January |
|
|
|
|
14,369 |
|
|
|
14,609 |
|
| Exchange adjustments |
|
|
|
|
43 |
|
|
|
(27 |
) |
| Charge (credit) for the year on profit |
|
|
|
|
678 |
|
|
|
(36 |
) |
| Charge (credit) for the year in other comprehensive income |
|
|
|
|
1,397 |
|
|
|
(272 |
) |
| Charge (credit) for the year in equity |
|
|
|
|
(33 |
) |
|
|
4 |
|
| Acquisitions |
|
|
|
|
– |
|
|
|
11 |
|
| Reclassified as assets/liabilities held for sale |
|
|
|
|
– |
|
|
|
48 |
|
| Deletions |
|
|
|
|
– |
|
|
|
32 |
|
| At 31 December |
|
|
|
|
16,454 |
|
|
|
14,369 |
|
A summary of temporary differences, unused tax credits and unused tax losses for which deferred tax has not been recognized is shown in
the table below.
|
|
|
|
|
|
|
|
|
|
|
| |
|
|
|
|
|
|
$ billion |
|
| At 31 December |
|
|
|
2013 |
|
|
2012 |
|
| Unused tax lossesa |
|
|
|
|
1.8 |
|
|
|
0.9 |
|
| Unused tax credits |
|
|
|
|
18.0 |
|
|
|
18.3 |
|
| of which – arising in the UKb |
|
|
|
|
16.3 |
|
|
|
16.0 |
|
| – arising in the USc |
|
|
|
|
1.7 |
|
|
|
2.3 |
|
| Other deductible temporary differencesd |
|
|
|
|
11.2 |
|
|
|
7.0 |
|
| Other taxable temporary differences associated with investments in subsidiaries and equity-accounted
entities |
|
|
|
|
0.5 |
|
|
|
0.5 |
|
| a |
Substantially all the tax losses have no fixed expiry date. |
| b |
The UK tax credits arise predominantly in overseas branches of UK entities based in jurisdictions with high tax rates. No deferred tax asset has been recognized on these tax credits as they are unlikely to have value in
the future; UK taxes on these overseas branches are largely mitigated by double tax relief on the overseas tax. These tax credits have no fixed expiry date. |
| c |
The US tax credits expire 10 years after generation and will all expire in the period 2015-2021. |
| d |
Other deductible temporary differences of $0.7 billion are expected to expire in the period 2014-2020, the remainder do not have an expiry date. |
|
|
|
|
|
|
|
|
|
|
|
|
|
|
|
| |
|
|
|
|
|
|
|
|
|
$ billion |
|
| Benefit of previously unrecognized deferred tax on current year tax charge |
|
|
|
2013 |
|
|
2012 |
|
|
2011 |
|
| Current tax benefit relating to the utilization of previously unrecognized tax losses |
|
|
|
|
– |
|
|
|
– |
|
|
|
0.1 |
|
| Current tax benefit relating to the utilization of previously unrecognized tax credits |
|
|
|
|
0.2 |
|
|
|
0.4 |
|
|
|
0.1 |
|
| Deferred tax benefit relating to the recognition of previously unrecognized tax credits |
|
|
|
|
0.2 |
|
|
|
0.1 |
|
|
|
– |
|
|
|
|
|
|
| BP Annual Report and Form 20-F 2013 |
|
|
157 |
|
12. Dividends
The quarterly dividend expected to be paid on 28 March 2014 in respect of the fourth quarter 2013 is 9.5 cents per ordinary share ($0.57 per American Depositary
Share (ADS)). The corresponding amount in sterling will be announced on 17 March 2014. A scrip dividend alternative is available, allowing shareholders to elect to receive their dividend in the form of new ordinary shares and ADS holders in the
form of new ADSs.
|
|
|
|
|
|
|
|
|
|
|
|
|
|
|
|
|
|
|
|
|
|
|
|
|
|
|
|
|
|
|
|
|
|
|
|
|
|
|
| |
|
|
|
|
|
|
Pence per share |
|
|
|
|
|
Cents per share |
|
|
|
|
|
|
|
|
$ million |
|
| |
|
|
|
2013 |
|
|
2012 |
|
|
2011 |
|
|
2013 |
|
|
2012 |
|
|
2011 |
|
|
2013 |
|
|
2012 |
|
|
2011 |
|
| Dividends announced and paid in cash |
|
|
|
|
|
|
|
|
|
|
|
|
|
|
|
|
|
|
|
|
|
|
|
|
|
|
|
|
|
|
|
|
|
|
|
|
|
|
| Preference shares |
|
|
|
|
|
|
|
|
|
|
|
|
|
|
|
|
|
|
|
|
|
|
|
|
|
|
|
|
2 |
|
|
|
2 |
|
|
|
2 |
|
| Ordinary shares |
|
|
|
|
|
|
|
|
|
|
|
|
|
|
|
|
|
|
|
|
|
|
|
|
|
|
|
|
|
|
|
|
|
|
|
|
|
|
| March |
|
|
|
|
6.0013 |
|
|
|
5.0958 |
|
|
|
4.3372 |
|
|
|
9.0 |
|
|
|
8.0 |
|
|
|
7.0 |
|
|
|
1,621 |
|
|
|
1,211 |
|
|
|
808 |
|
| June |
|
|
|
|
5.8342 |
|
|
|
5.1498 |
|
|
|
4.2809 |
|
|
|
9.0 |
|
|
|
8.0 |
|
|
|
7.0 |
|
|
|
1,399 |
|
|
|
1,448 |
|
|
|
794 |
|
| September |
|
|
|
|
5.7630 |
|
|
|
5.0171 |
|
|
|
4.3160 |
|
|
|
9.0 |
|
|
|
8.0 |
|
|
|
7.0 |
|
|
|
1,245 |
|
|
|
1,417 |
|
|
|
1,224 |
|
| December |
|
|
|
|
5.8008 |
|
|
|
5.5890 |
|
|
|
4.4694 |
|
|
|
9.5 |
|
|
|
9.0 |
|
|
|
7.0 |
|
|
|
1,174 |
|
|
|
1,216 |
|
|
|
1,244 |
|
| |
|
|
|
|
23.3993 |
|
|
|
20.8517 |
|
|
|
17.4035 |
|
|
|
36.5 |
|
|
|
33.0 |
|
|
|
28.0 |
|
|
|
5,441 |
|
|
|
5,294 |
|
|
|
4,072 |
|
| Dividend announced, payable in March 2014 |
|
|
|
|
|
|
|
|
|
|
|
|
|
|
|
|
9.5 |
|
|
|
|
|
|
|
|
|
|
|
1,733 |
|
|
|
|
|
|
|
|
|
The details of the scrip dividends issued are shown in the table below.
|
|
|
|
|
|
|
|
|
|
|
|
|
|
|
| |
|
|
|
2013 |
|
|
2012 |
|
|
2011 |
|
| Number of shares issued (thousand) |
|
|
|
|
202,124 |
|
|
|
138,406 |
|
|
|
165,601 |
|
| Value of shares issued ($ million) |
|
|
|
|
1,470 |
|
|
|
982 |
|
|
|
1,219 |
|
The financial statements for the year ended 31 December 2013 do not reflect the dividend announced on 4 February 2014 and
expected to be paid in March 2014; this will be treated as an appropriation of profit in the year ended 31
December 2014.
13. Earnings per ordinary share
|
|
|
|
|
|
|
|
|
|
|
|
|
|
|
| |
|
|
|
|
|
|
|
|
|
Cents per share |
|
| |
|
|
|
2013 |
|
|
2012 |
|
|
2011 |
|
| Basic earnings per share |
|
|
|
|
123.87 |
|
|
|
57.89 |
|
|
|
133.35 |
|
| Diluted earnings per share |
|
|
|
|
123.12 |
|
|
|
57.50 |
|
|
|
131.74 |
|
Basic earnings per ordinary share amounts are calculated by dividing the profit for the year attributable to ordinary shareholders by the
weighted average number of ordinary shares outstanding during the year. The average number of shares outstanding excludes treasury shares and the shares held by the Employee Share Ownership Plan trusts (ESOPs) and includes certain shares that will
be issuable in the future under employee share-based payment plans.
For the diluted earnings per share calculation, the weighted average number of shares outstanding
during the year is adjusted for the dilutive effect of shares that are potentially issuable in connection with employee share-based payment plans using the treasury stock method.
|
|
|
|
|
|
|
|
|
|
|
|
|
|
|
| |
|
|
|
|
|
|
|
|
|
$ million |
|
| |
|
|
|
2013 |
|
|
2012 |
|
|
2011 |
|
| Profit attributable to BP shareholders |
|
|
|
|
23,451 |
|
|
|
11,017 |
|
|
|
25,212 |
|
| Less: dividend requirements on preference shares |
|
|
|
|
2 |
|
|
|
2 |
|
|
|
2 |
|
| Profit for the year attributable to BP ordinary shareholders |
|
|
|
|
23,449 |
|
|
|
11,015 |
|
|
|
25,210 |
|
|
|
|
|
|
|
|
|
|
|
|
|
|
|
|
| |
|
|
|
|
|
|
Shares thousand |
|
| |
|
|
|
2013 |
|
|
2012 |
|
|
2011 |
|
| Basic weighted average number of ordinary shares |
|
|
|
|
18,931,021 |
|
|
|
19,027,929 |
|
|
|
18,904,812 |
|
| Potential dilutive effect of ordinary shares issuable under employee share-based payment plans |
|
|
|
|
115,152 |
|
|
|
129,959 |
|
|
|
231,388 |
|
| |
|
|
|
|
19,046,173 |
|
|
|
19,157,888 |
|
|
|
19,136,200 |
|
The number of ordinary shares outstanding at 31 December 2013, excluding treasury shares and the shares held by the ESOPs, and
including certain shares that will be issuable in the future under employee share-based payment plans was 18,611,489,958. Between 31 December 2013 and 18 February 2014, the latest practicable date before the completion of these financial
statements, there was a net decrease of 171,061,543 in the number of ordinary shares outstanding as a result of share issues in relation to employee share-based payment plans. During the same period, the group repurchased 195 million of its own
ordinary shares as part of the share repurchase programme announced on 22 March 2013.
Employee share-based payment plans
The group operates share and share option plans for directors and certain employees to obtain ordinary shares and ADSs in the company. Information on
these plans for directors is shown in the Directors remuneration report on page 81.
|
|
|
| 158 |
|
BP Annual Report and Form 20-F 2013 |
13. Earnings per ordinary share – continued
The following table shows the number of shares potentially issuable under employee share option plans, including the
number of options outstanding, the number of options exercisable at the end of each year, and the corresponding weighted average exercise prices. The dilutive effect of the employee share option plans at 31 December included in the diluted
earnings per share is also shown.
|
|
|
|
|
|
|
|
|
|
|
|
|
|
|
|
|
|
|
| Share options |
|
|
|
|
|
|
2013 |
|
|
|
|
|
2012 |
|
| |
|
|
|
Number of
optionsa b thousand |
|
|
Weighted
average
exercise
price $ |
|
|
Number of
optionsa b thousand |
|
|
Weighted
average
exercise
price $ |
|
| Outstanding |
|
|
|
|
286,725 |
|
|
|
7.71 |
|
|
|
324,096 |
|
|
|
7.62 |
|
| Exercisable |
|
|
|
|
127,290 |
|
|
|
10.01 |
|
|
|
159,419 |
|
|
|
9.33 |
|
| Dilutive effect |
|
|
|
|
23,169 |
|
|
|
n/a |
|
|
|
16,435 |
|
|
|
n/a |
|
| a |
Numbers of options shown are ordinary share equivalents (one ADS is equivalent to six ordinary shares). |
| b |
At 31 December 2013, the quoted market price of one BP ordinary share was $8.10 (2012 $6.94). |
In addition, the group
operates a number of equity-settled employee share plans under which share units are granted to the group’s senior leaders and certain other employees. These plans typically have a three-year performance or restricted period during which the
units accrue net notional dividends which are treated as having been reinvested. Leaving employment will normally preclude the conversion of units into shares, but special arrangements apply for participants that leave for qualifying reasons. The
number of shares that are expected to vest each year under employee share plans are shown in the table below. The dilutive effect of the employee share plans at 31 December included in the diluted earnings per share is also shown.
|
|
|
|
|
|
|
|
|
|
|
| Shares |
|
|
|
2013 |
|
|
2012 |
|
| Vesting |
|
|
|
Number of
sharesa thousand |
|
|
Number of
sharesa thousand |
|
| Within one year |
|
|
|
|
35,442 |
|
|
|
29,138 |
|
| 1 to 2 years |
|
|
|
|
120,056 |
|
|
|
67,593 |
|
| 2 to 3 years |
|
|
|
|
115,387 |
|
|
|
120,621 |
|
| 3 to 4 years |
|
|
|
|
14,231 |
|
|
|
25,066 |
|
| 4 to 5 years |
|
|
|
|
123 |
|
|
|
233 |
|
| |
|
|
|
|
285,239 |
|
|
|
242,651 |
|
| Dilutive effect |
|
|
|
|
95,014 |
|
|
|
95,683 |
|
| a |
Numbers of shares shown are ordinary share equivalents (one ADS is equivalent to six ordinary shares). |
There has been a
net decrease of 32,378,757 in the number of potential ordinary shares in relation to employee share-based payment plans between 31 December 2013 and 18 February 2014.
|
|
|
|
|
| BP Annual Report and Form 20-F 2013 |
|
|
159 |
|
14. Property, plant and equipment
|
|
|
|
|
|
|
|
|
|
|
|
|
|
|
|
|
|
|
|
|
|
|
|
|
|
|
|
|
|
|
|
|
|
|
| |
|
|
|
$ million |
|
| |
|
|
|
Land
and land
improvements |
|
|
Buildings |
|
|
Oil and
gas
properties |
|
|
Plant,
machinery
and
equipment |
|
|
Fixtures,
fittings
and office
equipment |
|
|
Transportation |
|
|
Oil depots,
storage
tanks and
service
stations |
|
|
Total |
|
| Cost |
|
|
|
|
|
|
|
|
|
|
|
|
|
|
|
|
|
|
|
|
|
|
|
|
|
|
|
|
|
|
|
|
|
|
| At 1 January 2013 |
|
|
|
|
3,279 |
|
|
|
2,812 |
|
|
|
171,772 |
|
|
|
45,200 |
|
|
|
3,346 |
|
|
|
13,436 |
|
|
|
9,059 |
|
|
|
248,904 |
|
| Exchange adjustments |
|
|
|
|
(4 |
) |
|
|
(26 |
) |
|
|
– |
|
|
|
(235 |
) |
|
|
5 |
|
|
|
(55 |
) |
|
|
(36 |
) |
|
|
(351 |
) |
| Additions |
|
|
|
|
120 |
|
|
|
286 |
|
|
|
14,272 |
|
|
|
4,386 |
|
|
|
299 |
|
|
|
51 |
|
|
|
625 |
|
|
|
20,039 |
|
| Acquisitions |
|
|
|
|
– |
|
|
|
– |
|
|
|
– |
|
|
|
8 |
|
|
|
– |
|
|
|
– |
|
|
|
– |
|
|
|
8 |
|
| Transfers |
|
|
|
|
– |
|
|
|
– |
|
|
|
4,365 |
|
|
|
– |
|
|
|
– |
|
|
|
– |
|
|
|
– |
|
|
|
4,365 |
|
| Deletions |
|
|
|
|
(20 |
) |
|
|
(45 |
) |
|
|
(2,718 |
) |
|
|
(447 |
) |
|
|
(474 |
) |
|
|
(118 |
) |
|
|
(257 |
) |
|
|
(4,079 |
) |
| At 31 December 2013 |
|
|
|
|
3,375 |
|
|
|
3,027 |
|
|
|
187,691 |
|
|
|
48,912 |
|
|
|
3,176 |
|
|
|
13,314 |
|
|
|
9,391 |
|
|
|
268,886 |
|
| Depreciation |
|
|
|
|
|
|
|
|
|
|
|
|
|
|
|
|
|
|
|
|
|
|
|
|
|
|
|
|
|
|
|
|
|
|
| At 1 January 2013 |
|
|
|
|
514 |
|
|
|
1,023 |
|
|
|
87,965 |
|
|
|
18,628 |
|
|
|
2,119 |
|
|
|
8,409 |
|
|
|
4,915 |
|
|
|
123,573 |
|
| Exchange adjustments |
|
|
|
|
(6 |
) |
|
|
(1 |
) |
|
|
– |
|
|
|
(61 |
) |
|
|
7 |
|
|
|
(28 |
) |
|
|
(7 |
) |
|
|
(96 |
) |
| Charge for the year |
|
|
|
|
37 |
|
|
|
129 |
|
|
|
10,334 |
|
|
|
1,616 |
|
|
|
278 |
|
|
|
347 |
|
|
|
502 |
|
|
|
13,243 |
|
| Impairment losses |
|
|
|
|
10 |
|
|
|
20 |
|
|
|
611 |
|
|
|
525 |
|
|
|
– |
|
|
|
160 |
|
|
|
35 |
|
|
|
1,361 |
|
| Impairment reversals |
|
|
|
|
– |
|
|
|
– |
|
|
|
(209 |
) |
|
|
– |
|
|
|
– |
|
|
|
(17 |
) |
|
|
– |
|
|
|
(226 |
) |
| Transfers |
|
|
|
|
– |
|
|
|
– |
|
|
|
365 |
|
|
|
– |
|
|
|
– |
|
|
|
– |
|
|
|
– |
|
|
|
365 |
|
| Deletions |
|
|
|
|
(5 |
) |
|
|
(30 |
) |
|
|
(2,003 |
) |
|
|
(330 |
) |
|
|
(434 |
) |
|
|
(38 |
) |
|
|
(184 |
) |
|
|
(3,024 |
) |
| At 31 December 2013 |
|
|
|
|
550 |
|
|
|
1,141 |
|
|
|
97,063 |
|
|
|
20,378 |
|
|
|
1,970 |
|
|
|
8,833 |
|
|
|
5,261 |
|
|
|
135,196 |
|
| Net book amount at 31 December 2013 |
|
|
|
|
2,825 |
|
|
|
1,886 |
|
|
|
90,628 |
|
|
|
28,534 |
|
|
|
1,206 |
|
|
|
4,481 |
|
|
|
4,130 |
|
|
|
133,690 |
|
| Cost |
|
|
|
|
|
|
|
|
|
|
|
|
|
|
|
|
|
|
|
|
|
|
|
|
|
|
|
|
|
|
|
|
|
|
| At 1 January 2012 |
|
|
|
|
3,169 |
|
|
|
2,942 |
|
|
|
176,988 |
|
|
|
41,319 |
|
|
|
3,140 |
|
|
|
12,753 |
|
|
|
8,611 |
|
|
|
248,922 |
|
| Exchange adjustments |
|
|
|
|
86 |
|
|
|
14 |
|
|
|
– |
|
|
|
320 |
|
|
|
28 |
|
|
|
8 |
|
|
|
272 |
|
|
|
728 |
|
| Additions |
|
|
|
|
120 |
|
|
|
387 |
|
|
|
16,303 |
|
|
|
4,481 |
|
|
|
314 |
|
|
|
902 |
|
|
|
533 |
|
|
|
23,040 |
|
| Acquisitions |
|
|
|
|
– |
|
|
|
– |
|
|
|
44 |
|
|
|
2 |
|
|
|
– |
|
|
|
15 |
|
|
|
– |
|
|
|
61 |
|
| Transfers |
|
|
|
|
– |
|
|
|
– |
|
|
|
1,306 |
|
|
|
– |
|
|
|
– |
|
|
|
– |
|
|
|
– |
|
|
|
1,306 |
|
| Reclassified as assets held for sale |
|
|
|
|
– |
|
|
|
– |
|
|
|
(19,410 |
) |
|
|
(143 |
) |
|
|
– |
|
|
|
(172 |
) |
|
|
(2 |
) |
|
|
(19,727 |
) |
| Deletions |
|
|
|
|
(96 |
) |
|
|
(531 |
) |
|
|
(3,459 |
) |
|
|
(779 |
) |
|
|
(136 |
) |
|
|
(70 |
) |
|
|
(355 |
) |
|
|
(5,426 |
) |
| At 31 December 2012 |
|
|
|
|
3,279 |
|
|
|
2,812 |
|
|
|
171,772 |
|
|
|
45,200 |
|
|
|
3,346 |
|
|
|
13,436 |
|
|
|
9,059 |
|
|
|
248,904 |
|
| Depreciation |
|
|
|
|
|
|
|
|
|
|
|
|
|
|
|
|
|
|
|
|
|
|
|
|
|
|
|
|
|
|
|
|
|
|
| At 1 January 2012 |
|
|
|
|
511 |
|
|
|
1,411 |
|
|
|
91,994 |
|
|
|
16,915 |
|
|
|
1,940 |
|
|
|
8,149 |
|
|
|
4,571 |
|
|
|
125,491 |
|
| Exchange adjustments |
|
|
|
|
8 |
|
|
|
13 |
|
|
|
– |
|
|
|
228 |
|
|
|
25 |
|
|
|
6 |
|
|
|
151 |
|
|
|
431 |
|
| Charge for the year |
|
|
|
|
33 |
|
|
|
123 |
|
|
|
9,659 |
|
|
|
1,442 |
|
|
|
289 |
|
|
|
320 |
|
|
|
504 |
|
|
|
12,370 |
|
| Impairment losses |
|
|
|
|
8 |
|
|
|
– |
|
|
|
2,765 |
|
|
|
493 |
|
|
|
– |
|
|
|
70 |
|
|
|
7 |
|
|
|
3,343 |
|
| Impairment reversals |
|
|
|
|
– |
|
|
|
– |
|
|
|
(221 |
) |
|
|
– |
|
|
|
– |
|
|
|
– |
|
|
|
(1 |
) |
|
|
(222 |
) |
| Reclassified as assets held for sale |
|
|
|
|
– |
|
|
|
– |
|
|
|
(13,774 |
) |
|
|
(36 |
) |
|
|
– |
|
|
|
(126 |
) |
|
|
(2 |
) |
|
|
(13,938 |
) |
| Deletions |
|
|
|
|
(46 |
) |
|
|
(524 |
) |
|
|
(2,458 |
) |
|
|
(414 |
) |
|
|
(135 |
) |
|
|
(10 |
) |
|
|
(315 |
) |
|
|
(3,902 |
) |
| At 31 December 2012 |
|
|
|
|
514 |
|
|
|
1,023 |
|
|
|
87,965 |
|
|
|
18,628 |
|
|
|
2,119 |
|
|
|
8,409 |
|
|
|
4,915 |
|
|
|
123,573 |
|
| Net book amount at 31 December 2012 |
|
|
|
|
2,765 |
|
|
|
1,789 |
|
|
|
83,807 |
|
|
|
26,572 |
|
|
|
1,227 |
|
|
|
5,027 |
|
|
|
4,144 |
|
|
|
125,331 |
|
| Net book amount at 1 January 2012 |
|
|
|
|
2,658 |
|
|
|
1,531 |
|
|
|
84,994 |
|
|
|
24,404 |
|
|
|
1,200 |
|
|
|
4,604 |
|
|
|
4,040 |
|
|
|
123,431 |
|
|
|
|
|
|
|
|
|
|
|
|
|
|
|
|
|
|
|
|
|
|
|
|
|
|
|
|
|
|
|
|
|
|
|
|
| Assets held under finance leases at net book amount included above |
|
|
|
|
|
|
|
|
|
|
|
|
|
|
|
|
|
|
|
|
|
|
|
|
|
|
|
|
|
|
|
|
|
|
| At 31 December 2013 |
|
|
|
|
– |
|
|
|
7 |
|
|
|
187 |
|
|
|
265 |
|
|
|
– |
|
|
|
4 |
|
|
|
– |
|
|
|
463 |
|
| At 31 December 2012 |
|
|
|
|
– |
|
|
|
9 |
|
|
|
157 |
|
|
|
254 |
|
|
|
– |
|
|
|
9 |
|
|
|
– |
|
|
|
429 |
|
| Assets under construction included above |
|
|
|
|
|
|
|
|
|
|
|
|
|
|
|
|
|
|
|
|
|
|
|
|
|
|
|
|
|
|
|
|
|
|
| At 31 December 2013 |
|
|
|
|
|
|
|
|
|
|
|
|
|
|
|
|
|
|
|
|
|
|
|
|
|
|
|
|
|
|
|
|
27,900 |
|
| At 31 December 2012 |
|
|
|
|
|
|
|
|
|
|
|
|
|
|
|
|
|
|
|
|
|
|
|
|
|
|
|
|
|
|
|
|
29,203 |
|
|
|
|
| 160 |
|
BP Annual Report and Form 20-F 2013 |
15. Goodwill and impairment review of goodwill
|
|
|
|
|
|
|
|
|
|
|
| |
|
|
|
|
|
|
$ million |
|
| |
|
|
|
2013 |
|
|
2012 |
|
| Cost |
|
|
|
|
|
|
|
|
|
|
| At 1 January |
|
|
|
|
12,804 |
|
|
|
14,041 |
|
| Exchange adjustments |
|
|
|
|
46 |
|
|
|
160 |
|
| Acquisitions |
|
|
|
|
44 |
|
|
|
25 |
|
| Reclassified as assets held for sale |
|
|
|
|
– |
|
|
|
(1,327 |
) |
| Deletions |
|
|
|
|
(43 |
) |
|
|
(95 |
) |
| At 31 December |
|
|
|
|
12,851 |
|
|
|
12,804 |
|
| Impairment losses |
|
|
|
|
|
|
|
|
|
|
| At 1 January |
|
|
|
|
614 |
|
|
|
1,612 |
|
| Impairment losses for the year |
|
|
|
|
56 |
|
|
|
– |
|
| Reclassified as assets held for sale |
|
|
|
|
– |
|
|
|
(977 |
) |
| Deletions |
|
|
|
|
– |
|
|
|
(21 |
) |
| At 31 December |
|
|
|
|
670 |
|
|
|
614 |
|
| Net book amount at 31 December |
|
|
|
|
12,181 |
|
|
|
12,190 |
|
| Net book amount at 1 January |
|
|
|
|
12,190 |
|
|
|
12,429 |
|
Impairment review of goodwill
|
|
|
|
|
|
|
|
|
|
|
| |
|
|
|
|
|
|
$ million |
|
| Goodwill at 31 December |
|
|
|
2013 |
|
|
2012 |
|
| Upstream |
|
|
|
|
7,812 |
|
|
|
7,862 |
|
| Downstream |
|
|
|
|
4,277 |
|
|
|
4,168 |
|
| Other businesses and corporate |
|
|
|
|
92 |
|
|
|
160 |
|
| |
|
|
|
|
12,181 |
|
|
|
12,190 |
|
Goodwill acquired through business combinations has been allocated to groups of cash-generating units that are expected to benefit from
the synergies of the acquisition. For Upstream, goodwill is allocated to all oil and gas assets in aggregate at the segment level. For Downstream, goodwill has been allocated to the Rhine fuels value chain (FVC), Lubricants and Other.
In assessing whether goodwill has been impaired, the carrying amount of the cash-generating unit (CGU) or groups of CGUs (including goodwill) is compared with the
recoverable amount of the CGU or groups of CGUs. The recoverable amount is the higher of fair value less costs to sell and value in use. In the absence of readily available information about the fair value of a cash-generating unit, the recoverable
amount is deemed to be the value in use for the purposes of performing an impairment test of goodwill, unless this would lead to an impairment loss. If goodwill would be impaired using value in use as the recoverable amount, a fair value less costs
to sell assessment would be performed as this may lead to a higher recoverable amount.
The group calculates the value in use using a discounted cash flow model. The
future cash flows are adjusted for risks specific to the cash-generating unit and are discounted using a pre-tax discount rate. The discount rate is derived from the group’s post-tax weighted average cost of capital and is adjusted where
applicable to take into account any specific risks relating to the country where the cash-generating unit is located. The rate to be applied to each country is reassessed each year. Discount rates of 12% and 14% have been used for goodwill
impairment calculations performed in 2013 (2012 12% and 14%).
The business segment plans, which are approved on an annual basis by senior management, are the primary
source of information for the determination of value in use. They contain forecasts for oil and natural gas production, refinery throughputs, sales volumes for various types of refined products (e.g. gasoline and lubricants), revenues, costs and
capital expenditure. As an initial step in the preparation of these plans, various environmental assumptions, such as oil prices, natural gas prices, refining margins, refined product margins and cost inflation rates, are set by senior management.
These environmental assumptions take account of existing prices, global supply-demand equilibrium for oil and natural gas, other macroeconomic factors and historical trends and variability.
Upstream
|
|
|
|
|
|
|
|
|
|
|
| |
|
|
|
|
|
|
$ million |
|
| |
|
|
|
2013 |
|
|
2012 |
|
| Goodwill |
|
|
|
|
7,812 |
|
|
|
7,862 |
|
| Excess of recoverable amount over carrying amount |
|
|
|
|
6,811 |
|
|
|
25,871 |
|
The table above shows the carrying amount of the goodwill for the segment and the excess of the recoverable amount, based upon a value in
use calculation, over the carrying amount (the headroom).
The value in use is based on the cash flows expected to be generated by the projected oil or natural gas
production profiles up to the expected dates of cessation of production of each producing field, based on current estimates of reserves. As the production profile and related cash flows can be estimated from BP’s past experience, management
believes that the cash flows generated over the estimated life of field is the appropriate basis upon which to assess goodwill and individual assets for impairment. The date of cessation of production depends on the interaction of a number of
variables, such as the recoverable quantities of hydrocarbons, the production profile of the hydrocarbons, the cost of the development of the infrastructure necessary to recover the hydrocarbons, the production costs, the contractual duration of the
production concession and the selling price of the hydrocarbons produced. As each producing field has specific reservoir characteristics and economic circumstances, the cash flows of the fields are computed using appropriate individual economic
models and key assumptions agreed by BP’s management. Capital expenditure, operating costs and expected hydrocarbon production profiles up to 2023 are derived from the business segment plan. Estimated production volumes and cash flows up to the
date of cessation of production on a field-by-field basis are developed to be consistent with this. The production profiles used are consistent with the reserve volumes approved as part of BP’s centrally controlled process for the estimation of
proved and probable reserves and total resources.
|
|
|
|
|
| BP Annual Report and Form 20-F 2013 |
|
|
161 |
|
15. Goodwill and impairment review of goodwill – continued
Intangible assets are deemed to have a recoverable amount equal to their carrying amount. Consistent with prior years, the 2013 review for impairment was carried out during the fourth quarter.
The Brent oil price and Henry Hub natural gas price assumptions used in the impairment review of goodwill are shown in the table below.
|
|
|
|
|
|
|
|
|
|
|
|
|
|
|
|
|
|
|
|
|
|
|
|
|
|
|
| |
|
|
|
|
|
|
|
|
|
|
|
|
|
|
|
|
|
|
2013 |
|
| |
|
|
|
2014 |
|
|
2015 |
|
|
2016 |
|
|
2017 |
|
|
2018 |
|
|
2019 and
thereafter |
|
| Brent oil price ($/bbl) |
|
|
|
|
108 |
|
|
|
102 |
|
|
|
97 |
|
|
|
93 |
|
|
|
90 |
|
|
|
90 |
|
| Henry Hub natural gas price ($/mmBtu) |
|
|
|
|
3.86 |
|
|
|
4.02 |
|
|
|
4.10 |
|
|
|
4.17 |
|
|
|
4.27 |
|
|
|
6.50 |
|
| |
|
|
|
|
|
|
|
|
|
|
|
|
|
|
|
|
|
|
|
|
|
|
|
|
|
|
| |
|
|
|
|
|
|
|
|
|
|
|
|
|
|
|
|
|
|
2012 |
|
| |
|
|
|
2013 |
|
|
2014 |
|
|
2015 |
|
|
2016 |
|
|
2017 |
|
|
2018 and
thereafter |
|
| Brent oil price ($/bbl) |
|
|
|
|
105 |
|
|
|
100 |
|
|
|
96 |
|
|
|
93 |
|
|
|
91 |
|
|
|
90 |
|
| Henry Hub natural gas price ($/mmBtu) |
|
|
|
|
3.96 |
|
|
|
4.25 |
|
|
|
4.42 |
|
|
|
4.61 |
|
|
|
4.82 |
|
|
|
6.50 |
|
Key assumptions for oil and gas prices for the first five years were derived from forward price curves in the fourth quarter. Prices in
2019 and beyond were determined using long-term views of global supply and demand, building upon past experience of the industry and using information from external sources. These prices were adjusted to arrive at appropriate consistent price
assumptions for different qualities of oil and gas, or where appropriate, contracted oil and gas prices were applied.
The key assumptions required for the
value-in-use estimation are the oil and natural gas prices, production volumes and the discount rate. The sensitivity of the headroom to changes in the key assumptions was estimated. Due to the non-linear relationship of different variables, the
calculations were performed using a number of simplifying assumptions, including assuming a change to the variable being tested only, therefore a detailed calculation at any given price may produce a different result.
It is estimated that if the oil price assumption for all future years was approximately equal to the current assumption for 2019 and beyond, this would cause the
recoverable amount to be equal to the carrying amount of goodwill and related non-current assets of the segment. It is estimated that if the price assumption for natural gas was around 24% lower than the current assumption for 2019 and beyond the
headroom would be reduced to zero.
Estimated production volumes are based on detailed data for each field and take into account development plans agreed by
management as part of the long-term planning process. The average production for the purposes of goodwill impairment testing over the next 15 years is 597mmboe per year (2012 576mmboe per year). It is estimated that if this production
volume were to be reduced by around 2% for the whole period, this would cause the recoverable amount to be equal to the carrying amount of goodwill and related non-current assets of the segment.
It is estimated that if the discount rate was approximately 14% for the entire portfolio this would cause the recoverable amount to be equal to the carrying amount of
goodwill and related non-current assets of the segment.
Downstream
|
|
|
|
|
|
|
|
|
|
|
|
|
|
|
|
|
|
|
|
|
|
|
|
|
|
|
|
|
|
|
|
|
|
|
| |
|
|
|
|
|
|
|
|
|
|
|
|
|
|
|
|
|
|
|
|
|
|
|
|
$ million |
|
| |
|
|
|
|
|
|
|
|
|
|
|
|
2013 |
|
|
|
|
|
|
|
|
|
|
|
2012 |
|
| |
|
|
|
Rhine FVC |
|
|
Lubricants |
|
|
Other |
|
|
Total |
|
|
Rhine FVC |
|
|
Lubricants |
|
|
Other |
|
|
Total |
|
| Goodwill |
|
|
|
|
643 |
|
|
|
3,518 |
|
|
|
116 |
|
|
|
4,277 |
|
|
|
627 |
|
|
|
3,441 |
|
|
|
100 |
|
|
|
4,168 |
|
| Excess of recoverable amount over carrying amount |
|
|
|
|
2,759 |
|
|
|
n/a |
|
|
|
n/a |
|
|
|
n/a |
|
|
|
2,411 |
|
|
|
n/a |
|
|
|
n/a |
|
|
|
n/a |
|
Cash flows for each cash-generating unit are derived from the business segment plans, which cover a period of two to five years. To
determine the value in use for each of the cash-generating units, cash flows for a period of 10 years are discounted and aggregated with a terminal value.
Rhine FVC
The key assumptions to which the calculation of value in use for the Rhine FVC is most sensitive are refinery gross margins,
throughput volumes and discount rate. Gross margin assumptions used in the Rhine FVC plan are consistent with those used to develop the regional Refining Marker Margin (RMM). The average values assigned to the regional RMM and refinery throughput
volume over the plan period are $12.35 per barrel and 250mmbbl per year (2012 $12.30 per barrel and 246mmbbl per year). These values reflect past experience and are consistent with external sources. Cash flows beyond the five-year plan
period are extrapolated using a nominal 4% growth rate (2012 4%).
No reasonably possible change in the discount rate would cause the Rhine FVC unit’s carrying
amount to exceed its recoverable amount. It is estimated that if the refinery margin assumption was $1.9 per barrel lower than the current assumption, the recoverable amount would equal the carrying amount. It is also estimated that if the refinery
throughput volume assumption was 32mmbbl per year lower than the current assumption, the recoverable amount would equal the carrying amount.
Lubricants
In certain circumstances IAS 36 allows the use
of the most recent detailed calculations of the recoverable amount performed in an earlier period as the basis for the current year’s goodwill impairment test. The most recent detailed calculation of the Lubricants unit’s recoverable
amount was performed in 2009 and this was used as the basis for the tests in 2010-2012 as the criteria of IAS 36 were met in each of those years. IAS 36 does not specify for how many years such an approach is appropriate and management determined
that a re-performance of the test was appropriate in 2013 given the passage of time since 2009. There was no significant change in the outcome of this test compared to that in 2009.
The key assumptions to which the calculation of the value in use for the Lubricants unit is most sensitive are operating margins, sales volumes, and discount rate.
Operating margin and sales volumes assumptions used in the detailed impairment review of goodwill calculation are consistent with the assumptions used in the Lubricant unit’s business plan and values assigned to these key assumptions reflect
past experience. No reasonably possible change in any of these key assumptions would cause the unit’s carrying amount to exceed its recoverable amount. Cash flows beyond the plan period are extrapolated using a 3% growth rate (2009 3%).
|
|
|
| 162 |
|
BP Annual Report and Form 20-F 2013 |
16. Intangible assets
|
|
|
|
|
|
|
|
|
|
|
|
|
|
|
|
|
|
|
|
|
|
|
|
|
|
|
| |
|
|
|
$ million |
|
| |
|
|
|
|
|
|
|
|
|
2013 |
|
|
|
|
|
|
|
|
2012 |
|
| |
|
|
|
Exploration
and appraisal
expenditure |
|
|
Other
intangibles |
|
|
Total |
|
|
Exploration
and appraisal
expenditure |
|
|
Other
intangibles |
|
|
Total |
|
| Cost |
|
|
|
|
|
|
|
|
|
|
|
|
|
|
|
|
|
|
|
|
|
|
|
|
|
|
| At 1 January |
|
|
|
|
24,511 |
|
|
|
3,739 |
|
|
|
28,250 |
|
|
|
21,216 |
|
|
|
3,500 |
|
|
|
24,716 |
|
| Exchange adjustments |
|
|
|
|
– |
|
|
|
(5 |
) |
|
|
(5 |
) |
|
|
– |
|
|
|
50 |
|
|
|
50 |
|
| Acquisitions |
|
|
|
|
– |
|
|
|
– |
|
|
|
– |
|
|
|
(68 |
) |
|
|
80 |
|
|
|
12 |
|
| Additions |
|
|
|
|
4,464 |
|
|
|
336 |
|
|
|
4,800 |
|
|
|
5,244 |
|
|
|
343 |
|
|
|
5,587 |
|
| Transfers |
|
|
|
|
(4,365 |
) |
|
|
– |
|
|
|
(4,365 |
) |
|
|
(1,306 |
) |
|
|
– |
|
|
|
(1,306 |
) |
| Reclassified as assets held for sale |
|
|
|
|
– |
|
|
|
– |
|
|
|
– |
|
|
|
(67 |
) |
|
|
(26 |
) |
|
|
(93 |
) |
| Deletions |
|
|
|
|
(2,868 |
) |
|
|
(134 |
) |
|
|
(3,002 |
) |
|
|
(508 |
) |
|
|
(208 |
) |
|
|
(716 |
) |
| At 31 December |
|
|
|
|
21,742 |
|
|
|
3,936 |
|
|
|
25,678 |
|
|
|
24,511 |
|
|
|
3,739 |
|
|
|
28,250 |
|
| Amortization |
|
|
|
|
|
|
|
|
|
|
|
|
|
|
|
|
|
|
|
|
|
|
|
|
|
|
| At 1 January |
|
|
|
|
1,077 |
|
|
|
2,541 |
|
|
|
3,618 |
|
|
|
783 |
|
|
|
2,280 |
|
|
|
3,063 |
|
| Exchange adjustments |
|
|
|
|
– |
|
|
|
(2 |
) |
|
|
(2 |
) |
|
|
– |
|
|
|
25 |
|
|
|
25 |
|
| Charge for the year |
|
|
|
|
2,710 |
|
|
|
267 |
|
|
|
2,977 |
|
|
|
745 |
|
|
|
317 |
|
|
|
1,062 |
|
| Impairment losses |
|
|
|
|
253 |
|
|
|
85 |
|
|
|
338 |
|
|
|
– |
|
|
|
126 |
|
|
|
126 |
|
| Impairment reversals |
|
|
|
|
– |
|
|
|
– |
|
|
|
– |
|
|
|
(42 |
) |
|
|
– |
|
|
|
(42 |
) |
| Transfers |
|
|
|
|
(365 |
) |
|
|
– |
|
|
|
(365 |
) |
|
|
– |
|
|
|
– |
|
|
|
– |
|
| Reclassified as assets held for sale |
|
|
|
|
– |
|
|
|
– |
|
|
|
– |
|
|
|
– |
|
|
|
(21 |
) |
|
|
(21 |
) |
| Deletions |
|
|
|
|
(2,798 |
) |
|
|
(129 |
) |
|
|
(2,927 |
) |
|
|
(409 |
) |
|
|
(186 |
) |
|
|
(595 |
) |
| At 31 December |
|
|
|
|
877 |
|
|
|
2,762 |
|
|
|
3,639 |
|
|
|
1,077 |
|
|
|
2,541 |
|
|
|
3,618 |
|
| Net book amount at 31 December |
|
|
|
|
20,865 |
|
|
|
1,174 |
|
|
|
22,039 |
|
|
|
23,434 |
|
|
|
1,198 |
|
|
|
24,632 |
|
| Net book amount at 1 January |
|
|
|
|
23,434 |
|
|
|
1,198 |
|
|
|
24,632 |
|
|
|
20,433 |
|
|
|
1,220 |
|
|
|
21,653 |
|
17. Investments in joint ventures
The significant joint ventures of the BP group at 31 December 2013 are shown in Note 38. Summarized financial information for the group’s share of joint
ventures is shown below. Balance sheet information shown below excludes data relating to joint ventures classified as assets held for sale as at the end of the period. Income statement information shown below includes data relating to joint ventures
reclassified as assets held for sale during the period up until the date of reclassification. The group does not have any individually material joint ventures.
The
following table provides aggregated summarized financial information relating to the group’s share of joint ventures.
|
|
|
|
|
|
|
|
|
|
|
|
|
|
|
| |
|
|
|
|
|
|
|
|
|
$ million |
|
| |
|
|
|
2013 |
|
|
2012 |
|
|
2011 |
|
| Sales and other operating revenues |
|
|
|
|
12,507 |
|
|
|
12,507 |
|
|
|
11,993 |
|
| Profit before interest and taxation |
|
|
|
|
1,076 |
|
|
|
778 |
|
|
|
1,315 |
|
| Finance costs |
|
|
|
|
130 |
|
|
|
113 |
|
|
|
115 |
|
| Profit before taxation |
|
|
|
|
946 |
|
|
|
665 |
|
|
|
1,200 |
|
| Taxation |
|
|
|
|
499 |
|
|
|
405 |
|
|
|
433 |
|
| Profit for the year |
|
|
|
|
447 |
|
|
|
260 |
|
|
|
767 |
|
| Other comprehensive income |
|
|
|
|
38 |
|
|
|
(52 |
) |
|
|
– |
|
| Total comprehensive income |
|
|
|
|
485 |
|
|
|
208 |
|
|
|
767 |
|
| Non-current assets |
|
|
|
|
11,576 |
|
|
|
11,147 |
|
|
|
|
|
| Current assets |
|
|
|
|
3,095 |
|
|
|
2,931 |
|
|
|
|
|
| Total assets |
|
|
|
|
14,671 |
|
|
|
14,078 |
|
|
|
|
|
| Current liabilities |
|
|
|
|
2,276 |
|
|
|
2,350 |
|
|
|
|
|
| Non-current liabilities |
|
|
|
|
3,499 |
|
|
|
3,379 |
|
|
|
|
|
| Total liabilities |
|
|
|
|
5,775 |
|
|
|
5,729 |
|
|
|
|
|
| |
|
|
|
|
8,896 |
|
|
|
8,349 |
|
|
|
|
|
| Group investment in joint ventures |
|
|
|
|
|
|
|
|
|
|
|
|
|
|
| Group share of net assets (as above) |
|
|
|
|
8,896 |
|
|
|
8,349 |
|
|
|
|
|
| Loans made by group companies to joint ventures |
|
|
|
|
303 |
|
|
|
265 |
|
|
|
|
|
| |
|
|
|
|
9,199 |
|
|
|
8,614 |
|
|
|
|
|
|
|
|
|
|
| BP Annual Report and Form 20-F 2013 |
|
|
163 |
|
17. Investments in joint ventures – continued
Transactions between the group and its joint ventures are summarized below.
|
|
|
|
|
|
|
|
|
|
|
|
|
|
|
|
|
|
|
|
|
|
|
|
|
|
|
| |
|
|
|
|
|
|
|
|
|
|
|
|
|
|
|
|
|
|
$ million |
|
| Sales to joint ventures |
|
|
|
|
|
|
2013 |
|
|
|
|
|
2012 |
|
|
|
|
|
2011 |
|
| Product |
|
|
|
Sales |
|
|
Amount
receivable at
31 December |
|
|
Sales |
|
|
Amount
receivable at
31 December |
|
|
Sales |
|
|
Amount
receivable at
31 December |
|
| LNG, crude oil and oil products, natural gas, employee services |
|
|
|
|
4,125 |
|
|
|
342 |
|
|
|
4,272 |
|
|
|
379 |
|
|
|
3,196 |
|
|
|
423 |
|
|
|
|
|
|
|
|
|
|
|
|
|
|
|
|
|
|
|
|
|
|
|
|
|
|
|
|
| |
|
|
|
|
|
|
|
|
|
|
|
|
|
|
|
|
|
|
$ million |
|
| Purchases from joint ventures |
|
|
|
|
|
|
2013 |
|
|
|
|
|
2012 |
|
|
|
|
|
2011 |
|
| Product |
|
|
|
Purchases |
|
|
Amount
payable at
31 December |
|
|
Purchases |
|
|
Amount
payable at
31 December |
|
|
Purchases |
|
|
Amount
payable at
31 December |
|
| LNG, crude oil and oil products, natural gas, refinery operating costs, plant processing fees |
|
|
|
|
503 |
|
|
|
51 |
|
|
|
1,107 |
|
|
|
116 |
|
|
|
1,165 |
|
|
|
62 |
|
The terms of the outstanding balances receivable from joint ventures are typically 30 to 45 days. The balances are unsecured and will be
settled in cash. There are no significant provisions for doubtful debts relating to these balances and no significant expense recognized in the income statement in respect of bad or doubtful debts. Dividends receivable are not included in the table
above.
BP has commitments amounting to $21 million (2012 $53 million) in relation to contracts with joint ventures for the purchase of LNG, crude oil and oil
products, refinery operating costs and storage and handling services. See Note 36 for further information on capital commitments relating to BP’s investments in joint ventures.
18. Investments in associates
The following table provides aggregated financial information for the group’s associates as it relates to the amounts recognized in the group income statement and on
the group balance sheet.
|
|
|
|
|
|
|
|
|
|
|
|
|
|
|
|
|
|
|
|
|
|
|
|
|
|
|
| |
|
|
|
|
|
|
|
|
|
|
|
|
|
|
|
|
|
|
$ million |
|
| |
|
|
|
Earnings from associates –
after interest and tax |
|
|
Investments
in associates |
|
| |
|
|
|
2013 |
|
|
2012 |
|
|
2011 |
|
|
2013 |
|
|
2012 |
|
|
2011 |
|
| Rosneft |
|
|
|
|
2,058 |
|
|
|
– |
|
|
|
– |
|
|
|
13,681 |
|
|
|
– |
|
|
|
– |
|
| TNK-BP |
|
|
|
|
– |
|
|
|
2,986 |
|
|
|
4,185 |
|
|
|
– |
|
|
|
– |
|
|
|
10,013 |
|
| Other associates |
|
|
|
|
684 |
|
|
|
689 |
|
|
|
731 |
|
|
|
2,955 |
|
|
|
2,998 |
|
|
|
3,278 |
|
| |
|
|
|
|
2,742 |
|
|
|
3,675 |
|
|
|
4,916 |
|
|
|
16,636 |
|
|
|
2,998 |
|
|
|
13,291 |
|
The associate that is material to the group at 31 December 2013 is Rosneft (2012 TNK-BP). In 2013, BP concluded transactions to sell
its 50% interest in TNK-BP to Rosneft and to increase BP’s investment in Rosneft. BP and Rosneft announced heads of terms for this transaction on 22 October 2012, after which our investment in TNK-BP was classified as an asset held for
sale and therefore equity accounting ceased. See below and Note 6 for further information. Other significant associates of the BP group at 31 December 2013 are shown in Note 38.
At 31 December 2013, and since the transaction described in Note 6 concluded on 21 March 2013, BP owned 19.75% of the voting shares of OJSC Oil Company Rosneft
(Rosneft), a Russian oil and gas company. Rosneft shares are listed on the MICEX stock exchange in Moscow and its global depository receipts are listed on the London Stock Exchange. The Russian federal government, through its investment company OJSC
Rosneftegaz, owned 69.5% of the voting shares of Rosneft at 31 December 2013.
BP uses the equity method of accounting for its investment in Rosneft because in
management’s judgement BP has significant influence over Rosneft, see Note 1 – Interests in other entities – significant estimate or judgement for further information.
|
|
|
| 164 |
|
BP Annual Report and Form 20-F 2013 |
18. Investments in associates – continued
The following table provides summarized financial information at 100% share relating to each of the group’s
material associates.
|
|
|
|
|
|
|
|
|
|
|
|
|
|
|
| |
|
|
|
|
|
|
|
|
|
$ million |
|
| |
|
|
|
|
|
|
|
|
|
Gross amount |
|
| |
|
|
|
2013 |
|
|
2012 |
|
|
2011 |
|
| |
|
|
|
Rosneft |
|
|
TNK-BPa |
|
|
TNK-BP |
|
| Sales and other operating revenues |
|
|
|
|
122,866 |
|
|
|
49,350 |
|
|
|
60,200 |
|
| Profit before interest and taxation |
|
|
|
|
14,106 |
|
|
|
8,810 |
|
|
|
11,984 |
|
| Finance costs |
|
|
|
|
1,337 |
|
|
|
168 |
|
|
|
264 |
|
| Profit before taxation |
|
|
|
|
12,769 |
|
|
|
8,642 |
|
|
|
11,720 |
|
| Taxation |
|
|
|
|
2,137 |
|
|
|
1,958 |
|
|
|
2,666 |
|
| Non-controlling interests |
|
|
|
|
213 |
|
|
|
712 |
|
|
|
684 |
|
| Profit for the year |
|
|
|
|
10,419 |
|
|
|
5,972 |
|
|
|
8,370 |
|
| Other comprehensive income |
|
|
|
|
(441 |
) |
|
|
26 |
|
|
|
(77 |
) |
| Total comprehensive income |
|
|
|
|
9,978 |
|
|
|
5,998 |
|
|
|
8,293 |
|
| Non-current assets |
|
|
|
|
149,149 |
|
|
|
|
|
|
|
|
|
| Current assets |
|
|
|
|
48,775 |
|
|
|
|
|
|
|
|
|
| Total assets |
|
|
|
|
197,924 |
|
|
|
|
|
|
|
|
|
| Current liabilities |
|
|
|
|
43,175 |
|
|
|
|
|
|
|
|
|
| Non-current liabilities |
|
|
|
|
83,458 |
|
|
|
|
|
|
|
|
|
| Total liabilities |
|
|
|
|
126,633 |
|
|
|
|
|
|
|
|
|
| Non-controlling interests |
|
|
|
|
2,020 |
|
|
|
|
|
|
|
|
|
| |
|
|
|
|
69,271 |
|
|
|
|
|
|
|
|
|
| a |
BP ceased equity accounting for TNK-BP on 22 October 2012. See Note 6 for further information. |
The group received dividends of $456 million from Rosneft in 2013, net of withholding tax (2012 dividends of $709 million from TNK-BP and 2011 dividends of $3,747 million
from TNK-BP).
Summarized financial information for the group’s share of associates is shown below. Balance sheet information shown below does not include data
relating to associates classified as assets held for sale as at the end of the period. Income statement and other comprehensive income information shown below includes data relating to associates classified as assets held for sale during the period
prior to their classification as assets held for sale.
|
|
|
|
|
|
|
|
|
|
|
|
|
|
|
|
|
|
|
|
|
|
|
|
|
|
|
|
|
|
|
|
|
|
|
|
|
|
|
| |
|
|
|
|
|
|
|
|
|
|
|
|
|
|
|
|
|
|
|
|
|
|
|
|
|
|
|
$ million |
|
| |
|
|
|
|
|
|
|
|
|
|
|
|
|
|
|
|
|
|
|
|
|
|
|
|
|
|
|
BP share |
|
| |
|
|
|
|
|
|
|
|
|
2013 |
|
|
|
|
|
|
|
|
2012 |
|
|
|
|
|
|
|
|
2011 |
|
| |
|
|
|
Rosnefta |
|
|
Other |
|
|
Total |
|
|
TNK-BPb |
|
|
Other |
|
|
Total |
|
|
TNK-BP |
|
|
Other |
|
|
Total |
|
| Sales and other operating revenues |
|
|
|
|
24,266 |
|
|
|
7,967 |
|
|
|
32,233 |
|
|
|
24,675 |
|
|
|
11,965 |
|
|
|
36,640 |
|
|
|
30,100 |
|
|
|
12,145 |
|
|
|
42,245 |
|
| Profit before interest and taxation |
|
|
|
|
2,786 |
|
|
|
908 |
|
|
|
3,694 |
|
|
|
4,405 |
|
|
|
906 |
|
|
|
5,311 |
|
|
|
5,992 |
|
|
|
958 |
|
|
|
6,950 |
|
| Finance costs |
|
|
|
|
264 |
|
|
|
11 |
|
|
|
275 |
|
|
|
84 |
|
|
|
16 |
|
|
|
100 |
|
|
|
132 |
|
|
|
13 |
|
|
|
145 |
|
| Profit before taxation |
|
|
|
|
2,522 |
|
|
|
897 |
|
|
|
3,419 |
|
|
|
4,321 |
|
|
|
890 |
|
|
|
5,211 |
|
|
|
5,860 |
|
|
|
945 |
|
|
|
6,805 |
|
| Taxation |
|
|
|
|
422 |
|
|
|
213 |
|
|
|
635 |
|
|
|
979 |
|
|
|
201 |
|
|
|
1,180 |
|
|
|
1,333 |
|
|
|
214 |
|
|
|
1,547 |
|
| Non-controlling interests |
|
|
|
|
42 |
|
|
|
– |
|
|
|
42 |
|
|
|
356 |
|
|
|
– |
|
|
|
356 |
|
|
|
342 |
|
|
|
– |
|
|
|
342 |
|
| Profit for the year |
|
|
|
|
2,058 |
|
|
|
684 |
|
|
|
2,742 |
|
|
|
2,986 |
|
|
|
689 |
|
|
|
3,675 |
|
|
|
4,185 |
|
|
|
731 |
|
|
|
4,916 |
|
| Other comprehensive income |
|
|
|
|
(87 |
) |
|
|
2 |
|
|
|
(85 |
) |
|
|
13 |
|
|
|
(6 |
) |
|
|
7 |
|
|
|
(39 |
) |
|
|
– |
|
|
|
(39 |
) |
| Total comprehensive income |
|
|
|
|
1,971 |
|
|
|
686 |
|
|
|
2,657 |
|
|
|
2,999 |
|
|
|
683 |
|
|
|
3,682 |
|
|
|
4,146 |
|
|
|
731 |
|
|
|
4,877 |
|
| Non-current assets |
|
|
|
|
29,457 |
|
|
|
3,148 |
|
|
|
32,605 |
|
|
|
– |
|
|
|
3,270 |
|
|
|
3,270 |
|
|
|
|
|
|
|
|
|
|
|
|
|
| Current assets |
|
|
|
|
9,633 |
|
|
|
2,477 |
|
|
|
12,110 |
|
|
|
– |
|
|
|
2,399 |
|
|
|
2,399 |
|
|
|
|
|
|
|
|
|
|
|
|
|
| Total assets |
|
|
|
|
39,090 |
|
|
|
5,625 |
|
|
|
44,715 |
|
|
|
– |
|
|
|
5,669 |
|
|
|
5,669 |
|
|
|
|
|
|
|
|
|
|
|
|
|
| Current liabilities |
|
|
|
|
8,527 |
|
|
|
2,114 |
|
|
|
10,641 |
|
|
|
– |
|
|
|
2,126 |
|
|
|
2,126 |
|
|
|
|
|
|
|
|
|
|
|
|
|
| Non-current liabilities |
|
|
|
|
16,483 |
|
|
|
1,053 |
|
|
|
17,536 |
|
|
|
– |
|
|
|
1,290 |
|
|
|
1,290 |
|
|
|
|
|
|
|
|
|
|
|
|
|
| Total liabilities |
|
|
|
|
25,010 |
|
|
|
3,167 |
|
|
|
28,177 |
|
|
|
– |
|
|
|
3,416 |
|
|
|
3,416 |
|
|
|
|
|
|
|
|
|
|
|
|
|
| Non-controlling interests |
|
|
|
|
399 |
|
|
|
– |
|
|
|
399 |
|
|
|
– |
|
|
|
– |
|
|
|
– |
|
|
|
|
|
|
|
|
|
|
|
|
|
| |
|
|
|
|
13,681 |
|
|
|
2,458 |
|
|
|
16,139 |
|
|
|
– |
|
|
|
2,253 |
|
|
|
2,253 |
|
|
|
|
|
|
|
|
|
|
|
|
|
| Group investment in associates |
|
|
|
|
|
|
|
|
|
|
|
|
|
|
|
|
|
|
|
|
|
|
|
|
|
|
|
|
|
|
|
|
|
|
|
|
|
|
| Group share of net assets (as above) |
|
|
|
|
13,681 |
|
|
|
2,458 |
|
|
|
16,139 |
|
|
|
– |
|
|
|
2,253 |
|
|
|
2,253 |
|
|
|
|
|
|
|
|
|
|
|
|
|
| Loans made by group companies to associates |
|
|
|
|
– |
|
|
|
497 |
|
|
|
497 |
|
|
|
– |
|
|
|
745 |
|
|
|
745 |
|
|
|
|
|
|
|
|
|
|
|
|
|
| |
|
|
|
|
13,681 |
|
|
|
2,955 |
|
|
|
16,636 |
|
|
|
– |
|
|
|
2,998 |
|
|
|
2,998 |
|
|
|
|
|
|
|
|
|
|
|
|
|
| a |
The fair value of BP’s 19.75% stake in Rosneft was $15,937 million at 31 December 2013 based on the quoted market share price of $7.62 per share. |
| b |
BP ceased equity accounting for TNK-BP on 22 October 2012. See Note 6 for further information. |
|
|
|
|
|
| BP Annual Report and Form 20-F 2013 |
|
|
165 |
|
18. Investments in associates – continued
Transactions between the group and its associates are summarized below.
|
|
|
|
|
|
|
|
|
|
|
|
|
|
|
|
|
|
|
|
|
|
|
|
|
|
|
| |
|
|
|
|
|
|
|
|
|
|
|
|
|
|
|
|
|
|
$ million |
|
| Sales to associates |
|
|
|
|
|
|
2013 |
|
|
|
|
|
2012 |
|
|
|
|
|
2011 |
|
| Product |
|
|
|
Sales |
|
|
Amount
receivable at
31 December |
|
|
Sales |
|
|
Amount
receivable at
31 December |
|
|
Sales |
|
|
Amount
receivable at
31 December |
|
| LNG, crude oil and oil products, natural gas, employee services |
|
|
|
|
5,170 |
|
|
|
783 |
|
|
|
3,771 |
|
|
|
401 |
|
|
|
3,855 |
|
|
|
393 |
|
|
|
|
|
|
|
|
|
|
|
|
|
|
|
|
|
|
|
|
|
|
|
|
|
|
|
|
| |
|
|
|
|
|
|
|
|
|
|
|
|
|
|
|
|
|
|
$ million |
|
| Purchases from associates |
|
|
|
|
|
|
2013 |
|
|
|
|
|
2012 |
|
|
|
|
|
2011 |
|
| Product |
|
|
|
Purchases |
|
|
Amount
payable at
31 December |
|
|
Purchases |
|
|
Amount
payable at
31 December |
|
|
Purchases |
|
|
Amount
payable at
31 December |
|
| Crude oil and oil products, natural gas, transportation tariff |
|
|
|
|
21,205 |
|
|
|
3,470 |
|
|
|
9,135 |
|
|
|
932 |
|
|
|
8,159 |
|
|
|
815 |
|
The terms of the outstanding balances receivable from associates are typically 30 to 45 days. The balances are unsecured and will be
settled in cash. There are no significant provisions for doubtful debts relating to these balances and no significant expense recognized in the income statement in respect of bad or doubtful debts. Dividends receivable are not included in the table
above.
The majority of the purchases from associates are crude oil and oil products purchased from Rosneft. BP has commitments amounting to $6,077 million (2012 $595
million) in relation to contracts with its associates for the purchase of crude oil and oil products, transportation and storage. See Note 36 for further information on capital commitments relating to BP’s investments in associates.
19. Financial instruments and financial risk factors
The accounting classification of each category of financial instruments, and their carrying amounts, are set out below.
|
|
|
|
|
|
|
|
|
|
|
|
|
|
|
|
|
|
|
|
|
|
|
|
|
|
|
|
|
|
|
|
|
|
|
| |
|
|
|
|
|
|
|
|
|
|
|
|
|
|
|
|
|
|
|
|
|
|
|
|
$ million |
|
| At 31 December 2013 |
|
|
|
Note |
|
|
Loans and
receivables |
|
|
Available-
for-sale financial
assets |
|
|
Held-to-
maturity
investments |
|
|
At fair value
through profit
or loss |
|
|
Derivative
hedging
instruments |
|
|
Financial
liabilities
measured at
amortized cost |
|
|
Total carrying
amount |
|
| Financial assets |
|
|
|
|
|
|
|
|
|
|
|
|
|
|
|
|
|
|
|
|
|
|
|
|
|
|
|
|
|
|
|
|
|
|
| Other investments – equity shares |
|
|
|
|
20 |
|
|
|
– |
|
|
|
291 |
|
|
|
– |
|
|
|
– |
|
|
|
– |
|
|
|
– |
|
|
|
291 |
|
|
– other |
|
|
|
|
20 |
|
|
|
– |
|
|
|
1,167 |
|
|
|
– |
|
|
|
574 |
|
|
|
– |
|
|
|
– |
|
|
|
1,741 |
|
| Loans |
|
|
|
|
|
|
|
|
979 |
|
|
|
– |
|
|
|
– |
|
|
|
– |
|
|
|
– |
|
|
|
– |
|
|
|
979 |
|
| Trade and other receivables |
|
|
|
|
22 |
|
|
|
39,630 |
|
|
|
– |
|
|
|
– |
|
|
|
– |
|
|
|
– |
|
|
|
– |
|
|
|
39,630 |
|
| Derivative financial instruments |
|
|
|
|
26 |
|
|
|
– |
|
|
|
– |
|
|
|
– |
|
|
|
5,189 |
|
|
|
995 |
|
|
|
– |
|
|
|
6,184 |
|
| Cash and cash equivalents |
|
|
|
|
23 |
|
|
|
19,153 |
|
|
|
2,267 |
|
|
|
1,100 |
|
|
|
– |
|
|
|
– |
|
|
|
– |
|
|
|
22,520 |
|
| Financial liabilities |
|
|
|
|
|
|
|
|
|
|
|
|
|
|
|
|
|
|
|
|
|
|
|
|
|
|
|
|
|
|
|
|
|
|
| Trade and other payables |
|
|
|
|
25 |
|
|
|
– |
|
|
|
– |
|
|
|
– |
|
|
|
– |
|
|
|
– |
|
|
|
(48,072 |
) |
|
|
(48,072 |
) |
| Derivative financial instruments |
|
|
|
|
26 |
|
|
|
– |
|
|
|
– |
|
|
|
– |
|
|
|
(4,159 |
) |
|
|
(388 |
) |
|
|
– |
|
|
|
(4,547 |
) |
| Accruals |
|
|
|
|
|
|
|
|
– |
|
|
|
– |
|
|
|
– |
|
|
|
– |
|
|
|
– |
|
|
|
(9,507 |
) |
|
|
(9,507 |
) |
| Finance debt |
|
|
|
|
27 |
|
|
|
– |
|
|
|
– |
|
|
|
– |
|
|
|
– |
|
|
|
– |
|
|
|
(48,192 |
) |
|
|
(48,192 |
) |
| |
|
|
|
|
|
|
|
|
59,762 |
|
|
|
3,725 |
|
|
|
1,100 |
|
|
|
1,604 |
|
|
|
607 |
|
|
|
(105,771 |
) |
|
|
(38,973 |
) |
|
|
|
|
|
|
|
|
|
|
|
|
|
|
|
|
|
|
|
|
|
|
|
|
|
|
|
|
|
|
|
|
|
|
|
| At 31 December 2012 |
|
|
|
|
|
|
|
|
|
|
|
|
|
|
|
|
|
|
|
|
|
|
|
|
|
|
| Financial assets |
|
|
|
|
|
|
|
|
|
|
|
|
|
|
|
|
|
|
|
|
|
|
|
|
|
|
|
|
|
|
|
|
|
|
| Other investments – equity shares |
|
|
|
|
20 |
|
|
|
– |
|
|
|
1,433 |
|
|
|
– |
|
|
|
– |
|
|
|
– |
|
|
|
– |
|
|
|
1,433 |
|
|
– other |
|
|
|
|
20 |
|
|
|
– |
|
|
|
1,005 |
|
|
|
– |
|
|
|
585 |
|
|
|
– |
|
|
|
– |
|
|
|
1,590 |
|
| Loans |
|
|
|
|
|
|
|
|
889 |
|
|
|
– |
|
|
|
– |
|
|
|
– |
|
|
|
– |
|
|
|
– |
|
|
|
889 |
|
| Trade and other receivables |
|
|
|
|
22 |
|
|
|
35,962 |
|
|
|
– |
|
|
|
– |
|
|
|
– |
|
|
|
– |
|
|
|
– |
|
|
|
35,962 |
|
| Derivative financial instruments |
|
|
|
|
26 |
|
|
|
– |
|
|
|
– |
|
|
|
– |
|
|
|
5,342 |
|
|
|
3,459 |
|
|
|
– |
|
|
|
8,801 |
|
| Cash and cash equivalents |
|
|
|
|
23 |
|
|
|
15,128 |
|
|
|
4,507 |
|
|
|
– |
|
|
|
– |
|
|
|
– |
|
|
|
– |
|
|
|
19,635 |
|
| Financial liabilities |
|
|
|
|
|
|
|
|
|
|
|
|
|
|
|
|
|
|
|
|
|
|
|
|
|
|
|
|
|
|
|
|
|
|
| Trade and other payables |
|
|
|
|
25 |
|
|
|
– |
|
|
|
– |
|
|
|
– |
|
|
|
– |
|
|
|
– |
|
|
|
(44,405 |
) |
|
|
(44,405 |
) |
| Derivative financial instruments |
|
|
|
|
26 |
|
|
|
– |
|
|
|
– |
|
|
|
– |
|
|
|
(5,093 |
) |
|
|
(288 |
) |
|
|
– |
|
|
|
(5,381 |
) |
| Accruals |
|
|
|
|
|
|
|
|
– |
|
|
|
– |
|
|
|
– |
|
|
|
– |
|
|
|
– |
|
|
|
(7,366 |
) |
|
|
(7,366 |
) |
| Finance debt |
|
|
|
|
27 |
|
|
|
– |
|
|
|
– |
|
|
|
– |
|
|
|
– |
|
|
|
– |
|
|
|
(48,168 |
) |
|
|
(48,168 |
) |
| |
|
|
|
|
|
|
|
|
51,979 |
|
|
|
6,945 |
|
|
|
– |
|
|
|
834 |
|
|
|
3,171 |
|
|
|
(99,939 |
) |
|
|
(37,010 |
) |
The fair value of finance debt is shown in Note 27. For all other financial instruments, the carrying amount is either the fair value, or
approximates the fair value.
Financial risk factors
The group is exposed to a number of different financial risks arising from natural business exposures as well as its use of financial instruments including: market risks
relating to commodity prices, foreign currency exchange rates, interest rates and equity prices; credit risk; and liquidity risk.
|
|
|
| 166 |
|
BP Annual Report and Form 20-F 2013 |
19. Financial instruments and financial risk factors – continued
The group financial risk committee (GFRC) advises the group chief financial officer (CFO) who oversees the management of
these risks. The GFRC is chaired by the CFO and consists of a group of senior managers including the group treasurer and the heads of the group finance, tax and the integrated supply and trading functions. The purpose of the committee is to advise
on financial risks and the appropriate financial risk governance framework for the group. The committee provides assurance to the CFO and the group chief executive (GCE), and via the GCE to the board, that the group’s financial risk-taking
activity is governed by appropriate policies and procedures and that financial risks are identified, measured and managed in accordance with group policies and group risk appetite.
The group’s trading activities in the oil, natural gas and power markets are managed within the integrated supply and trading function, while the activities in the
financial markets are managed by the treasury function, working under the compliance and control structure of the integrated supply and trading function. All derivative activity is carried out by specialist teams that have the appropriate skills,
experience and supervision. These teams are subject to close financial and management control.
The integrated supply and trading function maintains formal governance
processes that provide oversight of market risk associated with trading activity. A policy and risk committee monitors and validates limits and risk exposures, reviews incidents and validates risk-related policies, methodologies and procedures. A
commitments committee approves value-at-risk delegations, the trading of new products, instruments and strategies and material commitments.
In addition, the
integrated supply and trading function undertakes derivative activity for risk management purposes under a separate control framework as described more fully below.
(a) Market risk
Market risk is the risk or uncertainty arising from possible market price movements and their impact on the future
performance of a business. The primary commodity price risks that the group is exposed to include oil, natural gas and power prices that could adversely affect the value of the group’s financial assets, liabilities or expected future cash
flows. The group enters into derivatives in a well-established entrepreneurial trading operation. In addition, the group has developed a control framework aimed at managing the volatility inherent in certain of its natural business exposures. In
accordance with the control framework the group enters into various transactions using derivatives for risk management purposes.
The major components of market risk
are commodity price risk, foreign currency exchange risk, interest rate risk and equity price risk, each of which is discussed below.
(i)
Commodity price risk
The group’s integrated supply and trading function uses conventional financial and commodity instruments and physical cargoes
available in the related commodity markets. Oil and natural gas swaps, options and futures are used to mitigate price risk. Power trading is undertaken using a combination of over-the-counter forward contracts and other derivative contracts,
including options and futures. This activity is on both a standalone basis and in conjunction with gas derivatives in relation to gas-generated power margin. In addition, NGLs are traded around certain US inventory locations using over-the-counter
forward contracts in conjunction with over-the-counter swaps, options and physical inventories.
The group measures market risk exposure arising from its trading
positions using value-at-risk techniques. These techniques make a statistical assessment of the market risk arising from possible future changes in market prices over a one-day holding period. The value-at-risk measure is supplemented by stress
testing. Value-at-risk limits are in place for each trading activity and for the group’s trading activity in total. The board has delegated a limit of $100 million value at risk in support of this trading activity.
In addition, the group has embedded derivatives relating to certain natural gas contracts. The net fair value of these contracts was a liability of $652 million at
31 December 2013 (2012 liability of $1,112 million). For these embedded derivatives the sensitivity of the net fair value to an immediate 10% favourable or adverse change in each key assumption is less than $100 million in each case.
(ii) Foreign currency exchange risk
Where the
group enters into foreign currency exchange contracts for entrepreneurial trading purposes the activity is controlled using trading value-at-risk techniques as explained above.
Since BP has global operations, fluctuations in foreign currency exchange rates can have a significant effect on the group’s reported results. The effects of most
exchange rate fluctuations are absorbed in business operating results through changing cost competitiveness, lags in market adjustment to movements in rates and translation differences accounted for on specific transactions. For this reason, the
total effect of exchange rate fluctuations is not identifiable separately in the group’s reported results. The main underlying economic currency of the group’s cash flows is the US dollar. This is because BP’s major product, oil, is
priced internationally in US dollars. BP’s foreign currency exchange management policy is to limit economic and material transactional exposures arising from currency movements against the US dollar. The group co-ordinates the handling of
foreign currency exchange risks centrally, by netting off naturally-occurring opposite exposures wherever possible, and then managing any material residual foreign currency exchange risks.
The group manages these exposures by constantly reviewing the foreign currency economic value at risk and aims to manage such risk to keep the 12-month foreign currency value at risk below $400 million. At no point over the past three years did the value at risk exceed the maximum risk limit. The most significant exposures relate to capital expenditure
commitments and other UK and European operational requirements, for which a hedging programme is in place and hedge accounting is claimed as outlined in Note 26.
For
highly probable forecast capital expenditures the group locks in the US dollar cost of non-US dollar supplies by using currency forwards and futures. The main exposures are sterling, euro, Norwegian krone, Australian dollar and Korean won. At
31 December 2013 the most significant open contracts in place were for $723 million sterling (2012 $853 million sterling).
For other UK, European and Australian
operational requirements the group uses cylinders (purchased call and sold put options) and currency forwards to manage the estimated exposures on a 12-month rolling basis. At 31 December 2013, the open positions relating to cylinders consisted
of receive sterling, pay US dollar cylinders for $2,770 million (2012 $2,886 million); receive euro, pay US dollar cylinders for $962 million (2012 $1,636 million); receive Australian dollar, pay US dollar cylinders for $401 million (2012 $522
million).
In addition, most of the group’s borrowings are in US dollars or are hedged with respect to the US dollar. At 31 December 2013, the total foreign
currency net borrowings not swapped into US dollars amounted to $665 million (2012 $364 million).
(iii) Interest rate risk
Where the group enters into money market contracts for entrepreneurial trading purposes the activity is controlled using value-at-risk techniques as described above.
|
|
|
|
|
| BP Annual Report and Form 20-F 2013 |
|
|
167 |
|
19. Financial instruments and financial risk factors – continued
BP is also exposed to interest rate risk from the possibility that changes in interest rates will
affect future cash flows or the fair values of its financial instruments, principally finance debt. While the group issues debt in a variety of currencies based on market opportunities, it uses derivatives to swap the debt to a floating rate
exposure, mainly to US dollar floating, but in certain defined circumstances maintains a US dollar fixed rate exposure for a proportion of debt. The proportion of floating rate debt net of interest rate swaps at 31 December 2013 was 65% of
total finance debt outstanding (2012 65%). The weighted average interest rate on finance debt at 31 December 2013 was 2% (2012 2%) and the weighted average maturity of fixed rate debt was four years (2012 four years).
The group’s earnings are sensitive to changes in interest rates on the floating rate element of the group’s finance debt. If the interest rates applicable to
floating rate instruments were to have increased by one percentage point on 1 January 2014, it is estimated that the group’s finance costs for 2014 would increase by approximately $312 million (2012 $311 million increase in 2013).
(iv) Equity price risk
The group holds equity
investments, typically for strategic purposes, that are classified as non-current available-for-sale financial assets and are measured initially at fair value with changes in fair value recognized in other comprehensive income.
At 31 December 2013 the group had no significant exposure to the price of quoted equity instruments. At 31 December 2012, an increase or decrease of 10% in
quoted equity prices would have resulted in an immediate credit or charge to other comprehensive income of $1,502 million. At 31 December 2012, 82% of the carrying amount of non-current available-for-sale equity financial assets represented the
group’s 1.25% stake in Rosneft, thus the group’s exposure was concentrated on changes in the share price of this equity in particular. The sensitivity analysis at 31 December 2012 includes the impact of a change in the share price on
the valuation of the contracts to acquire Rosneft shares accounted for as cash flow hedge derivatives.
(b) Credit risk
Credit risk is the risk that a customer or counterparty to a financial instrument will fail to perform or fail to pay amounts due causing financial loss to the group and
arises from cash and cash equivalents, derivative financial instruments and deposits with financial institutions and principally from credit exposures to customers relating to outstanding receivables. Credit exposure also exists in relation to
guarantees issued by group companies under which amounts outstanding at 31 December 2013 were $199 million (2012 $237 million) in respect of liabilities of joint ventures and associates and $305 million (2012 $717 million) in respect of
liabilities of other third parties.
The group has a credit policy, approved by the CFO, that is designed to ensure that consistent processes are in place throughout
the group to measure and control credit risk. Credit risk is considered as part of the risk-reward balance of doing business. On entering into any business contract the extent to which the arrangement exposes the group to credit risk is considered.
Key requirements of the policy include segregation of credit approval authorities from any sales, marketing or trading teams authorized to incur credit risk; the establishment of credit systems and processes to ensure that all counterparty exposure
is rated and that all counterparty exposure and limits can be monitored and reported; and the timely identification and reporting of any non-approved credit exposures and credit losses. While each segment of the group is typically responsible for
its own credit risk management and reporting consistent with group policy, the treasury function holds group-wide credit risk authority and oversight responsibility for exposure to banks and financial institutions.
The maximum credit exposure associated with financial assets is equal to the carrying amount. The group does not aim to remove credit risk entirely but expects to
experience a certain level of credit losses. As at 31 December 2013, the group had in place credit enhancements designed to mitigate approximately $13 billion of credit risk (2012 $12 billion). Reports are regularly prepared and presented to the
GFRC that cover the group’s overall credit exposure and expected loss trends, exposure by segment, and overall quality of the portfolio.
For the contracts
comprising derivative financial instruments in an asset position at 31 December 2013 it is estimated that over 80% (2012 over 70%, excluding the contracts with Rosneft accounted for as derivatives) of the unmitigated credit exposure is to
counterparties of investment grade credit quality.
For cash and cash equivalents, the treasury function dynamically manages bank deposit limits to ensure cash is
well-diversified and to reduce concentration risks. At 31 December 2013, 92% of the cash and cash equivalents balance was deposited with financial institutions rated at least A- by Standard & Poor’s and Fitch, and A3 by
Moody’s. Of the total cash and cash equivalents held at year end, collateral of $5,450 million was held by third-party custodians in tri-partite repurchase agreements, which would only be released to BP
in the event of repayment default by the borrower.
Trade and other receivables of the group are analysed in the table below. By comparing the BP credit ratings to
the equivalent external credit ratings, it is estimated that approximately 70-80% (2012 approximately 70-80%) of the unmitigated trade receivables portfolio exposure is of investment grade credit quality. Current assets, including trade and other
receivables, in Egypt amount to $2.3 billion (see page 241), of which over one third relates to trade receivables which are not impaired but are past the original due date. Management is working with the counterparties to continue to collect these
amounts.
|
|
|
|
|
|
|
|
|
|
|
| |
|
|
|
|
|
|
$ million |
|
| Trade and other receivables at 31 December |
|
|
|
2013 |
|
|
2012 |
|
| Neither impaired nor past due |
|
|
|
|
37,201 |
|
|
|
33,053 |
|
| Impaired (net of provision) |
|
|
|
|
27 |
|
|
|
80 |
|
| Not impaired and past due in the following periods |
|
|
|
|
|
|
|
|
|
|
| within 30 days |
|
|
|
|
1,054 |
|
|
|
1,337 |
|
| 31 to 60 days |
|
|
|
|
249 |
|
|
|
286 |
|
| 61 to 90 days |
|
|
|
|
216 |
|
|
|
225 |
|
| over 90 days |
|
|
|
|
883 |
|
|
|
981 |
|
| |
|
|
|
|
39,630 |
|
|
|
35,962 |
|
Movements in the impairment provision for trade receivables are shown in Note 24.
Financial instruments subject to offsetting, enforceable master netting arrangements and similar agreements
The following table shows the gross amounts of recognized financial assets and liabilities (i.e. before offsetting) and the amounts offset in the balance sheet. Financial
assets and liabilities are only offset when the group currently has a legally enforceable right to set off the recognized amounts and the group intends to either settle on a net basis or realize the asset and settle the liability simultaneously. A
right of set off is the group’s legal right to settle an amount payable to a creditor by applying against it an amount receivable from the same counterparty. The relevant legal jurisdiction and laws applicable to the relationships between the
parties need to be considered when assessing whether a current legally enforceable right to set off exists.
|
|
|
| 168 |
|
BP Annual Report and Form 20-F 2013 |
19. Financial instruments and financial risk factors – continued
Furthermore, amounts which cannot be offset under IFRS, but which could be settled net under the terms of master netting agreements if certain conditions arise, and collateral received or
pledged, are also shown in the table to show the total net exposure of the group.
|
|
|
|
|
|
|
|
|
|
|
|
|
|
|
|
|
|
|
|
|
|
|
|
|
|
|
| |
|
|
|
|
|
|
|
|
|
|
|
|
|
|
|
|
|
|
$ million |
|
| At 31 December 2013 |
|
|
|
Gross
amounts of
recognized
financial
assets
(liabilities) |
|
|
Amounts
set off |
|
|
Net amounts
presented on
the balance
sheet |
|
|
Related amounts not set off
in the balance sheet |
|
|
Net amount |
|
| |
|
|
|
|
Master
netting arrangements |
|
|
Cash
collateral
(received) pledged |
|
|
| Derivative assets |
|
|
|
|
7,271 |
|
|
|
(1,563 |
) |
|
|
5,708 |
|
|
|
(344 |
) |
|
|
(231 |
) |
|
|
5,133 |
|
| Derivative liabilities |
|
|
|
|
(5,457 |
) |
|
|
1,563 |
|
|
|
(3,894 |
) |
|
|
344 |
|
|
|
– |
|
|
|
(3,550 |
) |
| Trade receivables |
|
|
|
|
11,034 |
|
|
|
(7,744 |
) |
|
|
3,290 |
|
|
|
(1,287 |
) |
|
|
(264 |
) |
|
|
1,739 |
|
| Trade payables |
|
|
|
|
(10,619 |
) |
|
|
7,744 |
|
|
|
(2,875 |
) |
|
|
1,287 |
|
|
|
– |
|
|
|
(1,588 |
) |
| At 31 December 2012 |
|
|
|
|
|
|
|
|
|
|
|
|
|
|
|
|
|
|
|
|
| Derivative assets |
|
|
|
|
9,291 |
|
|
|
(1,870 |
) |
|
|
7,421 |
|
|
|
(754 |
) |
|
|
(175 |
) |
|
|
6,492 |
|
| Derivative liabilities |
|
|
|
|
(6,117 |
) |
|
|
1,870 |
|
|
|
(4,247 |
) |
|
|
754 |
|
|
|
– |
|
|
|
(3,493 |
) |
| Trade receivables |
|
|
|
|
8,829 |
|
|
|
(6,368 |
) |
|
|
2,461 |
|
|
|
(578 |
) |
|
|
(176 |
) |
|
|
1,707 |
|
| Trade payables |
|
|
|
|
(9,330 |
) |
|
|
6,368 |
|
|
|
(2,962 |
) |
|
|
578 |
|
|
|
– |
|
|
|
(2,384 |
) |
(c) Liquidity risk
Liquidity risk is the risk that suitable sources of funding for the group’s business activities may not be available. The group’s liquidity is managed centrally
with operating units forecasting their cash and currency requirements to the central treasury function. Unless restricted by local regulations, subsidiaries pool their cash surpluses to treasury, which will then arrange to fund other
subsidiaries’ requirements, or invest any net surplus in the market or arrange for necessary external borrowings, while managing the group’s overall net currency positions.
The group has in place a European Debt Issuance Programme (DIP) under which the group may raise up to $30 billion of debt for maturities of one month or longer. At
31 December 2013, the amount drawn down against the DIP was $13,854 million (2012 $14,043 million). Since 5 February 2013, the group has had a US shelf registration with a limit of $30 billion. This was converted from an unlimited shelf
registration following the approval in December 2012 of the settlement with the US Securities and Exchange Commission in respect of Gulf of Mexico oil spill related claims. Amounts drawn down since conversion total $6.9 billion. In addition, the
group has an Australian Note Issuance Programme of A$5 billion, and as at 31 December 2013 the amount drawn down was A$800 million (2012 A$500 million).
The
group’s long-term credit ratings are A (positive outlook) from Standard & Poor’s, and A2 (stable outlook) from Moody’s Investor Services, both remaining unchanged during 2013.
During 2013, $8.6 billion of long-term taxable bonds were issued with terms ranging from 18 months to 10 years. Commercial paper is issued at competitive rates to meet
short-term borrowing requirements as and when needed.
As a further liquidity measure, the group continues to maintain suitable levels of cash and cash equivalents,
amounting to $22.5 billion at 31 December 2013, primarily invested with highly rated banks or money market funds and readily accessible at immediate and short notice (2012 $19.6 billion). At 31 December 2013, the group had substantial
amounts of undrawn borrowing facilities available, consisting of $7,375 million of standby facilities, of which $6,975 million is available to draw and repay until the first half of 2018, and $400 million is available to draw and repay until April
2016. These facilities were renegotiated during 2013 with 26 international banks, and borrowings under them would be at pre-agreed rates.
The group also has
committed letter of credit (LC) facilities totalling $7,475 million with a number of banks, allowing LCs to be issued for a maximum one-year duration. There were also uncommitted secured LC facilities in place at 31 December 2013 for $2,410
million, which are secured against inventories or receivables when utilized. The facilities only terminate by either party giving a stipulated termination notice to the other.
The amounts shown for finance debt in the table below include future minimum lease payments with respect to finance leases. The table also shows the timing of cash
outflows relating to trade and other payables and accruals.
|
|
|
|
|
|
|
|
|
|
|
|
|
|
|
|
|
|
|
|
|
|
|
|
|
|
|
|
|
|
|
|
|
|
|
| |
|
|
|
|
|
|
|
|
|
|
|
|
|
|
|
|
|
|
|
|
|
|
|
|
$ million |
|
| |
|
|
|
|
|
|
|
|
|
|
|
|
2013 |
|
|
|
|
|
|
|
|
|
|
|
2012 |
|
| |
|
|
|
Trade and
other
payables |
|
|
Accruals |
|
|
Finance
debt |
|
|
Interest
relating to
finance debt |
|
|
Trade and
other
payables |
|
|
Accruals |
|
|
Finance
debt |
|
|
Interest
relating to
finance debt |
|
| Within one year |
|
|
|
|
43,790 |
|
|
|
8,960 |
|
|
|
7,381 |
|
|
|
885 |
|
|
|
42,512 |
|
|
|
6,875 |
|
|
|
9,401 |
a |
|
|
893 |
|
| 1 to 2 years |
|
|
|
|
1,007 |
|
|
|
207 |
|
|
|
6,630 |
|
|
|
752 |
|
|
|
903 |
|
|
|
136 |
|
|
|
5,906 |
|
|
|
755 |
|
| 2 to 3 years |
|
|
|
|
822 |
|
|
|
66 |
|
|
|
6,720 |
|
|
|
621 |
|
|
|
434 |
|
|
|
80 |
|
|
|
5,902 |
|
|
|
634 |
|
| 3 to 4 years |
|
|
|
|
761 |
|
|
|
73 |
|
|
|
5,828 |
|
|
|
498 |
|
|
|
373 |
|
|
|
52 |
|
|
|
6,024 |
|
|
|
510 |
|
| 4 to 5 years |
|
|
|
|
1,405 |
|
|
|
37 |
|
|
|
5,279 |
|
|
|
388 |
|
|
|
71 |
|
|
|
83 |
|
|
|
5,797 |
|
|
|
388 |
|
| 5 to 10 years |
|
|
|
|
207 |
|
|
|
113 |
|
|
|
15,933 |
|
|
|
809 |
|
|
|
79 |
|
|
|
84 |
|
|
|
14,790 |
|
|
|
885 |
|
| Over 10 years |
|
|
|
|
80 |
|
|
|
51 |
|
|
|
421 |
|
|
|
119 |
|
|
|
33 |
|
|
|
56 |
|
|
|
348 |
|
|
|
50 |
|
| |
|
|
|
|
48,072 |
|
|
|
9,507 |
|
|
|
48,192 |
|
|
|
4,072 |
|
|
|
44,405 |
|
|
|
7,366 |
|
|
|
48,168 |
|
|
|
4,115 |
|
| a |
In addition, current finance debt on the group balance sheet at 31 December 2012 included $632 million in respect of cash deposits received for disposals which completed in 2013. |
The group manages liquidity risk associated with derivative contracts, other than derivative hedging instruments, based on the expected maturities of both derivative
assets and liabilities as indicated in Note 26. Management does not currently anticipate any cash flows that could be of a significantly different amount, or could occur earlier than the expected maturity analysis provided.
The table below shows cash outflows for derivative hedging instruments based upon contractual payment dates. The amounts reflect the maturity profile of the fair value
liability where the instruments will be settled net, and the gross settlement amount where the pay leg of a derivative will be settled separately from the receive leg, as in the case of cross-currency swaps hedging non-US dollar finance debt. The
swaps are with high investment-grade counterparties and therefore the settlement-day risk exposure is considered to be negligible. Not shown in the table are the gross
|
|
|
|
|
| BP Annual Report and Form 20-F 2013 |
|
|
169 |
|
19. Financial instruments and financial risk factors – continued
settlement amounts (inflows) for the receive leg of derivatives that are settled separately from the pay leg, which amount to $12,222 million at 31 December 2013 (2012 $8,620 million) to be
received on the same day as the related cash outflows.
|
|
|
|
|
|
|
|
|
|
|
| |
|
|
|
|
|
|
$ million |
|
| |
|
|
|
2013 |
|
|
2012 |
|
| Within one year |
|
|
|
|
1,095 |
|
|
|
1,356 |
|
| 1 to 2 years |
|
|
|
|
293 |
|
|
|
1,107 |
|
| 2 to 3 years |
|
|
|
|
2,959 |
|
|
|
295 |
|
| 3 to 4 years |
|
|
|
|
2,577 |
|
|
|
1,261 |
|
| 4 to 5 years |
|
|
|
|
1,505 |
|
|
|
2,577 |
|
| 5 to 10 years |
|
|
|
|
3,835 |
|
|
|
1,903 |
|
| |
|
|
|
|
12,264 |
|
|
|
8,499 |
|
20. Other investments
|
|
|
|
|
|
|
|
|
|
|
|
|
|
|
|
|
|
|
| |
|
|
|
|
|
|
|
|
|
|
|
|
$ million |
|
| |
|
|
|
|
|
|
2013 |
|
|
|
|
|
2012 |
|
| |
|
|
|
Current |
|
|
Non-current |
|
|
Current |
|
|
Non-current |
|
| Equity investments – listed |
|
|
|
|
– |
|
|
|
3 |
|
|
|
– |
|
|
|
1,182 |
|
|
– unlisted |
|
|
|
|
– |
|
|
|
288 |
|
|
|
– |
|
|
|
251 |
|
| Repurchased gas pre-paid bonds |
|
|
|
|
276 |
|
|
|
408 |
|
|
|
303 |
|
|
|
686 |
|
| Contingent consideration |
|
|
|
|
186 |
|
|
|
292 |
|
|
|
– |
|
|
|
– |
|
| Other |
|
|
|
|
5 |
|
|
|
574 |
|
|
|
16 |
|
|
|
585 |
|
| |
|
|
|
|
467 |
|
|
|
1,565 |
|
|
|
319 |
|
|
|
2,704 |
|
At 31 December 2012 the group’s 1.25% stake in Rosneft was the most significant listed investment, with a fair value of $1,179
million.
BP entered into long-term gas supply contracts which are backed by gas pre-paid bonds. In 2010, BP was unsuccessful in the remarketing of these bonds and
repurchased them. The outstanding bonds associated with these long-term gas supply contracts held by BP are recorded within other investments, with the related liability recorded within other payables on the balance sheet. The fair value of the gas
pre-paid bonds is the same as the carrying amount, as the bonds are based on floating rate interest with weekly market re-set, and as such are in level 1 of the fair value hierarchy.
At 31 December 2013 the group had contingent consideration receivable in respect of the disposal of the Devenick field, classified as an available-for-sale financial asset.
Other non-current investments at 31 December 2013
include $574 million relating to life insurance policies (2012 $585 million). The life insurance policies have been designated as financial assets at fair value through profit and loss and their valuation methodology is in level 3 of the fair value
hierarchy. Fair value losses of $4 million were recognized in the income statement (2012 $70 million gain and 2011 $21 million gain).
21. Inventories
|
|
|
|
|
|
|
|
|
|
|
| |
|
|
|
|
|
|
$ million |
|
| |
|
|
|
2013 |
|
|
2012 |
|
| Crude oil |
|
|
|
|
10,190 |
|
|
|
9,123 |
|
| Natural gas |
|
|
|
|
235 |
|
|
|
187 |
|
| Refined petroleum and petrochemical products |
|
|
|
|
15,427 |
|
|
|
15,465 |
|
|
|
|
|
|
25,852 |
|
|
|
24,775 |
|
| Supplies |
|
|
|
|
2,735 |
|
|
|
2,428 |
|
|
|
|
|
|
28,587 |
|
|
|
27,203 |
|
| Trading inventories |
|
|
|
|
644 |
|
|
|
1,000 |
|
| |
|
|
|
|
29,231 |
|
|
|
28,203 |
|
| Cost of inventories expensed in the income statement |
|
|
|
|
298,351 |
|
|
|
292,774 |
|
The inventory valuation at 31 December 2013 is stated net of a provision of $322 million (2012 $124 million) to write inventories
down to their net realizable value. The net charge to the income statement in the year in respect of inventory net realizable value provisions was $195 million (2012 $28 million credit).
Trading inventories are valued using quoted benchmark bid prices adjusted as appropriate for location and quality differentials. As such they are predominantly
categorized within level 2 of the fair value hierarchy.
Inventories with a carrying amount of $227 million (2012 $64 million) have been pledged as security for
certain of the group’s liabilities at 31 December 2013.
|
|
|
| 170 |
|
BP Annual Report and Form 20-F 2013 |
22. Trade and other receivables
|
|
|
|
|
|
|
|
|
|
|
|
|
|
|
|
|
|
|
| |
|
|
|
|
|
|
|
|
|
|
|
|
$ million |
|
| |
|
|
|
|
|
|
2013 |
|
|
|
|
|
2012 |
|
| |
|
|
|
Current |
|
|
Non-current |
|
|
Current |
|
|
Non-current |
|
| Financial assets |
|
|
|
|
|
|
|
|
|
|
|
|
|
|
|
|
|
|
| Trade receivables |
|
|
|
|
28,868 |
|
|
|
183 |
|
|
|
26,485 |
|
|
|
151 |
|
| Amounts receivable from joint ventures and associates |
|
|
|
|
1,213 |
|
|
|
47 |
|
|
|
871 |
|
|
|
102 |
|
| Other receivables |
|
|
|
|
6,594 |
|
|
|
2,725 |
|
|
|
5,683 |
|
|
|
2,670 |
|
| |
|
|
|
|
36,675 |
|
|
|
2,955 |
|
|
|
33,039 |
|
|
|
2,923 |
|
| Non-financial assets |
|
|
|
|
|
|
|
|
|
|
|
|
|
|
|
|
|
|
| Gulf of Mexico oil spill trust fund reimbursement asseta |
|
|
|
|
2,457 |
|
|
|
2,442 |
|
|
|
4,178 |
|
|
|
2,264 |
|
| Other receivables |
|
|
|
|
699 |
|
|
|
588 |
|
|
|
394 |
|
|
|
774 |
|
| |
|
|
|
|
3,156 |
|
|
|
3,030 |
|
|
|
4,572 |
|
|
|
3,038 |
|
| |
|
|
|
|
39,831 |
|
|
|
5,985 |
|
|
|
37,611 |
|
|
|
5,961 |
|
| a |
See Note 2 for further information. |
Trade and other receivables are predominantly non-interest bearing. See Note 19 for
further information.
Receivables with a carrying amount of $236 million (2012 $12 million) have been pledged as security for certain of the group’s liabilities
at 31 December 2013.
23. Cash and cash equivalents
|
|
|
|
|
|
|
|
|
|
|
| |
|
|
|
|
|
|
$ million |
|
| |
|
|
|
2013 |
|
|
2012 |
|
| Cash at bank and in hand |
|
|
|
|
6,907 |
|
|
|
5,885 |
|
| Term bank deposits |
|
|
|
|
12,246 |
|
|
|
9,243 |
|
| Cash equivalents |
|
|
|
|
3,367 |
|
|
|
4,507 |
|
| |
|
|
|
|
22,520 |
|
|
|
19,635 |
|
Cash and cash equivalents comprise cash in hand; current balances with banks and similar institutions; term deposits of three months or
less with banks and similar institutions; money market funds and commercial paper. The carrying amounts of cash at bank and in hand and term bank deposits approximate their fair values. Substantially all of the other cash equivalents are categorized
within level 1 of the fair value hierarchy.
Cash and cash equivalents at 31 December 2013 includes $1,626 million (2012 $1,544 million) that is restricted.
Included in restricted cash at 31 December 2012 was $709 million relating to the dividend received from TNK-BP in December 2012 which remained restricted until completion of the sale of BP’s interest in TNK-BP to Rosneft, which occurred in
the first quarter of 2013. See Note 6 for further information. The remaining restricted cash balances relate largely to amounts required to cover initial margin on trading exchanges.
24. Valuation and qualifying accounts
|
|
|
|
|
|
|
|
|
|
|
|
|
|
|
|
|
|
|
|
|
|
|
|
|
|
|
| |
|
|
|
|
|
|
|
|
|
|
|
|
|
|
|
|
|
|
$ million |
|
| |
|
|
|
|
|
|
2013 |
|
|
|
|
|
2012 |
|
|
|
|
|
2011 |
|
| |
|
|
|
Accounts
receivable |
|
|
Fixed asset
investments |
|
|
Accounts
receivable |
|
|
Fixed asset
investments |
|
|
Accounts
receivable |
|
|
Fixed asset
investments |
|
| At 1 January |
|
|
|
|
489 |
|
|
|
349 |
|
|
|
332 |
|
|
|
643 |
|
|
|
428 |
|
|
|
540 |
|
| Charged to costs and expenses |
|
|
|
|
82 |
|
|
|
4 |
|
|
|
240 |
|
|
|
196 |
|
|
|
115 |
|
|
|
111 |
|
| Charged to other accountsa |
|
|
|
|
(4 |
) |
|
|
4 |
|
|
|
7 |
|
|
|
18 |
|
|
|
(16 |
) |
|
|
(3 |
) |
| Deductions |
|
|
|
|
(224 |
) |
|
|
(189 |
) |
|
|
(90 |
) |
|
|
(508 |
) |
|
|
(195 |
) |
|
|
(5 |
) |
| At 31 December |
|
|
|
|
343 |
|
|
|
168 |
|
|
|
489 |
|
|
|
349 |
|
|
|
332 |
|
|
|
643 |
|
| a |
Principally currency transactions. |
Valuation and qualifying accounts comprise impairment provisions for accounts
receivable and fixed asset investments, and are deducted in the balance sheet from the assets to which they apply.
25.
Trade and other payables
|
|
|
|
|
|
|
|
|
|
|
|
|
|
|
|
|
|
|
| |
|
|
|
|
|
|
|
|
|
|
|
|
$ million |
|
| |
|
|
|
|
|
|
2013 |
|
|
|
|
|
2012 |
|
| |
|
|
|
Current |
|
|
Non-current |
|
|
Current |
|
|
Non-current |
|
| Financial liabilities |
|
|
|
|
|
|
|
|
|
|
|
|
|
|
|
|
|
|
| Trade payables |
|
|
|
|
28,926 |
|
|
|
– |
|
|
|
29,920 |
|
|
|
– |
|
| Amounts payable to joint ventures and associates |
|
|
|
|
3,576 |
|
|
|
47 |
|
|
|
1,105 |
|
|
|
102 |
|
| Other payables |
|
|
|
|
11,288 |
|
|
|
4,235 |
|
|
|
11,487 |
|
|
|
1,791 |
|
| |
|
|
|
|
43,790 |
|
|
|
4,282 |
|
|
|
42,512 |
|
|
|
1,893 |
|
| Non-financial liabilities |
|
|
|
|
|
|
|
|
|
|
|
|
|
|
|
|
|
|
| Other payables |
|
|
|
|
3,369 |
|
|
|
474 |
|
|
|
4,161 |
|
|
|
399 |
|
| |
|
|
|
|
47,159 |
|
|
|
4,756 |
|
|
|
46,673 |
|
|
|
2,292 |
|
Trade and other payables are predominantly non-interest bearing. See Note 19 for further information.
|
|
|
|
|
| BP Annual Report and Form 20-F 2013 |
|
|
171 |
|
26. Derivative financial instruments
In the normal course of business the group enters into derivative financial instruments (derivatives) to manage its normal business exposures in relation to commodity
prices, foreign currency exchange rates and interest rates, including management of the balance between floating rate and fixed rate debt, consistent with risk management policies and objectives. An outline of the group’s financial risks and
the objectives and policies pursued in relation to those risks is set out in Note 19. Additionally, the group has a well-established entrepreneurial trading operation that is undertaken in conjunction with these activities using a similar range of
contracts.
The fair values of derivative financial instruments at 31 December are set out below.
|
|
|
|
|
|
|
|
|
|
|
|
|
|
|
|
|
|
|
| |
|
|
|
|
|
|
|
|
|
|
|
|
$ million |
|
| |
|
|
|
|
|
|
2013 |
|
|
|
|
|
2012 |
|
| |
|
|
|
Fair value
asset |
|
|
Fair value
liability |
|
|
Fair value
asset |
|
|
Fair value
liability |
|
| Derivatives held for trading |
|
|
|
|
|
|
|
|
|
|
|
|
|
|
|
|
|
|
| Currency derivatives |
|
|
|
|
192 |
|
|
|
(111 |
) |
|
|
175 |
|
|
|
(189 |
) |
| Oil price derivatives |
|
|
|
|
810 |
|
|
|
(806 |
) |
|
|
841 |
|
|
|
(707 |
) |
| Natural gas price derivatives |
|
|
|
|
2,840 |
|
|
|
(2,029 |
) |
|
|
3,536 |
|
|
|
(2,496 |
) |
| Power price derivatives |
|
|
|
|
871 |
|
|
|
(560 |
) |
|
|
719 |
|
|
|
(589 |
) |
| Other derivatives |
|
|
|
|
475 |
|
|
|
– |
|
|
|
71 |
|
|
|
– |
|
| |
|
|
|
|
5,188 |
|
|
|
(3,506 |
) |
|
|
5,342 |
|
|
|
(3,981 |
) |
| Embedded derivatives |
|
|
|
|
|
|
|
|
|
|
|
|
|
|
|
|
|
|
| Commodity price contracts |
|
|
|
|
1 |
|
|
|
(653 |
) |
|
|
– |
|
|
|
(1,112 |
) |
| |
|
|
|
|
1 |
|
|
|
(653 |
) |
|
|
– |
|
|
|
(1,112 |
) |
| Cash flow hedges |
|
|
|
|
|
|
|
|
|
|
|
|
|
|
|
|
|
|
| Equity price derivatives |
|
|
|
|
– |
|
|
|
– |
|
|
|
1,339 |
|
|
|
– |
|
| Currency forwards, futures and cylinders |
|
|
|
|
129 |
|
|
|
(30 |
) |
|
|
51 |
|
|
|
(41 |
) |
| Cross-currency interest rate swaps |
|
|
|
|
– |
|
|
|
(69 |
) |
|
|
1 |
|
|
|
– |
|
| |
|
|
|
|
129 |
|
|
|
(99 |
) |
|
|
1,391 |
|
|
|
(41 |
) |
| Fair value hedges |
|
|
|
|
|
|
|
|
|
|
|
|
|
|
|
|
|
|
| Currency forwards, futures and swaps |
|
|
|
|
340 |
|
|
|
(154 |
) |
|
|
875 |
|
|
|
(247 |
) |
| Interest rate swaps |
|
|
|
|
526 |
|
|
|
(135 |
) |
|
|
1,193 |
|
|
|
– |
|
| |
|
|
|
|
866 |
|
|
|
(289 |
) |
|
|
2,068 |
|
|
|
(247 |
) |
| |
|
|
|
|
6,184 |
|
|
|
(4,547 |
) |
|
|
8,801 |
|
|
|
(5,381 |
) |
| Of which – current |
|
|
|
|
2,675 |
|
|
|
(2,322 |
) |
|
|
4,507 |
|
|
|
(2,658 |
) |
| –
non-current |
|
|
|
|
3,509 |
|
|
|
(2,225 |
) |
|
|
4,294 |
|
|
|
(2,723 |
) |
Exchange traded derivatives are valued using closing prices provided by the exchange as at the balance sheet date. These derivatives are
categorized within level 1 of the fair value hierarchy. Over-the-counter (OTC) financial swaps and physical commodity sale and purchase contracts are generally valued using readily available information in the public markets and quotations provided
by brokers and price index developers. These quotes are corroborated with market data and are categorized within level 2 of the fair value hierarchy.
In certain less
liquid markets, or for longer-term contracts, forward prices are not as readily available. In these circumstances, OTC financial swaps and physical commodity sale and purchase contracts are valued using internally developed methodologies that
consider historical relationships between various commodities, and that result in management’s best estimate of fair value. These contracts are categorized within level 3 of the fair value hierarchy.
Financial OTC and physical commodity options are valued using industry standard models that consider various assumptions, including quoted forward prices for commodities,
time value, volatility factors, and contractual prices for the underlying instruments, as well as other relevant economic factors. The degree to which these inputs are observable in the forward markets determines whether the option is categorized
within level 2 or level 3 of the fair value hierarchy.
Derivatives held for trading
The group maintains active trading positions in a variety of derivatives. The contracts may be entered into for risk management purposes, to satisfy supply requirements
or for entrepreneurial trading. Certain contracts are classified as held for trading, regardless of their original business objective, and are recognized at fair value with changes in fair value recognized in the income statement. Trading activities
are undertaken by using a range of contract types in combination to create incremental gains by arbitraging prices between markets, locations and time periods. The net of these exposures is monitored using market value-at-risk techniques as
described in Note 19.
|
|
|
| 172 |
|
BP Annual Report and Form 20-F 2013 |
26. Derivative financial instruments – continued
The following tables show further information on the fair value of derivatives and other financial instruments held for
trading purposes.
Derivative assets held for trading have the following fair values and maturities.
|
|
|
|
|
|
|
|
|
|
|
|
|
|
|
|
|
|
|
|
|
|
|
|
|
|
|
|
|
|
|
| |
|
|
|
|
|
|
|
|
|
|
|
|
|
|
|
|
|
|
|
|
|
$ million |
|
| |
|
|
|
|
|
|
|
|
|
|
|
|
|
|
|
|
|
|
|
|
|
2013 |
|
| |
|
|
|
Less than
1 year |
|
|
1-2 years |
|
|
2-3 years |
|
|
3-4 years |
|
|
4-5 years |
|
|
Over
5 years |
|
|
Total |
|
| Currency derivatives |
|
|
|
|
143 |
|
|
|
– |
|
|
|
21 |
|
|
|
– |
|
|
|
– |
|
|
|
28 |
|
|
|
192 |
|
| Oil price derivatives |
|
|
|
|
694 |
|
|
|
78 |
|
|
|
23 |
|
|
|
13 |
|
|
|
2 |
|
|
|
– |
|
|
|
810 |
|
| Natural gas price derivatives |
|
|
|
|
1,034 |
|
|
|
526 |
|
|
|
334 |
|
|
|
192 |
|
|
|
154 |
|
|
|
600 |
|
|
|
2,840 |
|
| Power price derivatives |
|
|
|
|
528 |
|
|
|
202 |
|
|
|
81 |
|
|
|
22 |
|
|
|
8 |
|
|
|
30 |
|
|
|
871 |
|
| Other derivatives |
|
|
|
|
102 |
|
|
|
– |
|
|
|
93 |
|
|
|
147 |
|
|
|
66 |
|
|
|
67 |
|
|
|
475 |
|
| |
|
|
|
|
2,501 |
|
|
|
806 |
|
|
|
552 |
|
|
|
374 |
|
|
|
230 |
|
|
|
725 |
|
|
|
5,188 |
|
|
|
|
|
|
|
|
|
|
|
|
|
|
|
|
|
|
|
|
|
|
|
|
|
|
|
|
|
|
|
|
| |
|
|
|
|
|
|
|
|
|
|
|
|
|
|
|
|
|
|
|
|
|
$ million |
|
| |
|
|
|
|
|
|
|
|
|
|
|
|
|
|
|
|
|
|
|
|
|
2012 |
|
| |
|
|
|
Less than
1 year |
|
|
1-2 years |
|
|
2-3 years |
|
|
3-4 years |
|
|
4-5 years |
|
|
Over
5 years |
|
|
Total |
|
| Currency derivatives |
|
|
|
|
169 |
|
|
|
6 |
|
|
|
– |
|
|
|
– |
|
|
|
– |
|
|
|
– |
|
|
|
175 |
|
| Oil price derivatives |
|
|
|
|
656 |
|
|
|
109 |
|
|
|
38 |
|
|
|
21 |
|
|
|
12 |
|
|
|
5 |
|
|
|
841 |
|
| Natural gas price derivatives |
|
|
|
|
1,532 |
|
|
|
711 |
|
|
|
418 |
|
|
|
259 |
|
|
|
144 |
|
|
|
472 |
|
|
|
3,536 |
|
| Power price derivatives |
|
|
|
|
327 |
|
|
|
188 |
|
|
|
114 |
|
|
|
62 |
|
|
|
19 |
|
|
|
9 |
|
|
|
719 |
|
| Other derivatives |
|
|
|
|
71 |
|
|
|
– |
|
|
|
– |
|
|
|
– |
|
|
|
– |
|
|
|
– |
|
|
|
71 |
|
| |
|
|
|
|
2,755 |
|
|
|
1,014 |
|
|
|
570 |
|
|
|
342 |
|
|
|
175 |
|
|
|
486 |
|
|
|
5,342 |
|
At 31 December 2013 the group had contingent consideration receivable in respect of a business disposal. The sale agreement contained
an embedded derivative – the whole agreement has, consequently, been designated at fair value through profit or loss and shown within other derivatives held for trading, and falls within level 3 of the fair value hierarchy. The valuation
depends on refinery throughput and future margins. At 31 December 2012, other derivatives related to the anticipated transaction with Rosneft – see Cash flow hedges below for further information.
Derivative liabilities held for trading have the following fair values and maturities.
|
|
|
|
|
|
|
|
|
|
|
|
|
|
|
|
|
|
|
|
|
|
|
|
|
|
|
|
|
|
|
| |
|
|
|
|
|
|
|
|
|
|
|
|
|
|
|
|
|
|
|
|
|
$ million |
|
| |
|
|
|
|
|
|
|
|
|
|
|
|
|
|
|
|
|
|
|
|
|
2013 |
|
| |
|
|
|
Less than
1 year |
|
|
1-2 years |
|
|
2-3 years |
|
|
3-4 years |
|
|
4-5 years |
|
|
Over
5 years |
|
|
Total |
|
| Currency derivatives |
|
|
|
|
(111 |
) |
|
|
– |
|
|
|
– |
|
|
|
– |
|
|
|
– |
|
|
|
– |
|
|
|
(111 |
) |
| Oil price derivatives |
|
|
|
|
(620 |
) |
|
|
(100 |
) |
|
|
(42 |
) |
|
|
(31 |
) |
|
|
(13 |
) |
|
|
– |
|
|
|
(806 |
) |
| Natural gas price derivatives |
|
|
|
|
(778 |
) |
|
|
(319 |
) |
|
|
(157 |
) |
|
|
(110 |
) |
|
|
(102 |
) |
|
|
(563 |
) |
|
|
(2,029 |
) |
| Power price derivatives |
|
|
|
|
(400 |
) |
|
|
(99 |
) |
|
|
(48 |
) |
|
|
(13 |
) |
|
|
– |
|
|
|
– |
|
|
|
(560 |
) |
| |
|
|
|
|
(1,909 |
) |
|
|
(518 |
) |
|
|
(247 |
) |
|
|
(154 |
) |
|
|
(115 |
) |
|
|
(563 |
) |
|
|
(3,506 |
) |
|
|
|
|
|
|
|
|
|
|
|
|
|
|
|
|
|
|
|
|
|
|
|
|
|
|
|
|
|
|
|
| |
|
|
|
|
|
|
|
|
|
|
|
|
|
|
|
|
|
|
|
|
|
$ million |
|
| |
|
|
|
|
|
|
|
|
|
|
|
|
|
|
|
|
|
|
|
|
|
2012 |
|
| |
|
|
|
Less than
1 year |
|
|
1-2 years |
|
|
2-3 years |
|
|
3-4 years |
|
|
4-5 years |
|
|
Over
5 years |
|
|
Total |
|
| Currency derivatives |
|
|
|
|
(189 |
) |
|
|
– |
|
|
|
– |
|
|
|
– |
|
|
|
– |
|
|
|
– |
|
|
|
(189 |
) |
| Oil price derivatives |
|
|
|
|
(580 |
) |
|
|
(77 |
) |
|
|
(27 |
) |
|
|
(12 |
) |
|
|
(8 |
) |
|
|
(3 |
) |
|
|
(707 |
) |
| Natural gas price derivatives |
|
|
|
|
(1,199 |
) |
|
|
(440 |
) |
|
|
(241 |
) |
|
|
(135 |
) |
|
|
(78 |
) |
|
|
(403 |
) |
|
|
(2,496 |
) |
| Power price derivatives |
|
|
|
|
(341 |
) |
|
|
(133 |
) |
|
|
(59 |
) |
|
|
(21 |
) |
|
|
(10 |
) |
|
|
(25 |
) |
|
|
(589 |
) |
| |
|
|
|
|
(2,309 |
) |
|
|
(650 |
) |
|
|
(327 |
) |
|
|
(168 |
) |
|
|
(96 |
) |
|
|
(431 |
) |
|
|
(3,981 |
) |
|
|
|
|
|
| BP Annual Report and Form 20-F 2013 |
|
|
173 |
|
26. Derivative financial instruments – continued
The following table shows the fair value of derivative assets and derivative liabilities held for
trading, analysed by maturity period and by methodology of fair value estimation. This information is presented on a gross basis, that is, before netting by counterparty.
|
|
|
|
|
|
|
|
|
|
|
|
|
|
|
|
|
|
|
|
|
|
|
|
|
|
|
|
|
|
|
| |
|
|
|
|
|
|
|
|
|
|
|
|
|
|
|
|
|
|
|
|
|
$ million |
|
| |
|
|
|
|
|
|
|
|
|
|
|
|
|
|
|
|
|
|
|
|
|
2013 |
|
| |
|
|
|
Less than
1 year |
|
|
1-2 years |
|
|
2-3 years |
|
|
3-4 years |
|
|
4-5 years |
|
|
Over
5 years |
|
|
Total |
|
| Fair value of derivative assets |
|
|
|
|
|
|
|
|
|
|
|
|
|
|
|
|
|
|
|
|
|
|
|
|
|
|
|
|
|
|
| Level 1 |
|
|
|
|
100 |
|
|
|
– |
|
|
|
– |
|
|
|
– |
|
|
|
– |
|
|
|
– |
|
|
|
100 |
|
| Level 2 |
|
|
|
|
3,118 |
|
|
|
981 |
|
|
|
399 |
|
|
|
83 |
|
|
|
20 |
|
|
|
30 |
|
|
|
4,631 |
|
| Level 3 |
|
|
|
|
389 |
|
|
|
183 |
|
|
|
252 |
|
|
|
291 |
|
|
|
210 |
|
|
|
695 |
|
|
|
2,020 |
|
|
|
|
|
|
3,607 |
|
|
|
1,164 |
|
|
|
651 |
|
|
|
374 |
|
|
|
230 |
|
|
|
725 |
|
|
|
6,751 |
|
| Less: netting by counterparty |
|
|
|
|
(1,106 |
) |
|
|
(358 |
) |
|
|
(99 |
) |
|
|
– |
|
|
|
– |
|
|
|
– |
|
|
|
(1,563 |
) |
| |
|
|
|
|
2,501 |
|
|
|
806 |
|
|
|
552 |
|
|
|
374 |
|
|
|
230 |
|
|
|
725 |
|
|
|
5,188 |
|
| Fair value of derivative liabilities |
|
|
|
|
|
|
|
|
|
|
|
|
|
|
|
|
|
|
|
|
|
|
|
|
|
|
|
|
|
|
| Level 1 |
|
|
|
|
(87 |
) |
|
|
– |
|
|
|
– |
|
|
|
– |
|
|
|
– |
|
|
|
– |
|
|
|
(87 |
) |
| Level 2 |
|
|
|
|
(2,790 |
) |
|
|
(733 |
) |
|
|
(215 |
) |
|
|
(36 |
) |
|
|
(15 |
) |
|
|
(31 |
) |
|
|
(3,820 |
) |
| Level 3 |
|
|
|
|
(138 |
) |
|
|
(143 |
) |
|
|
(131 |
) |
|
|
(118 |
) |
|
|
(100 |
) |
|
|
(532 |
) |
|
|
(1,162 |
) |
|
|
|
|
|
(3,015 |
) |
|
|
(876 |
) |
|
|
(346 |
) |
|
|
(154 |
) |
|
|
(115 |
) |
|
|
(563 |
) |
|
|
(5,069 |
) |
| Less: netting by counterparty |
|
|
|
|
1,106 |
|
|
|
358 |
|
|
|
99 |
|
|
|
– |
|
|
|
– |
|
|
|
– |
|
|
|
1,563 |
|
| |
|
|
|
|
(1,909 |
) |
|
|
(518 |
) |
|
|
(247 |
) |
|
|
(154 |
) |
|
|
(115 |
) |
|
|
(563 |
) |
|
|
(3,506 |
) |
| Net fair value |
|
|
|
|
592 |
|
|
|
288 |
|
|
|
305 |
|
|
|
220 |
|
|
|
115 |
|
|
|
162 |
|
|
|
1,682 |
|
|
|
|
|
|
|
|
|
|
|
|
|
|
|
|
|
|
|
|
|
|
|
|
|
|
|
|
|
|
|
|
| |
|
|
|
|
|
|
|
|
|
|
|
|
|
|
|
|
|
|
|
|
|
$ million |
|
| |
|
|
|
|
|
|
|
|
|
|
|
|
|
|
|
|
|
|
|
|
|
2012 |
|
| |
|
|
|
Less than
1 year |
|
|
1-2 years |
|
|
2-3 years |
|
|
3-4 years |
|
|
4-5 years |
|
|
Over
5 years |
|
|
Total |
|
| Fair value of derivative assets |
|
|
|
|
|
|
|
|
|
|
|
|
|
|
|
|
|
|
|
|
|
|
|
|
|
|
|
|
|
|
| Level 1 |
|
|
|
|
187 |
|
|
|
6 |
|
|
|
– |
|
|
|
– |
|
|
|
– |
|
|
|
– |
|
|
|
193 |
|
| Level 2 |
|
|
|
|
3,766 |
|
|
|
1,088 |
|
|
|
520 |
|
|
|
216 |
|
|
|
46 |
|
|
|
10 |
|
|
|
5,646 |
|
| Level 3 |
|
|
|
|
302 |
|
|
|
184 |
|
|
|
137 |
|
|
|
136 |
|
|
|
136 |
|
|
|
478 |
|
|
|
1,373 |
|
|
|
|
|
|
4,255 |
|
|
|
1,278 |
|
|
|
657 |
|
|
|
352 |
|
|
|
182 |
|
|
|
488 |
|
|
|
7,212 |
|
| Less: netting by counterparty |
|
|
|
|
(1,500 |
) |
|
|
(264 |
) |
|
|
(87 |
) |
|
|
(10 |
) |
|
|
(7 |
) |
|
|
(2 |
) |
|
|
(1,870 |
) |
| |
|
|
|
|
2,755 |
|
|
|
1,014 |
|
|
|
570 |
|
|
|
342 |
|
|
|
175 |
|
|
|
486 |
|
|
|
5,342 |
|
| Fair value of derivative liabilities |
|
|
|
|
|
|
|
|
|
|
|
|
|
|
|
|
|
|
|
|
|
|
|
|
|
|
|
|
|
|
| Level 1 |
|
|
|
|
(189 |
) |
|
|
– |
|
|
|
– |
|
|
|
– |
|
|
|
– |
|
|
|
– |
|
|
|
(189 |
) |
| Level 2 |
|
|
|
|
(3,476 |
) |
|
|
(810 |
) |
|
|
(315 |
) |
|
|
(78 |
) |
|
|
(19 |
) |
|
|
(28 |
) |
|
|
(4,726 |
) |
| Level 3 |
|
|
|
|
(144 |
) |
|
|
(104 |
) |
|
|
(99 |
) |
|
|
(100 |
) |
|
|
(84 |
) |
|
|
(405 |
) |
|
|
(936 |
) |
|
|
|
|
|
(3,809 |
) |
|
|
(914 |
) |
|
|
(414 |
) |
|
|
(178 |
) |
|
|
(103 |
) |
|
|
(433 |
) |
|
|
(5,851 |
) |
| Less: netting by counterparty |
|
|
|
|
1,500 |
|
|
|
264 |
|
|
|
87 |
|
|
|
10 |
|
|
|
7 |
|
|
|
2 |
|
|
|
1,870 |
|
| |
|
|
|
|
(2,309 |
) |
|
|
(650 |
) |
|
|
(327 |
) |
|
|
(168 |
) |
|
|
(96 |
) |
|
|
(431 |
) |
|
|
(3,981 |
) |
| Net fair value |
|
|
|
|
446 |
|
|
|
364 |
|
|
|
243 |
|
|
|
174 |
|
|
|
79 |
|
|
|
55 |
|
|
|
1,361 |
|
Level 3 derivatives
The
following table shows the changes during the year in the net fair value of derivatives held for trading purposes within level 3 of the fair value hierarchy.
|
|
|
|
|
|
|
|
|
|
|
|
|
|
|
|
|
|
|
|
|
|
|
| |
|
|
|
|
|
|
|
|
|
|
|
|
|
|
|
$ million |
|
| |
|
|
|
Oil
price |
|
|
Natural gas
price |
|
|
Power
price |
|
|
Other |
|
|
Total |
|
| Net fair value of contracts at 1 January 2013 |
|
|
|
|
105 |
|
|
|
304 |
|
|
|
(43 |
) |
|
|
71 |
|
|
|
437 |
|
| Gains (losses) recognized in the income statement |
|
|
|
|
(47 |
) |
|
|
62 |
|
|
|
81 |
|
|
|
– |
|
|
|
96 |
|
| Purchases |
|
|
|
|
110 |
|
|
|
1 |
|
|
|
– |
|
|
|
– |
|
|
|
111 |
|
| New contracts |
|
|
|
|
– |
|
|
|
– |
|
|
|
– |
|
|
|
475 |
|
|
|
475 |
|
| Settlements |
|
|
|
|
(143 |
) |
|
|
(52 |
) |
|
|
10 |
|
|
|
(71 |
) |
|
|
(256 |
) |
| Transfers out of level 3 |
|
|
|
|
(43 |
) |
|
|
(1 |
) |
|
|
36 |
|
|
|
– |
|
|
|
(8 |
) |
| Exchange adjustments |
|
|
|
|
– |
|
|
|
(1 |
) |
|
|
2 |
|
|
|
– |
|
|
|
1 |
|
| Net fair value of contracts at 31 December 2013 |
|
|
|
|
(18 |
) |
|
|
313 |
|
|
|
86 |
|
|
|
475 |
|
|
|
856 |
|
|
|
|
| 174 |
|
BP Annual Report and Form 20-F 2013 |
26. Derivative financial instruments – continued
|
|
|
|
|
|
|
|
|
|
|
|
|
|
|
|
|
|
|
|
|
|
|
| |
|
|
|
|
|
|
|
|
|
|
|
|
|
|
|
$ million |
|
| |
|
|
|
Oil
price |
|
|
Natural gas
price |
|
|
Power
price |
|
|
Other |
|
|
Total |
|
| Net fair value of contracts at 1 January 2012 |
|
|
|
|
162 |
|
|
|
408 |
|
|
|
13 |
|
|
|
– |
|
|
|
583 |
|
| Gains (losses) recognized in the income statement |
|
|
|
|
30 |
|
|
|
4 |
|
|
|
(4 |
) |
|
|
– |
|
|
|
30 |
|
| New contracts |
|
|
|
|
– |
|
|
|
– |
|
|
|
– |
|
|
|
71 |
|
|
|
71 |
|
| Settlements |
|
|
|
|
(87 |
) |
|
|
(56 |
) |
|
|
– |
|
|
|
– |
|
|
|
(143 |
) |
| Transfers into level 3 |
|
|
|
|
– |
|
|
|
(19 |
) |
|
|
– |
|
|
|
– |
|
|
|
(19 |
) |
| Transfers out of level 3 |
|
|
|
|
– |
|
|
|
(33 |
) |
|
|
(51 |
) |
|
|
– |
|
|
|
(84 |
) |
| Exchange adjustments |
|
|
|
|
– |
|
|
|
– |
|
|
|
(1 |
) |
|
|
– |
|
|
|
(1 |
) |
| Net fair value of contracts at 31 December 2012 |
|
|
|
|
105 |
|
|
|
304 |
|
|
|
(43 |
) |
|
|
71 |
|
|
|
437 |
|
US natural gas price derivatives are valued using observable market data for maturities up to 60 months in basis locations that trade at a
premium or discount to the NYMEX Henry Hub price, and using internally developed price curves based on economic forecasts for periods beyond that time. At 31 December 2013, the US natural gas derivatives in level 3 of the fair value
hierarchy had a net fair value of $351 million. Of this amount, $71 million (asset of $598 million and liability of $527 million) depends on level 3 inputs, with the remainder valued using level 2 inputs. The significant unobservable inputs for
fair value measurements categorized within level 3 of the fair value hierarchy for the year ended 31 December 2013 are presented below.
|
|
|
|
|
|
|
|
|
|
|
|
|
| |
|
|
|
Unobservable inputs |
|
Range
$/mmBtu |
|
|
Weighted average
$/mmBtu |
|
| Natural gas price contracts |
|
|
|
Long-dated market price |
|
|
3.15-6.71 |
|
|
|
4.63 |
|
If the natural gas prices after 2018 were 10% higher (lower), this would result in a decrease (increase) in derivative assets of $82
million, and decrease (increase) in derivative liabilities of $78 million, and a net decrease (increase) in profit before tax of $4 million.
Derivative gains and losses
Gains and losses relating to derivative contracts are included within sales and other operating revenues and
within purchases in the income statement depending upon the nature of the activity and type of contract involved. The contract types treated in this way include futures, options, swaps and certain forward sales and forward purchases contracts, and
relate to both currency and commodity trading activities. Gains or losses arise on contracts entered into for risk management purposes, optimization activity and entrepreneurial trading. They also arise on certain contracts that are for normal
procurement or sales activity for the group but that are required to be fair valued under accounting standards. Also included within sales and other operating revenues are gains and losses on inventory held for trading purposes. The total amount
relating to all these items (excluding gains and losses on realized physical derivative contracts that have been reflected gross in the income statement within sales and purchases) was a gain of $587 million (2012 $411 million net loss and 2011 $216
million net gaina).
| a |
The comparative amounts for 2012 and 2011 have been amended and now reflect only the margin on derivative contracts that have been reflected net within the income statement. |
Embedded derivatives
The group is a party to
contracts containing embedded derivatives, the majority of which relate to certain natural gas contracts. Prior to the development of an active gas trading market, UK gas contracts were priced using a basket of available price indices, primarily
relating to oil products, power and inflation. After the development of an active UK gas market, certain contracts were entered into or renegotiated using pricing formulae not directly related to gas prices, for example, oil product and power
prices. In these circumstances, pricing formulae have been determined to be derivatives, embedded within the overall contractual arrangements that are not clearly and closely related to the underlying commodity. The resulting fair value relating to
these contracts is recognized on the balance sheet with gains or losses recognized in the income statement.
Key information on the natural gas contracts is given
below.
|
|
|
|
|
|
|
|
|
| At 31 December |
|
|
|
|
|
2013 |
|
2012 |
| Remaining contract terms |
|
|
|
|
|
1 year and 5 months to 4 years and 9 months |
|
2 years and 5 months to 5 years and 9 months |
| Contractual/notional amount |
|
|
|
|
|
153 million therms |
|
117 million therms |
The commodity price embedded derivatives relate to natural gas contracts and are categorized in levels 2 and 3 of the fair value
hierarchy. The contracts in level 2 are valued using inputs that include price curves for each of the different products that are built up from active market pricing data. Where necessary, the price curves are extrapolated to the expiry of the
contracts (the last of which is in 2018) using all available external pricing information; additionally, where limited data exists for certain products, prices are interpolated using historic and long-term pricing relationships. These valuations are
categorized in level 3. Transfers from level 3 to level 2 occur when the valuation no longer depends significantly on extrapolated or interpolated data. Valuations use observable market data for maturities up to 36 months, and internally developed
price curves based on economic forecasts for periods beyond that time.
The following table shows the changes during the year in the net fair value of embedded
derivatives, within level 3 of the fair value hierarchy.
|
|
|
|
|
|
|
|
|
|
|
| |
|
|
|
|
|
|
$ million |
|
| |
|
|
|
2013 |
|
|
2012 |
|
| |
|
|
|
Commodity
price |
|
|
Commodity
price |
|
| Net fair value of contracts at 1 January |
|
|
|
|
(1,112 |
) |
|
|
(1,417 |
) |
| Settlements |
|
|
|
|
316 |
|
|
|
375 |
|
| Gains (losses) recognized in the income statement |
|
|
|
|
142 |
|
|
|
(6 |
) |
| Transfers out of level 3 |
|
|
|
|
258 |
|
|
|
– |
|
| Exchange adjustments |
|
|
|
|
17 |
|
|
|
(64 |
) |
| Net fair value of contracts at 31 December |
|
|
|
|
(379 |
) |
|
|
(1,112 |
) |
|
|
|
|
|
| BP Annual Report and Form 20-F 2013 |
|
|
175 |
|
26. Derivative financial instruments – continued
The fair value gain (loss) on embedded derivatives is shown below.
|
|
|
|
|
|
|
|
|
|
|
|
|
|
|
| |
|
|
|
|
|
|
|
|
|
$ million |
|
| |
|
|
|
2013 |
|
|
2012 |
|
|
2011 |
|
| Commodity price embedded derivatives |
|
|
|
|
459 |
|
|
|
347 |
|
|
|
190 |
|
| Other embedded derivatives |
|
|
|
|
– |
|
|
|
– |
|
|
|
(122 |
) |
| Fair value gain (loss) |
|
|
|
|
459 |
|
|
|
347 |
|
|
|
68 |
|
Cash flow hedges
At 31 December 2013, the group held currency forwards and futures contracts and cylinders that were being used to hedge the foreign currency risk of highly probable
forecast transactions. Note 19 outlines the management of risk aspects for currency risk. For cash flow hedges the group only claims hedge accounting for the intrinsic value on the currency with any fair value attributable to time value taken
immediately to the income statement. The pre-tax amount reclassified from equity and recognized in the income statement in production and manufacturing expenses was a loss of $4 million (2012 $62 million loss and 2011 $195 million gain). The amount
reclassified from equity and recognized in the carrying amount of non-financial assets was a loss of $17 million (2012 $19 million loss and 2011 $13 million gain). The amounts remaining in equity at 31 December 2013 in relation to these cash
flow hedges consist of deferred gains of $85 million maturing in 2014, deferred losses of $23 million maturing in 2015 and deferred gains of $10 million maturing in 2016 and beyond.
At 31 December 2012, BP had entered into three agreements to sell its 50% interest in TNK-BP and acquire 18.5% of Rosneft, as described in Note 6. During the period
from signing until completion on 21 March 2013, these agreements represented derivative financial instruments that were required to be measured at fair value. BP designated two of the agreements, for the acquisition of a 5.66% shareholding in
Rosneft from Rosneftegaz, and for the acquisition of a 9.80% shareholding from Rosneft, as hedging instruments in a cash flow hedge, and so changes in the fair values of these agreements were recognized in other comprehensive income. The third
agreement, under which BP sold its 50% interest in TNK-BP in exchange for cash and a 3.04% shareholding in Rosneft, was also a derivative financial instrument, but its fair value could not be reliably measured. An asset of $1,410 million
related to these agreements was recognized on the balance sheet at 31 December 2012, of which $1,339 million related to the fair value of the cash flow hedge derivatives. The derivatives measured at fair value at 31 December 2012 were
categorized in level 3 of the fair value hierarchy using inputs that included the quoted Rosneft share price. During 2013, a charge of $2,061 million was recognized in other comprehensive income in relation to these agreements and $4 million was
recognized in the income statement. The resulting cumulative charge of $651 million recognized in other comprehensive income would only be recognized in the income statement if the investment in Rosneft were either sold or impaired. The cash flow
hedge derivatives were valued using the quoted Rosneft share price at the time the deal completed, of $7.60 per share.
Fair value hedges
At 31 December 2013, the group held interest rate and cross-currency interest rate swap contracts as fair value hedges of the interest rate risk on
fixed rate debt issued by the group. The effectiveness of each hedge relationship is quantitatively assessed and demonstrated to continue to be highly effective. The loss on the hedging derivative instruments recognized in the income statement in
2013 was $1,240 million (2012 $536 million gain and 2011 $328 million gain) offset by a gain on the fair value of the finance debt of $1,228 million (2012 $537 million loss and 2011 $327 million loss).
The interest rate and cross-currency interest rate swaps mature within one to 10 years, with an average maturity of four to five years (2012 four to five years) and are
used to convert sterling, euro, Swiss franc, Australian dollar, Canadian dollar and Hong Kong dollar denominated borrowings primarily into US dollar floating rate debt. Note 19 outlines the group’s approach to interest rate and currency risk
management.
27. Finance debt
|
|
|
|
|
|
|
|
|
|
|
|
|
|
|
|
|
|
|
|
|
|
|
|
|
|
|
| |
|
|
|
|
|
|
|
|
|
|
|
|
|
|
|
|
|
|
$ million |
|
| |
|
|
|
|
|
|
|
|
|
2013 |
|
|
|
|
|
|
|
|
2012 |
|
| |
|
|
|
Current |
|
|
Non-current |
|
|
Total |
|
|
Current |
|
|
Non-current |
|
|
Total |
|
| Borrowings |
|
|
|
|
7,340 |
|
|
|
40,317 |
|
|
|
47,657 |
|
|
|
9,372 |
|
|
|
38,412 |
|
|
|
47,784 |
|
| Net obligations under finance leases |
|
|
|
|
41 |
|
|
|
494 |
|
|
|
535 |
|
|
|
29 |
|
|
|
355 |
|
|
|
384 |
|
|
|
|
|
|
7,381 |
|
|
|
40,811 |
|
|
|
48,192 |
|
|
|
9,401 |
|
|
|
38,767 |
|
|
|
48,168 |
|
| Disposal deposits |
|
|
|
|
– |
|
|
|
– |
|
|
|
– |
|
|
|
632 |
|
|
|
– |
|
|
|
632 |
|
| |
|
|
|
|
7,381 |
|
|
|
40,811 |
|
|
|
48,192 |
|
|
|
10,033 |
|
|
|
38,767 |
|
|
|
48,800 |
|
The main elements of current borrowings are the current portion of long-term borrowings that are due to be repaid in the next 12 months of
$6,230 million (2012 $6,240 million) and issued commercial paper of $1,050 million (2012 $3,028 million). Finance debt does not include accrued interest, which is
reported within other payables.
Deposits for disposal transactions of $632 million were included in current finance debt at 31 December 2012. This unsecured
debt was extinguished on completion of the transactions in 2013. There were no deposits for disposal transactions included within finance debt at 31 December 2013.
At 31 December 2013, $141 million (2012 $142 million) of finance debt was secured by the pledging of assets. The remainder of finance debt was unsecured.
|
|
|
| 176 |
|
BP Annual Report and Form 20-F 2013 |
27. Finance debt – continued
The following table shows, by major currency, the group’s finance debt at 31 December and the weighted average
interest rates achieved at those dates through a combination of borrowings and derivative financial instruments entered into to manage interest rate and currency exposures. The disposal deposits noted above are excluded from this analysis.
|
|
|
|
|
|
|
|
|
|
|
|
|
|
|
|
|
|
|
|
|
|
|
|
|
|
|
| |
|
|
|
|
|
|
Fixed rate debt |
|
|
Floating rate debt |
|
|
Total |
|
| |
|
|
|
Weighted
average
interest
rate
% |
|
|
Weighted
average
time for
which rate
is fixed
Years |
|
|
Amount
$ million |
|
|
Weighted
average
interest
rate
% |
|
|
Amount
$ million |
|
|
Amount
$ million |
|
| |
|
|
|
|
|
|
|
|
|
|
|
|
|
|
|
|
|
|
2013 |
|
| US dollar |
|
|
|
|
3 |
|
|
|
4 |
|
|
|
16,405 |
|
|
|
1 |
|
|
|
29,740 |
|
|
|
46,145 |
|
| Euro |
|
|
|
|
5 |
|
|
|
30 |
|
|
|
157 |
|
|
|
2 |
|
|
|
1,396 |
|
|
|
1,553 |
|
| Other currencies |
|
|
|
|
4 |
|
|
|
7 |
|
|
|
454 |
|
|
|
2 |
|
|
|
40 |
|
|
|
494 |
|
| |
|
|
|
|
|
|
|
|
|
|
|
|
17,016 |
|
|
|
|
|
|
|
31,176 |
|
|
|
48,192 |
|
|
|
|
|
|
|
|
|
|
|
|
|
|
|
|
|
|
|
|
|
|
|
|
|
|
|
|
| |
|
|
|
|
|
|
|
|
|
|
|
|
|
|
|
|
|
|
|
|
|
|
|
|
2012 |
|
| US dollar |
|
|
|
|
3 |
|
|
|
4 |
|
|
|
16,744 |
|
|
|
1 |
|
|
|
26,208 |
|
|
|
42,952 |
|
| Euro |
|
|
|
|
5 |
|
|
|
2 |
|
|
|
20 |
|
|
|
1 |
|
|
|
4,854 |
|
|
|
4,874 |
|
| Other currencies |
|
|
|
|
4 |
|
|
|
11 |
|
|
|
255 |
|
|
|
3 |
|
|
|
87 |
|
|
|
342 |
|
| |
|
|
|
|
|
|
|
|
|
|
|
|
17,019 |
|
|
|
|
|
|
|
31,149 |
|
|
|
48,168 |
|
The euro debt not swapped to US dollar is naturally hedged with respect to the foreign currency risk by holding equivalent euro cash and
cash equivalent amounts.
Fair values
The
estimated fair value of finance debt is shown in the table below together with the carrying amount as reflected in the balance sheet.
Long-term borrowings in the
table below include the portion of debt that matures in the 12 months from 31 December 2013, whereas in the balance sheet the amount is reported within current finance debt. The disposal deposits noted above are excluded from this analysis.
The carrying amount of the group’s short-term borrowings, comprising mainly commercial paper, approximates their fair value. The fair values of the group’s
long-term borrowings are principally determined using quoted prices in active markets (and so fall within level 1 of the fair value hierarchy) or, where quoted prices are not available, quoted prices for similar instruments in active markets. The
fair value of the group’s finance lease obligations is estimated using discounted cash flow analyses based on the group’s current incremental borrowing rates for similar types and maturities of borrowing.
|
|
|
|
|
|
|
|
|
|
|
|
|
|
|
|
|
|
|
| |
|
|
|
|
|
|
|
|
|
|
|
|
$ million |
|
| |
|
|
|
|
|
|
2013 |
|
|
|
|
|
2012 |
|
| |
|
|
|
Fair
value |
|
|
Carrying
amount |
|
|
Fair
value |
|
|
Carrying
amount |
|
| Short-term borrowings |
|
|
|
|
1,110 |
|
|
|
1,110 |
|
|
|
3,131 |
|
|
|
3,131 |
|
| Long-term borrowings |
|
|
|
|
47,398 |
|
|
|
46,547 |
|
|
|
45,969 |
|
|
|
44,653 |
|
| Net obligations under finance leases |
|
|
|
|
654 |
|
|
|
535 |
|
|
|
520 |
|
|
|
384 |
|
| Total finance debt |
|
|
|
|
49,162 |
|
|
|
48,192 |
|
|
|
49,620 |
|
|
|
48,168 |
|
28. Capital disclosures and analysis of changes in net debt
The group defines capital as total equity. The group’s approach to managing capital is set out in its financial framework which BP continues to refine to support the
pursuit of value growth for shareholders, whilst maintaining a secure financial base. We intend to maintain a net debt ratio within the 10-20% gearing range, and continue to hold a significant liquidity buffer
while uncertainties remain.
The group monitors capital on the basis of the net debt ratio, that is, the ratio of net debt to net debt plus equity. Net debt is
calculated as gross finance debt, as shown in the balance sheet, plus the fair value of associated derivative financial instruments that are used to hedge foreign exchange and interest rate risks relating to finance debt, for which hedge accounting
is applied, less cash and cash equivalents. Net debt and net debt ratio are non-GAAP measures. BP believes these measures provide useful information to investors. Net debt enables investors to see the economic effect of gross debt, related hedges
and cash and cash equivalents in total. The net debt ratio enables investors to see how significant net debt is relative to equity from shareholders. The derivatives are reported on the balance sheet within the headings ‘Derivative financial
instruments’. All components of equity are included in the denominator of the calculation. At 31 December 2013, the net debt ratio was 16.2% (2012 18.7%).
During 2013, the company repurchased 753 million shares for a total amount of $5.5 billion, including fees and stamp duty, as part of its share buyback programme
announced on 22 March 2013. During 2012, the company did not repurchase any of its own shares, other than as needed to satisfy the requirements of certain employee share-based payment plans.
|
|
|
|
|
|
|
|
|
|
|
| |
|
|
|
|
|
|
$ million |
|
| At 31 December |
|
|
|
2013 |
|
|
2012 |
|
| Gross debt |
|
|
|
|
48,192 |
|
|
|
48,800 |
|
| Fair value (asset) liability of hedges related to finance debt |
|
|
|
|
(477 |
) |
|
|
(1,700 |
) |
|
|
|
|
|
47,715 |
|
|
|
47,100 |
|
| Less: cash and cash equivalents |
|
|
|
|
22,520 |
|
|
|
19,635 |
|
| Net debt |
|
|
|
|
25,195 |
|
|
|
27,465 |
|
| Equity |
|
|
|
|
130,407 |
|
|
|
119,752 |
|
| Net debt ratio |
|
|
|
|
16.2% |
|
|
|
18.7% |
|
|
|
|
|
|
| BP Annual Report and Form 20-F 2013 |
|
|
177 |
|
28. Capital disclosures and analysis of changes in net debt – continued
An analysis of changes in net debt is provided below.
|
|
|
|
|
|
|
|
|
|
|
|
|
|
|
|
|
|
|
|
|
|
|
|
|
|
|
| |
|
|
|
|
|
|
|
|
|
|
|
|
|
|
|
|
|
|
$ million |
|
| |
|
|
|
|
|
|
|
|
|
2013 |
|
|
|
|
|
|
|
|
2012 |
|
| Movement in net debt |
|
|
|
Finance debta |
|
|
Cash and
cash
equivalents |
|
|
Net debt |
|
|
Finance
debta |
|
|
Cash and
cash
equivalents |
|
|
Net debt |
|
| At 1 January |
|
|
|
|
(47,100 |
) |
|
|
19,635 |
|
|
|
(27,465 |
) |
|
|
(43,075 |
) |
|
|
14,177 |
|
|
|
(28,898 |
) |
| Exchange adjustments |
|
|
|
|
(219 |
) |
|
|
40 |
|
|
|
(179 |
) |
|
|
(75 |
) |
|
|
64 |
|
|
|
(11 |
) |
| Net cash flow |
|
|
|
|
(836 |
) |
|
|
2,845 |
|
|
|
2,009 |
|
|
|
(3,244 |
) |
|
|
5,394 |
|
|
|
2,150 |
|
| Movement in finance debt relating to investing activitiesb |
|
|
|
|
632 |
|
|
|
– |
|
|
|
632 |
|
|
|
(602 |
) |
|
|
– |
|
|
|
(602 |
) |
| Other movements |
|
|
|
|
(192 |
) |
|
|
– |
|
|
|
(192 |
) |
|
|
(104 |
) |
|
|
– |
|
|
|
(104 |
) |
| At 31 December |
|
|
|
|
(47,715 |
) |
|
|
22,520 |
|
|
|
(25,195 |
) |
|
|
(47,100 |
) |
|
|
19,635 |
|
|
|
(27,465 |
) |
| a |
Including the fair value of associated derivative financial instruments. |
| b |
See Note 27 for further information. |
29. Provisions
|
|
|
|
|
|
|
|
|
|
|
|
|
|
|
|
|
|
|
|
|
|
|
|
|
|
|
|
|
|
|
| |
|
|
|
|
|
|
|
|
|
|
|
|
|
|
|
|
|
|
|
|
|
$ million |
|
| |
|
|
|
Decommissioning |
|
|
Environmental |
|
|
Spill
response |
|
|
Litigation and
claims |
|
|
Clean Water
Act penalties |
|
|
Other |
|
|
Total |
|
| At 1 January 2013 |
|
|
|
|
17,374 |
|
|
|
3,631 |
|
|
|
345 |
|
|
|
10,251 |
|
|
|
3,510 |
|
|
|
2,872 |
|
|
|
37,983 |
|
| Exchange adjustments |
|
|
|
|
(37 |
) |
|
|
(7 |
) |
|
|
– |
|
|
|
5 |
|
|
|
– |
|
|
|
14 |
|
|
|
(25 |
) |
| New or increased provisions |
|
|
|
|
2,092 |
|
|
|
472 |
|
|
|
(66 |
) |
|
|
2,466 |
|
|
|
– |
|
|
|
464 |
|
|
|
5,428 |
|
| Derecognition of provisions for items that cannot be reliably estimated |
|
|
|
|
– |
|
|
|
– |
|
|
|
– |
|
|
|
(379 |
) |
|
|
– |
|
|
|
– |
|
|
|
(379 |
) |
| Write-back of unused provisions |
|
|
|
|
(2 |
) |
|
|
(52 |
) |
|
|
– |
|
|
|
(38 |
) |
|
|
– |
|
|
|
(210 |
) |
|
|
(302 |
) |
| Transfer between categories of provision |
|
|
|
|
– |
|
|
|
47 |
|
|
|
(47 |
) |
|
|
– |
|
|
|
– |
|
|
|
– |
|
|
|
– |
|
| Unwinding of discount |
|
|
|
|
110 |
|
|
|
11 |
|
|
|
– |
|
|
|
10 |
|
|
|
– |
|
|
|
16 |
|
|
|
147 |
|
| Change in discount rate |
|
|
|
|
(1,602 |
) |
|
|
(41 |
) |
|
|
– |
|
|
|
(20 |
) |
|
|
– |
|
|
|
(13 |
) |
|
|
(1,676 |
) |
| Utilization |
|
|
|
|
(500 |
) |
|
|
(695 |
) |
|
|
(143 |
) |
|
|
(3,451 |
) |
|
|
– |
|
|
|
(230 |
) |
|
|
(5,019 |
) |
| Reclassified to other payables |
|
|
|
|
– |
|
|
|
– |
|
|
|
– |
|
|
|
(3,933 |
) |
|
|
– |
|
|
|
– |
|
|
|
(3,933 |
) |
| Deletions |
|
|
|
|
(230 |
) |
|
|
(1 |
) |
|
|
– |
|
|
|
– |
|
|
|
– |
|
|
|
(33 |
) |
|
|
(264 |
) |
| At 31 December 2013 |
|
|
|
|
17,205 |
|
|
|
3,365 |
|
|
|
89 |
|
|
|
4,911 |
|
|
|
3,510 |
|
|
|
2,880 |
|
|
|
31,960 |
|
| Of which – current |
|
|
|
|
866 |
|
|
|
769 |
|
|
|
84 |
|
|
|
2,725 |
|
|
|
– |
|
|
|
601 |
|
|
|
5,045 |
|
| –
non-current |
|
|
|
|
16,339 |
|
|
|
2,596 |
|
|
|
5 |
|
|
|
2,186 |
|
|
|
3,510 |
|
|
|
2,279 |
|
|
|
26,915 |
|
| Of which – Gulf of Mexico oil
spill |
|
|
|
|
– |
|
|
|
1,590 |
|
|
|
89 |
|
|
|
4,157 |
|
|
|
3,510 |
|
|
|
– |
|
|
|
9,346 |
|
Further information on the financial impacts of the Gulf of Mexico oil spill is provided in Note 2.
The group makes full provision for the future cost of decommissioning oil and natural gas wells, facilities and related pipelines on a discounted basis upon installation.
The provision for the costs of decommissioning these wells, production facilities and pipelines at the end of their economic lives has been estimated using existing technology, at current prices or future assumptions, depending on the expected
timing of the activity, and discounted using a real discount rate of 1% (2012 0.5%). The amount provided in the year for new or increased decommissioning provisions was $2,092 million (2012 $3,766 million). The weighted average period over which
these costs are generally expected to be incurred is estimated to be approximately 20 years. While the provision is based on the best estimate of future costs and the economic lives of the facilities and pipelines, there is uncertainty regarding
both the amount and timing of these costs.
Provisions for environmental remediation are made when a clean-up is probable and the amount of the obligation can be
estimated reliably. Generally, this coincides with commitment to a formal plan of action or, if earlier, on divestment or on closure of inactive sites. The provision for environmental liabilities has been estimated using existing technology, at
current prices and discounted using a real discount rate of 1% (2012 0.5%). The weighted average period over which these costs are generally expected to be incurred is estimated to be approximately five years. The extent and cost of future
remediation programmes are inherently difficult to estimate; they depend on the scale of any possible contamination, the timing and extent of corrective actions, and also the group’s share of the liability.
The litigation category includes provisions for matters related to, for example, commercial disputes, product liability, and allegations of exposures of third parties to
toxic substances. Included within the other category at 31 December 2013 are provisions for deferred employee compensation of $602 million (2012 $618 million). These provisions are discounted using either a nominal discount rate of 3.25% (2012
2.5%) or a real discount rate of 1% (2012 0.5%), as appropriate.
30. Pensions and other post-retirement
benefits
Most group companies have pension plans, the forms and benefits of which vary with conditions and practices in the countries concerned. Pension
benefits may be provided through defined contribution plans (money purchase schemes) or defined benefit plans (final salary and other types of schemes with committed pension payments). For defined contribution plans, retirement benefits are
determined by the value of funds arising from contributions paid in respect of each employee. For defined benefit plans, retirement benefits are based on such factors as the employees’ pensionable salary and length of service. Defined benefit
plans may be funded or unfunded. The assets of funded plans are generally held in separately administered trusts.
In particular, the primary pension arrangement in
the UK is a funded final salary pension plan under which retired employees draw the majority of their benefit as an annuity. This pension plan is governed by a trustee board composed of four member-nominated and four company-nominated
representatives, an independent chairman, an independent director and a chief executive officer appointed by the chairman. The trustee board is required by law to act in the best interests of the plan participants and is responsible for setting
certain policies, such as investment policies of the plan.
|
|
|
| 178 |
|
BP Annual Report and Form 20-F 2013 |
30. Pensions and other post-retirement benefits – continued
The UK plan is closed to new joiners but remains open to ongoing accrual for current members. New joiners in the UK are eligible for membership of a defined contribution plan.
In the US, a range of retirement arrangements is provided. This includes a funded final salary pension plan for certain heritage employees and a cash balance arrangement
for new joiners. Retired US employees typically take their pension benefit in the form of a lump sum payment. The plan’s assets are overseen by a fiduciary investment committee composed of seven company employees appointed by the appointing
officer, who is the president of BP Corporation North America Inc. The investment committee is required by law to act in the best interests of the plan participants and is responsible for setting certain policies, such as the investment policies, of
the plan. US employees are also eligible to participate in a defined contribution (401k) plan in which employee contributions are matched with company contributions.
The level of contributions to funded defined benefit plans is the amount needed to provide adequate funds to meet pension obligations as they fall due. During 2013,
contributions of $597 million (2012 $884 million and 2011 $429 million) and $386 million (2012 $153 million and 2011 $777 million) were made to the UK plans and US plans respectively. In addition, contributions of $289 million (2012 $238 million and
2011 $223 million) were made to other funded defined benefit plans. The aggregate level of contributions in 2014 is expected to be approximately $1,250 million, and includes contributions in all countries that we expect to be required to make by law
or under contractual agreements as well as an allowance for discretionary funding.
For the primary UK plan there is an agreement between the group and the trustee
under which contributions are determined annually based on the funding level of the plan. Under this agreement a proportion of any deficit and the service cost is funded in the following year. Contributions in the US are determined by legislation
and are supplemented by discretionary contributions.
Certain group companies, principally in the US, provide post-retirement healthcare and life insurance benefits
to retired employees and their dependants. The entitlement to these benefits is usually based on the employee remaining in service until retirement age and completion of a minimum period of service.
The obligation and cost of providing pensions and other post-retirement benefits is assessed annually using the projected unit credit method. The date of the most recent
actuarial review was 31 December 2013. The group’s principal plans are subject to a formal actuarial valuation every three years in the UK, with valuations being required more frequently in many other countries. The most recent formal
actuarial valuation of the UK pension plans was as at 31 December 2011.
The material financial assumptions used to estimate the benefit obligations of the
various plans are set out below. The assumptions are reviewed by management at the end of each year, and are used to evaluate accrued pension and other post-retirement benefits at 31 December and pension expense for the following year.
|
|
|
|
|
|
|
|
|
|
|
|
|
|
|
|
|
|
|
|
|
|
|
|
|
|
|
|
|
|
|
|
|
|
|
|
|
|
|
| |
|
|
|
|
|
|
|
|
|
|
|
|
|
|
|
|
|
|
|
|
|
|
|
|
|
|
|
% |
|
| Financial assumptions used to determine benefit obligation |
|
|
|
2013 |
|
|
2012 |
|
|
UK
2011 |
|
|
2013 |
|
|
2012 |
|
|
US
2011 |
|
|
2013 |
|
|
2012 |
|
|
Other
2011 |
|
| Discount rate for pension plan liabilities |
|
|
|
|
4.6 |
|
|
|
4.4 |
|
|
|
4.8 |
|
|
|
4.3 |
|
|
|
3.2 |
|
|
|
4.3 |
|
|
|
3.9 |
|
|
|
3.6 |
|
|
|
4.7 |
|
| Discount rate for other post-retirement benefit plan liabilities |
|
|
|
|
n/a |
|
|
|
n/a |
|
|
|
n/a |
|
|
|
4.5 |
|
|
|
3.7 |
|
|
|
4.5 |
|
|
|
n/a |
|
|
|
n/a |
|
|
|
n/a |
|
| Rate of increase in salaries |
|
|
|
|
5.1 |
|
|
|
4.9 |
|
|
|
5.1 |
|
|
|
3.9 |
|
|
|
4.2 |
|
|
|
3.7 |
|
|
|
3.7 |
|
|
|
3.7 |
|
|
|
3.7 |
|
| Rate of increase for pensions in payment |
|
|
|
|
3.3 |
|
|
|
3.1 |
|
|
|
3.2 |
|
|
|
– |
|
|
|
– |
|
|
|
– |
|
|
|
1.7 |
|
|
|
1.7 |
|
|
|
1.7 |
|
| Rate of increase in deferred pensions |
|
|
|
|
3.3 |
|
|
|
3.1 |
|
|
|
3.2 |
|
|
|
– |
|
|
|
– |
|
|
|
– |
|
|
|
1.3 |
|
|
|
1.2 |
|
|
|
1.2 |
|
| Inflation for pension plan liabilities |
|
|
|
|
3.3 |
|
|
|
3.1 |
|
|
|
3.2 |
|
|
|
2.1 |
|
|
|
2.4 |
|
|
|
1.9 |
|
|
|
2.2 |
|
|
|
2.2 |
|
|
|
2.2 |
|
| |
|
|
|
|
|
|
|
|
|
|
|
|
|
|
|
|
|
|
|
|
|
|
|
|
|
|
|
|
|
|
|
|
|
|
|
|
|
|
| Financial assumptions used to determine benefit expense |
|
|
|
2013 |
|
|
2012 |
|
|
UK
2011 |
|
|
2013 |
|
|
2012 |
|
|
US
2011 |
|
|
2013 |
|
|
2012 |
|
|
Other
2011 |
|
| Discount rate for pension plan service cost |
|
|
|
|
4.4 |
|
|
|
4.8 |
|
|
|
5.5 |
|
|
|
3.2 |
|
|
|
4.3 |
|
|
|
4.7 |
|
|
|
3.6 |
|
|
|
4.7 |
|
|
|
5.3 |
|
| Discount rate for pension plan other finance expense |
|
|
|
|
4.4 |
|
|
|
4.8 |
|
|
|
5.5 |
|
|
|
3.2 |
|
|
|
4.3 |
|
|
|
4.7 |
|
|
|
3.6 |
|
|
|
4.7 |
|
|
|
5.3 |
|
| Discount rate for other post-retirement benefit plan service cost |
|
|
|
|
n/a |
|
|
|
n/a |
|
|
|
n/a |
|
|
|
3.7 |
|
|
|
4.5 |
|
|
|
5.3 |
|
|
|
n/a |
|
|
|
n/a |
|
|
|
n/a |
|
| Inflation for pension plan service cost |
|
|
|
|
3.1 |
|
|
|
3.2 |
|
|
|
3.5 |
|
|
|
2.4 |
|
|
|
1.9 |
|
|
|
2.3 |
|
|
|
2.2 |
|
|
|
2.2 |
|
|
|
2.3 |
|
Our discount rate assumptions are based on third-party AA corporate bond indices and for our largest plans in the UK, US and Germany we
use yields that reflect the maturity profile of the expected benefit payments. The inflation rate assumptions for our UK and US plans are based on the difference between the yields on index-linked and fixed-interest long-term government bonds. In
other countries we use either this approach, or the central bank inflation target, or advice from the local actuary depending on the information that is available to us. The inflation assumptions are used to determine the rate of increase for
pensions in payment and the rate of increase in deferred pensions where there is such an increase.
Our assumptions for the rate of increase in salaries are based on
our inflation assumption plus an allowance for expected long-term real salary growth. These include allowance for promotion-related salary growth, of between 0.3% and 1.0% depending on country.
In addition to the financial assumptions, we regularly review the demographic and mortality assumptions. The mortality assumptions reflect best practice in the countries
in which we provide pensions, and have been chosen with regard to the latest available published tables adjusted where appropriate to reflect the experience of the group and an extrapolation of past longevity improvements into the future. BP’s
most substantial pension liabilities are in the UK, the US and Germany where our mortality assumptions are as follows:
|
|
|
|
|
|
|
|
|
|
|
|
|
|
|
|
|
|
|
|
|
|
|
|
|
|
|
|
|
|
|
|
|
|
|
|
|
|
|
| |
|
|
|
|
|
|
|
|
|
|
|
|
|
|
|
|
|
|
|
|
|
|
|
|
|
|
|
Years |
|
| Mortality assumptions |
|
|
|
2013 |
|
|
2012 |
|
|
UK
2011 |
|
|
2013 |
|
|
2012 |
|
|
US
2011 |
|
|
2013 |
|
|
2012 |
|
|
Germanya
2011 |
|
| Life expectancy at age 60 for a male currently aged 60 |
|
|
|
|
27.8 |
|
|
|
27.7 |
|
|
|
27.6 |
|
|
|
24.9 |
|
|
|
24.9 |
|
|
|
24.8 |
|
|
|
23.3 |
|
|
|
23.1 |
|
|
|
23.0 |
|
| Life expectancy at age 60 for a male currently aged 40 |
|
|
|
|
30.7 |
|
|
|
30.6 |
|
|
|
30.5 |
|
|
|
26.4 |
|
|
|
26.3 |
|
|
|
26.3 |
|
|
|
26.1 |
|
|
|
26.0 |
|
|
|
25.8 |
|
| Life expectancy at age 60 for a female currently aged 60 |
|
|
|
|
29.5 |
|
|
|
29.4 |
|
|
|
29.3 |
|
|
|
26.5 |
|
|
|
26.4 |
|
|
|
26.4 |
|
|
|
27.8 |
|
|
|
27.7 |
|
|
|
27.5 |
|
| Life expectancy at age 60 for a female currently aged 40 |
|
|
|
|
32.2 |
|
|
|
32.1 |
|
|
|
32.0 |
|
|
|
27.3 |
|
|
|
27.3 |
|
|
|
27.3 |
|
|
|
30.5 |
|
|
|
30.3 |
|
|
|
30.2 |
|
| a |
Minor amendments have been made to comparative amounts. |
|
|
|
|
|
| BP Annual Report and Form 20-F 2013 |
|
|
179 |
|
30. Pensions and other post-retirement benefits – continued
Our assumption for future US healthcare cost trend rate for the first year after the reporting date
reflects the rate of actual cost increases seen in recent years. The ultimate trend rate reflects our long-term expectations of the level at which cost inflation will stabilize based on past healthcare cost inflation seen over a longer period of
time. The assumed future US healthcare cost trend rate assumptions are as follows:
|
|
|
|
|
|
|
|
|
|
|
|
|
|
|
| |
|
|
|
|
|
|
|
|
|
% |
|
| |
|
|
|
2013 |
|
|
2012 |
|
|
2011 |
|
| First year’s US healthcare cost trend rate |
|
|
|
|
7.3 |
|
|
|
7.3 |
|
|
|
7.6 |
|
| Ultimate US healthcare cost trend rate |
|
|
|
|
5.0 |
|
|
|
5.0 |
|
|
|
5.0 |
|
| Year in which ultimate trend rate is reached |
|
|
|
|
2021 |
|
|
|
2020 |
|
|
|
2020 |
|
Pension plan assets are generally held in trusts. The primary objective of the trusts is to accumulate pools of assets sufficient to meet
the obligations of the various plans. The assets of the trusts are invested in a manner consistent with fiduciary obligations and principles that reflect current practices in portfolio management.
A significant proportion of the assets are held in equities, owing to a higher expected level of return over the long term with an acceptable level of risk. In order to
provide reasonable assurance that no single security or type of security has an unwarranted impact on the total portfolio, the investment portfolios are highly diversified.
The current long-term asset allocation policy for the major plans is as follows:
|
|
|
|
|
|
|
|
|
|
|
|
|
|
|
| |
|
|
|
|
|
|
|
|
|
% |
|
| Asset category |
|
|
|
UK |
|
|
US |
|
|
Other |
|
| Total equity |
|
|
|
|
70 |
|
|
|
60 |
|
|
|
17-65 |
|
| Bonds/cash |
|
|
|
|
23 |
|
|
|
40 |
|
|
|
25-78 |
|
| Property/real estate |
|
|
|
|
7 |
|
|
|
– |
|
|
|
0-10 |
|
The group’s main pension plans do not invest directly in either securities or property/real estate of the company or of any
subsidiary. Some of the group’s pension plans use derivative financial instruments as part of their asset mix to manage the level of risk.
For the primary UK
pension plan there is an agreement with the trustee to reduce the proportion of plan assets held as equities and increase the proportion held as bonds at certain market trigger points, over time, with a view to better matching the pension
liabilities. During 2013 the first trigger point was reached. There is a similar agreement in place in the US where trigger points were reached in 2011 and 2013.
BP’s main plans in the UK and US do not currently follow a liability driven investment (‘LDI’) approach, a form of investing designed to match the movement
in pension plan assets with the movement in projected benefit obligations over time.
|
|
|
| 180 |
|
BP Annual Report and Form 20-F 2013 |
30. Pensions and other post-retirement benefits – continued
The fair values of the various categories of assets held by the defined benefit plans at 31 December are presented
in the table below, including the effects of derivative financial instruments. Movements in the fair value of plan assets during the year are shown in detail in the table on page 182.
|
|
|
|
|
|
|
|
|
|
|
|
|
|
|
|
|
|
|
|
|
|
|
| |
|
|
|
|
|
|
|
|
|
|
|
|
|
|
|
$ million |
|
| |
|
|
|
UK
pension
plansa |
|
|
US
pension
plansb |
|
|
US other
post-
retirement
benefit
plans |
|
|
Other
plans |
|
|
Total |
|
| Fair value of pension plan assets |
|
|
|
|
|
|
|
|
|
|
|
|
|
|
|
|
|
|
|
|
|
|
| At 31 December 2013 |
|
|
|
|
|
|
|
|
|
|
|
|
|
|
|
|
|
|
|
|
|
|
| Listed equities – developed markets |
|
|
|
|
17,341 |
|
|
|
3,260 |
|
|
|
– |
|
|
|
913 |
|
|
|
21,514 |
|
| –
emerging markets |
|
|
|
|
2,290 |
|
|
|
308 |
|
|
|
– |
|
|
|
84 |
|
|
|
2,682 |
|
| Private equity |
|
|
|
|
2,907 |
|
|
|
1,432 |
|
|
|
– |
|
|
|
6 |
|
|
|
4,345 |
|
| Government issued nominal bonds |
|
|
|
|
549 |
|
|
|
1,259 |
|
|
|
– |
|
|
|
1,258 |
|
|
|
3,066 |
|
| Index-linked bonds |
|
|
|
|
787 |
|
|
|
– |
|
|
|
– |
|
|
|
69 |
|
|
|
856 |
|
| Corporate bonds |
|
|
|
|
4,427 |
|
|
|
1,323 |
|
|
|
– |
|
|
|
982 |
|
|
|
6,732 |
|
| Property |
|
|
|
|
2,200 |
|
|
|
6 |
|
|
|
– |
|
|
|
134 |
|
|
|
2,340 |
|
| Cash |
|
|
|
|
855 |
|
|
|
135 |
|
|
|
– |
|
|
|
278 |
|
|
|
1,268 |
|
| Other |
|
|
|
|
160 |
|
|
|
55 |
|
|
|
– |
|
|
|
113 |
|
|
|
328 |
|
| |
|
|
|
|
31,516 |
|
|
|
7,778 |
|
|
|
– |
|
|
|
3,837 |
|
|
|
43,131 |
|
| At 31 December 2012 |
|
|
|
|
|
|
|
|
|
|
|
|
|
|
|
|
|
|
|
|
|
|
| Listed equities – developed markets |
|
|
|
|
15,659 |
|
|
|
3,622 |
|
|
|
– |
|
|
|
844 |
|
|
|
20,125 |
|
| –
emerging markets |
|
|
|
|
1,074 |
|
|
|
341 |
|
|
|
– |
|
|
|
89 |
|
|
|
1,504 |
|
| Private equity |
|
|
|
|
2,879 |
|
|
|
1,468 |
|
|
|
– |
|
|
|
7 |
|
|
|
4,354 |
|
| Government issued nominal bonds |
|
|
|
|
544 |
|
|
|
904 |
|
|
|
– |
|
|
|
1,042 |
|
|
|
2,490 |
|
| Index-linked bonds |
|
|
|
|
491 |
|
|
|
– |
|
|
|
– |
|
|
|
78 |
|
|
|
569 |
|
| Corporate bonds |
|
|
|
|
3,850 |
|
|
|
1,255 |
|
|
|
– |
|
|
|
766 |
|
|
|
5,871 |
|
| Property |
|
|
|
|
1,783 |
|
|
|
5 |
|
|
|
– |
|
|
|
139 |
|
|
|
1,927 |
|
| Cash |
|
|
|
|
1,000 |
|
|
|
86 |
|
|
|
1 |
|
|
|
321 |
|
|
|
1,408 |
|
| Other |
|
|
|
|
66 |
|
|
|
105 |
|
|
|
– |
|
|
|
247 |
|
|
|
418 |
|
| |
|
|
|
|
27,346 |
|
|
|
7,786 |
|
|
|
1 |
|
|
|
3,533 |
|
|
|
38,666 |
|
| At 31 December 2011 |
|
|
|
|
|
|
|
|
|
|
|
|
|
|
|
|
|
|
|
|
|
|
| Listed equities – developed markets |
|
|
|
|
13,622 |
|
|
|
3,328 |
|
|
|
– |
|
|
|
754 |
|
|
|
17,704 |
|
| –
emerging markets |
|
|
|
|
890 |
|
|
|
299 |
|
|
|
– |
|
|
|
69 |
|
|
|
1,258 |
|
| Private equity |
|
|
|
|
2,690 |
|
|
|
1,407 |
|
|
|
– |
|
|
|
8 |
|
|
|
4,105 |
|
| Government issued nominal bonds |
|
|
|
|
513 |
|
|
|
733 |
|
|
|
– |
|
|
|
993 |
|
|
|
2,239 |
|
| Index-linked bonds |
|
|
|
|
390 |
|
|
|
– |
|
|
|
– |
|
|
|
123 |
|
|
|
513 |
|
| Corporate bonds |
|
|
|
|
3,238 |
|
|
|
1,289 |
|
|
|
– |
|
|
|
724 |
|
|
|
5,251 |
|
| Property |
|
|
|
|
1,710 |
|
|
|
4 |
|
|
|
– |
|
|
|
117 |
|
|
|
1,831 |
|
| Cash |
|
|
|
|
470 |
|
|
|
88 |
|
|
|
4 |
|
|
|
326 |
|
|
|
888 |
|
| Other |
|
|
|
|
64 |
|
|
|
56 |
|
|
|
– |
|
|
|
172 |
|
|
|
292 |
|
| |
|
|
|
|
23,587 |
|
|
|
7,204 |
|
|
|
4 |
|
|
|
3,286 |
|
|
|
34,081 |
|
| a |
Bonds held by the UK pension fund are typically denominated in sterling. Property held by the UK pension fund is in the United Kingdom. |
| b |
Bonds held by the US pension fund are typically denominated in US dollars. |
|
|
|
|
|
| BP Annual Report and Form 20-F 2013 |
|
|
181 |
|
30. Pensions and other post-retirement benefits – continued
|
|
|
|
|
|
|
|
|
|
|
|
|
|
|
|
|
|
|
|
|
|
|
| |
|
|
|
|
|
|
|
|
|
|
|
|
|
|
|
$ million |
|
| |
|
|
|
|
|
|
|
|
|
|
|
|
|
|
|
2013 |
|
| |
|
|
|
UK
pension
plans |
|
|
US
pension
plans |
|
|
US other
post-
retirement
benefit
plans |
|
|
Other
plans |
|
|
Total |
|
| Analysis of the amount charged to profit before interest and
taxation |
|
|
|
|
|
|
|
|
|
|
|
|
|
|
|
|
|
|
|
|
|
|
| Current service costa |
|
|
|
|
497 |
|
|
|
358 |
|
|
|
49 |
|
|
|
177 |
|
|
|
1,081 |
|
| Past service costb |
|
|
|
|
(22 |
) |
|
|
(49 |
) |
|
|
– |
|
|
|
27 |
|
|
|
(44 |
) |
| Settlement |
|
|
|
|
– |
|
|
|
– |
|
|
|
– |
|
|
|
(1 |
) |
|
|
(1 |
) |
| Operating charge relating to defined benefit plans |
|
|
|
|
475 |
|
|
|
309 |
|
|
|
49 |
|
|
|
203 |
|
|
|
1,036 |
|
| Payments to defined contribution plans |
|
|
|
|
24 |
|
|
|
223 |
|
|
|
– |
|
|
|
53 |
|
|
|
300 |
|
| Total operating charge |
|
|
|
|
499 |
|
|
|
532 |
|
|
|
49 |
|
|
|
256 |
|
|
|
1,336 |
|
| Interest income on plan assets |
|
|
|
|
(1,139 |
) |
|
|
(240 |
) |
|
|
– |
|
|
|
(130 |
) |
|
|
(1,509 |
) |
| Interest on plan liabilities |
|
|
|
|
1,221 |
|
|
|
305 |
|
|
|
101 |
|
|
|
362 |
|
|
|
1,989 |
|
| Other finance expense |
|
|
|
|
82 |
|
|
|
65 |
|
|
|
101 |
|
|
|
232 |
|
|
|
480 |
|
| Analysis of the amount recognized in other comprehensive income |
|
|
|
|
|
|
|
|
|
|
|
|
|
|
|
|
|
|
|
|
|
|
| Actual asset return less interest income on plan assetsa |
|
|
|
|
2,671 |
|
|
|
730 |
|
|
|
– |
|
|
|
114 |
|
|
|
3,515 |
|
| Change in financial assumptions underlying the present value of the plan liabilities |
|
|
|
|
60 |
|
|
|
1,054 |
|
|
|
106 |
|
|
|
283 |
|
|
|
1,503 |
|
| Change in demographic assumptions underlying the present value of the plan liabilities |
|
|
|
|
– |
|
|
|
14 |
|
|
|
– |
|
|
|
(65 |
) |
|
|
(51 |
) |
| Experience gains and losses arising on the plan liabilities |
|
|
|
|
41 |
|
|
|
(205 |
) |
|
|
(44 |
) |
|
|
5 |
|
|
|
(203 |
) |
| Remeasurements recognized in other comprehensive income |
|
|
|
|
2,772 |
|
|
|
1,593 |
|
|
|
62 |
|
|
|
337 |
|
|
|
4,764 |
|
| Movements in benefit obligation during the year |
|
|
|
|
|
|
|
|
|
|
|
|
|
|
|
|
|
|
|
|
|
|
| Benefit obligation at 1 January |
|
|
|
|
29,259 |
|
|
|
10,029 |
|
|
|
2,845 |
|
|
|
10,148 |
|
|
|
52,281 |
|
| Exchange adjustments |
|
|
|
|
705 |
|
|
|
– |
|
|
|
– |
|
|
|
132 |
|
|
|
837 |
|
| Operating charge relating to defined benefit plans |
|
|
|
|
475 |
|
|
|
309 |
|
|
|
49 |
|
|
|
203 |
|
|
|
1,036 |
|
| Interest cost |
|
|
|
|
1,221 |
|
|
|
305 |
|
|
|
101 |
|
|
|
362 |
|
|
|
1,989 |
|
| Contributions by plan participantsc |
|
|
|
|
37 |
|
|
|
– |
|
|
|
– |
|
|
|
13 |
|
|
|
50 |
|
| Benefit payments (funded plans)d |
|
|
|
|
(1,087 |
) |
|
|
(1,364 |
) |
|
|
(1 |
) |
|
|
(192 |
) |
|
|
(2,644 |
) |
| Benefit payments (unfunded plans)d |
|
|
|
|
(4 |
) |
|
|
(52 |
) |
|
|
(233 |
) |
|
|
(395 |
) |
|
|
(684 |
) |
| Disposals |
|
|
|
|
(9 |
) |
|
|
– |
|
|
|
(61 |
) |
|
|
(13 |
) |
|
|
(83 |
) |
| Remeasurements |
|
|
|
|
(101 |
) |
|
|
(863 |
) |
|
|
(62 |
) |
|
|
(223 |
) |
|
|
(1,249 |
) |
| Benefit obligation at 31 Decembera e |
|
|
|
|
30,496 |
|
|
|
8,364 |
|
|
|
2,638 |
|
|
|
10,035 |
|
|
|
51,533 |
|
| Movements in fair value of plan assets during the year |
|
|
|
|
|
|
|
|
|
|
|
|
|
|
|
|
|
|
|
|
|
|
| Fair value of plan assets at 1 January |
|
|
|
|
27,346 |
|
|
|
7,786 |
|
|
|
1 |
|
|
|
3,533 |
|
|
|
38,666 |
|
| Exchange adjustments |
|
|
|
|
822 |
|
|
|
– |
|
|
|
– |
|
|
|
(37 |
) |
|
|
785 |
|
| Interest income on plan assetsa |
|
|
|
|
1,139 |
|
|
|
240 |
|
|
|
– |
|
|
|
130 |
|
|
|
1,509 |
|
| Contributions by plan participantsc |
|
|
|
|
37 |
|
|
|
– |
|
|
|
– |
|
|
|
13 |
|
|
|
50 |
|
| Contributions by employers (funded plans) |
|
|
|
|
597 |
|
|
|
386 |
|
|
|
– |
|
|
|
289 |
|
|
|
1,272 |
|
| Benefit payments (funded plans)d |
|
|
|
|
(1,087 |
) |
|
|
(1,364 |
) |
|
|
(1 |
) |
|
|
(192 |
) |
|
|
(2,644 |
) |
| Disposals |
|
|
|
|
(9 |
) |
|
|
– |
|
|
|
– |
|
|
|
(13 |
) |
|
|
(22 |
) |
| Remeasurementsf |
|
|
|
|
2,671 |
|
|
|
730 |
|
|
|
– |
|
|
|
114 |
|
|
|
3,515 |
|
| Fair value of plan assets at 31 December |
|
|
|
|
31,516 |
|
|
|
7,778 |
|
|
|
– |
|
|
|
3,837 |
|
|
|
43,131 |
|
| Surplus (deficit) at 31 December |
|
|
|
|
1,020 |
|
|
|
(586 |
) |
|
|
(2,638 |
) |
|
|
(6,198 |
) |
|
|
(8,402 |
) |
| Represented by |
|
|
|
|
|
|
|
|
|
|
|
|
|
|
|
|
|
|
|
|
|
|
| Asset recognized |
|
|
|
|
1,291 |
|
|
|
6 |
|
|
|
– |
|
|
|
79 |
|
|
|
1,376 |
|
| Liability recognized |
|
|
|
|
(271 |
) |
|
|
(592 |
) |
|
|
(2,638 |
) |
|
|
(6,277 |
) |
|
|
(9,778 |
) |
| |
|
|
|
|
1,020 |
|
|
|
(586 |
) |
|
|
(2,638 |
) |
|
|
(6,198 |
) |
|
|
(8,402 |
) |
| The surplus (deficit) may be analysed between funded and unfunded plans as follows |
|
|
|
|
|
|
|
|
|
|
|
|
|
|
|
|
|
|
|
|
|
|
| Funded |
|
|
|
|
1,285 |
|
|
|
(5 |
) |
|
|
– |
|
|
|
(320 |
) |
|
|
960 |
|
| Unfunded |
|
|
|
|
(265 |
) |
|
|
(581 |
) |
|
|
(2,638 |
) |
|
|
(5,878 |
) |
|
|
(9,362 |
) |
| |
|
|
|
|
1,020 |
|
|
|
(586 |
) |
|
|
(2,638 |
) |
|
|
(6,198 |
) |
|
|
(8,402 |
) |
| The defined benefit obligation may be analysed between funded and unfunded plans as follows |
|
|
|
|
|
|
|
|
|
|
|
|
|
|
|
|
|
|
|
|
|
|
| Funded |
|
|
|
|
(30,231 |
) |
|
|
(7,783 |
) |
|
|
– |
|
|
|
(4,157 |
) |
|
|
(42,171 |
) |
| Unfunded |
|
|
|
|
(265 |
) |
|
|
(581 |
) |
|
|
(2,638 |
) |
|
|
(5,878 |
) |
|
|
(9,362 |
) |
| |
|
|
|
|
(30,496 |
) |
|
|
(8,364 |
) |
|
|
(2,638 |
) |
|
|
(10,035 |
) |
|
|
(51,533 |
) |
| a |
The costs of managing the plan’s investments are treated as being part of the return on plan assets, the costs of administering our pension plan benefits are generally included in current service cost and the costs
of administering our other post-retirement benefit plans are included in the benefit obligation. |
| b |
Past service costs include a credit of $73 million as the result of a curtailment in the pension arrangements of a number of employees in the UK and US following divestment transactions. A charge of $29 million for
special termination benefits represents the increased liability arising as a result of early retirements occurring as part of restructuring programmes. |
| c |
Most of the contributions made by plan participants into UK pension plans were made under salary sacrifice. |
| d |
The benefit payments amount shown above comprises $3,269 million benefits plus $59 million of plan expenses incurred in the administration of the benefit. |
| e |
The benefit obligation for other plans includes $4,874 million for the German plan, which is largely unfunded. |
| f |
The actual return on plan assets is made up of the sum of the interest income on plan assets and the remeasurment of plan assets as disclosed above. |
|
|
|
| 182 |
|
BP Annual Report and Form 20-F 2013 |
30. Pensions and other post-retirement benefits – continued
|
|
|
|
|
|
|
|
|
|
|
|
|
|
|
|
|
|
|
|
|
|
|
| |
|
|
|
|
|
|
|
|
|
|
|
|
|
|
|
$ million |
|
| |
|
|
|
|
|
|
|
|
|
|
|
|
|
|
|
2012 |
|
| |
|
|
|
UK
pension
plans |
|
|
US pension
plans |
|
|
US other
post-
retirement
benefit
plans |
|
|
Other
plans |
|
|
Total |
|
| Analysis of the amount charged to profit before interest and
taxation |
|
|
|
|
|
|
|
|
|
|
|
|
|
|
|
|
|
|
|
|
|
|
| Current service costa |
|
|
|
|
477 |
|
|
|
328 |
|
|
|
51 |
|
|
|
151 |
|
|
|
1,007 |
|
| Past service costb |
|
|
|
|
(1 |
) |
|
|
20 |
|
|
|
– |
|
|
|
82 |
|
|
|
101 |
|
| Settlement |
|
|
|
|
– |
|
|
|
– |
|
|
|
– |
|
|
|
1 |
|
|
|
1 |
|
| Operating charge relating to defined benefit plans |
|
|
|
|
476 |
|
|
|
348 |
|
|
|
51 |
|
|
|
234 |
|
|
|
1,109 |
|
| Payments to defined contribution plans |
|
|
|
|
14 |
|
|
|
223 |
|
|
|
– |
|
|
|
44 |
|
|
|
281 |
|
| Total operating charge |
|
|
|
|
490 |
|
|
|
571 |
|
|
|
51 |
|
|
|
278 |
|
|
|
1,390 |
|
| Interest income on plan assets |
|
|
|
|
(1,146 |
) |
|
|
(304 |
) |
|
|
– |
|
|
|
(154 |
) |
|
|
(1,604 |
) |
| Interest on plan liabilities |
|
|
|
|
1,249 |
|
|
|
382 |
|
|
|
134 |
|
|
|
405 |
|
|
|
2,170 |
|
| Other finance expense |
|
|
|
|
103 |
|
|
|
78 |
|
|
|
134 |
|
|
|
251 |
|
|
|
566 |
|
| Analysis of the amount recognized in other comprehensive income |
|
|
|
|
|
|
|
|
|
|
|
|
|
|
|
|
|
|
|
|
|
|
| Actual asset return less interest income on plan assetsa |
|
|
|
|
1,523 |
|
|
|
718 |
|
|
|
– |
|
|
|
173 |
|
|
|
2,414 |
|
| Change in financial assumptions underlying the present value of the plan liabilities |
|
|
|
|
(1,446 |
) |
|
|
(1,427 |
) |
|
|
187 |
|
|
|
(1,093 |
) |
|
|
(3,779 |
) |
| Change in demographic assumptions underlying the present value of the plan liabilities |
|
|
|
|
– |
|
|
|
– |
|
|
|
52 |
|
|
|
(37 |
) |
|
|
15 |
|
| Experience gains and losses arising on the plan liabilities |
|
|
|
|
(116 |
) |
|
|
68 |
|
|
|
(48 |
) |
|
|
(126 |
) |
|
|
(222 |
) |
| Remeasurements recognized in other comprehensive income |
|
|
|
|
(39 |
) |
|
|
(641 |
) |
|
|
191 |
|
|
|
(1,083 |
) |
|
|
(1,572 |
) |
| Movements in benefit obligation during the year |
|
|
|
|
|
|
|
|
|
|
|
|
|
|
|
|
|
|
|
|
|
|
| Benefit obligation at 1 January |
|
|
|
|
25,675 |
|
|
|
8,617 |
|
|
|
3,061 |
|
|
|
8,801 |
|
|
|
46,154 |
|
| Exchange adjustments |
|
|
|
|
1,313 |
|
|
|
– |
|
|
|
– |
|
|
|
254 |
|
|
|
1,567 |
|
| Operating charge relating to defined benefit plans |
|
|
|
|
476 |
|
|
|
348 |
|
|
|
51 |
|
|
|
234 |
|
|
|
1,109 |
|
| Interest cost |
|
|
|
|
1,249 |
|
|
|
382 |
|
|
|
134 |
|
|
|
405 |
|
|
|
2,170 |
|
| Contributions by plan participantsc |
|
|
|
|
39 |
|
|
|
– |
|
|
|
– |
|
|
|
14 |
|
|
|
53 |
|
| Benefit payments (funded plans)d |
|
|
|
|
(1,038 |
) |
|
|
(593 |
) |
|
|
(3 |
) |
|
|
(230 |
) |
|
|
(1,864 |
) |
| Benefit payments (unfunded plans)d |
|
|
|
|
(7 |
) |
|
|
(84 |
) |
|
|
(207 |
) |
|
|
(394 |
) |
|
|
(692 |
) |
| Disposals |
|
|
|
|
(10 |
) |
|
|
– |
|
|
|
– |
|
|
|
(192 |
) |
|
|
(202 |
) |
| Remeasurements |
|
|
|
|
1,562 |
|
|
|
1,359 |
|
|
|
(191 |
) |
|
|
1,256 |
|
|
|
3,986 |
|
| Benefit obligation at 31 Decembera e |
|
|
|
|
29,259 |
|
|
|
10,029 |
|
|
|
2,845 |
|
|
|
10,148 |
|
|
|
52,281 |
|
| Movements in fair value of plan assets during the year |
|
|
|
|
|
|
|
|
|
|
|
|
|
|
|
|
|
|
|
|
|
|
| Fair value of plan assets at 1 January |
|
|
|
|
23,587 |
|
|
|
7,204 |
|
|
|
4 |
|
|
|
3,286 |
|
|
|
34,081 |
|
| Exchange adjustments |
|
|
|
|
1,215 |
|
|
|
– |
|
|
|
– |
|
|
|
88 |
|
|
|
1,303 |
|
| Interest income on plan assetsa |
|
|
|
|
1,146 |
|
|
|
304 |
|
|
|
– |
|
|
|
154 |
|
|
|
1,604 |
|
| Contributions by plan participantsc |
|
|
|
|
39 |
|
|
|
– |
|
|
|
– |
|
|
|
14 |
|
|
|
53 |
|
| Contributions by employers (funded plans) |
|
|
|
|
884 |
|
|
|
153 |
|
|
|
– |
|
|
|
238 |
|
|
|
1,275 |
|
| Benefit payments (funded plans)d |
|
|
|
|
(1,038 |
) |
|
|
(593 |
) |
|
|
(3 |
) |
|
|
(230 |
) |
|
|
(1,864 |
) |
| Disposals |
|
|
|
|
(10 |
) |
|
|
– |
|
|
|
– |
|
|
|
(190 |
) |
|
|
(200 |
) |
| Remeasurementsf |
|
|
|
|
1,523 |
|
|
|
718 |
|
|
|
– |
|
|
|
173 |
|
|
|
2,414 |
|
| Fair value of plan assets at 31 December |
|
|
|
|
27,346 |
|
|
|
7,786 |
|
|
|
1 |
|
|
|
3,533 |
|
|
|
38,666 |
|
| Deficit at 31 December |
|
|
|
|
(1,913 |
) |
|
|
(2,243 |
) |
|
|
(2,844 |
) |
|
|
(6,615 |
) |
|
|
(13,615 |
) |
| Represented by |
|
|
|
|
|
|
|
|
|
|
|
|
|
|
|
|
|
|
|
|
|
|
| Asset recognized |
|
|
|
|
– |
|
|
|
– |
|
|
|
– |
|
|
|
12 |
|
|
|
12 |
|
| Liability recognized |
|
|
|
|
(1,913 |
) |
|
|
(2,243 |
) |
|
|
(2,844 |
) |
|
|
(6,627 |
) |
|
|
(13,627 |
) |
| |
|
|
|
|
(1,913 |
) |
|
|
(2,243 |
) |
|
|
(2,844 |
) |
|
|
(6,615 |
) |
|
|
(13,615 |
) |
| The surplus (deficit) may be analysed between funded and unfunded plans as follows |
|
|
|
|
|
|
|
|
|
|
|
|
|
|
|
|
|
|
|
|
|
|
| Funded |
|
|
|
|
(1,688 |
) |
|
|
(1,599 |
) |
|
|
(43 |
) |
|
|
(539 |
) |
|
|
(3,869 |
) |
| Unfunded |
|
|
|
|
(225 |
) |
|
|
(644 |
) |
|
|
(2,801 |
) |
|
|
(6,076 |
) |
|
|
(9,746 |
) |
| |
|
|
|
|
(1,913 |
) |
|
|
(2,243 |
) |
|
|
(2,844 |
) |
|
|
(6,615 |
) |
|
|
(13,615 |
) |
| The defined benefit obligation may be analysed between funded and unfunded plans as follows |
|
|
|
|
|
|
|
|
|
|
|
|
|
|
|
|
|
|
|
|
|
|
| Funded |
|
|
|
|
(29,034 |
) |
|
|
(9,385 |
) |
|
|
(44 |
) |
|
|
(4,072 |
) |
|
|
(42,535 |
) |
| Unfunded |
|
|
|
|
(225 |
) |
|
|
(644 |
) |
|
|
(2,801 |
) |
|
|
(6,076 |
) |
|
|
(9,746 |
) |
| |
|
|
|
|
(29,259 |
) |
|
|
(10,029 |
) |
|
|
(2,845 |
) |
|
|
(10,148 |
) |
|
|
(52,281 |
) |
| a |
The costs of managing the plan’s investments are treated as being part of the return on plan assets, the costs of administering our pension plan benefits are generally included in current service cost and the costs
of administering our other post-retirement benefit plans are included in the benefit obligation. |
| b |
Past service costs are charges for special termination benefits representing the increased liability arising as a result of early retirements occurring as part of restructuring programmes. |
| c |
Most of the contributions made by plan participants into UK pension plans were made under salary sacrifice. |
| d |
The benefit payments amount shown above comprises $2,501 million benefits plus $55 million of plan expenses incurred in the administration of the benefit. |
| e |
The benefit obligation for other plans includes $4,783 million for the German plan, which is largely unfunded. |
| f |
The actual return on plan assets is made up of the sum of the interest income on plan assets and the remeasurement of plan assets as disclosed above. |
|
|
|
|
|
| BP Annual Report and Form 20-F 2013 |
|
|
183 |
|
30. Pensions and other post-retirement benefits – continued
|
|
|
|
|
|
|
|
|
|
|
|
|
|
|
|
|
|
|
|
|
|
|
| |
|
|
|
|
|
|
|
|
|
|
|
|
|
|
|
$ million |
|
| |
|
|
|
|
|
|
|
|
|
|
|
|
|
|
|
2011 |
|
| |
|
|
|
UK
pension
plans |
|
|
US pension
plans |
|
|
US other
post-
retirement
benefit
plans |
|
|
Other
plans |
|
|
Total |
|
| Analysis of the amount charged to profit before interest and
taxation |
|
|
|
|
|
|
|
|
|
|
|
|
|
|
|
|
|
|
|
|
|
|
| Current service costa |
|
|
|
|
383 |
|
|
|
280 |
|
|
|
53 |
|
|
|
135 |
|
|
|
851 |
|
| Past service cost |
|
|
|
|
3 |
|
|
|
184 |
|
|
|
– |
|
|
|
43 |
|
|
|
230 |
|
| Settlement |
|
|
|
|
– |
|
|
|
– |
|
|
|
– |
|
|
|
4 |
|
|
|
4 |
|
| Operating charge relating to defined benefit plans |
|
|
|
|
386 |
|
|
|
464 |
|
|
|
53 |
|
|
|
182 |
|
|
|
1,085 |
|
| Payments to defined contribution plans |
|
|
|
|
5 |
|
|
|
199 |
|
|
|
– |
|
|
|
41 |
|
|
|
245 |
|
| Total operating charge |
|
|
|
|
391 |
|
|
|
663 |
|
|
|
53 |
|
|
|
223 |
|
|
|
1,330 |
|
| Analysis of the amount credited (charged) to other finance expense |
|
|
|
|
|
|
|
|
|
|
|
|
|
|
|
|
|
|
|
|
|
|
| Interest income on plan assets |
|
|
|
|
(1,361 |
) |
|
|
(304 |
) |
|
|
– |
|
|
|
(178 |
) |
|
|
(1,843 |
) |
| Interest on plan liabilities |
|
|
|
|
1,263 |
|
|
|
369 |
|
|
|
163 |
|
|
|
448 |
|
|
|
2,243 |
|
| Other finance (income) expense |
|
|
|
|
(98 |
) |
|
|
65 |
|
|
|
163 |
|
|
|
270 |
|
|
|
400 |
|
| Analysis of the amount recognized in other comprehensive income |
|
|
|
|
|
|
|
|
|
|
|
|
|
|
|
|
|
|
|
|
|
|
| Actual asset return less interest income on plan assetsa |
|
|
|
|
(1,552 |
) |
|
|
224 |
|
|
|
(1 |
) |
|
|
(54 |
) |
|
|
(1,383 |
) |
| Change in financial assumptions underlying the present value of the plan liabilities |
|
|
|
|
(2,251 |
) |
|
|
(468 |
) |
|
|
(63 |
) |
|
|
(636 |
) |
|
|
(3,418 |
) |
| Change in demographic assumptions underlying the present value of the plan liabilities |
|
|
|
|
(429 |
) |
|
|
(44 |
) |
|
|
102 |
|
|
|
(6 |
) |
|
|
(377 |
) |
| Experience gains and losses arising on the plan liabilities |
|
|
|
|
(84 |
) |
|
|
(102 |
) |
|
|
89 |
|
|
|
(26 |
) |
|
|
(123 |
) |
| Remeasurements recognized in other comprehensive income |
|
|
|
|
(4,316 |
) |
|
|
(390 |
) |
|
|
127 |
|
|
|
(722 |
) |
|
|
(5,301 |
) |
| a |
The costs of managing the plan’s investments are treated as being part of the return on plan assets, the costs of administering our pension plan benefits are generally included in current service cost and the costs
of administering our other post-retirement benefit plans are included in the benefit obligation. |
At 31 December 2013, reimbursement balances due
from or to other companies in respect of pensions amounted to $399 million reimbursement assets (2012 $381 million) and $15 million reimbursement liabilities (2012 $15 million). These balances are not included as part of the pension surpluses and
deficits, but are reflected within other receivables and other payables in the group balance sheet.
Sensitivity analysis
The discount rate, inflation, salary growth, US healthcare cost trend rate and the mortality assumptions all have a significant effect on the amounts reported. A
one-percentage point change, in isolation, in certain assumptions as at 31 December 2013 for the group’s plans would have had the effects shown in the table below. The effects shown for the expense in 2014 comprise the total of current
service cost and net finance income or expense.
|
|
|
|
|
|
|
|
|
|
|
| |
|
|
|
|
|
|
$ million |
|
| |
|
|
|
One percentage point |
|
| |
|
|
|
Increase |
|
|
Decrease |
|
| Discount ratea |
|
|
|
|
|
|
|
|
|
|
| Effect on pension and other post-retirement benefit expense in 2014 |
|
|
|
|
(474 |
) |
|
|
481 |
|
| Effect on pension and other post-retirement benefit obligation at 31 December 2013 |
|
|
|
|
(6,918 |
) |
|
|
9,059 |
|
| Inflation rate |
|
|
|
|
|
|
|
|
|
|
| Effect on pension and other post-retirement benefit expense in 2014 |
|
|
|
|
521 |
|
|
|
(397 |
) |
| Effect on pension and other post-retirement benefit obligation at 31 December 2013 |
|
|
|
|
7,120 |
|
|
|
(5,658 |
) |
| Salary growth |
|
|
|
|
|
|
|
|
|
|
| Effect on pension and other post-retirement benefit expense in 2014 |
|
|
|
|
142 |
|
|
|
(123 |
) |
| Effect on pension and other post-retirement benefit obligation at 31 December 2013 |
|
|
|
|
1,300 |
|
|
|
(1,158 |
) |
| US healthcare cost trend rate |
|
|
|
|
|
|
|
|
|
|
| Effect on US other post-retirement benefit expense in 2014 |
|
|
|
|
16 |
|
|
|
(13 |
) |
| Effect on US other post-retirement obligation at 31 December 2013 |
|
|
|
|
278 |
|
|
|
(233 |
) |
| a |
The amounts presented reflect that the discount rate is used to determine the asset interest income as well as the interest cost on the obligation. |
One additional year of longevity in the mortality assumptions would have the effects shown in the table below. The effect shown for the expense in 2014 comprises the
total of current service cost and net finance income or expense.
|
|
|
|
|
|
|
|
|
|
|
|
|
|
|
|
|
|
|
| |
|
|
|
|
|
|
|
|
|
|
|
|
$ million |
|
| |
|
|
|
UK
pension
plans |
|
|
US
pension
plans |
|
|
US other
post-
retirement
benefit
plans |
|
|
German
pension
plans |
|
| One additional year’s longevity |
|
|
|
|
|
|
|
|
|
|
|
|
|
|
|
|
|
|
| Effect on pension and other post-retirement benefit expense in 2014 |
|
|
|
|
52 |
|
|
|
5 |
|
|
|
3 |
|
|
|
9 |
|
| Effect on pension and other post-retirement benefit obligation at 31 December 2013 |
|
|
|
|
927 |
|
|
|
95 |
|
|
|
46 |
|
|
|
213 |
|
|
|
|
| 184 |
|
BP Annual Report and Form 20-F 2013 |
30. Pensions and other post-retirement benefits – continued
Estimated future benefit payments and the weighted average duration of defined benefit
obligations
The expected benefit payments, which reflect expected future service, as appropriate, but exclude plan expenses, up until 2023 and the
weighted average duration of the defined benefit obligations at the end of the reporting period are as follows:
|
|
|
|
|
|
|
|
|
|
|
|
|
|
|
|
|
|
|
|
|
|
|
| |
|
|
|
|
|
|
|
|
|
|
|
|
|
|
|
$ million |
|
| Estimated future benefit payments |
|
|
|
UK
pension
plans |
|
|
US
pension
plans |
|
|
US
other post-
retirement
benefit
plans |
|
|
Other plans |
|
|
Total |
|
| 2014 |
|
|
|
|
1,153 |
|
|
|
690 |
|
|
|
174 |
|
|
|
596 |
|
|
|
2,613 |
|
| 2015 |
|
|
|
|
1,201 |
|
|
|
715 |
|
|
|
177 |
|
|
|
585 |
|
|
|
2,678 |
|
| 2016 |
|
|
|
|
1,265 |
|
|
|
726 |
|
|
|
178 |
|
|
|
582 |
|
|
|
2,751 |
|
| 2017 |
|
|
|
|
1,281 |
|
|
|
733 |
|
|
|
178 |
|
|
|
570 |
|
|
|
2,762 |
|
| 2018 |
|
|
|
|
1,361 |
|
|
|
735 |
|
|
|
178 |
|
|
|
560 |
|
|
|
2,834 |
|
| 2019-2023 |
|
|
|
|
7,282 |
|
|
|
3,533 |
|
|
|
874 |
|
|
|
2,651 |
|
|
|
14,340 |
|
| |
|
|
|
|
|
|
|
|
|
|
|
|
|
|
|
years |
|
| Weighted average duration |
|
|
|
|
17.6 |
|
|
|
8.3 |
|
|
|
10.5 |
|
|
|
13.2 |
|
|
|
|
|
31. Called-up share capital
The allotted, called up and fully paid share capital at 31 December was as follows:
|
|
|
|
|
|
|
|
|
|
|
|
|
|
|
|
|
|
|
|
|
|
|
|
|
|
|
| |
|
|
|
|
|
|
2013 |
|
|
|
|
|
2012 |
|
|
|
|
|
2011 |
|
| Issued |
|
|
|
Shares
thousand |
|
|
$ million |
|
|
Shares
thousand |
|
|
$ million |
|
|
Shares
thousand |
|
|
$ million |
|
| 8% cumulative first preference shares of £1 eacha |
|
|
|
|
7,233 |
|
|
|
12 |
|
|
|
7,233 |
|
|
|
12 |
|
|
|
7,233 |
|
|
|
12 |
|
| 9% cumulative second preference shares of £1
eacha |
|
|
|
|
5,473 |
|
|
|
9 |
|
|
|
5,473 |
|
|
|
9 |
|
|
|
5,473 |
|
|
|
9 |
|
| |
|
|
|
|
|
|
|
|
21 |
|
|
|
|
|
|
|
21 |
|
|
|
|
|
|
|
21 |
|
| Ordinary shares of 25 cents each |
|
|
|
|
|
|
|
|
|
|
|
|
|
|
|
|
|
|
|
|
|
|
|
|
|
|
| At 1 January |
|
|
|
|
20,959,159 |
|
|
|
5,240 |
|
|
|
20,813,410 |
|
|
|
5,203 |
|
|
|
20,647,160 |
|
|
|
5,162 |
|
| Issue of new shares for the scrip dividend programme |
|
|
|
|
202,124 |
|
|
|
51 |
|
|
|
138,406 |
|
|
|
35 |
|
|
|
165,601 |
|
|
|
41 |
|
| Issue of new shares for employee share-based payment plansb |
|
|
|
|
18,203 |
|
|
|
5 |
|
|
|
7,343 |
|
|
|
2 |
|
|
|
649 |
|
|
|
– |
|
| Repurchase of ordinary share capitalc |
|
|
|
|
(752,854 |
) |
|
|
(188 |
) |
|
|
– |
|
|
|
– |
|
|
|
– |
|
|
|
– |
|
| At 31 December |
|
|
|
|
20,426,632 |
|
|
|
5,108 |
|
|
|
20,959,159 |
|
|
|
5,240 |
|
|
|
20,813,410 |
|
|
|
5,203 |
|
| |
|
|
|
|
|
|
|
|
5,129 |
|
|
|
|
|
|
|
5,261 |
|
|
|
|
|
|
|
5,224 |
|
| a |
The nominal amount of 8% cumulative first preference shares and 9% cumulative second preference shares that can be in issue at any time shall not exceed £10,000,000 for each class of preference shares.
|
| b |
The nominal value of new shares issued for the employee share plans in 2011 amounted to $162,000. Consideration received relating to the issue of new shares for employee share plans amounted to $116 million (2012 $47
million and 2011 $4 million). |
| c |
Purchased for a total consideration of $5,493 million, including transaction costs of $30 million. All shares purchased were for cancellation. The repurchased shares represented 3.6% of ordinary share capital.
|
Voting on substantive resolutions tabled at a general meeting is on a poll. On a poll, shareholders present in person or by proxy have two votes for
every £5 in nominal amount of the first and second preference shares held and one vote for every ordinary share held. On a show-of-hands vote on other resolutions (procedural matters) at a general meeting, shareholders present in person or by
proxy have one vote each.
In the event of the winding up of the company, preference shareholders would be entitled to a sum equal to the capital paid up on the
preference shares, plus an amount in respect of accrued and unpaid dividends and a premium equal to the higher of (i) 10% of the capital paid up on the preference shares and (ii) the excess of the average market price of such shares on the
London Stock Exchange during the previous six months over par value.
During 2013 the company repurchased 753 million ordinary shares at a cost of $5,463 million
as part of the share repurchase programme announced on 22 March 2013. The number of shares in issue is reduced when shares are repurchased, but is not reduced in respect of the year-end commitment to repurchase shares subsequent to the end of
the year, for which an amount of $1,430 million has been accrued at 31 December 2013 (2012 nil).
Treasury shares
|
|
|
|
|
|
|
|
|
|
|
|
|
|
|
|
|
|
|
|
|
|
|
|
|
|
|
| |
|
|
|
|
|
|
2013 |
|
|
|
|
|
2012 |
|
|
|
|
|
2011 |
|
| |
|
|
|
Shares
thousand |
|
|
Nominal value
$ million |
|
|
Shares
thousand |
|
|
Nominal value
$ million |
|
|
Shares
thousand |
|
|
Nominal value
$ million |
|
| At 1 January |
|
|
|
|
1,823,408 |
|
|
|
455 |
|
|
|
1,837,508 |
|
|
|
459 |
|
|
|
1,850,699 |
|
|
|
462 |
|
| Shares re-issued for employee share-based payment plans |
|
|
|
|
(35,469 |
) |
|
|
(8 |
) |
|
|
(14,100 |
) |
|
|
(4 |
) |
|
|
(13,191 |
) |
|
|
(3 |
) |
| At 31 December |
|
|
|
|
1,787,939 |
|
|
|
447 |
|
|
|
1,823,408 |
|
|
|
455 |
|
|
|
1,837,508 |
|
|
|
459 |
|
For each year presented, the balance at 1 January represents the maximum number of shares held in treasury during the year,
representing 8.7% (2012 8.8% and 2011 9.0%) of the called-up ordinary share capital of the company.
During 2013, the movement in treasury shares represented less
than 0.2% (2012 less than 0.1% and 2011 less than 0.1%) of the ordinary share capital of the company.
|
|
|
|
|
| BP Annual Report and Form 20-F 2013 |
|
|
185 |
|
32. Capital and reserves
|
|
|
|
|
|
|
|
|
|
|
|
|
|
|
|
|
|
|
|
|
|
|
| |
|
|
|
|
|
|
|
|
|
|
|
|
|
|
|
|
|
| |
|
|
|
Share
capital |
|
|
Share
premium
account |
|
|
Capital
redemption
reserve |
|
|
Merger
reserve |
|
|
Total
share capital
and capital
reserves |
|
| At 1 January 2013 |
|
|
|
|
5,261 |
|
|
|
9,974 |
|
|
|
1,072 |
|
|
|
27,206 |
|
|
|
43,513 |
|
| Profit for the year |
|
|
|
|
– |
|
|
|
– |
|
|
|
– |
|
|
|
– |
|
|
|
– |
|
| Items that may be reclassified subsequently to profit or loss |
|
|
|
|
|
|
|
|
|
|
|
|
|
|
|
|
|
|
|
|
|
|
| Currency translation differences (including recycling) |
|
|
|
|
– |
|
|
|
– |
|
|
|
– |
|
|
|
– |
|
|
|
– |
|
| Available-for-sale investments (including recycling) |
|
|
|
|
– |
|
|
|
– |
|
|
|
– |
|
|
|
– |
|
|
|
– |
|
| Cash flow hedges (including recycling) |
|
|
|
|
– |
|
|
|
– |
|
|
|
– |
|
|
|
– |
|
|
|
– |
|
| Share of items relating to equity-accounted entities, net of tax |
|
|
|
|
– |
|
|
|
– |
|
|
|
– |
|
|
|
– |
|
|
|
– |
|
| Other |
|
|
|
|
– |
|
|
|
– |
|
|
|
– |
|
|
|
– |
|
|
|
– |
|
| Items that will not be reclassified to profit or loss |
|
|
|
|
|
|
|
|
|
|
|
|
|
|
|
|
|
|
|
|
|
|
| Remeasurements of the net pension and other post-retirement benefit liability or asset |
|
|
|
|
– |
|
|
|
– |
|
|
|
– |
|
|
|
– |
|
|
|
– |
|
| Share of items relating to equity-accounted entities, net of tax |
|
|
|
|
– |
|
|
|
– |
|
|
|
– |
|
|
|
– |
|
|
|
– |
|
| Total comprehensive income |
|
|
|
|
– |
|
|
|
– |
|
|
|
– |
|
|
|
– |
|
|
|
– |
|
| Dividends |
|
|
|
|
51 |
|
|
|
(51 |
) |
|
|
– |
|
|
|
– |
|
|
|
– |
|
| Repurchases of ordinary share capital |
|
|
|
|
(188 |
) |
|
|
– |
|
|
|
188 |
|
|
|
– |
|
|
|
– |
|
| Share-based payments, net of taxa |
|
|
|
|
5 |
|
|
|
138 |
|
|
|
– |
|
|
|
– |
|
|
|
143 |
|
| Share of equity-accounted entities’ changes in equity, net of tax |
|
|
|
|
– |
|
|
|
– |
|
|
|
– |
|
|
|
– |
|
|
|
– |
|
| Transactions involving non-controlling interests |
|
|
|
|
– |
|
|
|
– |
|
|
|
– |
|
|
|
– |
|
|
|
– |
|
| At 31 December 2013 |
|
|
|
|
5,129 |
|
|
|
10,061 |
|
|
|
1,260 |
|
|
|
27,206 |
|
|
|
43,656 |
|
|
|
|
|
|
|
|
|
|
|
|
|
|
|
|
|
|
|
|
|
|
|
|
| |
|
|
|
Share
capital |
|
|
Share
premium
account |
|
|
Capital
redemption
reserve |
|
|
Merger
reserve |
|
|
Total
share capital
and capital
reserves |
|
| At 1 January 2012 |
|
|
|
|
5,224 |
|
|
|
9,952 |
|
|
|
1,072 |
|
|
|
27,206 |
|
|
|
43,454 |
|
| Profit for the year |
|
|
|
|
– |
|
|
|
– |
|
|
|
– |
|
|
|
– |
|
|
|
– |
|
| Items that may be reclassified subsequently to profit or loss |
|
|
|
|
|
|
|
|
|
|
|
|
|
|
|
|
|
|
|
|
|
|
| Currency translation differences (including recycling) |
|
|
|
|
– |
|
|
|
– |
|
|
|
– |
|
|
|
– |
|
|
|
– |
|
| Available-for-sale investments (including recycling) |
|
|
|
|
– |
|
|
|
– |
|
|
|
– |
|
|
|
– |
|
|
|
– |
|
| Cash flow hedges (including recycling) |
|
|
|
|
– |
|
|
|
– |
|
|
|
– |
|
|
|
– |
|
|
|
– |
|
| Share of items relating to equity-accounted entities, net of tax |
|
|
|
|
– |
|
|
|
– |
|
|
|
– |
|
|
|
– |
|
|
|
– |
|
| Other |
|
|
|
|
– |
|
|
|
– |
|
|
|
– |
|
|
|
– |
|
|
|
– |
|
| Items that will not be reclassified to profit or loss |
|
|
|
|
|
|
|
|
|
|
|
|
|
|
|
|
|
|
|
|
|
|
| Remeasurements of the net pension and other post-retirement benefit liability or asset |
|
|
|
|
– |
|
|
|
– |
|
|
|
– |
|
|
|
– |
|
|
|
– |
|
| Share of items relating to equity-accounted entities, net of tax |
|
|
|
|
– |
|
|
|
– |
|
|
|
– |
|
|
|
– |
|
|
|
– |
|
| Total comprehensive income |
|
|
|
|
– |
|
|
|
– |
|
|
|
– |
|
|
|
– |
|
|
|
– |
|
| Dividends |
|
|
|
|
35 |
|
|
|
(35 |
) |
|
|
– |
|
|
|
– |
|
|
|
– |
|
| Share-based payments, net of taxa |
|
|
|
|
2 |
|
|
|
57 |
|
|
|
– |
|
|
|
– |
|
|
|
59 |
|
| Transactions involving non-controlling interests |
|
|
|
|
– |
|
|
|
– |
|
|
|
– |
|
|
|
– |
|
|
|
– |
|
| At 31 December 2012 |
|
|
|
|
5,261 |
|
|
|
9,974 |
|
|
|
1,072 |
|
|
|
27,206 |
|
|
|
43,513 |
|
|
|
|
|
|
|
|
|
|
|
|
|
|
|
|
|
|
|
|
|
|
|
|
| |
|
|
|
Share
capital |
|
|
Share
premium
account |
|
|
Capital
redemption
reserve |
|
|
Merger
reserve |
|
|
Total
share capital
and capital
reserves |
|
| At 1 January 2011 |
|
|
|
|
5,183 |
|
|
|
9,987 |
|
|
|
1,072 |
|
|
|
27,206 |
|
|
|
43,448 |
|
| Profit for the year |
|
|
|
|
– |
|
|
|
– |
|
|
|
– |
|
|
|
– |
|
|
|
– |
|
| Items that may be reclassified subsequently to profit or loss |
|
|
|
|
|
|
|
|
|
|
|
|
|
|
|
|
|
|
|
|
|
|
| Currency translation differences (including recycling) |
|
|
|
|
– |
|
|
|
– |
|
|
|
– |
|
|
|
– |
|
|
|
– |
|
| Available-for-sale investments (including recycling) |
|
|
|
|
– |
|
|
|
– |
|
|
|
– |
|
|
|
– |
|
|
|
– |
|
| Cash flow hedges (including recycling) |
|
|
|
|
– |
|
|
|
– |
|
|
|
– |
|
|
|
– |
|
|
|
– |
|
| Share of items relating to equity-accounted entities, net of tax |
|
|
|
|
– |
|
|
|
– |
|
|
|
– |
|
|
|
– |
|
|
|
– |
|
| Items that will not be reclassified to profit or loss |
|
|
|
|
|
|
|
|
|
|
|
|
|
|
|
|
|
|
|
|
|
|
| Remeasurements of the net pension and other post-retirement benefit liability or asset |
|
|
|
|
– |
|
|
|
– |
|
|
|
– |
|
|
|
– |
|
|
|
– |
|
| Total comprehensive income |
|
|
|
|
– |
|
|
|
– |
|
|
|
– |
|
|
|
– |
|
|
|
– |
|
| Dividends |
|
|
|
|
41 |
|
|
|
(41 |
) |
|
|
– |
|
|
|
– |
|
|
|
– |
|
| Share-based payments, net of taxa |
|
|
|
|
– |
|
|
|
6 |
|
|
|
– |
|
|
|
– |
|
|
|
6 |
|
| Transactions involving non-controlling interests |
|
|
|
|
– |
|
|
|
– |
|
|
|
– |
|
|
|
– |
|
|
|
– |
|
| At 31 December 2011 |
|
|
|
|
5,224 |
|
|
|
9,952 |
|
|
|
1,072 |
|
|
|
27,206 |
|
|
|
43,454 |
|
| a |
Includes new share issues and movements in own shares and treasury shares where these relate to employee share-based payment plans. |
|
|
|
| 186 |
|
BP Annual Report and Form 20-F 2013 |
|
|
|
|
|
|
|
|
|
|
|
|
|
|
|
|
|
|
|
|
|
|
|
|
|
|
|
|
|
|
|
|
|
|
|
|
|
|
|
|
|
|
|
|
|
|
|
|
|
| |
|
|
|
|
|
|
|
|
|
|
|
|
|
|
|
|
|
|
|
|
|
|
|
|
|
|
|
|
|
|
|
|
|
|
$ million |
|
| |
|
Own
shares |
|
|
Treasury
shares |
|
|
Total
own shares
and treasury
shares |
|
|
Foreign
currency
translation
reserve |
|
|
Available-
for-sale
investments |
|
|
Cash flow
hedges |
|
|
Total
fair value
reserves |
|
|
Share-
based
payment
reserve |
|
|
Profit and
loss
account |
|
|
BP
shareholders’
equity |
|
|
Non-
controlling
interests |
|
|
Total
equity |
|
| |
|
|
(280 |
) |
|
|
(20,774 |
) |
|
|
(21,054 |
) |
|
|
5,128 |
|
|
|
685 |
|
|
|
1,090 |
|
|
|
1,775 |
|
|
|
1,608 |
|
|
|
87,576 |
|
|
|
118,546 |
|
|
|
1,206 |
|
|
|
119,752 |
|
|
|
|
– |
|
|
|
– |
|
|
|
– |
|
|
|
– |
|
|
|
– |
|
|
|
– |
|
|
|
– |
|
|
|
– |
|
|
|
23,451 |
|
|
|
23,451 |
|
|
|
307 |
|
|
|
23,758 |
|
|
|
|
|
|
|
|
|
|
|
|
|
|
|
|
|
|
|
|
|
|
|
|
|
|
|
|
|
|
|
|
|
|
|
|
|
|
|
|
|
|
|
|
|
|
|
|
|
|
|
|
|
– |
|
|
|
– |
|
|
|
– |
|
|
|
(1,603 |
) |
|
|
– |
|
|
|
– |
|
|
|
– |
|
|
|
– |
|
|
|
– |
|
|
|
(1,603 |
) |
|
|
(15 |
) |
|
|
(1,618 |
) |
|
|
|
– |
|
|
|
– |
|
|
|
– |
|
|
|
– |
|
|
|
(685 |
) |
|
|
– |
|
|
|
(685 |
) |
|
|
– |
|
|
|
– |
|
|
|
(685 |
) |
|
|
– |
|
|
|
(685 |
) |
|
|
|
– |
|
|
|
– |
|
|
|
– |
|
|
|
– |
|
|
|
– |
|
|
|
(1,785 |
) |
|
|
(1,785 |
) |
|
|
– |
|
|
|
– |
|
|
|
(1,785 |
) |
|
|
– |
|
|
|
(1,785 |
) |
|
|
|
– |
|
|
|
– |
|
|
|
– |
|
|
|
– |
|
|
|
– |
|
|
|
– |
|
|
|
– |
|
|
|
– |
|
|
|
(24 |
) |
|
|
(24 |
) |
|
|
– |
|
|
|
(24 |
) |
|
|
|
– |
|
|
|
– |
|
|
|
– |
|
|
|
– |
|
|
|
– |
|
|
|
– |
|
|
|
– |
|
|
|
– |
|
|
|
(25 |
) |
|
|
(25 |
) |
|
|
– |
|
|
|
(25 |
) |
|
|
|
|
|
|
|
|
|
|
|
|
|
|
|
|
|
|
|
|
|
|
|
|
|
|
|
|
|
|
|
|
|
|
|
|
|
|
|
|
|
|
|
|
|
|
|
|
|
|
|
|
– |
|
|
|
– |
|
|
|
– |
|
|
|
– |
|
|
|
– |
|
|
|
– |
|
|
|
– |
|
|
|
– |
|
|
|
3,243 |
|
|
|
3,243 |
|
|
|
– |
|
|
|
3,243 |
|
| |
|
|
– |
|
|
|
– |
|
|
|
– |
|
|
|
– |
|
|
|
– |
|
|
|
– |
|
|
|
– |
|
|
|
– |
|
|
|
2 |
|
|
|
2 |
|
|
|
– |
|
|
|
2 |
|
|
|
|
– |
|
|
|
– |
|
|
|
– |
|
|
|
(1,603 |
) |
|
|
(685 |
) |
|
|
(1,785 |
) |
|
|
(2,470 |
) |
|
|
– |
|
|
|
26,647 |
|
|
|
22,574 |
|
|
|
292 |
|
|
|
22,866 |
|
|
|
|
– |
|
|
|
– |
|
|
|
– |
|
|
|
– |
|
|
|
– |
|
|
|
– |
|
|
|
– |
|
|
|
– |
|
|
|
(5,441 |
) |
|
|
(5,441 |
) |
|
|
(469 |
) |
|
|
(5,910 |
) |
|
|
|
– |
|
|
|
– |
|
|
|
– |
|
|
|
– |
|
|
|
– |
|
|
|
– |
|
|
|
– |
|
|
|
– |
|
|
|
(6,923 |
) |
|
|
(6,923 |
) |
|
|
– |
|
|
|
(6,923 |
) |
|
|
|
(321 |
) |
|
|
404 |
|
|
|
83 |
|
|
|
– |
|
|
|
– |
|
|
|
– |
|
|
|
– |
|
|
|
97 |
|
|
|
150 |
|
|
|
473 |
|
|
|
– |
|
|
|
473 |
|
|
|
|
– |
|
|
|
– |
|
|
|
– |
|
|
|
– |
|
|
|
– |
|
|
|
– |
|
|
|
– |
|
|
|
– |
|
|
|
73 |
|
|
|
73 |
|
|
|
– |
|
|
|
73 |
|
| |
|
|
– |
|
|
|
– |
|
|
|
– |
|
|
|
– |
|
|
|
– |
|
|
|
– |
|
|
|
– |
|
|
|
– |
|
|
|
– |
|
|
|
– |
|
|
|
76 |
|
|
|
76 |
|
| |
|
|
(601 |
) |
|
|
(20,370 |
) |
|
|
(20,971 |
) |
|
|
3,525 |
|
|
|
– |
|
|
|
(695 |
) |
|
|
(695 |
) |
|
|
1,705 |
|
|
|
102,082 |
|
|
|
129,302 |
|
|
|
1,105 |
|
|
|
130,407 |
|
| |
|
|
|
|
|
|
|
|
|
|
|
|
|
|
|
|
|
|
|
|
|
|
|
|
|
|
|
|
|
|
|
|
|
|
|
|
|
|
|
|
|
|
|
|
|
|
|
|
| |
|
Own
shares |
|
|
Treasury
shares |
|
|
Total own
shares and
treasury
shares |
|
|
Foreign
currency
translation
reserve |
|
|
Available-
for-sale
investments |
|
|
Cash flow
hedges |
|
|
Total fair
value
reserves |
|
|
Share-
based
payment
reserve |
|
|
Profit and
loss
account |
|
|
BP
shareholders’
equity |
|
|
Non-
controlling
interests |
|
|
Total
equity |
|
| |
|
|
(388 |
) |
|
|
(20,935 |
) |
|
|
(21,323 |
) |
|
|
4,509 |
|
|
|
389 |
|
|
|
(122 |
) |
|
|
267 |
|
|
|
1,582 |
|
|
|
83,079 |
|
|
|
111,568 |
|
|
|
1,017 |
|
|
|
112,585 |
|
|
|
|
– |
|
|
|
– |
|
|
|
– |
|
|
|
– |
|
|
|
– |
|
|
|
– |
|
|
|
– |
|
|
|
– |
|
|
|
11,017 |
|
|
|
11,017 |
|
|
|
234 |
|
|
|
11,251 |
|
|
|
|
|
|
|
|
|
|
|
|
|
|
|
|
|
|
|
|
|
|
|
|
|
|
|
|
|
|
|
|
|
|
|
|
|
|
|
|
|
|
|
|
|
|
|
|
|
|
|
|
|
– |
|
|
|
– |
|
|
|
– |
|
|
|
619 |
|
|
|
– |
|
|
|
(5 |
) |
|
|
(5 |
) |
|
|
– |
|
|
|
– |
|
|
|
614 |
|
|
|
2 |
|
|
|
616 |
|
|
|
|
– |
|
|
|
– |
|
|
|
– |
|
|
|
– |
|
|
|
296 |
|
|
|
– |
|
|
|
296 |
|
|
|
– |
|
|
|
– |
|
|
|
296 |
|
|
|
– |
|
|
|
296 |
|
|
|
|
– |
|
|
|
– |
|
|
|
– |
|
|
|
– |
|
|
|
– |
|
|
|
1,217 |
|
|
|
1,217 |
|
|
|
– |
|
|
|
– |
|
|
|
1,217 |
|
|
|
– |
|
|
|
1,217 |
|
|
|
|
– |
|
|
|
– |
|
|
|
– |
|
|
|
– |
|
|
|
– |
|
|
|
– |
|
|
|
– |
|
|
|
– |
|
|
|
(39 |
) |
|
|
(39 |
) |
|
|
– |
|
|
|
(39 |
) |
|
|
|
– |
|
|
|
– |
|
|
|
– |
|
|
|
– |
|
|
|
– |
|
|
|
– |
|
|
|
– |
|
|
|
– |
|
|
|
23 |
|
|
|
23 |
|
|
|
– |
|
|
|
23 |
|
|
|
|
|
|
|
|
|
|
|
|
|
|
|
|
|
|
|
|
|
|
|
|
|
|
|
|
|
|
|
|
|
|
|
|
|
|
|
|
|
|
|
|
|
|
|
|
|
|
|
|
|
– |
|
|
|
– |
|
|
|
– |
|
|
|
– |
|
|
|
– |
|
|
|
– |
|
|
|
– |
|
|
|
– |
|
|
|
(1,134 |
) |
|
|
(1,134 |
) |
|
|
2 |
|
|
|
(1,132 |
) |
| |
|
|
– |
|
|
|
– |
|
|
|
– |
|
|
|
– |
|
|
|
– |
|
|
|
– |
|
|
|
– |
|
|
|
– |
|
|
|
(6 |
) |
|
|
(6 |
) |
|
|
– |
|
|
|
(6 |
) |
|
|
|
– |
|
|
|
– |
|
|
|
– |
|
|
|
619 |
|
|
|
296 |
|
|
|
1,212 |
|
|
|
1,508 |
|
|
|
– |
|
|
|
9,861 |
|
|
|
11,988 |
|
|
|
238 |
|
|
|
12,226 |
|
|
|
|
– |
|
|
|
– |
|
|
|
– |
|
|
|
– |
|
|
|
– |
|
|
|
– |
|
|
|
– |
|
|
|
– |
|
|
|
(5,294 |
) |
|
|
(5,294 |
) |
|
|
(82 |
) |
|
|
(5,376 |
) |
|
|
|
108 |
|
|
|
161 |
|
|
|
269 |
|
|
|
– |
|
|
|
– |
|
|
|
– |
|
|
|
– |
|
|
|
26 |
|
|
|
(70 |
) |
|
|
284 |
|
|
|
– |
|
|
|
284 |
|
| |
|
|
– |
|
|
|
– |
|
|
|
– |
|
|
|
– |
|
|
|
– |
|
|
|
– |
|
|
|
– |
|
|
|
– |
|
|
|
– |
|
|
|
– |
|
|
|
33 |
|
|
|
33 |
|
| |
|
|
(280 |
) |
|
|
(20,774 |
) |
|
|
(21,054 |
) |
|
|
5,128 |
|
|
|
685 |
|
|
|
1,090 |
|
|
|
1,775 |
|
|
|
1,608 |
|
|
|
87,576 |
|
|
|
118,546 |
|
|
|
1,206 |
|
|
|
119,752 |
|
| |
|
|
|
|
|
|
|
|
|
|
|
|
|
|
|
|
|
|
|
|
|
|
|
|
|
|
|
|
|
|
|
|
|
|
|
|
|
|
|
|
|
|
|
|
|
|
|
|
| |
|
Own
shares |
|
|
Treasury
shares |
|
|
Total own
shares and
treasury
shares |
|
|
Foreign
currency
translation
reserve |
|
|
Available-
for-sale
investments |
|
|
Cash flow
hedges |
|
|
Total fair
value
reserves |
|
|
Share-
based
payment
reserve |
|
|
Profit and
loss
account |
|
|
BP
shareholders’
equity |
|
|
Non-
controlling
interests |
|
|
Total
equity |
|
| |
|
|
(126 |
) |
|
|
(21,085 |
) |
|
|
(21,211 |
) |
|
|
5,036 |
|
|
|
463 |
|
|
|
6 |
|
|
|
469 |
|
|
|
1,586 |
|
|
|
65,754 |
|
|
|
95,082 |
|
|
|
904 |
|
|
|
95,986 |
|
|
|
|
– |
|
|
|
– |
|
|
|
– |
|
|
|
– |
|
|
|
– |
|
|
|
– |
|
|
|
– |
|
|
|
– |
|
|
|
25,212 |
|
|
|
25,212 |
|
|
|
397 |
|
|
|
25,609 |
|
|
|
|
|
|
|
|
|
|
|
|
|
|
|
|
|
|
|
|
|
|
|
|
|
|
|
|
|
|
|
|
|
|
|
|
|
|
|
|
|
|
|
|
|
|
|
|
|
|
|
|
|
– |
|
|
|
– |
|
|
|
– |
|
|
|
(527 |
) |
|
|
– |
|
|
|
(1 |
) |
|
|
(1 |
) |
|
|
– |
|
|
|
– |
|
|
|
(528 |
) |
|
|
(10 |
) |
|
|
(538 |
) |
|
|
|
– |
|
|
|
– |
|
|
|
– |
|
|
|
– |
|
|
|
(74 |
) |
|
|
– |
|
|
|
(74 |
) |
|
|
– |
|
|
|
– |
|
|
|
(74 |
) |
|
|
– |
|
|
|
(74 |
) |
|
|
|
– |
|
|
|
– |
|
|
|
– |
|
|
|
– |
|
|
|
– |
|
|
|
(127 |
) |
|
|
(127 |
) |
|
|
– |
|
|
|
– |
|
|
|
(127 |
) |
|
|
– |
|
|
|
(127 |
) |
|
|
|
– |
|
|
|
– |
|
|
|
– |
|
|
|
– |
|
|
|
– |
|
|
|
– |
|
|
|
– |
|
|
|
– |
|
|
|
(39 |
) |
|
|
(39 |
) |
|
|
– |
|
|
|
(39 |
) |
|
|
|
|
|
|
|
|
|
|
|
|
|
|
|
|
|
|
|
|
|
|
|
|
|
|
|
|
|
|
|
|
|
|
|
|
|
|
|
|
|
|
|
|
|
|
|
|
|
| |
|
|
– |
|
|
|
– |
|
|
|
– |
|
|
|
– |
|
|
|
– |
|
|
|
– |
|
|
|
– |
|
|
|
– |
|
|
|
(3,831 |
) |
|
|
(3,831 |
) |
|
|
(3 |
) |
|
|
(3,834 |
) |
|
|
|
– |
|
|
|
– |
|
|
|
– |
|
|
|
(527 |
) |
|
|
(74 |
) |
|
|
(128 |
) |
|
|
(202 |
) |
|
|
– |
|
|
|
21,342 |
|
|
|
20,613 |
|
|
|
384 |
|
|
|
20,997 |
|
|
|
|
– |
|
|
|
– |
|
|
|
– |
|
|
|
– |
|
|
|
– |
|
|
|
– |
|
|
|
– |
|
|
|
– |
|
|
|
(4,072 |
) |
|
|
(4,072 |
) |
|
|
(245 |
) |
|
|
(4,317 |
) |
|
|
|
(262 |
) |
|
|
150 |
|
|
|
(112 |
) |
|
|
– |
|
|
|
– |
|
|
|
– |
|
|
|
– |
|
|
|
(4 |
) |
|
|
102 |
|
|
|
(8 |
) |
|
|
– |
|
|
|
(8 |
) |
| |
|
|
– |
|
|
|
– |
|
|
|
– |
|
|
|
– |
|
|
|
– |
|
|
|
– |
|
|
|
– |
|
|
|
– |
|
|
|
(47 |
) |
|
|
(47 |
) |
|
|
(26 |
) |
|
|
(73 |
) |
| |
|
|
(388 |
) |
|
|
(20,935 |
) |
|
|
(21,323 |
) |
|
|
4,509 |
|
|
|
389 |
|
|
|
(122 |
) |
|
|
267 |
|
|
|
1,582 |
|
|
|
83,079 |
|
|
|
111,568 |
|
|
|
1,017 |
|
|
|
112,585 |
|
|
|
|
|
|
| BP Annual Report and Form 20-F 2013 |
|
|
187 |
|
32. Capital and reserves – continued
Share capital
The balance on the share capital account represents the aggregate nominal value of all ordinary and preference shares in issue, including treasury shares.
Share premium account
The balance on the share
premium account represents the amounts received in excess of the nominal value of the ordinary and preference shares.
Capital redemption
reserve
The balance on the capital redemption reserve represents the aggregate nominal value of all the ordinary shares repurchased and cancelled.
Merger reserve
The balance on the merger reserve
represents the fair value of the consideration given in excess of the nominal value of the ordinary shares issued in an acquisition made by the issue of shares.
Own shares
Own shares represent BP shares held in Employee Share Ownership Plans (ESOPs) to meet the future requirements of the
employee share-based payment plans. The ESOPs have waived their rights to dividends on shares held for future awards and are funded by the group. Until such time as the company’s own shares held by the ESOPs vest unconditionally to employees,
the amount paid for those shares is shown as a reduction in shareholders’ equity. Assets and liabilities of the ESOPs are recognized as assets and liabilities of the group.
At 31 December 2013, the ESOPs held 32,748,354 shares (2012 22,428,179 shares and 2011 27,784,503 shares) for potential future awards, which had a market value of
$253 million (2012 $154 million and 2011 $197 million). At 31 December 2013, a further 12,856,914 ordinary share equivalents (2012 18,673,926 ordinary share equivalents) were held by the group in the form of ADSs to meet the requirements of
employee share-based payment plans in the US.
Treasury shares
Treasury shares represent BP shares repurchased and available for re-issue.
Foreign currency translation reserve
The foreign currency translation reserve records exchange differences arising from the
translation of the financial statements of foreign operations. Upon disposal of foreign operations, the related accumulated exchange differences are recycled to the income statement.
Available-for-sale investments
This reserve
records the changes in fair value of available-for-sale investments except for impairment losses, foreign exchange gains or losses, or changes arising from revised estimates of future cash flows. On disposal or impairment of the investments, the
cumulative changes in fair value are recycled to the income statement.
Cash flow hedges
This reserve records the portion of the gain or loss on a hedging instrument in a cash flow hedge that is determined to be an effective hedge. For further information see
Note 1.
Share-based payment reserve
This
reserve represents cumulative amounts charged to profit in respect of employee share-based payment plans where the scheme has not yet been settled by means of an award of shares to an individual.
Profit and loss account
The balance held on this
reserve is the accumulated retained profits of the group.
|
|
|
| 188 |
|
BP Annual Report and Form 20-F 2013 |
32. Capital and reserves – continued
The pre-tax amounts of each component of other comprehensive income, and the related amounts of tax, are shown in the
table below.
|
|
|
|
|
|
|
|
|
|
|
|
|
|
|
| |
|
|
|
|
|
|
|
|
|
$ million |
|
| |
|
|
|
|
|
|
|
|
|
2013 |
|
| |
|
|
|
Pre-tax |
|
|
Tax |
|
|
Net of tax |
|
| Items that may be reclassified subsequently to profit or loss |
|
|
|
|
|
|
|
|
|
|
|
|
|
|
| Currency translation differences (including recycling) |
|
|
|
|
(1,586 |
) |
|
|
(32 |
) |
|
|
(1,618 |
) |
| Available-for-sale investments (including recycling) |
|
|
|
|
(695 |
) |
|
|
10 |
|
|
|
(685 |
) |
| Cash flow hedges (including recycling) |
|
|
|
|
(1,979 |
) |
|
|
194 |
|
|
|
(1,785 |
) |
| Share of items relating to equity-accounted entities, net of tax |
|
|
|
|
(24 |
) |
|
|
– |
|
|
|
(24 |
) |
| Other |
|
|
|
|
– |
|
|
|
(25 |
) |
|
|
(25 |
) |
| Items that will not be reclassified to profit or loss |
|
|
|
|
|
|
|
|
|
|
|
|
|
|
| Remeasurements of the net pension and other post-retirement benefit liability or asset |
|
|
|
|
4,764 |
|
|
|
(1,521 |
) |
|
|
3,243 |
|
| Share of items relating to equity-accounted entities, net of tax |
|
|
|
|
2 |
|
|
|
– |
|
|
|
2 |
|
| Other comprehensive income |
|
|
|
|
482 |
|
|
|
(1,374 |
) |
|
|
(892 |
) |
|
|
|
|
|
|
|
|
|
|
|
|
|
|
|
| |
|
|
|
|
|
|
|
|
|
$ million |
|
| |
|
|
|
|
|
|
|
|
|
2012 |
|
| |
|
|
|
Pre-tax |
|
|
Tax |
|
|
Net of tax |
|
| Items that may be reclassified subsequently to profit or loss |
|
|
|
|
|
|
|
|
|
|
|
|
|
|
| Currency translation differences (including recycling) |
|
|
|
|
470 |
|
|
|
146 |
|
|
|
616 |
|
| Available-for-sale investments (including recycling) |
|
|
|
|
305 |
|
|
|
(9 |
) |
|
|
296 |
|
| Cash flow hedges (including recycling) |
|
|
|
|
1,547 |
|
|
|
(330 |
) |
|
|
1,217 |
|
| Share of items relating to equity-accounted entities, net of tax |
|
|
|
|
(39 |
) |
|
|
– |
|
|
|
(39 |
) |
| Other |
|
|
|
|
– |
|
|
|
23 |
|
|
|
23 |
|
| Items that will not be reclassified to profit or loss |
|
|
|
|
|
|
|
|
|
|
|
|
|
|
| Remeasurements of the net pension and other post-retirement benefit liability or asset |
|
|
|
|
(1,572 |
) |
|
|
440 |
|
|
|
(1,132 |
) |
| Share of items relating to equity-accounted entities, net of tax |
|
|
|
|
(6 |
) |
|
|
– |
|
|
|
(6 |
) |
| Other comprehensive income |
|
|
|
|
705 |
|
|
|
270 |
|
|
|
975 |
|
|
|
|
|
|
|
|
|
|
|
|
|
|
|
|
| |
|
|
|
|
|
|
|
|
|
$ million |
|
| |
|
|
|
|
|
|
|
|
|
2011 |
|
| |
|
|
|
Pre-tax |
|
|
Tax |
|
|
Net of tax |
|
| Items that may be reclassified subsequently to profit or loss |
|
|
|
|
|
|
|
|
|
|
|
|
|
|
| Currency translation differences (including recycling) |
|
|
|
|
(524 |
) |
|
|
(14 |
) |
|
|
(538 |
) |
| Available-for-sale investments (including recycling) |
|
|
|
|
(74 |
) |
|
|
– |
|
|
|
(74 |
) |
| Cash flow hedges (including recycling) |
|
|
|
|
(164 |
) |
|
|
37 |
|
|
|
(127 |
) |
| Share of items relating to equity-accounted entities, net of tax |
|
|
|
|
(39 |
) |
|
|
– |
|
|
|
(39 |
) |
| Items that will not be reclassified to profit or loss |
|
|
|
|
|
|
|
|
|
|
|
|
|
|
| Remeasurements of the net pension and other post-retirement benefit liability or asset |
|
|
|
|
(5,301 |
) |
|
|
1,467 |
|
|
|
(3,834 |
) |
| Other comprehensive income |
|
|
|
|
(6,102 |
) |
|
|
1,490 |
|
|
|
(4,612 |
) |
33. Employee costs and numbers
|
|
|
|
|
|
|
|
|
|
|
|
|
|
|
| |
|
|
|
|
|
|
|
|
|
$ million |
|
| Employee costs |
|
|
|
2013 |
|
|
2012 |
|
|
2011 |
|
| Wages and salariesa b |
|
|
|
|
10,161 |
|
|
|
9,910 |
|
|
|
9,333 |
|
| Social security costs |
|
|
|
|
958 |
|
|
|
908 |
|
|
|
854 |
|
| Share-based paymentsc |
|
|
|
|
719 |
|
|
|
674 |
|
|
|
584 |
|
| Pension and other post-retirement benefit costs |
|
|
|
|
1,816 |
|
|
|
1,956 |
|
|
|
1,730 |
|
| |
|
|
|
|
13,654 |
|
|
|
13,448 |
|
|
|
12,501 |
|
|
|
|
|
|
|
|
|
|
|
|
|
|
|
|
| Number of employees at 31 Decemberd |
|
|
|
2013 |
|
|
2012 |
|
|
2011 |
|
| Upstream |
|
|
|
|
24,700 |
|
|
|
24,200 |
|
|
|
22,400 |
|
| Downstreame |
|
|
|
|
48,000 |
|
|
|
51,800 |
|
|
|
51,500 |
|
| Other businesses and corporatef |
|
|
|
|
11,100 |
|
|
|
10,300 |
|
|
|
10,100 |
|
| Gulf Coast Restoration Organization |
|
|
|
|
100 |
|
|
|
100 |
|
|
|
100 |
|
| |
|
|
|
|
83,900 |
|
|
|
86,400 |
|
|
|
84,100 |
|
| By geographical area |
|
|
|
|
|
|
|
|
|
|
|
|
|
|
| US |
|
|
|
|
19,600 |
|
|
|
23,400 |
|
|
|
22,900 |
|
| Non-USe |
|
|
|
|
64,300 |
|
|
|
63,000 |
|
|
|
61,200 |
|
| |
|
|
|
|
83,900 |
|
|
|
86,400 |
|
|
|
84,100 |
|
|
|
|
|
|
| BP Annual Report and Form 20-F 2013 |
|
|
189 |
|
33. Employee costs and numbers – continued
|
|
|
|
|
|
|
|
|
|
|
|
|
|
|
|
|
|
|
|
|
|
|
|
|
|
|
|
|
|
|
|
|
|
|
|
|
|
|
| |
|
|
|
|
|
|
|
|
|
2013 |
|
|
|
|
|
|
|
|
2012 |
|
|
|
|
|
|
|
|
2011 |
|
| Average number of employeesd |
|
|
|
US |
|
|
Non-US |
|
|
Total |
|
|
US |
|
|
Non-US |
|
|
Total |
|
|
US |
|
|
Non-US |
|
|
Total |
|
| Upstream |
|
|
|
|
9,400 |
|
|
|
15,100 |
|
|
|
24,500 |
|
|
|
9,300 |
|
|
|
14,100 |
|
|
|
23,400 |
|
|
|
8,500 |
|
|
|
13,400 |
|
|
|
21,900 |
|
| Downstream |
|
|
|
|
9,300 |
|
|
|
39,800 |
|
|
|
49,100 |
|
|
|
12,000 |
|
|
|
39,900 |
|
|
|
51,900 |
|
|
|
12,300 |
|
|
|
39,700 |
|
|
|
52,000 |
|
| Other businesses and corporate |
|
|
|
|
1,900 |
|
|
|
9,000 |
|
|
|
10,900 |
|
|
|
1,900 |
|
|
|
8,700 |
|
|
|
10,600 |
|
|
|
1,700 |
|
|
|
6,500 |
|
|
|
8,200 |
|
| Gulf Coast Restoration Organization |
|
|
|
|
100 |
|
|
|
– |
|
|
|
100 |
|
|
|
100 |
|
|
|
– |
|
|
|
100 |
|
|
|
100 |
|
|
|
– |
|
|
|
100 |
|
| |
|
|
|
|
20,700 |
|
|
|
63,900 |
|
|
|
84,600 |
|
|
|
23,300 |
|
|
|
62,700 |
|
|
|
86,000 |
|
|
|
22,600 |
|
|
|
59,600 |
|
|
|
82,200 |
|
| a |
Includes termination payments of $212 million (2012 $77 million and 2011 $126 million). |
| b |
Wages and salaries for 2012 and 2011 have been amended. |
| c |
The group provides certain employees with shares and share options as part of their remuneration packages. The majority of these share-based payment arrangements are equity-settled. |
| d |
Reported to the nearest 100. |
| e |
Includes 14,100 (2012 14,700 and 2011 14,600) service station staff. |
| f |
Includes 4,300 (2012 3,600 and 2011 4,000) agricultural, operational and seasonal workers in Brazil. |
34. Remuneration of directors and senior management
Remuneration of directors
|
|
|
|
|
|
|
|
|
|
|
|
|
|
|
| |
|
|
|
|
|
|
|
|
|
$ million |
|
| |
|
|
|
2013 |
|
|
2012 |
|
|
2011 |
|
| Total for all directors |
|
|
|
|
|
|
|
|
|
|
|
|
|
|
| Emoluments |
|
|
|
|
16 |
|
|
|
12 |
|
|
|
10 |
|
| Gains made on exercise of share options |
|
|
|
|
– |
|
|
|
– |
|
|
|
– |
|
| Amounts awarded under incentive schemes |
|
|
|
|
2 |
|
|
|
3 |
|
|
|
1 |
|
| Total |
|
|
|
|
18 |
|
|
|
15 |
|
|
|
11 |
|
Emoluments
These amounts
comprise fees and benefits paid to the non-executive chairman and the non-executive directors and, for executive directors, salary and benefits earned during the relevant financial year, plus cash bonuses awarded for the year. There was no
compensation for loss of office in 2013 (2012 nil and 2011 nil).
Pension contributions
During 2013 two executive directors participated in a non-contributory pension scheme established for UK employees. Two US executive directors participated in the US BP
Retirement Accumulation Plan during 2013.
Office facilities for former chairmen and deputy chairmen
It is customary for the company to make available to former chairmen and deputy chairmen, who were previously employed executives, the use of office and basic secretarial
facilities following their retirement. The cost involved in doing so is not significant.
Further information
Full details of individual directors’ remuneration are given in the Directors’ remuneration report on page 81.
Remuneration of directors and senior management
|
|
|
|
|
|
|
|
|
|
|
|
|
|
|
| |
|
|
|
|
|
|
|
|
|
$ million |
|
| Total for all senior management |
|
|
|
2013 |
|
|
2012a |
|
|
2011a |
|
| Total for all senior management |
|
|
|
|
|
|
|
|
|
|
|
|
|
|
| Short-term employee benefits |
|
|
|
|
36 |
|
|
|
29 |
|
|
|
34 |
|
| Pensions and other post-retirement benefits |
|
|
|
|
3 |
|
|
|
3 |
|
|
|
3 |
|
| Share-based payments |
|
|
|
|
43 |
|
|
|
37 |
|
|
|
28 |
|
| Total |
|
|
|
|
82 |
|
|
|
69 |
|
|
|
65 |
|
| a |
Prior year comparatives have been amended to include the portion of bonuses that were deferred and will be settled in shares in the future. |
Senior management, in addition to executive and non-executive directors, includes other senior managers who are members of the executive management team.
Short-term employee benefits
In addition to fees and
benefits paid to the non-executive chairman and non-executive directors, these amounts comprise, for executive directors and senior managers, salary and benefits earned during the year, plus cash bonuses awarded for the year. Deferred annual bonus
awards, to be settled in shares, are included in share-based payments. Short-term employee benefits includes compensation for loss of office of $3 million (2012 nil and 2011 $9 million).
Pensions and other post-retirement benefits
The amounts
represent the estimated cost to the group of providing defined benefit pensions and other post-retirement benefits to senior management in respect of the current year of service measured in accordance with IAS 19 ‘Employee Benefits’.
Share-based payments
This is the cost to the group of
senior management’s participation in share-based payment plans, as measured by the fair value of options and shares granted accounted for in accordance with IFRS 2 ‘Share-based Payments’. The main plans in which senior management have
participated are the EDIP, DAB, ACBD, SVP and RSP.
|
|
|
| 190 |
|
BP Annual Report and Form 20-F 2013 |
35. Contingent liabilities
Contingent liabilities related to the Gulf of Mexico oil spill
Details of contingent liabilities related to the Gulf of Mexico oil spill are set out in Note 2.
Contingent liabilities not related to the Gulf of Mexico oil spill
There were contingent liabilities at 31 December 2013 in respect of guarantees and indemnities entered into as part of the ordinary course of the group‘s
business. No material losses are likely to arise from such contingent liabilities. Further information is included in Note 19.
Lawsuits arising out of the Exxon
Valdez oil spill in Prince William Sound, Alaska, in March 1989 were filed against Exxon (now ExxonMobil), Alyeska Pipeline Service Company (Alyeska), which operates the oil terminal at Valdez, and the other oil companies that own Alyeska. Alyeska
initially responded to the spill until the response was taken over by Exxon. BP owns a 46.9% interest (reduced during 2001 from 50% by a sale of 3.1% to Phillips) in Alyeska through a subsidiary of BP America Inc. and briefly indirectly owned a
further 20% interest in Alyeska following BP‘s combination with Atlantic Richfield Company (Atlantic Richfield). Alyeska and its owners have settled all the claims against them under these lawsuits. Exxon has indicated that it may file a claim
for contribution against Alyeska for a portion of the costs and damages that Exxon has incurred. BP will defend any such claims vigorously. It is not possible to estimate any financial effect.
In the normal course of the group‘s business, legal proceedings are pending or may be brought against BP group entities arising out of current and past operations,
including matters related to commercial disputes, product liability, antitrust, commodities trading, premises-liability claims, consumer protection, general environmental claims and allegations of exposures of third parties to toxic substances, such
as lead pigment in paint, asbestos and other chemicals. BP believes that the impact of these legal proceedings on the group‘s results of operations, liquidity or financial position will not be material.
With respect to lead pigment in paint in particular, Atlantic Richfield, a subsidiary of BP, has been named as a co-defendant in numerous lawsuits brought in the US
alleging injury to persons and property. Although it is not possible to predict the outcome of the legal proceedings, Atlantic Richfield believes it has valid defences that render the incurrence of a liability remote; however, the amounts claimed
and the costs of implementing the remedies sought in the various cases could be substantial. The majority of the lawsuits have been abandoned or dismissed against Atlantic Richfield. No lawsuit against Atlantic Richfield has been settled nor has
Atlantic Richfield been subject to a final adverse judgment in any proceeding. Atlantic Richfield intends to defend such actions vigorously.
The group files tax
returns in many jurisdictions throughout the world. Various tax authorities are currently examining the group‘s tax returns. Tax returns contain matters that could be subject to differing interpretations of applicable tax laws and regulations
and the resolution of tax positions through negotiations with relevant tax authorities, or through litigation, can take several years to complete. While it is difficult to predict the ultimate outcome in some cases, the group does not anticipate
that there will be any material impact upon the group‘s results of operations, financial position or liquidity.
The group is subject to numerous national and
local environmental laws and regulations concerning its products, operations and other activities. These laws and regulations may require the group to take future action to remediate the effects on the environment of prior disposal or release of
chemicals or petroleum substances by the group or other parties. Such contingencies may exist for various sites including refineries, chemical plants, oil fields, service stations, terminals and waste disposal sites. In addition, the group may have
obligations relating to prior asset sales or closed facilities. The ultimate requirement for remediation and its cost are inherently difficult to estimate. However, the estimated cost of known environmental obligations has been provided in these
accounts in accordance with the group‘s accounting policies. While the amounts of future costs that are not provided for could be significant and could be material to the group‘s results of operations in the period in which they are
recognized, it is not possible to estimate the amounts involved. BP does not expect these costs to have a material effect on the group‘s financial position or liquidity.
The group also has obligations to decommission oil and natural gas production facilities and related pipelines. Provision is made for the estimated costs of these
activities, however there is uncertainty regarding both the amount and timing of these costs, given the long-term nature of these obligations. BP believes that the impact of any reasonably foreseeable changes to these provisions on the group‘s
results of operations, financial position or liquidity will not be material. If oil and natural gas production facilities and pipelines are sold to third parties and the subsequent owner is unable to meet their decommissioning obligations, judgement
must be used to determine whether BP is then responsible for decommissioning, and if so the extent of that responsibility.
The group generally restricts its purchase
of insurance to situations where this is required for legal or contractual reasons. This is because external insurance is not considered an economic means of financing losses for the group. Losses will therefore be borne as they arise rather than
being spread over time through insurance premiums with attendant transaction costs. The position is reviewed periodically.
36.
Capital commitments
Authorized future capital expenditure for property, plant and equipment by group companies for which contracts had been signed at
31 December 2013 amounted to $13,705 million (2012 $14,894 million). BP’s share of capital commitments of joint ventures amounted to $317 million (2012 $293 million).
|
|
|
|
|
| BP Annual Report and Form 20-F 2013 |
|
|
191 |
|
37. Auditor’s remuneration
|
|
|
|
|
|
|
|
|
|
|
|
|
|
|
| |
|
|
|
|
|
|
|
|
|
$ million |
|
| Fees – EY |
|
|
|
2013 |
|
|
2012 |
|
|
2011 |
|
| The audit of the company annual accountsa |
|
|
|
|
26 |
|
|
|
26 |
|
|
|
26 |
|
| The audit of accounts of any subsidiaries of the company |
|
|
|
|
13 |
|
|
|
13 |
|
|
|
15 |
|
| Total audit |
|
|
|
|
39 |
|
|
|
39 |
|
|
|
41 |
|
| Audit-related assurance servicesb |
|
|
|
|
8 |
|
|
|
7 |
|
|
|
6 |
|
| Total audit and audit-related assurance services |
|
|
|
|
47 |
|
|
|
46 |
|
|
|
47 |
|
| Taxation compliance services |
|
|
|
|
1 |
|
|
|
2 |
|
|
|
1 |
|
| Taxation advisory services |
|
|
|
|
1 |
|
|
|
2 |
|
|
|
1 |
|
| Services relating to corporate finance transactions |
|
|
|
|
2 |
|
|
|
2 |
|
|
|
4 |
|
| Other assurance services |
|
|
|
|
1 |
|
|
|
1 |
|
|
|
1 |
|
| Total non-audit or non-audit-related assurance services |
|
|
|
|
5 |
|
|
|
7 |
|
|
|
7 |
|
| Services relating to BP pension plansc |
|
|
|
|
1 |
|
|
|
1 |
|
|
|
1 |
|
| |
|
|
|
|
53 |
|
|
|
54 |
|
|
|
55 |
|
| a |
Fees in respect of the audit of the accounts of BP p.l.c. including the group’s consolidated financial statements. |
| b |
Includes interim reviews and reporting on internal financial controls and non-statutory audit services. |
| c |
The pension plan services include tax compliance services of $240,000 (2012 $50,000 and 2011 $108,000). |
2013 includes $3 million of additional fees for 2012, and 2012 includes $2 million of additional fees for 2011. Auditors’ remuneration is included in the income
statement within distribution and administration expenses.
The tax services relate to income tax and indirect tax compliance, employee tax services and tax advisory
services.
The audit committee has established pre-approval policies and procedures for the engagement of Ernst & Young to render audit and certain assurance
and tax services. The audit fees payable to Ernst & Young are reviewed by the audit committee in the context of other global companies for cost-effectiveness. Ernst & Young performed further assurance and tax services that were not
prohibited by regulatory or other professional requirements and were pre-approved by the committee. Ernst & Young is engaged for these services when its expertise and experience of BP are important. Most of this work is of an audit nature.
Tax services were awarded either through a full competitive tender process or following an assessment of the expertise of Ernst & Young compared with that of other potential service providers. These services are for a fixed term.
Under SEC regulations, the remuneration of the auditor of $53 million (2012 $54 million and 2011 $55 million) is required to be presented as follows: audit $39 million
(2012 $39 million and 2011 $41 million); other audit-related services $8 million (2012 $7 million and 2011 $6 million); tax $2 million (2012 $4 million and 2011 $2 million); and all other fees $4 million (2012 $4 million and 2011 $6 million).
|
|
|
| 192 |
|
BP Annual Report and Form 20-F 2013 |
38. Subsidiaries, joint arrangements and associates
The more important subsidiaries, joint arrangements and associates of the group at 31 December 2013 and the group percentage of ordinary share capital or joint
arrangement interest (to nearest whole number) are set out below. Those held directly by the parent company are marked with an asterisk (*), the percentage owned being that of the group unless otherwise indicated. The group has interests in a number
of joint arrangements, but none of these is individually material to the group. A complete list of investments in subsidiaries, joint arrangements and associates will be attached to the parent company’s annual return made to the Registrar of
Companies.
|
|
|
|
|
|
|
|
|
|
|
|
|
|
|
| Subsidiaries |
|
|
|
% |
|
|
Country of
incorporation |
|
|
|
|
|
Principal activities |
| International |
|
|
|
|
|
|
|
|
|
|
|
|
|
|
| *BP Corporate Holdings |
|
|
|
|
100 |
|
|
England & Wales |
|
|
|
|
|
Investment holding |
| BP Exploration Operating Company |
|
|
|
|
100 |
|
|
England & Wales |
|
|
|
|
|
Exploration and production |
| *BP Global Investments |
|
|
|
|
100 |
|
|
England & Wales |
|
|
|
|
|
Investment holding |
| *BP International |
|
|
|
|
100 |
|
|
England & Wales |
|
|
|
|
|
Integrated oil operations |
| BP Oil International |
|
|
|
|
100 |
|
|
England & Wales |
|
|
|
|
|
Integrated oil operations |
| *Burmah Castrol |
|
|
|
|
100 |
|
|
Scotland |
|
|
|
|
|
Lubricants |
| Algeria |
|
|
|
|
|
|
|
|
|
|
|
|
|
|
| BP Amoco Exploration (In Amenas) |
|
|
|
|
100 |
|
|
Scotland |
|
|
|
|
|
Exploration and production |
| Angola |
|
|
|
|
|
|
|
|
|
|
|
|
|
|
| BP Exploration (Angola) |
|
|
|
|
100 |
|
|
England & Wales |
|
|
|
|
|
Exploration and production |
| Australia |
|
|
|
|
|
|
|
|
|
|
|
|
|
|
| BP Australia Capital Markets |
|
|
|
|
100 |
|
|
Australia |
|
|
|
|
|
Finance |
| BP Finance Australia |
|
|
|
|
100 |
|
|
Australia |
|
|
|
|
|
Finance |
| Azerbaijan |
|
|
|
|
|
|
|
|
|
|
|
|
|
|
| BP Exploration (Caspian Sea) |
|
|
|
|
100 |
|
|
England & Wales |
|
|
|
|
|
Exploration and production |
| Brazil |
|
|
|
|
|
|
|
|
|
|
|
|
|
|
| BP Energy do Brazil |
|
|
|
|
100 |
|
|
Brazil |
|
|
|
|
|
Exploration and production |
| India |
|
|
|
|
|
|
|
|
|
|
|
|
|
|
| BP Exploration (Alpha) |
|
|
|
|
100 |
|
|
England & Wales |
|
|
|
|
|
Exploration and production |
| New Zealand |
|
|
|
|
|
|
|
|
|
|
|
|
|
|
| BP Oil New Zealand |
|
|
|
|
100 |
|
|
New Zealand |
|
|
|
|
|
Marketing |
| Norway |
|
|
|
|
|
|
|
|
|
|
|
|
|
|
| BP Norge |
|
|
|
|
100 |
|
|
Norway |
|
|
|
|
|
Exploration and production |
| UK |
|
|
|
|
|
|
|
|
|
|
|
|
|
|
| BP Capital Markets |
|
|
|
|
100 |
|
|
England & Wales |
|
|
|
|
|
Finance |
| US |
|
|
|
|
|
|
|
|
|
|
|
|
|
|
| *BP Holdings North America |
|
|
|
|
100 |
|
|
England & Wales |
|
|
|
|
|
Investment holding |
| Atlantic Richfield Company |
|
|
|
|
100 |
|
|
US |
|
|
|
|
|
Exploration and production, refining and marketing pipelines
and petrochemicals |
| BP America |
|
|
|
|
100 |
|
|
US |
|
|
|
|
|
| BP America Production Company |
|
|
|
|
100 |
|
|
US |
|
|
|
|
|
| BP Company North America |
|
|
|
|
100 |
|
|
US |
|
|
|
|
|
| BP Corporation North America |
|
|
|
|
100 |
|
|
US |
|
|
|
|
|
| BP Exploration & Production |
|
|
|
|
100 |
|
|
US |
|
|
|
|
|
| BP Exploration (Alaska) |
|
|
|
|
100 |
|
|
US |
|
|
|
|
|
| BP Products North America |
|
|
|
|
100 |
|
|
US |
|
|
|
|
|
|
| Standard Oil Company |
|
|
|
|
100 |
|
|
US |
|
|
|
|
|
|
| BP Capital Markets America |
|
|
|
|
100 |
|
|
US |
|
|
|
|
|
Finance |
|
|
|
|
|
|
|
|
|
|
|
|
|
|
|
| Associates |
|
|
|
% |
|
|
Country of
incorporation |
|
|
|
|
|
Principal activities |
| Russia |
|
|
|
|
|
|
|
|
|
|
|
|
|
|
| Rosneft |
|
|
|
|
20 |
|
|
Russia |
|
|
|
|
|
Integrated oil operations |
|
|
|
|
|
| BP Annual Report and Form 20-F 2013 |
|
|
193 |
|
39. Condensed consolidating information on certain US subsidiaries
BP p.l.c. fully and unconditionally guarantees the payment obligations of its 100%-owned subsidiary BP Exploration (Alaska) Inc. under the BP Prudhoe Bay
Royalty Trust. The following financial information for BP p.l.c., BP Exploration (Alaska) Inc. and all other subsidiaries on a condensed consolidating basis is intended to provide investors with meaningful and comparable financial information about
BP p.l.c. and its subsidiary issuers of registered securities and is provided pursuant to Rule 3-10 of Regulation S-X in lieu of the separate financial statements of each subsidiary issuer of public debt securities. Investments include the
investments in subsidiaries recorded under the equity method for the purposes of the condensed consolidating financial information. Equity accounted income of subsidiaries is the group’s share of profit related to such investments. The
eliminations and reclassifications column includes the necessary amounts to eliminate the intercompany balances and transactions between BP p.l.c., BP Exploration (Alaska) Inc. and other subsidiaries. The financial information presented in the
following tables for BP Exploration (Alaska) Inc. for all years includes equity income arising from subsidiaries of BP Exploration (Alaska) Inc. some of which operate outside of Alaska and excludes the BP group’s midstream operations in Alaska
that are reported through different legal entities and that are included within the ‘other subsidiaries’ column in these tables. BP p.l.c. also fully and unconditionally guarantees securities issued by BP Capital Markets p.l.c. and BP
Capital Markets America Inc. These companies are 100%- owned finance subsidiaries of BP p.l.c.
Income statement
|
|
|
|
|
|
|
|
|
|
|
|
|
|
|
|
|
|
|
|
|
|
|
| |
|
|
|
|
|
|
|
|
|
|
|
|
|
|
|
$ million |
|
| For the year ended 31 December |
|
|
|
|
|
|
|
|
|
|
|
|
|
|
|
2013 |
|
| |
|
|
|
Issuer |
|
|
Guarantor |
|
|
|
|
|
|
|
|
|
|
| |
|
|
|
BP
Exploration
(Alaska) Inc. |
|
|
BP p.l.c. |
|
|
Other
subsidiaries |
|
|
Eliminations and
reclassifications |
|
|
BP group |
|
| Sales and other operating revenues |
|
|
|
|
5,397 |
|
|
|
– |
|
|
|
379,136 |
|
|
|
(5,397 |
) |
|
|
379,136 |
|
| Earnings from joint ventures – after interest and tax |
|
|
|
|
– |
|
|
|
– |
|
|
|
447 |
|
|
|
– |
|
|
|
447 |
|
| Earnings from associates – after interest and tax |
|
|
|
|
– |
|
|
|
– |
|
|
|
2,742 |
|
|
|
– |
|
|
|
2,742 |
|
| Equity-accounted income of subsidiaries – after interest and tax |
|
|
|
|
– |
|
|
|
24,693 |
|
|
|
– |
|
|
|
(24,693 |
) |
|
|
– |
|
| Interest and other income |
|
|
|
|
7 |
|
|
|
118 |
|
|
|
841 |
|
|
|
(189 |
) |
|
|
777 |
|
| Gains on sale of businesses and fixed assets |
|
|
|
|
– |
|
|
|
– |
|
|
|
13,115 |
|
|
|
– |
|
|
|
13,115 |
|
| Total revenues and other income |
|
|
|
|
5,404 |
|
|
|
24,811 |
|
|
|
396,281 |
|
|
|
(30,279 |
) |
|
|
396,217 |
|
| Purchases |
|
|
|
|
861 |
|
|
|
– |
|
|
|
302,887 |
|
|
|
(5,397 |
) |
|
|
298,351 |
|
| Production and manufacturing expenses |
|
|
|
|
1,473 |
|
|
|
– |
|
|
|
26,054 |
|
|
|
– |
|
|
|
27,527 |
|
| Production and similar taxes |
|
|
|
|
1,010 |
|
|
|
– |
|
|
|
6,037 |
|
|
|
– |
|
|
|
7,047 |
|
| Depreciation, depletion and amortization |
|
|
|
|
616 |
|
|
|
– |
|
|
|
12,894 |
|
|
|
– |
|
|
|
13,510 |
|
| Impairment and losses on sale of businesses and fixed assets |
|
|
|
|
(68 |
) |
|
|
– |
|
|
|
2,029 |
|
|
|
– |
|
|
|
1,961 |
|
| Exploration expense |
|
|
|
|
– |
|
|
|
– |
|
|
|
3,441 |
|
|
|
– |
|
|
|
3,441 |
|
| Distribution and administration expenses |
|
|
|
|
108 |
|
|
|
1,234 |
|
|
|
11,728 |
|
|
|
– |
|
|
|
13,070 |
|
| Fair value gain on embedded derivatives |
|
|
|
|
– |
|
|
|
– |
|
|
|
(459 |
) |
|
|
– |
|
|
|
(459 |
) |
| Profit before interest and taxation |
|
|
|
|
1,404 |
|
|
|
23,577 |
|
|
|
31,670 |
|
|
|
(24,882 |
) |
|
|
31,769 |
|
| Finance costs |
|
|
|
|
42 |
|
|
|
43 |
|
|
|
1,172 |
|
|
|
(189 |
) |
|
|
1,068 |
|
| Net finance (income) expense relating to pensions and other post-retirement benefits |
|
|
|
|
– |
|
|
|
81 |
|
|
|
399 |
|
|
|
– |
|
|
|
480 |
|
| Profit before taxation |
|
|
|
|
1,362 |
|
|
|
23,453 |
|
|
|
30,099 |
|
|
|
(24,693 |
) |
|
|
30,221 |
|
| Taxation |
|
|
|
|
522 |
|
|
|
2 |
|
|
|
5,939 |
|
|
|
– |
|
|
|
6,463 |
|
| Profit for the year |
|
|
|
|
840 |
|
|
|
23,451 |
|
|
|
24,160 |
|
|
|
(24,693 |
) |
|
|
23,758 |
|
| Attributable to |
|
|
|
|
|
|
|
|
|
|
|
|
|
|
|
|
|
|
|
|
|
|
| BP shareholders |
|
|
|
|
840 |
|
|
|
23,451 |
|
|
|
23,853 |
|
|
|
(24,693 |
) |
|
|
23,451 |
|
| Non-controlling interests |
|
|
|
|
– |
|
|
|
– |
|
|
|
307 |
|
|
|
– |
|
|
|
307 |
|
| |
|
|
|
|
840 |
|
|
|
23,451 |
|
|
|
24,160 |
|
|
|
(24,693 |
) |
|
|
23,758 |
|
Statement of comprehensive income
|
|
|
|
|
|
|
|
|
|
|
|
|
|
|
|
|
|
|
|
|
|
|
| |
|
|
|
|
|
|
|
|
|
|
|
|
|
|
|
$ million |
|
| For the year ended 31 December |
|
|
|
|
|
|
|
|
|
|
|
|
|
|
|
2013 |
|
| |
|
|
|
Issuer |
|
|
Guarantor |
|
|
|
|
|
|
|
|
|
|
| |
|
|
|
BP
Exploration
(Alaska) Inc. |
|
|
BP p.l.c. |
|
|
Other
subsidiaries |
|
|
Eliminations and
reclassifications |
|
|
BP group |
|
| Profit for the year |
|
|
|
|
840 |
|
|
|
23,451 |
|
|
|
24,160 |
|
|
|
(24,693 |
) |
|
|
23,758 |
|
| Other comprehensive income |
|
|
|
|
– |
|
|
|
2,819 |
|
|
|
(3,711 |
) |
|
|
– |
|
|
|
(892 |
) |
| Total comprehensive income |
|
|
|
|
840 |
|
|
|
26,270 |
|
|
|
20,449 |
|
|
|
(24,693 |
) |
|
|
22,866 |
|
| Attributable to |
|
|
|
|
|
|
|
|
|
|
|
|
|
|
|
|
|
|
|
|
|
|
| BP shareholders |
|
|
|
|
840 |
|
|
|
26,270 |
|
|
|
20,157 |
|
|
|
(24,693 |
) |
|
|
22,574 |
|
| Non-controlling interests |
|
|
|
|
– |
|
|
|
– |
|
|
|
292 |
|
|
|
– |
|
|
|
292 |
|
| |
|
|
|
|
840 |
|
|
|
26,270 |
|
|
|
20,449 |
|
|
|
(24,693 |
) |
|
|
22,866 |
|
|
|
|
| 194 |
|
BP Annual Report and Form 20-F 2013 |
39. Condensed consolidating information on certain US subsidiaries – continued
Income statement continued
|
|
|
|
|
|
|
|
|
|
|
|
|
|
|
|
|
|
|
|
|
|
|
| |
|
|
|
|
|
|
|
|
|
|
|
|
|
|
|
$ million |
|
| For the year ended 31 December |
|
|
|
|
|
|
|
|
|
|
|
|
|
|
|
2012 |
|
| |
|
|
|
Issuer |
|
|
Guarantor |
|
|
|
|
|
|
|
|
|
|
| |
|
|
|
BP
Exploration
(Alaska) Inc. |
|
|
BP p.l.c. |
|
|
Other
subsidiaries |
|
|
Eliminations and
reclassifications |
|
|
BP group |
|
| Sales and other operating revenues |
|
|
|
|
5,501 |
|
|
|
– |
|
|
|
375,765 |
|
|
|
(5,501 |
) |
|
|
375,765 |
|
| Earnings from joint ventures – after interest and tax |
|
|
|
|
– |
|
|
|
– |
|
|
|
260 |
|
|
|
– |
|
|
|
260 |
|
| Earnings from associates – after interest and tax |
|
|
|
|
– |
|
|
|
– |
|
|
|
3,675 |
|
|
|
– |
|
|
|
3,675 |
|
| Equity-accounted income of subsidiaries – after interest and tax |
|
|
|
|
(59 |
) |
|
|
12,649 |
|
|
|
– |
|
|
|
(12,590 |
) |
|
|
– |
|
| Interest and other income |
|
|
|
|
12 |
|
|
|
187 |
|
|
|
1,764 |
|
|
|
(286 |
) |
|
|
1,677 |
|
| Gains on sale of businesses and fixed assets |
|
|
|
|
3,580 |
|
|
|
– |
|
|
|
6,697 |
|
|
|
(3,580 |
) |
|
|
6,697 |
|
| Total revenues and other income |
|
|
|
|
9,034 |
|
|
|
12,836 |
|
|
|
388,161 |
|
|
|
(21,957 |
) |
|
|
388,074 |
|
| Purchases |
|
|
|
|
777 |
|
|
|
– |
|
|
|
297,498 |
|
|
|
(5,501 |
) |
|
|
292,774 |
|
| Production and manufacturing expenses |
|
|
|
|
1,475 |
|
|
|
– |
|
|
|
32,451 |
|
|
|
– |
|
|
|
33,926 |
|
| Production and similar taxes |
|
|
|
|
1,374 |
|
|
|
– |
|
|
|
6,784 |
|
|
|
– |
|
|
|
8,158 |
|
| Depreciation, depletion and amortization |
|
|
|
|
457 |
|
|
|
– |
|
|
|
12,230 |
|
|
|
– |
|
|
|
12,687 |
|
| Impairment and losses on sale of businesses and fixed assets |
|
|
|
|
957 |
|
|
|
– |
|
|
|
5,318 |
|
|
|
– |
|
|
|
6,275 |
|
| Exploration expense |
|
|
|
|
– |
|
|
|
– |
|
|
|
1,475 |
|
|
|
– |
|
|
|
1,475 |
|
| Distribution and administration expenses |
|
|
|
|
35 |
|
|
|
1,766 |
|
|
|
11,641 |
|
|
|
(85 |
) |
|
|
13,357 |
|
| Fair value gain on embedded derivatives |
|
|
|
|
– |
|
|
|
– |
|
|
|
(347 |
) |
|
|
– |
|
|
|
(347 |
) |
| Profit before interest and taxation |
|
|
|
|
3,959 |
|
|
|
11,070 |
|
|
|
21,111 |
|
|
|
(16,371 |
) |
|
|
19,769 |
|
| Finance costs |
|
|
|
|
48 |
|
|
|
43 |
|
|
|
1,182 |
|
|
|
(201 |
) |
|
|
1,072 |
|
| Net finance expense relating to pensions and other post-retirement benefits |
|
|
|
|
– |
|
|
|
103 |
|
|
|
463 |
|
|
|
– |
|
|
|
566 |
|
| Profit before taxation |
|
|
|
|
3,911 |
|
|
|
10,924 |
|
|
|
19,466 |
|
|
|
(16,170 |
) |
|
|
18,131 |
|
| Taxation |
|
|
|
|
203 |
|
|
|
(93 |
) |
|
|
6,770 |
|
|
|
– |
|
|
|
6,880 |
|
| Profit for the year |
|
|
|
|
3,708 |
|
|
|
11,017 |
|
|
|
12,696 |
|
|
|
(16,170 |
) |
|
|
11,251 |
|
| Attributable to |
|
|
|
|
|
|
|
|
|
|
|
|
|
|
|
|
|
|
|
|
|
|
| BP shareholders |
|
|
|
|
3,708 |
|
|
|
11,017 |
|
|
|
12,462 |
|
|
|
(16,170 |
) |
|
|
11,017 |
|
| Non-controlling interests |
|
|
|
|
– |
|
|
|
– |
|
|
|
234 |
|
|
|
– |
|
|
|
234 |
|
| |
|
|
|
|
3,708 |
|
|
|
11,017 |
|
|
|
12,696 |
|
|
|
(16,170 |
) |
|
|
11,251 |
|
Statement of comprehensive income continued
|
|
|
|
|
|
|
|
|
|
|
|
|
|
|
|
|
|
|
|
|
|
|
| |
|
|
|
|
|
|
|
|
|
|
|
|
|
|
|
$ million |
|
| For the year ended 31 December |
|
|
|
|
|
|
|
|
|
|
|
|
|
|
|
2012 |
|
| |
|
|
|
Issuer |
|
|
Guarantor |
|
|
|
|
|
|
|
|
|
|
| |
|
|
|
BP
Exploration
(Alaska) Inc. |
|
|
BP p.l.c. |
|
|
Other
subsidiaries |
|
|
Eliminations and
reclassifications |
|
|
BP group |
|
| Profit for the year |
|
|
|
|
3,708 |
|
|
|
11,017 |
|
|
|
12,696 |
|
|
|
(16,170 |
) |
|
|
11,251 |
|
| Other comprehensive income |
|
|
|
|
– |
|
|
|
(232 |
) |
|
|
1,207 |
|
|
|
– |
|
|
|
975 |
|
| Total comprehensive income |
|
|
|
|
3,708 |
|
|
|
10,785 |
|
|
|
13,903 |
|
|
|
(16,170 |
) |
|
|
12,226 |
|
| Attributable to |
|
|
|
|
|
|
|
|
|
|
|
|
|
|
|
|
|
|
|
|
|
|
| BP shareholders |
|
|
|
|
3,708 |
|
|
|
10,785 |
|
|
|
13,665 |
|
|
|
(16,170 |
) |
|
|
11,988 |
|
| Non-controlling interests |
|
|
|
|
– |
|
|
|
– |
|
|
|
238 |
|
|
|
– |
|
|
|
238 |
|
| |
|
|
|
|
3,708 |
|
|
|
10,785 |
|
|
|
13,903 |
|
|
|
(16,170 |
) |
|
|
12,226 |
|
|
|
|
|
|
| BP Annual Report and Form 20-F 2013 |
|
|
195 |
|
39. Condensed consolidating information on certain US subsidiaries – continued
Income statement continued
|
|
|
|
|
|
|
|
|
|
|
|
|
|
|
|
|
|
|
|
|
|
|
| |
|
|
|
|
|
|
|
|
|
|
|
|
|
|
|
$ million |
|
| For the year ended 31 December |
|
|
|
|
|
|
|
|
|
|
|
|
|
|
|
2011 |
|
| |
|
|
|
Issuer |
|
|
Guarantor |
|
|
|
|
|
|
|
|
|
|
| |
|
|
|
BP
Exploration
(Alaska) Inc. |
|
|
BP p.l.c. |
|
|
Other
subsidiaries |
|
|
Eliminations and
reclassifications |
|
|
BP group |
|
| Sales and other operating revenues |
|
|
|
|
6,159 |
|
|
|
– |
|
|
|
375,713 |
|
|
|
(6,159 |
) |
|
|
375,713 |
|
| Earnings from joint ventures – after interest and tax |
|
|
|
|
– |
|
|
|
– |
|
|
|
767 |
|
|
|
– |
|
|
|
767 |
|
| Earnings from associates – after interest and tax |
|
|
|
|
– |
|
|
|
– |
|
|
|
4,916 |
|
|
|
– |
|
|
|
4,916 |
|
| Equity-accounted income of subsidiaries – after interest and tax |
|
|
|
|
313 |
|
|
|
26,019 |
|
|
|
– |
|
|
|
(26,332 |
) |
|
|
– |
|
| Interest and other income |
|
|
|
|
10 |
|
|
|
242 |
|
|
|
756 |
|
|
|
(320 |
) |
|
|
688 |
|
| Gains on sale of businesses and fixed assets |
|
|
|
|
– |
|
|
|
1 |
|
|
|
4,131 |
|
|
|
– |
|
|
|
4,132 |
|
| Total revenues and other income |
|
|
|
|
6,482 |
|
|
|
26,262 |
|
|
|
386,283 |
|
|
|
(32,811 |
) |
|
|
386,216 |
|
| Purchases |
|
|
|
|
978 |
|
|
|
– |
|
|
|
290,314 |
|
|
|
(6,159 |
) |
|
|
285,133 |
|
| Production and manufacturing expenses |
|
|
|
|
1,280 |
|
|
|
– |
|
|
|
22,883 |
|
|
|
– |
|
|
|
24,163 |
|
| Production and similar taxes |
|
|
|
|
1,684 |
|
|
|
– |
|
|
|
6,596 |
|
|
|
– |
|
|
|
8,280 |
|
| Depreciation, depletion and amortization |
|
|
|
|
335 |
|
|
|
– |
|
|
|
11,022 |
|
|
|
– |
|
|
|
11,357 |
|
| Impairment and losses on sale of businesses and fixed assets |
|
|
|
|
– |
|
|
|
– |
|
|
|
2,058 |
|
|
|
– |
|
|
|
2,058 |
|
| Exploration expense |
|
|
|
|
4 |
|
|
|
– |
|
|
|
1,516 |
|
|
|
– |
|
|
|
1,520 |
|
| Distribution and administration expenses |
|
|
|
|
27 |
|
|
|
1,048 |
|
|
|
12,992 |
|
|
|
(109 |
) |
|
|
13,958 |
|
| Fair value gain on embedded derivatives |
|
|
|
|
– |
|
|
|
– |
|
|
|
(68 |
) |
|
|
– |
|
|
|
(68 |
) |
| Profit before interest and taxation |
|
|
|
|
2,174 |
|
|
|
25,214 |
|
|
|
38,970 |
|
|
|
(26,543 |
) |
|
|
39,815 |
|
| Finance costs |
|
|
|
|
32 |
|
|
|
47 |
|
|
|
1,319 |
|
|
|
(211 |
) |
|
|
1,187 |
|
| Net finance (income) expense relating to pensions and other post-retirement benefits |
|
|
|
|
– |
|
|
|
(94 |
) |
|
|
494 |
|
|
|
– |
|
|
|
400 |
|
| Profit before taxation |
|
|
|
|
2,142 |
|
|
|
25,261 |
|
|
|
37,157 |
|
|
|
(26,332 |
) |
|
|
38,228 |
|
| Taxation |
|
|
|
|
729 |
|
|
|
49 |
|
|
|
11,841 |
|
|
|
– |
|
|
|
12,619 |
|
| Profit for the year |
|
|
|
|
1,413 |
|
|
|
25,212 |
|
|
|
25,316 |
|
|
|
(26,332 |
) |
|
|
25,609 |
|
| Attributable to |
|
|
|
|
|
|
|
|
|
|
|
|
|
|
|
|
|
|
|
|
|
|
| BP shareholders |
|
|
|
|
1,413 |
|
|
|
25,212 |
|
|
|
24,919 |
|
|
|
(26,332 |
) |
|
|
25,212 |
|
| Non-controlling interests |
|
|
|
|
– |
|
|
|
– |
|
|
|
397 |
|
|
|
– |
|
|
|
397 |
|
| |
|
|
|
|
1,413 |
|
|
|
25,212 |
|
|
|
25,316 |
|
|
|
(26,332 |
) |
|
|
25,609 |
|
Statement of comprehensive income continued
|
|
|
|
|
|
|
|
|
|
|
|
|
|
|
|
|
|
|
|
|
|
|
| |
|
|
|
|
|
|
|
|
|
|
|
|
|
|
|
$ million |
|
| For the year ended 31 December |
|
|
|
|
|
|
|
|
|
|
|
|
|
|
|
2011 |
|
| |
|
|
|
Issuer |
|
|
Guarantor |
|
|
|
|
|
|
|
|
|
|
| |
|
|
|
BP
Exploration
(Alaska) Inc. |
|
|
BP p.l.c. |
|
|
Other
subsidiaries |
|
|
Eliminations and
reclassifications |
|
|
BP group |
|
| Profit for the year |
|
|
|
|
1,413 |
|
|
|
25,212 |
|
|
|
25,316 |
|
|
|
(26,332 |
) |
|
|
25,609 |
|
| Other comprehensive income |
|
|
|
|
– |
|
|
|
(3,674 |
) |
|
|
(938 |
) |
|
|
– |
|
|
|
(4,612 |
) |
| Total comprehensive income |
|
|
|
|
1,413 |
|
|
|
21,538 |
|
|
|
24,378 |
|
|
|
(26,332 |
) |
|
|
20,997 |
|
| Attributable to |
|
|
|
|
|
|
|
|
|
|
|
|
|
|
|
|
|
|
|
|
|
|
| BP shareholders |
|
|
|
|
1,413 |
|
|
|
21,538 |
|
|
|
23,994 |
|
|
|
(26,332 |
) |
|
|
20,613 |
|
| Non-controlling interests |
|
|
|
|
– |
|
|
|
– |
|
|
|
384 |
|
|
|
– |
|
|
|
384 |
|
| |
|
|
|
|
1,413 |
|
|
|
21,538 |
|
|
|
24,378 |
|
|
|
(26,332 |
) |
|
|
20,997 |
|
|
|
|
| 196 |
|
BP Annual Report and Form 20-F 2013 |
39. Condensed consolidating information on certain US subsidiaries – continued
Balance sheet
|
|
|
|
|
|
|
|
|
|
|
|
|
|
|
|
|
|
|
|
|
|
|
| |
|
|
|
|
|
|
|
|
|
|
|
|
|
|
|
$ million |
|
| At 31 December |
|
|
|
|
|
|
|
|
|
|
|
|
|
|
|
2013 |
|
| |
|
|
|
Issuer |
|
|
Guarantor |
|
|
|
|
|
|
|
|
|
|
| |
|
|
|
BP
Exploration
(Alaska) Inc. |
|
|
BP p.l.c. |
|
|
Other
subsidiaries |
|
|
Eliminations and
reclassifications |
|
|
BP group |
|
| Non-current assets |
|
|
|
|
|
|
|
|
|
|
|
|
|
|
|
|
|
|
|
|
|
|
| Property, plant and equipment |
|
|
|
|
8,546 |
|
|
|
– |
|
|
|
125,144 |
|
|
|
– |
|
|
|
133,690 |
|
| Goodwill |
|
|
|
|
– |
|
|
|
– |
|
|
|
12,181 |
|
|
|
– |
|
|
|
12,181 |
|
| Intangible assets |
|
|
|
|
417 |
|
|
|
– |
|
|
|
21,622 |
|
|
|
– |
|
|
|
22,039 |
|
| Investments in joint ventures |
|
|
|
|
– |
|
|
|
– |
|
|
|
9,199 |
|
|
|
– |
|
|
|
9,199 |
|
| Investments in associates |
|
|
|
|
– |
|
|
|
2 |
|
|
|
16,634 |
|
|
|
– |
|
|
|
16,636 |
|
| Other investments |
|
|
|
|
– |
|
|
|
– |
|
|
|
1,565 |
|
|
|
– |
|
|
|
1,565 |
|
| Subsidiaries – equity-accounted basis |
|
|
|
|
– |
|
|
|
142,143 |
|
|
|
– |
|
|
|
(142,143 |
) |
|
|
– |
|
| Fixed assets |
|
|
|
|
8,963 |
|
|
|
142,145 |
|
|
|
186,345 |
|
|
|
(142,143 |
) |
|
|
195,310 |
|
| Loans |
|
|
|
|
– |
|
|
|
– |
|
|
|
5,356 |
|
|
|
(4,593 |
) |
|
|
763 |
|
| Trade and other receivables |
|
|
|
|
– |
|
|
|
– |
|
|
|
5,985 |
|
|
|
– |
|
|
|
5,985 |
|
| Derivative financial instruments |
|
|
|
|
– |
|
|
|
– |
|
|
|
3,509 |
|
|
|
– |
|
|
|
3,509 |
|
| Prepayments |
|
|
|
|
22 |
|
|
|
– |
|
|
|
900 |
|
|
|
– |
|
|
|
922 |
|
| Deferred tax assets |
|
|
|
|
– |
|
|
|
– |
|
|
|
985 |
|
|
|
– |
|
|
|
985 |
|
| Defined benefit pension plan surpluses |
|
|
|
|
– |
|
|
|
1,020 |
|
|
|
356 |
|
|
|
– |
|
|
|
1,376 |
|
| |
|
|
|
|
8,985 |
|
|
|
143,165 |
|
|
|
203,436 |
|
|
|
(146,736 |
) |
|
|
208,850 |
|
| Current assets |
|
|
|
|
|
|
|
|
|
|
|
|
|
|
|
|
|
|
|
|
|
|
| Loans |
|
|
|
|
– |
|
|
|
– |
|
|
|
216 |
|
|
|
– |
|
|
|
216 |
|
| Inventories |
|
|
|
|
152 |
|
|
|
– |
|
|
|
29,079 |
|
|
|
– |
|
|
|
29,231 |
|
| Trade and other receivables |
|
|
|
|
9,593 |
|
|
|
21,550 |
|
|
|
42,363 |
|
|
|
(33,675 |
) |
|
|
39,831 |
|
| Derivative financial instruments |
|
|
|
|
– |
|
|
|
– |
|
|
|
2,675 |
|
|
|
– |
|
|
|
2,675 |
|
| Prepayments |
|
|
|
|
18 |
|
|
|
– |
|
|
|
1,370 |
|
|
|
– |
|
|
|
1,388 |
|
| Current tax receivable |
|
|
|
|
– |
|
|
|
– |
|
|
|
512 |
|
|
|
– |
|
|
|
512 |
|
| Other investments |
|
|
|
|
– |
|
|
|
– |
|
|
|
467 |
|
|
|
– |
|
|
|
467 |
|
| Cash and cash equivalents |
|
|
|
|
– |
|
|
|
6 |
|
|
|
22,514 |
|
|
|
– |
|
|
|
22,520 |
|
| |
|
|
|
|
9,763 |
|
|
|
21,556 |
|
|
|
99,196 |
|
|
|
(33,675 |
) |
|
|
96,840 |
|
| Assets classified as held for sale |
|
|
|
|
– |
|
|
|
– |
|
|
|
– |
|
|
|
– |
|
|
|
– |
|
| |
|
|
|
|
9,763 |
|
|
|
21,556 |
|
|
|
99,196 |
|
|
|
(33,675 |
) |
|
|
96,840 |
|
| Total assets |
|
|
|
|
18,748 |
|
|
|
164,721 |
|
|
|
302,632 |
|
|
|
(180,411 |
) |
|
|
305,690 |
|
| Current liabilities |
|
|
|
|
|
|
|
|
|
|
|
|
|
|
|
|
|
|
|
|
|
|
| Trade and other payables |
|
|
|
|
889 |
|
|
|
2,727 |
|
|
|
77,218 |
|
|
|
(33,675 |
) |
|
|
47,159 |
|
| Derivative financial instruments |
|
|
|
|
– |
|
|
|
– |
|
|
|
2,322 |
|
|
|
– |
|
|
|
2,322 |
|
| Accruals |
|
|
|
|
171 |
|
|
|
1,540 |
|
|
|
7,249 |
|
|
|
– |
|
|
|
8,960 |
|
| Finance debt |
|
|
|
|
– |
|
|
|
– |
|
|
|
7,381 |
|
|
|
– |
|
|
|
7,381 |
|
| Current tax payable |
|
|
|
|
166 |
|
|
|
– |
|
|
|
1,779 |
|
|
|
– |
|
|
|
1,945 |
|
| Provisions |
|
|
|
|
1 |
|
|
|
– |
|
|
|
5,044 |
|
|
|
– |
|
|
|
5,045 |
|
| |
|
|
|
|
1,227 |
|
|
|
4,267 |
|
|
|
100,993 |
|
|
|
(33,675 |
) |
|
|
72,812 |
|
| Liabilities directly associated with assets classified as held for sale |
|
|
|
|
– |
|
|
|
– |
|
|
|
– |
|
|
|
– |
|
|
|
– |
|
| |
|
|
|
|
1,227 |
|
|
|
4,267 |
|
|
|
100,993 |
|
|
|
(33,675 |
) |
|
|
72,812 |
|
| Non-current liabilities |
|
|
|
|
|
|
|
|
|
|
|
|
|
|
|
|
|
|
|
|
|
|
| Other payables |
|
|
|
|
9 |
|
|
|
4,584 |
|
|
|
4,756 |
|
|
|
(4,593 |
) |
|
|
4,756 |
|
| Derivative financial instruments |
|
|
|
|
– |
|
|
|
– |
|
|
|
2,225 |
|
|
|
– |
|
|
|
2,225 |
|
| Accruals |
|
|
|
|
– |
|
|
|
58 |
|
|
|
489 |
|
|
|
– |
|
|
|
547 |
|
| Finance debt |
|
|
|
|
– |
|
|
|
– |
|
|
|
40,811 |
|
|
|
– |
|
|
|
40,811 |
|
| Deferred tax liabilities |
|
|
|
|
1,659 |
|
|
|
– |
|
|
|
15,780 |
|
|
|
– |
|
|
|
17,439 |
|
| Provisions |
|
|
|
|
1,942 |
|
|
|
– |
|
|
|
24,973 |
|
|
|
– |
|
|
|
26,915 |
|
| Defined benefit pension plan and other post-retirement benefit plan deficits |
|
|
|
|
– |
|
|
|
– |
|
|
|
9,778 |
|
|
|
– |
|
|
|
9,778 |
|
| |
|
|
|
|
3,610 |
|
|
|
4,642 |
|
|
|
98,812 |
|
|
|
(4,593 |
) |
|
|
102,471 |
|
| Total liabilities |
|
|
|
|
4,837 |
|
|
|
8,909 |
|
|
|
199,805 |
|
|
|
(38,268 |
) |
|
|
175,283 |
|
| Net assets |
|
|
|
|
13,911 |
|
|
|
155,812 |
|
|
|
102,827 |
|
|
|
(142,143 |
) |
|
|
130,407 |
|
| Equity |
|
|
|
|
|
|
|
|
|
|
|
|
|
|
|
|
|
|
|
|
|
|
| BP shareholders’ equity |
|
|
|
|
13,911 |
|
|
|
155,812 |
|
|
|
101,722 |
|
|
|
(142,143 |
) |
|
|
129,302 |
|
| Non-controlling interests |
|
|
|
|
– |
|
|
|
– |
|
|
|
1,105 |
|
|
|
– |
|
|
|
1,105 |
|
| |
|
|
|
|
13,911 |
|
|
|
155,812 |
|
|
|
102,827 |
|
|
|
(142,143 |
) |
|
|
130,407 |
|
|
|
|
|
|
| BP Annual Report and Form 20-F 2013 |
|
|
197 |
|
39. Condensed consolidating information on certain US subsidiaries – continued
Balance sheet continued
|
|
|
|
|
|
|
|
|
|
|
|
|
|
|
|
|
|
|
|
|
|
|
| |
|
|
|
|
|
|
|
|
|
|
|
|
|
|
|
$ million |
|
| At 31 December |
|
|
|
|
|
|
|
|
|
|
|
|
|
|
|
2012 |
|
| |
|
|
|
Issuer |
|
|
Guarantor |
|
|
|
|
|
|
|
|
|
|
| |
|
|
|
BP
Exploration
(Alaska) Inc. |
|
|
BP p.l.c. |
|
|
Other
subsidiaries |
|
|
Eliminations and
reclassifications |
|
|
BP group |
|
| Non-current assets |
|
|
|
|
|
|
|
|
|
|
|
|
|
|
|
|
|
|
|
|
|
|
| Property, plant and equipment |
|
|
|
|
8,343 |
|
|
|
– |
|
|
|
116,988 |
|
|
|
– |
|
|
|
125,331 |
|
| Goodwill |
|
|
|
|
– |
|
|
|
– |
|
|
|
12,190 |
|
|
|
– |
|
|
|
12,190 |
|
| Intangible assets |
|
|
|
|
379 |
|
|
|
– |
|
|
|
24,253 |
|
|
|
– |
|
|
|
24,632 |
|
| Investments in joint ventures |
|
|
|
|
– |
|
|
|
– |
|
|
|
8,614 |
|
|
|
– |
|
|
|
8,614 |
|
| Investments in associates |
|
|
|
|
– |
|
|
|
2 |
|
|
|
2,996 |
|
|
|
– |
|
|
|
2,998 |
|
| Other investments |
|
|
|
|
– |
|
|
|
– |
|
|
|
2,704 |
|
|
|
– |
|
|
|
2,704 |
|
| Subsidiaries – equity-accounted basis |
|
|
|
|
– |
|
|
|
136,553 |
|
|
|
– |
|
|
|
(136,553 |
) |
|
|
– |
|
| Fixed assets |
|
|
|
|
8,722 |
|
|
|
136,555 |
|
|
|
167,745 |
|
|
|
(136,553 |
) |
|
|
176,469 |
|
| Loans |
|
|
|
|
– |
|
|
|
– |
|
|
|
4,924 |
|
|
|
(4,282 |
) |
|
|
642 |
|
| Trade and other receivables |
|
|
|
|
– |
|
|
|
– |
|
|
|
5,961 |
|
|
|
– |
|
|
|
5,961 |
|
| Derivative financial instruments |
|
|
|
|
– |
|
|
|
– |
|
|
|
4,294 |
|
|
|
– |
|
|
|
4,294 |
|
| Prepayments |
|
|
|
|
34 |
|
|
|
– |
|
|
|
796 |
|
|
|
– |
|
|
|
830 |
|
| Deferred tax assets |
|
|
|
|
– |
|
|
|
– |
|
|
|
874 |
|
|
|
– |
|
|
|
874 |
|
| Defined benefit pension plan surpluses |
|
|
|
|
– |
|
|
|
– |
|
|
|
12 |
|
|
|
– |
|
|
|
12 |
|
| |
|
|
|
|
8,756 |
|
|
|
136,555 |
|
|
|
184,606 |
|
|
|
(140,835 |
) |
|
|
189,082 |
|
| Current assets |
|
|
|
|
|
|
|
|
|
|
|
|
|
|
|
|
|
|
|
|
|
|
| Loans |
|
|
|
|
– |
|
|
|
– |
|
|
|
247 |
|
|
|
– |
|
|
|
247 |
|
| Inventories |
|
|
|
|
174 |
|
|
|
– |
|
|
|
28,029 |
|
|
|
– |
|
|
|
28,203 |
|
| Trade and other receivables |
|
|
|
|
11,835 |
|
|
|
17,496 |
|
|
|
43,008 |
|
|
|
(34,728 |
) |
|
|
37,611 |
|
| Derivative financial instruments |
|
|
|
|
– |
|
|
|
– |
|
|
|
4,507 |
|
|
|
– |
|
|
|
4,507 |
|
| Prepayments |
|
|
|
|
15 |
|
|
|
– |
|
|
|
1,076 |
|
|
|
– |
|
|
|
1,091 |
|
| Current tax receivable |
|
|
|
|
– |
|
|
|
– |
|
|
|
456 |
|
|
|
– |
|
|
|
456 |
|
| Other investments |
|
|
|
|
– |
|
|
|
– |
|
|
|
319 |
|
|
|
– |
|
|
|
319 |
|
| Cash and cash equivalents |
|
|
|
|
– |
|
|
|
9 |
|
|
|
19,626 |
|
|
|
– |
|
|
|
19,635 |
|
| |
|
|
|
|
12,024 |
|
|
|
17,505 |
|
|
|
97,268 |
|
|
|
(34,728 |
) |
|
|
92,069 |
|
| Assets classified as held for sale |
|
|
|
|
– |
|
|
|
– |
|
|
|
19,315 |
|
|
|
– |
|
|
|
19,315 |
|
| |
|
|
|
|
12,024 |
|
|
|
17,505 |
|
|
|
116,583 |
|
|
|
(34,728 |
) |
|
|
111,384 |
|
| Total assets |
|
|
|
|
20,780 |
|
|
|
154,060 |
|
|
|
301,189 |
|
|
|
(175,563 |
) |
|
|
300,466 |
|
| Current liabilities |
|
|
|
|
|
|
|
|
|
|
|
|
|
|
|
|
|
|
|
|
|
|
| Trade and other payables |
|
|
|
|
3,914 |
|
|
|
2,577 |
|
|
|
74,910 |
|
|
|
(34,728 |
) |
|
|
46,673 |
|
| Derivative financial instruments |
|
|
|
|
– |
|
|
|
– |
|
|
|
2,658 |
|
|
|
– |
|
|
|
2,658 |
|
| Accruals |
|
|
|
|
140 |
|
|
|
27 |
|
|
|
6,708 |
|
|
|
– |
|
|
|
6,875 |
|
| Finance debt |
|
|
|
|
– |
|
|
|
– |
|
|
|
10,033 |
|
|
|
– |
|
|
|
10,033 |
|
| Current tax payable |
|
|
|
|
145 |
|
|
|
– |
|
|
|
2,358 |
|
|
|
– |
|
|
|
2,503 |
|
| Provisions |
|
|
|
|
1 |
|
|
|
– |
|
|
|
7,586 |
|
|
|
– |
|
|
|
7,587 |
|
| |
|
|
|
|
4,200 |
|
|
|
2,604 |
|
|
|
104,253 |
|
|
|
(34,728 |
) |
|
|
76,329 |
|
| Liabilities directly associated with assets classified as held for sale |
|
|
|
|
– |
|
|
|
– |
|
|
|
846 |
|
|
|
– |
|
|
|
846 |
|
| |
|
|
|
|
4,200 |
|
|
|
2,604 |
|
|
|
105,099 |
|
|
|
(34,728 |
) |
|
|
77,175 |
|
| Non-current liabilities |
|
|
|
|
|
|
|
|
|
|
|
|
|
|
|
|
|
|
|
|
|
|
| Other payables |
|
|
|
|
8 |
|
|
|
4,449 |
|
|
|
2,117 |
|
|
|
(4,282 |
) |
|
|
2,292 |
|
| Derivative financial instruments |
|
|
|
|
– |
|
|
|
– |
|
|
|
2,723 |
|
|
|
– |
|
|
|
2,723 |
|
| Accruals |
|
|
|
|
– |
|
|
|
38 |
|
|
|
453 |
|
|
|
– |
|
|
|
491 |
|
| Finance debt |
|
|
|
|
– |
|
|
|
– |
|
|
|
38,767 |
|
|
|
– |
|
|
|
38,767 |
|
| Deferred tax liabilities |
|
|
|
|
1,654 |
|
|
|
– |
|
|
|
13,589 |
|
|
|
– |
|
|
|
15,243 |
|
| Provisions |
|
|
|
|
1,887 |
|
|
|
– |
|
|
|
28,509 |
|
|
|
– |
|
|
|
30,396 |
|
| Defined benefit pension plan and other post-retirement benefit plan deficits |
|
|
|
|
– |
|
|
|
1,913 |
|
|
|
11,714 |
|
|
|
– |
|
|
|
13,627 |
|
| |
|
|
|
|
3,549 |
|
|
|
6,400 |
|
|
|
97,872 |
|
|
|
(4,282 |
) |
|
|
103,539 |
|
| Total liabilities |
|
|
|
|
7,749 |
|
|
|
9,004 |
|
|
|
202,971 |
|
|
|
(39,010 |
) |
|
|
180,714 |
|
| Net assets |
|
|
|
|
13,031 |
|
|
|
145,056 |
|
|
|
98,218 |
|
|
|
(136,553 |
) |
|
|
119,752 |
|
| Equity |
|
|
|
|
|
|
|
|
|
|
|
|
|
|
|
|
|
|
|
|
|
|
| BP shareholders’ equity |
|
|
|
|
13,031 |
|
|
|
145,056 |
|
|
|
97,012 |
|
|
|
(136,553 |
) |
|
|
118,546 |
|
| Non-controlling interests |
|
|
|
|
– |
|
|
|
– |
|
|
|
1,206 |
|
|
|
– |
|
|
|
1,206 |
|
| |
|
|
|
|
13,031 |
|
|
|
145,056 |
|
|
|
98,218 |
|
|
|
(136,553 |
) |
|
|
119,752 |
|
|
|
|
| 198 |
|
BP Annual Report and Form 20-F 2013 |
39. Condensed consolidating information on certain US subsidiaries – continued
Cash flow statement
|
|
|
|
|
|
|
|
|
|
|
|
|
|
|
|
|
|
|
|
|
|
|
| |
|
|
|
|
|
|
|
|
|
|
|
|
|
|
|
$ million |
|
| For the year ended 31 December |
|
|
|
|
|
|
|
|
|
|
|
|
|
|
|
2013 |
|
| |
|
|
|
Issuer |
|
|
Guarantor |
|
|
|
|
|
|
|
|
|
|
| |
|
|
|
BP
Exploration
(Alaska) Inc. |
|
|
BP p.l.c. |
|
|
Other
subsidiaries |
|
|
Eliminations and
reclassifications |
|
|
BP group |
|
| Net cash provided by operating activities |
|
|
|
|
746 |
|
|
|
11,488 |
|
|
|
25,094 |
|
|
|
(16,228 |
) |
|
|
21,100 |
|
| Net cash used in investing activities |
|
|
|
|
(746 |
) |
|
|
(690 |
) |
|
|
(6,419 |
) |
|
|
– |
|
|
|
(7,855 |
) |
| Net cash used in financing activities |
|
|
|
|
– |
|
|
|
(10,801 |
) |
|
|
(15,827 |
) |
|
|
16,228 |
|
|
|
(10,400 |
) |
| Currency translation differences relating to cash and cash equivalents |
|
|
|
|
– |
|
|
|
– |
|
|
|
40 |
|
|
|
– |
|
|
|
40 |
|
| Increase (decrease) in cash and cash equivalents |
|
|
|
|
– |
|
|
|
(3 |
) |
|
|
2,888 |
|
|
|
– |
|
|
|
2,885 |
|
| Cash and cash equivalents at beginning of year |
|
|
|
|
– |
|
|
|
9 |
|
|
|
19,626 |
|
|
|
– |
|
|
|
19,635 |
|
| Cash and cash equivalents at end of year |
|
|
|
|
– |
|
|
|
6 |
|
|
|
22,514 |
|
|
|
– |
|
|
|
22,520 |
|
|
|
|
|
|
|
|
|
|
|
|
|
|
|
|
|
|
|
|
|
|
|
|
| |
|
|
|
|
|
|
|
|
|
|
|
|
|
|
|
$ million |
|
| For the year ended 31 December |
|
|
|
|
|
|
|
|
|
|
|
|
|
|
|
2012 |
|
| |
|
|
|
Issuer |
|
|
Guarantor |
|
|
|
|
|
|
|
|
|
|
| |
|
|
|
BP
Exploration
(Alaska) Inc. |
|
|
BP p.l.c. |
|
|
Other
subsidiaries |
|
|
Eliminations and
reclassifications |
|
|
BP group |
|
| Net cash provided by operating activities |
|
|
|
|
681 |
|
|
|
12,381 |
|
|
|
20,932 |
|
|
|
(13,515 |
) |
|
|
20,479 |
|
| Net cash used in investing activities |
|
|
|
|
(680 |
) |
|
|
(7,060 |
) |
|
|
(5,335 |
) |
|
|
– |
|
|
|
(13,075 |
) |
| Net cash used in financing activities |
|
|
|
|
– |
|
|
|
(5,312 |
) |
|
|
(10,213 |
) |
|
|
13,515 |
|
|
|
(2,010 |
) |
| Currency translation differences relating to cash and cash equivalents |
|
|
|
|
– |
|
|
|
– |
|
|
|
64 |
|
|
|
– |
|
|
|
64 |
|
| Increase in cash and cash equivalents |
|
|
|
|
1 |
|
|
|
9 |
|
|
|
5,448 |
|
|
|
– |
|
|
|
5,458 |
|
| Cash and cash equivalents at beginning of year |
|
|
|
|
(1 |
) |
|
|
– |
|
|
|
14,178 |
|
|
|
– |
|
|
|
14,177 |
|
| Cash and cash equivalents at end of year |
|
|
|
|
– |
|
|
|
9 |
|
|
|
19,626 |
|
|
|
– |
|
|
|
19,635 |
|
|
|
|
|
|
|
|
|
|
|
|
|
|
|
|
|
|
|
|
|
|
|
|
| |
|
|
|
|
|
|
|
|
|
|
|
|
|
|
|
$ million |
|
| For the year ended 31 December |
|
|
|
|
|
|
|
|
|
|
|
|
|
|
|
2011 |
|
| |
|
|
|
Issuer |
|
|
Guarantor |
|
|
|
|
|
|
|
|
|
|
| |
|
|
|
BP
Exploration
(Alaska) Inc. |
|
|
BP p.l.c. |
|
|
Other
subsidiaries |
|
|
Eliminations and
reclassifications |
|
|
BP group |
|
| Net cash provided by operating activities |
|
|
|
|
661 |
|
|
|
8,321 |
|
|
|
25,178 |
|
|
|
(11,942 |
) |
|
|
22,218 |
|
| Net cash used in investing activities |
|
|
|
|
(661 |
) |
|
|
(3,710 |
) |
|
|
(22,382 |
) |
|
|
– |
|
|
|
(26,753 |
) |
| Net cash (used in) provided by financing activities |
|
|
|
|
– |
|
|
|
(4,615 |
) |
|
|
(6,850 |
) |
|
|
11,942 |
|
|
|
477 |
|
| Currency translation differences relating to cash and cash equivalents |
|
|
|
|
– |
|
|
|
– |
|
|
|
(493 |
) |
|
|
– |
|
|
|
(493 |
) |
| Decrease in cash and cash equivalents |
|
|
|
|
– |
|
|
|
(4 |
) |
|
|
(4,547 |
) |
|
|
– |
|
|
|
(4,551 |
) |
| Cash and cash equivalents at beginning of year |
|
|
|
|
(1 |
) |
|
|
4 |
|
|
|
18,725 |
|
|
|
– |
|
|
|
18,728 |
|
| Cash and cash equivalents at end of year |
|
|
|
|
(1 |
) |
|
|
– |
|
|
|
14,178 |
|
|
|
– |
|
|
|
14,177 |
|
|
|
|
|
|
| BP Annual Report and Form 20-F 2013 |
|
|
199 |
|
Supplementary information on oil and
natural gas (unaudited)
2013 reserves and production information for equity-accounted entities includes BP’s share of TNK-BP from 1 January to
20 March, and Rosneft for the period 21 March to 31 December. For the period 22 October 2012 to 31 December 2012, and throughout all of 2013, financial information for equity-accounted entities does not include any information for
TNK-BP, as equity accounting ceased on 22 October 2012. Comparative information for 2012 and 2011 has been restated to reflect the adoption of IFRS 11 ‘Joint Arrangements’. For further information see Financial statements –
Note 1.
The regional analysis presented below is on a continent basis, with separate disclosure for countries that contain 15% or more of the total proved
reserves (for subsidiaries plus equity-accounted entities), in accordance with SEC and FASB requirements.
Oil and gas reserves –
certain definitions
Unless the context indicates otherwise, the following terms have the meanings shown below:
Proved oil and gas reserves
Proved oil and gas reserves
are those quantities of oil and gas, which, by analysis of geoscience and engineering data, can be estimated with reasonable certainty to be economically producible – from a given date forward, from known reservoirs, and under existing economic
conditions, operating methods, and government regulations – prior to the time at which contracts providing the right to operate expire, unless evidence indicates that renewal is reasonably certain, regardless of whether deterministic or
probabilistic methods are used for the estimation. The project to extract the hydrocarbons must have commenced or the operator must be reasonably certain that it will commence the project within a reasonable time.
| |
(i) |
The area of the reservoir considered as proved includes: |
| |
(A) |
The area identified by drilling and limited by fluid contacts, if any; and |
| |
(B) |
Adjacent undrilled portions of the reservoir that can, with reasonable certainty, be judged to be continuous with it and to contain economically producible oil or gas on the basis of available geoscience and engineering
data. |
| |
(ii) |
In the absence of data on fluid contacts, proved quantities in a reservoir are limited by the lowest known hydrocarbons (LKH) as seen in a well penetration unless geoscience, engineering, or performance data and
reliable technology establishes a lower contact with reasonable certainty. |
| |
(iii) |
Where direct observation from well penetrations has defined a highest known oil (HKO) elevation and the potential exists for an associated gas cap, proved oil reserves may be assigned in the structurally higher portions
of the reservoir only if geoscience, engineering, or performance data and reliable technology establish the higher contact with reasonable certainty. |
| |
(iv) |
Reserves which can be produced economically through application of improved recovery techniques (including, but not limited to, fluid injection) are included in the proved classification when: |
| |
(A) |
Successful testing by a pilot project in an area of the reservoir with properties no more favourable than in the reservoir as a whole, the operation of an installed programme in the reservoir or an analogous reservoir,
or other evidence using reliable technology establishes the reasonable certainty of the engineering analysis on which the project or programme was based; and |
| |
(B) |
The project has been approved for development by all necessary parties and entities, including governmental entities. |
| |
(v) |
Existing economic conditions include prices and costs at which economic producibility from a reservoir is to be determined. The price shall be the average price during the 12-month period prior to the ending date of the
period covered by the report, determined as an unweighted arithmetic average of the first-day-of-the-month price for each month within such period, unless prices are defined by contractual arrangements, excluding escalations based upon future
conditions. |
Undeveloped oil and gas reserves
Undeveloped oil and gas reserves are reserves of any category that are expected to be recovered from new wells on undrilled acreage, or from existing wells where a
relatively major expenditure is required for recompletion.
| |
(i) |
Reserves on undrilled acreage shall be limited to those directly offsetting development spacing areas that are reasonably certain of production when drilled, unless evidence using reliable technology exists that
establishes reasonable certainty of economic producibility at greater distances. |
| |
(ii) |
Undrilled locations can be classified as having undeveloped reserves only if a development plan has been adopted indicating that they are scheduled to be drilled within five years, unless the specific circumstances,
justify a longer time. |
| |
(iii) |
Under no circumstances shall estimates for undeveloped reserves be attributable to any acreage for which an application of fluid injection or other improved recovery technique is contemplated, unless such techniques
have been proved effective by actual projects in the same reservoir or an analogous reservoir, or by other evidence using reliable technology establishing reasonable certainty. |
Developed oil and gas reserves
Developed oil and gas
reserves are reserves of any category that can be expected to be recovered:
| |
(i) |
Through existing wells with existing equipment and operating methods or in which the cost of the required equipment is relatively minor compared to the cost of a new well; and |
| |
(ii) |
Through installed extraction equipment and infrastructure operational at the time of the reserves estimate if the extraction is by means not involving a well. |
For details on BP’s proved reserves and production compliance and governance processes, see page 245.
|
|
|
| 200 |
|
BP Annual Report and Form 20-F 2013 |
Oil and natural gas exploration
and production activities
|
|
|
|
|
|
|
|
|
|
|
|
|
|
|
|
|
|
|
|
|
|
|
|
|
|
|
|
|
|
|
|
|
|
|
|
|
|
|
|
|
|
|
| |
|
|
|
|
|
|
|
|
|
|
|
|
|
|
|
|
|
|
|
|
|
|
|
|
|
|
|
|
|
|
$ million |
|
| |
|
|
|
|
|
|
|
|
|
|
|
|
|
|
|
|
|
|
|
|
|
|
|
|
|
|
|
|
|
|
2013 |
|
| |
|
|
|
 Europe

|
|
|
North
America |
|
|
 South
South

America |
|
|
 Africa

|
|
|
Asia
|
|
|
Australasia
|
|
|
Total |
|
| |
|
|
|
UK |
|
|
Rest of
Europe |
|
|
US |
|
|
Rest of
North America |
|
|
|
|
|
|
|
|
Russia |
|
|
Rest of
Asia |
|
|
|
|
|
|
|
| Subsidiariesa |
|
|
|
|
|
|
|
|
|
|
|
|
|
|
|
|
|
|
|
|
|
|
|
|
|
|
|
|
|
|
|
|
|
|
|
|
|
|
|
|
|
|
| Capitalized costs at 31 Decemberb |
|
|
|
|
|
|
|
|
|
|
|
|
|
|
|
|
|
|
|
|
|
|
|
|
|
|
|
|
|
|
|
|
|
|
|
|
|
|
|
|
|
|
| Gross capitalized costs |
|
|
|
|
|
|
|
|
|
|
|
|
|
|
|
|
|
|
|
|
|
|
|
|
|
|
|
|
|
|
|
|
|
|
|
|
|
|
|
|
|
|
| Proved properties |
|
|
|
|
29,314 |
|
|
|
10,040 |
|
|
|
75,313 |
|
|
|
2,501 |
|
|
|
8,809 |
|
|
|
35,720 |
|
|
|
– |
|
|
|
20,726 |
|
|
|
4,681 |
|
|
|
187,104 |
|
| Unproved properties |
|
|
|
|
316 |
|
|
|
195 |
|
|
|
6,816 |
|
|
|
2,408 |
|
|
|
3,366 |
|
|
|
5,079 |
|
|
|
– |
|
|
|
2,756 |
|
|
|
805 |
|
|
|
21,741 |
|
|
|
|
|
|
29,630 |
|
|
|
10,235 |
|
|
|
82,129 |
|
|
|
4,909 |
|
|
|
12,175 |
|
|
|
40,799 |
|
|
|
– |
|
|
|
23,482 |
|
|
|
5,486 |
|
|
|
208,845 |
|
| Accumulated depreciation |
|
|
|
|
18,707 |
|
|
|
3,650 |
|
|
|
38,236 |
|
|
|
193 |
|
|
|
5,063 |
|
|
|
20,082 |
|
|
|
– |
|
|
|
10,069 |
|
|
|
1,962 |
|
|
|
97,962 |
|
| Net capitalized costs |
|
|
|
|
10,923 |
|
|
|
6,585 |
|
|
|
43,893 |
|
|
|
4,716 |
|
|
|
7,112 |
|
|
|
20,717 |
|
|
|
– |
|
|
|
13,413 |
|
|
|
3,524 |
|
|
|
110,883 |
|
| |
|
|
|
|
|
|
|
|
|
|
|
|
|
|
|
|
|
|
|
|
|
|
|
|
|
|
|
|
|
|
|
|
|
|
|
|
|
|
|
|
|
|
| Costs incurred for the year ended 31
Decemberb |
|
|
|
|
|
|
|
|
|
|
|
|
|
|
|
|
|
|
|
|
|
|
|
|
|
|
|
|
|
| Acquisition of properties |
|
|
|
|
|
|
|
|
|
|
|
|
|
|
|
|
|
|
|
|
|
|
|
|
|
|
|
|
|
|
|
|
|
|
|
|
|
|
|
|
|
|
| Proved |
|
|
|
|
– |
|
|
|
– |
|
|
|
1 |
|
|
|
– |
|
|
|
7 |
|
|
|
– |
|
|
|
– |
|
|
|
– |
|
|
|
– |
|
|
|
8 |
|
| Unproved |
|
|
|
|
– |
|
|
|
– |
|
|
|
158 |
|
|
|
– |
|
|
|
284 |
|
|
|
30 |
|
|
|
– |
|
|
|
7 |
|
|
|
– |
|
|
|
479 |
|
|
|
|
|
|
– |
|
|
|
– |
|
|
|
159 |
|
|
|
– |
|
|
|
291 |
|
|
|
30 |
|
|
|
– |
|
|
|
7 |
|
|
|
– |
|
|
|
487 |
|
| Exploration and appraisal costsc |
|
|
|
|
178 |
|
|
|
14 |
|
|
|
1,291 |
|
|
|
194 |
|
|
|
951 |
|
|
|
883 |
|
|
|
– |
|
|
|
1,090 |
|
|
|
210 |
|
|
|
4,811 |
|
| Development |
|
|
|
|
1,942 |
|
|
|
455 |
|
|
|
4,877 |
|
|
|
569 |
|
|
|
683 |
|
|
|
2,755 |
|
|
|
– |
|
|
|
2,082 |
|
|
|
189 |
|
|
|
13,552 |
|
| Total costs |
|
|
|
|
2,120 |
|
|
|
469 |
|
|
|
6,327 |
|
|
|
763 |
|
|
|
1,925 |
|
|
|
3,668 |
|
|
|
– |
|
|
|
3,179 |
|
|
|
399 |
|
|
|
18,850 |
|
| |
|
|
|
|
|
|
|
|
|
|
|
|
|
|
|
|
|
|
|
|
|
|
|
|
|
|
|
|
|
|
|
|
|
|
|
|
|
|
|
|
|
|
| Results of operations for the year ended 31 December |
|
|
|
|
|
|
|
|
|
|
|
|
|
|
|
|
|
|
|
|
|
|
|
|
|
|
|
|
|
| Sales and other operating revenuesd |
|
|
|
|
|
|
|
|
|
|
|
|
|
|
|
|
|
|
|
|
|
|
|
|
|
|
|
|
|
|
|
|
|
|
|
|
|
|
|
|
|
|
| Third parties |
|
|
|
|
1,129 |
|
|
|
183 |
|
|
|
934 |
|
|
|
5 |
|
|
|
2,413 |
|
|
|
3,195 |
|
|
|
– |
|
|
|
1,005 |
|
|
|
1,784 |
|
|
|
10,648 |
|
| Sales between businesses |
|
|
|
|
1,661 |
|
|
|
1,280 |
|
|
|
14,047 |
|
|
|
12 |
|
|
|
1,154 |
|
|
|
6,518 |
|
|
|
– |
|
|
|
11,432 |
|
|
|
941 |
|
|
|
37,045 |
|
| |
|
|
|
|
2,790 |
|
|
|
1,463 |
|
|
|
14,981 |
|
|
|
17 |
|
|
|
3,567 |
|
|
|
9,713 |
|
|
|
– |
|
|
|
12,437 |
|
|
|
2,725 |
|
|
|
47,693 |
|
| Exploration expenditure |
|
|
|
|
280 |
|
|
|
17 |
|
|
|
437 |
|
|
|
28 |
|
|
|
1,477 |
|
|
|
387 |
|
|
|
– |
|
|
|
768 |
|
|
|
47 |
|
|
|
3,441 |
|
| Production costs |
|
|
|
|
1,102 |
|
|
|
430 |
|
|
|
3,691 |
|
|
|
42 |
|
|
|
892 |
|
|
|
1,623 |
|
|
|
– |
|
|
|
1,091 |
|
|
|
187 |
|
|
|
9,058 |
|
| Production taxes |
|
|
|
|
(35 |
) |
|
|
– |
|
|
|
1,112 |
|
|
|
– |
|
|
|
184 |
|
|
|
– |
|
|
|
– |
|
|
|
5,660 |
|
|
|
126 |
|
|
|
7,047 |
|
| Other costs (income)e |
|
|
|
|
(1,731 |
) |
|
|
86 |
|
|
|
3,241 |
|
|
|
55 |
|
|
|
322 |
|
|
|
89 |
|
|
|
65 |
|
|
|
84 |
|
|
|
351 |
|
|
|
2,562 |
|
| Depreciation, depletion and amortization |
|
|
|
|
504 |
|
|
|
490 |
|
|
|
3,268 |
|
|
|
– |
|
|
|
559 |
|
|
|
3,132 |
|
|
|
– |
|
|
|
2,174 |
|
|
|
207 |
|
|
|
10,334 |
|
| Impairments and (gains) losses on sale of businesses and fixed assets |
|
|
|
|
118 |
|
|
|
15 |
|
|
|
(80 |
) |
|
|
– |
|
|
|
129 |
|
|
|
29 |
|
|
|
– |
|
|
|
(16 |
) |
|
|
230 |
|
|
|
425 |
|
| |
|
|
|
|
238 |
|
|
|
1,038 |
|
|
|
11,669 |
|
|
|
125 |
|
|
|
3,563 |
|
|
|
5,260 |
|
|
|
65 |
|
|
|
9,761 |
|
|
|
1,148 |
|
|
|
32,867 |
|
| Profit (loss) before taxationf |
|
|
|
|
2,552 |
|
|
|
425 |
|
|
|
3,312 |
|
|
|
(108 |
) |
|
|
4 |
|
|
|
4,453 |
|
|
|
(65 |
) |
|
|
2,676 |
|
|
|
1,577 |
|
|
|
14,826 |
|
| Allocable taxes |
|
|
|
|
554 |
|
|
|
475 |
|
|
|
1,204 |
|
|
|
(26 |
) |
|
|
642 |
|
|
|
1,925 |
|
|
|
(2 |
) |
|
|
682 |
|
|
|
641 |
|
|
|
6,095 |
|
| Results of operations |
|
|
|
|
1,998 |
|
|
|
(50 |
) |
|
|
2,108 |
|
|
|
(82 |
) |
|
|
(638 |
) |
|
|
2,528 |
|
|
|
(63 |
) |
|
|
1,994 |
|
|
|
936 |
|
|
|
8,731 |
|
| |
|
|
|
|
|
|
|
|
|
|
|
|
|
|
|
|
|
|
|
|
|
|
|
|
|
|
|
|
|
|
|
|
|
|
|
|
|
|
|
|
|
|
| Upstream, Rosneft and TNK-BP segments replacement cost profit before interest and tax |
|
| Exploration and production activities – subsidiaries (as above) |
|
|
|
|
2,552 |
|
|
|
425 |
|
|
|
3,312 |
|
|
|
(108 |
) |
|
|
4 |
|
|
|
4,453 |
|
|
|
(65 |
) |
|
|
2,676 |
|
|
|
1,577 |
|
|
|
14,826 |
|
| Midstream activities – subsidiariesg |
|
|
|
|
244 |
|
|
|
(40 |
) |
|
|
296 |
|
|
|
(14 |
) |
|
|
153 |
|
|
|
(154 |
) |
|
|
(4 |
) |
|
|
(29 |
) |
|
|
347 |
|
|
|
799 |
|
| TNK-BP – gain on sale |
|
|
|
|
– |
|
|
|
– |
|
|
|
– |
|
|
|
– |
|
|
|
– |
|
|
|
– |
|
|
|
12,500 |
|
|
|
– |
|
|
|
– |
|
|
|
12,500 |
|
| Equity-accounted entitiesh |
|
|
|
|
– |
|
|
|
28 |
|
|
|
17 |
|
|
|
– |
|
|
|
405 |
|
|
|
24 |
|
|
|
2,158 |
|
|
|
553 |
|
|
|
– |
|
|
|
3,185 |
|
| Total replacement cost profit before interest and tax |
|
|
|
|
2,796 |
|
|
|
413 |
|
|
|
3,625 |
|
|
|
(122 |
) |
|
|
562 |
|
|
|
4,323 |
|
|
|
14,589 |
|
|
|
3,200 |
|
|
|
1,924 |
|
|
|
31,310 |
|
| a |
These tables contain information relating to oil and natural gas exploration and production activities of subsidiaries, which includes our share of oil and natural gas exploration and production activities of joint
operations. They do not include any costs relating to the Gulf of Mexico oil spill. Midstream activities relating to the management and ownership of crude oil and natural gas pipelines, processing and export terminals and LNG processing facilities
and transportation are excluded. In addition, our midstream activities of marketing and trading of natural gas, power and NGLs in the US, Canada, UK and Europe are excluded. The most significant midstream pipeline interests include the
Trans-Alaska Pipeline System, the Forties Pipeline System, the Central Area Transmission System pipeline, the South Caucasus Pipeline and the Baku-Tbilisi-Ceyhan pipeline. Major LNG activities are located in Trinidad, Indonesia, Australia and
Angola. |
| b |
Decommissioning assets are included in capitalized costs at 31 December but are excluded from costs incurred for the year. |
| c |
Includes exploration and appraisal drilling expenditures, which are capitalized within intangible assets, and geological and geophysical exploration costs, which are
charged to income as incurred. |
| d |
Presented net of transportation costs, purchases and sales taxes. |
| e |
Includes property taxes, other government take and the fair value gain on embedded derivatives of $459 million. The UK region includes a $1,055 million gain offset by corresponding charges primarily in the US, relating
to the group self-insurance programme. |
| f |
Excludes the unwinding of the discount on provisions and payables amounting to $141 million which is included in finance costs in the group income statement.
|
| g |
Midstream and other activities excludes inventory holding gains and losses. |
| h |
The profits of equity-accounted entities are included after interest and tax. |
|
|
|
|
|
| BP Annual Report and Form 20-F 2013 |
|
|
201 |
|
Oil and natural gas exploration and production activities –
continued
|
|
|
|
|
|
|
|
|
|
|
|
|
|
|
|
|
|
|
|
|
|
|
|
|
|
|
|
|
|
|
|
|
|
|
|
|
|
|
|
|
|
|
| |
|
|
|
|
|
|
$ million |
|
| |
|
|
|
|
|
|
|
|
|
|
|
|
|
|
|
|
|
|
|
|
|
|
|
|
|
|
|
|
|
|
2013 |
|
| |
|
|
|
Europe
|
|
|
North
America |
|
|
South
America |
|
|
Africa
|
|
|
Asia
|
|
|
Australasia
|
|
|
Total |
|
| |
|
|
|
UK |
|
|
Rest of
Europe |
|
|
US |
|
|
Rest of
North America |
|
|
|
|
|
|
|
|
Russiaa |
|
|
Rest of
Asia |
|
|
|
|
|
|
|
| Equity-accounted entities (BP
share)b |
|
|
|
|
|
|
|
|
|
|
|
|
|
|
|
|
|
|
|
|
|
|
|
|
|
|
|
|
|
|
|
|
|
|
|
|
|
|
|
|
| Capitalized costs at 31
Decemberc |
|
|
|
|
|
|
|
|
|
|
|
|
|
|
|
|
|
|
|
|
|
|
|
|
|
|
|
|
|
|
|
|
|
|
|
|
|
|
|
|
|
|
| Gross capitalized costs |
|
|
|
|
|
|
|
|
|
|
|
|
|
|
|
|
|
|
|
|
|
|
|
|
|
|
|
|
|
|
|
|
|
|
|
|
|
|
|
|
|
|
| Proved properties |
|
|
|
|
– |
|
|
|
– |
|
|
|
– |
|
|
|
– |
|
|
|
7,648 |
|
|
|
– |
|
|
|
18,942 |
|
|
|
4,239 |
|
|
|
– |
|
|
|
30,829 |
|
| Unproved properties |
|
|
|
|
– |
|
|
|
– |
|
|
|
– |
|
|
|
– |
|
|
|
29 |
|
|
|
– |
|
|
|
638 |
|
|
|
21 |
|
|
|
– |
|
|
|
688 |
|
|
|
|
|
|
– |
|
|
|
– |
|
|
|
– |
|
|
|
– |
|
|
|
7,677 |
|
|
|
– |
|
|
|
19,580 |
|
|
|
4,260 |
|
|
|
– |
|
|
|
31,517 |
|
| Accumulated depreciation |
|
|
|
|
– |
|
|
|
– |
|
|
|
– |
|
|
|
– |
|
|
|
3,282 |
|
|
|
– |
|
|
|
1,077 |
|
|
|
4,061 |
|
|
|
– |
|
|
|
8,420 |
|
| Net capitalized costs |
|
|
|
|
– |
|
|
|
– |
|
|
|
– |
|
|
|
– |
|
|
|
4,395 |
|
|
|
– |
|
|
|
18,503 |
|
|
|
199 |
|
|
|
– |
|
|
|
23,097 |
|
| |
|
|
|
|
|
|
|
|
|
|
|
|
|
|
|
|
|
|
|
|
|
|
|
|
|
|
|
|
|
|
|
|
|
|
|
|
|
|
|
|
|
|
| Costs incurred for the year ended
31 Decemberd |
|
|
|
|
|
|
|
|
|
|
|
|
|
|
|
|
|
|
|
|
|
|
|
|
|
|
|
|
|
| Acquisition of properties |
|
|
|
|
|
|
|
|
|
|
|
|
|
|
|
|
|
|
|
|
|
|
|
|
|
|
|
|
|
|
|
|
|
|
|
|
|
|
|
|
|
|
| Proved |
|
|
|
|
– |
|
|
|
– |
|
|
|
– |
|
|
|
– |
|
|
|
– |
|
|
|
– |
|
|
|
1,816 |
|
|
|
– |
|
|
|
– |
|
|
|
1,816 |
|
| Unproved |
|
|
|
|
– |
|
|
|
– |
|
|
|
– |
|
|
|
– |
|
|
|
– |
|
|
|
– |
|
|
|
657 |
|
|
|
– |
|
|
|
– |
|
|
|
657 |
|
|
|
|
|
|
– |
|
|
|
– |
|
|
|
– |
|
|
|
– |
|
|
|
– |
|
|
|
– |
|
|
|
2,473 |
|
|
|
– |
|
|
|
– |
|
|
|
2,473 |
|
| Exploration and appraisal costse |
|
|
|
|
– |
|
|
|
– |
|
|
|
– |
|
|
|
– |
|
|
|
8 |
|
|
|
– |
|
|
|
133 |
|
|
|
12 |
|
|
|
– |
|
|
|
153 |
|
| Development |
|
|
|
|
– |
|
|
|
– |
|
|
|
– |
|
|
|
– |
|
|
|
714 |
|
|
|
– |
|
|
|
1,860 |
|
|
|
538 |
|
|
|
– |
|
|
|
3,112 |
|
| Total costs |
|
|
|
|
– |
|
|
|
– |
|
|
|
– |
|
|
|
– |
|
|
|
722 |
|
|
|
– |
|
|
|
4,466 |
|
|
|
550 |
|
|
|
– |
|
|
|
5,738 |
|
| |
|
|
|
|
|
|
|
|
|
|
|
|
|
|
|
|
|
|
|
|
|
|
|
|
|
|
|
|
|
|
|
|
|
|
|
|
|
|
|
|
|
|
| Results of operations for the year ended 31 December |
|
|
|
|
|
|
|
|
|
|
|
|
|
|
|
|
|
|
|
|
|
|
|
|
|
|
|
|
|
| Sales and other operating revenuesf |
|
|
|
|
|
|
|
|
|
|
|
|
|
|
|
|
|
|
|
|
|
|
|
|
|
|
|
|
|
|
|
|
|
|
|
|
|
|
|
|
|
|
| Third parties |
|
|
|
|
– |
|
|
|
– |
|
|
|
– |
|
|
|
– |
|
|
|
2,294 |
|
|
|
– |
|
|
|
435 |
|
|
|
4,770 |
|
|
|
– |
|
|
|
7,499 |
|
| Sales between businesses |
|
|
|
|
– |
|
|
|
– |
|
|
|
– |
|
|
|
– |
|
|
|
– |
|
|
|
– |
|
|
|
9,679 |
|
|
|
14 |
|
|
|
– |
|
|
|
9,693 |
|
| |
|
|
|
|
– |
|
|
|
– |
|
|
|
– |
|
|
|
– |
|
|
|
2,294 |
|
|
|
– |
|
|
|
10,114 |
|
|
|
4,784 |
|
|
|
– |
|
|
|
17,192 |
|
| Exploration expenditure |
|
|
|
|
– |
|
|
|
– |
|
|
|
– |
|
|
|
– |
|
|
|
– |
|
|
|
– |
|
|
|
126 |
|
|
|
1 |
|
|
|
– |
|
|
|
127 |
|
| Production costs |
|
|
|
|
– |
|
|
|
– |
|
|
|
– |
|
|
|
– |
|
|
|
586 |
|
|
|
– |
|
|
|
1,177 |
|
|
|
404 |
|
|
|
– |
|
|
|
2,167 |
|
| Production taxes |
|
|
|
|
– |
|
|
|
– |
|
|
|
– |
|
|
|
– |
|
|
|
630 |
|
|
|
– |
|
|
|
4,511 |
|
|
|
3,645 |
|
|
|
– |
|
|
|
8,786 |
|
| Other costs (income) |
|
|
|
|
– |
|
|
|
– |
|
|
|
– |
|
|
|
– |
|
|
|
6 |
|
|
|
– |
|
|
|
94 |
|
|
|
(1 |
) |
|
|
– |
|
|
|
99 |
|
| Depreciation, depletion and amortization |
|
|
|
|
– |
|
|
|
– |
|
|
|
– |
|
|
|
– |
|
|
|
317 |
|
|
|
– |
|
|
|
1,232 |
|
|
|
544 |
|
|
|
– |
|
|
|
2,093 |
|
| Impairments and losses on sale of |
|
|
|
|
|
|
|
|
|
|
|
|
|
|
|
|
|
|
|
|
|
|
|
|
|
|
|
|
|
|
|
|
|
|
|
|
|
|
|
|
|
|
| businesses and fixed assets |
|
|
|
|
– |
|
|
|
– |
|
|
|
– |
|
|
|
– |
|
|
|
– |
|
|
|
– |
|
|
|
37 |
|
|
|
– |
|
|
|
– |
|
|
|
37 |
|
| |
|
|
|
|
– |
|
|
|
– |
|
|
|
– |
|
|
|
– |
|
|
|
1,539 |
|
|
|
– |
|
|
|
7,177 |
|
|
|
4,593 |
|
|
|
– |
|
|
|
13,309 |
|
| Profit (loss) before taxation |
|
|
|
|
– |
|
|
|
– |
|
|
|
– |
|
|
|
– |
|
|
|
755 |
|
|
|
– |
|
|
|
2,937 |
|
|
|
191 |
|
|
|
– |
|
|
|
3,883 |
|
| Allocable taxes |
|
|
|
|
– |
|
|
|
– |
|
|
|
– |
|
|
|
– |
|
|
|
460 |
|
|
|
– |
|
|
|
367 |
|
|
|
40 |
|
|
|
– |
|
|
|
867 |
|
| Results of operations |
|
|
|
|
– |
|
|
|
– |
|
|
|
– |
|
|
|
– |
|
|
|
295 |
|
|
|
– |
|
|
|
2,570 |
|
|
|
151 |
|
|
|
– |
|
|
|
3,016 |
|
|
|
|
|
|
|
|
|
|
|
|
|
|
|
|
|
|
|
|
|
|
|
|
|
|
|
|
|
|
|
| Exploration and production activities – equity-accounted entities after tax (as above) |
|
|
|
|
– |
|
|
|
– |
|
|
|
– |
|
|
|
– |
|
|
|
295 |
|
|
|
– |
|
|
|
2,570 |
|
|
|
151 |
|
|
|
– |
|
|
|
3,016 |
|
| Midstream and other activities after taxg |
|
|
|
|
– |
|
|
|
28 |
|
|
|
17 |
|
|
|
– |
|
|
|
110 |
|
|
|
24 |
|
|
|
(412 |
) |
|
|
402 |
|
|
|
– |
|
|
|
169 |
|
| Total replacement cost profit after interest and tax |
|
|
|
|
– |
|
|
|
28 |
|
|
|
17 |
|
|
|
– |
|
|
|
405 |
|
|
|
24 |
|
|
|
2,158 |
|
|
|
553 |
|
|
|
– |
|
|
|
3,185 |
|
| a |
Amounts reported for Russia in this table include BP’s share of Rosneft’s worldwide activities, including insignificant amounts outside Russia. |
| b |
These tables contain information relating to oil and natural gas exploration and production activities of equity-accounted entities. They do not include amounts relating to assets held for sale. Midstream activities
relating to the management and ownership of crude oil and natural gas pipelines, processing and export terminals and LNG processing facilities and transportation as well as downstream activities of TNK-BP and Rosneft are excluded. The amounts
reported for equity-accounted entities exclude the corresponding amounts for their equity-accounted entities. |
| c |
Decommissioning assets are included in capitalized costs at 31 December but are excluded from costs incurred for the year. |
| d |
The amounts shown reflect BP’s share of equity-accounted entities’ costs incurred, and not the costs incurred by BP in acquiring an interest in equity-accounted entities. |
| e |
Includes exploration and appraisal drilling expenditures, which are capitalized within intangible assets, and geological and geophysical exploration costs, which are charged to income as incurred. |
| f |
Presented net of transportation costs and sales taxes. |
| g |
Includes interest, non-controlling interest and the net results of equity-accounted entities, and excludes inventory holding gains and losses. |
|
|
|
| 202 |
|
BP Annual Report and Form 20-F 2013 |
Oil and natural gas exploration and production activities
– continued
|
|
|
|
|
|
|
|
|
|
|
|
|
|
|
|
|
|
|
|
|
|
|
|
|
|
|
|
|
|
|
|
|
|
|
|
|
|
|
|
|
|
|
| |
|
|
|
|
|
|
$ million |
|
| |
|
|
|
|
|
|
|
|
|
|
|
|
|
|
|
|
|
|
|
|
|
|
|
|
|
|
|
|
|
|
2012 |
|
| |
|
|
|
Europe
|
|
|
North
America |
|
|
South
America |
|
|
Africa
|
|
|
Asia
|
|
|
Australasia
|
|
|
Total |
|
| |
|
|
|
UK |
|
|
Rest of
Europe |
|
|
US |
|
|
Rest of
North America |
|
|
|
|
|
|
|
|
Russia |
|
|
Rest of
Asia |
|
|
|
|
|
|
|
| Subsidiariesa |
|
|
|
|
|
|
|
|
|
|
|
|
|
|
|
|
|
|
|
|
|
|
|
|
|
|
|
|
|
|
|
|
|
|
|
|
|
|
|
|
|
|
| Capitalized costs at 31 Decemberb
j |
|
|
|
|
|
|
|
|
|
|
|
|
|
|
|
|
|
|
|
|
|
|
|
|
|
|
|
|
|
|
|
|
|
|
|
|
|
|
|
|
|
|
| Gross capitalized costs |
|
|
|
|
|
|
|
|
|
|
|
|
|
|
|
|
|
|
|
|
|
|
|
|
|
|
|
|
|
|
|
|
|
|
|
|
|
|
|
|
|
|
| Proved properties |
|
|
|
|
28,370 |
|
|
|
9,421 |
|
|
|
70,133 |
|
|
|
1,928 |
|
|
|
8,153 |
|
|
|
32,755 |
|
|
|
– |
|
|
|
16,757 |
|
|
|
3,676 |
|
|
|
171,193 |
|
| Unproved properties |
|
|
|
|
400 |
|
|
|
199 |
|
|
|
7,084 |
|
|
|
2,244 |
|
|
|
3,590 |
|
|
|
4,524 |
|
|
|
– |
|
|
|
4,920 |
|
|
|
1,540 |
|
|
|
24,501 |
|
|
|
|
|
|
28,770 |
|
|
|
9,620 |
|
|
|
77,217 |
|
|
|
4,172 |
|
|
|
11,743 |
|
|
|
37,279 |
|
|
|
– |
|
|
|
21,677 |
|
|
|
5,216 |
|
|
|
195,694 |
|
| Accumulated depreciation |
|
|
|
|
19,002 |
|
|
|
3,161 |
|
|
|
35,459 |
|
|
|
197 |
|
|
|
4,444 |
|
|
|
16,901 |
|
|
|
– |
|
|
|
8,360 |
|
|
|
1,517 |
|
|
|
89,041 |
|
| Net capitalized costs |
|
|
|
|
9,768 |
|
|
|
6,459 |
|
|
|
41,758 |
|
|
|
3,975 |
|
|
|
7,299 |
|
|
|
20,378 |
|
|
|
– |
|
|
|
13,317 |
|
|
|
3,699 |
|
|
|
106,653 |
|
| |
|
|
|
|
|
|
|
|
|
|
|
|
|
|
|
|
|
|
|
|
|
|
|
|
|
|
|
|
|
|
|
|
|
|
|
|
|
|
|
|
|
|
| Costs incurred for the year ended 31
Decemberb |
|
|
|
|
|
|
|
|
|
|
|
|
|
|
|
|
|
|
|
|
|
|
|
|
|
|
|
|
|
| Acquisition of propertiesc k |
|
|
|
|
|
|
|
|
|
|
|
|
|
|
|
|
|
|
|
|
|
|
|
|
|
|
|
|
|
|
|
|
|
|
|
|
|
|
|
|
|
|
| Proved |
|
|
|
|
– |
|
|
|
– |
|
|
|
256 |
|
|
|
– |
|
|
|
51 |
|
|
|
– |
|
|
|
– |
|
|
|
– |
|
|
|
– |
|
|
|
307 |
|
| Unproved |
|
|
|
|
– |
|
|
|
– |
|
|
|
1,111 |
|
|
|
– |
|
|
|
27 |
|
|
|
239 |
|
|
|
– |
|
|
|
(68 |
) |
|
|
– |
|
|
|
1,309 |
|
|
|
|
|
|
– |
|
|
|
– |
|
|
|
1,367 |
|
|
|
– |
|
|
|
78 |
|
|
|
239 |
|
|
|
– |
|
|
|
(68 |
) |
|
|
– |
|
|
|
1,616 |
|
| Exploration and appraisal costsd |
|
|
|
|
173 |
|
|
|
47 |
|
|
|
1,069 |
|
|
|
230 |
|
|
|
758 |
|
|
|
1,024 |
|
|
|
– |
|
|
|
814 |
|
|
|
241 |
|
|
|
4,356 |
|
| Development |
|
|
|
|
1,907 |
|
|
|
784 |
|
|
|
3,866 |
|
|
|
611 |
|
|
|
581 |
|
|
|
2,992 |
|
|
|
– |
|
|
|
1,591 |
|
|
|
221 |
|
|
|
12,553 |
|
| Total costs |
|
|
|
|
2,080 |
|
|
|
831 |
|
|
|
6,302 |
|
|
|
841 |
|
|
|
1,417 |
|
|
|
4,255 |
|
|
|
– |
|
|
|
2,337 |
|
|
|
462 |
|
|
|
18,525 |
|
| |
|
|
|
|
|
|
|
|
|
|
|
|
|
|
|
|
|
|
|
|
|
|
|
|
|
|
|
|
|
|
|
|
|
|
|
|
|
|
|
|
|
|
| Results of operations for the year ended 31 December |
|
|
|
|
|
|
|
|
|
|
|
|
|
|
|
|
|
|
|
|
|
|
|
|
|
|
|
|
|
| Sales and other operating revenuese |
|
|
|
|
|
|
|
|
|
|
|
|
|
|
|
|
|
|
|
|
|
|
|
|
|
|
|
|
|
|
|
|
|
|
|
|
|
|
|
|
|
|
| Third parties |
|
|
|
|
1,595 |
|
|
|
76 |
|
|
|
453 |
|
|
|
10 |
|
|
|
2,026 |
|
|
|
3,424 |
|
|
|
– |
|
|
|
1,299 |
|
|
|
1,749 |
|
|
|
10,632 |
|
| Sales between businesses |
|
|
|
|
2,975 |
|
|
|
783 |
|
|
|
15,713 |
|
|
|
10 |
|
|
|
984 |
|
|
|
5,633 |
|
|
|
– |
|
|
|
11,345 |
|
|
|
915 |
|
|
|
38,358 |
|
| |
|
|
|
|
4,570 |
|
|
|
859 |
|
|
|
16,166 |
|
|
|
20 |
|
|
|
3,010 |
|
|
|
9,057 |
|
|
|
– |
|
|
|
12,644 |
|
|
|
2,664 |
|
|
|
48,990 |
|
| Exploration expenditure |
|
|
|
|
105 |
|
|
|
29 |
|
|
|
649 |
|
|
|
4 |
|
|
|
120 |
|
|
|
310 |
|
|
|
– |
|
|
|
126 |
|
|
|
132 |
|
|
|
1,475 |
|
| Production costs |
|
|
|
|
1,310 |
|
|
|
348 |
|
|
|
3,854 |
|
|
|
71 |
|
|
|
812 |
|
|
|
1,323 |
|
|
|
– |
|
|
|
1,076 |
|
|
|
191 |
|
|
|
8,985 |
|
| Production taxes |
|
|
|
|
92 |
|
|
|
– |
|
|
|
1,472 |
|
|
|
– |
|
|
|
162 |
|
|
|
– |
|
|
|
– |
|
|
|
6,291 |
|
|
|
141 |
|
|
|
8,158 |
|
| Other costs (income)f |
|
|
|
|
(1,474 |
) |
|
|
78 |
|
|
|
3,505 |
|
|
|
63 |
|
|
|
109 |
|
|
|
221 |
|
|
|
(330 |
) |
|
|
84 |
|
|
|
264 |
|
|
|
2,520 |
|
| Depreciation, depletion and amortization |
|
|
|
|
1,102 |
|
|
|
145 |
|
|
|
3,187 |
|
|
|
10 |
|
|
|
606 |
|
|
|
2,281 |
|
|
|
– |
|
|
|
2,116 |
|
|
|
211 |
|
|
|
9,658 |
|
| Impairments and (gains) losses on sale of businesses and fixed assets |
|
|
|
|
373 |
|
|
|
83 |
|
|
|
(3,576 |
) |
|
|
98 |
|
|
|
6 |
|
|
|
24 |
|
|
|
– |
|
|
|
(2 |
) |
|
|
(5 |
) |
|
|
(2,999 |
) |
| |
|
|
|
|
1,508 |
|
|
|
683 |
|
|
|
9,091 |
|
|
|
246 |
|
|
|
1,815 |
|
|
|
4,159 |
|
|
|
(330 |
) |
|
|
9,691 |
|
|
|
934 |
|
|
|
27,797 |
|
| Profit (loss) before taxationg |
|
|
|
|
3,062 |
|
|
|
176 |
|
|
|
7,075 |
|
|
|
(226 |
) |
|
|
1,195 |
|
|
|
4,898 |
|
|
|
330 |
|
|
|
2,953 |
|
|
|
1,730 |
|
|
|
21,193 |
|
| Allocable taxes |
|
|
|
|
1,121 |
|
|
|
(313 |
) |
|
|
2,762 |
|
|
|
(67 |
) |
|
|
804 |
|
|
|
2,371 |
|
|
|
(13 |
) |
|
|
663 |
|
|
|
755 |
|
|
|
8,083 |
|
| Results of operations |
|
|
|
|
1,941 |
|
|
|
489 |
|
|
|
4,313 |
|
|
|
(159 |
) |
|
|
391 |
|
|
|
2,527 |
|
|
|
343 |
|
|
|
2,290 |
|
|
|
975 |
|
|
|
13,110 |
|
| |
|
|
|
|
|
|
|
|
|
|
|
|
|
|
|
|
|
|
|
|
|
|
|
|
|
|
|
|
|
|
|
|
|
|
|
|
|
|
|
|
|
|
| Upstream segment and TNK-BP segment replacement cost profit before interest and tax |
|
| Exploration and production activities – subsidiaries (as above) |
|
|
|
|
3,062 |
|
|
|
176 |
|
|
|
7,075 |
|
|
|
(226 |
) |
|
|
1,195 |
|
|
|
4,898 |
|
|
|
330 |
|
|
|
2,953 |
|
|
|
1,730 |
|
|
|
21,193 |
|
| Midstream activities – subsidiariesh |
|
|
|
|
(250 |
) |
|
|
(114 |
) |
|
|
(173 |
) |
|
|
774 |
|
|
|
163 |
|
|
|
(46 |
) |
|
|
11 |
|
|
|
32 |
|
|
|
370 |
|
|
|
767 |
|
| Equity-accounted entitiesi |
|
|
|
|
– |
|
|
|
35 |
|
|
|
16 |
|
|
|
– |
|
|
|
160 |
|
|
|
48 |
|
|
|
3,005 |
|
|
|
640 |
|
|
|
– |
|
|
|
3,904 |
|
| Total replacement cost profit before interest and tax |
|
|
|
|
2,812 |
|
|
|
97 |
|
|
|
6,918 |
|
|
|
548 |
|
|
|
1,518 |
|
|
|
4,900 |
|
|
|
3,346 |
|
|
|
3,625 |
|
|
|
2,100 |
|
|
|
25,864 |
|
| a |
These tables contain information relating to oil and natural gas exploration and production activities of subsidiaries. They do not include any costs relating to the Gulf of Mexico oil spill or assets held for sale.
Midstream activities relating to the management and ownership of crude oil and natural gas pipelines, processing and export terminals and LNG processing facilities and transportation are excluded. In addition, our midstream activities of marketing
and trading of natural gas, power and NGLs in the US, Canada, UK and Europe are excluded. The most significant midstream pipeline interests include the Trans-Alaska Pipeline System, the Forties Pipeline System, the Central Area Transmission System
pipeline, the South Caucasus Pipeline and the Baku-Tbilisi-Ceyhan pipeline. Major LNG activities are located in Trinidad, Indonesia and Australia and BP is also investing in the LNG business in Angola. |
| b |
Decommissioning assets are included in capitalized costs at 31 December but are excluded from costs incurred for the year. |
| c |
Includes costs capitalized as a result of asset exchanges. |
| d |
Includes exploration and appraisal drilling expenditures, which are capitalized within intangible assets, and geological and geophysical exploration costs, which are charged to income as incurred. |
| e |
Presented net of transportation costs, purchases and sales taxes. |
| f |
Includes property taxes, other government take and the fair value gain on embedded derivatives of $347 million. The UK region includes a $1,161 million gain offset by corresponding charges primarily in the US, relating
to the group self-insurance programme. The Russia region, for which equity accounting ceased on 22 October 2012, includes a net non-operating gain of $351 million including dividend income of $709 million partly offset by a settlement charge of
$325 million. |
| g |
Excludes the unwinding of the discount on provisions and payables amounting to $173 million which is included in finance costs in the group income statement. |
| h |
Midstream and other activities exclude inventory holding gains and losses. |
| i |
The profits of equity-accounted entities are included after interest and tax and the results exclude balances associated with assets held for sale. |
| j |
Excludes balances associated with assets held for sale. |
| k |
Excludes goodwill associated with business combinations. |
|
|
|
|
|
| BP Annual Report and Form 20-F 2013 |
|
|
203 |
|
Oil and natural gas exploration and production activities –
continued
|
|
|
|
|
|
|
|
|
|
|
|
|
|
|
|
|
|
|
|
|
|
|
|
|
|
|
|
|
|
|
|
|
|
|
|
|
|
|
|
|
|
|
| |
|
|
|
$ million |
|
| |
|
|
|
|
|
|
|
|
|
|
|
|
|
|
|
|
|
|
|
|
|
|
|
|
|
|
|
|
|
|
2012 |
|
| |
|
|
|
Europe
|
|
|
North
America |
|
|
South
America |
|
|
Africa
|
|
|
Asia
|
|
|
Australasia
|
|
|
Total |
|
| |
|
|
|
UK |
|
|
Rest of
Europe |
|
|
US |
|
|
Rest of
North
America |
|
|
|
|
|
|
|
|
Russiaa |
|
|
Rest of
Asia |
|
|
|
|
|
|
|
| Equity-accounted entities (BP share)b |
|
|
|
|
|
|
|
|
|
|
|
|
|
|
|
|
|
|
|
|
|
|
|
|
|
|
|
|
|
|
|
|
|
|
|
|
|
|
|
|
|
|
| Capitalized costs at 31
Decemberc |
|
|
|
|
|
|
|
|
|
|
|
|
|
|
|
|
|
|
|
|
|
|
|
|
|
|
|
|
|
|
|
|
|
|
|
|
|
|
|
|
|
|
| Gross capitalized costs |
|
|
|
|
|
|
|
|
|
|
|
|
|
|
|
|
|
|
|
|
|
|
|
|
|
|
|
|
|
|
|
|
|
|
|
|
|
|
|
|
|
|
| Proved properties |
|
|
|
|
– |
|
|
|
– |
|
|
|
– |
|
|
|
– |
|
|
|
6,958 |
|
|
|
– |
|
|
|
– |
|
|
|
4,036 |
|
|
|
– |
|
|
|
10,994 |
|
| Unproved properties |
|
|
|
|
– |
|
|
|
– |
|
|
|
– |
|
|
|
– |
|
|
|
21 |
|
|
|
– |
|
|
|
– |
|
|
|
16 |
|
|
|
– |
|
|
|
37 |
|
|
|
|
|
|
– |
|
|
|
– |
|
|
|
– |
|
|
|
– |
|
|
|
6,979 |
|
|
|
– |
|
|
|
– |
|
|
|
4,052 |
|
|
|
– |
|
|
|
11,031 |
|
| Accumulated depreciation |
|
|
|
|
– |
|
|
|
– |
|
|
|
– |
|
|
|
– |
|
|
|
2,965 |
|
|
|
– |
|
|
|
– |
|
|
|
3,648 |
|
|
|
– |
|
|
|
6,613 |
|
| Net capitalized costs |
|
|
|
|
– |
|
|
|
– |
|
|
|
– |
|
|
|
– |
|
|
|
4,014 |
|
|
|
– |
|
|
|
– |
|
|
|
404 |
|
|
|
– |
|
|
|
4,418 |
|
| |
|
|
|
|
|
|
|
|
|
|
|
|
|
|
|
|
|
|
|
|
|
|
|
|
|
|
|
|
|
|
|
|
|
|
|
|
|
|
|
|
|
|
| Costs incurred for the year ended 31
Decemberc |
|
|
|
|
|
|
|
|
|
|
|
|
|
|
|
|
|
|
|
|
|
|
|
|
|
|
|
|
|
| Acquisition of propertiesd |
|
|
|
|
|
|
|
|
|
|
|
|
|
|
|
|
|
|
|
|
|
|
|
|
|
|
|
|
|
|
|
|
|
|
|
|
|
|
|
|
|
|
| Proved |
|
|
|
|
– |
|
|
|
– |
|
|
|
– |
|
|
|
– |
|
|
|
– |
|
|
|
– |
|
|
|
4 |
|
|
|
– |
|
|
|
– |
|
|
|
4 |
|
| Unproved |
|
|
|
|
– |
|
|
|
– |
|
|
|
– |
|
|
|
– |
|
|
|
439 |
|
|
|
– |
|
|
|
15 |
|
|
|
– |
|
|
|
– |
|
|
|
454 |
|
|
|
|
|
|
– |
|
|
|
– |
|
|
|
– |
|
|
|
– |
|
|
|
439 |
|
|
|
– |
|
|
|
19 |
|
|
|
– |
|
|
|
– |
|
|
|
458 |
|
| Exploration and appraisal costse |
|
|
|
|
– |
|
|
|
– |
|
|
|
– |
|
|
|
– |
|
|
|
31 |
|
|
|
– |
|
|
|
195 |
|
|
|
7 |
|
|
|
– |
|
|
|
233 |
|
| Development |
|
|
|
|
– |
|
|
|
– |
|
|
|
– |
|
|
|
– |
|
|
|
599 |
|
|
|
– |
|
|
|
1,560 |
|
|
|
556 |
|
|
|
– |
|
|
|
2,715 |
|
| Total costs |
|
|
|
|
– |
|
|
|
– |
|
|
|
– |
|
|
|
– |
|
|
|
1,069 |
|
|
|
– |
|
|
|
1,774 |
|
|
|
563 |
|
|
|
– |
|
|
|
3,406 |
|
| |
|
|
|
|
|
|
|
|
|
|
|
|
|
|
|
|
|
|
|
|
|
|
|
|
|
|
|
|
|
|
|
|
|
|
|
|
|
|
|
|
|
|
| Results of operations for the year ended 31 December |
|
|
|
|
|
|
|
|
|
|
|
|
|
|
|
|
|
|
|
|
|
|
|
|
|
|
|
|
|
| Sales and other operating revenuesf |
|
|
|
|
|
|
|
|
|
|
|
|
|
|
|
|
|
|
|
|
|
|
|
|
|
|
|
|
|
|
|
|
|
|
|
|
|
|
|
|
|
|
| Third parties |
|
|
|
|
– |
|
|
|
– |
|
|
|
– |
|
|
|
– |
|
|
|
2,267 |
|
|
|
– |
|
|
|
6,472 |
|
|
|
4,245 |
|
|
|
– |
|
|
|
12,984 |
|
| Sales between businesses |
|
|
|
|
– |
|
|
|
– |
|
|
|
– |
|
|
|
– |
|
|
|
– |
|
|
|
– |
|
|
|
3,639 |
|
|
|
21 |
|
|
|
– |
|
|
|
3,660 |
|
| |
|
|
|
|
– |
|
|
|
– |
|
|
|
– |
|
|
|
– |
|
|
|
2,267 |
|
|
|
– |
|
|
|
10,111 |
|
|
|
4,266 |
|
|
|
– |
|
|
|
16,644 |
|
| Exploration expenditure |
|
|
|
|
– |
|
|
|
– |
|
|
|
– |
|
|
|
– |
|
|
|
31 |
|
|
|
– |
|
|
|
93 |
|
|
|
1 |
|
|
|
– |
|
|
|
125 |
|
| Production costs |
|
|
|
|
– |
|
|
|
– |
|
|
|
– |
|
|
|
– |
|
|
|
555 |
|
|
|
– |
|
|
|
1,605 |
|
|
|
295 |
|
|
|
– |
|
|
|
2,455 |
|
| Production taxes |
|
|
|
|
– |
|
|
|
– |
|
|
|
– |
|
|
|
– |
|
|
|
959 |
|
|
|
– |
|
|
|
4,400 |
|
|
|
3,245 |
|
|
|
– |
|
|
|
8,604 |
|
| Other costs (income) |
|
|
|
|
– |
|
|
|
– |
|
|
|
– |
|
|
|
– |
|
|
|
(11 |
) |
|
|
– |
|
|
|
(24 |
) |
|
|
(2 |
) |
|
|
– |
|
|
|
(37 |
) |
| Depreciation, depletion and amortization |
|
|
|
|
– |
|
|
|
– |
|
|
|
– |
|
|
|
– |
|
|
|
328 |
|
|
|
– |
|
|
|
786 |
|
|
|
538 |
|
|
|
– |
|
|
|
1,652 |
|
| Impairments and losses on sale of businesses and fixed assets |
|
|
|
|
– |
|
|
|
– |
|
|
|
– |
|
|
|
– |
|
|
|
– |
|
|
|
– |
|
|
|
(27 |
) |
|
|
– |
|
|
|
– |
|
|
|
(27 |
) |
| |
|
|
|
|
– |
|
|
|
– |
|
|
|
– |
|
|
|
– |
|
|
|
1,862 |
|
|
|
– |
|
|
|
6,833 |
|
|
|
4,077 |
|
|
|
– |
|
|
|
12,772 |
|
| Profit (loss) before taxation |
|
|
|
|
– |
|
|
|
– |
|
|
|
– |
|
|
|
– |
|
|
|
405 |
|
|
|
– |
|
|
|
3,278 |
|
|
|
189 |
|
|
|
– |
|
|
|
3,872 |
|
| Allocable taxes |
|
|
|
|
– |
|
|
|
– |
|
|
|
– |
|
|
|
– |
|
|
|
294 |
|
|
|
– |
|
|
|
536 |
|
|
|
54 |
|
|
|
– |
|
|
|
884 |
|
| Results of operations |
|
|
|
|
– |
|
|
|
– |
|
|
|
– |
|
|
|
– |
|
|
|
111 |
|
|
|
– |
|
|
|
2,742 |
|
|
|
135 |
|
|
|
– |
|
|
|
2,988 |
|
|
|
|
|
|
|
|
|
|
|
|
|
|
|
|
|
|
|
|
|
|
|
|
|
|
|
|
|
|
|
| Exploration and production activities – equity-accounted entities after tax (as above) |
|
|
|
|
– |
|
|
|
– |
|
|
|
– |
|
|
|
– |
|
|
|
111 |
|
|
|
– |
|
|
|
2,742 |
|
|
|
135 |
|
|
|
– |
|
|
|
2,988 |
|
| Midstream and other activities after taxg |
|
|
|
|
– |
|
|
|
35 |
|
|
|
16 |
|
|
|
– |
|
|
|
49 |
|
|
|
48 |
|
|
|
263 |
|
|
|
505 |
|
|
|
– |
|
|
|
916 |
|
| Total replacement cost profit after interest and tax |
|
|
|
|
– |
|
|
|
35 |
|
|
|
16 |
|
|
|
– |
|
|
|
160 |
|
|
|
48 |
|
|
|
3,005 |
|
|
|
640 |
|
|
|
– |
|
|
|
3,904 |
|
| a |
The Russia region includes BP’s equity-accounted share of TNK-BP’s earnings. For 2012, equity-accounted earnings are included until 21 October 2012 only, after which our investment was classified as an asset
held for sale and therefore equity accounting ceased. The amounts shown exclude BP’s share of costs incurred and results of operations for the period 22 October to 31 December 2012. |
| b |
These tables contain information relating to oil and natural gas exploration and production activities of equity-accounted entities. They do not include amounts relating to assets held for sale. Midstream activities
relating to the management and ownership of crude oil and natural gas pipelines, processing and export terminals and LNG processing facilities and transportation as well as downstream activities of TNK-BP are excluded. The amounts reported for
equity-accounted entities exclude the corresponding amounts for their equity-accounted entities. |
| c |
Decommissioning assets are included in capitalized costs at 31 December but are excluded from costs incurred for the year. Capitalized costs exclude balances associated with assets held for sale. |
| d |
Includes costs capitalized as a result of asset exchanges. |
| e |
Includes exploration and appraisal drilling expenditures, which are capitalized within intangible assets, and geological and geophysical exploration costs, which are charged to income as incurred. |
| f |
Presented net of transportation costs and sales taxes. |
| g |
Includes interest, non-controlling interest and the net results of equity-accounted entities, and excludes inventory holding gains and losses. |
|
|
|
| 204 |
|
BP Annual Report and Form 20-F 2013 |
Oil and natural gas exploration and production activities
– continued
|
|
|
|
|
|
|
|
|
|
|
|
|
|
|
|
|
|
|
|
|
|
|
|
|
|
|
|
|
|
|
|
|
|
|
|
|
|
|
|
|
|
|
| |
|
|
|
$ million |
|
| |
|
|
|
|
|
|
|
|
|
|
|
|
|
|
|
|
|
|
|
|
|
|
|
|
|
|
|
|
|
|
2011 |
|
| |
|
|
|
Europe
|
|
|
North
America |
|
|
South
America |
|
|
Africa
|
|
|
Asia
|
|
|
Australasia
|
|
|
Total |
|
| |
|
|
|
UK |
|
|
Rest of
Europe |
|
|
US |
|
|
Rest of
North
America |
|
|
|
|
|
|
|
|
Russia |
|
|
Rest of
Asia |
|
|
|
|
|
|
|
| Subsidiariesa |
|
|
|
|
|
|
|
|
|
|
|
|
|
|
|
|
|
|
|
|
|
|
|
|
|
|
|
|
|
|
|
|
|
|
|
|
|
|
|
|
|
|
| Capitalized costs at 31 Decemberb j |
|
|
|
|
|
|
|
|
|
|
|
|
|
|
|
|
|
|
|
|
|
|
|
|
|
|
|
|
|
|
|
|
|
|
|
|
|
| Gross capitalized costs |
|
|
|
|
|
|
|
|
|
|
|
|
|
|
|
|
|
|
|
|
|
|
|
|
|
|
|
|
|
|
|
|
|
|
|
|
|
|
|
|
|
|
| Proved properties |
|
|
|
|
37,491 |
|
|
|
8,994 |
|
|
|
73,626 |
|
|
|
1,296 |
|
|
|
7,471 |
|
|
|
29,358 |
|
|
|
– |
|
|
|
14,833 |
|
|
|
3,370 |
|
|
|
176,439 |
|
| Unproved properties |
|
|
|
|
368 |
|
|
|
180 |
|
|
|
6,198 |
|
|
|
2,017 |
|
|
|
2,986 |
|
|
|
3,689 |
|
|
|
– |
|
|
|
4,495 |
|
|
|
1,279 |
|
|
|
21,212 |
|
|
|
|
|
|
37,859 |
|
|
|
9,174 |
|
|
|
79,824 |
|
|
|
3,313 |
|
|
|
10,457 |
|
|
|
33,047 |
|
|
|
– |
|
|
|
19,328 |
|
|
|
4,649 |
|
|
|
197,651 |
|
| Accumulated depreciation |
|
|
|
|
26,953 |
|
|
|
3,715 |
|
|
|
36,009 |
|
|
|
139 |
|
|
|
3,839 |
|
|
|
14,595 |
|
|
|
– |
|
|
|
6,235 |
|
|
|
1,294 |
|
|
|
92,779 |
|
| Net capitalized costs |
|
|
|
|
10,906 |
|
|
|
5,459 |
|
|
|
43,815 |
|
|
|
3,174 |
|
|
|
6,618 |
|
|
|
18,452 |
|
|
|
– |
|
|
|
13,093 |
|
|
|
3,355 |
|
|
|
104,872 |
|
| |
|
|
|
|
|
|
|
|
|
|
|
|
|
|
|
|
|
|
|
|
|
|
|
|
|
|
|
|
|
|
|
|
|
|
|
|
|
|
|
|
|
|
| Costs incurred for the year ended 31 Decemberb
j |
|
|
|
|
|
|
|
|
|
|
|
|
|
|
|
|
|
|
|
|
|
|
|
|
|
|
|
|
|
| Acquisition of propertiesc k |
|
|
|
|
|
|
|
|
|
|
|
|
|
|
|
|
|
|
|
|
|
|
|
|
|
|
|
|
|
|
|
|
|
|
|
|
|
|
|
|
|
|
| Proved |
|
|
|
|
– |
|
|
|
– |
|
|
|
1,178 |
|
|
|
8 |
|
|
|
237 |
|
|
|
– |
|
|
|
– |
|
|
|
1,733 |
|
|
|
– |
|
|
|
3,156 |
|
| Unproved |
|
|
|
|
– |
|
|
|
1 |
|
|
|
418 |
|
|
|
– |
|
|
|
2,592 |
|
|
|
679 |
|
|
|
– |
|
|
|
3,008 |
|
|
|
– |
|
|
|
6,698 |
|
|
|
|
|
|
– |
|
|
|
1 |
|
|
|
1,596 |
|
|
|
8 |
|
|
|
2,829 |
|
|
|
679 |
|
|
|
– |
|
|
|
4,741 |
|
|
|
– |
|
|
|
9,854 |
|
| Exploration and appraisal costsd |
|
|
|
|
211 |
|
|
|
1 |
|
|
|
566 |
|
|
|
132 |
|
|
|
271 |
|
|
|
490 |
|
|
|
6 |
|
|
|
511 |
|
|
|
225 |
|
|
|
2,413 |
|
| Development |
|
|
|
|
1,361 |
|
|
|
889 |
|
|
|
3,016 |
|
|
|
227 |
|
|
|
405 |
|
|
|
2,933 |
|
|
|
– |
|
|
|
1,340 |
|
|
|
251 |
|
|
|
10,422 |
|
| Total costs |
|
|
|
|
1,572 |
|
|
|
891 |
|
|
|
5,178 |
|
|
|
367 |
|
|
|
3,505 |
|
|
|
4,102 |
|
|
|
6 |
|
|
|
6,592 |
|
|
|
476 |
|
|
|
22,689 |
|
| |
|
|
|
|
|
|
|
|
|
|
|
|
|
|
|
|
|
|
|
|
|
|
|
|
|
|
|
|
|
|
|
|
|
|
|
|
|
|
|
|
|
|
| Results of operations for the year ended 31 December |
|
|
|
|
|
|
|
|
|
|
|
|
|
|
|
|
|
|
|
|
|
|
|
|
|
|
|
|
|
| Sales and other operating revenuese |
|
|
|
|
|
|
|
|
|
|
|
|
|
|
|
|
|
|
|
|
|
|
|
|
|
|
|
|
|
|
|
|
|
|
|
|
|
|
|
|
|
|
| Third parties |
|
|
|
|
1,997 |
|
|
|
– |
|
|
|
751 |
|
|
|
25 |
|
|
|
2,263 |
|
|
|
3,353 |
|
|
|
– |
|
|
|
1,450 |
|
|
|
1,611 |
|
|
|
11,450 |
|
| Sales between businesses |
|
|
|
|
3,495 |
|
|
|
1,273 |
|
|
|
19,089 |
|
|
|
20 |
|
|
|
1,409 |
|
|
|
4,858 |
|
|
|
– |
|
|
|
10,811 |
|
|
|
967 |
|
|
|
41,922 |
|
| |
|
|
|
|
5,492 |
|
|
|
1,273 |
|
|
|
19,840 |
|
|
|
45 |
|
|
|
3,672 |
|
|
|
8,211 |
|
|
|
– |
|
|
|
12,261 |
|
|
|
2,578 |
|
|
|
53,372 |
|
| Exploration expenditure |
|
|
|
|
37 |
|
|
|
1 |
|
|
|
1,065 |
|
|
|
9 |
|
|
|
35 |
|
|
|
163 |
|
|
|
6 |
|
|
|
134 |
|
|
|
70 |
|
|
|
1,520 |
|
| Production costs |
|
|
|
|
1,372 |
|
|
|
230 |
|
|
|
3,402 |
|
|
|
66 |
|
|
|
503 |
|
|
|
1,146 |
|
|
|
4 |
|
|
|
787 |
|
|
|
194 |
|
|
|
7,704 |
|
| Production taxes |
|
|
|
|
72 |
|
|
|
– |
|
|
|
1,854 |
|
|
|
– |
|
|
|
278 |
|
|
|
– |
|
|
|
– |
|
|
|
5,956 |
|
|
|
147 |
|
|
|
8,307 |
|
| Other costs (income)f |
|
|
|
|
(1,357 |
) |
|
|
101 |
|
|
|
4,688 |
|
|
|
62 |
|
|
|
935 |
|
|
|
215 |
|
|
|
72 |
|
|
|
118 |
|
|
|
257 |
|
|
|
5,091 |
|
| Depreciation, depletion and amortization |
|
|
|
|
874 |
|
|
|
199 |
|
|
|
2,980 |
|
|
|
6 |
|
|
|
523 |
|
|
|
1,668 |
|
|
|
– |
|
|
|
1,692 |
|
|
|
172 |
|
|
|
8,114 |
|
| Impairments and (gains) losses on sale of businesses and fixed assets |
|
|
|
|
26 |
|
|
|
(64 |
) |
|
|
(492 |
) |
|
|
15 |
|
|
|
(1,085 |
) |
|
|
18 |
|
|
|
(1 |
) |
|
|
(537 |
) |
|
|
– |
|
|
|
(2,120 |
) |
| |
|
|
|
|
1,024 |
|
|
|
467 |
|
|
|
13,497 |
|
|
|
158 |
|
|
|
1,189 |
|
|
|
3,210 |
|
|
|
81 |
|
|
|
8,150 |
|
|
|
840 |
|
|
|
28,616 |
|
| Profit (loss) before taxationg |
|
|
|
|
4,468 |
|
|
|
806 |
|
|
|
6,343 |
|
|
|
(113 |
) |
|
|
2,483 |
|
|
|
5,001 |
|
|
|
(81 |
) |
|
|
4,111 |
|
|
|
1,738 |
|
|
|
24,756 |
|
| Allocable taxes |
|
|
|
|
2,483 |
|
|
|
384 |
|
|
|
2,152 |
|
|
|
(159 |
) |
|
|
1,205 |
|
|
|
2,184 |
|
|
|
(21 |
) |
|
|
1,001 |
|
|
|
677 |
|
|
|
9,906 |
|
| Results of operations |
|
|
|
|
1,985 |
|
|
|
422 |
|
|
|
4,191 |
|
|
|
46 |
|
|
|
1,278 |
|
|
|
2,817 |
|
|
|
(60 |
) |
|
|
3,110 |
|
|
|
1,061 |
|
|
|
14,850 |
|
| |
|
|
|
|
|
|
|
|
|
|
|
|
|
|
|
|
|
|
|
|
|
|
|
|
|
|
|
|
|
|
|
|
|
|
|
|
|
|
|
|
|
|
| Upstream segment and TNK-BP segment replacement cost profit before interest and tax |
|
| Exploration and production activities – subsidiaries (as above) |
|
|
|
|
4,468 |
|
|
|
806 |
|
|
|
6,343 |
|
|
|
(113 |
) |
|
|
2,483 |
|
|
|
5,001 |
|
|
|
(81 |
) |
|
|
4,111 |
|
|
|
1,738 |
|
|
|
24,756 |
|
| Midstream activities – subsidiariesh |
|
|
|
|
(118 |
) |
|
|
29 |
|
|
|
(157 |
) |
|
|
299 |
|
|
|
78 |
|
|
|
(4 |
) |
|
|
(1 |
) |
|
|
42 |
|
|
|
284 |
|
|
|
452 |
|
| Equity-accounted entitiesi |
|
|
|
|
– |
|
|
|
12 |
|
|
|
10 |
|
|
|
– |
|
|
|
525 |
|
|
|
69 |
|
|
|
4,095 |
|
|
|
573 |
|
|
|
– |
|
|
|
5,284 |
|
| Total replacement cost profit before interest and tax |
|
|
|
|
4,350 |
|
|
|
847 |
|
|
|
6,196 |
|
|
|
186 |
|
|
|
3,086 |
|
|
|
5,066 |
|
|
|
4,013 |
|
|
|
4,726 |
|
|
|
2,022 |
|
|
|
30,492 |
|
| a |
These tables contain information relating to oil and natural gas exploration and production activities of subsidiaries. They do not include any costs relating to the Gulf of Mexico oil spill. Midstream activities
relating to the management and ownership of crude oil and natural gas pipelines, processing and export terminals and LNG processing facilities and transportation are excluded. In addition, our midstream activities of marketing and trading of natural
gas, power and NGLs in the US, Canada, UK and Europe are excluded. The most significant midstream pipeline interests include the Trans-Alaska Pipeline System, the Forties Pipeline System, the Central Area Transmission System pipeline, the South
Caucasus Pipeline and the Baku-Tbilisi-Ceyhan pipeline. Major LNG activities are located in Trinidad, Indonesia and Australia and BP is also investing in the LNG business in Angola. |
| b |
Decommissioning assets are included in capitalized costs at 31 December but are excluded from costs incurred for the year. |
| c |
Includes costs capitalized as a result of asset exchanges. |
| d |
Includes exploration and appraisal drilling expenditures, which are capitalized within intangible assets, and geological and geophysical exploration costs, which are charged to income as incurred. |
| e |
Presented net of transportation costs, purchases and sales taxes. |
| f |
Includes property taxes, other government take and the fair value gain on embedded derivatives of $191 million. The UK region includes a $1,442 million gain offset by corresponding charges primarily in the US, relating
to the group self-insurance programme. The South America region includes a charge of $700 million associated with the termination of the agreement to sell our 60% interest in Pan American Energy LLC to Bridas Corporation. |
| g |
Excludes the unwinding of the discount on provisions and payables amounting to $267 million which is included in finance costs in the group income statement. |
| h |
Midstream activities exclude inventory holding gains and losses. |
| i |
The profits of equity-accounted entities are included after interest and tax. |
| j |
Excludes balances associated with assets held for sale. |
| k |
Excludes goodwill associated with business combinations. |
|
|
|
|
|
| BP Annual Report and Form 20-F 2013 |
|
|
205 |
|
Oil and natural gas exploration and production activities –
continued
|
|
|
|
|
|
|
|
|
|
|
|
|
|
|
|
|
|
|
|
|
|
|
|
|
|
|
|
|
|
|
|
|
|
|
|
|
|
|
|
|
|
|
| |
|
|
|
$ million |
|
| |
|
|
|
|
|
|
|
|
|
|
|
|
|
|
|
|
|
|
|
|
|
|
|
|
|
|
|
|
|
|
2011 |
|
| |
|
|
|
Europe
|
|
|
North
America |
|
|
South
America |
|
|
Africa
|
|
|
Asia
|
|
|
Australasia
|
|
|
Total |
|
| |
|
|
|
UK |
|
|
Rest of
Europe |
|
|
US |
|
|
Rest of
North
America |
|
|
|
|
|
|
|
|
Russia |
|
|
Rest of
Asia |
|
|
|
|
|
|
|
| Equity-accounted entities (BP
share)a |
|
|
|
|
|
|
|
|
|
|
|
|
|
|
|
|
|
|
|
|
|
|
|
|
|
|
|
|
|
|
|
|
|
|
|
|
|
|
|
|
| Capitalized costs at 31
Decemberb |
|
|
|
|
|
|
|
|
|
|
|
|
|
|
|
|
|
|
|
|
|
|
|
|
|
|
|
|
|
|
|
|
|
|
|
|
|
|
|
|
|
|
| Gross capitalized costs |
|
|
|
|
|
|
|
|
|
|
|
|
|
|
|
|
|
|
|
|
|
|
|
|
|
|
|
|
|
|
|
|
|
|
|
|
|
|
|
|
|
|
| Proved properties |
|
|
|
|
– |
|
|
|
– |
|
|
|
– |
|
|
|
– |
|
|
|
6,562 |
|
|
|
– |
|
|
|
16,214 |
|
|
|
3,571 |
|
|
|
– |
|
|
|
26,347 |
|
| Unproved properties |
|
|
|
|
– |
|
|
|
– |
|
|
|
– |
|
|
|
– |
|
|
|
19 |
|
|
|
– |
|
|
|
652 |
|
|
|
9 |
|
|
|
– |
|
|
|
680 |
|
|
|
|
|
|
– |
|
|
|
– |
|
|
|
– |
|
|
|
– |
|
|
|
6,581 |
|
|
|
– |
|
|
|
16,866 |
|
|
|
3,580 |
|
|
|
– |
|
|
|
27,027 |
|
| Accumulated depreciation |
|
|
|
|
– |
|
|
|
– |
|
|
|
– |
|
|
|
– |
|
|
|
2,644 |
|
|
|
– |
|
|
|
6,978 |
|
|
|
3,017 |
|
|
|
– |
|
|
|
12,639 |
|
| Net capitalized costs |
|
|
|
|
– |
|
|
|
– |
|
|
|
– |
|
|
|
– |
|
|
|
3,937 |
|
|
|
– |
|
|
|
9,888 |
|
|
|
563 |
|
|
|
– |
|
|
|
14,388 |
|
| |
|
|
|
|
|
|
|
|
|
|
|
|
|
|
|
|
|
|
|
|
|
|
|
|
|
|
|
|
|
|
|
|
|
|
|
|
|
|
|
|
|
|
| Costs incurred for the year ended 31
Decemberb |
|
|
|
|
|
|
|
|
|
|
|
|
|
|
|
|
|
|
|
|
|
|
|
|
|
|
|
|
|
| Acquisition of propertiesc |
|
|
|
|
|
|
|
|
|
|
|
|
|
|
|
|
|
|
|
|
|
|
|
|
|
|
|
|
|
|
|
|
|
|
|
|
|
|
|
|
|
|
| Proved |
|
|
|
|
– |
|
|
|
– |
|
|
|
– |
|
|
|
– |
|
|
|
– |
|
|
|
– |
|
|
|
– |
|
|
|
46 |
|
|
|
– |
|
|
|
46 |
|
| Unproved |
|
|
|
|
– |
|
|
|
– |
|
|
|
– |
|
|
|
– |
|
|
|
6 |
|
|
|
– |
|
|
|
37 |
|
|
|
– |
|
|
|
– |
|
|
|
43 |
|
|
|
|
|
|
– |
|
|
|
– |
|
|
|
– |
|
|
|
– |
|
|
|
6 |
|
|
|
– |
|
|
|
37 |
|
|
|
46 |
|
|
|
– |
|
|
|
89 |
|
| Exploration and appraisal costsd |
|
|
|
|
– |
|
|
|
– |
|
|
|
– |
|
|
|
– |
|
|
|
2 |
|
|
|
– |
|
|
|
167 |
|
|
|
9 |
|
|
|
– |
|
|
|
178 |
|
| Development |
|
|
|
|
– |
|
|
|
– |
|
|
|
– |
|
|
|
– |
|
|
|
587 |
|
|
|
– |
|
|
|
1,862 |
|
|
|
435 |
|
|
|
– |
|
|
|
2,884 |
|
| Total costs |
|
|
|
|
– |
|
|
|
– |
|
|
|
– |
|
|
|
– |
|
|
|
595 |
|
|
|
– |
|
|
|
2,066 |
|
|
|
490 |
|
|
|
– |
|
|
|
3,151 |
|
| |
|
|
|
|
|
|
|
|
|
|
|
|
|
|
|
|
|
|
|
|
|
|
|
|
|
|
|
|
|
|
|
|
|
|
|
|
|
|
|
|
|
|
| Results of operations for the year ended 31 December |
|
|
|
|
|
|
|
|
|
|
|
|
|
|
|
|
|
|
|
|
|
|
|
|
|
|
|
|
|
| Sales and other operating revenuese |
|
|
|
|
|
|
|
|
|
|
|
|
|
|
|
|
|
|
|
|
|
|
|
|
|
|
|
|
|
|
|
|
|
|
|
|
|
|
|
|
|
|
| Third parties |
|
|
|
|
– |
|
|
|
– |
|
|
|
– |
|
|
|
– |
|
|
|
2,381 |
|
|
|
– |
|
|
|
7,380 |
|
|
|
3,828 |
|
|
|
– |
|
|
|
13,589 |
|
| Sales between businesses |
|
|
|
|
– |
|
|
|
– |
|
|
|
– |
|
|
|
– |
|
|
|
– |
|
|
|
– |
|
|
|
5,149 |
|
|
|
23 |
|
|
|
– |
|
|
|
5,172 |
|
| |
|
|
|
|
– |
|
|
|
– |
|
|
|
– |
|
|
|
– |
|
|
|
2,381 |
|
|
|
– |
|
|
|
12,529 |
|
|
|
3,851 |
|
|
|
– |
|
|
|
18,761 |
|
| Exploration expenditure |
|
|
|
|
– |
|
|
|
– |
|
|
|
– |
|
|
|
– |
|
|
|
10 |
|
|
|
– |
|
|
|
72 |
|
|
|
1 |
|
|
|
– |
|
|
|
83 |
|
| Production costs |
|
|
|
|
– |
|
|
|
– |
|
|
|
– |
|
|
|
– |
|
|
|
459 |
|
|
|
– |
|
|
|
1,846 |
|
|
|
212 |
|
|
|
– |
|
|
|
2,517 |
|
| Production taxes |
|
|
|
|
– |
|
|
|
– |
|
|
|
– |
|
|
|
– |
|
|
|
1,098 |
|
|
|
– |
|
|
|
5,000 |
|
|
|
3,125 |
|
|
|
– |
|
|
|
9,223 |
|
| Other costs (income) |
|
|
|
|
– |
|
|
|
– |
|
|
|
– |
|
|
|
– |
|
|
|
(239 |
) |
|
|
– |
|
|
|
2 |
|
|
|
(1 |
) |
|
|
– |
|
|
|
(238 |
) |
| Depreciation, depletion and amortization |
|
|
|
|
– |
|
|
|
– |
|
|
|
– |
|
|
|
– |
|
|
|
329 |
|
|
|
– |
|
|
|
988 |
|
|
|
431 |
|
|
|
– |
|
|
|
1,748 |
|
| Impairments and (gains) losses on sale of businesses and fixed assets |
|
|
|
|
– |
|
|
|
– |
|
|
|
– |
|
|
|
– |
|
|
|
– |
|
|
|
– |
|
|
|
– |
|
|
|
– |
|
|
|
– |
|
|
|
– |
|
| |
|
|
|
|
– |
|
|
|
– |
|
|
|
– |
|
|
|
– |
|
|
|
1,657 |
|
|
|
– |
|
|
|
7,908 |
|
|
|
3,768 |
|
|
|
– |
|
|
|
13,333 |
|
| Profit (loss) before taxation |
|
|
|
|
– |
|
|
|
– |
|
|
|
– |
|
|
|
– |
|
|
|
724 |
|
|
|
– |
|
|
|
4,621 |
|
|
|
83 |
|
|
|
– |
|
|
|
5,428 |
|
| Allocable taxes |
|
|
|
|
– |
|
|
|
– |
|
|
|
– |
|
|
|
– |
|
|
|
294 |
|
|
|
– |
|
|
|
806 |
|
|
|
19 |
|
|
|
– |
|
|
|
1,119 |
|
| Results of operations |
|
|
|
|
– |
|
|
|
– |
|
|
|
– |
|
|
|
– |
|
|
|
430 |
|
|
|
– |
|
|
|
3,815 |
|
|
|
64 |
|
|
|
– |
|
|
|
4,309 |
|
|
|
|
|
|
|
|
|
|
|
|
|
|
|
|
|
|
|
|
|
|
|
|
|
|
|
|
|
|
|
| Exploration and production activities – equity-accounted entities after tax (as above) |
|
|
|
|
– |
|
|
|
– |
|
|
|
– |
|
|
|
– |
|
|
|
430 |
|
|
|
– |
|
|
|
3,815 |
|
|
|
64 |
|
|
|
– |
|
|
|
4,309 |
|
| Midstream and other activities after taxf |
|
|
|
|
– |
|
|
|
12 |
|
|
|
10 |
|
|
|
– |
|
|
|
95 |
|
|
|
69 |
|
|
|
280 |
|
|
|
509 |
|
|
|
– |
|
|
|
975 |
|
| Total replacement cost profit after interest and tax |
|
|
|
|
– |
|
|
|
12 |
|
|
|
10 |
|
|
|
– |
|
|
|
525 |
|
|
|
69 |
|
|
|
4,095 |
|
|
|
573 |
|
|
|
– |
|
|
|
5,284 |
|
| a |
These tables contain information relating to oil and natural gas exploration and production activities of equity-accounted entities. They do not include amounts relating to assets held for sale. Midstream activities
relating to the management and ownership of crude oil and natural gas pipelines, processing and export terminals and LNG processing facilities and transportation as well as downstream activities of TNK-BP are excluded. The amounts reported for
equity-accounted entities exclude the corresponding amounts for their equity-accounted entities. |
| b |
Decommissioning assets are included in capitalized costs at 31 December but are excluded from costs incurred for the year. |
| c |
Includes costs capitalized as a result of asset exchanges. |
| d |
Includes exploration and appraisal drilling expenditures, which are capitalized within intangible assets, and geological and geophysical exploration costs, which are charged to income as incurred. |
| e |
Presented net of transportation costs and sales taxes. |
| f |
Includes interest, non-controlling interest and the net results of equity-accounted entities, and excludes inventory holding gains and losses |
|
|
|
| 206 |
|
BP Annual Report and Form 20-F 2013 |
Movements in estimated net proved
reserves
|
|
|
|
|
|
|
|
|
|
|
|
|
|
|
|
|
|
|
|
|
|
|
|
|
|
|
|
|
|
|
|
|
|
|
|
|
|
|
|
|
|
|
| |
|
|
|
million barrels |
|
| Crude oila |
|
|
|
|
|
|
|
|
|
|
|
|
|
|
|
|
|
|
|
|
|
|
|
|
|
|
|
|
|
|
2013 |
|
| |
|
|
|
Europe
|
|
|
North
America |
|
|
South
America |
|
|
Africa
|
|
|
Asia
|
|
|
Australasia
|
|
|
Total |
|
| |
|
|
|
UK |
|
|
Rest of
Europe |
|
|
USb |
|
|
Rest of
North
America |
|
|
|
|
|
|
|
|
Russia |
|
|
Rest of
Asia |
|
|
|
|
|
|
|
| Subsidiaries |
|
|
|
|
|
|
|
|
|
|
|
|
|
|
|
|
|
|
|
|
|
|
|
|
|
|
|
|
|
|
|
|
|
|
|
|
|
|
|
|
|
|
| At 1 January 2013 |
|
|
|
|
|
|
|
|
|
|
|
|
|
|
|
|
|
|
|
|
|
|
|
|
|
|
|
|
|
|
|
|
|
|
|
|
|
|
|
|
|
|
| Developed |
|
|
|
|
242 |
|
|
|
170 |
|
|
|
1,443 |
|
|
|
– |
|
|
|
22 |
|
|
|
312 |
|
|
|
– |
|
|
|
268 |
|
|
|
52 |
|
|
|
2,509 |
|
| Undeveloped |
|
|
|
|
431 |
|
|
|
79 |
|
|
|
989 |
|
|
|
– |
|
|
|
32 |
|
|
|
255 |
|
|
|
– |
|
|
|
137 |
|
|
|
45 |
|
|
|
1,968 |
|
| |
|
|
|
|
673 |
|
|
|
249 |
|
|
|
2,432 |
|
|
|
– |
|
|
|
54 |
|
|
|
567 |
|
|
|
– |
|
|
|
405 |
|
|
|
97 |
|
|
|
4,477 |
|
| Changes attributable to |
|
|
|
|
|
|
|
|
|
|
|
|
|
|
|
|
|
|
|
|
|
|
|
|
|
|
|
|
|
|
|
|
|
|
|
|
|
|
|
|
|
|
| Revisions of previous estimates |
|
|
|
|
(78 |
) |
|
|
(19 |
) |
|
|
(141 |
) |
|
|
– |
|
|
|
30 |
|
|
|
26 |
|
|
|
– |
|
|
|
65 |
|
|
|
(12 |
) |
|
|
(129 |
) |
| Improved recovery |
|
|
|
|
12 |
|
|
|
– |
|
|
|
52 |
|
|
|
– |
|
|
|
1 |
|
|
|
2 |
|
|
|
– |
|
|
|
65 |
|
|
|
– |
|
|
|
132 |
|
| Purchases of reserves-in-place |
|
|
|
|
– |
|
|
|
– |
|
|
|
– |
|
|
|
– |
|
|
|
– |
|
|
|
– |
|
|
|
– |
|
|
|
– |
|
|
|
– |
|
|
|
– |
|
| Discoveries and extensions |
|
|
|
|
– |
|
|
|
– |
|
|
|
4 |
|
|
|
– |
|
|
|
– |
|
|
|
– |
|
|
|
– |
|
|
|
39 |
|
|
|
3 |
|
|
|
46 |
|
| Productionc |
|
|
|
|
(22 |
) |
|
|
(12 |
) |
|
|
(132 |
) |
|
|
– |
|
|
|
(11 |
) |
|
|
(80 |
) |
|
|
– |
|
|
|
(52 |
) |
|
|
(9 |
) |
|
|
(318 |
) |
| Sales of reserves-in-place |
|
|
|
|
(36 |
) |
|
|
– |
|
|
|
(11 |
) |
|
|
– |
|
|
|
– |
|
|
|
– |
|
|
|
– |
|
|
|
– |
|
|
|
– |
|
|
|
(47 |
) |
| |
|
|
|
|
(124 |
) |
|
|
(31 |
) |
|
|
(228 |
) |
|
|
– |
|
|
|
20 |
|
|
|
(52 |
) |
|
|
– |
|
|
|
117 |
|
|
|
(18 |
) |
|
|
(316 |
) |
| At 31 December 2013d |
|
|
|
|
|
|
|
|
|
|
|
|
|
|
|
|
|
|
|
|
|
|
|
|
|
|
|
|
|
|
|
|
|
|
|
|
|
|
|
|
|
|
| Developed |
|
|
|
|
169 |
|
|
|
163 |
|
|
|
1,297 |
|
|
|
– |
|
|
|
29 |
|
|
|
320 |
|
|
|
– |
|
|
|
320 |
|
|
|
57 |
|
|
|
2,355 |
|
| Undeveloped |
|
|
|
|
380 |
|
|
|
55 |
|
|
|
907 |
|
|
|
– |
|
|
|
45 |
|
|
|
195 |
|
|
|
– |
|
|
|
202 |
|
|
|
22 |
|
|
|
1,806 |
|
| |
|
|
|
|
549 |
|
|
|
218 |
|
|
|
2,204 |
|
|
|
– |
|
|
|
74 |
|
|
|
515 |
|
|
|
– |
|
|
|
522 |
|
|
|
79 |
|
|
|
4,161 |
|
| Equity-accounted entities (BP share)e |
|
|
|
|
|
|
|
|
|
|
|
|
|
|
|
|
|
|
|
|
|
|
|
|
|
|
|
|
|
|
|
|
|
|
|
|
|
|
|
|
|
|
| At 1 January 2013 |
|
|
|
|
|
|
|
|
|
|
|
|
|
|
|
|
|
|
|
|
|
|
|
|
|
|
|
|
|
|
|
|
|
|
|
|
|
|
|
|
|
|
| Developed |
|
|
|
|
– |
|
|
|
– |
|
|
|
– |
|
|
|
– |
|
|
|
339 |
|
|
|
12 |
|
|
|
2,492 |
|
|
|
198 |
|
|
|
– |
|
|
|
3,041 |
|
| Undeveloped |
|
|
|
|
– |
|
|
|
– |
|
|
|
– |
|
|
|
– |
|
|
|
351 |
|
|
|
11 |
|
|
|
1,962 |
|
|
|
13 |
|
|
|
– |
|
|
|
2,337 |
|
| |
|
|
|
|
– |
|
|
|
– |
|
|
|
– |
|
|
|
– |
|
|
|
690 |
|
|
|
23 |
|
|
|
4,454 |
|
|
|
211 |
|
|
|
– |
|
|
|
5,378 |
|
| Changes attributable to |
|
|
|
|
|
|
|
|
|
|
|
|
|
|
|
|
|
|
|
|
|
|
|
|
|
|
|
|
|
|
|
|
|
|
|
|
|
|
|
|
|
|
| Revisions of previous estimates |
|
|
|
|
– |
|
|
|
– |
|
|
|
– |
|
|
|
1 |
|
|
|
(21 |
) |
|
|
(3 |
) |
|
|
384 |
|
|
|
1 |
|
|
|
– |
|
|
|
362 |
|
| Improved recovery |
|
|
|
|
– |
|
|
|
– |
|
|
|
– |
|
|
|
– |
|
|
|
27 |
|
|
|
– |
|
|
|
– |
|
|
|
– |
|
|
|
– |
|
|
|
27 |
|
| Purchases of reserves-in-place |
|
|
|
|
– |
|
|
|
– |
|
|
|
– |
|
|
|
– |
|
|
|
34 |
|
|
|
– |
|
|
|
4,579 |
|
|
|
– |
|
|
|
– |
|
|
|
4,613 |
|
| Discoveries and extensions |
|
|
|
|
– |
|
|
|
– |
|
|
|
– |
|
|
|
– |
|
|
|
12 |
|
|
|
– |
|
|
|
228 |
|
|
|
– |
|
|
|
– |
|
|
|
240 |
|
| Production |
|
|
|
|
– |
|
|
|
– |
|
|
|
– |
|
|
|
– |
|
|
|
(27 |
) |
|
|
– |
|
|
|
(303 |
) |
|
|
(85 |
) |
|
|
– |
|
|
|
(415 |
) |
| Sales of reserves-in-place |
|
|
|
|
– |
|
|
|
– |
|
|
|
– |
|
|
|
– |
|
|
|
(85 |
) |
|
|
– |
|
|
|
(4,399 |
) |
|
|
– |
|
|
|
– |
|
|
|
(4,484 |
) |
| |
|
|
|
|
– |
|
|
|
– |
|
|
|
– |
|
|
|
1 |
|
|
|
(60 |
) |
|
|
(3 |
) |
|
|
489 |
|
|
|
(84 |
) |
|
|
– |
|
|
|
343 |
|
| At 31 December 2013f g |
|
|
|
|
|
|
|
|
|
|
|
|
|
|
|
|
|
|
|
|
|
|
|
|
|
|
|
|
|
|
|
|
|
|
|
|
|
|
|
|
|
|
| Developed |
|
|
|
|
– |
|
|
|
– |
|
|
|
– |
|
|
|
– |
|
|
|
316 |
|
|
|
10 |
|
|
|
3,064 |
|
|
|
120 |
|
|
|
– |
|
|
|
3,510 |
|
| Undeveloped |
|
|
|
|
– |
|
|
|
– |
|
|
|
– |
|
|
|
1 |
|
|
|
314 |
|
|
|
10 |
|
|
|
1,879 |
|
|
|
7 |
|
|
|
– |
|
|
|
2,211 |
|
| |
|
|
|
|
– |
|
|
|
– |
|
|
|
– |
|
|
|
1 |
|
|
|
630 |
|
|
|
20 |
|
|
|
4,943 |
|
|
|
127 |
|
|
|
– |
|
|
|
5,721 |
|
| Total subsidiaries and equity-accounted entities (BP share) |
|
|
|
|
|
|
|
|
|
|
|
|
|
|
|
|
|
|
|
|
|
|
|
|
|
| At 1 January 2013 |
|
|
|
|
|
|
|
|
|
|
|
|
|
|
|
|
|
|
|
|
|
|
|
|
|
|
|
|
|
|
|
|
|
|
|
|
|
|
|
|
|
|
| Developed |
|
|
|
|
242 |
|
|
|
170 |
|
|
|
1,443 |
|
|
|
– |
|
|
|
361 |
|
|
|
324 |
|
|
|
2,492 |
|
|
|
466 |
|
|
|
52 |
|
|
|
5,550 |
|
| Undeveloped |
|
|
|
|
431 |
|
|
|
79 |
|
|
|
989 |
|
|
|
– |
|
|
|
383 |
|
|
|
266 |
|
|
|
1,962 |
|
|
|
150 |
|
|
|
45 |
|
|
|
4,305 |
|
| |
|
|
|
|
673 |
|
|
|
249 |
|
|
|
2,432 |
|
|
|
– |
|
|
|
744 |
|
|
|
590 |
|
|
|
4,454 |
|
|
|
616 |
|
|
|
97 |
|
|
|
9,855 |
|
| At 31 December 2013 |
|
|
|
|
|
|
|
|
|
|
|
|
|
|
|
|
|
|
|
|
|
|
|
|
|
|
|
|
|
|
|
|
|
|
|
|
|
|
|
|
|
|
| Developed |
|
|
|
|
169 |
|
|
|
163 |
|
|
|
1,297 |
|
|
|
– |
|
|
|
345 |
|
|
|
330 |
|
|
|
3,064 |
|
|
|
440 |
|
|
|
57 |
|
|
|
5,865 |
|
| Undeveloped |
|
|
|
|
380 |
|
|
|
55 |
|
|
|
907 |
|
|
|
1 |
|
|
|
359 |
|
|
|
205 |
|
|
|
1,879 |
|
|
|
209 |
|
|
|
22 |
|
|
|
4,017 |
|
| |
|
|
|
|
549 |
|
|
|
218 |
|
|
|
2,204 |
|
|
|
1 |
|
|
|
704 |
|
|
|
535 |
|
|
|
4,943 |
|
|
|
649 |
|
|
|
79 |
|
|
|
9,882 |
|
| a |
Crude oil includes NGLs and condensate. Proved reserves exclude royalties due to others, whether payable in cash or in kind, where the royalty owner has a direct
interest in the underlying production and the option and ability to make lifting and sales arrangements independently. |
| b |
Proved reserves in the Prudhoe Bay field in Alaska include an estimated 72 million barrels upon which a net profits royalty will be payable over the life of the field under the terms of the BP Prudhoe Bay Royalty
Trust. |
| c |
Excludes NGLs from processing plants in which an interest is held of 5,500 barrels per day. |
| d |
Includes 551 million barrels of NGLs. Also includes 21 million barrels of crude oil in respect of the 30% non-controlling interest in BP Trinidad and Tobago
LLC. |
| e |
Volumes of equity-accounted entities include volumes of equity-accounted investments of those entities. |
| f |
Includes 131 million barrels of NGLs. Also includes 23 million barrels of crude oil in respect of the 0.47% non-controlling interest in Rosneft. |
| g |
Total proved liquid reserves held as part of our equity interest in Rosneft is 4,975 million barrels, comprising less than 1 mmboe in Vietnam and Canada,
32 million barrels in Venezuela and 4,943 million barrels in Russia. |
|
|
|
|
|
| BP Annual Report and Form 20-F 2013 |
|
|
207 |
|
Movements in estimated net proved reserves – continued
|
|
|
|
|
|
|
|
|
|
|
|
|
|
|
|
|
|
|
|
|
|
|
|
|
|
|
|
|
|
|
|
|
|
|
|
|
|
|
|
|
|
|
| |
|
|
|
|
|
|
billion cubic feet |
|
| Natural
gasa |
|
|
|
|
|
|
|
|
|
|
|
|
|
|
|
|
|
|
|
|
|
|
|
|
|
|
|
|
|
|
2013 |
|
| |
|
|
|
Europe
|
|
|
North
America |
|
|
South
America |
|
|
Africa
|
|
|
Asia
|
|
|
Australasia
|
|
|
Total |
|
| |
|
|
|
UK |
|
|
Rest of
Europe |
|
|
US |
|
|
Rest of
North
America |
|
|
|
|
|
|
|
|
Russia |
|
|
Rest of
Asia |
|
|
|
|
|
|
|
| Subsidiaries |
|
|
|
|
|
|
|
|
|
|
|
|
|
|
|
|
|
|
|
|
|
|
|
|
|
|
|
|
|
|
|
|
|
|
|
|
|
|
|
|
|
|
| At 1 January 2013 |
|
|
|
|
|
|
|
|
|
|
|
|
|
|
|
|
|
|
|
|
|
|
|
|
|
|
|
|
|
|
|
|
|
|
|
|
|
|
|
|
|
|
| Developed |
|
|
|
|
1,038 |
|
|
|
340 |
|
|
|
8,245 |
|
|
|
4 |
|
|
|
3,588 |
|
|
|
1,139 |
|
|
|
– |
|
|
|
926 |
|
|
|
3,282 |
|
|
|
18,562 |
|
| Undeveloped |
|
|
|
|
666 |
|
|
|
141 |
|
|
|
2,986 |
|
|
|
– |
|
|
|
6,250 |
|
|
|
1,923 |
|
|
|
– |
|
|
|
413 |
|
|
|
2,323 |
|
|
|
14,702 |
|
| |
|
|
|
|
1,704 |
|
|
|
481 |
|
|
|
11,231 |
|
|
|
4 |
|
|
|
9,838 |
|
|
|
3,062 |
|
|
|
– |
|
|
|
1,339 |
|
|
|
5,605 |
|
|
|
33,264 |
|
| Changes attributable to |
|
|
|
|
|
|
|
|
|
|
|
|
|
|
|
|
|
|
|
|
|
|
|
|
|
|
|
|
|
|
|
|
|
|
|
|
|
|
|
|
|
|
| Revisions of previous estimates |
|
|
|
|
(62 |
) |
|
|
(47 |
) |
|
|
(1,166 |
) |
|
|
10 |
|
|
|
62 |
|
|
|
(138 |
) |
|
|
– |
|
|
|
2,148 |
|
|
|
(140 |
) |
|
|
667 |
|
| Improved recovery |
|
|
|
|
49 |
|
|
|
– |
|
|
|
630 |
|
|
|
– |
|
|
|
144 |
|
|
|
28 |
|
|
|
– |
|
|
|
94 |
|
|
|
– |
|
|
|
945 |
|
| Purchases of reserves-in-place |
|
|
|
|
9 |
|
|
|
– |
|
|
|
– |
|
|
|
– |
|
|
|
– |
|
|
|
– |
|
|
|
– |
|
|
|
– |
|
|
|
– |
|
|
|
9 |
|
| Discoveries and extensions |
|
|
|
|
– |
|
|
|
– |
|
|
|
39 |
|
|
|
– |
|
|
|
– |
|
|
|
55 |
|
|
|
– |
|
|
|
1,875 |
|
|
|
511 |
|
|
|
2,480 |
|
| Productionb |
|
|
|
|
(66 |
) |
|
|
(31 |
) |
|
|
(635 |
) |
|
|
(4 |
) |
|
|
(819 |
) |
|
|
(239 |
) |
|
|
– |
|
|
|
(199 |
) |
|
|
(289 |
) |
|
|
(2,282 |
) |
| Sales of reserves-in-place |
|
|
|
|
(677 |
) |
|
|
– |
|
|
|
(152 |
) |
|
|
– |
|
|
|
– |
|
|
|
– |
|
|
|
– |
|
|
|
(67 |
) |
|
|
– |
|
|
|
(896 |
) |
| |
|
|
|
|
(747 |
) |
|
|
(78 |
) |
|
|
(1,284 |
) |
|
|
6 |
|
|
|
(613 |
) |
|
|
(294 |
) |
|
|
– |
|
|
|
3,851 |
|
|
|
82 |
|
|
|
923 |
|
| At 31 December 2013c |
|
|
|
|
|
|
|
|
|
|
|
|
|
|
|
|
|
|
|
|
|
|
|
|
|
|
|
|
|
|
|
|
|
|
|
|
|
|
|
|
|
|
| Developed |
|
|
|
|
643 |
|
|
|
364 |
|
|
|
7,122 |
|
|
|
10 |
|
|
|
3,109 |
|
|
|
961 |
|
|
|
– |
|
|
|
1,519 |
|
|
|
3,932 |
|
|
|
17,660 |
|
| Undeveloped |
|
|
|
|
314 |
|
|
|
39 |
|
|
|
2,825 |
|
|
|
– |
|
|
|
6,116 |
|
|
|
1,807 |
|
|
|
– |
|
|
|
3,671 |
|
|
|
1,755 |
|
|
|
16,527 |
|
| |
|
|
|
|
957 |
|
|
|
403 |
|
|
|
9,947 |
|
|
|
10 |
|
|
|
9,225 |
|
|
|
2,768 |
|
|
|
– |
|
|
|
5,190 |
|
|
|
5,687 |
|
|
|
34,187 |
|
| Equity-accounted entities (BP share)d |
|
|
|
|
|
|
|
|
|
|
|
|
|
|
|
|
|
|
|
|
|
|
|
|
|
|
|
|
|
|
|
|
|
|
|
|
|
|
|
|
|
|
| At 1 January 2013 |
|
|
|
|
|
|
|
|
|
|
|
|
|
|
|
|
|
|
|
|
|
|
|
|
|
|
|
|
|
|
|
|
|
|
|
|
|
|
|
|
|
|
| Developed |
|
|
|
|
– |
|
|
|
– |
|
|
|
– |
|
|
|
– |
|
|
|
1,276 |
|
|
|
175 |
|
|
|
2,617 |
|
|
|
128 |
|
|
|
– |
|
|
|
4,196 |
|
| Undeveloped |
|
|
|
|
– |
|
|
|
– |
|
|
|
– |
|
|
|
– |
|
|
|
904 |
|
|
|
164 |
|
|
|
1,759 |
|
|
|
18 |
|
|
|
– |
|
|
|
2,845 |
|
| |
|
|
|
|
– |
|
|
|
– |
|
|
|
– |
|
|
|
– |
|
|
|
2,180 |
|
|
|
339 |
|
|
|
4,376 |
|
|
|
146 |
|
|
|
– |
|
|
|
7,041 |
|
| Changes attributable to |
|
|
|
|
|
|
|
|
|
|
|
|
|
|
|
|
|
|
|
|
|
|
|
|
|
|
|
|
|
|
|
|
|
|
|
|
|
|
|
|
|
|
| Revisions of previous estimates |
|
|
|
|
– |
|
|
|
– |
|
|
|
– |
|
|
|
1 |
|
|
|
3 |
|
|
|
29 |
|
|
|
685 |
|
|
|
1 |
|
|
|
– |
|
|
|
719 |
|
| Improved recovery |
|
|
|
|
– |
|
|
|
– |
|
|
|
– |
|
|
|
– |
|
|
|
64 |
|
|
|
– |
|
|
|
– |
|
|
|
3 |
|
|
|
– |
|
|
|
67 |
|
| Purchases of reserves-in-place |
|
|
|
|
– |
|
|
|
– |
|
|
|
– |
|
|
|
– |
|
|
|
14 |
|
|
|
– |
|
|
|
8,871 |
|
|
|
33 |
|
|
|
– |
|
|
|
8,918 |
|
| Discoveries and extensions |
|
|
|
|
– |
|
|
|
– |
|
|
|
– |
|
|
|
– |
|
|
|
51 |
|
|
|
– |
|
|
|
254 |
|
|
|
– |
|
|
|
– |
|
|
|
305 |
|
| Productionb |
|
|
|
|
– |
|
|
|
– |
|
|
|
– |
|
|
|
– |
|
|
|
(163 |
) |
|
|
(3 |
) |
|
|
(292 |
) |
|
|
(23 |
) |
|
|
– |
|
|
|
(481 |
) |
| Sales of reserves-in-place |
|
|
|
|
– |
|
|
|
– |
|
|
|
– |
|
|
|
– |
|
|
|
(38 |
) |
|
|
– |
|
|
|
(4,669 |
) |
|
|
(74 |
) |
|
|
– |
|
|
|
(4,781 |
) |
| |
|
|
|
|
– |
|
|
|
– |
|
|
|
– |
|
|
|
1 |
|
|
|
(69 |
) |
|
|
26 |
|
|
|
4,849 |
|
|
|
(60 |
) |
|
|
– |
|
|
|
4,747 |
|
| At 31 December 2013e f |
|
|
|
|
|
|
|
|
|
|
|
|
|
|
|
|
|
|
|
|
|
|
|
|
|
|
|
|
|
|
|
|
|
|
|
|
|
|
|
|
|
|
| Developed |
|
|
|
|
– |
|
|
|
– |
|
|
|
– |
|
|
|
– |
|
|
|
1,364 |
|
|
|
230 |
|
|
|
4,171 |
|
|
|
72 |
|
|
|
– |
|
|
|
5,837 |
|
| Undeveloped |
|
|
|
|
– |
|
|
|
– |
|
|
|
– |
|
|
|
1 |
|
|
|
747 |
|
|
|
135 |
|
|
|
5,054 |
|
|
|
14 |
|
|
|
– |
|
|
|
5,951 |
|
| |
|
|
|
|
– |
|
|
|
– |
|
|
|
– |
|
|
|
1 |
|
|
|
2,111 |
|
|
|
365 |
|
|
|
9,225 |
|
|
|
86 |
|
|
|
– |
|
|
|
11,788 |
|
| Total subsidiaries and equity-accounted entities
(BP share) |
|
|
|
|
|
|
|
|
|
|
|
|
|
|
|
|
|
|
|
|
|
|
|
|
|
|
|
|
|
|
|
|
|
| At 1 January 2013 |
|
|
|
|
|
|
|
|
|
|
|
|
|
|
|
|
|
|
|
|
|
|
|
|
|
|
|
|
|
|
|
|
|
|
|
|
|
|
|
|
|
|
| Developed |
|
|
|
|
1,038 |
|
|
|
340 |
|
|
|
8,245 |
|
|
|
4 |
|
|
|
4,864 |
|
|
|
1,314 |
|
|
|
2,617 |
|
|
|
1,054 |
|
|
|
3,282 |
|
|
|
22,758 |
|
| Undeveloped |
|
|
|
|
666 |
|
|
|
141 |
|
|
|
2,986 |
|
|
|
– |
|
|
|
7,154 |
|
|
|
2,087 |
|
|
|
1,759 |
|
|
|
431 |
|
|
|
2,323 |
|
|
|
17,547 |
|
| |
|
|
|
|
1,704 |
|
|
|
481 |
|
|
|
11,231 |
|
|
|
4 |
|
|
|
12,018 |
|
|
|
3,401 |
|
|
|
4,376 |
|
|
|
1,485 |
|
|
|
5,605 |
|
|
|
40,305 |
|
| At 31 December 2013 |
|
|
|
|
|
|
|
|
|
|
|
|
|
|
|
|
|
|
|
|
|
|
|
|
|
|
|
|
|
|
|
|
|
|
|
|
|
|
|
|
|
|
| Developed |
|
|
|
|
643 |
|
|
|
364 |
|
|
|
7,122 |
|
|
|
10 |
|
|
|
4,473 |
|
|
|
1,191 |
|
|
|
4,171 |
|
|
|
1,591 |
|
|
|
3,932 |
|
|
|
23,497 |
|
| Undeveloped |
|
|
|
|
314 |
|
|
|
39 |
|
|
|
2,825 |
|
|
|
1 |
|
|
|
6,863 |
|
|
|
1,942 |
|
|
|
5,054 |
|
|
|
3,685 |
|
|
|
1,755 |
|
|
|
22,478 |
|
| |
|
|
|
|
957 |
|
|
|
403 |
|
|
|
9,947 |
|
|
|
11 |
|
|
|
11,336 |
|
|
|
3,133 |
|
|
|
9,225 |
|
|
|
5,276 |
|
|
|
5,687 |
|
|
|
45,975 |
|
| a |
Proved reserves exclude royalties due to others, whether payable in cash or in kind, where the royalty owner has a direct interest in the underlying production and
the option and ability to make lifting and sales arrangements independently. |
| b |
Includes 180 billion cubic feet of natural gas consumed in operations, 149 billion cubic feet in subsidiaries, 31 billion cubic feet in equity-accounted entities. |
| c |
Includes 2,685 billion cubic feet of natural gas in respect of the 30% non-controlling interest in BP Trinidad and Tobago LLC. |
| d |
Volumes of equity-accounted entities include volumes of equity-accounted investments of those entities. |
| e |
Includes 41 billion cubic feet of natural gas in respect of the 0.44% non-controlling interest in Rosneft. |
| f |
Total proved gas reserves held as part of our equity interest in Rosneft is 9,271 billion cubic feet, comprising 1 billion cubic feet in Canada, 14 billion cubic feet
in Venezuela, 31 billion cubic feet in Vietnam and 9,225 billion cubic feet in Russia. |
|
|
|
| 208 |
|
BP Annual Report and Form 20-F 2013 |
Movements in estimated net proved reserves – continued
|
|
|
|
|
|
|
|
|
|
|
| |
|
|
|
|
million barrels |
|
| Bitumena |
|
|
|
|
|
|
|
|
2013 |
|
| |
|
|
|
|
Rest of
North
America |
|
|
|
Total |
|
| Subsidiaries |
|
|
|
|
|
|
|
|
|
|
| At 1 January 2013 |
|
|
|
|
|
|
|
|
|
|
| Developed |
|
|
|
|
– |
|
|
|
– |
|
| Undeveloped |
|
|
|
|
195 |
|
|
|
195 |
|
| |
|
|
|
|
195 |
|
|
|
195 |
|
| Changes attributable to |
|
|
|
|
|
|
|
|
|
|
| Revisions of previous estimates |
|
|
|
|
(7 |
) |
|
|
(7 |
) |
| Improved recovery |
|
|
|
|
– |
|
|
|
– |
|
| Purchases of reserves-in-place |
|
|
|
|
– |
|
|
|
– |
|
| Discoveries and extensions |
|
|
|
|
– |
|
|
|
– |
|
| Production |
|
|
|
|
– |
|
|
|
– |
|
| Sales of reserves-in-place |
|
|
|
|
– |
|
|
|
– |
|
| |
|
|
|
|
(7 |
) |
|
|
(7 |
) |
| At 31 December 2013 |
|
|
|
|
|
|
|
|
|
|
| Developed |
|
|
|
|
– |
|
|
|
– |
|
| Undeveloped |
|
|
|
|
188 |
|
|
|
188 |
|
| |
|
|
|
|
188 |
|
|
|
188 |
|
| a |
Proved reserves exclude royalties due to others, whether payable in cash or in kind, where the royalty owner has a direct interest in the underlying production and
the option and ability to make lifting and sales arrangements independently. |
|
|
|
|
|
| BP Annual Report and Form 20-F 2013 |
|
|
209 |
|
Movements in estimated net proved reserves – continued
|
|
|
|
|
|
|
|
|
|
|
|
|
|
|
|
|
|
|
|
|
|
|
|
|
|
|
|
|
|
|
|
|
|
|
|
|
|
|
|
|
|
|
| |
|
|
|
million barrels of oil equivalentb |
|
| Total hydrocarbonsa |
|
|
|
|
|
|
|
|
|
|
|
|
|
|
|
|
|
|
|
|
|
|
|
|
|
|
|
2013 |
|
| |
|
|
|
Europe
|
|
|
North
America |
|
|
South
America |
|
|
Africa
|
|
|
Asia
|
|
|
Australasia
|
|
|
Total |
|
| |
|
|
|
UK |
|
|
Rest of
Europe |
|
|
USc |
|
|
Rest of
North
America |
|
|
|
|
|
|
|
|
Russia |
|
|
Rest of
Asia |
|
|
|
|
|
|
|
| Subsidiaries |
|
|
|
|
|
|
|
|
|
|
|
|
|
|
|
|
|
|
|
|
|
|
|
|
|
|
|
|
|
|
|
|
|
| At 1 January 2013 |
|
|
|
|
|
|
|
|
|
|
|
|
|
|
|
|
|
|
|
|
|
|
|
|
|
|
|
|
|
|
|
|
|
|
|
|
|
|
|
|
|
|
| Developed |
|
|
|
|
421 |
|
|
|
229 |
|
|
|
2,865 |
|
|
|
1 |
|
|
|
640 |
|
|
|
508 |
|
|
|
– |
|
|
|
427 |
|
|
|
618 |
|
|
|
5,709 |
|
| Undeveloped |
|
|
|
|
546 |
|
|
|
103 |
|
|
|
1,504 |
|
|
|
195 |
|
|
|
1,110 |
|
|
|
587 |
|
|
|
– |
|
|
|
209 |
|
|
|
445 |
|
|
|
4,699 |
|
| |
|
|
|
|
967 |
|
|
|
332 |
|
|
|
4,369 |
|
|
|
196 |
|
|
|
1,750 |
|
|
|
1,095 |
|
|
|
– |
|
|
|
636 |
|
|
|
1,063 |
|
|
|
10,408 |
|
| Changes attributable to |
|
|
|
|
|
|
|
|
|
|
|
|
|
|
|
|
|
|
|
|
|
|
|
|
|
|
|
|
|
|
|
|
|
|
|
|
|
|
|
|
|
|
| Revisions of previous estimates |
|
|
|
|
(89 |
) |
|
|
(27 |
) |
|
|
(342 |
) |
|
|
(5 |
) |
|
|
41 |
|
|
|
3 |
|
|
|
– |
|
|
|
435 |
|
|
|
(36 |
) |
|
|
(20 |
) |
| Improved recovery |
|
|
|
|
20 |
|
|
|
– |
|
|
|
161 |
|
|
|
– |
|
|
|
25 |
|
|
|
7 |
|
|
|
– |
|
|
|
81 |
|
|
|
– |
|
|
|
294 |
|
| Purchases of reserves-in-place |
|
|
|
|
2 |
|
|
|
– |
|
|
|
– |
|
|
|
– |
|
|
|
– |
|
|
|
– |
|
|
|
– |
|
|
|
– |
|
|
|
– |
|
|
|
2 |
|
| Discoveries and extensions |
|
|
|
|
– |
|
|
|
– |
|
|
|
10 |
|
|
|
– |
|
|
|
– |
|
|
|
9 |
|
|
|
– |
|
|
|
363 |
|
|
|
91 |
|
|
|
473 |
|
| Productiond e |
|
|
|
|
(34 |
) |
|
|
(18 |
) |
|
|
(241 |
) |
|
|
(1 |
) |
|
|
(152 |
) |
|
|
(121 |
) |
|
|
– |
|
|
|
(86 |
) |
|
|
(59 |
) |
|
|
(712 |
) |
| Sales of reserves-in-place |
|
|
|
|
(152 |
) |
|
|
– |
|
|
|
(38 |
) |
|
|
– |
|
|
|
– |
|
|
|
– |
|
|
|
– |
|
|
|
(12 |
) |
|
|
– |
|
|
|
(202 |
) |
| |
|
|
|
|
(253 |
) |
|
|
(45 |
) |
|
|
(450 |
) |
|
|
(6 |
) |
|
|
(86 |
) |
|
|
(102 |
) |
|
|
– |
|
|
|
781 |
|
|
|
(4 |
) |
|
|
(165 |
) |
| At 31 December 2013f |
|
|
|
|
|
|
|
|
|
|
|
|
|
|
|
|
|
|
|
|
|
|
|
|
|
|
|
|
|
|
|
|
|
|
|
|
|
|
|
|
|
|
| Developed |
|
|
|
|
280 |
|
|
|
225 |
|
|
|
2,525 |
|
|
|
2 |
|
|
|
564 |
|
|
|
486 |
|
|
|
– |
|
|
|
582 |
|
|
|
735 |
|
|
|
5,399 |
|
| Undeveloped |
|
|
|
|
434 |
|
|
|
62 |
|
|
|
1,394 |
|
|
|
188 |
|
|
|
1,100 |
|
|
|
507 |
|
|
|
– |
|
|
|
835 |
|
|
|
324 |
|
|
|
4,844 |
|
| |
|
|
|
|
714 |
|
|
|
287 |
|
|
|
3,919 |
|
|
|
190 |
|
|
|
1,664 |
|
|
|
993 |
|
|
|
– |
|
|
|
1,417 |
|
|
|
1,059 |
|
|
|
10,243 |
|
| Equity-accounted entities (BP share)g |
|
|
|
|
|
|
|
|
|
|
|
|
|
|
|
|
|
|
|
|
|
|
|
|
|
|
|
|
|
|
|
|
|
| At 1 January 2013 |
|
|
|
|
|
|
|
|
|
|
|
|
|
|
|
|
|
|
|
|
|
|
|
|
|
|
|
|
|
|
|
|
|
|
|
|
|
|
|
|
|
|
| Developed |
|
|
|
|
– |
|
|
|
– |
|
|
|
– |
|
|
|
– |
|
|
|
559 |
|
|
|
43 |
|
|
|
2,943 |
|
|
|
220 |
|
|
|
– |
|
|
|
3,765 |
|
| Undeveloped |
|
|
|
|
– |
|
|
|
– |
|
|
|
– |
|
|
|
– |
|
|
|
508 |
|
|
|
39 |
|
|
|
2,265 |
|
|
|
15 |
|
|
|
– |
|
|
|
2,827 |
|
| |
|
|
|
|
– |
|
|
|
– |
|
|
|
– |
|
|
|
– |
|
|
|
1,067 |
|
|
|
82 |
|
|
|
5,208 |
|
|
|
235 |
|
|
|
– |
|
|
|
6,592 |
|
| Changes attributable to |
|
|
|
|
|
|
|
|
|
|
|
|
|
|
|
|
|
|
|
|
|
|
|
|
|
|
|
|
|
|
|
|
|
|
|
|
|
|
|
|
|
|
| Revisions of previous estimates |
|
|
|
|
– |
|
|
|
– |
|
|
|
– |
|
|
|
1 |
|
|
|
(20 |
) |
|
|
2 |
|
|
|
502 |
|
|
|
1 |
|
|
|
– |
|
|
|
486 |
|
| Improved recovery |
|
|
|
|
– |
|
|
|
– |
|
|
|
– |
|
|
|
– |
|
|
|
38 |
|
|
|
– |
|
|
|
– |
|
|
|
1 |
|
|
|
– |
|
|
|
39 |
|
| Purchases of reserves-in-place |
|
|
|
|
– |
|
|
|
– |
|
|
|
– |
|
|
|
– |
|
|
|
36 |
|
|
|
– |
|
|
|
6,108 |
|
|
|
6 |
|
|
|
– |
|
|
|
6,150 |
|
| Discoveries and extensions |
|
|
|
|
– |
|
|
|
– |
|
|
|
– |
|
|
|
– |
|
|
|
20 |
|
|
|
– |
|
|
|
272 |
|
|
|
– |
|
|
|
– |
|
|
|
292 |
|
| Productione |
|
|
|
|
– |
|
|
|
– |
|
|
|
– |
|
|
|
– |
|
|
|
(55 |
) |
|
|
(1 |
) |
|
|
(353 |
) |
|
|
(88 |
) |
|
|
– |
|
|
|
(497 |
) |
| Sales of reserves-in-place |
|
|
|
|
– |
|
|
|
– |
|
|
|
– |
|
|
|
– |
|
|
|
(92 |
) |
|
|
– |
|
|
|
(5,204 |
) |
|
|
(13 |
) |
|
|
– |
|
|
|
(5,309 |
) |
| |
|
|
|
|
– |
|
|
|
– |
|
|
|
– |
|
|
|
1 |
|
|
|
(73 |
) |
|
|
1 |
|
|
|
1,325 |
|
|
|
(93 |
) |
|
|
– |
|
|
|
1,161 |
|
| At 31 December 2013h i |
|
|
|
|
|
|
|
|
|
|
|
|
|
|
|
|
|
|
|
|
|
|
|
|
|
|
|
|
|
|
|
|
|
|
|
|
|
|
|
|
|
|
| Developed |
|
|
|
|
– |
|
|
|
– |
|
|
|
– |
|
|
|
– |
|
|
|
552 |
|
|
|
50 |
|
|
|
3,782 |
|
|
|
133 |
|
|
|
– |
|
|
|
4,517 |
|
| Undeveloped |
|
|
|
|
– |
|
|
|
– |
|
|
|
– |
|
|
|
1 |
|
|
|
442 |
|
|
|
33 |
|
|
|
2,751 |
|
|
|
9 |
|
|
|
– |
|
|
|
3,236 |
|
| |
|
|
|
|
– |
|
|
|
– |
|
|
|
– |
|
|
|
1 |
|
|
|
994 |
|
|
|
83 |
|
|
|
6,533 |
|
|
|
142 |
|
|
|
– |
|
|
|
7,753 |
|
| Total subsidiaries and equity-accounted entities (BP share) |
|
|
|
|
|
|
|
|
|
|
|
|
|
|
|
|
|
|
|
|
|
|
|
|
|
|
|
|
|
|
|
|
|
| At 1 January 2013 |
|
|
|
|
|
|
|
|
|
|
|
|
|
|
|
|
|
|
|
|
|
|
|
|
|
|
|
|
|
|
|
|
|
|
|
|
|
|
|
|
|
|
| Developed |
|
|
|
|
421 |
|
|
|
229 |
|
|
|
2,865 |
|
|
|
1 |
|
|
|
1,199 |
|
|
|
551 |
|
|
|
2,943 |
|
|
|
647 |
|
|
|
618 |
|
|
|
9,474 |
|
| Undeveloped |
|
|
|
|
546 |
|
|
|
103 |
|
|
|
1,504 |
|
|
|
195 |
|
|
|
1,618 |
|
|
|
626 |
|
|
|
2,265 |
|
|
|
224 |
|
|
|
445 |
|
|
|
7,526 |
|
| |
|
|
|
|
967 |
|
|
|
332 |
|
|
|
4,369 |
|
|
|
196 |
|
|
|
2,817 |
|
|
|
1,177 |
|
|
|
5,208 |
|
|
|
871 |
|
|
|
1,063 |
|
|
|
17,000 |
|
| At 31 December 2013 |
|
|
|
|
|
|
|
|
|
|
|
|
|
|
|
|
|
|
|
|
|
|
|
|
|
|
|
|
|
|
|
|
|
|
|
|
|
|
|
|
|
|
| Developed |
|
|
|
|
280 |
|
|
|
225 |
|
|
|
2,525 |
|
|
|
2 |
|
|
|
1,116 |
|
|
|
536 |
|
|
|
3,782 |
|
|
|
715 |
|
|
|
735 |
|
|
|
9,916 |
|
| Undeveloped |
|
|
|
|
434 |
|
|
|
62 |
|
|
|
1,394 |
|
|
|
189 |
|
|
|
1,542 |
|
|
|
540 |
|
|
|
2,751 |
|
|
|
844 |
|
|
|
324 |
|
|
|
8,080 |
|
| |
|
|
|
|
714 |
|
|
|
287 |
|
|
|
3,919 |
|
|
|
191 |
|
|
|
2,658 |
|
|
|
1,076 |
|
|
|
6,533 |
|
|
|
1,559 |
|
|
|
1,059 |
|
|
|
17,996 |
|
| a |
Proved reserves exclude royalties due to others, whether payable in cash or in kind, where the royalty owner has a direct interest in the underlying production and
the option and ability to make lifting and sales arrangements independently. |
| b |
5.8 billion cubic feet of natural gas = 1 million barrels of oil equivalent. |
| c |
Proved reserves in the Prudhoe Bay field in Alaska include an estimated 72 million barrels of oil equivalent upon which a net profits royalty will be payable,
over the life of the field under the terms of the BP Prudhoe Bay Royalty Trust. |
| d |
Excludes NGLs from processing plants in which an interest is held of 5,500 barrels of oil equivalent per day. |
| e |
Includes 31 million barrels of oil equivalent of natural gas consumed in operations, 26 million barrels of oil equivalent in subsidiaries, 5 million
barrels of oil equivalent in equity-accounted entities. |
| f |
Includes 551 million barrels of NGLs. Also includes 484 million barrels of oil equivalent in respect of the 30% non-controlling interest in BP Trinidad and
Tobago LLC. |
| g |
Volumes of equity-accounted entities include volumes of equity-accounted investments of those entities. |
| h |
Includes 131 million barrels of NGLs. Also includes 30 million barrels of oil equivalent in respect of the non-controlling interest in Rosneft.
|
| i |
Total proved reserves held as part of our equity interest in Rosneft is 6,574 million barrels of oil equivalent, comprising 1 million barrels of oil equivalent in Canada, 34 million barrels of oil
equivalent in Venezuela, 5 million barrels of oil equivalent in Vietnam and 6,533 million barrels of oil equivalent in Russia. |
|
|
|
| 210 |
|
BP Annual Report and Form 20-F 2013 |
Movements in estimated net proved reserves – continued
|
|
|
|
|
|
|
|
|
|
|
|
|
|
|
|
|
|
|
|
|
|
|
|
|
|
|
|
|
|
|
|
|
|
|
|
|
|
|
|
|
|
|
| |
|
|
|
million barrels |
|
| Crude oila |
|
|
|
|
|
|
|
|
|
|
|
|
|
|
|
|
|
|
|
|
|
|
|
|
|
|
|
2012 |
|
| |
|
|
|
Europe
|
|
|
North
America |
|
|
South
America |
|
|
Africa
|
|
|
Asia
|
|
|
Australasia
|
|
|
Total |
|
| |
|
|
|
UK |
|
|
Rest of
Europe |
|
|
USb |
|
|
Rest of
North
America |
|
|
|
|
|
|
|
|
Russia |
|
|
Rest of
Asia |
|
|
|
|
|
|
|
| Subsidiaries |
|
| At 1 January 2012 |
|
|
|
|
|
|
|
|
|
|
|
|
|
|
|
|
|
|
|
|
|
|
|
|
|
|
|
|
|
|
|
|
|
|
|
|
|
|
|
|
|
|
| Developed |
|
|
|
|
288 |
|
|
|
69 |
|
|
|
1,685 |
|
|
|
– |
|
|
|
27 |
|
|
|
311 |
|
|
|
– |
|
|
|
177 |
|
|
|
59 |
|
|
|
2,616 |
|
| Undeveloped |
|
|
|
|
445 |
|
|
|
230 |
|
|
|
1,173 |
|
|
|
– |
|
|
|
48 |
|
|
|
315 |
|
|
|
– |
|
|
|
279 |
|
|
|
47 |
|
|
|
2,537 |
|
| |
|
|
|
|
733 |
|
|
|
299 |
|
|
|
2,858 |
|
|
|
– |
|
|
|
75 |
|
|
|
626 |
|
|
|
– |
|
|
|
456 |
|
|
|
106 |
|
|
|
5,153 |
|
| Changes attributable to |
|
|
|
|
|
|
|
|
|
|
|
|
|
|
|
|
|
|
|
|
|
|
|
|
|
|
|
|
|
|
|
|
|
|
|
|
|
|
|
|
|
|
| Revisions of previous estimates |
|
|
|
|
(30 |
) |
|
|
(25 |
) |
|
|
(280 |
) |
|
|
– |
|
|
|
(11 |
) |
|
|
(1 |
) |
|
|
– |
|
|
|
(2 |
) |
|
|
– |
|
|
|
(349 |
) |
| Improved recovery |
|
|
|
|
3 |
|
|
|
– |
|
|
|
140 |
|
|
|
– |
|
|
|
– |
|
|
|
13 |
|
|
|
– |
|
|
|
2 |
|
|
|
– |
|
|
|
158 |
|
| Purchases of reserves-in-place |
|
|
|
|
4 |
|
|
|
– |
|
|
|
21 |
|
|
|
– |
|
|
|
– |
|
|
|
– |
|
|
|
– |
|
|
|
– |
|
|
|
– |
|
|
|
25 |
|
| Discoveries and extensions |
|
|
|
|
– |
|
|
|
1 |
|
|
|
23 |
|
|
|
– |
|
|
|
– |
|
|
|
2 |
|
|
|
– |
|
|
|
– |
|
|
|
– |
|
|
|
26 |
|
| Productionc |
|
|
|
|
(31 |
) |
|
|
(8 |
) |
|
|
(142 |
) |
|
|
– |
|
|
|
(10 |
) |
|
|
(73 |
) |
|
|
– |
|
|
|
(51 |
) |
|
|
(9 |
) |
|
|
(324 |
) |
| Sales of reserves-in-place |
|
|
|
|
(6 |
) |
|
|
(18 |
) |
|
|
(188 |
) |
|
|
– |
|
|
|
– |
|
|
|
– |
|
|
|
– |
|
|
|
– |
|
|
|
– |
|
|
|
(212 |
) |
| |
|
|
|
|
(60 |
) |
|
|
(50 |
) |
|
|
(426 |
) |
|
|
– |
|
|
|
(21 |
) |
|
|
(59 |
) |
|
|
– |
|
|
|
(51 |
) |
|
|
(9 |
) |
|
|
(676 |
) |
| At 31 December 2012d h |
|
|
|
|
|
|
|
|
|
|
|
|
|
|
|
|
|
|
|
|
|
|
|
|
|
|
|
|
|
|
|
|
|
|
|
|
|
|
|
|
|
|
| Developed |
|
|
|
|
242 |
|
|
|
170 |
|
|
|
1,443 |
|
|
|
– |
|
|
|
22 |
|
|
|
312 |
|
|
|
– |
|
|
|
268 |
|
|
|
52 |
|
|
|
2,509 |
|
| Undeveloped |
|
|
|
|
431 |
|
|
|
79 |
|
|
|
989 |
|
|
|
– |
|
|
|
32 |
|
|
|
255 |
|
|
|
– |
|
|
|
137 |
|
|
|
45 |
|
|
|
1,968 |
|
| |
|
|
|
|
673 |
|
|
|
249 |
|
|
|
2,432 |
|
|
|
– |
|
|
|
54 |
|
|
|
567 |
|
|
|
– |
|
|
|
405 |
|
|
|
97 |
|
|
|
4,477 |
|
| Equity-accounted entities (BP share)e |
|
| At 1 January 2012 |
|
|
|
|
|
|
|
|
|
|
|
|
|
|
|
|
|
|
|
|
|
|
|
|
|
|
|
|
|
|
|
|
|
|
|
|
|
|
|
|
|
|
| Developed |
|
|
|
|
– |
|
|
|
– |
|
|
|
– |
|
|
|
– |
|
|
|
349 |
|
|
|
– |
|
|
|
2,596 |
|
|
|
256 |
|
|
|
– |
|
|
|
3,201 |
|
| Undeveloped |
|
|
|
|
– |
|
|
|
– |
|
|
|
– |
|
|
|
– |
|
|
|
348 |
|
|
|
14 |
|
|
|
1,613 |
|
|
|
58 |
|
|
|
– |
|
|
|
2,033 |
|
| |
|
|
|
|
– |
|
|
|
– |
|
|
|
– |
|
|
|
– |
|
|
|
697 |
|
|
|
14 |
|
|
|
4,209 |
|
|
|
314 |
|
|
|
– |
|
|
|
5,234 |
|
| Changes attributable to |
|
|
|
|
|
|
|
|
|
|
|
|
|
|
|
|
|
|
|
|
|
|
|
|
|
|
|
|
|
|
|
|
|
|
|
|
|
|
|
|
|
|
| Revisions of previous estimates |
|
|
|
|
– |
|
|
|
– |
|
|
|
– |
|
|
|
– |
|
|
|
(2 |
) |
|
|
9 |
|
|
|
462 |
|
|
|
(23 |
) |
|
|
– |
|
|
|
446 |
|
| Improved recovery |
|
|
|
|
– |
|
|
|
– |
|
|
|
– |
|
|
|
– |
|
|
|
24 |
|
|
|
– |
|
|
|
47 |
|
|
|
– |
|
|
|
– |
|
|
|
71 |
|
| Purchases of reserves-in-place |
|
|
|
|
– |
|
|
|
– |
|
|
|
– |
|
|
|
– |
|
|
|
– |
|
|
|
– |
|
|
|
– |
|
|
|
– |
|
|
|
– |
|
|
|
– |
|
| Discoveries and extensions |
|
|
|
|
– |
|
|
|
– |
|
|
|
– |
|
|
|
– |
|
|
|
– |
|
|
|
– |
|
|
|
67 |
|
|
|
– |
|
|
|
– |
|
|
|
67 |
|
| Production |
|
|
|
|
– |
|
|
|
– |
|
|
|
– |
|
|
|
– |
|
|
|
(29 |
) |
|
|
– |
|
|
|
(316 |
) |
|
|
(80 |
) |
|
|
– |
|
|
|
(425 |
) |
| Sales of reserves-in-place |
|
|
|
|
– |
|
|
|
– |
|
|
|
– |
|
|
|
– |
|
|
|
– |
|
|
|
– |
|
|
|
(15 |
) |
|
|
– |
|
|
|
– |
|
|
|
(15 |
) |
| |
|
|
|
|
– |
|
|
|
– |
|
|
|
– |
|
|
|
– |
|
|
|
(7 |
) |
|
|
9 |
|
|
|
245 |
|
|
|
(103 |
) |
|
|
– |
|
|
|
144 |
|
| At 31 December 2012f g i |
|
|
|
|
|
|
|
|
|
|
|
|
|
|
|
|
|
|
|
|
|
|
|
|
|
|
|
|
|
|
|
|
|
|
|
|
|
|
|
|
|
|
| Developed |
|
|
|
|
– |
|
|
|
– |
|
|
|
– |
|
|
|
– |
|
|
|
339 |
|
|
|
12 |
|
|
|
2,492 |
|
|
|
198 |
|
|
|
– |
|
|
|
3,041 |
|
| Undeveloped |
|
|
|
|
– |
|
|
|
– |
|
|
|
– |
|
|
|
– |
|
|
|
351 |
|
|
|
11 |
|
|
|
1,962 |
|
|
|
13 |
|
|
|
– |
|
|
|
2,337 |
|
| |
|
|
|
|
– |
|
|
|
– |
|
|
|
– |
|
|
|
– |
|
|
|
690 |
|
|
|
23 |
|
|
|
4,454 |
|
|
|
211 |
|
|
|
– |
|
|
|
5,378 |
|
| Total subsidiaries and equity-accounted entities (BP share) |
|
| At 1 January 2012 |
|
|
|
|
|
|
|
|
|
|
|
|
|
|
|
|
|
|
|
|
|
|
|
|
|
|
|
|
|
|
|
|
|
|
|
|
|
|
|
|
|
|
| Developed |
|
|
|
|
288 |
|
|
|
69 |
|
|
|
1,685 |
|
|
|
– |
|
|
|
376 |
|
|
|
311 |
|
|
|
2,596 |
|
|
|
433 |
|
|
|
59 |
|
|
|
5,817 |
|
| Undeveloped |
|
|
|
|
445 |
|
|
|
230 |
|
|
|
1,173 |
|
|
|
– |
|
|
|
396 |
|
|
|
329 |
|
|
|
1,613 |
|
|
|
337 |
|
|
|
47 |
|
|
|
4,570 |
|
| |
|
|
|
|
733 |
|
|
|
299 |
|
|
|
2,858 |
|
|
|
– |
|
|
|
772 |
|
|
|
640 |
|
|
|
4,209 |
|
|
|
770 |
|
|
|
106 |
|
|
|
10,387 |
|
| At 31 December 2012 |
|
|
|
|
|
|
|
|
|
|
|
|
|
|
|
|
|
|
|
|
|
|
|
|
|
|
|
|
|
|
|
|
|
|
|
|
|
|
|
|
|
|
| Developed |
|
|
|
|
242 |
|
|
|
170 |
|
|
|
1,443 |
|
|
|
– |
|
|
|
361 |
|
|
|
324 |
|
|
|
2,492 |
|
|
|
466 |
|
|
|
52 |
|
|
|
5,550 |
|
| Undeveloped |
|
|
|
|
431 |
|
|
|
79 |
|
|
|
989 |
|
|
|
– |
|
|
|
383 |
|
|
|
266 |
|
|
|
1,962 |
|
|
|
150 |
|
|
|
45 |
|
|
|
4,305 |
|
| |
|
|
|
|
673 |
|
|
|
249 |
|
|
|
2,432 |
|
|
|
– |
|
|
|
744 |
|
|
|
590 |
|
|
|
4,454 |
|
|
|
616 |
|
|
|
97 |
|
|
|
9,855 |
|
| a |
Crude oil includes NGLs and condensate. Proved reserves exclude royalties due to others, whether payable in cash or in kind, where the royalty owner has a direct
interest in the underlying production and the option and ability to make lifting and sales arrangements independently. |
| b |
Proved reserves in the Prudhoe Bay field in Alaska include an estimated 76 million barrels upon which a net profits royalty will be payable over the life of the field under the terms of the BP Prudhoe Bay Royalty
Trust. |
| c |
Excludes NGLs from processing plants in which an interest is held of 13,500 barrels per day. |
| d |
Includes 591 million barrels of NGLs. Also includes 14 million barrels of crude oil in respect of the 30% non-controlling interest in BP Trinidad and Tobago
LLC. |
| e |
Volumes of equity-accounted entities include volumes of equity-accounted investments of those entities. |
| f |
Includes 103 million barrels of NGLs. Also includes 328 million barrels of crude oil in respect of the 7.35% non-controlling interest in TNK-BP. |
| g |
Total proved liquid reserves held as part of our equity interest in TNK-BP is 4,540 million barrels, comprising 87 million barrels in Venezuela and 4,454
million barrels in Russia. |
| h |
Includes assets held for sale of 39 million barrels. |
| i |
Includes assets held for sale of 4,540 million barrels. |
|
|
|
|
|
| BP Annual Report and Form 20-F 2013 |
|
|
211 |
|
Movements in estimated net proved reserves – continued
|
|
|
|
|
|
|
|
|
|
|
|
|
|
|
|
|
|
|
|
|
|
|
|
|
|
|
|
|
|
|
|
|
|
|
|
|
|
|
|
|
|
|
| |
|
|
|
billion cubic feet |
|
| Natural gasa |
|
|
|
|
|
|
|
|
|
|
|
|
|
|
|
|
|
|
|
|
|
|
|
|
|
|
|
2012 |
|
| |
|
|
|
Europe
|
|
|
North
America |
|
|
South
America |
|
|
Africa
|
|
|
Asia
|
|
|
Australasia
|
|
|
Total |
|
| |
|
|
|
UK |
|
|
Rest of
Europe |
|
|
US |
|
|
Rest of
North
America |
|
|
|
|
|
|
|
|
Russia |
|
|
Rest of
Asia |
|
|
|
|
|
|
|
| Subsidiaries |
|
| At 1 January 2012 |
|
|
|
|
|
|
|
|
|
|
|
|
|
|
|
|
|
|
|
|
|
|
|
|
|
|
|
|
|
|
|
|
|
|
|
|
|
|
|
|
|
|
| Developed |
|
|
|
|
1,411 |
|
|
|
43 |
|
|
|
9,721 |
|
|
|
28 |
|
|
|
2,869 |
|
|
|
1,224 |
|
|
|
– |
|
|
|
1,034 |
|
|
|
3,570 |
|
|
|
19,900 |
|
| Undeveloped |
|
|
|
|
909 |
|
|
|
450 |
|
|
|
3,831 |
|
|
|
– |
|
|
|
6,529 |
|
|
|
2,033 |
|
|
|
– |
|
|
|
364 |
|
|
|
2,365 |
|
|
|
16,481 |
|
| |
|
|
|
|
2,320 |
|
|
|
493 |
|
|
|
13,552 |
|
|
|
28 |
|
|
|
9,398 |
|
|
|
3,257 |
|
|
|
– |
|
|
|
1,398 |
|
|
|
5,935 |
|
|
|
36,381 |
|
| Changes attributable to |
|
|
|
|
|
|
|
|
|
|
|
|
|
|
|
|
|
|
|
|
|
|
|
|
|
|
|
|
|
|
|
|
|
|
|
|
|
|
|
|
|
|
| Revisions of previous estimates |
|
|
|
|
(18 |
) |
|
|
(13 |
) |
|
|
(1,853 |
) |
|
|
(19 |
) |
|
|
(116 |
) |
|
|
(14 |
) |
|
|
– |
|
|
|
38 |
|
|
|
(41 |
) |
|
|
(2,036 |
) |
| Improved recovery |
|
|
|
|
95 |
|
|
|
– |
|
|
|
885 |
|
|
|
– |
|
|
|
756 |
|
|
|
69 |
|
|
|
– |
|
|
|
156 |
|
|
|
– |
|
|
|
1,961 |
|
| Purchases of reserves-in-place |
|
|
|
|
17 |
|
|
|
(1 |
) |
|
|
232 |
|
|
|
– |
|
|
|
– |
|
|
|
– |
|
|
|
– |
|
|
|
– |
|
|
|
– |
|
|
|
248 |
|
| Discoveries and extensions |
|
|
|
|
– |
|
|
|
7 |
|
|
|
225 |
|
|
|
– |
|
|
|
598 |
|
|
|
1 |
|
|
|
– |
|
|
|
– |
|
|
|
– |
|
|
|
831 |
|
| Productionb |
|
|
|
|
(164 |
) |
|
|
(5 |
) |
|
|
(661 |
) |
|
|
(5 |
) |
|
|
(775 |
) |
|
|
(251 |
) |
|
|
– |
|
|
|
(253 |
) |
|
|
(289 |
) |
|
|
(2,403 |
) |
| Sales of reserves-in-place |
|
|
|
|
(546 |
) |
|
|
– |
|
|
|
(1,149 |
) |
|
|
– |
|
|
|
(23 |
) |
|
|
– |
|
|
|
– |
|
|
|
– |
|
|
|
– |
|
|
|
(1,718 |
) |
|
|
|
(616 |
) |
|
|
(12 |
) |
|
|
(2,321 |
) |
|
|
(24 |
) |
|
|
440 |
|
|
|
(195 |
) |
|
|
– |
|
|
|
(59 |
) |
|
|
(330 |
) |
|
|
(3,117 |
) |
| At 31 December 2012c g |
|
|
|
|
|
|
|
|
|
|
|
|
|
|
|
|
|
|
|
|
|
|
|
|
|
|
|
|
|
|
|
|
|
|
|
|
|
|
|
|
|
|
| Developed |
|
|
|
|
1,038 |
|
|
|
340 |
|
|
|
8,245 |
|
|
|
4 |
|
|
|
3,588 |
|
|
|
1,139 |
|
|
|
– |
|
|
|
926 |
|
|
|
3,282 |
|
|
|
18,562 |
|
| Undeveloped |
|
|
|
|
666 |
|
|
|
141 |
|
|
|
2,986 |
|
|
|
– |
|
|
|
6,250 |
|
|
|
1,923 |
|
|
|
– |
|
|
|
413 |
|
|
|
2,323 |
|
|
|
14,702 |
|
| |
|
|
|
|
1,704 |
|
|
|
481 |
|
|
|
11,231 |
|
|
|
4 |
|
|
|
9,838 |
|
|
|
3,062 |
|
|
|
– |
|
|
|
1,339 |
|
|
|
5,605 |
|
|
|
33,264 |
|
| Equity-accounted entities (BP share)d |
|
| At 1 January 2012 |
|
|
|
|
|
|
|
|
|
|
|
|
|
|
|
|
|
|
|
|
|
|
|
|
|
|
|
|
|
|
|
|
|
|
|
|
|
|
|
|
|
|
| Developed |
|
|
|
|
– |
|
|
|
– |
|
|
|
– |
|
|
|
– |
|
|
|
1,144 |
|
|
|
– |
|
|
|
2,119 |
|
|
|
104 |
|
|
|
– |
|
|
|
3,367 |
|
| Undeveloped |
|
|
|
|
– |
|
|
|
– |
|
|
|
– |
|
|
|
– |
|
|
|
1,006 |
|
|
|
195 |
|
|
|
659 |
|
|
|
51 |
|
|
|
– |
|
|
|
1,911 |
|
| |
|
|
|
|
– |
|
|
|
– |
|
|
|
– |
|
|
|
– |
|
|
|
2,150 |
|
|
|
195 |
|
|
|
2,778 |
|
|
|
155 |
|
|
|
– |
|
|
|
5,278 |
|
| Changes attributable to |
|
|
|
|
|
|
|
|
|
|
|
|
|
|
|
|
|
|
|
|
|
|
|
|
|
|
|
|
|
|
|
|
|
|
|
|
|
|
|
|
|
|
| Revisions of previous estimates |
|
|
|
|
– |
|
|
|
– |
|
|
|
– |
|
|
|
– |
|
|
|
86 |
|
|
|
144 |
|
|
|
569 |
|
|
|
25 |
|
|
|
– |
|
|
|
824 |
|
| Improved recovery |
|
|
|
|
– |
|
|
|
– |
|
|
|
– |
|
|
|
– |
|
|
|
110 |
|
|
|
– |
|
|
|
– |
|
|
|
1 |
|
|
|
– |
|
|
|
111 |
|
| Purchases of reserves-in-place |
|
|
|
|
– |
|
|
|
– |
|
|
|
– |
|
|
|
– |
|
|
|
– |
|
|
|
– |
|
|
|
– |
|
|
|
– |
|
|
|
– |
|
|
|
– |
|
| Discoveries and extensions |
|
|
|
|
– |
|
|
|
– |
|
|
|
– |
|
|
|
– |
|
|
|
3 |
|
|
|
– |
|
|
|
1,310 |
|
|
|
– |
|
|
|
– |
|
|
|
1,313 |
|
| Productionb |
|
|
|
|
– |
|
|
|
– |
|
|
|
– |
|
|
|
– |
|
|
|
(169 |
) |
|
|
– |
|
|
|
(280 |
) |
|
|
(35 |
) |
|
|
– |
|
|
|
(484 |
) |
| Sales of reserves-in-place |
|
|
|
|
– |
|
|
|
– |
|
|
|
– |
|
|
|
– |
|
|
|
– |
|
|
|
– |
|
|
|
(1 |
) |
|
|
– |
|
|
|
– |
|
|
|
(1 |
) |
| |
|
|
|
|
– |
|
|
|
– |
|
|
|
– |
|
|
|
– |
|
|
|
30 |
|
|
|
144 |
|
|
|
1,598 |
|
|
|
(9 |
) |
|
|
– |
|
|
|
1,763 |
|
| At 31 December 2012e f h |
|
|
|
|
|
|
|
|
|
|
|
|
|
|
|
|
|
|
|
|
|
|
|
|
|
|
|
|
|
|
|
|
|
|
|
|
|
|
|
|
|
|
| Developed |
|
|
|
|
– |
|
|
|
– |
|
|
|
– |
|
|
|
– |
|
|
|
1,276 |
|
|
|
175 |
|
|
|
2,617 |
|
|
|
128 |
|
|
|
– |
|
|
|
4,196 |
|
| Undeveloped |
|
|
|
|
– |
|
|
|
– |
|
|
|
– |
|
|
|
– |
|
|
|
904 |
|
|
|
164 |
|
|
|
1,759 |
|
|
|
18 |
|
|
|
– |
|
|
|
2,845 |
|
| |
|
|
|
|
– |
|
|
|
– |
|
|
|
– |
|
|
|
– |
|
|
|
2,180 |
|
|
|
339 |
|
|
|
4,376 |
|
|
|
146 |
|
|
|
– |
|
|
|
7,041 |
|
| Total subsidiaries and equity-accounted entities (BP share) |
|
| At 1 January 2012 |
|
|
|
|
|
|
|
|
|
|
|
|
|
|
|
|
|
|
|
|
|
|
|
|
|
|
|
|
|
|
|
|
|
|
|
|
|
|
|
|
|
|
| Developed |
|
|
|
|
1,411 |
|
|
|
43 |
|
|
|
9,721 |
|
|
|
28 |
|
|
|
4,013 |
|
|
|
1,224 |
|
|
|
2,119 |
|
|
|
1,138 |
|
|
|
3,570 |
|
|
|
23,267 |
|
| Undeveloped |
|
|
|
|
909 |
|
|
|
450 |
|
|
|
3,831 |
|
|
|
– |
|
|
|
7,535 |
|
|
|
2,228 |
|
|
|
659 |
|
|
|
415 |
|
|
|
2,365 |
|
|
|
18,392 |
|
| |
|
|
|
|
2,320 |
|
|
|
493 |
|
|
|
13,552 |
|
|
|
28 |
|
|
|
11,548 |
|
|
|
3,452 |
|
|
|
2,778 |
|
|
|
1,553 |
|
|
|
5,935 |
|
|
|
41,659 |
|
| At 31 December 2012 |
|
|
|
|
|
|
|
|
|
|
|
|
|
|
|
|
|
|
|
|
|
|
|
|
|
|
|
|
|
|
|
|
|
|
|
|
|
|
|
|
|
|
| Developed |
|
|
|
|
1,038 |
|
|
|
340 |
|
|
|
8,245 |
|
|
|
4 |
|
|
|
4,864 |
|
|
|
1,314 |
|
|
|
2,617 |
|
|
|
1,054 |
|
|
|
3,282 |
|
|
|
22,758 |
|
| Undeveloped |
|
|
|
|
666 |
|
|
|
141 |
|
|
|
2,986 |
|
|
|
– |
|
|
|
7,154 |
|
|
|
2,087 |
|
|
|
1,759 |
|
|
|
431 |
|
|
|
2,323 |
|
|
|
17,547 |
|
| |
|
|
|
|
1,704 |
|
|
|
481 |
|
|
|
11,231 |
|
|
|
4 |
|
|
|
12,018 |
|
|
|
3,401 |
|
|
|
4,376 |
|
|
|
1,485 |
|
|
|
5,605 |
|
|
|
40,305 |
|
| a |
Proved reserves exclude royalties due to others, whether payable in cash or in kind, where the royalty owner has a direct interest in the underlying production and the option and ability to make lifting and sales
arrangements independently. |
| b |
Includes 190 billion cubic feet of natural gas consumed in operations, 145 billion cubic feet in subsidiaries, 45 billion cubic feet in equity-accounted entities and excludes 9 billion cubic feet of produced
non-hydrocarbon components that meet regulatory requirements for sales. |
| c |
Includes 2,890 billion cubic feet of natural gas in respect of the 30% non-controlling interest in BP Trinidad and Tobago LLC. |
| d |
Volumes of equity-accounted entities include volumes of equity-accounted investments of those entities. |
| e |
Includes 270 billion cubic feet of natural gas in respect of the 6.17% non-controlling interest in TNK-BP. |
| f |
Total proved gas reserves held as part of our equity interest in TNK-BP is 4,492 billion cubic feet, comprising 38 billion cubic feet in Venezuela, 78 billion cubic feet in Vietnam and 4,376 billion cubic feet in
Russia. |
| g |
Includes assets held for sale of 590 billion cubic feet. |
| h |
Includes assets held for sale of 4,492 billion cubic feet. |
|
|
|
| 212 |
|
BP Annual Report and Form 20-F 2013 |
Movements in estimated net proved reserves – continued
|
|
|
|
|
|
|
|
|
|
|
| |
|
|
|
|
million barrels |
|
| Bitumena |
|
|
|
|
2012 |
|
| |
|
|
|
|
Rest of
North
America |
|
|
|
Total |
|
| Subsidiaries |
|
|
|
|
|
|
|
|
|
|
| At 1 January 2012 |
|
|
|
|
|
|
|
|
|
|
| Developed |
|
|
|
|
– |
|
|
|
– |
|
| Undeveloped |
|
|
|
|
178 |
|
|
|
178 |
|
| |
|
|
|
|
178 |
|
|
|
178 |
|
| Changes attributable to |
|
|
|
|
|
|
|
|
|
|
| Revisions of previous estimates |
|
|
|
|
17 |
|
|
|
17 |
|
| Improved recovery |
|
|
|
|
– |
|
|
|
– |
|
| Purchases of reserves-in-place |
|
|
|
|
– |
|
|
|
– |
|
| Discoveries and extensions |
|
|
|
|
– |
|
|
|
– |
|
| Production |
|
|
|
|
– |
|
|
|
– |
|
| Sales of reserves-in-place |
|
|
|
|
– |
|
|
|
– |
|
| |
|
|
|
|
17 |
|
|
|
17 |
|
| At 31 December 2012 |
|
|
|
|
|
|
|
|
|
|
| Developed |
|
|
|
|
– |
|
|
|
– |
|
| Undeveloped |
|
|
|
|
195 |
|
|
|
195 |
|
| |
|
|
|
|
195 |
|
|
|
195 |
|
| a |
Proved reserves exclude royalties due to others, whether payable in cash or in kind, where the royalty owner has a direct interest in the underlying production and
the option and ability to make lifting and sales arrangements independently. |
|
|
|
|
|
| BP Annual Report and Form 20-F 2013 |
|
|
213 |
|
Movements in estimated net proved reserves – continued
|
|
|
|
|
|
|
|
|
|
|
|
|
|
|
|
|
|
|
|
|
|
|
|
|
|
|
|
|
|
|
|
|
|
|
|
|
|
|
|
|
|
|
| |
|
|
|
million barrels of oil equivalentb |
|
| Total hydrocarbonsa |
|
|
|
|
|
|
|
|
|
|
|
|
|
|
|
|
|
|
|
|
|
|
|
|
|
|
|
|
|
|
2012 |
|
| |
|
|
|
Europe
|
|
|
North
America |
|
|
South
America |
|
|
Africa
|
|
|
Asia
|
|
|
Australasia
|
|
|
Total |
|
| |
|
|
|
UK |
|
|
Rest of
Europe |
|
|
USc |
|
|
Rest of
North America |
|
|
|
|
|
|
|
|
Russia |
|
|
Rest of
Asia |
|
|
|
|
|
|
|
| Subsidiaries |
|
| At 1 January 2012 |
|
|
|
|
|
|
|
|
|
|
|
|
|
|
|
|
|
|
|
|
|
|
|
|
|
|
|
|
|
|
|
|
|
|
|
|
|
|
|
|
|
|
| Developed |
|
|
|
|
531 |
|
|
|
76 |
|
|
|
3,362 |
|
|
|
5 |
|
|
|
522 |
|
|
|
522 |
|
|
|
– |
|
|
|
355 |
|
|
|
675 |
|
|
|
6,048 |
|
| Undeveloped |
|
|
|
|
602 |
|
|
|
308 |
|
|
|
1,833 |
|
|
|
178 |
|
|
|
1,173 |
|
|
|
665 |
|
|
|
– |
|
|
|
342 |
|
|
|
455 |
|
|
|
5,556 |
|
| |
|
|
|
|
1,133 |
|
|
|
384 |
|
|
|
5,195 |
|
|
|
183 |
|
|
|
1,695 |
|
|
|
1,187 |
|
|
|
– |
|
|
|
697 |
|
|
|
1,130 |
|
|
|
11,604 |
|
| Changes attributable to |
|
|
|
|
|
|
|
|
|
|
|
|
|
|
|
|
|
|
|
|
|
|
|
|
|
|
|
|
|
|
|
|
|
|
|
|
|
|
|
|
|
|
| Revisions of previous estimates |
|
|
|
|
(33 |
) |
|
|
(27 |
) |
|
|
(600 |
) |
|
|
14 |
|
|
|
(31 |
) |
|
|
(3 |
) |
|
|
– |
|
|
|
5 |
|
|
|
(8 |
) |
|
|
(683 |
) |
| Improved recovery |
|
|
|
|
19 |
|
|
|
– |
|
|
|
293 |
|
|
|
– |
|
|
|
130 |
|
|
|
25 |
|
|
|
– |
|
|
|
29 |
|
|
|
– |
|
|
|
496 |
|
| Purchases of reserves-in-place |
|
|
|
|
7 |
|
|
|
– |
|
|
|
61 |
|
|
|
– |
|
|
|
– |
|
|
|
– |
|
|
|
– |
|
|
|
– |
|
|
|
– |
|
|
|
68 |
|
| Discoveries and extensions |
|
|
|
|
– |
|
|
|
2 |
|
|
|
62 |
|
|
|
– |
|
|
|
103 |
|
|
|
2 |
|
|
|
– |
|
|
|
– |
|
|
|
– |
|
|
|
169 |
|
| Productiond e |
|
|
|
|
(59 |
) |
|
|
(9 |
) |
|
|
(256 |
) |
|
|
(1 |
) |
|
|
(143 |
) |
|
|
(116 |
) |
|
|
– |
|
|
|
(95 |
) |
|
|
(59 |
) |
|
|
(738 |
) |
| Sales of reserves-in-place |
|
|
|
|
(100 |
) |
|
|
(18 |
) |
|
|
(386 |
) |
|
|
– |
|
|
|
(4 |
) |
|
|
– |
|
|
|
– |
|
|
|
– |
|
|
|
– |
|
|
|
(508 |
) |
| |
|
|
|
|
(166 |
) |
|
|
(52 |
) |
|
|
(826 |
) |
|
|
13 |
|
|
|
55 |
|
|
|
(92 |
) |
|
|
– |
|
|
|
(61 |
) |
|
|
(67 |
) |
|
|
(1,196 |
) |
| At 31 December 2012f j |
|
|
|
|
|
|
|
|
|
|
|
|
|
|
|
|
|
|
|
|
|
|
|
|
|
|
|
|
|
|
|
|
|
|
|
|
|
|
|
|
|
|
| Developed |
|
|
|
|
421 |
|
|
|
229 |
|
|
|
2,865 |
|
|
|
1 |
|
|
|
640 |
|
|
|
508 |
|
|
|
– |
|
|
|
427 |
|
|
|
618 |
|
|
|
5,709 |
|
| Undeveloped |
|
|
|
|
546 |
|
|
|
103 |
|
|
|
1,504 |
|
|
|
195 |
|
|
|
1,110 |
|
|
|
587 |
|
|
|
– |
|
|
|
209 |
|
|
|
445 |
|
|
|
4,699 |
|
| |
|
|
|
|
967 |
|
|
|
332 |
|
|
|
4,369 |
|
|
|
196 |
|
|
|
1,750 |
|
|
|
1,095 |
|
|
|
– |
|
|
|
636 |
|
|
|
1,063 |
|
|
|
10,408 |
|
| Equity-accounted entities (BP share)g |
|
| At 1 January 2012 |
|
|
|
|
|
|
|
|
|
|
|
|
|
|
|
|
|
|
|
|
|
|
|
|
|
|
|
|
|
|
|
|
|
|
|
|
|
|
|
|
|
|
| Developed |
|
|
|
|
– |
|
|
|
– |
|
|
|
– |
|
|
|
– |
|
|
|
546 |
|
|
|
– |
|
|
|
2,961 |
|
|
|
274 |
|
|
|
– |
|
|
|
3,781 |
|
| Undeveloped |
|
|
|
|
– |
|
|
|
– |
|
|
|
– |
|
|
|
– |
|
|
|
522 |
|
|
|
48 |
|
|
|
1,727 |
|
|
|
66 |
|
|
|
– |
|
|
|
2,363 |
|
| |
|
|
|
|
– |
|
|
|
– |
|
|
|
– |
|
|
|
– |
|
|
|
1,068 |
|
|
|
48 |
|
|
|
4,688 |
|
|
|
340 |
|
|
|
– |
|
|
|
6,144 |
|
| Changes attributable to |
|
|
|
|
|
|
|
|
|
|
|
|
|
|
|
|
|
|
|
|
|
|
|
|
|
|
|
|
|
|
|
|
|
|
|
|
|
|
|
|
|
|
| Revisions of previous estimates |
|
|
|
|
– |
|
|
|
– |
|
|
|
– |
|
|
|
– |
|
|
|
13 |
|
|
|
34 |
|
|
|
560 |
|
|
|
(19 |
) |
|
|
– |
|
|
|
588 |
|
| Improved recovery |
|
|
|
|
– |
|
|
|
– |
|
|
|
– |
|
|
|
– |
|
|
|
43 |
|
|
|
– |
|
|
|
47 |
|
|
|
– |
|
|
|
– |
|
|
|
90 |
|
| Purchases of reserves-in-place |
|
|
|
|
– |
|
|
|
– |
|
|
|
– |
|
|
|
– |
|
|
|
– |
|
|
|
– |
|
|
|
– |
|
|
|
– |
|
|
|
– |
|
|
|
– |
|
| Discoveries and extensions |
|
|
|
|
– |
|
|
|
– |
|
|
|
– |
|
|
|
– |
|
|
|
1 |
|
|
|
– |
|
|
|
292 |
|
|
|
– |
|
|
|
– |
|
|
|
293 |
|
| Productiond e |
|
|
|
|
– |
|
|
|
– |
|
|
|
– |
|
|
|
– |
|
|
|
(58 |
) |
|
|
– |
|
|
|
(364 |
) |
|
|
(86 |
) |
|
|
– |
|
|
|
(508 |
) |
| Sales of reserves-in-place |
|
|
|
|
– |
|
|
|
– |
|
|
|
– |
|
|
|
– |
|
|
|
– |
|
|
|
– |
|
|
|
(15 |
) |
|
|
– |
|
|
|
– |
|
|
|
(15 |
) |
| |
|
|
|
|
– |
|
|
|
– |
|
|
|
– |
|
|
|
– |
|
|
|
(1 |
) |
|
|
34 |
|
|
|
520 |
|
|
|
(105 |
) |
|
|
– |
|
|
|
448 |
|
| At 31 December 2012h i k |
|
|
|
|
|
|
|
|
|
|
|
|
|
|
|
|
|
|
|
|
|
|
|
|
|
|
|
|
|
|
|
|
|
|
|
|
|
|
|
|
|
|
| Developed |
|
|
|
|
– |
|
|
|
– |
|
|
|
– |
|
|
|
– |
|
|
|
559 |
|
|
|
43 |
|
|
|
2,943 |
|
|
|
220 |
|
|
|
– |
|
|
|
3,765 |
|
| Undeveloped |
|
|
|
|
– |
|
|
|
– |
|
|
|
– |
|
|
|
– |
|
|
|
508 |
|
|
|
39 |
|
|
|
2,265 |
|
|
|
15 |
|
|
|
– |
|
|
|
2,827 |
|
| |
|
|
|
|
– |
|
|
|
– |
|
|
|
– |
|
|
|
– |
|
|
|
1,067 |
|
|
|
82 |
|
|
|
5,208 |
|
|
|
235 |
|
|
|
– |
|
|
|
6,592 |
|
| Total subsidiaries and equity-accounted entities (BP share) |
|
| At 1 January 2012 |
|
|
|
|
|
|
|
|
|
|
|
|
|
|
|
|
|
|
|
|
|
|
|
|
|
|
|
|
|
|
|
|
|
|
|
|
|
|
|
|
|
|
| Developed |
|
|
|
|
531 |
|
|
|
76 |
|
|
|
3,362 |
|
|
|
5 |
|
|
|
1,068 |
|
|
|
522 |
|
|
|
2,961 |
|
|
|
629 |
|
|
|
675 |
|
|
|
9,829 |
|
| Undeveloped |
|
|
|
|
602 |
|
|
|
308 |
|
|
|
1,833 |
|
|
|
178 |
|
|
|
1,695 |
|
|
|
713 |
|
|
|
1,727 |
|
|
|
408 |
|
|
|
455 |
|
|
|
7,919 |
|
| |
|
|
|
|
1,133 |
|
|
|
384 |
|
|
|
5,195 |
|
|
|
183 |
|
|
|
2,763 |
|
|
|
1,235 |
|
|
|
4,688 |
|
|
|
1,037 |
|
|
|
1,130 |
|
|
|
17,748 |
|
| At 31 December 2012 |
|
|
|
|
|
|
|
|
|
|
|
|
|
|
|
|
|
|
|
|
|
|
|
|
|
|
|
|
|
|
|
|
|
|
|
|
|
|
|
|
|
|
| Developed |
|
|
|
|
421 |
|
|
|
229 |
|
|
|
2,865 |
|
|
|
1 |
|
|
|
1,199 |
|
|
|
551 |
|
|
|
2,943 |
|
|
|
647 |
|
|
|
618 |
|
|
|
9,474 |
|
| Undeveloped |
|
|
|
|
546 |
|
|
|
103 |
|
|
|
1,504 |
|
|
|
195 |
|
|
|
1,618 |
|
|
|
626 |
|
|
|
2,265 |
|
|
|
224 |
|
|
|
445 |
|
|
|
7,526 |
|
| |
|
|
|
|
967 |
|
|
|
332 |
|
|
|
4,369 |
|
|
|
196 |
|
|
|
2,817 |
|
|
|
1,177 |
|
|
|
5,208 |
|
|
|
871 |
|
|
|
1,063 |
|
|
|
17,000 |
|
| a |
Proved reserves exclude royalties due to others, whether payable in cash or in kind, where the royalty owner has a direct interest in the underlying production and the option and ability to make lifting and sales
arrangements independently. |
| b |
5.8 billion cubic feet of natural gas = 1 million barrels of oil equivalent. |
| c |
Proved reserves in the Prudhoe Bay field in Alaska include an estimated 76 million barrels of oil equivalent upon which a net profits royalty will be payable, over the life of the field under the terms of the BP
Prudhoe Bay Royalty Trust. |
| d |
Excludes NGLs from processing plants in which an interest is held of 13,500 barrels of oil equivalent per day. |
| e |
Includes 33 million barrels of oil equivalent of natural gas consumed in operations, 25 million barrels of oil equivalent in subsidiaries, 8 million barrels of oil equivalent in equity-accounted entities
and excludes 2 million barrels of oil equivalent of produced non-hydrocarbon components that meet regulatory requirements for sales. |
| f |
Includes 591 million barrels of NGLs. Also includes 512 million barrels of oil equivalent in respect of the 30% non-controlling interest in BP Trinidad and Tobago LLC. |
| g |
Volumes of equity-accounted entities include volumes of equity-accounted investments of those entities. |
| h |
Includes 103 million barrels of NGLs. Also includes 374 million barrels of oil equivalent in respect of the non-controlling interest in TNK-BP. |
| i |
Total proved reserves held as part of our equity interest in TNK-BP is 5,315 million barrels of oil equivalent, comprising 93 million barrels of oil equivalent in Venezuela, 14 million barrels of oil
equivalent in Vietnam and 5,208 million barrels of oil equivalent in Russia. |
| j |
Includes assets held for sale of 140 million barrels of oil equivalent. |
| k |
Includes assets held for sale of 5,315 million barrels of oil equivalent. |
|
|
|
| 214 |
|
BP Annual Report and Form 20-F 2013 |
Movements in estimated net proved reserves – continued
|
|
|
|
|
|
|
|
|
|
|
|
|
|
|
|
|
|
|
|
|
|
|
|
|
|
|
|
|
|
|
|
|
|
|
|
|
|
|
|
|
|
|
| |
|
|
|
million barrels |
|
| Crude oila |
|
|
|
|
|
|
|
|
|
|
|
|
|
|
|
|
|
|
|
|
|
|
|
|
|
|
|
|
|
|
2011 |
|
| |
|
|
|
Europe
|
|
|
North
America |
|
|
South
America |
|
|
Africa
|
|
|
Asia
|
|
|
Australasia
|
|
|
Total |
|
| |
|
|
|
UK |
|
|
Rest of
Europe |
|
|
USb |
|
|
Rest of
North America |
|
|
|
|
|
|
|
|
Russia |
|
|
Rest of
Asia |
|
|
|
|
|
|
|
| Subsidiaries |
|
| At 1 January 2011 |
|
|
|
|
|
|
|
|
|
|
|
|
|
|
|
|
|
|
|
|
|
|
|
|
|
|
|
|
|
|
|
|
|
|
|
|
|
|
|
|
|
|
| Developed |
|
|
|
|
364 |
|
|
|
77 |
|
|
|
1,729 |
|
|
|
– |
|
|
|
44 |
|
|
|
371 |
|
|
|
– |
|
|
|
269 |
|
|
|
48 |
|
|
|
2,902 |
|
| Undeveloped |
|
|
|
|
431 |
|
|
|
221 |
|
|
|
1,190 |
|
|
|
– |
|
|
|
58 |
|
|
|
374 |
|
|
|
– |
|
|
|
325 |
|
|
|
58 |
|
|
|
2,657 |
|
| |
|
|
|
|
795 |
|
|
|
298 |
|
|
|
2,919 |
|
|
|
– |
|
|
|
102 |
|
|
|
745 |
|
|
|
– |
|
|
|
594 |
|
|
|
106 |
|
|
|
5,559 |
|
| Changes attributable to |
|
|
|
|
|
|
|
|
|
|
|
|
|
|
|
|
|
|
|
|
|
|
|
|
|
|
|
|
|
|
|
|
|
|
|
|
|
|
|
|
|
|
| Revisions of previous estimates |
|
|
|
|
(1 |
) |
|
|
5 |
|
|
|
27 |
|
|
|
– |
|
|
|
6 |
|
|
|
(68 |
) |
|
|
– |
|
|
|
(131 |
) |
|
|
3 |
|
|
|
(159 |
) |
| Improved recovery |
|
|
|
|
14 |
|
|
|
8 |
|
|
|
97 |
|
|
|
– |
|
|
|
1 |
|
|
|
10 |
|
|
|
– |
|
|
|
70 |
|
|
|
6 |
|
|
|
206 |
|
| Purchases of reserves-in-place |
|
|
|
|
– |
|
|
|
– |
|
|
|
10 |
|
|
|
– |
|
|
|
7 |
|
|
|
– |
|
|
|
– |
|
|
|
4 |
|
|
|
– |
|
|
|
21 |
|
| Discoveries and extensions |
|
|
|
|
– |
|
|
|
– |
|
|
|
1 |
|
|
|
– |
|
|
|
1 |
|
|
|
19 |
|
|
|
– |
|
|
|
– |
|
|
|
– |
|
|
|
21 |
|
| Productionc |
|
|
|
|
(41 |
) |
|
|
(12 |
) |
|
|
(162 |
) |
|
|
– |
|
|
|
(13 |
) |
|
|
(68 |
) |
|
|
– |
|
|
|
(50 |
) |
|
|
(9 |
) |
|
|
(355 |
) |
| Sales of reserves-in-place |
|
|
|
|
(34 |
) |
|
|
– |
|
|
|
(34 |
) |
|
|
– |
|
|
|
(29 |
) |
|
|
(12 |
) |
|
|
– |
|
|
|
(31 |
) |
|
|
– |
|
|
|
(140 |
) |
| |
|
|
|
|
(62 |
) |
|
|
1 |
|
|
|
(61 |
) |
|
|
– |
|
|
|
(27 |
) |
|
|
(119 |
) |
|
|
– |
|
|
|
(138 |
) |
|
|
– |
|
|
|
(406 |
) |
| At 31 December 2011d |
|
|
|
|
|
|
|
|
|
|
|
|
|
|
|
|
|
|
|
|
|
|
|
|
|
|
|
|
|
|
|
|
|
|
|
|
|
|
|
|
|
|
| Developed |
|
|
|
|
288 |
|
|
|
69 |
|
|
|
1,685 |
|
|
|
– |
|
|
|
27 |
|
|
|
311 |
|
|
|
– |
|
|
|
177 |
|
|
|
59 |
|
|
|
2,616 |
|
| Undeveloped |
|
|
|
|
445 |
|
|
|
230 |
|
|
|
1,173 |
|
|
|
– |
|
|
|
48 |
|
|
|
315 |
|
|
|
– |
|
|
|
279 |
|
|
|
47 |
|
|
|
2,537 |
|
| |
|
|
|
|
733 |
|
|
|
299 |
|
|
|
2,858 |
|
|
|
– |
|
|
|
75 |
|
|
|
626 |
|
|
|
– |
|
|
|
456 |
|
|
|
106 |
|
|
|
5,153 |
|
| Equity-accounted entities (BP share)e |
|
| At 1 January 2011 |
|
|
|
|
|
|
|
|
|
|
|
|
|
|
|
|
|
|
|
|
|
|
|
|
|
|
|
|
|
|
|
|
|
|
|
|
|
|
|
|
|
|
| Developed |
|
|
|
|
– |
|
|
|
– |
|
|
|
– |
|
|
|
– |
|
|
|
408 |
|
|
|
– |
|
|
|
2,388 |
|
|
|
370 |
|
|
|
– |
|
|
|
3,166 |
|
| Undeveloped |
|
|
|
|
– |
|
|
|
– |
|
|
|
– |
|
|
|
– |
|
|
|
407 |
|
|
|
12 |
|
|
|
1,362 |
|
|
|
24 |
|
|
|
– |
|
|
|
1,805 |
|
| |
|
|
|
|
– |
|
|
|
– |
|
|
|
– |
|
|
|
– |
|
|
|
815 |
|
|
|
12 |
|
|
|
3,750 |
|
|
|
394 |
|
|
|
– |
|
|
|
4,971 |
|
| Changes attributable to |
|
|
|
|
|
|
|
|
|
|
|
|
|
|
|
|
|
|
|
|
|
|
|
|
|
|
|
|
|
|
|
|
|
|
|
|
|
|
|
|
|
|
| Revisions of previous estimates |
|
|
|
|
– |
|
|
|
– |
|
|
|
– |
|
|
|
– |
|
|
|
(12 |
) |
|
|
2 |
|
|
|
677 |
|
|
|
(5 |
) |
|
|
– |
|
|
|
662 |
|
| Improved recovery |
|
|
|
|
– |
|
|
|
– |
|
|
|
– |
|
|
|
– |
|
|
|
70 |
|
|
|
– |
|
|
|
73 |
|
|
|
– |
|
|
|
– |
|
|
|
143 |
|
| Purchases of reserves-in-place |
|
|
|
|
– |
|
|
|
– |
|
|
|
– |
|
|
|
– |
|
|
|
98 |
|
|
|
– |
|
|
|
– |
|
|
|
1 |
|
|
|
– |
|
|
|
99 |
|
| Discoveries and extensions |
|
|
|
|
– |
|
|
|
– |
|
|
|
– |
|
|
|
– |
|
|
|
– |
|
|
|
– |
|
|
|
25 |
|
|
|
– |
|
|
|
– |
|
|
|
25 |
|
| Production |
|
|
|
|
– |
|
|
|
– |
|
|
|
– |
|
|
|
– |
|
|
|
(30 |
) |
|
|
– |
|
|
|
(316 |
) |
|
|
(76 |
) |
|
|
– |
|
|
|
(422 |
) |
| Sales of reserves-in-place |
|
|
|
|
– |
|
|
|
– |
|
|
|
– |
|
|
|
– |
|
|
|
(244 |
) |
|
|
– |
|
|
|
– |
|
|
|
– |
|
|
|
– |
|
|
|
(244 |
) |
| |
|
|
|
|
– |
|
|
|
– |
|
|
|
– |
|
|
|
– |
|
|
|
(118 |
) |
|
|
2 |
|
|
|
459 |
|
|
|
(80 |
) |
|
|
– |
|
|
|
263 |
|
| At 31 December 2011f g |
|
|
|
|
|
|
|
|
|
|
|
|
|
|
|
|
|
|
|
|
|
|
|
|
|
|
|
|
|
|
|
|
|
|
|
|
|
|
|
|
|
|
| Developed |
|
|
|
|
– |
|
|
|
– |
|
|
|
– |
|
|
|
– |
|
|
|
349 |
|
|
|
– |
|
|
|
2,596 |
|
|
|
256 |
|
|
|
– |
|
|
|
3,201 |
|
| Undeveloped |
|
|
|
|
– |
|
|
|
– |
|
|
|
– |
|
|
|
– |
|
|
|
348 |
|
|
|
14 |
|
|
|
1,613 |
|
|
|
58 |
|
|
|
– |
|
|
|
2,033 |
|
| |
|
|
|
|
– |
|
|
|
– |
|
|
|
– |
|
|
|
– |
|
|
|
697 |
|
|
|
14 |
|
|
|
4,209 |
|
|
|
314 |
|
|
|
– |
|
|
|
5,234 |
|
| Total subsidiaries and equity-accounted entities (BP share) |
|
| At 1 January 2011 |
|
|
|
|
|
|
|
|
|
|
|
|
|
|
|
|
|
|
|
|
|
|
|
|
|
|
|
|
|
|
|
|
|
|
|
|
|
|
|
|
|
|
| Developed |
|
|
|
|
364 |
|
|
|
77 |
|
|
|
1,729 |
|
|
|
– |
|
|
|
452 |
|
|
|
371 |
|
|
|
2,388 |
|
|
|
639 |
|
|
|
48 |
|
|
|
6,068 |
|
| Undeveloped |
|
|
|
|
431 |
|
|
|
221 |
|
|
|
1,190 |
|
|
|
– |
|
|
|
465 |
|
|
|
386 |
|
|
|
1,362 |
|
|
|
349 |
|
|
|
58 |
|
|
|
4,462 |
|
| |
|
|
|
|
795 |
|
|
|
298 |
|
|
|
2,919 |
|
|
|
– |
|
|
|
917 |
|
|
|
757 |
|
|
|
3,750 |
|
|
|
988 |
|
|
|
106 |
|
|
|
10,530 |
|
| At 31 December 2011 |
|
|
|
|
|
|
|
|
|
|
|
|
|
|
|
|
|
|
|
|
|
|
|
|
|
|
|
|
|
|
|
|
|
|
|
|
|
|
|
|
|
|
| Developed |
|
|
|
|
288 |
|
|
|
69 |
|
|
|
1,685 |
|
|
|
– |
|
|
|
376 |
|
|
|
311 |
|
|
|
2,596 |
|
|
|
433 |
|
|
|
59 |
|
|
|
5,817 |
|
| Undeveloped |
|
|
|
|
445 |
|
|
|
230 |
|
|
|
1,173 |
|
|
|
– |
|
|
|
396 |
|
|
|
329 |
|
|
|
1,613 |
|
|
|
337 |
|
|
|
47 |
|
|
|
4,570 |
|
| |
|
|
|
|
733 |
|
|
|
299 |
|
|
|
2,858 |
|
|
|
– |
|
|
|
772 |
|
|
|
640 |
|
|
|
4,209 |
|
|
|
770 |
|
|
|
106 |
|
|
|
10,387 |
|
| a |
Crude oil includes NGLs and condensate. Proved reserves exclude royalties due to others, whether payable in cash or in kind, where the royalty owner has a direct interest in the underlying production and the option and
ability to make lifting and sales arrangements independently. |
| b |
Proved reserves in the Prudhoe Bay field in Alaska include an estimated 82 million barrels upon which a net profits royalty will be payable over the life of the field under the terms of the BP Prudhoe Bay Royalty
Trust. |
| c |
Excludes NGLs from processing plants in which an interest is held of 28 thousand barrels per day. |
| d |
Includes 616 million barrels of NGLs. Also includes 20 million barrels of crude oil in respect of the 30% non-controlling interest in BP Trinidad and Tobago LLC. |
| e |
Volumes of equity-accounted entities include volumes of equity-accounted investments of those entities. |
| f |
Includes 19 million barrels of NGLs. Also includes 310 million barrels of crude oil in respect of the 7.37% non-controlling interest in TNK-BP. |
| g |
Total proved liquid reserves held as part of our equity interest in TNK-BP is 4,305 million barrels, comprising 95 million barrels in Venezuela, one million barrels in Vietnam and 4,209 million barrels in
Russia. In 2011, BP aligned its reporting with TNK-BP by moving to a life of field reporting basis. Reasonable certainty of licence renewals is demonstrated by evidence of Russian subsoil law, track record of renewals within the industry and track
record of success in obtaining renewals by TNK-BP. This has resulted in an increase in proved liquid reserves of 221 million barrels. |
|
|
|
|
|
| BP Annual Report and Form 20-F 2013 |
|
|
215 |
|
Movements in estimated net proved reserves – continued
|
|
|
|
|
|
|
|
|
|
|
|
|
|
|
|
|
|
|
|
|
|
|
|
|
|
|
|
|
|
|
|
|
|
|
|
|
|
|
|
|
|
|
| |
|
|
|
billion cubic feet |
|
|
Natural gasa |
|
|
|
|
|
|
|
|
|
|
|
|
|
|
|
|
|
|
|
|
|
|
|
|
|
|
|
|
|
|
2011 |
|
| |
|
|
|
Europe
|
|
|
North
America |
|
|
South
America |
|
|
Africa
|
|
|
Asia
|
|
|
Australasia
|
|
|
Total |
|
| |
|
|
|
UK |
|
|
Rest of
Europe |
|
|
US |
|
|
Rest of
North America |
|
|
|
|
|
|
|
|
Russia |
|
|
Rest of
Asia |
|
|
|
|
|
|
|
| Subsidiaries |
|
| At 1 January 2011 |
|
|
|
|
|
|
|
|
|
|
|
|
|
|
|
|
|
|
|
|
|
|
|
|
|
|
|
|
|
|
|
|
|
|
|
|
|
|
|
|
|
|
| Developed |
|
|
|
|
1,416 |
|
|
|
40 |
|
|
|
9,495 |
|
|
|
58 |
|
|
|
3,575 |
|
|
|
1,329 |
|
|
|
– |
|
|
|
1,290 |
|
|
|
3,563 |
|
|
|
20,766 |
|
| Undeveloped |
|
|
|
|
829 |
|
|
|
430 |
|
|
|
4,248 |
|
|
|
– |
|
|
|
6,575 |
|
|
|
2,351 |
|
|
|
– |
|
|
|
268 |
|
|
|
2,342 |
|
|
|
17,043 |
|
| |
|
|
|
|
2,245 |
|
|
|
470 |
|
|
|
13,743 |
|
|
|
58 |
|
|
|
10,150 |
|
|
|
3,680 |
|
|
|
– |
|
|
|
1,558 |
|
|
|
5,905 |
|
|
|
37,809 |
|
| Changes attributable to |
|
|
|
|
|
|
|
|
|
|
|
|
|
|
|
|
|
|
|
|
|
|
|
|
|
|
|
|
|
|
|
|
|
|
|
|
|
|
|
|
|
|
| Revisions of previous estimates |
|
|
|
|
169 |
|
|
|
30 |
|
|
|
– |
|
|
|
(9 |
) |
|
|
202 |
|
|
|
(206 |
) |
|
|
– |
|
|
|
69 |
|
|
|
299 |
|
|
|
554 |
|
| Improved recovery |
|
|
|
|
56 |
|
|
|
1 |
|
|
|
597 |
|
|
|
– |
|
|
|
84 |
|
|
|
15 |
|
|
|
– |
|
|
|
28 |
|
|
|
22 |
|
|
|
803 |
|
| Purchases of reserves-in-place |
|
|
|
|
8 |
|
|
|
– |
|
|
|
93 |
|
|
|
7 |
|
|
|
– |
|
|
|
– |
|
|
|
– |
|
|
|
310 |
|
|
|
– |
|
|
|
418 |
|
| Discoveries and extensions |
|
|
|
|
– |
|
|
|
– |
|
|
|
219 |
|
|
|
– |
|
|
|
47 |
|
|
|
– |
|
|
|
– |
|
|
|
– |
|
|
|
– |
|
|
|
266 |
|
| Productionb |
|
|
|
|
(146 |
) |
|
|
(8 |
) |
|
|
(737 |
) |
|
|
(5 |
) |
|
|
(811 |
) |
|
|
(232 |
) |
|
|
– |
|
|
|
(244 |
) |
|
|
(291 |
) |
|
|
(2,474 |
) |
| Sales of reserves-in-place |
|
|
|
|
(12 |
) |
|
|
– |
|
|
|
(363 |
) |
|
|
(23 |
) |
|
|
(274 |
) |
|
|
– |
|
|
|
– |
|
|
|
(323 |
) |
|
|
– |
|
|
|
(995 |
) |
| |
|
|
|
|
75 |
|
|
|
23 |
|
|
|
(191 |
) |
|
|
(30 |
) |
|
|
(752 |
) |
|
|
(423 |
) |
|
|
– |
|
|
|
(160 |
) |
|
|
30 |
|
|
|
(1,428 |
) |
| At 31 December 2011c |
|
|
|
|
|
|
|
|
|
|
|
|
|
|
|
|
|
|
|
|
|
|
|
|
|
|
|
|
|
|
|
|
|
|
|
|
|
|
|
|
|
|
| Developed |
|
|
|
|
1,411 |
|
|
|
43 |
|
|
|
9,721 |
|
|
|
28 |
|
|
|
2,869 |
|
|
|
1,224 |
|
|
|
– |
|
|
|
1,034 |
|
|
|
3,570 |
|
|
|
19,900 |
|
| Undeveloped |
|
|
|
|
909 |
|
|
|
450 |
|
|
|
3,831 |
|
|
|
– |
|
|
|
6,529 |
|
|
|
2,033 |
|
|
|
– |
|
|
|
364 |
|
|
|
2,365 |
|
|
|
16,481 |
|
| |
|
|
|
|
2,320 |
|
|
|
493 |
|
|
|
13,552 |
|
|
|
28 |
|
|
|
9,398 |
|
|
|
3,257 |
|
|
|
– |
|
|
|
1,398 |
|
|
|
5,935 |
|
|
|
36,381 |
|
| Equity-accounted entities (BP share)d |
|
| At 1 January 2011 |
|
|
|
|
|
|
|
|
|
|
|
|
|
|
|
|
|
|
|
|
|
|
|
|
|
|
|
|
|
|
|
|
|
|
|
|
|
|
|
|
|
|
| Developed |
|
|
|
|
– |
|
|
|
– |
|
|
|
– |
|
|
|
– |
|
|
|
1,075 |
|
|
|
– |
|
|
|
1,900 |
|
|
|
71 |
|
|
|
– |
|
|
|
3,046 |
|
| Undeveloped |
|
|
|
|
– |
|
|
|
– |
|
|
|
– |
|
|
|
– |
|
|
|
1,192 |
|
|
|
175 |
|
|
|
459 |
|
|
|
19 |
|
|
|
– |
|
|
|
1,845 |
|
| |
|
|
|
|
– |
|
|
|
– |
|
|
|
– |
|
|
|
– |
|
|
|
2,267 |
|
|
|
175 |
|
|
|
2,359 |
|
|
|
90 |
|
|
|
– |
|
|
|
4,891 |
|
| Changes attributable to |
|
|
|
|
|
|
|
|
|
|
|
|
|
|
|
|
|
|
|
|
|
|
|
|
|
|
|
|
|
|
|
|
|
|
|
|
|
|
|
|
|
|
| Revisions of previous estimates |
|
|
|
|
– |
|
|
|
– |
|
|
|
– |
|
|
|
– |
|
|
|
(75 |
) |
|
|
20 |
|
|
|
683 |
|
|
|
(3 |
) |
|
|
– |
|
|
|
625 |
|
| Improved recovery |
|
|
|
|
– |
|
|
|
– |
|
|
|
– |
|
|
|
– |
|
|
|
190 |
|
|
|
– |
|
|
|
– |
|
|
|
12 |
|
|
|
– |
|
|
|
202 |
|
| Purchases of reserves-in-place |
|
|
|
|
– |
|
|
|
– |
|
|
|
– |
|
|
|
– |
|
|
|
31 |
|
|
|
– |
|
|
|
– |
|
|
|
76 |
|
|
|
– |
|
|
|
107 |
|
| Discoveries and extensions |
|
|
|
|
– |
|
|
|
– |
|
|
|
– |
|
|
|
– |
|
|
|
– |
|
|
|
– |
|
|
|
– |
|
|
|
– |
|
|
|
– |
|
|
|
– |
|
| Productionb |
|
|
|
|
– |
|
|
|
– |
|
|
|
– |
|
|
|
– |
|
|
|
(167 |
) |
|
|
– |
|
|
|
(264 |
) |
|
|
(20 |
) |
|
|
– |
|
|
|
(451 |
) |
| Sales of reserves-in-place |
|
|
|
|
– |
|
|
|
– |
|
|
|
– |
|
|
|
– |
|
|
|
(96 |
) |
|
|
– |
|
|
|
– |
|
|
|
– |
|
|
|
– |
|
|
|
(96 |
) |
| |
|
|
|
|
– |
|
|
|
– |
|
|
|
– |
|
|
|
– |
|
|
|
(117 |
) |
|
|
20 |
|
|
|
419 |
|
|
|
65 |
|
|
|
– |
|
|
|
387 |
|
| At 31 December 2011e f |
|
|
|
|
|
|
|
|
|
|
|
|
|
|
|
|
|
|
|
|
|
|
|
|
|
|
|
|
|
|
|
|
|
|
|
|
|
|
|
|
|
|
| Developed |
|
|
|
|
– |
|
|
|
– |
|
|
|
– |
|
|
|
– |
|
|
|
1,144 |
|
|
|
– |
|
|
|
2,119 |
|
|
|
104 |
|
|
|
– |
|
|
|
3,367 |
|
| Undeveloped |
|
|
|
|
– |
|
|
|
– |
|
|
|
– |
|
|
|
– |
|
|
|
1,006 |
|
|
|
195 |
|
|
|
659 |
|
|
|
51 |
|
|
|
– |
|
|
|
1,911 |
|
| |
|
|
|
|
– |
|
|
|
– |
|
|
|
– |
|
|
|
– |
|
|
|
2,150 |
|
|
|
195 |
|
|
|
2,778 |
|
|
|
155 |
|
|
|
– |
|
|
|
5,278 |
|
| Total subsidiaries and equity-accounted entities (BP share) |
|
| At 1 January 2011 |
|
|
|
|
|
|
|
|
|
|
|
|
|
|
|
|
|
|
|
|
|
|
|
|
|
|
|
|
|
|
|
|
|
|
|
|
|
|
|
|
|
|
| Developed |
|
|
|
|
1,416 |
|
|
|
40 |
|
|
|
9,495 |
|
|
|
58 |
|
|
|
4,650 |
|
|
|
1,329 |
|
|
|
1,900 |
|
|
|
1,361 |
|
|
|
3,563 |
|
|
|
23,812 |
|
| Undeveloped |
|
|
|
|
829 |
|
|
|
430 |
|
|
|
4,248 |
|
|
|
– |
|
|
|
7,767 |
|
|
|
2,526 |
|
|
|
459 |
|
|
|
287 |
|
|
|
2,342 |
|
|
|
18,888 |
|
| |
|
|
|
|
2,245 |
|
|
|
470 |
|
|
|
13,743 |
|
|
|
58 |
|
|
|
12,417 |
|
|
|
3,855 |
|
|
|
2,359 |
|
|
|
1,648 |
|
|
|
5,905 |
|
|
|
42,700 |
|
| At 31 December 2011 |
|
|
|
|
|
|
|
|
|
|
|
|
|
|
|
|
|
|
|
|
|
|
|
|
|
|
|
|
|
|
|
|
|
|
|
|
|
|
|
|
|
|
| Developed |
|
|
|
|
1,411 |
|
|
|
43 |
|
|
|
9,721 |
|
|
|
28 |
|
|
|
4,013 |
|
|
|
1,224 |
|
|
|
2,119 |
|
|
|
1,138 |
|
|
|
3,570 |
|
|
|
23,267 |
|
| Undeveloped |
|
|
|
|
909 |
|
|
|
450 |
|
|
|
3,831 |
|
|
|
– |
|
|
|
7,535 |
|
|
|
2,228 |
|
|
|
659 |
|
|
|
415 |
|
|
|
2,365 |
|
|
|
18,392 |
|
| |
|
|
|
|
2,320 |
|
|
|
493 |
|
|
|
13,552 |
|
|
|
28 |
|
|
|
11,548 |
|
|
|
3,452 |
|
|
|
2,778 |
|
|
|
1,553 |
|
|
|
5,935 |
|
|
|
41,659 |
|
| a |
Proved reserves exclude royalties due to others, whether payable in cash or in kind, where the royalty owner has a direct interest in the underlying production and the option and ability to make lifting and sales
arrangements independently. |
| b |
Includes 196 billion cubic feet of natural gas consumed in operations,155 billion cubic feet in subsidiaries, 41 billion cubic feet in equity-accounted entities and excludes 14 billion cubic feet of produced
non-hydrocarbon components which meet regulatory requirements for sales. |
| c |
Includes 2,759 billion cubic feet of natural gas in respect of the 30% non-controlling interest in BP Trinidad and Tobago LLC. |
| d |
Volumes of equity-accounted entities include volumes of equity-accounted investments of those entities. |
| e |
Includes 174 billion cubic feet of natural gas in respect of the 6.27% non-controlling interest in TNK-BP. |
| f |
Total proved gas reserves held as part of our equity interest in TNK-BP is 2,881 billion cubic feet, comprising 30 billion cubic feet in Venezuela, 73 billion cubic feet in Vietnam and 2,778 billion cubic feet in
Russia. In 2011, BP aligned its reporting with TNK-BP by moving to a life of field reporting basis. Reasonable certainty of licence renewals is demonstrated by evidence of Russian subsoil law, track record of renewals within the industry and track
record of success in obtaining renewals by TNK-BP. This has resulted in an increase in proved gas reserves of 185 billion cubic feet. |
|
|
|
| 216 |
|
BP Annual Report and Form 20-F 2013 |
Movements in estimated net proved reserves – continued
|
|
|
|
|
|
|
|
|
|
|
| |
|
|
|
|
million barrels |
|
| Bitumena |
|
|
|
|
|
|
|
|
2011 |
|
| |
|
|
|
|
Rest of
North
America |
|
|
|
Total |
|
| Subsidiaries |
|
|
|
|
|
|
|
|
|
|
| At 1 January 2011 |
|
|
|
|
|
|
|
|
|
|
| Developed |
|
|
|
|
– |
|
|
|
– |
|
| Undeveloped |
|
|
|
|
179 |
|
|
|
179 |
|
| |
|
|
|
|
179 |
|
|
|
179 |
|
| Changes attributable to |
|
|
|
|
|
|
|
|
|
|
| Revisions of previous estimates |
|
|
|
|
(1 |
) |
|
|
(1 |
) |
| Improved recovery |
|
|
|
|
– |
|
|
|
– |
|
| Purchases of reserves-in-place |
|
|
|
|
– |
|
|
|
– |
|
| Discoveries and extensions |
|
|
|
|
– |
|
|
|
– |
|
| Production |
|
|
|
|
– |
|
|
|
– |
|
| Sales of reserves-in-place |
|
|
|
|
– |
|
|
|
– |
|
| |
|
|
|
|
(1 |
) |
|
|
(1 |
) |
| At 31 December 2011 |
|
|
|
|
|
|
|
|
|
|
| Developed |
|
|
|
|
– |
|
|
|
– |
|
| Undeveloped |
|
|
|
|
178 |
|
|
|
178 |
|
| |
|
|
|
|
178 |
|
|
|
178 |
|
| a |
Proved reserves exclude royalties due to others, whether payable in cash or in kind, where the royalty owner has a direct interest in the underlying production and the option and ability to make lifting and sales
arrangements independently. |
|
|
|
|
|
| BP Annual Report and Form 20-F 2013 |
|
|
217 |
|
Movements in estimated net proved reserves – continued
|
|
|
|
|
|
|
|
|
|
|
|
|
|
|
|
|
|
|
|
|
|
|
|
|
|
|
|
|
|
|
|
|
|
|
|
|
|
|
|
|
|
|
| |
|
|
|
million barrels of oil equivalentb |
|
| Total hydrocarbonsa |
|
|
|
|
|
|
|
|
|
|
|
|
|
|
|
|
|
|
|
|
|
|
|
|
|
|
|
|
|
|
2011 |
|
| |
|
|
|
Europe
|
|
|
North
America |
|
|
South
America |
|
|
Africa
|
|
|
Asia
|
|
|
Australasia
|
|
|
Total |
|
| |
|
|
|
UK |
|
|
Rest of
Europe |
|
|
USc |
|
|
Rest of
North America |
|
|
|
|
|
|
|
|
Russia |
|
|
Rest of
Asia |
|
|
|
|
|
|
|
| Subsidiaries |
|
|
|
|
|
|
|
|
|
|
|
|
|
|
|
|
|
|
|
|
|
|
|
|
|
|
|
|
|
|
|
|
|
|
|
|
|
|
|
|
|
|
| At 1 January 2011 |
|
|
|
|
|
|
|
|
|
|
|
|
|
|
|
|
|
|
|
|
|
|
|
|
|
|
|
|
|
|
|
|
|
|
|
|
|
|
|
|
|
|
| Developed |
|
|
|
|
608 |
|
|
|
84 |
|
|
|
3,366 |
|
|
|
10 |
|
|
|
660 |
|
|
|
600 |
|
|
|
– |
|
|
|
491 |
|
|
|
662 |
|
|
|
6,481 |
|
| Undeveloped |
|
|
|
|
574 |
|
|
|
295 |
|
|
|
1,923 |
|
|
|
179 |
|
|
|
1,192 |
|
|
|
779 |
|
|
|
– |
|
|
|
371 |
|
|
|
462 |
|
|
|
5,775 |
|
| |
|
|
|
|
1,182 |
|
|
|
379 |
|
|
|
5,289 |
|
|
|
189 |
|
|
|
1,852 |
|
|
|
1,379 |
|
|
|
– |
|
|
|
862 |
|
|
|
1,124 |
|
|
|
12,256 |
|
| Changes attributable to |
|
|
|
|
|
|
|
|
|
|
|
|
|
|
|
|
|
|
|
|
|
|
|
|
|
|
|
|
|
|
|
|
|
|
|
|
|
|
|
|
|
|
| Revisions of previous estimates |
|
|
|
|
28 |
|
|
|
10 |
|
|
|
27 |
|
|
|
(3 |
) |
|
|
41 |
|
|
|
(103 |
) |
|
|
– |
|
|
|
(119 |
) |
|
|
55 |
|
|
|
(64 |
) |
| Improved recovery |
|
|
|
|
24 |
|
|
|
8 |
|
|
|
200 |
|
|
|
– |
|
|
|
15 |
|
|
|
12 |
|
|
|
– |
|
|
|
75 |
|
|
|
10 |
|
|
|
344 |
|
| Purchases of reserves-in-place |
|
|
|
|
1 |
|
|
|
– |
|
|
|
26 |
|
|
|
2 |
|
|
|
7 |
|
|
|
– |
|
|
|
– |
|
|
|
58 |
|
|
|
– |
|
|
|
94 |
|
| Discoveries and extensions |
|
|
|
|
– |
|
|
|
– |
|
|
|
39 |
|
|
|
– |
|
|
|
9 |
|
|
|
19 |
|
|
|
– |
|
|
|
– |
|
|
|
– |
|
|
|
67 |
|
| Productiond e |
|
|
|
|
(66 |
) |
|
|
(13 |
) |
|
|
(289 |
) |
|
|
(1 |
) |
|
|
(153 |
) |
|
|
(108 |
) |
|
|
– |
|
|
|
(92 |
) |
|
|
(59 |
) |
|
|
(781 |
) |
| Sales of reserves-in-place |
|
|
|
|
(36 |
) |
|
|
– |
|
|
|
(97 |
) |
|
|
(4 |
) |
|
|
(76 |
) |
|
|
(12 |
) |
|
|
– |
|
|
|
(87 |
) |
|
|
– |
|
|
|
(312 |
) |
| |
|
|
|
|
(49 |
) |
|
|
5 |
|
|
|
(94 |
) |
|
|
(6 |
) |
|
|
(157 |
) |
|
|
(192 |
) |
|
|
– |
|
|
|
(165 |
) |
|
|
6 |
|
|
|
(652 |
) |
| At 31 December 2011f |
|
|
|
|
|
|
|
|
|
|
|
|
|
|
|
|
|
|
|
|
|
|
|
|
|
|
|
|
|
|
|
|
|
|
|
|
|
|
|
|
|
|
| Developed |
|
|
|
|
531 |
|
|
|
76 |
|
|
|
3,362 |
|
|
|
5 |
|
|
|
522 |
|
|
|
522 |
|
|
|
– |
|
|
|
355 |
|
|
|
675 |
|
|
|
6,048 |
|
| Undeveloped |
|
|
|
|
602 |
|
|
|
308 |
|
|
|
1,833 |
|
|
|
178 |
|
|
|
1,173 |
|
|
|
665 |
|
|
|
– |
|
|
|
342 |
|
|
|
455 |
|
|
|
5,556 |
|
| |
|
|
|
|
1,133 |
|
|
|
384 |
|
|
|
5,195 |
|
|
|
183 |
|
|
|
1,695 |
|
|
|
1,187 |
|
|
|
– |
|
|
|
697 |
|
|
|
1,130 |
|
|
|
11,604 |
|
| Equity-accounted entities (BP share)g |
|
|
|
|
|
|
|
|
|
|
|
|
|
|
|
|
|
|
|
|
|
|
|
|
|
|
|
|
|
| At 1 January 2011 |
|
|
|
|
|
|
|
|
|
|
|
|
|
|
|
|
|
|
|
|
|
|
|
|
|
|
|
|
|
|
|
|
|
|
|
|
|
|
|
|
|
|
| Developed |
|
|
|
|
– |
|
|
|
– |
|
|
|
– |
|
|
|
– |
|
|
|
593 |
|
|
|
– |
|
|
|
2,716 |
|
|
|
382 |
|
|
|
– |
|
|
|
3,691 |
|
| Undeveloped |
|
|
|
|
– |
|
|
|
– |
|
|
|
– |
|
|
|
– |
|
|
|
613 |
|
|
|
43 |
|
|
|
1,441 |
|
|
|
27 |
|
|
|
– |
|
|
|
2,124 |
|
| |
|
|
|
|
– |
|
|
|
– |
|
|
|
– |
|
|
|
– |
|
|
|
1,206 |
|
|
|
43 |
|
|
|
4,157 |
|
|
|
409 |
|
|
|
– |
|
|
|
5,815 |
|
| Changes attributable to |
|
|
|
|
|
|
|
|
|
|
|
|
|
|
|
|
|
|
|
|
|
|
|
|
|
|
|
|
|
|
|
|
|
|
|
|
|
|
|
|
|
|
| Revisions of previous estimates |
|
|
|
|
– |
|
|
|
– |
|
|
|
– |
|
|
|
– |
|
|
|
(25 |
) |
|
|
5 |
|
|
|
795 |
|
|
|
(5 |
) |
|
|
– |
|
|
|
770 |
|
| Improved recovery |
|
|
|
|
– |
|
|
|
– |
|
|
|
– |
|
|
|
– |
|
|
|
103 |
|
|
|
– |
|
|
|
73 |
|
|
|
2 |
|
|
|
– |
|
|
|
178 |
|
| Purchases of reserves-in-place |
|
|
|
|
– |
|
|
|
– |
|
|
|
– |
|
|
|
– |
|
|
|
103 |
|
|
|
– |
|
|
|
– |
|
|
|
14 |
|
|
|
– |
|
|
|
117 |
|
| Discoveries and extensions |
|
|
|
|
– |
|
|
|
– |
|
|
|
– |
|
|
|
– |
|
|
|
– |
|
|
|
– |
|
|
|
25 |
|
|
|
– |
|
|
|
– |
|
|
|
25 |
|
| Productiond e |
|
|
|
|
– |
|
|
|
– |
|
|
|
– |
|
|
|
– |
|
|
|
(59 |
) |
|
|
– |
|
|
|
(362 |
) |
|
|
(80 |
) |
|
|
– |
|
|
|
(501 |
) |
| Sales of reserves-in-place |
|
|
|
|
– |
|
|
|
– |
|
|
|
– |
|
|
|
– |
|
|
|
(260 |
) |
|
|
– |
|
|
|
– |
|
|
|
– |
|
|
|
– |
|
|
|
(260 |
) |
| |
|
|
|
|
– |
|
|
|
– |
|
|
|
– |
|
|
|
– |
|
|
|
(138 |
) |
|
|
5 |
|
|
|
531 |
|
|
|
(69 |
) |
|
|
– |
|
|
|
329 |
|
| At 31 December 2011h i |
|
|
|
|
|
|
|
|
|
|
|
|
|
|
|
|
|
|
|
|
|
|
|
|
|
|
|
|
|
|
|
|
|
|
|
|
|
|
|
|
|
|
| Developed |
|
|
|
|
– |
|
|
|
– |
|
|
|
– |
|
|
|
– |
|
|
|
546 |
|
|
|
– |
|
|
|
2,961 |
|
|
|
274 |
|
|
|
– |
|
|
|
3,781 |
|
| Undeveloped |
|
|
|
|
– |
|
|
|
– |
|
|
|
– |
|
|
|
– |
|
|
|
522 |
|
|
|
48 |
|
|
|
1,727 |
|
|
|
66 |
|
|
|
– |
|
|
|
2,363 |
|
| |
|
|
|
|
– |
|
|
|
– |
|
|
|
– |
|
|
|
– |
|
|
|
1,068 |
|
|
|
48 |
|
|
|
4,688 |
|
|
|
340 |
|
|
|
– |
|
|
|
6,144 |
|
| Total subsidiaries and equity-accounted entities (BP share) |
|
|
|
|
|
|
|
|
|
|
|
|
|
|
|
|
|
|
|
|
|
|
|
|
|
|
|
|
|
| At 1 January 2011 |
|
|
|
|
|
|
|
|
|
|
|
|
|
|
|
|
|
|
|
|
|
|
|
|
|
|
|
|
|
|
|
|
|
|
|
|
|
|
|
|
|
|
| Developed |
|
|
|
|
608 |
|
|
|
84 |
|
|
|
3,366 |
|
|
|
10 |
|
|
|
1,253 |
|
|
|
600 |
|
|
|
2,716 |
|
|
|
873 |
|
|
|
662 |
|
|
|
10,172 |
|
| Undeveloped |
|
|
|
|
574 |
|
|
|
295 |
|
|
|
1,923 |
|
|
|
179 |
|
|
|
1,805 |
|
|
|
822 |
|
|
|
1,441 |
|
|
|
398 |
|
|
|
462 |
|
|
|
7,899 |
|
| |
|
|
|
|
1,182 |
|
|
|
379 |
|
|
|
5,289 |
|
|
|
189 |
|
|
|
3,058 |
|
|
|
1,422 |
|
|
|
4,157 |
|
|
|
1,271 |
|
|
|
1,124 |
|
|
|
18,071 |
|
| At 31 December 2011 |
|
|
|
|
|
|
|
|
|
|
|
|
|
|
|
|
|
|
|
|
|
|
|
|
|
|
|
|
|
|
|
|
|
|
|
|
|
|
|
|
|
|
| Developed |
|
|
|
|
531 |
|
|
|
76 |
|
|
|
3,362 |
|
|
|
5 |
|
|
|
1,068 |
|
|
|
522 |
|
|
|
2,961 |
|
|
|
629 |
|
|
|
675 |
|
|
|
9,829 |
|
| Undeveloped |
|
|
|
|
602 |
|
|
|
308 |
|
|
|
1,833 |
|
|
|
178 |
|
|
|
1,695 |
|
|
|
713 |
|
|
|
1,727 |
|
|
|
408 |
|
|
|
455 |
|
|
|
7,919 |
|
| |
|
|
|
|
1,133 |
|
|
|
384 |
|
|
|
5,195 |
|
|
|
183 |
|
|
|
2,763 |
|
|
|
1,235 |
|
|
|
4,688 |
|
|
|
1,037 |
|
|
|
1,130 |
|
|
|
17,748 |
|
| a |
Proved reserves exclude royalties due to others, whether payable in cash or in kind, where the royalty owner has a direct interest in the underlying production and the option and ability to make lifting and sales
arrangements independently. |
| b |
5.8 billion cubic feet of natural gas = 1 million barrels of oil equivalent. |
| c |
Proved reserves in the Prudhoe Bay field in Alaska include an estimated 82 million barrels of oil equivalent upon which a net profits royalty will be payable over the life of the field under the terms of the BP
Prudhoe Bay Royalty Trust. |
| d |
Excludes NGLs from processing plants in which an interest is held of 28 thousand barrels of oil equivalent a day. |
| e |
Includes 34 million barrels of oil equivalent of natural gas consumed in operations, 27 million barrels of oil equivalent in subsidiaries, seven million barrels of oil equivalent in equity-accounted entities
and excludes two million barrels of oil equivalent of produced non-hydrocarbon components which meet regulatory requirements for sales. |
| f |
Includes 616 million barrels of NGLs. Also includes 496 million barrels of oil equivalent in respect of the 30% non-controlling interest in BP Trinidad and Tobago LLC. |
| g |
Volumes of equity-accounted entities include volumes of equity-accounted investments of those entities. |
| h |
Includes 19 million barrels of NGLs. Also includes 340 million barrels of oil equivalent in respect of the non-controlling interest in TNK-BP. |
| i |
Total proved reserves held as part of our equity interest in TNK-BP is 4,802 million barrels of oil equivalent, comprising 100 million barrels of oil equivalent in Venezuela, 14 million barrels of oil
equivalent in Vietnam and 4,688 million barrels of oil equivalent in Russia. In 2011, BP aligned its reporting with TNK-BP by moving to a life of field reporting basis. Reasonable certainty of licence renewals is demonstrated by evidence of
Russian subsoil law, track record of renewals within the industry and track record of success in obtaining renewals by TNK-BP. This has resulted in an increase in proved reserves of 253 million barrels of oil equivalent. |
|
|
|
| 218 |
|
BP Annual Report and Form 20-F 2013 |
Standardized measure of discounted
future net cash flows and changes therein relating to proved oil and gas reserves
The following tables set out the standardized measure of discounted future
net cash flows, and changes therein, relating to crude oil and natural gas production from the group’s estimated proved reserves. This information is prepared in compliance with FASB Oil and Gas Disclosures requirements.
Future net cash flows have been prepared on the basis of certain assumptions which may or may not be realized. These include the timing of future production, the
estimation of crude oil and natural gas reserves and the application of average crude oil and natural gas prices and exchange rates from the previous 12 months. Furthermore, both proved reserves estimates and production forecasts are subject to
revision as further technical information becomes available and economic conditions change. BP cautions against relying on the information presented because of the highly arbitrary nature of the assumptions on which it is based and its lack of
comparability with the historical cost information presented in the financial statements.
|
|
|
|
|
|
|
|
|
|
|
|
|
|
|
|
|
|
|
|
|
|
|
|
|
|
|
|
|
|
|
|
|
|
|
|
|
|
|
|
|
|
|
| |
|
|
|
$ million |
|
| |
|
|
|
|
|
|
|
|
|
|
|
|
|
|
|
|
|
|
|
|
|
|
|
|
|
|
|
|
|
|
2013 |
|
| |
|
|
|
Europe
|
|
|
North
America |
|
|
South
America |
|
|
Africa
|
|
|
Asia
|
|
|
Australasia
|
|
|
Total |
|
| |
|
|
|
UK |
|
|
Rest of
Europe |
|
|
US |
|
|
Rest of
North America |
|
|
|
|
|
|
|
|
Russia |
|
|
Rest of
Asia |
|
|
|
|
|
|
|
| At 31 December 2013 |
|
|
|
|
|
|
|
|
|
|
|
|
|
|
|
|
|
|
|
|
|
|
|
|
|
|
|
|
|
|
|
|
|
|
|
|
|
|
|
|
|
|
| Subsidiaries |
|
|
|
|
|
|
|
|
|
|
|
|
|
|
|
|
|
|
|
|
|
|
|
|
|
|
|
|
|
|
|
|
|
|
|
|
|
|
|
|
|
|
| Future cash inflowsa |
|
|
|
|
66,200 |
|
|
|
26,300 |
|
|
|
234,500 |
|
|
|
9,400 |
|
|
|
40,000 |
|
|
|
67,500 |
|
|
|
– |
|
|
|
89,000 |
|
|
|
57,600 |
|
|
|
590,500 |
|
| Future production costb |
|
|
|
|
21,900 |
|
|
|
11,200 |
|
|
|
99,000 |
|
|
|
4,600 |
|
|
|
11,600 |
|
|
|
17,800 |
|
|
|
– |
|
|
|
35,000 |
|
|
|
20,000 |
|
|
|
221,100 |
|
| Future development costb |
|
|
|
|
6,500 |
|
|
|
2,000 |
|
|
|
27,700 |
|
|
|
2,000 |
|
|
|
7,600 |
|
|
|
10,900 |
|
|
|
– |
|
|
|
23,700 |
|
|
|
6,900 |
|
|
|
87,300 |
|
| Future taxationc |
|
|
|
|
23,900 |
|
|
|
8,000 |
|
|
|
37,000 |
|
|
|
400 |
|
|
|
11,100 |
|
|
|
14,300 |
|
|
|
– |
|
|
|
6,200 |
|
|
|
8,100 |
|
|
|
109,000 |
|
| Future net cash flows |
|
|
|
|
13,900 |
|
|
|
5,100 |
|
|
|
70,800 |
|
|
|
2,400 |
|
|
|
9,700 |
|
|
|
24,500 |
|
|
|
– |
|
|
|
24,100 |
|
|
|
22,600 |
|
|
|
173,100 |
|
| 10% annual discountd |
|
|
|
|
6,800 |
|
|
|
2,200 |
|
|
|
34,300 |
|
|
|
1,900 |
|
|
|
4,200 |
|
|
|
9,300 |
|
|
|
– |
|
|
|
13,300 |
|
|
|
12,800 |
|
|
|
84,800 |
|
| Standardized measure of discounted future net cash
flowse |
|
|
|
|
7,100 |
|
|
|
2,900 |
|
|
|
36,500 |
|
|
|
500 |
|
|
|
5,500 |
|
|
|
15,200 |
|
|
|
– |
|
|
|
10,800 |
|
|
|
9,800 |
|
|
|
88,300 |
|
| Equity-accounted entities (BP share)f |
|
| Future cash inflowsa |
|
|
|
|
– |
|
|
|
– |
|
|
|
– |
|
|
|
– |
|
|
|
45,800 |
|
|
|
– |
|
|
|
255,600 |
|
|
|
14,300 |
|
|
|
– |
|
|
|
315,700 |
|
| Future production costb |
|
|
|
|
– |
|
|
|
– |
|
|
|
– |
|
|
|
– |
|
|
|
22,500 |
|
|
|
– |
|
|
|
139,000 |
|
|
|
11,800 |
|
|
|
– |
|
|
|
173,300 |
|
| Future development costb |
|
|
|
|
– |
|
|
|
– |
|
|
|
– |
|
|
|
– |
|
|
|
6,000 |
|
|
|
– |
|
|
|
19,700 |
|
|
|
2,100 |
|
|
|
– |
|
|
|
27,800 |
|
| Future taxationc |
|
|
|
|
– |
|
|
|
– |
|
|
|
– |
|
|
|
– |
|
|
|
5,900 |
|
|
|
– |
|
|
|
15,200 |
|
|
|
100 |
|
|
|
– |
|
|
|
21,200 |
|
| Future net cash flows |
|
|
|
|
– |
|
|
|
– |
|
|
|
– |
|
|
|
– |
|
|
|
11,400 |
|
|
|
– |
|
|
|
81,700 |
|
|
|
300 |
|
|
|
– |
|
|
|
93,400 |
|
| 10% annual discountd |
|
|
|
|
– |
|
|
|
– |
|
|
|
– |
|
|
|
– |
|
|
|
6,900 |
|
|
|
– |
|
|
|
48,700 |
|
|
|
100 |
|
|
|
– |
|
|
|
55,700 |
|
| Standardized measure of discounted future net cash flowsg
h |
|
|
|
|
– |
|
|
|
– |
|
|
|
– |
|
|
|
– |
|
|
|
4,500 |
|
|
|
– |
|
|
|
33,000 |
|
|
|
200 |
|
|
|
– |
|
|
|
37,700 |
|
| Total subsidiaries and equity-accounted entities |
|
| Standardized measure of discounted future net cash flows |
|
|
|
|
7,100 |
|
|
|
2,900 |
|
|
|
36,500 |
|
|
|
500 |
|
|
|
10,000 |
|
|
|
15,200 |
|
|
|
33,000 |
|
|
|
11,000 |
|
|
|
9,800 |
|
|
|
126,000 |
|
The following are the principal sources of change in the standardized measure of discounted future net cash flows:
|
|
|
|
|
|
|
|
|
|
|
|
|
|
|
| |
|
|
|
$ million |
|
| |
|
|
|
Subsidiaries |
|
|
Equity-accounted
entities (BP share) |
|
|
Total subsidiaries and
equity-accounted entities |
|
| Sales and transfers of oil and gas produced, net of production costs |
|
|
|
|
(30,600 |
) |
|
|
(7,900 |
) |
|
|
(38,500 |
) |
| Development costs for the current year as estimated in previous year |
|
|
|
|
14,000 |
|
|
|
3,200 |
|
|
|
17,200 |
|
| Extensions, discoveries and improved recovery, less related costs |
|
|
|
|
1,900 |
|
|
|
2,000 |
|
|
|
3,900 |
|
| Net changes in prices and production cost |
|
|
|
|
(1,800 |
) |
|
|
(100 |
) |
|
|
(1,900 |
) |
| Revisions of previous reserves estimates |
|
|
|
|
(3,100 |
) |
|
|
(400 |
) |
|
|
(3,500 |
) |
| Net change in taxation |
|
|
|
|
12,900 |
|
|
|
3,400 |
|
|
|
16,300 |
|
| Future development costs |
|
|
|
|
(4,100 |
) |
|
|
(2,100 |
) |
|
|
(6,200 |
) |
| Net change in purchase and sales of reserves-in-place |
|
|
|
|
(3,500 |
) |
|
|
9,000 |
|
|
|
5,500 |
|
| Addition of 10% annual discount |
|
|
|
|
9,300 |
|
|
|
2,800 |
|
|
|
12,100 |
|
| Total change in the standardized measure during the
yeari |
|
|
|
|
(5,000 |
) |
|
|
9,900 |
|
|
|
4,900 |
|
| a |
The marker prices used were Brent $108.02/bbl, Henry Hub $3.66/mmBtu. |
| b |
Production costs, which include production taxes, and development costs relating to future production of proved reserves are based on the continuation of existing
economic conditions. Future decommissioning costs are included. |
| c |
Taxation is computed using appropriate year-end statutory corporate income tax rates. |
| d |
Future net cash flows from oil and natural gas production are discounted at 10% regardless of the group assessment of the risk associated with its producing
activities. |
| e |
Non-controlling interest in BP Trinidad and Tobago LLC amounted to $1,700 million. |
| f |
The standardized measure of discounted future net cash flows of equity-accounted entities includes standardized measure of discounted future net cash flows of
equity-accounted investments of those entities. |
| g |
Non-controlling interest in Rosneft amounted to $200 million in Russia. |
| h |
No equity-accounted future cash flows in Africa because proved reserves are received as a result of contractual arrangements, with no associated costs.
|
| i |
Total change in the standardized measure during the year includes the effect of exchange rate movements. |
|
|
|
|
|
| BP Annual Report and Form 20-F 2013 |
|
|
219 |
|
Standardized measure of discounted future net cash flows and changes
therein relating to proved oil and gas reserve – continued
|
|
|
|
|
|
|
|
|
|
|
|
|
|
|
|
|
|
|
|
|
|
|
|
|
|
|
|
|
|
|
|
|
|
|
|
|
|
|
|
|
|
|
| |
|
|
|
$ million |
|
| |
|
|
|
|
|
|
|
|
|
|
|
|
|
|
|
|
|
|
|
|
|
|
|
|
|
|
|
|
|
|
2012 |
|
| |
|
|
|
Europe
|
|
|
North
America |
|
|
South
America |
|
|
Africa
|
|
|
Asia
|
|
|
Australasia
|
|
|
Total |
|
| |
|
|
|
UK |
|
|
Rest of
Europe |
|
|
US |
|
|
Rest of
North
America |
|
|
|
|
|
|
|
|
Russia |
|
|
Rest of
Asia |
|
|
|
|
|
|
|
| At 31 December 2012 |
|
|
|
|
|
|
|
|
|
|
|
|
|
|
|
|
|
|
|
|
|
|
|
|
|
|
|
|
|
|
|
|
|
|
|
|
|
|
|
|
|
|
| Subsidiaries |
|
|
|
|
|
|
|
|
|
|
|
|
|
|
|
|
|
|
|
|
|
|
|
|
|
|
|
|
|
|
|
|
|
|
|
|
|
|
|
|
|
|
| Future cash inflowsa |
|
|
|
|
88,000 |
|
|
|
30,800 |
|
|
|
261,100 |
|
|
|
9,500 |
|
|
|
30,400 |
|
|
|
75,800 |
|
|
|
– |
|
|
|
54,200 |
|
|
|
54,300 |
|
|
|
604,100 |
|
| Future production costb |
|
|
|
|
24,600 |
|
|
|
10,400 |
|
|
|
117,000 |
|
|
|
4,600 |
|
|
|
10,700 |
|
|
|
17,200 |
|
|
|
– |
|
|
|
14,000 |
|
|
|
19,000 |
|
|
|
217,500 |
|
| Future development costb |
|
|
|
|
7,400 |
|
|
|
2,400 |
|
|
|
29,600 |
|
|
|
2,400 |
|
|
|
7,700 |
|
|
|
13,000 |
|
|
|
– |
|
|
|
10,900 |
|
|
|
3,700 |
|
|
|
77,100 |
|
| Future taxationc |
|
|
|
|
35,200 |
|
|
|
11,700 |
|
|
|
40,700 |
|
|
|
400 |
|
|
|
6,300 |
|
|
|
17,500 |
|
|
|
– |
|
|
|
6,900 |
|
|
|
8,400 |
|
|
|
127,100 |
|
| Future net cash flows |
|
|
|
|
20,800 |
|
|
|
6,300 |
|
|
|
73,800 |
|
|
|
2,100 |
|
|
|
5,700 |
|
|
|
28,100 |
|
|
|
– |
|
|
|
22,400 |
|
|
|
23,200 |
|
|
|
182,400 |
|
| 10% annual discountd |
|
|
|
|
10,900 |
|
|
|
2,400 |
|
|
|
40,100 |
|
|
|
2,000 |
|
|
|
2,700 |
|
|
|
10,900 |
|
|
|
– |
|
|
|
8,300 |
|
|
|
11,800 |
|
|
|
89,100 |
|
| Standardized measure of discounted future net cash
flowse |
|
|
|
|
9,900 |
|
|
|
3,900 |
|
|
|
33,700 |
|
|
|
100 |
|
|
|
3,000 |
|
|
|
17,200 |
|
|
|
– |
|
|
|
14,100 |
|
|
|
11,400 |
|
|
|
93,300 |
|
| Equity-accounted entities (BP share)f |
|
| Future cash inflowsa |
|
|
|
|
– |
|
|
|
– |
|
|
|
– |
|
|
|
– |
|
|
|
49,400 |
|
|
|
– |
|
|
|
203,600 |
|
|
|
24,400 |
|
|
|
– |
|
|
|
277,400 |
|
| Future production costb |
|
|
|
|
– |
|
|
|
– |
|
|
|
– |
|
|
|
– |
|
|
|
24,800 |
|
|
|
– |
|
|
|
133,400 |
|
|
|
21,000 |
|
|
|
– |
|
|
|
179,200 |
|
| Future development costb |
|
|
|
|
– |
|
|
|
– |
|
|
|
– |
|
|
|
– |
|
|
|
5,500 |
|
|
|
– |
|
|
|
16,600 |
|
|
|
1,900 |
|
|
|
– |
|
|
|
24,000 |
|
| Future taxationc |
|
|
|
|
– |
|
|
|
– |
|
|
|
– |
|
|
|
– |
|
|
|
6,600 |
|
|
|
– |
|
|
|
10,100 |
|
|
|
200 |
|
|
|
– |
|
|
|
16,900 |
|
| Future net cash flows |
|
|
|
|
– |
|
|
|
– |
|
|
|
– |
|
|
|
– |
|
|
|
12,500 |
|
|
|
– |
|
|
|
43,500 |
|
|
|
1,300 |
|
|
|
– |
|
|
|
57,300 |
|
| 10% annual discountd |
|
|
|
|
– |
|
|
|
– |
|
|
|
– |
|
|
|
– |
|
|
|
7,600 |
|
|
|
– |
|
|
|
21,600 |
|
|
|
300 |
|
|
|
– |
|
|
|
29,500 |
|
| Standardized measure of discounted future net cash flowsg
h |
|
|
|
|
– |
|
|
|
– |
|
|
|
– |
|
|
|
– |
|
|
|
4,900 |
|
|
|
– |
|
|
|
21,900 |
|
|
|
1,000 |
|
|
|
– |
|
|
|
27,800 |
|
| Total subsidiaries and equity-accounted entities |
|
| Standardized measure of discounted future net cash
flowsi |
|
|
|
|
9,900 |
|
|
|
3,900 |
|
|
|
33,700 |
|
|
|
100 |
|
|
|
7,900 |
|
|
|
17,200 |
|
|
|
21,900 |
|
|
|
15,100 |
|
|
|
11,400 |
|
|
|
121,100 |
|
The following are the principal sources of change in the standardized measure of discounted future net cash flows:
|
|
|
|
|
|
|
|
|
|
|
|
|
|
|
| |
|
|
|
$ million |
|
| |
|
|
|
Subsidiaries |
|
|
Equity-accounted
entities (BP share) |
|
|
Total subsidiaries and
equity-accounted
entities |
|
| Sales and transfers of oil and gas produced, net of production costs |
|
|
|
|
(34,600 |
) |
|
|
(8,300 |
) |
|
|
(42,900 |
) |
| Development costs for the current year as estimated in previous year |
|
|
|
|
14,400 |
|
|
|
3,100 |
|
|
|
17,500 |
|
| Extensions, discoveries and improved recovery, less related costs |
|
|
|
|
8,000 |
|
|
|
1,200 |
|
|
|
9,200 |
|
| Net changes in prices and production cost |
|
|
|
|
(15,300 |
) |
|
|
2,900 |
|
|
|
(12,400 |
) |
| Revisions of previous reserves estimates |
|
|
|
|
(16,000 |
) |
|
|
(1,000 |
) |
|
|
(17,000 |
) |
| Net change in taxation |
|
|
|
|
23,200 |
|
|
|
300 |
|
|
|
23,500 |
|
| Future development costs |
|
|
|
|
(7,700 |
) |
|
|
(500 |
) |
|
|
(8,200 |
) |
| Net change in purchase and sales of reserves-in-place |
|
|
|
|
(6,800 |
) |
|
|
(100 |
) |
|
|
(6,900 |
) |
| Addition of 10% annual discount |
|
|
|
|
11,600 |
|
|
|
2,800 |
|
|
|
14,400 |
|
| Total change in the standardized measure during the
yearj |
|
|
|
|
(23,200 |
) |
|
|
400 |
|
|
|
(22,800 |
) |
| a |
The marker prices used were Brent $111.13/bbl, Henry Hub $2.75/mmBtu. |
| b |
Production costs, which include production taxes, and development costs relating to future production of proved reserves are based on the continuation of existing
economic conditions. Future decommissioning costs are included. |
| c |
Taxation is computed using appropriate year-end statutory corporate income tax rates. |
| d |
Future net cash flows from oil and natural gas production are discounted at 10% regardless of the group assessment of the risk associated with its producing
activities. |
| e |
Non-controlling interest in BP Trinidad and Tobago LLC amounted to $900 million. |
| f |
The standardized measure of discounted future net cash flows of equity-accounted entities includes standardized measure of discounted future net cash flows of
equity-accounted investments of those entities. |
| g |
Non-controlling interest in TNK-BP amounted to $1,600 million in Russia. |
| h |
No equity-accounted future cash flows in Africa because proved reserves are received as a result of contractual arrangements, with no associated costs.
|
| i |
Includes future net cash flows for assets held for sale at 31 December 2012. |
| j |
Total change in the standardized measure during the year includes the effect of exchange rate movements. |
|
|
|
| 220 |
|
BP Annual Report and Form 20-F 2013 |
Standardized measure of discounted future net cash flows and
changes therein relating to proved oil and gas reserve – continued
|
|
|
|
|
|
|
|
|
|
|
|
|
|
|
|
|
|
|
|
|
|
|
|
|
|
|
|
|
|
|
|
|
|
|
|
|
|
|
|
|
|
|
| |
|
|
|
$ million |
|
| |
|
|
|
|
|
|
|
|
|
|
|
|
|
|
|
|
|
|
|
|
|
|
|
|
|
|
|
|
|
|
2011 |
|
| |
|
|
|
Europe
|
|
|
North
America |
|
|
South
America |
|
|
Africa
|
|
|
Asia
|
|
|
Australasia
|
|
|
Total |
|
| |
|
|
|
UK |
|
|
Rest of
Europe |
|
|
US |
|
|
Rest of
North
America |
|
|
|
|
|
|
|
|
Russia |
|
|
Rest of
Asia |
|
|
|
|
|
|
|
| At 31 December 2011 |
|
|
|
|
|
|
|
|
|
|
|
|
|
|
|
|
|
|
|
|
|
|
|
|
|
|
|
|
|
|
|
|
|
|
|
|
|
|
|
|
|
|
| Subsidiaries |
|
|
|
|
|
|
|
|
|
|
|
|
|
|
|
|
|
|
|
|
|
|
|
|
|
|
|
|
|
| Future cash inflowsa |
|
|
|
|
97,900 |
|
|
|
36,400 |
|
|
|
332,900 |
|
|
|
9,200 |
|
|
|
39,100 |
|
|
|
82,100 |
|
|
|
– |
|
|
|
59,200 |
|
|
|
53,900 |
|
|
|
710,700 |
|
| Future production costb |
|
|
|
|
30,500 |
|
|
|
10,900 |
|
|
|
140,700 |
|
|
|
3,200 |
|
|
|
10,500 |
|
|
|
16,800 |
|
|
|
– |
|
|
|
16,000 |
|
|
|
15,600 |
|
|
|
244,200 |
|
| Future development costb |
|
|
|
|
8,500 |
|
|
|
2,700 |
|
|
|
32,300 |
|
|
|
1,900 |
|
|
|
7,600 |
|
|
|
13,200 |
|
|
|
– |
|
|
|
9,600 |
|
|
|
3,200 |
|
|
|
79,000 |
|
| Future taxationc |
|
|
|
|
37,100 |
|
|
|
15,200 |
|
|
|
57,000 |
|
|
|
900 |
|
|
|
11,400 |
|
|
|
19,800 |
|
|
|
– |
|
|
|
8,100 |
|
|
|
9,000 |
|
|
|
158,500 |
|
| Future net cash flows |
|
|
|
|
21,800 |
|
|
|
7,600 |
|
|
|
102,900 |
|
|
|
3,200 |
|
|
|
9,600 |
|
|
|
32,300 |
|
|
|
– |
|
|
|
25,500 |
|
|
|
26,100 |
|
|
|
229,000 |
|
| 10% annual discountd |
|
|
|
|
11,200 |
|
|
|
3,100 |
|
|
|
55,500 |
|
|
|
2,800 |
|
|
|
4,100 |
|
|
|
12,500 |
|
|
|
– |
|
|
|
9,800 |
|
|
|
13,500 |
|
|
|
112,500 |
|
| Standardized measure of discounted future net cash
flowse |
|
|
|
|
10,600 |
|
|
|
4,500 |
|
|
|
47,400 |
|
|
|
400 |
|
|
|
5,500 |
|
|
|
19,800 |
|
|
|
– |
|
|
|
15,700 |
|
|
|
12,600 |
|
|
|
116,500 |
|
| Equity-accounted entities (BP share)f |
|
|
|
|
|
|
|
|
|
|
|
|
|
|
|
|
|
|
|
|
|
|
|
|
|
|
|
|
|
| Future cash inflowsa |
|
|
|
|
– |
|
|
|
– |
|
|
|
– |
|
|
|
– |
|
|
|
46,700 |
|
|
|
– |
|
|
|
188,900 |
|
|
|
34,200 |
|
|
|
– |
|
|
|
269,800 |
|
| Future production costb |
|
|
|
|
– |
|
|
|
– |
|
|
|
– |
|
|
|
– |
|
|
|
21,500 |
|
|
|
– |
|
|
|
123,800 |
|
|
|
30,100 |
|
|
|
– |
|
|
|
175,400 |
|
| Future development costb |
|
|
|
|
– |
|
|
|
– |
|
|
|
– |
|
|
|
– |
|
|
|
5,000 |
|
|
|
– |
|
|
|
15,600 |
|
|
|
2,400 |
|
|
|
– |
|
|
|
23,000 |
|
| Future taxationc |
|
|
|
|
– |
|
|
|
– |
|
|
|
– |
|
|
|
– |
|
|
|
5,900 |
|
|
|
– |
|
|
|
9,600 |
|
|
|
200 |
|
|
|
– |
|
|
|
15,700 |
|
| Future net cash flows |
|
|
|
|
– |
|
|
|
– |
|
|
|
– |
|
|
|
– |
|
|
|
14,300 |
|
|
|
– |
|
|
|
39,900 |
|
|
|
1,500 |
|
|
|
– |
|
|
|
55,700 |
|
| 10% annual discountd |
|
|
|
|
– |
|
|
|
– |
|
|
|
– |
|
|
|
– |
|
|
|
8,700 |
|
|
|
– |
|
|
|
19,000 |
|
|
|
600 |
|
|
|
– |
|
|
|
28,300 |
|
| Standardized measure of discounted future net cash flowsg
h |
|
|
|
|
– |
|
|
|
– |
|
|
|
– |
|
|
|
– |
|
|
|
5,600 |
|
|
|
– |
|
|
|
20,900 |
|
|
|
900 |
|
|
|
– |
|
|
|
27,400 |
|
| Total subsidiaries and equity-accounted entities |
|
|
|
|
|
|
|
|
|
|
|
|
|
|
|
|
|
|
|
|
|
|
|
|
|
|
|
|
|
| Standardized measure of discounted future net cash flows |
|
|
|
|
10,600 |
|
|
|
4,500 |
|
|
|
47,400 |
|
|
|
400 |
|
|
|
11,100 |
|
|
|
19,800 |
|
|
|
20,900 |
|
|
|
16,600 |
|
|
|
12,600 |
|
|
|
143,900 |
|
The following are the principal sources of change in the standardized measure of discounted future net cash flows:
|
|
|
|
|
|
|
|
|
|
|
|
|
|
|
| |
|
|
|
|
|
|
|
|
|
$ million |
|
| |
|
|
|
Subsidiaries |
|
|
Equity-accounted
entities (BP share) |
|
|
Total subsidiaries and
equity-accounted entities |
|
| Sales and transfers of oil and gas produced, net of production costs |
|
|
|
|
(30,900 |
) |
|
|
(5,700 |
) |
|
|
(36,600 |
) |
| Development costs for the current year as estimated in previous year |
|
|
|
|
13,200 |
|
|
|
2,500 |
|
|
|
15,700 |
|
| Extensions, discoveries and improved recovery, less related costs |
|
|
|
|
6,600 |
|
|
|
2,800 |
|
|
|
9,400 |
|
| Net changes in prices and production cost |
|
|
|
|
75,100 |
|
|
|
15,700 |
|
|
|
90,800 |
|
| Revisions of previous reserves estimates |
|
|
|
|
(21,900 |
) |
|
|
2,000 |
|
|
|
(19,900 |
) |
| Net change in taxation |
|
|
|
|
(18,200 |
) |
|
|
(1,400 |
) |
|
|
(19,600 |
) |
| Future development costs |
|
|
|
|
(11,000 |
) |
|
|
(2,500 |
) |
|
|
(13,500 |
) |
| Net change in purchase and sales of reserves-in-place |
|
|
|
|
(6,500 |
) |
|
|
(2,700 |
) |
|
|
(9,200 |
) |
| Addition of 10% annual discount |
|
|
|
|
10,000 |
|
|
|
1,500 |
|
|
|
11,500 |
|
| Total change in the standardized measure during the
yeari |
|
|
|
|
16,400 |
|
|
|
12,200 |
|
|
|
28,600 |
|
| a |
The marker prices used were Brent $110.96/bbl, Henry Hub $4.12/mmBtu. |
| b |
Production costs, which include production taxes, and development costs relating to future production of proved reserves are based on the continuation of existing economic conditions. Future decommissioning costs are
included. |
| c |
Taxation is computed using appropriate year-end statutory corporate income tax rates. |
| d |
Future net cash flows from oil and natural gas production are discounted at 10% regardless of the group assessment of the risk associated with its producing activities. |
| e |
Non-controlling interest in BP Trinidad and Tobago LLC amounted to $1,600 million. |
| f |
The standardized measure of discounted future net cash flows of equity-accounted entities includes standardized measure of discounted future net cash flows of equity-accounted investments of those entities.
|
| g |
Non-controlling interest in TNK-BP amounted to $1,600 million in Russia. |
| h |
No equity-accounted future cash flows in Africa because proved reserves are received as a result of contractual arrangements, with no associated costs. |
| i |
Total change in the standardized measure during the year includes the effect of exchange rate movements. |
|
|
|
|
|
| BP Annual Report and Form 20-F 2013 |
|
|
221 |
|
Operational and statistical information
The following tables present operational and statistical information related to production, drilling, productive wells and acreage. Figures include amounts
attributable to assets held for sale.
Crude oil and natural gas production
The following table shows crude oil and natural gas production for the years ended 31 December 2013, 2012 and 2011.
Production for the yeara
|
|
|
|
|
|
|
|
|
|
|
|
|
|
|
|
|
|
|
|
|
|
|
|
|
|
|
|
|
|
|
|
|
|
|
|
|
|
|
|
|
|
|
| |
|
|
|
Europe
|
|
|
North
America |
|
|
South
America |
|
|
Africa
|
|
|
Asia
|
|
|
Australasia
|
|
|
Total |
|
| |
|
|
|
UK |
|
|
Rest of
Europe |
|
|
US |
|
|
Rest of
North
America |
|
|
|
|
|
|
|
|
Russia |
|
|
Rest of
Asia |
|
|
|
|
|
|
|
| Subsidiaries |
|
|
|
|
|
|
|
|
|
|
|
|
|
|
|
|
|
|
|
|
|
|
|
|
|
|
|
|
|
|
|
|
|
|
|
|
|
|
|
|
|
|
| Crude oilb |
|
|
|
thousand barrels per day |
|
| 2013 |
|
|
|
|
61 |
|
|
|
34 |
|
|
|
363 |
|
|
|
– |
|
|
|
30 |
|
|
|
225 |
|
|
|
– |
|
|
|
141 |
|
|
|
25 |
|
|
|
879 |
|
| 2012 |
|
|
|
|
86 |
|
|
|
23 |
|
|
|
390 |
|
|
|
1 |
|
|
|
28 |
|
|
|
202 |
|
|
|
– |
|
|
|
139 |
|
|
|
27 |
|
|
|
896 |
|
| 2011 |
|
|
|
|
113 |
|
|
|
32 |
|
|
|
453 |
|
|
|
2 |
|
|
|
39 |
|
|
|
190 |
|
|
|
– |
|
|
|
138 |
|
|
|
25 |
|
|
|
992 |
|
| Natural gasc |
|
|
|
million cubic feet per day |
|
| 2013 |
|
|
|
|
157 |
|
|
|
80 |
|
|
|
1,539 |
|
|
|
11 |
|
|
|
2,221 |
|
|
|
561 |
|
|
|
– |
|
|
|
494 |
|
|
|
780 |
|
|
|
5,845 |
|
| 2012 |
|
|
|
|
414 |
|
|
|
8 |
|
|
|
1,651 |
|
|
|
13 |
|
|
|
2,097 |
|
|
|
590 |
|
|
|
– |
|
|
|
633 |
|
|
|
787 |
|
|
|
6,193 |
|
| 2011 |
|
|
|
|
355 |
|
|
|
13 |
|
|
|
1,843 |
|
|
|
14 |
|
|
|
2,197 |
|
|
|
558 |
|
|
|
– |
|
|
|
618 |
|
|
|
795 |
|
|
|
6,393 |
|
| Equity-accounted entities(BP share) |
|
|
|
|
|
|
|
|
|
|
|
|
|
|
|
|
|
|
|
|
|
|
|
|
|
|
|
|
|
| Crude oilb |
|
|
|
thousand barrels per day |
|
| 2013 |
|
|
|
|
– |
|
|
|
– |
|
|
|
– |
|
|
|
– |
|
|
|
73 |
|
|
|
– |
|
|
|
829 |
|
|
|
232 |
|
|
|
– |
|
|
|
1,134 |
|
| 2012 |
|
|
|
|
– |
|
|
|
– |
|
|
|
– |
|
|
|
– |
|
|
|
80 |
|
|
|
– |
|
|
|
863 |
|
|
|
217 |
|
|
|
– |
|
|
|
1,160 |
|
| 2011 |
|
|
|
|
– |
|
|
|
– |
|
|
|
– |
|
|
|
– |
|
|
|
90 |
|
|
|
– |
|
|
|
865 |
|
|
|
210 |
|
|
|
– |
|
|
|
1,165 |
|
| Natural gasc |
|
|
|
million cubic feet per day |
|
| 2013 |
|
|
|
|
– |
|
|
|
– |
|
|
|
– |
|
|
|
– |
|
|
|
386 |
|
|
|
8 |
|
|
|
780 |
|
|
|
41 |
|
|
|
– |
|
|
|
1,216 |
|
| 2012 |
|
|
|
|
– |
|
|
|
– |
|
|
|
– |
|
|
|
– |
|
|
|
394 |
|
|
|
– |
|
|
|
734 |
|
|
|
72 |
|
|
|
– |
|
|
|
1,200 |
|
| 2011 |
|
|
|
|
– |
|
|
|
– |
|
|
|
– |
|
|
|
– |
|
|
|
392 |
|
|
|
– |
|
|
|
699 |
|
|
|
34 |
|
|
|
– |
|
|
|
1,125 |
|
| a |
Production excludes royalties due to others, whether payable in cash or in kind, where the royalty owner has a direct interest in the underlying production and the option and ability to make lifting and sales
arrangements independently. |
| b |
Crude oil includes natural gas liquids and condensate. |
| c |
Natural gas production excludes gas consumed in operations. |
Because of rounding, some totals may not exactly agree with
the sum of their component parts.
Productive oil and gas wells and acreage
The following tables show the number of gross and net productive oil and natural gas wells and total gross and net developed and undeveloped oil and natural gas acreage
in which the group and its equity-accounted entities had interests as at 31 December 2013. A ‘gross’ well or acre is one in which a whole or fractional working interest is owned, while the number of ‘net’ wells or acres is
the sum of the whole or fractional working interests in gross wells or acres. Productive wells are producing wells and wells capable of production. Developed acreage is the acreage within the boundary of a field, on which development wells have been
drilled, which could produce the reserves; while undeveloped acres are those on which wells have not been drilled or completed to a point that would permit the production of commercial quantities, whether or not such acres contain proved reserves.
|
|
|
|
|
|
|
|
|
|
|
|
|
|
|
|
|
|
|
|
|
|
|
|
|
|
|
|
|
|
|
|
|
|
|
|
|
|
|
|
|
|
|
|
|
|
|
| |
|
|
|
|
|
|
Europe
|
|
|
North
America |
|
|
South
America |
|
|
Africa
|
|
|
Asia
|
|
|
Australasia
|
|
|
Total |
|
| |
|
|
|
|
|
|
UK |
|
|
Rest of
Europe |
|
|
US |
|
|
Rest of
North
America |
|
|
|
|
|
|
|
|
Russia |
|
|
Rest of
Asia |
|
|
|
|
|
|
|
| Number of productive wells at 31 December 2013 |
|
|
|
|
|
|
|
|
|
|
|
|
|
|
|
|
|
|
|
|
|
|
|
|
|
|
|
|
|
| Oil wellsa |
|
|
– gross |
|
|
|
|
|
115 |
|
|
|
63 |
|
|
|
2,456 |
|
|
|
55 |
|
|
|
4,681 |
|
|
|
608 |
|
|
|
41,541 |
|
|
|
2,166 |
|
|
|
13 |
|
|
|
51,698 |
|
|
|
|
– net |
|
|
|
|
|
71 |
|
|
|
25 |
|
|
|
975 |
|
|
|
28 |
|
|
|
2,583 |
|
|
|
441 |
|
|
|
7,779 |
|
|
|
439 |
|
|
|
2 |
|
|
|
12,343 |
|
| Gas wellsb |
|
|
– gross |
|
|
|
|
|
68 |
|
|
|
6 |
|
|
|
21,445 |
|
|
|
364 |
|
|
|
688 |
|
|
|
135 |
|
|
|
72 |
|
|
|
761 |
|
|
|
74 |
|
|
|
23,613 |
|
| |
|
|
– net |
|
|
|
|
|
29 |
|
|
|
1 |
|
|
|
9,367 |
|
|
|
179 |
|
|
|
239 |
|
|
|
52 |
|
|
|
14 |
|
|
|
280 |
|
|
|
14 |
|
|
|
10,175 |
|
| Oil and natural gas acreage at 31 December 2013 |
|
|
|
|
|
|
|
|
|
|
|
|
|
|
|
|
|
|
|
|
|
|
|
|
|
|
|
Thousands of acres |
|
| Developed |
|
|
– gross |
|
|
|
|
|
128 |
|
|
|
39 |
|
|
|
6,340 |
|
|
|
223 |
|
|
|
1,634 |
|
|
|
621 |
|
|
|
4,380 |
|
|
|
1,982 |
|
|
|
162 |
|
|
|
15,509 |
|
|
|
|
– net |
|
|
|
|
|
71 |
|
|
|
16 |
|
|
|
3,334 |
|
|
|
109 |
|
|
|
453 |
|
|
|
221 |
|
|
|
831 |
|
|
|
355 |
|
|
|
35 |
|
|
|
5,425 |
|
| Undevelopedc |
|
|
– gross |
|
|
|
|
|
1,118 |
|
|
|
1,196 |
|
|
|
6,669 |
|
|
|
9,710 |
|
|
|
29,100 |
|
|
|
26,538 |
|
|
|
257,896 |
|
|
|
20,141 |
|
|
|
16,021 |
|
|
|
368,389 |
|
| |
|
|
– net |
|
|
|
|
|
672 |
|
|
|
403 |
|
|
|
4,585 |
|
|
|
7,638 |
|
|
|
12,943 |
|
|
|
17,142 |
|
|
|
50,285 |
|
|
|
7,258 |
|
|
|
11,254 |
|
|
|
112,180 |
|
| a |
Includes approximately 7,639 gross (1,491 net) multiple completion wells (more than one formation producing into the same well bore). |
| b |
Includes approximately 2,859 gross (1,350 net) multiple completion wells. If one of the multiple completions in a well is an oil completion, the well is classified as an oil well. |
| c |
Undeveloped acreage includes leases and concessions. |
|
|
|
| 222 |
|
BP Annual Report and Form 20-F 2013 |
Operational and statistical information – continued
Net oil and gas wells completed or abandoned
The following table shows the number of net productive and dry exploratory and development oil and natural gas wells completed or abandoned in the years indicated by the
group and its equity-accounted entities. Productive wells include wells in which hydrocarbons were encountered and the drilling or completion of which, in the case of exploratory wells, has been suspended pending further drilling or evaluation. A
dry well is one found to be incapable of producing hydrocarbons in sufficient quantities to justify completion.
|
|
|
|
|
|
|
|
|
|
|
|
|
|
|
|
|
|
|
|
|
|
|
|
|
|
|
|
|
|
|
|
|
|
|
|
|
|
|
|
|
|
|
| |
|
|
|
Europe
|
|
|
North
America |
|
|
South
America |
|
|
Africa
|
|
|
Asia
|
|
|
Australasia
|
|
|
Total |
|
| |
|
|
|
UK |
|
|
Rest of
Europe |
|
|
US |
|
|
Rest of
North
America |
|
|
|
|
|
|
|
|
Russiae |
|
|
Rest of
Asia |
|
|
|
|
|
|
|
| 2013 |
|
|
|
|
|
|
|
|
|
|
|
|
|
|
|
|
|
|
|
|
|
|
|
|
|
|
|
|
|
|
|
|
|
|
|
|
|
|
|
|
|
|
| Exploratory |
|
|
|
|
|
|
|
|
|
|
|
|
|
|
|
|
|
|
|
|
|
|
|
|
|
|
|
|
|
|
|
|
|
|
|
|
|
|
|
|
|
|
| Productive |
|
|
|
|
1.0 |
|
|
|
– |
|
|
|
12.7 |
|
|
|
– |
|
|
|
4.5 |
|
|
|
1.5 |
|
|
|
4.0 |
|
|
|
3.5 |
|
|
|
– |
|
|
|
27.2 |
|
| Dry |
|
|
|
|
– |
|
|
|
– |
|
|
|
1.1 |
|
|
|
– |
|
|
|
1.4 |
|
|
|
0.6 |
|
|
|
– |
|
|
|
0.9 |
|
|
|
0.5 |
|
|
|
4.5 |
|
| Development |
|
|
|
|
|
|
|
|
|
|
|
|
|
|
|
|
|
|
|
|
|
|
|
|
|
|
|
|
|
|
|
|
|
|
|
|
|
|
|
|
|
|
| Productive |
|
|
|
|
1.0 |
|
|
|
1.2 |
|
|
|
285.7 |
|
|
|
– |
|
|
|
94.6 |
|
|
|
12.6 |
|
|
|
395.0 |
|
|
|
58.0 |
|
|
|
0.2 |
|
|
|
848.3 |
|
| Dry |
|
|
|
|
– |
|
|
|
0.2 |
|
|
|
0.4 |
|
|
|
– |
|
|
|
2.7 |
|
|
|
0.2 |
|
|
|
– |
|
|
|
0.7 |
|
|
|
0.4 |
|
|
|
4.6 |
|
| 2012 |
|
|
|
|
|
|
|
|
|
|
|
|
|
|
|
|
|
|
|
|
|
|
|
|
|
|
|
|
|
|
|
|
|
|
|
|
|
|
|
|
|
|
| Exploratory |
|
|
|
|
|
|
|
|
|
|
|
|
|
|
|
|
|
|
|
|
|
|
|
|
|
|
|
|
|
|
|
|
|
|
|
|
|
|
|
|
|
|
| Productive |
|
|
|
|
– |
|
|
|
0.3 |
|
|
|
17.1 |
|
|
|
– |
|
|
|
5.8 |
|
|
|
2.3 |
|
|
|
14.7 |
|
|
|
– |
|
|
|
– |
|
|
|
40.2 |
|
| Dry |
|
|
|
|
0.2 |
|
|
|
– |
|
|
|
0.6 |
|
|
|
– |
|
|
|
1.0 |
|
|
|
0.5 |
|
|
|
5.0 |
|
|
|
– |
|
|
|
– |
|
|
|
7.3 |
|
| Development |
|
|
|
|
|
|
|
|
|
|
|
|
|
|
|
|
|
|
|
|
|
|
|
|
|
|
|
|
|
|
|
|
|
|
|
|
|
|
|
|
|
|
| Productive |
|
|
|
|
1.6 |
|
|
|
– |
|
|
|
317.8 |
|
|
|
– |
|
|
|
78.9 |
|
|
|
17.7 |
|
|
|
552.5 |
|
|
|
43.1 |
|
|
|
– |
|
|
|
1,011.6 |
|
| Dry |
|
|
|
|
– |
|
|
|
– |
|
|
|
– |
|
|
|
– |
|
|
|
– |
|
|
|
1.0 |
|
|
|
– |
|
|
|
9.5 |
|
|
|
– |
|
|
|
10.5 |
|
| 2011 |
|
|
|
|
|
|
|
|
|
|
|
|
|
|
|
|
|
|
|
|
|
|
|
|
|
|
|
|
|
|
|
|
|
|
|
|
|
|
|
|
|
|
| Exploratory |
|
|
|
|
|
|
|
|
|
|
|
|
|
|
|
|
|
|
|
|
|
|
|
|
|
|
|
|
|
|
|
|
|
|
|
|
|
|
|
|
|
|
| Productive |
|
|
|
|
0.4 |
|
|
|
– |
|
|
|
34.1 |
|
|
|
– |
|
|
|
4.4 |
|
|
|
2.1 |
|
|
|
16.7 |
|
|
|
1.0 |
|
|
|
0.2 |
|
|
|
58.9 |
|
| Dry |
|
|
|
|
– |
|
|
|
– |
|
|
|
2.1 |
|
|
|
– |
|
|
|
0.2 |
|
|
|
– |
|
|
|
7.2 |
|
|
|
0.3 |
|
|
|
0.3 |
|
|
|
10.1 |
|
| Development |
|
|
|
|
|
|
|
|
|
|
|
|
|
|
|
|
|
|
|
|
|
|
|
|
|
|
|
|
|
|
|
|
|
|
|
|
|
|
|
|
|
|
| Productive |
|
|
|
|
1.7 |
|
|
|
– |
|
|
|
199.4 |
|
|
|
– |
|
|
|
101.3 |
|
|
|
16.0 |
|
|
|
582.0 |
|
|
|
45.1 |
|
|
|
– |
|
|
|
945.5 |
|
| Dry |
|
|
|
|
– |
|
|
|
– |
|
|
|
0.2 |
|
|
|
– |
|
|
|
3.0 |
|
|
|
2.7 |
|
|
|
– |
|
|
|
0.4 |
|
|
|
– |
|
|
|
6.3 |
|
|
| e Information for 2011 and 2012 includes BP’s share of TNK-BP
which was sold to Rosneft on 21 March 2013. |
|
|
| Drilling and production activities in progress
The following table shows the number of exploratory and development oil and natural gas wells in the process of being drilled by the group and its equity-accounted
entities as of 31 December 2013. Suspended development wells and long-term suspended exploratory wells are also included in the table. |
|
| |
|
|
|
Europe
|
|
|
North
America |
|
|
South
America |
|
|
Africa
|
|
|
Asia
|
|
|
Australasia
|
|
|
Total |
|
| |
|
|
|
UK |
|
|
Rest of
Europe |
|
|
US |
|
|
Rest of
North
America |
|
|
|
|
|
|
|
|
Russia |
|
|
Rest of
Asia |
|
|
|
|
|
|
|
| At 31 December 2013 |
|
|
|
|
|
|
|
|
|
|
|
|
|
|
|
|
|
|
|
|
|
|
|
|
|
|
|
|
|
|
|
|
|
|
|
|
|
|
|
|
|
|
| Exploratory |
|
|
|
|
|
|
|
|
|
|
|
|
|
|
|
|
|
|
|
|
|
|
|
|
|
|
|
|
|
|
|
|
|
|
|
|
|
|
|
|
|
|
| Gross |
|
|
|
|
2.0 |
|
|
|
– |
|
|
|
32.0 |
|
|
|
3.0 |
|
|
|
6.0 |
|
|
|
10.0 |
|
|
|
– |
|
|
|
4.0 |
|
|
|
– |
|
|
|
57.0 |
|
| Net |
|
|
|
|
0.8 |
|
|
|
– |
|
|
|
9.2 |
|
|
|
1.5 |
|
|
|
2.2 |
|
|
|
5.2 |
|
|
|
– |
|
|
|
0.8 |
|
|
|
– |
|
|
|
19.7 |
|
| Development |
|
|
|
|
|
|
|
|
|
|
|
|
|
|
|
|
|
|
|
|
|
|
|
|
|
|
|
|
|
|
|
|
|
|
|
|
|
|
|
|
|
|
| Gross |
|
|
|
|
6.0 |
|
|
|
3.0 |
|
|
|
780.0 |
|
|
|
55.0 |
|
|
|
33.0 |
|
|
|
20.0 |
|
|
|
100.0 |
|
|
|
58.0 |
|
|
|
10.0 |
|
|
|
1,065.0 |
|
| Net |
|
|
|
|
4.0 |
|
|
|
1.1 |
|
|
|
169.1 |
|
|
|
27.5 |
|
|
|
16.6 |
|
|
|
6.1 |
|
|
|
19.8 |
|
|
|
20.7 |
|
|
|
1.4 |
|
|
|
266.3 |
|
|
|
|
|
|
| BP Annual Report and Form 20-F 2013 |
|
|
223 |
|
Pages 224-234 have been removed
as they do not form part of
the BP’s Annual Report on Form 20-F as filed with the SEC.
|
|
|
| 224 |
|
BP Annual Report and Form 20-F 2013 |
|
|
|
|
|
| BP Annual Report and Form 20-F 2013 |
|
|
235 |
|
Selected financial information
This information, insofar as it relates to 2013, has been extracted or derived from the audited consolidated financial statements of the BP group
presented on page 115. Note 1 to the financial statements includes details on the basis of preparation of these financial statements. The selected information should be read in conjunction with the audited financial statements and related notes
elsewhere herein. Comparative financial information for 2009-12 has been restated to reflect the adoption of amendments to IAS 19 ‘Employee Benefits’. Financial information for 2011 and 2012 has also been restated to reflect the adoption
of IFRS 11 ‘Joint Arrangements’. For further information see Financial statements – Note 1.
|
|
|
|
|
|
|
|
|
|
|
|
|
|
|
|
|
|
|
|
|
|
|
| |
|
|
|
$ million except per share amounts
|
|
| |
|
|
|
2013 |
|
|
2012 |
|
|
2011 |
|
|
2010 |
|
|
2009 |
|
| Income statement data |
|
|
|
|
|
|
|
|
|
|
|
|
|
|
|
|
|
|
|
|
|
|
| Sales and other operating revenues |
|
|
|
|
379,136 |
|
|
|
375,765 |
|
|
|
375,713 |
|
|
|
297,107 |
|
|
|
239,272 |
|
| Underlying replacement cost profit before interest and taxationa |
|
|
|
|
22,776 |
|
|
|
26,454 |
|
|
|
33,601 |
|
|
|
31,704 |
|
|
|
22,673 |
|
| Net favourable (unfavourable) impact of non-operating items and fair value accounting effectsa |
|
|
|
|
9,283 |
|
|
|
(6,091 |
) |
|
|
3,580 |
|
|
|
(37,190 |
) |
|
|
(169 |
) |
| Replacement cost profit (loss) before interest and taxationa |
|
|
|
|
32,059 |
|
|
|
20,363 |
|
|
|
37,181 |
|
|
|
(5,486 |
) |
|
|
22,504 |
|
| Inventory holding gains (losses)b |
|
|
|
|
(290 |
) |
|
|
(594 |
) |
|
|
2,634 |
|
|
|
1,784 |
|
|
|
3,922 |
|
| Profit (loss) before interest and taxation |
|
|
|
|
31,769 |
|
|
|
19,769 |
|
|
|
39,815 |
|
|
|
(3,702 |
) |
|
|
26,426 |
|
| Finance costs and net finance expense relating to pensions and other post-retirement benefits |
|
|
|
|
(1,548 |
) |
|
|
(1,638 |
) |
|
|
(1,587 |
) |
|
|
(1,605 |
) |
|
|
(1,609 |
) |
| Taxation |
|
|
|
|
(6,463 |
) |
|
|
(6,880 |
) |
|
|
(12,619 |
) |
|
|
1,638 |
|
|
|
(8,273 |
) |
| Profit (loss) for the year |
|
|
|
|
23,758 |
|
|
|
11,251 |
|
|
|
25,609 |
|
|
|
(3,669 |
) |
|
|
16,544 |
|
| Profit (loss) for the year attributable to BP shareholders |
|
|
|
|
23,451 |
|
|
|
11,017 |
|
|
|
25,212 |
|
|
|
(4,064 |
) |
|
|
16,363 |
|
| Inventory holding (gains) lossesb, net of
taxation |
|
|
|
|
230 |
|
|
|
411 |
|
|
|
(1,800 |
) |
|
|
(1,195 |
) |
|
|
(2,623 |
) |
| Replacement cost profit (loss) for the year attributable to BP shareholdersa |
|
|
|
|
23,681 |
|
|
|
11,428 |
|
|
|
23,412 |
|
|
|
(5,259 |
) |
|
|
13,740 |
|
| Non-operating items and fair value accounting
effectsa, net of taxation |
|
|
|
|
(10,253 |
) |
|
|
5,643 |
|
|
|
(2,242 |
) |
|
|
25,436 |
|
|
|
622 |
|
| Underlying replacement cost profit for the year attributable to BP shareholdersa |
|
|
|
|
13,428 |
|
|
|
17,071 |
|
|
|
21,170 |
|
|
|
20,177 |
|
|
|
14,362 |
|
| Per ordinary share – cents |
|
|
|
|
|
|
|
|
|
|
|
|
|
|
|
|
|
|
|
|
|
|
| Profit (loss) for the year attributable to BP shareholders |
|
|
|
|
|
|
|
|
|
|
|
|
|
|
|
|
|
|
|
|
|
|
| Basic |
|
|
|
|
123.87 |
|
|
|
57.89 |
|
|
|
133.35 |
|
|
|
(21.64 |
) |
|
|
87.34 |
|
| Diluted |
|
|
|
|
123.12 |
|
|
|
57.50 |
|
|
|
131.74 |
|
|
|
(21.64 |
) |
|
|
86.40 |
|
| Replacement cost profit (loss) for the year attributable to BP shareholders |
|
|
|
|
125.08 |
|
|
|
60.05 |
|
|
|
123.83 |
|
|
|
(28.01 |
) |
|
|
73.34 |
|
| Underlying replacement cost profit for the year attributable to BP shareholders |
|
|
|
|
70.92 |
|
|
|
89.70 |
|
|
|
111.97 |
|
|
|
107.39 |
|
|
|
76.66 |
|
| Dividends paid per share – cents |
|
|
|
|
36.50 |
|
|
|
33.00 |
|
|
|
28.00 |
|
|
|
14.00 |
|
|
|
56.00 |
|
| – pence |
|
|
|
|
23.399 |
|
|
|
20.852 |
|
|
|
17.404 |
|
|
|
8.679 |
|
|
|
36.417 |
|
|
|
|
|
|
|
|
| Capital expenditure and acquisitionsc |
|
|
|
|
36,612 |
|
|
|
25,204 |
|
|
|
31,959 |
|
|
|
23,016 |
|
|
|
20,309 |
|
| Acquisitions and asset exchanges |
|
|
|
|
71 |
|
|
|
200 |
|
|
|
11,283 |
|
|
|
3,406 |
|
|
|
308 |
|
| Organic capital expenditured |
|
|
|
|
24,600 |
|
|
|
23,950 |
|
|
|
19,580 |
|
|
|
18,218 |
|
|
|
20,001 |
|
| Balance sheet data (at 31 December) |
|
|
|
|
|
|
|
|
|
|
|
|
|
|
|
|
|
|
|
|
|
|
| Total assets |
|
|
|
|
305,690 |
|
|
|
300,466 |
|
|
|
292,907 |
|
|
|
272,262 |
|
|
|
235,968 |
|
| Net assets |
|
|
|
|
130,407 |
|
|
|
119,752 |
|
|
|
112,585 |
|
|
|
95,891 |
|
|
|
102,113 |
|
| Share capital |
|
|
|
|
5,129 |
|
|
|
5,261 |
|
|
|
5,224 |
|
|
|
5,183 |
|
|
|
5,179 |
|
| BP shareholders’ equity |
|
|
|
|
129,302 |
|
|
|
118,546 |
|
|
|
111,568 |
|
|
|
94,987 |
|
|
|
101,613 |
|
| Finance debt due after more than one year |
|
|
|
|
40,811 |
|
|
|
38,767 |
|
|
|
35,169 |
|
|
|
30,710 |
|
|
|
25,518 |
|
| Net debt to net debt plus equitye |
|
|
|
|
16.2% |
|
|
|
18.7% |
|
|
|
20.4% |
|
|
|
21.2% |
|
|
|
20.4% |
|
| Ordinary share
dataf |
|
|
|
|
Shares million
|
|
| Basic weighted average number of shares |
|
|
|
|
18,931 |
|
|
|
19,028 |
|
|
|
18,905 |
|
|
|
18,786 |
|
|
|
18,732 |
|
| Diluted weighted average number of shares |
|
|
|
|
19,046 |
|
|
|
19,158 |
|
|
|
19,136 |
|
|
|
18,998 |
|
|
|
18,936 |
|
| a |
RC profit or loss for the group, underlying RC profit or loss and fair value accounting effects are not recognized GAAP measures. For further information, see pages
237 and 238 and Certain definitions on page 269. |
| b |
See Certain definitions and also see Financial statements – Note 7 for an analysis of inventory holding gains and losses by segment. |
| c |
Includes asset exchanges. All capital expenditure and acquisitions during the past five years have been financed from cash flow from operations, disposal proceeds and
external financing. |
| d |
Organic capital expenditure excludes acquisitions and asset exchanges, and: in 2013 $11,941 million relating to our investment in Rosneft; in 2012 $1,054 million
associated with deepening our US natural gas and North Sea asset bases; in 2011 $1,096 million associated with deepening our US natural gas bases; in 2010 $900 million relating to the formation of a partnership with Value Creation Inc. to
develop the Terre de Grace oil sands acreage and $492 million for the purchase of additional interests in the Valhall and Hod fields in the North Sea. |
| e |
Net debt and the ratio of net debt to net debt plus equity are not recognized GAAP measures. We believe these numbers are useful information to investors. Further
information on net debt is given in Financial statements – Note 28. |
| f |
The number of ordinary shares shown has been used to calculate the per share amounts. |
|
|
|
| 236 |
|
BP Annual Report and Form 20-F 2013 |
Non-operating items
Non-operating items are charges and credits arising in consolidated entities and in TNK-BP and Rosneft that are included in the financial statements and that BP discloses
separately because it considers such disclosures to be meaningful and relevant to investors. They are items that management considers not to be part of underlying business operations and are disclosed in order to enable investors to understand
better and evaluate the group’s reported financial performance. An analysis of non-operating items is shown in the table below.
|
|
|
|
|
|
|
|
|
|
|
|
|
|
|
| |
|
|
|
|
|
|
|
|
|
$ million |
|
| |
|
|
|
2013 |
|
|
2012 |
|
|
2011 |
|
| Upstream |
|
|
|
|
|
|
|
|
|
|
|
|
|
|
| Impairment and gain (loss) on sale of businesses and fixed assets |
|
|
|
|
(802 |
) |
|
|
3,638 |
|
|
|
2,131 |
|
| Environmental and other provisions |
|
|
|
|
(20 |
) |
|
|
(48 |
) |
|
|
(27 |
) |
| Restructuring, integration and rationalization costs |
|
|
|
|
– |
|
|
|
– |
|
|
|
– |
|
| Fair value gain (loss) on embedded derivatives |
|
|
|
|
459 |
|
|
|
347 |
|
|
|
191 |
|
| Othera |
|
|
|
|
(1,001 |
) |
|
|
(748 |
) |
|
|
(1,165 |
) |
| |
|
|
|
|
(1,364 |
) |
|
|
3,189 |
|
|
|
1,130 |
|
| Downstream |
|
|
|
|
|
|
|
|
|
|
|
|
|
|
| Impairment and gain (loss) on sale of businesses and fixed assets |
|
|
|
|
(348 |
) |
|
|
(2,934 |
) |
|
|
(332 |
) |
| Environmental and other provisions |
|
|
|
|
(134 |
) |
|
|
(171 |
) |
|
|
(221 |
) |
| Restructuring, integration and rationalization costs |
|
|
|
|
(15 |
) |
|
|
(32 |
) |
|
|
(4 |
) |
| Fair value gain (loss) on embedded derivatives |
|
|
|
|
– |
|
|
|
– |
|
|
|
– |
|
| Other |
|
|
|
|
(38 |
) |
|
|
(35 |
) |
|
|
(45 |
) |
| |
|
|
|
|
(535 |
) |
|
|
(3,172 |
) |
|
|
(602 |
) |
| TNK-BP |
|
|
|
|
|
|
|
|
|
|
|
|
|
|
| Impairment and gain (loss) on sale of businesses and fixed assets |
|
|
|
|
12,500 |
|
|
|
(55 |
) |
|
|
– |
|
| Environmental and other provisions |
|
|
|
|
– |
|
|
|
(83 |
) |
|
|
– |
|
| Restructuring, integration and rationalization costs |
|
|
|
|
– |
|
|
|
– |
|
|
|
– |
|
| Fair value gain (loss) on embedded derivatives |
|
|
|
|
– |
|
|
|
– |
|
|
|
– |
|
| Otherb |
|
|
|
|
– |
|
|
|
384 |
|
|
|
– |
|
| |
|
|
|
|
12,500 |
|
|
|
246 |
|
|
|
– |
|
| Rosneft |
|
|
|
|
|
|
|
|
|
|
|
|
|
|
| Impairment and gain (loss) on sale of businesses and fixed assets |
|
|
|
|
(35 |
) |
|
|
– |
|
|
|
– |
|
| Environmental and other provisions |
|
|
|
|
(10 |
) |
|
|
– |
|
|
|
– |
|
| Restructuring, integration and rationalization costs |
|
|
|
|
– |
|
|
|
– |
|
|
|
– |
|
| Fair value gain (loss) on embedded derivatives |
|
|
|
|
– |
|
|
|
– |
|
|
|
– |
|
| Other |
|
|
|
|
– |
|
|
|
– |
|
|
|
– |
|
| |
|
|
|
|
(45 |
) |
|
|
– |
|
|
|
– |
|
| Other businesses and corporate |
|
|
|
|
|
|
|
|
|
|
|
|
|
|
| Impairment and gain (loss) on sale of businesses and fixed assets |
|
|
|
|
(196 |
) |
|
|
(282 |
) |
|
|
275 |
|
| Environmental and other provisions |
|
|
|
|
(241 |
) |
|
|
(261 |
) |
|
|
(220 |
) |
| Restructuring, integration and rationalization costs |
|
|
|
|
(3 |
) |
|
|
(15 |
) |
|
|
(39 |
) |
| Fair value gain (loss) on embedded derivativesc |
|
|
|
|
– |
|
|
|
– |
|
|
|
(123 |
) |
| Otherd |
|
|
|
|
19 |
|
|
|
(240 |
) |
|
|
(715 |
) |
| |
|
|
|
|
(421 |
) |
|
|
(798 |
) |
|
|
(822 |
) |
| Gulf of Mexico oil spill response |
|
|
|
|
(430 |
) |
|
|
(4,995 |
) |
|
|
3,800 |
|
| Total before interest and taxation |
|
|
|
|
9,705 |
|
|
|
(5,530 |
) |
|
|
3,506 |
|
| Finance costse |
|
|
|
|
(39 |
) |
|
|
(19 |
) |
|
|
(58 |
) |
| Taxation credit (charge)f |
|
|
|
|
867 |
|
|
|
251 |
|
|
|
(1,253 |
) |
| Total after taxation |
|
|
|
|
10,533 |
|
|
|
(5,298 |
) |
|
|
2,195 |
|
| a |
2013 included $845 million relating to the value ascribed to block BM-CAL-13 offshore Brazil, following the acquisition of upstream assets from Devon Energy in 2011,
which was written off as a result of the Pitanga exploration well not encountering commercial quantities of oil or gas. 2012 included a charge of $370 million relating to onerous gas marketing and trading contracts and $308 million relating to
exploration expense associated with our US natural gas assets (2011 $395 million). 2011 included a charge of $700 million associated with the termination of the agreement to sell our 60% interest in Pan American Energy LLC to Bridas
Corporation. |
| b |
2012 included dividend income from TNK-BP of $709 million and a charge of $325 million to settle disputes with AAR. |
| c |
Relates to an embedded derivative arising from a financing arrangement. |
| d |
2012 included charges of $244 million relating to our exit from the solar business (2011 $717 million). |
| e |
Finance costs relate to the Gulf of Mexico oil spill. See Financial statements – Note 2 for further details. |
| f |
For the Gulf of Mexico oil spill and certain impairment losses, disposal gains and fair value gains and losses on embedded derivatives, tax is based on statutory
rates, except for non-deductible items. For other items reported for consolidated subsidiaries, tax is calculated using the group’s discrete quarterly effective tax rate (adjusted for the items noted above, equity-accounted earnings and certain
deferred tax adjustments relating to changes in UK taxation). Non-operating items reported within the equity-accounted earnings of TNK-BP and Rosneft are reported net of tax. |
|
|
|
|
|
| BP Annual Report and Form 20-F 2013 |
|
|
237 |
|
Non-GAAP information on fair value accounting effects
The impacts of fair value accounting effects, relative to management’s internal measure of performance, and a reconciliation to GAAP information is also set out
below. Further information on fair value accounting effects is provided on page 269.
|
|
|
|
|
|
|
|
|
|
|
|
|
|
|
| |
|
|
|
|
|
|
|
|
|
$ million |
|
| |
|
|
|
2013 |
|
|
2012 |
|
|
2011 |
|
| Upstream |
|
|
|
|
|
|
|
|
|
|
|
|
|
|
| Unrecognized gains (losses) brought forward from previous period |
|
|
|
|
(404 |
) |
|
|
(538 |
) |
|
|
(527 |
) |
| Unrecognized (gains) losses carried forward |
|
|
|
|
160 |
|
|
|
404 |
|
|
|
538 |
|
| Favourable (unfavourable) impact relative to management’s measure of performance |
|
|
|
|
(244 |
) |
|
|
(134 |
) |
|
|
11 |
|
| Downstreama |
|
|
|
|
|
|
|
|
|
|
|
|
|
|
| Unrecognized gains (losses) brought forward from previous period |
|
|
|
|
501 |
|
|
|
74 |
|
|
|
137 |
|
| Unrecognized (gains) losses carried forward |
|
|
|
|
(679 |
) |
|
|
(501 |
) |
|
|
(74 |
) |
| Favourable (unfavourable) impact relative to management’s measure of performance |
|
|
|
|
(178 |
) |
|
|
(427 |
) |
|
|
63 |
|
| |
|
|
|
|
(422 |
) |
|
|
(561 |
) |
|
|
74 |
|
| Taxation credit (charge)b |
|
|
|
|
142 |
|
|
|
216 |
|
|
|
(27 |
) |
| |
|
|
|
|
(280 |
) |
|
|
(345 |
) |
|
|
47 |
|
| By region |
|
|
|
|
|
|
|
|
|
|
|
|
|
|
| Upstream |
|
|
|
|
|
|
|
|
|
|
|
|
|
|
| US |
|
|
|
|
(269 |
) |
|
|
(67 |
) |
|
|
15 |
|
| Non-US |
|
|
|
|
25 |
|
|
|
(67 |
) |
|
|
(4 |
) |
| |
|
|
|
|
(244 |
) |
|
|
(134 |
) |
|
|
11 |
|
| Downstreama |
|
|
|
|
|
|
|
|
|
|
|
|
|
|
| US |
|
|
|
|
(211 |
) |
|
|
(441 |
) |
|
|
– |
|
| Non-US |
|
|
|
|
33 |
|
|
|
14 |
|
|
|
63 |
|
| |
|
|
|
|
(178 |
) |
|
|
(427 |
) |
|
|
63 |
|
| a |
Fair value accounting effects arise solely in the fuels business. |
| b |
Tax is calculated using the group’s discrete quarterly effective tax rate (adjusted for the Gulf of Mexico oil spill, equity-accounted earnings, certain
impairment losses, disposal gains and fair value gains and losses on embedded derivatives and certain deferred tax adjustments relating to changes in UK taxation). |
Reconciliation of non-GAAP information
|
|
|
|
|
|
|
|
|
|
|
|
|
|
|
| |
|
|
|
|
|
|
|
|
|
$ million |
|
| |
|
|
|
2013 |
|
|
2012 |
|
|
2011 |
|
| Upstream |
|
|
|
|
|
|
|
|
|
|
|
|
|
|
| Replacement cost profit before interest and tax adjusted for fair value accounting effects |
|
|
|
|
16,901 |
|
|
|
22,625 |
|
|
|
26,347 |
|
| Impact of fair value accounting effects |
|
|
|
|
(244 |
) |
|
|
(134 |
) |
|
|
11 |
|
| Replacement cost profit before interest and tax |
|
|
|
|
16,657 |
|
|
|
22,491 |
|
|
|
26,358 |
|
| Downstream |
|
|
|
|
|
|
|
|
|
|
|
|
|
|
| Replacement cost profit before interest and tax adjusted for fair value accounting effects |
|
|
|
|
3,097 |
|
|
|
3,291 |
|
|
|
5,407 |
|
| Impact of fair value accounting effects |
|
|
|
|
(178 |
) |
|
|
(427 |
) |
|
|
63 |
|
| Replacement cost profit before interest and tax |
|
|
|
|
2,919 |
|
|
|
2,864 |
|
|
|
5,470 |
|
| Total group |
|
|
|
|
|
|
|
|
|
|
|
|
|
|
| Profit before interest and tax adjusted for fair value accounting effects |
|
|
|
|
32,191 |
|
|
|
20,330 |
|
|
|
39,741 |
|
| Impact of fair value accounting effects |
|
|
|
|
(422 |
) |
|
|
(561 |
) |
|
|
74 |
|
| Profit before interest and tax |
|
|
|
|
31,769 |
|
|
|
19,769 |
|
|
|
39,815 |
|
|
|
|
| 238 |
|
BP Annual Report and Form 20-F 2013 |
Upstream analysis by region
The following discussion reviews operations in our upstream business by geographical area, and lists associated significant events for 2013. BP’s percentage working
interest in oil and gas assets is shown in parentheses. Working interest is the cost-bearing ownership share of an oil or gas lease. Consequently, the percentages disclosed for certain agreements do not necessarily reflect the percentage interests
in reserves and production.
In addition to exploration, development and production activities, our upstream business also includes midstream and LNG activities.
Midstream activities involve the ownership and management of crude oil and natural gas pipelines, processing facilities and export terminals, LNG processing facilities and transportation, and our natural gas liquids (NGLs) extraction business.
Our LNG supply activities are located in Abu Dhabi, Angola, Australia, Indonesia and Trinidad. We market around 25% of our LNG production using BP LNG shipping and
contractual rights to access import terminal capacity in the liquid markets of the US (via Cove Point), the UK (via the Isle of Grain), Spain (in Bilbao) and Italy (in Rovigo), with the remainder marketed directly to customers. LNG is supplied to
customers in multiple markets including Japan, South Korea, China, the Dominican Republic, Argentina, Brazil and Mexico.
Europe
In Europe, BP is active in the UK North Sea and the Norwegian Sea. Our activities in the North Sea include a focus on maximizing recovery from existing producing fields
and selected new field developments.
| • |
|
In January production from the new facilities at the Valhall field in the southern part of the Norwegian North Sea commenced and has now ramped up to 70 mboe/d. Production from Skarv, which started up in December 2012,
has now ramped up to 160 mboe/d. |
| • |
|
In March BP and its partners, ConocoPhillips, Chevron and Shell, announced the decision to proceed with a two-year appraisal programme to evaluate a potential third phase of the Clair field, west of the Shetland
Islands. By the end of 2013, two appraisal wells had been completed and we are currently drilling a third. |
| • |
|
In April we completed the sale of our interest in the Sean (BP 50%) field in the North Sea to SSE plc for $288 million. |
| • |
|
In June we completed the sales of our interests in the Harding (BP 70%), Maclure (BP 37.04%), Braes (BP 27.7%), Braemar (BP 52%) and Devenick (BP 88.7%) fields in the North Sea to TAQA Bratani Ltd for $1,058 million
plus future payments which, depending on oil price and production, are currently expected to exceed $180 million after tax. |
| • |
|
In June BP announced that it had been awarded two licences in the Barents Sea as part of Norway’s 22nd offshore licensing round. |
| • |
|
In August the Clair Ridge platform jackets (the steel support structure) were installed, a major milestone in the project. |
| • |
|
In September BP announced that more than $1.5 billion in contracts had been awarded to UK-based companies to provide services and equipment for the major redevelopment of the Schiehallion and Loyal oil fields to the
west of Shetland. The project to redevelop the fields, which are operated by BP on behalf of its partners, involves two main elements: a new floating production, storage and offloading vessel (FPSO) and a major upgrade of the subsea infrastructure
that will lie on the seabed. |
| • |
|
In October the UK government announced a temporary management scheme to allow the restart of production from the Rhum gas field in the central North Sea, which has been suspended since November 2010 following the
imposition of EU sanctions on Iran. The field is owned by BP (50%) and the Iranian Oil Company (IOC) under a joint operating agreement dating back to the early 1970s. BP intends to recommence operations at Rhum in the future in accordance with
the temporary management scheme, under which the UK government will assume control of the IOC’s share of Rhum for a period of up to five years. Revenue from the IOC’s share will be placed in a blocked account. See Further note on certain
activities on page 267 for further information. |
| • |
|
In December BP was awarded 14 licences in the 27th UK Offshore Oil and Gas Licensing Round, subject to final government approval. |
In the UK sector of the North Sea, BP operates the Forties Pipeline System (FPS) (BP 100%), an integrated oil and NGLs transportation and
processing system that handles production from more than 80 fields in the central North Sea. The system has a capacity of more than 675mboe/d, with average throughput in 2013 of 421mboe/d. BP
also operates and has a 36% interest in the Central Area Transmission System (CATS), a 400-kilometre natural gas pipeline system in the central UK sector of the North Sea. The pipeline has a transportation capacity of 293mboe/d to a natural gas
terminal at Teesside in north-east England. Average throughput in 2013 was 52mboe/d. CATS offers natural gas transportation and processing services. In addition, BP operates the Sullom Voe oil and gas terminal in Shetland.
North America
Our upstream activities in North America
take place in four main areas: deepwater Gulf of Mexico, Lower 48 states, Alaska and Canada. For further information on BP’s activities in connection with its responsibilities following the Deepwater Horizon oil spill, see page 38.
BP has around 620 lease blocks in the deepwater Gulf of Mexico, more than any other company, and operates four production hubs.
| • |
|
In 2013 BP started up an additional three rigs in the Gulf of Mexico, and by the end of the year had ten rigs in operation. |
| • |
|
In April the Atlantis North expansion Phase 1 major project (BP 56%) started up. |
| • |
|
In April we completed the sale of our interest in the Freedom (BP 31.5%) field in the Gulf of Mexico to Ecopetrol America. |
| • |
|
In April the decision was taken not to move forward with the existing plan for the Mad Dog Phase 2 project in the deepwater Gulf of Mexico as market conditions and industry cost inflation made the project less
attractive than previously modelled. This decision resulted in an impairment of $159 million. BP and its partners reviewed alternative development concepts and the current concept being considered is a single production host designed for future
flexibility to capture additional potential resource. |
| • |
|
In December BP announced it had made a significant oil discovery at its Gila prospect (BP 80%), which it co-owns with ConocoPhillips, in the deepwater Gulf of Mexico. |
| • |
|
In February 2014 the Shell-operated Mars B major project (BP 28.5%) and the BP-operated Na Kika Phase 3 project (BP 50%) started up. |
For information on the temporary suspension and mandatory debarment notices issued by the US Environmental Protection Agency (EPA) in November 2012 and February 2013 and
related proceedings, see Legal proceedings on page 257.
The US onshore business operates in the Lower 48 states producing natural gas, NGLs and condensate across
nine states, including production from tight gas, coalbed methane (CBM) and shale gas assets.
During 2013 BP participated in the drilling of several hundred wells as
a non-operating partner in the Eagle Ford shale, Anadarko basin and Fayetteville shale. In the Eagle Ford shale BP, together with the operating partner, continued to expand its position, with around 450,000 gross acres at the end of 2013 and nine
rigs operating. Production from the liquids-rich Anadarko basin is from over 1,000,000 gross acres, with around 12 rigs operating, and at Fayetteville there is an average of eight rigs running over the 145,000 gross acreage position.
In March 2014 we announced plans to establish a separate BP business to manage our onshore oil and gas assets in the US lower 48, with the goal of building a stronger,
more competitive and sustainable business. We expect the separate organization to be operational in early 2015.
For further information on the use of hydraulic
fracturing in our shale gas assets see page 45. BP’s onshore US crude oil and product pipelines and related transportation assets are included in the Downstream segment (see page 31).
In Alaska, we operate 13 North Slope oilfields (including Prudhoe Bay, Endicott, Northstar and Milne Point) and four North Slope pipelines, and own significant interests
in six other producing fields.
| • |
|
Development of the Point Thomson initial production facility project continued throughout 2013. Engineering design is substantially complete, construction of field infrastructure is in progress and fabrication of the
four main process modules has commenced. Overall, the project is on track. BP holds a 32% working interest in the Point Thomson field, and ExxonMobil is the operator.
|
|
|
|
|
|
| BP Annual Report and Form 20-F 2013 |
|
|
239 |
|
| • |
|
In June BP announced plans to add $1 billion of new investment over five years beginning 2015 in the Alaska North Slope fields by adding two additional drilling rigs, one each in 2015 and 2016. Changes in the
state’s oil tax statute helped to enable this increased investment. In addition, BP secured support from the other working interest owners at Prudhoe Bay to begin evaluating an additional $3 billion of new development opportunities, including
facility expansions, a new well pad, and expansion of two existing well pads. |
| • |
|
BP continued to work jointly with ExxonMobil, ConocoPhillips and TransCanada throughout 2013 to advance the Alaska LNG project. In February 2013 a lead concept for the project was announced, consisting of a North Slope
gas treatment plant, an 800-mile (approximately) pipeline to tidewater and a three-train liquefaction facility, with an estimated capacity of 3bcf/d (15-18 million tonnes per annum). An initial summer
field season to collect data that will support filing of necessary regulatory permits was completed. In October selection of the lead site for the liquefaction facility was announced as Nikiski, Alaska, located on the south-central Alaskan coast. In
January 2014 BP, ExxonMobil, ConocoPhillips and TransCanada signed a heads of agreement (HOA) with the State of Alaska enabling state participation in the $45 – $65 billion Alaska LNG project. The HOA sets out guiding principles for
the parties to negotiate project-enabling contracts once enabling legislation is passed and provides a road map for state equity ownership in the project. |
Also in Alaska, BP owns a 48.4% interest in the Trans-Alaska Pipeline System (TAPS). The TAPS transports crude oil from Prudhoe Bay on the Alaska North Slope to the port
of Valdez in south-east Alaska.
| • |
|
In April 2012 the two non-controlling owners of TAPS, Koch (3.08%) and Unocal (1.37%) gave notice to BP, ExxonMobil (21.1%) and ConocoPhillips (29.1%) of their intention to withdraw as an owner of
TAPS. The transfer of Koch’s interest to the remaining owners (BP, ExxonMobil and ConocoPhillips) was agreed and approved by regulatory authorities, and closed in July with an effective date of August 2012. The remaining owners and Unocal have
not yet reached agreement regarding the terms for the transfer of Unocal’s interest in TAPS and are currently engaged in litigation. |
| • |
|
In September 2012 BP, ExxonMobil and ConocoPhillips entered into two settlement agreements on the pooling of costs on TAPS. In July the Federal Energy Regulatory Commission (FERC) issued an order approving the two
settlement agreements, and implementing cost pooling between TAPS owners under the terms of the settlement agreements. |
In Canada, BP is currently
focused on oil sands development and intends to use in situ steam-assisted gravity drainage (SAGD) technology, which uses the injection of steam into the reservoir to warm the bitumen so that it can flow to the surface through producing wells. We
hold interests in three oil sands leases through the Sunrise Oil Sands and Terre de Grace partnerships and the Pike Oil Sands joint operation. In addition, we have significant exploration interests in the Canadian Beaufort Sea. The award of four
offshore leases in Nova Scotia that were successfully bid for in 2012 was completed in 2013.
| • |
|
Phase 1 of the Sunrise Oil Sands SAGD development, in which we have a 50% non-operated interest, is under construction and is expected to commence operations in late 2014. The production capacity of Sunrise Phase 1 is
expected to be 60mb/d of bitumen. |
| • |
|
A major seismic programme on the Nova Scotia exploration leases is planned for the summer of 2014. The focus of the seismic programme will be to shoot 3D seismic on the 14,000km2 lease area in depths ranging from 100 metres to 3,500 metres. |
South America
In South America, BP has upstream activities in Brazil, Argentina, Bolivia, Chile, Uruguay and Trinidad & Tobago.
In Brazil, BP has interests in 24 exploration and production concessions, six of which are operated by BP, across six basins. Five of these concessions are subject to
government and regulatory approvals.
| • |
|
In March BP announced the completion of a successful flow test of the Itaipu-1A well, offshore Brazil. This activity was part of the ongoing appraisal programme and indicates that commercially viable flow rates can be
achieved from the BP-operated Itaipu discovery, located in the deepwater sector of the Campos basin.
|
| • |
|
In May BP and its partners announced they had been named winning bidders in eight deepwater blocks offshore Brazil in the Brazilian National Petroleum Agency’s 11th bid round. BP will be operator of two of these
blocks. Six of the blocks are in the Foz de Amazonas basin, with the remaining two in the Potiguar and Barreirinhas basins. |
| • |
|
In July BP announced the completion of an agreement with Petróleo Brasileiro S.A. (Petrobras) to farm in to five deepwater exploration and production blocks, subject to government and regulatory approvals. The
blocks are in the deepwater Potiguar basin located in the Brazilian equatorial margin and in total cover an area of 3,837km2. |
| • |
|
In December BP confirmed the Pitu oil discovery, operated by Petrobras, on block BM-POT-17 in the frontier deepwater of the Potiguar basin. BP’s farm-in to a 40% interest in this block is subject to final
regulatory approvals. |
| • |
|
In December BP announced the Pitanga exploration well on block BM-CAL-13 in the Camamu-Almada basin offshore Brazil had encountered oil shows but no commercial quantities of oil
or gas. This result will cause BP to relinquish the block and triggered a write-off of $216 million related to the costs of drilling the well, as well as a write-off of $845 million associated with the value allocated to this block as part of
the accounting related to the acquisition of Devon Energy’s interest in the block announced in 2010. |
| • |
|
In January 2014 we completed the sale of our interest in the Polvo oil field (BP 60%) in Brazil to HRT Oil & Gas Ltda for $135 million. |
In Argentina, Bolivia and Chile, BP conducts activity through Pan American Energy LLC (PAE), an equity-accounted joint venture with Bridas Corporation, in which BP has a
60% interest.
In Uruguay, BP has interests in three offshore deepwater exploration blocks: blocks 11 and 12 in the Pelotas basin and block 6 in the Punta del Este
basin, together covering an area of almost 26,000km2. The PSAs provide that BP will hold a 100% interest in the blocks and the Uruguayan state oil company, ANCAP, will have a right to participate
in up to 30% of any discoveries. BP is preparing to undertake its commitment to acquire over 13,000km2 of 3D seismic data and 3,000km of 2D seismic data during the first exploration period which
ends in December 2015.
In Trinidad & Tobago, BP holds licences covering 1,806,000 acres offshore of the east and north-east coast. Facilities include 13
offshore platforms and one onshore processing facility. Production is comprised of oil, gas and associated liquids.
BP has a shareholding in Atlantic LNG (ALNG), an
LNG liquefication plant, in Trinidad & Tobago that averages 39% across four LNG trainsa with a combined capacity of 21 million tonnes per annum. BP sells gas to each of the LNG
trains, supplying 100% of the gas for train 1, 50% for train 2, 75% for train 3 and around 67% of the gas for train 4. All of the LNG from Atlantic train 1 and most of the LNG from trains 2 and 3 is sold to third parties in the US and Europe under
long-term contracts. BP’s equity LNG entitlement from trains 2, 3 and 4 is marketed via BP’s LNG marketing and trading function to markets in the US, UK, Spain and South America.
Africa
BP’s upstream activities in Africa are
located in Angola, Algeria, Libya, Morocco, Egypt and Namibia.
BP is present in nine major deepwater licences offshore Angola and is operator in four of these.
| • |
|
Production from the Plutão, Saturno, Vénus and Marte (PSVM) development area in Block 31, offshore Angola, which started production in late 2012, continued to increase as planned, reaching a maximum rate
of just over 150mb/d in 2013. |
| • |
|
In October we had an oil and gas discovery in the pre-salt play of Angola in Block 20 (BP 30%), operated by Cobalt International Energy, Inc. This was followed by a successful drill-stem test in December.
|
| a |
An LNG train is a processing facility used to liquefy and purify natural gas in the formation of LNG.
|
|
|
|
| 240 |
|
BP Annual Report and Form 20-F 2013 |
In addition, BP has a 13.6% share in the Angola LNG project, which is expected to receive approximately 1bcf of associated
gas per day from offshore producing blocks and to produce 5.2 million tonnes per annum of LNG (gross), as well as related gas liquids products. The Angola LNG project exported its first cargo of LNG in June.
In Algeria, BP is a partner with Sonatrach and Statoil in the In Salah (BP 33.15%) and In Amenas (BP 45.89%) projects, which supply gas to the domestic and European
markets. In addition, BP has an appraisal and exploitation agreement with Sonatrach in the Bourarhat Sud block, located to the south-west of In Amenas. In the exploration phase this asset is BP-operated. The Bourarhat licence has been extended until
September 2014 and BP is currently assessing its options to appraise and potentially develop this asset. BP’s total assets in Algeria at 31 December 2013 were $3,413 million ($324 million current and $3,089 million non-current).
| • |
|
In January a terrorist attack occurred at the In Amenas joint operation site. Following the incident, BP had a staged reduction of non-essential workers out of Algeria as a precautionary and temporary measure. Trains 1
and 2 have been restored to full production but Train 3 remains out of service. In March, the decision was taken to suspend activity at Bourarhat while options to appraise and potentially develop this asset are assessed. Ramp-down of activity was
largely completed in October. |
In Libya, BP is in partnership with the Libyan Investment Authority (LIA) to explore acreage in the onshore Ghadames and
offshore Sirt basins, covered under the exploration and production-sharing agreement (EPSA) ratified in December 2007 (BP 85%). BP’s total assets in Libya at 31 December 2013 were $472 million ($72 million current and $400 million
non-current).
| • |
|
Planning and preparation work towards our offshore exploration drilling programme is continuing. With respect to the onshore exploration drilling programme, a security review in June concluded that this could not be
safely and securely delivered by BP at this time. Alternative approaches are being considered. |
In Morocco, BP entered into three farm-out agreements
with Kosmos Energy covering three blocks in the Agadir Basin, offshore Morocco. Under the terms of the agreements, one of which is still subject to government approval, BP will acquire a non-operating interest in each of the Essaouira Offshore (BP
45%), Foum Assaka Offshore (BP 26.325%) and Tarhazoute Offshore (BP 45%) blocks.
In Egypt, BP and its partners currently produce 15% of Egypt’s oil production
and more than 30% of its gas production. BP’s total assets in Egypt at 31 December 2013 were $7,638 million, of which $2,299 million were current (see Financial statements – Note 19) and $5,339 million were non-current.
| • |
|
In July the Egyptian army chief removed the country’s then-incumbent president, Mohamed Morsi, from power and suspended the Egyptian Constitution. Adly Mansour, Chief Justice of the Supreme Constitutional Court of
Egypt was declared interim president. The political and economic situation remains challenging despite aid being pledged from neighbouring Gulf states. Our production and operations continue and we are engaged with the government in managing our
operations. |
| • |
|
In September BP announced a significant gas discovery in the East Nile Delta with the Salamat well, the deepest well ever drilled in the Nile Delta. Salamat is the first well to be drilled in the BP-operated North
Damietta (BP 100%) offshore concession awarded in 2010. |
In Namibia, BP is a non-operating partner in one deepwater block, which is currently in the
exploration phase. This block was accessed in 2012. In December BP decided to withdraw from four deepwater blocks by not exercising an option to increase its interest in Luderita Basin licence 0047, offshore Namibia.
Asia
In Asia, BP has activities in Western Indonesia,
China, Azerbaijan, Oman, Abu Dhabi, India and Iraq.
In Western Indonesia, BP is involved in two of Indonesia’s three LNG centres. BP’s first operated LNG
plant, Tangguh (BP 37.16%), is located
in Papua Barat. The asset comprises 14 producing wells, two offshore platforms, two pipelines and an LNG plant with two production trains and has a total capacity of 7.6 million tonnes of
LNG per annum. Plans for a third train remain on track, with commissioning projected to occur in 2019. Tangguh supplies LNG to customers in China, South Korea, Mexico and Japan through a combination of long, medium and short-term contracts.
BP also participates in Indonesia’s LNG exports through its interest in Virginia Indonesia Company LLC (VICO), the operator of Sanga-Sanga PSA (BP 38%) supplying gas
to the Bontang LNG plant in Kalimantan. Sanga-Sanga currently delivers around 13% of the total gas feed to Bontang, Indonesia’s largest LNG export facility and one of the world’s largest LNG plants with a capacity of 22 million tonnes
per annum of LNG and output of more than 18 million tonnes of LNG.
BP also participates in the Sanga-Sanga CBM PSA (BP 38%), as well as one other CBM PSA,
Tanjung IV (BP 44%), in the Barito basin of Central Kalimantan. BP completed its exit from the Kapuas I, II and III PSAs in May by transfer of its working interest to its respective partner in each PSA.
In China, BP’s upstream activities in the country include deepwater exploration in the South China Sea’s Block 42/05 (BP 40.82%), Block 43/11 (BP 40.82%) and
Block 54/11 (BP 100%).
| • |
|
In July BP announced that it had signed a PSA with CNOOC for Block 54/11 in the South China Sea. The new block is close to BP’s two other existing deepwater interests. |
| • |
|
In December we completed the sale of our interests in the Yacheng offshore gas field (BP 34.3%) in China for $308 million (subject to post-closing adjustments). |
In China, BP also has a 30% equity stake in the 7 million tonnes per annum capacity Guangdong LNG regasification and pipeline project in south-east China, making it
the first foreign partner in China’s LNG import business. The terminal is also supplied under a long-term contract with Australia’s North West Shelf venture described below.
In Azerbaijan, BP invests more than any other foreign investor, operates two PSAs, Azeri-Chirag-Gunashli (ACG) (BP 35.8%) and Shah Deniz (BP 25.5%), and also holds
other exploration leases.
| • |
|
In 2012 further EU and US regulations concerning restrictive measures against Iran were issued. The Shah Deniz joint operation and its gas marketing and pipeline entities, in which Naftiran Intertrade Co. Ltd (NICO) has
an interest, were excluded from the main operative provisions of the EU regulations as well as from the application of the new US sanctions, and fall within the exception for certain natural gas projects under Section 603 of the US Iran Threat
Reduction and Syria Human Rights Act of 2012. Shah Deniz continues to operate in full compliance with EU and US law. For further information see Further note on certain activities on page 267. |
| • |
|
In June the Shah Deniz consortium announced that it had selected the Trans Adriatic Pipeline (TAP) to deliver gas volumes from the Shah Deniz Stage 2 project to customers in Italy, Greece, Bulgaria and Turkey. In
September, the consortium announced that it had concluded the Shah Deniz Stage 2 gas sales process with the completion of major sales agreements with European gas purchasers totalling 10bcma over 25 years. This adds to existing agreements to sell
6bcma of gas in Turkey. The agreements come in to force following the final investment decision (FID) on the project, which occurred in December. The upstream part of the Shah Deniz Stage 2 project entails drilling and completion of 26 subsea wells,
construction of two bridge-linked platforms and new processing and compression facilities at the onshore terminal. The FID also triggers plans to expand the South Caucasus Pipeline (SCP) through Azerbaijan and Georgia, to construct the Trans
Antolian Gas Pipeline (TANAP) across Turkey and to construct the TAP across Greece, Albania and into Italy. |
| • |
|
Additionally, the State Oil Company of Azerbaijan Republic (SOCAR) and the Shah Deniz partners also agreed terms for extending the Shah Deniz PSA to 2048 and, coincident with the FID, BP agreed to purchase a 3.3%
equity in Shah Deniz and SCP from Statoil, subject to conditions that are expected to be satisfied in 2014. |
| • |
|
In January 2014 the West Chirag platform came online. This completes the Chirag oil project sanctioned in 2010.
|
|
|
|
|
|
| BP Annual Report and Form 20-F 2013 |
|
|
241 |
|
| • |
|
BP, as operator, holds a 30.1% interest in and manages the Baku-Tbilisi-Ceyhan (BTC) oil pipeline. The 1,768-kilometre pipeline transports oil from the BP-operated ACG oilfield and gas condensate from the Shah Deniz gas
field in the Caspian Sea, along with other third-party oil, to the eastern Mediterranean port of Ceyhan. The BTC pipeline has a capacity of 1mmboe/d with average throughput in 2013 of 681mboe/d. |
BP is technical operator of, and currently holds a 25.5% interest in, the 693-kilometre South Caucasus Pipeline, which takes gas from Azerbaijan through Georgia to the
Turkish border and has a capacity of 134mboe/d with average throughput in 2013 of 82mboe/d. In addition, BP operates the Western Export Route Pipeline between Azerbaijan and the Black Sea coast of Georgia (as operator of Azerbaijan International
Operating Company).
BP currently has appraisal programmes and development activities in Oman.
In December BP and the Sultanate of Oman government signed a gas sales agreement and an amended exploration and production sharing agreement (EPSA) for the development of
the Khazzan field in Block 61 with BP as operator. In February 2014 the Sultan of Oman issued a royal decree approving the amended EPSA. The Sultanate of Oman government acquired a 40% stake in Block 61 in February 2014 through Makarim Gas
Development LLC, a wholly-owned subsidiary of the state-owned Oman Oil Company Exploration & Production (OOCEP). Construction work is expected to begin in 2014 with gas production expected to start in 2017.
In Jordan BP has decided to withdraw from the Risha concession, which resulted in a write-off of $121 million related to the costs of exploration drilling activities, as
well as a $257-million write-off for costs relating to the concession.
In Abu Dhabi, during 2013 we had equity interests of 9.5% and 14.67% in onshore and offshore
concessions respectively. The Abu Dhabi onshore concession expired in January 2014 with a consequent production impact of approximately 140mboe/d.
Also in Abu Dhabi,
we have a 10% equity shareholding in the Abu Dhabi Gas Liquefaction Company, which in 2013 supplied 5.4 million tonnes of LNG (281 bcfe regasified).
In India,
BP has a 30% interest in six oil and gas PSAs operated by Reliance Industries Limited (RIL), a 50% interest in one operated PSA, and is a partner with RIL in a 50:50 joint operation for the sourcing and marketing of gas in India.
| • |
|
In May RIL and its partners BP and NIKO Resources Ltd announced a significant gas and condensate discovery in the KG D6 block off the eastern coast of India. |
| • |
|
In August RIL and BP announced a new gas condensate discovery in the deepwater block CYD5 (BP 30%) situated in the Cauvery basin, off the east coast of India. This is the second discovery in the block.
|
| • |
|
In August the government approved the Field Development Plan (FDP) for the R-Series project in the KG D6 block and has reviewed the appraisal plan for the KG D6 discovery. |
| • |
|
Following approval by the relevant authorities in 2012, a number of activities are being progressed to arrest the decline in production rates and to extend the life of the block KG D6 producing fields. These include new
work-over wells and the installation of additional compression and water handling capacity. |
| • |
|
In January 2014 the Government of India issued notification of new guidelines for pricing of domestic gas, which will be formula driven, effective from 1 April 2014. |
In Iraq, BP holds a 38% working interest and is the lead contractor in the Rumaila technical service contract. Rumaila is one of the world’s largest oilfields and
was discovered by BP, as part of a consortium, in 1953 and comprises five producing reservoirs.
Australasia
In Australasia, we are active in Australia and Eastern Indonesia.
In Australia, BP is
one of seven partners in the North West Shelf (NWS) venture, which has been producing LNG, pipeline gas, condensate, LPG and oil since the 1980s. Six partners (including BP) hold an equal 16.67% interest in the gas infrastructure and an equal 15.78%
interest in the gas and condensate reserves, with a seventh partner owning the remaining
5.32%. BP also has a 16.67% interest in some of the NWS oil reserves and related infrastructure. The NWS venture is currently the principal supplier to the domestic market in Western Australia
and one of the largest LNG export projects in Asia with five LNG trains in operation. BP’s net share of the capacity of NWS LNG trains 1-5 is 2.7 million tonnes per annum of LNG.
BP also holds a 5.375% interest in the Jansz-lo field and 12.5% interests in the Geryon, Orthrus and Maenad fields which are part of the Greater Gorgon project.
BP holds a 70% interest in four deepwater offshore exploration blocks in the Ceduna Sub Basin (this follows the farm-down of 30% of our interest in the four blocks to
Statoil in April). BP, as operator, expects to drill four deepwater wells beginning in 2016 in this frontier exploration basin, located within the Great Australian Bight off the coast of southern Australia.
BP is also one of five partners in the Browse LNG venture (operated by Woodside) and holds a 17% interest.
| • |
|
In September the Browse joint operation partners decided to change the concept from an onshore LNG plant at James Price Point to an offshore floating LNG concept resulting in an impairment of $251 million. The
proposed development remains subject to regulatory, joint operation and internal BP approvals. |
| • |
|
In September gas production commenced at the Woodside-operated North Rankin Phase 2 compression platform, designed to extend the life of the North West Shelf production to 2040. |
In Eastern Indonesia, BP has 100% interests in two deepwater PSAs: West Aru I and II. The PSAs are located 200 kilometres west of the Aru island group. A seismic campaign
covering 5,000km2 in the West Aru PSAs was completed in September. In addition, BP owns a 32% interest in the Chevron-operated West Papua I and Ill PSAs, located 120 kilometres to the south of our
Tangguh LNG plant (BP 37.16% and operator).
BP received approval from the government of the Republic of Indonesia in November to transfer its 100% interest in the
North Arafura PSA, located on the coast of the Arafura Sea, 480 kilometres south east of the Tangguh LNG plant.
Downstream analysis by region
The downstream business includes our global fuels, lubricants and petrochemicals businesses. We have significant
operations in Europe, North America and Asia, and also manufacture and market our products across Australasia, Southern Africa and Central and South America.
We made
significant progress in our plans to reshape the US fuels business, build new capability and improve technology in 2013.
Our downstream business operations are
detailed below by geographical area with associated significant events for 2013.
North America
BP is active in North America through our refineries, terminals, pipelines, retail sites, lubricants, aviation and petrochemical plants.
| • |
|
To improve production, increase capacity or reduce unit cost we built and reconfigured major units at three refineries. |
| |
– |
Whiting refinery – commissioning of all major units of the Whiting refinery modernization project was completed in December 2013. As part of the project, we built or reconfigured almost
every process unit, including crude distillation and coking units as well as hydro-treating sulphur recovery and coking capacity. The upgrade increases the refinery’s heavy oil processing capability, enabling processing of up to 80% of heavy,
sour crude. Whiting’s Midwest location provides advantaged access to heavy Canadian crudes and access to three major geographic crude sources. |
| |
– |
Toledo refinery – BP-Husky Refining LLC successfully started up a new naphtha reformer in March 2013. It is intended to improve the plant’s efficiency and competitiveness and
reduce refinery air emissions. |
| |
– |
Cherry Point refinery – We completed a state-of-the-art diesel hydrotreater and hydrogen plant in May 2013. The units enhance our ability to meet regulations calling for lower sulphur
diesel fuel. |
|
|
|
| 242 |
|
BP Annual Report and Form 20-F 2013 |
| • |
|
We continued to reshape our US fuels business by completing the sales of the Texas City and Carson, California refineries, as well as related logistics and marketing assets. |
| • |
|
Our Decatur petrochemicals paraxylene/PTA plant will be the principal supplier for a new adjacent 432,000 ton PET resin facility of Indorama Polymers Group, announced in August 2013. |
Europe
| • |
|
We announced two new proprietary petrochemicals technologies, SaaBre and Hummingbird. Both technologies are expected to deliver significant reductions in variable manufacturing costs and simplify the
global manufacturing process. |
| |
– |
SaaBre significantly reduces the cost of production of acetic acid from syngas and avoids the need to purify carbon monoxide or purchase methanol. SaaBre technology could also be used to produce methanol
and ethanol. |
| |
– |
Hummingbird simplifies the process of converting ethanol to ethylene, a key component for the manufacture of plastics. Hummingbird could open the way for the production of biopolymers from bioethanol.
|
| • |
|
We have completed the sale of six out of eight countries of our global LPG marketing business, which sells bulk and bottled LPG products (UK, Benelux, Austria, Poland, Turkey and South Africa). Sales of the remaining
businesses in Portugal and China are expected to be completed in 2014.
|
| • |
|
Our lubricants business announced a co-operation agreement with Honda Motor Europe to be the recommended lubricants supplier for Honda’s European franchise car dealer network. |
Africa
| • |
|
We announced our intention to invest more than $500 million in southern Africa over the next five years. Around half of this investment will be used to upgrade refinery infrastructure at SAPREF, BP’s joint
operation with Shell located in Durban. In addition, BP will invest in Pick n PayTM retail network in South Africa and in building and upgrading our fuel terminals to a world-class standard in
Mozambique and South Africa. |
Asia
| • |
|
Construction of our third PTA plant at Zhuhai in Guangdong province of China progressed, with completion expected in late 2014. |
| • |
|
In December 2013 we agreed to purchase all interests held by our partners, Mitsui Chemicals, Inc. and Mitsui & Co. Ltd. in PT Amoco Mitsui PTA Indonesia which produces and markets PTA in the Republic of Indonesia.
This transaction completed on 28 February 2014 and is consistent with our strategy of growing our PTA business in our chosen markets. |
| • |
|
We launched the gasoline additive, Ultimate, in China. The aim is to create new market opportunities to capture more of the passenger car market in China.
|
Downstream plant capacity
The following table summarizes the BP group’s interests in refineries and average daily crude distillation capacities as at 31 December 2013.
|
|
|
|
|
|
|
|
|
|
|
|
|
|
|
|
|
|
|
| |
|
|
|
|
|
|
|
|
|
|
thousand barrels per day |
|
| |
|
|
|
|
|
|
|
|
|
|
Crude distillation
capacitiesa |
|
| Geographical area |
|
Refinery |
|
Fuels value chain |
|
|
|
Group interestb % |
|
|
Total |
|
|
BP
share |
|
| US |
|
|
|
|
|
|
|
|
|
|
|
|
|
|
|
|
|
|
| Washington |
|
Cherry Point |
|
US North West |
|
|
|
|
100.0 |
|
|
|
234 |
|
|
|
234 |
|
| Indiana |
|
Whiting |
|
US East of Rockies |
|
|
|
|
100.0 |
|
|
|
428 |
|
|
|
428 |
|
| Ohio |
|
Toledo |
|
US East of Rockies |
|
|
|
|
50.0 |
|
|
|
160 |
|
|
|
80 |
|
| |
|
|
|
|
|
|
|
|
|
|
|
|
822 |
|
|
|
742 |
|
| Europe |
|
|
|
|
|
|
|
|
|
|
|
|
|
|
|
|
|
|
| Germany |
|
Bayernoilc |
|
Rhine |
|
|
|
|
22.5 |
|
|
|
217 |
|
|
|
49 |
|
|
|
Gelsenkirchen |
|
Rhine |
|
|
|
|
50.0 |
|
|
|
265 |
|
|
|
132 |
|
|
|
Karlsruhec |
|
Rhine |
|
|
|
|
12.0 |
|
|
|
322 |
|
|
|
39 |
|
|
|
Lingen |
|
Rhine |
|
|
|
|
100.0 |
|
|
|
95 |
|
|
|
95 |
|
|
|
Schwedtc |
|
Rhine |
|
|
|
|
18.8 |
|
|
|
239 |
|
|
|
45 |
|
| Netherlands |
|
Rotterdam |
|
Rhine |
|
|
|
|
100.0 |
|
|
|
377 |
|
|
|
377 |
|
| Spain |
|
Castellón |
|
Iberia |
|
|
|
|
100.0 |
|
|
|
110 |
|
|
|
110 |
|
| |
|
|
|
|
|
|
|
|
|
|
|
|
1,625 |
|
|
|
847 |
|
| Rest of world |
|
|
|
|
|
|
|
|
|
|
|
|
|
|
|
|
|
|
| Australia |
|
Bulwer |
|
Australia New Zealand |
|
|
|
|
100.0 |
|
|
|
102 |
|
|
|
102 |
|
|
|
Kwinana |
|
Australia New Zealand |
|
|
|
|
100.0 |
|
|
|
146 |
|
|
|
146 |
|
| New Zealand |
|
Whangareic |
|
Australia New Zealand |
|
|
|
|
23.7 |
|
|
|
118 |
|
|
|
28 |
|
| South Africa |
|
Durbanc |
|
Southern Africa |
|
|
|
|
50.0 |
|
|
|
180 |
|
|
|
90 |
|
| |
|
|
|
|
|
|
|
|
|
|
|
|
546 |
|
|
|
366 |
|
| Total BP share of capacity at 31 December 2013 |
|
|
|
|
|
|
|
|
|
|
|
|
|
|
|
|
1,955 |
|
| a |
Crude distillation capacity is gross rated capacity, which is defined as the highest average sustained unit rate for a consecutive 30-day period. |
| b |
BP share of equity, which is not necessarily the same as BP share of processing entitlements. |
| c |
Indicates refineries not operated by BP. |
|
|
|
|
|
| BP Annual Report and Form 20-F 2013 |
|
|
243 |
|
Petrochemicals production capacitya b
The following table summarizes the BP group’s share of petrochemicals production capacities as at 31 December 2013.
|
|
|
|
|
|
|
|
|
|
|
|
|
|
|
| Geographical area |
|
Site |
|
Product |
|
|
|
Group interest
% |
|
|
BP share of
capacity
thousand tonnes
per
annumc |
|
| US |
|
|
|
|
|
|
|
|
|
|
|
|
|
|
|
|
Cooper River |
|
Purified terephthalic acid (PTA) |
|
|
|
|
100.0 |
|
|
|
1,300 |
|
|
|
Decaturd |
|
PTA |
|
|
|
|
100.0 |
|
|
|
1,000 |
|
|
|
|
|
Paraxylene (PX) |
|
|
|
|
100.0 |
|
|
|
1,100 |
|
|
|
Texas City |
|
Acetic acid |
|
|
|
|
100.0 |
e |
|
|
600 |
e |
|
|
|
|
PX |
|
|
|
|
100.0 |
|
|
|
1,300 |
|
| |
|
|
|
Metaxylene |
|
|
|
|
100.0 |
|
|
|
100 |
|
| |
|
|
|
|
|
|
|
|
|
|
|
|
5,400 |
|
| Europe |
|
|
|
|
|
|
|
|
|
|
|
|
|
|
| UK |
|
Hulld |
|
Acetic acid |
|
|
|
|
100.0 |
|
|
|
500 |
|
|
|
|
|
Acetic anhydride |
|
|
|
|
100.0 |
|
|
|
200 |
|
| Belgium |
|
Geel |
|
PTA |
|
|
|
|
100.0 |
|
|
|
1,300 |
|
|
|
|
|
PX |
|
|
|
|
100.0 |
|
|
|
700 |
|
| Germany |
|
Gelsenkirchenf |
|
Olefins and derivatives |
|
|
|
|
50.0 to 61.0 |
|
|
|
1,800 |
b g |
| |
|
Mülheimf |
|
Solvents |
|
|
|
|
50.0 |
|
|
|
100 |
b |
| |
|
|
|
|
|
|
|
|
|
|
|
|
4,600 |
|
| Rest of world |
|
|
|
|
|
|
|
|
|
|
|
|
|
|
| China |
|
Caojing |
|
Olefins and derivatives |
|
|
|
|
50.0 |
|
|
|
3,300 |
b |
|
|
Chongqing |
|
Acetic acid |
|
|
|
|
51.0 |
|
|
|
200 |
b |
|
|
|
|
Esters |
|
|
|
|
51.0 |
|
|
|
100 |
b |
|
|
Nanjing |
|
Acetic acid |
|
|
|
|
50.0 |
|
|
|
300 |
b |
|
|
Zhuhai |
|
PTA |
|
|
|
|
85.0 |
|
|
|
1,800 |
h |
| Indonesia |
|
Merak |
|
PTA |
|
|
|
|
50.0 |
|
|
|
300 |
b |
| South Korea |
|
Ulsan |
|
Acetic acid |
|
|
|
|
51.0 |
|
|
|
300 |
b |
|
|
|
|
Vinyl acetate monomer |
|
|
|
|
34.0 |
|
|
|
100 |
b |
| Malaysia |
|
Kertih |
|
Acetic acid |
|
|
|
|
70.0 |
|
|
|
400 |
b |
| Taiwan |
|
Kaohsiung |
|
PTA |
|
|
|
|
61.4 |
|
|
|
900 |
b |
|
|
Taichung |
|
PTA |
|
|
|
|
61.4 |
|
|
|
500 |
b |
| |
|
Mai Liao |
|
Acetic acid |
|
|
|
|
50.0 |
|
|
|
200 |
b |
| |
|
|
|
|
|
|
|
|
|
|
|
|
8,400 |
|
| Total BP share of capacity at 31 December 2013 |
|
|
|
|
|
|
|
|
18,400 |
|
| a |
Petrochemicals production capacity is the proven maximum sustainable daily rate (MSDR) multiplied by the number of days in the respective period, where MSDR is the
highest average daily rate ever achieved over a sustained period. |
| b |
Includes BP share of equity-accounted entities, as indicated. |
| c |
Capacities are shown to the nearest hundred thousand tonnes per annum. |
| d |
These sites have capacity under 100,000 tonnes per annum for a speciality product (e.g. naphthalene dicarboxylate and ethylidene diacetate). |
| e |
Group interest is quoted at 100%, reflecting the capacity entitlement, which is marketed by BP. |
| f |
Due to the integrated nature of these plants with our Gelsenkirchen refinery, the income and expenditure of these plants is managed and reported through the fuels
business. |
| g |
Group interest varies by product. |
| h |
BP Zhuhai Chemical Company Ltd is a subsidiary of BP, the capacity of which is shown above at 100%. |
|
|
|
| 244 |
|
BP Annual Report and Form 20-F 2013 |
Oil and gas disclosures for the group
Resource progression
BP manages its
hydrocarbon resources in three major categories: prospect inventory, contingent resources and proved reserves. When a discovery is made, volumes usually transfer from the prospect inventory to the contingent resources category. The contingent
resources move through various sub-categories as their technical and commercial maturity increases through appraisal activity.
At the point of final investment
decision, most proved reserves will be categorized as proved undeveloped (PUD). Volumes will subsequently be recategorized from PUD to proved developed (PD) as a consequence of development activity. When part of a well’s proved reserves depends
on a later phase of activity, only that portion of proved reserves associated with existing, available facilities and infrastructure moves to PD. The first PD bookings will typically occur at the point of first oil or gas production. Major
development projects typically take one to five years from the time of initial booking of PUD to the start of production. Changes to proved reserves bookings may be made due to analysis of new or existing data concerning production, reservoir
performance, commercial factors and additional reservoir development activity.
Volumes can also be added or removed from our portfolio through acquisition or
divestment of properties and projects. When we dispose of an interest in a property or project, the volumes associated with our adopted plan of development for which we have a final investment decision will be removed from our proved reserves upon
completion. When we acquire an interest in a property or project, the volumes associated with the existing development and any committed projects will be added to our proved reserves if BP has made a final investment decision and they satisfy the
SEC’s criteria for attribution of proved status. Following the acquisition, additional volumes may be progressed to proved reserves from contingent resources.
Contingent resources in a field will only be recategorized as proved reserves when all the criteria for attribution of proved status have been met and the proved reserves
are included in the business plan and scheduled for development, typically within five years. BP will only book proved reserves where development is scheduled to commence after more than five years, if these proved reserves satisfy the SEC’s
criteria for attribution of proved status and BP management has reasonable certainty that these proved reserves will be produced.
At the end of 2013 BP had material
volumes of proved undeveloped reserves held for more than five years in Trinidad and the Gulf of Mexico. These are part of ongoing development activities for which BP has a historical track record of completing comparable projects in these
countries. We have no proved undeveloped reserves held for more than five years in our onshore US developments.
In each case the volumes are being progressed as part
of an adopted development plan where there are physical limits to the development timing such as infrastructure limitations, contractual limits including gas delivery commitments, late life compression and the complex nature of working in remote
locations.
Over the past five years, BP has annually progressed on average 19% of our proved undeveloped reserves (accounting for disposals) to proved developed
reserves. This equates to a turnover time of about five years. We expect the turnover time to remain at or below five years and anticipate the volume of proved undeveloped reserves held for more than five years to remain about the same.
In 2013 we progressed 985mmboe of proved undeveloped reserves (532mmboe for our subsidiaries alone) to proved developed reserves through ongoing investment in our
subsidiaries’ and equity-accounted entities’ upstream development activities. Total development expenditure in Upstream, excluding midstream activities, was $16,664 million in 2013 ($13,552 million for subsidiaries and
$3,112 million for equity-accounted entities). The major areas with progressed volumes in 2013 were Angola, Australia, Azerbaijan, Iraq, Norway, Russia, Trinidad and the US. Revisions of previous estimates for proved undeveloped reserves are
due to changes relating to field performance or well results. The following tables describe the changes to
our proved undeveloped reserves position through the year for our subsidiaries and equity-accounted entities and for our subsidiaries alone.
|
|
|
|
|
| Subsidiaries and equity-accounted assets |
|
volumes in mmboe |
|
| Proved undeveloped reserves at 1 January 2013 |
|
|
7,526 |
|
| Revisions of previous estimates |
|
|
466 |
|
| Improved recovery |
|
|
333 |
|
| Discoveries and extensions |
|
|
765 |
|
| Purchases |
|
|
2,447 |
|
| Sales |
|
|
(2,472 |
) |
| Total in year proved undeveloped reserves changes |
|
|
9,065 |
|
| Progressed to proved developed reserves |
|
|
(985 |
) |
| Proved undeveloped reserves at 31 December 2013 |
|
|
8,080 |
|
|
|
|
|
|
| Subsidiaries only |
|
volumes in mmboe |
|
| Proved undeveloped reserves at 1 January 2013 |
|
|
4,699 |
|
| Revisions of previous estimates |
|
|
(20 |
) |
| Improved recovery |
|
|
294 |
|
| Discoveries and extensions |
|
|
473 |
|
| Purchases |
|
|
– |
|
| Sales |
|
|
(70 |
) |
| Total in year proved undeveloped reserves changes |
|
|
5,376 |
|
| Progressed to proved developed reserves |
|
|
(532 |
) |
| Proved undeveloped reserves at 31 December 2013 |
|
|
4,844 |
|
BP bases its proved reserves estimates on the requirement of reasonable certainty with rigorous technical and commercial assessments based
on conventional industry practice and regulatory requirements. BP only applies technologies that have been field tested and have been demonstrated to provide reasonably certain results with consistency and repeatability in the formation being
evaluated or in an analogous formation. BP applies high-resolution seismic data for the identification of reservoir extent and fluid contacts only where there is an overwhelming track record of success in its local application. In certain deepwater
fields BP has booked proved reserves before production flow tests are conducted, in part because of the significant safety, cost and environmental implications of conducting these tests. The industry has made substantial technological improvements
in understanding, measuring and delineating reservoir properties without the need for flow tests. To determine reasonable certainty of commercial recovery, BP employs a general method of reserves assessment that relies on the integration of three
types of data:
| 1. |
Well data used to assess the local characteristics and conditions of reservoirs and fluids. |
| 2. |
Field scale seismic data to allow the interpolation and extrapolation of these characteristics outside the immediate area of the local well control. |
| 3. |
Data from relevant analogous fields. Well data includes appraisal wells or sidetrack holes, full logging suites, core data and fluid samples. BP considers the integration of this data in certain cases to be superior to
a flow test in providing understanding of overall reservoir performance. The collection of data from logs, cores, wireline formation testers, pressures and fluid samples calibrated to each other and to the seismic data can allow reservoir properties
to be determined over a greater volume than the localized volume of investigation associated with a short-term flow test. There is a strong track record of proved reserves recorded using these methods, validated by actual production levels.
|
Governance
BP’s centrally
controlled process for proved reserves estimation approval forms part of a holistic and integrated system of internal control. It consists of the following elements:
| • |
|
Accountabilities of certain officers of the group to ensure that there is review and approval of proved reserves bookings independent of the operating business and that there are effective controls in the approval
process and verification that the proved reserves estimates and the related financial impacts are reported in a timely manner. |
| • |
|
Capital allocation processes, whereby delegated authority is exercised to commit to capital projects that are consistent with the delivery of
|
|
|
|
|
|
| BP Annual Report and Form 20-F 2013 |
|
|
245 |
|
| |
|
the group’s business plan. A formal review process exists to ensure that both technical and commercial criteria are met prior to the commitment of capital to projects. |
| • |
|
Group audit, whose role is to consider whether the group’s system of internal control is adequately designed and operating effectively to respond appropriately to the risks that are significant to BP.
|
| • |
|
Approval hierarchy, whereby proved reserves changes above certain threshold volumes require central authorization and periodic reviews. The frequency of review is determined according to field size and ensures that more
than 80% of the BP proved reserves base undergoes central review every two years, and more than 90% is reviewed centrally every four years. |
BP’s
vice president of segment reserves is the petroleum engineer primarily responsible for overseeing the preparation of the reserves estimate. He has more than 30 years of diversified industry experience with the past nine spent managing the governance
and compliance of BP’s reserves estimation. He is a past member of the Society of Petroleum Engineers Oil and Gas Reserves Committee, a sitting member of the American Association of Petroleum Geologists Committee on Resource Evaluation and
chair of the bureau of the United Nations Economic Commission for Europe Expert Group on Resource Classification.
No specific portion of compensation bonuses for
executive directors and senior management is directly related to proved reserves targets. Additions to proved reserves is one of several indicators by which the performance of the Upstream segment is assessed by the remuneration committee for the
purposes of determining compensation bonuses for the executive directors. Other indicators include a number of financial and operational measures.
BP’s variable
pay programme for the other senior managers in the Upstream segment is based on individual performance contracts. Individual performance contracts are based on agreed items from the business performance plan, one of which, if chosen, could relate to
proved reserves.
Compliance
International Financial
Reporting Standards (IFRS) do not provide specific guidance on reserves disclosures. BP estimates proved reserves in accordance with SEC Rule 4-10 (a) of Regulation S-X and relevant Compliance and Disclosure Interpretations (C&DI) and Staff
Accounting Bulletins as issued by the SEC staff.
By their nature, there is always some risk involved in the ultimate development and production of proved reserves
including, but not limited to: final regulatory approval; the installation of new or additional infrastructure, as well as changes in oil and gas prices; changes in operating and development costs; and the continued availability of additional
development capital. All the group’s proved reserves held in subsidiaries and equity-accounted entities with the exception of those proved reserves held by our Russian equity-accounted entity, Rosneft are estimated by the group’s petroleum
engineers.
DeGolyer & MacNaughton (D&M), an independent petroleum engineering consulting firm, has estimated the net proved crude oil, condensate, natural
gas liquids (NGLs) and natural gas reserves, as of 31 December 2013, of certain properties owned by Rosneft. The properties evaluated by D&M account for 100% of Rosneft’s net proved reserves as of 31 December 2013. The net proved
reserves estimates prepared by D&M were prepared in accordance with the reserves definitions of Rule 4-10(a)(1)-(32) of Regulation S-X. All reserves estimates involve some degree of uncertainty. BP has filed D&M’s independent
report on its reserves estimates as an exhibit to this document.
Our proved reserves are associated with both concessions (tax and royalty arrangements) and
agreements where the group is exposed to the upstream risks and rewards of ownership, but where our entitlement to the hydrocarbons is calculated using a more complex formula, such as with PSAs. In a concession, the consortium of which we are a part
is entitled to the proved reserves that can be produced over the licence period, which may be the life of the field. In a PSA, we are entitled to recover volumes that equate to costs incurred to develop and produce the proved reserves and an agreed
share of the remaining volumes or the economic equivalent. As part of our entitlement is driven by the monetary
amount of costs to be recovered, price fluctuations will have an impact on both production volumes and reserves.
We disclose our share of proved reserves held in equity-accounted entities (joint ventures and associates), although we do not control these entities or the assets held
by such entities.
BP’s estimated net proved reserves and proved reserves replacement
Eighty-three per cent of our total proved reserves of subsidiaries at 31 December 2013 were held through joint operations (82% in 2012), and 31% of the proved
reserves were held through such joint operations where we were not the operator (31% in 2012).
Estimated net proved reserves of liquids at
31 December 2013a b c
|
|
|
|
|
|
|
|
|
|
|
|
|
| |
|
|
|
|
|
|
|
million barrels |
|
| |
|
Developed |
|
|
Undeveloped |
|
|
Total |
|
| UK |
|
|
169 |
|
|
|
380 |
|
|
|
549 |
|
| Rest of Europe |
|
|
163 |
|
|
|
55 |
|
|
|
218 |
|
| US |
|
|
1,297 |
|
|
|
907 |
|
|
|
2,204 |
d |
| Rest of North America |
|
|
– |
|
|
|
188 |
|
|
|
188 |
|
| South America |
|
|
29 |
|
|
|
45 |
|
|
|
74 |
e |
| Africa |
|
|
320 |
|
|
|
195 |
|
|
|
515 |
|
| Rest of Asia |
|
|
320 |
|
|
|
202 |
|
|
|
522 |
|
| Australasia |
|
|
57 |
|
|
|
22 |
|
|
|
79 |
|
| Subsidiaries |
|
|
2,355 |
|
|
|
1,994 |
|
|
|
4,349 |
|
| Equity-accounted entities |
|
|
3,510 |
|
|
|
2,211 |
|
|
|
5,721 |
f |
| Total |
|
|
5,865 |
|
|
|
4,205 |
|
|
|
10,070 |
|
Estimated net proved reserves of natural gas at 31 December
2013a b
|
|
|
|
|
|
|
|
|
|
|
|
|
| |
|
|
|
|
billion cubic feet |
|
| |
|
Developed |
|
|
Undeveloped |
|
|
Total |
|
| UK |
|
|
643 |
|
|
|
314 |
|
|
|
957 |
|
| Rest of Europe |
|
|
364 |
|
|
|
39 |
|
|
|
403 |
|
| US |
|
|
7,122 |
|
|
|
2,825 |
|
|
|
9,947 |
|
| Rest of North America |
|
|
10 |
|
|
|
– |
|
|
|
10 |
|
| South America |
|
|
3,109 |
|
|
|
6,116 |
|
|
|
9,225 |
g |
| Africa |
|
|
961 |
|
|
|
1,807 |
|
|
|
2,768 |
|
| Rest of Asia |
|
|
1,519 |
|
|
|
3,671 |
|
|
|
5,190 |
|
| Australasia |
|
|
3,932 |
|
|
|
1,755 |
|
|
|
5,687 |
|
| Subsidiaries |
|
|
17,660 |
|
|
|
16,527 |
|
|
|
34,187 |
|
| Equity-accounted entities |
|
|
5,837 |
|
|
|
5,951 |
|
|
|
11,788 |
h |
| Total |
|
|
23,497 |
|
|
|
22,478 |
|
|
|
45,975 |
|
|
| Net proved reserves on an oil equivalent basis |
|
| |
|
million barrels of oil equivalent |
|
| |
|
Developed |
|
|
Undeveloped |
|
|
Total |
|
| Subsidiaries |
|
|
5,399 |
|
|
|
4,844 |
|
|
|
10,243 |
|
| Equity-accounted entities |
|
|
4,517 |
|
|
|
3,236 |
|
|
|
7,753 |
|
| Total |
|
|
9,916 |
|
|
|
8,080 |
|
|
|
17,996 |
|
| a |
Proved reserves exclude royalties due to others, whether payable in cash or in kind, where the royalty owner has a direct interest in the underlying production and
the option and ability to make lifting and sales arrangements independently, and include non-controlling interests in consolidated operations. We disclose our share of reserves held in joint ventures and associates that are accounted for by the
equity method although we do not control these entities or the assets held by such entities. |
| b |
The 2013 marker prices used were Brent $108.02/bbl (2012 $111.13/bbl and 2011 $110.96/bbl) and Henry Hub $3.66/mmBtu (2012 $2.75/mmBtu and 2011 $4.12/mmBtu).
|
| c |
Liquids include crude oil, condensate, natural gas liquids and bitumen. |
| d |
Proved reserves in the Prudhoe Bay field in Alaska include an estimated 72 million barrels on which a net profits royalty will be payable over the life of the
field under the terms of the BP Prudhoe Bay Royalty Trust. |
| e |
Includes 21 million barrels of crude oil in respect of the 30% non-controlling interest in BP Trinidad and Tobago LLC. |
| f |
Includes 23 million barrels of crude oil in respect of the 0.47% non-controlling interest in Rosneft held assets in Russia. |
| g |
Includes 2,685 billion cubic feet of natural gas in respect of the 30% non-controlling interest in BP Trinidad and Tobago LLC. |
| h |
Includes 41 billion cubic feet of natural gas in respect of the 0.44% non-controlling interest in Rosneft held assets in Russia.
|
|
|
|
| 246 |
|
BP Annual Report and Form 20-F 2013 |
Proved reserves replacement
Total hydrocarbon proved reserves, on an oil equivalent basis including equity-accounted entities, comprised 17,996mmboe (10,243mmboe for subsidiaries and 7,753mmboe for
equity-accounted entities) at 31 December 2013, an increase of 6% (decrease of 2% for subsidiaries and increase of 18% for equity-accounted entities) compared with the 31 December 2012 reserves of 17,000mmboe (10,408mmboe for subsidiaries
and 6,592mmboe for equity-accounted entities). Natural gas represented about 44% (58% for subsidiaries and 26% for equity-accounted entities) of these reserves. The change includes a net increase from acquisitions and disposals of 641mmboe (200mmboe
net decrease for subsidiaries and 841mmboe net increase for equity-accounted entities). Net divestments in our subsidiaries occurred in the UK, the US, China and Canada. We had sales and purchases as a consequence of our divestment of TNK-BP and
acquisition of Rosneft.
The proved reserves replacement ratio is the extent to which production is replaced by proved reserves additions. This ratio is expressed in
oil equivalent terms and includes changes resulting from revisions to previous estimates, improved recovery, and extensions and discoveries. For 2013, the proved reserves replacement ratio excluding acquisitions and disposals was 129% (77% in 2012
and 103% in 2011) for subsidiaries and equity-accounted entities, 105% for subsidiaries alone and 164% for equity-accounted entities alone. Including the net growth in our Russian portfolio as a result of the change in our holdings, but excluding
other acquisitions and disposals, the reserves replacement ratio on a combined basis was 199%. The net growth in our Russian portfolio relates only to equity-accounted entities (the transaction we completed during the year resulted in the disposal
of our interest in TNK-BP and the acquisition of an interest in Rosneft). Therefore the split of this ratio between subsidiaries and equity-accounted entities is as follows. For subsidiaries alone it is
105%, the same amount as disclosed above. For equity-accounted entities alone it is 334%. BP reported its share of production and reserves for TNK-BP until the transaction completed on 21 March
2013, and this is reflected in the equity-accounted entities and group ratios disclosed above.
In 2013 net additions to the group’s proved reserves (excluding
production and sales and purchases of reserves-in-place) amounted to 1,564mmboe (747mmboe for subsidiaries and 817mmboe for equity-accounted entities), through revisions to previous estimates, improved recovery from, and extensions to, existing
fields and discoveries of new fields. The subsidiary additions through improved recovery from, and extensions to, existing fields and discoveries of new fields were in existing developments where they represented a mixture of proved developed and
proved undeveloped reserves. Volumes added in 2013 principally resulted from the application of conventional technologies. The principal proved reserves additions in our subsidiaries were in Angola, Azerbaijan, Indonesia, Iraq, Oman, India and
Trinidad. We had material proved reserves reductions in the UK and the US due to changes in activity and performance updates. The principal reserves additions in our equity-accounted entities were in Argentina and Russia.
Fifteen per cent of our proved reserves are associated with PSAs. The countries in which we operated under PSAs in 2013 were Algeria, Angola, Azerbaijan, Egypt, India,
Indonesia, Oman and a non-material volume in Trinidad. In addition, the technical service contract (TSC) governing our investment in the Rumaila field in Iraq functions as a PSA.
The Abu Dhabi onshore concession expired in January 2014 with a consequent reduction in production of approximately 140mboe/d. The group holds no other licences due to
expire within the next three years that would have a significant impact on BP’s reserves or production.
For further information on our reserves see page 207.
BP’s net production by
major field – liquids
|
|
|
|
|
|
|
|
|
|
|
|
|
|
|
|
|
| |
|
|
|
|
|
thousand barrels per day |
|
| |
|
|
|
|
|
BP net share of productiona |
|
| |
|
Field or area |
|
|
|
2013 |
|
|
2012 |
|
|
2011 |
|
| Subsidiaries
UKb |
|
ETAPc |
|
|
|
|
22 |
|
|
|
11 |
|
|
|
22 |
|
|
|
Foinaven (BP-operated) |
|
|
|
|
17 |
|
|
|
14 |
|
|
|
26 |
|
| |
|
Other |
|
|
|
|
22 |
|
|
|
61 |
|
|
|
65 |
|
| Total UK |
|
|
|
|
|
|
61 |
|
|
|
86 |
|
|
|
113 |
|
| Norwayb |
|
Various |
|
|
|
|
34 |
|
|
|
23 |
|
|
|
32 |
|
| Total Rest of Europe |
|
|
|
|
|
|
34 |
|
|
|
23 |
|
|
|
32 |
|
| Total Europe |
|
|
|
|
|
|
96 |
|
|
|
109 |
|
|
|
145 |
|
| Alaskab |
|
Greater Prudhoe Bay (BP-operated) |
|
|
|
|
73 |
|
|
|
77 |
|
|
|
78 |
|
|
|
Kuparuk |
|
|
|
|
36 |
|
|
|
36 |
|
|
|
39 |
|
|
|
Milne Point (BP-operated) |
|
|
|
|
16 |
|
|
|
15 |
|
|
|
19 |
|
| |
|
Other |
|
|
|
|
12 |
|
|
|
11 |
|
|
|
17 |
|
| Total Alaska |
|
|
|
|
|
|
137 |
|
|
|
139 |
|
|
|
153 |
|
| Lower 48 onshoreb |
|
Various |
|
|
|
|
56 |
|
|
|
60 |
|
|
|
69 |
|
| Gulf of Mexico deepwaterb |
|
Great White |
|
|
|
|
23 |
|
|
|
19 |
|
|
|
9 |
|
|
|
Thunder Horse (BP-operated) |
|
|
|
|
27 |
|
|
|
49 |
|
|
|
77 |
|
|
|
Atlantis (BP-operated) |
|
|
|
|
40 |
|
|
|
23 |
|
|
|
34 |
|
|
|
Mad Dog (BP-operated) |
|
|
|
|
18 |
|
|
|
9 |
|
|
|
8 |
|
|
|
Mars |
|
|
|
|
14 |
|
|
|
15 |
|
|
|
19 |
|
|
|
Na Kika (BP-operated) |
|
|
|
|
28 |
|
|
|
21 |
|
|
|
14 |
|
|
|
Horn Mountain (BP-operated) |
|
|
|
|
– |
|
|
|
6 |
|
|
|
8 |
|
|
|
King (BP-operated) |
|
|
|
|
– |
|
|
|
14 |
|
|
|
15 |
|
| |
|
Other |
|
|
|
|
20 |
|
|
|
35 |
|
|
|
47 |
|
| Total Gulf of Mexico deepwater |
|
|
|
|
|
|
170 |
|
|
|
191 |
|
|
|
231 |
|
| Total US |
|
|
|
|
|
|
363 |
|
|
|
390 |
|
|
|
453 |
|
|
Canadab |
|
Various (BP-operated) |
|
|
|
|
– |
|
|
|
1 |
|
|
|
2 |
|
| Total Rest of North America |
|
|
|
|
|
|
– |
|
|
|
1 |
|
|
|
2 |
|
| Total North America |
|
|
|
|
|
|
363 |
|
|
|
391 |
|
|
|
455 |
|
|
|
|
|
|
| BP Annual Report and Form 20-F 2013 |
|
|
247 |
|
BP’s net production by major field – liquids — continued
|
|
|
|
|
|
|
|
|
|
|
|
|
|
|
|
|
| |
|
|
|
|
|
thousand barrels per day |
|
| |
|
|
|
|
|
BP net share of productiona |
|
| |
|
Field or area |
|
|
|
2013 |
|
|
2012 |
|
|
2011 |
|
| Subsidiaries
Colombiab |
|
Various (BP-operated) |
|
|
|
|
– |
|
|
|
– |
|
|
|
1 |
|
| Trinidad & Tobago |
|
Various (BP-operated) |
|
|
|
|
23 |
|
|
|
21 |
|
|
|
31 |
|
| Brazilb |
|
Polvo |
|
|
|
|
7 |
|
|
|
7 |
|
|
|
7 |
|
| Total South America |
|
|
|
|
|
|
30 |
|
|
|
28 |
|
|
|
39 |
|
| Angola |
|
Greater Plutonio (BP-operated) |
|
|
|
|
59 |
|
|
|
59 |
|
|
|
51 |
|
|
|
Kizomba C Dev |
|
|
|
|
9 |
|
|
|
9 |
|
|
|
21 |
|
|
|
Dalia |
|
|
|
|
11 |
|
|
|
11 |
|
|
|
12 |
|
|
|
Girassol FPSO |
|
|
|
|
11 |
|
|
|
11 |
|
|
|
12 |
|
|
|
Pazflor |
|
|
|
|
32 |
|
|
|
29 |
|
|
|
5 |
|
|
|
PSVM |
|
|
|
|
24 |
|
|
|
1 |
|
|
|
– |
|
| |
|
Other |
|
|
|
|
34 |
|
|
|
29 |
|
|
|
22 |
|
| Total Angola |
|
|
|
|
|
|
180 |
|
|
|
149 |
|
|
|
123 |
|
| Egypt |
|
Gupco |
|
|
|
|
29 |
|
|
|
32 |
|
|
|
34 |
|
| |
|
Other |
|
|
|
|
9 |
|
|
|
9 |
|
|
|
11 |
|
| Total Egypt |
|
|
|
|
|
|
38 |
|
|
|
41 |
|
|
|
45 |
|
| Algeriab |
|
Various |
|
|
|
|
7 |
|
|
|
12 |
|
|
|
22 |
|
| Total Africa |
|
|
|
|
|
|
225 |
|
|
|
202 |
|
|
|
190 |
|
| Azerbaijanb |
|
Azeri-Chirag-Gunashli (BP-operated) |
|
|
|
|
83 |
|
|
|
82 |
|
|
|
86 |
|
| |
|
Other |
|
|
|
|
13 |
|
|
|
10 |
|
|
|
8 |
|
| Total Azerbaijan |
|
|
|
|
|
|
96 |
|
|
|
92 |
|
|
|
94 |
|
| Western Indonesia |
|
Various |
|
|
|
|
1 |
|
|
|
1 |
|
|
|
2 |
|
| Iraq |
|
Rumaila |
|
|
|
|
39 |
|
|
|
39 |
|
|
|
31 |
|
| Other |
|
Various |
|
|
|
|
5 |
|
|
|
7 |
|
|
|
11 |
|
| Total Rest of Asiab |
|
|
|
|
|
|
141 |
|
|
|
139 |
|
|
|
138 |
|
| Total Asia |
|
|
|
|
|
|
141 |
|
|
|
139 |
|
|
|
138 |
|
| Australia |
|
Various |
|
|
|
|
23 |
|
|
|
24 |
|
|
|
23 |
|
| Other |
|
Various |
|
|
|
|
2 |
|
|
|
3 |
|
|
|
2 |
|
| Total Australasia |
|
|
|
|
|
|
25 |
|
|
|
27 |
|
|
|
25 |
|
| Total subsidiariesd |
|
|
|
|
|
|
879 |
|
|
|
896 |
|
|
|
992 |
|
| Equity-accounted entities (BP share) |
|
|
|
|
|
|
|
|
|
|
|
|
|
|
|
|
| TNK-BP (Russia, Venezuela, Vietnam)b e |
|
Various |
|
|
|
|
187 |
|
|
|
877 |
|
|
|
871 |
|
| Rosneft (Russia, Canada, Venezuela, Vietnam)b f |
|
Various |
|
|
|
|
650 |
|
|
|
– |
|
|
|
– |
|
| Abu Dhabig |
|
Various |
|
|
|
|
231 |
|
|
|
216 |
|
|
|
209 |
|
| Argentina |
|
Various |
|
|
|
|
63 |
|
|
|
65 |
|
|
|
74 |
|
| Bolivia |
|
Various |
|
|
|
|
2 |
|
|
|
1 |
|
|
|
– |
|
| Venezuelab |
|
Various |
|
|
|
|
– |
|
|
|
– |
|
|
|
10 |
|
| Other |
|
Various |
|
|
|
|
1 |
|
|
|
1 |
|
|
|
1 |
|
| Total equity-accounted entities |
|
|
|
|
|
|
1,134 |
|
|
|
1,160 |
|
|
|
1,165 |
|
| Total subsidiaries and equity-accounted entities |
|
|
|
|
|
|
2,013 |
|
|
|
2,056 |
|
|
|
2,157 |
|
| a |
Production excludes royalties due to others whether payable in cash or in kind where the royalty owner has a direct interest in the underlying production and the
option and ability to make lifting and sales arrangements independently. |
| b |
In 2013, BP divested its interests in TNK-BP, its interests in the Harding, Devenick, Maclure, Braes and Braemar fields in the North Sea and its interests in the US
onshore Moxa upstream operation in Wyoming. It also acquired an interest in Rosneft. In 2012, BP divested its interests in the Gulf of Mexico Marlin, Dorado, King, Horn Mountain, Holstein, Ram Powell and Diana Hoover assets, a portion of its
interest in the Gulf of Mexico Mad Dog asset, its interests in the US onshore Jonah and Pinedale upstream operation in Wyoming, and associated gas gathering system, its interests in the Canadian natural gas liquid business, its interests in the Alba
and Britannia fields in the UK North Sea, its interests in the Draugen field in the Norwegian Sea, and TNK-BP disposed of its interests in OJSC Novosibirskneftegaz, with interests in Novosibirsk region, Omsk region, and Irkutsk region, and its
interests in OJSC Severnoeneftegaz, with interests in Novosibirsk region. BP also increased its interest in the US onshore Eagle Ford Shale in south Texas, its interests in certain UK North Sea assets, and in certain US Alaska assets. In 2011, BP
sold its holdings in Venezuela and Vietnam to TNK-BP. It also made acquisitions in India through a joint arrangement with Reliance, Brazil and additional volumes in the Gulf of Mexico and UK North Sea. BP
divested its holdings in Pompano along with other interests in the Gulf of Mexico, Tuscaloosa and interests in South Texas in the US onshore, a portion of our interest in the Azeri-Chirag-Gunashli development in Azerbaijan, Wytch Farm in the UK, our
interests in the REB field in Algeria, and the remainder of our interests in Colombia and Pakistan. |
| c |
Volumes relate to six BP-operated fields within ETAP. BP has no interests in the remaining three ETAP fields, which are operated by Shell. |
| d |
Includes 5.5 net mboe/d of NGLs from processing plants in which BP has an interest (2012 13.5mboe/d and 2011 28mboe/d). |
| e |
Estimated production for 2013 represents BP’s share of TNK-BP’s estimated production from 1 January to 20 March, averaged over the full year.
|
| f |
2013 reflects production for the period 21 March to 31 December, averaged over the full year. |
| g |
In 2013 BP held interests, through associates, in onshore and offshore concessions in Abu Dhabi, of which the onshore concession expired in 2014 and the offshore
concession expires in 2018. |
Because of rounding, some totals may not agree exactly with the sum of their component parts.
|
|
|
| 248 |
|
BP Annual Report and Form 20-F 2013 |
BP’s net production by major field – natural gas
|
|
|
|
|
|
|
|
|
|
|
|
|
|
|
|
|
| |
|
|
|
|
|
million cubic feet per day |
|
| |
|
|
|
|
|
BP net share of productiona |
|
| |
|
Field or area |
|
|
|
2013 |
|
|
2012 |
|
|
2011 |
|
| Subsidiaries
UKb |
|
Bruce/Rhum (BP-operated) |
|
|
|
|
25 |
|
|
|
15 |
|
|
|
20 |
|
| |
|
Other |
|
|
|
|
132 |
|
|
|
399 |
|
|
|
335 |
|
| Total UK |
|
|
|
|
|
|
157 |
|
|
|
414 |
|
|
|
355 |
|
| Norway |
|
Various |
|
|
|
|
80 |
|
|
|
8 |
|
|
|
13 |
|
| Total Rest of Europe |
|
|
|
|
|
|
80 |
|
|
|
8 |
|
|
|
13 |
|
| Total Europe |
|
|
|
|
|
|
237 |
|
|
|
422 |
|
|
|
368 |
|
| Lower 48 onshoreb |
|
San Juan (BP-operated) |
|
|
|
|
529 |
|
|
|
561 |
|
|
|
603 |
|
|
|
Jonah (BP-operated) |
|
|
|
|
– |
|
|
|
69 |
|
|
|
145 |
|
|
|
Anadarko |
|
|
|
|
129 |
|
|
|
142 |
|
|
|
141 |
|
|
|
Arkoma Central |
|
|
|
|
107 |
|
|
|
118 |
|
|
|
136 |
|
|
|
Wamsutter (BP-operated) |
|
|
|
|
159 |
|
|
|
141 |
|
|
|
122 |
|
|
|
Arkoma East |
|
|
|
|
115 |
|
|
|
112 |
|
|
|
115 |
|
|
|
Arkoma West |
|
|
|
|
110 |
|
|
|
98 |
|
|
|
109 |
|
| |
|
Other |
|
|
|
|
255 |
|
|
|
258 |
|
|
|
274 |
|
| Total Lower 48 onshore |
|
|
|
|
|
|
1,404 |
|
|
|
1,499 |
|
|
|
1,645 |
|
| Gulf of Mexico deepwaterb |
|
Various |
|
|
|
|
114 |
|
|
|
134 |
|
|
|
176 |
|
| Alaska |
|
Various |
|
|
|
|
21 |
|
|
|
18 |
|
|
|
22 |
|
| Total US |
|
|
|
|
|
|
1,539 |
|
|
|
1,651 |
|
|
|
1,843 |
|
| Canadab |
|
Various |
|
|
|
|
11 |
|
|
|
13 |
|
|
|
14 |
|
| Total Rest of North America |
|
|
|
|
|
|
11 |
|
|
|
13 |
|
|
|
14 |
|
| Total North America |
|
|
|
|
|
|
1,551 |
|
|
|
1,664 |
|
|
|
1,857 |
|
| Trinidad & Tobago |
|
Mango (BP-operated) |
|
|
|
|
119 |
|
|
|
181 |
|
|
|
308 |
|
|
|
Cashima/NEQB (BP-operated) |
|
|
|
|
138 |
|
|
|
305 |
|
|
|
570 |
|
|
|
Kapok (BP-operated) |
|
|
|
|
358 |
|
|
|
360 |
|
|
|
464 |
|
|
|
Cannonball (BP-operated) |
|
|
|
|
27 |
|
|
|
56 |
|
|
|
99 |
|
|
|
Amherstia (BP-operated) |
|
|
|
|
257 |
|
|
|
324 |
|
|
|
296 |
|
|
|
Serrette (BP-operated) |
|
|
|
|
527 |
|
|
|
367 |
|
|
|
35 |
|
|
|
Savonette (BP-operated) |
|
|
|
|
545 |
|
|
|
320 |
|
|
|
327 |
|
|
|
Immortelle (BP-operated) |
|
|
|
|
200 |
|
|
|
95 |
|
|
|
68 |
|
| |
|
Other (BP-operated) |
|
|
|
|
50 |
|
|
|
89 |
|
|
|
26 |
|
| Total Trinidad |
|
|
|
|
|
|
2,221 |
|
|
|
2,097 |
|
|
|
2,193 |
|
| Colombiab |
|
Various |
|
|
|
|
– |
|
|
|
– |
|
|
|
4 |
|
| Total South America |
|
|
|
|
|
|
2,221 |
|
|
|
2,097 |
|
|
|
2,197 |
|
| Egypt |
|
Temsah |
|
|
|
|
30 |
|
|
|
34 |
|
|
|
74 |
|
|
|
Ha’py (BP-operated) |
|
|
|
|
72 |
|
|
|
88 |
|
|
|
99 |
|
|
|
Taurt (BP-operated) |
|
|
|
|
50 |
|
|
|
67 |
|
|
|
61 |
|
|
|
Denis |
|
|
|
|
99 |
|
|
|
138 |
|
|
|
77 |
|
| |
|
Other |
|
|
|
|
193 |
|
|
|
143 |
|
|
|
133 |
|
| Total Egypt |
|
|
|
|
|
|
444 |
|
|
|
470 |
|
|
|
444 |
|
| Algeria |
|
Various |
|
|
|
|
117 |
|
|
|
120 |
|
|
|
114 |
|
| Total Africa |
|
|
|
|
|
|
561 |
|
|
|
590 |
|
|
|
558 |
|
| Pakistanb |
|
Various (BP-operated) |
|
|
|
|
– |
|
|
|
– |
|
|
|
73 |
|
| Azerbaijan |
|
Various (BP-operated) |
|
|
|
|
203 |
|
|
|
158 |
|
|
|
140 |
|
| Western Indonesia |
|
Sanga-Sanga |
|
|
|
|
55 |
|
|
|
59 |
|
|
|
59 |
|
| Indiab |
|
D1 D3 |
|
|
|
|
117 |
|
|
|
253 |
|
|
|
121 |
|
|
|
D26 |
|
|
|
|
38 |
|
|
|
59 |
|
|
|
25 |
|
| |
|
Other |
|
|
|
|
1 |
|
|
|
1 |
|
|
|
– |
|
| Total India |
|
|
|
|
|
|
156 |
|
|
|
313 |
|
|
|
146 |
|
| Vietnamb |
|
Various (BP-operated) |
|
|
|
|
– |
|
|
|
– |
|
|
|
69 |
|
| Chinab |
|
Yacheng |
|
|
|
|
34 |
|
|
|
54 |
|
|
|
70 |
|
| Oman |
|
|
|
|
|
|
22 |
|
|
|
14 |
|
|
|
20 |
|
| Sharjah |
|
Various (BP-operated) |
|
|
|
|
25 |
|
|
|
35 |
|
|
|
41 |
|
| Total Rest of Asia |
|
|
|
|
|
|
494 |
|
|
|
633 |
|
|
|
618 |
|
| Total Asia |
|
|
|
|
|
|
494 |
|
|
|
633 |
|
|
|
618 |
|
|
|
|
|
|
| BP Annual Report and Form 20-F 2013 |
|
|
249 |
|
BP’s net production by major field – natural gas – continued
|
|
|
|
|
|
|
|
|
|
|
|
|
|
|
|
|
| |
|
|
|
|
|
million cubic feet per day |
|
| |
|
|
|
|
|
BP net share of productiona |
|
| |
|
Field or area |
|
|
|
2013 |
|
|
2012 |
|
|
2011 |
|
| Subsidiaries
Australia |
|
Perseus/Athena |
|
|
|
|
139 |
|
|
|
141 |
|
|
|
170 |
|
|
|
Goodwyn |
|
|
|
|
57 |
|
|
|
73 |
|
|
|
72 |
|
|
|
Angel |
|
|
|
|
89 |
|
|
|
110 |
|
|
|
126 |
|
| |
|
Other |
|
|
|
|
146 |
|
|
|
111 |
|
|
|
87 |
|
| Total Australia |
|
|
|
|
|
|
431 |
|
|
|
435 |
|
|
|
455 |
|
| Eastern Indonesia |
|
Tangguh (BP-operated) |
|
|
|
|
349 |
|
|
|
352 |
|
|
|
340 |
|
| Total Australasia |
|
|
|
|
|
|
780 |
|
|
|
787 |
|
|
|
795 |
|
| Total subsidiariesc |
|
|
|
|
|
|
5,845 |
|
|
|
6,193 |
|
|
|
6,393 |
|
| Equity-accounted entities (BP share) |
|
|
|
|
|
|
|
|
|
|
|
|
|
|
|
|
| TNK-BP (Russia, Venezuela, Vietnam)b d |
|
Various |
|
|
|
|
184 |
|
|
|
785 |
|
|
|
710 |
|
| Rosneft (Russia, Canada, Venezuela, Vietnam)b e |
|
Various |
|
|
|
|
617 |
|
|
|
– |
|
|
|
– |
|
| Angola |
|
ALNG |
|
|
|
|
8 |
|
|
|
– |
|
|
|
– |
|
| Argentina |
|
Various |
|
|
|
|
329 |
|
|
|
355 |
|
|
|
371 |
|
| Bolivia |
|
Various |
|
|
|
|
55 |
|
|
|
34 |
|
|
|
14 |
|
| Venezuelab |
|
Various |
|
|
|
|
– |
|
|
|
– |
|
|
|
4 |
|
| Western Indonesia |
|
Various |
|
|
|
|
22 |
|
|
|
26 |
|
|
|
26 |
|
| Total equity-accounted entitiesc |
|
|
|
|
|
|
1,216 |
|
|
|
1,200 |
|
|
|
1,125 |
|
| Total subsidiaries and equity-accounted entities |
|
|
|
|
|
|
7,060 |
|
|
|
7,393 |
|
|
|
7,518 |
|
| a |
Production excludes royalties due to others whether payable in cash or in kind where the royalty owner has a direct interest in the underlying production and the
option and ability to make lifting and sales arrangements independently. |
| b |
In 2013, BP divested its interests in TNK-BP, its interests in the Harding, Devenick, Maclure, Braes, Braemar and Sean fields in the North Sea, its interests in the
US onshore Moxa upstream operation in Wyoming and its interests in the Yacheng gas field in the South China Sea. It also acquired an interest in Rosneft. In 2012, BP divested its interests in the US Hugoton basin including the Jayhawk NGL plant, its
interests in the Gulf of Mexico Marlin, Dorado, King, Horn Mountain, Holstein, Ram Powell and Diana Hoover assets, a portion of its interest in the Gulf of Mexico Mad Dog asset, its interests in the US onshore Jonah and Pinedale upstream
operation in Wyoming, its interests in the Sunray and Hemphill gas processing plants in Texas, and associated gas gathering system, its interests in the UK North Sea southern gas fields including associated pipeline infrastructure and the Dimlington
terminal (including the integrated Easington terminal), and its interests in the Alba and Britannia fields in the UK North Sea. BP also increased its interest in the US onshore Eagle Ford Shale in South Texas, and its interests in certain UK North
Sea assets. In 2011, BP sold its holdings in Venezuela and Vietnam to TNK-BP. It also made acquisitions in India through a joint operation with Reliance, in the Eagle Ford shale in North America and additional volumes in the Gulf of Mexico.
BP divested its holdings in Pompano along with other interests in the Gulf of Mexico, Tuscaloosa and interests in south Texas in the US onshore, Wytch Farm in the UK, minor volumes in Canada and the remainder of our interests in Colombia and
Pakistan. |
| c |
Natural gas production volumes exclude gas consumed in operations within the lease boundaries of the producing field, but the related reserves are included in the group’s reserves. |
| d |
Estimated production for 2013 represents BP’s share of TNK-BP’s estimated production from 1 January to 20 March, averaged over the full year. |
| e |
2013 reflects production for the period 21 March to 31 December, averaged over the full year. |
Because of
rounding, some totals may not agree exactly with the sum of their component parts.
|
|
|
| 250 |
|
BP Annual Report and Form 20-F 2013 |
The following tables provide additional data and disclosures in relation to our oil and gas operations.
Average sales price per unit of productiona
|
|
|
|
|
|
|
|
|
|
|
|
|
|
|
|
|
|
|
|
|
|
|
|
|
|
|
|
|
|
|
|
|
|
|
|
|
|
|
|
|
|
|
| |
|
|
|
|
|
|
|
|
|
|
|
|
|
|
|
|
|
|
|
|
|
|
|
|
|
|
|
$ per unit of production |
|
| |
|
|
|
Europe
|
|
|
North
America |
|
|
South
America |
|
|
Africa
|
|
|
Asia
|
|
|
Australasia
|
|
|
Total
group
average |
|
| |
|
|
|
UK |
|
|
Rest of
Europe |
|
|
US |
|
|
Rest of
North
America |
|
|
|
|
|
|
|
|
Russiab |
|
|
Rest of
Asia |
|
|
|
|
|
|
|
| Subsidiaries |
|
|
|
|
|
|
|
|
|
|
|
|
|
|
|
|
|
|
|
|
|
|
|
|
|
|
|
|
|
|
|
|
|
|
|
|
|
|
|
|
|
|
| 2013 |
|
|
|
|
|
|
|
|
|
|
|
|
|
|
|
|
|
|
|
|
|
|
|
|
|
|
|
|
|
|
|
|
|
|
|
|
|
|
|
|
|
|
| Liquidsc |
|
|
|
|
105.86 |
|
|
|
102.72 |
|
|
|
91.88 |
|
|
|
– |
|
|
|
87.16 |
|
|
|
104.27 |
|
|
|
– |
|
|
|
108.24 |
|
|
|
100.41 |
|
|
|
99.24 |
|
| Gas |
|
|
|
|
9.43 |
|
|
|
10.18 |
|
|
|
3.07 |
|
|
|
– |
|
|
|
4.66 |
|
|
|
5.75 |
|
|
|
– |
|
|
|
4.99 |
|
|
|
10.55 |
|
|
|
5.35 |
|
| 2012 |
|
|
|
|
|
|
|
|
|
|
|
|
|
|
|
|
|
|
|
|
|
|
|
|
|
|
|
|
|
|
|
|
|
|
|
|
|
|
|
|
|
|
| Liquidsc |
|
|
|
|
109.64 |
|
|
|
106.93 |
|
|
|
96.35 |
|
|
|
– |
|
|
|
84.53 |
|
|
|
106.39 |
|
|
|
– |
|
|
|
109.69 |
|
|
|
103.12 |
|
|
|
102.10 |
|
| Gas |
|
|
|
|
8.62 |
|
|
|
9.43 |
|
|
|
2.32 |
|
|
|
– |
|
|
|
3.53 |
|
|
|
6.05 |
|
|
|
– |
|
|
|
5.08 |
|
|
|
10.08 |
|
|
|
4.75 |
|
| 2011 |
|
|
|
|
|
|
|
|
|
|
|
|
|
|
|
|
|
|
|
|
|
|
|
|
|
|
|
|
|
|
|
|
|
|
|
|
|
|
|
|
|
|
| Liquidsc |
|
|
|
|
106.89 |
|
|
|
107.83 |
|
|
|
96.34 |
|
|
|
– |
|
|
|
86.60 |
|
|
|
104.37 |
|
|
|
– |
|
|
|
111.10 |
|
|
|
101.22 |
|
|
|
101.29 |
|
| Gas |
|
|
|
|
7.91 |
|
|
|
13.15 |
|
|
|
3.34 |
|
|
|
– |
|
|
|
3.60 |
|
|
|
5.24 |
|
|
|
– |
|
|
|
4.73 |
|
|
|
9.13 |
|
|
|
4.69 |
|
| Equity-accounted entitiesd |
|
|
|
|
|
|
|
|
|
|
|
|
|
|
|
|
|
|
|
|
|
|
|
|
|
|
|
|
|
|
|
|
|
|
|
|
|
|
|
|
|
|
| 2013 |
|
|
|
|
|
|
|
|
|
|
|
|
|
|
|
|
|
|
|
|
|
|
|
|
|
|
|
|
|
|
|
|
|
|
|
|
|
|
|
|
|
|
| Liquidsc |
|
|
|
|
– |
|
|
|
– |
|
|
|
– |
|
|
|
– |
|
|
|
75.45 |
|
|
|
– |
|
|
|
95.28 |
|
|
|
11.58 |
|
|
|
– |
|
|
|
63.65 |
|
| Gas |
|
|
|
|
– |
|
|
|
– |
|
|
|
– |
|
|
|
– |
|
|
|
4.05 |
|
|
|
– |
|
|
|
2.47 |
|
|
|
13.21 |
|
|
|
– |
|
|
|
3.26 |
|
| 2012 |
|
|
|
|
|
|
|
|
|
|
|
|
|
|
|
|
|
|
|
|
|
|
|
|
|
|
|
|
|
|
|
|
|
|
|
|
|
|
|
|
|
|
| Liquidsc |
|
|
|
|
– |
|
|
|
– |
|
|
|
– |
|
|
|
– |
|
|
|
79.08 |
|
|
|
– |
|
|
|
83.85 |
|
|
|
10.15 |
|
|
|
– |
|
|
|
69.41 |
|
| Gas |
|
|
|
|
– |
|
|
|
– |
|
|
|
– |
|
|
|
– |
|
|
|
2.35 |
|
|
|
– |
|
|
|
2.35 |
|
|
|
5.08 |
|
|
|
– |
|
|
|
2.52 |
|
| 2011 |
|
|
|
|
|
|
|
|
|
|
|
|
|
|
|
|
|
|
|
|
|
|
|
|
|
|
|
|
|
|
|
|
|
|
|
|
|
|
|
|
|
|
| Liquidsc |
|
|
|
|
– |
|
|
|
– |
|
|
|
– |
|
|
|
– |
|
|
|
73.51 |
|
|
|
– |
|
|
|
84.39 |
|
|
|
8.11 |
|
|
|
– |
|
|
|
71.35 |
|
| Gas |
|
|
|
|
– |
|
|
|
– |
|
|
|
– |
|
|
|
– |
|
|
|
2.31 |
|
|
|
– |
|
|
|
2.23 |
|
|
|
12.21 |
|
|
|
– |
|
|
|
2.40 |
|
| a |
Units of production are barrels for liquids and thousands of cubic feet for gas. Realizations include transfers between businesses. |
| b |
Amounts reported for Russia in 2013 include BP’s share of Rosneft’s worldwide activities, including insignificant amounts outside Russia. |
| c |
Crude oil, condensate and natural gas liquids. |
| d |
It is common for equity-accounted entities’ agreements to include pricing clauses that require selling a significant portion of the entitled production to local
governments or markets at discounted prices. |
Average production cost per unit of productiona
|
|
|
|
|
|
|
|
|
|
|
|
|
|
|
|
|
|
|
|
|
|
|
|
|
|
|
|
|
|
|
|
|
|
|
|
|
|
|
|
|
|
|
| |
|
|
|
|
|
|
|
|
|
|
|
|
|
|
|
|
|
|
|
|
|
|
|
|
|
|
|
$ per unit of production |
|
| |
|
|
|
Europe
|
|
|
North
America |
|
|
South
America |
|
|
Africa
|
|
|
Asia
|
|
|
Australasia
|
|
|
Total
group
average |
|
| |
|
|
|
UK |
|
|
Rest of
Europe |
|
|
US |
|
|
Rest of
North
America |
|
|
|
|
|
|
|
|
Russiab |
|
|
Rest of
Asia |
|
|
|
|
| Subsidiaries |
|
|
|
|
|
|
|
|
|
|
|
|
|
|
|
|
|
|
|
|
|
|
|
|
|
|
|
|
|
|
|
|
|
|
|
|
|
|
|
|
|
|
| 2013 |
|
|
|
|
34.10 |
|
|
|
24.48 |
|
|
|
16.11 |
|
|
|
– |
|
|
|
5.92 |
|
|
|
13.84 |
|
|
|
– |
|
|
|
13.20 |
|
|
|
3.21 |
|
|
|
13.16 |
|
| 2012 |
|
|
|
|
22.77 |
|
|
|
39.10 |
|
|
|
15.60 |
|
|
|
– |
|
|
|
5.69 |
|
|
|
11.89 |
|
|
|
– |
|
|
|
11.85 |
|
|
|
3.23 |
|
|
|
12.50 |
|
| 2011 |
|
|
|
|
21.59 |
|
|
|
18.23 |
|
|
|
12.09 |
|
|
|
– |
|
|
|
3.20 |
|
|
|
10.82 |
|
|
|
– |
|
|
|
8.65 |
|
|
|
3.05 |
|
|
|
10.08 |
|
| Equity-accounted entities |
|
|
|
|
|
|
|
|
|
|
|
|
|
|
|
|
|
|
|
|
|
|
|
|
|
|
|
|
|
|
|
|
|
|
|
|
|
|
|
|
|
|
| 2013 |
|
|
|
|
– |
|
|
|
– |
|
|
|
– |
|
|
|
– |
|
|
|
12.16 |
|
|
|
– |
|
|
|
4.36 |
|
|
|
4.19 |
|
|
|
– |
|
|
|
5.28 |
|
| 2012 |
|
|
|
|
– |
|
|
|
– |
|
|
|
– |
|
|
|
– |
|
|
|
11.33 |
|
|
|
– |
|
|
|
5.72 |
|
|
|
2.88 |
|
|
|
– |
|
|
|
5.76 |
|
| 2011 |
|
|
|
|
– |
|
|
|
– |
|
|
|
– |
|
|
|
– |
|
|
|
9.04 |
|
|
|
– |
|
|
|
5.68 |
|
|
|
2.70 |
|
|
|
– |
|
|
|
5.58 |
|
| a |
Units of production are barrels for liquids and thousands of cubic feet for gas. Amounts do not include ad valorem and severance taxes. |
| b |
Amounts reported for Russia in 2013 include BP’s share of Rosneft’s worldwide activities, including insignificant amounts outside Russia. |
|
|
|
|
|
| BP Annual Report and Form 20-F 2013 |
|
|
251 |
|
Environmental expenditure
|
|
|
|
|
|
|
|
|
|
|
|
|
| |
|
|
|
|
|
|
|
$ million |
|
| |
|
2013 |
|
|
2012 |
|
|
2011 |
|
| Environmental expenditure relating to the Gulf of Mexico oil spill |
|
|
(66 |
) |
|
|
919 |
|
|
|
1,838 |
|
| Operating expenditure |
|
|
657 |
|
|
|
742 |
|
|
|
704 |
|
| Capital expenditure |
|
|
1,091 |
|
|
|
1,207 |
|
|
|
819 |
|
| Clean-ups |
|
|
42 |
|
|
|
47 |
|
|
|
53 |
|
| Additions to environmental remediation provision |
|
|
472 |
|
|
|
549 |
|
|
|
512 |
|
| Additions to decommissioning provision |
|
|
2,092 |
|
|
|
3,766 |
|
|
|
4,595 |
|
Environmental expenditure relating to the Gulf of Mexico oil spill
The environmental expenditure credit of $66 million relating to the Gulf of Mexico oil spill arises primarily from the write-back of a spill response provision. For full
details of all environmental activities in relation to the Gulf of Mexico oil spill, see Financial statements – Note 2.
Other
environmental expenditure
Operating and capital expenditure on the prevention, control, abatement or elimination of air, water and solid waste pollution is
often not incurred as a separately identifiable transaction. Instead, it forms part of a larger transaction that includes, for example, normal maintenance expenditure. The figures for environmental operating and capital expenditure in the table are
therefore estimates, based on the definitions and guidelines of the American Petroleum Institute.
Environmental operating expenditure of $657 million in 2013 was
lower than in 2012 and 2011. This is primarily due to the divestment of the Texas City and Carson refineries during 2013.
Capital expenditure in 2013 was lower than
in 2012 principally due to reduced levels of construction activity at our Whiting refinery in 2013 as compared to 2012. All of the major new units associated with the Whiting refinery modernization project were progressively commissioned during 2013
with the final major unit being brought onstream in December. Similar levels of operating and capital expenditures are expected in the foreseeable future.
In
addition to operating and capital expenditures, we also establish provisions for future environmental remediation. Expenditure against such provisions normally occurs in subsequent periods and is not included in environmental operating expenditure
reported for such periods.
Provisions for environmental remediation are made when a clean-up is probable and the amount of the obligation can be reliably estimated.
Generally, this coincides with the commitment to a formal plan of action or, if earlier, on divestment or on closure of inactive sites.
The extent and cost of future environmental restoration, remediation and abatement programmes are inherently difficult to estimate. They often depend on the extent of
contamination, and the associated impact and timing of the corrective actions required, technological feasibility and BP’s share of liability. Though the costs of future programmes could be significant and may be material to the results of
operations in the period in which they are recognized, it is not expected that such costs will be material to the group’s overall results of operations or financial position.
Additions to our environmental remediation provision decreased in 2013 largely due to scope reassessments of the remediation plans of a number of our sites in the US and
Canada. The charge for environmental remediation provisions in 2013 included $13 million in respect of provisions for new sites (2012 $19 million and 2011 $12 million).
In addition, we make provisions on installation of our oil- and gas-producing assets and related pipelines to meet the cost of eventual decommissioning. On installation
of an oil or natural gas production facility a provision is established that represents the discounted value of the expected future cost of decommissioning the asset.
In 2013 additions to the decommissioning provision were less than in 2012, and were driven by detailed reviews of expected future costs, and to a lesser extent increases
to the asset base. The additions in 2011 and 2012 were driven by changes in estimation and detailed reviews of expected future costs. The majority of these additions related to our sites in Trinidad, the Gulf of Mexico, Alaska, Angola and the North
Sea.
In 2011 and 2012, the Gulf of Mexico was impacted by the Bureau of Ocean Energy Management, Regulation and Enforcement’s (BOEMRE) Notice to Lessees (NTL)
2010-G05, issued in October 2010, which requires that idle infrastructure on active leases be decommissioned earlier than previously was required and establishes guidelines to determine the future utility of idle infrastructure on active leases.
We undertake periodic reviews of existing provisions. These reviews take account of revised cost assumptions, changes in decommissioning requirements and any
technological developments.
Provisions for environmental remediation and decommissioning are usually established on a discounted basis, as required by IAS 37
‘Provisions, Contingent Liabilities and Contingent Assets’.
Further details of decommissioning and environmental provisions appear in the financial
statements – Note 29.
Contractual obligations
The following table summarizes the group’s principal contractual obligations at 31 December 2013, distinguishing between those for which a liability is
recognized on the balance sheet and those for which no liability is recognized. Further information on borrowings is given in Financial statements – Note 27 and more information on operating leases is given in Financial statements – Note
9.
|
|
|
|
|
|
|
|
|
|
|
|
|
|
|
|
|
|
|
|
|
|
|
|
|
|
|
|
|
|
|
| |
|
|
|
|
|
|
|
|
|
|
|
|
|
|
|
|
|
|
|
|
|
$ million |
|
| |
|
|
|
|
|
|
|
|
|
|
|
|
|
|
|
|
|
|
Payments due by period |
|
| Expected payments by period under contractual obligations |
|
|
|
Total |
|
|
2014 |
|
|
2015 |
|
|
2016 |
|
|
2017 |
|
|
2018 |
|
|
2019 and
thereafter |
|
| Balance sheet obligations |
|
|
|
|
|
|
|
|
|
|
|
|
|
|
|
|
|
|
|
|
|
|
|
|
|
|
|
|
|
|
| Borrowingsa |
|
|
|
|
51,393 |
|
|
|
8,186 |
|
|
|
7,307 |
|
|
|
7,275 |
|
|
|
6,263 |
|
|
|
5,607 |
|
|
|
16,755 |
|
| Finance lease future minimum lease paymentsb |
|
|
|
|
871 |
|
|
|
80 |
|
|
|
75 |
|
|
|
66 |
|
|
|
63 |
|
|
|
60 |
|
|
|
527 |
|
| Decommissioning liabilitiesc |
|
|
|
|
20,850 |
|
|
|
988 |
|
|
|
731 |
|
|
|
699 |
|
|
|
568 |
|
|
|
865 |
|
|
|
16,999 |
|
| Environmental liabilitiesc |
|
|
|
|
3,546 |
|
|
|
861 |
|
|
|
1,277 |
|
|
|
281 |
|
|
|
267 |
|
|
|
186 |
|
|
|
674 |
|
| Pensions and other post-retirement benefitsd |
|
|
|
|
24,145 |
|
|
|
1,916 |
|
|
|
1,904 |
|
|
|
1,894 |
|
|
|
1,633 |
|
|
|
1,325 |
|
|
|
15,473 |
|
| |
|
|
|
|
100,805 |
|
|
|
12,031 |
|
|
|
11,294 |
|
|
|
10,215 |
|
|
|
8,794 |
|
|
|
8,043 |
|
|
|
50,428 |
|
| Off-balance sheet obligations |
|
|
|
|
|
|
|
|
|
|
|
|
|
|
|
|
|
|
|
|
|
|
|
|
|
|
|
|
|
|
| Operating lease future minimum lease paymentse |
|
|
|
|
19,186 |
|
|
|
5,188 |
|
|
|
3,790 |
|
|
|
2,871 |
|
|
|
2,117 |
|
|
|
1,630 |
|
|
|
3,590 |
|
| Unconditional purchase obligationsf |
|
|
|
|
232,757 |
|
|
|
116,856 |
|
|
|
25,387 |
|
|
|
16,193 |
|
|
|
12,275 |
|
|
|
10,687 |
|
|
|
51,359 |
|
| |
|
|
|
|
251,943 |
|
|
|
122,044 |
|
|
|
29,177 |
|
|
|
19,064 |
|
|
|
14,392 |
|
|
|
12,317 |
|
|
|
54,949 |
|
| Total |
|
|
|
|
352,748 |
|
|
|
134,075 |
|
|
|
40,471 |
|
|
|
29,279 |
|
|
|
23,186 |
|
|
|
20,360 |
|
|
|
105,377 |
|
| a |
Expected payments include interest totalling $3,736 million ($846 million in 2014, $717 million in 2015, $588 million in 2016, $468 million in 2017, $360 million in 2018 and $757 million thereafter). |
|
|
|
| 252 |
|
BP Annual Report and Form 20-F 2013 |
| b |
Expected payments include interest totalling $336 million ($39 million in 2014, $35 million in 2015, $33 million in 2016, $30 million in 2017, $28 million in 2018 and $171 million thereafter). |
| c |
The amounts are undiscounted. Environmental liabilities include those relating to the Gulf of Mexico oil spill, including liabilities for spill response costs. |
| d |
Represents the expected future contributions to funded pension plans and payments by the group for unfunded pension plans and the expected future payments for other
post-retirement benefits. |
| e |
The future minimum lease payments are before deducting related rental income from operating sub-leases. In the case of an operating lease entered into solely by BP as the operator of a joint operation, the amounts shown
in the table represent the net future minimum lease payments, after deducting amounts reimbursed, or to be reimbursed, by joint operation partners. Where BP is not the operator of a joint operation BP’s share of the future minimum lease
payments are included in the amounts shown, whether BP has co-signed the lease or not. Where operating lease costs are incurred in relation to the hire of equipment used in connection with a capital project, some or all of the cost may be
capitalized as part of the capital cost of the project. |
| f |
Represents any agreement to purchase goods or services that is enforceable and legally binding and that specifies all significant terms. The amounts shown include arrangements to secure long-term access to supplies of
crude oil, natural gas, feedstocks and pipeline systems. In addition, the amounts shown for 2014 include purchase commitments existing at 31 December 2013 entered into principally to meet the group’s short-term manufacturing and marketing
requirements. The price risk associated with these crude oil, natural gas and power contracts is discussed in Financial statements – Note 19. |
The
following table summarizes the nature of the group’s unconditional purchase obligations.
|
|
|
|
|
|
|
|
|
|
|
|
|
|
|
|
|
|
|
|
|
|
|
|
|
|
|
|
|
|
|
| |
|
|
|
|
|
|
|
|
|
|
|
|
|
|
|
|
|
|
|
|
|
$ million |
|
| |
|
|
|
|
|
|
|
|
|
|
|
|
|
|
|
|
|
|
Payments due by period |
|
| Unconditional purchase obligations |
|
|
|
Total |
|
|
2014 |
|
|
2015 |
|
|
2016 |
|
|
2017 |
|
|
2018 |
|
|
2019 and
thereafter |
|
| Crude oil and oil products |
|
|
|
|
133,774 |
|
|
|
84,558 |
|
|
|
13,854 |
|
|
|
9,026 |
|
|
|
6,533 |
|
|
|
5,281 |
|
|
|
14,522 |
|
| Natural gas |
|
|
|
|
37,005 |
|
|
|
23,417 |
|
|
|
5,612 |
|
|
|
2,751 |
|
|
|
1,768 |
|
|
|
1,309 |
|
|
|
2,148 |
|
| Chemicals and other refinery feedstocks |
|
|
|
|
17,005 |
|
|
|
3,976 |
|
|
|
3,190 |
|
|
|
2,590 |
|
|
|
2,306 |
|
|
|
2,248 |
|
|
|
2,695 |
|
| Power |
|
|
|
|
3,208 |
|
|
|
2,067 |
|
|
|
794 |
|
|
|
250 |
|
|
|
97 |
|
|
|
— |
|
|
|
— |
|
| Utilities |
|
|
|
|
796 |
|
|
|
200 |
|
|
|
168 |
|
|
|
108 |
|
|
|
83 |
|
|
|
73 |
|
|
|
164 |
|
| Transportation |
|
|
|
|
22,727 |
|
|
|
1,589 |
|
|
|
1,084 |
|
|
|
965 |
|
|
|
1,041 |
|
|
|
1,031 |
|
|
|
17,017 |
|
| Use of facilities and services |
|
|
|
|
18,242 |
|
|
|
1,049 |
|
|
|
685 |
|
|
|
503 |
|
|
|
447 |
|
|
|
745 |
|
|
|
14,813 |
|
| Total |
|
|
|
|
232,757 |
|
|
|
116,856 |
|
|
|
25,387 |
|
|
|
16,193 |
|
|
|
12,275 |
|
|
|
10,687 |
|
|
|
51,359 |
|
The information above contains forward-looking statements, which by their nature involve risk and uncertainty because they relate to
events and depend on circumstances that will or may occur in the future and are outside the control of BP. You are urged to read the cautionary statement on page 271 and Risk factors on page 51, which describe the risks and uncertainties that may
cause actual results and developments to differ materially from those expressed or implied by these forward-looking statements.
Regulation of the group’s business
BP’s activities, including its oil and gas exploration and production, pipelines and transportation, refining and marketing, petrochemicals
production, trading, alternative energy and shipping activities, are conducted in many different countries and are subject to a broad range of EU, US, international, regional and local legislation and regulations, including legislation that
implements international conventions and protocols. These cover virtually all aspects of BP’s activities and include matters such as licence acquisition, production rates, royalties, environmental, health and safety protection, fuel
specifications and transportation, trading, pricing, anti-trust, export, taxes and foreign exchange.
The terms and conditions of the leases, licences and contracts
under which our oil and gas interests are held vary from country to country. These leases, licences and contracts are generally granted by or entered into with a government entity or state-owned or controlled company and are sometimes entered into
with private property owners. Arrangements with governmental or state entities usually take the form of licences or production-sharing agreements (PSAs), although arrangements with the US government can be by lease. Arrangements with private
property owners are usually in the form of leases.
Licences (or concessions) give the holder the right to explore for and exploit a commercial discovery. Under a
licence, the holder bears the risk of exploration, development and production activities and provides the financing for these operations. In principle, the licence holder is entitled to all production, minus any royalties that are payable in kind. A
licence holder is generally required to pay production taxes or royalties, which may be in cash or in kind. Less typically, BP may explore for and exploit hydrocarbons under a service agreement with the host entity in exchange for reimbursement of
costs and/or a fee paid in cash rather than production.
PSAs entered into with a government entity or state-owned or controlled company generally require BP to
provide all the financing and bear the risk of exploration and production activities in exchange for a share of the production remaining after royalties, if any.
In
certain countries, separate licences are required for exploration and production activities and, in certain cases, production licences are limited to only a portion of the area covered by the original exploration licence. Both exploration and
production licences are generally for a specified period of time. In the US, leases from the US government typically remain in effect for a specified term, but may be extended
beyond that term as long as there is production in paying quantities. The term of BP’s licences and the extent to which these licences may be renewed vary from country to country.
Frequently, BP conducts its exploration and production activities in joint arrangements or co-ownership arrangements with other international oil companies, state-owned
or controlled companies and/or private companies. These joint arrangements may be incorporated or unincorporated arrangements, while the co-ownerships are typically unincorporated. Whether incorporated or unincorporated, relevant agreements set out
each party’s level of participation or ownership interest in the joint arrangement or co-ownership. Conventionally, all costs, benefits, rights, obligations, liabilities and risks incurred in carrying out joint-arrangement or co-ownership
operations under a lease or licence are shared among the joint-arrangement or co-owning parties according to these agreed ownership interests. Ownership of joint-arrangement or co-owned property and
hydrocarbons to which the joint arrangement or co-ownership is entitled is also shared in these proportions. To the extent that any liabilities arise, whether to governments or third parties, or as between the
joint arrangement parties or co-owners themselves, each joint arrangement party or co-owner will generally be liable to meet these in proportion to its ownership interest. In many upstream operations, a party (known as the operator) will be
appointed (pursuant to a joint operating agreement (JOA)) to carry out day-to-day operations on behalf of the joint arrangement or co-ownership. The operator is typically one of the joint arrangement parties or a co-owner and will carry out its
duties either through its own staff, or by contracting out various elements to third-party contractors or service providers. BP acts as operator on behalf of joint arrangements and co-ownerships in a number of countries where we have exploration and
production activities.
Frequently, work (including drilling and related activities) will be contracted out to third-party service providers who have the relevant
expertise and equipment not available within the joint arrangement or the co-owning operator’s organization. The relevant contract will specify the work to be done and the remuneration to be paid and typically will set out how major risks will
be allocated between the joint arrangement or co-ownership and the service provider. Generally, the joint arrangement or co-owner and the contractor would respectively allocate responsibility for and provide reciprocal indemnities to each other for
harm caused to their respective staff and property. Depending on the service to be provided, an oil and gas industry service contract may also contain provisions allocating risks and liabilities associated with pollution and environmental damage,
damage to a well or hydrocarbon reservoir and for claims from third
|
|
|
|
|
| BP Annual Report and Form 20-F 2013 |
|
|
253 |
|
parties or other losses. The allocation of those risks vary among contracts and are determined through negotiation between the parties.
In general, BP is required to pay income tax on income generated from production activities (whether under a licence or PSAs). In addition, depending on the area,
BP’s production activities may be subject to a range of other taxes, levies and assessments, including special petroleum taxes and revenue taxes. The taxes imposed on oil and gas production profits and activities may be substantially higher
than those imposed on other activities, for example in Abu Dhabi, Angola, Egypt, Norway, the UK, the US, Russia and Trinidad & Tobago.
Environmental regulation
BP has operations in around 80
countries and is subject to a wide variety of environmental regulations concerning its products, operations and activities. Current and proposed fuel and product specifications, emission controls, climate change programmes and regulation of
unconventional gas extraction under a number of environmental laws may have a significant effect on the production, sale and profitability of many of BP’s products.
There are also environmental laws that require BP to remediate and restore areas affected by the release of hazardous substances or hydrocarbons associated with our
operations. These laws may apply to sites that BP currently owns or operates, sites that it previously owned or operated, or sites used for the disposal of its and other parties’ waste. Provisions for environmental restoration and remediation
are made when a clean-up is probable and the amount of BP’s legal obligation can be reliably estimated. The cost of future environmental remediation obligations is often inherently difficult to estimate.
Uncertainties can include the extent of contamination, the appropriate corrective actions, technological feasibility and BP’s share of liability. See Financial
statements – Note 29 for the amounts provided in respect of environmental remediation and decommissioning.
A number of pending or anticipated governmental
proceedings against certain BP group companies under environmental laws could result in monetary or other sanctions. We are also subject to environmental claims for personal injury and property damage alleging the release of, or exposure to,
hazardous substances. The costs associated with such future environmental remediation obligations, governmental proceedings and claims could be significant and may be material to the results of operations in the period in which they are recognized.
We cannot accurately predict the effects of future developments on the group, such as stricter environmental laws or enforcement policies, or future events at our facilities, and there can be no assurance that material liabilities and costs will not
be incurred in the future. For a discussion of the group’s environmental expenditure see page 252.
A significant proportion of our fixed assets are located in
the US and the EU. US and EU environmental, health and safety regulations significantly affect BP’s exploration and production, refining and marketing, transportation and shipping operations. Significant legislation and regulation in the US and
the EU affecting our businesses and profitability includes the following:
United States
| • |
|
The Clean Air Act (CAA) regulates air emissions, permitting, fuel specifications and other aspects of our production, distribution and marketing activities. Stricter limits on sulphur in fuels will affect us in future,
as will actions on greenhouse gas (GHG) emissions and other air pollutants. Additionally, states may have separate, stricter air emission laws in addition to the CAA. |
| • |
|
The Energy Policy Act of 2005 and the Energy Independence and Security Act of 2007 affect our US fuel markets by, among other things, imposing renewable fuel mandates and imposing GHG emissions thresholds for certain
renewable fuels. States such as California also impose additional fuel carbon standards. |
| • |
|
The Clean Water Act regulates wastewater and other effluent discharges from BP’s facilities, and BP is required to obtain discharge permits, install control equipment and implement operational controls and
preventative measures. |
| • |
|
The Resource Conservation and Recovery Act regulates the generation, storage, transportation and disposal of wastes associated
|
| |
|
with our operations and can require corrective action at locations where such wastes have been disposed of or released. |
| • |
|
The Comprehensive Environmental Response, Compensation and Liability Act (CERCLA) can, in certain circumstances, impose the entire cost of investigation and remediation on a party who owned or operated a site
contaminated with a hazardous substance, or arranged for disposal of a hazardous substance at a site. BP has incurred, or is likely to incur, liability under the CERCLA or similar state laws, including costs attributed to insolvent or unidentified
parties. BP is also subject to claims for remediation costs under other federal and state laws, and to claims for natural resource damages under the CERCLA, the Oil Pollution Act of 1990 (OPA 90) (discussed below) and other federal and state laws.
CERCLA also requires hazardous substance release notification. |
| • |
|
The Toxic Substances Control Act regulates BP’s import, export and sale of new chemical products. |
| • |
|
The Occupational Safety and Health Act imposes workplace safety and health requirements on BP operations along with significant process safety management obligations. |
| • |
|
In May 2012, the US adopted the UN Global Harmonization System for hazard classification and labelling of chemicals and products, with the modification of the Occupational Safety & Health Administration Hazard
Communication Standard. Manufacturers are required to reclassify both Substance and Mixture safety and data sheets (SDS) by 1 June 2015 and to have trained employees on the new label elements (pictograms) and SDS format by 1 December 2013.
BP completed the training for its employees by the 1 December 2013 deadline. |
| • |
|
The Emergency Planning and Community Right-to-Know Act requires emergency planning and hazardous substance release notification as well as public disclosure of our chemical usage and emissions. |
| • |
|
The US Department of Transportation (DOT) regulates the transport of BP’s petroleum products such as crude oil, gasoline, petrochemicals and other hydrocarbon liquids. |
| • |
|
The Maritime Transportation Security Act (MTSA), the DOT Hazardous Materials (HAZMAT) and the Chemical Facility Anti-Terrorism Standard (CFATS) regulations impose security compliance regulations on around 50 BP
facilities. These regulations require security vulnerability assessments, security risk mitigation plans and security upgrades, increasing our cost of operations. |
OPA 90 is implemented through regulations issued by the US Environmental Protection Agency (EPA), the US Coast Guard, the DOT, the Occupational Safety and Health
Administration, the Bureau of Safety and Environmental Enforcement and various states. Alaska and the west coast states currently have the most demanding state requirements.
As a consequence of the Deepwater Horizon incident BP has become subject to claims under OPA 90 and other laws and has established a
$20-billion trust fund for legitimate state and local government response claims, final judgments and settlement claims, legitimate state and local response costs, natural resource damages and related costs
and legitimate individual and business claims (see Gulf of Mexico oil spill on page 38). BP is also subject to natural resource damages claims, claims for civil penalties under the Clean Water Act, and numerous civil lawsuits by individuals,
businesses and governmental entities. The ultimate costs for these claims cannot be determined at this time. For further disclosures relating to the consequences of the 2010 Deepwater Horizon oil spill, see Legal proceedings on page 257.
BP has also been in discussions with the EPA regarding alleged CAA violations at the Toledo refinery and the EPA has alleged certain CAA violations at the Cherry
Point refinery and the Carson refinery (which BP sold to Tesoro Corporation on 1 June 2013).
European Union
| • |
|
The 2008 EU Climate and Energy Package, includes the EU Emissions Trading System (EU ETS) Directive and the Renewable Energy Directive (see Greenhouse gas
regulation on page 44). In January 2014, the European Commission proposed a new Climate and Energy Package for the period up to 2030. Under the third trading period of the EU ETS – ‘Phase III’ – which started on 1 January
2013, the EU ETS |
|
|
|
| 254 |
|
BP Annual Report and Form 20-F 2013 |
| |
|
has been expanded to include, among others, the petrochemical sector. Installations in sectors at risk of “carbon leakage” (i.e. production transfers out of the EU ETS trading area) are
partially compensated with free allocation of emission allowances based on benchmarks used to calculate the number of free emissions per installation. There is no free allocation for electricity generation and production installations; instead these
allowances are auctioned off to market participants. |
| • |
|
The Energy Efficiency Directive (EED) was adopted in 2012. It requires EU Member States to implement an indicative 2020 energy saving target and apply a framework of measures as part of a national energy efficiency
programme. Such measures include mandatory industrial energy efficiency surveys, to obtain data on both new plants and the replacement of large plants. |
| • |
|
The Industrial Emissions Directive (IED) provides the framework for granting permits for major industrial sites. It imposes emission limit values, based on the use of Best Available Techniques (BAT), for discharges to
air and water. The emission limit values are informed by the sector specific and cross-sector BAT Reference Documents (BREFs), which are reviewed periodically. The outcome of the review of several BREFs relevant to our major sites is expected in
2014. The IED transposition and output from the BREF revisions may result in requirements for further emission reductions at our EU sites. |
| • |
|
The European Commission’s Air Policy Review and the related work on revisions to the Gothenburg Protocol and National Emissions Ceiling Directive (NECD) may lead to national ceilings for emissions of a variety of
air pollutants in order to achieve EU-wide health and environmental improvement targets. Along with the proposed Directive on medium combustion plants, this may result in requirements for further emission reductions at BP’s EU sites.
|
| • |
|
The implementation of the Water Framework Directive and the Environmental Quality Directive may mean that BP has to take further steps to manage water discharges from its refineries and chemical plants in the EU.
|
| • |
|
The EU regulation on ozone depleting substances (ODS), which implements the Montreal Protocol (Protocol) on ODS requires BP to reduce the use of ODS and phase out use of certain ODSs. BP continues to replace ODS in
refrigerants and/or equipment, in the EU and elsewhere, in accordance with the Protocol and related legislation. Methyl bromide (an ODS) is a minor by-product in the production of purified terephthalic acid in our petrochemicals operations. The
progressive phase-out of methyl bromide uses may result in future pressure to reduce our emissions of methyl bromide. In addition, the impending adoption of a revised regulation to phase out the use of fluorinated gases, including hydrofluorocarbons
(HFCs) may have an impact on some of BP’s operations. |
| • |
|
The EU Fuel Quality Directive affects our production and marketing of transport fuels. Revisions adopted in 2009 mandate reductions in the life cycle GHG emissions per unit of energy and tighter environmental fuel
quality standards for petrol and diesel. |
| • |
|
The EU Registration, Evaluation and Authorization of Chemicals (REACH) Regulation requires registration of chemical substances, manufactured in, or imported into, the EU in quantities greater than 1 tonne per annum
per legal entity, together with the submission of relevant hazard and risk data. REACH affects our refining, petrochemicals, exploration and production, biofuels, lubricants and other manufacturing or trading/import operations. Having completed
registration of all the substances that we were required to submit by the regulatory deadlines of 1 December 2010 (>1,000 tonnes per annum/legal entity) and 31 May 2013 (100-1,000 tonnes per annum/legal entity), we are now preparing
registration dossiers for substances manufactured or imported in amounts in the range 1-100 tonnes per annum/legal entity that are due to be submitted before 31 May 2018. Some substances registered previously, including substances supplied to
us by third parties for our use, are now subject to thorough evaluation and/or potential authorization/restriction procedures by the European Chemicals Agency and EU Member state authorities. Legislation similar to REACH is in place in Turkey, which
requires the registration of manufactured and imported chemicals.
|
| • |
|
In addition, Europe has adopted the UN Global Harmonization System for hazard classification and labelling of chemicals and products, which has been fully implemented in a number of countries outside the EU, through the
Classification Labelling and Packaging (CLP) Regulation. This requires BP to assess the hazards of all of our chemicals and products against new criteria and will result in significant changes to warning labels and material safety data sheets. All
our European Material Safety Data Sheets are being updated to include both REACH and CLP information. We have also notified the European Chemicals Agency of hazard classifications for our manufactured and imported chemicals, for inclusion in a
publicly available inventory of hazardous chemicals. CLP will also apply to mixtures (e.g. lubricants) by 2015. Activities covered by both CLP and REACH are subject to enforcement activity by national regulatory authorities. Several BP entities were
already subject to inspections. All observations made were minor in nature, and were readily rectified to the satisfaction of the authorities. |
| • |
|
The EU Commission has issued the Offshore Safety Directive which is now required to be transposed into national legislation by Member States, including the UK. Its purpose is to introduce a harmonized regime aimed at
reducing the potential environmental, health and safety impacts of the offshore oil and gas industry throughout EU waters. Implementation into UK legislation will involve alignment of the regime currently operating in the UK. |
Environmental maritime regulations
BP’s shipping
operations are subject to extensive national and international regulations governing liability, operations, training, spill prevention and insurance. These include:
| • |
|
In US waters, OPA 90 imposes liability and spill prevention and planning requirements governing, among others, tankers, barges and offshore facilities. It also mandates a levy on imported and domestically produced oil
to fund oil spill responses. Some states, including Alaska, Washington, Oregon and California, impose additional liability for oil spills. Outside US territorial waters, BP shipping tankers are subject to international liability, spill response and
preparedness regulations under the UN’s International Maritime Organization, including the International Convention on Civil Liability for Oil Pollution, the International Convention for the Prevention of Pollution from Ships (MARPOL)
Convention, the International Convention on Oil Pollution, Preparedness, Response and Co-operation and the International Convention on Civil Liability for Bunker Oil Pollution Damage. In April 2010, the Hazardous and Noxious Substance (HNS) Protocol
2010, was adopted to address issues that have inhibited ratification of the International Convention on Liability and Compensation for Damage in Connection with the Carriage of Hazardous and Noxious Substances by Sea 1996 (the HNS Convention). As at
9 January 2014, there were 14 contracting states to the HNS Convention but it had not yet entered into force. |
| • |
|
In April 2008, the International Maritime Organization (IMO) approved amendments to Annex VI of the MARPOL to reduce the sulphur content in marine fuels. Since 1 January 2012 the global limit on sulphur content in
marine fuels may not exceed 3.50%. This global limit will be further reduced to 0.5% in 2020, provided there is enough fuel available. Annex VI also provides for stricter sulphur emission restrictions on ships in SOx Emission Control Areas (SECAs).
EU ports and inland waterways and the North Sea and Baltic Sea have been covered by SECAs since 2010 imposing a sulphur content limit of 0.1%. These restrictions require the use of compliant heavy fuel oil (HFO) or distillate, or the installation of
abatement technologies on ships. These restrictions are expected to place additional costs on refineries producing marine fuel, including costs to dispose of sulphur, as well as increased GHG emissions and energy costs for additional refining.
|
To meet its financial responsibility requirements, BP shipping maintains marine liability pollution insurance in respect of its operated ships to a
maximum limit of $1 billion for each occurrence through mutual insurance associations (P&I Clubs) but there can be no assurance that a spill will necessarily be adequately covered by insurance or that liabilities will not exceed insurance
recoveries.
|
|
|
|
|
| BP Annual Report and Form 20-F 2013 |
|
|
255 |
|
Greenhouse gas regulation
Increasing concerns about climate change have led to a number of international climate agreements and negotiations continue on defining the scope and nature of the
commitments to be entered into by those subject to the next phase of international climate change regulation.
At the UN summit in Cancun in December 2010, the
parties to the UN Framework Convention on Climate Change (UNFCCC) entered into a formal agreement on a package of measures to 2020. The Cancun Agreement seeks deep cuts in global greenhouse gas (GHG) emissions required to hold the increase in global
temperature to below 2°C. Signatories formally committed to carbon reduction targets or actions by 2020. Around 85 countries, including 69 developed economies (the EU counted as 28 countries) and 16 developing countries, have made such
commitments currently. An additional 39 developing countries have submitted pledges related to sectoral goals. Supporting those climate efforts, principles were agreed for monitoring, verifying and reporting emissions reductions; the Green Climate
Fund was established to help developing countries limit and adapt to climate change; and measures were agreed to protect forests and transfer low-carbon technology to poorer nations. In November 2011, parties to the UNFCCC conference in Durban
(COP17) agreed to several measures. One was a ‘roadmap’ for negotiating a legal framework for action on climate change by 2015 that would involve all countries by 2020 and would close the ‘ambition gap’ between existing GHG
reduction pledges and what is required to achieve the goal of limiting global temperature rise to 2°C. Another was a second commitment period for the Kyoto Protocol, to begin immediately after the first period. An amendment was subsequently
adopted at the 2012 conference of parties (COP18) in Doha establishing a second commitment period to run until the end of 2020. However, it will not include the US, Canada, Japan and Russia and thus covers only about 15% of global emissions. The
2013 Warsaw meeting (COP19) agreed to continue these processes with a view to agreeing to post-2015 and post-2020 targets or frameworks.
Aspects of these
international concerns and agreements are reflected in national and regional measures seeking to limit GHG emissions. Additional, more stringent, measures can be expected in the future. These measures could increase BP’s production costs for
certain products, increase demand for competing energy alternatives or products with lower-carbon intensity, and affect the sales and specifications of many of BP’s products. Current measures and developments potentially affecting BP’s
businesses include the following:
| • |
|
The European Union (EU) has agreed to an overall GHG reduction target of 20% by 2020. To meet this, a ‘Climate and Energy Package’ of regulatory measures has been adopted including: national reduction targets
for emissions not covered by the EU ETS; binding national renewable energy targets to double usage of renewable energy sources in the EU including at least a 10% share of renewable energy in the transport sector; a legal framework to promote carbon
capture and storage (CCS); and a revised EU ETS Phase 3. EU ETS revisions include a GHG reduction of 21% from 2005 levels, a significant increase in allowance auctioning, an expansion in the scope of the EU ETS to encompass more industrial sectors
and gases and no free allocation for electricity generation or production but benchmarked free allocation for energy-intensive and trade-exposed industrial sectors. Finally, EU energy efficiency policy is currently implemented via national energy
efficiency action plans and the Energy Efficiency Directive adopted in 2012. The EU recently started discussions on a new framework for its energy and climate policies over the 2030 time horizon which will succeed the current framework once adopted.
|
| • |
|
Article 7a of the revised EU Fuel Quality Directive requires fuel suppliers to reduce the life cycle GHG emissions per unit of fuel and energy supplied in certain transport markets. |
| • |
|
Australia has committed to reduce its GHG emissions by at least 5% below 2000 levels by 2020. In accordance with the Clean Energy Act 2011, Australia’s carbon price took effect on 1 July 2012 with a fixed
price of $23 Australian dollars per tonne. The fixed price phase is scheduled to transition into a market-based price (emissions trading scheme) by 1 July 2016. BP refineries and its share of the North West Shelf Project are covered entities
within the Clean Energy Act 2011 and are liable for carbon dioxide-equivalent emissions. With Australia’s change of federal government in September 2013, there is significant
|
| |
|
uncertainty that exists in relation to the future of the Carbon Pricing Mechanism provided for under the Clean Energy Act 2011. BP Australia continues to monitor this situation.
|
| • |
|
New Zealand has agreed to cut GHG emissions by at least 5% below 1990 levels by 2020, with additional reduction conditioned on a comprehensive global agreement for emissions reductions coming into force. New
Zealand’s emission trading scheme (NZ ETS) commenced on 1 July 2010 for transport fuels, industrial processes and stationary energy. New Zealand also employs a portfolio of mandatory and voluntary complementary measures aimed at GHG
reductions. New Zealand made its recent commitments for GHG reduction under the UN Framework Convention rather than the Kyoto Protocol. |
| • |
|
In the US, with the potential for passing comprehensive climate legislation remaining very unlikely, the US Environmental Protection Agency (EPA) continues to pursue regulatory measures to address GHGs under the Clean
Air Act (CAA). |
| |
– |
In late 2009, the EPA released a GHG endangerment finding to establish its authority to regulate GHG emissions under the CAA. |
| |
– |
Subsequent to this, the EPA finalized regulations imposing light duty vehicle emissions standards for GHGs. |
| |
– |
The EPA finalized the initial GHG mandatory reporting rule (GHGMRR) in 2009 and continues to make amendments to the rule. Reports under the GHGMRR are due annually. The majority of BP’s US businesses are affected
by the GHGMRR and submitted their GHG emissions reports to the EPA under the GHGMRR on or before the required deadlines. In addition to direct emissions from affected facilities, producers and importers/exporters of petroleum products, certain
natural gas liquids and GHGs are required to report product volumes and notional GHG emissions as if these products were fully combusted. The EPA has released direct emissions data since 2011, and in 2013 released aggregated site product emissions
data. Certain confidential business information protections remain for both direct and product emissions data reported. |
| |
– |
The EPA finalized permitting requirements for new or modified large GHG emission sources in 2010, with initial regulations taking effect in January 2011, the second phase taking effect on 1 July 2011 and the third
phase finalized on 29 June 2012. |
| |
– |
In a legal settlement with environmental advocacy groups, the EPA committed to propose a GHG New Source Performance Standards (NSPS) for GHG emissions from refineries by December 2011 and to finalize the NSPS by
November 2012. These deadlines were not met and the new refinery NSPS deadlines were not proposed by the administration when the electric generating unit (EGU) GHG EGU NSPS deadlines were announced in a Climate Policy Directive in June 2013.
|
| |
– |
Legal challenges to the EPA’s efforts to regulate GHG emissions through the CAA continue, including before the US Supreme Court in the 2013-2014 term, along with active political debate with the final content and
scope of GHG regulation in the US remaining uncertain. |
| • |
|
A number of additional state and regional initiatives in the US will affect our operations. Of particular significance, California implemented a low-carbon fuel standard in 2010 and is seeking to reduce GHG emissions to
1990 levels by 2020 and to reduce the carbon intensity of transport fuel sold in the state. Legal challenges resulted in a pause for 2014 carbon intensity targets at the 2013 level. Whilst these legal challenges continue, the preliminary injunction
stopping implementation was lifted and implementation of the programme continues. The California cap and trade programme started in January 2012 with the first auctions of carbon allowances held in November 2012 and obligations commencing in 2013.
|
| • |
|
Canada has established an action plan to reduce emissions to 17% below 2005 levels by 2020 and the national government continues to seek a co-ordinated approach with the US on environmental and energy objectives.
Additionally, Canada’s highest emitting province, Alberta, has been running a market mechanism to reduce GHG emissions since 2007. Controversy, partially driven by perceived GHG intensity regarding Canadian oil sand produced crude, continues
with some jurisdictions contemplating policies to restrict or penalize the use of such crude. |
|
|
|
| 256 |
|
BP Annual Report and Form 20-F 2013 |
| • |
|
China has committed to reducing carbon intensity of GDP 40-45% below 2005 levels by 2020 and increasing the share of non-fossil fuels in total energy consumption from 7.5% in 2005 to 15% by 2020. The country’s 12th
(2011-2015) Development Programme has set the target to reduce carbon intensity by 17% within five years, and this national target has been deconstructed into provincial ones for local actions. Four emission trading pilots have begun in the cities
of Beijing, Shenzhen and Shanghai and in Guangdong province. Additional emission trading schemes have been approved for Tianjin and Chongqing cities as well as Hubei province. As part of the country’s energy saving programme, the government
also requires any operating entity with annual energy consumption of 10 thousand tonnes of coal equivalent (7ktoe/a) to have an energy saving target for the next five years. A number of BP joint venture companies in China will be required
to participate in these initiatives. |
For information on the steps that BP is taking in relation to climate change issues and in relation to GHG
regulation and for details of BP’s GHG reporting see Environment and society on page 45.
Legal proceedings
Proceedings relating to the Deepwater Horizon oil spill
BP’s potential liabilities resulting from threatened, pending and potential future claims, lawsuits and enforcement actions relating to the 20 April 2010
explosions and fire on the semi-submersible rig Deepwater Horizon and resulting oil spill (the Incident), together with the potential cost of implementing remedies sought in the various proceedings, cannot be fully estimated at this time but they
have had and could continue to have a material adverse impact on the group’s business, competitive position, financial performance, cash flows, prospects, liquidity, shareholder returns and/or implementation of its strategic agenda,
particularly in the US. The potential liabilities may continue to have a material adverse effect on the group’s results and financial condition. See Financial statements – Note 2 to the financial statements for information regarding the
financial impact of the Incident.
BP p.l.c., BP Exploration & Production Inc. (BPXP) and various other BP entities (collectively referred to as BP) are
among the companies named as defendants in approximately 2,950 pending civil lawsuits relating to the Incident and further actions are likely to be brought. BPXP was lease operator of Mississippi Canyon, Block 252 in the Gulf of Mexico (Macondo),
where the Deepwater Horizon was deployed at the time of the Incident. The other working interest owners at the time of the Incident were Anadarko Petroleum Company (Anadarko) and MOEX Offshore 2007 LLC (MOEX). The Deepwater Horizon, which was owned
and operated by certain affiliates of Transocean Ltd. (Transocean), sank on 22 April 2010. The pending lawsuits and/or claims arising from the Incident have generally been brought in US federal and state courts. The plaintiffs include
individuals, corporations, insurers, and governmental entities and many of the lawsuits purport to be class actions. The lawsuits assert, among others, claims under the Oil Pollution Act of 1990 (OPA 90), claims for personal injury in connection
with the Incident itself and the response to it, wrongful death, commercial and economic injury, breach of contract and violations of statutes. Many of the lawsuits assert claims which are excluded from the Economic and Property Damages Settlement
Agreement (discussed below), including claims for recovery for losses allegedly resulting from the 2010 federal deepwater drilling moratoria and/or the related permitting process. The lawsuits seek various remedies including compensation to injured
workers, recovery for commercial losses and property damage, compensation for personal injuries and medical monitoring, claims for environmental damage, remediation costs, claims for unpaid wages, injunctive and declaratory relief, treble damages
and punitive damages. Purported classes of claimants include residents of the states of Louisiana, Mississippi, Alabama, Florida and Texas; property owners and rental agents, fishermen and persons dependent on the fishing industry, charter boat
owners and deck hands, marina owners, gasoline distributors, shipping interests, restaurant and hotel owners, cruise lines and others who are property and/or business owners alleged to have suffered economic loss; and response workers and residents
claiming injuries due to exposure to the components of oil and/or chemical dispersants. Among other claims arising from the spill response efforts, lawsuits have been filed claiming
that additional payments are due by BP under certain Master Vessel Charter Agreements entered into in the course of the Vessels of Opportunity Program implemented as part of the response to the
Incident. Purported class action and individual lawsuits have also been filed in US state and federal courts, as well as one suit in Canada, against BP entities and/or various current and former officers and directors alleging, among other things,
shareholder derivative claims, securities fraud claims, violations of the Employee Retirement Income Security Act (ERISA) and contractual and quasi-contractual claims related to the cancellation of the dividend on 16 June 2010.
In August 2010, many of the lawsuits pending in federal court were consolidated by the Federal Judicial Panel on Multi-district Litigation into two multi-district
litigation proceedings, one in federal district court in Houston for the securities, derivative and ERISA cases (MDL 2185) and another in federal district court in New Orleans for the remaining cases (MDL 2179).
Presentation of evidence in the first trial phase (Phase 1) of a Trial of Liability, Limitation, Exoneration and Fault Allocation in MDL 2179 concluded on 17 April
2013, and the parties completed post-trial briefing in respect of Phase 1 on 12 July 2013. The second trial phase (Phase 2), which addressed source control efforts and the amount of oil that was spilled into the Gulf as a result of the
Incident, completed on 18 October 2013, and post-trial briefing in respect of Phase 2 is substantially complete. In a further trial phase, which is yet to be scheduled, the district court will determine the amount of civil penalties arising
under the Clean Water Act based on the court’s rulings as to the presence of negligence, gross negligence or wilful misconduct in Phases 1 and 2, the court’s rulings as to quantification of discharge in Phase 2 and the application of the
penalty factors under the Clean Water Act. For further information, see MDL 2179 and related matters – Trial phases below.
On 3 March 2012, BP announced an
agreement in principle with the Plaintiffs’ Steering Committee (PSC) in MDL 2179 to settle the substantial majority of legitimate private economic and property damages claims and exposure-based medical claims stemming from the Incident. See MDL
2179 and related matters – PSC settlements below.
On 1 June 2010, the US Department of Justice (the DoJ) announced that it was conducting an investigation
into the Incident encompassing possible violations of US civil or criminal laws, and subsequently created a unified task force of federal agencies to investigate the Incident. On 15 November 2012, BP announced that it reached agreement with the
US government, subject to court approval, to resolve all federal criminal charges and all claims by the US Securities and Exchange Commission (the SEC) against BP arising from the Deepwater Horizon accident, oil spill and response. See Settlements
with the DoJ and SEC below.
MDL 2179 and related matters
DoJ Action; liability limitation-, contribution- and indemnity-related proceedings; and Trial of Liability, Limitation,
Exoneration and Fault Allocation
On 13 May 2010, Transocean and certain affiliates filed a complaint under
admiralty law in federal court in Texas seeking exoneration from or limitation of liability as managing owners and operators of the Deepwater Horizon. That action (the Limitation Action) was consolidated with MDL 2179 on 24 August 2010.
The United States filed a civil complaint in MDL 2179 against BPXP and others on 15 December 2010 (the DoJ Action). The complaint seeks a declaration of
liability under OPA 90 and civil penalties under the Clean Water Act and sets forth a purported reservation of rights on behalf of the US to amend the complaint or file additional complaints seeking various remedies under various US federal laws and
statutes. See Financial statements – Note 2.
On 18 February 2011, Transocean filed a third-party complaint against BP, the US government, and other
corporations involved in the Incident, naming those entities as formal parties in the Limitation Action. On 20 April 2011, Transocean filed claims in the Limitation Action alleging that BP had breached BP America Production Company’s
contract with Transocean Holdings LLC by BP not agreeing to indemnify Transocean against liability related to the Incident and by not paying certain invoices. Transocean also asserted claims against BP under state law, maritime law, and OPA 90 for
contribution.
|
|
|
|
|
| BP Annual Report and Form 20-F 2013 |
|
|
257 |
|
On 20 April 2011, BP filed claims against Cameron International Corporation (Cameron), Halliburton Energy Services,
Inc. (Halliburton), and Transocean in the DoJ Action, seeking contribution for any assessments against BP under OPA 90 based on those entities’ fault. On 20 June 2011, Cameron and Halliburton moved to dismiss BP’s claims against them
in the DoJ Action. BP’s claim against Cameron has been resolved pursuant to settlement (described below), but Halliburton’s motion remains pending.
On
20 April 2011, BP asserted claims against Cameron, Halliburton and Transocean in the Limitation Action. BP’s claims against Transocean include breach of contract, unseaworthiness of the Deepwater Horizon vessel, negligence (or gross
negligence and/or gross fault as may be established at trial based upon the evidence), contribution and subrogation for costs (including those arising from litigation claims) resulting from the Incident, as well as a declaratory claim that
Transocean is wholly or partly at fault for the Incident and responsible for its proportionate share of the costs and damages. BP asserted claims against Halliburton for fraud and fraudulent concealment based on Halliburton’s misrepresentations
to BP concerning, among other things, the stability testing on the foamed cement used at the Macondo well; for negligence (or, if established by the evidence at trial, gross negligence) based on Halliburton’s performance of its professional
services, including cementing and mud logging services; and for contribution and subrogation for amounts that BP has paid in responding to the Incident, as well as in OPA 90 assessments and in payments to the plaintiffs. BP filed a similar complaint
against Halliburton in federal court in the Southern District of Texas, Houston Division, and the action was transferred to MDL 2179 on 4 May 2011.
On
20 April 2011, Halliburton filed claims in the Limitation Action seeking indemnification from BP for claims brought against Halliburton in that action. Halliburton also asserted a claim for negligence, gross negligence and wilful misconduct
against BP and others. On 30 November 2011, Halliburton filed a motion for summary judgment in MDL 2179. On 21 December 2011, BP filed a cross-motion for partial summary judgment seeking an order that BP has no contractual obligation to
indemnify Halliburton for fines, penalties or punitive damages resulting from the Incident. On 31 January 2012, the judge ruled on BP’s and Halliburton’s indemnity motions, holding that BP is required to indemnify Halliburton for
third-party claims for compensatory damages resulting from pollution that did not originate from property or equipment of Halliburton located above the surface of the land or water, regardless of whether the claims result from Halliburton’s
gross negligence. The court, however, ruled that BP does not owe Halliburton indemnity to the extent that Halliburton is held liable for punitive damages or for civil penalties under the Clean Water Act. The court further held that BP’s
obligation to defend Halliburton for third-party claims does not require BP to fund Halliburton’s defence of third-party claims at this time, nor does it include Halliburton’s expenses in proving its right to indemnity. The court deferred
ruling on whether BP is required to indemnify Halliburton for any penalties or fines under the Outer Continental Shelf Lands Act. It also deferred ruling on whether Halliburton acted so as to invalidate the indemnity by breaching its contract with
BP, by committing fraud, or by committing another act that materially increased the risk to BP or prejudiced the rights of BP as an indemnitor.
On 30 May 2011,
Transocean filed claims against BP in the DoJ Action alleging that BP America Production Company had breached its contract with Transocean Holdings LLC by not agreeing to indemnify Transocean against liability related to the Incident. Transocean
also asserted claims against BP under state law, maritime law and OPA 90 for contribution.
On 1 November 2011, Transocean filed a motion for partial summary
judgment on certain claims filed in the Limitation Action and the DoJ Action between BP and Transocean, seeking an order that would bar BP’s contribution claims against Transocean and require BP to defend and indemnify Transocean against all
pollution claims, including those resulting from any gross negligence, and from civil fines and penalties sought by the government. On 7 December 2011, BP filed a cross-motion for summary judgment seeking an order that BP is not required to
indemnify Transocean for any civil fines and penalties sought by the government or for punitive damages. On 26 January 2012, the judge ruled on BP’s and Transocean’s indemnity motions, holding that BP is required to indemnify
Transocean for third-party claims for compensatory
damages resulting from pollution originating beneath the surface of the water, regardless of whether the claim results from Transocean’s strict liability, negligence or gross negligence. The
court, however, ruled that BP does not owe Transocean indemnity for such claims to the extent Transocean is held liable for punitive damages or for civil penalties under the Clean Water Act, or if Transocean acted with intentional or wilful
misconduct in excess of gross negligence. The court further held that BP’s obligation to defend Transocean for third-party claims does not require BP to fund Transocean’s defence of third-party claims at this time, nor does it include
Transocean’s expenses in proving its right to indemnity. The court deferred a final ruling on the question of whether Transocean breached its drilling contract with BP so as to invalidate the contract’s indemnity clause.
On 8 December 2011, the United States brought a motion for partial summary judgment in the DoJ Action seeking, among other things, an order finding that BPXP,
Transocean and Anadarko are strictly liable for a civil penalty under Section 311(b) (7)(A) of the Clean Water Act. On 22 February 2012, the judge ruled on motions filed in the DoJ Action by the United States, Anadarko, and Transocean
seeking early rulings regarding the liability of BPXP, Anadarko and Transocean under OPA 90 and the Clean Water Act, but limited the order to addressing the discharge of hydrocarbons occurring under the surface of the water. Regarding OPA 90,
the judge held that BPXP and Anadarko are responsible parties under OPA 90 with regard to the subsurface discharge. The judge ruled that BPXP and Anadarko have joint and several liability under OPA 90 for removal costs and damages for such
discharge, but did not rule on whether such liability under OPA 90 is unlimited. While the judge held that Transocean is not a responsible party under OPA 90 for subsurface discharge, the judge left open the question of whether Transocean may be
liable under OPA 90 for removal costs for such discharge as the owner/operator of the Deepwater Horizon. Regarding the Clean Water Act, the judge held that the subsurface discharge was from the Macondo well, rather than from the Deepwater Horizon,
and that BPXP and Anadarko are liable for civil penalties under Section 311 of the Clean Water Act as owners of the well. Anadarko, BPXP and the United States each appealed the 22 February 2012 ruling to the US Court of Appeals for the
Fifth Circuit (the Fifth Circuit), and the appeals were consolidated. Briefing in this appeal is complete and oral argument was heard on 4 December 2013, but no ruling has been issued.
On 18 December 2012, Transocean filed a motion seeking an early ruling that it is not liable in connection with claims for compensatory or punitive damages, or
claims for contribution, brought by private, state, or local government entities and based on the subsurface discharge of oil. Transocean’s motion has been fully briefed but remains pending.
On 18 December 2012, Transocean filed a motion seeking an early ruling that it is not liable in connection with punitive damages claims brought by members of the
Economic and Property Damages Settlement Class (for a description of the Economic and Property Damages Settlement Agreement, see below). On 20 December 2012, Transocean filed a motion seeking an early ruling that it is not liable in connection
with BP’s claims for reimbursement of payments made under the Economic and Property Damages Settlement Agreement and BP’s separate claims for spill-related damages, such as lost profits from the Macondo well, which claims were assigned by
BP to the Economic and Property Damages Settlement Class. On 17 January 2013, Halliburton filed motions seeking early rulings that it is not liable in connection with punitive damages claims brought by members of the Economic and Property
Damages Settlement Class; that it is not liable in connection with any contribution claim for punitive damages, whether asserted by BP or by the Economic and Property Damages Settlement Class as BP’s assignee; and that it is not liable in
connection with claims assigned by BP to the Economic and Property Damages Settlement Class. Transocean’s and Halliburton’s motions have been fully briefed but remain pending.
On 11 January 2013, BP filed a motion in the DoJ Action for partial summary judgment against the United States, seeking rulings that (1) BP collected at least
810,000 barrels from the broken riser, from the top of the blowout preventer and lower marine riser package, and from the choke and kill lines of the blowout preventer, all before these barrels reached the waters of the Gulf of Mexico, and
(2) that these barrels may not be counted toward the maximum penalty potentially to be assessed
|
|
|
| 258 |
|
BP Annual Report and Form 20-F 2013 |
against BPXP under Section 311 of the Clean Water Act, 33 U.S.C. § 1321. BP and the United States subsequently reached a stipulation, entered by the court on 19 February 2013,
providing that 810,000 barrels of oil were collected without coming into contact with ambient Gulf waters and that those barrels are not to be used in calculating the statutory maximum penalty under the Clean Water Act.
On 1 March 2013, Transocean sought the district court’s leave to supplement its pleadings to include an affirmative defence asserting that BP’s
representations regarding the flow rate at the Macondo well constituted an intervening and superseding cause of the oil spill for the majority of its duration. Transocean’s defence claims that BP fraudulently misrepresented and concealed
information regarding the flow rate at the Macondo well in late April and May 2010, as well as the likelihood of success of a top-kill approach to stopping the flow of hydrocarbons from the well, and thus prevented the implementation of alternative
means of source control that Transocean asserts could have capped the well as early as May 2010. Also on 1 March 2013, Halliburton filed a motion for leave to amend its answers to assert a similar defence. On 4 March 2013, the court
granted Transocean’s motion to file amended answers, and it granted Halliburton’s motion the following day.
Trial phases
To address certain issues asserted in or relevant to the claims, counterclaims, cross-claims, third-party claims, and comparative fault defences raised in the DoJ Action
and the Limitation Action, a Trial of Liability, Limitation, Exoneration and Fault Allocation commenced in MDL 2179 on 25 February 2013. The presentation of evidence in the first phase of the trial (Phase 1), which completed on
17 April 2013, addressed issues arising out of the conduct of various parties allegedly relevant to the loss of well control at the Macondo well, the ensuing fire and explosion on the Deepwater Horizon on 20 April 2010, the sinking of the
vessel on 22 April 2010 and the initiation of the release of oil from the Deepwater Horizon or the Macondo well during those time periods, including whether BP or any other party was grossly negligent. The parties completed court-ordered
post-trial briefing in respect of Phase 1 on 12 July 2013. On 13 August 2013, BP moved for leave to supplement the Phase 1 record to include Halliburton’s agreement to plead guilty to destroying evidence relating to Halliburton’s
internal examination of the Incident and the US government’s press release announcing the Halliburton plea agreement. The US government, the Plaintiffs’ Steering Committee and Halliburton have also submitted briefs addressing the
implications of Halliburton’s plea agreement. The district court has yet to rule on BP’s motion. BP is not currently aware of the timing of the district court’s ruling in respect of issues addressed in Phase 1 which could be at
any time.
The second trial phase (Phase 2), which commenced on 30 September 2013, addressed (i) ’source control’ issues pertaining to the conduct
or inaction of BP, Transocean or other relevant parties regarding stopping the release of hydrocarbons stemming from the Incident from 22 April 2010 through to approximately 19 September 2010, and (ii) ’quantification of
discharge’ issues pertaining to the amount of oil actually released into the Gulf of Mexico as a result of the Incident from the time when these releases began until the Macondo well was capped on approximately 15 July 2010 and then
permanently cemented shut on approximately 19 September 2010. Post-trial briefing in respect of Phase 2 is substantially complete. On 25 January 2014, Transocean filed a motion to supplement the Phase 2 record with certain testimony that
occurred in a separate trial of a former BP employee related to the Incident. The district court has yet to rule on this motion. BP is not currently aware of the timing of the district court’s ruling in respect of issues addressed in Phase 2
which could be at any time.
In a further trial phase, which is yet to be scheduled, the district court will determine the amount of civil penalties arising under the
Clean Water Act based on the court’s rulings as to the presence of negligence, gross negligence or wilful misconduct in Phases 1 and 2, the court’s rulings as to quantification of discharge in Phase 2 and the application of the penalty
factors under the Clean Water Act. The district court set a status conference for 21 March 2014 to address case management issues relating to this phase of the litigation. The district court also ordered the parties, on a schedule to be completed
prior to 21 March, to serve initial disclosures and written discovery requests, to provide proposed stipulations, and to file submissions regarding potential evidence to be adduced at a penalty phase trial, as well as certain other issues.
The district court in MDL 2179 has wide discretion in its determination as to whether a defendant’s conduct involved
negligence or gross negligence as well as in its determinations on the volume of oil spilled and the application of statutory penalty factors.
MOEX, Anadarko and Cameron settlements
BP announced settlement agreements in
respect of all claims related to the Incident with MOEX, Anadarko and Cameron on 20 May 2011, 17 October 2011 and 16 December 2011, respectively. Under the settlement agreement with MOEX, MOEX paid BP $1.065 billion and also agreed to
transfer all of its 10% interest in the MC252 lease to BP. Under the settlement agreement with Anadarko, Anadarko paid BP $4 billion and also agreed to transfer all of its 25% interest in the MC252 lease to BP. The settlement agreement with Anadarko
grants Anadarko the opportunity for a 12.5% participation in certain future recoveries from third parties and certain insurance proceeds in the event that such recoveries and proceeds exceed $1.5 billion in aggregate. Any such payments to Anadarko
are capped at a total of $1 billion. BP agreed to indemnify MOEX, Anadarko and Cameron for certain claims arising from the Incident (excluding civil, criminal or administrative fines and penalties, claims for punitive damages, and certain other
claims). The settlement agreements with MOEX, Anadarko and Cameron are not an admission of liability by any party regarding the Incident.
PSC settlements
The Economic and Property Damages Settlement resolves certain
economic and property damage claims, and the Medical Benefits Class Action Settlement resolves certain medical claims by response workers and certain Gulf Coast residents. The Economic and Property Damages Settlement includes a $2.3 billion BP
commitment to help resolve economic loss claims related to the Gulf seafood industry (for further information, see – PSC Settlements – Seafood Compensation Fund below) and a $57 million fund to support continued advertising that promotes
Gulf Coast tourism. It also resolves property damage in certain areas along the Gulf Coast, as well as claims for additional payments under certain Master Vessel Charter Agreements entered into in the course of the Vessels of Opportunity Program
implemented as part of the response to the Incident. The Economic and Property Damages Settlement does not include claims made against BP by the DoJ or other federal agencies (including under the Clean Water Act and for Natural Resource Damages
under OPA 90) or by the states and local governments. Also excluded are certain other claims against BP, such as securities and shareholder claims pending in MDL 2185, and claims based solely on the deepwater drilling moratorium and/or the related
permitting process.
The Medical Benefits Class Action Settlement involves payments to qualifying class members based on a matrix for certain Specified Physical
Conditions, as well as a 21-year Periodic Medical Consultation Program for qualifying class members. Payments of claims under the Medical Benefits Class Action Settlement could not begin until after the agreement’s 12 February 2014
Effective Date, being the day after the resolution of all appeals from the final approval of the Medical Benefits Class Action Settlement, though class members were permitted to file claim forms in advance of the Effective Date to facilitate
administration of the Medical Benefits Class Action Settlement upon the Effective Date. The deadline for submitting claims under the Medical Benefits Class Action Settlement is one year after the Effective Date. The settlement also provides that
class members claiming Later-Manifested Physical Conditions may pursue their claims through a mediation/litigation process, but waive, among other things, the right to seek punitive damages. Consistent with its commitment to the Gulf, BP has also
agreed as part of the Medical Benefits Class Action Settlement to provide $105 million to the Gulf Region Health Outreach Program to improve the availability, scope and quality of healthcare in certain Gulf Coast communities. This healthcare
outreach programme will be available to, and is intended to benefit, class members and other individuals in those communities. BP has already begun funding the projects sponsored by this programme.
Each agreement provides that class members will be compensated for their claims on a claims-made basis, according to agreed compensation protocols in separate
court-supervised claims processes. The compensation protocols under the Economic and Property Damages Settlement provide for the payment of class members’ economic losses and property damages related to the oil spill. In addition many economic
|
|
|
|
|
| BP Annual Report and Form 20-F 2013 |
|
|
259 |
|
and property damages class members will receive payments based on negotiated risk transfer premiums, which are multiplication factors designed, in part, to compensate claimants for potential
future damages that are not currently known, relating to the Incident. The Economic and Property Damages Settlement and the Medical Benefits Class Action Settlement are not an admission of liability by BP. The settlements are uncapped except for
economic loss claims related to the Gulf seafood industry under the Economic and Property Damages Settlement and the $105 million to be provided to the Gulf Region Health Outreach Program under the Medical Benefits Class Action Settlement.
All class member settlements under the settlement agreements are payable under the terms of the Trust. Other costs to be paid from the Trust include state and local
government claims, state and local response costs, natural resource damages and related claims, and final judgments and settlements. As at 31 December 2013, the aggregate cash balances in the Trust and the qualified settlement funds amounted to
$6.7 billion, including $1.2 billion remaining in the seafood compensation fund which has yet to be distributed, and $0.9 billion held for natural resource damage early restoration. Should the cash balances in the Trust not be sufficient, payments
in respect of legitimate claims and other costs will be made directly by BP. See Financial statements – Note 2.
The economic and property damages claims process
is under court supervision through the settlement claims process established by the Economic and Property Damages Settlement. Under the Economic and Property Damages Settlement, class members release and dismiss their claims against BP not expressly
reserved by that agreement. The Economic and Property Damages Settlement also provides that, to the extent permitted by law, BP assigns to the PSC certain of its claims, rights and recoveries against Transocean and Halliburton for damages with
protections such that Transocean and Halliburton cannot pass those damages through to BP. Under the Medical Benefits Class Action Settlement, class members release and dismiss their claims against BP covered by that settlement, except that class
members do not release claims for Later-Manifested Physical Conditions.
On 24 April 2013, the plaintiffs in two actions arising from the Incident filed a motion
asking the Federal Judicial Panel on Multi-district Litigation to create new multi-district litigation proceedings for certain claims not covered by the two class settlements entered into between BP and the PSC. BP and other defendants opposed the
motion and on 9 August 2013 the Federal Judicial Panel on Multi-district Litigation denied the motion.
PSC
settlements – appeals
Under US federal law, there is an established procedure for determining the fairness,
reasonableness and adequacy of class action settlements. Pursuant to this procedure, an extensive notice programme to the public was implemented to explain the settlement agreements and class members’ rights, including the right to ’opt
out’ of the classes, and the processes for making claims. The court conducted a fairness hearing on 8 November 2012 in which to consider, among other things, whether to grant final approval of the Economic and Property Damages Settlement
and the Medical Benefits Class Action Settlement, whether to certify the classes for settlement purposes only, and the merits of any objections to the settlement agreements. On 21 November 2012, the parties to the settlement filed a list of
13,123 individuals and entities who had submitted timely requests to opt out of the Economic and Property Damages Settlement Class and 1,638 individuals who had submitted timely requests to opt out of the Medical Benefits Settlement Class. On
16 November 2012, the court extended the deadline from 5 November 2012 to 15 December 2012 for such excluded persons or entities to request revocation of their requests to opt out of the settlement. As a result of such revocations,
the number of opt-outs for the Economic and Property Damages Settlement and the Medical Benefits Class Action Settlement is fewer than those reported figures.
Following the fairness hearing, the Economic and Property Damages Settlement was approved by the district court in a final order and judgment on 21 December 2012,
and the Medical Benefits Class Action Settlement was approved in a final order and judgment on 11 January 2013.
Subsequent to the district court’s final
order and judgment approving the Economic and Property Damages Settlement, groups of purported members of the Economic and Property Damages Settlement Class (the
Appellants) appealed from the district court’s approval of that settlement to the Fifth Circuit. Additionally, a coalition of fishing and community groups (the Coalition) appealed to the
Fifth Circuit from an order of the district court denying it permission to intervene in the civil action serving as the vehicle for the Economic and Property Damages Settlement and further denying it permission to take discovery regarding the
fairness of that settlement. On 11 November 2013, the Fifth Circuit affirmed the district court’s rulings in respect of the Coalition. On 10 January 2014, a panel of the Fifth Circuit affirmed the district court’s approval of the
Economic and Property Damages Settlement but left to another panel of the Fifth Circuit (the business economic loss panel, discussed further below) the question of how to interpret the Economic and Property Damages Settlement, including the meaning
of the causation requirements of that agreement. BP and several Appellants have filed petitions requesting that all the active judges of the Fifth Circuit review the decision to uphold approval of the settlement.
PSC settlements – Deepwater Horizon Court Supervised Settlement Program (DHCSSP) and interpretation of the Economic
and Property Damages Settlement Agreement
The DHCSSP, the claims facility operating under the framework established by
the Economic and Property Damages Settlement, commenced operation on 4 June 2012 under the oversight of Claims Administrator Patrick Juneau.
As part of its
monitoring of payments made by the court-supervised claims processes operated by the DHCSSP, BP identified multiple business economic loss claim determinations that appeared to result from an interpretation of the Economic and Property Damages
Settlement Agreement by that settlement’s claims administrator that BP believed was incorrect. This interpretation produced a higher number and value of awards than the interpretation BP used in making its initial estimate of the total cost of
the Economic and Property Damages Settlement. Pursuant to the mechanisms in the Economic and Property Damages Settlement Agreement, the claims administrator sought clarification on this matter from the district court in MDL 2179 and on 5 March
2013, the district court affirmed the claims administrator’s interpretation of the agreement and rejected BP’s position as it relates to business economic loss claims (the March Ruling).
BP appealed the district court’s March Ruling and related rulings to the Fifth Circuit. On 2 October 2013, the business economic loss panel of the Fifth Circuit
(by a 2 to 1 vote) reversed the district court’s denial of BP’s motion for a preliminary injunction and the district court’s order affirming the claims administrator’s interpretation of the settlement, remanded the case for
further proceedings and ordered the district court to enter a ’narrowly-tailored’ injunction that suspends payment to claimants affected by the misinterpretation issue and who do not have ’actual injury traceable to loss from the
Deepwater Horizon accident.’ The business economic loss panel also retained jurisdiction to review the district court’s conclusions on remand.
On
18 October 2013, the district court issued a preliminary injunction that, amongst other things, required the claims administrator to temporarily suspend payments of business economic loss claims other than those claims supported by sufficiently
matched accrual-basis accounting or any other business economic loss claim for which the claims administrator determines that the matching of revenue and expenses is not an issue. On 25 October 2013, the claims administrator provided a
declaration outlining the criteria that the claims administrator’s office will use to determine the eligibility of claims for payment. In orders dated 18 October 2013, 15 November 2013, and 22 November 2013, the district court
held that causation (i.e., whether the claims administrator could properly pay business economic loss claimants whose injuries are not traceable to the spill) was not an issue for consideration on remand. On 21 November 2013, BP filed an
emergency motion to enforce the business economic loss panel’s 2 October 2013 judgment and to enjoin any further payments to the business economic loss claimants whose injuries are not traceable to the spill. On 2 December 2013, the
business economic loss panel of the Fifth Circuit granted BP’s motion and ordered that the issue of causation again be remanded for expeditious consideration and resolution in crafting “[a] stay tailored so that those who experienced
actual injury traceable to loss from the Deepwater Horizon accident continue to receive recovery but those who did not do not receive their payments until this case is fully heard and decided
|
|
|
| 260 |
|
BP Annual Report and Form 20-F 2013 |
through the judicial process.” On 5 December 2013, the district court amended its preliminary injunction related to business economic loss claims to temporarily suspend the issuance of
final determination notices and payments of business economic loss claims, pending resolution of the business economic loss issues that are the subject of the pending remand.
On 24 December 2013, the district court ruled on the issues remanded to it by the business economic loss panel of the Fifth Circuit, ordering that the claims
administrator, in administering business economic loss claims, must match revenue with the variable expenses incurred by claimants in conducting their business, even where the revenues and expenses were recorded at different times. The district
court assigned to the claims administrator the development of more detailed matching requirements. On 12 February 2014, the claims administrator issued a draft policy addressing the matching of revenue and expenses for business economic loss claims.
The parties have made written submissions on the draft policy and the claims administrator will issue a final policy to which BP and the PSC have the right to object and seek review by the district court. As to the issue of causation, the district
court ruled that the Economic and Property Damages Settlement Agreement contained no causation requirement beyond the revenue and related tests set out in an exhibit to that agreement, and that BP was judicially estopped from arguing otherwise. The
district court also held that the absence of a further causation requirement does not defeat class certification nor invalidate the settlement under the federal class certification rule or Article III of the US Constitution. On 26 December
2013, BP filed a motion to consolidate that appeal with the related appeals pending before the business economic loss panel of the Fifth Circuit. BP subsequently filed a renewed motion for a permanent injunction that would prevent the claims
administrator from making awards to claimants whose alleged injuries are not traceable to the spill and a motion to expedite the court’s resolution of that renewed motion. On 3 March 2014, the business economic loss panel (in a 2 to 1
decision) affirmed the district court’s ruling on causation and denied BP’s motion for a permanent injunction. BP is considering its appeal options, including a potential petition that all the active judges of the Fifth Circuit
review the 3 March decision. Under the terms of the business economic loss panel’s ruling, the injunction temporarily suspending issuance of final determination notices and payments of business economic loss claims will be lifted when the
matter is transferred back to the district court; the timing of this would be affected by the status of any such petition by BP.
For more information about BP’s
current estimate of the total cost of the PSC settlements, see Financial Statements – Note 2.
PSC settlements
– investigation of the DHCSSP
On 2 July 2013, the district court in MDL 2179 appointed former federal
district court judge Louis Freeh as Special Master to lead an independent investigation of the DHCSSP in connection with allegations of potential ethical violations or misconduct within the DHCSSP. On 6 September 2013, Judge Freeh submitted a
written report to the district court in which he presented his findings that the conduct of two attorneys in the office of the claims administrator may have violated federal criminal statutes regarding fraud, money laundering, conspiracy or perjury.
In an order issued the same day, the court instructed Judge Freeh to promptly recommend, design, and test enhanced internal compliance, anti-corruption, anti-fraud and conflicts of interest policies and procedures, and assist the claims
administrator in the implementation of such policies and procedures. On 23 September 2013, BP filed a response to Judge Freeh’s report and requested that the court enter a preliminary injunction temporarily suspending all payments from the
DHCSSP until such time as improved anti-fraud and other efficiency controls are put in place at the DHCSSP to the satisfaction of Judge Freeh, the Claims Administrator, and the court. The court has not yet ruled on BP’s request for a
preliminary injunction. On 17 January 2014, Judge Freeh submitted a second written report that described the behaviour at the DHCSSP that led to the resignations of senior staff members.
PSC settlements – Seafood Compensation Fund
On 17 December 2013, BP filed a civil lawsuit in MDL 2179 against former PSC lawyer Mikal C. Watts, accusing him of having fraudulently claimed to represent more
than 40,000 deckhands who allegedly suffered economic injuries as a result of the Incident. BP’s action alleges
that BP relied on Mr. Watts’s representations when it agreed to pay $2.3 billion to the Seafood Compensation Fund (the Fund), which was established under the Economic and Property
Damages Settlement to compensate those who earn their livelihood from Gulf waters and were directly affected by the spill, and that the Economic and Property Damages Class stands to benefit unjustly from the full distribution of the money remaining
in the Fund. In addition, BP filed two motions asking the district court to suspend further distributions from the Fund and to determine the extent of the fraud and what portion, if any, of the Fund should be returned as a result. On 17 January
2014, Mr Watts filed a motion to stay the litigation pending a parallel criminal investigation and the PSC also filed a brief opposing BP’s motion seeking an injunction. On 26 February 2014, the district court granted Mr Watts’s motion to
stay the litigation and denied BP’s motion to suspend further distributions, on the basis that no further payment from the Fund is imminent. The district court deferred ruling on BP’s motion seeking to determine the extent of the fraud and
what portion, if any, of the seafood fund should be returned as a result.
State and local civil claims, including
under OPA 90
On 12 August 2010, the State of Alabama filed a lawsuit seeking damages for alleged economic and
environmental harms, including natural resource damages, civil penalties under state law, declaratory and injunctive relief, and punitive damages as a result of the Incident. On 3 March 2011, the State of Louisiana filed a lawsuit to declare
various BP entities (as well as other entities) liable for removal costs and damages, including natural resource damages under federal and state law, to recover civil penalties, attorney’s fees and response costs under state law, and to recover
for alleged negligence, nuisance, trespass, fraudulent concealment and negligent misrepresentation of material facts regarding safety procedures and BP’s (and other defendants’) ability to manage the oil spill, unjust enrichment from
economic and other damages to the State of Louisiana and its citizens, and punitive damages.
On 10 December 2010, the Mississippi Department of Environmental
Quality issued a Complaint and Notice of Violation alleging violations of several state environmental statutes.
The Louisiana Department of Environmental Quality has
issued an administrative order seeking environmental civil penalties and other relief under state law. On 23 September 2011, BP removed this matter to federal district court, and it has been consolidated with MDL 2179.
District Attorneys of 11 parishes in the State of Louisiana have filed suits under state wildlife statutes seeking penalties for damage to wildlife as a result of the
Incident. On 9 December 2011 and 28 December 2011, the district court in MDL 2179 granted BP’s motions to dismiss the District Attorneys’ complaints, holding that those claims are pre-empted by the Clean Water Act. All 11 of the
District Attorneys of parishes in the State of Louisiana filed notices of appeal. The State of Alabama’s attempt to intervene in the case was denied. Since May 2012, amicus briefs have been filed in those appeals by the states of Alabama,
Louisiana, and Mississippi. Oral argument was held on 5 March 2013 and the Fifth Circuit affirmed the district court’s ruling on 24 February 2014.
On
14 November 2011, the district court in MDL 2179 granted in part BP’s motion to dismiss the complaints filed by the states of Alabama and Louisiana. The court’s order dismissed the states’ claims brought under state law,
including claims for civil penalties and the State of Louisiana’s request for a declaratory judgment under the Louisiana Oil Spill Prevention and Response Act, holding that those claims were pre-empted by federal law. It also dismissed the
State of Louisiana’s claims of nuisance and trespass under general maritime law. The court’s order further held that the states have stated claims for negligence and products liability under general maritime law, have sufficiently alleged
presentment of their claims under OPA 90 and may seek punitive damages under general maritime law.
On 9 December 2011, the district court in MDL 2179 granted in
part BP’s motion to dismiss a master complaint brought on behalf of local government entities. The court’s order dismissed the plaintiffs’ state law claims and limited the types of maritime law claims the plaintiffs may pursue, but
also held that the plaintiffs have sufficiently alleged presentment of their claims under OPA 90 and that certain local government entity claimants may seek punitive damages under general maritime law. The court did not, however, lift an earlier
stay on the
|
|
|
|
|
| BP Annual Report and Form 20-F 2013 |
|
|
261 |
|
underlying individual complaints raising those claims or otherwise apply his dismissal of the master complaint to those individual complaints.
In January 2013, the states of Alabama, Mississippi and Florida submitted or asserted claims to BP under OPA 90 for alleged losses including economic losses and property
damage as a result of the Incident. BP is evaluating these claims. The states of Louisiana and Texas have also asserted similar claims. The amounts claimed, certain of which include punitive damages or other multipliers, are very substantial.
However, BP considers these claims unsubstantiated and the methodologies used to calculate these claims to be seriously flawed, not supported by OPA 90, not supported by documentation, and to substantially overstate the claims. Similar claims have
also been submitted by various local government entities and a foreign government. These claims under OPA 90 are substantial in aggregate, and more claims are expected to be submitted. The amounts alleged in the submissions for state and local
government claims total approximately $35 billion. BP will defend vigorously against these claims if adjudicated at trial. Certain of these states (including the states of Alabama, Florida, Texas and Mississippi, as described below) and local
government entities have filed civil lawsuits that pertain to claims asserted by them under their earlier OPA 90 submissions to BP.
In April 2013, the states of
Alabama, Florida, and Mississippi each filed new actions against BP related to the Incident, which have been consolidated with MDL 2179. On 19 April 2013, the State of Alabama filed a new action against BP alleging general maritime law claims
of negligence, gross negligence, and wilful misconduct; claims under OPA 90 seeking damages for removal costs, natural resource damages, property damage, lost tax and other revenue, and damages for providing increased public services during or after
removal activities; and various state law claims. The State of Alabama’s complaint also seeks punitive damages.
On 20 April 2013, the State of Florida
filed suit against BP and Halliburton in federal court in Florida, and its case has also been transferred to MDL 2179. Florida’s complaint alleges general maritime law claims for negligence and gross negligence; OPA 90 claims for alleged lost
tax revenue and other economic damages; and various state law claims. Florida also seeks punitive damages.
The State of Mississippi filed both federal court and
state court complaints in Mississippi against BP in April 2013. Mississippi’s federal court complaint alleges OPA 90 claims against BP, Transocean, and Anadarko for natural resource damages, property damage, lost tax revenue, and damages for
providing increased public services during or after removal activities. It asserts general maritime law claims for negligence and gross negligence against Halliburton only. Mississippi’s state court complaint alleges various state law claims,
including negligence, gross negligence, and willful misconduct. Both Mississippi complaints seek punitive damages. The State of Mississippi’s federal court action and state court action have both been consolidated with MDL 2179.
On 17 May 2013, the State of Texas filed suit against BP and others in federal court in Texas. Its complaint asserts claims under OPA 90 for natural resource damages
and lost sales tax and state park revenue; claims for natural resource damages under the Comprehensive Environmental Response, Compensation, and Liability Act (CERCLA); and claims for natural resource damages, cost recovery, civil penalties, and
economic damages under state environmental statutes. The State of Texas’s action has been consolidated with MDL 2179.
On 14 January 2014, the district
court in MDL 2179 set a briefing schedule, to be completed by 28 March 2014, for BP’s motion to strike the State of Alabama’s jury trial demand as to its claim for compensatory damages under OPA 90 which BP then filed on 14 February
2014.
On 5 March 2014, the State of Florida filed a lawsuit to declare various BP entities (and other entities) liable for removal costs and natural resource
damages.
Agreement for early natural resource restoration
On 21 April 2011, BP announced an agreement with natural resource trustees for the US and five Gulf Coast states, providing for up to $1 billion to be spent on
early restoration projects to address natural resource injuries resulting from the Incident. Funding for these projects
will come from the $20-billion trust fund. As of December 2013, BP and the trustees had reached agreement, or agreement in principle, on a total of 54 early restoration projects that are expected
to cost approximately $698 million. These include 10 projects that are already in place or under way, and 44 projects that are subject to a further regulatory review and public comment process and further trustee approval before they may proceed.
Other civil complaints
On 26 August 2011, the district court in MDL 2179 granted in part BP’s motion to dismiss a master complaint raising claims for economic loss by private
plaintiffs, dismissing the plaintiffs’ state law claims and limiting the types of maritime law claims the plaintiffs may pursue, but also held that certain classes of claimants may seek punitive damages under general maritime law. The court did
not, however, lift an earlier stay on the underlying individual complaints raising those claims or otherwise apply its dismissal of the master complaint to those individual complaints. On 30 September 2011, the court granted in part BP’s
motion to dismiss a master complaint asserting personal injury claims on behalf of persons exposed to crude oil or chemical dispersants, dismissing the plaintiffs’ state law claims, claims by seamen for punitive damages, claims for medical
monitoring damages by asymptomatic plaintiffs, claims for battery and nuisance under maritime law, and claims alleging negligence per se. As with its other rulings on motions to dismiss master complaints, the court did not lift an earlier stay on
the underlying individual complaints raising those claims or otherwise apply its dismissal of the master complaint to those individual complaints.
Citizens groups
have also filed either lawsuits or notices of intent to file lawsuits seeking civil penalties and injunctive relief under the Clean Water Act and other environmental statutes. On 16 June 2011, the district court in MDL 2179 granted BP’s
motion to dismiss a master complaint raising claims for injunctive relief under various federal environmental statutes brought by various citizens groups and others. The court did not, however, lift an earlier stay on the underlying individual
complaints raising those claims for injunctive relief or otherwise apply its dismissal of the master complaint to those individual complaints. In addition, a different set of environmental groups filed a motion to reconsider dismissal of their
Endangered Species Act claims on 14 July 2011. That motion remains pending.
On 31 January 2012, the district court in MDL 2179, on motion by the Center for
Biological Diversity, entered final judgment on the basis of the 16 June 2011 order with respect to two actions brought against BP by that plaintiff. On 2 February 2012, the Center for Biological Diversity filed a notice of appeal of both
actions to the Fifth Circuit. Following oral argument, the Fifth Circuit ruled in BP’s favour on 9 January 2013 in virtually all respects, though it remanded the Center for Biological Diversity’s claim under the Emergency Planning and
Community Right to Know Act (EPCRA) to the district court. On 22 January 2013, the Center for Biological Diversity filed a Petition for Panel Rehearing in the Fifth Circuit, which was denied on 4 February 2013. In January 2014, the
district court in MDL 2179 set a schedule for proceedings on remand of the EPCRA claim under which limited discovery is under way, after which the parties may file cross-motions for summary judgment to be fully briefed by 19 May 2014.
On 11 July 2012, BP filed motions to dismiss several categories of claims in MDL 2179 that were not covered by the Economic and Property Damages Settlement. On
1 October 2012, the court granted BP’s motion, dismissing (1) claims alleging a reduction in the value of real property caused by the oil spill or other contaminant where the property was not physically touched by the oil and the
property was not sold; (2) claims by or on behalf of entities marketing BP-branded fuels that they have suffered damages, including loss of business, income, and profits, as a result of the loss of value to the ‘BP’ brand or name; and
(3) claims by or on behalf of recreational fishermen, recreational divers, beachgoers, recreational boaters, and similar claimants, that they have suffered damages that include loss of enjoyment of life from the inability to use of the Gulf of
Mexico for recreation and amusement purposes. The judge did not, however, lift an earlier stay on the underlying individual complaints raising those claims or otherwise apply his dismissal of those categories of claims to those individual
complaints. This order was appealed to the Fifth Circuit, but the appeal was ultimately dismissed on 14 May 2013 for lack of jurisdiction.
|
|
|
| 262 |
|
BP Annual Report and Form 20-F 2013 |
Halliburton lawsuits
On 19 April 2011, Halliburton filed a lawsuit in Texas state court seeking indemnification from BPXP for certain tort and pollution-related liabilities resulting
from the Incident. On 3 May 2011, BPXP removed Halliburton’s case to federal court, and on 9 August 2011, the action was transferred to MDL 2179.
On
1 September 2011, Halliburton filed an additional lawsuit against BP in Texas state court alleging that BP did not identify the existence of a purported hydrocarbon zone at the Macondo well to Halliburton in connection with Halliburton’s
cement work performed before the Incident and that BP has concealed the existence of this purported hydrocarbon zone following the Incident. Halliburton claims that the alleged failure to identify this information has harmed its business ventures
and reputation and resulted in lost profits and other damages. On 7 February 2012, the lawsuit was transferred to MDL 2179.
RICO lawsuits
BP has been named in several lawsuits alleging claims under the
Racketeer-Influenced and Corrupt Organizations Act (RICO). On 15 July 2011, the district court granted BP’s motion to dismiss a master complaint raising RICO claims against BP. The court’s order dismissed the claims of the plaintiffs
in four RICO cases encompassed by the master complaint.
Non-US government lawsuits
On 15 September 2010, three Mexican states bordering the Gulf of Mexico (Veracruz, Quintana Roo, and Tamaulipas) filed
lawsuits in federal court in Texas against several BP entities. These lawsuits were subsequently transferred to MDL 2179 on 4 November 2010. These lawsuits allege that the Incident harmed their tourism, fishing, and commercial shipping
industries (resulting in, among other things, diminished tax revenue), damaged natural resources and the environment, and caused the states to incur expenses in preparing a response to the Incident. On 9 December 2011, the district court in MDL
2179 granted in part BP’s motion to dismiss the three Mexican states’ complaints, dismissing their claims under OPA 90 and for nuisance and negligence per se, and preserving their claims for negligence and gross negligence only to the
extent there has been a physical injury to a proprietary interest of the states. BP, other defendants and the three Mexican states filed cross-motions for summary judgment on 4 January 2013 on the issue of whether the Mexican states have a
proprietary interest in the matters asserted in their complaints. The district court heard oral argument on the cross-motions on 27 June 2013, and on 6 September 2013 the court granted defendants’ motions. On 12 September 2013,
the court issued a final judgment dismissing the three Mexican states’ claims with prejudice. On 4 October 2013, the three Mexican states filed notices of appeal from the judgment to the Fifth Circuit. The Mexican states’ opening
brief in the appeal is due on 31 March 2014.
On 5 April 2011, the State of Yucatan submitted a claim to the Gulf Coast Claims Facility (GCCF) alleging
potential damage to its natural resources and environment, and seeking to recover the cost of assessing the alleged damage. On 18 September 2013, the State of Yucatan filed suit against BP in federal court in Florida, and, on 13 December
2013, its action was transferred to MDL 2179.
On 19 April 2013, the Mexican federal government filed a civil action against BP and others in MDL 2179. The
complaint seeks a determination that each defendant bears liability under OPA 90 for damages that include the costs of responding to the spill; natural resource damages allegedly recoverable by Mexico as an OPA 90 trustee; and the net loss of taxes,
royalties, fees, or net profits.
Insurance-related matters
On 1 March 2012, the district court in MDL 2179 issued a partial final judgment dismissing with prejudice certain claims by BP, Anadarko and MOEX for additional
insured coverage under insurance policies issued to Transocean for the sub-surface pollution liabilities BP, Anadarko and MOEX have incurred and will incur with respect to the Macondo well oil release. BP filed a notice of appeal from the district
court’s judgment to the Fifth Circuit and on 1 March 2013, the Fifth Circuit reversed the district court’s judgment, rejecting the district court’s ruling that the insurance that BP is entitled to receive as an additional insured
under the Transocean insurance policies at issue is limited to the scope of the
indemnity in the drilling contract between BP and Transocean. On 29 August 2013, the Fifth Circuit withdrew its 1 March 2013 opinion and certified two questions of Texas law at issue in
the appeal to the Supreme Court of Texas. The Supreme Court of Texas accepted the certification. Briefing is expected to be completed on 10 March 2014, and oral argument has not yet been scheduled.
False Claims Act actions
BP is aware that actions have been or may be brought under the Qui Tam (whistle-blower) provisions of the False Claims Act (FCA). On 17 December 2012, the court
ordered unsealed one complaint that had been filed in the US District Court for the Eastern District of Louisiana by an individual under the FCA’s Qui Tam provisions. The complaint alleged that BP and another defendant had made false reports
and certifications of the amount of oil released into the Gulf of Mexico following the Incident. On 17 December 2012, the DoJ filed with the court a notice that the DoJ elected to decline to intervene in the action. On 31 January 2013, the
complaint was transferred to MDL 2179 and remains stayed.
MDL 2185 and other securities-related litigation
Since the Incident, shareholders have sued BP and various of its current and former officers and directors asserting shareholder derivative claims and class and
individual claims. Many of these lawsuits have been consolidated or co-ordinated in federal district court in Houston (MDL 2185).
Shareholder derivative litigation
Shareholder derivative lawsuits related to
the Incident have been filed in US federal and state courts against various current and former officers and directors of BP alleging, among other things, breach of fiduciary duty, gross mismanagement, abuse of control and waste of corporate assets.
On 15 September 2011, the district court in MDL 2185 granted BP’s motion to dismiss the pending consolidated shareholder derivative litigation on the grounds that the courts of England are the appropriate forum for the litigation. On
8 December 2011, a final judgment was entered dismissing the shareholder derivative case and, on 3 January 2012, one of the derivative plaintiffs filed a notice of appeal to the Fifth Circuit. On 16 January 2013, the Fifth Circuit
affirmed dismissal of the action. All of the state court derivative actions have been dismissed based on the final outcome of the federal case.
Securities class action
On 13 February 2012, the district court in MDL
2185 issued two decisions on the defendants’ motions to dismiss the two consolidated securities fraud complaints filed on behalf of purported classes of BP ordinary shareholders and ADS holders. The court dismissed all of the claims of the
ordinary shareholders, dismissed the claims of the lead class of ADS holders against most of the individual defendants while holding that a subset of the claims against two individual defendants and the corporate defendants could proceed, and
dismissed all of the claims of a smaller purported subclass with leave to re-plead in 20 days. On 2 April 2012, the plaintiffs in the lead class and subclass filed an amended consolidated complaint with claims based on (1) the 12 alleged
misstatements that the court held were actionable in its February 2012 order on BP’s motion to dismiss the earlier complaints; and (2) 13 alleged misstatements concerning BP’s operating management system that the judge either rejected
with leave to re-plead or did not address in his February decisions. On 2 May 2012, defendants moved to dismiss the claims based on the 13 statements in the amended complaint that the judge did not already rule are actionable. On
6 February 2013, the court granted in part this motion to dismiss, rejecting the plaintiffs’ claims based on 10 of the 17 statements at issue in the motion and also dismissing all claims against former BP employee Andrew Inglis. On
6 December 2013, the court denied the plaintiffs’ motion for class certification and gave the plaintiffs 30 days to renew that motion, and the plaintiffs renewed their motion on 6 January 2014. Briefing on the plaintiffs’ renewed
motion is scheduled to complete on 10 March 2014 and a hearing on this motion is scheduled for 21 April 2014. On 20 December 2013, the court revised the schedule for the action and set a trial date for 14 October 2014.
Individual securities litigation
In April and May 2012, six cases (three of which were consolidated into one action) were filed in state and federal courts by one or more state, county or municipal
pension funds against BP entities and several current
|
|
|
|
|
| BP Annual Report and Form 20-F 2013 |
|
|
263 |
|
and former officers and directors seeking damages for alleged losses those funds suffered because of their purchases of BP ordinary shares and, in two cases, ADSs. The funds assert various state
law and federal law claims. From July 2012 to November 2013, 14 additional cases were filed in Texas state and federal courts (later consolidated into 11 actions) by pension or investment funds or advisers against BP entities and current and former
officers and directors, asserting state law and other claims and seeking damages for alleged losses that those funds suffered because of their purchases of BP ordinary shares and/or ADSs, and one case was filed in New York federal court by funds
that purchased BP ordinary shares and ADSs, asserting state and federal law claims. All of the cases have been transferred to federal court in Houston and, with the exception of one case that has been stayed, the judge presiding over MDL 2185. One
case was voluntarily dismissed on 9 May 2013. On 3 October 2013, the judge granted in part and denied in part the defendants’ motion to dismiss three of the remaining 14 cases. A subset of the claims was dismissed. The judge held
that English law governs the plaintiffs’ remaining claims (with the exception of the federal law claims based on purchases of ADSs and a potential claim under Ohio state law against BP p.l.c. by certain Ohio funds). On 11 December 2013,
defendants moved to dismiss 10 of the remaining cases and answered the complaints in two others. On 5 December 2013, the Ohio funds filed an amended complaint withdrawing their English law claim and asserting only a claim under Ohio state law.
On 6 January 2014, BP moved to dismiss that case.
Canadian class action
On 20 July 2012, a BP entity received an amended statement of claim for an action in Alberta, Canada, filed by three plaintiffs seeking to assert claims
under Canadian law against BP on behalf of a class of Canadian residents who allegedly suffered losses because of their purchase of BP ordinary shares and ADSs. This case was dismissed on jurisdictional grounds on 14 November 2012. On
15 November 2012, one of the plaintiffs re-filed a statement of claim against BP in Ontario, Canada, seeking to assert the same claims under Canadian law against BP on behalf of a class of Canadian residents. BP moved to dismiss that action for
lack of jurisdiction, and on 9 October 2013 the Ontario court denied BP’s motion. On 7 November 2013, BP filed a notice of appeal from that decision, and filed its papers on that appeal on 19 December 2013; argument is scheduled
for 24 June 2014.
Dividend-related proceedings
On 5 July 2012, the district court in MDL 2185 issued a decision granting BP’s motion to dismiss, for lack of personal jurisdiction, the lawsuit against BP
p.l.c. for cancelling its dividend payment in June 2010. On 10 August 2012, the plaintiffs filed an amended complaint, which BP moved to dismiss on 9 October 2012. On 12 April 2013, the court granted BP’s motion and dismissed the
lawsuit for lack of personal jurisdiction and on the alternative grounds of failure to state a claim and that the courts of England are the more appropriate forum for the litigation. On 16 June 2013, the court granted the plaintiff’s
motion to amend its decision so as to eliminate the alternative grounds for dismissal. On 22 November 2013, the plaintiffs filed a new and substantially identical action against BP p.l.c. in federal court in New York, which was transferred to
the judge presiding over MDL 2185. BP p.l.c. moved to dismiss that new action on 19 February 2014.
ERISA
On 30 March 2012, the district court in MDL 2185 issued a decision granting the defendants’ motions to dismiss the ERISA
case related to BP share funds in several employee benefit savings plans. On 11 April 2012, the plaintiffs requested leave to file an amended complaint, which was denied on 27 August 2012. Final judgment dismissing the case was entered on
4 September 2012 and, on 25 September 2012, the plaintiffs filed a notice of appeal to the Fifth Circuit. That appeal was fully briefed as of 21 June 2013 and oral argument was held on 4 November 2013, but no ruling has yet been
issued.
Settlements with the DoJ and SEC
On
1 June 2010, the DoJ announced that it was conducting an investigation into the Incident encompassing possible violations of US civil or criminal laws, and subsequently created a unified task force of federal agencies to investigate the
Incident. On 15 November 2012, BP announced that it reached agreement with the US government, subject
to court approval, to resolve all federal criminal charges and all claims by the SEC against BP arising from the Deepwater Horizon accident, oil spill and response.
On 29 January 2013, the US District Court for the Eastern District of Louisiana accepted BP’s pleas regarding the federal criminal charges, and BP was sentenced
in connection with the criminal plea agreement. BP pleaded guilty to 11 felony counts of Misconduct or Neglect of Ships Officers relating to the loss of 11 lives; one misdemeanour count under the Clean Water Act; one misdemeanour count under the
Migratory Bird Treaty Act; and one felony count of obstruction of Congress.
Pursuant to that sentence, BP will pay $4 billion, including $1,256 million in criminal
fines, in instalments over a period of five years. Under the terms of the criminal plea agreement, a total of $2,394 million will be paid to the National Fish & Wildlife Foundation (NFWF) over a period of five years. In addition, $350
million will be paid to the National Academy of Sciences (NAS) over a period of five years. BP made its required payments that were due by 30 March and 29 April 2013 and 29 January 2014, totalling $926 million. The next scheduled payments
under the plea agreement total $595 million and are due by 29 January 2015.
The court also ordered, as previously agreed with the US government, that BP serve a
term of five years’ probation. Pursuant to the terms of the plea agreement, the court also ordered certain equitable relief, including additional actions, enforceable by the court, to further enhance the safety of drilling operations in the
Gulf of Mexico. These requirements relate to BP’s risk management processes, such as third-party auditing and verification, BP’s oil spill response plan, training, and well control equipment and processes such as blowout preventers and
cementing. BP has also agreed to maintain a real-time drilling operations monitoring centre in Houston or another appropriate location. In addition, BP will undertake several initiatives with academia and regulators to develop new technologies
related to deepwater drilling safety. The resolution also provides for the appointment of two monitors, both with terms of up to four years. A process safety monitor will review, and provide recommendations concerning BPXP’s process safety and
risk management procedures for deepwater drilling in the Gulf of Mexico. An ethics monitor will review and provide recommendations concerning BP’s ethics and compliance programme. BP has also agreed to retain an independent third-party auditor
who will review and report to the probation officer, the DoJ and BP regarding BPXP’s compliance with the key terms of the plea agreement including the completion of safety and environmental management systems audits, operational oversight
enhancements, oil spill response training and drills and the implementation of best practices. Under the plea agreement, BP has also agreed to co-operate in ongoing criminal actions and investigations, including prosecutions of four former employees
who have been separately charged.
In its resolution with the SEC, BP has resolved the SEC’s Deepwater Horizon-related claims against the company under Sections
10(b) and 13(a) of the Securities Exchange Act of 1934 and the associated rules. BP has agreed to a civil penalty of $525 million, payable in three instalments over a period of three years, and has consented to the entry of an injunction prohibiting
it from violating certain US securities laws and regulations. The SEC’s claims are premised on oil flow rate estimates contained in three reports provided by BP to the SEC during a one-week period (on 29 and 30 April 2010 and 4 May
2010), within the first 14 days after the accident. BP’s consent was incorporated in a final judgment and court order on 10 December 2012, and BP made its first payment of $175 million on 11 December 2012 and its second payment of
$175 million on 1 August 2013. The final instalment of $175 million, plus accrued interest, is due on 1 August 2014.
BP’s November 2012 agreement
with the US government does not resolve the DoJ’s civil claims, such as claims for civil penalties under the Clean Water Act or claims for natural resource damages under OPA 90. Neither does it resolve the private securities claims pending in
MDL 2185.
US Environmental Protection Agency matters
On 28 November 2012, the US Environmental Protection Agency (EPA) notified BP that it had temporarily suspended BP p.l.c., BPXP and a number of other BP subsidiaries
from participating in new federal
|
|
|
| 264 |
|
BP Annual Report and Form 20-F 2013 |
contracts. As a result of the temporary suspension, the BP entities listed in the notice are ineligible to receive any US government contracts either through the award of a new contract, or the
extension of the term of or renewal of an expiring contract. The suspension does not affect existing contracts the company has with the US government, including those relating to current and ongoing drilling and production operations in the Gulf of
Mexico.
The charges to which BPXP pleaded guilty included one misdemeanour count under the Clean Water Act that, by operation of law following the court’s
acceptance of BPXP’s plea, triggers a statutory debarment, also referred to as mandatory debarment, of the facility where the Clean Water Act violation occurred. On 1 February 2013, the EPA issued a notice that BPXP was mandatorily
debarred at its Houston headquarters. Mandatory debarment prevents a company from entering into new contracts or new leases with the US government that would be performed at the facility where the Clean Water Act violation occurred. A mandatory
debarment does not affect any existing contracts or leases a company has with the US government and will remain in place until such time as the debarment is lifted through an agreement with the EPA or the EPA decides to lift the debarment.
On 15 February 2013, BP filed an administrative challenge with the EPA seeking to lift the 28 November 2012 suspension of 22 BP entities and the 1 February
2013 mandatory debarment of BPXP at its Houston headquarters. On 19 July 2013, the EPA affirmed its suspension and mandatory debarment decisions. BP maintains that the EPA’s actions do not have an adequate legal basis and do not reflect
BP’s present status as a responsible government contractor. On 12 August 2013, BP filed a lawsuit in the US District Court for the Southern District of Texas (the Texas District Court) challenging the EPA’s suspension and mandatory
debarment decisions. On 25 November 2013, BP filed a motion for summary judgment on its claims in the Texas District Court. The UK government and a coalition of major trade and business groups led by the American Petroleum Institute later filed
friend of the court (amicus) briefs supporting BP’s position. On 28 January 2014, the EPA filed a motion for summary judgment in the Texas District Court. Both motions remain pending with briefing scheduled to be completed by 14 March
2014.
On 26 November 2013, the EPA issued a Notice of Continued Suspensions and Proposed Debarments that continued the suspensions of the previously suspended
BP entities, suspended two new BP entities (BP Alternative Energy and BP Pipelines (Alaska) Inc.), and proposed discretionary debarment of all suspended BP entities.
BP continues to work with the EPA in preparing an administrative agreement to resolve these suspension and debarment issues.
US Department of Interior matters
On 14 September
2011, the US Coast Guard and Bureau of Ocean Energy Management, Regulation and Enforcement (BOEMRE) issued a report regarding the causes of the 20 April 2010 Macondo well blowout (the BOEMRE Report). The BOEMRE Report states that decisions by
BP, Halliburton and Transocean increased the risk or failed to fully consider or mitigate the risk of a blowout on 20 April 2010. The BOEMRE Report also states that BP, Transocean and Halliburton violated certain regulations related to offshore
drilling. In itself, the BOEMRE Report does not constitute the initiation of enforcement proceedings relating to any violation. On 12 October 2011, the US Department of the Interior Bureau of Safety and Environmental Enforcement issued to BPXP,
Transocean, and Halliburton Notification of Incidents of Noncompliance (INCs). The notification issued to BPXP is for a number of alleged regulatory violations concerning Macondo well operations. The Department of Interior has indicated that this
list of violations may be supplemented as additional evidence is reviewed, and on 7 December 2011, the Bureau of Safety and Environmental Enforcement issued to BPXP a second INC. This notification was issued to BP for five alleged violations
related to drilling and abandonment operations at the Macondo well. BP has filed an administrative appeal with respect to the first and second INCs. BP has filed a joint stay of proceedings with the Department of Interior with respect to both INCs.
Louisiana Department of Natural Resources
On
21 August 2013, the Louisiana Department of Natural Resources (LDNR) issued a Cease and Desist Order (the Order) directing BP to apply
for a Coastal Use Permit to remove certain ’orphan’ anchors that had been placed in coastal waters to secure containment boom during oil spill response operations in 2010. On
6 September 2013, BP sent a letter to the LDNR observing that the Order is pre-empted by federal law and would require the consent of the Federal On-Scene Coordinator following a net environmental benefits analysis. BP has requested that the
LDNR withdraw the Order or initiate a judicial hearing. The LDNR has yet to withdraw the Order or initiate a judicial hearing, but responded on 17 September 2013 that the Order will not take effect unless and until the LDNR assesses costs or
penalties or files a lawsuit. On 18 September 2013, BP filed a complaint in the US District Court for the Middle District of Louisiana seeking to enjoin the State of Louisiana from enforcing the Order on grounds of federal pre-emption. The LDNR
moved to dismiss BP’s complaint on 5 November 2013, and BP filed a motion for summary judgment on 18 December 2013. Briefing on the motions is now complete.
Non-US lawsuits
Mexico
On 18 October 2012, before a Mexican Federal District Court
located in Mexico City, a class action complaint was filed against BPXP, BP America Production Company, and other BP subsidiaries. The plaintiffs, consisting of fishermen and other groups, are seeking, among other things, compensatory damages for
the class members who allegedly suffered economic losses, as well as an order requiring BP to remediate environmental damage resulting from the Incident, to provide funding for the preservation of the environment and to conduct environmental impact
studies in the Gulf of Mexico for the next 10 years. The plaintiffs did not properly serve the BP entities named as defendants and, on 20 January 2014, the plaintiffs voluntarily dismissed their action.
Ecuador
A claim was commenced against BP by a group of claimants on 26 July 2012 in Ecuador. The majority of the claimants represent local NGOs. The claim alleges that
through the Incident and BP’s response to it, BP violated the ’rights of nature’. The claim is not monetary but rather seeks injunctive relief. Two previous claims on identical grounds were dismissed at an early stage by the
Ecuadorian courts. On 3 December 2012, the Ecuadorian court of first instance dismissed the claim. On 7 December 2012, the claimants filed a timely notice of appeal to the Ecuadorian court of second instance. On 28 February 2013, the
court affirmed the dismissal by the lower court.
Pending investigations and reports relating to the Deepwater Horizon oil spill
CSB investigation
The US Chemical Safety and Hazard Investigation Board (CSB) is conducting an investigation of the Incident that is focused on the explosions and fire, and not the
resulting oil spill or response efforts. As part of this effort, on 24 July 2012, the CSB conducted a hearing at which it released its preliminary findings on, among other things, the use of safety indicators by industry (including BP and
Transocean) and government regulators in offshore operations prior to the Incident. On 30 March 2013, a ruling was issued in the CSB’s pending enforcement action against Transocean in federal district court in the Southern District of
Texas holding that the CSB has jurisdiction to investigate the Incident and its subpoenas are valid and enforceable. On 3 May 2013, Transocean appealed to the Fifth Circuit, the district court’s ruling that the CSB has jurisdiction. That appeal
is currently pending. On 20 June 2013, the CSB sent BP a letter stating that BP must comply with the outstanding document subpoenas. BP is producing documents in compliance with the CSB’s document subpoenas. Separately the CSB has
announced that it may issue its reports in this matter in 2014. The CSB may seek to recommend improvements to BP and industry practices and to regulatory programmes to prevent recurrence and mitigate potential consequences.
National Academy of Engineering/National Research Council report
A Committee of the National Academy of Engineering/National Research Council that had been reviewing methods for assessing impacts on natural resources issued its final
report on 10 July 2013. The report endorses use of an ‘ecosystems services approach,’ and discusses additional data, models, research, and analysis that potentially would be needed in order to apply the approach to the Deepwater
Horizon oil spill.
|
|
|
|
|
| BP Annual Report and Form 20-F 2013 |
|
|
265 |
|
Other legal proceedings
FERC and CFTC matters
The US Federal Energy Regulatory
Commission (FERC) and the US Commodity Futures Trading Commission (CFTC) have been investigating several BP entities regarding trading in the next-day natural gas market at Houston Ship Channel during September, October and November 2008. The
FERC Office of Enforcement staff notified BP on 12 November 2010 of their preliminary conclusions relating to alleged market manipulation in violation of 18 C.F.R. Sec. 1c.1. On 30 November 2010, CFTC Enforcement staff also provided BP
with a notice of intent to recommend charges based on the same conduct alleging that BP engaged in attempted market manipulation in violation of Section 6(c), 6(d), and 9(a)(2) of the Commodity Exchange Act. On 23 December 2010, BP
submitted responses to the FERC and CFTC November 2010 notices providing a detailed response that it did not engage in any inappropriate or unlawful activity. On 28 July 2011, FERC staff issued a Notice of Alleged Violations stating that it had
preliminarily determined that several BP entities fraudulently traded physical natural gas in the Houston Ship Channel and Katy markets and trading points to increase the value of their financial swing spread positions. On 5 August 2013, the
FERC issued an Order to Show Cause and Notice of Proposed Penalty directing BP to respond to a FERC Enforcement Staff report, which FERC issued on the same day, alleging that BP manipulated the next-day, fixed price gas market at Houston Ship
Channel from mid-September 2008 to 30 November 2008. The FERC Enforcement Staff report proposes a civil penalty of $28 million and the surrender of $800,000 of alleged profits. BP filed its answer on 4 October 2013 denying the allegations
and moving for dismissal.
CSB matters
On
23 March 2005, an explosion and fire occurred at the Texas City refinery. Fifteen workers died in the incident and many others were injured. BP Products North America, Inc. (BP Products) has resolved all civil injury claims and all civil and
criminal governmental claims arising from the March 2005 incident. In March 2007, the US Chemical Safety and Hazard Investigation Board (CSB) issued a report on the incident. The report contained recommendations to the Texas City refinery and to the
board of directors of BP. To date, the CSB has accepted that the majority of BP’s responses to its recommendations have been satisfactorily addressed. BP and the CSB are continuing to discuss the remaining open recommendations with the
objective of the CSB agreeing to accept these as satisfactorily addressed as well.
OSHA matters
On 29 October 2009, the US Occupational Safety and Health Administration (OSHA) issued citations to the Texas City refinery related to the Process Safety Management
(PSM) Standard. On 12 July 2012, OSHA and BP resolved 409 of the 439 citations. The agreement required that BP pay a civil penalty of $13,027,000 and that BP abate the alleged violations by 31 December 2012. BP completed these requirements
and the agreement has terminated. The settlement excluded 30 citations for which BP and OSHA could not reach agreement. However, the parties
agreed that BP’s
penalty liability will not exceed $1 million if those citations are resolved through litigation. On 4 March 2014, the parties reached agreement in relation to the remaining Texas City citations. The agreement, which is subject to approval by an
Administrative Law Judge from the OSH Review Commission, links the outcome of the remaining Texas City citations to the ultimate outcome of the remaining Toledo citations (see below). If the 31 July 2013 decision of the Administrative Law Judge in
relation to the remaining Toledo citations is ultimately upheld, OSHA has agreed to dismiss the remaining Texas City citations. If the 31 July 2013 decision is ultimately overturned, BP has agreed to pay a penalty not exceeding $1 million to resolve
the remaining Texas City citations.
On 8 March 2010, OSHA issued 65 citations to BP Products and BP-Husky for alleged violations of the PSM Standard at the
Toledo refinery, with penalties of approximately $3 million. These citations resulted from an inspection conducted pursuant to OSHA’s Petroleum Refinery Process Safety Management National Emphasis Program. Both BP Products and BP-Husky
contested the citations. The parties resolved 23 citations in a pre-trial settlement for an aggregate amount of $45,000. A trial of the remaining 42 citations was completed in June 2012 before an Administrative Law Judge from the OSH Review
Commission. The
Administrative Law Judge rendered her decision on 31 July 2013. Of the 42 remaining citations, OSHA voluntarily dismissed one of them and the judge vacated 36 additional citations. The
remaining five citations were downgraded and assessed an aggregate penalty of $35,000. In addition, the judge accepted the parties’ pre-trial settlement of the 23 citations. As a result of the settlement and the judge’s decision, the total
penalty in respect of the citations was reduced from the original amount of approximately $3 million to $80,000. The Review Commission has granted OSHA’s petition for review with briefing scheduled to be completed in the first half of 2014. The
Review Commission is not expected to issue its decision until 2015.
Texas City flaring event
A flaring event occurred at the Texas City refinery in April and May 2010. This flaring event is the subject of civil lawsuit claims for personal injury and, in some
cases, property damage by roughly 50,000 individuals. These lawsuit claims have been consolidated in a Texas multi-district litigation proceeding in Galveston, Texas. The first trial in the matter began in September 2013 and was completed in October
2013. Of the six plaintiffs initially scheduled for trial, two filed nonsuits before trial, the claims of one plaintiff were dismissed by the court on directed verdict, and the jury awarded no damages to the remaining three plaintiffs. The second
trial in the matter is scheduled to begin on 15 September 2014. In addition, this flaring event and other refinery emissions from December 2008 through to 2010 were the subject of a purported class action, on behalf of some local residential
property owners, filed in US federal district court in Galveston. The court denied the plaintiffs’ class certification motion on 2 October 2013, and the plaintiffs dismissed their complaint on 4 December 2013. The flares involved in
this event are also the subject of a federal government enforcement action. BP retained these liabilities when it sold the Texas City refinery.
Prudhoe Bay leak
In March and August 2006, oil leaked
from oil transit pipelines operated by BP Exploration (Alaska) Inc. (BPXA) at the Prudhoe Bay unit on the North Slope of Alaska. On 12 May 2008, a BP p.l.c. shareholder filed a consolidated complaint alleging violations of federal securities
law on behalf of a putative class of BP p.l.c. shareholders against BP p.l.c., BPXA, BP America Inc., and four officers of the companies, based on alleged misrepresentations concerning the integrity of the Prudhoe Bay pipeline before its shutdown on
6 August 2006. On 8 February 2010, the US Court of Appeals for the Ninth Circuit (the Ninth Circuit) accepted BP’s appeal from a decision of the lower court granting in part and denying in part BP’s motion to dismiss the lawsuit.
On 29 June 2011, the Ninth Circuit ruled in BP’s favour that the filing of a trust-related agreement with the SEC containing contractual obligations on the part of BP was not a misrepresentation which violated federal securities laws. The
BP p.l.c. shareholder filed an amended complaint, in response to which BP filed a new motion to dismiss, which was granted by the trial court on 14 March 2012. The plaintiff appealed the court’s dismissal of the case, and on
13 February 2014 the Ninth Circuit affirmed in part and reversed in part, ruling that claims based on four alleged misrepresentations should not have been dismissed. The case has been remanded to the trial court for further proceedings.
Exxon Valdez matters
Approximately 200 lawsuits were
filed in state and federal courts in Alaska seeking compensatory and punitive damages arising out of the Exxon Valdez oil spill in Prince William Sound in March 1989. Most of those suits named Exxon (now ExxonMobil), Alyeska Pipeline Service Company
(Alyeska), which operates the oil terminal at Valdez, and the other oil companies that own Alyeska. Alyeska initially responded to the spill until the response was taken over by Exxon. BP owns a 46.9% interest (reduced during 2001 from 50% by a sale
of 3.1% to Phillips) in Alyeska through a subsidiary of BP America Inc. and briefly indirectly owned a further 20% interest in Alyeska following BP’s combination with Atlantic Richfield. Alyeska and its owners have settled all the claims
against them under these lawsuits. Exxon has indicated that it may file a claim for contribution against Alyeska for a portion of the costs and damages that it has incurred. If any claims are asserted by Exxon that affect Alyeska and its owners, BP
will defend the claims vigorously.
Lead paint matters
Since 1987, Atlantic Richfield Company (Atlantic Richfield), a subsidiary of BP, has been named as a co-defendant in numerous lawsuits brought in
|
|
|
| 266 |
|
BP Annual Report and Form 20-F 2013 |
the US alleging injury to persons and property caused by lead pigment in paint. The majority of the lawsuits have been abandoned or dismissed against Atlantic Richfield. Atlantic Richfield is
named in these lawsuits as alleged successor to International Smelting and Refining and another company that manufactured lead pigment during the period 1920-1946. The plaintiffs include individuals and governmental entities. Several of the lawsuits
purport to be class actions. The lawsuits seek various remedies including compensation to lead-poisoned children, cost to find and remove lead paint from buildings, medical monitoring and screening programmes, public warning and education of lead
hazards, reimbursement of government healthcare costs and special education for lead-poisoned citizens and punitive damages. No lawsuit against Atlantic Richfield has been settled nor has Atlantic Richfield been subject to a final adverse judgment
in any proceeding. The amounts claimed and, if such suits were successful, the costs of implementing the remedies sought in the various cases could be substantial. While it is not possible to predict the outcome of these legal actions, Atlantic
Richfield believes that it has valid defences. It intends to defend such actions vigorously and believes that the incurrence of liability is remote. Consequently, BP believes that the impact of these lawsuits on the group’s results, financial
position or liquidity will not be material.
Abbott Atlantis related matters
In April 2009, Kenneth Abbott, as relator, filed a US False Claims Act lawsuit against BP, alleging that BP violated federal regulations, and made false statements in
connection with its compliance with those regulations, by failing to have necessary documentation for the Atlantis subsea and other systems. BP is the operator and 56% interest owner of the Atlantis unit in production in the Gulf of Mexico. That
complaint was unsealed in May 2010 and served on BP in June 2010. Abbott seeks damages measured by the value, net of royalties, of all past and future production from the Atlantis platform, trebled, plus penalties. In September 2010, Kenneth Abbott
and Food & Water Watch filed an amended complaint in the False Claims Act lawsuit seeking an injunction shutting down the Atlantis platform. The court denied BP’s motion to dismiss the complaint in March 2011. Separately, also in March
2011, BOEMRE issued its investigation report of the Abbott Atlantis allegations, which concluded that Kenneth Abbott’s allegations that Atlantis operations personnel lacked access to critical, engineer-approved drawings were without merit and
that his allegations about false submissions by BP to BOEMRE were unfounded. Trial was scheduled to begin on 10 April 2012, but the trial date was vacated and not rescheduled pending consideration of the parties’ summary judgment motions.
Clean Air Act matters
On 1 February 2013,
Marathon Petroleum Company LP (Marathon) purchased the Texas City refinery from BP Products and directed BP Products to transfer the refinery to Blanchard Refining Company LLC (Blanchard). On 4 November 2013, BP Products, Blanchard and the EPA
reached an agreement to settle certain alleged Clean Air Act violations at the Texas City refinery. Pursuant to the settlement BP Products paid a civil penalty of $950,000 and Blanchard agreed to undertake certain injunctive relief.
BP Products has also been in discussions with the EPA regarding alleged CAA violations at the Toledo refinery and the EPA has alleged certain CAA violations at the Cherry
Point refinery and the Carson refinery (which BP Products sold to Tesoro Corporation on 1 June 2013).
Bolivia
On 24 January 2012, the Republic of Bolivia issued a press statement declaring its intent to nationalize Pan American Energy’s (PAE) interests in the Caipipendi
Operations Contract. No formal decision has been issued or announced by the government, and no nationalization process has commenced. In October 2013, in a public speech the President of Bolivia made remarks in connection with PAE’s arbitration
case for compensation for expropriation of its shares in Empresa Petrolera Chaco S.A. (Chaco). PAE and its shareholders BP and Bridas intend to vigorously defend their legal interests under the Caipipendi Operations Contract and in relation to the
arbitration case relating to the expropriation of the PAE shares in Chaco. That arbitration was filed in March 2012 and jurisdiction has been confirmed by the tribunal. The case is due to proceed. PAE has reiterated its willingness to negotiate on
the Chaco compensation claim
and in December 2013 there was an agreement in principle to explore settlement options with the Bolivian government. Such proposals are being evaluated.
EC investigation and related matters
On 14 May 2013,
European Commission officials made a series of unannounced inspections at the offices of BP and other companies involved in the oil industry acting on concerns that anticompetitive practices may have occurred in connection with oil price reporting
practices and the reference price assessment process. Such inspections are a preliminary step in investigations. There is no deadline for the completion of the inquiries. Related inquiries and requests for information have also been received from US
and other regulators following the European Commission’s actions. On 25 June 2013, the Federal Trade Commission (FTC) served BP with a Request for Voluntary Submission of Documents and Information regarding its non-public investigation
into whether or not Shell, BP or Statoil have engaged in unfair methods of competition or manipulative or deceptive conduct. BP is producing documents to the FTC. In June 2013, BP received an initial request for information from the Japanese Fair
Trade Commission. In December 2013, the Korea Fair Trade Commission initiated an investigation and a first information request is expected to be issued. On 16 January 2014, the U.S. Commodity Futures Trading Commission requested price
reporting documents from BP.
In addition, fifteen purported class actions related to these matters have been filed in US District Courts alleging manipulation and
antitrust violations under the Commodity Exchange Act and US antitrust laws, and these purported class actions have been consolidated in federal court in New York.
Further note on certain activities
During the period covered by this report,
non-US subsidiaries or other non-US entities of BP conducted limited activities in, or with persons from, certain countries identified by the US Department of State as State Sponsors of Terrorism or otherwise subject to US sanctions
(‘Sanctioned Countries’). These activities continue to be insignificant to the group’s financial condition and results of operations. BP monitors its activities with Sanctioned Countries and persons from Sanctioned Countries and seeks
to comply with applicable sanctions laws and regulations.
Both the US and the EU have enacted strong sanctions against Iran, including: in the US, sanctions against
persons involved with Iran’s energy, shipping and petrochemicals industries, and sanctions against financial institutions that engage in significant transactions with the Iran Central Bank; and in the EU, a prohibition on the import, purchase
and transport of Iranian-origin crude oil, petroleum products and natural gas. In addition, in August 2012, US President Obama signed into law the Iran Threat Reduction and Syria Human Rights Act of 2012 (‘ITRA’), which, among other
things, added a new Section 13(r) to the Securities Exchange Act of 1934, as amended (the ‘Exchange Act’) and requires issuers that must file annual or quarterly reports under the Exchange Act to disclose in such reports whether,
during the period covered by the report, the registrant or its affiliates have knowingly engaged in certain, principally Iran-related, activities.
Both the US and
the EU have enacted strong sanctions against Syria, including a prohibition on the purchase of Syrian-origin crude and a US prohibition on the provision of services to Syria by US persons. The EU sanctions against Syria include a prohibition on
supplying certain equipment used in the production, refining, or liquefaction of petroleum resources as well as restrictions on dealing with the Central Bank of Syria and numerous other Syrian financial institutions.
With effect from 20 January 2014, the US and the EU implemented temporary, limited and reversible relief of certain sanctions related to Iran pursuant to a Joint
Plan of Action entered by Iran, China, France, Germany, Russia, the UK and the US. BP has not changed its policy in relation to Iran as a result of the Joint Plan of Action and has no plans to engage in any new business with Iran which would now be
permitted as a result of the Joint Plan of Action.
BP has interests in and operates two fields – the North Sea Rhum field (‘Rhum’) and the Azerbaijan
Shah Deniz field – and has interests in a gas marketing entity and a gas pipeline entity which, respectively, market and
|
|
|
|
|
| BP Annual Report and Form 20-F 2013 |
|
|
267 |
|
transport Shah Deniz gas (both entities and related assets are located outside Iran), in which Naftiran Intertrade Co. Limited and NICO SPV Limited (collectively, ‘NICO’) or Iranian Oil
Company (U.K.) Limited (‘IOC UK’) have interests. Production was suspended at Rhum (in which IOC UK has a 50% interest) in November 2010 and Rhum remains shut-in. On 22 October 2013, the UK government announced a temporary
management scheme (the ‘Temporary Scheme’) under The Hydrocarbon (Temporary Management Scheme) Regulations 2013 under which the UK government will assume control of and manage IOC UK’s interest in the Rhum field, thereby
permitting operations to re-commence at Rhum in accordance with applicable EU regulations and in compliance with US laws and regulations.
The Shah Deniz field, its
gas marketing entity and the gas pipeline entity (in which NICO has a 10% or less non-operating interest) continue in operation. The Shah Deniz joint operation and its gas marketing and pipeline entities were excluded from the main operative
provisions of the EU regulations as well as from the application of the new US sanctions, and fall within the exception for certain natural gas projects under Section 603 of ITRA.
BP has no operations in Iran and it is BP’s policy that it shall not purchase or ship crude oil or other products of Iranian origin. Participants in non-BP
controlled or operated joint ventures may purchase Iranian-origin crude oil or other components as feedstock for facilities located outside the EU and US. It is also BP’s policy that BP shall not sell crude oil or other products into Iran.
Until January 2010, BP held an equity interest in an Iranian joint venture that blended and marketed automotive lubricants for sale to domestic consumers in Iran. BP sold its equity interest but continued to sell small quantities of automotive
lubricants and components and license relevant trade marks to the current owner. These sales of automotive lubricants and components were terminated in June 2013. BP currently holds an interest in a non-BP operated joint venture which sells crude
oil to an Indian entity in which NICO holds a minority, non-controlling stake.
In 2012, BP became aware that a Canadian university had been using graduate students,
some of whom were nationals of Iran, on a research programme funded in part by BP. BP suspended the programme and made a voluntary disclosure to OFAC. Also in 2012, BP became aware that in 2010, as consideration for certain auditing services, BP
effected a transfer of funds to a local Iranian consulting firm which may have been in violation of relevant EU notification requirements. BP has made a voluntary disclosure to the applicable EU regulator of such transfer.
Following the imposition in 2011 of further US and EU sanctions against Syria, BP terminated all sales of crude oil and petroleum products into Syria, though BP continues
to supply aviation fuel to non-governmental Syrian resellers outside of Syria.
BP sells lubricants in Cuba through a 50:50 joint arrangement and trades in small
quantities of lubricants. In the first quarter of 2013, BP sold a small quantity of lubricants to a third-party drilling company for use in Myanmar.
BP has equity
interests in non-operated joint arrangements with air fuel sellers, resellers, and fuel delivery services around the world. From time to time, the joint arrangement operator may sell or deliver fuel to airlines from Sanctioned Countries or flights
to Sanctioned Countries without BP’s knowledge or consent. BP has registered and paid required fees for patents and trade marks in Sanctioned Countries.
Disclosure pursuant to Section 219 of ITRA
To our knowledge, none of BP’s activities, transactions or dealings are required to be
disclosed pursuant to ITRA Section 219, with the following possible exception:
The Rhum field (‘Rhum’), located in the UK sector of the North Sea, is
operated by BP Exploration Operating Company Limited (‘BPEOC’), a non-US subsidiary of BP. Rhum is owned under a 50:50 unincorporated joint arrangement between BPEOC and Iranian Oil Company (U.K.) Limited (‘IOC’). The Rhum joint
arrangement was originally formed in 1974. During the period of production from Rhum, the Rhum joint arrangement supplied natural gas and certain associated liquids to the UK. On 16 November 2010, production from Rhum was suspended in response
to relevant EU sanctions. Rhum remains shut-in.
During the year ended 31 December 2013, BP recorded gross revenues of $5,297 related to Rhum due to changes in prices
related to hydrocarbon stock. These changes in prices were non-cash transactions that were recorded as revenue in accordance with BP accounting policy. BP had no net profits related to Rhum during the year ended 31 December 2013, recording an
overall loss.
The re-commencement of operations at Rhum in accordance with the Temporary Scheme (see above) remains
contingent on the commitment of third-party contractors and financial institutions to provide services to Rhum. BP currently intends to continue to hold its ownership stake in the Rhum joint arrangement, and to meet any applicable obligations in
respect of safety and maintenance of the facilities related to the Rhum field. Subject to the availability of the Temporary Scheme in the future and to the commitment of relevant third-party contractors and financial institutions to provide services
to Rhum, BP also intends to recommence operations at Rhum in the future in accordance with the Temporary Scheme.
Material contracts
On 6 August 2010, BP entered into a trust agreement with John S Martin, Jr and Kent D Syverud, as individual trustees, and Citigroup Trust –
Delaware, N.A., as corporate trustee (the Trust Agreement) which established the Deepwater Horizon Oil Spill Trust (the Trust) to be funded in the amount of $20 billion (the trust fund) over the period to the fourth quarter of 2013. During the
fourth quarter of 2012, BP made a final contribution to the Trust to complete the funding of the full $20-billion commitment. The trust fund is available to satisfy legitimate individual and business claims that were previously administered by the
Gulf Coast Claims Facility (GCCF), state and local government claims resolved by BP, final judgments and settlements, state and local response costs, and natural resource damages and related costs. The trust fund is available to satisfy claims that
were previously processed through the transitional court-supervised claims facility, to fund the qualified settlement funds established under the terms of the settlement agreements with the Plaintiffs’ Steering Committee (PSC) administered
through the court-supervised settlement programme, and to satisfy claims processed through the separate BP claims programme in respect of claimants not in the Economic and Property Damages class as determined by the Economic and Property Damages
Settlement Agreement or who have requested to opt out of that settlement. Fines, penalties and claims administration costs are not covered by the trust fund. Under the terms of the Trust Agreement, BP has no right to access the funds once they have
been contributed to the trust fund. BP will receive funds from the trust fund only upon its expiration, if there are any funds remaining at that point. BP has the authority under the Trust Agreement to present certain resolved claims, including
natural resource damages claims and state and local response claims, to the Trust for payment, by providing the trustees with all the required documents establishing that such claims are valid under the Trust Agreement. However, any such payments
can only be made on the authority of the trustee and any funds distributed are paid directly to the claimants, not to BP. The Trust Agreement is governed by the laws of the State of Delaware.
Property, plant and equipment
BP has freehold and leasehold interests in real estate in numerous countries, but no individual property is significant to the group as a whole. For more on the
significant subsidiaries of the group at 31 December 2013 and the group percentage of ordinary share capital see Financial statements – Note 38. For information on significant joint ventures and associates of the group see Financial
statements – Notes 17 and 18.
Related-party transactions
Transactions between the group and its significant joint ventures and associates are summarized in Financial statements – Note 17 and Note 18. In the ordinary course
of its business, the group enters into transactions with various organizations with which some of its directors or executive officers are associated. Except as described in this report, the group did not have material transactions or transactions of
an unusual nature with, and did not make loans to, related parties in the period commencing 1 January 2013 to 18 February 2014.
|
|
|
| 268 |
|
BP Annual Report and Form 20-F 2013 |
Exhibits
The following documents are filed in the Securities and Exchange Commission (SEC) EDGAR system, as part of this Annual Report on Form 20-F, and can be viewed on the
SEC’s website.
|
|
|
| Exhibit 1 |
|
Memorandum and Articles of Association of BP p.l.c.*† |
| Exhibit 4.1 |
|
The BP Executive Directors’ Incentive Plan*† |
| Exhibit 4.2 |
|
Amended BP Deferred Annual Bonus Plan 2005**† |
| Exhibit 4.3 |
|
Amended Director’s Secondment Agreement for R W Dudley† |
| Exhibit 4.4 |
|
Amended Director’s Service Contract and Secondment Agreement for R W Dudley*† |
| Exhibit 4.6 |
|
Director’s Service Contract for I C Conn***† |
| Exhibit 4.7 |
|
Director’s Service Contract for Dr B Gilvary****† |
| Exhibit 7 |
|
Computation of Ratio of Earnings to Fixed Charges (Unaudited)† |
| Exhibit 8 |
|
Subsidiaries (included as Note 38 to the Financial Statements) |
| Exhibit 10.1 |
|
Trust Agreement dated as of 6 August 2010 among BP Exploration & Production Inc., John S Martin, Jr and Kent D Syverud, as individual trustees, and Citigroup Trust- Delaware, N.A., as corporate trustee, as amended by an
Addendum, dated 6 August 2010*† |
| Exhibit 11 |
|
Code of Ethics*****† |
| Exhibit 12 |
|
Rule 13a – 14(a) Certifications† |
| Exhibit 13 |
|
Rule 13a – 14(b) Certifications#† |
| Exhibit 15.1 |
|
Consent of DeGolyer and MacNaughton† |
| Exhibit 15.2 |
|
Report of DeGolyer and MacNaughton† |
| |
* |
|
Incorporated by reference to the company’s Annual Report on Form 20-F for the year ended 31 December 2010. |
| |
** |
|
Incorporated by reference to the company’s Annual Report on Form 20-F for the year ended 31 December 2012. |
| |
*** |
|
Incorporated by reference to the company’s Annual Report on Form 20-F for the year ended 31 December 2004. |
| |
**** |
|
Incorporated by reference to the company’s Annual Report on Form 20-F for the year ended 31 December 2011. |
| |
***** |
|
Incorporated by reference to the company’s Annual Report on Form 20-F for the year ended 31 December 2009. |
| |
† |
|
Included only in the annual report filed in the Securities and Exchange Commission EDGAR system. |
The total amount of
long-term securities of the Registrant and its subsidiaries authorized under any one instrument does not exceed 10% of the total assets of BP p.l.c. and its subsidiaries on a consolidated basis. The company agrees to furnish copies of any or all
such instruments to the SEC on request.
Certain definitions
Unless the context indicates otherwise, the following terms have the meaning provided below:
Replacement cost profit
Replacement cost (RC) profit or
loss reflects the replacement cost of supplies and is arrived at by excluding inventory holding gains and losses from profit or loss. IFRS requires that the measure of profit or loss disclosed for each operating segment is the measure that is
provided regularly to the chief operating decision maker for the purposes of performance assessment and resource allocation. For BP, both RC profit or loss before interest and tax and underlying RC profit or loss before interest and tax are provided
regularly to the chief operating decision maker. In such cases IFRS requires that the measure of profit disclosed for each operating segment is the measure that is closest to IFRS, which for BP is RC profit or loss before interest and tax. RC profit
or loss for the group is not a recognized GAAP measure. The nearest equivalent GAAP measure is profit or loss for the year attributable to BP shareholders. BP believes that replacement cost profit before interest and taxation for the group is a
useful measure for investors because it is a profitability measure used by management. A reconciliation is provided between the total of the operating segments’ measures of profit or loss and the group profit or loss before taxation, as
required under IFRS. See Financial statements – Note 7.
Inventory holding gains and losses
Inventory holding gains and losses represent the difference between the cost of sales calculated using the average cost to BP of supplies acquired during the period and
the cost of sales calculated on the first-in first-out (FIFO) method after adjusting for any changes in provisions where the net realizable value of the inventory is lower than its cost. Under the FIFO method, which we use for IFRS reporting, the
cost of inventory charged to the income statement is based on its historic cost of purchase, or manufacture, rather than its replacement cost. In volatile energy markets, this can have a significant distorting effect on reported income. The amounts
disclosed represent the difference between the charge (to the income statement) for inventory on a FIFO basis (after adjusting for any related movements in net realizable value provisions) and the charge that would have arisen if an average cost of
supplies was used for the period. For this purpose, the average cost of supplies during the period is principally calculated on a monthly basis by dividing the total cost of inventory acquired in the period by the number of barrels acquired. The
amounts disclosed are not separately reflected in the financial statements as a gain or loss. No adjustment is made in respect of the cost of inventories held as part of a trading position and certain other temporary inventory positions.
Management believes this information is useful to illustrate to investors the fact that crude oil and product prices can vary significantly from period to period and that
the impact on our reported result under IFRS can be significant. Inventory holding gains and losses vary from period to period due principally to changes in oil prices as well as changes to underlying inventory levels. In order for investors to
understand the operating performance of the group excluding the impact of oil price changes on the replacement of inventories, and to make comparisons of operating performance between reporting periods, BP’s management believes it is helpful to
disclose this information.
Underlying replacement cost profit
Underlying RC profit or loss is RC profit or loss after adjusting for non-operating items and fair value accounting effects. Underlying RC profit or loss and fair value
accounting effects are not recognized GAAP measures. On pages 237 and 238 we provide additional information on the non-operating items and fair value accounting effects that are used to arrive at underlying RC profit or loss in order to enable a
full understanding of the events and their financial impact.
BP believes that underlying RC profit or loss before interest and taxation is a useful measure for
investors because it is a measure closely tracked by management to evaluate BP’s operating performance and to make financial, strategic and operating decisions and because it may help investors to understand and evaluate, in the same manner as
management, the underlying trends in BP’s operational performance on a comparable basis, year on year, by adjusting for the effects of these non-operating items and fair value accounting effects. The nearest equivalent measure on an IFRS basis
for the group is profit or loss for the year attributable to BP shareholders. The nearest equivalent measure on an IFRS basis for segments is RC profit or loss before interest and taxation.
Non-GAAP information on fair value accounting effects
BP
uses derivative instruments to manage the economic exposure relating to inventories above normal operating requirements of crude oil, natural gas and petroleum products. Under IFRS, these inventories are recorded at historic cost. The related
derivative instruments, however, are required to be recorded at fair value with gains and losses recognized in income because hedge accounting is either not permitted or not followed, principally due to the impracticality of effectiveness testing
requirements. Therefore, measurement differences in relation to recognition of gains and losses occur. Gains and losses on these inventories are not recognized until the commodity is sold in a subsequent accounting period. Gains and losses on the
related derivative commodity contracts are recognized in the income statement from the time the derivative commodity contract is entered into on a fair value basis using forward prices consistent with the contract maturity.
BP enters into commodity contracts to meet certain business requirements, such as the purchase of crude for a refinery or the sale of BP’s gas production. Under IFRS
these contracts are treated as derivatives and are required to be fair valued when they are managed as
|
|
|
|
|
| BP Annual Report and Form 20-F 2013 |
|
|
269 |
|
part of a larger portfolio of similar transactions. Gains and losses arising are recognized in the income statement from the time the derivative commodity contract is entered into.
IFRS requires that inventory held for trading be recorded at its fair value using period-end spot prices whereas any related derivative commodity instruments are required
to be recorded at values based on forward prices consistent with the contract maturity. Depending on market conditions, these forward prices can be either higher or lower than spot prices resulting in measurement differences.
BP enters into contracts for pipelines and storage capacity, oil and gas processing and liquefied natural gas (LNG) that, under IFRS, are recorded on an accruals basis.
These contracts are risk-managed using a variety of derivative instruments, which are fair valued under IFRS. This results in measurement differences in relation to recognition of gains and losses.
The way that BP manages the economic exposures described above, and measures performance internally, differs from the way these activities are measured under IFRS. BP
calculates this difference for consolidated entities by comparing the IFRS result with management’s internal measure of performance. Under management’s internal measure of performance the inventory and capacity contracts in question are
valued based on fair value using relevant forward prices prevailing at the end of the period, the fair values of certain derivative instruments used to risk manage LNG and oil and gas processing contracts are deferred to match with the underlying
exposure and the commodity contracts for business requirements are accounted for on an accruals basis. We believe that disclosing management’s estimate of this difference provides useful information for investors because it enables investors to
see the economic effect of these activities as a whole.
Commodity trading contracts
BP’s Upstream and Downstream segments both participate in regional and global commodity trading markets in order to manage, transact and hedge the crude oil, refined
products and natural gas that the group either produces or consumes in its manufacturing operations. These physical trading activities, together with associated incremental trading opportunities, are discussed further in Upstream on page 25 and in
Downstream on page 31. The range of contracts the group enters into in its commodity trading operations is described below. Using these contracts, in combination with rights to access storage and transportation capacity, allows the group to access
advantageous pricing differences between locations, time periods and arbitrage between markets.
Exchange-traded commodity derivatives
These contracts are typically in the form of futures and options traded on a recognized exchange, such as Nymex, SGX and ICE. Such contracts are traded in
standard specifications for the main marker crude oils, such as Brent and West Texas Intermediate, the main product grades, such as gasoline and gasoil, and for natural gas and power. Gains and losses, otherwise referred to as variation margins, are
settled on a daily basis with the relevant exchange. These contracts are used for the trading and risk management of crude oil, refined products, natural gas and power. Realized and unrealized gains and losses on exchange-traded commodity
derivatives are included in sales and other operating revenues for accounting purposes.
Over-the-counter contracts
These contracts are typically in the form of forwards, swaps and options. Some of these contracts are traded bilaterally between counterparties or through brokers; others
may be cleared by a central clearing counterparty. These contracts can be used both for trading and risk management activities. Realized and unrealized gains and losses on over-the-counter (OTC) contracts are included in sales and other operating
revenues for accounting purposes. Many grades of crude oil bought and sold use standard contracts including US domestic light sweet crude oil, commonly referred to as West Texas Intermediate, and a standard North Sea crude blend (Brent, Forties and
Oseberg or BFO). Forward contracts are used in connection with the purchase of crude oil supplies for refineries, purchases of products for marketing, sales of the group’s oil production and refined product. The contracts typically contain
standard delivery and settlement terms. These transactions call for physical delivery of oil with consequent operational and price risk. However, various means exist, and are from time to time used, to settle obligations
under the contracts in cash rather than through physical delivery. Additionally, the BFO contract specifies a standard volume and tolerance given that the physically settled transactions are
delivered by cargo.
Gas and power OTC markets are highly developed in North America and the UK, where the commodities can be bought and sold for delivery in future
periods. These contracts are negotiated between two parties to purchase and sell gas and power at a specified price, with delivery and settlement at a future date. Typically, these contracts specify delivery terms for the underlying commodity.
Certain of these transactions are not settled physically, which can be achieved by transacting offsetting sale or purchase contracts for the same location and delivery period that are offset during the scheduling of delivery or dispatch. The
contracts contain standard terms such as delivery point, pricing mechanism, settlement terms and specification of the commodity. Typically, volume, price and term (e.g. daily, monthly and balance of month) are the main variable contract terms.
Swaps are often contractual obligations to exchange cash flows between two parties: a typical swap transaction usually references a floating price and a fixed price with
the net difference of the cash flows being settled. Options give the holder the right, but not the obligation, to buy or sell crude, oil products, natural gas or power at a specified price on or before a specific future date. Amounts under these
derivative financial instruments are settled at expiry. Typically, netting agreements are used to limit credit exposure and support liquidity.
Spot and term contracts
Spot contracts are contracts to
purchase or sell a commodity at the market price prevailing on or around the delivery date when title to the inventory is taken. Term contracts are contracts to purchase or sell a commodity at regular intervals over an agreed term. Though spot and
term contracts may have a standard form, there is no offsetting mechanism in place. These transactions result in physical delivery with operational and price risk. Spot and term contracts typically relate to purchases of crude for a refinery,
purchases of products for marketing, purchases of third-party natural gas, sales of the group’s oil production, sales of the group’s oil products and sales of the group’s gas production to third parties. For accounting purposes, spot
and term sales are included in sales and other operating revenues, when title passes. Similarly, spot and term purchases are included in purchases for accounting purposes.
Associate
An entity, including an unincorporated entity
such as a partnership, over which the group has significant influence and that is neither a subsidiary nor a joint arrangement of the group. Significant influence is the power to participate in the financial and operating policy decisions of the
investee but is not control or joint control over those policies.
Joint arrangement
A joint arrangement is an arrangement of which two or more parties have joint control.
Joint control
Joint control is the contractually agreed
sharing of control over an arrangement, which exists only when decisions about the relevant activities require the unanimous consent of the parties sharing control.
Joint operation
A joint operation is a joint arrangement
whereby the parties that have joint control of the arrangement have rights to the assets, and obligations for the liabilities, relating to the arrangement.
Joint venture
A joint arrangement whereby the parties that have joint control of the arrangement have rights to the net assets of the
arrangement.
Subsidiary
An entity that is
controlled by the BP group. Control of an investee exists when an investor is exposed, or has rights, to variable returns from its involvement with the investee and has the ability to affect those returns through its power over the investee.
|
|
|
| 270 |
|
BP Annual Report and Form 20-F 2013 |
PSA
A
production-sharing agreement (PSA) is an arrangement through which an oil company bears the risks and costs of exploration, development and production. In return, if exploration is successful, the oil company receives entitlement to variable
physical volumes of hydrocarbons, representing recovery of the costs incurred and a stipulated share of the production remaining after such cost recovery.
Directors’ report information
This section of BP Annual Report and Form
20-F 2013 forms part of, and includes certain disclosures which are required by law to be included in, the Directors’ report.
Indemnity provisions
In accordance with BP’s
Articles of Association, each director is granted an indemnity from the company in respect of liabilities incurred as a result of their office, to the extent permitted by law. These indemnities were in force throughout the financial year and at the
date of this report. In respect of those liabilities for which directors may not be indemnified, the company maintained a directors’ and officers’ liability insurance policy throughout 2013. During the year, a review of the terms and scope
of the policy was undertaken. The policy has been renewed for 2014. Although their defence costs may be met, neither the company’s indemnity nor insurance provides cover in the event that the director is proved to have acted fraudulently or
dishonestly. In addition, each director of the company’s subsidiaries, which subsidiaries are trustees of the group’s pension schemes, is granted an indemnity from the company in respect of liabilities incurred as a result of such a
subsidiary’s activities as a trustee of the pension scheme, to the extent permitted by law. These indemnities were in force throughout the financial year and at the date of this report.
Financial risk management objectives and policies
The
disclosures in relation to financial risk management objectives and policies, including the policy for hedging, are included in Our management of risk on page 49 and Liquidity and capital resources on page 56.
Exposure to price risk, credit risk, liquidity risk and cash flow risk
The disclosures in relation to exposure to price risk, credit risk, liquidity risk and cash flow risk are included in Financial statements – Note 19.
Important events since the end of the financial year
Disclosures of the particulars of the important events affecting BP which have occurred since the end of the financial year are included in the Strategic report as well
as in other places in the Directors’ report.
Likely future developments in the business
An indication of the likely future developments of the business is included in the Strategic report.
Research and development
An indication of the activities
of the company in the field of research and development is included in Our strategy on page 13.
Branches
As a global group our interests and activities are held or operated through subsidiaries, branches, joint arrangements or associates established in – and subject to
the laws and regulations of – many different jurisdictions.
Employees
The disclosures concerning policies in relation to the employment of disabled persons and employee involvement are included in Corporate responsibility – Employees
on page 47.
Greenhouse gas emissions
The
disclosures in relation to greenhouse gas emissions are included in Corporate responsibility – Environment and society on page 45.
Cautionary statement
This document contains certain forecasts, projections and forward-looking statements – that is, statements related to future, not past events – with respect to
the financial condition, results of operations and businesses of BP and certain of the plans and objectives of BP with respect to these items. These statements may generally, but not always, be identified by the use of words such as
‘will’, ‘expects’, ‘is expected to’, ‘aims’, ‘should’, ‘may’, ‘objective’, ‘is likely to’, ‘intends’, ‘believes’, ‘anticipates’,
‘plans’, ‘we see’ or similar expressions. In particular, among other statements, (i) certain statements in the Chairman’s letter (pages 6-7), the Group chief executive’s
letter (pages 8-9), the Strategic report (pages 1-58) and Additional disclosures (pages 235-272), including but not limited to statements under the headings ‘Our market outlook’, ‘Beyond 2035’, ‘Our business model’,
‘Our strategy’, ‘Outlook’ and ‘Looking ahead’, and including but not limited to statements regarding plans to optimize BP’s portfolio of assets, expectations regarding future distributions to shareholders, the
estimated levels of capital expenditure in 2014, the expected levels of capital expenditure from 2015 to 2018, plans regarding the future divestment of $10 billion in assets by the end of 2015 and the prospects for and timing of planned and future
divestments, prospects for future value creation arising from certain of BP’s new investments in 2013, BP’s outlook on global energy trends to 2035 and beyond, including the role of oil, gas and renewables in coming decades, plans to make
disciplined financial choices, including the disciplined allocation of capital, expectations regarding the ‘10-point plan’, plans to explore future opportunities with Rosneft, the anticipated delivery of an increase in operating cash flow
by more than 50% by 2014 versus 2011 and expectations regarding growth in sustainable free cash flow beyond 2014, the expected implementation in the future of lessons learned from the In Amenas terrorist attacks, the expected design-life of the
field at Valhall, plans to grow BP’s exploration position and focus on high-value upstream assets in deep water, giant fields and selected gas value chains, expectations regarding financial momentum from the assets portfolio in the future,
plans to grow free cash flow by leveraging newly upgraded assets, customer relationships and technology in the downstream business, plans to create shareholder value and increase sustainable free cash flows, plans and expectations regarding
Project 20K, LoSal technology, the ‘virtual arrival system’, Veba Combi-Cracking technology and SaaBre and Hummingbird technologies, plans relating to future hiring and workforce, expectations that
the 2014 start-ups will have double the 2011 average unit operating cash margins, the expected target net debt ratio in 2014 and beyond, the expected level of depreciation, depletion and amortization in the future, the expected level of the
underlying effective tax rate in 2014, plans to generate $30 billion to $31 billion of operating cash flow in 2014, plans to use around half of the extra cash in 2014 for increased investments and around half for other purposes including
distributions, the expected levels of full-year underlying and reported production in 2014, expectations regarding BP’s plans to separate its US Lower 48 onshore oil and gas business, including the timing thereof and the expected impact on
BP’s resource position and portfolio in the future, the prospects for movement in and the levels of oil and gas prices in 2014, the timing and composition of planned and future projects including expected final investment decisions, start up,
construction, commissioning, completion, timing of production, level of production and margins, plans for gas discovery and production in India, plans to enhance safety, compliance and risk management, increase efficiency and reliability, improve
margins and create new market opportunities, expectations regarding and plans to deliver a strong performance in safety, portfolio management, competitive returns and material and growing cash flows in the Downstream segment, expectations regarding
refining margins in 2014, the expected impact of refinery turnarounds in 2014, expectations regarding the market environments for lubricants and petrochemicals in 2014, plans to increase lubricant revenues in the future, the expected level of heavy
crude processing at the Whiting refinery during the second quarter 2014 and Whiting’s prospects for supporting BP’s ability to deliver increased cash flow in 2014 and beyond, plans to continue to develop biofuel blend capabilities,
BP’s plans for LPG in the future, Air BP’s future strategic aims, the timing of first production at the third PTA plant at Zhuhai and the expected capacity thereof in the future, expectations regarding the material impacts of investments
in Asia and the deployment of new PTA technology in existing plants and new asset platforms, plans to access Asian demand and feedstock sources, expectations for the environment for PTA, acetic
|
|
|
|
|
| BP Annual Report and Form 20-F 2013 |
|
|
271 |
|
acid and olefins and derivative value chains in 2014, Rosneft’s plans for its refinery modernization programme, plans to expand ethanol production capacity in Brazilian sugar cane mills, the
expected level of production at the Vivergo joint venture plant, the expected range for the annual charge of Other businesses and corporate in 2014, plans regarding the reporting and recording of losses of primary containment, the timing of the
expected delivery of new tankers, the impact of the additional regulation of GHG emissions on BP’s business, plans to minimize air pollutants and emissions at hydraulic fracturing sites, prospects for the UK temporary management scheme in
respect of Rhum and the resumption of operations thereat in the future, plans for new investment including new drilling rigs in Alaska, plans for oil sand development and a major seismic programme in Canada, plans regarding deepwater blocks in
offshore Brazil and Uruguay, the expected production levels of the Angola LNG project, the expected completion of farm-out agreements in Morocco, plans for a third train at the LNG plant in Tangguh, prospects for Shah Deniz Stage 2 and the expected
satisfaction of conditions precedent to the planned purchase of an additional 3.3% equity stake in Shah Deniz and the South Caucasus Pipeline from Statoil, the expected amount of future payments from the disposal of interests in certain North Sea
fields, prospects for future developments at Mad Dog Phase 2, plans regarding the timing of construction and production of the Khazzan field in Oman, plans to drill four deepwater wells in the Ceduna Sub Basin, the expected production life of the
North West Shelf, expectations regarding the naptha reformer at the Toledo refinery, plans to increase investment in Africa, including in upgrades to refinery infrastructure and the Pick n PayTM
retail network, expectations regarding future reserves booking, expectations of future undeveloped reserves turnover time and volume, the anticipated future composition of the board of directors, the timing of, cost of, source of payment and
provision for future remediation and restoration programmes and environmental operating and capital expenditures, expectations regarding the impact of various regulations upon BP’s business and expectations regarding greater regulation and
increased operating costs in the Gulf of Mexico in the future, expectations regarding the issuance of a final policy for the materiality of revenue and expenses under the Economic and Property Damages Settlement Agreement by the claims administrator
under such settlement, and expectations regarding legal and trial proceedings, court decisions, potential investigations and civil actions by regulators, government entities and/or other entities or parties, and the risks associated with such
proceedings and BP’s intentions in respect thereof; (ii) certain statements in Corporate governance (pages 59-80) and the Directors’ remuneration report (pages 81-108) with regard to the anticipated future composition of the board of
directors, the board’s goals and plans stemming from the board’s annual evaluation, plans regarding the timing of future audit contract tendering, the expectation that BP will be in second place amongst oil majors in respect of reserves
replacement for the year ended 31 December 2013, the expected percentage of performance shares that will vest based on 2013 outcomes, and plans and expectations with regard to the remuneration, pensions and other benefits of executive directors,
including prospective scenarios for total remuneration opportunities for executive directors in the future, changes in the metrics used to calculate remuneration and changes to the limits of aggregate annual remuneration; and (iii) certain
statements in the Strategic report (pages 56-58), with regard to future dividend and optional scrip dividend payments, including the board’s plans for reviewing the dividend level in future quarters, future capital expenditures and capital
expenditure commitments, including estimated levels of capital expenditure in 2014 and from 2015 to 2018, taxation, intentions to maintain a significant liquidity buffer, future working capital and cash flows, gearing and the net debt ratio,
BP’s intention to maintain a strong cash position, the expected effect on operating cash flow of completion of Deepwater Horizon Oil Spill Trust fund payments and high-margin projects coming onstream, expectations regarding taxes due upon
repatriation of cash into the UK, expectations regarding total capital expenditure, and expected payments under contractual and commercial commitments and purchase obligations; are all forward looking in nature.
By their nature, forward-looking statements involve risk and uncertainty because they relate to events and depend on circumstances that will or may occur in the future
and are outside the control of BP. Actual results may differ materially from those expressed in such statements, depending on a variety of factors, including the specific factors identified in the discussions accompanying such forward-looking
statements; the receipt of relevant third party and/or regulatory approvals; the timing and level of
maintenance and/or turnaround activity; the timing and volume of refinery additions and outages; the timing of bringing new fields onstream; the timing, quantum and nature of certain divestments;
future levels of industry product supply, demand and pricing, including supply growth in North America; OPEC quota restrictions; PSA effects; operational problems; economic and financial market conditions generally or in various countries and
regions; political stability and economic growth in relevant areas of the world; changes in laws and governmental regulations; regulatory or legal actions including the types of enforcement action pursued and the nature of remedies sought or
imposed; the actions of prosecutors, regulatory authorities and courts; the impact on our reputation following the Gulf of Mexico oil spill; the actions of the Claims Administrator appointed under the Economic and Property Damages Settlement; the
actions of all parties to the Gulf of Mexico oil spill-related litigation at various phases of the litigation; exchange rate fluctuations; development and use of new technology; the success or otherwise of partnering; the actions of competitors,
trading partners, creditors, rating agencies and others; decisions by Rosneft’s management and board of directors; the actions of contractors; natural disasters and adverse weather conditions; changes in public expectations and other changes to
business conditions; wars and acts of terrorism, cyber-attacks or sabotage; and other factors discussed elsewhere in this report including under Risk factors (pages 51-55). In addition to factors set forth elsewhere in this report, those set out
above are important factors, although not exhaustive, that may cause actual results and developments to differ materially from those expressed or implied by these forward-looking statements.
Statements regarding competitive position
Statements
referring to BP’s competitive position are based on the company’s belief and, in some cases, rely on a range of sources, including investment analysts’ reports, independent market studies and BP’s internal assessments of market
share based on publicly available information about the financial results and performance of market participants.
|
|
|
| 272 |
|
BP Annual Report and Form 20-F 2013 |
|
|
|
|
|
| BP Annual Report and Form 20-F 2013 |
|
|
273 |
|
Called-up share capital
Details of the allotted, called-up and fully-paid share capital at 31 December 2013 are set out in Financial statements – Note 31.
At the AGM on 11 April 2013, authorization was given to the directors to allot shares up to an aggregate nominal amount equal to $3,194 million. Authority was also
given to the directors to allot shares for cash and to dispose of treasury shares, other than by way of rights issue, up to a maximum of $240 million, without having to offer such shares to existing shareholders. These authorities were given for the
period until the next AGM in 2014 or 11
July 2014, whichever is the earlier. These authorities are renewed annually at the AGM.
Share
prices and listings
Markets and market prices
The primary market for BP’s ordinary shares is the London Stock Exchange (LSE). BP’s ordinary shares are a constituent element of the Financial Times Stock
Exchange 100 Index. BP’s ordinary shares are also traded on the Frankfurt Stock Exchange in Germany.
Trading of BP’s shares on the LSE is primarily through
the use of the Stock Exchange Electronic Trading Service (SETS), introduced in 1997 for the largest companies in terms of market capitalization whose primary
listing is the LSE. Under SETS, buy and sell orders at specific prices may be sent electronically to the exchange by any firm that is a member of the LSE, on behalf of a client or on behalf of
itself acting as a principal. The orders are then anonymously displayed in the order book. When there is a match on a buy and a sell order, the trade is executed and automatically reported to the LSE. Trading is continuous from 8.00 a.m. to 4.30
p.m. UK time but, in the event of a 20% movement in the share price either way, the LSE may impose a temporary halt in the trading of that company’s shares in the order book to allow the market to re-establish equilibrium. Dealings in ordinary
shares may also take place between an investor and a market-maker, via a member firm, outside the electronic order book.
In the US, BP’s securities are traded
on the New York Stock Exchange (NYSE) in the form of ADSs, for which JPMorgan Chase Bank, N.A. is the depositary (the Depositary) and transfer agent. The Depositary’s principal office is 1 Chase Manhattan Plaza, N.A., Floor 58, New York, NY
10005-1401, US. Each ADS represents six ordinary shares. ADSs are listed on the NYSE. ADSs are evidenced by American depositary receipts (ADRs), which may be issued in either certificated or book entry form.
The following table sets forth, for the periods indicated, the highest and lowest middle market quotations for BP’s ordinary shares and ADSs for the periods shown.
These are derived from the highest and lowest intra-day sales prices as reported on the LSE and NYSE, respectively.
|
|
|
|
|
|
|
|
|
|
|
|
|
|
|
|
|
|
|
| |
|
|
|
|
Pence |
|
|
|
Dollars |
|
| |
|
|
|
|
Ordinary shares |
|
|
|
American depositary sharesa |
|
| |
|
|
|
|
High |
|
|
|
Low |
|
|
|
High |
|
|
|
Low |
|
| Year ended 31 December |
|
|
|
|
|
|
|
|
|
|
|
|
|
|
|
|
|
|
| 2009 |
|
|
|
|
613.40 |
|
|
|
400.00 |
|
|
|
60.00 |
|
|
|
33.70 |
|
| 2010 |
|
|
|
|
658.20 |
|
|
|
296.00 |
|
|
|
62.38 |
|
|
|
26.75 |
|
| 2011 |
|
|
|
|
514.90 |
|
|
|
361.25 |
|
|
|
49.50 |
|
|
|
33.62 |
|
| 2012 |
|
|
|
|
512.00 |
|
|
|
388.56 |
|
|
|
48.34 |
|
|
|
36.25 |
|
| 2013 |
|
|
|
|
494.20 |
|
|
|
426.50 |
|
|
|
48.65 |
|
|
|
39.99 |
|
| Year ended 31 December |
|
|
|
|
|
|
|
|
|
|
|
|
|
|
|
|
|
|
| 2012: First quarter |
|
|
|
|
512.00 |
|
|
|
455.05 |
|
|
|
48.34 |
|
|
|
42.53 |
|
| Second quarter |
|
|
|
|
475.47 |
|
|
|
388.56 |
|
|
|
45.60 |
|
|
|
36.25 |
|
| Third quarter |
|
|
|
|
456.00 |
|
|
|
415.60 |
|
|
|
44.16 |
|
|
|
39.13 |
|
| Fourth quarter |
|
|
|
|
464.71 |
|
|
|
416.35 |
|
|
|
43.90 |
|
|
|
39.58 |
|
| 2013: First quarter |
|
|
|
|
482.33 |
|
|
|
426.50 |
|
|
|
45.45 |
|
|
|
39.99 |
|
| Second quarter |
|
|
|
|
485.43 |
|
|
|
437.25 |
|
|
|
44.27 |
|
|
|
40.12 |
|
| Third quarter |
|
|
|
|
477.53 |
|
|
|
430.30 |
|
|
|
43.75 |
|
|
|
40.51 |
|
| Fourth quarter |
|
|
|
|
494.20 |
|
|
|
426.55 |
|
|
|
48.65 |
|
|
|
41.30 |
|
| 2014: First quarter (to 18 February) |
|
|
|
|
499.90 |
|
|
|
463.80 |
|
|
|
49.63 |
|
|
|
45.83 |
|
| Month of |
|
|
|
|
|
|
|
|
|
|
|
|
|
|
|
|
|
|
| September 2013 |
|
|
|
|
458.28 |
|
|
|
430.85 |
|
|
|
42.86 |
|
|
|
41.08 |
|
| October 2013 |
|
|
|
|
491.27 |
|
|
|
426.55 |
|
|
|
46.65 |
|
|
|
41.30 |
|
| November 2013 |
|
|
|
|
494.20 |
|
|
|
474.10 |
|
|
|
48.03 |
|
|
|
45.72 |
|
| December 2013 |
|
|
|
|
491.26 |
|
|
|
464.15 |
|
|
|
48.65 |
|
|
|
45.30 |
|
| January 2014 |
|
|
|
|
499.90 |
|
|
|
470.15 |
|
|
|
49.20 |
|
|
|
46.62 |
|
| February 2014 (to 18 February) |
|
|
|
|
495.85 |
|
|
|
463.80 |
|
|
|
49.63 |
|
|
|
45.83 |
|
| a |
One ADS is equivalent to six 25 cent ordinary shares. |
| Source: |
Thomson Reuters Datastream. |
Market prices for the ordinary shares on the LSE and in after-hours trading off the LSE, in each case while the NYSE is
open, and the market prices for ADSs on the NYSE, are closely related due to arbitrage among the various markets, although differences may exist from time to time.
On 18 February 2014, 876,828,675.5 ADSs (equivalent to approximately 5,260,972,053 ordinary shares or some 28.51% of the total issued share capital, excluding shares
held in treasury) were outstanding and were held by approximately 100,614 ADS holders. Of these, about 99,394 had registered addresses in the US at that date. One of the registered holders of ADSs represents some 868,478 underlying holders.
On 18 February 2014, there were approximately 279,391 ordinary shareholders. Of these shareholders, around 1,574 had registered addresses in the US and held a total
of some 4,286,769 ordinary shares.
Since a number of the ordinary shares and ADSs were held by brokers and other nominees, the number of holders in the US may not be
representative of the number of beneficial holders of their respective country of residence.
Dividends
BP’s current policy is to pay interim dividends on a quarterly basis on its ordinary shares.
BP’s current policy is also to announce dividends for ordinary shares in US dollars and state an equivalent sterling dividend. Dividends on BP ordinary shares
will be paid in sterling and on BP ADSs in US dollars. The rate of exchange used to determine the sterling amount equivalent is the average of the market exchange rates in London over the four business days prior to the sterling equivalent
announcement date. The directors may choose to declare dividends in any currency provided that a sterling equivalent is announced, but it is not the company’s intention to change its current policy of announcing dividends on ordinary shares in
US dollars.
Information regarding dividends announced and paid by the company on ordinary shares and preference shares is provided in Financial statements
– Note 12.
|
|
|
| 274 |
|
BP Annual Report and Form 20-F 2013 |
A Scrip Dividend Programme (Scrip) was approved by shareholders in 2010 which enables BP ordinary shareholders and ADS
holders to elect to receive dividends by way of new fully paid BP ordinary shares (or ADSs in the case of ADS holders) instead of cash. The operation of the Scrip is always subject to the directors’ decision to make the Scrip offer available in
respect of any particular dividend. Should the directors decide not to offer the Scrip in respect of any particular dividend, cash will be paid automatically instead.
Future dividends will be dependent on future earnings, the financial condition of the group, the Risk factors set out on page 51 and other matters that may affect the
business of the group set out in our strategy on page 13 and in Liquidity and capital resources on page 56.
The following table shows dividends announced and paid by
the company per ADS for the past five years.
|
|
|
|
|
|
|
|
|
|
|
|
|
|
|
|
|
|
|
|
|
|
|
|
|
| Dividends per ADSa |
|
|
|
|
|
|
March |
|
|
|
June |
|
|
|
September |
|
|
|
December |
|
|
|
Total |
|
| 2009 |
|
|
UK pence |
|
|
|
58.91 |
|
|
|
57.50 |
|
|
|
51.02 |
|
|
|
51.07 |
|
|
|
218.5 |
|
| |
|
|
US cents |
|
|
|
84 |
|
|
|
84 |
|
|
|
84 |
|
|
|
84 |
|
|
|
336 |
|
| 2010 |
|
|
UK pence |
|
|
|
52.07 |
|
|
|
– |
|
|
|
– |
|
|
|
– |
|
|
|
52.07 |
|
| |
|
|
US cents |
|
|
|
84 |
|
|
|
– |
|
|
|
– |
|
|
|
– |
|
|
|
84 |
|
| 2011 |
|
|
UK pence |
|
|
|
26.02 |
|
|
|
25.68 |
|
|
|
25.90 |
|
|
|
26.82 |
|
|
|
104.42 |
|
| |
|
|
US cents |
|
|
|
42 |
|
|
|
42 |
|
|
|
42 |
|
|
|
42 |
|
|
|
168 |
|
| 2012 |
|
|
UK pence |
|
|
|
30.57 |
|
|
|
30.90 |
|
|
|
30.10 |
|
|
|
33.53 |
|
|
|
125.10 |
|
| |
|
|
US cents |
|
|
|
48 |
|
|
|
48 |
|
|
|
48 |
|
|
|
54 |
|
|
|
198 |
|
| 2013 |
|
|
UK pence |
|
|
|
36.01 |
|
|
|
35.01 |
|
|
|
34.58 |
|
|
|
34.80 |
|
|
|
140.4 |
|
| |
|
|
US cents |
|
|
|
54 |
|
|
|
54 |
|
|
|
54 |
|
|
|
57 |
|
|
|
219 |
|
| a |
Dividends announced and paid by the company on ordinary and preference shares are provided in Financial statements – Note 12. |
UK foreign exchange controls on dividends
There are currently no UK foreign exchange controls or restrictions on remittances of dividends on the ordinary shares or on the conduct of the company’s operations,
other than restrictions applicable to certain countries and persons subject to EU economic sanctions.
There are no limitations, either under the laws of the UK or
under the company’s Articles of Association, restricting the right of non-resident or foreign owners to hold or vote BP ordinary or preference shares in the company other than limitations that would generally apply to all of the shareholders
and limitations applicable to certain countries and persons subject to EU economic sanctions.
Shareholder taxation information
This section describes the material US federal income tax and UK taxation consequences of owning ordinary shares or
ADSs to a US holder who holds the ordinary shares or ADSs as capital assets for tax purposes. It does not apply, however, interalia to members of special classes of holders some of which may be subject to other rules, including: tax-exempt entities,
life insurance companies, dealers in securities, traders in securities that elect a mark-to-market method of accounting for securities holdings, investors liable for alternative minimum tax, holders that, directly or indirectly, hold 10% or more of
the company’s voting stock, holders that hold the shares or ADSs as part of a straddle or a hedging or conversion transaction, holders that purchase or sell the shares or ADSs as part of a wash sale for US federal income tax purposes, or
holders whose functional currency is not the US dollar. In addition, if a partnership holds the shares or ADSs, the US federal income tax treatment of a partner will generally depend on the status of the partner and the tax treatment of the
partnership and may not be described fully below.
A US holder is any beneficial owner of ordinary shares or ADSs that is for US federal income tax purposes
(i) a citizen or resident of the US, (ii) a US domestic corporation, (iii) an estate whose income is subject to US federal income taxation regardless of its source, or (iv) a trust if a US court can exercise primary supervision
over the trust’s administration and one or more US persons are authorized to control all substantial decisions of the trust.
This section is based on the tax
laws of the United States, including the Internal Revenue Code of 1986, as amended, its legislative history,
existing and proposed US Treasury regulations thereunder, published rulings and court decisions, and the taxation laws of the UK, all as currently in effect, as well as the income tax convention
between the US and the UK that entered into force on 31 March 2003 (the ‘Treaty’). These laws are subject to change, possibly on a retroactive basis. This section is further based in part on the representations of the Depositary and
assumes that each obligation in the Deposit Agreement and any related agreement will be performed in accordance with its terms.
For purposes of the Treaty and the
estate and gift tax Convention (the ‘Estate Tax Convention’) and for US federal income tax and UK taxation purposes, a holder of ADRs evidencing ADSs will be treated as the owner of the company’s ordinary shares represented by those
ADRs. Exchanges of ordinary shares for ADRs and ADRs for ordinary shares generally will not be subject to US federal income tax or to UK taxation other than stamp duty or stamp duty reserve tax, as described below.
Investors should consult their own tax adviser regarding the US federal, state and local, UK and other tax consequences of owning and disposing of ordinary shares and
ADSs in their particular circumstances, and in particular whether they are eligible for the benefits of the Treaty in respect of their investment in the shares or ADSs.
Taxation of dividends
UK taxation
Under current UK taxation law, no withholding tax will be deducted from dividends paid by the company, including dividends paid to US holders. A shareholder
that is a company resident for tax purposes in the UK or trading in the UK through a permanent establishment generally will not be taxable in the UK on a dividend it receives from the company. A shareholder who is an individual resident for tax
purposes in the UK is subject to UK tax but entitled to a tax credit on cash dividends paid on ordinary shares or ADSs of the company equal to one-ninth of the cash dividend.
US federal income taxation
A US holder is subject to US
federal income taxation on the gross amount of any dividend paid by the company out of its current or accumulated earnings and profits (as determined for US federal income tax purposes). Dividends paid to a non-corporate US holder in taxable years
beginning after 2012 that constitute “qualified dividend income” will be taxable to the holder at a maximum rate of 20%, provided that the holder has a holding period in the ordinary shares or ADSs of more than 60 days during the 121-day
period beginning 60 days before the ex-dividend date and meets other holding period requirements. Dividends paid by the company with respect to the ordinary shares or ADSs will generally be qualified dividend income.
As noted above in UK taxation, a US holder will not be subject to UK withholding tax. Accordingly, a US holder will include only the dividend actually received from the
company in gross income for US federal income tax purposes, and the receipt of a dividend will not entitle the US holder to a foreign tax credit.
For US federal
income tax purposes, a dividend must be included in income when the US holder, in the case of ordinary shares, or the Depositary, in the case of ADSs, actually or constructively receives the dividend and will not be eligible for the
dividends-received deduction generally allowed to US corporations in respect of dividends received from other US corporations. Dividends will be income from sources outside the US and generally will be ‘passive category income’ or, in the
case of certain US holders, ‘general category income’, each of which is treated separately for purposes of computing a US holder’s foreign tax credit limitation.
The amount of the dividend distribution on the ordinary shares that is paid in pounds sterling will be the US dollar value of the pounds sterling payments made,
determined at the spot pounds sterling/ US dollar rate on the date the dividend distribution is includible in income, regardless of whether the payment is, in fact, converted into US dollars. Generally, any gain or loss resulting from currency
exchange fluctuations during the period from the date the pounds sterling dividend payment is includible in income to the date the payment is converted into US dollars will be treated as ordinary income or loss and will not be eligible for the
preferential tax rate on qualified dividend income. The gain or loss generally will be income or loss from sources within the US for foreign tax credit limitation purposes.
|
|
|
|
|
| BP Annual Report and Form 20-F 2013 |
|
|
275 |
|
Distributions in excess of the company’s earnings and profits, as determined for US federal income tax purposes, will
be treated as a return of capital to the extent of the US holder’s basis in the ordinary shares or ADSs and thereafter as capital gain, subject to taxation as described in Taxation of capital gains – US federal income taxation section
below.
In addition, the taxation of dividends may be subject to the rules for passive foreign investment companies (PFIC), described below under ‘Taxation of
capital gains – US federal income taxation’. Distributions made by a PFIC do not constitute qualified dividend income and are not eligible for the preferential tax rate applicable to such income.
Taxation of capital gains
UK
taxation
A US holder may be liable for both UK and US tax in respect of a gain on the disposal of ordinary shares or ADSs if the US holder is (i) a
citizen of the US resident or ordinarily resident in the UK, (ii) a US domestic corporation resident in the UK by reason of its business being managed or controlled in the UK or (iii) a citizen of the US or a corporation that carries on a
trade or profession or vocation in the UK through a branch or agency or, in respect of corporations for accounting periods beginning on or after 1 January 2003, through a permanent establishment, and that has used, held, or acquired the
ordinary shares or ADSs for the purposes of such trade, profession or vocation of such branch, agency or permanent establishment. However, such persons may be entitled to a tax credit against their US federal income tax liability for the amount of
UK capital gains tax or UK corporation tax on chargeable gains (as the case may be) that is paid in respect of such gain.
Under the Treaty, capital gains on
dispositions of ordinary shares or ADSs generally will be subject to tax only in the jurisdiction of residence of the relevant holder as determined under both the laws of the UK and the US and as required by the terms of the Treaty.
Under the Treaty, individuals who are residents of either the UK or the US and who have been residents of the other jurisdiction (the US or the UK, as the case may be) at
any time during the six years immediately preceding the relevant disposal of ordinary shares or ADSs may be subject to tax with respect to capital gains arising from a disposition of ordinary shares or ADSs of the company not only in the
jurisdiction of which the holder is resident at the time of the disposition but also in the other jurisdiction.
US federal income taxation
A US holder who sells or otherwise disposes of ordinary shares or ADSs will recognize a capital gain or loss for US federal income tax purposes equal to the
difference between the US dollar value of the amount realized on the disposition and the US holder’s tax basis, determined in US dollars, in the ordinary shares or ADSs. Any such capital gain or loss generally will be long-term gain or loss,
subject to tax at a preferential rate for a non-corporate US holder, if the US holder’s holding period for such ordinary shares or ADSs exceeds one year.
Gain
or loss from the sale or other disposition of ordinary shares or ADSs will generally be income or loss from sources within the US for foreign tax credit limitation purposes. The deductibility of capital losses is subject to limitations.
We do not believe that ordinary shares or ADSs will be treated as stock of a passive foreign investment company, or PFIC, for US federal income tax purposes, but this
conclusion is a factual determination that is made annually and thus is subject to change. If we are treated as a PFIC, unless a US holder elects to be taxed annually on a mark-to-market basis with respect to ordinary shares or ADSs, any gain
realized on the sale or other disposition of ordinary shares or ADSs would in general not be treated as capital gain. Instead, a US holder would be treated as if he or she had realized such gain rateably over the holding period for ordinary shares
or ADSs and would be taxed at the highest tax rate in effect for each such year to which the gain was allocated, in addition to which an interest charge in respect of the tax attributable to each such year would apply. Certain ‘excess
distributions’ would be similarly treated if we were treated as a PFIC.
Additional tax considerations
Scrip Dividend Programme
The company has an optional
Scrip Dividend Programme, wherein holders of BP ordinary shares or ADSs may elect to receive any dividends in the form of new fully paid ordinary shares or ADSs of the company instead of cash. Please consult your tax adviser for the consequences to
you.
UK inheritance tax
The Estate Tax Convention
applies to inheritance tax. ADSs held by an individual who is domiciled for the purposes of the Estate Tax Convention in the US and is not for the purposes of the Estate Tax Convention a national of the UK will not be subject to UK inheritance tax
on the individual’s death or on transfer during the individual’s lifetime unless, among other things, the ADSs are part of the business property of a permanent establishment situated in the UK used for the performance of independent
personal services. In the exceptional case where ADSs are subject to both inheritance tax and US federal gift or estate tax, the Estate Tax Convention generally provides for tax payable in the US to be credited against tax payable in the UK or for
tax paid in the UK to be credited against tax payable in the US, based on priority rules set forth in the Estate Tax Convention.
UK stamp duty
and stamp duty reserve tax
The statements below relate to what is understood to be the current practice of HM Revenue & Customs in the UK under
existing law.
Provided that any instrument of transfer is not executed in the UK and remains at all times outside the UK and the transfer does not relate to any
matter or thing done or to be done in the UK, no UK stamp duty is payable on the acquisition or transfer of ADSs. Neither will an agreement to transfer ADSs in the form of ADRs give rise to a liability to stamp duty reserve tax.
Purchases of ordinary shares, as opposed to ADSs, through the CREST system of paperless share transfers will be subject to stamp duty reserve tax at 0.5%. The charge will
arise as soon as there is an agreement for the transfer of the shares (or, in the case of a conditional agreement, when the condition is fulfilled). The stamp duty reserve tax will apply to agreements to transfer ordinary shares even if the
agreement is made outside the UK between two non-residents. Purchases of ordinary shares outside the CREST system are subject either to stamp duty at a rate of £5 per £1,000 (or part, unless the stamp duty is less than £5,
when no stamp duty is charged), or stamp duty reserve tax at 0.5%. Stamp duty and stamp duty reserve tax are generally the liability of the purchaser.
A subsequent
transfer of ordinary shares to the Depositary’s nominee will give rise to further stamp duty at the rate of £1.50 per £100 (or part) or stamp duty reserve tax at the rate of 1.5% of the value of the ordinary shares at the time
of the transfer. For ADR holders electing to receive ADSs instead of cash, after the 2012 first quarter dividend payment HM Revenue & Customs no longer seeks to impose 1.5% stamp duty reserve tax on issues of UK shares and securities to
non-EU clearance services and depositary receipt systems.
US Medicare Tax
For taxable years beginning after December 31, 2012, a US holder that is an individual or estate, or a trust that does not fall into a special class of trusts that
is exempt from such tax, will be subject to an additional 3.8% “Medicare tax” on the lesser of (1) the US holder’s “net investment income” for the relevant taxable year and (2) the excess of the US holder’s
modified adjusted gross income for the taxable year over a certain threshold (which in the case of individuals will be $125,000, $200,000 or $250,000, depending on the individual’s circumstances). A US holder’s net investment income will
generally include its dividend income and its net gains from the sale or other disposition of ordinary shares or ADSs. If you are a US holder that is an individual, estate or trust, you are urged to consult your tax adviser regarding the
applicability of the Medicare tax to your income and gains in respect of your investment in ordinary shares or ADSs.
|
|
|
| 276 |
|
BP Annual Report and Form 20-F 2013 |
Major shareholders
The disclosure of certain major and significant shareholdings in the share capital of the company is governed by the Companies Act 2006, the UK Financial Conduct
Authority’s Disclosure and Transparency Rules (DTR) and the US Securities Exchange Act of 1934.
Register of members holding BP ordinary
shares as at 31 December 2013
|
|
|
|
|
|
|
|
|
|
|
|
|
| Range of holdings |
|
|
Number of
ordinary
shareholders |
|
|
|
Percentage of total
ordinary
shareholders |
|
|
|
Percentage of total
ordinary share capital excluding shares
held in treasury |
|
| 1-200 |
|
|
58,190 |
|
|
|
20.46 |
|
|
|
0.02 |
|
| 201-1,000 |
|
|
101,442 |
|
|
|
35.68 |
|
|
|
0.29 |
|
| 1,001-10,000 |
|
|
112,294 |
|
|
|
39.49 |
|
|
|
1.82 |
|
| 10,001-100,000 |
|
|
10,920 |
|
|
|
3.84 |
|
|
|
1.18 |
|
| 100,001-1,000,000 |
|
|
823 |
|
|
|
0.29 |
|
|
|
1.67 |
|
| Over 1,000,000a |
|
|
678 |
|
|
|
0.24 |
|
|
|
95.02 |
|
| Totals |
|
|
284,347 |
|
|
|
100.00 |
|
|
|
100.00 |
|
| a |
Includes JPMorgan Chase Bank, N.A. holding 28.70% of the total ordinary issued share capital (excluding shares held in treasury) as the approved depositary for ADSs, a breakdown of which is shown in the table below.
|
Register of holders of American depositary shares (ADSs) as at 31 December
2013a
|
|
|
|
|
|
|
|
|
|
|
|
|
| Range of holdings |
|
|
Number of
ADS holders |
|
|
|
Percentage of total
ADS holders |
|
|
|
Percentage of total
ADSs |
|
| 1-200 |
|
|
58,281 |
|
|
|
57.60 |
|
|
|
0.36 |
|
| 201-1,000 |
|
|
27,376 |
|
|
|
27.06 |
|
|
|
1.47 |
|
| 1,001-10,000 |
|
|
14,699 |
|
|
|
14.53 |
|
|
|
4.34 |
|
| 10,001-100,000 |
|
|
809 |
|
|
|
0.80 |
|
|
|
1.51 |
|
| 100,001-1,000,000 |
|
|
10 |
|
|
|
0.01 |
|
|
|
0.16 |
|
| Over 1,000,000b |
|
|
1 |
|
|
|
0.00 |
|
|
|
92.16 |
|
| Totals |
|
|
101,176 |
|
|
|
100.00 |
|
|
|
100.00 |
|
| a |
One ADS represents six 25 cent ordinary shares. |
| b |
One holder of ADSs represents 868,478 underlying shareholders. |
As at 31 December 2013, there were also 1,510
preference shareholders. Preference shareholders represented 0.45% and ordinary shareholders represented 99.55% of the total issued nominal share capital of the company (excluding shares held in treasury) as at that date.
In accordance with DTR 5, we have received notification that as at 31 December 2013 BlackRock, Inc held 5.61%, Legal & General Group plc held 3.50% and The
Capital Group Companies, Inc held 3.37% of the voting rights of the issued share capital of the company. As at 18 February 2014 BlackRock, Inc held 5.73%, Legal & General Group plc held 3.51% and The Capital Group Companies, Inc. held 3.35%
of the voting rights of the issued share capital of the company.
Under the US Securities Exchange Act of 1934 BP has received notification of the following interests
as at 18 February 2014:
|
|
|
|
|
|
|
|
|
| Holder |
|
|
Holding of
ordinary shares |
|
|
|
Percentage
of ordinary
share capital excluding
shares held in treasury |
|
| JPMorgan Chase Bank N.A., depositary for ADSs, through its nominee Guaranty Nominees Limited |
|
|
5,260,972,053 |
|
|
|
28.51 |
|
| BlackRock, Inc. |
|
|
1,057,431,913 |
|
|
|
5.73 |
|
The company’s major shareholders do not have different voting rights.
The company has also been notified of the following interests in preference shares as at 18 February 2014:
|
|
|
|
|
|
|
|
|
| Holder |
|
|
Holding of 8%
cumulative first preference shares |
|
|
|
Percentage
of class |
|
| The National Farmers Union Mutual Insurance Society |
|
|
945,000 |
|
|
|
13.07 |
|
| M & G Investment Management Ltd. |
|
|
528,150 |
|
|
|
7.30 |
|
| Smith & Williamson Investment Management Ltd. |
|
|
409,200 |
|
|
|
5.66 |
|
| Duncan Lawrie Ltd. |
|
|
364,876 |
|
|
|
5.04 |
|
|
|
|
|
|
|
|
|
|
| Holder |
|
|
Holding of 9%
cumulative second preference shares |
|
|
|
Percentage
of class |
|
| The National Farmers Union Mutual Insurance Society |
|
|
987,000 |
|
|
|
18.03 |
|
| M & G Investment Management Ltd. |
|
|
644,450 |
|
|
|
11.77 |
|
| Smith & Williamson Investment Management Ltd. |
|
|
352,000 |
|
|
|
6.43 |
|
| Royal London Asset Management Ltd. |
|
|
338,000 |
|
|
|
6.18 |
|
Lazard Asset Management Limited disposed of its interests in 374,000 8% cumulative first preference shares and 404,500 9% cumulative
second preference shares during 2011.
Gartmore Investment Management Limited disposed of its interest in 394,538 8% cumulative first preference shares and 500,000 9%
cumulative second preference shares during 2010.
In accordance with DTR 5.8.12, The Capital Group of Companies, Inc. notified the company on 24 September 2012
that due to their group reorganization their holdings would not be reported separately but as a combined holdings thereby taking their interest in shares above the 3% threshold as of 1 September 2012.
As at 18 February 2014, the total preference shares in issue comprised only 0.45% of the company’s total issued nominal share capital (excluding shares held in
treasury), the rest being ordinary shares.
No changes in interests in the share capital of the company have been notified to the company in accordance with
DTR 5 between 31 December 2013 and 18 February 2014.
|
|
|
|
|
| BP Annual Report and Form 20-F 2013 |
|
|
277 |
|
Purchases of equity securities by the issuer
and affiliated purchasers
On 22 March 2013 BP announced the start of a share repurchase, or buyback, programme (the buyback programme). The buyback
programme is expected to return up to $8 billion to BP shareholders. As at 18 February 2014 the total number of ordinary shares repurchased under the buyback programme since 22 March 2013 was 947,930,354 at a cost of $7,065 million including
transaction costs. The following table provides details of this share repurchase activity under the buyback programme as well as details of ordinary share purchases made by the Employee Share Ownership Plans (ESOPs) and other purchases of ordinary
shares and ADSs made to satisfy the requirements of certain employee share-based payment plans.
|
|
|
|
|
|
|
|
|
|
|
|
|
|
|
|
|
|
|
|
|
|
|
| |
|
|
|
|
Total number
of shares
purchased |
a |
|
|
Average price
paid per share
$ |
|
|
|
Number
of
shares
purchased by ESOPs or for
certain employee
share-based
payment plans |
b |
|
|
Number
of shares
purchased
as part of publicly announced
programmes |
c |
|
|
Maximum
approximate
dollar value
of shares
that may yet
be purchased
under the
programme
$ million |
|
| 2013 |
|
|
|
|
|
|
|
|
|
|
|
|
|
|
|
|
|
|
|
|
|
|
| January |
|
|
|
|
– |
|
|
|
– |
|
|
|
– |
|
|
|
– |
|
|
|
– |
|
| February |
|
|
|
|
– |
|
|
|
– |
|
|
|
– |
|
|
|
– |
|
|
|
– |
|
| March 22 – March 28 |
|
|
|
|
21,400,000 |
|
|
|
7.04 |
|
|
|
– |
|
|
|
21,400,000 |
|
|
|
7,849 |
|
| April 2 – April 30 |
|
|
|
|
102,573,190 |
|
|
|
6.94 |
|
|
|
1,800,000 |
|
|
|
100,773,190 |
|
|
|
7,150 |
|
| May 1 – May 31 |
|
|
|
|
91,671,000 |
|
|
|
7.25 |
|
|
|
– |
|
|
|
91,671,000 |
|
|
|
6,485 |
|
| June 3 – June 28 |
|
|
|
|
74,649,000 |
|
|
|
7.14 |
|
|
|
– |
|
|
|
74,649,000 |
|
|
|
5,952 |
|
| July 1 – July 31 |
|
|
|
|
66,536,585 |
|
|
|
7.07 |
|
|
|
– |
|
|
|
66,536,585 |
|
|
|
5,482 |
|
| August 1 – August 31 |
|
|
|
|
57,395,332 |
|
|
|
6.90 |
|
|
|
10,245,332 |
|
|
|
47,150,000 |
|
|
|
5,155 |
|
| September 2 – September 30 |
|
|
|
|
64,540,000 |
|
|
|
7.08 |
|
|
|
1,860,000 |
|
|
|
62,680,000 |
|
|
|
4,711 |
|
| October 1 – October 31 |
|
|
|
|
92,100,761 |
|
|
|
7.22 |
|
|
|
1,020,000 |
|
|
|
91,080,761 |
|
|
|
4,053 |
|
| November 1 – November 29 |
|
|
|
|
129,680,000 |
|
|
|
7.87 |
|
|
|
– |
|
|
|
129,680,000 |
|
|
|
3,032 |
|
| December 2 – December 31 |
|
|
|
|
99,933,273 |
|
|
|
7.83 |
|
|
|
32,700,000 |
|
|
|
67,233,273 |
|
|
|
2,507 |
|
|
|
|
|
|
|
|
| 2014 |
|
|
|
|
|
|
|
|
|
|
|
|
|
|
|
|
|
|
|
|
|
|
| January 2 – January 31 |
|
|
|
|
162,240,000 |
|
|
|
8.09 |
|
|
|
– |
|
|
|
162,240,000 |
|
|
|
1,194 |
|
| February 3 to February 18 |
|
|
|
|
34,836,545 |
|
|
|
7.92 |
|
|
|
2,000,000 |
|
|
|
32,836,545 |
|
|
|
934 |
|
| a |
All share purchases were of ordinary shares of 25 cents each and/or ADSs (each representing six ordinary shares) and were on/open market transactions. |
| b |
Transactions represent the purchase of ordinary shares by ESOPs and other purchases of ordinary shares and ADSs made to satisfy requirements of certain employee share-based payment plans. |
| c |
At the AGMs on 12 April 2012 and 11 April 2013, authorization was given in each case to repurchase up to 1.9 billion ordinary shares in the period to the next AGM in 2013 and 2014, respectively or 12 July 2013 and
11 July 2014, respectively, being the latest dates by which an AGM must be held for the relevant year. This authorization is renewed annually at the AGM. All shares were purchased for cancellation to reduce BP’s issued share capital. The total number of ordinary shares purchased during 2013 under the buyback programme was 752,853,809 at a cost of $5,493 million (including transaction costs) representing 4.04% of BP’s issued
share capital excluding shares held in treasury on 31 December 2013. |
Fees and charges payable by ADSs holders
The Depositary collects fees for delivery and surrender of ADSs directly from investors depositing shares or surrendering ADSs for the purpose of withdrawal or from
intermediaries acting for them. The Depositary collects fees for making distributions to investors by deducting those fees from the amounts distributed or by selling a portion of the distributable property to pay the fees.
The charges of the Depositary payable by investors are as follows:
|
|
|
|
|
|
|
|
|
| Type of service |
|
|
|
Depositary actions |
|
|
|
Fee |
| Depositing or substituting the underlying shares |
|
|
|
Issuance of ADSs against the deposit of shares, including deposits and issuances in respect of:
• Share distributions, stock splits, rights, merger.
• Exchange of securities or other transactions or event or other distribution affecting the ADSs or deposited
securities. |
|
|
|
$5.00 per 100 ADSs (or portion thereof) evidenced by the new ADSs delivered. |
| Selling or exercising rights |
|
|
|
Distribution or sale of securities, the fee being in an amount equal to the fee for the execution and delivery of ADSs that would have been charged as a result of the deposit of such
securities. |
|
|
|
$5.00 per 100 ADSs (or portion thereof). |
| Withdrawing an underlying share |
|
|
|
Acceptance of ADSs surrendered for withdrawal of deposited securities. |
|
|
|
$5.00 for each 100 ADSs (or portion thereof) evidenced by the ADSs surrendered. |
| Expenses of the Depositary |
|
|
|
Expenses incurred on behalf of holders in connection with:
• Stock transfer or other taxes and governmental charges.
• Cable, telex, electronic and facsimile transmission, delivery.
• Transfer or registration fees, if applicable, for the registration of transfers of underlying shares.
• Expenses of the Depositary in connection with the conversion of foreign currency into US dollars (which are paid out
of such foreign currency). |
|
|
|
Expenses payable at the sole discretion of the Depositary by billing holders or by deducting charges from one or more cash dividends or other cash distributions. |
|
|
|
| 278 |
|
BP Annual Report and Form 20-F 2013 |
Fees and payments made by the Depositary
to the issuer
The Depositary has agreed to reimburse certain company expenses related to the company’s ADS programme and incurred by the company
in connection with the ADS programme arising during the year ended 31 December 2013. The Depositary reimbursed to the company, or paid amounts on the company’s behalf to third parties, or waived its fees and expenses, of $2,815,205.43 for
the year ended 31 December 2013.
The table below sets out the types of expenses that the Depositary has agreed to reimburse and the fees it has agreed to waive
for standard costs associated with the administration of the ADS programme relating to the year ended 31 December 2013. The Depositary has also paid certain expenses directly to third parties on behalf of the company.
|
|
|
|
|
| Category of expense reimbursed,
waived or paid directly to third parties |
|
|
Amount reimbursed, waived or paid
directly
to third parties for the year ended 31 December 2013 |
|
| NYSE listing fees reimbursed |
|
|
$420,168 |
|
| Service fees and out of pocket expenses waiveda |
|
|
$1,428,022.6 |
|
| Broker fees reimbursedb |
|
|
$858,306.07 |
|
| Other third-party mailing costs reimbursedc |
|
|
$108,708.76 |
|
| Total |
|
|
$2,815,205.43 |
|
| a |
Includes fees in relation to transfer agent costs and costs of the BP Scrip Dividend Programme operated by JPMorgan Chase Bank, N.A. |
| b |
Broker reimbursements are fees payable to Broadridge for the distribution of hard copy material to ADR beneficial holders in the Depository Trust Company. Corporate materials include information related to
shareholders’ meetings and related voting instructions. These fees are SEC approved. |
| c |
Payment of fees to Precision IR for proxy solicitation and investor support.
|
Under certain circumstances, including removal of the Depositary or termination of the ADR programme by the company, the
company is required to repay the Depositary amounts reimbursed and/or expenses paid to or on behalf of the company during the 12-month period prior to notice of removal or termination.
Documents on display
BP Annual Report and Form 20-F 2013 and BP Strategic Report 2013 are also available online at bp.com/annualreport. Shareholders may obtain a hard copy of
BP’s complete audited financial statements, free of charge, by contacting BP Distribution Services at +44 (0)870 241 3269 or via an email request addressed to bpdistributionservices@bp.com or from Precision IR at +1 888 301 2505 or
via an email request addressed to bpreports@precisionir.com if in the US and Canada.
The company is subject to the information requirements of the US
Securities Exchange Act of 1934 applicable to foreign private issuers. In accordance with these requirements, the company files its Annual Report on Form 20-F and other related documents with the SEC. It is possible to read and copy documents that
have been filed with the SEC at the SEC’s public reference room located at 100 F Street NE, Washington, DC 20549, US. You may also call the SEC at +1 800-SEC-0330. In addition, BP’s SEC filings are available to the public at the SEC’s
website. BP discloses on its website at bp.com/NYSEcorporategovernancerules, and in this report (see Corporate governance practices (Form 20-F Item 16G) on page 110) significant ways (if any) in which its corporate governance practices
differ from those mandated for US companies under NYSE listing standards.
|
|
|
|
|
| BP Annual Report and Form 20-F 2013 |
|
|
279 |
|
Administration
If you have any queries about the administration of shareholdings, such as change of address, change of ownership, dividend payments or the Scrip Dividend Programme or to
change the way you receive your company documents (such as the BP Annual Report and Form 20-F, BP Strategic Report and Notice of BP Annual General Meeting) please contact the BP Registrar or the BP ADS Depositary.
Ordinary and preference shareholders
The BP Registrar
Capita Asset Services
The Registry, 34 Beckenham Road
Beckenham, Kent BR3 4TU, UK
Freephone in UK 0800 701107
From outside the UK +44 (0)20 3170 3678
Textphone 0871 664 0532; fax +44 (0)1484
601512
Please note that any numbers quoted with the prefix 0871 will be charged at 10p per minute from a BT landline. Other network providers’ costs may
vary and calls from mobiles will be considerably higher.
ADS holders
JPMorgan Chase Bank, N.A. PO Box 64504
St Paul, MN 55164-0504, US
Toll-free in US and Canada +1 877 638 5672
From outside the US and Canada +1 651 306
4383
Annual general meeting
The 2014 AGM will be held on Thursday, 10 April 2014 at 11.30 a.m. at ExCeL London, One Western Gateway, Royal Victoria Dock, London E16 1XL. A separate notice
convening the meeting is distributed to shareholders, which includes an explanation of the items of business to be considered at the meeting.
All resolutions for
which notice has been given, will be decided on a poll. Ernst & Young LLP have expressed their willingness to continue in office as auditors and a resolution for their reappointment is included in the Notice of BP Annual General Meeting
2014.
The Directors’ report on pages 59-80, 109-114, 116, 200-223 and 235-280 was approved by the board and signed on its
behalf by David J Jackson, Company Secretary on 6 March 2014.
BP p.l.c.
Registered in England and Wales No. 102498
|
|
|
| 280 |
|
BP Annual Report and Form 20-F 2013 |
Signatures
The registrant hereby certifies that it meets all of the requirements for filing on Form 20-F and that it has duly caused and authorized the undersigned to sign this
annual report on its behalf.
BP p.l.c.
(Registrant)
/s/ David J Jackson
Company
Secretary
6 March 2014
|
|
|
|
|
| BP Annual Report and Form 20-F 2013 |
|
|
281 |
|
Cross reference to Form 20-F
|
|
|
|
|
|
|
|
|
|
|
|
|
|
|
|
Page |
|
| Item 1. |
|
|
|
Identity of Directors, Senior Management and Advisors |
|
|
n/a |
|
| Item 2. |
|
|
|
Offer Statistics and Expected Timetable |
|
|
n/a |
|
| Item 3. |
|
|
|
Key Information |
|
|
|
|
|
|
A. |
|
Selected financial data |
|
|
236 |
|
|
|
B. |
|
Capitalization and indebtedness |
|
|
n/a |
|
|
|
C. |
|
Reasons for the offer and use of proceeds |
|
|
n/a |
|
|
|
D. |
|
Risk factors |
|
|
51-55 |
|
| Item 4. |
|
|
|
Information on the Company |
|
|
|
|
|
|
A. |
|
History and development of the company |
|
|
ii, 2-40, 56-58, 236, 239-243 |
|
|
|
B. |
|
Business overview |
|
|
2-5, 10-19, 23-58, 149-154, 239-257, 269-271 |
|
|
|
C. |
|
Organizational structure |
|
|
193 |
|
|
|
D. |
|
Property, plants and equipment |
|
|
25-37, 191, 222-223, 239-251, 268 |
|
| Item 4A. |
|
|
|
Unresolved Staff Comments |
|
|
None |
|
| Item 5. |
|
|
|
Operating and Financial Review and Prospects |
|
|
|
|
|
|
A. |
|
Operating results |
|
|
23-25, 27-28, 31-33, 36-37, 40, 56-58,
126, 252
|
|
|
|
B. |
|
Liquidity and capital resources |
|
|
56-58, 75, 132-133, 161, 166-170, 172-176,
191 |
|
|
|
C. |
|
Research and development, patent and licenses |
|
|
16-17, 35, 37, 154 |
|
|
|
D. |
|
Trend information |
|
|
10-11, 22-37 |
|
|
|
E. |
|
Off-balance sheet arrangements |
|
|
57, 252-253 |
|
|
|
F. |
|
Tabular disclosure of contractual commitments |
|
|
57, 252-253 |
|
|
|
G. |
|
Safe harbor |
|
|
n/a |
|
| Item 6. |
|
|
|
Directors, Senior Management and Employees |
|
|
|
|
|
|
A. |
|
Directors and senior management |
|
|
60-68 |
|
|
|
B. |
|
Compensation |
|
|
82-108, 158, 178-181, 190 |
|
|
|
C. |
|
Board practices |
|
|
61-65, 71, 74-80, 90, 105, 108 |
|
|
|
D. |
|
Employees |
|
|
47-48, 189-190 |
|
|
|
E. |
|
Share ownership |
|
|
48, 91, 93-95, 189-190 |
|
| Item 7. |
|
|
|
Major Shareholders and Related Party Transactions |
|
|
|
|
|
|
A. |
|
Major shareholders |
|
|
277 |
|
|
|
B. |
|
Related party transactions |
|
|
163-166, 268 |
|
|
|
C. |
|
Interests of experts and counsel |
|
|
n/a |
|
| Item 8. |
|
|
|
Financial Information |
|
|
|
|
|
|
A. |
|
Consolidated statements and other financial information |
|
|
56, 120-199, 257-268, 274-275 |
|
|
|
B. |
|
Significant changes |
|
|
None |
|
| Item 9. |
|
|
|
The Offer and Listing |
|
|
|
|
|
|
A. |
|
Offer and listing details |
|
|
274 |
|
|
|
B. |
|
Plan of distribution |
|
|
n/a |
|
|
|
C. |
|
Markets |
|
|
274 |
|
|
|
D. |
|
Selling shareholders |
|
|
n/a |
|
|
|
E. |
|
Dilution |
|
|
n/a |
|
|
|
F. |
|
Expenses of the issue |
|
|
n/a |
|
| Item 10. |
|
|
|
Additional Information |
|
|
|
|
|
|
A. |
|
Share capital |
|
|
n/a |
|
|
|
B. |
|
Memorandum and articles of association |
|
|
112-114 |
|
|
|
C. |
|
Material contracts |
|
|
268 |
|
|
|
D. |
|
Exchange controls |
|
|
275 |
|
|
|
E. |
|
Taxation |
|
|
275-276 |
|
|
|
F. |
|
Dividends and paying agents |
|
|
n/a |
|
|
|
G. |
|
Statements by experts |
|
|
n/a |
|
|
|
H. |
|
Documents on display |
|
|
279 |
|
|
|
I. |
|
Subsidiary information |
|
|
193 |
|
| Item 11. |
|
|
|
Quantitative and Qualitative Disclosures about Market Risk |
|
|
166-170, 172-176 |
|
| Item 12. |
|
|
|
Description of securities other than equity securities |
|
|
|
|
|
|
A. |
|
Debt Securities |
|
|
n/a |
|
|
|
B. |
|
Warrants and Rights |
|
|
n/a |
|
|
|
C. |
|
Other Securities |
|
|
n/a |
|
|
|
D. |
|
American Depositary Shares |
|
|
278-279 |
|
| Item 13. |
|
|
|
Defaults, Dividend Arrearages and Delinquencies |
|
|
None |
|
| Item 14. |
|
|
|
Material Modifications to the Rights of Security Holders and Use of Proceeds |
|
|
None |
|
| Item 15. |
|
|
|
Controls and Procedures |
|
|
111, 121 |
|
| Item 16A. |
|
|
|
Audit Committee Financial Expert |
|
|
74 |
|
| Item 16B. |
|
|
|
Code of Ethics |
|
|
111 |
|
| Item 16C. |
|
|
|
Principal Accountant Fees and Services |
|
|
111, 192 |
|
| Item 16D. |
|
|
|
Exemptions from the Listing Standards for Audit Committees |
|
|
n/a |
|
| Item 16E. |
|
|
|
Purchases of Equity Securities by the Issuer and Affiliated Purchasers |
|
|
278 |
|
| Item 16F. |
|
|
|
Change in Registrant’s Certifying Accountant |
|
|
None |
|
| Item 16G. |
|
|
|
Corporate governance |
|
|
110-111 |
|
| Item 17. |
|
|
|
Financial Statements |
|
|
n/a |
|
| Item 18. |
|
|
|
Financial Statements |
|
|
120-199 |
|
| Item 19. |
|
|
|
Exhibits |
|
|
269 |
|
|
|
|
| 282 |
|
BP Annual Report and Form 20-F 2013 |

BP’s corporate reporting suite includes information about our
financial and operating performance, sustainability performance
and also on global energy trends and projections.
|
|
|
|
|
|
|
|
|
|
|

|
|
Annual Report and Form 20-F 2013 Details of our financial and
operating performance in print or online. Published in March.
bp.com/annualreport |
|

|
|
Strategic Report 2013 A summary
of our financial and operating performance in print or online.
Published in March. bp.com/annualreport |
|

|
|
Energy Outlook 2035 Projections
for world energy markets, considering the potential evolution of global
economy, population, policy and technology.
Published in January. bp.com/energyoutlook |
|
|
|
|
|
|

|
|
Sustainability Review 2013 A
summary of our sustainability reporting with additional information online.
Published in March. bp.com/sustainability |
|

|
|
Financial and Operating Information 2009-2013 Five-year financial and
operating data in PDF or Excel format.
Published in April. bp.com/financialandoperating |
|

|
|
Statistical Review of World Energy 2014 An objective review of key global
energy trends. Published in June.
bp.com/statisticalreview |
|
|
|
|
|
|
|
| You can order BP’s
printed publications free
of charge from: |
|
US and Canada
Precision IR Toll-free: +1 888 301 2505
Fax: +1 804 327 7549 bpreports@precisionir.com
UK and rest of world
BP Distribution Services Tel: +44 (0)870 241 3269
Fax: +44 (0)870 240 5753 bpdistributionservices@bp.com |
|
Feedback
Your feedback is important to us. You can email the corporate reporting team at corporatereporting@bp.com
or provide your feedback online at bp.com/annualreportfeedback |
|
You can also telephone +44 (0)20
7496 4000 or write to:
Corporate reporting BP p.l.c.
1 St James’s Square London SW1Y 4PD
UK |
|
|
|
|
|
|
|
| Acknowledgements |
|
Paper |
|
© BP p.l.c. 2014 |
| Design Typesetting
Printing |
|
Salterbaxter RR Donnelley
Pureprint Group Limited, UK, ISO 14001,
FSC® certified and CarbonNeutral® |
|
This document is printed on Oxygen paper and board. Oxygen is made using 100%
recycled pulp, a large percentage of which is de-inked. It is manufactured at a mill
with ISO 9001 and 14001 accreditation and is FSC® (Forest Stewardship Council) certified.
This document has been printed using vegetable inks.

Printed in the UK by Pureprint Group using their
alcofree• and pureprint• printing technology. |
|
|
| Photography |
|
Shahin Abasaliyev, Pankaj Anand, Moritz Brilo, Jon Challicom,
Stuart Conway, Richard Davies, Joshua Drake, Rocky Kneten,
Simon Kreitem, Kate Kunz, Andy McAuslan, Marc Morrison,
Aaron Tait, Bob Wheeler |
|
|