Report to Shareholders for the fourth quarter ended December 31, 2019

All financial figures are unaudited and presented in Canadian dollars unless noted otherwise. Production volumes are presented on a working-interest basis, before royalties, except for Libya, which are presented on an economic basis. Certain financial measures in this Report to Shareholders (this document) are not prescribed by Canadian generally accepted accounting principles (GAAP). For a description of these non-GAAP financial measures, see the Non-GAAP Financial Measures Advisory section of this document. See also the Advisories section of this document. References to Oil Sands operations exclude Suncor's interests in Fort Hills and Syncrude.
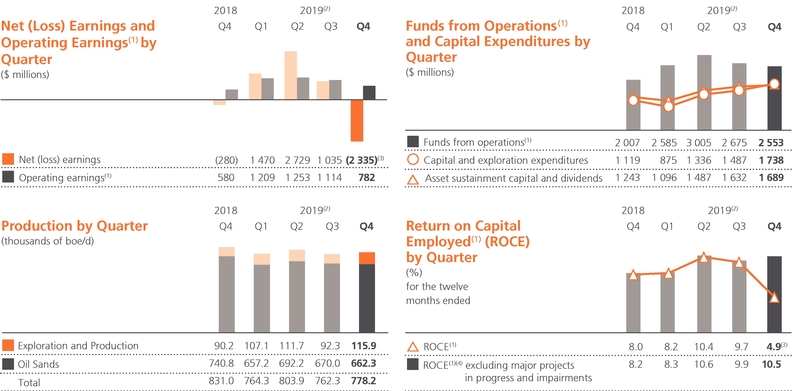
"In the fourth quarter of 2019, Suncor generated funds from operations of $2.6 billion, bringing annual funds from operations to a new record of $10.8 billion," said Mark Little, president and chief executive officer. "In 2019, we returned $4.9 billion in dividends and share repurchases to shareholders, representing 45% of our total funds from operations. Since the start of 2017, we have paid $7.1 billion in dividends and repurchased $6.7 billion of shares, representing over 9% of our outstanding common shares, demonstrating our commitment to shareholder returns."
- •
- Funds
from operations(1) were $2.553 billion ($1.66 per common share) in the fourth quarter of 2019, compared to $2.007 billion ($1.26 per common
share) in the prior year quarter, marking the tenth consecutive quarter above $2 billion. Cash flow provided by operating activities was $2.304 billion in the fourth quarter of 2019,
compared to $3.040 billion in the prior year quarter, as the prior year quarter included a source of cash in working capital associated with a declining price environment.
- •
- Operating
earnings(1) were $782 million ($0.51 per common share) in the fourth quarter of 2019, compared to $580 million ($0.36 per common share)
in the prior year quarter. The company had a net loss of $2.335 billion ($1.52 per common share) in the fourth quarter of 2019 due to non-cash asset impairment charges of $3.352 billion
after-tax primarily due to lower forecasted heavy oil prices for Fort Hills and higher capital cost estimates for the West White Rose Project, compared to a net loss of $280 million ($0.18 per
common share) in the prior year quarter.
- •
- In
the fourth quarter of 2019, Suncor demonstrated its continued focus on value over volume as Oil Sands operations achieved synthetic crude oil (SCO) production of
300,000 barrels per day (bbls/d) and upgrader utilization of 86%, compared to SCO production of 273,400 bbls/d and upgrader utilization of 79% in the prior year period, with both periods
impacted by maintenance.
- •
- Total
Exploration and Production (E&P) production during the fourth quarter of 2019 increased to 115,900 barrels of oil equivalent per day (boe/d) from
90,200 boe/d in the prior year quarter. The increase was primarily due to higher production in East Coast Canada, which increased to 69,600 bbls/d, from 47,900 bbls/d in the prior
year quarter.
- •
- Reliable
operations in Refining and Marketing drove refinery utilization of 97% and crude throughput of 447,500 bbls/d.
- •
- Suncor
sanctioned the Forty Mile Wind Power Project, which is expected to drive value through sustainable low-carbon power generation and the retention of generated carbon
credits for utilization in Suncor's upstream business.
- •
- Subsequent to the end of the quarter, Suncor's Board of Directors (the Board) approved a quarterly dividend of $0.465 per share, an increase of 11%. The Board also approved an increase to the company's existing share repurchase program from $2.0 billion to $2.5 billion through to the end of February 2020 and a further annual extension of the share repurchase program up to $2.0 billion, beginning March 1, 2020, demonstrating confidence in the company's ability to generate cash flow and its commitment to return cash to shareholders.
|
- (1)
- Funds
from operations, operating earnings and ROCE are non-GAAP financial measures. See page 5 for a reconciliation of net loss to operating earnings. See the Non-GAAP
Financial Measures Advisory section of this document.
- (2)
- Includes
the impact of the Government of Alberta's mandatory production curtailments.
- (3)
- Includes
asset impairment charges of $3.352 billion after-tax.
- (4)
- ROCE excluding major projects in progress and impairments would have been 8.7%, 8.0%, and 8.6% for the second quarter of 2019, third quarter of 2019, and fourth quarter of 2019, respectively, excluding the impacts of the $1.116 billion deferred tax recovery for the Alberta corporate income tax rate change in the second quarter of 2019.
Financial Results
Operating Earnings
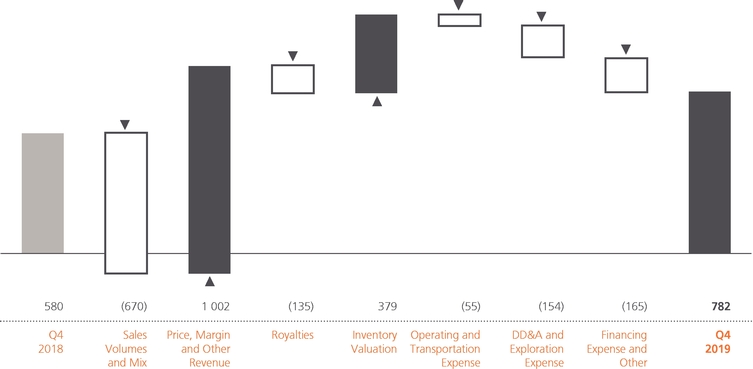
Suncor's fourth quarter 2019 operating earnings were $782 million ($0.51 per common share), compared to $580 million ($0.36 per common share) in the prior year quarter. The increase was primarily a result of improved western Canadian crude oil differentials, including a substantial narrowing of heavy crude and SCO differentials, which more than offset lower benchmark pricing, from the prior year quarter. This resulted in an increase in Oil Sands price realizations and a net favourable inventory valuation change, partially offset by lower refining margins. Fourth quarter 2019 operating earnings were also positively impacted by increased production at East Coast Canada and Oda.
Operating earnings were unfavourably impacted by lower Oil Sands production compared to the prior year quarter, primarily due to planned maintenance and the Alberta government's mandatory production curtailments, higher depreciation, depletion, and amortization (DD&A) and royalties, and lower refinery crude throughput.
Bridge Analysis of Operating Earnings ($ millions)(1)
- (1)
- For an explanation of this bridge analysis, see the Non-GAAP Financial Measures Advisory section of this document.
Net Loss
Suncor's net loss was $2.335 billion ($1.52 per common share) in the fourth quarter of 2019, compared to a net loss of $280 million ($0.18 per common share) in the prior year quarter. In addition to the factors impacting operating earnings discussed above, the net loss for the fourth quarter of 2019 included $3.352 billion of non-cash after-tax asset impairment charges partially offset by a $235 million unrealized after-tax foreign exchange gain on the revaluation of U.S. dollar denominated debt. The net loss in the prior year quarter included an unrealized after-tax foreign exchange loss of $637 million on the revaluation of U.S. dollar denominated debt and a non-cash impairment loss of $223 million after-tax on one of the company's equity investments.
Funds from Operations and Cash Flow Provided By Operating Activities
Funds from operations were $2.553 billion ($1.66 per common share) in the fourth quarter of 2019, compared to $2.007 billion ($1.26 per common share) in the fourth quarter of 2018, and were influenced primarily by the same factors impacting operating earnings noted above.
Cash flow provided by operating activities was $2.304 billion ($1.50 per common share) for the fourth quarter of 2019, compared to $3.040 billion ($1.90 per common share) for the fourth quarter of 2018. In addition to the items impacting operating earnings noted above, cash flow provided by operating activities was further impacted by a use of cash from working capital in the current quarter as compared to a source of cash in the prior year quarter. The use of cash in the company's non-cash working capital balances was primarily due to an increase in accounts receivable related to increasing refinery margins at the end of the quarter and higher upstream sales volumes.
| 2 2019 FOURTH QUARTER Suncor Energy Inc. | | |
Operating Results
Suncor's total upstream production was 778,200 boe/d during the fourth quarter of 2019, compared to 831,000 boe/d in the prior year quarter. The decrease was primarily due to lower Oil Sands production as a result of planned maintenance and mandatory production curtailments in the province of Alberta. E&P production volumes increased from the prior year quarter, primarily due to higher production from East Coast Canada and Oda.
During the fourth quarter of 2019, the company continued to leverage its regional footprint and asset flexibility to maximize the value of its allotted barrels under the mandatory production curtailment program. The company was able to optimize the transfer of our allotted curtailment credits among the company's assets during planned maintenance at Oil Sands operations and Syncrude, while continuing to focus on higher value SCO production. Upon completion of maintenance in the quarter, the company was able to purchase additional curtailment credits from third parties, as well as capitalize on the Special Production Allowances announced by the Government of Alberta on October 31, 2019 and effective December 1, 2019. This program provides producers with temporary relief equivalent to incremental increases in rail shipments, which is anticipated to continue into 2020.
Oil Sands operations production was 418,100 bbls/d in the fourth quarter of 2019, compared to 432,700 bbls/d in the prior year quarter. The decrease in production was primarily due to maintenance, including planned annual coker maintenance at Oil Sands Base, increased yield loss associated with higher SCO production, mandatory production curtailments and an outage at MacKay River. MacKay River is expected to return to operation early in the second quarter of 2020, after completion of planned maintenance which has been accelerated to the first quarter of 2020 to coincide with the outage in an effort to minimize the impacts to annual production. As a result of strong upgrader reliability, SCO production increased to 300,000 bbls/d in the fourth quarter of 2019, despite maintenance, compared to 273,400 bbls/d in the fourth quarter of 2018, representing utilization rates of 86% and 79%, respectively. Production of non-upgraded bitumen from the company's In Situ assets was 118,100 bbls/d in the fourth quarter of 2019, compared to 159,300 bbls/d in the prior year quarter, primarily impacted by the outage at MacKay River and management of mandatory production curtailments, which increased volumes diverted to upgrading as we continue to focus on value over volume through the production of higher value SCO.
Oil Sands operations cash operating costs(1) per barrel increased to $28.55 in the fourth quarter of 2019, from $24.50 in the prior year quarter, reflecting the impact of lower production volumes discussed above, higher costs associated with increased production of higher value SCO barrels, as well as an increase in contractor mining, shovel maintenance and commodity costs.
Suncor's share of production from Fort Hills averaged 87,900 bbls/d in the fourth quarter of 2019, compared to 98,500 bbls/d in the prior year quarter. The decrease in production was due to planned maintenance, which was completed during the quarter, and mandatory production curtailments. Fort Hills remains adversely impacted by mandatory production curtailment due to the continued, disproportionate effect of curtailment as it is applied on a 2018 production basis when the asset was ramping up to full production rates. However, the company was able to partially mitigate production impacts by internally transferring credits from Oil Sands operations and purchasing third-party credits.
Fort Hills cash operating costs(1) per barrel averaged $28.65 in the fourth quarter of 2019, compared to $24.85 in the prior year quarter, reflecting the impact of lower production volumes and slightly higher cash operating costs due to the increase in planned maintenance.
Suncor's share of Syncrude production was 156,300 bbls/d in the fourth quarter of 2019, compared to 209,600 bbls/d in the prior year quarter. The decrease in production was primarily due to planned maintenance that commenced in the third quarter of 2019 and was completed within the fourth quarter, compared to no planned maintenance in the fourth quarter of 2018, and mandatory production curtailments. Upon completion of maintenance, the company was able to partially mitigate impacts of curtailment on production by internally transferring and purchasing third-party curtailment credits. Strong reliability following the maintenance was reflective of the asset's performance in the year, with 2019 marking the second best year of production in the asset's history, even when curtailed.
Syncrude cash operating costs(1) per barrel were $39.85 in the fourth quarter of 2019, an increase from $31.75 in the prior year quarter, due primarily to the decrease in production, partially offset by lower cash operating costs.
Production volumes at E&P were 115,900 boe/d in the fourth quarter of 2019, compared to 90,200 boe/d in the prior year quarter. The increase was primarily due to higher production at East Coast Canada and Oda, which began production in the first quarter of 2019, partially offset by natural declines in the United Kingdom.
- (1)
- Oil Sands operations cash operating costs, Fort Hills cash operating costs and Syncrude cash operating costs are non-GAAP financial measures. See the Non-GAAP Financial Measures Advisory section of this document.
| | | 2019 FOURTH QUARTER Suncor Energy Inc. 3 |
Refinery crude throughput was 447,500 bbls/d and refinery utilization remained strong at 97% in the fourth quarter of 2019, compared to crude throughput of 467,900 bbls/d and refinery utilization of 101% in the prior year quarter. Refined product sales increased in the fourth quarter of 2019 to 534,600 bbls/d, compared to 530,600 bbls/d in the prior year quarter, reflecting strong retail volumes.
"We demonstrated solid reliability across our refineries and upgraders during the quarter and, while we had some operational challenges, we completed significant maintenance across our upstream operations," said Little. "Our strong upgrader reliability enabled the company to opportunistically focus on value over volume, generating higher margin production during mandatory production curtailments."
Strategy Update
In the fourth quarter of 2019, Suncor remained focused on maximizing the return to its shareholders through payment of $644 million of dividends and the repurchase of 11.1 million common shares for $452 million under the company's share repurchase program. In 2019, the company returned $4.9 billion in dividends and share repurchases to shareholders, representing 45% of total funds from operations, in addition to a reduction of debt of $425 million, reflecting continued flexibility in the company's capital allocation strategy.
In the fourth quarter of 2019, the Board approved an increase to the company's share repurchase program from $2.0 billion to $2.5 billion. Following this approval, the Toronto Stock Exchange accepted a notice to increase the maximum number of shares the company may purchase pursuant to its normal course issuer bid. The increase to the program demonstrates confidence in the company's ability to generate cash flow and its commitment to return cash to shareholders.
Subsequent to the end of the quarter, the Board approved a quarterly dividend of $0.465 per share, an increase of 11%, and also approved authority to repurchase shares of up to $2.0 billion beginning March 1, 2020.
Suncor continues to advance projects and investments intended to incrementally and sustainably grow annual free funds flow by reducing operating and sustainment costs, and investing in projects that enhance value within our existing integrated asset base, while moving forward in the areas of safety, reliability and sustainability.
Suncor is focused on low capital intensity, value-creating projects including the cogeneration facility announced in the third quarter of 2019, the continued implementation of autonomous haul trucks, tailings technology advancements, the Syncrude bi-directional pipelines, and digital technology adoption, which underscores our commitment to deliver growth that is economically robust, technologically progressive and delivers leading sustainable outcomes.
The company is committed to its goal to reduce total greenhouse gas (GHG) emissions intensity by 30% by 2030 and continues to invest in low-carbon innovation aimed at reducing the carbon footprint of our operations and the products we sell. In the fourth quarter of 2019, the company sanctioned the Forty Mile Wind Power Project in southern Alberta. This renewable power project has an estimated total capital spend of $300 million, with 25% of the capital spent in 2019 and the remainder to be spent over the next two years. This investment approach in renewable energy is expected to generate significant value through sustainable low-carbon power generation and the retention of generated carbon credits for utilization in Suncor's upstream business. Together with the cogeneration facility, Suncor has sanctioned projects in 2019 that are expected to achieve one-third of our GHG emissions intensity reduction goal.
In the fourth quarter of 2019, the company also finalized an additional $50 million equity investment in Enerkem Inc., a waste-to-biofuels and chemicals producer, bringing the company's total equity investment to $73 million.
"Suncor continues to invest in high-return projects and, in the fourth quarter of 2019, sanctioned the Forty Mile Wind Power Project, which is designed to provide reliable, low-carbon power to the Alberta power grid," said Little. "In addition, through our Petro-Canada brand, we are contributing to the transformation of Canada's energy system through the completion of our cross Canada network of fast-charging electric vehicle stations. These projects are expected to generate value for Suncor shareholders and contribute to the company's strategic sustainability goals."
Within our offshore business in the E&P segment, the company continued to focus on strategic production growth of existing assets including developing step-out opportunities and asset extensions. Drilling activity at Hebron is ongoing and production continues to ramp up with the completion of the tenth production well during the fourth quarter of 2019. Other E&P activity in the fourth quarter of 2019 included development drilling at Hibernia, Hebron and Buzzard, and development work on Terra Nova, Fenja and the West White Rose Projects.
| 4 2019 FOURTH QUARTER Suncor Energy Inc. | | |
Operating Earnings Reconciliation(1)
|
Three months ended December 31 |
Twelve months ended December 31 |
||||||||
($ millions) |
2019 | 2018 | 2019 | 2018 | ||||||
| | | | | | | | | | | |
Net (loss) earnings |
(2 335 | ) | (280 | ) | 2 899 | 3 293 | ||||
| | ||||||||||
Asset impairments(2) |
3 352 | — | 3 352 | — | ||||||
| | ||||||||||
Unrealized foreign exchange (gain) loss on U.S. dollar denominated debt |
(235 | ) | 637 | (590 | ) | 989 | ||||
| | ||||||||||
Impact of income tax rate adjustment on deferred taxes(3) |
— | — | (1 116 | ) | — | |||||
| | ||||||||||
Loss on equity investment and (gain) on significant disposals(4) |
— | 223 | (187 | ) | 30 | |||||
| | ||||||||||
Operating earnings(1) |
782 | 580 | 4 358 | 4 312 | ||||||
| | | | | | | | | | | |
- (1)
- Operating
earnings is a non-GAAP financial measure. All reconciling items are presented on an after-tax basis. See the Non-GAAP Financial Measures Advisory section of
this document.
- (2)
- During
the fourth quarter of 2019, the company recorded after-tax impairment charges of $2.803 billion on its share of the Fort Hills assets, in the Oil Sands segment, due to a
decline in forecasted long-term heavy crude oil prices, and $393 million against White Rose, in the E&P segment, due to increased capital cost estimates at the West White Rose Project. Refer to
note 13 in the company's unaudited interim Consolidated Financial Statements for the three and twelve months ended December 31, 2019 for further details on this item.
- (3)
- In
the second quarter of 2019, the company recorded a $1.116 billion deferred income tax recovery associated with the Government of Alberta's substantive enactment of
legislation for the staged reduction of the corporate income tax rate from 12% to 8% over the next four years.
- (4)
- The third quarter of 2019 included an after-tax gain of $48 million in the E&P segment related to the sale of certain non-core assets. The third quarter of 2018 included an after-tax gain of $60 million on the sale of the company's interest in the Joslyn Oil Sands mining project. In the second quarter of 2019, Suncor sold its 37% interest in Canbriam Energy Inc. for total proceeds and an equivalent gain of $151 million ($139 million after-tax), which had previously been written down to nil in the fourth quarter of 2018 following the company's assessment of forward natural gas prices and the impact on estimated future cash flows.
Corporate Guidance
No changes have been made to Suncor's previously announced 2020 guidance. For further details and advisories regarding Suncor's 2020 annual guidance, see www.suncor.com/guidance.
Measurement Conversions
Certain natural gas volumes in this report to shareholders have been converted to boe on the basis of one bbl to six mcf. See the Advisories section of this document.
| | | 2019 FOURTH QUARTER Suncor Energy Inc. 5 |
FOURTH QUARTER DISCUSSION
February 5, 2020
Suncor is an integrated energy company headquartered in Calgary, Alberta, Canada. We are strategically focused on developing one of the world's largest petroleum resource basins – Canada's Athabasca oil sands. In addition, we explore for, acquire, develop, produce and market crude oil in Canada and internationally; we transport and refine crude oil, and we market petroleum and petrochemical products primarily in Canada. We also operate a renewable energy business and conduct energy trading activities focused principally on the marketing and trading of crude oil, natural gas, byproducts, refined products, and power.
Additional information about Suncor filed with Canadian securities regulatory authorities and the United States Securities and Exchange Commission (SEC), including quarterly and annual reports and Suncor's Annual Information Form dated February 28, 2019 (the 2018 AIF), which is also filed with the SEC under cover of Form 40-F, is available online at www.sedar.com, www.sec.gov and our website www.suncor.com. Information contained in or otherwise accessible through our website does not form part of this document, and is not incorporated into this document by reference.
References to "we", "our", "Suncor", or "the company" mean Suncor Energy Inc., and the company's subsidiaries and interests in associates and jointly controlled entities, unless the context otherwise requires.
Table of Contents
Basis of Presentation
Unless otherwise noted, all financial information has been prepared in accordance with Canadian generally accepted accounting principles (GAAP), specifically International Accounting Standard (IAS) 34 Interim Financial Reporting as issued by the International Accounting Standards Board (IASB), which is within the framework of International Financial Reporting Standards (IFRS) as issued by the IASB.
Effective January 1, 2019, the company adopted IFRS 16 Leases (IFRS 16), which replaced the previous leasing standard IAS 17 Leases (IAS 17), and requires the recognition of all leases on the balance sheet, with optional exemptions for short-term leases where the term is twelve months or less and for leases of low value. IFRS 16 effectively removes the classification of leases as either finance or operating leases and treats all leases as finance leases for lessees. The accounting treatment for lessors remains essentially unchanged, with the requirement to classify leases as either finance or operating. Please refer to note 3 in the company's unaudited interim Consolidated Financial Statements for the three and twelve months ended December 31, 2019 for further information. The company has selected the modified retrospective transition approach, electing to adjust opening retained earnings with no restatement of comparative figures. As such, comparative information continues to be reported under IAS 17 and International Financial Reporting Interpretations Committee 4.
All financial information is reported in Canadian dollars, unless otherwise noted. Production volumes are presented on a working-interest basis, before royalties, except for Libya, which is on an economic basis.
Beginning in the first quarter of 2019, results from the company's Energy Trading business have been included within each of the respective operating business segments to which the respective trading activity relates. The Energy Trading business was previously reported within the Corporate, Energy Trading and Eliminations segment. Prior periods have been restated to reflect this change.
Also beginning in the first quarter of 2019, the company revised the classification of its capital expenditures into "asset sustainment and maintenance" and "economic investment" to better reflect the types of capital investments being made by
| 6 2019 FOURTH QUARTER Suncor Energy Inc. | | |
the company. There is no impact to overall capital expenditures, and comparative periods have been restated to reflect this change. Refer to the Capital Investment Update section of this document for further details.
References to Oil Sands operations exclude Suncor's interests in Fort Hills and Syncrude.
Non-GAAP Financial Measures
Certain financial measures in this document – namely operating earnings (loss), funds from (used in) operations, return on capital employed (ROCE), Oil Sands operations cash operating costs, Fort Hills cash operating costs, Syncrude cash operating costs, refining margin, refining operating expense, free funds flow, discretionary free funds flow, and last-in, first-out (LIFO) inventory valuation methodology and related per share amounts – are not prescribed by GAAP. Operating earnings (loss) is defined in the Non-GAAP Financial Measures Advisory section of this document and reconciled to the most directly comparable GAAP measures in the Consolidated Financial Information and Segment Results and Analysis sections of this document. Oil Sands operations cash operating costs, Fort Hills cash operating costs, Syncrude cash operating costs and LIFO are defined in the Non-GAAP Financial Measures Advisory section of this document and reconciled to the most directly comparable GAAP measures in the Segment Results and Analysis section of this document. Funds from (used in) operations, ROCE, free funds flow, discretionary free funds flow, refining margin and refining operating expense are defined and reconciled, where applicable, to the most directly comparable GAAP measures in the Non-GAAP Financial Measures Advisory section of this document.
Risk Factors and Forward-Looking Information
The company's financial and operational performance is potentially affected by a number of factors, including, but not limited to, the factors described within the Forward-Looking Information section of this document. This document contains forward-looking information based on Suncor's current expectations, estimates, projections and assumptions. This information is provided to assist readers in understanding the company's future plans and expectations and may not be appropriate for other purposes. Refer to the Forward-Looking Information section of this document for information on the material risk factors and assumptions underlying our forward-looking information contained in this document.
Measurement Conversions
Certain crude oil and natural gas liquids volumes have been converted to mcfe on the basis of one bbl to six mcf. Also, certain natural gas volumes have been converted to boe or mboe on the same basis. Any figure presented in mcfe, boe or mboe may be misleading, particularly if used in isolation. A conversion ratio of one bbl of crude oil or natural gas liquids to six mcf of natural gas is based on an energy equivalency conversion method primarily applicable at the burner tip and does not represent a value equivalency at the wellhead. Given that the value ratio based on the current price of crude oil as compared to natural gas is significantly different from the energy equivalency of 6:1, conversion on a 6:1 basis may be misleading as an indication of value.
Common Abbreviations
For a list of abbreviations that may be used in this document, refer to the Common Abbreviations section of this document.
| | | 2019 FOURTH QUARTER Suncor Energy Inc. 7 |
- •
- Fourth quarter financial results
- •
- Suncor's
fourth quarter 2019 operating earnings(1) were $782 million ($0.51 per common share), compared to $580 million ($0.36 per common share)
in the prior year quarter. The increase was primarily a result of improved western Canadian crude oil differentials, including a substantial narrowing of heavy crude and SCO differentials, which more
than offset lower benchmark pricing from the prior year quarter. This resulted in an increase in Oil Sands price realizations and a net favourable inventory valuation change, partially offset by lower
refining margins. Fourth quarter 2019 operating earnings were also positively impacted by increased production at East Coast Canada and Oda. Operating earnings were unfavourably impacted by lower Oil
Sands production compared to the prior year quarter, primarily due to planned maintenance and the Alberta government's mandatory production curtailments, higher DD&A and royalties, and lower refinery
crude throughput.
- •
- Suncor's
net loss was $2.335 billion ($1.52 per common share) in the fourth quarter of 2019, compared to a net loss of $280 million ($0.18 per common share) in
the prior year quarter. In addition to the factors impacting operating earnings discussed above, the net loss for the fourth quarter of 2019 included non-cash after-tax impairment charges of
$3.352 billion primarily due to lower forecasted heavy oil prices at Fort Hills and higher capital cost estimates for the West White Rose Project, partially offset by a
$235 million unrealized after-tax foreign exchange gain on the revaluation of U.S. dollar denominated debt. The net loss in the prior year quarter included an unrealized after-tax
foreign exchange loss of $637 million on the revaluation of U.S. dollar denominated debt and a non-cash impairment loss of $223 million after-tax on one of the company's equity
investments.
- •
- Funds
from operations(1) were $2.553 billion ($1.66 per common share) in the fourth quarter of 2019, compared to $2.007 billion ($1.26 per common
share) in the fourth quarter of 2018, and were influenced primarily by the same factors impacting operating earnings noted above. Cash flow provided by operating activities, which includes changes in
non-cash working capital, was $2.304 billion ($1.50 per common share) for the fourth quarter of 2019, compared to $3.040 billion ($1.90 per common share) for the fourth quarter of 2018,
reflecting a use of cash from working capital as compared to a source of cash in the prior year quarter due to an increase in accounts receivable related to increasing refinery margins at the end of
the quarter and higher upstream sales volumes.
- •
- Sustained focus on value over volume. In the fourth quarter of 2019, Oil Sands operations achieved SCO production of
300,000 bbls/d and upgrader utilization of 86%, compared to SCO production of 273,400 bbls/d and upgrader utilization of 79% in the prior year period, reflecting planned maintenance in
both periods.
- •
- Exploration and Production (E&P) production during the fourth quarter of 2019 increased to 115,900 boe/d from 90,200 boe/d in the
prior
year quarter. The increase was primarily due to higher production in East Coast Canada, which increased to 69,600 bbls/d, from 47,900 bbls/d in the prior
year quarter.
- •
- Refining and Marketing (R&M) refinery utilization averaged 97% for the quarter. R&M delivered
quarterly crude throughput of
447,500 bbls/d and refined product sales of 534,600 bbls/d in the fourth quarter of 2019, compared to 467,900 bbls/d and 530,600 bbls/d, respectively, in the prior
year quarter.
- •
- Continued investment in clean energy. In the fourth quarter of 2019, Suncor sanctioned the Forty Mile
Wind Power Project,
which is expected to drive value through sustainable power generation and retention of the generated carbon credits. The company also finalized an additional $50 million equity investment in
Enerkem Inc., a waste-to-biofuels and chemicals producer, bringing the company's total equity investment to $73 million.
- •
- Completion of network of electric vehicle (EV) stations across Canada. Suncor advanced its
sustainability and technology
initiatives by completing its coast-to-coast network of fast-charging EV stations across Canada during the fourth quarter of 2019.
- •
- Returning value to shareholders. The company returned $644 million to shareholders through
dividends and repurchased
$452 million of its shares during the fourth quarter of 2019 under its normal course issuer bid (NCIB).
- •
- Increase to share repurchase program. In the fourth quarter of 2019, Suncor's Board of Directors
approved an increase to the
share repurchase program from $2.0 billion to $2.5 billion through to the end of February 2020, demonstrating confidence in the company's ability to generate cash flow and its
commitment to return cash to shareholders.
- •
- Subsequent to the end of the quarter, Suncor's Board of Directors approved an 11% increase in the quarterly dividend and a renewal of the share repurchase program. This increases the quarterly dividend from $0.42 to $0.465 per share and provides approval for $2.0 billion in share repurchases beginning March 1, 2020.
- (1)
- Non-GAAP financial measures. See the Non-GAAP Financial Measures Advisory section of this document.
| 8 2019 FOURTH QUARTER Suncor Energy Inc. | | |
3. CONSOLIDATED FINANCIAL INFORMATION(1)
Financial Highlights
|
Three months ended December 31 | Twelve months ended December 31 | ||||||||
($ millions) |
2019 | 2018 | 2019 | 2018 | ||||||
| | | | | | | | | | | |
Net (loss) earnings |
||||||||||
| | ||||||||||
Oil Sands |
(2 682 | ) | (377 | ) | (427 | ) | 945 | |||
| | ||||||||||
Exploration and Production |
(162 | ) | (115 | ) | 1 005 | 807 | ||||
| | ||||||||||
Refining and Marketing |
558 | 762 | 3 000 | 3 154 | ||||||
| | ||||||||||
Corporate and Eliminations |
(49 | ) | (550 | ) | (679 | ) | (1 613 | ) | ||
| | | | | | | | | | | |
Total |
(2 335 | ) | (280 | ) | 2 899 | 3 293 | ||||
| | | | | | | | | | | |
Operating earnings (loss)(2) |
||||||||||
| | ||||||||||
Oil Sands |
277 | (377 | ) | 1 622 | 885 | |||||
| | ||||||||||
Exploration and Production |
231 | 108 | 1 141 | 897 | ||||||
| | ||||||||||
Refining and Marketing |
558 | 762 | 2 912 | 3 154 | ||||||
| | ||||||||||
Corporate and Eliminations |
(284 | ) | 87 | (1 317 | ) | (624 | ) | |||
| | | | | | | | | | | |
Total |
782 | 580 | 4 358 | 4 312 | ||||||
| | | | | | | | | | | |
Funds from (used in) operations(2) |
||||||||||
| | ||||||||||
Oil Sands |
1 405 | 607 | 6 061 | 4 964 | ||||||
| | ||||||||||
Exploration and Production |
555 | 331 | 2 143 | 1 779 | ||||||
| | ||||||||||
Refining and Marketing |
793 | 873 | 3 863 | 3 798 | ||||||
| | ||||||||||
Corporate and Eliminations |
(200 | ) | 196 | (1 249 | ) | (369 | ) | |||
| | | | | | | | | | | |
Total |
2 553 | 2 007 | 10 818 | 10 172 | ||||||
| | | | | | | | | | | |
(Increase) Decrease in non-cash working capital |
(249 | ) | 1 033 | (397 | ) | 408 | ||||
| | ||||||||||
Cash flow provided by operating activities |
2 304 | 3 040 | 10 421 | 10 580 | ||||||
| | | | | | | | | | | |
Capital and exploration expenditures(3) |
||||||||||
| | ||||||||||
Asset sustainment and maintenance |
1 026 | 654 | 3 227 | 3 347 | ||||||
| | ||||||||||
Economic investment |
712 | 465 | 2 209 | 1 903 | ||||||
| | | | | | | | | | | |
Total |
1 738 | 1 119 | 5 436 | 5 250 | ||||||
| | | | | | | | | | | |
|
Three months ended December 31 | Twelve months ended December 31 | ||||||||
($ millions) |
2019 | 2018 | 2019 | 2018 | ||||||
| | | | | | | | | | | |
Discretionary free funds flow(2) |
864 | 764 | 4 914 | 4 432 | ||||||
| | | | | | | | | | | |
- (1)
- The
three and twelve months ended December 31, 2018 have been restated to reflect the change to the company's segmented presentation of its Energy Trading business, with no
impact to overall consolidated results. The Energy Trading business is now included within each of the respective operating business segments to which the respective trading activity relates. Suncor's
Energy Trading business was previously reporting within the Corporate, Energy Trading and Eliminations segment.
- (2)
- Non-GAAP
financial measures. See the Non-GAAP Financial Measures Advisory section of this document. Discretionary free funds flow for the three and twelve months ended
December 31, 2018 have been restated for the impact of the change to the company's classification of asset sustainment and maintenance capital expenditures. Refer to the Capital and Investment
Update section of this document for further details.
- (3)
- Excludes capitalized interest of $37 million in the fourth quarter of 2019 and $28 million in the fourth quarter of 2018 and reflects the company's revised capital expenditure classification. Refer to the Capital and Investment Update section of this document for further details.
| | | 2019 FOURTH QUARTER Suncor Energy Inc. 9 |
Operating Highlights
|
Three months ended December 31 |
Twelve months ended December 31 |
||||||||
|
2019 | 2018 | 2019 | 2018 | ||||||
| | | | | | | | | | | |
Production volumes by segment |
||||||||||
| | ||||||||||
Oil Sands (mbbls/d) |
662.3 | 740.8 | 670.4 | 628.6 | ||||||
| | ||||||||||
Exploration and Production (mboe/d) |
115.9 | 90.2 | 106.8 | 103.4 | ||||||
| | | | | | | | | | | |
Total (mboe/d) |
778.2 | 831.0 | 777.2 | 732.0 | ||||||
| | | | | | | | | | | |
Refinery utilization (%) |
97 | 101 | 95 | 93 | ||||||
| | ||||||||||
Refinery crude oil processed (mbbls/d) |
447.5 | 467.9 | 438.9 | 430.8 | ||||||
| | | | | | | | | | | |
Net Loss
Suncor's consolidated net loss for the fourth quarter of 2019 was $2.335 billion, compared to a net loss of $280 million for the prior year quarter. The net losses were primarily affected by the same factors that influenced operating earnings described subsequently in this section of this document.
Other items affecting net losses over these periods included:
- •
- During
the fourth quarter of 2019, the company recorded after-tax impairment charges of $2.803 billion on its share of the Fort Hills assets, in the Oil Sands
segment, due to a decline in forecasted long-term heavy crude oil prices, and $393 million against White Rose, in the E&P segment, due to increased capital cost estimates at the West White
Rose Project.
- •
- The
after-tax unrealized foreign exchange gain on the revaluation of U.S. dollar denominated debt was $235 million for the fourth quarter of 2019, compared to
a loss of $637 million for the fourth quarter of 2018.
- •
- The fourth quarter of 2018 included a $223 million after-tax impairment charge in the E&P segment associated with the company's equity investment in Canbriam Energy Inc. (Canbriam). This included the reversal of a $133 million after-tax gain recorded in the first quarter of 2018, when the equity investment was acquired through an asset exchange, for a net after-tax impairment of $90 million in 2018.
Operating Earnings Reconciliation(1)
|
Three months ended December 31 |
Twelve months ended December 31 |
||||||||
($ millions) |
2019 | 2018 | 2019 | 2018 | ||||||
| | | | | | | | | | | |
Net (loss) earnings |
(2 335 | ) | (280 | ) | 2 899 | 3 293 | ||||
| | ||||||||||
Asset impairments(2) |
3 352 | — | 3 352 | — | ||||||
| | ||||||||||
Unrealized foreign exchange (gain) loss on U.S. dollar denominated debt |
(235 | ) | 637 | (590 | ) | 989 | ||||
| | ||||||||||
Impact of income tax rate adjustment on deferred taxes(3) |
— | — | (1 116 | ) | — | |||||
| | ||||||||||
Loss on equity investment and (gain) on significant disposals(4) |
— | 223 | (187 | ) | 30 | |||||
| | | | | | | | | | | |
Operating earnings(1) |
782 | 580 | 4 358 | 4 312 | ||||||
| | | | | | | | | | | |
- (1)
- Operating
earnings is a non-GAAP financial measure. All reconciling items are presented on an after-tax basis. See the Non-GAAP Financial Measures Advisory section of
this document.
- (2)
- During
the fourth quarter of 2019, the company recorded after-tax impairment charges of $2.803 billion on its share of the Fort Hills assets, in the Oil Sands segment, due to a
decline in forecasted long-term heavy crude oil prices, and $393 million against White Rose, in the E&P segment, due to increased capital cost estimates at the West White Rose Project. Refer to
note 13 in the company's unaudited interim Consolidated Financial Statements for the three and twelve months ended December 31, 2019 for further details on this item.
- (3)
- In
the second quarter of 2019, the company recorded a $1.116 billion deferred income tax recovery associated with the Government of Alberta's substantive enactment of
legislation for the staged reduction of the corporate income tax rate from 12% to 8% over the next four years.
- (4)
- The third quarter of 2019 included an after-tax gain of $48 million in the E&P segment related to the sale of certain non-core assets. In the second quarter of 2019, Suncor sold its 37% interest in Canbriam for total proceeds and an equivalent gain of $151 million ($139 million after-tax), which had previously been written down to nil in the fourth quarter of 2018 following the company's assessment of forward natural gas prices and the impact on estimated future cash flows. The equity interest in Canbriam was acquired during the first quarter of 2018 in exchange for the company's mineral landholdings in northeast British Columbia, at which time a gain of $133 million after-tax was recorded on the transaction. The third quarter of 2018 included an after-tax gain of $60 million on the sale of the company's interest in the Joslyn Oil Sands mining project.
| 10 2019 FOURTH QUARTER Suncor Energy Inc. | | |
Bridge Analysis of Operating Earnings ($ millions)(1)
- (1)
- For an explanation of this bridge analysis, see the Non-GAAP Financial Measures Advisory section of this document.
Suncor's fourth quarter 2019 operating earnings were $782 million ($0.51 per common share), compared to $580 million ($0.36 per common share) in the prior year quarter. The increase was primarily a result of improved western Canadian crude oil differentials, including a substantial narrowing of heavy crude and SCO differentials, which more than offset lower benchmark pricing from the prior year quarter. This resulted in an increase in Oil Sands price realizations and a net favourable inventory valuation change, partially offset by lower refining margins. Fourth quarter 2019 operating earnings were also positively impacted by increased production at East Coast Canada and Oda.
Operating earnings were unfavourably impacted by lower Oil Sands production compared to the prior year quarter, primarily due to planned maintenance and the Alberta government's mandatory production curtailments, higher DD&A and royalties, and lower refinery crude throughput.
After-Tax Share-Based Compensation Expense by Segment
|
Three months ended December 31 |
Twelve months ended December 31 |
||||||||
($ millions) |
2019 | 2018 | 2019 | 2018 | ||||||
| | | | | | | | | | | |
Oil Sands |
17 | (15 | ) | 70 | 48 | |||||
| | ||||||||||
Exploration and Production |
2 | (2 | ) | 8 | 4 | |||||
| | ||||||||||
Refining and Marketing |
9 | (7 | ) | 39 | 25 | |||||
| | ||||||||||
Corporate and Eliminations |
27 | (40 | ) | 134 | 90 | |||||
| | | | | | | | | | | |
Total share-based compensation expense (recovery) |
55 | (64 | ) | 251 | 167 | |||||
| | | | | | | | | | | |
The after-tax share-based compensation impact on results was an expense of $55 million during the fourth quarter of 2019, compared to a recovery of $64 million during the prior year quarter, as a result of an increase in the company's share price through the period, compared to a decrease in the prior year quarter.
| | | 2019 FOURTH QUARTER Suncor Energy Inc. 11 |
Business Environment
Commodity prices, refining crack spreads and foreign exchange rates are important factors that affect the results of Suncor's operations.
|
Average for the three months ended December 31 |
Average for the twelve months ended December 31 |
||||||||||
|
2019 | 2018 | 2019 | 2018 | ||||||||
| | | | | | | | | | | | | |
WTI crude oil at Cushing |
US$/bbl | 56.95 | 58.85 | 57.05 | 64.80 | |||||||
| | ||||||||||||
Dated Brent crude |
US$/bbl | 63.30 | 67.80 | 64.30 | 71.05 | |||||||
| | ||||||||||||
Dated Brent/Maya crude oil FOB price differential |
US$/bbl | 9.30 | 4.35 | 6.45 | 9.10 | |||||||
| | ||||||||||||
MSW at Edmonton |
Cdn$/bbl | 68.10 | 42.70 | 69.20 | 69.30 | |||||||
| | ||||||||||||
WCS at Hardisty |
US$/bbl | 41.10 | 19.50 | 44.25 | 38.50 | |||||||
| | ||||||||||||
Light/heavy differential for WTI at Cushing less WCS at Hardisty |
US$/bbl | (15.85 | ) | (39.35 | ) | (12.80 | ) | (26.30 | ) | |||
| | ||||||||||||
SYN-WTI differential |
US$/bbl | (0.70 | ) | (21.60 | ) | (0.60 | ) | (6.15 | ) | |||
| | ||||||||||||
Condensate at Edmonton |
US$/bbl | 53.00 | 45.30 | 52.85 | 61.05 | |||||||
| | ||||||||||||
Natural gas (Alberta spot) at AECO |
Cdn$/mcf | 2.50 | 1.60 | 1.75 | 1.50 | |||||||
| | ||||||||||||
Alberta Power Pool Price |
Cdn$/MWh | 46.95 | 55.55 | 54.95 | 50.20 | |||||||
| | ||||||||||||
New York Harbor 2-1-1 crack(1) |
US$/bbl | 18.50 | 18.75 | 19.90 | 19.40 | |||||||
| | ||||||||||||
Chicago 2-1-1 crack(1) |
US$/bbl | 14.45 | 16.25 | 17.05 | 17.40 | |||||||
| | ||||||||||||
Portland 2-1-1 crack(1) |
US$/bbl | 25.75 | 24.25 | 24.55 | 24.00 | |||||||
| | ||||||||||||
Gulf Coast 2-1-1 crack(1) |
US$/bbl | 17.10 | 17.45 | 19.15 | 18.40 | |||||||
| | ||||||||||||
Exchange rate |
US$/Cdn$ | 0.76 | 0.76 | 0.75 | 0.77 | |||||||
| | ||||||||||||
Exchange rate (end of period) |
US$/Cdn$ | 0.77 | 0.73 | 0.77 | 0.73 | |||||||
| | | | | | | | | | | | | |
- (1)
- 2-1-1 crack spreads are indicators of the refining margin generated by converting two barrels of WTI into one barrel of gasoline and one barrel of diesel. The company previously quoted 3-2-1 crack margin benchmarks based on wider use and familiarity with these benchmarks and, although the 3-2-1 crack spread is more commonly quoted, the company's refinery production is better aligned with a 2-1-1 crack spread, which better reflects the approximate composition of Suncor's overall refined product mix. The crack spreads presented here generally approximate the regions into which the company sells refined products through retail and wholesale channels.
Suncor's sweet SCO price realizations are influenced primarily by the price of WTI at Cushing and by the supply and demand for sweet SCO from Western Canada, which influences SCO differentials. Price realizations in the fourth quarter of 2019 for sweet SCO were favourably impacted by a significant narrowing of SCO differentials, partially offset by a decrease in WTI at Cushing to US$56.95/bbl, compared to US$58.85/bbl in the prior year quarter. Suncor also produces sour SCO, the price of which is influenced by various crude benchmarks, including, but not limited to, MSW at Edmonton and WCS at Hardisty, and which can also be affected by prices negotiated for spot sales. Prices for MSW at Edmonton increased to $68.10/bbl compared to $42.70/bbl in the prior year quarter, and prices for WCS at Hardisty increased to US$41.10/bbl in the fourth quarter of 2019, from US$19.50/bbl in the prior year quarter, as a result of narrower western Canadian heavy crude differentials, in part due to mandatory production curtailments in Alberta.
Bitumen production that Suncor does not upgrade is blended with diluent or SCO to facilitate delivery on pipeline systems. Net bitumen price realizations are, therefore, influenced by both prices for Canadian heavy crude oil (WCS at Hardisty is a common reference), prices for diluent (Condensate at Edmonton) and SCO. Bitumen price realizations can also be affected by bitumen quality and spot sales. Bitumen prices were favourably impacted by narrower heavy crude oil differentials in the fourth quarter of 2019.
Suncor's price realizations for production from East Coast Canada and International assets are influenced primarily by the price for Brent crude, which decreased to US$63.30/bbl in the fourth quarter of 2019, compared to US$67.80/bbl in the prior year quarter.
Suncor's refining margins are primarily influenced by industry benchmark crack spreads and, although the 3-2-1 crack spread is more commonly quoted, the company's refinery production is better aligned with a 2-1-1 crack spread, which more appropriately reflects the company's refined product mix of gasoline and distillates. Benchmark crack spreads are industry
| 12 2019 FOURTH QUARTER Suncor Energy Inc. | | |
indicators approximating the gross margin on a barrel of crude oil that is refined to produce gasoline and distillates. More complex refineries can earn greater refining margin by processing less expensive, heavier crudes. Crack spreads do not necessarily reflect the margins at a specific refinery. Crack spreads are based on current crude feedstock prices, whereas actual earnings are based on first-in, first-out (FIFO) inventory accounting where a delay exists between the time that feedstock is purchased and when it is processed and sold to a third-party. A FIFO loss normally reflects a declining price environment for crude oil and finished products, whereas FIFO gains reflect an increasing price environment for crude oil and finished products. Specific refinery margins are determined by actual crude purchase costs, refinery configuration, production mix and realized prices for refined product sales in markets unique to each refinery.
The cost of natural gas used in Suncor's Oil Sands and Refining operations is primarily referenced to Alberta spot prices at AECO. The average AECO benchmark increased to $2.50/mcf in the fourth quarter of 2019, from $1.60/mcf in the prior year quarter.
Excess electricity produced in Suncor's Oil Sands operations and at Fort Hills is sold to the Alberta Electric System Operator, with the proceeds netted against the cash operating cost per barrel metric. The Alberta power pool price decreased to an average of $46.95/MWh in the fourth quarter of 2019, compared to $55.55/MWh in the prior year quarter.
The majority of Suncor's revenues from the sale of oil and natural gas commodities are based on prices that are determined by or referenced to U.S. dollar benchmark prices, while the majority of Suncor's expenditures are realized in Canadian dollars. In the fourth quarter of 2019, the Canadian dollar remained unchanged in relation to the U.S. dollar as the average exchange rate for both the fourth quarters of 2019 and 2018 was US$0.76 per one Canadian dollar.
Suncor also has assets and liabilities, including approximately 65% of the company's debt, which are denominated in U.S. dollars and translated to Suncor's reporting currency (Canadian dollars) at each balance sheet date. A decrease in the value of the Canadian dollar, relative to the U.S. dollar, from the previous balance sheet date increases the amount of Canadian dollars required to settle U.S. dollar denominated obligations, while an increase in the value of the Canadian dollar, relative to the U.S. dollar, decreases the amount of Canadian dollars required to settle U.S. dollar denominated obligations.
| | | 2019 FOURTH QUARTER Suncor Energy Inc. 13 |
4. SEGMENT RESULTS AND ANALYSIS
OIL SANDS(1)
Financial Highlights
|
Three months ended December 31 | Twelve months ended December 31 | ||||||||
($ millions) |
2019 | 2018 | 2019 | 2018 | ||||||
| | | | | | | | | | | |
Gross revenues |
4 425 | 3 149 | 18 347 | 15 743 | ||||||
| | ||||||||||
Less: Royalties |
(143 | ) | (67 | ) | (917 | ) | (398 | ) | ||
| | | | | | | | | | | |
Operating revenues, net of royalties |
4 282 | 3 082 | 17 430 | 15 345 | ||||||
| | | | | | | | | | | |
Net (loss) earnings |
(2 682 | ) | (377 | ) | (427 | ) | 945 | |||
| | ||||||||||
Adjusted for: |
||||||||||
| | ||||||||||
Impact of income tax rate adjustment on deferred taxes(2) |
— | — | (910 | ) | — | |||||
| | ||||||||||
Asset impairment(3) |
2 959 | — | 2 959 | — | ||||||
| | ||||||||||
Gain on significant disposal(4) |
— | — | — | (60 | ) | |||||
| | | | | | | | | | | |
Operating earnings (loss)(5) |
277 | (377 | ) | 1 622 | 885 | |||||
| | | | | | | | | | | |
Funds from operations(5) |
1 405 | 607 | 6 061 | 4 964 | ||||||
| | | | | | | | | | | |
- (1)
- The
three and twelve months ended December 31, 2018 have been restated to reflect the change to the company's segmented presentation of its Energy Trading business, with no
impact to overall consolidated results. The Energy Trading business is now included within each of the respective operating business segments to which the respective trading activity relates. Suncor's
Energy Trading business was previously reported within the Corporate, Energy Trading and Eliminations segment.
- (2)
- In
the second quarter of 2019, the company recorded a $910 million deferred income tax recovery in the Oil Sands segment associated with the Government of Alberta's substantive
enactment of legislation for the staged reduction of the corporate income tax rate from 12% to 8% over the next four years.
- (3)
- During
the fourth quarter of 2019, the company recorded after-tax impairment charges of $2.803 billion on its share of the Fort Hills assets due to continued volatility in the
crude oil price environment, resulting in a decline in forecasted long-term heavy crude oil prices. Refer to note 13 in the company's unaudited interim Consolidated Financial Statements for the
three and twelve months ended December 31, 2019 for further details on this item.
- (4)
- The
third quarter of 2018 included an after-tax gain of $60 million on the sale of the company's interest in the Joslyn Oil Sands mining project.
- (5)
- Non-GAAP financial measures. See the Non-GAAP Financial Measures Advisory section of this document.
Bridge Analysis of Operating Earnings ($ millions)(1)
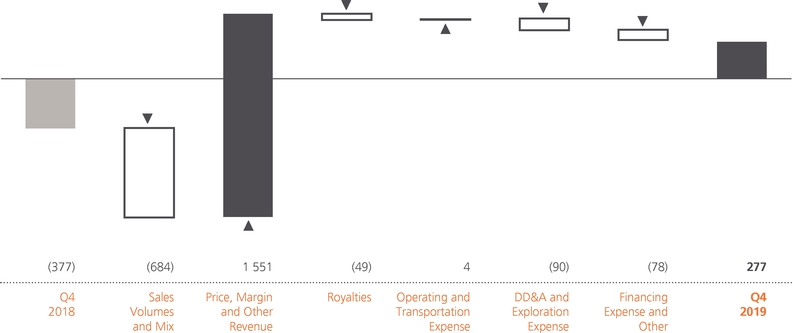
- (1)
- For an explanation of this bridge analysis, see the Non-GAAP Financial Measures Advisory section of this document.
| 14 2019 FOURTH QUARTER Suncor Energy Inc. | | |
The Oil Sands segment had operating earnings of $277 million in the fourth quarter of 2019, compared to an operating loss of $377 million in the prior year quarter. The increase was primarily due to higher realized crude prices due to improved western Canadian crude oil differentials, including a substantial narrowing of heavy crude and SCO differentials, more than offsetting benchmark pricing declines. This was partially offset by lower overall production volumes due to planned maintenance and mandatory production curtailments and higher DD&A.
Production Volumes(1)
|
Three months ended December 31 |
Twelve months ended December 31 |
||||||||
(mbbls/d) |
2019 | 2018 | 2019 | 2018 | ||||||
| | | | | | | | | | | |
Upgraded product (SCO and diesel) |
310.1 | 284.9 | 322.4 | 290.9 | ||||||
| | ||||||||||
Internally consumed diesel(2) |
(10.1 | ) | (11.5 | ) | (9.1 | ) | (10.6 | ) | ||
| | | | | | | | | | | |
Total Oil Sands operations upgraded product |
300.0 | 273.4 | 313.3 | 280.3 | ||||||
| | ||||||||||
In Situ non-upgraded bitumen |
118.1 | 159.3 | 99.5 | 138.0 | ||||||
| | | | | | | | | | | |
Total Oil Sands operations production |
418.1 | 432.7 | 412.8 | 418.3 | ||||||
| | ||||||||||
Fort Hills bitumen |
87.9 | 98.5 | 85.3 | 67.4 | ||||||
| | ||||||||||
Internally upgraded bitumen from froth |
— | — | — | (1.3 | ) | |||||
| | | | | | | | | | | |
Total Fort Hills bitumen production |
87.9 | 98.5 | 85.3 | 66.1 | ||||||
| | ||||||||||
Syncrude (sweet SCO and diesel) |
158.1 | 212.4 | 174.6 | 146.5 | ||||||
| | ||||||||||
Internally consumed diesel(2) |
(1.8 | ) | (2.8 | ) | (2.3 | ) | (2.3 | ) | ||
| | | | | | | | | | | |
Total Syncrude production |
156.3 | 209.6 | 172.3 | 144.2 | ||||||
| | | | | | | | | | | |
Total Oil Sands production |
662.3 | 740.8 | 670.4 | 628.6 | ||||||
| | | | | | | | | | | |
- (1)
- Bitumen
production from Oil Sands Base is upgraded, while bitumen production from In Situ operations is either upgraded or sold directly to customers, including Suncor's own
refineries, with SCO and diesel yields of approximately 79% of bitumen feedstock input. Fort Hills finished bitumen is sold directly to customers and bitumen froth from Fort Hills can be sent to Oil
Sands Base for further processing into SCO. Essentially all of the bitumen produced at Syncrude is upgraded to sweet SCO and a small amount of diesel, at an approximate yield of 85%.
- (2)
- Both Oil Sands operations and Syncrude produce diesel, which is internally consumed in mining operations, and Fort Hills uses internally produced diesel from Oil Sands Base within its mining operations. Of the 10,100 bbls/d of internally consumed diesel at Oil Sands operations in the fourth quarter of 2019, 8,300 bbls/d was consumed at Oil Sands Base and 1,800 bbls/d, net, was consumed at Fort Hills. Oil Sands operations utilization rates are calculated net of Oil Sands Base internally consumed diesel, but inclusive of diesel consumed internally at Fort Hills. Syncrude utilization rates are calculated using intermediate sour production.
Oil Sands operations production was 418,100 bbls/d in the fourth quarter of 2019, compared to 432,700 bbls/d in the prior year quarter. The decrease in production was primarily due to maintenance, including planned annual coker maintenance at Oil Sands Base, increased yield loss associated with higher SCO production, mandatory production curtailments and an outage at MacKay River. Mackay River is expected to return to operation early in the second quarter of 2020, after completion of planned maintenance which has been accelerated to the first quarter of 2020 to coincide with the outage in an effort to minimize the impacts to annual production. As a result of improved reliability, SCO production increased to 300,000 bbls/d in the fourth quarter of 2019, despite planned maintenance, compared to 273,400 bbls/d in the fourth quarter of 2018, representing utilization rates of 86% and 79%, respectively. Production of non-upgraded bitumen from the company's In Situ assets was 118,100 bbls/d in the fourth quarter of 2019, compared to 159,300 bbls/d in the prior year quarter, primarily impacted by increased volumes diverted to upgrading as we continue to focus on value over volume through the production of higher value SCO, and the outage at MacKay River.
Suncor's share of production from Fort Hills averaged 87,900 bbls/d in the fourth quarter of 2019, compared to 98,500 bbls/d in the prior year quarter. The decrease in production was due to planned maintenance, which was completed during the quarter, and mandatory production curtailments. Fort Hills remains adversely impacted by mandatory production curtailment due to the continued, disproportionate effect of curtailment as it is applied on a 2018 production basis when the asset was ramping up to full production rates. However, the company was able to partially mitigate production impacts by internally transferring credits from Oil Sands operations and purchasing third-party credits.
| | | 2019 FOURTH QUARTER Suncor Energy Inc. 15 |
Suncor's share of Syncrude production was 156,300 bbls/d in the fourth quarter of 2019, compared to 209,600 bbls/d in the prior year quarter. The decrease in production was primarily due to planned maintenance that commenced in the third quarter of 2019 and completed in the fourth quarter, compared to no planned maintenance in the prior year quarter, and mandatory production curtailments. Upon completion of maintenance, the company was able to partially mitigate impacts of curtailment on production by internally transferring and purchasing third-party curtailment credits.
Sales
|
Three months ended December 31 |
Twelve months ended December 31 |
||||||||
(mbbls/d) |
2019 | 2018 | 2019 | 2018 | ||||||
| | | | | | | | | | | |
Oil Sands operations sales volumes |
||||||||||
| | ||||||||||
Sweet SCO |
106.2 | 110.2 | 113.5 | 96.1 | ||||||
| | ||||||||||
Diesel |
29.7 | 27.6 | 26.0 | 28.8 | ||||||
| | ||||||||||
Sour SCO |
155.4 | 150.7 | 171.8 | 162.6 | ||||||
| | | | | | | | | | | |
Upgraded product |
291.3 | 288.5 | 311.3 | 287.5 | ||||||
| | ||||||||||
In Situ non-upgraded bitumen |
126.3 | 172.0 | 101.4 | 134.0 | ||||||
| | | | | | | | | | | |
Oil Sands operations |
417.6 | 460.5 | 412.7 | 421.5 | ||||||
| | ||||||||||
Fort Hills bitumen |
91.8 | 94.6 | 86.1 | 57.3 | ||||||
| | ||||||||||
Syncrude |
156.3 | 209.6 | 172.3 | 144.2 | ||||||
| | | | | | | | | | | |
Total |
665.7 | 764.7 | 671.1 | 623.0 | ||||||
| | | | | | | | | | | |
Sales volumes for Oil Sands operations were 417,600 bbls/d in the fourth quarter of 2019, compared to 460,500 bbls/d in the prior year quarter, and were influenced by the same factors influencing production, combined with a draw in inventory in the prior year quarter.
Bitumen sales at Fort Hills decreased to 91,800 bbls/d, net to Suncor, in the fourth quarter of 2019, from 94,600 bbls/d in the prior year quarter, consistent with the decrease in production, partially offset by a small draw in inventory.
| 16 2019 FOURTH QUARTER Suncor Energy Inc. | | |
Bitumen Production
|
Three months ended December 31 |
Twelve months ended December 31 |
||||||||
|
2019 | 2018 | 2019 | 2018 | ||||||
| | | | | | | | | | | |
Oil Sands Base |
||||||||||
| | ||||||||||
Bitumen production (mbbls/d) |
289.9 | 278.3 | 289.9 | 258.8 | ||||||
| | ||||||||||
Bitumen ore mined (thousands of tonnes per day) |
445.8 | 412.1 | 434.8 | 378.0 | ||||||
| | ||||||||||
Bitumen ore grade quality (bbls/tonne) |
0.65 | 0.68 | 0.67 | 0.68 | ||||||
| | | | | | | | | | | |
In Situ |
||||||||||
| | ||||||||||
Bitumen production – Firebag (mbbls/d) |
195.6 | 197.2 | 187.0 | 204.0 | ||||||
| | ||||||||||
Steam-to-oil ratio – Firebag |
2.6 | 2.7 | 2.7 | 2.7 | ||||||
| | | | | | | | | | | |
Bitumen production – MacKay River (mbbls/d) |
22.3 | 37.0 | 29.2 | 36.0 | ||||||
| | ||||||||||
Steam-to-oil ratio – MacKay River |
3.2 | 2.8 | 3.0 | 2.9 | ||||||
| | | | | | | | | | | |
Total In Situ bitumen production (mbbls/d) |
217.9 | 234.2 | 216.2 | 240.0 | ||||||
| | | | | | | | | | | |
Total Oil Sands operations bitumen production (mbbls/d) |
507.8 | 512.5 | 506.1 | 498.8 | ||||||
| | | | | | | | | | | |
Fort Hills |
||||||||||
| | ||||||||||
Bitumen production (mbbls/d) |
87.9 | 98.5 | 85.3 | 67.4 | ||||||
| | ||||||||||
Bitumen ore mined (thousands of tonnes per day) |
149.1 | 154.1 | 140.5 | 106.2 | ||||||
| | ||||||||||
Bitumen ore grade quality (bbls/tonne) |
0.59 | 0.64 | 0.61 | 0.63 | ||||||
| | | | | | | | | | | |
Syncrude |
||||||||||
| | ||||||||||
Bitumen production (mbbls/d) |
188.5 | 240.7 | 205.4 | 172.0 | ||||||
| | ||||||||||
Bitumen ore mined (thousands of tonnes per day) |
296.8 | 384.4 | 330.5 | 277.5 | ||||||
| | | | | | | | | | | |
Bitumen ore grade quality (bbls/tonne) |
0.64 | 0.63 | 0.62 | 0.62 | ||||||
| | | | | | | | | | | |
Total Oil Sands bitumen production |
784.2 | 851.7 | 796.8 | 738.2 | ||||||
| | | | | | | | | | | |
Bitumen production at Oil Sands operations decreased in the fourth quarter of 2019 to 507,800 bbls/d, compared to 512,500 bbls/d in the prior year quarter. The decrease was primarily due to an outage at MacKay River, which is expected to return to operation early in the second quarter of 2020, and mandatory production curtailments, which was partially offset by increased production at Oil Sands Base.
Bitumen production at Syncrude in the fourth quarter of 2019 decreased to 188,500 bbls/d, net to Suncor, from 240,700 bbls/d in the prior year quarter. The decrease was primarily due to planned maintenance that was completed in the fourth quarter and mandatory production curtailments. Upon completion of maintenance in the quarter, the company was able to partially mitigate further production impacts from mandatory production curtailments by internally transferring and purchasing third-party curtailment credits.
Price Realizations
Net of transportation costs, but before royalties |
Three months ended December 31 |
Twelve months ended December 31 |
||||||||
($/bbl) |
2019 | 2018 | 2019 | 2018 | ||||||
| | | | | | | | | | | |
Oil Sands operations |
||||||||||
| | ||||||||||
SCO and diesel |
70.93 | 42.44 | 69.65 | 68.97 | ||||||
| | ||||||||||
Bitumen |
36.73 | 2.43 | 42.08 | 24.70 | ||||||
| | ||||||||||
Crude sales basket (all products) |
60.58 | 27.50 | 62.87 | 54.91 | ||||||
| | ||||||||||
Crude sales basket, relative to WTI |
(14.35 | ) | (49.94 | ) | (13.20 | ) | (29.24 | ) | ||
| | | | | | | | | | | |
Fort Hills bitumen |
41.41 | 20.26 | 48.96 | 38.47 | ||||||
| | | | | | | | | | | |
Syncrude – sweet SCO |
72.14 | 47.71 | 73.45 | 70.19 | ||||||
| | ||||||||||
Syncrude, relative to WTI |
(2.79 | ) | (29.73 | ) | (2.62 | ) | (13.97 | ) | ||
| | | | | | | | | | | |
| | | 2019 FOURTH QUARTER Suncor Energy Inc. 17 |
Average price realizations at Oil Sands operations increased to $60.58/bbl in the fourth quarter of 2019 from $27.50/bbl in the prior year quarter, primarily due to the narrowing of heavy crude oil differentials resulting from mandatory production curtailments in the province of Alberta and narrower SCO differentials, partially offset by a decrease in the WTI benchmark price.
Average price realizations for Fort Hills bitumen were $41.41/bbl in the fourth quarter of 2019 and were higher than In Situ bitumen realizations due to a higher proportion of sales being made in the U.S. mid-continent and the U.S. Gulf Coast, where Suncor is able to utilize its logistics network to access favourable pricing in the U.S. market, combined with the higher quality associated with paraffinic froth-treated bitumen produced at Fort Hills. Average price realizations were higher than the prior year quarter due to improved heavy crude oil differentials in the fourth quarter of 2019.
Average price realizations at Syncrude increased to $72.14/bbl in the fourth quarter of 2019 from $47.71/bbl in the prior year quarter due to narrower SCO differentials, partially offset by a decrease in the WTI benchmark price.
Royalties
Royalties for the Oil Sands segment were higher in the fourth quarter of 2019 compared to the prior year quarter, primarily due to the increase in crude price realizations.
Expenses and Other Factors
Total Oil Sands operating and transportation expenses for the fourth quarter of 2019 were comparable to the prior year quarter, as described in detail below. See the reconciliation in the Cash Operating Costs section below for further details regarding cash operating costs and a breakdown of non-production costs by asset.
At Oil Sands operations, operating costs increased compared to the prior year quarter primarily as a result of an increase in maintenance, commodity costs, and contractor mining costs for increased ore volumes processed.
At Fort Hills, operating costs in the fourth quarter of 2019 decreased when compared to the prior year quarter due to a decline in sales volumes in the current quarter, partially offset by the increase in planned maintenance.
Suncor's share of Syncrude operating costs were lower than the prior year quarter, primarily due to lower unplanned maintenance costs on improved reliability.
Oil Sands transportation costs in the fourth quarter of 2019 were comparable to the prior year quarter.
DD&A and impairment expenses for the fourth quarter of 2019 were higher compared to the prior year due to an increase in depreciation on the company's asset retirement obligation asset and additional depreciation associated with the transition to IFRS 16.
| 18 2019 FOURTH QUARTER Suncor Energy Inc. | | |
Cash Operating Costs
|
Three months ended December 31 |
Twelve months ended December 31 |
||||||||
($ millions, except as noted) |
2019 | 2018 | 2019 | 2018 | ||||||
| | | | | | | | | | | |
Oil Sands Operating, selling and general expense (OS&G) |
1 985 | 1 998 | 8 027 | 7 577 | ||||||
| | | | | | | | | | | |
Oil Sands operations cash operating costs(1) reconciliation |
||||||||||
| | ||||||||||
Oil Sands operations OS&G |
1 143 | 1 088 | 4 639 | 4 222 | ||||||
| | ||||||||||
Non-production costs(2) |
(11 | ) | (4 | ) | (179 | ) | (100 | ) | ||
| | ||||||||||
Excess power capacity and other(3) |
(60 | ) | (80 | ) | (241 | ) | (237 | ) | ||
| | ||||||||||
Inventory changes |
32 | (25 | ) | 48 | (14 | ) | ||||
| | | | | | | | | | | |
Oil Sands operations cash operating costs(1) |
1 104 | 979 | 4 267 | 3 871 | ||||||
| | ||||||||||
Oil Sands operations cash operating costs ($/bbl)(1) |
28.55 | 24.50 | 28.20 | 25.25 | ||||||
| | | | | | | | | | | |
Fort Hills cash operating costs(1) reconciliation |
||||||||||
| | ||||||||||
Fort Hills OS&G |
248 | 291 | 921 | 832 | ||||||
| | ||||||||||
Non-production costs(2) |
(20 | ) | (24 | ) | (115 | ) | (120 | ) | ||
| | ||||||||||
Inventory changes |
4 | (43 | ) | 9 | 55 | |||||
| | | | | | | | | | | |
Fort Hills cash operating costs(1) |
232 | 224 | 815 | 767 | ||||||
| | ||||||||||
Fort Hills cash operating costs ($/bbl)(1) |
28.65 | 24.85 | 26.15 | 31.20 | ||||||
| | | | | | | | | | | |
Syncrude cash operating costs(1) reconciliation |
||||||||||
| | ||||||||||
Syncrude OS&G |
594 | 619 | 2 467 | 2 523 | ||||||
| | ||||||||||
Non-production costs(2) |
(20 | ) | (7 | ) | (82 | ) | (33 | ) | ||
| | | | | | | | | | | |
Syncrude cash operating costs(1) |
574 | 612 | 2 385 | 2 490 | ||||||
| | ||||||||||
Syncrude cash operating costs ($/bbl)(1) |
39.85 | 31.75 | 37.95 | 47.25 | ||||||
| | | | | | | | | | | |
- (1)
- Non-GAAP
financial measures. See the Non-GAAP Financial Measures Advisory section of this document.
- (2)
- Significant
non-production costs include, but are not limited to, share-based compensation expense and research expenses. Non-production costs at Fort Hills also include, but are not
limited to, project startup costs, excess power revenue from cogeneration units and an adjustment to reflect internally produced diesel from Oil Sands operations at the cost of production.
- (3)
- Oil Sands operations excess power capacity and other includes, but is not limited to, the operational revenue impacts of excess power from a cogeneration unit and the natural gas expense recorded as part of a non-monetary arrangement involving a third-party processor.
Oil Sands operations cash operating costs(1) per barrel were $28.55 in the fourth quarter of 2019, compared to $24.50 in the prior year quarter, reflecting the impact of lower production volumes discussed above, higher costs associated with increased production of higher value SCO barrels, as well as an increase in contractor mining, shovel maintenance and commodity costs. Total Oil Sands operations cash operating costs were $1.104 billion, compared to $979 million in the prior year quarter due to the same factors discussed above.
Excess power capacity and other decreased compared to the prior year quarter due mainly to a decrease in excess power revenue as a result of lower volumes and power prices.
Oil Sands operations inventory changes in the fourth quarter of 2019 reflect a build of higher cost SCO inventory, partially offset by a draw of lower cost bitumen inventory.
Fort Hills cash operating costs(1) per barrel averaged $28.65 in the fourth quarter of 2019, compared to $24.85 in the prior year quarter, reflecting the impact of lower production volumes in the current period and slightly higher cash operating costs due to higher planned maintenance. In the fourth quarter of 2019, inventory changes reflected an increase in crude production costs, partially offset by a draw of inventory.
Syncrude cash operating costs(1) per barrel were $39.85 in the fourth quarter of 2019, compared to $31.75 in the prior year quarter, with the increase attributable to the decrease in production, partially offset by lower cash operating costs. Higher non-production costs compared to the prior year quarter is due to increased share-based compensation expense.
Planned Maintenance Update
The company completed planned maintenance at Oil Sands operations, Fort Hills, and Syncrude in the fourth quarter of 2019. Planned cogeneration maintenance at MacKay River originally scheduled for the third quarter of 2020 has been accelerated to the first quarter of 2020 to coincide with the outage that occurred in the fourth quarter 2019, in an effort to minimize impacts to annual production.
- (1)
- Non-GAAP financial measure. See the Non-GAAP Financial Measures Advisory section of this document.
| | | 2019 FOURTH QUARTER Suncor Energy Inc. 19 |
EXPLORATION AND PRODUCTION(1)
Financial Highlights
|
Three months ended December 31 |
Twelve months ended December 31 |
||||||||
($ millions) |
2019 | 2018 | 2019 | 2018 | ||||||
| | | | | | | | | | | |
Gross revenues(2) |
911 | 651 | 3 372 | 3 474 | ||||||
| | ||||||||||
Less: Royalties(2) |
(83 | ) | (19 | ) | (302 | ) | (257 | ) | ||
| | | | | | | | | | | |
Operating revenues, net of royalties |
828 | 632 | 3 070 | 3 217 | ||||||
| | | | | | | | | | | |
Net (loss) earnings |
(162 | ) | (115 | ) | 1 005 | 807 | ||||
| | ||||||||||
Adjusted for: |
||||||||||
| | ||||||||||
Impact of income tax rate adjustment on deferred taxes(3) |
— | — | (70 | ) | — | |||||
| | ||||||||||
Asset impairment(4) |
393 | — | 393 | — | ||||||
| | ||||||||||
Loss on equity investment and (gain) on significant disposals(5) |
— | 223 | (187 | ) | 90 | |||||
| | | | | | | | | | | |
Operating earnings(6) |
231 | 108 | 1 141 | 897 | ||||||
| | | | | | | | | | | |
Funds from operations(6) |
555 | 331 | 2 143 | 1 779 | ||||||
| | | | | | | | | | | |
- (1)
- The
three and twelve months ended December 31, 2018 have been restated to reflect the change to the company's segmented presentation of its Energy Trading business, with no
impact to overall consolidated results. The Energy Trading business is now included within each of the respective operating business segments to which the respective trading activity relates. Suncor's
Energy Trading business was previously reported within the Corporate, Energy Trading and Eliminations segment.
- (2)
- Production,
revenues and royalties from the company's Libya operations have been presented in the E&P section of this document on an economic basis and exclude an equal and offsetting
gross up of revenues and royalties of $87 million in the fourth quarter of 2019 and $120 million in the fourth quarter of 2018, which is required for presentation purposes in the
company's financial statements under the working-interest basis.
- (3)
- In
the second quarter of 2019, the company recorded a $70 million deferred income tax recovery in the E&P segment associated with the Government of Alberta's substantive
enactment of legislation for the staged reduction of the corporate income tax rate from 12% to 8% over the next four years.
- (4)
- During
the fourth quarter of 2019, the company recorded an after-tax impairment charge of $393 million against White Rose due to increased capital cost estimates at the West
White Rose Project. Refer to note 13 in the company's unaudited interim Consolidated Financial Statements for the three and twelve months ended December 31, 2019 for further details on
this item.
- (5)
- The
third quarter of 2019 included an after-tax gain of $48 million in the E&P segment related to the sale of certain non-core assets. In the second quarter of 2019, Suncor
sold its 37% interest in Canbriam for total proceeds and an equivalent gain of $151 million ($139 million after-tax), which had previously been written down to nil in the fourth quarter
of 2018 following the company's assessment of forward natural gas prices and the impact on estimated future cash flows.
- (6)
- Non-GAAP financial measures. See the Non-GAAP Financial Measures Advisory section of this document.
Bridge Analysis of Operating Earnings ($ millions)(1)

- (1)
- For an explanation of this bridge analysis, see the Non-GAAP Financial Measures Advisory section of this document.
| 20 2019 FOURTH QUARTER Suncor Energy Inc. | | |
Operating earnings for the E&P segment in the fourth quarter of 2019 increased to $231 million, from $108 million in the prior year quarter, primarily as a result of higher East Coast Canada production volumes and crude price realizations, partially offset by higher royalties and DD&A related to the increased production. Financing and other expenses in the fourth quarter of 2019 were lower when compared to the fourth quarter of 2018, primarily due to losses related to our equity investment in Canbriam that were recorded in the prior year quarter.
Production Volumes
|
Three months ended December 31 |
Twelve months ended December 31 |
||||||||
|
2019 | 2018 | 2019 | 2018 | ||||||
| | | | | | | | | | | |
E&P Canada |
||||||||||
| | ||||||||||
Terra Nova (mbbls/d) |
8.2 | 9.5 | 11.6 | 11.7 | ||||||
| | ||||||||||
Hibernia (mbbls/d) |
25.1 | 19.0 | 20.1 | 22.1 | ||||||
| | ||||||||||
White Rose (mbbls/d) |
8.1 | 3.7 | 4.7 | 6.6 | ||||||
| | ||||||||||
Hebron (mbbls/d) |
28.2 | 15.7 | 23.5 | 13.0 | ||||||
| | ||||||||||
North America Onshore (mboe/d) |
— | — | — | 0.5 | ||||||
| | | | | | | | | | | |
|
69.6 | 47.9 | 59.9 | 53.9 | ||||||
| | ||||||||||
E&P International |
||||||||||
| | ||||||||||
Buzzard (mboe/d) |
26.7 | 27.7 | 31.9 | 34.2 | ||||||
| | ||||||||||
Golden Eagle (mboe/d) |
9.1 | 10.7 | 9.0 | 12.4 | ||||||
| | | | | | | | | | | |
United Kingdom (mboe/d) |
35.8 | 38.4 | 40.9 | 46.6 | ||||||
| | ||||||||||
Norway – Oda (mboe/d) |
7.8 | — | 3.7 | — | ||||||
| | ||||||||||
Libya (mbbls/d) |
2.7 | 3.9 | 2.3 | 2.9 | ||||||
| | | | | | | | | | | |
|
46.3 | 42.3 | 46.9 | 49.5 | ||||||
| | | | | | | | | | | |
Total Production (mboe/d) |
115.9 | 90.2 | 106.8 | 103.4 | ||||||
| | | | | | | | | | | |
Total Sales Volumes (mboe/d) |
113.5 | 83.1 | 106.0 | 102.8 | ||||||
| | | | | | | | | | | |
Production volumes for E&P Canada were 69,600 boe/d in the fourth quarter of 2019, compared to 47,900 boe/d in the prior year quarter. The increase in production was primarily due to the ramp up of Hebron production throughout 2019 and the impact of a temporary production interruption due to a major storm system that impacted all E&P East Coast Canada assets in the prior year quarter.
E&P International production increased to 46,300 boe/d, from 42,300 boe/d in the prior year quarter, primarily due to increased production from Oda, which began production near the end of the first quarter of 2019, partially offset by natural declines in the U.K.
E&P sales volumes increased to 113,500 boe/d in the fourth quarter of 2019, compared to 83,100 boe/d in the prior year quarter, due to the increase in production.
Price Realizations
|
Three months ended December 31 |
Twelve months ended December 31 |
||||||||
Net of transportation costs, but before royalties |
2019 | 2018 | 2019 | 2018 | ||||||
| | | | | | | | | | | |
Exploration and Production |
||||||||||
| | ||||||||||
E&P Canada – Crude oil and natural gas liquids ($/bbl) |
84.36 | 73.48 | 84.86 | 87.82 | ||||||
| | ||||||||||
E&P Canada – Natural gas ($/mcfe) |
— | — | — | 1.94 | ||||||
| | ||||||||||
E&P International ($/boe) |
78.82 | 82.30 | 81.09 | 86.77 | ||||||
| | | | | | | | | | | |
Price realizations at E&P Canada were higher in the fourth quarter of 2019 than the prior year quarter, despite a decrease in Brent crude benchmark pricing, as the prior year quarter was impacted by unfavourable pricing windows realized on the timing of cargo sales relative to the Brent crude benchmark average in the period.
| | | 2019 FOURTH QUARTER Suncor Energy Inc. 21 |
Price realizations at E&P International were lower in the fourth quarter of 2019 than the prior year quarter, due to lower benchmark crude pricing for Brent.
Royalties
E&P royalties in the fourth quarter of 2019 were higher due to an increase in East Coast Canada sales volumes and crude price realizations.
Expenses and Other Factors
Operating and transportation expenses for the fourth quarter of 2019 were lower than the prior year quarter, as the prior year quarter was impacted by increased costs at Terra Nova related to planned maintenance activities.
DD&A and impairment expenses in the fourth quarter of 2019 was higher when compared to the fourth quarter of 2018, primarily due to higher East Coast Canada production, partially offset by lower U.K. production.
Planned Maintenance Update for Operated Assets
There are no significant maintenance events scheduled for the first quarter of 2020.
| 22 2019 FOURTH QUARTER Suncor Energy Inc. | | |
REFINING AND MARKETING(1)
Financial Highlights
|
Three months ended December 31 |
Twelve months ended December 31 |
||||||||
($ millions) |
2019 | 2018 | 2019 | 2018 | ||||||
| | | | | | | | | | | |
Operating revenues |
5 545 | 5 667 | 22 304 | 23 778 | ||||||
| | | | | | | | | | | |
Net earnings |
558 | 762 | 3 000 | 3 154 | ||||||
| | | | | | | | | | | |
Adjusted for: |
||||||||||
| | ||||||||||
Impact of income tax rate adjustment on deferred taxes(2) |
— | — | (88 | ) | — | |||||
| | | | | | | | | | | |
Operating earnings(3) |
558 | 762 | 2 912 | 3 154 | ||||||
| | | | | | | | | | | |
Funds from operations(3) |
793 | 873 | 3 863 | 3 798 | ||||||
| | | | | | | | | | | |
- (1)
- The
three and twelve months ended December 31, 2018 have been restated to reflect the change to the company's segmented presentation of its Energy Trading business, with no
impact to overall consolidated results. The Energy Trading business is now included within each of the respective operating business segments to which the respective trading activity relates. Suncor's
Energy Trading business was previously reported within the Corporate, Energy Trading and Eliminations segment.
- (2)
- In
the second quarter of 2019, the company recorded an $88 million deferred income tax recovery in the R&M segment associated with the Government of Alberta's substantive
enactment of legislation for the staged reduction of the corporate income tax rate from 12% to 8% over the next four years.
- (3)
- Non-GAAP financial measures. See the Non-GAAP Financial Measures Advisory section of this document.
Bridge Analysis of Operating Earnings ($ millions)(1)

- (1)
- For an explanation of this bridge analysis, see the Non-GAAP Financial Measures Advisory section of this document.
R&M operating earnings in the fourth quarter of 2019 were $558 million, compared to $762 million in the prior year quarter. The decrease in operating earnings was primarily due to lower refining margins, attributed to significantly narrower crude differentials, lower refinery crude throughput, lower marketing margins, partially offset by a lower FIFO loss, as the prior year quarter included a significant FIFO loss associated with the significant decline in crude and refined product benchmarks.
| | | 2019 FOURTH QUARTER Suncor Energy Inc. 23 |
Volumes
|
Three months ended December 31 |
Twelve months ended December 31 |
||||||||
|
2019 | 2018 | 2019 | 2018 | ||||||
| | | | | | | | | | | |
Crude oil processed (mbbls/d) |
||||||||||
| | ||||||||||
Eastern North America |
217.3 | 221.0 | 203.3 | 208.1 | ||||||
| | ||||||||||
Western North America |
230.2 | 246.9 | 235.6 | 222.7 | ||||||
| | | | | | | | | | | |
Total |
447.5 | 467.9 | 438.9 | 430.8 | ||||||
| | | | | | | | | | | |
Refinery utilization(1) (%) |
||||||||||
| | ||||||||||
Eastern North America |
98 | 100 | 92 | 94 | ||||||
| | ||||||||||
Western North America |
96 | 103 | 98 | 93 | ||||||
| | | | | | | | | | | |
Total |
97 | 101 | 95 | 93 | ||||||
| | | | | | | | | | | |
Refined product sales (mbbls/d) |
||||||||||
| | ||||||||||
Gasoline |
247.4 | 245.6 | 246.6 | 245.6 | ||||||
| | ||||||||||
Distillate |
213.7 | 209.7 | 218.1 | 203.4 | ||||||
| | ||||||||||
Other |
73.5 | 75.3 | 74.7 | 78.4 | ||||||
| | | | | | | | | | | |
Total |
534.6 | 530.6 | 539.4 | 527.4 | ||||||
| | | | | | | | | | | |
Refining margin(2) ($/bbl) |
34.80 | 41.50 | 33.15 | 34.50 | ||||||
| | ||||||||||
Refining operating expense(2) ($/bbl) |
5.05 | 5.45 | 5.35 | 5.35 | ||||||
| | | | | | | | | | | |
- (1)
- Refinery
utilization is the amount of crude oil and natural gas plant liquids run through crude distillation units, expressed as a percentage of the capacity of these units.
- (2)
- Non-GAAP financial measures. See the Non-GAAP Financial Measures Advisory section of this document. Refining margins include the impact of the FIFO method of inventory valuation.
Refinery crude throughput was 447,500 bbls/d in the fourth quarter of 2019, compared to 467,900 bbls/d in the prior year quarter. Both periods achieved high utilization rates at 97% and 101%, respectively.
Refined product sales increased in the fourth quarter of 2019 to 534,600 bbls/d, compared to 530,600 bbls/d in the prior year quarter, reflecting strong retail sales volumes.
Prices and Margin
Realized refined product gross margins, including FIFO inventory valuation, were higher in the fourth quarter of 2019, compared to the prior year quarter, and were influenced by the following:
- •
- Narrower
crude oil differentials in the fourth quarter of 2019 compared to significantly wider differentials in the fourth quarter of 2018.
- •
- In the fourth quarter of 2019, the impact of the FIFO method of inventory valuation, relative to an estimated LIFO(1) accounting method, resulted in a negative impact on the company's results of $16 million, after-tax, compared to a negative impact on operating earnings of $649 million, after-tax, in the prior year quarter, for an overall favourable quarter-over-quarter impact of $633 million, after-tax.
Marketing gross margins in the fourth quarter of 2019 were lower than in the prior year quarter, primarily due to finished product market conditions.
Expenses and Other Factors
Operating expenses in the fourth quarter of 2019 increased slightly compared to the prior year quarter, primarily due to share-based compensation expense incurred in the fourth quarter of 2019, compared to a recovery of share-based compensation in the prior year quarter.
DD&A increased in the fourth quarter of 2019 compared to the prior year quarter due to the implementation of IFRS 16.
Planned Maintenance
A two-week planned maintenance event is scheduled at the Commerce City refinery in the first quarter of 2020. The anticipated impact of this maintenance event has been reflected in the company's 2020 guidance.
- (1)
- The estimated impact of the LIFO method is a non-GAAP financial measure. See the Non-GAAP Financial Measures Advisory section of this document.
| 24 2019 FOURTH QUARTER Suncor Energy Inc. | | |
CORPORATE AND ELIMINATIONS(1)
Financial Highlights
|
Three months ended December 31 |
Twelve months ended December 31 |
||||||||
($ millions) |
2019 | 2018 | 2019 | 2018 | ||||||
| | | | | | | | | | | |
Net loss |
(49 | ) | (550 | ) | (679 | ) | (1 613 | ) | ||
| | | | | | | | | | | |
Adjusted for: |
||||||||||
| | ||||||||||
Impact of income tax rate adjustment on deferred taxes(2) |
— | — | (48 | ) | — | |||||
| | ||||||||||
Unrealized foreign exchange (gain) loss on U.S. dollar denominated debt |
(235 | ) | 637 | (590 | ) | 989 | ||||
| | | | | | | | | | | |
Operating (loss) earnings(3) |
(284 | ) | 87 | (1 317 | ) | (624 | ) | |||
| | ||||||||||
Corporate |
(295 | ) | (178 | ) | (1,113 | ) | (876 | ) | ||
| | ||||||||||
Eliminations |
11 | 265 | (204 | ) | 252 | |||||
| | | | | | | | | | | |
Funds (used in) from operations(3) |
(200 | ) | 196 | (1 249 | ) | (369 | ) | |||
| | | | | | | | | | | |
- (1)
- Beginning
in the first quarter of 2019, results from the company's Energy Trading business have been included within each of the respective operating business segments to which the
respective trading activity relates. The Energy Trading business was previously reported within the Corporate, Energy Trading and Eliminations segment. Prior periods have been restated to reflect this
change. The results from the company's Renewable Energy business are included within Corporate results.
- (2)
- In
the second quarter of 2019, the company recorded a $48 million deferred income tax recovery in the Corporate and Eliminations segment associated with the Government of
Alberta's substantive enactment of legislation for the staged reduction of the corporate income tax rate from 12% to 8% over the next four years.
- (3)
- Non-GAAP financial measures. See the Non-GAAP Financial Measures Advisory section of this document.
Corporate
The Corporate operating loss was $295 million for the fourth quarter of 2019, compared to an operating loss of $178 million for the prior year quarter, with the increased loss attributable to a share-based compensation expense incurred in the fourth quarter of 2019, as compared to a share-based compensation recovery in the prior year quarter, and a lower operational foreign exchange gain than in the prior year quarter. Suncor capitalized $37 million of its borrowing costs in the fourth quarter of 2019 as part of the cost of major development assets and construction projects in progress, compared to $28 million in the prior year quarter.
Eliminations
Eliminations reflect the deferral or realization of profit on crude oil sales from Oil Sands to Suncor's refineries. Consolidated profits are only realized when the refined products produced from internal purchases of crude feedstock have been sold to third parties. During the fourth quarter of 2019, the company realized $11 million of after-tax intersegment profit, compared to a realization of $265 million of after-tax intersegment profit in the prior year quarter. The realization of deferred profit in the fourth quarter of 2019 was driven by the decrease in Oil Sands price realizations over the quarter, as higher margin crude refinery feedstock inventory sourced internally from Oil Sands was sold and replaced by lower margin crude feedstock inventory. The realization of deferred profit in the prior year quarter was driven by the decrease in oil sands benchmark prices, as a result of the significant widening of crude differentials.
| | | 2019 FOURTH QUARTER Suncor Energy Inc. 25 |
Capital and Exploration Expenditures by Segment
|
Three months ended December 31 |
Twelve months ended December 31 |
||||||||
($ millions) |
2019 | 2018 | 2019 | 2018 | ||||||
| | | | | | | | | | | |
Oil Sands |
1 082 | 663 | 3 522 | 3 546 | ||||||
| | ||||||||||
Exploration and Production |
281 | 285 | 1 070 | 946 | ||||||
| | ||||||||||
Refining and Marketing |
314 | 189 | 818 | 856 | ||||||
| | ||||||||||
Corporate and Eliminations |
98 | 10 | 148 | 58 | ||||||
| | | | | | | | | | | |
Total capital and exploration expenditures |
1 775 | 1 147 | 5 558 | 5 406 | ||||||
| | ||||||||||
Less: capitalized interest on debt |
(37 | ) | (28 | ) | (122 | ) | (156 | ) | ||
| | | | | | | | | | | |
|
1 738 | 1 119 | 5 436 | 5 250 | ||||||
| | | | | | | | | | | |
Capital and Exploration Expenditures by Type, excluding capitalized interest(1)
|
Three months ended December 31, 2019 |
Twelve months ended December 31, 2019 |
||||||||||||
($ millions) |
Asset Sustainment and Maintenance(2) |
Economic Investment(3) |
Total |
Asset Sustainment and Maintenance(2) |
Economic Investment(3) |
Total | ||||||||
| | | | | | | | | | | | | | | |
Oil Sands |
||||||||||||||
| | ||||||||||||||
Oil Sands Base |
541 | 107 | 648 | 1 667 | 164 | 1 831 | ||||||||
| | ||||||||||||||
In Situ |
31 | 129 | 160 | 113 | 575 | 688 | ||||||||
| | ||||||||||||||
Fort Hills |
66 | 10 | 76 | 331 | 72 | 403 | ||||||||
| | ||||||||||||||
Syncrude |
156 | 24 | 180 | 493 | 46 | 539 | ||||||||
| | ||||||||||||||
Exploration and Production |
2 | 263 | 265 | 5 | 1 011 | 1 016 | ||||||||
| | ||||||||||||||
Refining and Marketing |
200 | 112 | 312 | 566 | 245 | 811 | ||||||||
| | ||||||||||||||
Corporate and Eliminations |
30 | 67 | 97 | 52 | 96 | 148 | ||||||||
| | | | | | | | | | | | | | | |
|
1 026 | 712 | 1 738 | 3 227 | 2 209 | 5 436 | ||||||||
| | | | | | | | | | | | | | | |
- (1)
- The
classification of the company's capital expenditures has been updated to "asset sustainment and maintenance" and "economic investment" to better reflect the types of capital
investments being made by the company.
- (2)
- Asset
sustainment and maintenance capital expenditures include capital investments that deliver on existing value by ensuring compliance or maintaining relations with regulators and
other stakeholders, maintaining current processing capacity, and delivering existing developed reserves.
- (3)
- Economic investment capital expenditures include capital investments that result in an increase in value through adding reserves, improving processing capacity, utilization, cost or margin, including associated infrastructure.
The company spent $1.738 billion on capital expenditures in the fourth quarter of 2019, excluding capitalized interest, an increase from $1.119 billion in the prior year quarter, with the increase driven by increased asset sustainment and maintenance capital expenditures related to an increase in planned maintenance activities at Oil Sands Base and Syncrude, as well as increased economic investment capital expenditures at In Situ, Refining and Marketing and Corporate.
Activity in the fourth quarter of 2019 is summarized by business unit below.
Oil Sands
Oil Sands Base capital and exploration expenditures were $648 million in the fourth quarter of 2019, the majority of which was focused on asset sustainment activities related to the company's planned maintenance program, which included the completion of annual coker maintenance at Upgrader 2, the continued development of tailings infrastructure, and other reliability and sustainment projects across the operations. This also included increasing economic investment to progress low-carbon power cogeneration to replace the coke-fired boilers and continued construction of the Syncrude interconnecting pipelines.
| 26 2019 FOURTH QUARTER Suncor Energy Inc. | | |
In Situ capital expenditures were $160 million in the fourth quarter of 2019, and were primarily directed towards economic investment activities, including well pad construction that is expected to maintain existing production levels at Firebag and MacKay River.
Capital expenditures at Fort Hills were $76 million in the fourth quarter of 2019, primarily focused on sustaining capital activities on mine and tailings development to preserve production capacity.
Syncrude capital expenditures were $180 million in the fourth quarter of 2019, the majority of which was for asset sustainment expenditures focused on maintaining existing assets, including capital related to the upgrader turnaround.
Exploration and Production
Capital and exploration expenditures at E&P were $265 million in the fourth quarter of 2019 and were primarily focused on economic investment projects, including development drilling at Hibernia, Hebron and Buzzard, and development work on Terra Nova, Fenja and the West White Rose Projects.
Refining and Marketing
R&M capital expenditures were $312 million and were primarily related to the ongoing sustainment and enhancement to refinery and retail operations, and other economic investment projects on logistics and our retail and wholesale network, including an electric vehicle fast-charge network.
Corporate and Eliminations
Corporate capital expenditures were $97 million, primarily directed towards the company's information technology initiatives and the Forty Mile Wind Power Project.
| | | 2019 FOURTH QUARTER Suncor Energy Inc. 27 |
6. FINANCIAL CONDITION AND LIQUIDITY
Indicators
|
Twelve months ended | |||||||||
|
Previous leasing standard December 31 2019 |
IFRS 16 impact |
IFRS 16 December 31 2019 |
December 31 2018 |
||||||
| | | | | | | | | | | |
Return on Capital Employed(1) (%) |
||||||||||
| | ||||||||||
Excluding major projects in progress(2)(3) |
5.2 | (0.1 | ) | 5.1 | 8.2 | |||||
| | ||||||||||
Including major projects in progress(2) |
5.0 | (0.1 | ) | 4.9 | 8.0 | |||||
| | | | | | | | | | | |
Net debt to funds from operations(4)(5) (times) |
1.3 | 0.2 | 1.5 | 1.5 | ||||||
| | | | | | | | | | | |
Interest coverage on long-term debt (times) |
||||||||||
| | ||||||||||
Earnings basis(6) |
3.6 | (0.1 | ) | 3.5 | 6.4 | |||||
| | ||||||||||
Funds from operations basis(5)(7) |
13.9 | (0.5 | ) | 13.4 | 14.1 | |||||
| | | | | | | | | | | |
Total debt to total debt plus shareholders' equity (%) |
27.8 | 2.2 | 29.9 | 28.3 | ||||||
| | | | | | | | | | | |
- (1)
- Non-GAAP
financial measure. See the Non-GAAP Financial Measures Advisory section of this document.
- (2)
- 2019
ROCE includes asset impairment charges of $3.352 billion after-tax.
- (3)
- ROCE
excluding major projects in progress would have been 8.6% for the twelve months ended December 31, 2019, excluding the impacts of impairments of $3.352 billion
after-tax in the fourth quarter of 2019 and the impacts of $1.116 billion deferred tax recovery for the Alberta corporate income tax rate change in the second quarter of 2019.
- (4)
- Net
debt is equal to total debt less cash and cash equivalents.
- (5)
- Funds
from operations and metrics that use funds from operations are non-GAAP financial measures. See the Non-GAAP Financial Measures Advisory section of this document.
- (6)
- Equal
to net earnings plus income taxes and interest expense, divided by the sum of interest expense and capitalized interest on debt.
- (7)
- Equal to funds from operations plus current income taxes and interest expense, divided by the sum of interest expense and capitalized interest on debt.
Capital Resources
Suncor's capital resources consist primarily of cash flow provided by operating activities, cash and cash equivalents, and available lines of credit. Suncor's management believes the company will have the capital resources to fund its planned 2020 capital spending program of $5.4 to $6.0 billion and to meet current and future working capital requirements, through cash and cash equivalents balances, cash flow provided by operating activities, available committed credit facilities, issuing commercial paper and, if needed, accessing capital markets. The company's cash flow provided by operating activities depends on a number of factors, including commodity prices, production and sales volumes, refining and marketing margins, operating expenses, taxes, royalties and foreign exchange rates.
The company has invested cash in short-term financial instruments that are presented as cash and cash equivalents. The objectives of the company's short-term investment portfolio are to ensure the preservation of capital, maintain adequate liquidity to meet Suncor's cash flow requirements and deliver competitive returns derived from the quality and diversification of investments within acceptable risk parameters. The maximum weighted average term to maturity of the short-term investment portfolio is not expected to exceed six months, and all investments will be with counterparties with investment grade debt ratings.
Available Sources of Liquidity
For the three months ended December 31, 2019, cash and cash equivalents decreased to $1.960 billion, from $2.089 billion at September 30, 2019, with cash flow provided by operating activities and an increase in short-term indebtedness being more than offset by the planned use of cash related to the company's capital and exploration expenditures, dividend requirements and the repurchase of Suncor's own shares under its NCIB in the fourth quarter of 2019. The company's cash and cash equivalents balance at December 31, 2019, was also impacted by a use of cash in the current period associated with the company's working capital balances, as the company's accounts receivables balances increased due to increasing refinery margins at the end of the quarter and higher upstream sales volumes.
For the twelve months ended December 31, 2019, cash and cash equivalents decreased to $1.960 billion, from $2.221 billion at December 31, 2018, with uses of cash in respect of the company's capital and exploration expenditures, dividend requirements, the repurchase of $2.274 billion of Suncor's own shares under its NCIB, and a net decrease of short-term and long-term debt of $425 million, exceeding cash flow provided by operating activities.
| 28 2019 FOURTH QUARTER Suncor Energy Inc. | | |
As at December 31, 2019, the weighted average days to maturity of the company's short-term investment portfolio was approximately 17 days.
Available credit facilities for liquidity purposes at December 31, 2019 increased to $4.701 billion, compared to $3.608 billion at December 31, 2018, primarily as a result of the repayment of short-term indebtedness.
Financing Activities
Management of debt levels continues to be a priority for Suncor given the company's long-term growth plans and future expected volatility in the pricing environment. Suncor believes a phased and flexible approach to existing and future growth projects should assist the company in maintaining its ability to manage project costs and debt levels.
Total Debt to Total Debt Plus Shareholders' Equity
Suncor is subject to financial and operating covenants related to its bank debt and public market debt. Failure to meet the terms of one or more of these covenants may constitute an "event of default" as defined in the respective debt agreements, potentially resulting in accelerated repayment of one or more of the debt obligations. The company is in compliance with its financial covenant that requires total debt to not exceed 65% of its total debt plus shareholders' equity. At December 31, 2019, total debt to total debt plus shareholders' equity was 29.9% (December 31, 2018 – 28.3%) and increased due to the implementation of IFRS 16 and impairment charges recorded in the fourth quarter of 2019. The company continues to be in compliance with all operating covenants under its debt agreements.
($ millions, except as noted) |
December 31 2019 |
December 31 2018(1) |
||||
| | | | | | | |
Short-term debt |
2 155 | 3 231 | ||||
| | ||||||
Current portion of long-term debt |
— | 191 | ||||
| | ||||||
Current portion of long-term lease liabilities |
310 | 38 | ||||
| | ||||||
Long-term debt |
12 884 | 12 668 | ||||
| | ||||||
Long-term lease liabilities |
2 621 | 1 222 | ||||
| | | | | | | |
Total debt |
17 970 | 17 350 | ||||
| | ||||||
Less: Cash and cash equivalents |
1 960 | 2 221 | ||||
| | | | | | | |
Net debt |
16 010 | 15 129 | ||||
| | ||||||
Shareholders' equity |
42 042 | 44 005 | ||||
| | | | | | | |
Total debt plus shareholders' equity |
60 012 | 61 355 | ||||
| | | | | | | |
Total debt to total debt plus shareholders' equity (%) |
29.9 | 28.3 | ||||
| | | | | | | |
- (1)
- Excludes the impact of IFRS 16, which was prospectively adopted on January 1, 2019 in accordance with the standard.
Change in Debt
($ millions) |
Three months ended December 31, 2019 |
Twelve months ended December 31, 2019 |
||||
| | | | | | | |
Total debt – beginning of period |
17 690 | 17 350 | ||||
| | ||||||
Increase in long-term debt |
— | 557 | ||||
| | ||||||
Increase (decrease) in short-term debt |
545 | (982 | ) | |||
| | ||||||
January 1, 2019 increase in lease liabilities associated with IFRS 16 |
— | 1 792 | ||||
| | ||||||
Increase in lease liability |
63 | 186 | ||||
| | ||||||
Lease payments |
(77 | ) | (307 | ) | ||
| | ||||||
Foreign exchange on debt, and other |
(251 | ) | (626 | ) | ||
| | | | | | | |
Total debt – December 31, 2019 |
17 970 | 17 970 | ||||
| | ||||||
Less: Cash and cash equivalents – December 31, 2019 |
1 960 | 1 960 | ||||
| | | | | | | |
Net debt – December 31, 2019 |
16 010 | 16 010 | ||||
| | | | | | | |
| | | 2019 FOURTH QUARTER Suncor Energy Inc. 29 |
The company's total debt increased in the fourth quarter of 2019 due to an increase of short-term indebtedness and leases entered into during the period, partially offset by favourable foreign exchange rates on U.S. dollar denominated debt compared to September 30, 2019, and lease principal payments made during the fourth quarter of 2019.
On a year-to-date basis, the company's total debt increased in 2019 due primarily to the impact of the adoption of IFRS 16, which added $1.792 billion in lease liability to the company's balance sheet, a net increase in long-term debt and leases entered into in 2019, partially offset by the repayment of $982 million of short-term debt, favourable foreign exchange rates on U.S. dollar denominated debt, as compared to December 31, 2018, and lease principal payments made in 2019.
Common Shares
(thousands) |
December 31, 2019 | |||
| | | | | |
Common shares |
1 531 874 | |||
| | ||||
Common share options – exercisable |
21 535 | |||
| | ||||
Common share options – non-exercisable |
12 347 | |||
| | | | | |
As at February 3, 2020, the total number of common shares outstanding was 1,529,583,074 and the total number of exercisable and non-exercisable common share options outstanding was 33,142,876. Once exercisable, each outstanding common share option is convertible into one common share.
Share Repurchases
Under the company's NCIB that commenced in the second quarter of 2019, Suncor is permitted to purchase common shares for cancellation through the facilities of the Toronto Stock Exchange (TSX), the New York Stock Exchange and/or alternative trading platforms between May 6, 2019 and May 5, 2020. Under the company's NCIB, 40,406,781 common shares have been purchased to date, representing 2.6% of the total outstanding common shares.
During the fourth quarter of 2019, Suncor repurchased and cancelled 11,139,941 common shares, representing 0.7% of the total outstanding common shares, at an average price of $40.56 per common share, for a total of $452 million, compared to the prior year quarter when the company repurchased and cancelled 26,725,575 common shares at an average price of $43.61 per common share, for a total of $1.166 billion.
|
Three months ended December 31 |
Twelve months ended December 31 |
||||||||
($ millions, except as noted) |
2019 | 2018 | 2019 | 2018 | ||||||
| | | | | | | | | | | |
Share repurchase activities (thousands of common shares) |
11 140 | 26 726 | 55 298 | 64 426 | ||||||
| | ||||||||||
Weighted average repurchase price per share (dollars per share) |
40.56 | 43.61 | 41.12 | 47.38 | ||||||
| | ||||||||||
Share repurchase cost |
452 | 1 166 | 2 274 | 3 053 | ||||||
| | | | | | | | | | | |
Following the approval by the Board of Directors to increase the NCIB to $2.5 billion in the fourth quarter of 2019, the TSX accepted a notice filed by Suncor of its intention to amend its NCIB effective as of December 30, 2019. The notice provided that Suncor may increase the maximum number of common shares that may be purchased for cancellation between May 6, 2019 and May 5, 2020 from approximately 3% of Suncor's issued and outstanding common shares as at April 30, 2019 to approximately 5% of Suncor's issued and outstanding common shares as at April 30, 2019.
Between May 6, 2019 and February 3, 2020, pursuant to the NCIB, Suncor has already repurchased approximately $1.781 billion of common shares on the open market. Pursuant to the NCIB (as amended), Suncor has agreed that it will not purchase more than 78,549,178 common shares, of which 43,931,561 common shares have already been purchased between May 6, 2019 and February 3, 2020. Suncor security holders may obtain a copy of the notice, without charge, by contacting the company. Subsequent to the end of the fourth quarter of 2019, Suncor's Board of Directors approved a further share repurchase program of up to $2.0 billion.
Contractual Obligations, Commitments, Guarantees, and Off-Balance Sheet Arrangements
In the normal course of business, the company is obligated to make future payments, including contractual obligations and non-cancellable commitments. Suncor has included these items in the Financial Condition and Liquidity section of Suncor's Management's Discussion and Analysis for the year ended December 31, 2018 dated February 28, 2019 (the 2018 annual MD&A) with no significant updates to note in the fourth quarter of 2019. Suncor does not believe that it has any guarantees or off-balance sheet arrangements that have, or are reasonably likely to have, a current or future material effect on the company's financial performance or financial condition, results of operations, liquidity or capital expenditures.
| 30 2019 FOURTH QUARTER Suncor Energy Inc. | | |
Trends in Suncor's quarterly revenue, earnings and funds from operations are driven primarily by production volumes, which can be significantly impacted by major maintenance events, changes in commodity prices, including widening of crude differentials, refining crack spreads, foreign exchange rates and other significant events impacting operations, such as the Government of Alberta's mandatory production curtailments implemented during 2019.
Financial Summary
|
Three months ended ($ millions, unless otherwise noted) |
Dec 31 2019 |
Sept 30 2019 |
June 30 2019 |
Mar 31 2019 |
Dec 31 2018 |
Sept 30 2018 |
June 30 2018 |
Mar 31 2018 |
||||||||||
| | | | | | | | | | | | | | | | | | | |
Total production (mboe/d) |
||||||||||||||||||
| | ||||||||||||||||||
Oil Sands |
662.3 | 670.0 | 692.2 | 657.2 | 740.8 | 651.7 | 547.6 | 571.7 | ||||||||||
| | ||||||||||||||||||
Exploration and Production |
115.9 | 92.3 | 111.7 | 107.1 | 90.2 | 92.1 | 114.1 | 117.7 | ||||||||||
| | | | | | | | | | | | | | | | | | | |
|
778.2 | 762.3 | 803.9 | 764.3 | 831.0 | 743.8 | 661.7 | 689.4 | ||||||||||
| | | | | | | | | | | | | | | | | | | |
Revenues and other income |
||||||||||||||||||
| | ||||||||||||||||||
Operating revenues, net of royalties |
9 487 | 9 803 | 10 071 | 8 983 | 8 561 | 10 847 | 10 327 | 8 807 | ||||||||||
| | ||||||||||||||||||
Other income (loss) |
111 | 93 | 27 | 414 | 384 | 16 | 101 | (57 | ) | |||||||||
| | | | | | | | | | | | | | | | | | | |
|
9 598 | 9 896 | 10 098 | 9 397 | 8 945 | 10 863 | 10 428 | 8 750 | ||||||||||
| | | | | | | | | | | | | | | | | | | |
Net (loss) earnings |
(2 335 | ) | 1 035 | 2 729 | 1 470 | (280 | ) | 1 812 | 972 | 789 | ||||||||
| | ||||||||||||||||||
per common share – basic (dollars) |
(1.52 | ) | 0.67 | 1.74 | 0.93 | (0.18 | ) | 1.12 | 0.60 | 0.48 | ||||||||
| | ||||||||||||||||||
per common share – diluted (dollars) |
(1.52 | ) | 0.67 | 1.74 | 0.93 | (0.18 | ) | 1.11 | 0.59 | 0.48 | ||||||||
| | | | | | | | | | | | | | | | | | | |
Operating earnings(1) |
782 | 1 114 | 1 253 | 1 209 | 580 | 1 557 | 1 190 | 985 | ||||||||||
| | ||||||||||||||||||
per common share – basic(1) (dollars) |
0.51 | 0.72 | 0.80 | 0.77 | 0.36 | 0.96 | 0.73 | 0.60 | ||||||||||
| | | | | | | | | | | | | | | | | | | |
Funds from operations(1) |
2 553 | 2 675 | 3 005 | 2 585 | 2 007 | 3 139 | 2 862 | 2 164 | ||||||||||
| | ||||||||||||||||||
per common share – basic(1) (dollars) |
1.66 | 1.72 | 1.92 | 1.64 | 1.26 | 1.94 | 1.75 | 1.32 | ||||||||||
| | | | | | | | | | | | | | | | | | | |
Cash flow provided by operating activities |
2 304 | 3 136 | 3 433 | 1 548 | 3 040 | 4 370 | 2 446 | 724 | ||||||||||
| | ||||||||||||||||||
per common share – basic (dollars) |
1.50 | 2.02 | 2.19 | 0.98 | 1.90 | 2.70 | 1.50 | 0.44 | ||||||||||
| | | | | | | | | | | | | | | | | | | |
ROCE(1) (%) for the twelve months ended |
4.9 | 9.7 | 10.4 | 8.2 | 8.0 | 9.7 | 8.3 | 6.5 | ||||||||||
| | | | | | | | | | | | | | | | | | | |
ROCE(1)(2), excluding major projects in progress (%) for twelve months ended |
5.1 | 9.9 | 10.6 | 8.3 | 8.2 | 10.4 | 9.5 | 7.8 | ||||||||||
| | | | | | | | | | | | | | | | | | | |
After-tax unrealized foreign exchange gain (loss) on U.S. dollar denominated debt |
235 | (127 | ) | 221 | 261 | (637 | ) | 195 | (218 | ) | (329 | ) | ||||||
| | | | | | | | | | | | | | | | | | | |
Common share information (dollars) |
||||||||||||||||||
| | ||||||||||||||||||
Dividend per common share |
0.42 | 0.42 | 0.42 | 0.42 | 0.36 | 0.36 | 0.36 | 0.36 | ||||||||||
| | ||||||||||||||||||
Share price at the end of trading |
||||||||||||||||||
| | ||||||||||||||||||
Toronto Stock Exchange (Cdn$) |
42.56 | 41.79 | 40.85 | 43.31 | 38.13 | 49.98 | 53.50 | 44.49 | ||||||||||
| | ||||||||||||||||||
New York Stock Exchange (US$) |
32.80 | 31.58 | 31.16 | 32.43 | 27.97 | 38.69 | 40.68 | 34.54 | ||||||||||
| | | | | | | | | | | | | | | | | | | |
- (1)
- Non-GAAP
financial measures. See the Non-GAAP Financial Measures Advisory section of this document.
- (2)
- ROCE excluding major projects in progress would have been 8.7%, 8.0%, and 8.6% for the second quarter of 2019, third quarter of 2019, and fourth quarter of 2019, respectively, excluding the impacts of impairments of $3.352 billion after-tax in the fourth quarter of 2019 and the impacts of $1.116 billion deferred tax recovery for the Alberta corporate income tax rate change in the second quarter of 2019.
| | | 2019 FOURTH QUARTER Suncor Energy Inc. 31 |
Business Environment
| (average for the three months ended) |
Dec 31 2019 |
Sept 30 2019 |
June 30 2019 |
Mar 31 2019 |
Dec 31 2018 |
Sept 30 2018 |
June 30 2018 |
Mar 31 2018 |
||||||||||||
| | | | | | | | | | | | | | | | | | | | | |
WTI crude oil at Cushing |
US$/bbl | 56.95 | 56.45 | 59.85 | 54.90 | 58.85 | 69.50 | 67.90 | 62.90 | |||||||||||
| | ||||||||||||||||||||
Dated Brent crude |
US$/bbl | 63.30 | 61.90 | 68.85 | 63.20 | 67.80 | 75.25 | 74.40 | 66.80 | |||||||||||
| | ||||||||||||||||||||
Dated Brent/Maya FOB price differential |
US$/bbl | 9.30 | 5.20 | 6.90 | 5.00 | 4.35 | 10.20 | 12.40 | 7.70 | |||||||||||
| | ||||||||||||||||||||
MSW at Edmonton |
Cdn$/bbl | 68.10 | 68.35 | 73.40 | 66.45 | 42.70 | 82.10 | 80.95 | 72.45 | |||||||||||
| | ||||||||||||||||||||
WCS at Hardisty |
US$/bbl | 41.10 | 44.20 | 49.20 | 42.50 | 19.50 | 47.35 | 48.65 | 38.60 | |||||||||||
| | ||||||||||||||||||||
Light/heavy crude oil differential for WTI at Cushing less WCS at Hardisty |
US$/bbl | (15.85 | ) | (12.25 | ) | (10.65 | ) | (12.40 | ) | (39.35 | ) | (22.15 | ) | (19.25 | ) | (24.30 | ) | |||
| | ||||||||||||||||||||
SYN-WTI (differential) premium |
US$/bbl | (0.70 | ) | 0.40 | 0.15 | (2.30 | ) | (21.60 | ) | (0.90 | ) | (0.65 | ) | (1.45 | ) | |||||
| | ||||||||||||||||||||
Condensate at Edmonton |
US$/bbl | 53.00 | 52.00 | 55.90 | 50.55 | 45.30 | 66.80 | 68.50 | 63.15 | |||||||||||
| | ||||||||||||||||||||
Natural gas (Alberta spot) at AECO |
Cdn$/mcf | 2.50 | 0.95 | 1.05 | 2.55 | 1.60 | 1.20 | 1.20 | 1.75 | |||||||||||
| | ||||||||||||||||||||
Alberta Power Pool Price |
Cdn$/MWh | 46.95 | 46.85 | 56.35 | 70.75 | 55.55 | 54.45 | 56.00 | 34.95 | |||||||||||
| | ||||||||||||||||||||
New York Harbor 2-1-1 crack(1) |
US$/bbl | 18.50 | 19.75 | 22.40 | 19.10 | 18.75 | 19.50 | 21.45 | 17.95 | |||||||||||
| | ||||||||||||||||||||
Chicago 2-1-1 crack(1) |
US$/bbl | 14.45 | 17.05 | 21.55 | 15.30 | 16.25 | 19.90 | 19.10 | 14.30 | |||||||||||
| | ||||||||||||||||||||
Portland 2-1-1 crack(1) |
US$/bbl | 25.75 | 23.85 | 29.15 | 19.35 | 24.25 | 22.05 | 28.75 | 21.05 | |||||||||||
| | ||||||||||||||||||||
Gulf Coast 2-1-1 crack(1) |
US$/bbl | 17.10 | 20.00 | 21.70 | 17.85 | 17.45 | 19.30 | 20.50 | 16.35 | |||||||||||
| | ||||||||||||||||||||
Exchange rate |
US$/Cdn$ | 0.76 | 0.76 | 0.75 | 0.75 | 0.76 | 0.77 | 0.77 | 0.79 | |||||||||||
| | ||||||||||||||||||||
Exchange rate (end of period) |
US$/Cdn$ | 0.77 | 0.76 | 0.76 | 0.75 | 0.73 | 0.77 | 0.76 | 0.78 | |||||||||||
| | | | | | | | | | | | | | | | | | | | | |
- (1)
- 2-1-1 crack spreads are indicators of the refining margin generated by converting two barrels of WTI into one barrel of gasoline and one barrel of diesel. The company previously quoted 3-2-1 crack margin benchmarks based on wider use and familiarity with these benchmarks and though the 3-2-1 crack spread is more commonly quoted, the company's refinery production is better aligned with a 2-1-1 crack spread, which better reflects the approximate composition of Suncor's overall refined product mix. The crack spreads presented here generally approximate the regions into which the company sells refined products through retail and wholesale channels.
| 32 2019 FOURTH QUARTER Suncor Energy Inc. | | |
Accounting Policies and New IFRS Standards
Suncor's significant accounting policies and a summary of recently announced accounting standards are described in the Accounting Policies and Critical Accounting Estimates section of Suncor's 2018 annual MD&A and in note 3 of Suncor's unaudited interim Consolidated Financial Statements for the three and twelve months ended December 31, 2019.
Critical Accounting Estimates
The preparation of financial statements in accordance with GAAP requires management to make estimates, judgments and assumptions that affect reported assets, liabilities, revenues and expenses, gains and losses, and disclosures of contingencies. These estimates and assumptions are subject to change based on experience and new information. Critical accounting estimates are those that require management to make assumptions about matters that are highly uncertain at the time the estimate is made. Critical accounting estimates are also those estimates which, where a different estimate could have been used or where changes in the estimate that are reasonably likely to occur, would have a material impact on the company's financial condition, changes in financial condition or financial performance. Critical accounting estimates and judgments are reviewed annually by the Audit Committee of the Board of Directors. A detailed description of Suncor's critical accounting estimates is provided in note 4 to the audited Consolidated Financial Statements for the year ended December 31, 2018 and in the Accounting Policies and Critical Accounting Estimates section of Suncor's 2018 annual MD&A.
Financial Instruments
Suncor periodically enters into derivative contracts such as forwards, futures, swaps, options and costless collars to manage exposure to fluctuations in commodity prices and foreign exchange rates, and to optimize the company's position with respect to interest payments. The company also uses physical and financial energy derivatives to earn trading profits. For more information on Suncor's financial instruments and the related financial risk factors, see note 25 of the audited Consolidated Financial Statements for the year ended December 31, 2018, note 10 to the unaudited interim Consolidated Financial Statements for the three and twelve months ended December 31, 2019, and the Financial Condition and Liquidity section of the 2018 annual MD&A.
| | | 2019 FOURTH QUARTER Suncor Energy Inc. 33 |
9. NON-GAAP FINANCIAL MEASURES ADVISORY
Certain financial measures in this document – namely operating earnings (loss), ROCE, funds from (used in) operations, free funds flow, discretionary free funds flow, Oil Sands operations cash operating costs, Fort Hills cash operating costs, Syncrude cash operating costs, refining margin, refining operating expense, LIFO inventory valuation methodology and related per share amounts – are not prescribed by GAAP. These non-GAAP financial measures are included because management uses the information to analyze business performance, leverage and liquidity, and it may be useful to investors on the same basis. These non-GAAP financial measures do not have any standardized meaning and, therefore, are unlikely to be comparable to similar measures presented by other companies. Therefore, these non-GAAP financial measures should not be considered in isolation or as a substitute for measures of performance prepared in accordance with GAAP. Except as otherwise indicated, these non-GAAP financial measures are calculated and disclosed on a consistent basis from period to period. Specific adjusting items may only be relevant in certain periods.
Operating Earnings (Loss)
Operating earnings (loss) is a non-GAAP financial measure that adjusts net earnings (loss) for significant items that are not indicative of operating performance. Management uses operating earnings (loss) to evaluate operating performance because management believes it provides better comparability between periods. Operating earnings (loss) are reconciled to net earnings (loss) in the Consolidated Financial Information and Segment Results and Analysis sections of this document.
Bridge Analyses of Operating Earnings
Throughout this document, the company presents charts that illustrate the change in operating earnings from the comparative period through key variance factors. These factors are analyzed in the Operating Earnings narratives following the bridge analyses in particular sections of this document. These bridge analyses are presented because management uses this presentation to evaluate performance.
- •
- The
factor for Sales Volumes and Mix is calculated based on sales volumes and mix for the Oil Sands and E&P segments and throughput volumes and mix for the
R&M segment.
- •
- The
factor for Price, Margin and Other Revenue includes upstream price realizations before royalties, with the exception of Libya, which is net of royalties. Also included
are refining and marketing margins, other operating revenue, and the net impacts of sales and purchases of third-party crude, including product purchased for use as diluent in the company's Oil Sands
operations and subsequently sold as part of diluted bitumen.
- •
- The
factor for Inventory Valuation includes the after-tax impact of the FIFO method of inventory valuation in the company's R&M segment, as well as the impact of the
deferral or realization of profit or loss on crude oil sales from the Oil Sands segment to Suncor's refineries, as both represent inventory valuation adjustments.
- •
- The
factor for Royalties excludes the impact of Libya, as royalties in Libya are taken into account in Price, Margin and Other Revenue as described above.
- •
- The
factor for Operating and Transportation Expense includes project startup costs, operating, selling and general expense, and transportation expense.
- •
- The factor for Financing Expense and Other includes financing expenses, other income, operational foreign exchange gains and losses, changes in gains and losses on disposal of assets that are not operating earnings adjustments, changes in statutory income tax rates and other income tax adjustments.
| 34 2019 FOURTH QUARTER Suncor Energy Inc. | | |
Return on Capital Employed (ROCE)
ROCE is a non-GAAP financial measure that management uses to analyze operating performance and the efficiency of Suncor's capital allocation process. Average capital employed is calculated as a twelve-month average of the capital employed balance at the beginning of the twelve-month period and the month-end capital employed balances throughout the remainder of the twelve-month period. Figures for capital employed at the beginning and end of the twelve-month period are presented to show the changes in the components of the calculation over the twelve-month period.
The company presents two ROCE calculations – one including and one excluding the impacts on capital employed for major projects in progress. Major projects in progress includes accumulated capital expenditures and capitalized interest for significant projects still under construction or in the process of being commissioned, and acquired assets that are still being evaluated. Management uses ROCE excluding the impacts of major projects in progress on capital employed to assess performance of operating assets.
|
For the twelve months ended December 31 ($ millions, except as noted) |
2019 | 2018 | ||||||
| | | | | | | | | |
Adjustments to net earnings |
||||||||
| | ||||||||
Net earnings |
2 899 | 3 293 | ||||||
| | ||||||||
(Deduct) add after-tax amounts for: |
||||||||
| | ||||||||
Unrealized foreign exchange (gain) loss on U.S. dollar denominated debt |
(590 | ) | 989 | |||||
| | ||||||||
Net interest expense |
638 | 541 | ||||||
| | | | | | | | | |
|
A | 2 947 | 4 823 | |||||
| | | | | | | | | |
Capital employed – beginning of twelve-month period |
||||||||
| | ||||||||
Net debt |
15 129 | 12 907 | ||||||
| | ||||||||
Shareholders' equity |
44 005 | 45 383 | ||||||
| | | | | | | | | |
|
59 134 | 58 290 | ||||||
| | | | | | | | | |
Capital employed – end of twelve-month period |
||||||||
| | ||||||||
Net debt |
16 010 | 15 129 | ||||||
| | ||||||||
Shareholders' equity |
42 042 | 44 005 | ||||||
| | | | | | | | | |
|
58 052 | 59 134 | ||||||
| | | | | | | | | |
Average capital employed |
B | 60 402 | 60 347 | |||||
| | | | | | | | | |
ROCE – including major projects in progress (%) |
A/B | 4.9 | 8.0 | |||||
| | | | | | | | | |
Average capitalized costs related to major projects in progress |
C | 2 452 | 1 412 | |||||
| | | | | | | | | |
ROCE – excluding major projects in progress (%)(1) |
A/(B-C) | 5.1 | 8.2 | |||||
| | | | | | | | | |
- (1)
- ROCE excluding major projects in progress would have been 8.6% for the twelve months ended December 31, 2019, excluding the impacts of impairments of $3.352 billion after-tax in the fourth quarter of 2019 and the impacts of $1.116 billion deferred tax recovery for the Alberta corporate income tax rate change in the second quarter of 2019.
| | | 2019 FOURTH QUARTER Suncor Energy Inc. 35 |
Funds From (Used In) Operations(1)
Funds from (used in) operations is a non-GAAP financial measure that adjusts a GAAP measure – cash flow provided by (used in) operating activities – for changes in non-cash working capital, which management uses to analyze operating performance and liquidity. Changes to non-cash working capital can be impacted by, among other factors, the timing of offshore feedstock purchases and payments for commodity and income taxes, the timing of cash flows related to accounts receivable and accounts payable, and changes in inventory which management believes reduces comparability between periods.
Funds from (used in) operations for each quarter are separately defined and reconciled to the cash flow provided by operating activities measure in the Non-GAAP Financial Measures Advisory section of each respective management's discussion and analysis or quarterly report to shareholders, as applicable, for the related quarter.
| Three months ended December 31 | Oil Sands |
Exploration and Production |
Refining and Marketing |
Corporate and Eliminations |
Total | |||||||||||||||||
| ($ millions) | 2019 | 2018 | 2019 | 2018 | 2019 | 2018 | 2019 | 2018 | 2019 | 2018 | ||||||||||||
| | | | | | | | | | | | | | | | | | | | | | | |
Net (loss) earnings |
(2 682 | ) | (377 | ) | (162 | ) | (115 | ) | 558 | 762 | (49 | ) | (550 | ) | (2 335 | ) | (280 | ) | ||||
| | ||||||||||||||||||||||
Adjustments for: |
||||||||||||||||||||||
| | ||||||||||||||||||||||
Depreciation, depletion, amortization and impairment |
5 081 | 1 019 | 803 | 199 | 211 | 184 | 18 | 17 | 6 113 | 1 419 | ||||||||||||
| | ||||||||||||||||||||||
Deferred income taxes |
(890 | ) | 89 | (112 | ) | 3 | (7 | ) | (19 | ) | 7 | 87 | (1 002 | ) | 160 | |||||||
| | ||||||||||||||||||||||
Accretion |
54 | 53 | 10 | 12 | 1 | 2 | — | — | 65 | 67 | ||||||||||||
| | ||||||||||||||||||||||
Unrealized foreign exchange (gain) loss on U.S. dollar denominated debt |
— | — | — | — | — | — | (246 | ) | 688 | (246 | ) | 688 | ||||||||||
| | ||||||||||||||||||||||
Change in fair value of financial instruments and trading inventory |
(20 | ) | (84 | ) | 13 | (37 | ) | (6 | ) | (27 | ) | — | — | (13 | ) | (148 | ) | |||||
| | ||||||||||||||||||||||
(Gain) loss on disposal of assets |
(1 | ) | (1 | ) | — | 253 | (8 | ) | (2 | ) | — | — | (9 | ) | 250 | |||||||
| | ||||||||||||||||||||||
Share-based compensation |
22 | (22 | ) | 2 | (3 | ) | 11 | (12 | ) | 28 | (51 | ) | 63 | (88 | ) | |||||||
| | ||||||||||||||||||||||
Exploration |
— | — | 27 | 11 | — | — | — | — | 27 | 11 | ||||||||||||
| | ||||||||||||||||||||||
Settlement of decommissioning and restoration liabilities |
(128 | ) | (91 | ) | (16 | ) | (8 | ) | (7 | ) | (5 | ) | — | — | (151 | ) | (104 | ) | ||||
| | ||||||||||||||||||||||
Other |
(31 | ) | 21 | (10 | ) | 16 | 40 | (10 | ) | 42 | 5 | 41 | 32 | |||||||||
| | | | | | | | | | | | | | | | | | | | | | | |
Funds from (used in) operations |
1 405 | 607 | 555 | 331 | 793 | 873 | (200 | ) | 196 | 2 553 | 2 007 | |||||||||||
| | ||||||||||||||||||||||
(Increase) decrease in non-cash working capital |
(249 | ) | 1 033 | |||||||||||||||||||
| | | | | | | | | | | | | | | | | | | | | | | |
Cash flow provided by operating activities |
2 304 | 3 040 | ||||||||||||||||||||
| | | | | | | | | | | | | | | | | | | | | | | |
- (1)
- The three and twelve months ended December 31, 2018 have been restated to reflect the change to the company's segmented presentation of its Energy Trading business, with no impact to overall consolidated results. The Energy Trading business is now included within each of the respective operating business segments to which the respective trading activity relates. Suncor's Energy Trading business was previously reported within the Corporate, Energy Trading and Eliminations segment.
| 36 2019 FOURTH QUARTER Suncor Energy Inc. | | |
| Twelve months ended December 31 | Oil Sands |
Exploration and Production |
Refining and Marketing |
Corporate and Eliminations |
Total | |||||||||||||||||
| ($ millions) | 2019 | 2018 | 2019 | 2018 | 2019 | 2018 | 2019 | 2018 | 2019 | 2018 | ||||||||||||
| | | | | | | | | | | | | | | | | | | | | | | |
Net (loss) earnings |
(427 | ) | 945 | 1 005 | 807 | 3 000 | 3 154 | (679 | ) | (1 613 | ) | 2 899 | 3 293 | |||||||||
| | ||||||||||||||||||||||
Adjustments for: |
||||||||||||||||||||||
| | ||||||||||||||||||||||
Depreciation, depletion, amortization and impairment |
8 170 | 4 024 | 1 505 | 967 | 823 | 684 | 74 | 63 | 10 572 | 5 738 | ||||||||||||
| | ||||||||||||||||||||||
Deferred income taxes |
(1 565 | ) | 351 | (215 | ) | (112 | ) | (49 | ) | 72 | (89 | ) | 129 | (1 918 | ) | 440 | ||||||
| | ||||||||||||||||||||||
Accretion |
221 | 209 | 43 | 48 | 6 | 7 | — | 2 | 270 | 266 | ||||||||||||
| | ||||||||||||||||||||||
Unrealized foreign exchange (gain) loss on U.S. dollar denominated debt |
— | — | — | — | — | — | (624 | ) | 1 090 | (624 | ) | 1 090 | ||||||||||
| | ||||||||||||||||||||||
Change in fair value of financial instruments and trading inventory |
21 | (59 | ) | 16 | (89 | ) | 70 | (32 | ) | — | 1 | 107 | (179 | ) | ||||||||
| | ||||||||||||||||||||||
(Gain) loss on disposal of assets |
(14 | ) | (108 | ) | (228 | ) | 91 | (11 | ) | (7 | ) | — | — | (253 | ) | (24 | ) | |||||
| | ||||||||||||||||||||||
Share-based compensation |
16 | (28 | ) | — | (5 | ) | 3 | (21 | ) | 25 | (63 | ) | 44 | (117 | ) | |||||||
| | ||||||||||||||||||||||
Exploration |
— | — | 66 | 11 | — | — | — | — | 66 | 11 | ||||||||||||
| | ||||||||||||||||||||||
Settlement of decommissioning and restoration liabilities |
(413 | ) | (428 | ) | (32 | ) | (23 | ) | (19 | ) | (17 | ) | — | (1 | ) | (464 | ) | (469 | ) | |||
| | ||||||||||||||||||||||
Other |
52 | 58 | (17 | ) | 84 | 40 | (42 | ) | 44 | 23 | 119 | 123 | ||||||||||
| | | | | | | | | | | | | | | | | | | | | | | |
Funds from (used in) operations |
6 061 | 4 964 | 2 143 | 1 779 | 3 863 | 3 798 | (1 249 | ) | (369 | ) | 10 818 | 10 172 | ||||||||||
| | ||||||||||||||||||||||
(Increase) decrease in non-cash working capital |
(397 | ) | 408 | |||||||||||||||||||
| | | | | | | | | | | | | | | | | | | | | | | |
Cash flow provided by operating activities |
10 421 | 10 580 | ||||||||||||||||||||
| | | | | | | | | | | | | | | | | | | | | | | |
- (1)
- The three and twelve months ended December 31, 2018 have been restated to reflect the change to the company's segmented presentation of its Energy Trading business, with no impact to overall consolidated results. The Energy Trading business is now included within each of the respective operating business segments to which the respective trading activity relates. Suncor's Energy Trading business was previously reported within the Corporate, Energy Trading and Eliminations segment.
Free Funds Flow and Discretionary Free Funds Flow
Free funds flow is a non-GAAP financial measure that is calculated by taking funds from operations and subtracting capital expenditures, including capitalized interest. Discretionary free funds flow is a non-GAAP financial measure that is calculated by taking funds from operations and subtracting asset sustainment and maintenance capital, inclusive of associated capitalized interest, and dividends. Both free funds flow and discretionary free funds flow reflects cash available for increasing distributions to shareholders and to fund growth investments. Management uses free funds flow and discretionary free funds flow to measure the capacity of the company to increase returns to shareholders and to grow Suncor's business.
|
Three months ended Dec 31 |
Twelve months ended Dec 31 |
||||||||
($ millions) |
2019 | 2018 | 2019 | 2018 | ||||||
| | | | | | | | | | | |
Funds from operations |
2 553 | 2 007 | 10 818 | 10 172 | ||||||
| | ||||||||||
Asset sustaining and maintenance capital and dividends(1) |
(1 689 | ) | (1 243 | ) | (5 904 | ) | (5 740 | ) | ||
| | | | | | | | | | | |
Discretionary free funds flow |
864 | 764 | 4 914 | 4 432 | ||||||
| | | | | | | | | | | |
- (1)
- The classification of the company's capital expenditures has been updated to "asset sustainment and maintenance" to better reflect the types of capital investments being made by the company. Comparative periods have been updated to reflect this change.
| | | 2019 FOURTH QUARTER Suncor Energy Inc. 37 |
Oil Sands Operations, Fort Hills and Syncrude Cash Operating Costs
Oil Sands operations, Syncrude and Fort Hills cash operating costs are non-GAAP financial measures. Oil Sands operations cash operating costs are calculated by adjusting Oil Sands segment OS&G expense (a GAAP measure based on sales volumes) for i) costs pertaining to Fort Hills and Syncrude operations; ii) non-production costs that management believes do not relate to the production performance of Oil Sands operations, including, but not limited to, share-based compensation adjustments, research and the expense recorded as part of a non-monetary arrangement involving a third-party processor; iii) revenues associated with excess capacity, including excess power generated and sold that is recorded in operating revenue; iv) project startup costs; and v) the impacts of changes in inventory levels, such that the company is able to present cost information based on production volumes. Syncrude and Fort Hills cash operating costs are calculated by adjusting Syncrude OS&G expense and Fort Hills OS&G expense, respectively, for non-production costs that management believes do not relate to the production performance of Syncrude operations or Fort Hills operations, respectively, including, but not limited to, share-based compensation, research and project startup costs, if applicable. Oil Sands operations, Fort Hills and Syncrude cash operating costs are reconciled in the Segment Results and Analysis – Oil Sands section of this document. Management uses cash operating costs to measure operating performance.
Refining Margin and Refining Operating Expense
Refining margin and refining operating expense are non-GAAP financial measures. Refining margin is calculated by adjusting R&M segment operating revenue, other income and purchases of crude oil and products (all of which are GAAP measures) for non-refining margin pertaining to the company's supply, marketing and ethanol businesses, as well as removing the impact of risk management gains and losses. Refinery operating expense is calculated by adjusting R&M segment OS&G for i) non-refining costs pertaining to the company's supply, marketing and ethanol businesses; and ii) non-refining costs that management believes do not relate to the production of refined products, including, but not limited to, share-based compensation and enterprise shared service allocations. Management uses refining margin and refining operating expense to measure operating performance on a production barrel basis.
|
Three months ended December 31 |
Twelve months ended December 31 |
||||||||
($ millions, except as noted) |
2019 | 2018 | 2019 | 2018 | ||||||
| | | | | | | | | | | |
Refining margin reconciliation |
||||||||||
| | ||||||||||
Gross margin, operating revenue less purchases of crude oil and products |
1 568 | 1 711 | 7 008 | 7 122 | ||||||
| | ||||||||||
Other income |
33 | 90 | 75 | 68 | ||||||
| | ||||||||||
Non-refining margin |
(54 | ) | 115 | (1 320 | ) | (1 351 | ) | |||
| | | | | | | | | | | |
Refining margin |
1 547 | 1 916 | 5 763 | 5 839 | ||||||
| | ||||||||||
Refinery production(1) (mbbls) |
44 422 | 46 145 | 173 705 | 169 138 | ||||||
| | | | | | | | | | | |
Refining margin ($/bbl) |
34.80 | 41.50 | 33.15 | 34.50 | ||||||
| | | | | | | | | | | |
Refining operating expense reconciliation |
||||||||||
| | ||||||||||
Operating, selling and general expense |
576 | 538 | 2 173 | 2 043 | ||||||
| | ||||||||||
Non-refining costs |
(352 | ) | (288 | ) | (1 246 | ) | (1 142 | ) | ||
| | | | | | | | | | | |
Refining operating expense |
224 | 250 | 927 | 901 | ||||||
| | ||||||||||
Refinery production(1) (mbbls) |
44 422 | 46 145 | 173 705 | 169 138 | ||||||
| | | | | | | | | | | |
Refining operating expense ($/bbl) |
5.05 | 5.45 | 5.35 | 5.35 | ||||||
| | | | | | | | | | | |
- (1)
- Refinery production is the output of the refining process, and differs from crude oil processed as a result of volumetric adjustments for non-crude feedstock, volumetric gain associated with the refining process, and changes in unfinished product inventories.
Impact of First-in, First-out (FIFO) Inventory Valuation on Refining and Marketing Net Earnings
GAAP requires the use of a FIFO inventory valuation methodology. For Suncor, this results in a disconnect between the sales prices for refined products, which reflect current market conditions, and the amount recorded as the cost of sale for the related refinery feedstock, which reflects market conditions at the time the feedstock was purchased. This lag between purchase and sale can be anywhere from several weeks to several months, and is influenced by the time to receive crude after purchase (which can be several weeks for foreign offshore crude purchases), regional crude inventory levels, the completion of refining processes, transportation time to distribution channels, and regional refined product inventory levels.
| 38 2019 FOURTH QUARTER Suncor Energy Inc. | | |
Suncor prepares and presents an estimate of the impact of using a FIFO inventory valuation methodology compared to a LIFO methodology, because management uses the information to analyze operating performance and compare itself against refining peers that are permitted to use LIFO inventory valuation under United States GAAP (U.S. GAAP).
The company's estimate is not derived from a standardized calculation and, therefore, may not be directly comparable to similar measures presented by other companies, and should not be considered in isolation or as a substitute for measures of performance prepared in accordance with GAAP or U.S. GAAP.
The following is a list of abbreviations that may be used in this document:
| Measurement | Places and Currencies | |||||
| bbl | barrel | U.S. | United States | |||
| bbls/d | barrels per day | U.K. | United Kingdom | |||
| mbbls/d | thousands of barrels per day | |||||
| $ or Cdn$ | Canadian dollars | |||||
| boe | barrels of oil equivalent | US$ | United States dollars | |||
| boe/d | barrels of oil equivalent per day | |||||
| mboe | thousands of barrels of oil equivalent | |||||
| mboe/d | thousands of barrels of oil equivalent per day | Financial and Business Environment | ||||
| Q4 | Three months ended December 31 | |||||
| GJ | Gigajoule | DD&A | Depreciation, depletion and amortization | |||
| WTI | West Texas Intermediate | |||||
| mcf | thousands of cubic feet of natural gas | WCS | Western Canadian Select | |||
| mcfe | thousands of cubic feet of natural gas equivalent | SCO | Synthetic crude oil | |||
| mmcf | millions of cubic feet of natural gas | SYN | Synthetic crude oil benchmark | |||
| mmcf/d | millions of cubic feet of natural gas per day | MSW | Mixed Sweet Blend | |||
| mmcfe | millions of cubic feet of natural gas equivalent | NYMEX | New York Mercantile Exchange | |||
| mmcfe/d | millions of cubic feet of natural gas equivalent per day | YTD | Year to date | |||
| MW | megawatts | |||||
| MWh | megawatts per hour | |||||
| | | 2019 FOURTH QUARTER Suncor Energy Inc. 39 |
11. FORWARD-LOOKING INFORMATION
This document contains certain forward-looking information and forward-looking statements (collectively referred to herein as "forward-looking statements") within the meaning of applicable Canadian and U.S. securities laws. Forward-looking statements and other information are based on Suncor's current expectations, estimates, projections and assumptions that were made by the company in light of information available at the time the statement was made and consider Suncor's experience and its perception of historical trends, including expectations and assumptions concerning: the accuracy of reserves and resources estimates; commodity prices and interest and foreign exchange rates; the performance of assets and equipment; capital efficiencies and cost-savings; applicable laws and government policies; future production rates; the sufficiency of budgeted capital expenditures in carrying out planned activities; the availability and cost of labour, services and infrastructure; the satisfaction by third parties of their obligations to Suncor; the development and execution of projects; and the receipt, in a timely manner, of regulatory and third-party approvals. All statements and information that address expectations or projections about the future, and other statements and information about Suncor's strategy for growth, expected and future expenditures or investment decisions, commodity prices, costs, schedules, production volumes, operating and financial results, future financing and capital activities, and the expected impact of future commitments are forward-looking statements. Some of the forward-looking statements may be identified by words like "expects", "anticipates", "will", "estimates", "plans", "scheduled", "intends", "believes", "projects", "indicates", "could", "focus", "vision", "goal", "outlook", "proposed", "target", "objective", "continue", "should", "may", "future", "potential", "opportunity", "would", "priority", "strategy" and similar expressions. Forward-looking statements in this document include references to:
- •
- Statements about the Forty Mile Wind Power Project, including: the expectation that it will generate significant value through sustainable low-carbon
power generation and the retention of generated carbon credits for utilization in Suncor's upstream business, that it will provide reliable, low-carbon power to the Alberta power grid, the estimated
capital spend of the project and the timing thereof and that, together with the completion of fast-charging electric vehicle stations across Canada, it will generate value for Suncor shareholders and
contribute to the company's strategic sustainability goals;
- •
- Suncor's ongoing commitment to return cash to shareholders and focus on maximizing the return to its shareholders;
- •
- Suncor's expectations regarding the Government of Alberta's mandatory production curtailments, including that both the curtailments and the
Special
Production Allowances program will continue into 2020;
- •
- That Suncor will continue to advance projects and investments intended to incrementally and sustainably grow its annual free funds flow by
reducing
operating and sustainment costs, and investing in projects that enhance value within our integrated asset bases, while moving forward in the areas of safety, reliability and
sustainability;
- •
- The expectation that the company's continued focus on strategic production growth of existing assets will include developing step-out
opportunities
and asset extensions within its offshore business in the E&P segment;
- •
- Statements about Suncor's goal to reduce total GHG emissions intensity by 30% by 2030, including the belief that Suncor has sanctioned projects
in
2019 that are expected to achieve one-third of its GHG emissions intensity reduction goal and that Suncor will continue to invest in low-carbon innovation aimed at lowering the carbon footprint of its
operations and the products it sells;
- •
- The expectation that Suncor's focus on low capital intensity, value-creating projects underscores its commitment to deliver growth that is
economically robust, technologically progressive and delivers leading sustainable outcomes;
- •
- The expectation that MacKay River will return to operation early in the second quarter of 2020;
- •
- Statements with respect to planned maintenance events and the timing thereof, including at Commerce City and MacKay River and the planned
cogeneration maintenance;
- •
- Suncor's expectation that existing production levels at Firebag and MacKay River will be maintained due to well pad construction and drilling
activities;
- •
- Suncor's planned 2020 capital spending program of $5.4 to $6.0 billion and the belief that Suncor will have the capital resources to fund
the
capital spending program and to meet current and future working capital requirements through cash and cash equivalents balances, cash flow provided by operating activities, available committed credit
facilities, issuing commercial paper and, if needed, accessing capital markets;
- •
- The objectives of Suncor's short-term investment portfolio and Suncor's expectation that the maximum weighted average term to maturity of the
short-term investment portfolio will not exceed six months, and that all investments will be with counterparties with investment grade debt ratings;
- •
- The company's priority regarding the management of debt levels given the company's long-term growth plans and future expected volatility in the pricing environment and Suncor's belief that a phased and flexible approach to existing and future growth projects should assist Suncor in its ability to manage project costs and debt levels; and
| 40 2019 FOURTH QUARTER Suncor Energy Inc. | | |
- •
- The company's belief that it does not have any guarantees or off-balance sheet arrangements that have, or are reasonably likely to have, a current or future material effect on the company's financial performance or financial condition, results of operations, liquidity or capital expenditures.
Forward-looking statements are not guarantees of future performance and involve a number of risks and uncertainties, some that are similar to other oil and gas companies and some that are unique to Suncor. Suncor's actual results may differ materially from those expressed or implied by its forward-looking statements, so readers are cautioned not to place undue reliance on them. The financial and operating performance of the company's reportable operating segments, specifically Oil Sands, E&P, and R&M, may be affected by a number of factors.
Factors that affect Suncor's Oil Sands segment include, but are not limited to, volatility in the prices for crude oil and other production, and the related impacts of fluctuating light/heavy and sweet/sour crude oil differentials; changes in the demand for refinery feedstock and diesel fuel, including the possibility that refiners that process the company's proprietary production will be closed, experience equipment failure or other accidents; Suncor's ability to operate its Oil Sands facilities reliably in order to meet production targets; the output of newly commissioned facilities, the performance of which may be difficult to predict during initial operations; Suncor's dependence on pipeline capacity and other logistical constraints, which may affect the company's ability to distribute products to market and which may cause the company to delay or cancel planned growth projects in the event of insufficient takeaway capacity; Suncor's ability to finance Oil Sands economic investment and asset sustainment and maintenance capital expenditures; the availability of bitumen feedstock for upgrading operations, which can be negatively affected by poor ore grade quality, unplanned mine equipment and extraction plant maintenance, tailings storage, and in situ reservoir and equipment performance, or the unavailability of third-party bitumen; changes in operating costs, including the cost of labour, natural gas and other energy sources used in oil sands processes; and the company's ability to complete projects, including planned maintenance events, both on time and on budget, which could be impacted by competition from other projects (including other oil sands projects) for goods and services and demands on infrastructure in Alberta's Wood Buffalo region and the surrounding area (including housing, roads and schools).
Factors that affect Suncor's E&P segment include, but are not limited to, volatility in crude oil and natural gas prices; operational risks and uncertainties associated with oil and gas activities, including unexpected formations or pressures, premature declines of reservoirs, fires, blow-outs, equipment failures and other accidents, uncontrollable flows of crude oil, natural gas or well fluids, and pollution and other environmental risks; adverse weather conditions, which could disrupt output from producing assets or impact drilling programs, resulting in increased costs and/or delays in bringing on new production; political, economic and socio-economic risks associated with Suncor's foreign operations, including the unpredictability of operating in Libya due to ongoing political unrest; and market demand for mineral rights and producing properties, potentially leading to losses on disposition or increased property acquisition costs.
Factors that affect our R&M segment include, but are not limited to, fluctuations in demand and supply for refined products that impact the company's margins; market competition, including potential new market entrants; the company's ability to reliably operate refining and marketing facilities in order to meet production or sales targets; and risks and uncertainties affecting construction or planned maintenance schedules, including the availability of labour and other impacts of competing projects drawing on the same resources during the same time period.
Additional risks, uncertainties and other factors that could influence the financial and operating performance of all of Suncor's operating segments and activities include, but are not limited to, changes in general economic, market and business conditions, such as commodity prices, interest rates and currency exchange rates; fluctuations in supply and demand for Suncor's products; the successful and timely implementation of capital projects, including growth projects and regulatory projects; risks associated with the development and execution of Suncor's major projects and the commissioning and integration of new facilities; the possibility that completed maintenance activities may not improve operational performance or the output of related facilities; the risk that projects and initiatives intended to achieve cash flow growth and/or reductions in operating costs may not achieve the expected results in the time anticipated or at all; competitive actions of other companies, including increased competition from other oil and gas companies or from companies that provide alternative sources of energy; labour and material shortages; actions by government authorities, including the imposition or reassessment of, or changes to, taxes, fees, royalties, duties and other government-imposed compliance costs; changes to laws and government policies that could impact the company's business, including environmental (including climate change), royalty and tax laws and policies; the ability and willingness of parties with whom Suncor has material relationships to perform their obligations to the company; the unavailability of, or outages to, third-party infrastructure that could cause disruptions to production or prevent the company from being able to transport its products; the occurrence of a protracted operational outage, a major safety or environmental incident, or unexpected events such as fires (including forest fires), equipment failures and other similar events affecting Suncor or other parties whose operations or assets directly or indirectly affect Suncor; the potential for security breaches of Suncor's information technology and infrastructure by malicious persons or entities, and the unavailability or failure of such systems to perform as anticipated as a result of such breaches; security threats and terrorist or activist activities; the risk that competing business objectives may exceed Suncor's capacity to adopt and implement change; risks and uncertainties associated with obtaining regulatory, third-party and
| | | 2019 FOURTH QUARTER Suncor Energy Inc. 41 |
stakeholder approvals outside of Suncor's control for the company's operations, projects, initiatives and exploration and development activities and the satisfaction of any conditions to approvals; the potential for disruptions to operations and construction projects as a result of Suncor's relationships with labour unions that represent employees at the company's facilities; the company's ability to find new oil and gas reserves that can be developed economically; the accuracy of Suncor's reserves, resources and future production estimates; market instability affecting Suncor's ability to borrow in the capital debt markets at acceptable rates or to issue other securities at acceptable prices; maintaining an optimal debt to cash flow ratio; the success of the company's risk management activities using derivatives and other financial instruments; the cost of compliance with current and future environmental laws, including climate change laws; risks relating to increased activism and public opposition to fossil fuels and oil sands; risks and uncertainties associated with closing a transaction for the purchase or sale of a business, asset or oil and gas property, including estimates of the final consideration to be paid or received; the ability of counterparties to comply with their obligations in a timely manner; risks associated with joint arrangements in which the company has an interest; risks associated with land claims and Aboriginal consultation requirements; the risk that the company may be subject to litigation; the impact of technology and risks associated with developing and implementing new technologies; and the accuracy of cost estimates, some of which are provided at the conceptual or other preliminary stage of projects and prior to commencement or conception of the detailed engineering that is needed to reduce the margin of error and increase the level of accuracy. The foregoing important factors are not exhaustive.
Many of these risk factors and other assumptions related to Suncor's forward-looking statements are discussed in further detail throughout this document, and in the company's 2018 annual MD&A, the 2018 AIF and Form 40-F on file with Canadian securities commissions at www.sedar.com and the United States Securities and Exchange Commission at www.sec.gov. Readers are also referred to the risk factors and assumptions described in other MD&As that Suncor files from time to time with securities regulatory authorities. Copies of these MD&As are available without charge from the company.
The forward-looking statements contained in this document are made as of the date of this document. Except as required by applicable securities laws, we assume no obligation to update publicly or otherwise revise any forward-looking statements or the foregoing risks and assumptions affecting such forward-looking statements, whether as a result of new information, future events or otherwise.
| 42 2019 FOURTH QUARTER Suncor Energy Inc. | | |
CONSOLIDATED STATEMENTS OF COMPREHENSIVE (LOSS) INCOME
(unaudited)
|
Three months ended December 31 |
Twelve months ended December 31 |
||||||||
($ millions) |
2019 | 2018 | 2019 | 2018 | ||||||
|
| | | | | | | | | |
Revenues and Other Income |
||||||||||
| | ||||||||||
Operating revenues, net of royalties (note 4) |
9 487 | 8 561 | 38 344 | 38 542 | ||||||
| | ||||||||||
Other income (note 5) |
111 | 384 | 645 | 444 | ||||||
| | | | | | | | | | | |
|
9 598 | 8 945 | 38 989 | 38 986 | ||||||
| | | | | | | | | | | |
Expenses |
||||||||||
| | ||||||||||
Purchases of crude oil and products |
3 253 | 3 329 | 12 562 | 14 133 | ||||||
| | ||||||||||
Operating, selling and general |
2 820 | 2 696 | 11 244 | 10 573 | ||||||
| | ||||||||||
Transportation |
367 | 362 | 1 442 | 1 319 | ||||||
| | ||||||||||
Depreciation, depletion, amortization and impairment (note 13) |
6 113 | 1 419 | 10 572 | 5 738 | ||||||
| | ||||||||||
Exploration |
52 | 49 | 256 | 122 | ||||||
| | ||||||||||
(Gain) loss on asset exchange and disposals (note 17) |
(9 | ) | 250 | (253 | ) | (24 | ) | |||
| | ||||||||||
Financing expenses (note 7) |
71 | 952 | 633 | 2 142 | ||||||
| | | | | | | | | | | |
|
12 667 | 9 057 | 36 456 | 34 003 | ||||||
| | | | | | | | | | | |
(Loss) Earnings before Income Taxes |
(3 069 | ) | (112 | ) | 2 533 | 4 983 | ||||
| | | | | | | | | | | |
Income Tax (Recovery) Expense |
||||||||||
| | ||||||||||
Current |
268 | 8 | 1 552 | 1 250 | ||||||
| | ||||||||||
Deferred (notes 13 and 16) |
(1 002 | ) | 160 | (1 918 | ) | 440 | ||||
| | | | | | | | | | | |
|
(734 | ) | 168 | (366 | ) | 1 690 | ||||
| | | | | | | | | | | |
Net (Loss) Earnings |
(2 335 | ) | (280 | ) | 2 899 | 3 293 | ||||
| | | | | | | | | | | |
Other Comprehensive Income (Loss) |
||||||||||
| | ||||||||||
Items That May be Subsequently Reclassified to Earnings: |
||||||||||
| | ||||||||||
Foreign currency translation adjustment |
(33 | ) | 168 | (177 | ) | 267 | ||||
| | ||||||||||
Items That Will Not be Reclassified to Earnings: |
||||||||||
| | ||||||||||
Actuarial gain (loss) on employee retirement benefit plans, net of income taxes |
210 | (109 | ) | (48 | ) | 103 | ||||
| | | | | | | | | | | |
Other Comprehensive Income (Loss) |
177 | 59 | (225 | ) | 370 | |||||
| | | | | | | | | | | |
Total Comprehensive (Loss) Income |
(2 158 |
) |
(221 |
) |
2 674 |
3 663 |
||||
| | | | | | | | | | | |
Per Common Share (dollars) (note 8) |
||||||||||
| | ||||||||||
Net (loss) earnings – basic |
(1.52 | ) | (0.18 | ) | 1.86 | 2.03 | ||||
| | ||||||||||
Net (loss) earnings – diluted |
(1.52 | ) | (0.18 | ) | 1.86 | 2.02 | ||||
| | ||||||||||
Cash dividends |
0.42 | 0.36 | 1.68 | 1.44 | ||||||
|
| | | | | | | | | |
See accompanying notes to the condensed interim consolidated financial statements. |
||||||||||
| | | 2019 FOURTH QUARTER Suncor Energy Inc. 43 |
CONSOLIDATED BALANCE SHEETS
(unaudited)
($ millions) |
December 31 2019 |
December 31 2018 |
||||
|
| | | | | |
Assets |
||||||
| | ||||||
Current assets |
||||||
| | ||||||
Cash and cash equivalents |
1 960 | 2 221 | ||||
| | ||||||
Accounts receivable |
4 052 | 3 206 | ||||
| | ||||||
Inventories |
3 761 | 3 159 | ||||
| | ||||||
Income taxes receivable |
133 | 114 | ||||
| | | | | | | |
Total current assets |
9 906 | 8 700 | ||||
| | ||||||
Property, plant and equipment, net (notes 3, 12 and 13) |
72 640 | 74 245 | ||||
| | ||||||
Exploration and evaluation |
2 428 | 2 319 | ||||
| | ||||||
Other assets |
1 194 | 1 126 | ||||
| | ||||||
Goodwill and other intangible assets |
3 058 | 3 061 | ||||
| | ||||||
Deferred income taxes |
209 | 128 | ||||
| | | | | | | |
Total assets |
89 435 | 89 579 | ||||
| | | | | | | |
Liabilities and Shareholders' Equity |
||||||
| | ||||||
Current liabilities |
||||||
| | ||||||
Short-term debt |
2 155 | 3 231 | ||||
| | ||||||
Current portion of long-term debt |
— | 229 | ||||
| | ||||||
Current portion of long-term lease liabilities (note 3) |
310 | — | ||||
| | ||||||
Accounts payable and accrued liabilities |
6 555 | 5 647 | ||||
| | ||||||
Current portion of provisions |
631 | 667 | ||||
| | ||||||
Income taxes payable |
886 | 535 | ||||
| | | | | | | |
Total current liabilities |
10 537 | 10 309 | ||||
| | ||||||
Long-term debt |
12 884 | 13 890 | ||||
| | ||||||
Long-term lease liabilities (note 3) |
2 621 | — | ||||
| | ||||||
Other long-term liabilities |
2 499 | 2 346 | ||||
| | ||||||
Provisions (note 11) |
8 676 | 6 984 | ||||
| | ||||||
Deferred income taxes (notes 13 and 16) |
10 176 | 12 045 | ||||
| | ||||||
Equity |
42 042 | 44 005 | ||||
| | | | | | | |
Total liabilities and shareholders' equity |
89 435 | 89 579 | ||||
|
| | | | | |
See accompanying notes to the condensed interim consolidated financial statements. |
||||||
| 44 2019 FOURTH QUARTER Suncor Energy Inc. | | |
CONSOLIDATED STATEMENTS OF CASH FLOWS
(unaudited)
|
Three months ended December 31 |
Twelve months ended December 31 |
||||||||
($ millions) |
2019 | 2018 | 2019 | 2018 | ||||||
|
| | | | | | | | | |
Operating Activities |
||||||||||
| | ||||||||||
Net (Loss) Earnings |
(2 335 | ) | (280 | ) | 2 899 | 3 293 | ||||
| | ||||||||||
Adjustments for: |
||||||||||
Depreciation, depletion, amortization and impairment (note 13) |
6 113 | 1 419 | 10 572 | 5 738 | ||||||
| | ||||||||||
Deferred income tax (recovery) expense (notes 13 and 16) |
(1 002 | ) | 160 | (1 918 | ) | 440 | ||||
| | ||||||||||
Accretion |
65 | 67 | 270 | 266 | ||||||
| | ||||||||||
Unrealized foreign exchange (gain) loss on U.S. dollar denominated debt |
(246 | ) | 688 | (624 | ) | 1 090 | ||||
| | ||||||||||
Change in fair value of financial instruments and trading inventory |
(13 | ) | (148 | ) | 107 | (179 | ) | |||
| | ||||||||||
(Gain) loss on asset exchange and disposals (note 17) |
(9 | ) | 250 | (253 | ) | (24 | ) | |||
| | ||||||||||
Share-based compensation |
63 | (88 | ) | 44 | (117 | ) | ||||
| | ||||||||||
Exploration |
27 | 11 | 66 | 11 | ||||||
| | ||||||||||
Settlement of decommissioning and restoration liabilities |
(151 | ) | (104 | ) | (464 | ) | (469 | ) | ||
| | ||||||||||
Other |
41 | 32 | 119 | 123 | ||||||
| | ||||||||||
(Increase) decrease in non-cash working capital |
(249 | ) | 1 033 | (397 | ) | 408 | ||||
| | | | | | | | | | | |
Cash flow provided by operating activities |
2 304 | 3 040 | 10 421 | 10 580 | ||||||
| | | | | | | | | | | |
Investing Activities |
||||||||||
| | ||||||||||
Capital and exploration expenditures |
(1 775 | ) | (1 147 | ) | (5 558 | ) | (5 406 | ) | ||
| | ||||||||||
Acquisitions (notes 14 and 15) |
— | (25 | ) | — | (1 230 | ) | ||||
| | ||||||||||
Proceeds from disposal of assets (note 17) |
12 | 32 | 274 | 84 | ||||||
| | ||||||||||
Other investments (note 17) |
(79 | ) | (54 | ) | (213 | ) | (170 | ) | ||
| | ||||||||||
Decrease (increase) in non-cash working capital |
26 | (265 | ) | 409 | 25 | |||||
| | | | | | | | | | | |
Cash flow used in investing activities |
(1 816 | ) | (1 459 | ) | (5 088 | ) | (6 697 | ) | ||
| | | | | | | | | | | |
Financing Activities |
||||||||||
| | ||||||||||
Net increase (decrease) in short-term debt |
545 | 117 | (982 | ) | 866 | |||||
| | ||||||||||
Net (decrease) increase in long-term debt |
— | (132 | ) | 557 | (186 | ) | ||||
| | ||||||||||
Lease liability payments |
(77 | ) | — | (307 | ) | — | ||||
| | ||||||||||
Issuance of common shares under share option plans |
31 | 4 | 90 | 286 | ||||||
| | ||||||||||
Purchase of common shares (note 9) |
(452 | ) | (1 166 | ) | (2 274 | ) | (3 053 | ) | ||
| | ||||||||||
Distributions relating to non-controlling interest |
(1 | ) | (2 | ) | (7 | ) | (6 | ) | ||
| | ||||||||||
Dividends paid on common shares |
(644 | ) | (574 | ) | (2 614 | ) | (2 333 | ) | ||
| | | | | | | | | | | |
Cash flow used in financing activities |
(598 | ) | (1 753 | ) | (5 537 | ) | (4 426 | ) | ||
| | | | | | | | | | | |
Decrease in Cash and Cash Equivalents |
(110 | ) | (172 | ) | (204 | ) | (543 | ) | ||
| | ||||||||||
Effect of foreign exchange on cash and cash equivalents |
(19 | ) | 61 | (57 | ) | 92 | ||||
| | ||||||||||
Cash and cash equivalents at beginning of period |
2 089 | 2 332 | 2 221 | 2 672 | ||||||
| | | | | | | | | | | |
Cash and Cash Equivalents at End of Period |
1 960 | 2 221 | 1 960 | 2 221 | ||||||
| | | | | | | | | | | |
Supplementary Cash Flow Information |
||||||||||
| | ||||||||||
Interest paid |
357 | 299 | 996 | 800 | ||||||
| | ||||||||||
Income taxes paid (received) |
153 | (17 | ) | 1 033 | 645 | |||||
|
| | | | | | | | | |
See accompanying notes to the condensed interim consolidated financial statements. |
||||||||||
| | | 2019 FOURTH QUARTER Suncor Energy Inc. 45 |
CONSOLIDATED STATEMENTS OF CHANGES IN EQUITY
(unaudited)
($ millions) |
Share Capital |
Contributed Surplus |
Accumulated Other Comprehensive Income |
Retained Earnings |
Total |
Number of Common Shares (thousands) |
||||||||
| | | | | | | | | | | | | | | |
At December 31, 2017 |
26 606 | 567 | 809 | 17 401 | 45 383 | 1 640 983 | ||||||||
| | | | | | | | | | | | | | | |
Net earnings |
— | — | — | 3 293 | 3 293 | — | ||||||||
| | | | ||||||||||||
Foreign currency translation adjustment |
— | — | 267 | — | 267 | — | ||||||||
| | | | ||||||||||||
Actuarial gain on employee retirement benefit plans, net of income taxes of $39 |
— | — | — | 103 | 103 | — | ||||||||
| | | | | | | | | | | | | | | |
Total comprehensive income |
— | — | 267 | 3 396 | 3 663 | — | ||||||||
| | | | ||||||||||||
Issued under share option plans |
358 | (73 | ) | — | — | 285 | 7 927 | |||||||
| | | | ||||||||||||
Purchase of common shares for cancellation (note 9) |
(1 040 | ) | — | — | (2 013 | ) | (3 053 | ) | (64 426 | ) | ||||
| | | | ||||||||||||
Change in liability for share purchase commitment (note 9) |
(14 | ) | — | — | 28 | 14 | — | |||||||
| | | | ||||||||||||
Share-based compensation |
— | 46 | — | — | 46 | — | ||||||||
| | | | ||||||||||||
Dividends paid on common shares |
— | — | — | (2 333 | ) | (2 333 | ) | — | ||||||
| | | | | | | | | | | | | | | |
At December 31, 2018 |
25 910 | 540 | 1 076 | 16 479 | 44 005 | 1 584 484 | ||||||||
| | | | | | | | | | | | | | | |
At January 1, 2019 |
25 910 | 540 | 1 076 | 16 479 | 44 005 | 1 584 484 | ||||||||
| | | | ||||||||||||
Adoption of IFRS 16 impact (note 3) |
— | — | — | 14 | 14 | — | ||||||||
| | | | | | | | | | | | | | | |
At January 1, 2019, adjusted |
25 910 | 540 | 1 076 | 16 493 | 44 019 | 1 584 484 | ||||||||
| | | | | | | | | | | | | | | |
Net earnings |
— | — | — | 2 899 | 2 899 | — | ||||||||
| | | | ||||||||||||
Foreign currency translation adjustment |
— | — | (177 | ) | — | (177 | ) | — | ||||||
| | | | ||||||||||||
Actuarial loss on employee retirement benefit plans, net of income taxes of $23 |
— | — | — | (48 | ) | (48 | ) | — | ||||||
| | | | | | | | | | | | | | | |
Total comprehensive (loss) income |
— | — | (177 | ) | 2 851 | 2 674 | — | |||||||
| | | | ||||||||||||
Issued under share option plans |
116 | (24 | ) | — | — | 92 | 2 688 | |||||||
| | | | ||||||||||||
Purchase of common shares for cancellation (note 9) |
(905 | ) | — | — | (1 369 | ) | (2 274 | ) | (55 298 | ) | ||||
| | | | ||||||||||||
Change in liability for share purchase commitment (note 9) |
46 | — | — | 49 | 95 | — | ||||||||
| | | | ||||||||||||
Share-based compensation |
— | 50 | — | — | 50 | — | ||||||||
| | | | ||||||||||||
Dividends paid on common shares |
— | — | — | (2 614 | ) | (2 614 | ) | — | ||||||
| | | | | | | | | | | | | | | |
At December 31, 2019 |
25 167 | 566 | 899 | 15 410 | 42 042 | 1 531 874 | ||||||||
| | | | | | | | | | | | | | | |
See accompanying notes to the condensed interim consolidated financial statements. |
||||||||||||||
| 46 2019 FOURTH QUARTER Suncor Energy Inc. | | |
NOTES TO THE CONSOLIDATED FINANCIAL STATEMENTS
(unaudited)
1. REPORTING ENTITY AND DESCRIPTION OF THE BUSINESS
Suncor Energy Inc. (Suncor or the company) is an integrated energy company headquartered in Calgary, Alberta. The company is focused on developing one of the world's largest petroleum resource basins – Canada's Athabasca oil sands. In addition, the company explores for, acquires, develops, produces and markets crude oil in Canada and internationally, transports and refines crude oil, and markets petroleum and petrochemical products primarily in Canada. The company also operates a renewable energy business and conducts energy trading activities focused principally on the marketing and trading of crude oil, natural gas, byproducts, refined products, and power.
The address of the company's registered office is 150 – 6th Avenue S.W., Calgary, Alberta, Canada, T2P 3E3.
2. BASIS OF PREPARATION
(a) Statement of Compliance
These condensed interim consolidated financial statements have been prepared in accordance with International Financial Reporting Standards (IFRS), specifically International Accounting Standard (IAS) 34 Interim Financial Reporting as issued by the International Accounting Standards Board (IASB). They are condensed as they do not include all of the information required for full annual financial statements, and they should be read in conjunction with the consolidated financial statements of the company for the year ended December 31, 2018.
(b) Basis of Measurement
The consolidated financial statements are prepared on a historical cost basis except as detailed in the accounting policies disclosed in the company's consolidated financial statements for the year ended December 31, 2018. Adoption of the new accounting pronouncements are described in note 3.
(c) Functional Currency and Presentation Currency
These consolidated financial statements are presented in Canadian dollars, which is the company's functional currency.
(d) Use of Estimates, Assumptions and Judgments
The timely preparation of financial statements requires that management make estimates and assumptions and use judgment. Accordingly, actual results may differ from estimated amounts as future confirming events occur. Significant estimates and judgment used in the preparation of the financial statements are described in the company's consolidated financial statements for the year ended December 31, 2018.
(e) Income taxes
The company recognizes the impacts of income tax rate changes in earnings in the period that the applicable rate change is enacted or substantively enacted.
3. NEW IFRS STANDARDS
(a) Adoption of New IFRS Standards
IFRS 16 Leases
Effective January 1, 2019, the company adopted IFRS 16 Leases (IFRS 16) which replaces IAS 17 Leases (IAS 17) and requires the recognition of most leases on the balance sheet. IFRS 16 effectively removes the classification of leases as either finance or operating leases and treats all leases as finance leases for lessees with optional exemptions for short-term leases where the term is twelve months or less. The accounting treatment for lessors remains essentially unchanged, with the requirement to classify leases as either finance or operating.
The company has selected the modified retrospective transition approach, electing to adjust opening retained earnings with no restatement of comparative figures. As such, comparative information continues to be reported under IAS 17 and International Financial Reporting Interpretations Committee (IFRIC) 4. The details of accounting policies under IAS 17 and IFRIC 4 are disclosed separately if they are different from those under IFRS 16 and the impact of the change is disclosed below.
| | | 2019 FOURTH QUARTER Suncor Energy Inc. 47 |
The company's accounting policy under IFRS 16 is as follows:
At inception of a contract, the company assesses whether a contract is, or contains, a lease based on whether the contract conveys the right to control the use of an identified asset for a period of time in exchange for consideration.
The company recognizes a right-of-use asset and a lease liability at the lease commencement date. The right-of-use asset is initially measured based on the initial amount of the lease liability adjusted for any lease payments made at or before the commencement date, plus any initial direct costs incurred and an estimate of costs to dismantle and remove the underlying asset or to restore the underlying asset on the site on which it is located, less any lease incentives received. The assets are depreciated to the earlier of the end of the useful life of the right-of-use asset or the lease term, using the straight-line method as this most closely reflects the expected pattern of consumption of the future economic benefits. Judgment is applied to determine the lease term of lease contracts in which the company has a renewal option. In addition, the right-of-use assets may be periodically reduced by impairment losses, if any, and adjusted for certain re-measurements of the lease liability.
The lease liability is initially measured at the present value of the lease payments that are not paid at the commencement date, discounted using the interest rate implicit in the lease or, if that rate cannot be readily determined, the company's incremental borrowing rate. Lease payments include fixed payments, and variable payments that are based on an index or a rate.
Cash payments for the principal portion of the lease liability are presented within the financing activities and the interest portion of the lease liability is presented within the operating activities of the statement of cash flows. Short-term lease payments and variable lease payments not included in the measurement of the lease liability are presented within the operating activities of the statement of cash flows.
The lease liability is measured at amortized cost using the effective interest method. It is re-measured when there is a change in future lease payments arising from a change in an index or rate, if there is a change in the company's estimate of the amount expected to be payable under a residual value guarantee, or if the company changes its assessment of whether it will exercise a purchase, extension or termination option.
When the lease liability is re-measured in this way, a corresponding adjustment is made to the carrying amount of the right-of-use asset, or is recorded in profit or loss if the carrying amount of the right-of-use asset has been reduced to zero.
Under IAS 17
In the comparative period, the company classified leases that transfer substantially all of the risks and rewards of ownership as finance leases. When this was the case, the leased assets were measured initially at an amount equal to the lower of their fair value and the present value of minimum lease payments. Minimum lease payments were the payments over the lease term that the lessee was required to make, excluding any contingent rent.
Subsequently, the assets were accounted for in accordance with the accounting policy applicable to that asset.
Assets held under other leases were classified as operating leases and were not recognized in the company's statement of financial position. Payments made under operating leases were recognized in profit or loss on a straight-line basis over the term of the lease. Lease incentives received were recognized as an integral part of the total lease expense over the term of the lease.
As part of the initial application of IFRS 16, the company also chose to apply the following transitional provisions:
Right-of-use assets are measured at:
- •
- An amount equal to the lease liability on January 1, 2019, adjusted by the amount of any prepaid or accrued lease payments relating to that lease recognized in the statement of financial position immediately before the date of transition.
The company applied the following practical expedients when applying IFRS 16 to leases previously classified as operating leases under IAS 17:
- •
- Adjusted
the right-of-use assets by the amount of any provision for onerous leases recognized in the balance sheet immediately before the date of initial application, as an
alternative to performing an impairment review.
- •
- Elected
not to recognize right-of-use assets and lease liabilities for short-term leases that have a lease term of twelve months or less and leases with a short-term
remaining life upon adoption. The lease payments associated with these leases are recognized as an expense on a straight-line basis over the lease term.
- •
- Accounted
for each lease component and any non-lease components as a single lease component for storage tanks.
- •
- Used hindsight to determine the lease term if the contract contained options to extend or terminate the lease.
| 48 2019 FOURTH QUARTER Suncor Energy Inc. | | |
The following table reconciles the company's operating lease obligations at December 31, 2018, as previously disclosed in the company's consolidated financial statements, to the lease obligations recognized on initial application of IFRS 16 at January 1, 2019.
Reconciliation
($ millions) |
January 1 2019 |
|||
|
| | | |
Operating leases as at December 31, 2018(1) |
2 457 | |||
| | ||||
Exemption for short-term leases |
(42 | ) | ||
| | ||||
Discounting |
(623 | ) | ||
| | | | | |
Additional lease liabilities recognized due to adoption of IFRS 16 as at January 1, 2019 |
1 792 | |||
|
| | | |
- (1)
- Represents undiscounted lease commitments.
The following table summarizes the impact of adopting IFRS 16 on the company's consolidated balance sheets at January 1, 2019. Prior period amounts have not been restated. The effects of the transition have been recognized through retained earnings in equity.
| ($ millions) increase (decrease) | |
December 31 2018 |
|
Adjustments due to IFRS 16 |
|
January 1 2019 |
| |
| | | | | | | | | |
Assets |
| | | | ||||
| | ||||||||
Current assets |
| | | | ||||
| | ||||||||
Accounts receivable |
| 3 206 | | (2) | | 3 204 | | |
| | ||||||||
Property, plant and equipment, net |
| 74 245 | | (1 267) | | 72 978 | | |
| | ||||||||
Right-of-use assets, net |
| — | | 3 059 | | 3 059 | | |
| | ||||||||
Liabilities and Shareholders' Equity |
| | | | ||||
| | ||||||||
Current liabilities |
| | | | ||||
| | ||||||||
Current portion of long-term debt |
| 229 | | (38) | | 191 | | |
| | ||||||||
Current portion of lease liabilities |
| — | | 276 | | 276 | | |
| | ||||||||
Current portion of provisions |
| 667 | | (1) | | 666 | | |
| | ||||||||
Long-term debt |
| 13 890 | | (1 222) | | 12 668 | | |
| | ||||||||
Long-term lease liabilities |
| — | | 2 777 | | 2 777 | | |
| | ||||||||
Other long-term liabilities |
| 2 346 | | (1) | | 2 345 | | |
| | ||||||||
Provisions |
| 6 984 | | (20) | | 6 964 | | |
| | ||||||||
Deferred income taxes |
| 12 045 | | 5 | | 12 050 | | |
| | ||||||||
Equity |
| 44 005 | | 14 | | 44 019 | | |
| | | | | | | | | |
For leases that were classified as finance leases under IAS 17, the carrying amount of the right-of-use asset and the lease liability at January 1, 2019 were determined as the carrying amount of the lease asset and lease liability under IAS 17 immediately before that date.
The lease liabilities recognized in accordance with IFRS 16 were discounted using the company's incremental borrowing rate upon adoption. The weighted average rate of additional leases recognized in accordance with IFRS 16 was 3.85% as at January 1, 2019.
| | | 2019 FOURTH QUARTER Suncor Energy Inc. 49 |
4. SEGMENTED INFORMATION (1)(2)
The company's operating segments are reported based on the nature of their products and services and management responsibility.
Intersegment sales of crude oil and natural gas are accounted for at market values and are included, for segmented reporting, in revenues of the segment making the transfer and expenses of the segment receiving the transfer. Intersegment amounts are eliminated on consolidation.
|
Three months ended December 31 |
Oil Sands |
Exploration and Production |
Refining and Marketing |
Corporate and Eliminations |
Total |
|||||||||||||||||||||||||||
| ($ millions) | 2019 | 2018 | 2019 | 2018 | 2019 | 2018 | 2019 | 2018 | 2019 | 2018 | ||||||||||||||||||||||
| | | | | | | | | | | | | | | | | | | | | | | | | | | | | | | | | |
Revenues and Other Income |
||||||||||||||||||||||||||||||||
| | ||||||||||||||||||||||||||||||||
Gross revenues |
3 272 | 2 368 | 998 | 771 | 5 522 | 5 618 | 8 | 10 | 9 800 | 8 767 | ||||||||||||||||||||||
| | ||||||||||||||||||||||||||||||||
Intersegment revenues |
1 153 | 781 | — | — | 23 | 49 | (1 176 | ) | (830 | ) | — | — | ||||||||||||||||||||
| | ||||||||||||||||||||||||||||||||
Less: Royalties |
(143 | ) | (67 | ) | (170 | ) | (139 | ) | — | — | — | — | (313 | ) | (206 | ) | ||||||||||||||||
| | | | | | | | | | | | | | | | | | | | | | | | | | | | | | | | | |
Operating revenues, net of royalties |
4 282 | 3 082 | 828 | 632 | 5 545 | 5 667 | (1 168 | ) | (820 | ) | 9 487 | 8 561 | ||||||||||||||||||||
| | ||||||||||||||||||||||||||||||||
Other income (loss) |
98 | 298 | 20 | (2 | ) | 33 | 90 | (40 | ) | (2 | ) | 111 | 384 | |||||||||||||||||||
| | | | | | | | | | | | | | | | | | | | | | | | | | | | | | | | | |
|
4 380 | 3 380 | 848 | 630 | 5 578 | 5 757 | (1 208 | ) | (822 | ) | 9 598 | 8 945 | ||||||||||||||||||||
| | | | | | | | | | | | | | | | | | | | | | | | | | | | | | | | | |
Expenses |
||||||||||||||||||||||||||||||||
| | ||||||||||||||||||||||||||||||||
Purchases of crude oil and products |
446 | 515 | — | — | 3 977 | 3 956 | (1 170 | ) | (1 142 | ) | 3 253 | 3 329 | ||||||||||||||||||||
| | ||||||||||||||||||||||||||||||||
Operating, selling and general |
1 985 | 1 998 | 134 | 155 | 576 | 538 | 125 | 5 | 2 820 | 2 696 | ||||||||||||||||||||||
| | ||||||||||||||||||||||||||||||||
Transportation |
325 | 319 | 21 | 19 | 34 | 41 | (13 | ) | (17 | ) | 367 | 362 | ||||||||||||||||||||
| | ||||||||||||||||||||||||||||||||
Depreciation, depletion, amortization and impairment |
5 081 | 1 019 | 803 | 199 | 211 | 184 | 18 | 17 | 6 113 | 1 419 | ||||||||||||||||||||||
| | ||||||||||||||||||||||||||||||||
Exploration |
13 | 14 | 39 | 35 | — | — | — | — | 52 | 49 | ||||||||||||||||||||||
| | ||||||||||||||||||||||||||||||||
(Gain) loss on asset exchange and disposals |
(1 | ) | (1 | ) | — | 253 | (8 | ) | (2 | ) | — | — | (9 | ) | 250 | |||||||||||||||||
| | ||||||||||||||||||||||||||||||||
Financing expenses (income) |
81 | 102 | 25 | 17 | 22 | (2 | ) | (57 | ) | 835 | 71 | 952 | ||||||||||||||||||||
| | | | | | | | | | | | | | | | | | | | | | | | | | | | | | | | | |
|
7 930 | 3 966 | 1 022 | 678 | 4 812 | 4 715 | (1 097 | ) | (302 | ) | 12 667 | 9 057 | ||||||||||||||||||||
| | | | | | | | | | | | | | | | | | | | | | | | | | | | | | | | | |
(Loss) Earnings before Income Taxes |
(3 550 | ) | (586 | ) | (174 | ) | (48 | ) | 766 | 1 042 | (111 | ) | (520 | ) | (3 069 | ) | (112 | ) | ||||||||||||||
| | ||||||||||||||||||||||||||||||||
Income Tax (Recovery) Expense |
||||||||||||||||||||||||||||||||
| | ||||||||||||||||||||||||||||||||
Current |
22 | (298 | ) | 100 | 64 | 215 | 299 | (69 | ) | (57 | ) | 268 | 8 | |||||||||||||||||||
| | ||||||||||||||||||||||||||||||||
Deferred |
(890 | ) | 89 | (112 | ) | 3 | (7 | ) | (19 | ) | 7 | 87 | (1 002 | ) | 160 | |||||||||||||||||
| | | | | | | | | | | | | | | | | | | | | | | | | | | | | | | | | |
|
(868 | ) | (209 | ) | (12 | ) | 67 | 208 | 280 | (62 | ) | 30 | (734 | ) | 168 | |||||||||||||||||
| | | | | | | | | | | | | | | | | | | | | | | | | | | | | | | | | |
Net (Loss) Earnings |
(2 682 | ) | (377 | ) | (162 | ) | (115 | ) | 558 | 762 | (49 | ) | (550 | ) | (2 335 | ) | (280 | ) | ||||||||||||||
| | | | | | | | | | | | | | | | | | | | | | | | | | | | | | | | | |
Capital and Exploration Expenditures |
1 082 | 663 | 281 | 285 | 314 | 189 | 98 | 10 | 1 775 | 1 147 | ||||||||||||||||||||||
| | | | | | | | | | | | | | | | | | | | | | | | | | | | | | | | | |
- (1)
- The
company adopted IFRS 16 on January 1, 2019 using the modified retrospective transition approach and, therefore, prior periods have not been restated. Refer to
note 3 for further information.
- (2)
- Beginning in 2019, results from the company's Energy Trading business are included within each of the respective operating business segments to which the respective trading activity relates. The Energy Trading business was previously reported within the Corporate, Energy Trading and Eliminations segment. Prior periods have been restated to reflect this change. The results from the company's Renewable Energy business continue to be included within the Corporate and Eliminations segment.
| 50 2019 FOURTH QUARTER Suncor Energy Inc. | | |
| Twelve months ended December 31 |
Oil Sands |
Exploration and Production |
Refining and Marketing |
Corporate and Eliminations |
Total |
|||||||||||||||||||||||||||
| ($ millions) | 2019 | 2018 | 2019 | 2018 | 2019 | 2018 | 2019 | 2018 | 2019 | 2018 | ||||||||||||||||||||||
| | | | | | | | | | | | | | | | | | | | | | | | | | | | | | | | | |
Revenues and Other Income |
||||||||||||||||||||||||||||||||
| | ||||||||||||||||||||||||||||||||
Gross revenues |
13 948 | 12 039 | 3 675 | 3 869 | 22 216 | 23 655 | 27 | 29 | 39 866 | 39 592 | ||||||||||||||||||||||
| | ||||||||||||||||||||||||||||||||
Intersegment revenues |
4 399 | 3 704 | — | — | 88 | 123 | (4 487 | ) | (3 827 | ) | — | — | ||||||||||||||||||||
| | ||||||||||||||||||||||||||||||||
Less: Royalties |
(917 | ) | (398 | ) | (605 | ) | (652 | ) | — | — | — | — | (1 522 | ) | (1 050 | ) | ||||||||||||||||
| | | | | | | | | | | | | | | | | | | | | | | | | | | | | | | | | |
Operating revenues, net of royalties |
17 430 | 15 345 | 3 070 | 3 217 | 22 304 | 23 778 | (4 460 | ) | (3 798 | ) | 38 344 | 38 542 | ||||||||||||||||||||
| | ||||||||||||||||||||||||||||||||
Other income (loss) |
172 | 387 | 430 | (68 | ) | 75 | 68 | (32 | ) | 57 | 645 | 444 | ||||||||||||||||||||
| | | | | | | | | | | | | | | | | | | | | | | | | | | | | | | | | |
|
17 602 | 15 732 | 3 500 | 3 149 | 22 379 | 23 846 | (4 492 | ) | (3 741 | ) | 38 989 | 38 986 | ||||||||||||||||||||
| | | | | | | | | | | | | | | | | | | | | | | | | | | | | | | | | |
Expenses |
||||||||||||||||||||||||||||||||
| | ||||||||||||||||||||||||||||||||
Purchases of crude oil and products |
1 407 | 1 563 | — | — | 15 296 | 16 656 | (4 141 | ) | (4 086 | ) | 12 562 | 14 133 | ||||||||||||||||||||
| | ||||||||||||||||||||||||||||||||
Operating, selling and general |
8 027 | 7 577 | 525 | 507 | 2 173 | 2 043 | 519 | 446 | 11 244 | 10 573 | ||||||||||||||||||||||
| | ||||||||||||||||||||||||||||||||
Transportation |
1 293 | 1 144 | 80 | 85 | 120 | 147 | (51 | ) | (57 | ) | 1 442 | 1 319 | ||||||||||||||||||||
| | ||||||||||||||||||||||||||||||||
Depreciation, depletion, amortization and impairment |
8 170 | 4 024 | 1 505 | 967 | 823 | 684 | 74 | 63 | 10 572 | 5 738 | ||||||||||||||||||||||
| | ||||||||||||||||||||||||||||||||
Exploration |
127 | 44 | 129 | 78 | — | — | — | — | 256 | 122 | ||||||||||||||||||||||
| | ||||||||||||||||||||||||||||||||
(Gain) loss on asset exchange and disposals |
(14 | ) | (108 | ) | (228 | ) | 91 | (11 | ) | (7 | ) | — | — | (253 | ) | (24 | ) | |||||||||||||||
| | ||||||||||||||||||||||||||||||||
Financing expenses |
318 | 320 | 73 | 46 | 55 | 7 | 187 | 1 769 | 633 | 2 142 | ||||||||||||||||||||||
| | | | | | | | | | | | | | | | | | | | | | | | | | | | | | | | | |
|
19 328 | 14 564 | 2 084 | 1 774 | 18 456 | 19 530 | (3 412 | ) | (1 865 | ) | 36 456 | 34 003 | ||||||||||||||||||||
| | | | | | | | | | | | | | | | | | | | | | | | | | | | | | | | | |
(Loss) earnings before Income Taxes |
(1 726 | ) | 1 168 | 1 416 | 1 375 | 3 923 | 4 316 | (1 080 | ) | (1 876 | ) | 2 533 | 4 983 | |||||||||||||||||||
| | ||||||||||||||||||||||||||||||||
Income Tax (Recovery) Expense |
||||||||||||||||||||||||||||||||
| | ||||||||||||||||||||||||||||||||
Current |
266 | (128 | ) | 626 | 680 | 972 | 1 090 | (312 | ) | (392 | ) | 1 552 | 1 250 | |||||||||||||||||||
| | ||||||||||||||||||||||||||||||||
Deferred |
(1 565 | ) | 351 | (215 | ) | (112 | ) | (49 | ) | 72 | (89 | ) | 129 | (1 918 | ) | 440 | ||||||||||||||||
| | | | | | | | | | | | | | | | | | | | | | | | | | | | | | | | | |
|
(1 299 | ) | 223 | 411 | 568 | 923 | 1 162 | (401 | ) | (263 | ) | (366 | ) | 1 690 | ||||||||||||||||||
| | | | | | | | | | | | | | | | | | | | | | | | | | | | | | | | | |
Net (Loss) Earnings |
(427 | ) | 945 | 1 005 | 807 | 3 000 | 3 154 | (679 | ) | (1 613 | ) | 2 899 | 3 293 | |||||||||||||||||||
| | | | | | | | | | | | | | | | | | | | | | | | | | | | | | | | | |
Capital and Exploration Expenditures |
3 522 | 3 546 | 1 070 | 946 | 818 | 856 | 148 | 58 | 5 558 | 5 406 | ||||||||||||||||||||||
| | | | | | | | | | | | | | | | | | | | | | | | | | | | | | | | | |
- (1)
- The
company adopted IFRS 16 on January 1, 2019 using the modified retrospective transition approach and, therefore, prior periods have not been restated. Refer to
note 3 for further information.
- (2)
- Beginning in 2019, results from the company's Energy Trading business are included within each of the respective operating business segments to which the respective trading activity relates. The Energy Trading business was previously reported within the Corporate, Energy Trading and Eliminations segment. Prior periods have been restated to reflect this change. The results from the company's Renewable Energy business continue to be included within the Corporate and Eliminations segment.
| | | 2019 FOURTH QUARTER Suncor Energy Inc. 51 |
Disaggregation of Revenue from Contracts with Customers and Intersegment Revenue
The company derives revenue from the transfer of goods mainly at a point in time in the following major commodities, revenue streams and geographical regions:
Three months ended December 31 |
2019 |
2018 |
||||||||||||
($ millions) |
North America | International | Total | North America | International | Total | ||||||||
|
| | | | | | | | | | | | | |
Oil Sands |
||||||||||||||
| | ||||||||||||||
SCO and diesel |
3 122 | — | 3 122 | 2 236 | — | 2 236 | ||||||||
| | ||||||||||||||
Bitumen |
1 303 | — | 1 303 | 913 | — | 913 | ||||||||
| | | | | | | | | | | | | | | |
|
4 425 | — | 4 425 | 3 149 | — | 3 149 | ||||||||
| | | | | | | | | | | | | | | |
Exploration and Production |
||||||||||||||
| | ||||||||||||||
Crude oil and natural gas liquids |
531 | 465 | 996 | 287 | 481 | 768 | ||||||||
| | ||||||||||||||
Natural gas |
— | 2 | 2 | — | 3 | 3 | ||||||||
| | | | | | | | | | | | | | | |
|
531 | 467 | 998 | 287 | 484 | 771 | ||||||||
| | | | | | | | | | | | | | | |
Refining and Marketing |
||||||||||||||
| | ||||||||||||||
Gasoline |
2 471 | — | 2 471 | 2 391 | — | 2 391 | ||||||||
| | ||||||||||||||
Distillate |
2 408 | — | 2 408 | 2 478 | — | 2 478 | ||||||||
| | ||||||||||||||
Other |
666 | — | 666 | 798 | — | 798 | ||||||||
| | | | | | | | | | | | | | | |
|
5 545 | — | 5 545 | 5 667 | — | 5 667 | ||||||||
| | | | | | | | | | | | | | | |
Corporate and Eliminations |
||||||||||||||
| | | | | | | | | | | | | | | |
|
(1 168 | ) | — | (1 168 | ) | (820 | ) | — | (820 | ) | ||||
| | | | | | | | | | | | | | | |
Total Revenue from Contracts with Customers |
9 333 | 467 | 9 800 | 8 283 | 484 | 8 767 | ||||||||
|
| | | | | | | | | | | | | |
Twelve months ended December 31 |
2019 |
2018 |
||||||||||||
($ millions) |
North America | International | Total | North America | International | Total | ||||||||
|
| | | | | | | | | | | | | |
Oil Sands |
||||||||||||||
| | ||||||||||||||
SCO and diesel |
13 368 | — | 13 368 | 11 659 | — | 11 659 | ||||||||
| | ||||||||||||||
Bitumen |
4 979 | — | 4 979 | 4 084 | — | 4 084 | ||||||||
| | | | | | | | | | | | | | | |
|
18 347 | — | 18 347 | 15 743 | — | 15 743 | ||||||||
| | | | | | | | | | | | | | | |
Exploration and Production |
||||||||||||||
| | ||||||||||||||
Crude oil and natural gas liquids |
1 922 | 1 747 | 3 669 | 1 741 | 2 112 | 3 853 | ||||||||
| | ||||||||||||||
Natural gas |
— | 6 | 6 | 3 | 13 | 16 | ||||||||
| | | | | | | | | | | | | | | |
|
1 922 | 1 753 | 3 675 | 1 744 | 2 125 | 3 869 | ||||||||
| | | | | | | | | | | | | | | |
Refining and Marketing |
||||||||||||||
| | ||||||||||||||
Gasoline |
9 941 | — | 9 941 | 10 819 | — | 10 819 | ||||||||
| | ||||||||||||||
Distillate |
9 447 | — | 9 447 | 9 698 | — | 9 698 | ||||||||
| | ||||||||||||||
Other |
2 916 | — | 2 916 | 3 261 | — | 3 261 | ||||||||
| | | | | | | | | | | | | | | |
|
22 304 | — | 22 304 | 23 778 | — | 23 778 | ||||||||
| | | | | | | | | | | | | | | |
Corporate and Eliminations |
||||||||||||||
| | | | | | | | | | | | | | | |
|
(4 460 | ) | — | (4 460 | ) | (3 798 | ) | — | (3 798 | ) | ||||
| | | | | | | | | | | | | | | |
Total Revenue from Contracts with Customers |
38 113 | 1 753 | 39 866 | 37 467 | 2 125 | 39 592 | ||||||||
|
| | | | | | | | | | | | | |
- (1)
- The
company adopted IFRS 16 on January 1, 2019 using the modified retrospective transition approach and, therefore, prior periods have not been restated. Refer to
note 3 for further information.
- (2)
- Beginning in 2019, results from the company's Energy Trading business are included within each of the respective operating business segments to which the respective trading activity relates. The Energy Trading business was previously reported within the Corporate, Energy Trading and Eliminations segment. Prior periods have been restated to reflect this change. The results from the company's Renewable Energy business continue to be included within the Corporate and Eliminations segment.
| 52 2019 FOURTH QUARTER Suncor Energy Inc. | | |
5. OTHER INCOME
Other income consists of the following:
|
Three months ended December 31 |
Twelve months ended December 31 |
||||||||
($ millions) |
2019 | 2018 | 2019 | 2018 | ||||||
|
| | | | | | | | | |
Risk management and trading activities(1) |
(2 | ) | 254 | 155 | 255 | |||||
| | ||||||||||
Gains (losses) on inventory valuation |
39 | 24 | (7 | ) | 13 | |||||
| | ||||||||||
Investment and interest income |
3 | 19 | 89 | 34 | ||||||
| | ||||||||||
Insurance proceeds(2) |
34 | 87 | 431 | 120 | ||||||
| | ||||||||||
Other |
37 | — | (23 | ) | 22 | |||||
| | | | | | | | | | | |
|
111 | 384 | 645 | 444 | ||||||
|
| | | | | | | | | |
- (1)
- Includes
fair value changes related to derivative contracts in the Oil Sands, Exploration and Production, and Refining and Marketing segments.
- (2)
- Three months ended and twelve months ended December 31, 2019 and 2018 include insurance proceeds for Syncrude within the Oil Sands segment. Twelve months ended December 31, 2019 also includes insurance proceeds for Libyan assets within the Exploration and Production segment (note 17).
6. SHARE-BASED COMPENSATION
The following table summarizes the share-based compensation expense (recovery) for all plans recorded within Operating, Selling and General expense:
|
Three months ended December 31 |
Twelve months ended December 31 |
||||||||
($ millions) |
2019 | 2018 | 2019 | 2018 | ||||||
|
| | | | | | | | | |
Equity-settled plans |
8 | 8 | 50 | 46 | ||||||
| | ||||||||||
Cash-settled plans |
63 | (96 | ) | 274 | 181 | |||||
| | | | | | | | | | | |
|
71 | (88 | ) | 324 | 227 | |||||
|
| | | | | | | | | |
7. FINANCING EXPENSES
|
Three months ended December 31 |
Twelve months ended December 31 |
||||||||
($ millions) |
2019 | 2018 | 2019 | 2018 | ||||||
|
| | | | | | | | | |
Interest on debt |
208 | 224 | 825 | 897 | ||||||
| | ||||||||||
Interest on lease liabilities (note 3) |
42 | — | 172 | — | ||||||
| | ||||||||||
Capitalized interest |
(37 | ) | (28 | ) | (122 | ) | (156 | ) | ||
| | | | | | | | | | | |
Interest expense |
213 | 196 | 875 | 741 | ||||||
| | ||||||||||
Interest on partnership liability |
14 | 14 | 55 | 56 | ||||||
| | ||||||||||
Interest on pension and other post-retirement benefits |
14 | 13 | 59 | 56 | ||||||
| | ||||||||||
Accretion |
65 | 67 | 270 | 266 | ||||||
| | ||||||||||
Foreign exchange (gain) loss on U.S. dollar denominated debt |
(246 | ) | 688 | (624 | ) | 1 090 | ||||
| | ||||||||||
Operational foreign exchange and other |
11 | (26 | ) | (2 | ) | (67 | ) | |||
| | | | | | | | | | | |
|
71 | 952 | 633 | 2 142 | ||||||
|
| | | | | | | | | |
| | | 2019 FOURTH QUARTER Suncor Energy Inc. 53 |
During the second quarter of 2019, the company re-paid its US$140 million (book value of $188 million) senior unsecured notes at maturity, with a coupon of 7.75%, for US$145 million ($195 million), including US$5 million ($7 million) of accrued interest.
In May 2019, the company issued $750 million of senior unsecured Series 6 Medium Term Notes maturing on May 24, 2029. The Series 6 Medium Term Notes have a coupon of 3.10% and were priced at $99.761 per $100 principal amount for an effective yield of 3.128%. Interest is paid semi-annually.
During the fourth quarter of 2018, the company completed an early retirement of US$83 million (book value of $109 million) of subsidiary debt acquired through the acquisition of Canadian Oil Sands Limited with a coupon of 7.75% originally scheduled to mature on May 15, 2019 for US$88 million ($116 million). The early retirement payment included US$3 million ($4 million) of accrued interest, resulting in a debt extinguishment loss of $3 million ($2 million after-tax).
8. (LOSS) EARNINGS PER COMMON SHARE
|
Three months ended December 31 |
Twelve months ended December 31 |
||||||||
($ millions) |
2019 | 2018 | 2019 | 2018 | ||||||
|
| | | | | | | | | |
Net (loss) earnings |
(2 335 | ) | (280 | ) | 2 899 | 3 293 | ||||
|
| | | | | | | | | |
(millions of common shares) |
||||||||||
|
| | | | | | | | | |
Weighted average number of common shares |
1 536 | 1 599 | 1 559 | 1 623 | ||||||
| | ||||||||||
Dilutive securities: |
||||||||||
| | ||||||||||
Effect of share options |
2 | 4 | 2 | 6 | ||||||
| | | | | | | | | | | |
Weighted average number of diluted common shares |
1 538 | 1 603 | 1 561 | 1 629 | ||||||
|
| | | | | | | | | |
(dollars per common share) |
||||||||||
|
| | | | | | | | | |
Basic (loss) earnings per share |
(1.52 | ) | (0.18 | ) | 1.86 | 2.03 | ||||
| | ||||||||||
Diluted (loss) earnings per share |
(1.52 | ) | (0.18 | ) | 1.86 | 2.02 | ||||
|
| | | | | | | | | |
9. NORMAL COURSE ISSUER BID
On May 1, 2018, the company announced its intent to continue its normal course issuer bid program (the 2018 NCIB) to repurchase common shares through the facilities of the Toronto Stock Exchange (TSX), New York Stock Exchange (NYSE) and/or alternative trading platforms. Pursuant to the 2018 NCIB, the company was permitted to purchase for cancellation up to 52,285,330 of its common shares between May 4, 2018 and May 3, 2019. On November 14, 2018, Suncor announced an amendment to the 2018 NCIB, effective as of November 19, 2018, which increased the maximum number of aggregate common shares that it was permitted to repurchase for cancellation between May 4, 2018 and May 3, 2019 to 81,695,830
On May 1, 2019, the company announced its intention to renew its existing normal course issuer bid (the 2019 NCIB) to continue to repurchase shares under its previously announced buyback program through the facilities of the TSX, NYSE and/or alternative trading platforms. Pursuant to the 2019 NCIB, the company is permitted to purchase for cancellation up to 50,252,231 of its common shares between May 6, 2019 and May 5, 2020. On December 23, 2019, Suncor announced an amendment to the 2019 NCIB, effective as of December 30, 2019, which allows the company to increase the maximum number of aggregate common shares that may be repurchased between May 6, 2019 and May 5, 2020 to 78,549,178. Subsequent to the end of the quarter, the Board approved a further share repurchase program of up to $2.0 billion between March 2020 and February 2021.
During the fourth quarter of 2019, the company repurchased 11.1 million common shares under the 2019 NCIB at an average price of $40.56 per share, for a total repurchase cost of $452 million.
| 54 2019 FOURTH QUARTER Suncor Energy Inc. | | |
The following table summarizes the share repurchase activities during the period:
|
Three months ended December 31 |
Twelve months ended December 31 |
||||||||
($ millions, except as noted) |
2019 | 2018 | 2019 | 2018 | ||||||
|
| | | | | | | | | |
Share repurchase activities (thousands of common shares) |
||||||||||
| | ||||||||||
Shares repurchased |
11 140 | 26 726 | 55 298 | 64 426 | ||||||
| | | | | | | | | | | |
Amounts charged to |
||||||||||
| | ||||||||||
Share capital |
183 | 431 | 905 | 1 040 | ||||||
| | ||||||||||
Retained earnings |
269 | 735 | 1 369 | 2 013 | ||||||
| | | | | | | | | | | |
Share repurchase cost |
452 | 1 166 | 2 274 | 3 053 | ||||||
|
| | | | | | | | | |
Under an automatic repurchase plan agreement with an independent broker, the company recorded the following liability for share repurchases that could have taken place during its internal blackout period:
($ millions) |
December 31 2019 |
December 31 2018 |
||||
|
| | | | | |
Amounts charged to |
||||||
| | ||||||
Share capital |
65 | 111 | ||||
| | ||||||
Retained earnings |
103 | 152 | ||||
| | | | | | | |
Liability for share purchase commitment |
168 | 263 | ||||
|
| | | | | |
10. FINANCIAL INSTRUMENTS
Derivative Financial Instruments
(a) Non-Designated Derivative Financial Instruments
The company uses derivative financial instruments, such as physical and financial contracts, to manage certain exposures to fluctuations in interest rates, commodity prices and foreign currency exchange rates, as part of its overall risk management program, as well as for trading purposes.
The changes in the fair value of non-designated derivatives are as follows:
($ millions) |
Total | |||
|
| | | |
Fair value outstanding at December 31, 2018 |
60 | |||
| | ||||
Cash Settlements – received during the year |
(254 | ) | ||
| | ||||
Changes in fair value recognized in earnings during the year (note 5) |
155 | |||
| | | | | |
Fair value outstanding at December 31, 2019 |
(39 | ) | ||
|
| | | |
(b) Fair Value Hierarchy
To estimate the fair value of derivatives, the company uses quoted market prices when available, or third-party models and valuation methodologies that utilize observable market data. In addition to market information, the company incorporates transaction-specific details that market participants would utilize in a fair value measurement, including the impact of non-performance risk. However, these fair value estimates may not necessarily be indicative of the amounts that could be realized or settled in a current market transaction. The company characterizes inputs used in determining fair value using a hierarchy that prioritizes inputs depending on the degree to which they are observable. The three levels of the fair value hierarchy are as follows:
- •
- Level 1 consists of instruments with a fair value determined by an unadjusted quoted price in an active market for identical assets or liabilities. An active market is characterized by readily and regularly available quoted prices where the prices are representative of actual and regularly occurring market transactions to assure liquidity.
| | | 2019 FOURTH QUARTER Suncor Energy Inc. 55 |
- •
- Level 2
consists of instruments with a fair value that is determined by quoted prices in an inactive market, prices with observable inputs, or prices with
insignificant non-observable inputs. The fair value of these positions is determined using observable inputs from exchanges, pricing services, third-party independent broker quotes, and published
transportation tolls. The observable inputs may be adjusted using certain methods, which include extrapolation over the quoted price term and quotes for comparable assets and liabilities.
- •
- Level 3 consists of instruments with a fair value that is determined by prices with significant unobservable inputs. As at December 31, 2019, the company does not have any derivative instruments measured at fair value Level 3.
In forming estimates, the company utilizes the most observable inputs available for valuation purposes. If a fair value measurement reflects inputs of different levels within the hierarchy, the measurement is categorized based upon the lowest level of input that is significant to the fair value measurement.
The following table presents the company's financial instruments measured at fair value for each hierarchy level as at December 31, 2019:
| ($ millions) | | Level 1 | | Level 2 | | Level 3 | |
Total Fair Value |
| |||||
| | | | | | | | | | | | ||||
Accounts receivable |
| 33 | | 61 | | — | | 94 | | |||||
| | ||||||||||||||
Accounts payable |
| (66 | ) | (67 | ) | — | | (133 | ) | |||||
| | | | | | | | | | | | ||||
|
| (33 | ) | (6 | ) | — | | (39 | ) | |||||
| | | | | | | | | | | | ||||
During the fourth quarter of 2019, there were no transfers between Level 1 and Level 2 fair value measurements.
Non-Derivative Financial Instruments
At December 31, 2019, the carrying value of fixed-term debt accounted for under amortized cost was $12.9 billion (December 31, 2018 – $12.9 billion) and the fair value was $16.1 billion (December 31, 2018 – $14.2 billion). Increase in fair value of debt is mainly due to decline in interest rates during the year. The estimated fair value of long-term debt is based on pricing sourced from market data.
11. PROVISIONS
Suncor's decommissioning and restoration provision increased by $1.7 billion for the twelve months ended December 31, 2019. The increase was primarily due to a decrease in the credit-adjusted risk-free interest rate to 3.30% (December 31, 2018 – 4.20%) and additional disturbances in the year. This increase was partially offset by the liabilities settled during the period.
12. RIGHT-OF-USE ASSETS AND LEASES
The company has lease contracts which include storage tanks, pipelines, railway cars, vessels, buildings, land and mobile equipment for the purpose of production, storage and transportation of crude oil and related products.
Right-of-use (ROU) assets within property, plant and equipment:
($ millions) |
December 31 2019 |
|||
|
| | | |
Property, plant and equipment, net – excluding ROU assets |
69 745 | |||
| | ||||
ROU assets |
2 895 | |||
| | | | | |
|
72 640 | |||
|
| | | |
| 56 2019 FOURTH QUARTER Suncor Energy Inc. | | |
The following table presents the ROU assets by asset class:
($ millions) |
Plant and Equipment |
|||
|
| | | |
Cost |
||||
| | ||||
At January 1, 2019 |
3 326 | |||
| | ||||
Additions and adjustments |
186 | |||
| | ||||
Foreign exchange |
(7 | ) | ||
| | | | | |
At December 31, 2019 |
3 505 | |||
| | | | | |
Accumulated provision |
||||
| | ||||
At January 1, 2019 |
(267 | ) | ||
| | ||||
Depreciation |
(343 | ) | ||
| | | | | |
At December 31, 2019 |
(610 | ) | ||
| | | | | |
Net ROU assets |
||||
| | ||||
At January 1, 2019 |
3 059 | |||
| | ||||
At December 31, 2019 |
2 895 | |||
|
| | | |
13. ASSET IMPAIRMENT
Due to continued volatility in the crude oil price environment and resulting declines in forecasted long-term heavy crude oil prices, the company performed an asset impairment test on its Fort Hills cash generating unit (CGU) in the Oil Sands segment. Due to an increase to forecasted capital expenditures within the White Rose CGU, the company also performed an impairment test within the Exploration and Production segment as at December 31, 2019. The impairment tests were performed using recoverable amounts based on the fair value less cost of disposal. An expected cash flow approach was used with the key assumptions discussed below (Level 3 fair value inputs – note 10):
Oil Sands
As a result of the impairment test, the company recorded impairment of $2.80 billion (net of taxes of $0.91 billion) on its share of the Fort Hills project in the Oil Sands segment using the following asset-specific assumptions:
- •
- WCS
price forecast of US$40.75/bbl in 2020, US$45.60/bbl in 2021, US$49.65/bbl in 2022, US$51.55/bbl in 2023 and US$52.90/bbls in 2024, escalating at 2% per year thereafter
over the life of the project up to 2060, adjusted for asset-specific location and quality differentials;
- •
- the
company's share of production ranging from 96,000 to 106,000 bbls/d over the life of the project;
- •
- cash
operating costs averaging $22/bbl to $24/bbl over the life of the project (expressed in real dollars), reflects operating, selling and general expenses adjusted for
non-production costs including share based compensation, research costs, and excess power revenue; and
- •
- risk-adjusted discount rate of 7.5% (after-tax).
The recoverable amount of the Fort Hills CGU was $7.7 billion as at December 31, 2019, which also includes the cost of carbon compliance in accordance with current provincial and federal regulations which starts at $30/tonne in 2020, reaches $50/tonne by 2022 and escalates at the rate of inflation thereafter. Estimate of the recoverable amount is most sensitive to price and discount rate. A 5% decrease in price would have resulted in an increase to the impairment charge of approximately $1.2 billion (after-tax) on the company's share of the Fort Hills assets. A 1% increase in the discount rate would have resulted in an increase to the impairment charge of approximately $900 million (after-tax) on the company's share of the Fort Hills assets.
| | | 2019 FOURTH QUARTER Suncor Energy Inc. 57 |
Exploration and Production
As a result of the impairment test, the company recorded impairment of $393 million (net of taxes of $128 million) on its share of the White Rose assets in the Exploration and Production segment using the following asset-specific assumptions:
- •
- Brent
price forecast of US$65.00/bbl in 2020, escalating at 2% per year thereafter over the life of the project up to 2036 and adjusted for asset-specific location and
quality differentials;
- •
- the
company's share of production of approximately 8,700 bbls/d over the life of the project;
- •
- the
company's share of future capital expenditure of $1.4 billion, including the West White Rose expansion; and
- •
- risk-adjusted discount rate of 9.0% (after-tax).
The recoverable amount of the White Rose CGU was $360 million as at December 31, 2019, which also includes the cost of carbon compliance in accordance with current provincial and federal regulations which starts at $30/tonne in 2020, reaches $50/tonne by 2022 and escalates at the rate of inflation thereafter. Estimate of the recoverable amount is most sensitive to price and discount rate. A 5% decrease in price would have resulted in an increase to the impairment charge of approximately $85 million (after-tax) on the company's share of the White Rose assets. A 1% increase in the discount rate would have resulted in an increase to the impairment charge of approximately $35 million (after-tax) on the company's share of the White Rose assets.
14. FORT HILLS
During the first quarter of 2018, Suncor acquired an additional 1.05% interest in the Fort Hills project for consideration of $145 million. The additional interest was an outcome of the commercial dispute settlement agreement reached among the Fort Hills partners in December 2017. Teck Resources Limited (Teck) also acquired an additional 0.42% in the project. Suncor's share in the project has increased to 54.11% and Teck's has increased to 21.31%, with Total E&P Canada Ltd.'s share decreasing to 24.58%.
15. ACQUISITION OF ADDITIONAL OWNERSHIP INTEREST IN THE SYNCRUDE PROJECT
On February 23, 2018, Suncor completed the purchase of an additional 5% working interest in the Syncrude project from Mocal Energy Limited for $923 million cash. Suncor's share in the Syncrude project has increased to 58.74%.
The acquisition has been accounted for as a business combination using the acquisition method. The purchase price allocation is based on management's best estimates of fair values of Syncrude's assets and liabilities as at February 23, 2018.
($ millions) |
||||
|
| | | |
Accounts receivable |
2 | |||
| | ||||
Inventory |
15 | |||
| | ||||
Property, plant and equipment |
998 | |||
| | ||||
Exploration and evaluation |
163 | |||
| | | | | |
Total assets acquired |
1 178 | |||
| | | | | |
Accounts payable and accrued liabilities |
(51 | ) | ||
| | ||||
Employee future benefits |
(33 | ) | ||
| | ||||
Decommissioning provision |
(169 | ) | ||
| | ||||
Deferred income taxes |
(2 | ) | ||
| | | | | |
Total liabilities assumed |
(255 | ) | ||
| | | | | |
Net assets acquired |
923 | |||
|
| | | |
The fair values of accounts receivable and accounts payable approximate their carrying values due to the short-term maturity of the instruments. The fair value of materials and supplies inventory approximates book value due to short-term turnover rates. The fair values of property, plant and equipment, and the decommissioning provision were determined using an expected future cash flow approach. Key assumptions used in the calculations were discount rates, future commodity prices
| 58 2019 FOURTH QUARTER Suncor Energy Inc. | | |
and costs, timing of development activities, projections of oil reserves, and cost estimates to abandon and reclaim the mine and facilities.
The additional working interest in Syncrude contributed $270 million to gross revenues and a $7 million net loss to consolidated net earnings (loss) from the acquisition date to December 31, 2018.
Had the acquisition occurred on January 1, 2018, the additional working interest would have contributed an additional $64 million to gross revenues and $4 million to consolidated net earnings, which would have resulted in gross revenues of $39.66 billion and consolidated net earnings of $3.30 billion for the twelve months ended December 31, 2018.
16. INCOME TAXES
In the second quarter of 2019, Suncor recognized a deferred income tax recovery of $1.116 billion related to a decrease in the Alberta provincial corporate tax rate from 12% to 8%. The tax rate decrease will be phased in as follows: 11% effective July 1, 2019, 10% effective January 1, 2020, 9% effective January 1, 2021, and 8% effective January 1, 2022. The deferred income tax recovery of $1.116 billion was comprised of $910 million recovery in the Oil Sands segment, $88 million recovery in the Refining and Marketing segment, $70 million recovery in the Exploration and Production segment and $48 million recovery in the Corporate and Eliminations segment.
17. OTHER TRANSACTIONS
In the third quarter of 2019, the company recognized a gain on sale of $65 million ($48 million after-tax) in the Exploration and Production segment related to the sale of its non-core Australian assets.
On June 28, 2019, the company completed a transaction to sell its 37% equity interest in Canbriam Energy Inc. (Canbriam) and recognized a gain on sale for the full proceeds of $151 million ($139 million after-tax) in the Exploration and Production segment. The investment in Canbriam was acquired early in 2018 through the exchange of Suncor's northeast British Columbia mineral landholdings, including associated production, and consideration of $52 million.
During the first quarter of 2019, the company received $363 million in insurance proceeds for its Libyan assets ($264 million after-tax). The proceeds may be subject to a provisional repayment, which may be dependent on the future performance and cash flows from Suncor's Libyan assets.
On September 29, 2018, Suncor along with the other working-interest partners in the Joslyn Oil Sands Mining Project agreed to sell 100% of their respective working interests to Canadian Natural Resources Limited for gross proceeds of $225 million, $82.7 million net to Suncor. Suncor held a 36.75% working interest in Joslyn prior to the transaction. The working-interest partners received cash proceeds of $100 million ($36.8 million net to Suncor) upon closing with the remaining $125 million ($45.9 million net to Suncor) to be received in equal instalments over the next five years. As a result, Suncor has recorded a long-term receivable of $36.7 million within the Other Assets line item and the first instalment of $9.2 million is recorded within the Accounts Receivable line item. The transaction resulted in a gain of $83 million in the Oil Sands segment.
On May 31, 2018, the company completed the previously announced transaction to acquire a 17.5% interest in the Fenja development project in Norway from Faroe Petroleum Norge AS for acquisition costs of US$55 million (approximately $70 million), plus interim settlement costs of $22 million under the acquisition method. This project was sanctioned by its owners in December 2017.
| | | 2019 FOURTH QUARTER Suncor Energy Inc. 59 |
SUPPLEMENTAL FINANCIAL AND OPERATING INFORMATION
QUARTERLY FINANCIAL SUMMARY
(unaudited)
| | Three months ended | |
Twelve months ended |
| |||||||||||||||||||||||||||||||||
| ($ millions, except per share amounts) | |
Dec 31 2019 |
|
Sep 30 2019 |
|
Jun 30 2019 |
|
Mar 31 2019 |
|
Dec 31 2018 |
|
Dec 31 2019 |
|
Dec 31 2018 |
| ||||||||||||||||||||||
| | | | | | | | | | | | | | | | | | |||||||||||||||||||||
Revenues, net of royalties, and other income |
| | 9 598 | | | | 9 896 | | | | 10 098 | | | | 9 397 | | | | 8 945 | | | | 38 989 | | | | 38 986 | | | ||||||||
| | | | | | | | | | | | | | | | | | |||||||||||||||||||||
Net (loss) earnings(A) |
| | | | | | | | | | | | | | | | | | | | | | |||||||||||||||
| | |||||||||||||||||||||||||||||||||||||
Oil Sands |
| | (2 682 | ) | | | 505 | | | | 1 561 | | | | 189 | | | | (377 | ) | | | (427 | ) | | | 945 | | | ||||||||
| | |||||||||||||||||||||||||||||||||||||
Exploration and Production |
| | (162 | ) | | | 219 | | | | 456 | | | | 492 | | | | (115 | ) | | | 1 005 | | | | 807 | | | ||||||||
| | |||||||||||||||||||||||||||||||||||||
Refining and Marketing |
| | 558 | | | | 668 | | | | 765 | | | | 1 009 | | | | 762 | | | | 3 000 | | | | 3 154 | | | ||||||||
| | |||||||||||||||||||||||||||||||||||||
Corporate and Eliminations |
| | (49 | ) | | | (357 | ) | | | (53 | ) | | | (220 | ) | | | (550 | ) | | | (679 | ) | | | (1 613 | ) | | ||||||||
| | | | | | | | | | | | | | | | | | |||||||||||||||||||||
Total |
| | (2 335 | ) | | | 1 035 | | | | 2 729 | | | | 1 470 | | | | (280 | ) | | | 2 899 | | | | 3 293 | | | ||||||||
| | | | | | | | | | | | | | | | | | |||||||||||||||||||||
Operating earnings (loss)(A)(B) |
| | | | | | | | | | | | | | | | | | | | | | |||||||||||||||
| | |||||||||||||||||||||||||||||||||||||
Oil Sands |
| | 277 | | | | 505 | | | | 651 | | | | 189 | | | | (377 | ) | | | 1 622 | | | | 885 | | | ||||||||
| | |||||||||||||||||||||||||||||||||||||
Exploration and Production |
| | 231 | | | | 171 | | | | 247 | | | | 492 | | | | 108 | | | | 1 141 | | | | 897 | | | ||||||||
| | |||||||||||||||||||||||||||||||||||||
Refining and Marketing |
| | 558 | | | | 668 | | | | 677 | | | | 1 009 | | | | 762 | | | | 2 912 | | | | 3 154 | | | ||||||||
| | |||||||||||||||||||||||||||||||||||||
Corporate and Eliminations |
| | (284 | ) | | | (230 | ) | | | (322 | ) | | | (481 | ) | | | 87 | | | | (1 317 | ) | | | (624 | ) | | ||||||||
| | | | | | | | | | | | | | | | | | |||||||||||||||||||||
Total |
| | 782 | | | | 1 114 | | | | 1 253 | | | | 1 209 | | | | 580 | | | | 4 358 | | | | 4 312 | | | ||||||||
| | | | | | | | | | | | | | | | | | |||||||||||||||||||||
Funds from (used in) operations(A)(B) |
| | | | | | | | | | | | | | | | | | | | | | |||||||||||||||
| | |||||||||||||||||||||||||||||||||||||
Oil Sands |
| | 1 405 | | | | 1 606 | | | | 1 866 | | | | 1 184 | | | | 607 | | | | 6 061 | | | | 4 964 | | | ||||||||
| | |||||||||||||||||||||||||||||||||||||
Exploration and Production |
| | 555 | | | | 379 | | | | 507 | | | | 702 | | | | 331 | | | | 2 143 | | | | 1 779 | | | ||||||||
| | |||||||||||||||||||||||||||||||||||||
Refining and Marketing |
| | 793 | | | | 885 | | | | 932 | | | | 1 253 | | | | 873 | | | | 3 863 | | | | 3 798 | | | ||||||||
| | |||||||||||||||||||||||||||||||||||||
Corporate and Eliminations |
| | (200 | ) | | | (195 | ) | | | (300 | ) | | | (554 | ) | | | 196 | | | | (1 249 | ) | | | (369 | ) | | ||||||||
| | | | | | | | | | | | | | | | | | |||||||||||||||||||||
Total |
| | 2 553 | | | | 2 675 | | | | 3 005 | | | | 2 585 | | | | 2 007 | | | | 10 818 | | | | 10 172 | | | ||||||||
| | | | | | | | | | | | | | | | | | |||||||||||||||||||||
Change in non-cash working capital |
| | (249 | ) | | | 461 | | | | 428 | | | | (1 037 | ) | | | 1 033 | | | | (397 | ) | | | 408 | | | ||||||||
| | | | | | | | | | | | | | | | | | |||||||||||||||||||||
Cash flow provided by operating activities |
| | 2 304 | | | | 3 136 | | | | 3 433 | | | | 1 548 | | | | 3 040 | | | | 10 421 | | | | 10 580 | | | ||||||||
| | | | | | | | | | | | | | | | | | |||||||||||||||||||||
Per common share |
| | | | | | | | | | | | | | | | | | | | | | |||||||||||||||
| | |||||||||||||||||||||||||||||||||||||
Net (loss) earnings – basic |
| | (1.52 | ) | | | 0.67 | | | | 1.74 | | | | 0.93 | | | | (0.18 | ) | | | 1.86 | | | | 2.03 | | | ||||||||
| | |||||||||||||||||||||||||||||||||||||
Operating earnings – basic(B) |
| | 0.51 | | | | 0.72 | | | | 0.80 | | | | 0.77 | | | | 0.36 | | | | 2.80 | | | | 2.65 | | | ||||||||
| | |||||||||||||||||||||||||||||||||||||
Cash dividends – basic |
| | 0.42 | | | | 0.42 | | | | 0.42 | | | | 0.42 | | | | 0.36 | | | | 1.68 | | | | 1.44 | | | ||||||||
| | |||||||||||||||||||||||||||||||||||||
Funds from operations – basic(B) |
| | 1.66 | | | | 1.72 | | | | 1.92 | | | | 1.64 | | | | 1.26 | | | | 6.94 | | | | 6.27 | | | ||||||||
| | |||||||||||||||||||||||||||||||||||||
Cash flow provided by operating activities – basic |
| | 1.50 | | | | 2.02 | | | | 2.19 | | | | 0.98 | | | | 1.90 | | | | 6.69 | | | | 6.54 | | | ||||||||
| | | | | | | | | | | | | | | | | | |||||||||||||||||||||
| | For the twelve months ended | | |||||||||||||||||||||||||
| |
Dec 31 2019 |
|
Sep 30 2019 |
|
Jun 30 2019 |
|
Mar 31 2019 |
|
Dec 31 2018 |
| |||||||||||||||||
| | | | | | | | | | | | | | |||||||||||||||
Return on capital employed(B) |
| | | | | | | | | | | | | | | | |||||||||||
| | |||||||||||||||||||||||||||
– excluding major projects in progress (%) |
| | 5.1 | | | | 9.9 | | | | 10.6 | | | | 8.3 | | | | 8.2 | | | ||||||
| | |||||||||||||||||||||||||||
– including major projects in progress (%) |
| | 4.9 | | | | 9.7 | | | | 10.4 | | | | 8.2 | | | | 8.0 | | | ||||||
| | | | | | | | | | | | | | |||||||||||||||
- (A)
- Comparative
figures from 2018 have been restated to reflect the change to the company's segmented presentation of its Energy Trading business, with no impact to overall consolidated
results. The Energy Trading business is now included within each of the respective operating business segments to which the respective trade relates, where previously Suncor's Energy Trading business
results were reported within the Corporate, Energy Trading and Eliminations segment.
- (B)
- Non-GAAP financial measures. See the Operating Summary Information – Non-GAAP Financial Measures section of this Quarterly Report.
See accompanying footnotes and definitions to the quarterly operating summaries.
| 60 2019 FOURTH QUARTER Suncor Energy Inc. | | |
QUARTERLY OPERATING SUMMARY
(unaudited)
| | Three months ended | |
Twelve months ended |
| |||||||||||||||||||||||||||||||||
| Oil Sands | |
Dec 31 2019 |
|
Sep 30 2019 |
|
Jun 30 2019 |
|
Mar 31 2019 |
|
Dec 31 2018 |
|
Dec 31 2019 |
|
Dec 31 2018 |
| ||||||||||||||||||||||
| | | | | | | | | | | | | | | | | | |||||||||||||||||||||
Total Production (mbbls/d) |
| | 662.3 | | | | 670.0 | | | | 692.2 | | | | 657.2 | | | | 740.8 | | | | 670.4 | | | | 628.6 | | | ||||||||
| | | | | | | | | | | | | | | | | | |||||||||||||||||||||
Oil Sands operations |
| | | | | | | | | | | | | | | | | | | | | | |||||||||||||||
| | |||||||||||||||||||||||||||||||||||||
Upgraded product (sweet SCO, sour SCO and diesel) |
| | 300.0 | | | | 317.0 | | | | 295.5 | | | | 341.2 | | | | 273.4 | | | | 313.3 | | | | 280.3 | | | ||||||||
| | |||||||||||||||||||||||||||||||||||||
Non-upgraded bitumen |
| | 118.1 | | | | 105.2 | | | | 118.7 | | | | 55.4 | | | | 159.3 | | | | 99.5 | | | | 138.0 | | | ||||||||
| | | | | | | | | | | | | | | | | | |||||||||||||||||||||
Oil Sands operations production |
| | 418.1 | | | | 422.2 | | | | 414.2 | | | | 396.6 | | | | 432.7 | | | | 412.8 | | | | 418.3 | | | ||||||||
| | | | | | | | | | | | | | | | | | |||||||||||||||||||||
Bitumen production (mbbls/d) |
| | | | | | | | | | | | | | | | | | | | | | |||||||||||||||
| | | | | | | | | | | | | | | | | | |||||||||||||||||||||
Mining |
| | 289.9 | | | | 301.0 | | | | 300.5 | | | | 267.8 | | | | 278.3 | | | | 289.9 | | | | 258.8 | | | ||||||||
| | |||||||||||||||||||||||||||||||||||||
In Situ – Firebag |
| | 195.6 | | | | 194.6 | | | | 168.4 | | | | 189.4 | | | | 197.2 | | | | 187.0 | | | | 204.0 | | | ||||||||
| | |||||||||||||||||||||||||||||||||||||
In Situ – MacKay River |
| | 22.3 | | | | 23.1 | | | | 36.3 | | | | 35.2 | | | | 37.0 | | | | 29.2 | | | | 36.0 | | | ||||||||
| | | | | | | | | | | | | | | | | | |||||||||||||||||||||
Total bitumen production |
| | 507.8 | | | | 518.7 | | | | 505.2 | | | | 492.4 | | | | 512.5 | | | | 506.1 | | | | 498.8 | | | ||||||||
| | | | | | | | | | | | | | | | | | |||||||||||||||||||||
Sales (mbbls/d) |
| | | | | | | | | | | | | | | | | | | | | | |||||||||||||||
| | |||||||||||||||||||||||||||||||||||||
Light sweet crude oil |
| | 106.2 | | | | 116.1 | | | | 118.3 | | | | 113.7 | | | | 110.2 | | | | 113.5 | | | | 96.1 | | | ||||||||
| | |||||||||||||||||||||||||||||||||||||
Diesel |
| | 29.7 | | | | 20.1 | | | | 25.2 | | | | 29.0 | | | | 27.6 | | | | 26.0 | | | | 28.8 | | | ||||||||
| | |||||||||||||||||||||||||||||||||||||
Light sour crude oil |
| | 155.4 | | | | 184.6 | | | | 165.0 | | | | 182.4 | | | | 150.7 | | | | 171.8 | | | | 162.6 | | | ||||||||
| | | | | | | | | | | | | | | | | | |||||||||||||||||||||
Upgraded product (SCO and diesel) |
| | 291.3 | | | | 320.8 | | | | 308.5 | | | | 325.1 | | | | 288.5 | | | | 311.3 | | | | 287.5 | | | ||||||||
| | |||||||||||||||||||||||||||||||||||||
Non-upgraded bitumen |
| | 126.3 | | | | 110.2 | | | | 115.1 | | | | 53.2 | | | | 172.0 | | | | 101.4 | | | | 134.0 | | | ||||||||
| | | | | | | | | | | | | | | | | | |||||||||||||||||||||
Sales |
| | 417.6 | | | | 431.0 | | | | 423.6 | | | | 378.3 | | | | 460.5 | | | | 412.7 | | | | 421.5 | | | ||||||||
| | | | | | | | | | | | | | | | | | |||||||||||||||||||||
Oil Sands operations cash operating costs – Average(1)(B) ($/bbl)* |
| | | | | | | | | | | | | | | | | | | | | | |||||||||||||||
| | |||||||||||||||||||||||||||||||||||||
Cash costs |
| | 26.00 | | | | 25.65 | | | | 26.80 | | | | 27.15 | | | | 22.80 | | | | 26.35 | | | | 23.85 | | | ||||||||
| | |||||||||||||||||||||||||||||||||||||
Natural gas |
| | 2.55 | | | | 0.95 | | | | 1.00 | | | | 2.80 | | | | 1.70 | | | | 1.85 | | | | 1.40 | | | ||||||||
| | | | | | | | | | | | | | | | | | |||||||||||||||||||||
|
| | 28.55 | | | | 26.60 | | | | 27.80 | | | | 29.95 | | | | 24.50 | | | | 28.20 | | | | 25.25 | | | ||||||||
| | | | | | | | | | | | | | | | | | |||||||||||||||||||||
Mining cash operating costs(1)(B) ($/bbl) |
| | | | | | | | | | | | | | | | | | | | | | |||||||||||||||
| | |||||||||||||||||||||||||||||||||||||
Cash costs |
| | 26.00 | | | | 24.70 | | | | 25.55 | | | | 27.80 | | | | 23.65 | | | | 26.00 | | | | 25.20 | | | ||||||||
| | |||||||||||||||||||||||||||||||||||||
Natural gas |
| | 1.00 | | | | 0.20 | | | | 0.30 | | | | 1.00 | | | | 0.35 | | | | 0.60 | | | | 0.35 | | | ||||||||
| | | | | | | | | | | | | | | | | | |||||||||||||||||||||
|
| | 27.00 | | | | 24.90 | | | | 25.85 | | | | 28.80 | | | | 24.00 | | | | 26.60 | | | | 25.55 | | | ||||||||
| | | | | | | | | | | | | | | | | | |||||||||||||||||||||
In Situ cash operating costs(1)(B) ($/bbl) |
| | | | | | | | | | | | | | | | | | | | | | |||||||||||||||
| | |||||||||||||||||||||||||||||||||||||
Cash costs |
| | 6.40 | | | | 6.90 | | | | 7.15 | | | | 6.10 | | | | 5.75 | | | | 6.60 | | | | 6.15 | | | ||||||||
| | |||||||||||||||||||||||||||||||||||||
Natural gas |
| | 3.55 | | | | 1.55 | | | | 1.60 | | | | 3.80 | | | | 2.55 | | | | 2.65 | | | | 2.30 | | | ||||||||
| | | | | | | | | | | | | | | | | | |||||||||||||||||||||
|
| | 9.95 | | | | 8.45 | | | | 8.75 | | | | 9.90 | | | | 8.30 | | | | 9.25 | | | | 8.45 | | | ||||||||
| | | | | | | | | | | | | | | | | | |||||||||||||||||||||
- (B)
- Non-GAAP financial measures. See the Quarterly Operating Metrics Reconciliation and the Operating Summary Information – Non-GAAP Financial Measures section of this Quarterly Report.
See accompanying footnotes and definitions to the quarterly operating summaries.
| | | 2019 FOURTH QUARTER Suncor Energy Inc. 61 |
QUARTERLY OPERATING
SUMMARY (continued)
(unaudited)
| | Three months ended | |
Twelve months ended |
| |||||||||||||||||||||||||||||||||
| Oil Sands | |
Dec 31 2019 |
|
Sep 30 2019 |
|
Jun 30 2019 |
|
Mar 31 2019 |
|
Dec 31 2018 |
|
Dec 31 2019 |
|
Dec 31 2018 |
| ||||||||||||||||||||||
| | | | | | | | | | | | | | | | | | |||||||||||||||||||||
Fort Hills |
| | | | | | | | | | | | | | | | | | | | | | |||||||||||||||
| | |||||||||||||||||||||||||||||||||||||
Bitumen production (mbbls/d) |
| | 87.9 | | | | 85.5 | | | | 89.3 | | | | 78.4 | | | | 98.5 | | | | 85.3 | | | | 67.4 | | | ||||||||
| | |||||||||||||||||||||||||||||||||||||
Internally upgraded bitumen from froth (mbbls/d) |
| | — | | | | — | | | | — | | | | — | | | | — | | | | — | | | | (1.3 | ) | | ||||||||
| | | | | | | | | | | | | | | | | | |||||||||||||||||||||
Total Fort Hills Bitumen Production |
| | 87.9 | | | | 85.5 | | | | 89.3 | | | | 78.4 | | | | 98.5 | | | | 85.3 | | | | 66.1 | | | ||||||||
| | | | | | | | | | | | | | | | | | |||||||||||||||||||||
Bitumen sales (mbbls/d) |
| | 91.8 | | | | 91.6 | | | | 82.0 | | | | 78.7 | | | | 94.6 | | | | 86.1 | | | | 57.3 | | | ||||||||
| | | | | | | | | | | | | | | | | | |||||||||||||||||||||
Fort Hills cash operating costs(1)(B) ($/bbl) * |
| | | | | | | | | | | | | | | | | | | | | | |||||||||||||||
| | |||||||||||||||||||||||||||||||||||||
Cash costs |
| | 27.05 | | | | 23.65 | | | | 21.80 | | | | 27.70 | | | | 23.85 | | | | 24.95 | | | | 30.00 | | | ||||||||
| | |||||||||||||||||||||||||||||||||||||
Natural gas |
| | 1.60 | | | | 0.60 | | | | 0.70 | | | | 1.90 | | | | 1.00 | | | | 1.20 | | | | 1.20 | | | ||||||||
| | | | | | | | | | | | | | | | | | |||||||||||||||||||||
|
| | 28.65 | | | | 24.25 | | | | 22.50 | | | | 29.60 | | | | 24.85 | | | | 26.15 | | | | 31.20 | | | ||||||||
| | | | | | | | | | | | | | | | | | |||||||||||||||||||||
Syncrude |
| | | | | | | | | | | | | | | | | | | | | | |||||||||||||||
| | |||||||||||||||||||||||||||||||||||||
Sweet SCO production (mbbls/d) |
| | 156.3 | | | | 162.3 | | | | 188.7 | | | | 182.2 | | | | 209.6 | | | | 172.3 | | | | 144.2 | | | ||||||||
| | | | | | | | | | | | | | | | | | |||||||||||||||||||||
Bitumen production (mbbls/d) |
| | 188.5 | | | | 194.4 | | | | 228.5 | | | | 210.6 | | | | 240.7 | | | | 205.4 | | | | 172.0 | | | ||||||||
| | |||||||||||||||||||||||||||||||||||||
Intermediate sour SCO (mbbls/d)(2) |
| | 159.1 | | | | 165.3 | | | | 191.4 | | | | 186.0 | | | | 206.3 | | | | 175.6 | | | | 143.0 | | | ||||||||
| | | | | | | | | | | | | | | | | | |||||||||||||||||||||
Syncrude cash operating costs(1)(B) ($/bbl)* |
| | | | | | | | | | | | | | | | | | | | | | |||||||||||||||
| | |||||||||||||||||||||||||||||||||||||
Cash costs |
| | 38.30 | | | | 39.80 | | | | 34.40 | | | | 35.55 | | | | 30.85 | | | | 36.85 | | | | 46.15 | | | ||||||||
| | |||||||||||||||||||||||||||||||||||||
Natural gas |
| | 1.55 | | | | 0.70 | | | | 0.50 | | | | 1.50 | | | | 0.90 | | | | 1.10 | | | | 1.10 | | | ||||||||
| | | | | | | | | | | | | | | | | | |||||||||||||||||||||
|
| | 39.85 | | | | 40.50 | | | | 34.90 | | | | 37.05 | | | | 31.75 | | | | 37.95 | | | | 47.25 | | | ||||||||
| | | | | | | | | | | | | | | | | | |||||||||||||||||||||
- (B)
- Non-GAAP financial measures. See the Quarterly Operating Metrics Reconciliation and the Operating Summary Information – Non-GAAP Financial Measures section of this Quarterly Report.
See accompanying footnotes and definitions to the quarterly operating summaries.
| 62 2019 FOURTH QUARTER Suncor Energy Inc. | | |
QUARTERLY OPERATING
SUMMARY (continued)
(unaudited)
| | Three months ended | |
Twelve months ended |
| |||||||||||||||||||||||||||||||||
| Oil Sands Operating Netbacks (B)(C) | |
Dec 31 2019 |
|
Sep 30 2019 |
|
Jun 30 2019 |
|
Mar 31 2019 |
|
Dec 31 2018 |
|
Dec 31 2019 |
|
Dec 31 2018 |
| ||||||||||||||||||||||
| | | | | | | | | | | | | | | | | | |||||||||||||||||||||
Bitumen ($/bbl) |
| | | | | | | | | | | | | | | | | | | | | | |||||||||||||||
| | |||||||||||||||||||||||||||||||||||||
Average price realized |
| | 43.36 | | | | 48.64 | | | | 54.03 | | | | 48.37 | | | | 7.96 | | | | 48.43 | | | | 30.22 | | | ||||||||
| | |||||||||||||||||||||||||||||||||||||
Royalties |
| | (1.23 | ) | | | (1.98 | ) | | | (2.96 | ) | | | (1.37 | ) | | | (0.06 | ) | | | (1.94 | ) | | | (1.70 | ) | | ||||||||
| | |||||||||||||||||||||||||||||||||||||
Transportation costs |
| | (6.63 | ) | | | (6.43 | ) | | | (5.77 | ) | | | (6.78 | ) | | | (5.53 | ) | | | (6.35 | ) | | | (5.52 | ) | | ||||||||
| | |||||||||||||||||||||||||||||||||||||
Net operating expenses |
| | (9.10 | ) | | | (8.07 | ) | | | (8.86 | ) | | | (8.56 | ) | | | (7.61 | ) | | | (8.68 | ) | | | (7.68 | ) | | ||||||||
| | | | | | | | | | | | | | | | | | |||||||||||||||||||||
Operating netback(B) |
| | 26.40 | | | | 32.16 | | | | 36.44 | | | | 31.66 | | | | (5.24 | ) | | | 31.46 | | | | 15.32 | | | ||||||||
| | | | | | | | | | | | | | | | | | |||||||||||||||||||||
SCO and diesel ($/bbl) |
| | | | | | | | | | | | | | | | | | | | | | |||||||||||||||
| | |||||||||||||||||||||||||||||||||||||
Average price realized |
| | 75.42 | | | | 72.45 | | | | 78.67 | | | | 69.34 | | | | 46.07 | | | | 73.89 | | | | 73.07 | | | ||||||||
| | |||||||||||||||||||||||||||||||||||||
Royalties |
| | (2.02 | ) | | | (2.17 | ) | | | (2.98 | ) | | | (1.38 | ) | | | (0.91 | ) | | | (2.13 | ) | | | (1.63 | ) | | ||||||||
| | |||||||||||||||||||||||||||||||||||||
Transportation costs |
| | (4.49 | ) | | | (4.34 | ) | | | (3.70 | ) | | | (4.44 | ) | | | (3.63 | ) | | | (4.24 | ) | | | (4.10 | ) | | ||||||||
| | |||||||||||||||||||||||||||||||||||||
Net operating expenses – bitumen |
| | (25.77 | ) | | | (22.64 | ) | | | (26.94 | ) | | | (23.87 | ) | | | (23.72 | ) | | | (24.77 | ) | | | (24.04 | ) | | ||||||||
| | |||||||||||||||||||||||||||||||||||||
Net operating expenses – upgrading |
| | (5.77 | ) | | | (5.10 | ) | | | (6.39 | ) | | | (5.11 | ) | | | (6.49 | ) | | | (5.54 | ) | | | (6.32 | ) | | ||||||||
| | | | | | | | | | | | | | | | | | |||||||||||||||||||||
Operating netback(B) |
| | 37.37 | | | | 38.20 | | | | 38.66 | | | | 34.54 | | | | 11.32 | | | | 37.21 | | | | 36.98 | | | ||||||||
| | | | | | | | | | | | | | | | | | |||||||||||||||||||||
Average Oil Sands operations ($/bbl) |
| | | | | | | | | | | | | | | | | | | | | | |||||||||||||||
| | |||||||||||||||||||||||||||||||||||||
Average price realized |
| | 65.72 | | | | 66.36 | | | | 71.98 | | | | 66.39 | | | | 31.84 | | | | 67.63 | | | | 59.46 | | | ||||||||
| | |||||||||||||||||||||||||||||||||||||
Royalties |
| | (1.78 | ) | | | (2.12 | ) | | | (2.98 | ) | | | (1.38 | ) | | | (0.59 | ) | | | (2.09 | ) | | | (1.70 | ) | | ||||||||
| | |||||||||||||||||||||||||||||||||||||
Transportation costs |
| | (5.14 | ) | | | (4.87 | ) | | | (4.26 | ) | | | (4.77 | ) | | | (4.34 | ) | | | (4.76 | ) | | | (4.55 | ) | | ||||||||
| | |||||||||||||||||||||||||||||||||||||
Net operating expenses – bitumen and upgrading |
| | (24.74 | ) | | | (22.71 | ) | | | (26.68 | ) | | | (26.11 | ) | | | (21.78 | ) | | | (25.00 | ) | | | (23.15 | ) | | ||||||||
| | | | | | | | | | | | | | | | | | |||||||||||||||||||||
Operating netback(B) |
| | 34.06 | | | | 36.66 | | | | 38.06 | | | | 34.13 | | | | 5.13 | | | | 35.78 | | | | 30.06 | | | ||||||||
| | | | | | | | | | | | | | | | | | |||||||||||||||||||||
Fort Hills ($/bbl) |
| | | | | | | | | | | | | | | | | | | | | | |||||||||||||||
| | |||||||||||||||||||||||||||||||||||||
Average price realized |
| | 50.77 | | | | 60.51 | | | | 70.71 | | | | 62.92 | | | | 30.57 | | | | 60.86 | | | | 48.48 | | | ||||||||
| | |||||||||||||||||||||||||||||||||||||
Royalties |
| | (1.10 | ) | | | (1.70 | ) | | | (1.27 | ) | | | (1.43 | ) | | | (1.41 | ) | | | (1.37 | ) | | | (1.67 | ) | | ||||||||
| | |||||||||||||||||||||||||||||||||||||
Transportation costs |
| | (9.36 | ) | | | (12.01 | ) | | | (13.61 | ) | | | (12.97 | ) | | | (10.31 | ) | | | (11.90 | ) | | | (10.01 | ) | | ||||||||
| | |||||||||||||||||||||||||||||||||||||
Net operating expenses – bitumen |
| | (25.19 | ) | | | (22.75 | ) | | | (24.43 | ) | | | (25.17 | ) | | | (28.79 | ) | | | (24.35 | ) | | | (30.32 | ) | | ||||||||
| | | | | | | | | | | | | | | | | | |||||||||||||||||||||
Operating netback(B) |
| | 15.12 | | | | 24.05 | | | | 31.40 | | | | 23.35 | | | | (9.94 | ) | | | 23.24 | | | | 6.48 | | | ||||||||
| | | | | | | | | | | | | | | | | | |||||||||||||||||||||
Syncrude ($/bbl) |
| | | | | | | | | | | | | | | | | | | | | | |||||||||||||||
| | |||||||||||||||||||||||||||||||||||||
Average price realized |
| | 72.81 | | | | 74.67 | | | | 79.74 | | | | 68.36 | | | | 48.07 | | | | 73.98 | | | | 70.68 | | | ||||||||
| | |||||||||||||||||||||||||||||||||||||
Royalties |
| | (4.49 | ) | | | (9.17 | ) | | | (12.59 | ) | | | (8.09 | ) | | | (1.53 | ) | | | (8.75 | ) | | | (1.90 | ) | | ||||||||
| | |||||||||||||||||||||||||||||||||||||
Transportation costs |
| | (0.67 | ) | | | (0.60 | ) | | | (0.42 | ) | | | (0.46 | ) | | | (0.36 | ) | | | (0.53 | ) | | | (0.49 | ) | | ||||||||
| | |||||||||||||||||||||||||||||||||||||
Net operating expenses – bitumen and upgrading |
| | (32.65 | ) | | | (33.80 | ) | | | (28.73 | ) | | | (31.53 | ) | | | (28.33 | ) | | | (31.56 | ) | | | (43.81 | ) | | ||||||||
| | | | | | | | | | | | | | | | | | |||||||||||||||||||||
Operating netback(B) |
| | 35.00 | | | | 31.10 | | | | 38.00 | | | | 28.28 | | | | 17.85 | | | | 33.14 | | | | 24.48 | | | ||||||||
| | | | | | | | | | | | | | | | | | |||||||||||||||||||||
- (B)
- Non-GAAP
financial measures. See the Quarterly Operating Metrics Reconciliation and the Operating Summary Information – Non-GAAP Financial
Measures section of this Quarterly Report.
- (C)
- Netbacks are based on sales volumes.
See accompanying footnotes and definitions to the quarterly operating summaries.
| | | 2019 FOURTH QUARTER Suncor Energy Inc. 63 |
QUARTERLY OPERATING
SUMMARY (continued)
(unaudited)
| | Three months ended | |
Twelve months ended |
| |||||||||||||||||||||||||||||||||
| Exploration and Production | |
Dec 31 2019 |
|
Sep 30 2019 |
|
Jun 30 2019 |
|
Mar 31 2019 |
|
Dec 31 2018 |
|
Dec 31 2019 |
|
Dec 31 2018 |
| ||||||||||||||||||||||
| | | | | | | | | | | | | | | | | | |||||||||||||||||||||
Total Sales Volumes (mboe/d) |
| | 113.5 | | | | 92.5 | | | | 106.1 | | | | 111.8 | | | | 83.1 | | | | 106.0 | | | | 102.8 | | | ||||||||
| | | | | | | | | | | | | | | | | | |||||||||||||||||||||
Total Production (mboe/d) |
| | 115.9 | | | | 92.3 | | | | 111.7 | | | | 107.1 | | | | 90.2 | | | | 106.8 | | | | 103.4 | | | ||||||||
| | | | | | | | | | | | | | | | | | |||||||||||||||||||||
Production Volumes |
| | | | | | | | | | | | | | | | | | | | | | |||||||||||||||
| | |||||||||||||||||||||||||||||||||||||
Exploration and Production Canada |
| | | | | | | | | | | | | | | | | | | | | | |||||||||||||||
| | |||||||||||||||||||||||||||||||||||||
East Coast Canada |
| | | | | | | | | | | | | | | | | | | | | | |||||||||||||||
| | |||||||||||||||||||||||||||||||||||||
Terra Nova (mbbls/d) |
| | 8.2 | | | | 13.9 | | | | 11.3 | | | | 13.2 | | | | 9.5 | | | | 11.6 | | | | 11.7 | | | ||||||||
| | |||||||||||||||||||||||||||||||||||||
Hibernia (mbbls/d) |
| | 25.1 | | | | 5.9 | | | | 23.8 | | | | 25.7 | | | | 19.0 | | | | 20.1 | | | | 22.1 | | | ||||||||
| | |||||||||||||||||||||||||||||||||||||
White Rose (mbbls/d) |
| | 8.1 | | | | 6.2 | | | | 3.2 | | | | 1.1 | | | | 3.7 | | | | 4.7 | | | | 6.6 | | | ||||||||
| | |||||||||||||||||||||||||||||||||||||
Hebron (mbbls/d) |
| | 28.2 | | | | 23.6 | | | | 23.6 | | | | 18.3 | | | | 15.7 | | | | 23.5 | | | | 13.0 | | | ||||||||
| | |||||||||||||||||||||||||||||||||||||
North America Onshore (mboe/d) |
| | — | | | | — | | | | — | | | | — | | | | — | | | | — | | | | 0.5 | | | ||||||||
| | | | | | | | | | | | | | | | | | |||||||||||||||||||||
|
| | 69.6 | | | | 49.6 | | | | 61.9 | | | | 58.3 | | | | 47.9 | | | | 59.9 | | | | 53.9 | | | ||||||||
| | | | | | | | | | | | | | | | | | |||||||||||||||||||||
Exploration and Production International |
| | | | | | | | | | | | | | | | | | | | | | |||||||||||||||
| | |||||||||||||||||||||||||||||||||||||
Buzzard (mboe/d) |
| | 26.7 | | | | 29.2 | | | | 35.0 | | | | 36.7 | | | | 27.7 | | | | 31.9 | | | | 34.2 | | | ||||||||
| | |||||||||||||||||||||||||||||||||||||
Golden Eagle (mboe/d) |
| | 9.1 | | | | 8.7 | | | | 8.2 | | | | 10.2 | | | | 10.7 | | | | 9.0 | | | | 12.4 | | | ||||||||
| | | | | | | | | | | | | | | | | | |||||||||||||||||||||
United Kingdom (mboe/d) |
| | 35.8 | | | | 37.9 | | | | 43.2 | | | | 46.9 | | | | 38.4 | | | | 40.9 | | | | 46.6 | | | ||||||||
| | |||||||||||||||||||||||||||||||||||||
Norway – Oda (mboe/d) |
| | 7.8 | | | | 2.7 | | | | 4.0 | | | | 0.2 | | | | — | | | | 3.7 | | | | — | | | ||||||||
| | |||||||||||||||||||||||||||||||||||||
Libya (mbbls/d)(3) |
| | 2.7 | | | | 2.1 | | | | 2.6 | | | | 1.7 | | | | 3.9 | | | | 2.3 | | | | 2.9 | | | ||||||||
| | | | | | | | | | | | | | | | | | |||||||||||||||||||||
|
| | 46.3 | | | | 42.7 | | | | 49.8 | | | | 48.8 | | | | 42.3 | | | | 46.9 | | | | 49.5 | | | ||||||||
| | | | | | | | | | | | | | | | | | |||||||||||||||||||||
Netbacks(B)(C) |
| | | | | | | | | | | | | | | | | | | | | | |||||||||||||||
| | |||||||||||||||||||||||||||||||||||||
East Coast Canada ($/bbl) |
| | | | | | | | | | | | | | | | | | | | | | |||||||||||||||
| | |||||||||||||||||||||||||||||||||||||
Average price realized |
| | 86.07 | | | | 81.25 | | | | 92.42 | | | | 86.16 | | | | 76.19 | | | | 86.62 | | | | 90.04 | | | ||||||||
| | |||||||||||||||||||||||||||||||||||||
Royalties |
| | (13.46 | ) | | | (6.54 | ) | | | (13.65 | ) | | | (19.75 | ) | | | (5.04 | ) | | | (13.62 | ) | | | (13.31 | ) | | ||||||||
| | |||||||||||||||||||||||||||||||||||||
Transportation costs |
| | (1.71 | ) | | | (1.86 | ) | | | (1.94 | ) | | | (1.56 | ) | | | (2.71 | ) | | | (1.76 | ) | | | (2.22 | ) | | ||||||||
| | |||||||||||||||||||||||||||||||||||||
Operating costs |
| | (11.28 | ) | | | (16.49 | ) | | | (10.96 | ) | | | (15.63 | ) | | | (23.71 | ) | | | (13.45 | ) | | | (14.43 | ) | | ||||||||
| | | | | | | | | | | | | | | | | | |||||||||||||||||||||
Operating netback(B) |
| | 59.62 | | | | 56.36 | | | | 65.87 | | | | 49.22 | | | | 44.73 | | | | 57.79 | | | | 60.08 | | | ||||||||
| | | | | | | | | | | | | | | | | | |||||||||||||||||||||
United Kingdom ($/boe) |
| | | | | | | | | | | | | | | | | | | | | | |||||||||||||||
| | |||||||||||||||||||||||||||||||||||||
Average price realized |
| | 82.92 | | | | 77.15 | | | | 90.13 | | | | 85.40 | | | | 85.31 | | | | 84.17 | | | | 89.10 | | | ||||||||
| | |||||||||||||||||||||||||||||||||||||
Transportation costs |
| | (2.23 | ) | | | (1.97 | ) | | | (2.24 | ) | | | (2.22 | ) | | | (2.14 | ) | | | (2.17 | ) | | | (2.18 | ) | | ||||||||
| | |||||||||||||||||||||||||||||||||||||
Operating costs |
| | (8.57 | ) | | | (5.29 | ) | | | (7.08 | ) | | | (5.09 | ) | | | (8.94 | ) | | | (6.43 | ) | | | (6.27 | ) | | ||||||||
| | | | | | | | | | | | | | | | | | |||||||||||||||||||||
Operating netback(B) |
| | 72.12 | | | | 69.89 | | | | 80.81 | | | | 78.09 | | | | 74.23 | | | | 75.57 | | | | 80.65 | | | ||||||||
| | | | | | | | | | | | | | | | | | |||||||||||||||||||||
- (B)
- Non-GAAP
financial measures. See the Quarterly Operating Metrics Reconciliation and the Operating Summary Information – Non-GAAP Financial
Measures section of this Quarterly Report.
- (C)
- Netbacks are based on sales volumes.
See accompanying footnotes and definitions to the quarterly operating summaries.
| 64 2019 FOURTH QUARTER Suncor Energy Inc. | | |
QUARTERLY OPERATING
SUMMARY (continued)
(unaudited)
| | Three months ended | |
Twelve months ended |
| |||||||||||||||||||||||||||||||||
| Refining and Marketing | |
Dec 31 2019 |
|
Sep 30 2019 |
|
Jun 30 2019 |
|
Mar 31 2019 |
|
Dec 31 2018 |
|
Dec 31 2019 |
|
Dec 31 2018 |
| ||||||||||||||||||||||
| | | | | | | | | | | | | | | | | | |||||||||||||||||||||
Refined product sales (mbbls/d) |
| | 534.6 | | | | 572.0 | | | | 508.1 | | | | 542.8 | | | | 530.6 | | | | 539.4 | | | | 527.4 | | | ||||||||
| | |||||||||||||||||||||||||||||||||||||
Crude oil processed (mbbls/d) |
| | 447.5 | | | | 463.7 | | | | 399.1 | | | | 444.9 | | | | 467.9 | | | | 438.9 | | | | 430.8 | | | ||||||||
| | |||||||||||||||||||||||||||||||||||||
Utilization of refining capacity (%) |
| | 97 | | | | 100 | | | | 86 | | | | 96 | | | | 101 | | | | 95 | | | | 93 | | | ||||||||
| | | | | | | | | | | | | | | | | | |||||||||||||||||||||
Refining margin ($/bbl)(B) |
| | 34.80 | | | | 28.35 | | | | 33.45 | | | | 36.35 | | | | 41.50 | | | | 33.15 | | | | 34.50 | | | ||||||||
| | |||||||||||||||||||||||||||||||||||||
Refining operating expense ($/bbl)(B) |
| | 5.05 | | | | 4.90 | | | | 5.90 | | | | 5.60 | | | | 5.45 | | | | 5.35 | | | | 5.35 | | | ||||||||
| | | | | | | | | | | | | | | | | | |||||||||||||||||||||
Eastern North America |
| | | | | | | | | | | | | | | | | | | | | | |||||||||||||||
| | |||||||||||||||||||||||||||||||||||||
Refined product sales (mbbls/d) |
| | | | | | | | | | | | | | | | | | | | | | |||||||||||||||
| | |||||||||||||||||||||||||||||||||||||
Transportation fuels |
| | | | | | | | | | | | | | | | | | | | | | |||||||||||||||
| | |||||||||||||||||||||||||||||||||||||
Gasoline |
| | 121.6 | | | | 122.9 | | | | 114.1 | | | | 120.6 | | | | 117.8 | | | | 119.8 | | | | 117.8 | | | ||||||||
| | |||||||||||||||||||||||||||||||||||||
Distillate |
| | 102.8 | | | | 107.4 | | | | 98.2 | | | | 103.1 | | | | 100.2 | | | | 102.9 | | | | 95.8 | | | ||||||||
| | | | | | | | | | | | | | | | | | |||||||||||||||||||||
Total transportation fuel sales |
| | 224.4 | | | | 230.3 | | | | 212.3 | | | | 223.7 | | | | 218.0 | | | | 222.7 | | | | 213.6 | | | ||||||||
| | |||||||||||||||||||||||||||||||||||||
Petrochemicals |
| | 7.9 | | | | 9.4 | | | | 12.5 | | | | 12.8 | | | | 10.3 | | | | 10.6 | | | | 11.3 | | | ||||||||
| | |||||||||||||||||||||||||||||||||||||
Asphalt |
| | 17.3 | | | | 21.6 | | | | 12.7 | | | | 12.6 | | | | 15.2 | | | | 16.1 | | | | 15.5 | | | ||||||||
| | |||||||||||||||||||||||||||||||||||||
Other |
| | 25.3 | | | | 21.1 | | | | 14.6 | | | | 27.5 | | | | 25.7 | | | | 22.1 | | | | 26.0 | | | ||||||||
| | | | | | | | | | | | | | | | | | |||||||||||||||||||||
Total refined product sales |
| | 274.9 | | | | 282.4 | | | | 252.1 | | | | 276.6 | | | | 269.2 | | | | 271.5 | | | | 266.4 | | | ||||||||
| | | | | | | | | | | | | | | | | | |||||||||||||||||||||
Crude oil supply and refining |
| | | | | | | | | | | | | | | | | | | | | | |||||||||||||||
| | |||||||||||||||||||||||||||||||||||||
Processed at refineries (mbbls/d) |
| | 217.3 | | | | 209.5 | | | | 170.0 | | | | 216.2 | | | | 221.0 | | | | 203.3 | | | | 208.1 | | | ||||||||
| | |||||||||||||||||||||||||||||||||||||
Utilization of refining capacity (%) |
| | 98 | | | | 94 | | | | 77 | | | | 97 | | | | 100 | | | | 92 | | | | 94 | | | ||||||||
| | | | | | | | | | | | | | | | | | |||||||||||||||||||||
Western North America |
| | | | | | | | | | | | | | | | | | | | | | |||||||||||||||
| | |||||||||||||||||||||||||||||||||||||
Refined product sales (mbbls/d) |
| | | | | | | | | | | | | | | | | | | | | | |||||||||||||||
| | |||||||||||||||||||||||||||||||||||||
Transportation fuels |
| | | | | | | | | | | | | | | | | | | | | | |||||||||||||||
| | |||||||||||||||||||||||||||||||||||||
Gasoline |
| | 125.8 | | | | 133.9 | | | | 121.2 | | | | 126.1 | | | | 127.8 | | | | 126.8 | | | | 127.8 | | | ||||||||
| | |||||||||||||||||||||||||||||||||||||
Distillate |
| | 110.9 | | | | 123.4 | | | | 107.9 | | | | 118.7 | | | | 109.5 | | | | 115.2 | | | | 107.6 | | | ||||||||
| | | | | | | | | | | | | | | | | | |||||||||||||||||||||
Total transportation fuel sales |
| | 236.7 | | | | 257.3 | | | | 229.1 | | | | 244.8 | | | | 237.3 | | | | 242.0 | | | | 235.4 | | | ||||||||
| | |||||||||||||||||||||||||||||||||||||
Asphalt |
| | 11.4 | | | | 18.1 | | | | 11.4 | | | | 7.5 | | | | 11.3 | | | | 12.1 | | | | 13.3 | | | ||||||||
| | |||||||||||||||||||||||||||||||||||||
Other |
| | 11.6 | | | | 14.2 | | | | 15.5 | | | | 13.9 | | | | 12.8 | | | | 13.8 | | | | 12.3 | | | ||||||||
| | | | | | | | | | | | | | | | | | |||||||||||||||||||||
Total refined product sales |
| | 259.7 | | | | 289.6 | | | | 256.0 | | | | 266.2 | | | | 261.4 | | | | 267.9 | | | | 261.0 | | | ||||||||
| | | | | | | | | | | | | | | | | | |||||||||||||||||||||
Crude oil supply and refining |
| | | | | | | | | | | | | | | | | | | | | | |||||||||||||||
| | |||||||||||||||||||||||||||||||||||||
Processed at refineries (mbbls/d) |
| | 230.2 | | | | 254.2 | | | | 229.1 | | | | 228.7 | | | | 246.9 | | | | 235.6 | | | | 222.7 | | | ||||||||
| | |||||||||||||||||||||||||||||||||||||
Utilization of refining capacity (%) |
| | 96 | | | | 106 | | | | 95 | | | | 95 | | | | 103 | | | | 98 | | | | 93 | | | ||||||||
| | | | | | | | | | | | | | | | | | |||||||||||||||||||||
- (B)
- Non-GAAP financial measures. See the Quarterly Operating Metrics Reconciliation and the Operating Summary Information – Non-GAAP Financial Measures section of this Quarterly Report.
See accompanying footnotes and definitions to the quarterly operating summaries.
| | | 2019 FOURTH QUARTER Suncor Energy Inc. 65 |
QUARTERLY OPERATING METRICS
RECONCILIATION
(unaudited)
Oil Sands Netbacks(B)
($ millions, except per barrel amounts)
For the quarter ended December 31, 2019 |
Bitumen |
SCO and Diesel |
Oil Sands Operations |
Fort Hills | Syncrude | Other(4) |
Oil Sands Segment |
|||||||||
|
| | | | | | | | | | | | | | | |
Operating revenues |
657 | 2 087 | 2 744 | 646 | 1 063 | (28 | ) | 4 425 | ||||||||
| | ||||||||||||||||
Other income |
— | 7 | 7 | 7 | 65 | 19 | 98 | |||||||||
| | ||||||||||||||||
Purchases of crude oil and products |
(142 | ) | (63 | ) | (205 | ) | (203 | ) | (46 | ) | 8 | (446 | ) | |||
| | ||||||||||||||||
Gross realization adjustment(5) |
(11 | ) | (10 | ) | (21 | ) | (22 | ) | (35 | ) | ||||||
| | | | | | | | | | | | | | | | | |
Gross realizations |
504 | 2,021 | 2,525 | 428 | 1,047 | |||||||||||
| | ||||||||||||||||
Royalties |
(14 | ) | (55 | ) | (69 | ) | (9 | ) | (65 | ) | — | (143 | ) | |||
| | ||||||||||||||||
Transportation |
(77 | ) | (151 | ) | (228 | ) | (83 | ) | (14 | ) | — | (325 | ) | |||
| | ||||||||||||||||
Transportation adjustment(6) |
— | 31 | 31 | 4 | 5 | |||||||||||
| | | | | | | | | | | | | | | | | |
Net transportation expenses |
(77 | ) | (120 | ) | (197 | ) | (79 | ) | (9 | ) | ||||||
| | ||||||||||||||||
Operating, selling and general (OS&G) |
(111 | ) | (1 056 | ) | (1 167 | ) | (248 | ) | (594 | ) | 24 | (1 985 | ) | |||
| | ||||||||||||||||
OS&G adjustment(7) |
6 | 212 | 218 | 35 | 124 | |||||||||||
| | | | | | | | | | | | | | | | | |
Net operating expenses |
(105 | ) | (844 | ) | (949 | ) | (213 | ) | (470 | ) | ||||||
| | | | | | | | | | | | | | | | | |
Gross profit |
308 | 1 002 | 1 310 | 127 | 503 | |||||||||||
| | ||||||||||||||||
Sales volumes (mbbls) |
11 620 | 26 791 | 38 411 | 8 447 | 14 383 | |||||||||||
| | | | | | | | | | | | | | | | | |
Operating netback per barrel |
26.40 | 37.37 | 34.06 | 15.12 | 35.00 | |||||||||||
|
| | | | | | | | | | | | | | | |
For the quarter ended September 30, 2019 |
Bitumen |
SCO and Diesel |
Oil Sands Operations |
Fort Hills | Syncrude | Other(4) |
Oil Sands Segment |
|||||||||
|
| | | | | | | | | | | | | | | |
Operating revenues |
588 | 2 213 | 2 801 | 705 | 1 118 | (23 | ) | 4 601 | ||||||||
| | ||||||||||||||||
Other income |
— | 35 | 35 | — | 7 | 21 | 63 | |||||||||
| | ||||||||||||||||
Purchases of crude oil and products |
(87 | ) | (22 | ) | (109 | ) | (171 | ) | (3 | ) | (1 | ) | (284 | ) | ||
| | ||||||||||||||||
Gross realization adjustment(5) |
(8 | ) | (88 | ) | (96 | ) | (24 | ) | (7 | ) | ||||||
| | | | | | | | | | | | | | | | | |
Gross realizations |
493 | 2 138 | 2 631 | 510 | 1 115 | |||||||||||
| | ||||||||||||||||
Royalties |
(20 | ) | (64 | ) | (84 | ) | (14 | ) | (137 | ) | — | (235 | ) | |||
| | ||||||||||||||||
Transportation |
(65 | ) | (159 | ) | (224 | ) | (105 | ) | (15 | ) | — | (344 | ) | |||
| | ||||||||||||||||
Transportation adjustment(6) |
— | 31 | 31 | 4 | 6 | |||||||||||
| | | | | | | | | | | | | | | | | |
Net transportation expenses |
(65 | ) | (128 | ) | (193 | ) | (101 | ) | (9 | ) | ||||||
| | ||||||||||||||||
OS&G |
(116 | ) | (1 060 | ) | (1 176 | ) | (224 | ) | (629 | ) | 20 | (2 009 | ) | |||
| | ||||||||||||||||
OS&G adjustment(7) |
34 | 242 | 276 | 32 | 125 | |||||||||||
| | | | | | | | | | | | | | | | | |
Net operating expenses |
(82 | ) | (818 | ) | (900 | ) | (192 | ) | (504 | ) | ||||||
| | | | | | | | | | | | | | | | | |
Gross profit |
326 | 1 128 | 1 454 | 203 | 465 | |||||||||||
| | ||||||||||||||||
Sales volumes (mbbls) |
10 139 | 29 503 | 39 642 | 8 428 | 14 930 | |||||||||||
| | | | | | | | | | | | | | | | | |
Operating netback per barrel |
32.16 | 38.20 | 36.66 | 24.05 | 31.10 | |||||||||||
|
| | | | | | | | | | | | | | | |
- (B)
- Non-GAAP financial measures. See the Operating Summary Information – Non-GAAP Financial Measures section of this Quarterly Report.
See accompanying footnotes and definitions to the quarterly operating summaries.
| 66 2019 FOURTH QUARTER Suncor Energy Inc. | | |
QUARTERLY OPERATING METRICS
RECONCILIATION (continued)
(unaudited)
Oil Sands Netbacks(B)
($ millions, except per barrel amounts)
For the quarter ended June 30, 2019 |
Bitumen |
SCO and Diesel |
Oil Sands Operations |
Fort Hills | Syncrude | Other(4) |
Oil Sands Segment |
|||||||||
|
| | | | | | | | | | | | | | | |
Operating revenues |
720 | 2 301 | 3 021 | 760 | 1 380 | (21 | ) | 5 140 | ||||||||
| | ||||||||||||||||
Other (loss) income |
— | — | — | (4 | ) | 18 | (13 | ) | 1 | |||||||
| | ||||||||||||||||
Purchases of crude oil and products |
(144 | ) | (41 | ) | (185 | ) | (208 | ) | (11 | ) | — | (404 | ) | |||
| | ||||||||||||||||
Gross realization adjustment(5) |
(10 | ) | (52 | ) | (62 | ) | (21 | ) | (18 | ) | ||||||
| | | | | | | | | | | | | | | | | |
Gross realizations |
566 | 2 208 | 2 774 | 527 | 1 369 | |||||||||||
| | ||||||||||||||||
Royalties |
(31 | ) | (84 | ) | (115 | ) | (10 | ) | (216 | ) | — | (341 | ) | |||
| | ||||||||||||||||
Transportation |
(60 | ) | (143 | ) | (203 | ) | (105 | ) | (18 | ) | — | (326 | ) | |||
| | ||||||||||||||||
Transportation adjustment(6) |
— | 38 | 38 | 4 | 11 | |||||||||||
| | | | | | | | | | | | | | | | | |
Net transportation expenses |
(60 | ) | (105 | ) | (165 | ) | (101 | ) | (7 | ) | ||||||
| | ||||||||||||||||
OS&G |
(122 | ) | (1 118 | ) | (1 240 | ) | (216 | ) | (625 | ) | 21 | (2 060 | ) | |||
| | ||||||||||||||||
OS&G adjustment(7) |
29 | 182 | 211 | 34 | 132 | |||||||||||
| | | | | | | | | | | | | | | | | |
Net operating expenses |
(93 | ) | (936 | ) | (1 029 | ) | (182 | ) | (493 | ) | ||||||
| | | | | | | | | | | | | | | | | |
Gross profit |
382 | 1 083 | 1 465 | 234 | 653 | |||||||||||
| | ||||||||||||||||
Sales volumes (mbbls) |
10 474 | 28 078 | 38 552 | 7 458 | 17 169 | |||||||||||
| | | | | | | | | | | | | | | | | |
Operating netback per barrel |
36.44 | 38.66 | 38.06 | 31.40 | 38.00 | |||||||||||
|
| | | | | | | | | | | | | | | |
For the quarter ended March 31, 2019 |
Bitumen |
SCO and Diesel |
Oil Sands Operations |
Fort Hills | Syncrude | Other(4) |
Oil Sands Segment |
|||||||||
|
| | | | | | | | | | | | | | | |
Operating revenues |
277 | 2 158 | 2 435 | 627 | 1 143 | (24 | ) | 4 181 | ||||||||
| | ||||||||||||||||
Other income (loss) |
— | 24 | 24 | (41 | ) | (10 | ) | 37 | 10 | |||||||
| | ||||||||||||||||
Purchases of crude oil and products |
(58 | ) | (36 | ) | (94 | ) | (155 | ) | (22 | ) | (2 | ) | (273 | ) | ||
| | ||||||||||||||||
Gross realization adjustment(5) |
12 | (117 | ) | (105 | ) | 15 | 10 | |||||||||
| | | | | | | | | | | | | | | | | |
Gross realizations |
231 | 2 029 | 2 260 | 446 | 1 121 | |||||||||||
| | ||||||||||||||||
Royalties |
(7 | ) | (40 | ) | (47 | ) | (10 | ) | (133 | ) | (8 | ) | (198 | ) | ||
| | ||||||||||||||||
Transportation |
(32 | ) | (156 | ) | (188 | ) | (102 | ) | (8 | ) | — | (298 | ) | |||
| | ||||||||||||||||
Transportation adjustment(6) |
— | 26 | 26 | 10 | (1 | ) | ||||||||||
| | | | | | | | | | | | | | | | | |
Net transportation expenses |
(32 | ) | (130 | ) | (162 | ) | (92 | ) | (9 | ) | ||||||
| | ||||||||||||||||
OS&G |
(58 | ) | (1 083 | ) | (1 141 | ) | (233 | ) | (619 | ) | 20 | (1 973 | ) | |||
| | ||||||||||||||||
OS&G adjustment(7) |
17 | 236 | 253 | 55 | 103 | |||||||||||
| | | | | | | | | | | | | | | | | |
Net operating expenses |
(41 | ) | (847 | ) | (888 | ) | (178 | ) | (516 | ) | ||||||
| | | | | | | | | | | | | | | | | |
Gross profit |
151 | 1 012 | 1 163 | 166 | 463 | |||||||||||
| | ||||||||||||||||
Sales volumes (mbbls) |
4 784 | 29 260 | 34 044 | 7 080 | 16 380 | |||||||||||
| | | | | | | | | | | | | | | | | |
Operating netback per barrel |
31.66 | 34.54 | 34.13 | 23.35 | 28.28 | |||||||||||
|
| | | | | | | | | | | | | | | |
- (B)
- Non-GAAP financial measures. See the Operating Summary Information – Non-GAAP Financial Measures section of this Quarterly Report.
See accompanying footnotes and definitions to the quarterly operating summaries.
| | | 2019 FOURTH QUARTER Suncor Energy Inc. 67 |
QUARTERLY OPERATING METRICS
RECONCILIATION (continued)
(unaudited)
Oil Sands Netbacks(B)
($ millions, except per barrel amounts)
For the quarter ended December 31, 2018 |
Bitumen |
SCO and Diesel |
Oil Sands Operations |
Fort Hills | Syncrude | Other(4) |
Oil Sands Segment |
|||||||||
|
| | | | | | | | | | | | | | | |
Operating revenues |
405 | 1 326 | 1 731 | 508 | 940 | (30 | ) | 3 149 | ||||||||
| | ||||||||||||||||
Other income |
— | 76 | 76 | 111 | 93 | 18 | 298 | |||||||||
| | ||||||||||||||||
Purchases of crude oil and products |
(267 | ) | (16 | ) | (283 | ) | (218 | ) | (14 | ) | — | (515 | ) | |||
| | ||||||||||||||||
Gross realization adjustment(5) |
(12 | ) | (164 | ) | (176 | ) | (136 | ) | (93 | ) | ||||||
| | | | | | | | | | | | | | | | | |
Gross realizations |
126 | 1 222 | 1 348 | 265 | 926 | |||||||||||
| | ||||||||||||||||
Royalties |
(1 | ) | (24 | ) | (25 | ) | (12 | ) | (30 | ) | — | (67 | ) | |||
| | ||||||||||||||||
Transportation |
(88 | ) | (116 | ) | (204 | ) | (106 | ) | (9 | ) | — | (319 | ) | |||
| | ||||||||||||||||
Transportation adjustment(6) |
— | 20 | 20 | 16 | 2 | |||||||||||
| | | | | | | | | | | | | | | | | |
Net transportation expenses |
(88 | ) | (96 | ) | (184 | ) | (90 | ) | (7 | ) | ||||||
| | ||||||||||||||||
OS&G |
(167 | ) | (949 | ) | (1 116 | ) | (291 | ) | (619 | ) | 28 | (1 998 | ) | |||
| | ||||||||||||||||
OS&G adjustment(7) |
47 | 147 | 194 | 41 | 73 | |||||||||||
| | | | | | | | | | | | | | | | | |
Net operating expenses |
(120 | ) | (802 | ) | (922 | ) | (250 | ) | (546 | ) | ||||||
| | | | | | | | | | | | | | | | | |
Gross (loss) profit |
(83 | ) | 300 | 217 | (87 | ) | 343 | |||||||||
| | ||||||||||||||||
Sales volumes (mbbls) |
15 825 | 26 545 | 42 370 | 8 706 | 19 286 | |||||||||||
| | | | | | | | | | | | | | | | | |
Operating netback per barrel |
(5.24 | ) | 11.32 | 5.13 | (9.94 | ) | 17.85 | |||||||||
|
| | | | | | | | | | | | | | | |
For the year ended December 31, 2019 |
Bitumen |
SCO and Diesel |
Oil Sands Operations |
Fort Hills | Syncrude | Other(4) |
Oil Sands Segment |
|||||||||
|
| | | | | | | | | | | | | | | |
Operating revenues |
2 242 | 8 759 | 11 001 | 2 738 | 4 704 | (96 | ) | 18 347 | ||||||||
| | ||||||||||||||||
Other income (loss) |
— | 66 | 66 | (38 | ) | 80 | 64 | 172 | ||||||||
| | ||||||||||||||||
Purchases of crude oil and products |
(431 | ) | (162 | ) | (593 | ) | (737 | ) | (82 | ) | 5 | (1 407 | ) | |||
| | ||||||||||||||||
Gross realization adjustment(5) |
(17 | ) | (267 | ) | (284 | ) | (52 | ) | (50 | ) | ||||||
| | | | | | | | | | | | | | | | | |
Gross realizations |
1 794 | 8 396 | 10 190 | 1 911 | 4 652 | |||||||||||
| | ||||||||||||||||
Royalties |
(72 | ) | (243 | ) | (315 | ) | (43 | ) | (551 | ) | (8 | ) | (917 | ) | ||
| | ||||||||||||||||
Transportation |
(234 | ) | (609 | ) | (843 | ) | (395 | ) | (55 | ) | — | (1 293 | ) | |||
| | ||||||||||||||||
Transportation adjustment(6) |
— | 126 | 126 | 22 | 21 | |||||||||||
| | | | | | | | | | | | | | | | | |
Net transportation expenses |
(234 | ) | (483 | ) | (717 | ) | (373 | ) | (34 | ) | ||||||
| | ||||||||||||||||
OS&G |
(407 | ) | (4 317 | ) | (4 724 | ) | (921 | ) | (2 467 | ) | 85 | (8 027 | ) | |||
| | ||||||||||||||||
OS&G adjustment(7) |
86 | 872 | 958 | 156 | 484 | |||||||||||
| | | | | | | | | | | | | | | | | |
Net operating expenses |
(321 | ) | (3 445 | ) | (3 766 | ) | (765 | ) | (1 983 | ) | ||||||
| | | | | | | | | | | | | | | | | |
Gross profit |
1 167 | 4 225 | 5 392 | 730 | 2 084 | |||||||||||
| | ||||||||||||||||
Sales volumes (mbbls) |
37 017 | 113 632 | 150 649 | 31 413 | 62 862 | |||||||||||
| | | | | | | | | | | | | | | | | |
Operating netback per barrel |
31.46 | 37.21 | 35.78 | 23.24 | 33.14 | |||||||||||
|
| | | | | | | | | | | | | | | |
- (B)
- Non-GAAP financial measures. See the Operating Summary Information – Non-GAAP Financial Measures section of this Quarterly Report.
See accompanying footnotes and definitions to the quarterly operating summaries.
| 68 2019 FOURTH QUARTER Suncor Energy Inc. | | |
QUARTERLY OPERATING METRICS
RECONCILIATION (continued)
(unaudited)
Oil Sands Netbacks(B)
($ millions, except per barrel amounts)
For the year ended December 31, 2018 |
Bitumen |
SCO and Diesel |
Oil Sands Operations |
Fort Hills | Syncrude | Other(4) |
Oil Sands Segment |
|||||||||
|
| | | | | | | | | | | | | | | |
Operating revenues |
2 409 | 8 002 | 10 411 | 1 675 | 3 765 | (108 | ) | 15 743 | ||||||||
| | ||||||||||||||||
Other (loss) income |
(2 | ) | 57 | 55 | 97 | 136 | 99 | 387 | ||||||||
| | ||||||||||||||||
Purchases of crude oil and products |
(893 | ) | (79 | ) | (972 | ) | (555 | ) | (48 | ) | 12 | (1 563 | ) | |||
| | ||||||||||||||||
Gross realization adjustment(5) |
(36 | ) | (306 | ) | (342 | ) | (203 | ) | (133 | ) | ||||||
| | | | | | | | | | | | | | | | | |
Gross realizations |
1 478 | 7 674 | 9 152 | 1 014 | 3 720 | |||||||||||
| | ||||||||||||||||
Royalties |
(84 | ) | (179 | ) | (263 | ) | (35 | ) | (100 | ) | — | (398 | ) | |||
| | ||||||||||||||||
Transportation |
(261 | ) | (542 | ) | (803 | ) | (297 | ) | (44 | ) | — | (1 144 | ) | |||
| | ||||||||||||||||
Transportation adjustment(6) |
— | 113 | 113 | 87 | 18 | |||||||||||
| | | | | | | | | | | | | | | | | |
Net transportation expenses |
(261 | ) | (429 | ) | (690 | ) | (210 | ) | (26 | ) | ||||||
| | ||||||||||||||||
OS&G |
(526 | ) | (3 790 | ) | (4 316 | ) | (832 | ) | (2 523 | ) | 94 | (7 577 | ) | |||
| | ||||||||||||||||
OS&G adjustment(7) |
153 | 604 | 757 | 198 | 226 | |||||||||||
| | | | | | | | | | | | | | | | | |
Net operating expenses |
(373 | ) | (3 186 | ) | (3 559 | ) | (634 | ) | (2 297 | ) | ||||||
| | | | | | | | | | | | | | | | | |
Gross profit |
760 | 3 880 | 4 640 | 135 | 1 297 | |||||||||||
| | ||||||||||||||||
Sales volumes (mbbls) |
48 903 | 104 916 | 153 819 | 20 927 | 52 583 | |||||||||||
| | | | | | | | | | | | | | | | | |
Operating netback per barrel |
15.32 | 36.98 | 30.06 | 6.48 | 24.48 | |||||||||||
|
| | | | | | | | | | | | | | | |
Syncrude Cash Operating Costs(B)
($ millions, except per barrel amounts)
| | Three months ended | |
Twelve months ended |
| |||||||||||||||||||||||||||||||||
| |
Dec 31 2019 |
|
Sept 30 2019 |
|
June 30 2019 |
|
Mar 31 2019 |
|
Dec 31 2018 |
|
Dec 31 2019 |
|
Dec 31 2018 |
| |||||||||||||||||||||||
| | | | | | | | | | | | | | | | | | |||||||||||||||||||||
Syncrude OS&G |
| | 594 | | | | 629 | | | | 625 | | | | 619 | | | | 619 | | | | 2 467 | | | | 2 523 | | | ||||||||
| | |||||||||||||||||||||||||||||||||||||
Non-production costs(8) |
| | (20 | ) | | | (24 | ) | | | (26 | ) | | | (12 | ) | | | (7 | ) | | | (82 | ) | | | (33 | ) | | ||||||||
| | | | | | | | | | | | | | | | | | |||||||||||||||||||||
Syncrude cash operating costs |
| | 574 | | | | 605 | | | | 599 | | | | 607 | | | | 612 | | | | 2 385 | | | | 2 490 | | | ||||||||
| | |||||||||||||||||||||||||||||||||||||
Syncrude sales volumes (mbbls) |
| | 14 383 | | | | 14 930 | | | | 17 169 | | | | 16 380 | | | | 19 286 | | | | 62 862 | | | | 52 583 | | | ||||||||
| | | | | | | | | | | | | | | | | | |||||||||||||||||||||
Syncrude cash operating costs ($/bbl) |
| | 39.85 | | | | 40.50 | | | | 34.90 | | | | 37.05 | | | | 31.75 | | | | 37.95 | | | | 47.25 | | | ||||||||
| | | | | | | | | | | | | | | | | | |||||||||||||||||||||
- (B)
- Non-GAAP financial measures. See the Operating Summary Information – Non-GAAP Financial Measures section of this Quarterly Report.
See accompanying footnotes and definitions to the quarterly operating summaries.
| | | 2019 FOURTH QUARTER Suncor Energy Inc. 69 |
QUARTERLY OPERATING METRICS
RECONCILIATION (continued)
(unaudited)
Exploration and Production Netbacks(B)
($ millions, except per barrel amounts)
For the quarter ended December 31, 2019 |
United Kingdom |
East Coast Canada |
Other(9) |
E&P Segment |
||||||
|
| | | | | | | | | |
Operating revenues |
327 | 532 | 139 | 998 | ||||||
| | ||||||||||
Royalties |
— | (83 | ) | (87 | ) | (170 | ) | |||
| | ||||||||||
Transportation |
(10 | ) | (10 | ) | (1 | ) | (21 | ) | ||
| | ||||||||||
OS&G |
(40 | ) | (78 | ) | (16 | ) | (134 | ) | ||
| | ||||||||||
Non-production costs(10) |
6 | 8 | ||||||||
| | | | | | | | | | | |
Gross realizations |
283 | 369 | ||||||||
| | ||||||||||
Sales volumes (mboe) |
4 013 | 6 176 | ||||||||
| | | | | | | | | | | |
Operating netback per barrel |
72.12 | 59.62 | ||||||||
|
| | | | | | | | | |
For the quarter ended September 30, 2019 |
United Kingdom |
East Coast Canada |
Other(9) |
E&P Segment |
||||||
|
| | | | | | | | | |
Operating revenues |
269 | 393 | 84 | 746 | ||||||
| | ||||||||||
Royalties |
— | (32 | ) | (65 | ) | (97 | ) | |||
| | ||||||||||
Transportation |
(7 | ) | (9 | ) | (3 | ) | (19 | ) | ||
| | ||||||||||
OS&G |
(22 | ) | (93 | ) | (14 | ) | (129 | ) | ||
| | ||||||||||
Non-production costs(10) |
4 | 13 | ||||||||
| | | | | | | | | | | |
Gross realizations |
244 | 272 | ||||||||
| | ||||||||||
Sales volumes (mboe) |
3 488 | 4 832 | ||||||||
| | | | | | | | | | | |
Operating netback per barrel |
69.89 | 56.36 | ||||||||
|
| | | | | | | | | |
For the quarter ended June 30, 2019 |
United Kingdom |
East Coast Canada |
Other(9) |
E&P Segment |
||||||
|
| | | | | | | | | |
Operating revenues |
354 | 507 | 133 | 994 | ||||||
| | ||||||||||
Royalties |
— | (75 | ) | (90 | ) | (165 | ) | |||
| | ||||||||||
Transportation |
(9 | ) | (11 | ) | (1 | ) | (21 | ) | ||
| | ||||||||||
OS&G |
(32 | ) | (69 | ) | (13 | ) | (114 | ) | ||
| | ||||||||||
Non-production costs(10) |
5 | 9 | ||||||||
| | | | | | | | | | | |
Gross realizations |
318 | 361 | ||||||||
| | ||||||||||
Sales volumes (mboe) |
3 923 | 5 489 | ||||||||
| | | | | | | | | | | |
Operating netback per barrel |
80.81 | 65.87 | ||||||||
|
| | | | | | | | | |
- (B)
- Non-GAAP financial measures. See the Operating Summary Information – Non-GAAP Financial Measures section of this Quarterly Report.
See accompanying footnotes and definitions to the quarterly operating summaries.
| 70 2019 FOURTH QUARTER Suncor Energy Inc. | | |
QUARTERLY OPERATING METRICS
RECONCILIATION (continued)
(unaudited)
Exploration and Production Netbacks(B)
($ millions, except per barrel amounts)
For the quarter ended March 31, 2019 |
United Kingdom |
East Coast Canada |
Other(9) |
E&P Segment |
||||||
|
| | | | | | | | | |
Operating revenues |
360 | 491 | 86 | 937 | ||||||
| | ||||||||||
Royalties |
— | (112 | ) | (61 | ) | (173 | ) | |||
| | ||||||||||
Transportation |
(9 | ) | (9 | ) | (1 | ) | (19 | ) | ||
| | ||||||||||
OS&G |
(26 | ) | (106 | ) | (16 | ) | (148 | ) | ||
| | ||||||||||
Non-production costs(10) |
4 | 16 | ||||||||
| | | | | | | | | | | |
Gross realizations |
329 | 280 | ||||||||
| | ||||||||||
Sales volumes (mboe) |
4 217 | 5 693 | ||||||||
| | | | | | | | | | | |
Operating netback per barrel |
78.09 | 49.22 | ||||||||
|
| | | | | | | | | |
For the quarter ended December 31, 2018 |
United Kingdom |
East Coast Canada |
Other(9) |
E&P Segment |
||||||
|
| | | | | | | | | |
Operating revenues |
301 | 286 | 184 | 771 | ||||||
| | ||||||||||
Royalties |
— | (19 | ) | (120 | ) | (139 | ) | |||
| | ||||||||||
Transportation |
(8 | ) | (10 | ) | (1 | ) | (19 | ) | ||
| | ||||||||||
OS&G |
(39 | ) | (101 | ) | (15 | ) | (155 | ) | ||
| | ||||||||||
Non-production costs(10) |
8 | 12 | ||||||||
| | | | | | | | | | | |
Gross realizations |
262 | 168 | ||||||||
| | ||||||||||
Sales volumes (mboe) |
3 531 | 3 758 | ||||||||
| | | | | | | | | | | |
Operating netback per barrel |
74.23 | 44.73 | ||||||||
|
| | | | | | | | | |
- (B)
- Non-GAAP financial measures. See the Operating Summary Information – Non-GAAP Financial Measures section of this Quarterly Report.
See accompanying footnotes and definitions to the quarterly operating summaries.
| | | 2019 FOURTH QUARTER Suncor Energy Inc. 71 |
QUARTERLY OPERATING METRICS
RECONCILIATION (continued)
(unaudited)
Exploration and Production Netbacks(B)
($ millions, except per barrel amounts)
For the year ended December 31, 2019 |
United Kingdom |
East Coast Canada |
Other(9) |
E&P Segment |
||||||
|
| | | | | | | | | |
Operating revenues |
1 310 | 1 923 | 442 | 3 675 | ||||||
| | ||||||||||
Royalties |
— | (302 | ) | (303 | ) | (605 | ) | |||
| | ||||||||||
Transportation |
(35 | ) | (39 | ) | (6 | ) | (80 | ) | ||
| | ||||||||||
OS&G |
(120 | ) | (346 | ) | (59 | ) | (525 | ) | ||
| | ||||||||||
Non-production costs(10) |
19 | 46 | ||||||||
| | | | | | | | | | | |
Gross realizations |
1 174 | 1 282 | ||||||||
| | ||||||||||
Sales volumes (mboe) |
15 641 | 22 190 | ||||||||
| | | | | | | | | | | |
Operating netback per barrel |
75.57 | 57.79 | ||||||||
|
| | | | | | | | | |
For the year ended December 31, 2018 |
United Kingdom |
East Coast Canada |
Other(9) |
E&P Segment |
||||||
|
| | | | | | | | | |
Operating revenues |
1 515 | 1 736 | 618 | 3 869 | ||||||
| | ||||||||||
Royalties |
— | (257 | ) | (395 | ) | (652 | ) | |||
| | ||||||||||
Transportation |
(37 | ) | (43 | ) | (5 | ) | (85 | ) | ||
| | ||||||||||
OS&G |
(129 | ) | (328 | ) | (50 | ) | (507 | ) | ||
| | ||||||||||
Non-production costs(10) |
23 | 50 | ||||||||
| | | | | | | | | | | |
Gross realizations |
1 372 | 1 158 | ||||||||
| | ||||||||||
Sales volumes (mboe) |
17 006 | 19 283 | ||||||||
| | | | | | | | | | | |
Operating netback per barrel |
80.65 | 60.08 | ||||||||
|
| | | | | | | | | |
- (B)
- Non-GAAP financial measures. See the Operating Summary Information – Non-GAAP Financial Measures section of this Quarterly Report.
See accompanying footnotes and definitions to the quarterly operating summaries.
| 72 2019 FOURTH QUARTER Suncor Energy Inc. | | |
QUARTERLY OPERATING METRICS
RECONCILIATION (continued)
(unaudited)
Refining and Marketing(B)
($ millions, except per barrel amounts)
| | Three months ended | |
Twelve months ended |
| |||||||||||||||||||||||||||||
| |
Dec 31 2019 |
|
Sep 30 2019 |
|
Jun 30 2019 |
|
Mar 31 2019 |
|
Dec 31 2018 |
|
Dec 31 2019 |
|
Dec 31 2018 |
| |||||||||||||||||||
| | | | | | | | | | | | | | | | | | |||||||||||||||||
Gross margin(11) |
| | 1 568 | | | | 1 653 | | | | 1 647 | | | | 2 140 | | | | 1 711 | | | 7 008 | | 7 122 | | ||||||||
| | |||||||||||||||||||||||||||||||||
Other income |
| | 33 | | | | 13 | | | | 14 | | | | 15 | | | | 90 | | | 75 | | 68 | | ||||||||
| | |||||||||||||||||||||||||||||||||
Non-refining margin(12) |
| | (54 | ) | | | (353 | ) | | | (326 | ) | | | (587 | ) | | | 115 | | | (1 320 | ) | (1 351 | ) | ||||||||
| | | | | | | | | | | | | | | | | | |||||||||||||||||
Refining margin(B) |
| | 1 547 | | | | 1 313 | | | | 1 335 | | | | 1 568 | | | | 1 916 | | | 5 763 | | 5 839 | | ||||||||
| | |||||||||||||||||||||||||||||||||
Refinery production (mbbls)(13) |
| | 44 422 | | | | 46 239 | | | | 39 901 | | | | 43 143 | | | | 46 145 | | | 173 705 | | 169 138 | | ||||||||
| | | | | | | | | | | | | | | | | | |||||||||||||||||
Refining margin ($/bbl)(B) |
| | 34.80 | | | | 28.35 | | | | 33.45 | | | | 36.35 | | | | 41.50 | | | 33.15 | | 34.50 | | ||||||||
| | | | | | | | | | | | | | | | | | |||||||||||||||||
Last-in, first out (LIFO) adjustment |
| | 7 | | | | (4 | ) | | | 7 | | | | (333 | ) | | | 444 | | | (323 | ) | 337 | | ||||||||
| | | | | | | | | | | | | | | | | | |||||||||||||||||
Adjusted LIFO Refining Margin(B) |
| | 1 554 | | | | 1 309 | | | | 1 342 | | | | 1 235 | | | | 2 360 | | | 5 440 | | 6 176 | | ||||||||
| | | | | | | | | | | | | | | | | | |||||||||||||||||
Adjusted LIFO refining margin ($/bbl)(B) |
| | 34.95 | | | | 28.30 | | | | 33.65 | | | | 28.65 | | | | 51.15 | | | 31.30 | | 36.50 | | ||||||||
| | | | | | | | | | | | | | | | | | |||||||||||||||||
OS&G |
| | 576 |
| | | 531 |
| | | 530 |
| | | 536 |
| | | 538 |
| | 2 173 |
| 2 043 |
| ||||||||
| | |||||||||||||||||||||||||||||||||
Non-refining costs(14) |
| | (352 | ) | | | (305 | ) | | | (295 | ) | | | (294 | ) | | | (288 | ) | | (1 246 | ) | (1 142 | ) | ||||||||
| | | | | | | | | | | | | | | | | | |||||||||||||||||
Refining operating expense |
| | 224 | | | | 226 | | | | 235 | | | | 242 | | | | 250 | | | 927 | | 901 | | ||||||||
| | |||||||||||||||||||||||||||||||||
Refinery production (mbbls)(13) |
| | 44 422 | | | | 46 239 | | | | 39 901 | | | | 43 143 | | | | 46 145 | | | 173 705 | | 169 138 | | ||||||||
| | | | | | | | | | | | | | | | | | |||||||||||||||||
Refining operating expense ($/bbl)(B) |
| | 5.05 | | | | 4.90 | | | | 5.90 | | | | 5.60 | | | | 5.45 | | | 5.35 | | 5.35 | | ||||||||
| | | | | | | | | | | | | | | | | | |||||||||||||||||
- (B)
- Non-GAAP financial measures. See the Operating Summary Information – Non-GAAP Financial Measures section of this Quarterly Report.
See accompanying footnotes and definitions to the quarterly operating summaries.
| | | 2019 FOURTH QUARTER Suncor Energy Inc. 73 |
OPERATING SUMMARY INFORMATION
Non-GAAP Financial Measures
Certain financial measures in this document – namely operating earnings (loss), funds from (used in) operations, return on capital employed (ROCE), Oil Sands operations cash operating costs, Syncrude cash operating costs, Fort Hills cash operating costs, In Situ cash operating costs, mining cash operating costs, refining margin, refining operating expense and netbacks – are not prescribed by generally accepted accounting principles (GAAP). Suncor uses this information to analyze business performance, leverage and liquidity and includes these financial measures because investors may find such measures useful on the same basis. These non-GAAP financial measures do not have any standardized meaning and, therefore, are unlikely to be comparable to similar measures presented by other companies. The additional information should not be considered in isolation or as a substitute for measures of performance prepared in accordance with GAAP.
Operating earnings (loss), Oil Sands operations cash operating costs, and Fort Hills cash operating costs are defined in the Non-GAAP Financial Measures Advisory section and reconciled to GAAP measures in the Consolidated Financial Information and Segment Results and Analysis sections of each respective quarterly Report to Shareholders issued by Suncor in respect of the relevant quarter (Quarterly Reports). Funds from (used in) operations and ROCE are defined and reconciled to GAAP measures in the Non-GAAP Financial Measures Advisory section of each respective Quarterly Report. Refining margin, refining operating expense and Syncrude cash operating costs are defined in the Non-GAAP Financial Measures Advisory section and reconciled to GAAP measures in the Operating Metrics Reconciliation section of each respective Quarterly Report. Netbacks are defined below and are reconciled to GAAP measures in the Operating Metrics Reconciliation section of each respective Quarterly Report. The remainder of the non-GAAP financial measures not otherwise mentioned in this paragraph are defined and reconciled in this Quarterly Report.
Oil Sands Netbacks
Oil Sands operating netbacks are a non-GAAP measure, presented on a crude product and sales barrel basis, and are derived from the Oil Sands segmented statement of net earnings (loss), after adjusting for items not directly attributable to the revenues and costs associated with production and delivery. Management uses Oil Sands operating netbacks to measure crude product profitability on a sales barrel basis.
Exploration and Production (E&P) Netbacks
E&P netbacks are a non-GAAP measure, presented on an asset location and sales barrel basis, and are derived from the E&P segmented statement of net earnings (loss), after adjusting for items not directly attributable to the revenues and costs associated with production and delivery. Management uses E&P netbacks to measure asset profitability by location on a sales barrel basis.
Definitions
- (1)
- Cash
operating costs – Include cash costs that are defined as operating, selling and general expenses (excluding inventory changes and
non-production costs), and are net of operating revenues associated with excess power from cogeneration units. Oil Sands operations cash operating costs (including for In Situ and mining) and Fort
Hills cash operating costs are presented on a production basis by adjusting for inventory impacts, while Syncrude production volumes are equal to sales volumes.
- (2)
- Syncrude's
capacity to upgrade bitumen to an intermediary sour SCO is 350,000 bbls/d.
- (3)
- Effective
2016, Libyan production volumes reflect the company's entitlement share of production sold in the period.
- (4)
- Reflects
non-producing Oil Sands assets and enterprise shared service allocations and recoveries.
- (5)
- Reflects
the impact of items not directly attributed to revenues received from the sale of proprietary crude and net non-proprietary activity at its deemed point of sale.
- (6)
- Reflects
adjustments for expenses or credits not directly related to the transportation of the crude product to its deemed point of sale. For Oil Sands operations bitumen and SCO and
Fort Hills bitumen, the point of sale is at the final customer, whereas Syncrude sweet SCO is deemed to be sold into the sweet synthetic crude oil pool in Edmonton, Alberta. Expenses or credits
adjusted out of the netback transportation line include, but are not limited to, costs associated with the sale of non-proprietary product on pipelines with unutilized capacity under minimum volume
commitment agreements.
- (7)
- Reflects adjustments for general and administrative costs not directly attributed to the production of each crude product type, as well as the revenues associated with excess power from cogeneration units.
| 74 2019 FOURTH QUARTER Suncor Energy Inc. | | |
- (8)
- Reflects
adjustments for operating, selling and general expenses not directly attributable to Syncrude production.
- (9)
- Reflects
other E&P assets, such as North America Onshore, Norway and Libya.
- (10)
- Reflects
adjustments for general and administrative costs not directly attributed to production.
- (11)
- Operating
revenues less purchases of crude oil and products.
- (12)
- Reflects
the gross margin associated with the company's supply, marketing, and ethanol businesses.
- (13)
- Refinery
production is the output of the refining process, and differs from crude oil processed as a result of volumetric adjustments for non-crude feedstock, volumetric gain
associated with the refining process, and changes in unfinished product inventories.
- (14)
- Reflects operating, selling and general costs associated with the company's supply, marketing, and ethanol businesses, as well as certain general and administrative costs not directly attributable to refinery production.
Explanatory Notes
- *
- Users are cautioned that the Oil Sands operations, Fort Hills and Syncrude cash operating costs per barrel measures may not be fully comparable to one another or to similar information calculated by other entities due to differing operations of each entity as well as other entities' respective accounting policy choices.
Abbreviations
| bbl | – barrel | |
bbls/d |
– barrels per day | |
mbbls |
– thousands of barrels | |
mbbls/d |
– thousands of barrels per day | |
boe |
– barrels of oil equivalent | |
boe/d |
– barrels of oil equivalent per day | |
mboe |
– thousands of barrels of oil equivalent | |
mboe/d |
– thousands of barrels of oil equivalent per day | |
SCO |
– synthetic crude oil |
| | | 2019 FOURTH QUARTER Suncor Energy Inc. 75 |
