© 2023 Fannie Mae DRAFT Financial Supplement Q1 2023 May 2, 2023 EXHIBIT 99.2

Q1 2023 Financial Supplement 2© 2023 Fannie Mae DRAFT ▪ Some of the terms and other information in this presentation are defined and discussed more fully in Fannie Mae’s Form 10-Q for the quarter ended March 31, 2023 (“Q1 2023 Form 10-Q”) and Form 10-K for the year ended December 31, 2022 (“2022 Form 10-K”). This presentation should be reviewed together with the Q1 2023 Form 10-Q and the 2022 Form 10-K, which are available at www.fanniemae.com in the “About Us—Investor Relations—SEC Filings” section. Information on or available through the company’s website is not part of this supplement. ▪ Some of the information in this presentation is based upon information from third-party sources such as sellers and servicers of mortgage loans. Although Fannie Mae generally considers this information reliable, Fannie Mae does not independently verify all reported information. ▪ Due to rounding, amounts reported in this presentation may not sum to totals indicated (i.e., 100%), or amounts shown as 100% may not reflect the entire population. ▪ Unless otherwise indicated, data is as of March 31, 2023 or for the first three months of 2023. Data for prior years is as of December 31 or for the full year indicated. ▪ Note references are to endnotes, appearing on pages 22 to 24. ▪ Terms used in presentation CAS: Connecticut Avenue Securities® CIRT™: Credit Insurance Risk Transfer™ CRT: Credit risk transfer DSCR: Weighted-average debt service coverage ratio DTI ratio: Debt-to-income (“DTI”) ratio refers to the ratio of a borrower’s outstanding debt obligations (including both mortgage debt and certain other long-term and significant short-term debts) to that borrower’s reported or calculated monthly income, to the extent the income is used to qualify for the mortgage DUS®: Fannie Mae’s Delegated Underwriting and Servicing program HARP®: Home Affordable Refinance Program®, registered trademarks of the Federal Housing Finance Agency, which allowed eligible Fannie Mae borrowers with high LTV ratio loans to refinance into more sustainable loans LTV ratio: Loan-to-value ratio MSA: Metropolitan statistical area MTMLTV ratio: Mark-to-market loan-to-value ratio, which refers to the current unpaid principal balance of a loan at period end, divided by the estimated current home price at period end OLTV ratio: Origination loan-to-value ratio, which refers to the unpaid principal balance of a loan at the time of origination of the loan, divided by the home price or property value at origination of the loan Refi Plus™: Refi Plus initiative, which offered refinancing flexibility to eligible Fannie Mae borrowers REO: Real estate owned by Fannie Mae because it has foreclosed on the property or obtained the property through a deed-in-lieu of foreclosure TCCA fees: Refers to revenues generated by the 10 basis point guaranty fee increase the company implemented on single-family residential mortgages pursuant to the Temporary Payroll Tax Cut Continuation Act of 2011 (“TCCA”) and as extended by the Infrastructure Investment and Jobs Act, the incremental revenue from which is remitted to Treasury and not retained by the company UPB: Unpaid principal balance

Q1 2023 Financial Supplement 3© 2023 Fannie Mae DRAFTTable of Contents Overview Corporate Financial Highlights 5 Guaranty Book of Business Highlights 6 Interest Income and Liquidity Management 7 Key Market Economic Indicators 8 Single-Family Business Single-Family Highlights 10 Credit Characteristics of Single-Family Conventional Loan Acquisitions 11 Credit Characteristics of Single-Family Conventional Guaranty Book of Business 12 Single-Family Credit Risk Transfer 13 Single-Family Problem Loan Statistics 14 Single-Family Cumulative Default Rates 15 Multifamily Business Multifamily Highlights 17 Credit Characteristics of Multifamily Loan Acquisitions 18 Credit Characteristics of Multifamily Guaranty Book of Business 19 Multifamily Credit Loss and Serious Delinquency Rates 20 Endnotes Endnotes 22

© 2023 Fannie Mae DRAFT Overview

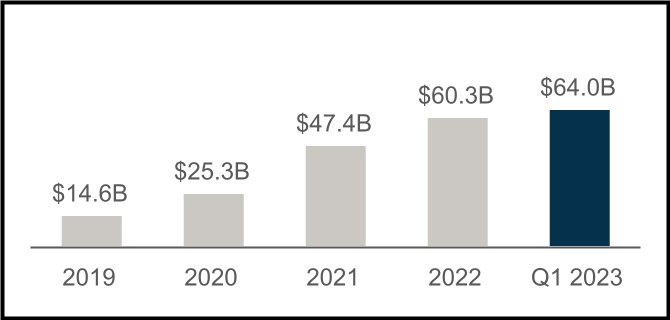
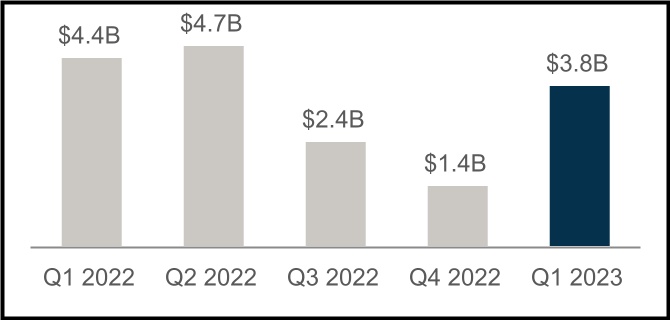
Q1 2023 Financial Supplement 5© 2023 Fannie Mae DRAFT Net income increased $2.3 billion in the first quarter of 2023, compared with the fourth quarter of 2022, primarily driven by a $3.2 billion decrease in provision for credit losses. Net interest income Net interest income decreased $306 million in the first quarter of 2023, compared with the fourth quarter of 2022, primarily driven by a decrease in amortization income partially offset by an increase in income from the other investments portfolio. • Amortization income declined due to the continued higher interest-rate environment in the first quarter of 2023, which continued to slow refinancing activity driving lower loan prepayment volumes. Substantially all of the company's single-family conventional guaranty book of business as of March 31, 2023 had an interest rate below the current market rate, resulting in a low likelihood these loans would refinance at current rates. • Higher income from the other investments portfolio was due to an increase in short-term yields. Provision for credit losses Provision for credit losses was $132 million in the first quarter of 2023, compared with $3.3 billion in the fourth quarter of 2022. The provision for credit losses for the first quarter of 2023 was driven by a multifamily provision, partially offset by a modest single-family credit benefit. • The multifamily provision was primarily due to declines in property values and continued uncertainty related to seniors housing loans, including uncertainty related to adjustable-rate loans, partially offset by a benefit from lower actual and projected interest rates. • The single-family credit benefit was primarily driven by improvements in actual and forecasted home prices, substantially offset by provision on newly acquired loans. Corporate Financial Highlights (Dollars in millions) Q1 2023 Q4 2022 Variance Q1 2022 Variance Net interest income $6,786 $7,092 $(306) $7,399 $(613) Fee and other income 63 43 20 83 (20) Net revenues 6,849 7,135 (286) 7,482 (633) Investment gains (losses), net (67) 26 (93) (102) 35 Fair value gains (losses), net 204 (17) 221 480 (276) Administrative expenses (868) (856) (12) (808) (60) Provision for credit losses (132) (3,283) 3,151 (240) 108 TCCA fees (855) (854) (1) (824) (31) Credit enhancement expense (341) (349) 8 (278) (63) Change in expected credit enhancement recoveries 120 424 (304) 60 60 Other expenses, net(1) (130) (306) 176 (197) 67 Income before federal income taxes 4,780 1,920 2,860 5,573 (793) Provision for federal income taxes (1,008) (494) (514) (1,165) 157 Net income $3,772 $1,426 $2,346 $4,408 $(636) Total comprehensive income $3,772 $1,437 $2,335 $4,401 $(629) Net worth $64,049 $60,277 $3,772 $51,758 $12,291 Net worth ratio(2) 1.5 % 1.4 % 1.2 % Summary of Q1 2023 Financial Results Q1 2023 Key Highlights $3.8 billion Net Income in Q1 2023, with Net Worth Reaching $64.0 billion as of March 31, 2023

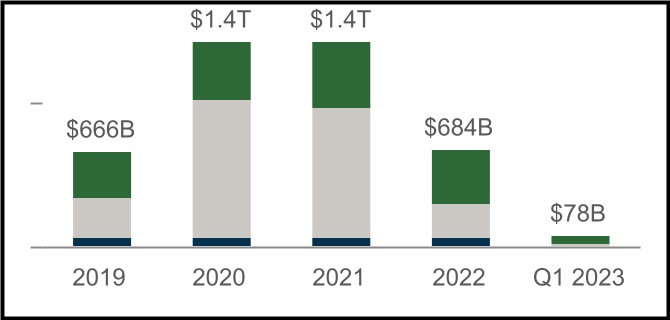
Q1 2023 Financial Supplement 6© 2023 Fannie Mae DRAFT U P B (D ol la rs in tr ill io ns ) $3.3 $3.6 $3.9 $4.1 $4.1 $0.3 $0.4 $0.4 $0.4 $0.4 $3.0 $3.2 $3.5 $3.6 $3.6 2019 2020 2021 2022 Q1 2023 $0.0 $1.0 $2.0 $3.0 $4.0 $5.0 Guaranty Book of Business Highlights Outstanding Guaranty Book of Business at Period End Guaranty Book of Business in a CRT U P B (D ol la rs in b ill io ns ) $70 $76 $69 $69 $283 $948 $904 $237 $313 $411 $451 $378 $666 $1,435 $1,424 $684 $78 2019 2020 2021 2022 Q1 2023 $0 $500 $1,000 $1,500 Single-Family Home Purchases Multifamily Rental Units Single-Family Refinancings Market Liquidity Provided Total liquidity provided in the first quarter of 2023 was $78B Unpaid Principal Balance Units $57B 170K Single-Family Home Purchases $11B 45K Single-Family Refinancings $10B 91K Multifamily Rental Units U P B (D ol la rs in b ill io ns ) $1,425 $1,056 $862 $1,219 $1,279 $84 $101 $112 $113 $111 $1,341 $955 $750 $1,106 $1,168 2019 2020 2021 2022 Q1 2023 $0 $500 $1,000 $1,500 Outstanding UPB of single-family loans in a CRT transaction(24) Outstanding UPB of multifamily loans in a CRT transaction UPB outstanding of single-family conventional guaranty book of business(4) UPB outstanding of multifamily guaranty book of business(5)

Q1 2023 Financial Supplement 7© 2023 Fannie Mae DRAFTInterest Income and Liquidity Management Components of Net Interest Income Net Worth of Fannie Mae Aggregate Indebtedness of Fannie Mae(11) Other Investments Portfolio ("OIP") N et In te re st In co m e (D ol la rs in b ill io ns ) $21.3 $24.9 $29.6 $29.4 $6.8 $9.7 $11.2 $14.2 $16.1 $4.0 $2.4 $2.7 $3.1 $3.3 $0.9 $5.9 $9.1 $11.2 $7.1 $3.3 $1.9 $1.1 $2.9 $1.2 2019 2020 2021 2022 Q1 2023 $0 $10 $20 $30 Base guaranty fee income, net of TCCA(9) Net amortization income(3) Base guaranty fee income related to TCCA Net interest income from portfolios(10) (D ol la rs in b ill io ns ) $14.0 $179.4 $140.7 $131.9 $129.1 $129.8 $183.4 $148.3 $134.9 $139.3 $143.8 Q1 2022 Q2 2022 Q3 2022 Q4 2022 Q1 2023 $0 $50 $100 $150 $200 (D ol la rs in b ill io ns ) $36.3 $41.6 $35.6 $58.0 $60.3 $8.2 $2.0 $10.8 $11.1 $21.5 $80.0 $60.9 $54.7 $46.9 $47.5 $124.5 $104.5 $101.1 $116.0 $129.3 Q1 2022 Q2 2022 Q3 2022 Q4 2022 Q1 2023 $0 $50 $100 $150 Cash and cash equivalents(12) Securities purchased under agreements to resell U.S. Treasury securities Short-term debt Long-term debt (D ol la rs in b ill io ns ) $14.6 $25.3 $47.4 $60.3 $64.0 2019 2020 2021 2022 Q1 2023 $0 $15 $30 $45 $60

Q1 2023 Financial Supplement 8© 2023 Fannie Mae DRAFT R at e (a s of p er io d en d) 3.6% 6.7% 3.9% 3.5% 3.5% 2.6% (1.5)% 5.7% 0.9% 1.1% 2019 2020 2021 2022 Q1 2023 -10% -5% 0% 5% 10% Key Market Economic Indicators 0.67% 1.74% 2.34% 3.47% 1.80% 2.04% 3.49% 5.05% 3.50% 3.17% 4.67% 6.32% 3/31/2020 3/31/2021 3/31/2022 3/31/2023 Top 10 States by UPB(15) State One Year Home Price Growth Rate Q1 2023 Share of Single-Family Conventional Guaranty Book CA (1.4)% 19% TX 2.8% 7% FL 8.2% 6% NY 5.9% 4% WA (4.8)% 4% CO 0.1% 3% NJ 9.2% 3% IL 5.7% 3% VA 6.4% 3% AZ (0.7)% 3% H om e P ric e G ro w th 4.3% 10.4% 18.6% 9.2% 1.0% 2019 2020 2021 2022 Q1 2023 0% 5% 10% 15% 20% Benchmark Interest Rates U.S. GDP Growth (Decline) Rate and Unemployment Rate(14) One Year Home Price Growth Rate Q1 2023(15) United States 4.7% Single-Family Home Price Growth Rate(15) Growth (decline) in GDP U.S. unemployment rate30-year FRM rate(13) 10-year Treasury rate 30-year Fannie Mae MBS par coupon rate State Growth Rate: < (5.00)% (4.99)% to (0.01)% 0.00% to 2.49% 2.50% to 4.99% > 5.00%

© 2023 Fannie Mae DRAFT Single-Family Business

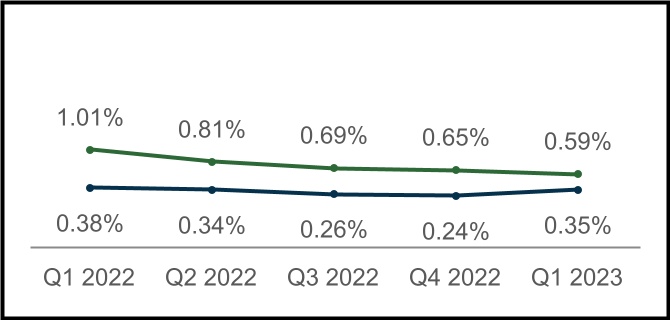
Q1 2023 Financial Supplement 10© 2023 Fannie Mae DRAFT Fannie Mae 31% Freddie Mac 27% Ginnie Mae 35% Private-label securities 7% U P B (D ol la rs in b ill io ns ) $3,525 $3,591 $3,621 $3,632 $3,632 46.0 46.1 46.3 46.5 46.6 Q1 2022 Q2 2022 Q3 2022 Q4 2022 Q1 2023 $0 $1,000 $2,000 $3,000 $4,000 0 10 20 30 40 50 U P B (D ol la rs in b ill io ns ) $104 $111 $92 $71 $57 $135 $61 $26 $14 $11 47.9 49.6 52.1 49.3 51.6 $239 $172 $118 $85 $68 Q1 2022 Q2 2022 Q3 2022 Q4 2022 Q1 2023 $0 $200 $400 0 10 20 30 40 50 Single-Family Highlights Q1 2023 $5,672M Net interest income $(71)M Investment losses, net $166M Fair value gains, net $47M Benefit for credit losses $3,132M Net income Single-Family Conventional Loan Acquisitions(4) Single-Family Conventional Guaranty Book of Business(4) Q1 2023 Single-Family Mortgage-Related Securities Share of Issuances Highlights Refinance Purchase Average charged guaranty fee on new single-family conventional acquisitions, net of TCCA fees (bps)(16) Average single-family conventional guaranty book of business Average charged guaranty fee on single-family conventional guaranty book of business, net of TCCA fees (bps)(16) • Single-family conventional acquisition volume was $67.5 billion in Q1 2023, a decrease of 21% compared with $85.3 billion in Q4 2022. • Purchase acquisition volume, of which more than 45% was for first-time homebuyers, decreased to $56.5 billion in Q1 2023 from $70.8 billion in Q4 2022. • Refinance acquisition volume was $11.0 billion in Q1 2023, a decline from $14.5 billion in Q4 2022, due to the continued higher mortgage interest-rate environment. • Average single-family conventional guaranty book of business in Q1 2023 decreased $322 million from Q4 2022 driven by acquisition volumes being lower than loan paydowns during the quarter. • Single-family serious delinquency rate decreased to 0.59% as of March 31, 2023, from 0.65% as of December 31, 2022.

Q1 2023 Financial Supplement 11© 2023 Fannie Mae DRAFT S ha re o f A cq ui si tio ns 52% 30% 33% 62% 84% 28% 51% 43% 13% 5% 20% 19% 24% 25% 11% 2019 2020 2021 2022 Q1 2023 0% 25% 50% 75% 100% W ei gh te d- A ve ra ge F IC O C re di t S co re FIC O C redit S core < 680 749 760 756 747 751 7.3% 4.0% 6.0% 8.0% 6.0% 2019 2020 2021 2022 Q1 2023 0 200 400 600 800 0% 5% 10% 15% 20% 25% Credit Characteristics of Single-Family Conventional Loan Acquisitions Certain Credit Characteristics of Single-Family Conventional Loans by Acquisition Period Q1 2023 Acquisition Credit Profile by Certain Loan Features Categories are not mutually exclusive Q1 2022 Q2 2022 Q3 2022 Q4 2022 Full Year 2022 Q1 2023 OLTV Ratio >95% Home- Ready®(18) FICO Credit Score < 680(7) DTI Ratio > 43%(17) Total UPB (Dollars in billions) $239.5 $172.3 $117.7 $85.3 $614.8 $67.5 $4.1 $2.7 $4.2 $25.4 Weighted-Average OLTV Ratio 71% 75% 78% 78% 75% 79% 97% 88% 72% 80% OLTV Ratio > 95% 4% 5% 6% 6% 5% 6% 100% 32% 3% 7% Weighted-Average FICO® Credit Score(7) 748 746 746 749 747 751 745 747 656 746 FICO Credit Score < 680(7) 9% 9% 8% 7% 8% 6% 3% 7% 100% 7% DTI Ratio > 43%(17) 29% 32% 35% 37% 32% 38% 41% 57% 41% 100% Fixed-rate 99% 99% 98% 98% 99% 98% 100% 100% 99% 98% Primary Residence 90% 91% 91% 91% 91% 91% 100% 100% 96% 92% HomeReady®(18) 2% 3% 3% 4% 3% 4% 21% 100% 4% 6% W ei gh te d- A ve ra ge O LT V R at io O rigination LTV > 95% 76% 71% 69% 75% 79% 6.6% 2.0% 3.0% 5.0% 6.0% 2019 2020 2021 2022 Q1 2023 0% 20% 40% 60% 80% 100% 0% 5% 10% 15% 20% 25% Origination Loan-to-Value Ratio FICO Credit Score(7) Acquisitions by Loan Purpose Weighted-Average OLTV Ratio % OLTV > 95% Weighted-Average FICO Credit Score % FICO Credit Score < 680 Cash-out Refinance Purchase Other Refinance

Q1 2023 Financial Supplement 12© 2023 Fannie Mae DRAFT S er io us D el in qu en cy R at e (% ) 0.66% 2.87% 1.25% 0.65% 0.59% 2019 2020 2021 2022 Q1 2023 0% 1% 2% 3% Certain Credit Characteristics of Single-Family Conventional Guaranty Book of Business by Origination Year and Loan Features(4)(20) As of March 31, 2023 Origination Year Certain Loan Features Categories are not mutually exclusive Overall Book 2008 & Earlier 2009-2019 2020 2021 2022 2023 OLTV Ratio > 95% Home- Ready®(18) FICO Credit Score < 680(7) Refi Plus Including HARP(19) DTI Ratio > 43%(17) Total UPB (Dollars in billions) $3,628.4 $72.5 $929.7 $914.4 $1,148.6 $520.8 $42.4 $169.5 $107.9 $286.6 $120.3 $882.0 Average UPB $206,288 $78,114 $137,129 $248,650 $267,160 $294,696 $308,926 $173,940 $179,641 $161,199 $102,038 $227,560 Share of SF Conventional Guaranty Book 100% 2% 26% 25% 32% 14% 1% 5% 3% 8% 3% 25% Loans in Forbearance by UPB(21) 0.3% 0.6% 0.3% 0.2% 0.3% 0.3% 0.0% 0.5% 0.5% 1.0% 0.3% 0.5% Share of Loans with Credit Enhancement(22) 43% 9% 47% 32% 52% 41% 43% 84% 82% 40% 40% 48% Serious Delinquency Rate(8) 0.59% 2.48% 0.76% 0.27% 0.32% 0.27% 0.00% 1.39% 1.04% 2.25% 0.81% 0.91% Weighted-Average OLTV Ratio 72% 75% 75% 71% 70% 76% 79% 102% 87% 74% 85% 75% OLTV Ratio > 95% 5% 9% 7% 3% 3% 5% 6% 100% 34% 7% 28% 6% Weighted-Average Mark-to-Market LTV Ratio(6) 53% 31% 37% 51% 58% 73% 79% 68% 67% 51% 32% 56% Weighted-Average FICO Credit Score(7) 752 697 747 762 755 747 752 735 742 652 727 741 FICO Credit Score < 680(7) 8% 38% 11% 4% 7% 9% 6% 11% 9% 100% 23% 11% Credit Characteristics of Single-Family Conventional Guaranty Book of Business W ei gh te d- A ve ra ge F IC O C re di t S co re FIC O C redit S core < 680 746 750 753 752 752 10.5% 9.0% 8.1% 9.0% 8.0% 2019 2020 2021 2022 Q1 2023 0 200 400 600 800 0% 5% 10% 15% 20% 25% W ei gh te d- A ve ra ge M TM LT V 57% 58% 54% 52% 53% 0.3% 0.1% 0.0%* 0.1% 0.2% 2019 2020 2021 2022 Q1 2023 0% 10% 20% 30% 40% 50% 60% 70% 0% 0.5% 1% 1.5% 2% Mark-to-Market Loan-to-Value (MTMLTV) Ratio(6) FICO Credit Score(7) SDQ Rate(8) % MTMLTV > 100% Weighted-Average MTMLTV * Represents less than 0.05% of MTMLTV > 100% % FICO Credit Score < 680 Weighted-Average FICO Credit Score

Q1 2023 Financial Supplement 13© 2023 Fannie Mae DRAFT U P B (D ol la rs in b ill io ns ) $102 $86 $82 $67 $63 $213 $44 $265 $206 $290 $58 $142 $322 $43 $44 $45 $73 $57 $410 $338 $445 $182 $205 $535 $87 2017 2018 2019 2020 2021 2022 Q1 2023 $0 $200 $400 $600 Single-Family Credit Risk Transfer U P B (D ol la rs in b ill io ns ) $906 $1,018 $1,112 $1,106 $1,16825% 28% 31% 31% 32% Q1 2022 Q2 2022 Q3 2022 Q4 2022 Q1 2023 $0 $500 $1,000 $1,500 0% 10% 20% 30% 40% 2021 2022 Q1 2023 Credit Enhancement Outstanding UPB (Dollars in billions) Outstanding UPB % of Book(27) Outstanding Outstanding UPB % of Book(27) Outstanding Outstanding UPB % of Book(27) Outstanding Primary mortgage insurance and other(25) $697 20% $754 21% $753 21% Connecticut Avenue Securities(26) 512 14 726 20 754 21 Credit Insurance Risk Transfer(24) 168 5 323 9 358 10 Lender risk-sharing(26) 70 2 57 2 56 1 Less: loans covered by multiple credit enhancements (253) (7) (351) (10) (355) (10) Total single-family loans with credit enhancement $1,194 34% $1,509 42% $1,566 43% Single-Family Credit Risk Transfer Issuance Single-Family Credit Risk Transfer Single-Family Loans with Credit Enhancement % Single-family conventional guaranty book of business in a CRT transaction Outstanding UPB of single-family loans in a CRT transaction(24) Lender risk-sharing Connecticut Avenue Securities Credit Insurance Risk Transfer

Q1 2023 Financial Supplement 14© 2023 Fannie Mae DRAFT U P B (D ol la rs in b ill io ns ) N um ber of Loan W orkouts $7.7 $5.3 $8.4 $16.6 $56.0 $62.1 $18.4 $3.7 56.3K 299.2K 342.7K 167.3K 26.9K 2019 2020 2021 2022 Q1 2023 $0 $25 $50 $75 $100 $125 0K 50K 100K 150K 200K 250K 300K R E O E nd in g In ve nt or y (U ni ts in th ou sa nd s) 18 8 7 9 9 2019 2020 2021 2022 Q1 2023 0 10 20 30 Single-Family Problem Loan Statistics State Serious Delinquency Rate(8) Average Months to Foreclosure(28) CA 0.43% 26 TX 0.63% 33 FL 0.81% 49 NY 1.02% 78 WA 0.38% 50 CO 0.37% 17 NJ 0.76% 53 IL 0.79% 31 VA 0.41% 25 AZ 0.43% 18 Single-Family Serious Delinquency Rate by State as of March 31, 2023(8) Top 10 States by UPB Single-Family Loan Workouts Single-Family REO Ending Inventory Less than 0.50% 1.00% to 1.99% 0.50% to 0.99% 2.00% and above Other(29) Total Loan Workouts Modifications(30) Payment Deferrals $71.4 $62.9 $9.3 $35.3 $5.8 State SDQ Rate:

Q1 2023 Financial Supplement 15© 2023 Fannie Mae DRAFT Time Since Beginning of Origination Year C um ul at iv e D ef au lt R at e 2004* 2005* 2006* 2007* 2008* 2009** 2010** 2011** 2012** 2013** 2014** 2015** 2016** 2017** 2018** 2019** 2020** 2021** 2022** 2023** Y r1 Y r2 Y r3 Y r4 Y r5 Y r6 Y r7 Y r8 Y r9 Y r1 0 Y r1 1 Y r1 2 Y r1 3 Y r1 4 Y r 1 5 Y r 1 6 Y r 1 7 Y r 1 8 Y r 1 9 Y r 2 0 0% 2% 4% 6% 8% 10% 12% 14% 16% 18% Single-Family Cumulative Default Rates Cumulative Default Rates of Single-Family Conventional Guaranty Book of Business by Origination Year(40) * Loans originated prior to 2009 represent only 2% of the single-family conventional guaranty book of business as of March 31, 2023. ** As of March 31, 2023, cumulative default rates on the loans originated in each individual year from 2009-2023 were less than 1%. 2007 2009 2006 201020112012 2004 2008 2005

© 2023 Fannie Mae DRAFT Multifamily Business

Q1 2023 Financial Supplement 17© 2023 Fannie Mae DRAFT U P B (D ol la rs in b ill io ns ) $419.8 $425.7 $429.4 $440.4 $445.4 79.3 79.5 79.0 78.5 78.1 Q1 2022 Q2 2022 Q3 2022 Q4 2022 Q1 2023 $0 $150 $300 $450 0 25 50 75 U P B (D ol la rs in b ill io ns ) $16.0 $18.7 $15.9 $18.6 $10.2 Q1 2022 Q2 2022 Q3 2022 Q4 2022 Q1 2023 $0 $5 $10 $15 $20 $25 Multifamily Highlights Q1 2023 $1,114M Net interest income $15M Fee and other income $(179)M Provision for credit losses $25M Change in expected credit enhancement recoveries $640M Net income Multifamily New Business Volume Multifamily Guaranty Book of Business(5) Multifamily Credit Risk Transfer Highlights U P B (D ol la rs in b ill io ns ) 26.6 25.7 25.3 25.1 25.1 82.4 79.3 89.5 87.7 86.3 26% 25% 27% 26% 25% $109.0 $105.0 $114.8 $112.8 $111.4 Q1 2022 Q2 2022 Q3 2022 Q4 2022 Q1 2023 $0 $25 $50 $75 $100 10% 20% 30% 40% Average charged guaranty fee on multifamily guaranty book of business (in bps) at period end UPB outstanding of multifamily guaranty book of business UPB outstanding of multifamily loans in a Multifamily Connecticut Avenue SecuritiesTM transaction % Multifamily guaranty book in a Multifamily CRT transaction UPB outstanding of multifamily loans in a Multifamily CIRT transaction • New multifamily business volume was $10.2 billion in Q1 2023. • The multifamily guaranty book of business grew by approximately 1% in Q1 2023 to $445.4 billion. The average charged guaranty fee on the multifamily book declined slightly to 78.1 basis points as of March 31, 2023, compared with 78.5 basis points as of December 31, 2022. • The multifamily serious delinquency rate increased to 0.35% as of March 31, 2023, compared with 0.24% as of December 31, 2022, largely driven by a seniors housing portfolio. • The credit profile of the multifamily guaranty book of business, as a whole, is strong. However, the company’s seniors housing loans, especially those that are adjustable-rate mortgages, remain stressed. Approximately 38% of the $16.5 billion seniors housing loans in the company’s multifamily guaranty book of business as of March 31, 2023 were adjustable-rate mortgages, compared with 11% for the entire multifamily guaranty book of business.

Q1 2023 Financial Supplement 18© 2023 Fannie Mae DRAFT S ha re o f A cq ui si tio ns 93% 93% 89% 78% 100% 7% 7% 11% 22% 2019 2020 2021 2022 Q1 2023 0% 20% 40% 60% 80% 100% Credit Characteristics of Multifamily Loan Acquisitions Certain Credit Characteristics of Multifamily Loans by Acquisition Period(5) Categories are not mutually exclusive 2019 2020 2021 2022 Q1 2023 Total UPB (Dollars in billions) $70.2 $76.0 $69.5 $69.2 $10.2 Weighted-Average OLTV Ratio 66% 64% 65% 59% 58% Loan Count 4,113 5,051 4,203 3,572 546 % Lender Recourse(31) 100% 99% 100% 100% 100% % DUS(32) 100% 99% 99% 99% 100% % Full Interest-Only 33% 38% 40% 53% 66% Weighted-Average OLTV Ratio on Full Interest-Only Acquisitions 59% 58% 59% 56% 56% Weighted-Average OLTV Ratio on Non-Full Interest-Only Acquisitions 69% 68% 68% 63% 62% % Partial Interest-Only(33) 56% 50% 50% 39% 28% S ha re o f A cq ui si tio ns 33% 29% 27% 14% 7% 66% 70% 72% 86% 93% 2019 2020 2021 2022 Q1 2023 0% 20% 40% 60% 80% 100% $1.0B $0.5B $0.5B $0.4B $0.4B $0.4B $0.4B $0.3B $0.3B $0.2B Share of Acquisitions: 43.1% Total Top 10 UPB: $4.4B Origination Loan-to-Value Ratio(5) Top 10 MSAs by Q1 2023 Acquisition UPB(5) Acquisitions by Note Type(5) % OLTV ratio less than or equal to 70% % OLTV ratio greater than 70% and less than or equal to 80% % OLTV ratio greater than 80% Fixed-rate Variable-rate Washington D.C Seattle Tampa Houston San Francisco Dallas Nashville Atlanta Chicago New York

Q1 2023 Financial Supplement 19© 2023 Fannie Mae DRAFT Certain Credit Characteristics of Multifamily Guaranty Book of Business by Acquisition Year, Asset Class, or Targeted Affordable Segment(5) As of March 31, 2023 Acquisition Year Asset Class or Targeted Affordable Segment Categories are not mutually exclusive Overall Book 2008 & Earlier 2009-2019 2020 2021 2022 2023 Conventional /Co-op(34) Seniors Housing(34) Student Housing(34) Manufactured Housing(34) Privately Owned with Subsidy(38) Total UPB (Dollars in billions) $445.4 $5.7 $222.7 $71.1 $66.8 $68.9 $10.2 $394.5 $16.5 $14.3 $20.1 $53.2 % of Multifamily Guaranty Book 100% 1% 50% 16% 15% 16% 2% 89% 4% 3% 4% 12% Loan Count 28,036 2,155 13,083 4,663 4,033 3,556 546 25,055 589 577 1,815 3,805 Average UPB (Dollars in millions) $15.9 $2.6 $17.0 $15.2 $16.6 $19.4 $18.7 $15.7 $28.1 $24.8 $11.1 $14.0 Weighted-Average OLTV Ratio 64% 68% 65% 64% 64% 59% 58% 64% 66% 66% 64% 67% Weighted-Average DSCR(36) 2.1 2.6 2.0 2.6 2.4 1.9 1.5 2.2 1.4 1.9 2.3 2.0 % with DSCR < 1.0(36) 3% 6% 5% 2% 1% —%* —% 1% 38% 4% —%* 4% % Fixed rate 89% 22% 92% 95% 91% 78% 100% 91% 62% 79% 92% 85% % Full Interest-Only 39% 32% 33% 39% 41% 54% 66% 41% 14% 33% 29% 28% % Partial Interest-Only(33) 48% 19% 52% 50% 49% 39% 28% 47% 63% 61% 57% 45% % Small Balance Loans(35) 37% 90% 36% 36% 26% 25% 30% 37% 12% 21% 50% 43% % DUS(32) 99% 93% 99% 99% 99% 99% 100% 99% 99% 100% 100% 98% Serious Delinquency Rate(37) 0.35% 0.37% 0.63% 0.12% 0.04% 0.02% —% 0.17% 3.87% 1.57% 0.02% 0.12% % Criticized(41) 6% 13% 9% 3% 3% 4% —% 4% 56% 10% 1% 9% * represents less than 0.5% Credit Characteristics of Multifamily Guaranty Book of Business $37.2B $28.0B $19.7B$17.7B $12.6B $12.2B $11.7B $11.3B $10.8B $10.7B Share of Book of Business: 38.6% Total Top 10 UPB: $171.9B $4.4B $12.1B $18.3B $33.7B $135.3B $182.2B $59.4B Total UPB: $445.4B UPB by Maturity Year As of March 31, 2023(5) Top 10 MSAs by UPB As of March 31, 2023(5) Certain Credit Characteristics of Guaranty Book(5) New York Dallas Phoenix San Francisco Los Angeles Atlanta Seattle Washington D.C. Chicago Houston 2023 2025 2027 - 2029 2024 2026 2030 - 2032 Other W ei gh te d- A ve ra ge D S C R W eighted-A verage O LTV R atio 1.9 2.0 2.1 2.2 2.1 66% 66% 65% 64% 64% 2019 2020 2021 2022 Q1 2023 0.0 1.0 2.0 0% 10% 20% 30% 40% 50% 60% 70% Weighted-Average DSCR(36) Weighted-Average OLTV Ratio

Q1 2023 Financial Supplement 20© 2023 Fannie Mae DRAFT S er io us D el in qu en cy R at e 0.59% 0.24% 0.10% 0.05% 0.07% 0.05% 0.11% 0.06% 0.04% 0.98% 0.42% 0.24% 0.35% 2011 2012 2013 2014 2015 2016 2017 2018 2019 2020 2021 2022 Q1 2023 0.0% 0.2% 0.4% 0.6% 0.8% 1.0% 1.2% 1.4% Multifamily Credit Loss and Serious Delinquency Rates 0.9% 0.3% 0.1% —% * —%* 0.1% 0.6% 0.1% 0.1% 0.1% —%* —% * —% * —%* —%* —% 2008 2009 2010 2011 2012 2013 2014 2015 2016 2017 2018 2019 2020 2021 2022 2023 0% 1% Serious Delinquency Rate(37) Cumulative Total Credit Loss Rate, Net by Acquisition Year Through Q1 2023(39) * Represents less than 0.05% of cumulative total credit loss rate, net by acquisition year

© 2023 Fannie Mae DRAFT Endnotes

Q1 2023 Financial Supplement 22© 2023 Fannie Mae DRAFT (1) Other expenses, net are comprised of debt extinguishment gains and losses, foreclosed property income (expense), gains and losses from partnership investments, housing trust fund expenses, loan subservicing costs, and servicer fees paid in connection with certain loss mitigation activities. (2) Calculated based upon net worth divided by total assets outstanding at the end of the period. (3) Net amortization income refers to the amortization of premiums and discounts on mortgage loans and debt of consolidated trusts. These cost basis adjustments represent the difference between the initial fair value and the carrying value of these instruments as well as upfront fees Fannie Mae receives at the time of loan acquisition. This excludes the amortization of cost basis adjustments resulting from hedge accounting. (4) Single-family conventional loan population consists of: (a) single-family conventional mortgage loans of Fannie Mae and (b) single-family conventional mortgage loans underlying Fannie Mae MBS other than loans underlying Freddie Mac securities that Fannie Mae has resecuritized. It excludes non-Fannie Mae single-family mortgage-related securities held in the retained mortgage portfolio for which Fannie Mae does not provide a guaranty. Conventional refers to mortgage loans and mortgage-related securities that are not guaranteed or insured, in whole or in part, by the U.S. government or one of its agencies. (5) The multifamily guaranty book of business consists of: (a) multifamily mortgage loans of Fannie Mae; (b) multifamily mortgage loans underlying Fannie Mae MBS; and (c) other credit enhancements that the company provided on multifamily mortgage assets. It excludes non-Fannie Mae multifamily mortgage-related securities held in the retained mortgage portfolio for which Fannie Mae does not provide a guaranty. (6) The average estimated mark-to-market LTV ratio is based on the unpaid principal balance of the loan divided by the estimated current value of the property at period end, which the company calculates using an internal valuation model that estimates periodic changes in home value. Excludes loans for which this information is not readily available. (7) FICO credit score is as of loan origination, as reported by the seller of the mortgage loan. (8) Single-family SDQ rate refers to single-family loans that are 90 days or more past due or in the foreclosure process, expressed as a percentage of the company’s single-family conventional guaranty book of business, based on loan count. Single-family SDQ rate for loans in a particular category refers to SDQ loans in the applicable category, divided by the number of loans in the single-family conventional guaranty book of business in that category. (9) Base guaranty fee income, net of TCCA, is interest income from the guaranty book of business excluding the impact of a 10 basis point guaranty fee increase implemented in 2012 pursuant to the Temporary Payroll Tax Cut Continuation Act of 2011 and as extended by the Infrastructure Investment and Jobs Act, the incremental revenue from which is remitted to Treasury and not retained by the company. (10) "Net interest income from portfolios" consists of: interest income from assets held in the company's retained mortgage portfolio and other investments portfolio; interest income from other assets used to support lender liquidity; and interest expense on the company's outstanding corporate debt and Connecticut Avenue Securities® debt. For purposes of this Financial Supplement chart, income (expense) from hedge accounting is included in the "net interest income from portfolios" category; however, the company does not consider income (expense) from hedge accounting to be a component of net interest income from portfolios. The company had $232 million in hedge accounting expense in the first quarter of 2023. (11) Reflects the company's aggregate indebtedness at the end of each period presented measured in unpaid principal balance and excludes effects of cost basis adjustments and debt of consolidated trusts. (12) Cash equivalents are composed of overnight repurchase agreements and U.S. Treasuries, if any, that have a maturity at the date of acquisition of three months or less. (13) Refers to the U.S. weekly average fixed-rate mortgage rate according to Freddie Mac's Primary Mortgage Market Survey®. These rates are reported using the latest available data for a given period. (14) U.S. Gross Domestic Product ("GDP") annual growth (decline) rates for periods prior to 2023 are based on the annual "percentage change from fourth quarter to fourth quarter one year ago" calculated by the Bureau of Economic Analysis and are subject to revision. GDP rate for Q1 2023 is the annualized GDP rate based on the First Quarter 2023 (Advance Estimate) published by the Bureau of Economic Analysis on April 27, 2023. Endnotes

Q1 2023 Financial Supplement 23© 2023 Fannie Mae DRAFT Endnotes (15) Home price estimates are based on purchase transactions in Fannie-Freddie acquisition and public deed data available through the end of March 2023. Including subsequent data may lead to materially different results. Home price growth rate is not seasonally adjusted. UPB estimates are based on data available through the end of March 2023, and the top 10 states are reported by UPB in descending order. One-year home price growth rate is for the 12-month period ending March 31, 2023. (16) Represents, on an annualized basis, the sum of the base guaranty fees charged during the period for the company's single-family conventional guaranty arrangements plus the recognition of any upfront cash payments relating to these guaranty arrangements based on an estimated average life at the time of acquisition. In Q4 2022, the company enhanced the method it uses to estimate average loan life at acquisition. Charged fees reported for prior periods have been updated in this Financial Supplement to reflect this updated methodology. Excludes the impact of a 10 basis point guaranty fee increase implemented pursuant to the TCCA, the incremental revenue from which is remitted to Treasury and not retained by the company. (17) Excludes loans for which this information is not readily available. From time to time, the company revises its guidelines for determining a borrower's DTI ratio. The amount of income reported by a borrower and used to qualify for a mortgage may not represent the borrower's total income; therefore, the DTI ratios reported may be higher than borrowers' actual DTI ratios. (18) Refers to HomeReady® mortgage loans, a low down payment mortgage product offered by the company that is designed for creditworthy low-income borrowers. HomeReady allows up to 97% loan-to-value ratio financing for home purchases. The company offers additional low down payment mortgage products that are not HomeReady loans; therefore, this category is not representative of all high LTV ratio single-family loans acquired or in the single-family conventional guaranty book of business for the periods shown. See the "OLTV Ratio > 95%" category for information on the single-family loans acquired or in the single-family conventional guaranty book of business with origination LTV ratios greater than 95%. (19) "Refi Plus" refers to loans acquired under Fannie Mae's Refi Plus initiative, which offered refinancing flexibility to eligible Fannie Mae borrowers who were current on their loans and who applied prior to the initiative's December 31, 2018 sunset date. Refi Plus had no limits on maximum LTV ratio and provided mortgage insurance flexibilities for loans with LTV ratios greater than 80%. (20) Calculated based on the aggregate unpaid principal balance of single-family loans for each category divided by the aggregate unpaid principal balance of loans in the single-family conventional guaranty book of business. Loans with multiple product features are included in all applicable categories. (21) Consists of loans that are in an active forbearance as of March 31, 2023. (22) Percentage of loans in the single-family conventional guaranty book of business, measured by unpaid principal balance, included in an agreement used to reduce credit risk by requiring collateral, letters of credit, mortgage insurance, corporate guarantees, inclusion in a credit risk transfer transaction reference pool, or other agreement that provides for Fannie Mae's compensation to some degree in the event of a financial loss relating to the loan. (23) Intentionally left blank. (24) Includes mortgage pool insurance transactions covering loans with an unpaid principal balance of approximately $1.3 billion outstanding as of March 31, 2023. (25) Refers to loans included in an agreement used to reduce credit risk by requiring primary mortgage insurance, collateral, letters of credit, corporate guarantees, or other agreements to provide an entity with some assurance that it will be compensated to some degree in the event of a financial loss. Excludes loans covered by credit risk transfer transactions unless such loans are also covered by primary mortgage insurance. (26) Outstanding unpaid principal balance represents the underlying loan balance, which is different from the reference pool balance for CAS and some lender risk-sharing transactions. (27) Based on the unpaid principal balance of the single-family conventional guaranty book of business as of period end. (28) Measured from the borrowers' last paid installment on their mortgages to when the related properties were added to the company's REO inventory for foreclosures completed during the three months ended March 31, 2023. Home Equity Conversion Mortgages insured by the Department of Housing and Urban Development are excluded from this calculation.

Q1 2023 Financial Supplement 24© 2023 Fannie Mae DRAFT (29) Includes repayment plans and foreclosure alternatives. Repayment plans reflect only those plans associated with loans that were 60 days or more delinquent. Beginning with the year ended December 31, 2020, completed forbearance arrangements are excluded. (30) There were approximately 16,200 loans in a trial modification period that was not complete as of March 31, 2023. (31) Represents the percentage of loans with lender risk-sharing agreements in place, measured by unpaid principal balance. (32) Under the Delegated Underwriting and Servicing ("DUS") program, Fannie Mae acquires individual, newly originated mortgages from specially approved DUS lenders using DUS underwriting standards and/or DUS loan documents. Because DUS lenders generally share the risk of loss with Fannie Mae, they are able to originate, underwrite, close and service most loans without a pre-review by the company. (33) Includes any loan that was underwritten with an interest-only term less than the term of the loan, regardless of whether it is currently in its interest-only period. (34) See https://multifamily.fanniemae.com/financing-options for definitions. Loans with multiple product features are included in all applicable categories. (35) Small balance loans refers to multifamily loans with an original unpaid balance of up to $6 million nationwide. (36) Our estimates of current DSCRs are based on the latest available income information covering a 12 month period, from quarterly and annual statements for these properties including the related debt service. When an annual statement is the latest statement available, it is used. When operating statement information is not available, the underwritten DSCR is used. Co-op loans are excluded from this metric. (37) Multifamily serious delinquency rate refers to multifamily loans that are 60 days or more past due, expressed as a percentage of the company’s multifamily guaranty book of business, based on unpaid principal balance. Multifamily serious delinquency rate for loans in a particular category (such as acquisition year, asset class or targeted affordable segment), refers to seriously delinquent loans in the applicable category, divided by the unpaid principal balance of the loans in the multifamily guaranty book of business in that category. (38) The Multifamily Affordable Business Channel focuses on financing properties that are under an agreement that provides long-term affordability, such as properties with rent subsidies or income restrictions. (39) Cumulative net credit loss rate is the cumulative net credit losses (gains) through March 31, 2023 on the multifamily loans that were acquired in the applicable period, as a percentage of the total acquired unpaid principal balance of multifamily loans that were acquired in the applicable period. Net credit losses include expected benefit of freestanding loss-sharing arrangements, primarily multifamily DUS lender risk-sharing transactions. Credit loss rate for 2014 acquisitions was primarily driven by the write-off of a seniors housing portfolio in Q1 2023. (40) Defaults include loan foreclosures, short sales, sales to third parties at the time of foreclosure and deeds-in-lieu of foreclosure. Cumulative Default Rate is the total number of single-family conventional loans in the guaranty book of business originated in the identified year that have defaulted, divided by the total number of single-family conventional loans in the guaranty book of business originated in the identified year. Data as of March 31, 2023 is not necessarily indicative of the ultimate performance of the loans and performance may change, perhaps materially, in future periods. (41) Criticized loans represent loans classified as "Special Mention," "Substandard" or "Doubtful." Loans classified as "Special Mention" refers to loans that are otherwise performing but have potential weaknesses that, if left uncorrected, may result in deterioration in the borrower’s ability to repay in full. Loans classified as "Substandard" have a well-defined weakness that jeopardizes the timely full repayment. "Doubtful" refers to a loan with a weakness that makes collection or liquidation in full highly questionable and improbable based on existing conditions and values. Endnotes