UNITED STATES
SECURITIES AND EXCHANGE COMMISSION
Washington, DC 20549
FORM 8-K
CURRENT REPORT
PURSUANT TO SECTION 13 OR 15(d) OF THE
SECURITIES EXCHANGE ACT OF 1934
Date of Report (Date of earliest event reported): July 17, 2018
OMNICOM GROUP INC.
(Exact Name of Registrant as Specified in its Charter)
New York (State or other jurisdiction |
1-10551 (Commission |
13-1514814 (IRS Employer |
437 Madison Avenue, New York, NY (Address of principal executive offices) |
10022 (Zip Code) |
Registrant’s telephone number, including area code: (212) 415-3600
Not Applicable
(Former name or former address, if changed since last report)
Check the appropriate box below if the Form 8-K filing is intended to simultaneously satisfy the filing obligation of the registrant under any of the following provisions (see General Instruction A.2. below):
¨ | Written communications pursuant to Rule 425 under the Securities Act (17 CFR 230.425) |
¨ | Soliciting material pursuant to Rule 14a-12 under the Exchange Act (17 CFR 240.14a-12) |
¨ | Pre-commencement communications pursuant to Rule 14d-2(b) under the Exchange Act (17 CFR 240.14d-2(b)) |
¨ | Pre-commencement communications pursuant to Rule 13e-4(c) under the Exchange Act (17 CFR 240.13e-4(c)) |
Indicate by check mark whether the registrant is an emerging growth company as defined in Rule 405 of the Securities Act of 1933 (§230.405 of this chapter) or Rule 12b-2 of the Securities Exchange Act of 1934 (§240.12b-2 of this chapter).
Emerging growth company ¨ |
If an emerging growth company, indicate by check mark if the registrant has elected not to use the extended transition period for complying with any new or revised financial accounting standards provided pursuant to Section 13(a) of the Exchange Act. ¨
Item 2.02 Results of Operations and Financial Condition.
On July 17, 2018, Omnicom Group Inc. (“Omnicom” or the “Company”) published an earnings release reporting its financial results for the three and six months ended June 30, 2018. A copy of the earnings release is attached as Exhibit 99.1 hereto and is incorporated by reference herein. Following the publication of the earnings release, Omnicom hosted an earnings call in which its financial results were discussed. The investor presentation materials used for the call are attached as Exhibit 99.2 hereto and are incorporated by reference herein.
On July 17, 2018, Omnicom posted the materials attached as Exhibits 99.1 and 99.2 on its web site (www.omnicomgroup.com).
Certain statements in the exhibits to this Current Report on Form 8-K constitute forward-looking statements, including statements within the meaning of the Private Securities Litigation Reform Act of 1995. In addition, from time to time, the Company or its representatives have made, or may make, forward-looking statements, orally or in writing. These statements may discuss goals, intentions and expectations as to future plans, trends, events, results of operations or financial condition, or otherwise, based on current beliefs of the Company’s management as well as assumptions made by, and information currently available to, the Company’s management. Forward-looking statements may be accompanied by words such as “aim,” “anticipate,” “believe,” “plan,” “could,” “should,” “would,” “estimate,” “expect,” “forecast,” “future,” “guidance,” “intend,” “may,” “will,” “possible,” “potential,” “predict,” “project” or similar words, phrases or expressions. These forward-looking statements are subject to various risks and uncertainties, many of which are outside the Company’s control. Therefore, you should not place undue reliance on such statements. Factors that could cause actual results to differ materially from those in the forward-looking statements include: international, national or local economic conditions that could adversely affect the Company or its clients; losses on media purchases and production costs incurred on behalf of clients; reductions in client spending, a slowdown in client payments and a deterioration in the credit markets; ability to attract new clients and retain existing clients in the manner anticipated; changes in client advertising, marketing and corporate communications requirements; failure to manage potential conflicts of interest between or among clients; unanticipated changes relating to competitive factors in the advertising, marketing and corporate communications industries; ability to hire and retain key personnel; currency exchange rate fluctuations; reliance on information technology systems; changes in legislation or governmental regulations affecting the Company or its clients; risks associated with assumptions the Company makes in connection with its critical accounting estimates and legal proceedings; and the Company’s international operations, which are subject to the risks of currency repatriation restrictions, social or political conditions and regulatory environment. The foregoing list of factors is not exhaustive. You should carefully consider the foregoing factors and the other risks and uncertainties that may affect the Company’s business, including those described under “Risk Factors” in Omnicom's Annual Report on Form 10-K for the year ended December 31, 2017 and other documents filed from time to time with the Securities and Exchange Commission. Except as required under applicable law, the Company does not assume any obligation to update these forward-looking statements.
The foregoing information (including the exhibits hereto) is being furnished and shall not be deemed “filed” for purposes of Section 18 of the Securities Exchange Act of 1934, as amended, or otherwise subject to the liabilities of that section, nor shall it be deemed incorporated by reference in any filing under the Securities Act of 1933, as amended, except as expressly set forth by specific reference in such filing.
Item 9.01. Financial Statements and Exhibits.
(d) Exhibits.
Exhibit |
Description |
99.1 | Earnings release dated July 17, 2018. |
99.2 |
Investor presentation materials dated July 17, 2018. |
SIGNATURES
Pursuant to the requirements of the Securities Exchange Act of 1934, the registrant has duly caused this report to be signed on its behalf by the undersigned hereunto duly authorized.
Omnicom Group Inc. | |||
By: | /s/ Andrew L. Castellaneta | ||
Name: | Andrew L. Castellaneta | ||
Title: | Senior Vice President, | ||
Chief Accounting Officer |
Date: July 17, 2018
2 |
Exhibit 99.1
Omnicom Group Reports Second Quarter and
Year-to-Date
2018 Results
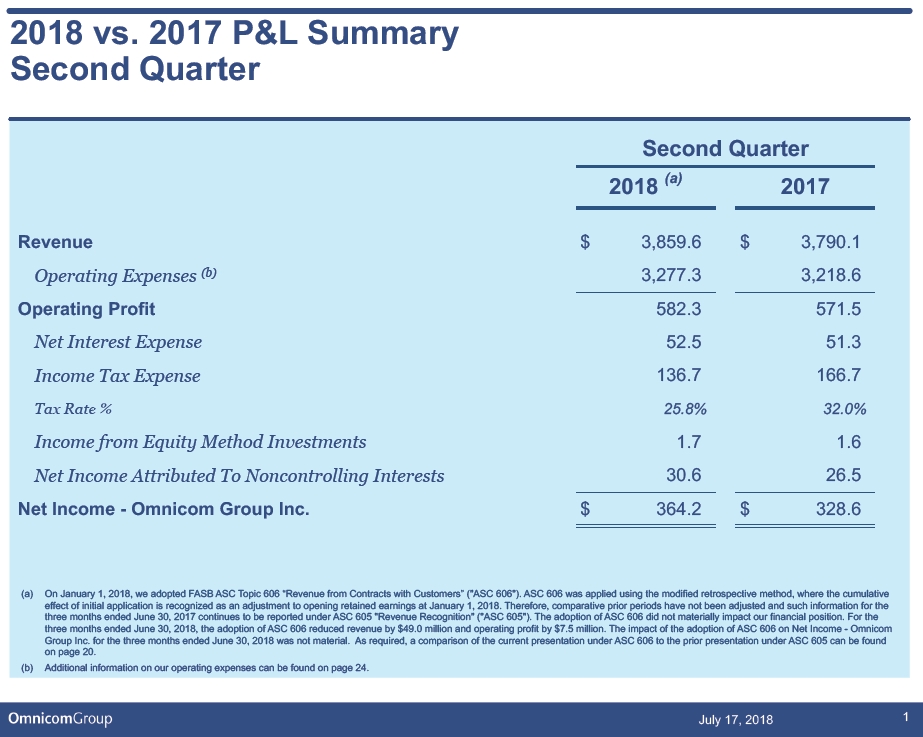
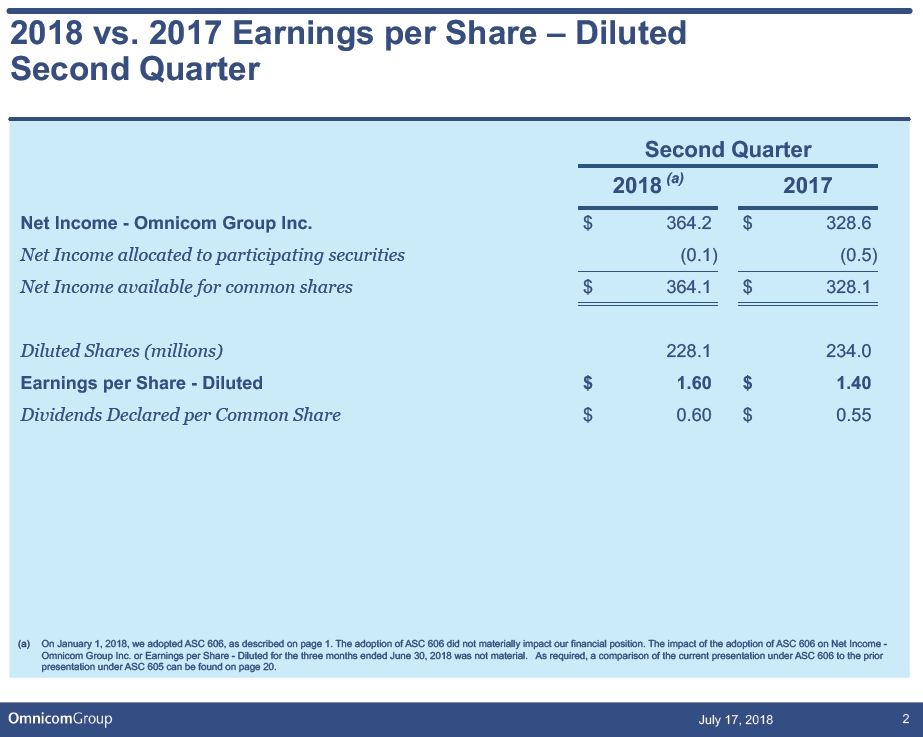
NEW YORK, July 17, 2018 - Omnicom Group Inc. (NYSE: OMC) today announced that its net income for the second quarter of 2018 increased $35.6 million, or 10.8%, to $364.2 million from $328.6 million in the second quarter of 2017. Diluted net income per common share for the second quarter of 2018 increased twenty cents, or 14.3%, to $1.60 per share versus $1.40 per share for the second quarter of 2017.
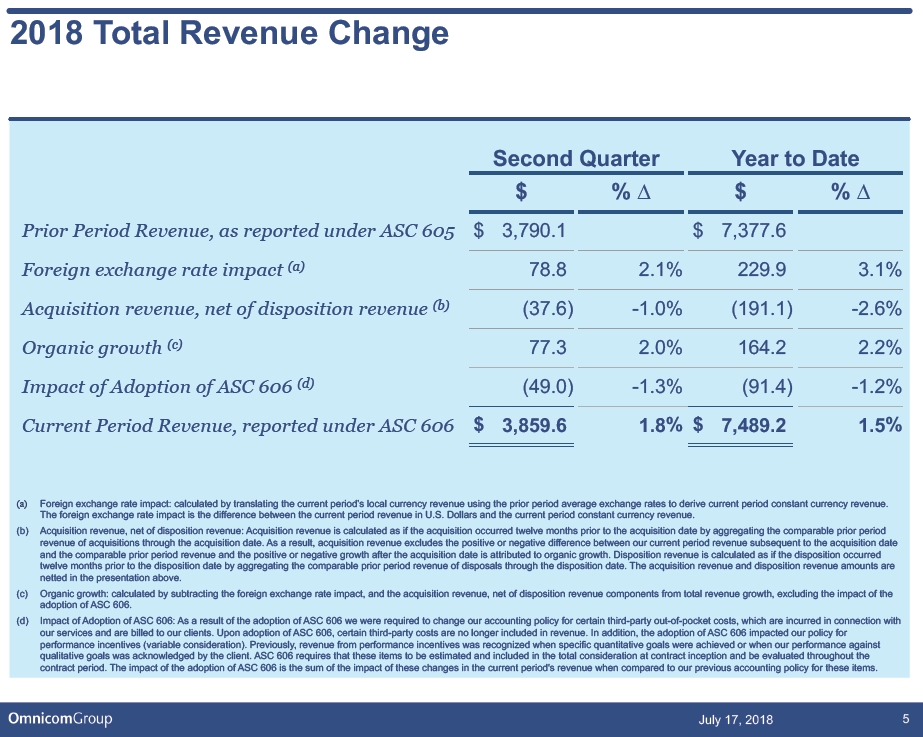
Omnicom’s worldwide revenue in the second quarter of 2018 increased 1.8% to $3,859.6 million from $3,790.1 million in the second quarter of 2017. The components of the change in revenue included an increase in revenue from the positive foreign exchange rate impact of 2.1%, a decrease in acquisition revenue, net of disposition revenue of 1.0% and an increase in revenue from organic growth of 2.0% when compared to the second quarter of 2017. In addition, effective January 1, 2018, we adopted FASB Accounting Standards Codification Topic 606 "Revenue from Contracts with Customers" ("ASC 606"). We elected to adopt ASC 606 applying the modified retrospective method. The effect on revenue in the second quarter of 2018 from adopting ASC 606 when compared to the second quarter of 2017 was a decrease in revenue of 1.3%.
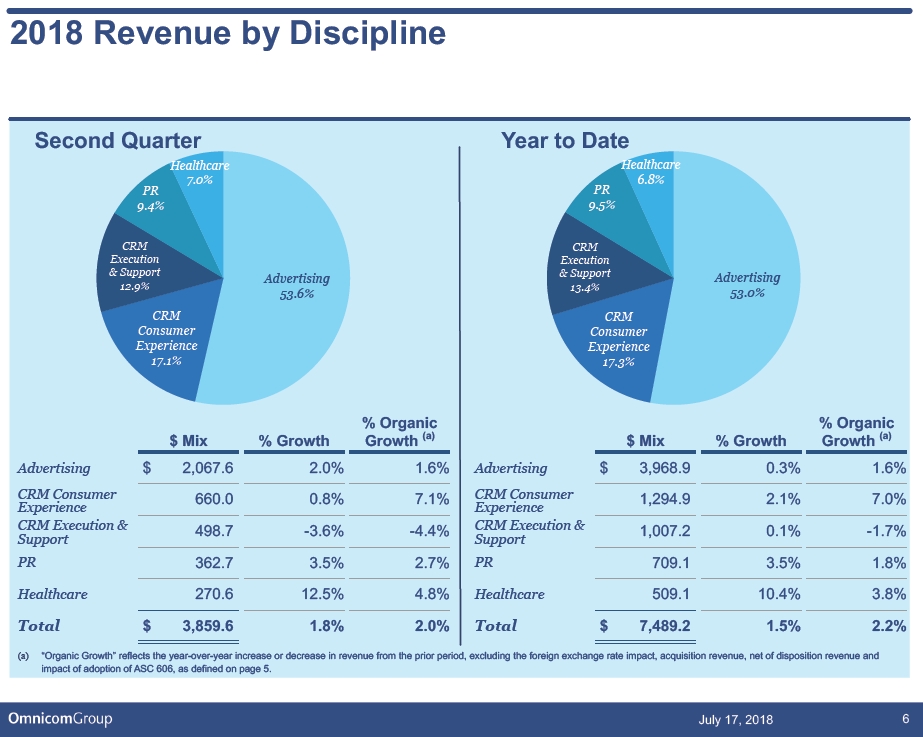
Organic growth in the second quarter of 2018 as compared to the second quarter of 2017 in our fundamental disciplines was as follows: Advertising increased 1.6%, CRM Consumer Experience increased 7.1%, CRM Execution & Support decreased 4.4%, Public Relations increased 2.7% and Healthcare increased 4.8%.
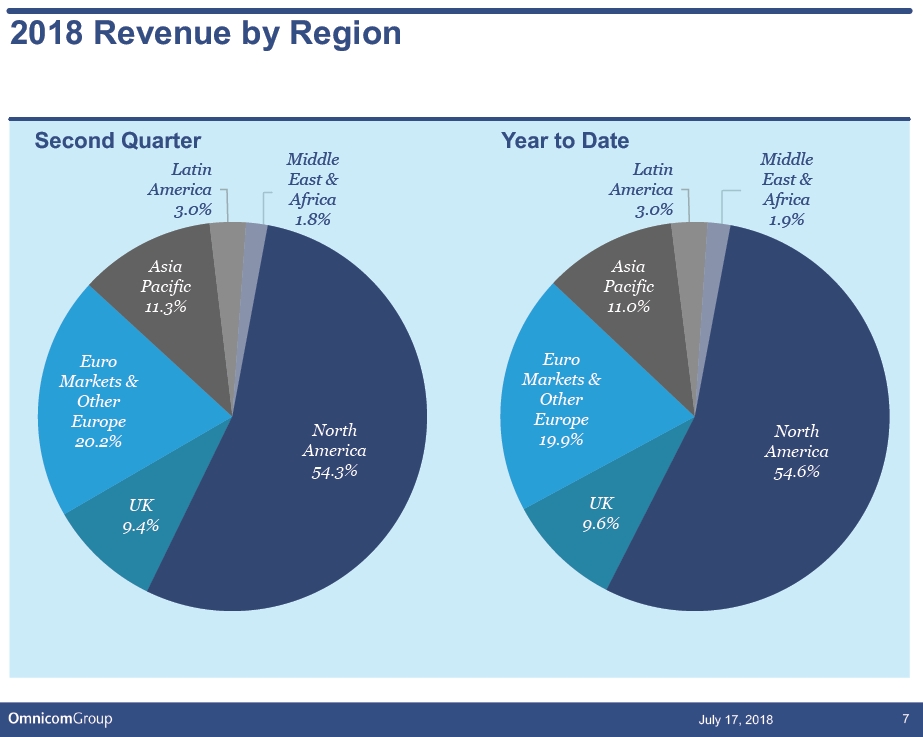
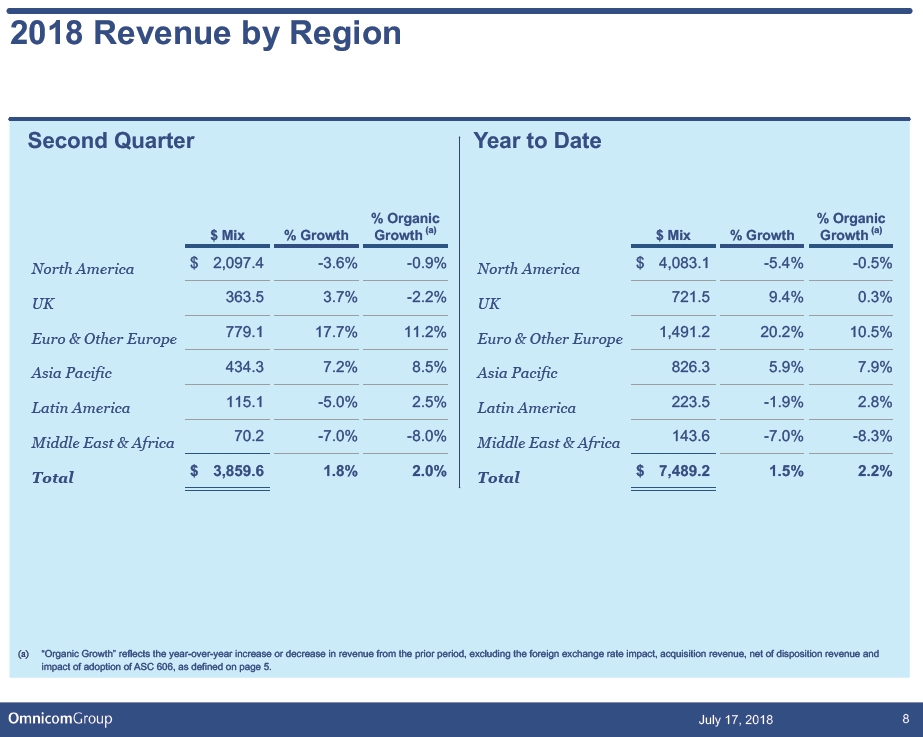
Across our regional markets, organic growth in the second quarter of 2018 as compared to the second quarter of 2017 was 11.2% in the Euro Markets and Other Europe, 8.5% in Asia Pacific and 2.5% in Latin America, while North America decreased 0.9%, the United Kingdom decreased 2.2% and the Middle East and Africa decreased 8.0%.
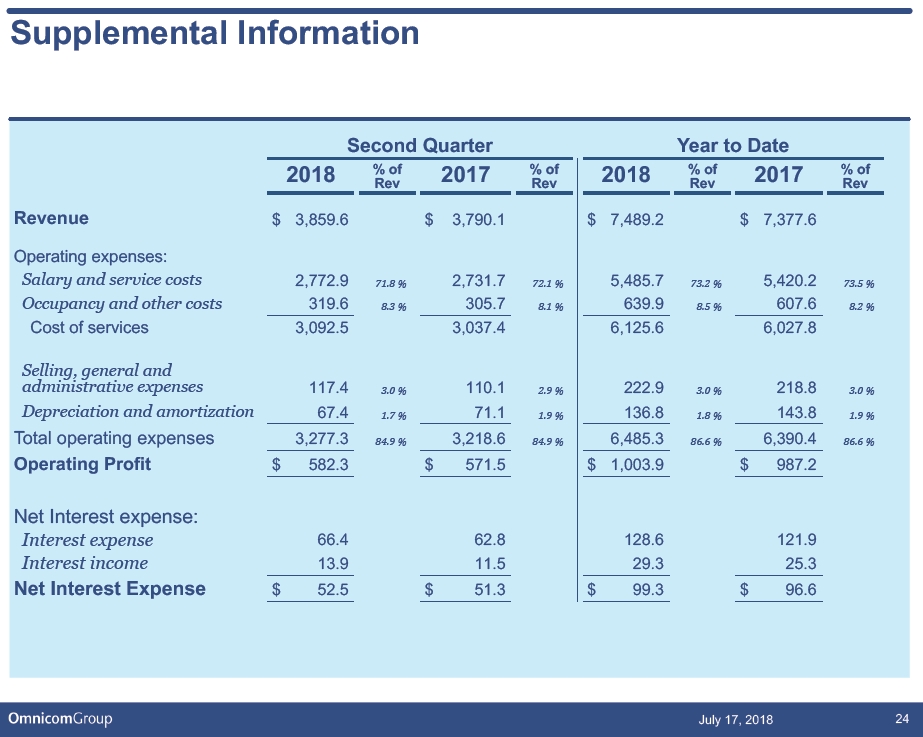
Operating profit in the second quarter of 2018 increased $10.8 million, or 1.9%, to $582.3 million from $571.5 million in the second quarter of 2017. Our operating margin for the second quarter of 2018 of 15.1% was unchanged when compared to
437 Madison Avenue, New York, New York 10022 (212) 415-3600 Fax (212) 415-3530
Omnicom Group Inc.
the second quarter of 2017. The impact from adopting ASC 606 reduced operating profit by $7.5 million during the second quarter of 2018.
For the second quarter of 2018, our income tax rate was 25.8% compared to 32.0% for the same period in 2017. The year over year difference in our effective tax rate primarily resulted from the enactment of the Tax Cuts and Jobs Act (the "2017 Tax Act"), which reduced the U.S. Federal statutory tax rate from 35% to 21%. In addition, the decrease in the effective tax rate reflects a reduction in the expected incremental U.S. tax applied against Omnicom's overall foreign earnings of $12 million.
Full Year
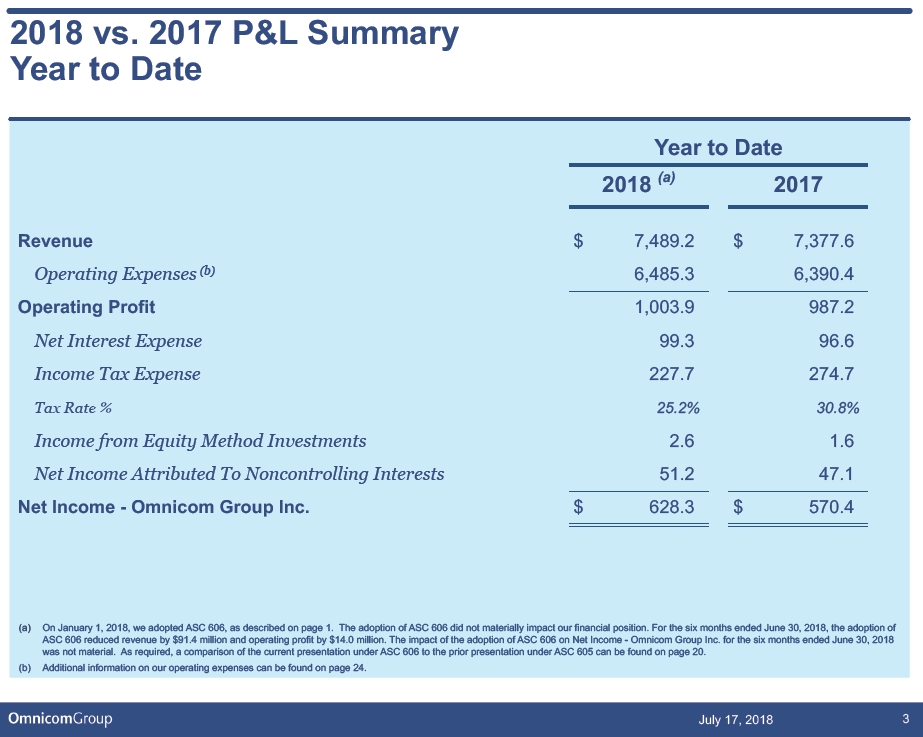
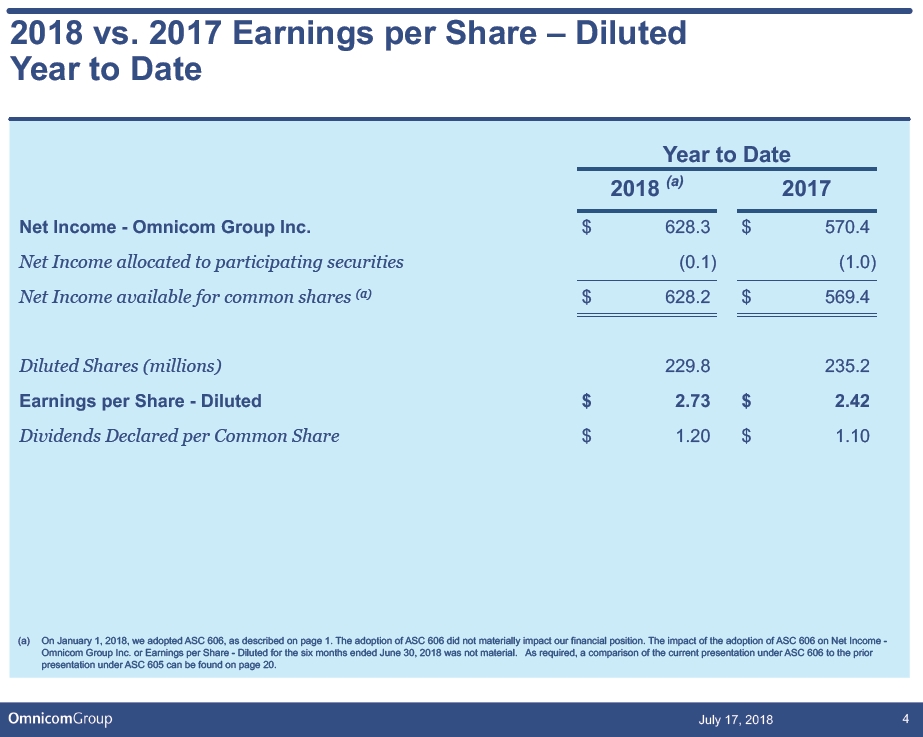
Net income - Omnicom Group Inc. for the six months ended June 30, 2018 increased $57.9 million, or 10.2%, to $628.3 million from $570.4 million in the same period in 2017. Diluted net income per common share for the six months ended June 30, 2018 increased thirty-one cents, or 12.8%, to $2.73 per share compared to $2.42 per share for the six months ended June 30, 2017.
Worldwide revenue for the six months ended June 30, 2018 increased 1.5% to $7,489.2 million from $7,377.6 million in the same period of 2017. The components of the change in revenue included an increase in revenue from the positive foreign exchange rate impact of 3.1%, a decrease in acquisition revenue, net of disposition revenue of 2.6% and an increase in revenue from organic growth of 2.2% when compared to the same period of 2017. The effect on revenue for the six months ended June 30, 2018 from adopting ASC 606 when compared to the same period of 2017 was a decrease in revenue of 1.2%.
Organic growth for the six months ended June 30, 2018 compared to the same period in 2017 in our fundamental disciplines was as follows: Advertising increased 1.6%, CRM Consumer Experience increased 7.0%, CRM Execution & Support decreased 1.7%, Public Relations increased 1.8% and Healthcare increased 3.8%.
Across our regional markets, organic growth for the six months ended June 30, 2018 as compared to the same period of 2017 was 0.3% in the United Kingdom, 10.5% in the Euro Markets and Other Europe, 7.9% in Asia Pacific and 2.8% in Latin America, while North America decreased 0.5% and the Middle East and Africa decreased 8.3%.
Page 2
Omnicom Group Inc.
Operating profit for the six months ended June 30, 2018 increased $16.7 million, or 1.7%, to $1,003.9 million compared to $987.2 million for the same period in 2017. Our operating margin for the six months ended June 30, 2018 of 13.4% was unchanged when compared to the same period in 2017. The impact from adopting ASC 606 reduced operating profit by $14.0 million for the six months ended June 30, 2018.
For the six months ended June 30, 2018, our income tax rate was 25.2% compared to 30.8% for the same period in 2017. The year over year difference in our effective tax rate primarily resulted from the enactment of the 2017 Tax Act, as described above. In addition, income tax expense for the six months ended June 30, 2018 was reduced by approximately $25 million, resulting from the successful resolution of foreign tax claims during the first quarter of 2018 and a reduction in the expected incremental U.S. tax applied against Omnicom's overall foreign earnings during the second quarter of 2018.
Non-GAAP Financial Measures
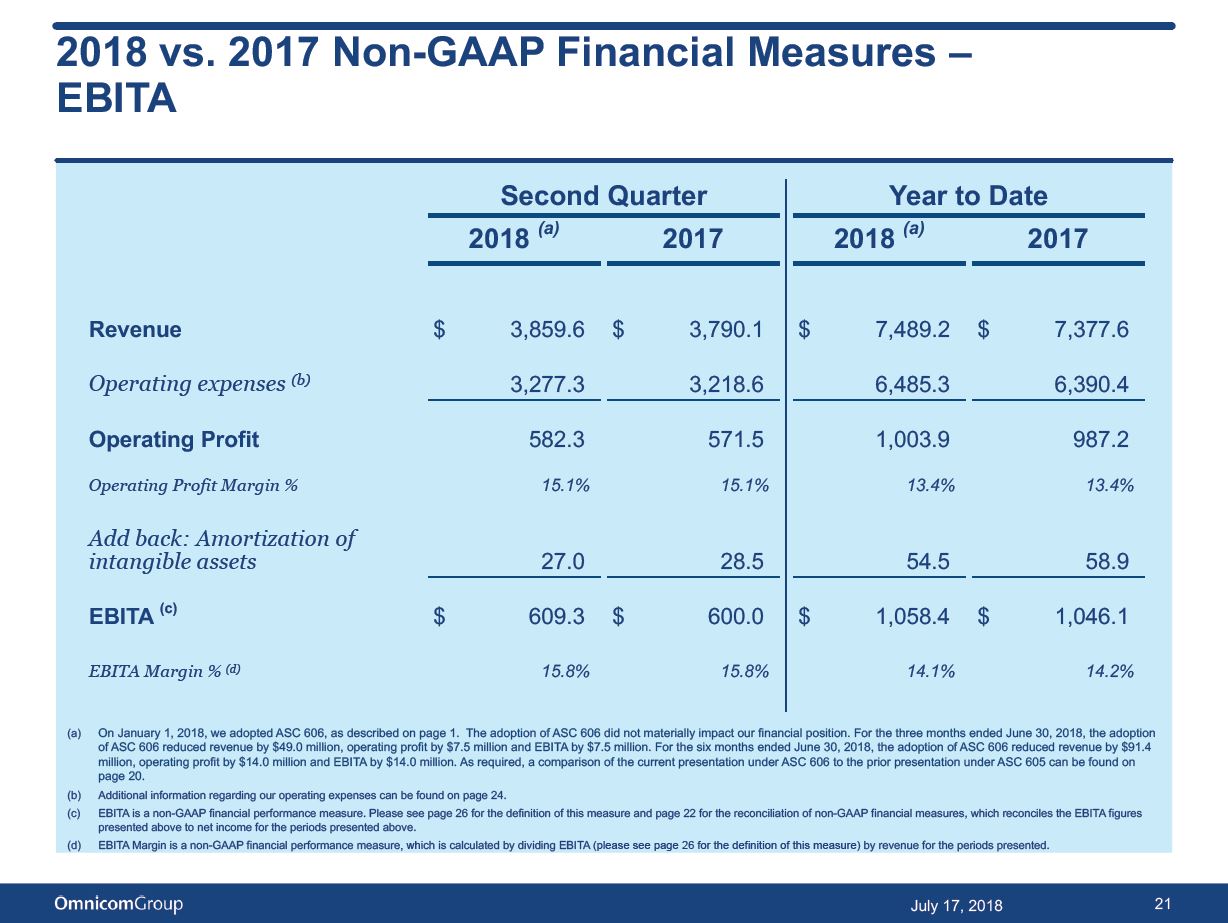
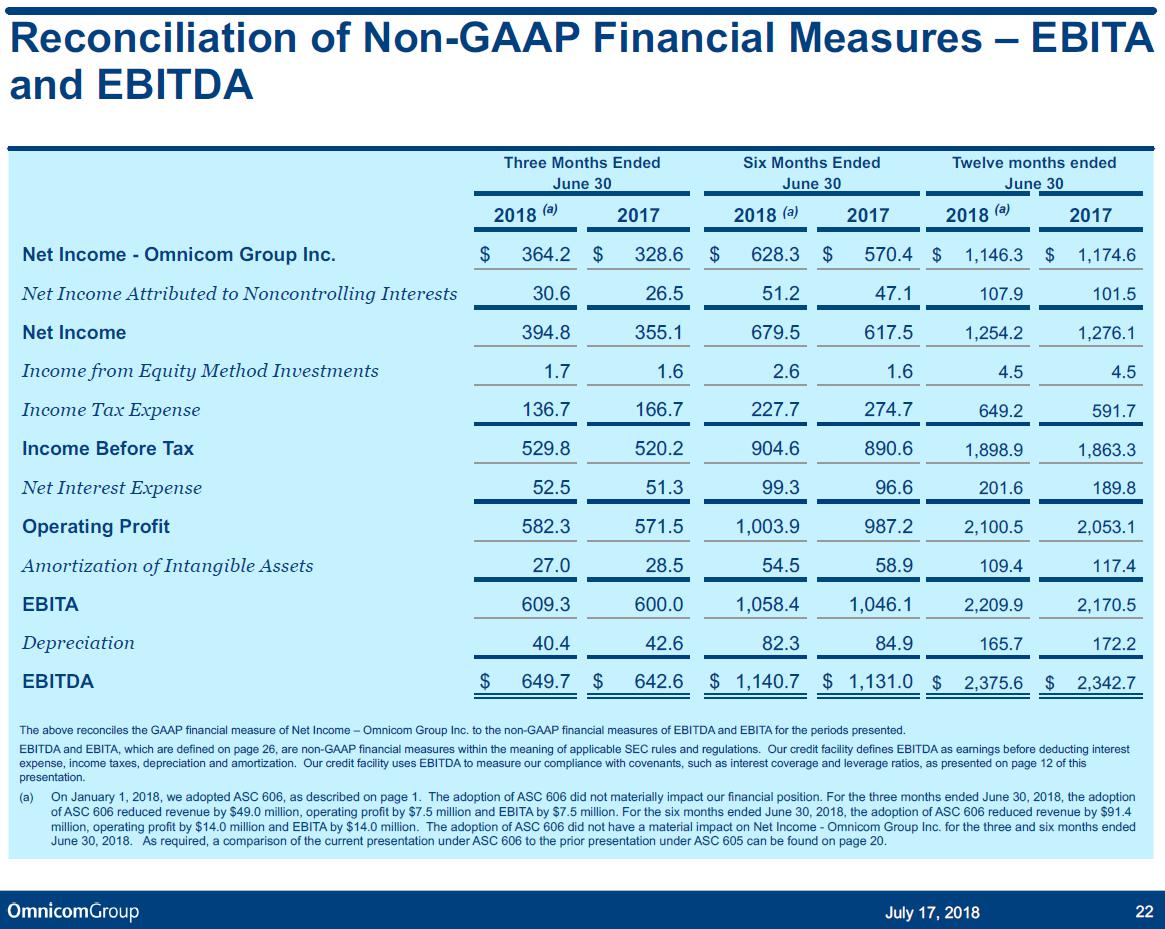
We use certain non-GAAP financial measures in describing our performance. We use EBITA (defined as earnings before interest, taxes and amortization of intangible assets) and EBITA margin (defined as EBITA divided by revenue) as additional operating performance measures, which exclude the non-cash amortization expense of intangible assets (primarily consisting of amortization of intangible assets arising from acquisitions). Accordingly, we believe they are useful measures for investors to evaluate the performance of our business. The financial tables at the end of this document reconcile the GAAP financial measure of net income to EBITA for the periods presented.
For the second quarter of 2018, EBITA increased $9.3 million, or 1.6%, to $609.3 million from $600.0 million in the second quarter of 2017. Our EBITA margin of 15.8% was unchanged when compared to the second quarter of 2017.
For the six months ended June 30, 2018, EBITA increased 1.2%, or $12.3 million, to $1,058.4 million from $1,046.1 million for the same period in 2017. Our EBITA margin for the six months ended June 30, 2018 decreased to 14.1% versus 14.2% for the same period in 2017.
Non-GAAP financial measures should not be considered in isolation from, or as a substitute for, financial information presented in compliance with U.S. GAAP. Non-
Page 3
Omnicom Group Inc.
GAAP financial measures reported by us may not be comparable to similarly titled amounts reported by other companies.
Definitions - Components of Revenue Change
We use certain terms in describing the components of the change in revenue above.
Foreign exchange rate impact: calculated by translating the current period’s local currency revenue using the prior period average exchange rates to derive current period constant currency revenue. The foreign exchange rate impact is the difference between the current period revenue in U.S. Dollars and the current period constant currency revenue.
Acquisition revenue, net of disposition revenue: Acquisition revenue is calculated as if the acquisition occurred twelve months prior to the acquisition date by aggregating the comparable prior period revenue of acquisitions through the acquisition date. As a result, acquisition revenue excludes the positive or negative difference between our current period revenue subsequent to the acquisition date and the comparable prior period revenue and the positive or negative growth after the acquisition date is attributed to organic growth. Disposition revenue is calculated as if the disposition occurred twelve months prior to the disposition date by aggregating the comparable prior period revenue of disposals through the disposition date. The acquisition revenue and disposition revenue amounts are netted in the presentation above.
Organic growth: calculated by subtracting the foreign exchange rate impact component and the acquisition revenue, net of disposition revenue component from total revenue growth, excluding the impact of the adoption of ASC 606.
About Omnicom Group Inc.
Omnicom Group Inc. (NYSE: OMC) (www.omnicomgroup.com) is a leading global marketing and corporate communications company. Omnicom’s branded networks and numerous specialty firms provide advertising, strategic media planning and buying, digital and interactive marketing, direct and promotional marketing, public relations and other specialty communications services to over 5,000 clients in more than 100 countries. Follow us on Twitter for the latest news.
For a live webcast or a replay of our second quarter earnings conference call, go to http://investor.omnicomgroup.com/investor-relations/news-events-and-filings.
Page 4
Omnicom Group Inc.
Contacts
Investor Relations: | Media: |
Shub Mukherjee, 212-415-3011 | Joanne Trout, 212-415-3669 |
shub.mukherjee@omnicomgroup.com | joanne.trout@omnicomgroup.com |
Page 5
Omnicom Group Inc.
Consolidated Statements of Income
Three Months Ended June 30
(Unaudited)
(Dollars in Millions, Except Per Share Data)
2018 (a) | 2017 | ||||||
Revenue | $ | 3,859.6 | $ | 3,790.1 | |||
Operating Expenses: | |||||||
Salary and service costs | 2,772.9 | 2,731.7 | |||||
Occupancy and other costs | 319.6 | 305.7 | |||||
Costs of services | 3,092.5 | 3,037.4 | |||||
Selling, general and administrative expenses | 117.4 | 110.1 | |||||
Depreciation and amortization | 67.4 | 71.1 | |||||
3,277.3 | 3,218.6 | ||||||
Operating Profit | 582.3 | 571.5 | |||||
Interest Expense | 66.4 | 62.8 | |||||
Interest Income | 13.9 | 11.5 | |||||
Income Before Income Taxes | 529.8 | 520.2 | |||||
Income Tax Expense | 136.7 | 166.7 | |||||
Income From Equity Method Investments | 1.7 | 1.6 | |||||
Net Income | 394.8 | 355.1 | |||||
Net Income Attributed To Noncontrolling Interests | 30.6 | 26.5 | |||||
Net Income - Omnicom Group Inc. | 364.2 | 328.6 | |||||
Net income allocated to participating securities | (0.1 | ) | (0.5 | ) | |||
Net income available for common shares | $ | 364.1 | $ | 328.1 | |||
Net income per common share - Omnicom Group Inc. | |||||||
Basic | $ | 1.61 | $ | 1.41 | |||
Diluted | $ | 1.60 | $ | 1.40 | |||
Weighted average shares (in millions) | |||||||
Basic | 226.8 | 232.1 | |||||
Diluted | 228.1 | 234.0 | |||||
Dividends declared per common share | $ | 0.60 | $ | 0.55 |
(a) | On January 1, 2018 we adopted FASB ASC Topic 606 “Revenue from Contracts with Customers” ("ASC 606"). ASC 606 was applied using the modified retrospective method, where the cumulative effect of initial application is recognized as an adjustment to opening retained earnings at January 1, 2018. Therefore, comparative prior periods have not been adjusted and continue to be reported under ASC 605 "Revenue Recognition" ("ASC 605"). The adoption of ASC 606 did not materially impact our financial position. For the three months ended June 30, 2018, the adoption of ASC 606 reduced revenue by $49.0 million and operating profit by $7.5 million. The adoption of ASC 606 did not have a material impact on Net Income - Omnicom Group Inc. or Diluted net income per common share - Omnicom Group Inc. for the three months ended June 30, 2018. As required, a comparison of the current presentation under ASC 606 to the prior presentation under ASC 605 is provided below. |
Page 6
Omnicom Group Inc.
Impact of the Adoption of ASC 606
Three Months Ended June 30
(Unaudited)
(Dollars in Millions)
2018 Reported under ASC 606 |
2018 Adjustments |
2018 Excluding Impact of Adoption of ASC 606 | |||||||||
Revenue | $ | 3,859.6 | $ | 49.0 | $ | 3,908.6 | |||||
Operating Expenses | 3,277.3 | 41.5 | 3,318.8 | ||||||||
Operating Profit | $ | 582.3 | $ | 7.5 | $ | 589.8 |
The above table presents the U.S. GAAP financial measures of Revenue, Operating Expenses and Operating Profit as reported, as well as the impact of the adoption of ASC 606 on these measures for the period presented. The impact of the adoption of ASC 606 on net income - Omnicom Group Inc. and diluted net income per share - Omnicom Group Inc. was not material.
Page 7
Omnicom Group Inc.
Consolidated Statements of Income
Six Months Ended June 30
(Unaudited)
(Dollars in Millions, Except Per Share Data)
2018 (a) | 2017 | ||||||
Revenue | $ | 7,489.2 | $ | 7,377.6 | |||
Operating Expenses: | |||||||
Salary and service costs | 5,485.7 | 5,420.2 | |||||
Occupancy and other costs | 639.9 | 607.6 | |||||
Costs of services | 6,125.6 | 6,027.8 | |||||
Selling, general and administrative expenses | 222.9 | 218.8 | |||||
Depreciation and amortization | 136.8 | 143.8 | |||||
6,485.3 | 6,390.4 | ||||||
Operating Profit | 1,003.9 | 987.2 | |||||
Interest Expense | 128.6 | 121.9 | |||||
Interest Income | 29.3 | 25.3 | |||||
Income Before Income Taxes | 904.6 | 890.6 | |||||
Income Tax Expense | 227.7 | 274.7 | |||||
Income From Equity Method Investments | 2.6 | 1.6 | |||||
Net Income | 679.5 | 617.5 | |||||
Net Income Attributed To Noncontrolling Interests | 51.2 | 47.1 | |||||
Net Income - Omnicom Group Inc. | 628.3 | 570.4 | |||||
Net income allocated to participating securities | (0.1 | ) | (1.0 | ) | |||
Net income available for common shares | $ | 628.2 | $ | 569.4 | |||
Net income per common share - Omnicom Group Inc. | |||||||
Basic | $ | 2.75 | $ | 2.44 | |||
Diluted | $ | 2.73 | $ | 2.42 | |||
Weighted average shares (in millions) | |||||||
Basic | 228.5 | 233.3 | |||||
Diluted | 229.8 | 235.2 | |||||
Dividends declared per common share | $ | 1.20 | $ | 1.10 |
(a) | On January 1, 2018 we adopted FASB ASC Topic 606 “Revenue from Contracts with Customers” ("ASC 606"). ASC 606 was applied using the modified retrospective method, where the cumulative effect of initial application is recognized as an adjustment to opening retained earnings at January 1, 2018. Therefore, comparative prior periods have not been adjusted and continue to be reported under ASC 605 "Revenue Recognition" ("ASC 605"). The adoption of ASC 606 did not materially impact our financial position. For the six months ended June 30, 2018, the adoption of ASC 606 reduced revenue by $91.4 million and operating profit by $14.0 million. The adoption of ASC 606 did not have a material impact on Net Income - Omnicom Group Inc. or Diluted net income per common share - Omnicom Group Inc. for the six months ended June 30, 2018. As required, a comparison of the current presentation under ASC 606 to the prior presentation under ASC 605 is provided below. |
Page 8
Omnicom Group Inc.
Impact of the Adoption of ASC 606
Six Months Ended June 30
(Unaudited)
(Dollars in Millions)
2018 Reported under ASC 606 |
2018 Adjustments |
2018 Excluding Impact of Adoption of ASC 606 | |||||||||
Revenue | $ | 7,489.2 | $ | 91.4 | $ | 7,580.6 | |||||
Operating Expenses | 6,485.3 | 77.4 | 6,562.7 | ||||||||
Operating Profit | $ | 1,003.9 | $ | 14.0 | $ | 1,017.9 |
The above table presents the U.S. GAAP financial measures of Revenue, Operating Expenses and Operating Profit as reported, as well as the impact of the adoption of ASC 606 on these measures for the period presented. The impact of the adoption of ASC 606 on net income - Omnicom Group Inc. and diluted net income per share - Omnicom Group Inc. was not material.
Page 9
Omnicom Group Inc.
Reconciliation of Non-GAAP Financial Measures
Three Months Ended June 30
(Unaudited)
(Dollars in Millions)
2018 | 2017 | ||||||
Net Income - Omnicom Group Inc. | $ | 364.2 | $ | 328.6 | |||
Net Income Attributed To Noncontrolling Interests | 30.6 | 26.5 | |||||
Net Income | 394.8 | 355.1 | |||||
Income From Equity Method Investments | 1.7 | 1.6 | |||||
Income Tax Expense | 136.7 | 166.7 | |||||
Income Before Income Taxes | 529.8 | 520.2 | |||||
Interest Income | 13.9 | 11.5 | |||||
Interest Expense | 66.4 | 62.8 | |||||
Operating Profit | 582.3 | 571.5 | |||||
Add back: Amortization of intangible assets | 27.0 | 28.5 | |||||
Earnings before interest, taxes and amortization of intangible assets ("EBITA") | $ | 609.3 | $ | 600.0 | |||
Revenue | $ | 3,859.6 | $ | 3,790.1 | |||
EBITA | $ | 609.3 | $ | 600.0 | |||
EBITA Margin - % | 15.8 | % | 15.8 | % |
The above table reconciles the U.S. GAAP financial measure of Net Income - Omnicom Group Inc. to EBITA (defined as earnings before interest, taxes and amortization of intangibles) and EBITA Margin (defined as EBITA divided by revenue) for the periods presented. We use EBITA and EBITA margin as additional operating performance measures, which exclude the non-cash amortization expense of intangible assets (primarily consisting of amortization of intangible assets arising from acquisitions). Accordingly, we believe they are useful measures for investors to evaluate the performance of our business. Non-GAAP financial measures should not be considered in isolation from, or as a substitute for, financial information presented in compliance with U.S. GAAP. Non-GAAP financial measures reported by us may not be comparable to similarly titled amounts reported by other companies.
Page 10
Omnicom Group Inc.
Reconciliation of Non-GAAP Financial Measures
Six Months Ended June 30
(Unaudited)
(Dollars in Millions)
2018 | 2017 | ||||||
Net Income - Omnicom Group Inc. | $ | 628.3 | $ | 570.4 | |||
Net Income Attributed To Noncontrolling Interests | 51.2 | 47.1 | |||||
Net Income | 679.5 | 617.5 | |||||
Income From Equity Method Investments | 2.6 | 1.6 | |||||
Income Tax Expense | 227.7 | 274.7 | |||||
Income Before Income Taxes | 904.6 | 890.6 | |||||
Interest Income | 29.3 | 25.3 | |||||
Interest Expense | 128.6 | 121.9 | |||||
Operating Profit | 1,003.9 | 987.2 | |||||
Add back: Amortization of intangible assets | 54.5 | 58.9 | |||||
Earnings before interest, taxes and amortization of intangible assets ("EBITA") | $ | 1,058.4 | $ | 1,046.1 | |||
Revenue | $ | 7,489.2 | $ | 7,377.6 | |||
EBITA | $ | 1,058.4 | $ | 1,046.1 | |||
EBITA Margin - % | 14.1 | % | 14.2 | % |
The above table reconciles the U.S. GAAP financial measure of Net Income - Omnicom Group Inc. to EBITA (defined as earnings before interest, taxes and amortization of intangibles) and EBITA Margin (defined as EBITA divided by revenue) for the periods presented. We use EBITA and EBITA margin as additional operating performance measures, which exclude the non-cash amortization expense of intangible assets (primarily consisting of amortization of intangible assets arising from acquisitions). Accordingly, we believe they are useful measures for investors to evaluate the performance of our business. Non-GAAP financial measures should not be considered in isolation from, or as a substitute for, financial information presented in compliance with U.S. GAAP. Non-GAAP financial measures reported by us may not be comparable to similarly titled amounts reported by other companies.
Page 11
Exhibit 99.2
Second Quarter 2018 Results
July 17, 2018
Investor Presentation
2018 vs. 2017 P&L Summary Second Quarter
Second Quarter
2018 (a) 2017
Revenue $ 3,859.6 $ 3,790.1
Operating Expenses (b) 3,277.3 3,218.6
Operating Profit 582.3 571.5
Net Interest Expense 52.5 51.3
Income Tax Expense 136.7 166.7
Tax Rate % 25.8% 32.0%
Income from Equity Method Investments 1.7 1.6
Net Income Attributed To Noncontrolling Interests 30.6 26.5
Net Income - Omnicom Group Inc. $ 364.2 $ 328.6
(a) On January 1, 2018, we adopted FASB ASC Topic 606 Revenue from Contracts with Customers ("ASC 606"). ASC 606 was applied using the modified retrospective method, where the cumulative effect of initial application is recognized as an adjustment to opening retained earnings at January 1, 2018. Therefore, comparative prior periods have not been adjusted and such information for the three months ended June 30, 2017 continues to be reported under ASC 605 "Revenue Recognition" ("ASC 605"). The adoption of ASC 606 did not materially impact our financial position. For the three months ended June 30, 2018, the adoption of ASC 606 reduced revenue by $49.0 million and operating profit by $7.5 million. The impact of the adoption of ASC 606 on Net Income - Omnicom Group Inc. for the three months ended June 30, 2018 was not material. As required, a comparison of the current presentation under ASC 606 to the prior presentation under ASC 605 can be found on page 20.
(b) Additional information on our operating expenses can be found on page 24.
July 17, 2018 1
2018 vs. 2017 Earnings per Share Diluted Second Quarter
Second Quarter
2018 (a) 2017
Net Income - Omnicom Group Inc. $ 364.2 $ 328.6
Net Income allocated to participating securities (0.1) (0.5)
Net Income available for common shares $ 364.1 $ 328.1
Diluted Shares (millions) 228.1 234.0
Earnings per Share - Diluted $ 1.60 $ 1.40
Dividends Declared per Common Share $ 0.60 $ 0.55
(a) On January 1, 2018, we adopted ASC 606, as described on page 1. The adoption of ASC 606 did not materially impact our financial position. The impact of the adoption of ASC 606 on Net Income -Omnicom Group Inc. or Earnings per Share - Diluted for the three months ended June 30, 2018 was not material. As required, a comparison of the current presentation under ASC 606 to the prior presentation under ASC 605 can be found on page 20.
July 17, 2018 2
2018 vs. 2017 P&L Summary Year to Date
Year to Date
2018 (a) 2017
Revenue $ 7,489.2 $ 7,377.6
Operating Expenses (b) 6,485.3 6,390.4
Operating Profit 1,003.9 987.2
Net Interest Expense 99.3 96.6
Income Tax Expense 227.7 274.7
Tax Rate % 25.2% 30.8%
Income from Equity Method Investments 2.6 1.6
Net Income Attributed To Noncontrolling Interests 51.2 47.1
Net Income - Omnicom Group Inc. $ 628.3 $ 570.4
(a) On January 1, 2018, we adopted ASC 606, as described on page 1. The adoption of ASC 606 did not materially impact our financial position. For the six months ended June 30, 2018, the adoption of ASC 606 reduced revenue by $91.4 million and operating profit by $14.0 million. The impact of the adoption of ASC 606 on Net Income - Omnicom Group Inc. for the six months ended June 30, 2018 was not material. As required, a comparison of the current presentation under ASC 606 to the prior presentation under ASC 605 can be found on page 20.
(b) Additional information on our operating expenses can be found on page 24.
July 17, 2018 3
2018 vs. 2017 Earnings per Share Diluted Year to Date
Year to Date 2018 (a) 2017
Net Income - Omnicom Group Inc. $ 628.3 $ 570.4
Net Income allocated to participating securities (0.1) (1.0)
Net Income available for common shares (a) $ 628.2 $ 569.4
Diluted Shares (millions) 229.8 235.2
Earnings per Share - Diluted $ 2.73 $ 2.42
Dividends Declared per Common Share $ 1.20 $ 1.10
(a) On January 1, 2018, we adopted ASC 606, as described on page 1. The adoption of ASC 606 did not materially impact our financial position. The impact of the adoption of ASC 606 on Net Income -Omnicom Group Inc. or Earnings per Share - Diluted for the six months ended June 30, 2018 was not material. As required, a comparison of the current presentation under ASC 606 to the prior presentation under ASC 605 can be found on page 20.
July 17, 2018 4
2018 Total Revenue Change
Second Quarter Year to Date
$ % $ %
Prior Period Revenue, as reported under ASC 605 $ 3,790.1 $ 7,377.6
Foreign exchange rate impact (a) 78.8 2.1% 229.9 3.1%
Acquisition revenue, net of disposition revenue (b) (37.6) -1.0% (191.1) -2.6%
Organic growth (c) 77.3 2.0% 164.2 2.2%
Impact of Adoption of ASC 606 (d) (49.0) -1.3% (91.4) -1.2%
Current Period Revenue, reported under ASC 606 $ 3,859.6 1.8% $ 7,489.2 1.5%
(a) Foreign exchange rate impact: calculated by translating the current periods local currency revenue using the prior period average exchange rates to derive current period constant currency revenue. The foreign exchange rate impact is the difference between the current period revenue in U.S. Dollars and the current period constant currency revenue.
(b) Acquisition revenue, net of disposition revenue: Acquisition revenue is calculated as if the acquisition occurred twelve months prior to the acquisition date by aggregating the comparable prior period revenue of acquisitions through the acquisition date. As a result, acquisition revenue excludes the positive or negative difference between our current period revenue subsequent to the acquisition date and the comparable prior period revenue and the positive or negative growth after the acquisition date is attributed to organic growth. Disposition revenue is calculated as if the disposition occurred twelve months prior to the disposition date by aggregating the comparable prior period revenue of disposals through the disposition date. The acquisition revenue and disposition revenue amounts are netted in the presentation above.
(c) Organic growth: calculated by subtracting the foreign exchange rate impact, and the acquisition revenue, net of disposition revenue components from total revenue growth, excluding the impact of the adoption of ASC 606.
(d) Impact of Adoption of ASC 606: As a result of the adoption of ASC 606 we were required to change our accounting policy for certain third-party out-of-pocket costs, which are incurred in connection with our services and are billed to our clients. Upon adoption of ASC 606, certain third-party costs are no longer included in revenue. In addition, the adoption of ASC 606 impacted our policy for performance incentives (variable consideration). Previously, revenue from performance incentives was recognized when specific quantitative goals were achieved or when our performance against qualitative goals was acknowledged by the client. ASC 606 requires that these items to be estimated and included in the total consideration at contract inception and be evaluated throughout the contract period. The impact of the adoption of ASC 606 is the sum of the impact of these changes in the current period's revenue when compared to our previous accounting policy for these items.
July 17, 2018 5
2018 Revenue by Discipline
Second Quarter Year to Date
Healthcare Healthcare 7.0% 6.8% PR PR
9.4% 9.5%
CRM CRM Execution Execution & Support & Support
Advertising Advertising 12.9% 13.4% 53.6% 53.0% CRM CRM
Consumer Consumer Experience Experience 17.1% 17.3%
% Organic % Organic $ Mix % Growth Growth (a) $ Mix % Growth Growth (a)
Advertising $ 2,067.6 2.0% 1.6% Advertising $ 3,968.9 0.3% 1.6%
CRM Consumer CRM Consumer
660.0 0.8% 7.1% 1,294.9 2.1% 7.0%
Experience Experience CRM Execution & CRM Execution &
498.7 -3.6% -4.4% 1,007.2 0.1% -1.7%
Support Support
PR 362.7 3.5% 2.7% PR 709.1 3.5% 1.8%
Healthcare 270.6 12.5% 4.8% Healthcare 509.1 10.4% 3.8%
Total $ 3,859.6 1.8% 2.0% Total $ 7,489.2 1.5% 2.2%
(a) Organic Growth reflects the year-over-year increase or decrease in revenue from the prior period, excluding the foreign exchange rate impact, acquisition revenue, net of disposition revenue and impact of adoption of ASC 606, as defined on page 5.
July 17, 2018 6
2018 Revenue by Region
Second Quarter Year to Date
Middle Middle Latin Latin East & East & America America Africa Africa 3.0% 3.0% 1.8% 1.9%
Asia Asia Pacific Pacific 11.3% 11.0%
Euro Euro Markets & Markets & Other Other Europe Europe
North North 20.2% 19.9% America America 54.3% 54.6%
UK UK 9.4% 9.6%
July 17, 2018 7
2018 Revenue by Region
Second Quarter Year to Date
% Organic % Organic $ Mix % Growth Growth (a) $ Mix % Growth Growth (a)
$ 2,097.4 -3.6% -0.9% $ 4,083.1 -5.4% -0.5%
North America North America
363.5 3.7% -2.2% 721.5 9.4% 0.3%
UK UK
779.1 17.7% 11.2% 1,491.2 20.2% 10.5%
Euro & Other Europe Euro & Other Europe
434.3 7.2% 8.5% 826.3 5.9% 7.9%
Asia Pacific Asia Pacific
115.1 -5.0% 2.5% 223.5 -1.9% 2.8%
Latin America Latin America
70.2 -7.0% -8.0% 143.6 -7.0% -8.3%
Middle East & Africa Middle East & Africa
$ 3,859.6 1.8% 2.0% $ 7,489.2 1.5% 2.2%
Total Total
(a) Organic Growth reflects the year-over-year increase or decrease in revenue from the prior period, excluding the foreign exchange rate impact, acquisition revenue, net of disposition revenue and impact of adoption of ASC 606, as defined on page 5.
July 17, 2018 8
Revenue by Industry
Year to Date 2018 Year to Date 2017
T&E Auto T&E Auto
7% 10% 6% 9% Telcom Telcom 5% 5%
Consumer Consumer Products Products Tech 10% Tech 9% 9% 9%
Financial Financial Services Services Retail 7% Retail 8% 6% 6%
Food & Food & Pharma & Beverage Pharma & Beverage Health 13% Health 13% 12% 13%
Other Other 20% 23%
July 17, 2018 9
Cash Flow Performance
Six Months Ended June 30
2018 2017
Net Income $ 679.5 $ 617.5
Depreciation and Amortization of Intangible Assets 136.8 143.8
Share-Based Compensation 35.1 40.0
Other Items to Reconcile to Net Cash Used in Operating
7.5 6.1
Activities, net
Free Cash Flow (a) $ 858.9 $ 807.4
Additional information regarding our cash flows can be found in our condensed cash flow statement on page 19.
(a) The Free Cash Flow amounts presented above are non-GAAP liquidity measures. See page 26 for the definition of this measure and page 23 for the reconciliation of the non-GAAP financial measures, which reconciles Free Cash Flow to the Net Cash Used in Operating Activities for the periods presented above.
July 17, 2018 10
Cash Flow Performance
Six Months Ended June 30
2018 2017
Free Cash Flow (a) $ 858.9 $ 807.4
Primary Uses of Cash:
Dividends paid to Common Shareholders 278.1 260.7
Dividends paid to Noncontrolling Interest Shareholders 57.3 67.3
Capital Expenditures 89.8 67.9 Acquisition of Businesses and Affiliates, Acquisition of Additional Noncontrolling Interests and Contingent Purchase Price Payments, net 294.9 73.3 of Proceeds from Investments
Stock Repurchases, net of Proceeds from Stock Plans 462.7 468.2
Primary Uses of Cash (a) 1,182.8 937.4
Net Free Cash Flow (a) $ (323.9) $ (130.0)
Additional information regarding our cash flows can be found in our condensed cash flow statement on page 19.
(a) The Free Cash Flow, Primary Uses of Cash and Net Free Cash Flow amounts presented above are non-GAAP liquidity measures. See page 26 or the definition of these measures and page 23 for the reconciliation of non-GAAP financial measures, which reconciles Free Cash Flow to the Net Cash Used in Operating Activities and Net Free Cash Flow to the Net Decrease in Cash and Cash Equivalents for the periods presented above.
July 17, 2018 11
Current Credit Picture
Twelve months ended June 30
2018 2017
EBITDA (a) $ 2,375.6 $ 2,342.7
Gross Interest Expense on Indebtedness 230.6 215.4 EBITDA / Gross Interest Expense on Indebtedness 10.3 x 10.9 x Total Debt / EBITDA 2.1 x 2.1 x Net Debt (b) / EBITDA 1.2 x 1.3 x
Debt
Bank Loans (Due Less Than 1 Year) $ 21 $ 19 CP & Borrowings Issued Under Revolver Senior Notes (c) 4,900 4,900 Other Debt (33) 30
Total Debt $ 4,888 $ 4,949
Cash, Cash Equivalents and Short Term Investments 1,919 1,874
Net Debt (b) $ 2,969 $ 3,075
(a) EBITDA is a non-GAAP performance measure. See page 26 for the definition of this measure and page 22 for the reconciliation of non-GAAP financial measures. (b) Net Debt is a non-GAAP liquidity measure. See page 26 for the definition of this measure, which is reconciled in the table above.
(c) See pages 16 and 17 for additional information on our Senior Notes.
July 17, 2018 12
Historical Returns
Return on Invested Capital (ROIC) (a):
Twelve months ended June 30, 2018 20.2%
Twelve months ended June 30, 2017 20.1%
Return on Equity (b):
Twelve months ended June 30, 2018 50.1%
Twelve months ended June 30, 2017 51.8%
(a) Return on Invested Capital is After Tax Reported Operating Profit (a non-GAAP performance measure see page 26 for the definition of this measure and page 23 for the reconciliation of non-GAAP financial measures) divided by the average of Invested Capital at the beginning and the end of the period (book value of all long-term liabilities and short-term interest bearing debt plus shareholders equity less cash, cash equivalents and short term investments).
(b) Return on Equity is Reported Net Income for the given period divided by the average of shareholders equity at the beginning and end of the period.
July 17, 2018 13
Net Cash Returned to Shareholders through Dividends and Share Repurchases
From 2008 through June 30, 2018, Omnicom distributed 106% of Net Income to shareholders through Dividends and Share Repurchases.
106% $12.0 105% $10.6 106% $10.0 $10.0 108% $8.9 3.9 3.6 108% $7.8 $8.0 3.1
Billions 102% $6.7
2.6 106% $5.6 2.1 $6.0 99% $4.6 In 1.6
$ 97% 1.3 $4.0 $3.6
7.0 7.4 63% 6.4 $2.6 0.9 95% 5.8 $1.8 5.1 $2.0 0.6 4.1 $1.0 3.6 2.7 1.9 $0.0
2008 2009 2010 2011 2012 2013 2014 2015 2016 2017 YTD 2018
Cumulative Cost of Net Shares Repurchased - Payments for repurchases of common stock less proceeds from stock plans. Cumulative Dividends Paid Cumulative Net Income - Omnicom Group Inc.
% of Cumulative Net Income Returned to Shareholders - Cumulative Dividends Paid plus Cumulative Cost of Net Shares Repurchased divided by Cumulative Net Income.
July 17, 2018 14
Supplemental Financial Information
July 17, 2018 15
Omnicom Debt Structure
Bank Loans $21
2019 Senior Notes $500
2026 Senior Notes $1,400 2020 Senior Notes $1,000
2024 Senior Notes $750 2022 Senior Notes $1,250
The above chart sets forth Omnicoms debt outstanding at June 30, 2018. The amounts reflected above for the 2019, 2020, 2022, 2024 and 2026 Senior Notes represent the principal amount of these notes at maturity on July 15, 2019, August 15, 2020, May 1, 2022, November 1, 2024 and April 15, 2026, respectively.
July 17, 2018 16
Omnicom Debt Maturity Profile
2026 Senior 2022 Notes
$1,400
Senior Notes
$1,200 2020
Senior Notes
$1,000
2024 Senior $800 Notes 2019 $600 Senior Notes
$400
$200
Other Borrowings
$0
17 18 18 19 19 - 20 20 21 21 - 22 22 - 23 - 23 - 24 24 25 - 25 - 26 - 26 -----------Dec Jun Dec Jun Dec Jun Dec Jun Dec Jun Dec Jun Dec Jun Dec Jun Dec Jun Dec
Other borrowings at June 30, 2018 include short-term borrowings of $21 million which are due in less than one year. For purposes of this presentation we have included these borrowings as outstanding through July 31, 2021, the date of expiration of our five-year credit facility.
July 17, 2018 17
2018 Acquisition Related Expenditures
Year to Date
Acquisition of Businesses and Affiliates (a) $ 207.3 Acquisition of Additional Noncontrolling Interests (b) 40.3 Contingent Purchase Price Payments (c) 51.3
Total Acquisition Expenditures (d) $ 298.9
(a) Includes acquisitions of a majority interest in agencies resulting in their consolidation, including additional interest in existing affiliate agencies resulting in majority ownership.
(b) Includes the acquisition of additional equity interests in already consolidated subsidiary agencies which are recorded to Equity Noncontrolling Interest.
(c) Includes additional consideration paid for acquisitions completed in prior periods.
(d) Total Acquisition Expenditures figure is net of cash acquired.
July 17, 2018 18
Condensed Cash Flow
Six Months Ended June 30 2018 2017
Net Income $ 679.5 $ 617.5
Share-Based Compensation 35.1 40.0 Depreciation and Amortization of Intangible Assets 136.8 143.8 Other Items to Reconcile to Net Cash Provided by Operating Activities, net 7.5 6.1 Changes in Operating Capital (1,431.8) (1,138.4)
Net Cash Used in Operating Activities (572.9) (331.0)
Capital Expenditures (89.8) (67.9) Proceeds from Sale of Investments, net 4.0 25.4 Acquisition of Businesses and Interest in Affiliates, net of cash acquired (207.3) (19.5)
Net Cash Used in Investing Activities (293.1) (62.0)
Dividends paid to Common Shareholders (278.1) (260.7) Dividends paid to Noncontrolling Interest Shareholders (57.3) (67.3) Proceeds from/(Repayments of) Short-term & Long-term Debt, net 9.7 (10.2) Stock Repurchases, net of Proceeds from Stock Plans (462.7) (468.2) Acquisition of Additional Noncontrolling Interests (40.3) (8.0) Payment of Contingent Purchase Price Obligations (51.3) (71.2) Other Financing Activities, net (22.4) (17.1)
Net Cash Used in Financing Activities (902.4) (902.7) Effect of exchange rate changes on cash and cash equivalents (114.3) 127.5 Net Decrease in Cash and Cash Equivalents $ (1,882.7) $ (1,168.2)
July 17, 2018 19
2018 P&L Summary Impact of Adoption of ASC 606 on Reported Results
Second Quarter
Without the Reported under Adjustments Adoption of ASC
ASC 606
606
Revenue $ 3,859.6 $ 49.0 $ 3,908.6 Operating Expenses 3,277.3 41.5 3,318.8 Operating Profit $ 582.3 $ 7.5 $ 589.8
Year to Date
Without the Reported under Adjustments Adoption of ASC
ASC 606
606
Revenue $ 7,489.2 $ 91.4 $ 7,580.6 Operating Expenses 6,485.3 77.4 6,562.7 Operating Profit $ 1,003.9 $ 14.0 $ 1,017.9
The above table identifies the impact of the adoption of ASC 606 on our reported U.S. GAAP financial measures of Revenue, Operating Expenses and Operating Profit, for the periods presented. The impact of the adoption of ASC 606 on Net Income - Omnicom Group Inc. and Earnings per Share - Diluted was not material for the periods presented.
July 17, 2018 20
2018 vs. 2017 Non-GAAP Financial Measures EBITA
Second Quarter Year to Date 2018 (a) 2017 2018 (a) 2017
Revenue $ 3,859.6 $ 3,790.1 $ 7,489.2 $ 7,377.6
Operating expenses (b) 3,277.3 3,218.6 6,485.3 6,390.4
Operating Profit 582.3 571.5 1,003.9 987.2
Operating Profit Margin % 15.1% 15.1% 13.4% 13.4%
Add back: Amortization of intangible assets 27.0 28.5 54.5 58.9
EBITA (c) $ 609.3 $ 600.0 $ 1,058.4 $ 1,046.1
EBITA Margin % (d) 15.8% 15.8% 14.1% 14.2%
(a) On January 1, 2018, we adopted ASC 606, as described on page 1. The adoption of ASC 606 did not materially impact our financial position. For the three months ended June 30, 2018, the adoption of ASC 606 reduced revenue by $49.0 million, operating profit by $7.5 million and EBITA by $7.5 million. For the six months ended June 30, 2018, the adoption of ASC 606 reduced revenue by $91.4 million, operating profit by $14.0 million and EBITA by $14.0 million. As required, a comparison of the current presentation under ASC 606 to the prior presentation under ASC 605 can be found on page 20.
(b) Additional information regarding our operating expenses can be found on page 24.
(c) EBITA is a non-GAAP financial performance measure. Please see page 26 for the definition of this measure and page 22 for the reconciliation of non-GAAP financial measures, which reconciles the EBITA figures presented above to net income for the periods presented above.
(d) EBITA Margin is a non-GAAP financial performance measure. Please see page 26 for the definition of this measure, which is calculated by dividing EBITA by revenue for the periods presented.
July 17, 2018 21
Reconciliation of Non-GAAP Financial Measures EBITA and EBITDA
Three Months Ended Six Months Ended Twelve months ended June 30 June 30 June 30
2018 (a) 2017 2018 2017 2018 (a) 2017
Net Income - Omnicom Group Inc. $ 364.2 $ 328.6 $ 628.3 $ 570.4 $ 1,146.3 $ 1,174.6
Net Income Attributed to Noncontrolling Interests 30.6 26.5 51.2 47.1 107.9 101.5
Net Income 394.8 355.1 679.5 617.5 1,254.2 1,276.1
Income from Equity Method Investments 1.7 1.6 2.6 1.6 4.5 4.5
Income Tax Expense 136.7 166.7 227.7 274.7 649.2 591.7
Income Before Tax 529.8 520.2 904.6 890.6 1,898.9 1,863.3
Net Interest Expense 52.5 51.3 99.3 96.6 201.6 189.8
Operating Profit 582.3 571.5 1,003.9 987.2 2,100.5 2,053.1
Amortization of Intangible Assets 27.0 28.5 54.5 58.9 109.4 117.4
EBITA 609.3 600.0 1,058.4 1,046.1 2,209.9 2,170.5 Depreciation 40.4 42.6 82.3 84.9 165.7 172.2 EBITDA $ 649.7 $ 642.6 $ 1,140.7 $ 1,131.0 $ 2,375.6 $ 2,342.7
The above reconciles the GAAP financial measure of Net Income Omnicom Group Inc. to the non-GAAP financial measures of EBITDA and EBITA for the periods presented.
EBITDA and EBITA, which are defined on page 26, are non-GAAP financial measures within the meaning of applicable SEC rules and regulations. Our credit facility defines EBITDA as earnings before deducting interest expense, income taxes, depreciation and amortization. Our credit facility uses EBITDA to measure our compliance with covenants, such as interest coverage and leverage ratios, as presented on page 12 of this presentation.
(a) On January 1, 2018, we adopted ASC 606, as described on page 1. The adoption of ASC 606 did not materially impact our financial position. For the three months ended June 30, 2018, the adoption of ASC 606 reduced revenue by $49.0 million, operating profit by $7.5 million and EBITA by $7.5 million. For the six months ended June 30, 2018, the adoption of ASC 606 reduced revenue by $91.4 million, operating profit by $14.0 million and EBITA by $14.0 million. The adoption of ASC 606 did not have a material impact on Net Income - Omnicom Group Inc. for the three and six months ended June 30, 2018. As required, a comparison of the current presentation under ASC 606 to the prior presentation under ASC 605 can be found on page 20.
July 17, 2018 22
Reconciliation of Non-GAAP Financial Measures
Six Months Ended June 30 2018 2017 Net Cash Used in Operating Activities $ (572.9) $ (331.0) Operating Activities items excluded from Free Cash Flow:
Changes in Operating Capital (1,431.8) (1,138.4)
Free Cash Flow $ 858.9 $ 807.4
Six Months Ended June 30
2018 2017 Net Decrease in Cash and Cash Equivalents $ (1,882.7) $ (1,168.2)
Cash Flow items excluded from Net Free Cash Flow:
Changes in Operating Capital (1,431.8) (1,138.4) Proceeds from/(Repayments of) Short-term & Long-term Debt, net 9.7 (10.2) Other Financing Activities, net (22.4) (17.1) Effect of exchange rate changes on cash and cash equivalents (114.3) 127.5
Net Free Cash Flow $ (323.9) $ (130.0)
Twelve months ended June 30
2018 2017 Reported Operating Profit 2,100.5 2,053.1
Effective Tax Rate for the applicable period 34.2% 31.8% Income Taxes on Reported Operating Profit 718.4 652.9
After Tax Reported Operating Profit $ 1,382.1 $ 1,400.2
July 17, 2018 23
Supplemental Information
Second Quarter Year to Date
2018 % of 2017 % of 2018 % of 2017 % of
Rev Rev Rev Rev
Revenue $ 3,859.6 $ 3,790.1 $ 7,489.2 $ 7,377.6
Operating expenses:
Salary and service costs 2,772.9 71.8 % 2,731.7 72.1 % 5,485.7 73.2 % 5,420.2 73.5 %
Occupancy and other costs 319.6 8.3 % 305.7 8.1 % 639.9 8.5 % 607.6 8.2 %
Cost of services 3,092.5 3,037.4 6,125.6 6,027.8
Selling, general and administrative expenses 117.4 3.0 % 110.1 2.9 % 222.9 3.0 % 218.8 3.0 % Depreciation and amortization 67.4 1.7 % 71.1 1.9 % 136.8 1.8 % 143.8 1.9 %
Total operating expenses 3,277.3 84.9 % 3,218.6 84.9 % 6,485.3 86.6 % 6,390.4 86.6 % Operating Profit $ 582.3 $ 571.5 $ 1,003.9 $ 987.2
Net Interest expense:
Interest expense 66.4 62.8 128.6 121.9 Interest income 13.9 11.5 29.3 25.3 Net Interest Expense $ 52.5 $ 51.3 $ 99.3 $ 96.6
July 17, 2018 24
Second Quarter Acquisition
Omnicom Health Group has acquired the pharmaceutical communications business of Elsevier in Japan. Going forward, the agency will operate under the name EMC K.K.
Established in 1980, EMC specializes in creating quality medical content for promotional materials and education programs directed at doctors and patients. The majority of EMC's services are provided on behalf of pharmaceutical clients specializing in oncology, specialty and rare diseases requiring the medical literacy unique to the agency's large pool of talented healthcare specialists.
EMC K.K. is located in Tokyo and Osaka, Japan and will operate as part of the Omnicom Health Group within the DAS Group of Companies.
July 17, 2018 25
Disclosure
The preceding materials have been prepared for use in the July 17, 2018 conference call on Omnicoms results of operations for the three and six months ended June 30, 2018. The call will be archived on the Internet at http://investor.omnicomgroup.com/investor-relations/news-events-and-filings/.
Forward-Looking Statements
Certain statements in this presentation constitute forward-looking statements, including statements within the meaning of the Private Securities Litigation Reform Act of 1995. In addition, from time to time, the Company or its representatives have made, or may make, forward-looking statements, orally or in writing. These statements may discuss goals, intentions and expectations as to future plans, trends, events, results of operations or financial condition, or otherwise, based on current beliefs of the Companys management as well as assumptions made by, and information currently available to, the Companys management. Forward-looking statements may be accompanied by words such as aim, anticipate, believe, plan, could, should, would, estimate, expect, forecast, future, guidance, intend, may, will, possible, potential, predict, project or similar words, phrases or expressions. These forward-looking statements are subject to various risks and uncertainties, many of which are outside the Companys control. Therefore, you should not place undue reliance on such statements. Factors that could cause actual results to differ materially from those in the forward-looking statements include: international, national or local economic conditions that could adversely affect the Company or its clients; losses on media purchases and production costs incurred on behalf of clients; reductions in client spending, a slowdown in client payments and a deterioration in the credit markets; ability to attract new clients and retain existing clients in the manner anticipated; changes in client advertising, marketing and corporate communications requirements; failure to manage potential conflicts of interest between or among clients; unanticipated changes relating to competitive factors in the advertising, marketing and corporate communications industries; ability to hire and retain key personnel; currency exchange rate fluctuations; reliance on information technology systems; changes in legislation or governmental regulations affecting the Company or its clients; risks associated with assumptions the Company makes in connection with its critical accounting estimates and legal proceedings; and the Companys international operations, which are subject to the risks of currency repatriation restrictions, social or political conditions and regulatory environment. The foregoing list of factors is not exhaustive. You should carefully consider the foregoing factors and the other risks and uncertainties that may affect the Companys business, including those described in the Risk Factors in Omnicoms Annual Report on Form 10-K for the year ended December 31, 2017. Except as required under applicable law, the Company does not assume any obligation to update these forward-looking statements.
Non-GAAP Financial Measures
We present financial measures determined in accordance with generally accepted accounting principles in the United States (GAAP) and adjustments to the GAAP presentation (Non-GAAP), which we believe are meaningful for understanding our performance. Non-GAAP financial measures should not be considered in isolation from, or as a substitute for, financial information presented in compliance with GAAP. Non-GAAP financial measures as reported by us may not be comparable to similarly titled amounts reported by other companies. We provide a reconciliation of non-GAAP measures to the comparable GAAP measures on pages 21 to 23.
The Non-GAAP measures used in this presentation include the following:
Free Cash Flow, defined as net income plus depreciation, amortization, share based compensation expense plus/(less) other items to reconcile to net cash provided by operating activities. We believe Free Cash Flow is a useful measure of liquidity to evaluate our ability to generate excess cash from our operations.
Primary Uses of Cash, defined as dividends to common shareholders, dividends paid to non-controlling interest shareholders, capital expenditures, cash paid on acquisitions, payments for additional interest in controlled subsidiaries and stock repurchases, net of the proceeds from our stock plans, and excludes changes in operating capital and other investing and financing activities, including commercial paper issuances and redemptions used to fund working capital changes. We believe this liquidity measure is useful in identifying the significant uses of our cash.
Net Free Cash Flow, defined as Free Cash Flow less the Primary Uses of Cash. Net Free Cash Flow is one of the metrics used by us to assess our sources and uses of cash and was derived from our consolidated statements of cash flows. We believe that this liquidity measure is meaningful for understanding our primary sources and primary uses of that cash flow.
EBITDA, defined as operating profit before interest, taxes, depreciation and amortization. We believe EBITDA is meaningful operating performance measure because the financial covenants in our credit facilities are based on EBITDA.
EBITA, defined as operating profit before interest, taxes and amortization and EBITA margin, defined as EBITA divided by revenue. We use EBITA and EBITA margin as additional operating performance measures, which excludes the non-cash amortization expense of intangible assets (primarily consisting of amortization arising from acquisitions). Accordingly, we believe it is a useful measure for investors to evaluate the performance of our businesses.
Net Debt, defined as total debt less cash, cash equivalents and short-term investments. We believe net debt, together with the comparable GAAP measures, reflects one of the liquidity metrics used by us to assess our cash management.
After Tax Reported Operating Profit, defined as reported operating profit less income taxes calculated using the effective tax rate for the applicable period. Management uses after tax operating profit as a measure of after tax operating performance as it excludes the after tax effects of financing and investing activities on results of operations.
Other Information
All dollar amounts are in millions except for per share amounts and figures shown on pages 2 and 4 and the net cash returned to shareholders figures on page 14. The information contained in this document has not been audited, although some data has been derived from Omnicoms historical financial statements, including its audited financial statements. In addition, industry, operational and other non-financial data contained in this document have been derived from sources that we believe to be reliable, but we have not independently verified such information, and we do not, nor does any other person, assume responsibility for the accuracy or completeness of that information. Certain amounts in prior periods have been reclassified to conform to our current presentation.
The inclusion of information in this presentation does not mean that such information is material or that disclosure of such information is required.
July 17, 2018 26
4UG_;$]K:&*RM[2W@]S_X+E/I7QH_9J_9G
M_:#^&6K6_B_X96/C3Q3IB>(]*2=K*>#QSI5G_9.I!;B*"ZBL6O/ NH:>;F6W
M2$7EQ9P,ZR7=JLWF/_!5?]J?X+_&[]B?]DWX>?"[QOX<\;>,?$/B7P+XZOO#
M?AK6K/6?$'A6#PW\,O$/A2ZT;Q/HE@9M1T369]>\9QZ;:V&J0V-Y J::9_7M.I3K4Z=:E.%6E5A&I2J4Y
M*<*E.<5*$X3BW&4)Q:E&46U)---IA1114EA1110 4444 %%%% !1110 4444
M %%%% !1110 5^>7[27QQ/B&YNOA_P"$[P'0+.8Q>(=3MI,KK5Y!(I_L^WD4
M '3+*:,F:5&9-0N54H?LD"/=^M_M,?&0^$],;P-X;N]GB76;;.K7<#_O=$T>
M=<>6KJ?W6HZHA*PX/FVMB9+D"*2XL9Z_.&O#Q
M6(PKJ)*;H5JE+G2U2ER2C>W2^VMMV'W/U2?Y]?/<\CN/@)\&KKX/-^S_ #?#
MCPN?@RWA^/PP?AXFGK#X?&CQ3+=QQ)#"T=Q'>IJ")JZZPEPNL#6U&N"__M?_
M $VOCCP3_P $DOV"/ UQKUQ:_!&'Q"_B#2-7T&5?&'BSQ?XCBTO2]=T^\TO4
M4T*.]UO;I.I&SO9%T_Q';8\3:)H>$O%T\CMD;MZ-IL2IA@NV23<"=I7\,:_#.-Z?)Q%BY?
M\_:6$J?=AJ=+_P!Q];_=8_TY^C+B?;^$624O^@/,<]PW7[6:XG&==/\ F*^S
M9?\ ;W,V4445\D?OY;L$L9+ZRCU2YN[/39+NW34;NPLH=2OK6Q:9%N[FRTZX
MO]*M[^[@MS)+;V4^J:;#=3*D$M_9I(UQ'^JNA_M;?LY>'OA;^TI^SC9ZW\3)
M_@)XR^ FA?#OX)@?LE?LZZ7\5G^(=MXR\$?%?5?$_P 4_B;I_P 8_P#A8MMX
M?;XE>!!<+H$/Q"^(_AV_L?&%W?V'@_PDW@?PEH4GY/U] ^$/V9OBGXY^#\_Q
ML\-6F@:GX7?XR^"/@#HFAV?B32]0\?\ BCXJ_$'3-:UCP[X;T;P'IDU.\H.ZG.-.]W&*/TPUK]O']D>Z\3?#+Q5;:+^T1JUEI/[3G[+'QE^
M)GPXU_P=\+HO"VM_#G]F+X36/PR^'GPX\/ZW8?$634'?X?:<=>TV*;6]$?3?
MBG::PFLZG:?#*^M9-+N_*]%_;=^$/AKP#X;U*TE^+VN_^"_VQO GAK1;
M[P?X6T/X8?$?7?VMKKX@Z)JW[0'Q$U:V^*FMZSH/CC2?AS\08_#-Y\-M+\'>
M+;#4;CP#X)=OBM_9]O/9Q^+7O[#W_"'26FN>._CS\%M2\$^'OB=)\(/C%??#
MC7_%&M7/PJ^)LO@OQKXS\,_#[7O$?B+P/X<^'>IWWCUOA_XF\*Z%XZ\ >+/B
M'\-M"UNQGO?%7B33]*@AEON6_:$_9@T3X-6M_P"(;+Q-XGO?#][I/@*3PO8G
MPK-K<\7B/7_!GA37_%^F>,?%ENWA_P /:!H&CZ[JOB/1? >NFR;Q-\4-%T31
M?'^F_#S1OAYXU\,>*[_QZ6#R64J6'A5Q%3G45%253EG"%.>%5&4G1B[5,-BI
M1:NI2PLJ5135&%"4G7S50J5W3HPY6U/EY%*+YH5_:N/M&ERU:,7%O3VRG!
M18U_,=:
MFZ5:K2>].I.F_6$G'N^W=^I_M5E>*6-RS+L8ML7@<)BEUTQ&'IU5JXQ_G_EC
M_A6R****S.X**** "BBB@!55F9552S,0JJH)9F)P%4#)))( &2>!7WC\-_"
M(\'>&+6QFC4:I>'[?J[C8S"\F1 +42(6#164*QVZA9'A:9;BYBQ]I8'Y[^"7
MA!M9U_\ X2*[B)TSP](DEN65@EQK)7?:(C KDZ>"-0D*.6BG6P$B-%<$'["K
MW
$LK%_'^O
MW>4&!B_NC?!2#_$HN KG^)PS#(-> 5]4_MMZ>^F_M2?%NW?R
!Q-"BJN-JXK PRRM6Q;K?9&M_LJ_"7PGX+U^#5[
M?XL:U\1?"WC+]G#P#/J>G^*/"VA^!O%GC7XVZ1+XU\1>%O#6E3_#OQ!KEHG@
M[P=!'9VGB2YUW4DUC5]1M]8_X1^WTN*WT[5M#Q!^R?\ N+4;W4_#VK?%J3P
M=X6UK]J"^UN"74_">M^(?&7P^_9]F\/Z?IVM^$KNS\)Z1IN@WOBCQ%KS>'YI
M+^S\46UA8:/J/B^2VAAQX=B^*F^//QR;3]/TEOC-\5VTO2?^$<_LK36^(GB\
MZ?IG_"'W$=YX2_L^S.L?9[+_ (1:[BBNO#GV:./^Q+B..?3/LLJ*PDTKXA_'
M?P]H.A>(]$\<_%O0_#&A>)M=A\,Z]I7B;QCIF@Z-XRU:SCO_ !+%H6J6E[!I
M^G^)M3T^_BO-=CT^>'5;VSO8[B_$L%PKOLN'N,(*,ZO%,8UYUJR:^LXE4<2\
M1E,,-)0A4HN.&G_:%&>/P]"C3J4\(L57C14HX?#0CS+C'PVJ2J4Z/ ,ZF%IX
M:E*+>$P