ppt.htm - Generated by SEC Publisher for SEC Filing

First
Quarter 2013 Results
April
18, 2013
Investor
Presentation
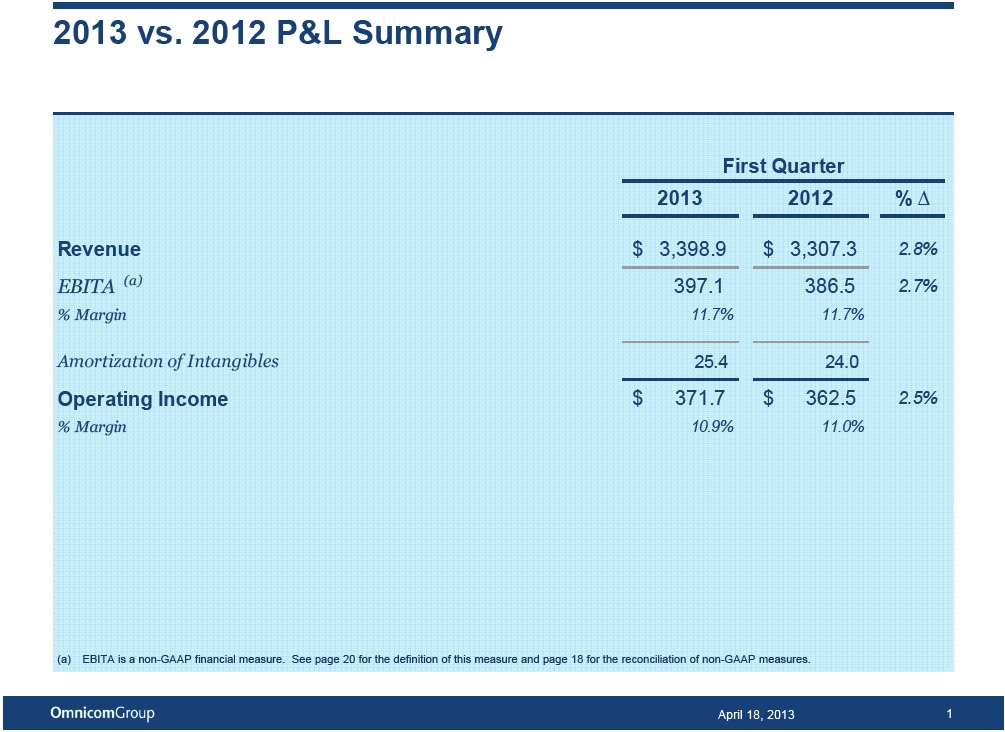
2013
vs. 2012 P&L Summary
First
Quarter
2013
2012 %
Revenue
$ 3,398.9 $ 3,307.3 2.8% EBITA (a) 397.1 386.5 2.7%
%
Margin 11.7% 11.7%
Amortization
of Intangibles 25.4 24.0
Operating
Income $ 371.7 $ 362.5 2.5%
%
Margin 10.9% 11.0%
(a)
EBITA is a non-GAAP financial measure. See page 20 for the definition of this measure and page 18 for the reconciliation of non-GAAP
measures.
April
18, 2013 1
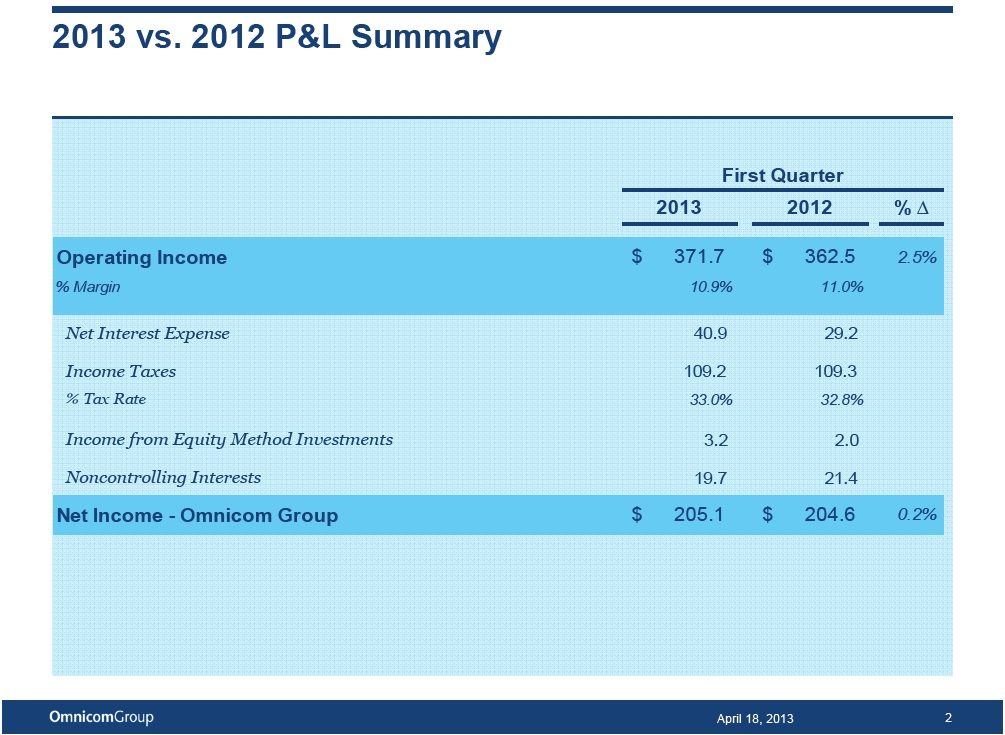
2013
vs. 2012 P&L Summary
First
Quarter
2013
2012 %
Operating
Income $ 371.7 $ 362.5 2.5%
%
Margin 10.9% 11.0%
Net
Interest Expense 40.9 29.2
Income
Taxes 109.2 109.3
%
Tax Rate 33.0% 32.8%
Income
from Equity Method Investments 3.2 2.0
Noncontrolling
Interests 19.7 21.4
Net
Income - Omnicom Group $ 205.1 $ 204.6 0.2%
April
18, 2013 2
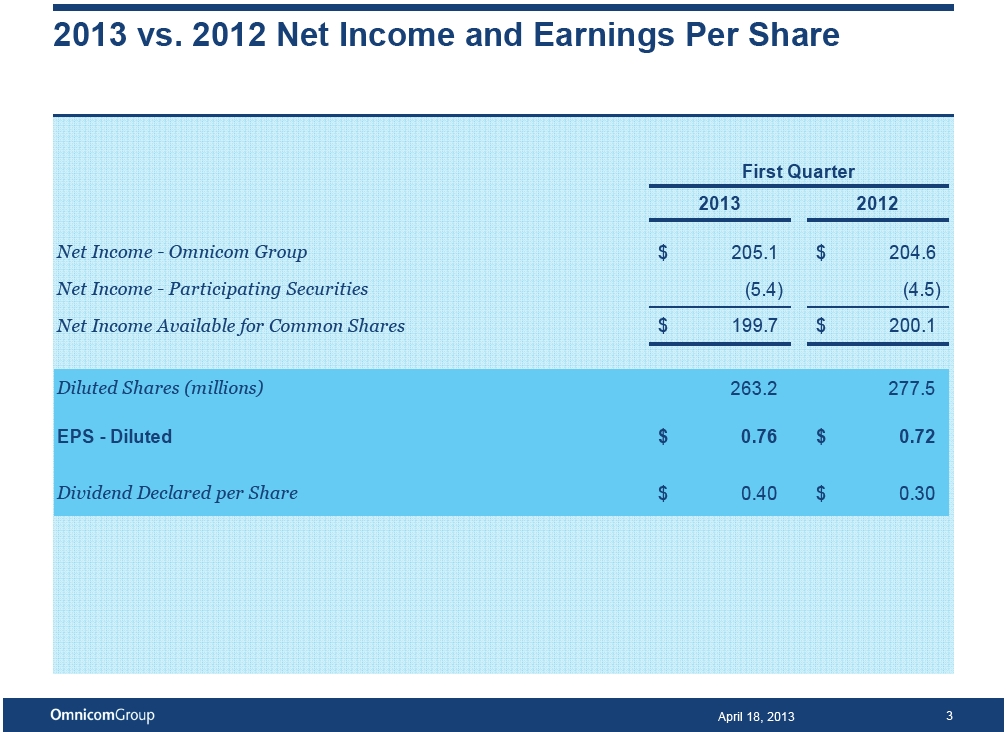
2013
vs. 2012 Net Income and Earnings Per Share
First
Quarter
2013
2012
Net
Income - Omnicom Group $ 205.1 $ 204.6 Net Income - Participating Securities (5.4) (4.5) Net Income Available
for Common Shares $ 199.7 $ 200.1
Diluted
Shares (millions) 263.2 277.5
EPS
- Diluted $ 0.76 $ 0.72
Dividend
Declared per Share $ 0.40 $ 0.30
April
18, 2013 3
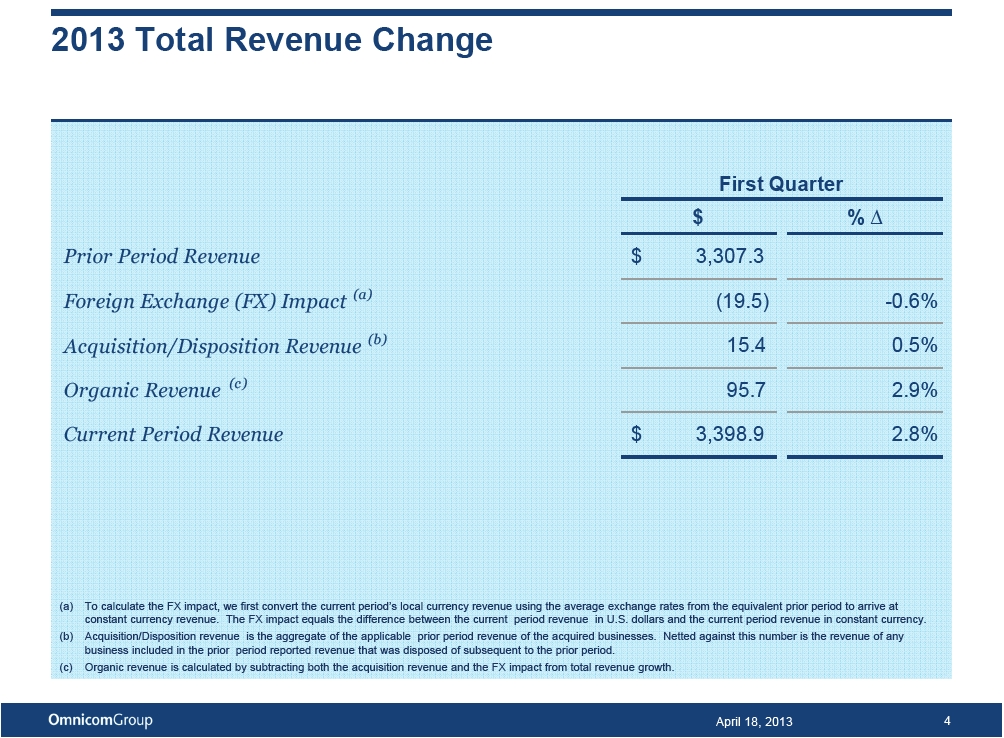
2013
Total Revenue Change
First
Quarter $%
Prior
Period Revenue $ 3,307.3
Foreign
Exchange (FX) Impact (a) (19.5) -0.6% Acquisition/Disposition Revenue (b) 15.4 0.5% Organic Revenue (c) 95.7
2.9% Current Period Revenue $ 3,398.9 2.8%
(a)
To calculate the FX impact, we first convert the current period’s local currency revenue using the average exchange rates
from the equivalent prior period to arrive at constant currency revenue. The FX impact equals the difference between the current
period revenue in U.S. dollars and the current period revenue in constant currency.
(b)
Acquisition/Disposition revenue is the aggregate of the applicable prior period revenue of the acquired businesses. Netted against
this number is the revenue of any business included in the prior period reported revenue that was disposed of subsequent to the
prior period.
(c)
Organic revenue is calculated by subtracting both the acquisition revenue and the FX impact from total revenue growth.
April
18, 2013 4
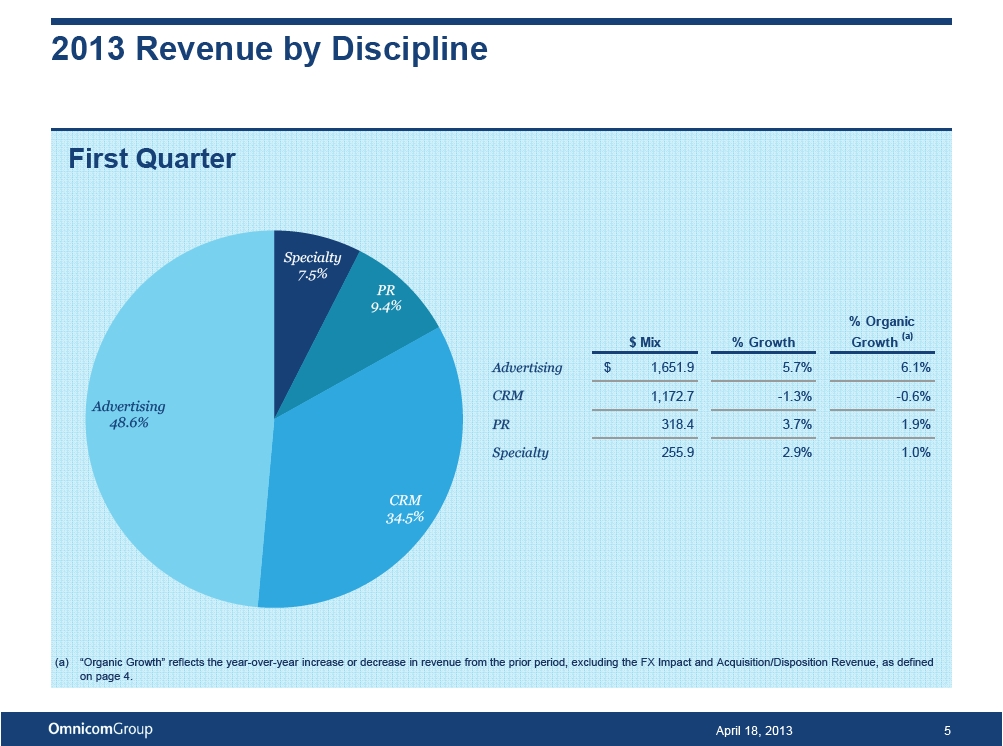
2013
Revenue by Discipline
First
Quarter
Specialty
7.5%
PR
9.4%
%
Organic $ Mix % Growth Growth (a)
Advertising
$ 1,651.9 5.7% 6.1% CRM 1,172.7 -1.3% -0.6%
Advertising
48.6%
PR 318.4 3.7% 1.9% Specialty 255.9 2.9% 1.0%
CRM
34.5%
(a)
“Organic Growth” reflects the year-over-year increase or decrease in revenue from the prior period, excluding the FX
Impact and Acquisition/Disposition Revenue, as defined on page 4.
April
18, 2013 5
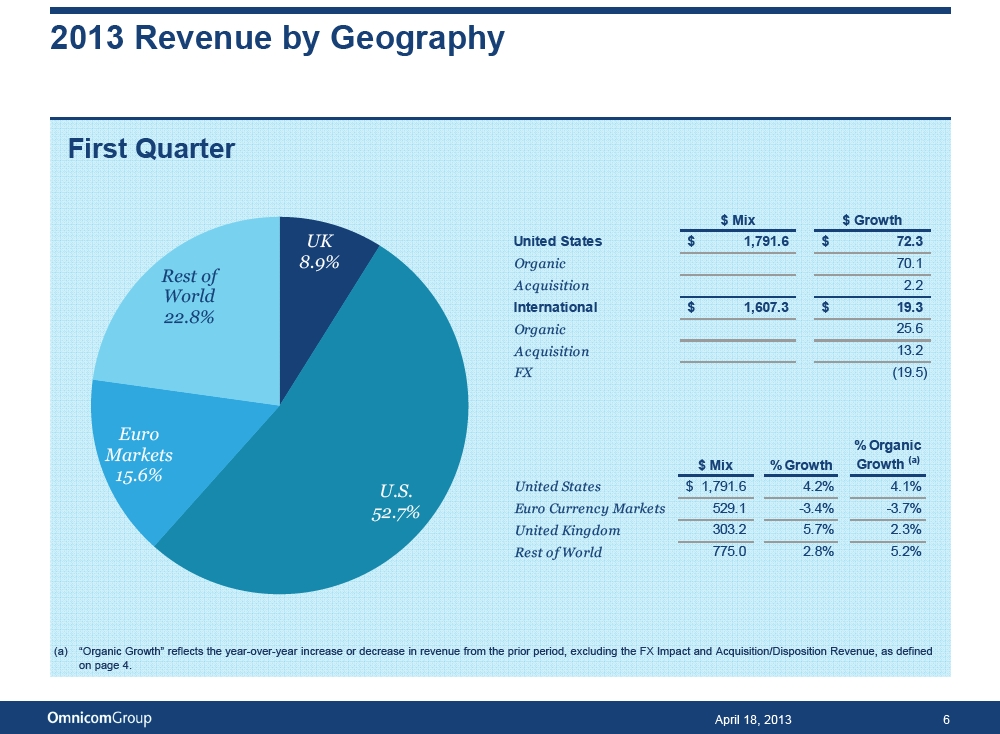
2013
Revenue by Geography
First
Quarter
$
Mix $ Growth
UK
United States $ 1,791.6 $ 72.3
8.9%
Organic 70.1
Rest
of
Acquisition
2.2
World
International
$ 1,607.3 $ 19.3
22.8%
Organic
25.6 Acquisition 13.2
FX
(19.5)
Euro
%
Organic
Markets
(a)
$
Mix % Growth Growth
15.6%
U.S.
United States $ 1,791.6 4.2% 4.1%
52.7%
Euro Currency Markets 529.1 -3.4% -3.7% United Kingdom 303.2 5.7% 2.3%
Rest
of World 775.0 2.8% 5.2%
(a)
“Organic Growth” reflects the year-over-year increase or decrease in revenue from the prior period, excluding the FX
Impact and Acquisition/Disposition Revenue, as defined on page 4.
April
18, 2013 6
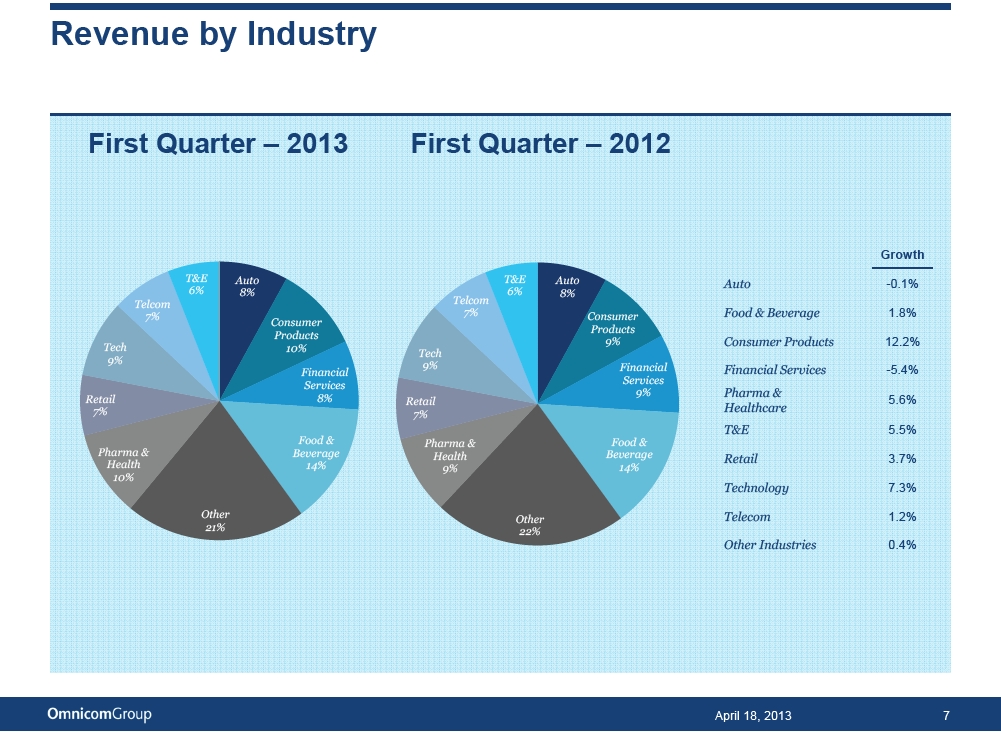
Revenue
by Industry
First
Quarter – 2013 First Quarter – 2012
Growth
T&E
Auto T&E Auto Auto -0.1%
6%
8% 6% 8% Telcom Telcom
7%
7% Consumer Food & Beverage 1.8% Consumer Products Products
9%
Consumer Products 12.2% Tech 10% Tech 9%
9%
Financial Financial Services -5.4% Financial Services Services
9%
Pharma &
Retail
8% Retail 5.6%
7%
Healthcare 7%
T&E
5.5%
Food
& Pharma & Food & Pharma & Beverage Health Beverage
Retail
3.7% Health 14% 9% 14% 10% Technology 7.3%
Other
Other Telecom 1.2% 21% 22% Other Industries 0.4%
April
18, 2013 7
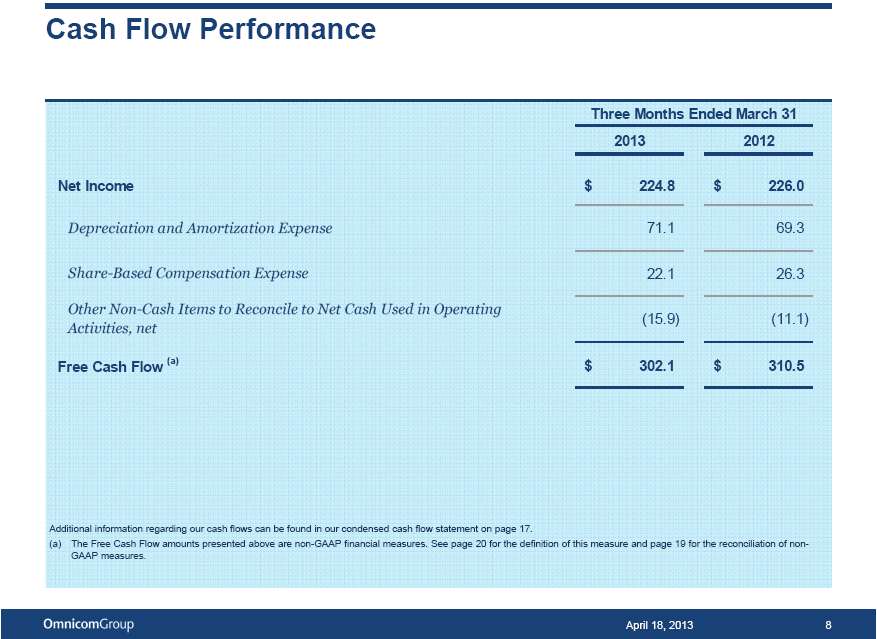
Cash
Flow Performance
Three
Months Ended March 31 2013 2012
Net
Income $ 224.8 $ 226.0
Depreciation
and Amortization Expense 71.1 69.3
Share-Based
Compensation Expense 22.1 26.3
Other
Non-Cash Items to Reconcile to Net Cash Used in Operating
(15.9)
(11.1)
Activities,
net
Free
Cash Flow (a) $ 302.1 $ 310.5
Additional
information regarding our cash flows can be found in our condensed cash flow statement on page 17.
(a)
The Free Cash Flow amounts presented above are non-GAAP financial measures. See page 20 for the definition of this measure and
page 19 for the reconciliation of non-GAAP measures.
April
18, 2013 8
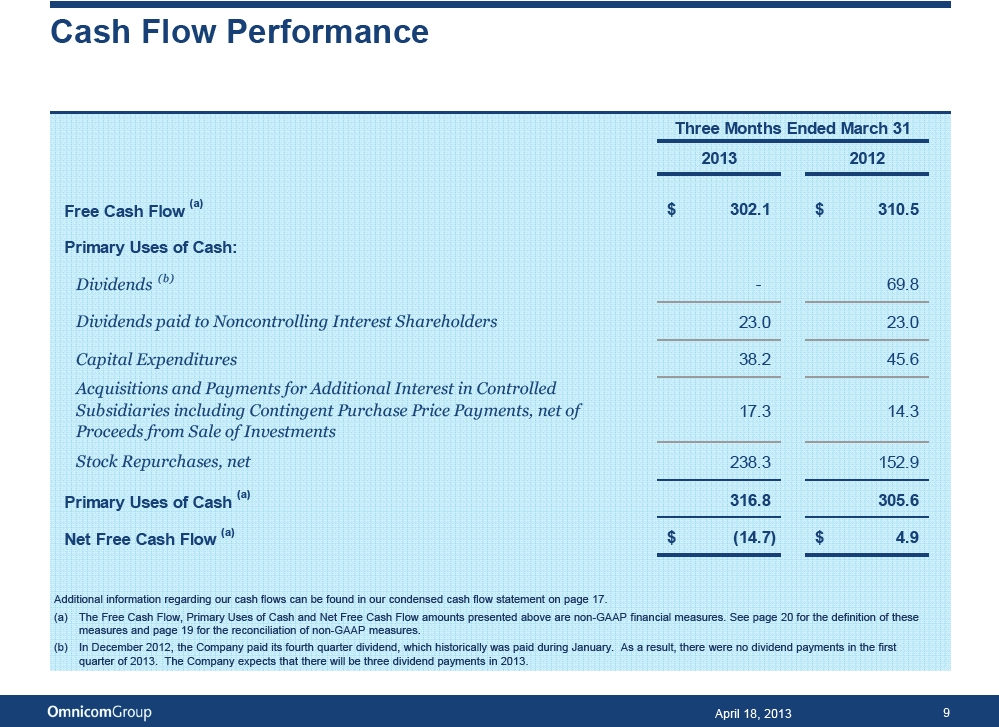
Cash
Flow Performance
Three
Months Ended March 31 2013 2012
Free
Cash Flow (a) $ 302.1 $ 310.5 Primary Uses of Cash:
Dividends
(b) - 69.8 Dividends paid to Noncontrolling Interest Shareholders 23.0 23.0
Capital
Expenditures 38.2 45.6 Acquisitions and Payments for Additional Interest in Controlled Subsidiaries including Contingent
Purchase Price Payments, net of 17.3 14.3 Proceeds from Sale of Investments Stock Repurchases, net 238.3 152.9
Primary
Uses of Cash (a) 316.8 305.6 Net Free Cash Flow (a) $ (14.7) $ 4.9
Additional
information regarding our cash flows can be found in our condensed cash flow statement on page 17.
(a)
The Free Cash Flow, Primary Uses of Cash and Net Free Cash Flow amounts presented above are non-GAAP financial measures. See page
20 for the definition of these measures and page 19 for the reconciliation of non-GAAP measures.
(b)
In December 2012, the Company paid its fourth quarter dividend, which historically was paid during January. As a result, there
were no dividend payments in the first quarter of 2013. The Company expects that there will be three dividend payments in 2013.
April
18, 2013 9
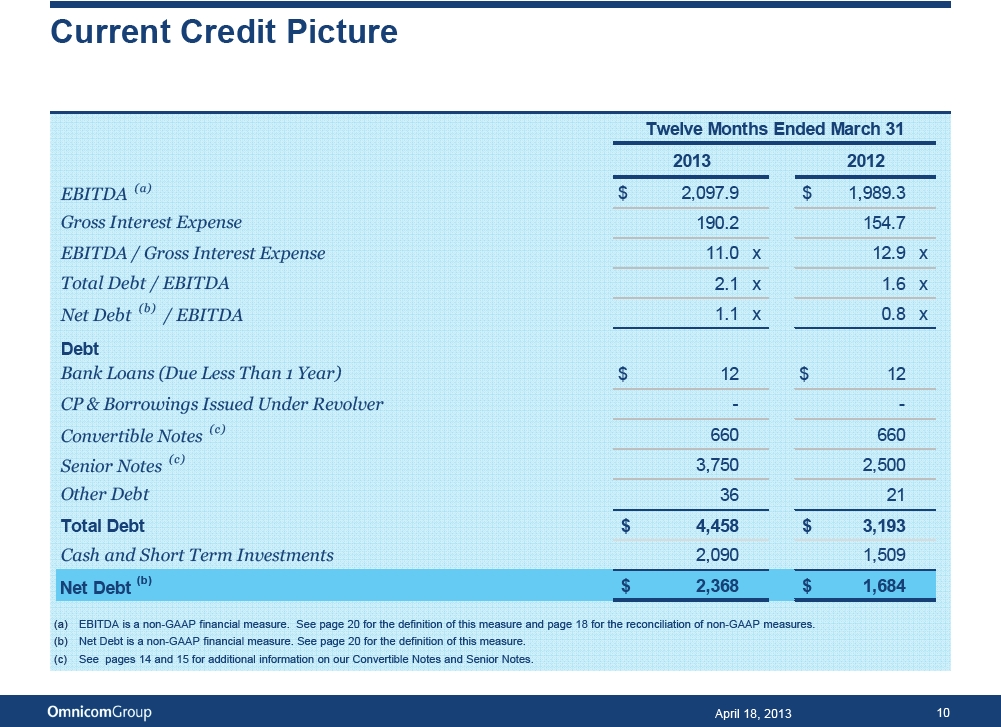
Current
Credit Picture
Twelve
Months Ended March 31 2013 2012
EBITDA
(a) $ 2,097.9 $ 1,989.3
Gross
Interest Expense 190.2 154.7 EBITDA / Gross Interest Expense 11.0 x 12.9 x Total Debt / EBITDA 2.1 x 1.6 x Net
Debt (b) / EBITDA 1.1 x 0.8 x
Debt
Bank
Loans (Due Less Than 1 Year) $12 $ 12 CP & Borrowings Issued Under Revolver - -Convertible Notes (c)
660 660 Senior Notes (c) 3,750 2,500 Other Debt 36 21
Total
Debt $ 4,458 $ 3,193
Cash
and Short Term Investments 2,090 1,509
Net
Debt (b) $2,368 $ 1,684
(a)
EBITDA is a non-GAAP financial measure. See page 20 for the definition of this measure and page 18 for the reconciliation of non-GAAP
measures. (b) Net Debt is a non-GAAP financial measure. See page 20 for the definition of this measure.
(c)
See pages 14 and 15 for additional information on our Convertible Notes and Senior Notes.
April
18, 2013 10
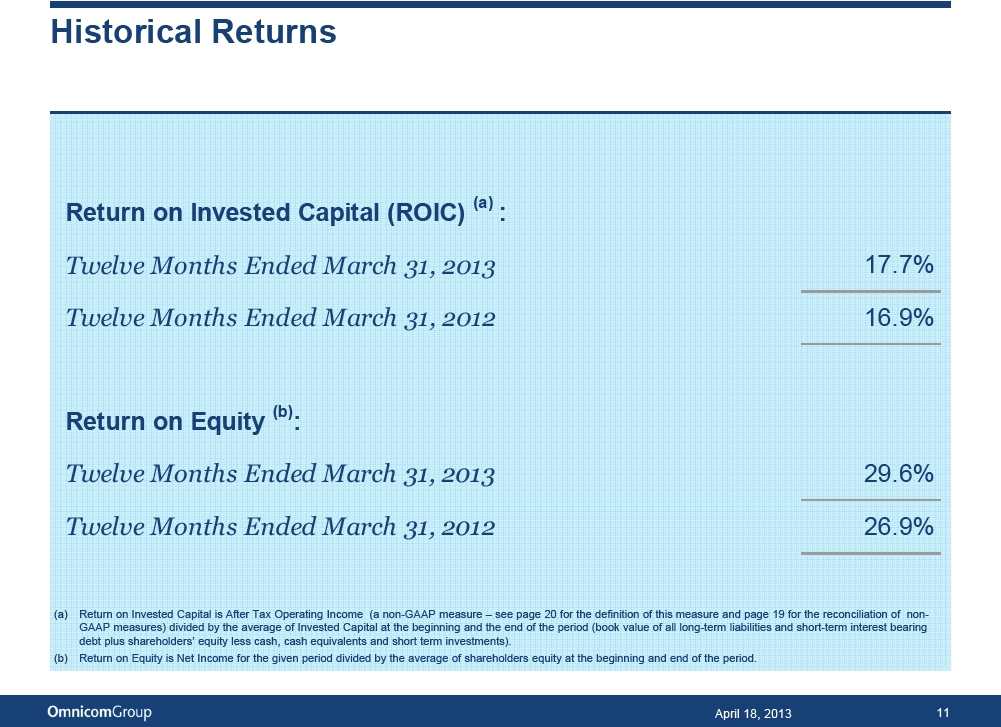
Historical
Returns
Return
on Invested Capital (ROIC) (a) :
Twelve
Months Ended March 31, 2013 17.7%
Twelve
Months Ended March 31, 2012 16.9%
Return
on Equity (b):
Twelve
Months Ended March 31, 2013 29.6%
Twelve
Months Ended March 31, 2012 26.9%
(a)
Return on Invested Capital is After Tax Operating Income (a non-GAAP measure – see page 20 for the definition of this measure
and page 19 for the reconciliation of non-GAAP measures) divided by the average of Invested Capital at the beginning and the end
of the period (book value of all long-term liabilities and short-term interest bearing debt plus shareholders’ equity less
cash, cash equivalents and short term investments) .
(b)
Return on Equity is Net Income for the given period divided by the average of shareholders equity at the beginning and end of
the period.
April
18, 2013 11
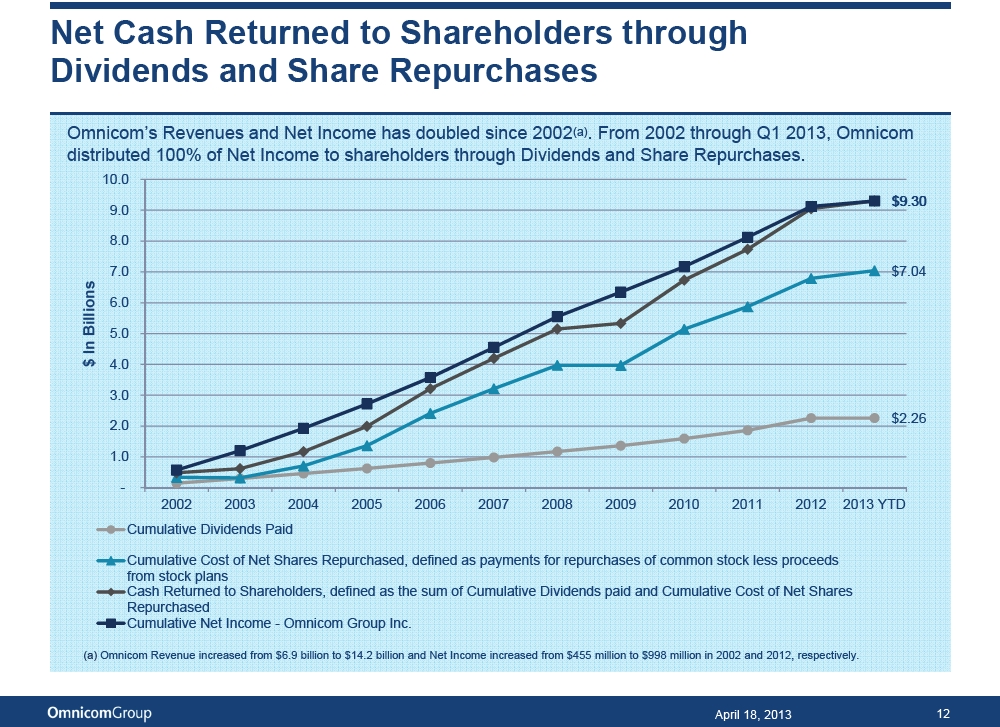
Net
Cash Returned to Shareholders through Dividends and Share Repurchases
Omnicom’s
Revenues and Net Income has doubled since 2002(a). From 2002 through Q1 2013, Omnicom distributed 100% of Net Income
to shareholders through Dividends and Share Repurchases .
10.0
$9.30
9.0
8.0
7.0
$7.04
Billions
6.0 5.0
In
$
4.0
3.0
$2.26 2.0
1.0
-
2002
2003 2004 2005 2006 2007 2008 2009 2010 2011 2012 2013 YTD Cumulative Dividends Paid
Cumulative
Cost of Net Shares Repurchased, defined as payments for repurchases of common stock less proceeds from stock plans Cash Returned
to Shareholders, defined as the sum of Cumulative Dividends paid and Cumulative Cost of Net Shares Repurchased Cumulative Net
Income - Omnicom Group Inc.
(a)
Omnicom Revenue increased from $6.9 billion to $14.2 billion and Net Income increased from $455 million to $998
million in 2002 and 2012, respectively .
April
18, 2013 12
 Supplemental Financial Information
April
18, 2013 13
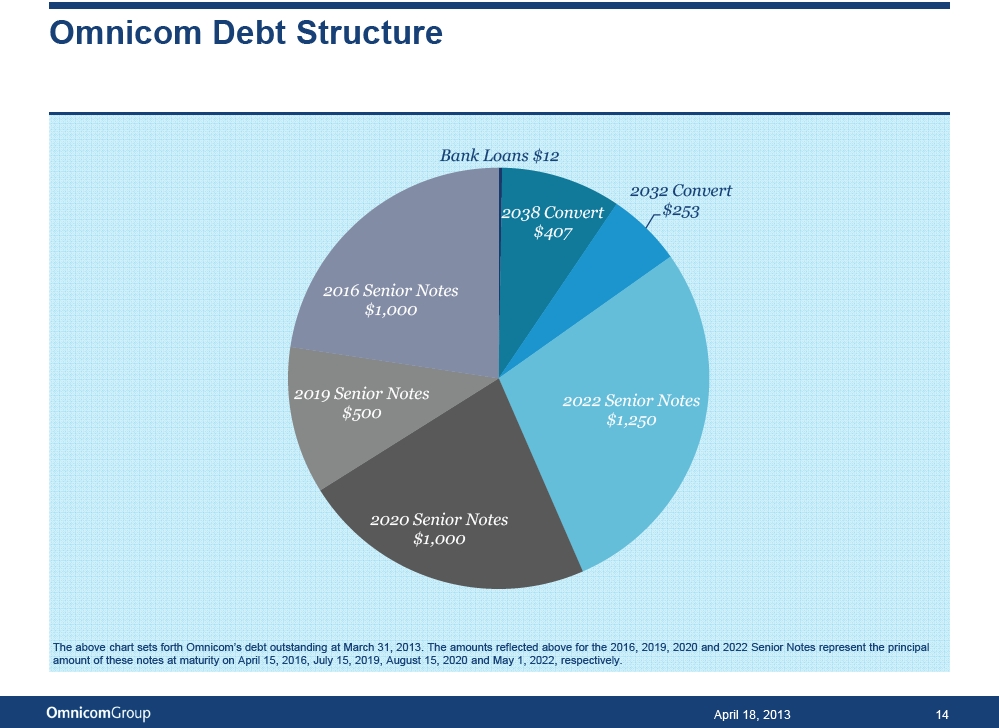
Omnicom
Debt Structure
Bank
Loans $12
2032
Convert 2038 Convert $253 $407
2016
Senior Notes $1,000
2019
Senior Notes 2022 Senior Notes $500 $1,250
2020
Senior Notes $1,000
The
above chart sets forth Omnicom’s debt outstanding at March 31, 2013. The amounts reflected above for the 2016, 2019, 2020
and 2022 Senior Notes represent the principal amount of these notes at maturity on April 15, 2016, July 15, 2019, August 15, 2020
and May 1, 2022, respectively.
April
18, 2013 14
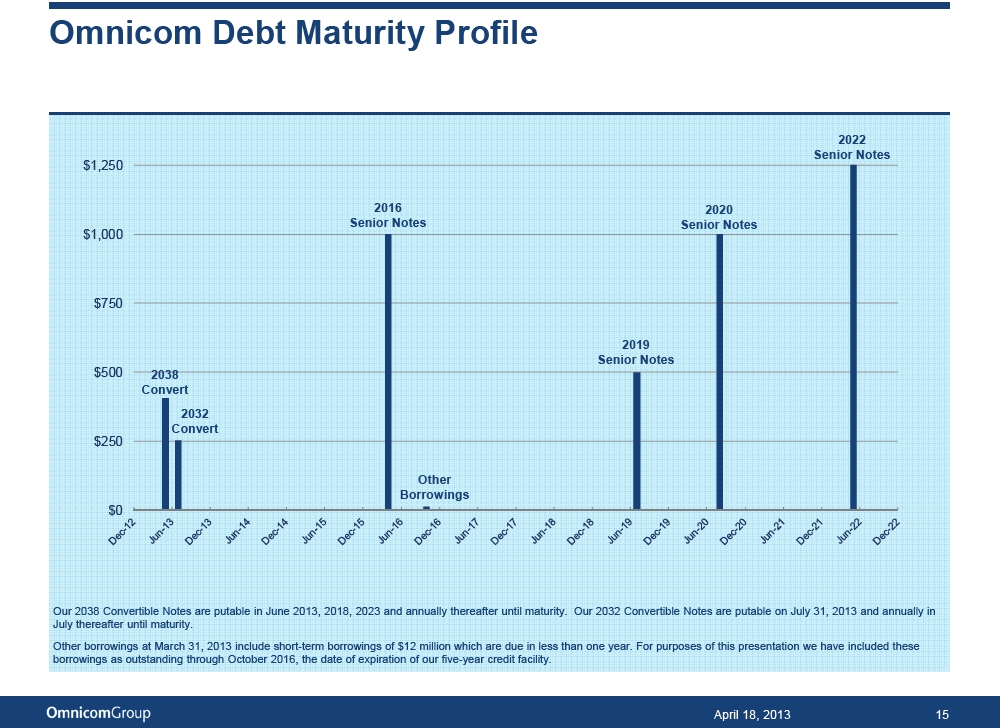
Omnicom
Debt Maturity Profile
2022
Senior Notes $1,250
2016
2020 Senior Notes Senior Notes $1,000
$750
2019
Senior Notes $500 2038 Convert 2032 Convert $250
Other
Borrowings $0
Our
2038 Convertible Notes are putable in June 2013, 2018, 2023 and annually thereafter until maturity. Our 2032 Convertible Notes
are putable on July 31, 2013 and annually in July thereafter until maturity.
Other
borrowings at March 31, 2013 include short-term borrowings of $12 million which are due in less than one year. For purposes
of this presentation we have included these borrowings as outstanding through October 2016, the date of expiration of our five-year
credit facility.
April
18, 2013 15
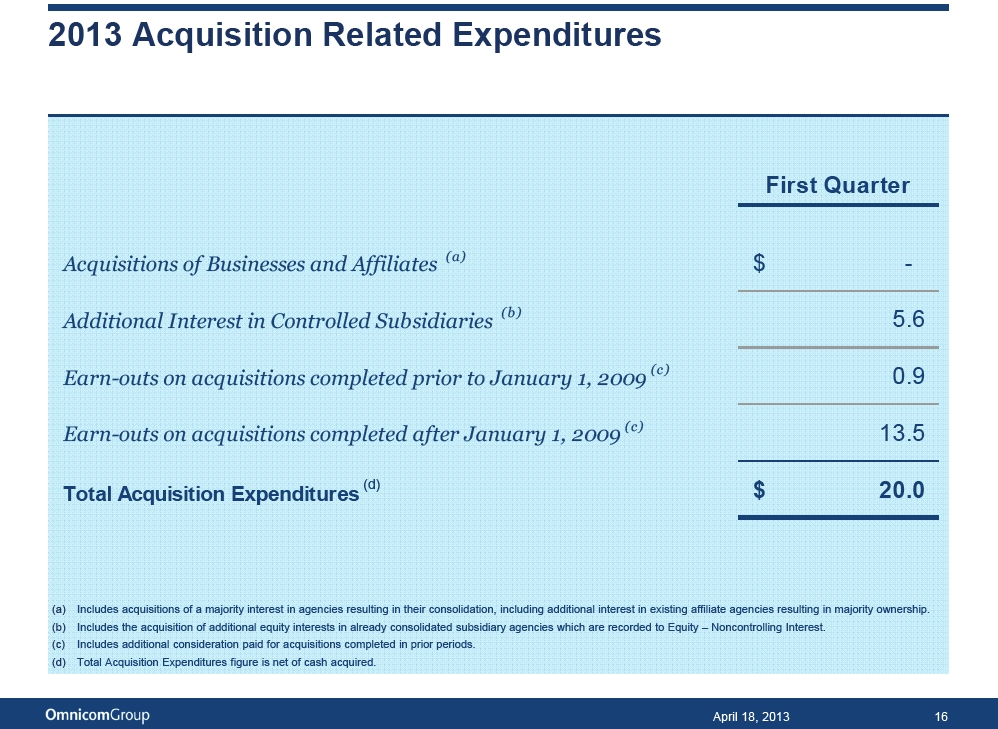 2013 Acquisition Related Expenditures
First
Quarter
Acquisitions
of Businesses and Affiliates (a) $ -Additional Interest in Controlled Subsidiaries (b) 5.6 Earn -outs on acquisitions
completed prior to January 1, 2009 (c) 0.9 Earn -outs on acquisitions completed after January 1, 2009 (c) 13.5
Total
Acquisition Expenditures (d) $ 20.0
(a)
Includes acquisitions of a majority interest in agencies resulting in their consolidation, including additional interest in existing
affiliate agencies resulting in majority ownership. (b) Includes the acquisition of additional equity interests in already consolidated
subsidiary agencies which are recorded to Equity – Noncontrolling Interest.
(c)
Includes additional consideration paid for acquisitions completed in prior periods. (d) Total Acquisition Expenditures figure
is net of cash acquired.
April
18, 2013 16
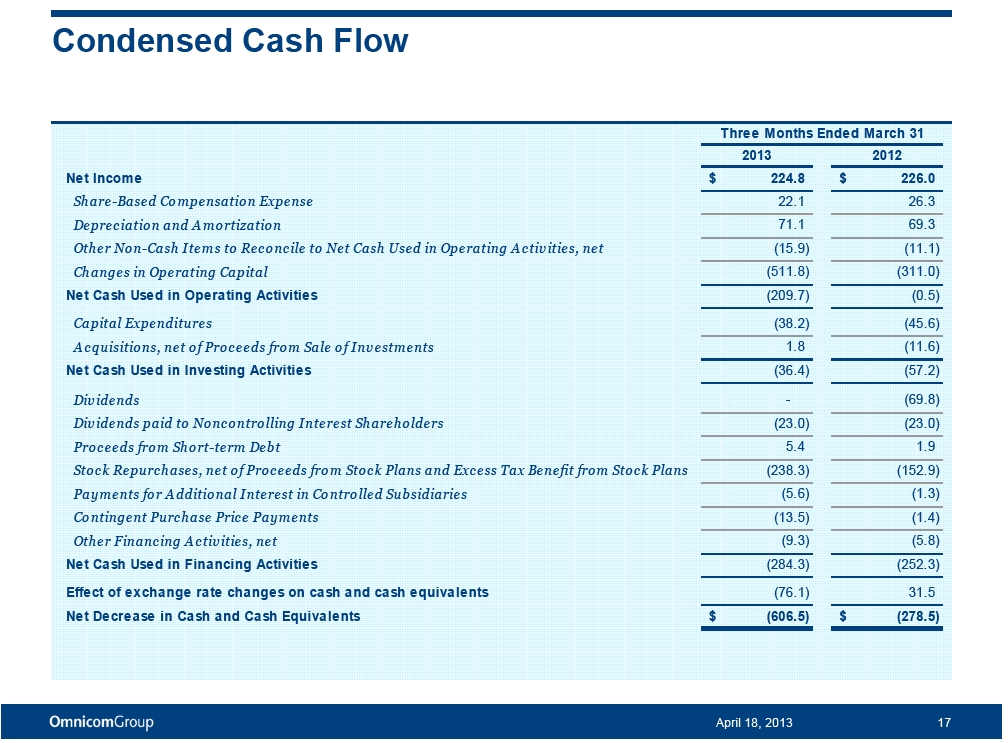
Condensed
Cash Flow
Three
Months Ended March 31 2013 2012 Net Income $ 224.8 $ 226.0
Share-Based
Compensation Expense 22.1 26.3 Depreciation and Amortization 71.1 69.3 Other Non-Cash Items to Reconcile to Net
Cash Used in Operating Activities, net (15.9) (11.1) Changes in Operating Capital (511.8) (311.0)
Net
Cash Used in Operating Activities (209.7) (0.5)
Capital
Expenditures (38.2) (45.6) Acquisitions, net of Proceeds from Sale of Investments 1.8 (11.6)
Net
Cash Used in Investing Activities (36.4) (57.2)
Dividends
- (69.8) Dividends paid to Noncontrolling Interest Shareholders (23.0) (23.0) Proceeds from Short-term
Debt 5.4 1.9 Stock Repurchases, net of Proceeds from Stock Plans and Excess Tax Benefit from Stock
Plans (238.3) (152.9) Payments for Additional Interest in Controlled Subsidiaries (5.6) (1.3) Contingent Purchase
Price Payments (13.5) (1.4) Other Financing Activities, net (9.3) (5.8)
Net
Cash Used in Financing Activities (284.3) (252.3) Effect of exchange rate changes on cash and cash equivalents (76.1)
31.5 Net Decrease in Cash and Cash Equivalents $ (606.5) $ (278.5)
April
18, 2013 17
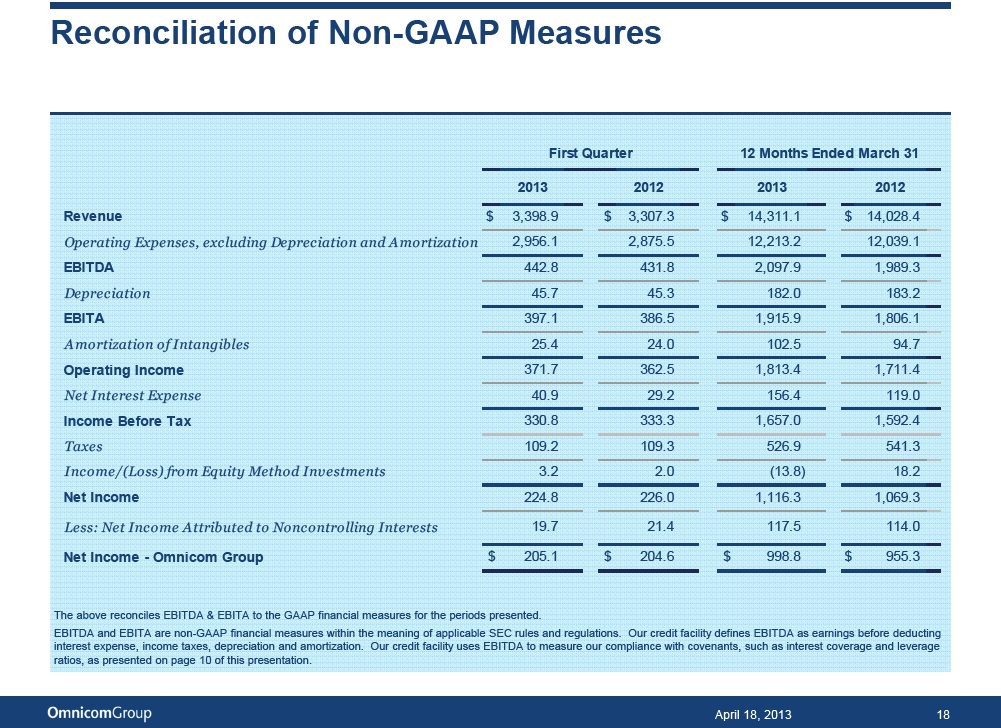
Reconciliation
of Non-GAAP Measures
First
Quarter 12 Months Ended March 31
2013
2012 2013 2012
Revenue
$ 3,398.9 $ 3,307.3 $ 14,311.1 $ 14,028.4
Operating
Expenses, excluding Depreciation and Amortization 2,956.1 2,875.5 12,213.2 12,039.1
EBITDA
442.8 431.8 2,097.9 1,989.3 Depreciation 45.7 45.3 182.0 183.2 EBITA 397.1 386.5 1,915.9 1,806.1
Amortization
of Intangibles 25.4 24.0 102.5 94.7
Operating
Income 371.7 362.5 1,813.4 1,711.4
Net
Interest Expense 40.9 29.2 156.4 119.0
Income
Before Tax 330.8 333.3 1,657.0 1,592.4 Taxes 109.2 109.3 526.9 541.3
Income/(Loss)
from Equity Method Investments 3.2 2.0 (13.8) 18.2
Net
Income 224.8 226.0 1,116.3 1,069.3
Less:
Net Income Attributed to Noncontrolling Interests 19.7 21.4 117.5 114.0
Net
Income - Omnicom Group $ 205.1 $ 204.6 $ 998.8 $ 955.3
The
above reconciles EBITDA & EBITA to the GAAP financial measures for the periods presented.
EBITDA
and EBITA are non-GAAP financial measures within the meaning of applicable SEC rules and regulations. Our credit facility defines
EBITDA as earnings before deducting interest expense, income taxes, depreciation and amortization. Our credit facility uses EBITDA
to measure our compliance with covenants, such as interest coverage and leverage ratios, as presented on page 10 of this presentation.
April
18, 2013 18
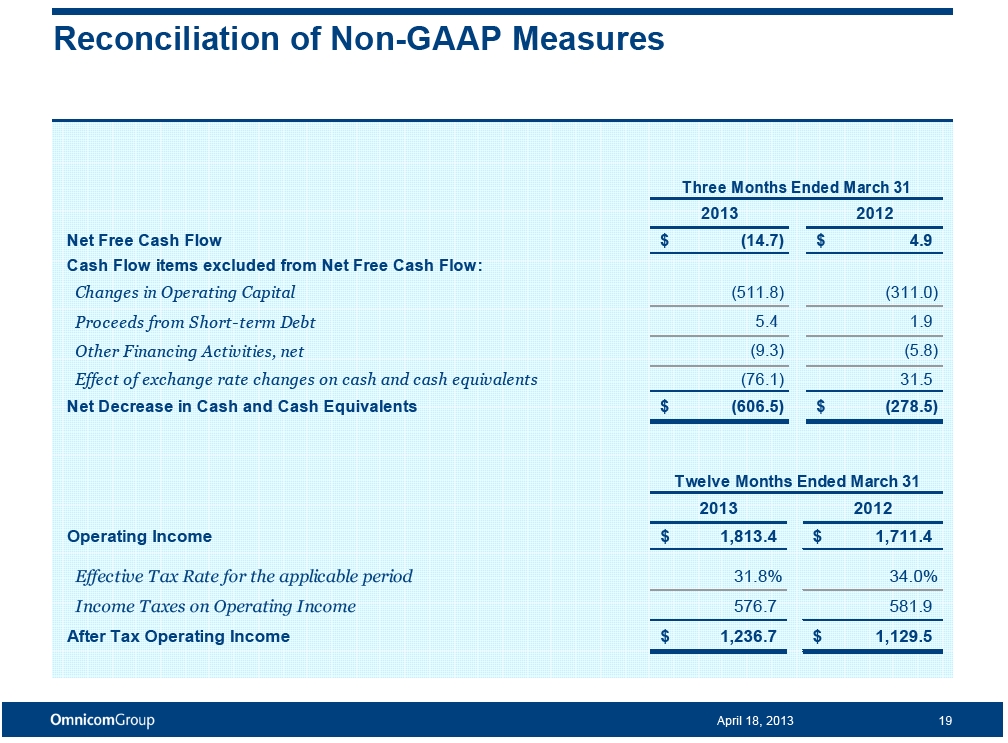 Reconciliation of Non-GAAP Measures
Three
Months Ended March 31 2013 2012 Net Free Cash Flow $ (14.7) $ 4.9 Cash Flow items excluded from Net Free Cash Flow:
Changes
in Operating Capital (511.8) (311.0) Proceeds from Short-term Debt 5.4 1.9 Other Financing
Activities, net (9.3) (5.8) Effect of exchange rate changes on cash and cash equivalents (76.1) 31.5
Net
Decrease in Cash and Cash Equivalents $ (606.5) $ (278.5)
Twelve
Months Ended March 31 2013 2012 Operating Income $ 1,813.4 $ 1,711.4
Effective
Tax Rate for the applicable period 31.8% 34.0% Income Taxes on Operating Income 576.7 581.9
After
Tax Operating Income $ 1,236.7 $ 1,129.5
April
18, 2013 19
Disclosure
The preceding materials have
been prepared for use in the April 18, 2013 conference call on Omnicom’s results of operations for the period ended March
31, 2013. The call will be archived on the Internet at http://www. omnicomgroup. com/financialwebcasts.
Forward-Looking
Statements
Certain of the statements in
this presentation constitute forward-looking statements within the meaning of the Private Securities Litigation Reform Act of
1995. In addition, from time to time, we or our representatives have made or may make forward-looking statements, orally or in
writing. These statements relate to future events or future financial performance and involve known and unknown risks and other
factors that may cause our actual or our industry’s results, levels of activity or achievement to be materially different
from those expressed or implied by any forward-looking statements. These risks and uncertainties, including those that are described
in our 2012 Annual Report of Form 10-K under Item 1A- Risk Factors and Item 7-Management’s Discussion and Analysis of Financial
Condition and Results of Operations, include, but are not limited to, our future financial position and results of operations,
global economic conditions, losses on media purchases and production costs incurred on behalf of clients, reductions in client
spending and/or a slowdown in client payments, competitive factors, changes in client communication requirements, managing conflicts
of interest, the hiring and retention of personnel, maintaining a highly skilled workforce, our ability to attract new clients
and retain existing clients, reliance on information technology systems, changes in government regulations impacting our advertising
and marketing strategies, conditions in the credit markets, risks associated with assumptions we make in connection with our critical
accounting estimates and legal proceedings, and our international operations, which are subject to the risks of currency fluctuations
and foreign exchange controls. In some cases, forward-looking statements can be identified by terminology such as “may,”
“will,” “could,” “would,” “should,” “expect,” “plan,” “anticipate,”
“intend,” “believe,” “estimate,” “predict,” “potential” or “continue”
or the negative of those terms or other comparable terminology. These statements are our present expectations. Actual events or
results may differ. We undertake no obligation to update or revise any forward-looking statement, except as required by law.
Non-GAAP Financial
Measures
We present financial measures
determined in accordance with generally accepted accounting principles in the United States (“GAAP”) and adjustments
to the GAAP presentation (“Non-GAAP”), which we believe are meaningful for understanding our performance. Non-GAAP financial
measures should not be considered in isolation from, or as a substitute for, financial information presented in compliance with
GAAP. Non-GAAP financial measures as reported by us may not be comparable to similarly titled amounts reported by other companies.
We provide a reconciliation of non-GAAP measures to the comparable GAAP measures on pages 18 and 19.
The non-GAAP measures used in
this presentation include the following:
Net Free Cash Flow, defined as
Free Cash Flow (defined below) less the Primary Uses of Cash (defined below). Net Free Cash Flow is one of the metrics used by
us to assess our sources and uses of cash and was derived from our consolidated statements of cash flows. We believe that this
presentation is meaningful for understanding our primary sources and primary uses of that cash flow. Free Cash Flow, defined as
net income plus depreciation, amortization, share based compensation expense less other non-cash items to reconcile to net cash
provided by operating activities. Primary Uses of Cash, defined as dividends to common shareholders, dividends paid to non-controlling
interest shareholders, capital expenditures, cash paid on acquisitions, payments for additional interest in controlled subsidiaries
and stock repurchases, net of the proceeds and excess tax benefit from our stock plans, and excludes changes in working capital
and other investing and financing activities, including commercial paper issuances and redemptions used to fund working capital
changes.
EBITDA, defined as operating
income before interest, taxes, depreciation and amortization. We believe EBITDA is meaningful because the financial covenants
in our credit facilities are based on EBITDA.
EBITA, defined as operating income
before interest, taxes and amortization. We use EBITA as an additional operating performance measure, which excludes acquisition-related amortization expense, because we believe that EBITA is a useful measure to evaluate the performance of our businesses.
Net Debt, defined as total debt
less cash, cash equivalents and short-term investments. We believe net debt, together with the comparable GAAP measures, reflects
one of the metrics used by us to assess our cash management.
After Tax Operating Income, defined
as operating income less income taxes calculated using the effective tax rate for the applicable period.
Other Information
All dollar amounts are in millions
except for per share amounts and figures shown on page 3. The information contained in this document has not been audited, although
some data has been derived from Omnicom’s historical financial statements, including its audited financial statements. In
addition, industry, operational and other non-financial data contained in this document have been derived from sources that we
believe to be reliable, but we have not independently verified such information, and we do not, nor does any other person, assume
responsibility for the accuracy or completeness of that information. Certain amounts in prior periods have been reclassified to
conform to our current presentation.
The inclusion of information
in this presentation does not mean that such information is material or that disclosure of such information is required.