UNITED STATES
SECURITIES AND EXCHANGE COMMISSION
Washington, D.C. 20549
FORM 10-K
þ ANNUAL REPORT PURSUANT TO SECTION 13 OR 15(d) OF THE SECURITIES EXCHANGE ACT OF 1934
For the fiscal year ended December 31, 2016
or
¨ TRANSITION REPORT PURSUANT TO SECTION 13 OR 15(d) OF THE SECURITIES EXCHANGE ACT OF 1934
For the transition period from __________to__________
Commission file number: 1-3433
THE DOW CHEMICAL COMPANY
(Exact name of registrant as specified in its charter)
Delaware | 38-1285128 | |
State or other jurisdiction of incorporation or organization | (I.R.S. Employer Identification No.) | |
2030 DOW CENTER, MIDLAND, MICHIGAN 48674
(Address of principal executive offices) (Zip Code)
Registrant’s telephone number, including area code: 989-636-1000
Securities registered pursuant to Section 12(b) of the Act:
Title of each class | Name of each exchange on which registered | |
Common Stock, par value $2.50 per share | New York Stock Exchange | |
Indicate by check mark if the registrant is a well-known seasoned issuer, as defined in Rule 405 of the Securities Act.
þ Yes ¨ No
Indicate by check mark if the registrant is not required to file reports pursuant to Section 13 or Section 15(d) of the Act.
¨ Yes þ No
Indicate by check mark whether the registrant (1) has filed all reports required to be filed by Section 13 or 15(d) of the Securities Exchange Act of 1934 during the preceding 12 months (or for such shorter period that the registrant was required to file such reports), and (2) has been subject to such filing requirements for the past 90 days. þ Yes ¨ No
Indicate by check mark whether the registrant has submitted electronically and posted on its corporate Web site, if any, every Interactive Data File required to be submitted and posted pursuant to Rule 405 of Regulation S-T (§232.405 of this chapter) during the preceding 12 months (or for such shorter period that the registrant was required to submit and post such files). þ Yes ¨ No
Indicate by check mark if disclosure of delinquent filers pursuant to Item 405 of Regulation S-K (§229.405 of this chapter) is not contained herein, and will not be contained, to the best of the registrant’s knowledge, in definitive proxy or information statements incorporated by reference in Part III of this Form 10-K or any amendment to this Form 10-K. ¨
Indicate by check mark whether the registrant is a large accelerated filer, an accelerated filer, a non-accelerated filer, or a smaller reporting company. See the definitions of “large accelerated filer,” “accelerated filer” and “smaller reporting company” in Rule 12b-2 of the Exchange Act.
Large accelerated filer þ Accelerated filer ¨ Non-accelerated filer ¨ Smaller reporting company ¨
Indicate by check mark whether the registrant is a shell company (as defined in Rule 12b-2 of the Act). ¨ Yes þ No
The aggregate market value of voting common stock held by non-affiliates as of June 30, 2016 (based upon the closing price of $49.71 per common share as quoted on the New York Stock Exchange), was approximately $55.8 billion. For purposes of this computation, it is assumed that the shares of voting stock held by Directors and Officers would be deemed to be stock held by affiliates. Non-affiliated common stock outstanding at June 30, 2016, was 1,123,496,434 shares.
Total common stock outstanding at January 31, 2017, was 1,213,311,580 shares.
DOCUMENTS INCORPORATED BY REFERENCE
Part III: Proxy Statement for the 2017 Annual Meeting of Stockholders.
The Dow Chemical Company
ANNUAL REPORT ON FORM 10-K
For the fiscal year ended December 31, 2016
TABLE OF CONTENTS
PAGE | ||
Business. | ||
Risk Factors. | ||
Unresolved Staff Comments. | ||
Properties. | ||
Legal Proceedings. | ||
Mine Safety Disclosures. | ||
Market for Registrant’s Common Equity, Related Stockholder Matters and Issuer Purchases of Equity Securities. | ||
Selected Financial Data. | ||
Management’s Discussion and Analysis of Financial Condition and Results of Operations. | ||
Quantitative and Qualitative Disclosures About Market Risk. | ||
Financial Statements and Supplementary Data. | ||
Changes in and Disagreements With Accountants on Accounting and Financial Disclosure. | ||
Controls and Procedures. | ||
Other Information. | ||
Directors, Executive Officers and Corporate Governance. | ||
Executive Compensation. | ||
Security Ownership of Certain Beneficial Owners and Management and Related Stockholder Matters. | ||
Certain Relationships and Related Transactions, and Director Independence. | ||
Principal Accounting Fees and Services. | ||
Exhibits, Financial Statement Schedules. | ||
2
The Dow Chemical Company and Subsidiaries | ||
Throughout this Annual Report on Form 10-K, except as otherwise noted by the context, the terms "Company" or "Dow" as used herein mean The Dow Chemical Company and its consolidated subsidiaries.
FORWARD-LOOKING STATEMENTS
Certain statements in this report, other than purely historical information, including estimates, projections, statements relating to business plans, objectives, and expected operating results, and the assumptions upon which those statements are based, are “forward-looking statements” within the meaning of the Private Securities Litigation Reform Act of 1995, Section 27A of the Securities Act of 1933 and Section 21E of the Securities Exchange Act of 1934. Forward-looking statements may appear throughout this report including, without limitation, the following sections: “Item 1. Business,” “Management's Discussion and Analysis,” and “Risk Factors.” These forward-looking statements are generally identified by the words “anticipate,” “believe,” “estimate,” “expect,” “future,” “intend,” “may,” “opportunity,” “outlook,” “plan,” “project,” “should,” “strategy,” “will,” “would,” “will be,” “will continue,” “will likely result” and similar expressions. Forward-looking statements are based on current expectations and assumptions that are subject to risks and uncertainties which may cause actual results to differ materially from the forward-looking statements.
This document also contains statements about Dow's agreement to effect an all-stock, merger of equals strategic combination with E. I. du Pont de Nemours and Company ("DuPont") resulting in a new combined company ("DowDuPont") and then, subsequent to the merger, Dow and DuPont intend to pursue the separation of DowDuPont's agricultural business, specialty products business and material science business through one or more tax-efficient transactions (collectively, the "Transaction"). Many factors could cause actual results to differ materially from these forward-looking statements with respect to the Transaction, including (i) the completion of the proposed Transaction on anticipated terms and timing, including obtaining regulatory approvals, anticipated tax treatment, unforeseen liabilities, future capital expenditures, revenues, expenses, earnings, synergies, economic performance, indebtedness, financial condition, losses, future prospects, business and management strategies for the management, expansion and growth of the new combined company’s operations and other conditions to the completion of the merger, (ii) the ability of Dow and DuPont to integrate the business successfully and to achieve anticipated synergies, risks and costs and pursuit and/or implementation of the potential separation, including anticipated timing, and any changes to the configuration of businesses included in the potential separation if implemented, (iii) potential litigation relating to the proposed Transaction that could be instituted against Dow, DuPont or their respective directors, (iv) the risk that disruptions from the proposed Transaction will harm Dow’s or DuPont’s business, including current plans and operations, (v) the ability of Dow or DuPont to retain and hire key personnel, (vi) potential adverse reactions or changes to business relationships resulting from the announcement or completion of the merger, (vii) uncertainty as to the long-term value of DowDuPont common stock, (viii) continued availability of capital and financing and rating agency actions, (ix) legislative, regulatory and economic developments, (x) potential business uncertainty during the pendency of the merger that could affect Dow’s and/or DuPont’s economic performance, (xi) certain contractual restrictions that could be imposed on Dow and/or DuPont during the pendency of the merger that might impact Dow’s or DuPont’s ability to pursue certain business opportunities or strategic transactions and (xii) unpredictability and severity of catastrophic events, including, but not limited to, acts of terrorism or outbreak of war or hostilities, as well as management’s response to any of the aforementioned factors. These risks, as well as other risks associated with the proposed merger, are more fully discussed in the joint proxy statement/prospectus that is included in the registration statement on Form S-4 (File No. 333-209869) that was filed with the U.S. Securities and Exchange Commission in connection with the proposed merger. While the list of factors presented here is, and the list of factors presented in the registration statement on Form S-4 are, considered representative, no such list should be considered to be a complete statement of all potential risks and uncertainties. Unlisted factors may present significant additional obstacles to the realization of forward-looking statements. Consequences of material differences in results as compared with those anticipated in the forward-looking statements could include, among other things, business disruption, operational problems, financial loss, legal liability to third parties and similar risks, any of which could have a material adverse effect on Dow’s or DuPont’s consolidated financial condition, results of operations, credit rating or liquidity. Neither Dow nor DuPont assumes any obligation to publicly provide revisions or updates to any forward-looking statements, whether as a result of new information, future developments or otherwise, should circumstances change, except as otherwise required by securities and other applicable laws.
A detailed discussion of principal risks and uncertainties which may cause actual results and events to differ materially from such forward-looking statements is included in the section titled “Risk Factors” (Part I, Item 1A of this Form 10-K). The Dow Chemical Company undertakes no obligation to update or revise publicly any forward-looking statements whether because of new information, future events, or otherwise, except as required by securities and other applicable laws.
3
The Dow Chemical Company and Subsidiaries | ||
PART I, Item 1. Business. | ||
THE COMPANY
The Dow Chemical Company was incorporated in 1947 under Delaware law and is the successor to a Michigan corporation, of the same name, organized in 1897. The Company's principal executive offices are located at 2030 Dow Center, Midland, Michigan 48674. Throughout this Annual Report on Form 10-K, except as otherwise indicated by the context, the terms “Company” or “Dow” as used herein mean The Dow Chemical Company and its consolidated subsidiaries.
Available Information
The Company's annual reports on Form 10-K, quarterly reports on Form 10-Q and current reports on Form 8-K, and amendments to those reports filed or furnished pursuant to Section 13(a) or 15(d) of the Securities Exchange Act of 1934, are available free of charge through the Investor Relations section of the Company's website (www.dow.com/investor-relations), as soon as reasonably practicable after the reports are electronically filed or furnished with the U.S. Securities and Exchange Commission (“SEC”). The SEC maintains a website that contains these reports as well as proxy statements and other information regarding issuers that file electronically. The SEC's website is at www.sec.gov. The Company's website and its content are not deemed incorporated by reference into this report.
General
Dow combines the power of science and technology to passionately innovate what is essential to human progress. The Company is driving innovations that extract value from material, polymer, chemical and biological science to help address many of the world's most challenging problems, such as the need for fresh food, safer and more sustainable transportation, clean water, energy efficiency, more durable infrastructure, and increasing agricultural productivity. Dow's integrated, market-driven portfolio delivers a broad range of technology-based products and solutions to customers in 175 countries and in high-growth sectors such as packaging, infrastructure, transportation, consumer care, electronics and agriculture. In 2016, Dow had annual sales of $48 billion and employed approximately 56,000 people worldwide. The Company's more than 7,000 product families are manufactured at 189 sites in 34 countries across the globe. The Company conducts its worldwide operations through global businesses, which are reported in five operating segments: Agricultural Sciences, Consumer Solutions, Infrastructure Solutions, Performance Materials & Chemicals and Performance Plastics.
Strategy
Dow’s strategy is to invest in a market-driven portfolio of advantaged and technology-enabled businesses that create value for our shareholders and customers.
Dow DuPont Planned Merger of Equals
On December 11, 2015, the Company and E. I. du Pont de Nemours and Company ("DuPont") announced that their boards of directors unanimously approved a definitive agreement under which the companies will combine in an all-stock merger of equals strategic combination. The combined company will be named DowDuPont.
Dow and DuPont remain focused on closing the transaction and continue to work constructively with regulatory agencies in all relevant jurisdictions, including the United States, European Union, China, Brazil and Canada. Given current regulatory agency status, closing is expected to occur in the first half of 2017, subject to satisfaction of customary closing conditions, including receipt of all regulatory approvals. The parties intend to subsequently pursue a separation of DowDuPont into three independent, publicly traded companies through tax-efficient transactions, including a leading global pure-play agriculture company, a leading global pure-play material science company and a leading technology and innovation-driven specialty products company. See the Note About Forward-Looking Statements; Part I, Item 1A. Risk Factors; and Note 27 to the Consolidated Financial Statements for further details on this transaction.
4
BUSINESS SEGMENTS AND PRODUCTS
Dow’s worldwide operations are managed through global businesses which are reported in five operating segments: Agricultural Sciences, Consumer Solutions, Infrastructure Solutions, Performance Materials & Chemicals and Performance Plastics. This operating structure maximizes Dow’s integration benefits and the value from material, polymer, chemical and biological sciences to help address many of the world's most challenging problems - either through molecular and value chain alignment, or through the benefits derived from Dow's enhanced, innovation-driven market focus. See Part II, Item 7, Management’s Discussion and Analysis of Financial Condition and Results of Operations and Note 26 to the Consolidated Financial Statements for additional information concerning the Company’s operating segments.
AGRICULTURAL SCIENCES
The Agricultural Sciences segment is a global leader in providing crop protection and seed/plant biotechnology products and technologies, urban pest management solutions and healthy oils. The business invents, develops, manufactures and markets products for use in agricultural, industrial and commercial pest management. The segment has broad global reach with sales in nearly 130 countries and research and development ("R&D") and manufacturing facilities located in all geographic areas. Growth is achieved through the development of innovative new products and technologies, successful segmentation of market offerings with leading brands, diverse channels to market, competitive cost positions, strategic bolt-on acquisitions, and commercial and R&D collaborations. The Company is committed to the development of innovative new crop protection and seed products.
Details on Agricultural Sciences' 2016 sales, by business and geographic area, are as follows:
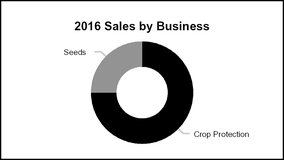
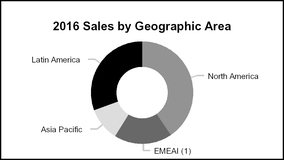
(1) | Europe, Middle East, Africa and India |
Products
Key product lines, including crop application, are listed below:
Crop Application | ||||||||||
Key Product Lines | Canola | Cereals | Corn | Cotton | Range and Pasture | Rice | Soybeans | Sunflower | Trees, Fruits and Vegetables | Others |
Insecticides | x | x | x | x | x | x | x | x | x | |
Fungicides | x | x | x | x | x | x | ||||
Herbicides | x | x | x | x | x | x | x | x | x | x |
Seeds | x | x | x | x | x | x | x | x | ||
Other | x | x | x | |||||||
The Company's ability to produce seeds can be materially impacted by weather conditions, local political conditions and the availability of reliable contract growers.
5
Agricultural Sciences is focused on delivering results through technology leadership. Major brands and technologies, by key product line, are listed below:
Key Product Lines | Brands and Technologies |
Insecticides | ISOCLAST™; LORSBAN™; RADIANT™; SENTRICON™; TRACER™ |
Fungicides | DITHANE™; INATREQ™ |
Herbicides | ARYLEX™; BROADWAY™; CLINCHER™; DURANGO™; FENCER™; GARLON™; LONTREL™; MILESTONE™; PANZER™; PRIMUS™; RESICORE™; RINSKOR™; SPIDER™; STARANE™; SURESTART™; TORDON™ |
Seed Brands | AGROMEN™(1); BRODBECK™ Seeds; DAIRYLAND SEED™; DOW™ Seeds; MYCOGEN™ Seeds; NEXERA™; Omega-9 Healthier Oils; PFISTER™ Seeds; PHYTOGEN™; PRAIRIE BRAND™ Seeds; PROPOUND™ |
Seed Traits and Technologies | ENLIST™; ENLIST DUO™; EXZACT™ Precision Technology; POWERCORE™ Insect Trait Technology(2); REFUGE ADVANCED™ powered by SmartStax®(2); SmartStax® Insect Trait Technology(2) |
Other | INSTINCT®; N-SERVE™ Nitrogen Stabilizer; TELONE™ |
(1) | AGROMEN trademark used under license from Agromen Sementes Agricolas Ltda. |
(2) | Smartstax® and POWERCORE™ multi-event technology developed by Dow AgroSciences LLC and Monsanto. Smartstax®, the Smartstax® logo, POWERCORE™ and the POWERCORE™ logo are trademarks of Monsanto Technology, LLC. |
U.S. federal regulatory approvals have been obtained for the commercialization of ENLIST™ Corn, Soybeans and Cotton, including the U.S. Environmental Protection Agency's registration of ENLIST DUO™ for use with ENLIST™ Corn, Soybeans and Cotton in 34 states. The Company has also secured approval of the registration of ENLIST E3™ Soybeans in Argentina and approval of the registration of ENLIST E3™ Soybeans, ENLIST™ Soybean Seeds and ENLIST™ Corn Seeds in Brazil and Canada. ENLIST DUO™ is also approved for use with ENLIST™ crops in Canada. Regulatory approvals for ENLIST™ products in certain other countries are still pending.
Patents, Trademarks and Licenses
Agricultural Sciences has significant technology-driven growth, driven by crop protection and seed/plant biotechnology products and technologies, urban pest management solutions and healthy oils. As a result, the Company uses patents, trademarks, licenses and registrations to protect its investment in germplasm, traits and proprietary chemistries and formulations. The Company also licenses plant biotechnology traits from third parties and engages in research collaborations.
Competition
Agricultural Sciences competes with producers of crop protection and seed/plant biotechnology products on a global basis. The Company competes on the basis of technology and trait leadership, price, quality and cost competitiveness. Key competitors include BASF, Bayer, DuPont, Monsanto and Syngenta, as well as generic crop protection companies and regional seed companies.
Distribution
Agricultural Sciences has a diverse worldwide network which markets and distributes the Company's brands to customers globally. This network consists of the Company's sales and marketing organization partnering with distributors, independent retailers and growers, cooperatives and agents throughout the world.
Seasonality
Agricultural Sciences sales and EBITDA are strongest in the first half of the year, aligning with the planting and growing season in the northern hemisphere, where more than 50 percent of the segment's annual sales are generated. Accounts receivable tends to be higher during the first half of the year, consistent with the peak sales period in the northern hemisphere.
Divestiture
On July 31, 2015, the Company sold its AgroFresh business to AgroFresh Solutions, Inc. ("AFSI"). The AgroFresh business was reported in the Agricultural Sciences segment through the date of divestiture. The Company has retained a minority interest in AFSI which is also reported in the Agricultural Sciences segment. See Note 5 to the Consolidated Financial Statements for additional information on this transaction.
6
CONSUMER SOLUTIONS
The Consumer Solutions segment consists of four global businesses: Consumer Care, Dow Automotive Systems, Dow Electronic Materials and Consumer Solutions - Silicones. These global businesses develop and market customized materials using advanced technology and unique chemistries for specialty applications including semiconductors and organic light-emitting diodes ("OLEDs"), adhesives and foams used by the transportation industry, cellulosics and other polymers for innovative pharmaceutical formulations and food solutions, and silicone solutions used in consumer goods and automotive applications. These businesses serve the needs of market segments as diverse as: automotive; electronics and entertainment; food and pharmaceuticals; and, personal and home care products. The segment's commitment to continuous innovation and rapid new product development enables it to maximize opportunities in emerging geographies and high-growth consumer market segments in nearly 110 countries.
Details on Consumer Solutions' 2016 sales, by business and geographic area, are as follows:

Consumer Care
Consumer Care provides global and regional brand owners in food, pharmaceutical, personal care and home care markets with innovative formulations and ingredients designed to add value to their products and help consumers live healthier and more convenient lives.
Consumer Care's principal businesses each serve one or more key market segments, as noted below:
Business | Market Segments | Technologies |
Dow Home, Institutional & Personal Care Solutions | Personal care, home care and specialty applications with key focus on hair care, skin care, sun care, cleansing, as well as fabric, dish, floor, hard surface and air care applications | From polymers and emollients to chelants and dispersants, Dow offers unique innovations that empower consumer brands around the world to deliver exceptional product performance and process enhancements that create value. Other notable technologies include opacifiers, rheology modifiers, surfactants and solvents. |
Dow Pharma and Food Solutions | Pharmaceutical, food and nutrition | Cellulosic and other technologies help bring new classes of medicines to market and enable foods that are healthier (gluten-free, reduced oil/fat content). Notable technologies include excipients and active pharmaceutical ingredients, solubility enhancers, reagents, granulation and binders, as well as coatings and controlled release. |
SAFECHEM™(1) | A service business responsible for the sustainable and innovative use of solvents | Offers cleaning solutions, equipment and services for metal and dry cleaning applications. Provides closed-loop SAFE-TAINER™ System delivery systems to ensure emission free use of cleaning agents. |
(1) | On December 31, 2016, the Company sold its SAFECHEM™ business. SAFECHEM™ was reported as part of the Consumer Solutions segment through the date of divestiture. |
7
Dow Automotive Systems
Dow Automotive Systems is a leading global provider of collaborative solutions and advanced materials for original equipment manufacturers, tier suppliers, aftermarket customers and commercial transportation manufacturers. Dow Automotive Systems’ leading technologies, materials engineering, testing and service support are complemented by a robust line of structural, elastic and rubber-to-substrate adhesives; composite materials technologies; polyurethane foams and acoustical management systems; and films and fluids.
Dow Automotive Systems’ principal businesses offer the following technologies and serve the following market segments:
Business | Market Segments | Technologies |
Adhesives | Elastic, structural and specialty adhesives | Innovative and differentiated adhesive technologies to meet customer specifications for durability and crash performance |
Performance Solutions | Performance plastics, fluids and polyurethane foam solutions | Technologies that differentiate customers’ products with improved performance characteristics |
Dow Electronic Materials
Dow Electronic Materials is a leading global supplier of enabling materials for a broad range of consumer electronics including smartphones, tablets, television monitors and personal computers, as well as electronic devices and systems used in a variety of industries. The business produces materials for chemical mechanical planarization ("CMP"); materials used in the production of electronic displays, including films, filters and OLEDs; metalorganic precursors for light-emitting diodes; products and technologies that drive leading-edge semiconductor design; materials used in the fabrication of printed circuit boards; and integrated metallization processes for metal finishing and decorative applications.
Dow Electronic Materials is comprised of four principal businesses, each serving one or more key market segments, as noted below:
Business | Market Segments | Technologies |
Semiconductor Technologies | Integrated circuit fabrication for memory and logic | CMP consumables, photolithography materials |
Interconnect Technologies | Printed circuit board, electronic and industrial finishing | Interconnect metallization and imaging process chemistries |
Display Technologies | Display materials | Display films and filters, OLED materials |
Growth Technologies | New and emerging technologies | Advanced chip packaging materials, metalorganic precursors, optical and ceramic materials |
Consumer Solutions - Silicones
Consumer Solutions - Silicones provides innovative silicone solutions and ingredients to customers in beauty and personal care, household care, healthcare, consumer goods and automotive market segments around the world. Backed by extensive application expertise and industry knowledge, Consumer Solutions - Silicones features a broad, diverse portfolio of elastomers, emulsifiers, film formers, fluids, antifoams, additives, tubing and molded assemblies and adhesives.
8
Consumer Solutions - Silicones principal businesses offer the following technologies and serve the following market segments:
Business | Applications/Market Segments | Technologies |
Beauty and Personal Care | Hair care, skin care, sun care and color cosmetics | Innovative beauty care ingredients that help improve product performance and meet the needs of consumers. Notable silicone technologies include elastomers, emulsifiers, rheology modifiers, film formers-resins, gums and acrylates, powders and fluids. |
Household Care | Laundry and fabric care, hard surface care | Proven solutions to deliver benefits to both consumers and manufacturers alike. Notable silicone technologies include antifoams, processing aids, polishing gloss aids and softening agents. |
Healthcare | Drug delivery, medical device, wound care and topical ingredient applications | Innovative silicone solutions backed by industry application and regulatory expertise. Notable silicone technologies include elastomers, emulsifiers, excipients, tubing and molded assemblies, adhesives, antifoams and fluids. |
Consumer Goods | Electronics, packaging, sporting goods, household goods, infant care | Elastomer and thermal plastic technologies with proven performance delivering benefits to consumers around the world in multiple applications. Notable technology includes liquid silicone rubbers, high consistency rubbers, TPSiV™, thermoplastic additives and food-grade materials. |
Automotive | Safety, lighting, sealing, electronics, NVH (noise, vibration, harshness), exterior trim | Notable technology includes: elastomers, liquid silicone rubbers, high consistency rubbers, thermoplastics, additives, coatings, thermal management materials, sealants and lubricants. |
Competition
The Consumer Solutions segment experiences competition in each business within the segment. The competitors include many large multinational chemical firms as well as a number of regional and local competitors. The segment's products have unique performance characteristics that are required by customers who demand a high-level of customer service and technical expertise from the Company's sales force and scientists; therefore, Dow is well positioned to withstand competitive threats. Key competitors include Ashland, BASF, Bayer, Bluestar, JSR Micro, Momentive, Shin-Etsu Chemical and Wacker.
Joint Ventures
The Consumer Solutions segment includes a portion of the Company's share of the results of the Hemlock Semiconductor Group ("HSC Group"), a U.S.-based group of companies that manufacture polycrystalline silicon products, which is owned 50 percent by the Company.
As of June 1, 2016, Dow Corning Corporation ("Dow Corning"), previously a 50:50 joint venture with Corning Incorporated ("Corning"), became a wholly owned subsidiary of Dow as a result of an ownership restructure ("DCC Transaction"). Dow and Corning continue to maintain their historical proportional equity interest in the HSC Group. See Note 4 to the Consolidated Financial Statements for additional information on this transaction.
9
INFRASTRUCTURE SOLUTIONS
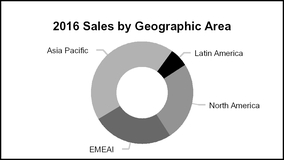
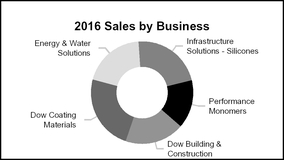
The Infrastructure Solutions segment is comprised of an industry-leading portfolio of businesses utilizing advanced technology to deliver products such as architectural and industrial coatings, construction material ingredients, building insulation and materials, adhesives, microbial protection for the oil and gas industry, telecommunications, light and water technologies. With unmatched R&D capabilities, a broad range of chemistries, extensive geographic reach and strong channels to market, this segment is well positioned to capitalize on market trends. The segment has broad geographic reach with sales in nearly 150 countries and R&D and manufacturing facilities located in key geographic areas.
Details on Infrastructure Solutions' 2016 sales, by business and geographic area, are as follows:
Dow Building & Construction
Dow Building & Construction is comprised of two businesses - Dow Building Solutions and Dow Construction Chemicals. Leveraging more than 70 years of building science experience and deep application expertise that go well beyond the business's 75 years of STYROFOAM™ brand insulation products, Dow creates high-performance solutions designed to help make residential and commercial buildings more comfortable, last longer, save energy and reduce emissions. The business group offers extensive lines of industry-leading durable insulation and building material solutions, as well as functional ingredients that provide improved thermal performance, air sealing, weatherization, waterproofing and fire retardancy for construction products.
Dow Coating Materials
The Dow Coating Materials business manufactures and delivers solutions that leverage high quality, technologically advanced product offerings for architectural paint and coatings, as well as industrial coatings applications, including paper, leather, concrete, wood, automotive, maintenance and protective industries. Dow Coating Materials introduced the industry's first waterborne technology in 1953 and has since led the industry's conversion away from solvent borne technology to allow for lower volatile organic compounds and an improved sustainability profile while pushing performance boundaries.
Energy & Water Solutions
Energy & Water Solutions includes the following businesses - Dow Microbial Control; Dow Oil, Gas & Mining; and Dow Water and Process Solutions. Dow Microbial Control provides technology used to predict, diagnose and sustainably solve the planet’s most difficult microbial challenges while Dow Oil, Gas & Mining is helping to provide energy to the world by supplying smart, innovative and customized solutions to enable the tapping of both conventional and unconventional sources. Aligned to the infrastructure market sector is Dow Water and Process Solutions, a leading provider of purification and separation technologies including reverse osmosis membranes and ion exchange resins to help customers with a broad array of separation and purification needs such as reusing waste water streams, making fresh drinking water from sea water, creating a closed loop water system for oil field operations, and removing impurities in dairy processing.
Performance Monomers
The Performance Monomers business produces monomer products that are sold externally as well as consumed internally as building blocks used in downstream polymer businesses. The business' products are used in several applications, including dispersions and emulsions for adhesives, coatings, inks, woven and non-woven textiles, plastics and polymers and superabsorbent products. Included in this portfolio is Plastics Additives, a worldwide supplier of additives used in a large variety of applications ranging from construction materials and packaging containers to consumer appliances and electronics, business machines and automotive parts.
Infrastructure Solutions - Silicones
Infrastructure Solutions - Silicones is a global leader in providing solutions to pressing challenges customers face in the infrastructure segment delivered via proven and innovative silicon-based technology. The diverse portfolio provides solutions
10
to the building and construction, telecommunications, lighting and energy sectors. In construction particularly, silicone materials enable buildings that promote occupant comfort, safety and security, improved productivity and design freedom.
Products
Infrastructure Solutions' businesses each serve one or more key market segments, as noted below:
Business | Applications/Market Segments | Major Products |
Dow Building & Construction | Rigid and spray foam insulation; weatherization, waterproofing and air sealing; caulks and sealants; elastomeric roof coatings; exterior insulation finishing systems; roof tiles and siding; industrial non-wovens; cement-based tile adhesives; plasters and renders; tape joint compounds; and concrete additives | AQUASET™ acrylic thermosetting resins, DOW™ latex powder, FROTH-PAK™ foam insulation and sealants, GREAT STUFF™ insulating foam sealants and adhesives, RHOPLEX™ and PRIMAL™ acrylic emulsion polymers, STYROFOAM™ brand insulation products, THERMAX™ exterior insulation, WALOCEL™ cellulose ethers, WEATHERMATE™ house wrap, XENERGY™ high performance insulation, LIQUIDARMOR™ flashing and sealant |
Dow Coating Materials | Acrylic binders for architectural paint and coatings, industrial coatings, and paper; dispersants; rheology modifiers; opacifiers and surfactants for both architectural and industrial applications; protective and functional coatings | ACRYSOL™ Rheology Modifiers, AVANSE™ acrylic binders, EVOQUE™ Pre-Composite Polymer, FORMASHIELD™ acrylic binder, RHOPLEX™ acrylic resin, TAMOL™ Dispersants, MAINCOTE™ acrylic epoxy hybrid, PARALOID™ Edge ISO-free technology and ACOUSTICRYL™ liquid-applied sound damping technology |
Energy & Water Solutions | Helping customers in exploration, production, transmission, refining and gas processing to optimize supply, improve efficiencies and manage emissions. Providing expertise and localized solutions for microbial control for well souring, industrial cooling water, fabric odor elimination, in-can preservation and dry film protection. Providing advanced, cost effective separation and purification technology for water treatment and filtration, pharmaceutical, food and beverage, and chemical processing | Demulsifiers, drilling and completion fluids, heat transfer fluids, rheology modifiers, scale inhibitors, shale inhibitors, specialty amine solvents, surfactants, water clarifiers, DOW ADSORBSIA™ selective media, DOW EDI™ modules, DOWEX™ and AMBERJET™ ion exchange resins, DOWEX™ OPTIPORE™ polymeric adsorbent resins, DOW FILMTEC™ reverse osmosis and nanofiltration elements, TEQUATIC™ PLUS fine particle filter, AMBERLYST™ polymeric catalysts, AQUCAR™, BIOBAN™, SILVADUR™ antimicrobial |
Performance Monomers | Super absorbents, water treatment, flocculants and detergents, acrylic sheets, coatings, inks and paints, molding compounds, impact modifiers, processing aids, electronic displays, adhesives, textiles, automotive and architectural safety glass, and plastics additives | Acrylates, methacrylates, vinyl acetate monomers, high-quality impact modifiers, processing aids, foam cell promoters and weatherable acrylic capstock compounds for thermoplastic and thermosetting materials |
Infrastructure Solutions - Silicones | Commercial glazing, building envelope, construction chemicals, window and door infrastructure, wire and cable, electrical and high voltage insulation, power transmission, sleeving, optical devices, light-emitting diodes, lamp and luminaire, oil and gas, solar | Elastomers, fluids, pottants, potting agents, thermal interface materials, adhesives and sealants, encapsulants, gels, resins, antifoams, demulsifiers, lubricants |
Competition
Competitors of the Infrastructure Solutions segment include many large multinational chemical firms as well as a number of regional and local competitors. The segment's products have unique performance characteristics that are required by customers who demand a high level of customer service and expertise from its sales force and scientists; therefore, Dow is well positioned to withstand competitive threats. Key competitors include Arkema, Ashland, BASF, Bluestar, Elementis, Hydranautics, Lanxess, Lonza, Momentive, Owens-Corning, Shin-Etsu Chemical and Wacker.
Joint Ventures
The Infrastructure Solutions segment includes a portion of the Company's share of the results of the HSC Group, a U.S.-based group of companies that manufacture polycrystalline silicon products, which is owned 50 percent by the Company.
As of June 1, 2016, Dow Corning, previously a 50:50 joint venture with Corning, became a wholly owned subsidiary of Dow as a result of the DCC Transaction. Dow and Corning continue to maintain their historical proportional equity interest in the HSC Group. See Note 4 to the Consolidated Financial Statements for additional information on this transaction.
11
PERFORMANCE MATERIALS & CHEMICALS
The Performance Materials & Chemicals segment is comprised of three technology-driven, customer-centric global businesses that are advantaged through integration and driven by innovative technology and solutions: Chlor-Alkali and Vinyl, Industrial Solutions and Polyurethanes. Products produced by this segment are back-integrated into feedstocks, supporting a low-cost manufacturing base and consistent, reliable supply. The Performance Materials & Chemicals segment is positioned for growth through diverse markets and product offerings. The segment has broad geographic reach with sales in nearly 140 countries and manufacturing facilities located in all geographic areas. Performance Materials & Chemicals has a diverse product line that serves customers in a large number of industries including appliance, construction and industrial.
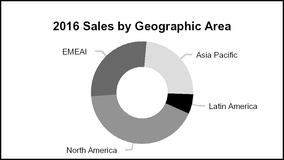
Details on Performance Materials & Chemicals' 2016 sales, by business and geographic area, are as follows:
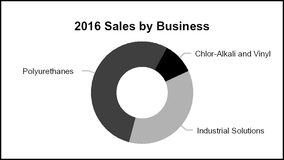
Chlor-Alkali and Vinyl
The Chlor-Alkali and Vinyl business provides cost-advantaged chlorine and caustic soda supply and integration for the Polyurethanes business. Chlor-Alkali and Vinyl also includes the marketing of caustic soda, a valuable co-product of the chlor-alkali manufacturing process, and ethylene dichloride and vinyl chloride monomer, essential for the production of polyvinyl chloride.
Industrial Solutions
The Industrial Solutions business enables manufacturing of the world’s goods and services with additive solutions that minimize friction and heat in mechanical processes, manage the oil and water interface, deliver active ingredients for maximum effectiveness, facilitate dissolvability and provide the foundational building blocks for the development of chemical technologies. The business supports industrial manufacturers associated with virtually all end-markets, notably electronics, agricultural chemicals, engine/heavy equipment, coatings, adhesives and inks, and detergents and cleaners. Industrial Solutions is also the world’s largest producer of purified ethylene oxide. Approximately 80 percent of the ethylene oxide produced by Dow is consumed within the Performance Materials & Chemicals segment.
Polyurethanes
Polyurethanes is comprised of four businesses: Isocyanates, Polyols, Polyurethane Systems and Propylene Oxide/Propylene Glycol ("PO/PG"). The Polyurethanes business is the world’s largest producer of propylene oxide and propylene glycol as well as a leading producer of polyether polyols and aromatic isocyanates that serve energy efficiency, consumer comfort and industrial market sectors. Propylene oxide is produced using the chlorohydrins process as well as by hydrogen peroxide to propylene oxide manufacturing technology(1). Performance Materials & Chemicals businesses consume more than 90 percent of the propylene oxide produced or procured by Dow.
Competition
Competition for the Performance Materials & Chemicals segment varies based on the business. Key competitors include large, international chemical companies as well as chemical divisions of major national and international oil companies. Performance Materials & Chemicals back-integration into feedstocks supports a low-cost manufacturing base and consistent, reliable product supply. Dow is a full-service supplier with a global technical service network located close to the customer, which allows the Company to fuel growth in specialty applications and collaborate with customers to invent unique chemistries and tailored solutions. In addition to its competitive cost position, reliable supply and superior customer service, the Company also competes worldwide on the basis of quality, technology and price. Key competitors include BASF, Covestro, Eastman, INEOS, Huntsman, LyondellBasell, Olin and Oxea.
(1) | Hydrogen peroxide to propylene oxide manufacturing technology is utilized by MTP HPPO Manufacturing Company Limited, a Thailand-based consolidated variable interest entity ultimately owned 50 percent by the Company and 50 percent by SCG Chemicals Co. Ltd.; and BASF DOW HPPO Production B.V.B.A., a Belgium-based joint venture ultimately owned 100 percent by HPPO Holding & Finance C.V., which is owned 50 percent by the Company and 50 percent by BASF. |
12
Distribution
The Performance Materials & Chemicals segment markets its products primarily through the Company's sales force and also utilizes distributors worldwide.
Joint Ventures
The Performance Materials & Chemicals segment includes a portion of the Company's share of the results of the following joint ventures:
• | EQUATE Petrochemicals Company K.S.C. ("EQUATE") - a Kuwait-based company that manufactures ethylene, polyethylene and ethylene glycol; and manufactures and markets monoethylene glycol, diethylene glycol and polyethylene terephthalate resins; owned 42.5 percent by the Company. |
• | The Kuwait Olefins Company K.S.C. - a Kuwait-based company that manufactures ethylene and ethylene glycol; owned 42.5 percent by the Company. |
• | Map Ta Phut Olefins Company Limited - effective ownership is 32.77 percent of which the Company directly owns 20.27 percent (aligned with Performance Materials & Chemicals) and indirectly owns 12.5 percent through its equity interest in Siam Polyethylene Company Limited and Siam Synthetic Latex Company Limited (both part of The SCG-Dow Group and aligned with Performance Plastics). This Thailand-based company manufactures propylene and ethylene. |
• | Sadara Chemical Company - a Saudi Arabian company that currently manufactures chlorine, ethylene and propylene for internal consumption and manufactures and sells polyethylene; will produce and sell high-value added chemical products and other performance plastics when fully operational; owned 35 percent by the Company. |
On December 23, 2015, the Company sold its 50 percent ownership interest in MEGlobal, a manufacturer and marketer of monoethylene glycol, diethylene glycol and polyethylene terephthalate resins headquartered in Dubai, United Arab Emirates, to EQUATE. MEGlobal was aligned 100 percent with Performance Materials & Chemicals through the date of divestiture. Dow has retained 42.5 percent ownership stake in MEGlobal through its ownership in EQUATE. The Performance Materials & Chemicals segment will continue to include a portion of the equity earnings from EQUATE, which will include the results of MEGlobal.
Divestitures
On January 30, 2015, the Company sold its global Sodium Borohydride business to Vertellus Specialty Materials LLC. On February 2, 2015, the Company sold ANGUS Chemical Company to Golden Gate Capital. On October 5, 2015, the Company completed the split-off of its U.S. Gulf Coast Chlor-Alkali and Vinyl, Global Chlorinated Organics and Global Epoxy businesses to Olin Corporation in a tax-efficient Reverse Morris Trust transaction. These businesses were reported in the Performance Materials & Chemicals segment through the date of divestiture. See Notes 5 and 6 to the Consolidated Financial Statements for additional information on these transactions.
PERFORMANCE PLASTICS
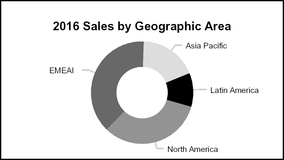
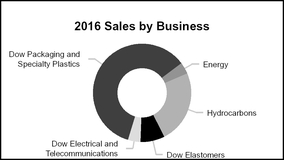
The Performance Plastics segment is the world’s leading plastics franchise, and is a market-oriented portfolio composed of five global businesses: Dow Elastomers, Dow Electrical and Telecommunications, Dow Packaging and Specialty Plastics, Energy and Hydrocarbons. The segment is advantaged through its low cost position into key feedstocks and broad geographic reach, with sales in approximately 110 countries and manufacturing facilities located in all geographic areas. It also benefits from Dow’s R&D expertise to deliver leading-edge technology that provides a competitive benefit to customers in key strategic markets.
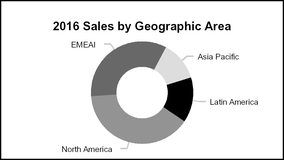
Details on Performance Plastics' 2016 sales, by business and geographic area, are as follows:
13
Dow Elastomers, Dow Electrical and Telecommunications, and Dow Packaging and Specialty Plastics serve high-growth, high-value sectors where Dow's world-class technology and rich innovation pipeline creates competitive advantages for customers and the entire value chain. Together, these three global businesses have complimentary market reach, asset capabilities and technology platforms that provide the Company with immediate and long-term growth synergies. Market growth is expected to be driven by major shifts in population demographics, improving socioeconomic status in emerging geographies, consumer and brand owner demand for increased consumer convenience, efforts to reduce food waste, growth in telecommunications networks, specifically broadband and LTE networks, and global development of electrical transmission and distribution infrastructure and renewable energy applications. Market segments served by these businesses include adhesives, construction, food and specialty packaging, footwear, industrial and consumer packaging, hygiene and medical, infrastructure, pipe, telecommunications and transportation.
The Energy business is one of the world’s largest industrial energy producers. This business produces or procures the energy used by Dow, sells energy to customers located on Dow manufacturing sites and also engages in opportunistic merchant sales driven by market conditions. Because of its unparalleled scale, purchasing power and global reach, the Energy business offers Dow tremendous knowledge of world energy markets and the agility to respond to sudden changes in conditions.
The Hydrocarbons business is one of the largest global producers of ethylene, an internal feedstock that is consumed primarily within Performance Plastics. The Hydrocarbons business is also a large producer and purchaser of propylene. The Company strategically locates its polyethylene production facilities near its ethylene production facilities to optimize integration benefits and drive low costs. Dow's global scale, operational discipline and feedstock flexibility create a cost-advantaged foundation for the Company's downstream, market-driven businesses. In North America, shale gas opportunities - and the resulting increased supplies of natural gas and natural gas liquids (“NGLs”) - remain a key, cost-competitive position for the Company's ethane- and propane-based production. The Company's U.S. and European ethylene production facilities allow Dow to use different feedstocks in response to price conditions. Meanwhile, the Company's U.S. Gulf Coast investments will strengthen ethylene and propylene integration and establish a platform for growth of Dow's downstream businesses.
Products
Major applications/market segments and products are listed below by business:
Business | Applications/Market Segments | Major Products |
Dow Elastomers | Adhesives, footwear, housewares, infrastructure, sports recreation, toys and infant products, transportation | Elastomers, polyolefin plastomers, ethylene propylene diene monomer elastomers ("EPDMs") |
Dow Electrical and Telecommunications | Building and construction, electrical transmission and distribution infrastructure, telecommunications infrastructure | Wire and cable insulation, semiconductive and jacketing compound solutions, bio-based plasticizers |
Dow Packaging and Specialty Plastics | Adhesives, food and specialty packaging, hygiene and medical, industrial and consumer packaging, transmission pipe and photovoltaics | Acrylics, polyethylene, low-density polyethylene, linear low-density polyethylene, high-density polyethylene, polyolefin plastomers |
Energy | Principally for use in Dow’s global operations | Power, steam and other utilities |
Hydrocarbons | Purchaser of feedstocks; production of cost competitive monomers utilized by Dow’s derivative businesses | Ethylene, propylene, benzene, butadiene, octene, aromatics co-products, crude C4 Advantaged feedstock positions in the United States, Canada, Argentina and the Middle East |
Competition
Competition for the Performance Plastics segment includes chemical divisions of major national and international oil companies, which provide competition in the United States and abroad. Dow competes worldwide on the basis of product quality, product supply, technology, price and customer service. Performance Plastics will continue to benefit from an advantaged feedstock position, including favorable shale gas dynamics in the United States, which will further strengthen the Company's low-cost position and enhance global cost competitiveness. Key competitors include BASF, Borealis, Braskem, CP Chem, ExxonMobil, INEOS, LyondellBasell, Mitsui and SABIC.
14
Joint Ventures
Joint ventures play an integral role within the Performance Plastics segment by dampening earnings cyclicality and improving earnings growth. Principal joint ventures impacting Performance Plastics are listed below:
Aligned 100 percent with Performance Plastics:
• | The Kuwait Styrene Company K.S.C. - a Kuwait-based company that manufactures styrene monomer; owned 42.5 percent by the Company. |
• | The SCG-Dow Group consists of Siam Polyethylene Company Limited; Siam Polystyrene Company Limited; Siam Styrene Monomer Co., Ltd.; and Siam Synthetic Latex Company Limited. These Thailand-based companies manufacture polyethylene, polystyrene, styrene and latex; owned 50 percent by the Company. |
Performance Plastics includes a portion of the results of:
• | EQUATE - a Kuwait-based company that manufactures ethylene, polyethylene and ethylene glycol; and manufactures and markets monoethylene glycol, diethylene glycol and polyethylene terephthalate resins; owned 42.5 percent by the Company. |
• | The Kuwait Olefins Company K.S.C. - a Kuwait-based company that manufactures ethylene and ethylene glycol; owned 42.5 percent by the Company. |
• | Map Ta Phut Olefins Company Limited - effective ownership is 32.77 percent of which the Company directly owns 20.27 percent (aligned with Performance Materials & Chemicals) and indirectly owns 12.5 percent through its equity interest in Siam Polyethylene Company Limited and Siam Synthetic Latex Company Limited (both part of The SCG-Dow Group and aligned with Performance Plastics). This Thailand-based company manufactures propylene and ethylene. |
• | Sadara Chemical Company - a Saudi Arabian company that currently manufactures chlorine, ethylene and propylene for internal consumption and manufactures and sells polyethylene; will produce and sell high-value added chemical products and other performance plastics when fully operational; owned 35 percent by the Company. |
On May 5, 2015, Univation Technologies, LLC, previously a 50:50 joint venture between Dow and ExxonMobil Chemical Company, became a wholly owned subsidiary of Dow. See Note 4 to the Consolidated Financial Statements for additional information on this transaction.
Current and Future Investments
The Company has a number of investments in the U.S. Gulf Coast to take advantage of increasing supplies of low-cost natural gas and natural gas liquids derived from shale gas including: construction of a new on-purpose propylene production facility, which commenced operations in December 2015; completion of a major maintenance turnaround in December 2016 at an ethylene production facility in Plaquemine, Louisiana, which included expanding the facility's ethylene production capacity by up to 250 kilotonnes per annum ("KTA") and modifications to enable full ethane cracking flexibility; and construction of a new world-scale ethylene production facility in Freeport, Texas, which is expected to start up in mid-2017. As a result of these investments, the Company's exposure to purchased ethylene and propylene is expected to decline, offset by increased exposure to ethane and propane feedstocks. Dow’s ethylene production capabilities are expected to increase by as much as 20 percent.
In 2016, the Company completed an expansion of a gas-phase polyethylene production facility in Seadrift, Texas. Expansion projects are also currently underway at two of the Company's gas-phase polyethylene units in St. Charles, Louisiana, with expected start-up in mid-2018. The Company is also building four new production facilities on the U.S. Gulf Coast to leverage an advantaged feedstock position to support profitable growth of the Company's high value Performance Plastics franchise which includes an ELITE™ Polymer production facility, a Low Density Polyethylene (LDPE) production facility and a NORDEL™ Metallocene EPDM production facility, which are all expected to start up in 2017, and a High Melt Index (HMI) AFFINITY™ Polymer production facility, which is expected to start up in the second half of 2018.
CORPORATE
Corporate includes certain enterprise and governance activities (including insurance operations, geographic management, risk management such as foreign currency hedging activities, audit fees, donations, etc.); the results of Ventures (including business incubation platforms and non-business aligned joint ventures); environmental operations; gains and losses on the sales of financial assets; severance costs; non-business aligned litigation expenses (including asbestos-related defense and processing costs and reserve adjustments); and, foreign exchange results.
15
RAW MATERIALS
The Company operates in an integrated manufacturing environment. Basic raw materials are processed through many stages to produce a number of products that are sold as finished goods at various points in those processes. The major raw material stream that feeds the production of the Company’s finished goods is hydrocarbon-based raw materials. The Company purchases hydrocarbon raw materials including ethane, propane, butane, naphtha and condensate as feedstocks. These raw materials are used in the production of both saleable products and energy. The Company also purchases certain monomers, primarily ethylene and propylene, to supplement internal production. The Company purchases natural gas, primarily to generate electricity, and purchases electric power to supplement internal generation. The Company also produces a portion of its electricity needs in Louisiana and Texas; Alberta, Canada; and Germany.
Expenditures for hydrocarbon feedstocks and energy accounted for 24 percent of the Company’s production costs and operating expenses for the year ended December 31, 2016. The Company purchases these raw materials on both short- and long-term contracts.
The Company had adequate supplies of raw materials during 2016, and expects to continue to have adequate supplies of raw materials in 2017. Significant raw materials, by operating segment, are listed below:
Significant Raw Materials | Performance Materials & Chemicals | ||||
Raw Material | Agricultural Sciences | Consumer Solutions | Infrastructure Solutions | Performance Plastics | |
Acetone | x | x | |||
Ammonia | x | x | x | ||
Aniline (1) | x | ||||
Benzene | x | x | |||
Butane | x | ||||
Butene | x | x | |||
Butyl Acrylate (1) | x | x | x | ||
Carbon Black | x | x | |||
Carbon Monoxide | x | ||||
Caustic Soda (1) | x | x | x | x | |
Chlorine (1) | x | x | x | x | |
Condensate | x | ||||
Electric Power | x | x | |||
Ethane | x | ||||
Ethanol | x | x | x | x | |
Ethylene (1) | x | x | x | ||
Formaldehyde | x | x | x | ||
Hexene | x | ||||
Hydrogen Peroxide (2) | x | ||||
Isopropanol | x | x | |||
Methanol | x | x | x | x | x |
Naphtha | x | ||||
Natural Gas | x | ||||
Nitrogen | x | x | |||
Octene (1) | x | ||||
Polystyrene | x | x | |||
Propane | x | x | x | ||
Propylene (1) | x | x | x | x | |
Pygas | x | ||||
Silica | x | x | |||
Silicon Metal (1) | x | x | |||
Styrene | x | x | |||
Wood Pulp | x | x | |||
(1) Produced by the Company and procured from external sources for internal consumption.
(2) Primarily produced and procured by a consolidated variable interest entity.
16
INDUSTRY SEGMENTS AND GEOGRAPHIC AREA RESULTS
See Note 26 to the Consolidated Financial Statements for information regarding sales, EBITDA and total assets by segment as well as sales and total assets by geographic area.
SIGNIFICANT CUSTOMERS AND PRODUCTS
All products and services are marketed primarily through the Company’s sales force, although in some instances more emphasis is placed on sales through distributors. No significant portion of any operating segment's sales is dependent upon a single customer. No single product accounted for more than five percent of the Company’s consolidated net sales in 2016.
RESEARCH AND DEVELOPMENT
The Company is engaged in a continuous program of basic and applied research to develop new products and processes, to improve and refine existing products and processes, and to develop new applications for existing products. Research and development expenses were $1,584 million in 2016, $1,598 million in 2015 and $1,647 million in 2014. At December 31, 2016, the Company employed approximately 7,200 people in various research and development activities.
PATENTS, LICENSES AND TRADEMARKS
The Company continually applies for and obtains U.S. and foreign patents and has a substantial number of pending patent applications throughout the world. At December 31, 2016, the Company owned 5,651 active U.S. patents and 25,449 active foreign patents as follows:
Patents Owned at December 31, 2016 | United States | Foreign | ||||
Agricultural Sciences | 1,041 | 4,603 | ||||
Consumer Solutions | 1,645 | 6,189 | ||||
Infrastructure Solutions | 1,338 | 6,827 | ||||
Performance Materials & Chemicals | 375 | 2,332 | ||||
Performance Plastics | 1,150 | 5,283 | ||||
Corporate | 102 | 215 | ||||
Total | 5,651 | 25,449 | ||||
Remaining Life of Patents Owned at December 31, 2016 | ||||||
United States | Foreign | |||||
Within 5 years | 1,384 | 5,170 | ||||
6 to 10 years | 1,187 | 8,000 | ||||
11 to 15 years | 2,312 | 10,843 | ||||
16 to 20 years | 768 | 1,436 | ||||
Total | 5,651 | 25,449 | ||||
Dow’s primary purpose in obtaining patents is to protect the results of its research for use in operations and licensing. Dow is also party to a substantial number of patent licenses and other technology agreements. The Company had revenue related to patent and technology royalties totaling $394 million in 2016, $357 million in 2015 and $388 million in 2014. The Company incurred royalties to others of $191 million in 2016, $198 million in 2015 and $170 million in 2014. Dow also has a substantial number of trademarks and trademark registrations in the United States and in other countries, including the “Dow in Diamond” trademark. Although the Company considers that its patents, licenses and trademarks in the aggregate constitute a valuable asset, it does not regard its business as being materially dependent on any single or group of related patents, licenses or trademarks.
17
PRINCIPAL PARTLY OWNED COMPANIES
Dow’s principal nonconsolidated affiliates at December 31, 2016, including direct or indirect ownership interest for each, are listed below:
Principal Nonconsolidated Affiliate | Ownership Interest | Business Description | |||
Dow Corning Corporation (1) | N/A | A U.S. company that manufactures silicone and silicone products | |||
EQUATE Petrochemical Company K.S.C. | 42.50 | % | A Kuwait-based company that manufactures ethylene, polyethylene and ethylene glycol, and manufactures and markets monoethylene glycol, diethylene glycol and polyethylene terephthalate resins | ||
The HSC Group: (1) | |||||
DC HSC Holdings LLC (2) | 50.00 | % | A U.S.-based group of companies that manufactures polycrystalline silicon products | ||
Hemlock Semiconductor L.L.C. | 50.10 | % | A U.S. company that sells polycrystalline silicon products | ||
The Kuwait Olefins Company K.S.C. | 42.50 | % | A Kuwait-based company that manufactures ethylene and ethylene glycol | ||
The Kuwait Styrene Company K.S.C. | 42.50 | % | A Kuwait-based company that manufactures styrene monomer | ||
Map Ta Phut Olefins Company Limited (3) | 32.77 | % | A Thailand-based company that manufactures propylene and ethylene | ||
Sadara Chemical Company (4) | 35.00 | % | A Saudi Arabian company that currently manufactures chlorine, ethylene and propylene for internal consumption and manufactures and sells polyethylene; will produce and sell high-value added chemical products and other performance plastics when fully operational | ||
The SCG-Dow Group: | |||||
Siam Polyethylene Company Limited | 50.00 | % | A Thailand-based company that manufactures polyethylene | ||
Siam Polystyrene Company Limited | 50.00 | % | A Thailand-based company that manufactures polystyrene | ||
Siam Styrene Monomer Co., Ltd. | 50.00 | % | A Thailand-based company that manufactures styrene | ||
Siam Synthetic Latex Company Limited | 50.00 | % | A Thailand-based company that manufactures latex | ||
(1) | As of June 1, 2016, Dow Corning, previously a 50:50 joint venture with Corning, became a wholly owned subsidiary of Dow as a result of the DCC Transaction. Dow and Corning continue to maintain their historical proportional equity interest in the HSC Group. Dow Corning was treated as a principal nonconsolidated affiliate through May 31, 2016. Beginning in June 2016, the results of Dow Corning, excluding the HSC Group, are fully consolidated into the Company's consolidated statements of income. The results of the HSC Group will continue to be reported as "Equity in earnings of nonconsolidated affiliates" in the Company's consolidated statements of income. See Note 4 to the Consolidated Financial Statements for additional information on this transaction. |
(2) | DC HSC Holdings LLC holds an 80.5 percent indirect ownership interest in Hemlock Semiconductor Operations. |
(3) | The Company's effective ownership of Map Ta Phut Olefins Company Limited is 32.77 percent, of which the Company directly owns 20.27 percent and indirectly owns 12.5 percent through its equity interest in Siam Polyethylene Company Limited and Siam Synthetic Latex Company Limited. |
(4) | Dow is responsible for marketing the majority of Sadara products outside of the Middle East zone through the Company's established sales channels. Under this arrangement, the Company purchases and sells Sadara products for a marketing fee. |
See Note 9 to the Consolidated Financial Statements for additional information regarding nonconsolidated affiliates.
FINANCIAL INFORMATION ABOUT FOREIGN AND DOMESTIC OPERATIONS AND EXPORT SALES
In 2016, the Company derived 65 percent of its sales and had 37 percent of its property investment outside the United States. While the Company’s international operations may be subject to a number of additional risks, such as changes in currency exchange rates and geopolitical risks in emerging geographies, the Company does not regard its foreign operations, on the whole, as carrying any greater risk than its operations in the United States. Information on sales and long-lived assets by geographic area for each of the last three years appears in Note 26 to the Consolidated Financial Statements, and discussions of the Company’s risk management program for foreign exchange and interest rate risk management appear in Part I, Item 1A. Risk Factors; Part II, Item 7A. Quantitative and Qualitative Disclosures About Market Risk; and Note 11 to the Consolidated Financial Statements.
18
PROTECTION OF THE ENVIRONMENT
Matters pertaining to the environment are discussed in Part I, Item 1A. Risk Factors; Part II, Item 7. Management's Discussion and Analysis of Financial Condition and Results of Operations; and Notes 1 and 15 to the Consolidated Financial Statements. In addition, detailed information on Dow's performance regarding environmental matters and goals can be found online on Dow's Sustainability webpage at www.dow.com. The Company's website and its content are not deemed incorporated by reference into this report.
EMPLOYEES
As of December 31, 2016, the Company permanently employed approximately 56,000 people on a full-time basis, with approximately 45 percent located in North America, 25 percent located in Europe, Middle East, Africa and India, and
30 percent located in other locations.
OTHER ACTIVITIES
Dow engages in the property and casualty insurance and reinsurance business primarily through its Liana Limited subsidiaries.
EXECUTIVE OFFICERS OF THE REGISTRANT
Set forth below is information related to the Company’s executive officers as of February 9, 2017.
Name - Age | Present Position with Registrant | Year Elected to be an Officer | Other Business Experience since January 1, 2012 |
Ronald C. Edmonds, 59 | Controller and Vice President of Controllers and Tax | 2009 | Vice President and Controller 2009 to date. Present position held since January 2016. |
James R. Fitterling, 55 | President and Chief Operating Officer | 2010 | Executive Vice President and President, Feedstocks & Energy and Corporate Development September 2011 to September 2012. Executive Vice President, Feedstocks, Performance Plastics, Asia and Latin America September 2012 to December 2013. Executive Vice President, Feedstocks, Performance Plastics and Supply Chain December 2013 to October 2014. Vice Chairman, Business Operations October 2014 to October 2015. Vice Chairman and Chief Operating Officer October 2015 to February 2016. Present position held since February 2016. |
Heinz Haller, 61 | Executive Vice President and President of Dow Europe, Middle East, Africa and India | 2006 | Executive Vice President and Chief Commercial Officer August 2010 to September 2012. Present position held since September 2012. |
Joe E. Harlan, 57 | Vice Chairman and Chief Commercial Officer | 2011 | Executive Vice President, Performance Materials September 2011 to September 2012. Executive Vice President, Chemicals, Energy and Performance Materials September 2012 to October 2014. Chief Commercial Officer and Vice Chairman, Market Businesses October 2014 to October 2015. Present position held since October 2015. |
Peter Holicki, 56 | Senior Vice President, Operations, Manufacturing & Engineering, Environment, Health & Safety Operations, and Emergency Services & Security | 2014 | Global Manufacturing Vice President, Hydrocarbons May 2009 to October 2012. Vice President for Manufacturing and Engineering Europe, Middle East and Africa May 2009 to October 2012. Vice President of Operations for Europe, Middle East and Africa and the Ethylene Envelope October 2012 to December 2013. Emergency Services and Security Expertise Center September 2014 to present. Corporate Vice President October 2014 to October 2015. Present position held since 2015. |
Charles J. Kalil, 65 | Executive Vice President and General Counsel | 2004 | General Counsel 2004 to date. Executive Vice President 2008 to date. Corporate Secretary 2005 to February 2015. |
Andrew N. Liveris, 62 | Chief Executive Officer and Chairman of the Board | 2003 | President 2004 to February 2016. Chief Executive Officer 2004 to date. Chairman 2006 to date. |
Johanna Söderström, 45 | Corporate Vice President, Human Resources and Aviation, and Chief Human Resource Officer | 2015 | Global Human Resources Director, Performance Materials Division January 2011 to October 2012. Vice President, Human Resource Center of Expertise October 2012 to January 2015. Present position held since January 2015. |
A. N. Sreeram, 49 | Senior Vice President, Research & Development and Chief Technology Officer | 2013 | Vice President, Research & Development, Dow Advanced Materials 2009 to October 2013. Corporate Vice President, Research & Development October 2013 to October 2015. Present position held since October 2015. |
Howard I. Ungerleider, 48 | Vice Chairman and Chief Financial Officer | 2011 | Senior Vice President and President, Performance Plastics March 2011 to September 2012. Executive Vice President, Advanced Materials September 2012 to October 2014. Chief Financial Officer and Executive Vice President October 2014 to October 2015. Present position held since October 2015. |
19
The Dow Chemical Company and Subsidiaries |
PART I, Item 1A. Risk Factors. |
RISK FACTORS
The factors described below represent the Company's principal risks.
Global Economic Considerations: The Company operates in a global, competitive environment which gives rise to operating and market risk exposure.
The Company sells its broad range of products and services in a competitive, global environment, and competes worldwide for sales on the basis of product quality, price, technology and customer service. Increased levels of competition could result in lower prices or lower sales volume, which could have a negative impact on the Company's results of operations. Sales of the Company's products are also subject to extensive federal, state, local and foreign laws and regulations, trade agreements, import and export controls, and duties and tariffs. The imposition of additional regulations, controls and duties and tariffs or changes to bilateral and regional trade agreements could result in lower sales volume which could negatively impact the Company's results of operations.
Economic conditions around the world, and in certain industries in which the Company does business, also impact sales prices and volume. As a result, market uncertainty or an economic downturn in the geographic areas or industries in which Dow sells its products could reduce demand for these products and result in decreased sales volume, which could have a negative impact on Dow's results of operations.
In addition, volatility and disruption of financial markets could limit customers' ability to obtain adequate financing to maintain operations, which could result in a decrease in sales volume and have a negative impact on Dow's results of operations. The Company's global business operations also give rise to market risk exposure related to changes in foreign exchange rates, interest rates, commodity prices and other market factors such as equity prices. To manage such risks, Dow enters into hedging transactions pursuant to established guidelines and policies. If Dow fails to effectively manage such risks, it could have a negative impact on the Company's results of operations.
Financial Commitments and Credit Markets: Market conditions could reduce the Company's flexibility to respond to changing business conditions or fund capital needs.
Adverse economic conditions could reduce the Company's flexibility to respond to changing business and economic conditions or to fund capital expenditures or working capital needs. The economic environment could result in a contraction in the availability of credit in the marketplace and reduce sources of liquidity for the Company. This could result in higher borrowing costs.
Raw Materials: Availability of purchased feedstocks and energy, and the volatility of these costs, impact Dow’s operating costs and add variability to earnings.
Purchased feedstock and energy costs account for a substantial portion of the Company’s total production costs and operating expenses. The Company purchases hydrocarbon raw materials including ethane, propane, butane, naphtha and condensate as feedstocks. The Company also purchases certain monomers, primarily ethylene and propylene, to supplement internal production, as well as other raw materials. The Company purchases natural gas, primarily to generate electricity, and purchases electric power to supplement internal generation.
Feedstock and energy costs generally follow price trends in crude oil and natural gas, which are sometimes volatile. While the Company uses its feedstock flexibility and financial and physical hedging programs to help mitigate feedstock cost increases, the Company is not always able to immediately raise selling prices. Ultimately, the ability to pass on underlying cost increases is dependent on market conditions. Conversely, when feedstock and energy costs decline, selling prices generally decline as well. As a result, volatility in these costs could impact the Company’s results of operations.
The Company has a number of investments in the U.S. Gulf Coast to take advantage of increasing supplies of low-cost natural gas and natural gas liquids derived from shale gas including: construction of a new on-purpose propylene production facility, which commenced operations in December 2015; completion of a major maintenance turnaround in December 2016 at an ethylene production facility in Plaquemine, Louisiana, which included expanding the facility's ethylene production capacity by up to 250 KTA and modifications to enable full ethane cracking flexibility; and construction of a new world-scale ethylene production facility in Freeport, Texas, which is expected to start up in mid-2017. As a result of these investments, the
20
Company's exposure to purchased ethylene and propylene is expected to decline, offset by increased exposure to ethane and propane feedstocks.
While the Company expects abundant and cost-advantaged supplies of NGLs in the United States to persist for the foreseeable future, if NGLs were to become significantly less advantaged than crude oil-based feedstocks, it could have a negative impact on the Company’s results of operations and future investments. Also, if the Company’s key suppliers of feedstocks and energy are unable to provide the raw materials required for production, it could have a negative impact on the Company's results of operations.
Supply/Demand Balance: Earnings generated by the Company's products vary based in part on the balance of supply relative to demand within the industry.
The balance of supply relative to demand within the industry may be significantly impacted by the addition of new capacity, especially for basic commodities where capacity is generally added in large increments as world-scale facilities are built. This may disrupt industry balances and result in downward pressure on prices due to the increase in supply, which could negatively impact the Company's results of operations.
Litigation: The Company is party to a number of claims and lawsuits arising out of the normal course of business with respect to product liability, patent infringement, employment matters, governmental tax and regulation disputes, contract and commercial litigation, and other actions.
Certain of the claims and lawsuits facing the Company purport to be class actions and seek damages in very large amounts. All such claims are contested. With the exception of the possible effect of the asbestos-related liability of Union Carbide Corporation (“Union Carbide”) and Chapter 11 related matters of Dow Corning as described below, it is the opinion of the Company's management that the possibility is remote that the aggregate of all such claims and lawsuits will have a material adverse impact on the Company's consolidated financial statements.
Union Carbide is and has been involved in a large number of asbestos-related suits filed primarily in state courts during the past four decades. At December 31, 2016, Union Carbide's total asbestos-related liability, including defense and processing costs, was $1,490 million ($437 million at December 31, 2015, which excluded defense and processing costs).
In 1995, Dow Corning, a former 50:50 joint venture, voluntarily filed for protection under Chapter 11 of the U.S. Bankruptcy Code in order to resolve breast implant liabilities and related matters ("Chapter 11 Proceeding"). Dow Corning emerged from the Chapter 11 Proceeding on June 1, 2004, and is implementing the Joint Plan of Reorganization (the "Plan"). The Plan provides funding for the resolution of breast implant and other product liability litigation covered by the Chapter 11 Proceeding and provides a process for the satisfaction of commercial creditor claims in the Chapter 11 Proceeding. At December 31, 2016, Dow Corning's liability for breast implant and other product liability claims was $263 million and the liability related to commercial creditor claims was $108 million.
See Note 15 to the Consolidated Financial Statements for additional information on these matters.
Environmental Compliance: The costs of complying with evolving regulatory requirements could negatively impact the Company's financial results. Actual or alleged violations of environmental laws or permit requirements could result in restrictions or prohibitions on plant operations, substantial civil or criminal sanctions, as well as the assessment of strict liability and/or joint and several liability.
The Company is subject to extensive federal, state, local and foreign laws, regulations, rules and ordinances relating to pollution, protection of the environment, greenhouse gas emissions, and the generation, storage, handling, transportation, treatment, disposal and remediation of hazardous substances and waste materials. At December 31, 2016, the Company had accrued obligations of $909 million ($670 million at December 31, 2015) for probable environmental remediation and restoration costs, including $151 million ($74 million at December 31, 2015) for the remediation of Superfund sites. This is management's best estimate of the costs for remediation and restoration with respect to environmental matters for which the Company has accrued liabilities, although it is reasonably possible that the ultimate cost with respect to these particular matters could range up to approximately two times that amount. Costs and capital expenditures relating to environmental, health or safety matters are subject to evolving regulatory requirements and depend on the timing of the promulgation and enforcement of specific standards which impose the requirements. Moreover, changes in environmental regulations could inhibit or interrupt the Company's operations, or require modifications to its facilities. Accordingly, environmental, health or safety regulatory matters could result in significant unanticipated costs or liabilities.
21
Health and Safety: Increased concerns regarding the safe use of chemicals in commerce and their potential impact on the environment as well as perceived impacts of plant biotechnology on health and the environment have resulted in more restrictive regulations and could lead to new regulations.
Concerns regarding the safe use of chemicals in commerce and their potential impact on health and the environment and the perceived impacts of plant biotechnology on health and the environment reflect a growing trend in societal demands for increasing levels of product safety and environmental protection. These concerns could manifest themselves in stockholder proposals, preferred purchasing, delays or failures in obtaining or retaining regulatory approvals, delayed product launches, lack of market acceptance, continued pressure for more stringent regulatory intervention and litigation. These concerns could also influence public perceptions, the viability or continued sales of certain of the Company's products, the Company's reputation and the cost to comply with regulations. In addition, terrorist attacks and natural disasters have increased concerns about the security and safety of chemical production and distribution. These concerns could have a negative impact on the Company's results of operations.
Local, state, federal and foreign governments continue to propose new regulations related to the security of chemical plant locations and the transportation of hazardous chemicals, which could result in higher operating costs.
Operational Event: A significant operational event could negatively impact the Company's results of operations.
As a diversified chemical manufacturing company, the Company's operations, the transportation of products, cyber attacks, or severe weather conditions and other natural phenomena (such as drought, hurricanes, earthquakes, tsunamis, floods, etc.) could result in an unplanned event that could be significant in scale and could negatively impact operations, neighbors or the public at large, which could have a negative impact on the Company's results of operations.
Major hurricanes have caused significant disruption in Dow's operations on the U.S. Gulf Coast, logistics across the region, and the supply of certain raw materials, which had an adverse impact on volume and cost for some of Dow's products. Due to the Company's substantial presence on the U.S. Gulf Coast, similar severe weather conditions or other natural phenomena in the future could negatively impact Dow's results of operations.
Cyber Vulnerability: The risk of loss of the Company’s intellectual property, trade secrets or other sensitive business information or disruption of operations could negatively impact the Company’s financial results.
Cyber attacks or security breaches could compromise confidential, business critical information, cause a disruption in the Company’s operations or harm the Company's reputation. The Company has attractive information assets, including intellectual property, trade secrets and other sensitive, business critical information. While the Company has a comprehensive cyber security program that is continuously reviewed, maintained and upgraded, a significant cyber attack could result in the loss of critical business information and/or could negatively impact operations, which could have a negative impact on the Company’s financial results.
Company Strategy: Implementing certain elements of the Company's strategy could negatively impact the Company's financial results.
The Company currently has manufacturing operations, sales and marketing activities, joint ventures, as well as proposed and existing projects of varying size in emerging geographies. Activities in these geographic areas are accompanied by uncertainty and risks including: navigating different government regulatory environments; relationships with new, local partners; project funding commitments and guarantees; expropriation, military actions, war, terrorism and political instability; sabotage; uninsurable risks; suppliers not performing as expected resulting in increased risk of extended project timelines; and determining raw material supply and other details regarding product movement. If the manufacturing operations, sales and marketing activities, and/or implementation of these projects is not successful, it could adversely affect the Company's financial condition, cash flows and results of operations.
The Company has also announced a number of portfolio management actions as part of Dow's ongoing transformation, including a proposed all-stock merger of equals transaction with E.I. du Pont de Nemours and Company, as well as transactions to restructure the Company's ownership interest in certain joint ventures. If the execution or implementation of these transactions is not successful, it could adversely impact the Company's financial condition, cash flows and results of operations.
Goodwill: An impairment of goodwill could negatively impact the Company's financial results.
At least annually, the Company assesses goodwill for impairment. If an initial qualitative assessment identifies that it is more likely than not that the carrying value of a reporting unit exceeds its estimated fair value, additional quantitative testing is performed. The Company may also elect to skip the qualitative testing and proceed directly to quantitative testing. If the quantitative testing indicates that goodwill is impaired, the carrying value of goodwill is written down to fair value with a charge against earnings. Since the Company utilizes a discounted cash flow methodology to calculate the fair value of its reporting units, continued weak demand for a specific product line or business could result in an impairment. Accordingly, any
22
determination requiring the write-off of a significant portion of goodwill could negatively impact the Company's results of operations.
Pension and Other Postretirement Benefits: Increased obligations and expenses related to the Company's defined benefit pension plans and other postretirement benefit plans could negatively impact Dow's financial condition and results of operations.
The Company has defined benefit pension plans and other postretirement benefit plans (the “plans”) in the United States and a number of other countries. The assets of the Company's funded plans are primarily invested in fixed income and equity securities of U.S. and foreign issuers. Changes in the market value of plan assets, investment returns, discount rates, mortality rates, regulations and the rate of increase in compensation levels may affect the funded status of the Company's plans and could cause volatility in the net periodic benefit cost, future funding requirements of the plans and the funded status of the plans. A significant increase in the Company's obligations or future funding requirements could have a negative impact on the Company's results of operations and cash flows for a particular period and on the Company's financial condition.
23
The Dow Chemical Company and Subsidiaries |
PART I, Item 1B. Unresolved Staff Comments. |
UNRESOLVED STAFF COMMENTS
None.
24
The Dow Chemical Company and Subsidiaries |
PART I, Item 2. Properties. |
PROPERTIES
The Company operates 189 manufacturing sites in 34 countries. Properties of Dow include facilities which, in the opinion of management, are suitable and adequate for the manufacture and distribution of Dow’s products. During 2016, the Company’s production facilities and plants operated at 85 percent of capacity. The Company’s major production sites, including consolidated variable interest entities, are as follows:
Location | Agricultural Sciences | Consumer Solutions | Infrastructure Solutions | Performance Materials & Chemicals | Performance Plastics |
Bahia Blanca, Argentina | x | ||||
Candeias, Brazil | x | ||||
Canada: | |||||
Fort Saskatchewan, Alberta | x | ||||
Joffre, Alberta | x | ||||
Germany: | |||||
Boehlen | x | x | x | ||
Bomlitz | x | x | |||
Leuna | x | ||||
Schkopau | x | x | x | x | |
Stade | x | x | x | x | x |
Terneuzen, The Netherlands | x | x | x | x | |
Tarragona, Spain | x | x | x | ||
Map Ta Phut, Thailand | x | x | x | ||
United States: | |||||
Carrollton, Kentucky | x | x | |||
Louisville, Kentucky | x | ||||
Hahnville (St. Charles), Louisiana | x | x | x | ||
Plaquemine, Louisiana | x | x | x | x | |
Midland, Michigan | x | x | x | x | x |
Deer Park, Texas | x | x | |||
Freeport, Texas | x | x | x | x | |
Seadrift, Texas | x | x | x | x | |
Texas City, Texas | x | x | |||
Wales, United Kingdom | x | x | |||
Zhangjiagang, China | x | x | x | ||
Including the major production sites, the Company has plants and holdings in the following geographic areas:
Asia Pacific: | 40 manufacturing locations in 11 countries. |
Canada: | 6 manufacturing locations in 3 provinces. |
Europe, Middle East, Africa and India: | 50 manufacturing locations in 17 countries. |
Latin America: | 33 manufacturing locations in 4 countries. |
United States: | 60 manufacturing locations in 25 states and 1 U.S. territory. |
All of Dow’s plants are owned or leased, subject to certain easements of other persons which, in the opinion of management, do not substantially interfere with the continued use of such properties or materially affect their value.
A summary of properties, classified by type, is provided in Note 8 to the Consolidated Financial Statements. Additional information regarding leased properties can be found in Note 19 to the Consolidated Financial Statements.
25
The Dow Chemical Company and Subsidiaries |
PART I, Item 3. Legal Proceedings. |
LEGAL PROCEEDINGS
Asbestos-Related Matters of Union Carbide Corporation
Union Carbide Corporation (“Union Carbide”), a wholly owned subsidiary of the Company, is and has been involved in a large number of asbestos-related suits filed primarily in state courts during the past four decades. These suits principally allege personal injury resulting from exposure to asbestos-containing products and frequently seek both actual and punitive damages. The alleged claims primarily relate to products that Union Carbide sold in the past, alleged exposure to asbestos-containing products located on Union Carbide’s premises, and Union Carbide’s responsibility for asbestos suits filed against a former Union Carbide subsidiary, Amchem Products, Inc.
For additional information, see Part II, Item 7. Other Matters, Asbestos-Related Matters of Union Carbide Corporation in Management’s Discussion and Analysis of Financial Condition and Results of Operations, and Notes 1 and 15 to the Consolidated Financial Statements.
Environmental Matters
In a meeting on July 22, 2015, Rohm and Haas Company and Rohm and Haas Chemicals LLC (collectively, “ROH”), wholly owned subsidiaries of the Company, were informed by representatives of the U.S. Environmental Protection Agency (“EPA”) of the EPA’s intent to seek injunctive relief and assess a civil penalty in excess of $100,000 for alleged violations of the General Duty Clause of the Clean Air Act at ROH’s Louisville, Kentucky, manufacturing facility. In a letter dated November 13, 2016, ROH was informed that after consideration of the information provided by the Company, the EPA has determined that it will not, at this time, pursue civil enforcement related to the alleged violations of the General Duty Clause of the Clean Air Act at ROH’s Louisville, Kentucky manufacturing facility.
Dow Corning Corporation ("Dow Corning"), a wholly owned subsidiary of the Company, has received the following notifications from the EPA, Region Five related to Dow Corning’s Midland manufacturing facility (the “Facility”): 1) a Notice of Violation and Finding of Violation (received in April 2012) which alleges a number of violations in connection with the detection, monitoring and control of certain organic hazardous air pollutants at the Facility and various recordkeeping and reporting violations under the Clean Air Act and 2) a Notice of Violation (received in May 2015) alleging a number of violations relating to the management of hazardous wastes at the Facility pursuant to the Resource Conservation and Recovery Act. While Dow Corning contests these allegations, resolution may result in a penalty in excess of $100,000. Discussions between the EPA and Dow Corning are ongoing.
On August 17, 2016, Dow Corning received notification from the Kentucky Department for Environmental Protection ("KDEP") of their intent to assess a civil penalty in excess of $100,000 for alleged air violations at Dow Corning's Carrollton, Kentucky, manufacturing facility. Discussions between Dow Corning and the KDEP are ongoing.
Rohm and Haas Texas Incorporated ("ROH Texas"), a wholly owned subsidiary of the Company, was informed by the EPA, Region 6 of concerns related to the operation and condition of certain flares installed at ROH Texas' Deer Park, Texas, manufacturing facility. This matter was resolved on January 12, 2017, through the issuance of an Administrative Complaint as well as a Consent Agreement and Final Order, under which ROH Texas does not admit the alleged violations but agrees to pay the U.S. Treasury $400,000 and commits to a mitigation plan involving additional monitoring and completion of two Supplemental Environmental Projects ("SEPs") to provide a local college with an air monitoring bench and improved energy efficient lighting. The SEPs are estimated to cost ROH Texas approximately $1.5 million.
Derivative Litigation
In April 2016, Stephen Levine ("Levine"), purportedly in the name of and on behalf of the Company, served the Company with a complaint filed in the United States District Court for the Eastern District of Michigan (the “Court”) against certain officers and directors of the Company (the “Defendants”) alleging, among other things, that Defendants breached certain fiduciary obligations with respect to the urethanes antitrust class action litigation and the underlying conduct alleged therein, and the use of corporate assets. Defendants and the Company moved to dismiss the complaint on July 13, 2016, arguing that Levine had not alleged sufficient facts to establish his ability to assert claims on the Company's behalf and that the allegations were not sufficient to state a legal claim. On October 19, 2016, the Court entered an order granting Defendants' motion to dismiss and entering judgment for the Defendants. In November 2016, the shareholder appealed the Court’s judgment to the United States Court of Appeals for the Sixth Circuit.
26
The Dow Chemical Company and Subsidiaries |
PART I, Item 4. Mine Safety Disclosures. |
MINE SAFETY DISCLOSURES
Not applicable.
27
The Dow Chemical Company and Subsidiaries |
PART II, Item 5. Market for Registrant’s Common Equity, |
Related Stockholder Matters and Issuer Purchases of Equity Securities. |
MARKET FOR REGISTRANT’S COMMON EQUITY, RELATED STOCKHOLDER MATTERS AND ISSUER PURCHASES OF EQUITY SECURITIES
The principal market for the Company’s common stock is the New York Stock Exchange, traded under the symbol “DOW.”
Quarterly market and dividend information can be found in Quarterly Statistics at the end of Part II, Item 8. Financial Statements and Supplementary Data.
At December 31, 2016, there were 57,838 registered common stockholders. The Company estimates there were an additional 855,171 stockholders whose shares were held in nominee names at December 31, 2016. At January 31, 2017, there were 57,651 registered common stockholders.
On December 15, 2016, the Board of Directors declared a quarterly dividend of $0.46 per share, payable January 30, 2017, to stockholders of record on December 28, 2016. On February 9, 2017, the Board of Directors announced the declaration of a quarterly dividend of $0.46 per share, payable April 28, 2017, to stockholders of record on March 31, 2017. Since 1912, the Company has maintained or increased the amount of the quarterly dividend, adjusted for stock splits, with the exception of February 12, 2009. During this 105-year period, Dow has increased the amount of the quarterly dividend 52 times (approximately 13 percent of the time), reduced the dividend once and maintained the amount of the quarterly dividend approximately 87 percent of the time.
See Part III, Item 11. Executive Compensation for information relating to the Company’s equity compensation plans.
Issuer Purchases of Equity Securities
The following table provides information regarding purchases of the Company’s common stock by the Company during the three months ended December 31, 2016:
Issuer Purchases of Equity Securities | Average price paid per share | Total number of shares purchased as part of the Company's publicly announced share repurchase program (1) | Approximate dollar value of shares that may yet be purchased under the Company's publicly announced share repurchase program (1) (In millions) | |||||||||||
Period | Total number of shares purchased | |||||||||||||
October 2016 | — | $ | — | — | $ | 1,896 | ||||||||
November 2016 | 8,822,551 | $ | 53.64 | 8,822,551 | $ | 1,423 | ||||||||
December 2016 | 493,480 | $ | 54.25 | 493,480 | $ | 1,396 | ||||||||
Fourth quarter 2016 | 9,316,031 | $ | 53.67 | 9,316,031 | $ | 1,396 | ||||||||
(1) | On February 13, 2013, the Board of Directors approved a share buy-back program, authorizing up to $1.5 billion to be spent on the repurchase of the Company’s common stock. On January 29, 2014, the Board of Directors announced an expansion of the Company's share buy-back authorization, authorizing an additional amount not to exceed $3 billion to be spent on the repurchase of the Company's common stock over a period of time. On November 12, 2014, the Board of Directors announced a new $5 billion tranche to its share buy-back program. As a result of these actions, the total authorized amount of the share repurchase program is $9.5 billion. |
28
The Dow Chemical Company and Subsidiaries |
PART II, Item 6. Selected Financial Data. |
SELECTED FINANCIAL DATA
In millions, except as noted (Unaudited) | 2016 | 2015 | 2014 | 2013 | 2012 | ||||||||||
Summary of Operations | |||||||||||||||
Net sales | $ | 48,158 | $ | 48,778 | $ | 58,167 | $ | 57,080 | $ | 56,786 | |||||
Net income (1) | $ | 4,404 | $ | 7,783 | $ | 3,839 | $ | 4,816 | $ | 1,100 | |||||
Per share of common stock (in dollars): | |||||||||||||||
Net income per common share - basic (1) | $ | 3.57 | $ | 6.45 | $ | 2.91 | $ | 3.72 | $ | 0.71 | |||||
Net income per common share - diluted (1) | $ | 3.52 | $ | 6.15 | $ | 2.87 | $ | 3.68 | $ | 0.70 | |||||
Cash dividends declared per share of common stock | $ | 1.84 | $ | 1.72 | $ | 1.53 | $ | 1.28 | $ | 1.21 | |||||
Book value per share of common stock | $ | 21.70 | $ | 23.06 | $ | 19.71 | $ | 22.59 | $ | 17.73 | |||||
Year-end Financial Position | |||||||||||||||
Total assets (2) (3) | $ | 79,511 | $ | 67,938 | $ | 68,639 | $ | 69,380 | $ | 69,462 | |||||
Long-term debt (2) | $ | 20,456 | $ | 16,215 | $ | 18,741 | $ | 16,732 | $ | 19,819 | |||||
Financial Ratios | |||||||||||||||
Research and development expenses as percent of net sales | 3.3 | % | 3.3 | % | 2.8 | % | 3.1 | % | 3.0 | % | |||||
Income before income taxes as percent of net sales (1) | 9.2 | % | 20.4 | % | 9.1 | % | 11.9 | % | 2.9 | % | |||||
Return on stockholders’ equity (1) | 15.3 | % | 34.4 | % | 18.6 | % | 19.4 | % | 5.0 | % | |||||
Debt as a percent of total capitalization | 44.0 | % | 39.7 | % | 45.5 | % | 38.9 | % | 48.7 | % | |||||
(1) | The 2016 values include the impact of a change in accounting policy for asbestos-related defense and processing costs. See Notes 1 and 15 to the Consolidated Financial Statements for additional information. |
(2) | Adjusted for the reclassification of debt issuance costs related to the adoption of ASU 2015-03 in 2015. See Note 2 to the Consolidated Financial Statements for additional information. |
(3) | Adjusted for the adoption of ASU 2015-17 in 2016. See Notes 1 and 2 to the Consolidated Financial Statements for additional information. |
29
The Dow Chemical Company and Subsidiaries | ||
PART II, Item 7. Management’s Discussion and | ||
(Unaudited) | Analysis of Financial Condition and Results of Operations. | |
MANAGEMENT'S DISCUSSION AND ANALYSIS OF FINANCIAL CONDITION AND RESULTS OF OPERATIONS Table of Contents | Page |
ABOUT DOW
Dow combines the power of science and technology to passionately innovate what is essential to human progress. The Company is driving innovations that extract value from material, polymer, chemical and biological science to help address many of the world's most challenging problems, such as the need for fresh food, safer and more sustainable transportation, clean water, energy efficiency, more durable infrastructure, and increasing agricultural productivity. Dow's integrated, market-driven portfolio delivers a broad range of technology-based products and solutions to customers in 175 countries and in high-growth sectors such as packaging, infrastructure, transportation, consumer care, electronics and agriculture. In 2016, Dow had annual sales of $48 billion and employed approximately 56,000 people worldwide. The Company's more than 7,000 product families are manufactured at 189 sites in 34 countries across the globe. The Company conducts its worldwide operations through global businesses, which are reported in five operating segments: Agricultural Sciences, Consumer Solutions, Infrastructure Solutions, Performance Materials & Chemicals and Performance Plastics.
In 2016, 38 percent of the Company’s sales were to customers in North America; 30 percent were in Europe, Middle East, Africa and India ("EMEAI"); while the remaining 32 percent were to customers in Asia Pacific and Latin America.
In 2016, the Company and its consolidated subsidiaries did not operate in countries subject to U.S. economic sanctions and export controls as imposed by the U.S. State Department or in countries designated by the U.S. State Department as state sponsors of terrorism, including Iran, Sudan and Syria. The Company has policies and procedures in place designed to ensure that it and its consolidated subsidiaries remain in compliance with applicable U.S. laws and regulations.
30
2016 OVERVIEW
Dow had another strong year in 2016, delivering on a number of strategic priorities including progress on growth investments and portfolio actions. A summary of financial highlights and other notable events are as follows:
Net sales for 2016 were $48.2 billion, down 1 percent from $48.8 billion in 2015, with volume up 5 percent and price down 6 percent. Sales declined in Performance Materials & Chemicals (down 23 percent, primarily due to the split-off of the chlorine value chain) and Agricultural Sciences (down 3 percent) which more than offset sales increases in Consumer Solutions (up 25 percent) and Infrastructure Solutions (up 17 percent), both of which include Dow Corning Corporation's ("Dow Corning") silicones business. Performance Plastics sales were flat. Sales declined in all geographic areas, except Asia Pacific (up 10 percent).
Volume increased 5 percent in 2016 compared with 2015, as increases in Consumer Solutions (up 29 percent), Infrastructure Solutions (up 23 percent), and Performance Plastics (up 8 percent) more than offset volume declines in Performance Materials & Chemicals (down 14 percent) and Agricultural Sciences (down 3 percent). Volume increased in all geographic areas, except Latin America (down 1 percent), including a double-digit increase in Asia Pacific (up 16 percent). Excluding the impact of recent acquisitions and divestitures(1), volume was up 4 percent with increases in all operating segments, except Infrastructure Solutions (down 3 percent) and Agricultural Sciences (down 2 percent). On the same basis, volume increased in all geographic areas, except Latin America which was flat.
Price was down 6 percent in 2016 compared with 2015, driven by lower feedstock and raw material prices and competitive pricing pressures. Price declines were reported in all operating segments, except Agricultural Sciences which was flat, and all geographic areas.
Dow's Board of Directors approved a restructuring plan in the second quarter of 2016 that incorporates actions related to the ownership restructure of Dow Corning. These actions, aligned with Dow’s value growth and synergy targets, will result in a global workforce reduction of approximately 2,500 positions, with most of these positions resulting from synergies related to the Dow Corning transaction. As a result, the Company recorded pretax restructuring charges of $449 million in 2016 related to this plan.
In the fourth quarter of 2016, the Company changed its method of accounting for asbestos-related defense and processing costs from expensing as incurred to estimating and accruing a liability through the expected terminal date of 2049, resulting in a charge of $1,009 million. The Company also increased its asbestos-related liability for pending and future claims through the expected terminal date of 2049, resulting in an additional charge of $104 million.
Dow's earnings from nonconsolidated affiliates totaled $442 million in 2016, down from $674 million in 2015. In 2016, equity earnings decreased as higher earnings from The SCG-Dow Group, Map Ta Phut Olefins Company Limited and the HSC Group were more than offset by higher equity losses from Sadara Chemical Company ("Sadara") related to start-up expenses, and lower equity earnings from the Kuwait joint ventures as a result of lower monoethylene glycol prices and a reduction in the ownership of MEGlobal (now part of EQUATE Petrochemicals Company K.S.C. ("EQUATE")). Equity earnings also declined as a result of the ownership restructure of Dow Corning ("DCC Transaction").
Sundry income (expense) - net was income of $1,202 million in 2016, reflecting a gain related to the DCC Transaction partially offset by a loss related to the Company's settlement of the urethane matters class action lawsuit and the opt-out cases litigation.
The provision for income taxes was $9 million in 2016, which resulted in an effective tax rate of 0.2 percent, down from $2,147 million in 2015, or an effective tax rate of 21.6 percent. The provision for income taxes decreased primarily due to the non-taxable gain on the DCC Transaction, a tax benefit on the reassessment of a deferred tax liability related to the basis difference in the Company’s investment in Dow Corning and the deductibility of both the urethane matters class action lawsuit and opt-out cases settlements and the asbestos-related charge resulting from the change in accounting policy.
The Company resumed its share repurchase program in the third quarter of 2016 after the shareholder vote on the DowDuPont merger on July 20, 2016. During 2016, the Company executed $916 million in share repurchases. At December 31, 2016, $1.4 billion of the share buy-back authorization remained available for repurchases.
(1) | Excludes prior period sales of recent divestitures including the chlorine value chain, divested on October 5, 2015 (primarily Performance Materials & Chemicals and Performance Plastics); the AgroFresh business, divested on July 31, 2015 (Agricultural Sciences); ANGUS Chemical Company, divested on February 2, 2015 (Performance Materials & Chemicals); and the global Sodium Borohydride business, divested on January 30, 2015 (Performance Materials & Chemicals). Also excludes current period sales related to the ownership restructure of Dow Corning announced on June 1, 2016 (Consumer Solutions and Infrastructure Solutions) and sales from January 1, 2016 through April 30, 2016 for the step acquisition of Univation Technologies, LLC, acquired on May 5, 2015 (Performance Plastics). |
31
On December 30, 2016, the Company converted 4 million shares of the Company's Cumulative Convertible Perpetual Preferred Stock, Series A ("Preferred Stock") into 96.8 million shares of the Company's common stock. As a result of this conversion, the annual Preferred Stock dividend of $340 million will be eliminated.
Other notable events and highlights from 2016 include:
• | On March 7, 2016, the Company announced its new, on-purpose propylene production facility in Freeport, Texas, successfully completed the performance test, certifying that the 750 kilotonnes per annum ("KTA") unit is capable of operating at full operating capacity. |
• | On June 1, 2016, the Company announced the closing of the transaction to restructure the ownership of Dow Corning, a former 50:50 joint venture. As a result, Dow is now the 100 percent owner of Dow Corning's silicones business. |
• | On June 9, 2016, DowDuPont's registration statement filed with the U.S. Securities and Exchange Commission on Form S-4 (File No. 333-209869), as amended, was declared effective. The registration statement was filed in connection with the proposed merger with E. I. du Pont de Nemours & Company ("DuPont") and includes a joint proxy statement of Dow and DuPont and a prospectus of DowDuPont. |
• | In connection with the planned merger of equals transaction with DuPont, Dow held a special meeting of stockholders on July 20, 2016. Stockholders of the Company voted to approve all stockholder proposals necessary to complete the merger of equals transaction. |
• | On August 29, 2016, the Company announced that its joint venture in the Middle East - Sadara - achieved a significant milestone with the successful start-up of its mixed feed cracker and a third polyethylene train, which added to the two polyethylene trains already in operation. |
• | On December 9, 2016, the Company announced that it will invest in a new, state-of-the-art innovation center in Midland, Michigan, which will support approximately 200 research and development jobs in Michigan, including 100 newly created jobs while repatriating 100 jobs from other Dow facilities throughout the globe to Midland. |
• | Dow launched two additional Pack Studios in 2016 - the opening of Pack Studios Singapore, the second Pack Studios center for Asia Pacific, and Pack Studios Ringwood, located in North America and focused on laminating adhesives. |
• | Dow completed expansions of its Louisiana ethylene and Seadrift, Texas, gas-phase polyethylene production facilities, delivering further integration strength to complement the Company's market-focused downstream investments. |
• | Dow was named to the Dow Jones Sustainability World Index - marking the 16th time the Company has been named to this global benchmark. |
• | Dow received seven R&D 100 Awards from R&D Magazine for revolutionary technologies including: BETAFORCE™ 2817 Structural Adhesive, two awards for CANVERA™ Polyolefin Dispersions, Dow Corning® TC-3040 Thermal Gel, Flexible Acrylic Resin, PARADIGM™ WG Herbicide with ARYLEX™ Active and DOW AGILITY™ Performance LDPE. |
• | Dow received two 2016 Sustainability Awards from the Business Intelligence Group including the Sustainability Initiative of the Year Award for RETAIN™ Polymer Modifiers and the Sustainability Product of the Year Award for CANVERA™ Polyolefin Dispersions. |
• | Dow AgroSciences LLC was the recipient of a Presidential Green Chemistry Challenge Award from the U.S. Environmental Protection Agency for INSTINCT® Nitrogen Stabilizer. |
• | Dow was recognized in the Top 10 Best Companies for Leaders by Chief Executive magazine. |
• | Dow was named to the 2016 Working Mother 100 Best Companies list, marking the 12th time Dow has received this prestigious recognition. |
• | Dow was named to Forbes Just 100: America's Best Corporation Citizens in 2016 list - recognizing the Company's strategic vision and actions to deliver long-term value to society as a whole while earning the right to operate. |
32
• | Dow was named the ICIS Company of the Year, based on financial metrics, by weekly global publication ICIS Chemical Business. The selection takes into account year-on-year growth in profits at the operating and net levels, as well as margins. |
• | Dow was honored for the 12th consecutive year by the Human Rights Campaign for achieving a 100 percent rating on its corporate equality index - a global benchmarking tool on corporate policies and practices related to lesbian, gay, bisexual and transgender (LGBT) employees. |
• | On February 2, 2016, Dow announced the planned transition of Chairman and Chief Executive Officer Andrew N. Liveris. The transition will occur on the earlier of the material completion of the anticipated spins following the closing of the announced DowDuPont merger transaction or June 30, 2017. |
• | On February 2, 2016, James R. Fitterling was appointed President and Chief Operating Officer. He succeeds Andrew N. Liveris as President with Mr. Liveris continuing as the Company's Chairman and Chief Executive Officer. |
• | On April 15, 2016, Gary McGuire was elected Vice President and Treasurer, succeeding Fernando Ruiz, Corporate Vice President and Treasurer, who announced his intention to retire from the Company. |
Dow’s results of operations and financial condition for the year ended December 31, 2016, are described in further detail in the following discussion and analysis.
RESULTS OF OPERATIONS
Net Sales
Net sales for 2016 were $48.2 billion, down 1 percent from $48.8 billion in 2015, with volume up 5 percent and price down 6 percent. Price decreased in all operating segments, except Agricultural Sciences which was flat, and all geographic areas, due to lower feedstock and raw material prices and competitive pricing pressures. Volume increases in Consumer Solutions (up 29 percent) and Infrastructure Solutions (up 23 percent), both of which include Dow Corning's silicones business, and Performance Plastics (up 8 percent) more than offset lower volume in Performance Materials & Chemicals (down 14 percent, primarily due to the split-off of the chlorine value chain) and Agricultural Sciences (down 3 percent). Volume increased in Asia Pacific (up 16 percent), North America (up 5 percent), EMEAI (up 3 percent) and declined in Latin America (down 1 percent). Excluding recent acquisitions and divestitures(1), volume was up 4 percent as increases in Performance Plastics (up 9 percent), Consumer Solutions (up 4 percent) and Performance Materials & Chemicals (up 2 percent) more than offset declines in Infrastructure Solutions (down 3 percent) and Agricultural Sciences (down 2 percent). On the same basis, volume increased in all geographic areas, except Latin America which remained flat.
Net sales for 2015 were $48.8 billion, down 16 percent from $58.2 billion in 2014, with volume up 1 percent and price down 17 percent. Price decreased in all operating segments and geographic areas, driven primarily by a decline in average crude oil prices of approximately 45 percent and the unfavorable impact of currency, which represented nearly 30 percent of the price decline. Double-digit price declines were reported in all geographic areas and all operating segments, except Agricultural Sciences (down 8 percent) and Consumer Solutions (down 7 percent). Volume increases in Performance Plastics (up 5 percent), Infrastructure Solutions (up 2 percent) and Consumer Solutions (up 1 percent) more than offset lower volume in Performance Materials & Chemicals (down 6 percent) and Agricultural Sciences (down 4 percent). Volume increased in Asia Pacific (up 3 percent) and remained flat in North America, EMEAI and Latin America. Excluding the impact of recent acquisitions and divestitures(1), Performance Materials & Chemicals volume was up 1 percent and Agricultural Sciences volume was down 3 percent. Volume increased in all geographic areas, led by Asia Pacific (up 4 percent).
Sales in the United States accounted for 35 percent of total sales in 2016 (35 percent in 2015 and 33 percent in 2014). See the Sales Volume and Price tables at the beginning of the section titled “Segment Results” for details regarding the change in sales by operating segment and geographic area. In addition, sales and other information by operating segment and geographic area are provided in Note 26 to the Consolidated Financial Statements.
(1) | Excludes prior period sales of recent divestitures including the chlorine value chain, divested on October 5, 2015 (primarily Performance Materials & Chemicals and Performance Plastics); the AgroFresh business, divested on July 31, 2015 (Agricultural Sciences); ANGUS Chemical Company, divested on February 2, 2015 (Performance Materials & Chemicals); and the global Sodium Borohydride business, divested on January 30, 2015 (Performance Materials & Chemicals). Also excludes current period sales related to the ownership restructure of Dow Corning announced on June 1, 2016 (Consumer Solutions and Infrastructure Solutions) and sales from January 1, 2016 through April 30, 2016 for the step acquisition of Univation, acquired on May 5, 2015 (Performance Plastics). |
33
Gross Margin
Gross margin was $10.5 billion in 2016, $10.9 billion in 2015 and $10.7 billion in 2014. Gross margin in 2016 was impacted by a $317 million loss associated with the fair value step-up in inventories acquired in the DCC Transaction, reflected in Consumer Solutions ($147 million) and Infrastructure Solutions ($170 million); a $295 million charge for environmental matters, reflected in Agricultural Sciences ($2 million), Performance Materials & Chemicals ($1 million), Performance Plastics ($2 million) and Corporate ($290 million); $124 million of costs associated with transactions and productivity actions (reflected in Corporate); and a $117 million charge for the termination of a terminal use agreement (reflected in Performance Plastics). Excluding these items, gross margin increased compared with 2015 as lower feedstock, energy and other raw material costs, cost cutting and productivity initiatives, higher sales volume and the favorable impact from the addition of Dow Corning's silicones business more than offset lower selling prices. See Notes 4 and 15 to the Consolidated Financial Statements for additional information regarding these items.
Gross margin increased in 2015 driven by an $8,542 million decrease in purchased feedstock and energy costs and the favorable impact of currency on costs which was partially offset by lower selling prices, including the unfavorable impact of currency. In 2015, gross margin was reduced by $91 million of charges for asset impairments and related costs, including the shutdown of manufacturing assets and facilities in the Dow Building & Construction, Energy & Water Solutions and Dow Packaging and Specialty Plastics businesses and the abandonment of certain capital projects in the Dow Building & Construction and Dow Coating Materials businesses and reflected in the following segments: Infrastructure Solutions ($34 million) and Performance Plastics ($57 million). Gross margin was also reduced by $24 million of costs associated with transactions and productivity actions (reflected in Corporate) and a $12 million loss related to Univation Technologies, LLC ("Univation") for the fair value step-up of inventories assumed in the step acquisition (reflected in Performance Plastics). See Notes 4 and 12 to the Consolidated Financial Statements for additional information regarding these items.
Gross margin in 2014 was positively impacted by increased sales volume, a $392 million decrease in purchased feedstock and energy costs, lower other raw material costs and increased operating rates. Gross margin in 2014 was reduced by a $100 million warranty accrual adjustment related to an exited business (reflected in Infrastructure Solutions) and by $23 million for asset impairments related to the Dow Electronic Materials business (reflected in Consumer Solutions). See Notes 12 and 15 to the Consolidated Financial Statements for additional information regarding these items.
Operating Rate
Dow's global plant operating rate was 85 percent of capacity in 2016, flat compared with 2015 and 2014.
Personnel Count
The Company permanently employed approximately 56,000 people at December 31, 2016, up from approximately 46,500 at December 31, 2015. Headcount increased in 2016 primarily due to the DCC Transaction, which was partially offset by a decline related to the Company's restructuring programs. Personnel count at December 31, 2015, decreased from approximately 50,000 at December 31, 2014, primarily due to the separation of employees as a result of divestitures and the Company's restructuring programs.
Research and Development Expenses
Research and development (“R&D”) expenses were $1,584 million in 2016, compared with $1,598 million in 2015 and $1,647 million in 2014. In 2016, R&D expenses decreased slightly compared with 2015, as increased costs from Dow Corning's silicones business were more than offset by decreased spending due to divestitures and cost reduction initiatives as well as lower performance-based compensation costs. In 2015, R&D expenses decreased primarily due to cost reduction initiatives, notably in Agricultural Sciences, which were partially offset by increased performance-based compensation costs.
Selling, General and Administrative Expenses
Selling, general and administrative (“SG&A”) expenses were $3,304 million in 2016, compared with $2,971 million in 2015 and $3,106 million in 2014. In 2016, SG&A was negatively impacted by $379 million of costs associated with transactions and productivity actions, reflected in Corporate ($51 million in 2015). Excluding these items, SG&A expenses were essentially flat in 2016 compared with 2015, as increased costs from Dow Corning's silicones business were nearly offset by decreased spending due to divestitures and cost reduction initiatives as well as lower performance-based compensation costs. In 2015, SG&A expenses decreased as lower expenses, notably in Agricultural Sciences, and from the impact of divestitures, more than offset increased performance-based compensation costs.
34
Production Costs and Operating Expenses
The following table illustrates the relative size of the primary components of total production costs and operating expenses of Dow. More information about each of these components can be found in other sections of Management’s Discussion and Analysis of Financial Condition and Results of Operations, and Notes to the Consolidated Financial Statements.
Production Costs and Operating Expenses | |||||||||
Cost components as a percent of total | 2016 | 2015 | 2014 | ||||||
Hydrocarbon feedstocks and energy | 24 | % | 27 | % | 38 | % | |||
Salaries, wages and employee benefits | 17 | 18 | 15 | ||||||
Maintenance | 4 | 5 | 4 | ||||||
Depreciation | 5 | 4 | 4 | ||||||
Restructuring charges | 1 | 1 | — | ||||||
Supplies, services and other raw materials | 49 | 45 | 39 | ||||||
Total | 100 | % | 100 | % | 100 | % | |||
Amortization of Intangibles
Amortization of intangibles was $544 million in 2016, $419 million in 2015 and $436 million in 2014. The increase in amortization in 2016 is primarily due to an increase in intangible assets as a result of the DCC Transaction. See Notes 4 and 10 to the Consolidated Financial Statements for additional information on intangible assets.
Goodwill and Other Intangible Asset Impairment Losses
The Company performs annual goodwill impairment tests in the fourth quarter of the year. In 2016, the Company performed qualitative testing for 11 of the 14 reporting units carrying goodwill (9 of 12 reporting units in 2015 and 9 of 14 reporting units in 2014) and quantitative testing for the remaining three reporting units (three in 2015 and five in 2014). No goodwill impairments were identified in 2016, 2015 and 2014. See Critical Accounting Policies in Other Matters in Management’s Discussion and Analysis of Financial Condition and Results of Operations and Note 10 to the Consolidated Financial Statements for additional information regarding goodwill and the impairment tests conducted.
In the fourth quarter of 2014, the Company recognized a pretax charge of $50 million for the impairment of intangible assets in the Dow Electronic Materials business, reflected in the Consumer Solutions segment. See Notes 10 and 12 to the Consolidated Financial Statements for additional information on this impairment.
Restructuring Charges (Credits)
On June 27, 2016, the Board of Directors of the Company approved a restructuring plan that incorporates actions related to the DCC Transaction. These actions, aligned with Dow’s value growth and synergy targets, will result in a global workforce reduction of approximately 2,500 positions, with most of these positions resulting from synergies related to the DCC Transaction. These actions are expected to be substantially completed by June 30, 2018. As a result, the Company recorded pretax restructuring charges of $449 million in the second quarter of 2016 consisting of severance costs of $268 million, asset write-downs and write-offs of $153 million and costs associated with exit and disposal activities of $28 million and reflected in the Company's segments results as follows: $28 million in Consumer Solutions, $97 million in Infrastructure Solutions, $10 million in Performance Plastics and $314 million in Corporate.
On April 29, 2015, Dow's Board of Directors approved actions to further streamline the organization and optimize the Company’s footprint as a result of the split-off of the chlorine value chain. These actions, which further accelerate Dow’s value growth and productivity targets, will result in a reduction of approximately 1,750 positions across a number of businesses and functions and adjustments to the Company's asset footprint to enhance competitiveness. These actions are expected to be completed primarily by June 30, 2017. As a result of these actions, the Company recorded pretax restructuring charges of $375 million in the second quarter of 2015 consisting of severance costs of $196 million, asset write-downs and write-offs of $169 million and costs associated with exit and disposal activities of $10 million. In the fourth quarter of 2015, the Company recorded a restructuring charge adjustment of $40 million, primarily related to severance costs for the separation of approximately 500 additional positions. The impact of these charges was reflected in the Company's segment results as follows: $16 million in Agricultural Sciences, $67 million in Consumer Solutions, $26 million in Infrastructure Solutions, $12 million in Performance Plastics and $294 million in Corporate.
In 2016, the Company recorded an unfavorable restructuring charge adjustment of $6 million for additional accruals for costs associated with exit and disposal activities and a favorable adjustment of $3 million for the impairment of long-lived assets related to the 2015 Restructuring plan. The net charge was included in the Company's segment results as follows: $5 million charge in Agricultural Sciences, $1 million charge in Consumer Solutions and a $3 million gain in Infrastructure Solutions.
35
In 2014, the Company recognized a pretax gain of $3 million for adjustments to contract cancellation fees related to the 4Q12 Restructuring plan, reflected in Performance Materials & Chemicals. See Note 3 to the Consolidated Financial Statements for details on the Company's restructuring activities.
Asbestos-related Charge
In 2016, the Company and Union Carbide Corporation ("Union Carbide"), a wholly owned subsidiary, elected to change the method of accounting for asbestos-related defense and processing costs from expensing as incurred to estimating and accruing a liability. As a result of this accounting policy change, the Company recorded a pretax charge of $1,009 million for asbestos-related defense costs through the terminal year of 2049. The Company also recorded a pretax charge of $104 million to increase the asbestos-related liability for pending and future claims through the terminal year of 2049. These charges were reflected in Corporate.
In 2014, the Company recorded a pretax charge of $78 million (reflected in Corporate) for an increase in the asbestos-related liability for pending and future claims (excluding defense and processing costs). Union Carbide determined that an adjustment to the asbestos accrual was required due to an increase in mesothelioma claim activity compared with what had been previously forecasted. See Notes 1 and 15 to the Consolidated Financial Statements for additional information on asbestos-related matters.
Equity in Earnings of Nonconsolidated Affiliates
Dow’s share of the earnings of nonconsolidated affiliates in 2016 was $442 million, compared with $674 million in 2015 and $835 million in 2014. In 2016, equity earnings declined due to higher equity losses at Sadara related to start-up expenses, lower equity earnings from the Kuwait joint ventures due to lower monoethylene glycol prices and a reduction in the ownership of MEGlobal (now part of EQUATE), and the DCC Transaction. Equity earnings for 2016 also declined due to a charge of $22 million for a loss on early redemption of debt incurred by Dow Corning and reflected in Consumer Solutions ($8 million) and Infrastructure Solutions ($14 million). These declines were partially offset by higher earnings at the HSC Group, The SCG-Dow Group and Map Ta Phut Olefins Company Limited. In 2015, equity earnings decreased as higher earnings at The SCG-Dow Group and Map Ta Phut Olefins Company Limited were more than offset by increased equity losses from Sadara, lower equity earnings from Univation resulting from the May 5, 2015, step acquisition and lower earnings from EQUATE, The Kuwait Olefins Company K.S.C. ("TKOC") and MEGlobal. Equity earnings in 2015 were also impacted by a $29 million charge (reflected in Agricultural Sciences) related to AgroFresh Solutions' fair value step-up of its inventories and start-up costs and a loss recognized by Sadara related to the write-off of design engineering work for an epoxy plant, of which Dow's share was $27 million (reflected in Corporate). In 2014, equity earnings decreased primarily due to lower earnings at EQUATE, The Kuwait Styrene Company K.S.C. ("TKSC") and MEGlobal and increased losses at Sadara which were partially offset by increased earnings at Dow Corning.
On June 1, 2016, the Company announced the closing of the transaction to restructure the ownership of Dow Corning, a former 50:50 joint venture between Dow and Corning. As a result, Dow Corning became a wholly owned subsidiary of Dow. Dow and Corning continue to maintain their historical proportional equity interest in the HSC Group. See Note 4 to the Consolidated Financial Statements for additional information on this transaction.
In January 2014, the Chinese Ministry of Commerce issued a final determination that China's solar-grade polycrystalline silicon industry suffered material damage because of dumping, which resulted in antidumping duties of 53.3 percent and countervailing duties of 2.1 percent on future imports from the HSC Group into China. During the fourth quarter of 2014, Dow Corning determined its polycrystalline silicon plant expansion in Clarksville, Tennessee, would not be economically viable and made the decision to permanently abandon the assets. Dow's share of the charge related to this asset abandonment was $500 million (reflected in Infrastructure Solutions). As a result of the significant change in the use of this asset, Dow Corning assessed whether the carrying value of all remaining polycrystalline silicon assets might be impaired. Dow Corning's estimates of future undiscounted cash flows indicated the polycrystalline silicon asset group was recoverable.
During the fourth quarter of 2014, Dow Corning reduced its implant liability by approximately $1.3 billion. The revised implant liability reflected Dow Corning’s best estimate of its remaining obligations. Dow’s share of the implant liability reduction was $407 million ($155 million reflected in Consumer Solutions and $252 million reflected in Infrastructure Solutions). In the fourth quarter of 2015, Dow Corning further reduced its implant liability. Dow's share of the implant liability reduction was $20 million ($8 million reflected in Consumer Solutions and $12 million reflected in Infrastructure Solutions). See Note 9 to the Consolidated Financial Statements for additional information on nonconsolidated affiliates and Note 15 for additional information on Dow Corning's implant liability.
36
Sundry Income (Expense) - Net
Sundry income (expense) - net includes a variety of income and expense items such as the gain or loss on foreign currency exchange, dividends from investments, and gains and losses on sales of investments and assets, and litigation. Sundry income (expense) - net for 2016 was net income of $1,202 million, compared with net income of $4,592 million in 2015 and net expense of $27 million in 2014.
In 2016, sundry income (expense) - net included a $2,445 million gain related to the DCC Transaction (reflected in Consumer Solutions ($1,301 million) and Infrastructure Solutions ($1,144 million)), a $6 million gain adjustment on the split-off of the Company's chlorine value chain (reflected in Performance Materials & Chemicals), a $27 million favorable adjustment related to a decrease in Dow Corning's implant liability (reflected in Consumer Solutions) and gains on sales of assets and investments. These gains more than offset a $1,235 million loss related to the Company's settlement of the urethane matters class action lawsuit and the opt-out cases litigation (reflected in Performance Materials & Chemicals), a $143 million impairment charge related to the Company's investment in AgroFresh Solutions, Inc., a $20 million charge for post-closing adjustments related to non-cash consideration for the AgroFresh divestiture (both reflected in Agricultural Sciences), $41 million of costs associated with transactions and productivity actions (reflected in Corporate) and foreign currency exchange losses. See Notes 4, 5, 6, 9, 12, 13 and 15 to the Consolidated Financial Statements for additional information.
In 2015, sundry income (expense) - net included a $2,233 million gain on the split-off of the Company's chlorine value chain (reflected in Performance Materials & Chemicals (gain of $1,984 million), Performance Plastics (gain of $317 million), and Corporate (loss of $68 million)), a $723 million gain on the sale of MEGlobal (reflected in Performance Materials & Chemicals), a $682 million gain on the divestiture of ANGUS Chemical Company (reflected in Performance Materials & Chemicals), a $20 million gain on the divestiture of the global Sodium Borohydride business (reflected in Performance Materials & Chemicals), a $618 million gain related to the divestiture of the AgroFresh business (net of an $8 million loss for mark-to-market adjustments on the fair value of warrants receivable and reflected in Agricultural Sciences), a $361 million gain on the Univation step acquisition (reflected in Performance Plastics) and gains on sales of assets and investments. These gains more than offset foreign currency exchange losses, including a $98 million loss related to the impact of the Argentine peso devaluation (reflected in Corporate), a $53 million loss on asset impairments and related costs (reflected in Infrastructure Solutions), an $8 million loss related to the early extinguishment of debt (reflected in Corporate) and $119 million of costs associated with transactions and productivity actions (reflected in Corporate). See Notes 4, 5, 6, 9, 12, 13 and 17 to the Consolidated Financial Statements for additional information.
In 2014, sundry income (expense) - net included a gain related to the termination of an off-take agreement and gains on asset sales which were more than offset by foreign currency exchange losses, venture capital investment losses and $49 million of costs associated with transactions and productivity actions (reflected in Corporate).
Net Interest Expense
Net interest expense (interest expense less capitalized interest and interest income) was $751 million in 2016, down from $875 million in 2015 and $932 million in 2014. In 2016, net interest expense decreased primarily due to the impact of approximately $2.5 billion of debt retired in 2015. In 2015, net interest expense decreased due to the impact of higher capitalized interest as a result of increased capital spending, primarily related to U.S. Gulf Coast projects, which more than offset higher interest expense related to the issuance of $2 billion of debt in 2014. Interest income was $107 million in 2016, $71 million in 2015 and $51 million in 2014. Interest expense (net of capitalized interest) and amortization of debt discount totaled $858 million in 2016, $946 million in 2015 and $983 million in 2014. See Liquidity and Capital Resources in Management's Discussion and Analysis of Financial Condition and Results of Operations and Note 17 to the Consolidated Financial Statements for additional information related to debt financing activity.
Provision for Income Taxes
The Company's effective tax rate fluctuates based on, among other factors, where income is earned, reinvestment assertions regarding foreign income and the level of income relative to tax credits available. For example, as the percentage of foreign sourced income increases, the Company's effective tax rate declines. The Company's tax rate is also influenced by the level of equity earnings, since most of the earnings from the Company's equity method investments are taxed at the joint venture level. The underlying factors affecting the Company's overall tax rate are summarized in Note 23 to the Consolidated Financial Statements.
The provision for income taxes was $9 million in 2016, down from $2,147 million in 2015 and $1,426 million in 2014. The tax rate for 2016 was favorably impacted by the non-taxable gain on the DCC Transaction and a tax benefit on the reassessment of a deferred tax liability related to the basis difference in the Company’s investment in Dow Corning. The tax rate was also favorably impacted by the geographic mix of earnings, the availability of foreign tax credits and the deductibility of both the urethane matters class action lawsuit and opt-out cases settlements and the asbestos-related charge. A reduction in equity
37
earnings and non-deductible costs associated with transactions and productivity actions unfavorably impacted the tax rate. These factors resulted in an effective tax rate of 0.2 percent for 2016.
The tax rate for 2015 was favorably impacted by portfolio actions, specifically the tax-efficient split-off of the Company's chlorine value chain, the non-taxable gain from the Univation step acquisition, and the sale of MEGlobal. The geographic mix of earnings favorably impacted the tax rate with the gain from the ANGUS Chemical Company divestiture and continued profitability improvement in Europe and Asia Pacific providing most of the benefit. The tax rate was unfavorably impacted by foreign subsidiaries repatriating cash to the United States which was primarily derived from divestiture proceeds. Reduced equity earnings and continued increases in statutory income in Latin America and Canada due to local currency devaluations also unfavorably impacted the tax rate. These factors resulted in an effective tax rate of 21.6 percent for 2015.
The tax rate for 2014 was favorably impacted by the geographic mix of earnings, with the most notable components being improved profitability in Europe and Asia Pacific. Equity earnings were strong, providing additional favorable impact on the tax rate. The tax rate was also favorably impacted by a reduction in the tax impact on remittances by foreign subsidiaries to the United States. The tax rate was unfavorably impacted by a continued increase in statutory income in Latin America due to local currency devaluations, and increases in valuation allowances, primarily in Asia Pacific. These factors resulted in an effective tax rate of 27.1 percent for 2014.
Net Income Attributable to Noncontrolling Interests
Net income attributable to noncontrolling interests was $86 million in 2016, $98 million in 2015 and $67 million in 2014. Net income attributable to noncontrolling interests decreased in 2016 compared with 2015, primarily due to losses incurred by a cogeneration facility in Brazil, which more than offset earnings from Dow Corning's consolidated joint ventures. Net income attributable to noncontrolling interests increased in 2015 compared with 2014, primarily due to higher earnings at most of the Company's consolidated joint ventures which was partially offset by an after-tax loss related to the exercise of an equity option by a noncontrolling interest in a variable interest entity. In addition to the items previously discussed, 2015 was also impacted by noncontrolling interests' portion of the 2015 restructuring charge. See Notes 3, 20 and 25 to the Consolidated Financial Statements for additional information on these matters.
Preferred Stock Dividends
Preferred Stock dividends of $340 million were recognized in 2016, 2015 and 2014. The final Preferred Stock dividend was paid on December 30, 2016. See Note 22 to the Consolidated Financial Statements for additional information.
Net Income Available for Common Stockholders
Net income available for common stockholders was $3,978 million ($3.52 per share) in 2016, compared with $7,345 million ($6.15 per share) in 2015 and $3,432 million ($2.87 per share) in 2014.
Certain Items Impacting Results
The Company provides certain financial measures - Income before income taxes, Net income and Earnings per share - excluding the impact of certain items ("non-GAAP" financial measures). Due to the nature of these certain items, they do not reflect the ongoing operating performance of the Company. Accordingly, Dow's management believes presenting financial measures excluding certain items is useful for investors as it provides financial information on a more comparative basis for the periods presented. Non-GAAP financial measures are not recognized in accordance with principles generally accepted in the United State of America ("U.S. GAAP") and should not be viewed as an alternative to U.S. GAAP financial measures of performance. In addition, these measures are not intended to replace U.S. GAAP measures.
38
The following table summarizes the impact of certain items recorded in 2016, 2015 and 2014:
Certain Items Impacting Results | Pretax Impact (1) | Impact on Net Income (2) | Impact on EPS (3) (4) (5) | ||||||||||||||||||||||||||||||||
In millions, except per share amounts | 2016 | 2015 | 2014 | 2016 | 2015 | 2014 | 2016 | 2015 | 2014 | ||||||||||||||||||||||||||
Reported U.S. GAAP Amounts (6) | $ | 3,978 | $ | 7,345 | $ | 3,432 | $ | 3.52 | $ | 6.15 | $ | 2.87 | |||||||||||||||||||||||
- Certain items: | |||||||||||||||||||||||||||||||||||
Cost of sales: | |||||||||||||||||||||||||||||||||||
Environmental charges | $ | (295 | ) | $ | — | $ | — | (205 | ) | — | — | (0.17 | ) | — | — | ||||||||||||||||||||
Charge for termination of a terminal use agreement | (117 | ) | — | — | (74 | ) | — | — | (0.06 | ) | — | — | |||||||||||||||||||||||
Impact of Dow Corning ownership restructure | (317 | ) | — | — | (216 | ) | — | — | (0.19 | ) | — | — | |||||||||||||||||||||||
Asset impairments and related costs | — | (91 | ) | (23 | ) | — | (70 | ) | (14 | ) | — | (0.06 | ) | (0.01 | ) | ||||||||||||||||||||
Warranty accrual adjustment of exited business | — | — | (100 | ) | — | — | (63 | ) | — | — | (0.05 | ) | |||||||||||||||||||||||
Univation step acquisition | — | (12 | ) | — | — | (8 | ) | — | — | (0.01 | ) | — | |||||||||||||||||||||||
Transactions and productivity costs | (124 | ) | (24 | ) | — | (79 | ) | (16 | ) | — | (0.06 | ) | (0.01 | ) | — | ||||||||||||||||||||
Selling, general and administrative expenses: | |||||||||||||||||||||||||||||||||||
Transactions and productivity costs | (379 | ) | (51 | ) | — | (307 | ) | (38 | ) | — | (0.27 | ) | (0.03 | ) | — | ||||||||||||||||||||
Goodwill and other intangible asset impairment losses | — | — | (50 | ) | — | — | (33 | ) | — | — | (0.03 | ) | |||||||||||||||||||||||
Restructuring charges | (454 | ) | (415 | ) | — | (308 | ) | (274 | ) | — | (0.27 | ) | (0.24 | ) | — | ||||||||||||||||||||
Asbestos-related charge | (1,113 | ) | — | (78 | ) | (701 | ) | — | (49 | ) | (0.58 | ) | — | (0.04 | ) | ||||||||||||||||||||
Equity in earnings of nonconsolidated affiliates: | |||||||||||||||||||||||||||||||||||
Impact of Dow Corning ownership restructure | (22 | ) | — | — | (20 | ) | — | — | (0.02 | ) | — | — | |||||||||||||||||||||||
Joint venture actions | — | (36 | ) | (93 | ) | — | (26 | ) | (87 | ) | — | (0.02 | ) | (0.08 | ) | ||||||||||||||||||||
Sundry income (expense) - net: | |||||||||||||||||||||||||||||||||||
Implant liability adjustment | 27 | — | — | 17 | — | — | 0.01 | — | — | ||||||||||||||||||||||||||
Charges related to AgroFresh | (163 | ) | — | — | (103 | ) | — | — | (0.08 | ) | — | — | |||||||||||||||||||||||
Impact of Dow Corning ownership restructure | 2,445 | — | — | 2,586 | — | — | 2.28 | — | — | ||||||||||||||||||||||||||
Urethane matters legal settlements | (1,235 | ) | — | — | (778 | ) | — | — | (0.70 | ) | — | — | |||||||||||||||||||||||
Gain on split-off of chlorine value chain | 6 | 2,233 | — | 6 | 2,215 | — | 0.01 | 1.96 | — | ||||||||||||||||||||||||||
Gain on sale of MEGlobal | — | 723 | — | — | 589 | — | — | 0.52 | — | ||||||||||||||||||||||||||
Gain on 2015 business divestitures | — | 1,320 | — | — | 823 | — | — | 0.71 | — | ||||||||||||||||||||||||||
Gain on Univation step acquisition | — | 361 | — | — | 359 | — | — | 0.31 | — | ||||||||||||||||||||||||||
Asset impairments and related costs | — | (53 | ) | — | — | (53 | ) | — | — | (0.05 | ) | — | |||||||||||||||||||||||
Impact of Argentine peso devaluation | — | (98 | ) | — | — | (106 | ) | — | — | (0.09 | ) | — | |||||||||||||||||||||||
Loss on early extinguishment of debt | — | (8 | ) | — | — | (5 | ) | — | — | — | — | ||||||||||||||||||||||||
Transactions and productivity costs | (41 | ) | (119 | ) | (49 | ) | (48 | ) | (99 | ) | (31 | ) | (0.05 | ) | (0.09 | ) | (0.03 | ) | |||||||||||||||||
Provision for income taxes: | |||||||||||||||||||||||||||||||||||
Uncertain tax position | — | — | — | (13 | ) | — | — | (0.01 | ) | — | — | ||||||||||||||||||||||||
Total certain items | $ | (1,782 | ) | $ | 3,730 | $ | (393 | ) | $ | (243 | ) | $ | 3,291 | $ | (277 | ) | $ | (0.16 | ) | $ | 2.90 | $ | (0.24 | ) | |||||||||||
+ Dilutive effect of assumed preferred stock conversion into shares of common stock | $ | 0.04 | $ | 0.22 | N/A | ||||||||||||||||||||||||||||||
= Operating Results (Non-GAAP) (7) | $ | 4,221 | $ | 4,054 | $ | 3,709 | $ | 3.72 | $ | 3.47 | $ | 3.11 | |||||||||||||||||||||||
(1) | Impact on "Income Before Income Taxes." |
(2) | Impact on "Net Income Available for The Dow Chemical Company Common Stockholders." |
(3) | Impact on "Earnings per common share - diluted." |
(4) | The assumed conversion of the Company's Preferred Stock into shares of the Company's common stock was excluded from the calculation of "Earnings per common share - diluted" for the twelve-month periods ended December 31, 2016 and December 31, 2014. The assumed conversion of the Company's Preferred Stock into shares of the Company's common stock was excluded from the calculation of "Operating earnings per common share - diluted" (Non-GAAP) as well as the certain items earnings per share impact for the twelve-month periods ended December 31, 2015 and December 31, 2014 because the effect of including them would have been antidilutive. |
(5) | For the twelve-month period ended December 31, 2016, an assumed conversion of the Company's Preferred Stock into shares of the Company's common stock was included in the calculation of "Operating earnings per common share - diluted" (Non-GAAP). For the twelve-month period ended December 31, 2015, an assumed conversion of the Company's Preferred Stock into shares of the Company's common stock was included in the calculation of "Earnings per common share - diluted" (GAAP). |
(6) | The Company used "Net Income Attributable to The Dow Chemical Company" when calculating "Earnings per common share - diluted" (GAAP) for the twelve-month period ended December 31, 2015, as it excludes preferred dividends of $340 million. |
(7) | "Operating earnings per common share - diluted" (Non-GAAP) for the twelve-month period ended December 31, 2016, excludes preferred dividends of $340 million. |
39
SEGMENT RESULTS
The Company uses EBITDA (which Dow defines as earnings (i.e., "Net Income") before interest, income taxes, depreciation and amortization) as its measure of profit/loss for segment reporting purposes. EBITDA by operating segment includes all operating items relating to the businesses; items that principally apply to the Company as a whole are assigned to Corporate. In the segment discussions that follow, the Company provides EBITDA excluding certain items. Due to the nature of these certain items, they do not reflect the ongoing operating performance of the Company. Accordingly, Dow's management believes presenting EBITDA excluding certain items is useful for investors as it provides financial information on a more comparative basis for the periods presented. EBITDA excluding certain items is not recognized in accordance with U.S. GAAP and should not be viewed as an alternative to U.S. GAAP financial measures of performance. Additional information regarding the Company's operating segments and a reconciliation of “Income Before Income Taxes” to EBITDA can be found in Note 26 to the Consolidated Financial Statements.
Due to the completion of several acquisitions and divestitures (see Notes 4, 5 and 6 to the Consolidated Financial Statements), the change in sales volume from 2015 to 2016, 2014 to 2015 and 2013 to 2014 excluding acquisitions and divestitures is also provided by operating segment, where applicable.
SALES VOLUME AND PRICE BY OPERATING SEGMENT AND GEOGRAPHIC AREA
Sales Volume and Price by Operating Segment and Geographic Area | ||||||||||||||||||||||||||
2016 | 2015 | 2014 | ||||||||||||||||||||||||
Percent change from prior year | Volume | Price | Total | Volume | Price | Total | Volume | Price | Total | |||||||||||||||||
Operating Segments: | ||||||||||||||||||||||||||
Agricultural Sciences | (3 | )% | — | % | (3 | )% | (4 | )% | (8 | )% | (12 | )% | 3 | % | (1 | )% | 2 | % | ||||||||
Consumer Solutions | 29 | (4 | ) | 25 | 1 | (7 | ) | (6 | ) | 3 | (1 | ) | 2 | |||||||||||||
Infrastructure Solutions | 23 | (6 | ) | 17 | 2 | (14 | ) | (12 | ) | 1 | — | 1 | ||||||||||||||
Performance Materials & Chemicals | (14 | ) | (9 | ) | (23 | ) | (6 | ) | (15 | ) | (21 | ) | 2 | — | 2 | |||||||||||
Performance Plastics | 8 | (8 | ) | — | 5 | (23 | ) | (18 | ) | — | 2 | 2 | ||||||||||||||
Total | 5 | % | (6 | )% | (1 | )% | 1 | % | (17 | )% | (16 | )% | 2 | % | — | % | 2 | % | ||||||||
Geographic Areas: | ||||||||||||||||||||||||||
United States | 5 | % | (6 | )% | (1 | )% | — | % | (14 | )% | (14 | )% | 2 | % | 2 | % | 4 | % | ||||||||
Europe, Middle East, Africa & India | 3 | (7 | ) | (4 | ) | — | (22 | ) | (22 | ) | 3 | (1 | ) | 2 | ||||||||||||
Rest of World | 7 | (6 | ) | 1 | 1 | (13 | ) | (12 | ) | (1 | ) | — | (1 | ) | ||||||||||||
Total | 5 | % | (6 | )% | (1 | )% | 1 | % | (17 | )% | (16 | )% | 2 | % | — | % | 2 | % | ||||||||
Sales Volume and Price by Operating Segment and Geographic Area, Excluding Acquisitions and Divestitures (1) | ||||||||||||||||||||||||||
2016 | 2015 | 2014 | ||||||||||||||||||||||||
Percent change from prior year | Volume | Price | Total | Volume | Price | Total | Volume | Price | Total | |||||||||||||||||
Operating Segments: | ||||||||||||||||||||||||||
Agricultural Sciences | (2 | )% | — | % | (2 | )% | (3 | )% | (8 | )% | (11 | )% | 3 | % | (1 | )% | 2 | % | ||||||||
Consumer Solutions | 4 | (4 | ) | — | 1 | (7 | ) | (6 | ) | 3 | (1 | ) | 2 | |||||||||||||
Infrastructure Solutions | (3 | ) | (6 | ) | (9 | ) | 2 | (14 | ) | (12 | ) | 1 | — | 1 | ||||||||||||
Performance Materials & Chemicals | 2 | (11 | ) | (9 | ) | 1 | (16 | ) | (15 | ) | 2 | — | 2 | |||||||||||||
Performance Plastics | 9 | (8 | ) | 1 | 5 | (23 | ) | (18 | ) | 1 | 2 | 3 | ||||||||||||||
Total | 4 | % | (7 | )% | (3 | )% | 2 | % | (17 | )% | (15 | )% | 2 | % | — | % | 2 | % | ||||||||
Geographic Areas: | ||||||||||||||||||||||||||
United States | 4 | % | (7 | )% | (3 | )% | 2 | % | (14 | )% | (12 | )% | 2 | % | 2 | % | 4 | % | ||||||||
Europe, Middle East, Africa & India | 4 | (8 | ) | (4 | ) | 3 | (23 | ) | (20 | ) | 4 | (1 | ) | 3 | ||||||||||||
Rest of World | 3 | (6 | ) | (3 | ) | 2 | (13 | ) | (11 | ) | — | — | — | |||||||||||||
Total | 4 | % | (7 | )% | (3 | )% | 2 | % | (17 | )% | (15 | )% | 2 | % | — | % | 2 | % | ||||||||
(1) | Excludes prior period sales of recent divestitures including the chlorine value chain, divested on October 5, 2015 (primarily Performance Materials & Chemicals and Performance Plastics); the AgroFresh business, divested on July 31, 2015 (Agricultural Sciences); ANGUS Chemical Company, divested on February 2, 2015 (Performance Materials & Chemicals); the global Sodium Borohydride business, divested on January 30, 2015 (Performance Materials & Chemicals); the Polypropylene Licensing and Catalysts business, divested on December 2, 2013 (Performance Plastics); and sales related to Nippon Unicar Company Limited, divested on July 1, 2013 (Performance Plastics). Also excludes current period sales related to the ownership restructure of Dow Corning announced on June 1, 2016 (Consumer Solutions and Infrastructure Solutions), the step acquisition of Univation, acquired on May 5, 2015 (Performance Plastics) and sales from Cooperativa Central de Pesquisa Agrícola's ("Coodetec"), acquired on February 1, 2015 (Agricultural Sciences). |
40
AGRICULTURAL SCIENCES
The Agricultural Sciences segment is a global leader in providing crop protection and seed/plant biotechnology products and technologies, urban pest management solutions and healthy oils. The business invents, develops, manufactures and markets products for use in agricultural, industrial and commercial pest management. Agricultural Sciences consists of two businesses - Crop Protection and Seeds.
On January 30, 2015, DAS acquired Coodetec's seed business. See Note 4 to the Consolidated Financial Statements for additional information on this acquisition.
On July 31, 2015, the Company sold its AgroFresh business to AgroFresh Solutions, Inc. (“AFSI”). The AgroFresh business was reported in the Agricultural Sciences segment through the date of divestiture. The Company has retained a minority interest in AFSI which is also reported in the Agricultural Sciences segment. See Note 5 to the Consolidated Financial Statements for additional information on this divestiture.
Agricultural Sciences In millions | 2016 | 2015 | 2014 | |||||||||
Sales | $ | 6,174 | $ | 6,381 | $ | 7,290 | ||||||
Price change from comparative period | — | % | (8 | )% | (1 | )% | ||||||
Volume change from comparative period | (3 | )% | (4 | )% | 3 | % | ||||||
Volume change, excluding acquisitions and divestitures | (2 | )% | (3 | )% | 3 | % | ||||||
Equity earnings (losses) | $ | 3 | $ | (15 | ) | $ | 4 | |||||
EBITDA | $ | 806 | $ | 1,432 | $ | 962 | ||||||
Certain items impacting EBITDA | $ | (170 | ) | $ | 573 | $ | — | |||||
EBITDA excluding certain items | $ | 976 | $ | 859 | $ | 962 | ||||||
2016 Versus 2015
Agricultural Sciences sales were $6,174 million in 2016, down 3 percent from $6,381 million in 2015. Compared with the same period last year, volume decreased 3 percent and price was flat. Sales declined in all geographic areas, except Latin America, as low crop commodity prices continued to drive a slow-growth agricultural market. Crop Protection sales decreased 6 percent compared with 2015, driven primarily by the AgroFresh divestiture, currency headwinds and reduced demand for insecticides and herbicides, primarily glyphosate. Seeds sales increased 7 percent compared with 2015, as strong demand and price increases for corn seeds in Latin America more than offset the impact of product lines divested in 2015 and lower demand for sunflower and cotton seeds. Excluding acquisitions and divestitures, volume for the segment declined 2 percent.
EBITDA for 2016 was $806 million, down $626 million from $1,432 million in 2015. EBITDA for 2016 was impacted by a $143 million impairment charge related to the Company's equity interest in AFSI, a $20 million charge related to post-closing adjustments on the sale of AgroFresh, a $5 million unfavorable adjustment to the 2015 restructuring charge, and a $2 million charge for environmental matters. EBITDA for 2015 was impacted by a gain of $618 million related to the divestiture of AgroFresh, $16 million of restructuring charges and a $29 million charge related to AFSI's fair value step-up of its inventories and start-up costs. See Notes 3, 5, 9, 12, 13, 15 and 20 to the Consolidated Financial Statements for additional information on these certain items. Excluding these certain items, EBITDA increased compared with the same period last year as benefits from lower operating costs driven by productivity initiatives and increased corn seeds sales more than offset lower sales of herbicides and insecticides and the absence of earnings from AgroFresh and other product lines divested in 2015.
2015 Versus 2014
Agricultural Sciences sales were $6,381 million in 2015, down 12 percent from $7,290 million in 2014. Compared with 2014, volume decreased 4 percent and price decreased 8 percent, including the unfavorable impact of currency which represented approximately 40 percent of the price decline. Sales declined in all geographic areas and both businesses, impacted by lower crop commodity prices, which drove a flat agricultural market, coupled with currency headwinds. Despite a 6 percent increase in new product sales, Crop Protection sales decreased 13 percent compared with 2014, partly driven by declines in glyphosate and the divestiture of AgroFresh in the third quarter of 2015. Seeds reported an 11 percent decline in sales compared with 2014 as soybean seeds and canola seeds growth was more than offset by lower sales of corn seeds, primarily due to lower sales in the Americas as a result of shifting acreage from corn to soybeans. Excluding acquisitions and divestitures, volume for the segment was down 3 percent.
EBITDA for 2015 was $1,432 million, up $470 million from $962 million in 2014. EBITDA for 2015 was favorably impacted by $573 million of certain items, as previously discussed. Excluding these certain items, EBITDA declined from 2014 as lower selling prices, softer demand due to lower crop commodity prices and the absence of earnings from the divestiture of the
41
AgroFresh business more than offset the favorable impact of currency on costs, lower R&D and SG&A spending driven by productivity measures and gains from the sales of product lines and a subsidiary.
Agricultural Sciences Outlook for 2017
Agricultural Sciences sales for 2017 are expected to show modest growth despite a projection of flat to declining sales in the global agriculture industry. Market dynamics experienced in 2016 are expected in 2017, with continued low crop commodity prices and declining industry growth rates. Currency headwinds are also expected due to the strengthening U.S. dollar. The Crop Protection business expects sales growth in 2017, driven by the continued adoption of N-SERVE™ Nitrogen Stabilizer, ISOCLAST™ insecticide and ARYLEX™ herbicide, as well as increased demand for cereal, corn and soybean herbicides. The Seeds business expects volume growth in corn, cotton and sunflower seeds and lower sales of soybean seeds.
U.S. federal regulatory approvals have been obtained for the commercialization of ENLIST™ Corn, Soybeans and Cotton, including the U.S. Environmental Protection Agency's registration of ENLIST DUO™ for use with ENLIST™ Corn, Soybeans and Cotton in 34 states. The Company has also secured approval of the registration of ENLIST E3™ Soybeans in Argentina and approval of the registration of ENLIST E3™ Soybeans, ENLIST™ Soybean Seeds and ENLIST™ Corn Seeds in Brazil and Canada. ENLIST DUO™ is also approved for use with ENLIST™ crops in Canada. Regulatory approvals for ENLIST™ products in certain other countries are still pending.
CONSUMER SOLUTIONS
The Consumer Solutions segment consists of four global businesses – Consumer Care, Dow Automotive Systems, Dow Electronic Materials and Consumer Solutions - Silicones. This segment also includes a portion of the Company’s share of the results of Dow Corning, a joint venture of the Company through May 31, 2016, and the results of the HSC Group. Consumer Care includes Dow Home, Institutional & Personal Care Solutions, Dow Pharma and Food Solutions and SAFECHEM™. Dow Automotive Systems includes Adhesives and Performance Solutions. Dow Electronic Materials includes Semiconductor Technologies, Interconnect Technologies, Display Technologies and Growth Technologies. Consumer Solutions - Silicones includes Beauty and Personal Care, Household Care, Healthcare, Consumer Goods and Automotive.
As of June 1, 2016, Dow Corning, previously a 50:50 joint venture with Corning, became a wholly owned subsidiary of Dow as a result of the DCC Transaction. Dow and Corning continue to maintain their historical proportional equity interest in the HSC Group. Beginning in June 2016, the results of Dow Corning, excluding the HSC Group, are fully consolidated into the Company's consolidated statements of income and aligned with the Consumer Solutions and Infrastructure Solutions segments. The results of the HSC Group will continue to be reported as "Equity in earnings of nonconsolidated affiliates" in the Company's consolidated statements of income and aligned with the Consumer Solutions and Infrastructure Solutions segments. See Note 4 to the Consolidated Financial Statements for additional information on this transaction.
On December 31, 2016, the Company sold its SAFECHEM™ business. SAFECHEM™ was reported as part of the Consumer Solutions segment through the date of divestiture.
Consumer Solutions In millions | 2016 | 2015 | 2014 | |||||||||
Sales | $ | 5,455 | $ | 4,379 | $ | 4,639 | ||||||
Price change from comparative period | (4 | )% | (7 | )% | (1 | )% | ||||||
Volume change from comparative period | 29 | % | 1 | % | 3 | % | ||||||
Volume change, excluding acquisitions | 4 | % | 1 | % | 3 | % | ||||||
Equity earnings | $ | 132 | $ | 91 | $ | 281 | ||||||
EBITDA | $ | 2,828 | $ | 1,048 | $ | 1,130 | ||||||
Certain items impacting EBITDA | $ | 1,144 | $ | (59 | ) | $ | 82 | |||||
EBITDA excluding certain items | $ | 1,684 | $ | 1,107 | $ | 1,048 | ||||||
2016 Versus 2015
Consumer Solutions sales were $5,455 million in 2016, up from $4,379 million in 2015. Sales increased 25 percent from 2015, with volume up 29 percent and price down 4 percent. Volume increased in all geographic areas, primarily reflecting the impact of Consumer Solutions - Silicones, and in all businesses. Excluding the impact of Consumer Solutions - Silicones, volume increased 4 percent. Consumer Care volume increased due to market share and innovation gains in the home and personal care market sectors in North America and EMEAI. This increase more than offset customer de-stocking of cellulosics used in pharmaceutical applications, primarily in North America, and from the shutdown of a cellulosics facility in Institute, West Virginia, in the fourth quarter of 2015. Dow Automotive Systems reported strong volume growth primarily driven by demand
42
for Dow's light-weighting technologies used at original equipment manufacturers as well as solid demand for sound-dampening solutions. Dow Electronic Materials reported increased volume in Asia Pacific, driven by chemical mechanical planarization pads used in semiconductor manufacturing along with new demand for organic light-emitting diodes used in mobile phone displays. Price declined in all businesses and all geographic areas. Competitive pricing pressures for home care products drove price declines in Consumer Care. Price declined in Dow Automotive Systems in response to lower raw material costs. Price declined in Dow Electronic Materials, primarily in Display Technologies, due to continued competitive pricing pressures.
EBITDA for 2016 was $2,828 million, up from $1,048 million in 2015. EBITDA for 2016 was impacted by a gain of $1,301 million on the DCC Transaction, a $27 million benefit related to a decrease in Dow Corning's implant liability, $28 million of 2016 restructuring charges, a loss of $147 million associated with the fair value step-up in inventories assumed in the DCC Transaction, a loss of $8 million related to the early redemption of debt incurred by Dow Corning, and a $1 million unfavorable adjustment related to the Company’s 2015 restructuring program. EBITDA for 2015 was impacted by $67 million of restructuring charges and an $8 million gain related to Dow Corning’s adjustment of its implant liability. See Notes 3, 4, 9 and 15 to the Consolidated Financial Statements for additional information on these certain items. Excluding these certain items, EBITDA increased in 2016 as earnings from Consumer Solutions - Silicones, higher sales volume, lower feedstock, energy and other raw material costs and higher equity earnings from the HSC Group more than offset the impact of lower selling prices.
2015 Versus 2014
Consumer Solutions sales were $4,379 million in 2015, down from $4,639 million in 2014. Sales decreased 6 percent from 2014, with volume up 1 percent and price down 7 percent (with more than 60 percent of the price decline due to the unfavorable impact of currency). Volume increases in North America and EMEAI were partially offset by decreases in Asia Pacific and Latin America. Consumer Care volume increased as higher demand in the personal care market sector and for cellulosics used in pharmaceutical applications more than offset lower demand in the home care market sector and for cellulosics used in industrial applications, which declined ahead of a plant closure in Institute, West Virginia. Dow Automotive Systems reported volume growth in both businesses and in all geographic areas, except Latin America, as customer demand for light-weighting technologies and lower oil prices drove automotive industry growth, most notably in North America and Europe. Dow Electronic Materials volume decreased slightly due to weakened demand for Interconnect Technologies and Display Technologies which more than offset healthy demand in Semiconductor Technologies resulting from strong silicon wafer growth in mobile device applications, notably in Asia Pacific, and Growth Technologies. Price declined in all businesses and all geographic areas. Price declined in Consumer Care and Dow Automotive Systems due to continued competitive pricing and the unfavorable impact of currency in EMEAI. Price declined in Dow Electronic Materials due to continued competitive pricing and the unfavorable impact of currency, primarily the Japanese yen.
EBITDA for 2015 was $1,048 million, down from $1,130 million in 2014. EBITDA for 2015 was negatively impacted by
$59 million of certain items, as previously discussed. EBITDA for 2014 was impacted by a $155 million gain related to Dow Corning's adjustment of its implant liability and a $73 million charge related to asset impairments in Dow Electronic Materials. See Notes 3, 9, 10 and 12 to the Consolidated Financial Statements for additional information on these items. Excluding these certain items, EBITDA increased in 2015 as lower feedstock, energy and other raw material costs, the favorable impact of currency on costs, lower operating expenses and higher sales volume more than offset lower selling prices and decreased equity earnings from Dow Corning.
Consumer Solutions Outlook for 2017
Consumer Solutions expects continued sales growth in 2017. The segment will benefit from a full year of sales from Consumer Solutions - Silicones, which expects sales growth in the automotive, beauty care and health care end markets. Sales are expected to increase in Consumer Care due to volume growth from share gains in home and personal care end markets and strong demand for cellulosics used in food and pharmaceutical applications while price is expected to be flat to slightly improved from 2016 levels. Dow Automotive Systems expects continued strong demand for light-weighting technologies and volume growth from the commercialization of new technologies, including VORAFORCETM and VORAFUSETM composite systems, while price is expected to follow raw material prices. Dow Electronic Materials expects sales growth from new product introductions and continued strong demand for Dow technologies used in smartphones, printed circuit boards and mobile phone displays while price is expected to remain flat to slightly lower than 2016.
43
INFRASTRUCTURE SOLUTIONS
The Infrastructure Solutions segment consists of the following businesses: Dow Building & Construction, Dow Coating Materials, Energy & Water Solutions, Performance Monomers and Infrastructure Solutions - Silicones. This segment also includes a portion of the Company's share of the results of Dow Corning, a joint venture of the Company, through May 31, 2016, and the results of the HSC Group.
As of June 1, 2016, Dow Corning, previously a 50:50 joint venture with Corning, became a wholly owned subsidiary of Dow as a result of the DCC Transaction. Dow and Corning continue to maintain their historical proportional equity interest in the HSC Group. Beginning in June 2016, the results of Dow Corning, excluding the HSC Group, are fully consolidated into the Company's consolidated statements of income and aligned with the Consumer Solutions and Infrastructure Solutions segments. The results of the HSC Group will continue to be reported as "Equity in earnings of nonconsolidated affiliates" in the Company's consolidated statements of income and aligned with the Consumer Solutions and Infrastructure Solutions segments. See Note 4 to the Consolidated Financial Statements for additional information on this transaction.
Infrastructure Solutions In millions | 2016 | 2015 | 2014 | |||||||||
Sales | $ | 8,621 | $ | 7,394 | $ | 8,429 | ||||||
Price change from comparative period | (6 | )% | (14 | )% | — | % | ||||||
Volume change from comparative period | 23 | % | 2 | % | 1 | % | ||||||
Volume change, excluding acquisitions | (3 | )% | 2 | % | 1 | % | ||||||
Equity earnings (losses) | $ | 215 | $ | 203 | $ | (6 | ) | |||||
EBITDA | $ | 2,318 | $ | 1,021 | $ | 817 | ||||||
Certain items impacting EBITDA | $ | 864 | $ | (101 | ) | $ | (348 | ) | ||||
EBITDA excluding certain items | $ | 1,454 | $ | 1,122 | $ | 1,165 | ||||||
2016 Versus 2015
Infrastructure Solutions sales were $8,621 million in 2016, up 17 percent from $7,394 million in 2015. Volume increased 23 percent and price decreased 6 percent. Volume increased in all geographic areas, primarily reflecting the impact of Infrastructure Solutions - Silicones, and in all businesses, except Energy & Water Solutions and Performance Monomers.
Excluding the impact of Infrastructure Solutions - Silicones, volume decreased 3 percent. Performance Monomers volume decreased primarily due to the business' ongoing strategy to reduce its merchant sales of acrylic monomers as well as increased internal consumption of acrylates. Volume decreased in Energy & Water Solutions across all geographic areas due to soft demand for reverse osmosis membranes used in industrial application and weakness in the energy sector throughout the year. Dow Coating Materials experienced volume growth in all geographic areas, except Latin America, with growth in architectural and industrial coatings due to a strong innovation pipeline and expansion into new end markets. Dow Building & Construction volume increased in all geographic areas, most notably in EMEAI, on strong growth in construction chemicals, primarily cellulosics- and acrylics-based products. Price declined in all businesses and all geographic areas in response to lower raw material prices and competitive pricing pressures.
EBITDA for 2016 was $2,318 million, up from $1,021 million in 2015. EBITDA for 2016 was impacted by a gain of $1,144 million on the DCC Transaction, a loss of $170 million related to the fair value step-up in inventories acquired in the DCC Transaction, $96 million of restructuring charges, and a loss of $14 million related to early redemption of debt incurred by Dow Corning. EBITDA for 2015 was impacted by $87 million of asset impairments and related costs in all businesses, $26 million of restructuring charges and a gain of $12 million related to Dow Corning's adjustment of its implant liability. See Notes 3, 4, 9 and 12 to the Consolidated Financial Statements for additional information on these certain items. Excluding these certain items, EBITDA increased $332 million compared with the prior year as earnings from Infrastructure Solutions - Silicones, lower propylene and other raw material costs and increased equity earnings more than offset the impact of lower selling prices.
2015 Versus 2014
Infrastructure Solutions sales were $7,394 million in 2015, down 12 percent from $8,429 million in 2014. Price decreased 14 percent, including the unfavorable impact of currency which represented one-third of the price decline, and volume increased 2 percent. Price declined in all businesses, most notably in Performance Monomers, and all geographic areas in response to lower raw material costs. Volume increased in all geographic areas, except North America, and all businesses, except Energy & Water Solutions. Dow Building & Construction reported volume growth in EMEAI and North America, as demand continued to be strong for innovative product offerings, primarily in construction chemicals. Dow Coating Materials volume increased due to higher demand for architectural coatings in EMEAI and higher demand for industrial coatings in North America. Volume increased in Performance Monomers due to higher demand and improved asset utilization for vinyl
44
acetate monomers and acrylic monomers. In Energy & Water Solutions, volume declines in North American energy exploration and fracturing market sectors and slow global demand for ion exchange resins used in industrial water applications more than offset strong demand for reverse osmosis technologies.
EBITDA for 2015 was $1,021 million, compared with $817 million in 2014. EBITDA for 2015 was negatively impacted by $101 million of certain items, as previously discussed. EBITDA for 2014 included a $500 million loss related to Dow Corning’s abandonment of a polycrystalline silicon plant expansion in Clarksville, Tennessee, and a $252 million gain related to Dow Corning’s adjustment of its implant liability. EBITDA for 2014 was also impacted by a $100 million charge for a warranty accrual adjustment related to an exited business. See Notes 9, 12 and 15 to Consolidated Financial Statements for additional information on these certain items. Excluding these certain items, EBITDA decreased in 2015 as lower selling prices and lower equity earnings from Dow Corning more than offset lower propylene and other raw material costs, the favorable impact of currency on costs, lower operating costs and higher sales volume.
Infrastructure Solutions Outlook for 2017
Infrastructure Solutions sales are expected to grow in 2017, primarily due to volume growth from a full year of sales from Infrastructure Solutions - Silicones. Dow Building & Construction sales are expected to increase primarily due to higher demand in North America across residential and non-residential construction end markets, driven by cellulosics- and acrylics-based products. Dow Coating Materials expects strong sales and volume growth driven by commercialization of new technologies in both architectural and industrial coatings with growth in economy paints and new market segments. Energy & Water Solutions expects demand to increase in both energy and water market sectors as oil prices stabilize. Growth is also expected for reverse osmosis membrane technology due to increased capacity and increasing demand in emerging economies and the energy and industrial sectors. Performance Monomers sales are expected to be higher due to price increases driven by higher raw material costs partially offset by a decline in sales volume due to increased internal consumption. Infrastructure Solutions - Silicones expects selling prices to increase across all geographic areas for commodity silicone products in response to higher raw material costs.
PERFORMANCE MATERIALS & CHEMICALS
The Performance Materials & Chemicals segment consists of the following businesses: Chlor-Alkali and Vinyl, Industrial Solutions and Polyurethanes. The segment also includes a portion of the results of EQUATE, TKOC, Map Ta Phut Olefins Company Limited and Sadara, all joint ventures of the Company.
On January 30, 2015, the Company sold its global Sodium Borohydride business to Vertellus Specialty Materials LLC. On February 2, 2015, the Company sold ANGUS Chemical Company to Golden Gate Capital. On October 5, 2015, the Company completed the split-off of its U.S. Gulf Coast Chlor-Alkali and Vinyl, Global Chlorinated Organics and Global Epoxy businesses to Olin Corporation in a tax-efficient Reverse Morris Trust transaction. These businesses were reported in the Performance Materials & Chemicals segment through the date of divestiture. See Notes 5 and 6 to the Consolidated Financial Statements for additional information.
On December 23, 2015, the Company sold its 50 percent ownership interest in MEGlobal to EQUATE. MEGlobal was aligned 100 percent with Performance Materials & Chemicals through the date of divestiture. Dow has retained a 42.5 percent ownership stake in MEGlobal through its ownership in EQUATE. The Performance Materials & Chemicals segment will continue to include a portion of the equity earnings from EQUATE, which will include the results of MEGlobal. See Notes 5 and 9 to the Consolidated Financial Statements for additional information.
Performance Materials & Chemicals In millions | 2016 | 2015 | 2014 | |||||||||
Sales | $ | 9,225 | $ | 11,973 | $ | 15,114 | ||||||
Price change from comparative period | (9 | )% | (15 | )% | — | % | ||||||
Volume change from comparative period | (14 | )% | (6 | )% | 2 | % | ||||||
Volume change, excluding divestitures | 2 | % | 1 | % | 2 | % | ||||||
Equity earnings (losses) | $ | (18 | ) | $ | 225 | $ | 322 | |||||
EBITDA | $ | 134 | $ | 5,479 | $ | 2,193 | ||||||
Certain items impacting EBITDA | $ | (1,230 | ) | $ | 3,409 | $ | — | |||||
EBITDA excluding certain items | $ | 1,364 | $ | 2,070 | $ | 2,193 | ||||||
45
2016 Versus 2015
Performance Materials & Chemicals sales were $9,225 million in 2016, down 23 percent from $11,973 million in 2015, with volume down 14 percent and price down 9 percent. Price decreased across all geographic areas and all businesses, primarily in response to lower raw material costs. Volume was impacted by recent divestitures, including ANGUS Chemical Company and the global Sodium Borohydride business and the split-off of the chlorine value chain. Excluding these divestitures, volume increased 2 percent. Volume increased in Polyurethanes due to strong demand for higher-margin system house applications used in energy, industrial and consumer markets, particularly in EMEAI and Asia Pacific, along with increased demand for specialty polyols in Asia Pacific due to an expanding customer base. These increases were partially offset by decreased volume in isocyanates and propylene oxide/propylene glycol in all geographic areas, primarily reflecting planned and unplanned maintenance turnaround activity as well as increased internal consumption of propylene oxide. Industrial Solutions volume was flat as strong demand in crop defense, electronics and textile market sectors was offset by reduced demand for deicer fluids as a result of warmer winter temperatures, weak demand for industrial lubricants and long market conditions for ethylene oxide/ethylene glycol. Chlor-Alkali and Vinyl reported increased volume in EMEAI due to favorable supply and demand fundamentals, which was partially offset by volume declines in North America and Latin America.
EBITDA for 2016 was $134 million, compared with $5,479 million in 2015. EBITDA for 2016 was impacted by a $1,235 million loss related to the settlement of the urethane matters class action lawsuit and opt-out cases litigation, a gain of $6 million related to post-closing adjustments on the split-off of the chlorine value chain and a $1 million charge related to environmental remediation activities. EBITDA for 2015 was impacted by a gain of $682 million on the divestiture of ANGUS Chemical Company, a gain of $20 million on the divestiture of the global Sodium Borohydride business, a gain of $1,984 million on the split-off of the chlorine value chain and a gain of $723 million on the sale of the Company's interest in MEGlobal. See Notes 5, 6, 9 and 15 to the Consolidated Financial Statements for additional information on these transactions. Excluding these certain items, EBITDA decreased due to the impact of lower sales volume, lower selling prices, the absence of earnings from divested businesses, lower equity earnings from the Kuwait joint ventures and higher equity losses from Sadara related to start-up expenses. These declines were partially offset by lower feedstock, energy and other raw material costs, lower SG&A and R&D spending and higher equity earnings from Map Ta Phut Olefins Company Limited.
2015 Versus 2014
Performance Materials & Chemicals sales were $11,973 million in 2015, down 21 percent from $15,114 million in 2014, with price down 15 percent, including the unfavorable impact of currency which represented more than one-third of the price decline, and volume down 6 percent. Price declined in all geographic areas and all businesses. Lower raw material costs and the unfavorable impact of currency drove price declines in Epoxy, Polyurethanes and Industrial Solutions. Chlor-Alkali and Vinyl reported lower prices as a result of the decline in ethylene prices and increased availability of caustic soda. Volume was impacted by recent divestitures, including the divestitures of ANGUS Chemical Company and the global Sodium Borohydride business and the split-off of the chlorine value chain. Excluding these divestitures, volume increased 1 percent. Volume increased in Polyurethanes driven by increased demand, lower raw material costs and growth in energy efficiency, consumer and industrial market sectors in North America and EMEAI, and in Asia Pacific due to the start up of a polyols plant in Thailand. Industrial Solutions reported volume declines across all geographic areas, except Asia Pacific, due to weakness in the agriculture and energy market sectors and a change in a long-term supply arrangement. Epoxy volume was up in all areas, except Asia Pacific, driven by increased demand for phenolics. Chlor-Alkali and Vinyl reported decreased volume in EMEAI and Latin America, partially offset by increases in Asia Pacific and North America, due to unfavorable supply and demand fundamentals and the expiration of a long-term supply agreement in EMEAI.
EBITDA for 2015 was $5,479 million, compared with $2,193 million in 2014. EBITDA for 2015 was favorably impacted by $3,409 million of certain items, as previously discussed. Excluding these certain items, EBITDA decreased due to the impact of lower sales volume, lower selling prices including the impact of currency, the absence of earnings from divested businesses, lower equity earnings from TKOC, EQUATE and MEGlobal and higher equity losses from Sadara. These declines were partially offset by lower feedstock, energy and other raw material costs, lower SG&A and R&D spending, the favorable impact of currency on costs and higher equity earnings from Map Ta Phut Olefins Company Limited.
Performance Materials & Chemicals Outlook for 2017
Performance Materials & Chemicals sales are expected to grow in 2017. Prices will primarily follow feedstock and energy prices, which are expected to increase in 2017, but will also be influenced by additional industry capacity, particularly in Polyurethanes and Industrial Solutions. Polyurethanes volume is expected to grow in excess of GDP, driven by strong demand for products used in energy efficiency applications as well as consumer-driven demand in emerging geographies. Polyurethanes volume will also be favorably impacted as Sadara capacity comes on-line in the second half of 2017. Industrial Solutions volume is expected to increase as a result of Sadara capacity coming on-line in 2017, with modest growth also expected for amines, surfactants and fluids used in specialty applications. The Chlor-Alkali and Vinyl business expects volume growth due to increased operating rates and higher demand for vinyl chloride monomer in construction end-markets.
46
In 2017, Sadara is expected to start up a number of manufacturing facilities, including units that will produce glycol ethers, ethanolamines, ethyleneamines, polyols and propylene glycol. Dow is responsible for marketing the majority of Sadara products outside of the Middle East zone through the Company's established sales channels. As part of this arrangement, the Company purchases and sells Sadara products for a marketing fee.
PERFORMANCE PLASTICS
The Performance Plastics segment is a market-oriented portfolio comprised of Dow Elastomers, Dow Electrical and Telecommunications, Dow Packaging and Specialty Plastics, Energy and Hydrocarbons. The segment also includes the results of TKSC, The SCG-Dow Group as well as a portion of the results of EQUATE, TKOC, Map Ta Phut Olefins Company Limited and Sadara, all joint ventures of the Company.
On May 5, 2015, Univation, previously a 50:50 joint venture between Dow and ExxonMobil, became a wholly owned subsidiary of Dow. Prior to this transaction, the Company's share of Univation's results of operations was reported as "Equity in earnings of nonconsolidated affiliates" in the consolidated statements of income. Beginning in May 2015, Univation's results of operations are fully consolidated in the Company's consolidated statements of income. See Note 4 to the Consolidated Financial Statements for additional information on this step acquisition.
Sales for the Energy business are primarily opportunistic merchant sales driven by market conditions and sales to customers located on Dow manufacturing sites. Sales for the Hydrocarbons business are comprised primarily of monomers and ethylene by-products that are not required for internal use. Hydrocarbons sales can fluctuate significantly based on ethylene production facility feedslates and operating rates, derivative demand and market prices for monomers and by-products.
Performance Plastics In millions | 2016 | 2015 | 2014 | |||||||||
Sales | $ | 18,404 | $ | 18,357 | $ | 22,386 | ||||||
Price change from comparative period | (8 | )% | (23 | )% | 2 | % | ||||||
Volume change from comparative period | 8 | % | 5 | % | — | % | ||||||
Volume change, excluding acquisitions and divestitures | 9 | % | 5 | % | 1 | % | ||||||
Equity earnings | $ | 137 | $ | 220 | $ | 257 | ||||||
EBITDA | $ | 4,503 | $ | 5,399 | $ | 4,422 | ||||||
Certain items impacting EBITDA | $ | (129 | ) | $ | 597 | $ | — | |||||
EBITDA excluding certain items | $ | 4,632 | $ | 4,802 | $ | 4,422 | ||||||
2016 Versus 2015
Performance Plastics sales for 2016 were $18,404 million, essentially flat from $18,357 million in 2015, with volume up 8 percent and price down 8 percent. Price decreased across all geographic areas and all businesses in response to lower feedstock, energy and other raw material prices and competitive pricing pressures. Double-digit price declines were reported in Hydrocarbons as a result of lower Brent crude oil prices, which declined approximately 16 percent compared with 2015. Volume increased across all geographic areas and all businesses. Excluding acquisitions and divestitures, volume increased 9 percent. Volume increased in the Hydrocarbons and Energy businesses due to third party supply agreements. Dow Packaging and Specialty Plastics volume increased due to demand growth in all market segments, most notably in industrial and consumer packaging and health and hygiene, and in Asia Pacific due to new production from Sadara. Dow Elastomers volume improved across all geographic areas, except Latin America, primarily due to higher demand in the transportation, consumer goods and footwear market sectors. Dow Electrical and Telecommunications volume increased across all geographic areas due to continued demand for power cable installations and fiber optics.
The Company uses derivatives of crude oil and natural gas as feedstock in its ethylene facilities. In addition, the Company purchases electric power, ethylene and propylene to supplement internal production, as well as other raw materials. The Company's cost of purchased feedstock and energy decreased $1,449 million in 2016, a 12 percent decrease from 2015, primarily due to decreased naptha and condensate costs in Europe and decreased purchased monomers costs across all geographic areas.
EBITDA for 2016 was $4,503 million, down from $5,399 million in 2015. EBITDA for 2016 was impacted by $10 million of restructuring charges, a $2 million environmental charge and a $117 million charge related to the termination of a terminal use agreement. EBITDA for 2015 was impacted by a gain of $349 million related to the step acquisition of Univation, a $317 million gain related to the split-off of the chlorine value chain, and $57 million of asset impairments and related costs and $12 million of restructuring charges, consisting of asset write-downs and write-offs. See Notes 3, 4, 6, 12 and 15 to the
47
Consolidated Financial Statements for additional information on these items. Excluding these certain items, EBITDA decreased compared with 2015 as the impact of higher sales volume, lower feedstock, energy and other raw material costs and higher equity earnings from The SCG-Dow Group were more than offset by lower selling prices, lower equity earnings from EQUATE and increased equity losses from Sadara related to start-up expenses.
2015 Versus 2014
Performance Plastics sales for 2015 were $18,357 million, down 18 percent from $22,386 million in 2014, with price down 23 percent and volume up 5 percent. Price decreased across all geographic areas and all businesses in response to significantly lower raw material costs coupled with the unfavorable impact of currency, which represented approximately 20 percent of the price decline. Double-digit price declines were reported in Hydrocarbons as prices for monomers and ethylene by-products are generally correlated to Brent crude oil prices, which declined approximately 45 percent compared with 2014. Volume increased across all geographic areas and all businesses, except Energy. Volume in Hydrocarbons increased due to new supply agreements with Olin as a result of the split-off of the chlorine value chain. Dow Packaging and Specialty Plastics volume improved across all geographic areas due to improved operating rates and increased demand in the food and specialty packaging, industrial and consumer packaging, and hygiene and medical market sectors. Dow Elastomers volume improved across all geographic areas due to improved raw material supply and higher demand in the transportation, infrastructure and consumer goods market sectors. Volume in Dow Electrical and Telecommunications was flat compared with 2014 as growth in North America was offset by volume declines in EMEAI and Latin America. Volume declined in the Energy business due to reduced sales in North America which more than offset increased volume from new supply agreements with Olin as a result of the split-off of the chlorine value chain.
The Company's cost of purchased feedstock and energy decreased $8,542 million in 2015, a 42 percent decrease from 2014, primarily due to decreased naphtha, condensate, propane, natural gas and purchased monomers costs in Europe and North America.
EBITDA for 2015 was $5,399 million, up from $4,422 million in 2014. EBITDA for 2015 was favorably impacted by $597 million of certain items, as previously discussed. Excluding these certain items, EBITDA improved compared with 2014 as the impact of lower feedstock and energy costs, higher sales volume and increased equity earnings from The SCG-Dow Group more than offset the impact of lower selling prices, higher maintenance turnaround spending and lower equity earnings from EQUATE, TKSC and Univation and increased equity losses from Sadara.
Performance Plastics Outlook for 2017
In 2017, the Company expects crude oil and natural gas prices, on average, to be higher than 2016. As a result, feedstock and energy costs are expected to be higher than 2016 levels. Global ethylene margins are expected to increase with continued strong demand and delays in new North American industry ethylene production capacity. Ethylene margins could vary materially from these expectations depending on changes in input costs, global GDP growth and global operating rates. Volume in the Hydrocarbons and Energy businesses is expected to decrease as higher crude oil and naphtha prices are expected to cause a shift to lighter cracker feedslates and lower production of ethylene by-products. Volume is expected to increase in Dow Packaging and Specialty Plastics due to continued strong demand fundamentals, increased production from the Sadara polyethylene facilities and the expected start-up of certain U.S. Gulf Coast projects. Dow Elastomers is expected to experience volume growth in most market segments, primarily in transportation, infrastructure and footwear, despite new global industry capacity coming on-line. Dow Electrical and Telecommunications volume is expected to grow at or slightly above GDP in all geographic areas, driven by demand growth in power transmission and increased use of fiber optic applications used in telecommunications, partially offset by the impact of new industry capacity. Price across all businesses is expected to be influenced by changes in feedstock costs and competitive pricing pressures.
Sadara is expected to increase production in 2017 with the start-up of a fourth polyethylene train (three were in operation during 2016) plus the start-up of additional facilities producing other high-value added ethylene, propylene and aromatics derivatives. Dow is responsible for marketing the majority of Sadara products outside of the Middle East zone through the Company's established sales channels. As part of this arrangement, the Company purchases and sells Sadara products for a marketing fee.
On February 2, 2017, the Company announced it reached an agreement to sell its global ethylene acrylic acid ("EAA") copolymers and ionomers business to SK Global Chemical Co., Ltd. as part of the ongoing regulatory approval process for the proposed merger with DuPont. The divestiture will be conditioned on Dow and DuPont closing the merger transaction, in addition to other closing conditions, including regulatory filings, local employment law and governance obligations. The EAA business is part of the Dow Packaging and Specialty Plastics global business and marketed under the PRIMACOR™ brand. The divestiture agreement includes production assets in Freeport, Texas, and Tarragona, Spain, along with associated intellectual property and trademarks.
48
Current and Future Investments
The Company has a number of investments in the U.S. Gulf Coast to take advantage of increasing supplies of low-cost natural gas and natural gas liquids derived from shale gas including: construction of a new on-purpose propylene production facility, which commenced operations in December 2015; completion of a major maintenance turnaround in December 2016 at an ethylene production facility in Plaquemine, Louisiana, which included expanding the facility's ethylene production capacity by up to 250 KTA and modifications to enable full ethane cracking flexibility; and construction of a new world-scale ethylene production facility in Freeport, Texas, which is expected to start up in mid-2017. As a result of these investments, the Company's exposure to purchased ethylene and propylene is expected to decline, offset by increased exposure to ethane and propane feedstocks. Dow’s ethylene production capabilities are expected to increase by as much as 20 percent.
In 2016, the Company completed an expansion of a gas-phase polyethylene production facility in Seadrift, Texas. Expansion projects are also currently underway at two of the Company's gas-phase polyethylene units in St. Charles, Louisiana, with expected start-up in mid-2018. The Company is also building four new production facilities on the U.S. Gulf Coast to leverage an advantaged feedstock position to support profitable growth of the Company's high value Performance Plastics franchise which include an ELITE™ Polymer production facility, a Low Density Polyethylene (LDPE) production facility and a NORDEL™ Metallocene EPDM production facility, which are all expected to start up in 2017, and a High Melt Index (HMI) AFFINITY™ Polymer production facility, which is expected to start up in the second half of 2018.
CORPORATE
Corporate includes certain enterprise and governance activities (including insurance operations, geographic management, risk management such as foreign currency hedging activities, audit fees, donations, etc.); the results of Ventures (including business incubation platforms and non-business aligned joint ventures); environmental operations; gains and losses on the sales of financial assets; severance costs; non-business aligned litigation expenses (including asbestos-related defense and processing costs and reserve adjustments); and foreign exchange results.
Corporate In millions | 2016 | 2015 | 2014 | |||||||||
Sales | $ | 279 | $ | 294 | $ | 309 | ||||||
Equity losses | $ | (27 | ) | $ | (50 | ) | $ | (23 | ) | |||
EBITDA | $ | (2,563 | ) | $ | (1,053 | ) | $ | (580 | ) | |||
Certain items impacting EBITDA | $ | (2,261 | ) | $ | (689 | ) | $ | (127 | ) | |||
EBITDA excluding certain items | $ | (302 | ) | $ | (364 | ) | $ | (453 | ) | |||
2016 Versus 2015
Sales for Corporate, which primarily relate to insurance operations, were $279 million in 2016, down from $294 million in 2015.
EBITDA for 2016 was a loss of $2,563 million, compared with a loss of $1,053 million in 2015. EBITDA for 2016 was impacted by a $1,009 million charge due to a change in accounting policy for asbestos-related defense and processing costs, and a $104 million charge to increase the asbestos-related liability for pending and future claims, which both reflect estimates through the terminal year of 2049. EBITDA was also impacted by $544 million of costs associated with transactions and productivity actions, $314 million of restructuring charges and $290 million of charges for environmental matters. EBITDA for 2015 was impacted by $294 million of restructuring charges, $194 million of costs associated with transactions and productivity actions, a $98 million loss related to the impact of the Argentine peso devaluation, a $68 million loss on the early extinguishment of debt related to the split-off of the Company's chlorine value chain, a loss recognized by Sadara related to the write-off of design engineering work for an Epoxy plant of which Dow's share was $27 million, and an $8 million loss related to the early extinguishment of debt. Excluding these certain items, EBITDA improved in 2016 as increased gains related to Ventures, lower asbestos-related defense costs resulting from the change in accounting policy and lower performance-based compensation costs more than offset higher foreign exchange losses. See Notes 1, 3, 6, 13, 15 and 17 to the Consolidated Financial Statements for additional information on these matters.
In the fourth quarter of 2016, the Company elected to change its method of accounting for Union Carbide's asbestos-related defense and processing costs from expensing as incurred to estimating and accruing a liability. The Company’s total asbestos-related liability, including defense and processing costs, was $1,490 million at December 31, 2016. Future defense and resolution costs will be applied against this liability.
49
2015 Versus 2014
Sales for Corporate were $294 million in 2015, down slightly from $309 million in 2014.
EBITDA for 2015 was a loss of $1,053 million, compared with a loss of $580 million in 2014. EBITDA for 2015 was negatively impacted by $689 million of certain items, as previously discussed. EBITDA for 2014 was impacted by $49 million of costs associated with transactions and productivity actions and a $78 million charge related to an increase in the asbestos-related liability. Excluding these certain items, EBITDA improved in 2015 as gains related to Ventures and asset sales more than offset an increase in performance-based compensation costs. See Note 15 to the Consolidated Financial Statements for additional information.
LIQUIDITY AND CAPITAL RESOURCES
The Company had cash and cash equivalents of $6,607 million at December 31, 2016 and $8,577 million at December 31, 2015, of which $4,890 million at December 31, 2016 and $6,494 million at December 31, 2015 was held by subsidiaries in foreign countries, including United States territories. For each of its foreign subsidiaries, the Company makes an assertion regarding the amount of earnings intended for permanent reinvestment, with the balance available to be repatriated to the United States. The cash held by foreign subsidiaries for permanent reinvestment is generally used to finance the subsidiaries' operational activities and future foreign investments. A deferred tax liability has been accrued for the funds that are available to be repatriated to the United States. At December 31, 2016, management believed that sufficient liquidity was available in the United States. However, in the unusual event that additional foreign funds are needed in the United States, the Company has the ability to repatriate additional funds. The repatriation could result in an adjustment to the tax liability after considering available foreign tax credits and other tax attributes. It is not practicable to calculate the unrecognized deferred tax liability on undistributed foreign earnings.
The Company’s cash flows from operating, investing and financing activities, as reflected in the consolidated statements of cash flows, are summarized in the following table:
Cash Flow Summary In millions | 2016 | 2015 | 2014 | |||||||||
Cash provided by (used in): | ||||||||||||
Operating activities | $ | 5,478 | $ | 7,516 | $ | 6,502 | ||||||
Investing activities | (3,479 | ) | (1,350 | ) | (3,105 | ) | ||||||
Financing activities | (3,892 | ) | (3,041 | ) | (3,583 | ) | ||||||
Effect of exchange rate changes on cash | (77 | ) | (202 | ) | (100 | ) | ||||||
Summary | ||||||||||||
Increase (decrease) in cash and cash equivalents | $ | (1,970 | ) | $ | 2,923 | $ | (286 | ) | ||||
Cash and cash equivalents at beginning of year | 8,577 | 5,654 | 5,940 | |||||||||
Cash and cash equivalents at end of year | $ | 6,607 | $ | 8,577 | $ | 5,654 | ||||||
Cash Flows from Operating Activities
Cash provided by operating activities decreased in 2016 compared with 2015, primarily due to cash payments related to the settlement of the urethane matters class action lawsuit and opt-out cases, increased costs associated with transactions and productivity actions, a cash payment related to the settlement of an uncertain tax position and a one-time payment related to the termination of a terminal use agreement. Cash provided by operating activities increased in 2015 compared with 2014, primarily due to improvements in working capital and increased earnings.
50
Net Working Capital at December 31 In millions | 2016 | 2015 | ||||||
Current assets (1) | $ | 23,659 | $ | 23,941 | ||||
Current liabilities (1) | 12,604 | 11,115 | ||||||
Net working capital | $ | 11,055 | $ | 12,826 | ||||
Current ratio | 1.88 | :1 | 2.15 | :1 | ||||
Days-sales-outstanding-in-receivables | 47 | 47 | ||||||
Days-sales-in-inventory | 67 | 72 | ||||||
(1) | Presented in accordance with newly implemented ASU 2015-17. See Notes 1 and 2 to the Consolidated Financial Statements for further information. |
Net working capital decreased from December 31, 2015 to December 31, 2016, principally due to a decrease in "Cash and cash equivalents," primarily related to the settlement of the urethane matters class action lawsuit and opt-out cases litigation, and an increase in "Accounts payable" which were partially offset by increases in "Accounts and notes receivable" and "Inventories," reflecting the addition of Dow Corning's silicones business. At December 31, 2016, trade receivables were $4.7 billion, up from $4.1 billion at December 31, 2015. Days-sales-outstanding-in-receivables (excluding the impact of sales of receivables) was 47 days at December 31, 2016, flat compared with December 31, 2015. At December 31, 2016, total inventories were $7.4 billion, up from $6.9 billion at December 31, 2015. Days-sales-in-inventory at December 31, 2016, was 67 days compared with 72 days at December 31, 2015, primarily driven by higher sales volume and flat operating rates, as well as strong inventory management across all operating segments.
Cash Flows from Investing Activities
Cash used in investing activities in 2016 was primarily for capital expenditures as well as investments in and loans to nonconsolidated affiliates, primarily with Sadara, which were partially offset by net cash acquired in the DCC Transaction. Cash used in investing activities in 2015 was primarily for capital expenditures; purchases of investments, including the repayment of outstanding loans issued under company-owned life insurance policies; and investments in and loans made to nonconsolidated affiliates, primarily with Sadara. This was partially offset by proceeds received from divestitures, including the divestitures of ANGUS Chemical Company and the AgroFresh business, proceeds from the sale of the Company's interest in MEGlobal and proceeds from sales and maturities of investments. Cash used in investing activities in 2014 was primarily for capital expenditures which was partially offset by proceeds received on the sale-leaseback of assets, including a significant portion of the Company's North American railcar fleet.
In the first quarter of 2015, a $193 million note receivable from Sadara was converted to equity. In 2015, the Company loaned an additional $753 million to Sadara, of which $280 million was converted to equity. The Company loaned an additional $1,015 million to Sadara in 2016, and $1,230 million was converted to equity. At December 31, 2016, the Company had a $258 million note receivable with Sadara, of which $193 million is expected to be converted to equity in the first quarter of 2017. The Company expects to loan approximately $700 million to Sadara during 2017. All or a portion of the outstanding loans to Sadara could potentially be converted into equity in future periods. See Note 9 to the Consolidated Financial Statements for additional information.
The following table summarizes the Company's capital expenditures, which includes capital expenditures of consolidated variable interest entities, along with the approximate percentage of spending by project type. The Company expects capital spending in 2017 to be $3.2 billion to $3.4 billion.
Capital Expenditures Summary | ||||||||||||
In millions | 2016 | 2015 | 2014 | |||||||||
Capital expenditures | $ | 3,804 | $ | 3,703 | $ | 3,572 | ||||||
Spending by project type: | ||||||||||||
Projects related to additional capacity for new and existing products | 67 | % | 68 | % | 68 | % | ||||||
Projects related to environmental protection, safety, loss prevention and industrial hygiene | 9 | % | 9 | % | 10 | % | ||||||
Other (primarily shared infrastructure and plant maintenance/health) | 24 | % | 23 | % | 22 | % | ||||||
Capital spending in 2016, 2015 and 2014 included spending related to certain U.S. Gulf Coast investment projects including: an on-purpose propylene production facility, which commenced operations in December 2015; a world-scale ethylene production facility; an ELITE™ Polymer production facility; a NORDEL™ Metallocene EPDM production facility; and a Low Density
51
Polyethylene (LDPE) production facility, all aligned with the Company's Performance Plastics segment. See Note 26 to the Consolidated Financial Statements for capital expenditures by operating segment.
Cash Flows from Financing Activities
Cash used in financing activities in 2016 included dividends paid to stockholders (including the accelerated payment of the fourth quarter preferred dividend), $916 million in purchases of treasury stock, and payments on long-term debt. Cash used in financing activities in 2015 included dividends paid to stockholders, $1.2 billion in purchases of treasury stock, and payments on long-term debt, including the early redemption of $724 million of InterNotes which was partially offset by proceeds from the issuance of long-term debt, including $875 million related to the split-off of the chlorine value chain. Cash used in financing activities in 2014 included purchases of treasury stock, which totaled $4.2 billion and resulted in the completion of the Company's initial $4.5 billion share repurchase program, and increased dividends paid to stockholders which was partially offset by proceeds received from the issuance of new debt, including $2 billion issued in the third quarter of 2014. See Notes 17 and 22 to the Consolidated Financial Statements for additional information related to the issuance or retirement of debt and the Company's share repurchase program and Note 6 for information on the split-off of the chlorine value chain.
Free Cash Flow
The Company's management believes that free cash flow, a non-GAAP financial measure, provides relevant and meaningful information to investors about the Company's ability to generate cash after investing in its asset base. Free cash flow represents the cash that remains available to fund obligations using the Company's primary source of incremental liquidity - cash provided by operating activities. This financial measure is not recognized in accordance with U.S. GAAP and should not be viewed as an alternative to U.S. GAAP financial measures of performance.
Reconciliation of Free Cash Flow to "Cash Provided by Operating Activities" | |||||||||||
In millions | 2016 | 2015 | 2014 | ||||||||
Cash provided by operating activities | $ | 5,478 | $ | 7,516 | $ | 6,502 | |||||
Capital expenditures | (3,804 | ) | (3,703 | ) | (3,572 | ) | |||||
Free Cash Flow | $ | 1,674 | $ | 3,813 | $ | 2,930 | |||||
Liquidity & Financial Flexibility
The Company’s primary source of incremental liquidity is cash provided by operating activities. The generation of cash from operations and the Company's ability to access debt markets is expected to meet the Company’s cash requirements for working capital, capital expenditures, debt maturities, dividend payments, share repurchases, contributions to pension plans and other needs. In addition to cash provided by operating activities, the Company’s current liquidity sources also include U.S. and Euromarket commercial paper, committed credit facilities, accounts receivable securitization facilities and other debt markets. Additional details on these sources of liquidity are as follows:
Commercial Paper
Dow issues promissory notes under its U.S. and Euromarket commercial paper programs. At December 31, 2016, the Company had no commercial paper outstanding. The Company maintains access to the commercial paper market at competitive rates.
Shelf Registration - U.S.
On October 28, 2016, the Company renewed a shelf registration with the U.S. Securities and Exchange Commission ("SEC") for an unspecified amount of debt securities and warrants to purchase debt securities, with pricing and availability dependent on market conditions. A prospectus supplement that registered an unlimited amount of securities for issuance under the Company’s InterNotes program expired on February 19, 2016. Due to the pending transaction with DuPont in which the Company and DuPont will combine in an all-stock merger of equals strategic combination, the Company did not file a new prospectus supplement for the InterNotes program. However, the Company remains prepared to file a new prospectus supplement for the InterNotes program with the SEC.
Shelf Registration - Japan
The Company's shelf registration with the Kanto Local Finance Bureau of the Ministry of Finance of Japan expired on December 12, 2016.
52
Committed Credit Facilities
In the event Dow has short-term liquidity needs and is unable to issue commercial paper for any reason, Dow has the ability to access liquidity through its committed and available credit facilities, as summarized below:
Committed and Available Credit Facilities at December 31, 2016 | ||||||||||||||
In millions | Effective Date | Committed Credit | Credit Available | Maturity Date | Interest | |||||||||
Five Year Competitive Advance and Revolving Credit Facility | March 2015 | $ | 5,000 | $ | 5,000 | March 2020 | Floating rate | |||||||
Bilateral Revolving Credit Facility | August 2015 | 100 | 100 | March 2017 | Floating rate | |||||||||
Bilateral Revolving Credit Facility | August 2015 | 100 | 100 | March 2020 | Floating rate | |||||||||
Bilateral Revolving Credit Facility | August 2015 | 280 | 280 | March 2020 | Floating rate | |||||||||
Bilateral Revolving Credit Facility | August 2015 | 100 | 100 | March 2020 | Floating rate | |||||||||
Bilateral Revolving Credit Facility | August 2015 | 100 | 100 | March 2020 | Floating rate | |||||||||
Bilateral Revolving Credit Facility | August 2015 | 200 | 200 | March 2020 | Floating rate | |||||||||
Bilateral Revolving Credit Facility | May 2016 | 200 | 200 | May 2018 | Floating rate | |||||||||
Bilateral Revolving Credit Facility | July 2016 | 200 | 200 | July 2018 | Floating rate | |||||||||
Bilateral Revolving Credit Facility | August 2016 | 100 | 100 | August 2018 | Floating rate | |||||||||
DCC Term Loan Facility (1) | February 2016 | 4,500 | — | May 2018 | Floating rate | |||||||||
Total Committed and Available Credit Facilities | $ | 10,880 | $ | 6,380 | ||||||||||
(1) | Drawn on May 31, 2016, by Dow Corning, a wholly owned subsidiary of the Company as of June 1, 2016. |
In connection with the DCC Transaction, on May 31, 2016, Dow Corning incurred $4.5 billion of indebtedness under a certain third party credit agreement ("DCC Term Loan Facility") in order to fund the contribution of cash to Splitco. Subsequent to the DCC Transaction, the Company guaranteed the obligations of Dow Corning under the DCC Term Loan Facility and, as a result, the covenants and events of default applicable to the DCC Term Loan Facility are substantially similar to the covenants and events of default set forth in the Company's Five Year Competitive Advance and Revolving Credit Facility. Amounts borrowed under the DCC Term Loan Facility are repayable on May 30, 2017, subject to a 364-day extension option, at Dow Corning's election, upon the satisfaction of certain customary conditions precedent. Dow Corning intends to exercise the 364-day extension option on the DCC Term Loan Facility. See Note 4 for additional information on the DCC Transaction.
Accounts Receivable Securitization Facilities
The Company has access to committed accounts receivable securitization facilities in the United States, Europe and Japan, from which amounts available for funding are based upon available and eligible accounts receivable within each of the facilities. The Japan facilities are renewed annually. The Europe facility was renewed in July 2015 for a term that extends to July 2018. The Company renewed the United States facility in June 2015 for a term that extends to June 2018. See Note 16 to the Consolidated Financial Statements for further information.
Debt
As Dow continues to maintain its strong balance sheet and financial flexibility, management is focused on net debt (a non-GAAP financial measure), as Dow believes this is the best representation of the Company’s financial leverage at this point in time. As shown in the following table, net debt is equal to total gross debt minus "Cash and cash equivalents." At December 31, 2016, net debt as a percent of total capitalization increased to 35.1 percent. This increase was primarily due to debt assumed in the DCC Transaction and a nearly $2 billion decrease in cash and cash equivalents. See Note 4 to the Consolidated Financial Statements for further information on the DCC Transaction.
Total Debt at December 31 In millions | 2016 | 2015 | ||||||
Notes payable | $ | 272 | $ | 454 | ||||
Long-term debt due within one year (1) | 635 | 541 | ||||||
Long-term debt (1) | 20,456 | 16,215 | ||||||
Gross debt | $ | 21,363 | $ | 17,210 | ||||
Cash and cash equivalents | $ | 6,607 | $ | 8,577 | ||||
Net debt | $ | 14,756 | $ | 8,633 | ||||
Gross debt as a percent of total capitalization | 44.0 | % | 39.7 | % | ||||
Net debt as a percent of total capitalization | 35.1 | % | 24.8 | % | ||||
(1) | Presented net of unamortized debt issuance costs. See Note 17 to the Consolidated Financial Statements for additional information. |
53
See Note 17 to the Consolidated Financial Statements for information related to the Company’s notes payable and long-term debt activity.
Dow’s public debt instruments and primary, private credit agreements contain, among other provisions, certain customary restrictive covenant and default provisions. The Company’s most significant debt covenant with regard to its financial position is the obligation to maintain the ratio of the Company’s consolidated indebtedness to consolidated capitalization at no greater than 0.65 to 1.00 at any time the aggregate outstanding amount of loans under the Five Year Competitive Advance and Revolving Credit Facility Agreement equals or exceeds $500 million. The ratio of the Company’s consolidated indebtedness to consolidated capitalization as defined in the Revolving Credit Facility was 0.42 to 1.00 at December 31, 2016. Management believes the Company was in compliance with all of its covenants and default provisions at December 31, 2016. For information on Dow’s covenants and default provisions, see Note 17 to the Consolidated Financial Statements.
Management expects that the Company will continue to have sufficient liquidity and financial flexibility to meet all of its business obligations.
Credit Ratings
As of February 9, 2017, the Company's credit ratings were as follows:
Credit Ratings | Long-Term | Short-Term | |
Rating Agency | Rating | Rating | Outlook |
Standard & Poor’s | BBB | A-2 | Watch Developing |
Moody’s Investors Service | Baa2 | P-2 | Stable |
Fitch Ratings | BBB | F2 | Watch Positive |
Downgrades in the Company’s credit ratings would increase borrowing costs on certain indentures and could have a negative
impact on the Company’s ability to access credit markets.
Dividends
For the years ended December 31, 2016, 2015, and 2014, the Company paid dividends to common and preferred shareholders as noted below:
Dividends Paid at December 31 In millions, except per share amounts | 2016 | 2015 | 2014 | ||||||||
Dividends paid, per common share | $ | 1.84 | $ | 1.68 | $ | 1.43 | |||||
Dividends paid to common shareholders | $ | 2,037 | $ | 1,913 | $ | 1,680 | |||||
Dividends paid to preferred shareholders (1) | $ | 425 | $ | 340 | $ | 340 | |||||
(1) | Dividends paid to preferred shareholders in 2016 includes payment of the fourth quarter 2016 declared dividend. |
On December 15, 2016, the Board of Directors declared a quarterly dividend of $0.46 per share, payable January 30, 2017, to stockholders of record on December 28, 2016. On February 9, 2017, the Board of Directors announced the declaration of a quarterly dividend of $0.46 per share, payable April 28, 2017, to stockholders of record on March 31, 2017. Since 1912, the Company has maintained or increased the amount of the quarterly dividend, adjusted for stock splits, with the exception of February 12, 2009. During this 105-year period, Dow has increased the amount of the quarterly dividend 52 times (approximately 13 percent of the time), reduced the dividend once and maintained the amount of the quarterly dividend approximately 87 percent of the time.
On December 15, 2016, the Board of Directors declared a quarterly dividend of $85 million to the Preferred Stock shareholders of record on December 15, 2016, which was paid on December 30, 2016. On December 15, 2016, the trading price of Dow's common stock closed at $58.35, marking the 20th trading day in the previous 30 trading days that the common stock closed above $53.72, triggering the right of the Company to exercise its conversion right. On December 30, 2016, the Company converted 4 million outstanding Preferred Stock shares into 96.8 million shares of the Company's common stock. After the conversion, no shares of Preferred Stock are issued or outstanding and all rights of the holders of the Preferred Stock have terminated. See Note 22 to the Consolidated Financial Statements for additional information.
54
Share Repurchase Program
On February 13, 2013, the Board of Directors approved a share buy-back program, authorizing up to $1.5 billion to be spent on the repurchase of the Company's common stock. On January 29, 2014, the Board of Directors announced an expansion of the Company's share buy-back authorization, authorizing an additional amount not to exceed $3 billion to be spent on the repurchase of the Company's common stock over a period of time. On November 12, 2014, the Board of Directors announced a new $5 billion tranche to its share buy-back program. As a result of these actions, the total authorized amount of the share repurchase program is $9.5 billion. As of December 31, 2016, the Company has spent $8.1 billion on repurchases of common stock under the share buy-back program. The Company intends to repurchase shares in 2017.
On October 5, 2015, (i) the Company completed the transfer of its U.S. Gulf Coast Chlor-Alkali and Vinyl, Global Chlorinated Organics and Global Epoxy businesses ("chlorine value chain") into a new company ("Splitco"), (ii) participating Dow shareholders tendered, and the Company accepted, Dow shares for Splitco shares in a public exchange offer, and (iii) Splitco merged with a wholly owned subsidiary of Olin Corporation in a tax-efficient Reverse Morris Trust transaction (collectively, the "Transaction"). Dow shareholders who participated in the public exchange offer tendered 34.1 million shares of Dow common stock in exchange for 100 million shares of Splitco. As a result of this non-cash share exchange offer, the Company included the 34.1 million tendered shares as part of the share repurchase program and recorded an increase of $1,523 million in “Treasury stock at cost” in the consolidated balance sheets, which was valued based on Dow’s opening stock price on October 5, 2015. See Note 6 to the Consolidated Financial Statements for additional information on this Transaction.
For additional information related to the share repurchase program, see Part II. Item 5. Market for Registrant's Common Equity, Related Stockholder Matters and Issuer Purchases of Equity Securities and Note 22 to the Consolidated Financial Statements.
Pension Plans
The Company has defined benefit pension plans in the United States and a number of other countries. The Company’s funding policy is to contribute to plans when pension laws and/or economics either require or encourage funding. During 2016, 2015 and 2014, the Company contributed $629 million, $844 million and $815 million to its pension plans, including contributions to fund benefit payments for its non-qualified supplemental plans. Dow expects to contribute approximately $500 million to its pension plans in 2017. See Note 18 to the Consolidated Financial Statements for additional information concerning the Company’s pension plans.
Restructuring
The activities related to the 2015 and 2016 restructuring programs are expected to result in additional cash expenditures of $281 million, primarily through June 30, 2018, related to severance costs and costs associated with exit and disposal activities, including environmental remediation (see Note 3 to the Consolidated Financial Statements). The Company expects to incur additional costs in the future related to its restructuring activities, as the Company continually looks for ways to enhance the efficiency and cost effectiveness of its operations, and to ensure competitiveness across its businesses and geographic areas. Future costs are expected to include demolition costs related to closed facilities and restructuring plan implementation costs; these costs will be recognized as incurred. The Company also expects to incur additional employee-related costs, including involuntary termination benefits, related to its other optimization activities. These costs cannot be reasonably estimated at this time.
55
Contractual Obligations
The following table summarizes the Company’s contractual obligations, commercial commitments and expected cash requirements for interest at December 31, 2016. Additional information related to these obligations can be found in Notes 15, 17, 18, 19 and 23 to the Consolidated Financial Statements.
Contractual Obligations at December 31, 2016 | Payments Due by Year | ||||||||||||||||||||||||||
In millions | 2017 | 2018 | 2019 | 2020 | 2021 | 2022 and beyond | Total | ||||||||||||||||||||
Long-term debt – current and noncurrent (1) | $ | 659 | $ | 5,237 | $ | 2,391 | $ | 1,825 | $ | 1,567 | $ | 9,785 | $ | 21,464 | |||||||||||||
Deferred income tax liabilities (2) | — | — | — | — | — | 923 | 923 | ||||||||||||||||||||
Pension and other postretirement benefits | 658 | 450 | 450 | 883 | 933 | 7,825 | 11,199 | ||||||||||||||||||||
Other noncurrent obligations (3) | — | 756 | 691 | 548 | 372 | 4,326 | 6,693 | ||||||||||||||||||||
Uncertain tax positions, including interest and penalties (4) | 26 | — | — | — | — | 231 | 257 | ||||||||||||||||||||
Other contractual obligations: | |||||||||||||||||||||||||||
Minimum lease commitments | 351 | 300 | 272 | 246 | 221 | 1,064 | 2,454 | ||||||||||||||||||||
Purchase commitments – take-or-pay and throughput obligations | 2,600 | 2,498 | 2,172 | 2,083 | 1,725 | 7,304 | 18,382 | ||||||||||||||||||||
Purchase commitments – other (5) | 203 | 145 | 148 | 85 | 63 | 88 | 732 | ||||||||||||||||||||
Expected cash requirements for interest (6) | 997 | 921 | 789 | 690 | 609 | 6,710 | 10,716 | ||||||||||||||||||||
Total | $ | 5,494 | $ | 10,307 | $ | 6,913 | $ | 6,360 | $ | 5,490 | $ | 38,256 | $ | 72,820 | |||||||||||||
(1) | Excludes unamortized debt discount and issuance costs of $373 million. Includes $295 million of capital lease obligations. Assumes the option to extend the DCC Term Loan facility will be exercised. |
(2) | Deferred income tax liabilities may vary according to changes in tax laws, tax rates and the operating results of the Company. As a result, it is impractical to determine whether there will be a cash impact to an individual year. All noncurrent deferred income tax liabilities have been reflected in “2022 and beyond.” |
(3) | Includes "Asbestos-related liabilities - noncurrent." Annual payments to resolve asbestos-related matters will vary based on changes in defense strategies, changes in state and national law, and claims filing and resolution rates. |
(4) | Due to uncertainties in the timing of the effective settlement of tax positions with the respective taxing authorities, the Company is unable to determine the timing of payments related to its uncertain tax positions, including interest and penalties. Amounts beyond the current year are therefore reflected in “2022 and beyond.” |
(5) | Includes outstanding purchase orders and other commitments greater than $1 million, obtained through a survey conducted within the Company. |
(6) | Cash requirements for interest on long-term debt was calculated using current interest rates at December 31, 2016, and includes approximately $4,968 million of various floating rate notes. |
Off-Balance Sheet Arrangements
Off-balance sheet arrangements are obligations the Company has with nonconsolidated entities related to transactions, agreements or other contractual arrangements. The Company holds variable interests in joint ventures accounted for under the equity method of accounting. The Company is not the primary beneficiary of these joint ventures and therefore is not required to consolidate the entities (see Note 20 to the Consolidated Financial Statements). In addition, see Note 16 to the Consolidated Financial Statements for information regarding the transfer of financial assets.
Guarantees arise during the ordinary course of business from relationships with customers and nonconsolidated affiliates when the Company undertakes an obligation to guarantee the performance of others if specific triggering events occur. The Company had outstanding guarantees at December 31, 2016 of $6,043 million, compared with $5,822 million at December 31, 2015. Additional information related to these guarantees can be found in the “Guarantees” section of Note 15 to the Consolidated Financial Statements.
Fair Value Measurements
See Note 11 to the Consolidated Financial Statements for information related to other-than-temporary impairments; see Note 12 for additional information concerning fair value measurements, including the Company’s interests held in trade receivable conduits; and, see Note 18 for information related to fair value measurements of pension and other postretirement benefit plan assets.
56
OUTLOOK
The Company is seeing early signs of positive economic momentum, with the United States in expansionary mode, driven by the ongoing strength of the consumer and the tailwind of a new incoming administration promising structural reforms. Europe continues its gradual recovery, despite increasing political uncertainty and geopolitical tensions. China’s transition is progressing on a robust path, and sustained growth of Asia’s middle class continues to drive demand throughout the region. And finally, Dow sees improvement in Latin America from its low base, with slow but stable gains continuing in Brazil.
The Company expects demand for Dow’s portfolio to remain healthy, particularly in the businesses that serve packaging, infrastructure, consumer care, electronics, automotive and agriculture. Building on Dow's strong achievements these past several years, the Company remains well-positioned to capture growth where growth exists around the world. And Dow's strategic investments - Sadara, Dow Corning and the U.S. Gulf Coast projects - will deliver the next layers of integration strength, earnings growth and cash flow generation.
For the year ahead, Dow remains squarely focused on three priorities: achieving the financial and operating plan; closing the DowDuPont transaction and driving quickly toward the intended spins; and capitalizing on the Company's strategic growth projects. Dow will continue to deliver strong financial performance for its customers and shareholders.
OTHER MATTERS
Recent Accounting Guidance
See Note 2 to the Consolidated Financial Statements for a summary of recent accounting guidance.
Critical Accounting Policies
The preparation of financial statements and related disclosures in accordance with U.S. GAAP requires management to make judgments, assumptions and estimates that affect the amounts reported in the consolidated financial statements and accompanying notes. Note 1 to the Consolidated Financial Statements describes the significant accounting policies and methods used in the preparation of the consolidated financial statements. Following are the Company’s critical accounting policies impacted by judgments, assumptions and estimates:
Litigation
The Company is subject to legal proceedings and claims arising out of the normal course of business including product liability, patent infringement, employment matters, governmental tax and regulation disputes, contract and commercial litigation, and other actions. The Company routinely assesses the legal and factual circumstances of each matter, the likelihood of any adverse outcomes to these matters, as well as ranges of probable losses. A determination of the amount of the reserves required, if any, for these contingencies is made after thoughtful analysis of each known claim. Dow has an active risk management program consisting of numerous insurance policies secured from many carriers covering various timeframes. These policies may provide coverage that could be utilized to minimize the financial impact, if any, of certain contingencies. The required reserves may change in the future due to new developments in each matter. For further discussion, see Note 15 to the Consolidated Financial Statements.
Asbestos-Related Matters of Union Carbide Corporation
Union Carbide is and has been involved in a large number of asbestos-related suits filed primarily in state courts during the past four decades. These suits principally allege personal injury resulting from exposure to asbestos-containing products and frequently seek both actual and punitive damages. The alleged claims primarily relate to products that Union Carbide sold in the past, alleged exposure to asbestos-containing products located on Union Carbide’s premises, and Union Carbide’s responsibility for asbestos suits filed against a former Union Carbide subsidiary, Amchem Products, Inc. Each year, Ankura Consulting Group, LLC ("Ankura") (formerly known as Analysis, Research and Planning Corporation prior to the March 2016 merger with Ankura) performs a review for Union Carbide based upon historical asbestos claims, resolution and historical defense spending. Union Carbide compares current asbestos claim, resolution and defense spending activity to the results of the most recent Ankura study at each balance sheet date to determine whether the asbestos-related liability continues to be appropriate.
In 2016, the Company elected to change its method of accounting for Union Carbide's asbestos-related defense and processing costs from expensing as incurred to estimating and accruing a liability. In addition to performing their annual review of pending and future asbestos claim resolution activity, Ankura also performed a review of Union Carbide's asbestos-related defense and processing costs to determine a reasonable estimate of future defense and processing costs to be included in the asbestos-related liability, through the terminal year of 2049.
57
For additional information, see Part I, Item 3. Legal Proceedings; Asbestos-Related Matters of Union Carbide Corporation in Management’s Discussion and Analysis of Financial Condition and Results of Operations; and Notes 1 and 15 to the Consolidated Financial Statements.
Environmental Matters
The Company determines the costs of environmental remediation of its facilities and formerly owned facilities based on evaluations of current law and existing technologies. Inherent uncertainties exist in such evaluations primarily due to unknown environmental conditions, changing governmental regulations and legal standards regarding liability, and emerging remediation technologies. The recorded liabilities are adjusted periodically as remediation efforts progress, or as additional technical or legal information becomes available. At December 31, 2016, the Company had accrued obligations of $909 million for probable environmental remediation and restoration costs, including $151 million for the remediation of Superfund sites. This is management’s best estimate of the costs for remediation and restoration with respect to environmental matters for which the Company has accrued liabilities, although it is reasonably possible that the ultimate cost with respect to these particular matters could range up to approximately two times that amount. For further discussion, see Environmental Matters in Management’s Discussion and Analysis of Financial Condition and Results of Operations and Notes 1 and 15 to the Consolidated Financial Statements.
Goodwill
The Company assesses goodwill recoverability through business financial performance reviews, enterprise valuation analysis and impairment tests. Annual goodwill impairment tests are completed by the Company during the fourth quarter of the year in accordance with the measurement provisions of the accounting guidance for goodwill. The tests are performed at the reporting unit level which is defined as one level below operating segment with the exception of Agricultural Sciences, which is both an operating segment and a reporting unit. Reporting units are the level at which discrete financial information is available and reviewed by business management on a regular basis. At December 31, 2016, the Company has defined five operating segments and 18 reporting units; goodwill is carried by 14 of these reporting units.
In addition to the annual goodwill impairment tests, the Company reviews the financial performance of its reporting units over the course of the year to assess whether circumstances have changed that would indicate it is more likely than not that the fair value of a reporting unit has declined below its carrying value. In cases where an indication of impairment is determined to exist, the Company completes an interim goodwill impairment test specifically for that reporting unit.
As part of its annual goodwill impairment testing, the Company has the option to first assess qualitative factors to determine whether it is more likely than not that the fair value of a reporting unit is less than its carrying value. The qualitative assessment is also used as a basis for determining whether it is necessary to perform the quantitative test. Qualitative factors assessed at the Company level include, but are not limited to, GDP growth rates, long-term hydrocarbon and energy prices, equity and credit market activity, discount rates, foreign exchange rates and overall financial performance. Qualitative factors assessed at the reporting unit level include, but are not limited to, changes in industry and market structure, competitive environments, planned capacity and new product launches, cost factors such as raw material prices, and financial performance of the reporting unit. If the Company chooses to not complete a qualitative assessment for a given reporting unit or if the initial assessment indicates that it is more likely than not that the carrying value of a reporting unit exceeds its estimated fair value, additional quantitative testing is required.
The first step of the quantitative test requires the fair value of the reporting unit to be compared with its carrying value. The Company utilizes a discounted cash flow methodology to calculate the fair value of its reporting units. This valuation technique has been selected by management as the most meaningful valuation method due to the limited number of market comparables for the Company's reporting units. However, where market comparables are available, the Company includes EBIT/EBITDA multiples as part of the reporting unit valuation analysis. The discounted cash flow valuations are completed using the following key assumptions (including certain ranges used for the 2016 testing): projected revenue growth rates, or compounded annual growth rates, over a ten-year cash flow forecast period, which ranged from 4.9 percent to 6.4 percent and varied by reporting unit based on underlying business fundamentals and future expectations; discount rates, which ranged from 8.9 percent to 9.5 percent; tax rates; terminal values, differentiated based on the cash flow projection of each reporting unit and the projected net operating profit after tax ("NOPAT") growth rate, which ranged from 2 percent to 3.5 percent; currency exchange rates; and forecasted long-term hydrocarbon and energy prices, by geographic area and by year, which included the Company's key feedstocks as well as natural gas and crude oil (due to its correlation to naphtha). Currency exchange rates and long-term hydrocarbon and energy prices are established for the Company as a whole and applied consistently to all
58
reporting units, while revenue growth rates, discount rates and tax rates are established by reporting unit to account for differences in business fundamentals and industry risk.
The second step of the quantitative test is required if the first step of the quantitative test indicates a potential impairment. The second step requires the Company to compare the implied fair value of a reporting unit's goodwill with the carrying amount of goodwill. If the carrying amount of goodwill is greater than its implied fair value, an impairment loss is recorded.
The Company also monitors and evaluates its market capitalization relative to book value. When the market capitalization of the Company falls below book value, management undertakes a process to evaluate whether a change in circumstances has occurred that would indicate it is more likely than not that the fair value of any of its reporting units has declined below carrying value. This evaluation process includes the use of third-party market-based valuations and internal discounted cash flow analysis. As part of the annual goodwill impairment test, the Company also compares market capitalization with the most recent total estimated fair value of its reporting units to ensure that significant differences are understood. At December 31, 2016 and 2015, Dow’s market capitalization exceeded book value.
2016 Goodwill Impairment Test
In 2016, there were no events or changes in circumstances identified that warranted interim goodwill impairment testing. In the fourth quarter of 2016, qualitative testing was performed for all but three of the Company's reporting units that carry goodwill. The results of the qualitative testing did not indicate any reporting units where it was more likely than not that the carrying value of the reporting unit was greater than its fair value. As a result, no additional quantitative testing was required for those reporting units.
The Company chose to proceed directly to the first step of the quantitative testing for three reporting units to re-evaluate the reasonableness of the differences between fair value and carrying value under current market conditions. Quantitative testing was conducted for the following reporting units, using key assumptions for the discounted cash flow analysis: Dow Coating Materials, Performance Monomers and Dow Electronic Materials.
Changes in key assumptions can affect the results of goodwill impairment testing. The changes made to key assumptions in 2016 did not result in a significant change in the impairment analysis conclusion. The key assumptions with the most significant impact on reporting unit fair value calculations include the discount rate and terminal value NOPAT growth rate. For the 2016 impairment testing, management completed sensitivity analysis on both of these key assumptions using a 100 basis point increase in the discount rate and a 100 basis point decrease in the terminal value NOPAT growth rate for reporting units where a quantitative fair value analysis was completed. In both cases the resulting fair values, based on discounted cash flows, exceeded the carrying values for all reporting units tested. Additional sensitivity analysis was completed on the combined impact of a 100 basis point increase in the discount rate and a 100 basis point decrease in the terminal value NOPAT growth rate. This analysis resulted in a fair value, based on discounted cash flows, that exceeded the carrying value for Dow Electronic Materials and Performance Monomers. This analysis also resulted in a fair value for Dow Coating Materials, which carried $2,233 million of goodwill at December 31, 2016, that was $122 million below carrying value.
In completing the fair value analysis for the 2016 impairment test, management evaluated the reasonableness of differences noted between fair value and carrying value of each reporting unit. All differences were determined to be reasonable.
Based on the fair value analysis completed by the Company in the fourth quarter of 2016, using the key assumptions defined for the Company as well as the key assumptions defined specifically for each reporting unit, management concluded that fair value exceeded carrying value for all reporting units.
Pension and Other Postretirement Benefits
The amounts recognized in the consolidated financial statements related to pension and other postretirement benefits are determined from actuarial valuations. Inherent in these valuations are assumptions including expected return on plan assets, discount rates at which the liabilities could have been settled at December 31, 2016, rate of increase in future compensation levels, mortality rates and health care cost trend rates. These assumptions are updated annually and are disclosed in Note 18 to the Consolidated Financial Statements. In accordance with U.S. GAAP, actual results that differ from the assumptions are accumulated and amortized over future periods and, therefore, affect expense recognized and obligations recorded in future periods. The U.S. pension plans represent 72 percent of the Company’s pension plan assets and 71 percent of the pension obligations.
59
The following information relates to the U.S. plans only; a similar approach is used for the Company’s non-U.S. plans.
The Company determines the expected long-term rate of return on assets by performing a detailed analysis of historical and expected returns based on the strategic asset allocation approved by the Company's Investment Committee and the underlying return fundamentals of each asset class. The Company’s historical experience with the pension fund asset performance is also considered. The expected return of each asset class is derived from a forecasted future return confirmed by historical experience. The expected long-term rate of return is an assumption and not what is expected to be earned in any one particular year. The weighted-average long-term rate of return assumption used for determining net periodic pension expense for 2016 was 7.77 percent. The assumption used for determining 2017 net periodic pension expense is 7.91 percent. Future actual pension expense will depend on future investment performance, changes in future discount rates and various other factors related to the population of participants in the Company’s pension plans.
The discount rates utilized to measure the pension and other postretirement obligations of the U.S. qualified plans are based on the yield on high-quality corporate fixed income investments at the measurement date. Future expected actuarially determined cash flows for Dow’s U.S. plans are individually discounted at the spot rates under the Willis Towers Watson U.S. RATE:Link 60-90 corporate yield curve (based on 60th to 90th percentile high-quality corporate bond yields) to arrive at the plan’s obligations as of the measurement date. The weighted average discount rate decreased to 4.11 percent at December 31, 2016, from 4.40 percent at December 31, 2015.
At December 31, 2016, the U.S. qualified plans were underfunded on a projected benefit obligation basis by $5.1 billion. The underfunded amount increased approximately $1.3 billion compared with December 31, 2015. The increase in the underfunded amount in 2016 was primarily due to the pension plan assets and obligations assumed from Dow Corning and the change in the discount rate. The Company contributed $350 million to the U.S. qualified plans in 2016.
The assumption for the long-term rate of increase in compensation levels for the principal U.S. qualified plans was 4.25 percent. The Company uses a generational mortality table to determine the duration of its pension and other postretirement obligations.
The following discussion relates to the Company’s significant pension plans.
The Company bases the determination of pension expense on a market-related valuation of plan assets that reduces year-to-year volatility. This market-related valuation recognizes investment gains or losses over a five-year period from the year in which they occur. Investment gains or losses for this purpose represent the difference between the expected return calculated using the market-related value of plan assets and the actual return based on the market value of plan assets. Since the market-related value of plan assets recognizes gains or losses over a five-year period, the future value of plan assets will be impacted when previously deferred gains or losses are recorded. Over the life of the plans, both gains and losses have been recognized and amortized. At December 31, 2016, net losses of $520 million remain to be recognized in the calculation of the market-related value of plan assets. These net losses will result in increases in future pension expense as they are recognized in the market-related value of assets.
The decrease in the market-related value of assets due to the recognition of prior losses is presented in the following table:
Decrease in Market-Related Asset Value Due to Recognition of Prior Losses In millions | |||
2017 | $ | 94 | |
2018 | 148 | ||
2019 | 241 | ||
2020 | 37 | ||
Total | $ | 520 | |
On January 1, 2016, the Company adopted the spot rate approach to determine the discount rate utilized to measure the service cost and interest cost components of net periodic pension and other postretirement benefit costs for the U.S. and other selected countries. Under the spot rate approach, the Company calculates service costs and interest costs by applying individual spot rates from the Willis Towers Watson RATE:Link yield curve (based on high-quality corporate
60
bond yields) for each selected country to the separate expected cash flow components of service cost and interest cost; service cost and interest cost for all other plans (including all plans prior to adoption) are determined on the basis of the single equivalent discount rates derived in determining those plan obligations. The Company changed to this method to provide a more precise measure of interest and service costs for certain countries by improving the correlation between projected benefit cash flows and the discrete spot yield curves. The Company accounted for this change as a change in accounting estimate and it was applied prospectively starting in 2016.
The Company expects pension expense to increase in 2017 by approximately $50 million. The increase in pension expense is primarily due to pension plans assumed from Dow Corning and the impact of lower discount rates.
A 25 basis point increase or decrease in the long-term return on assets assumption would change the Company’s total pension expense for 2017 by $53 million. A 25 basis point increase in the discount rate assumption would lower the Company's total pension expense for 2017 by $58 million. A 25 basis point decrease in the discount rate assumption would increase the Company's total pension expense for 2017 by $61 million. A 25 basis point change in the long-term return and discount rate assumptions would have an immaterial impact on the other postretirement benefit expense for 2017.
Income Taxes
Deferred tax assets and liabilities are determined based on temporary differences between the financial reporting and tax bases of assets and liabilities, applying enacted tax rates expected to be in effect for the year in which the differences are expected to reverse. Based on the evaluation of available evidence, both positive and negative, the Company recognizes future tax benefits, such as net operating loss carryforwards and tax credit carryforwards, to the extent that realizing these benefits is considered to be more likely than not.
At December 31, 2016, the Company had a net deferred tax asset balance of $2,156 million, after valuation allowances of $1,061 million.
In evaluating the ability to realize the deferred tax assets, the Company relies on, in order of increasing subjectivity, taxable income in prior carryback years, the future reversals of existing taxable temporary differences, tax planning strategies and forecasted taxable income using historical and projected future operating results.
At December 31, 2016, the Company had deferred tax assets for tax loss and tax credit carryforwards of $2,450 million, $205 million of which is subject to expiration in the years 2017-2021. In order to realize these deferred tax assets for tax loss and tax credit carryforwards, the Company needs taxable income of approximately $22,058 million across multiple jurisdictions. The taxable income needed to realize the deferred tax assets for tax loss and tax credit carryforwards that are subject to expiration between 2017-2021 is approximately $3,222 million.
The Company recognizes the financial statement effects of an uncertain income tax position when it is more likely than not, based on technical merits, that the position will be sustained upon examination. At December 31, 2016, the Company had uncertain tax positions for both domestic and foreign issues of $231 million.
The Company accrues for non-income tax contingencies when it is probable that a liability to a taxing authority has been incurred and the amount of the contingency can be reasonably estimated. At December 31, 2016, the Company had a non-income tax contingency reserve for both domestic and foreign issues of $108 million.
For additional information, see Notes 1 and 23 to the Consolidated Financial Statements.
61
Environmental Matters
Environmental Policies
Dow is committed to world-class environmental, health and safety (“EH&S”) performance, as demonstrated by industry-leading performance, a long-standing commitment to Responsible Care®, and a strong commitment to achieve the Company’s 2025 Sustainability Goals – goals that set the standard for sustainability in the chemical industry by focusing on improvements in Dow’s local corporate citizenship and product stewardship, and by actively pursuing methods to reduce the Company’s environmental impact.
To meet the Company’s public commitments, as well as the stringent laws and government regulations related to environmental protection and remediation to which its global operations are subject, Dow has well-defined policies, requirements and management systems. Dow’s EH&S Management System (“EMS”) defines the “who, what, when and how” needed for the businesses to achieve the Company’s policies, requirements, performance objectives, leadership expectations and public commitments. To ensure effective utilization, the EMS is integrated into a company-wide management system for EH&S, Operations, Quality and Human Resources.
It is Dow’s policy to adhere to a waste management hierarchy that minimizes the impact of wastes and emissions on the environment. First, Dow works to eliminate or minimize the generation of waste and emissions at the source through research, process design, plant operations and maintenance. Second, Dow finds ways to reuse and recycle materials. Finally, unusable or non-recyclable hazardous waste is treated before disposal to eliminate or reduce the hazardous nature and volume of the waste. Treatment may include destruction by chemical, physical, biological or thermal means. Disposal of waste materials in landfills is considered only after all other options have been thoroughly evaluated. Dow has specific requirements for waste that is transferred to non-Dow facilities, including the periodic auditing of these facilities.
Dow believes third-party verification and transparent public reporting are cornerstones of world-class EH&S performance and building public trust. Numerous Dow sites in Europe, Latin America, Asia Pacific and North America have received third-party verification of Dow’s compliance with Responsible Care® and with outside specifications such as ISO-14001. Dow continues to be a global champion of Responsible Care® and has worked to broaden the application and impact of Responsible Care® around the world through engagement with suppliers, customers and joint venture partners.
Dow’s EH&S policies helped the Company achieve improvements in many aspects of EH&S performance in 2016. Dow’s process safety performance was excellent in 2016 and improvements were made in injury/illness rates. In light of the fatalities that we tragically experienced in 2016, safety focus remains a priority for the entire Company. Further improvement in these areas, as well as environmental compliance, remains a top management priority, with initiatives underway to further improve performance and compliance in 2017 as Dow continues to implement the Company's 2025 Sustainability Goals.
Detailed information on Dow’s performance regarding environmental matters and goals can be found online on Dow’s Sustainability webpage at www.dow.com. The Company's website and its content are not deemed incorporated by reference into this report.
Chemical Security
Public and political attention continues to be placed on the protection of critical infrastructure, including the chemical industry, from security threats. Terrorist attacks, natural disasters and cyber incidents have increased concern about the security and safety of chemical production and distribution. Many, including Dow and the American Chemistry Council, have called for uniform risk-based and performance-based national standards for securing the U.S. chemical industry. The Maritime Transportation Security Act of 2002 and its regulations further set forth risk-based and performance-based standards that must be met at U.S. Coast Guard-regulated facilities. U.S. Chemical Plant Security legislation was passed in 2006 and the Department of Homeland Security is now implementing the regulations known as the Chemical Facility Anti-Terrorism Standards. The Company is complying with the requirements of the Rail Transportation Security Rule issued by the U.S. Transportation Security Administration. Dow continues to support uniform risk-based national standards for securing the chemical industry.
The focus on security, emergency planning, preparedness and response is not new to Dow. A comprehensive, multi-level security plan for the Company has been maintained since 1988. This plan, which has been activated in response to significant world and national events since then, is reviewed on an annual basis. Dow continues to improve its security plans, placing emphasis on the safety of Dow communities and people by being prepared to meet risks at any level and to address both internal and external identifiable risks. The security plan includes regular vulnerability assessments, security audits, mitigation efforts and physical security upgrades designed to reduce vulnerability. Dow’s security plans also are developed to avert interruptions of normal business operations that could materially and adversely affect the Company’s results of operations, liquidity and financial condition.
62
Dow played a key role in the development and implementation of the American Chemistry Council’s Responsible Care® Security Code, which requires that all aspects of security – including facility, transportation and cyberspace – be assessed and gaps addressed. Through the Company’s global implementation of the Security Code, Dow has permanently heightened the level of security – not just in the United States, but worldwide. Dow employs several hundred employees and contractors in its Emergency Services and Security department worldwide.
Through the implementation of the Security Code, including voluntary security enhancements and upgrades made since 2002, Dow is well-positioned to comply with U.S. chemical facility regulations and other regulatory security frameworks. Dow is currently participating with the American Chemistry Council to review and update the Responsible Care® Security Code.
Dow continues to work collaboratively across the supply chain on Responsible Care®, Supply Chain Design, Emergency Preparedness, Shipment Visibility and transportation of hazardous materials. Dow is cooperating with public and private entities to lead the implementation of advanced tank car design, and track and trace technologies. Further, Dow’s Distribution Risk Review process that has been in place for decades was expanded to address potential threats in all modes of transportation across the Company’s supply chain. To reduce vulnerabilities, Dow maintains security measures that meet or exceed regulatory and industry security standards in all areas in which the Company operates.
Dow's initiatives relative to chemical security, emergency preparedness and response, Community Awareness and Emergency Responses and crisis management are implemented consistently at all Dow sites on a global basis. Dow participates with chemical associations globally and participates as an active member of the U.S. delegation to the G7 Global Partnership Sub-Working Group on Chemical Security.
Climate Change
Climate change matters for Dow are likely to be driven by changes in regulations, public policy and physical climate parameters.
Regulatory Matters
Regulatory matters include cap and trade schemes; increased greenhouse gas (“GHG”) limits; and taxes on GHG emissions, fuel and energy. The potential implications of each of these matters are all very similar, including increased cost of purchased energy, additional capital costs for installation or modification of GHG emitting equipment, and additional costs associated directly with GHG emissions (such as cap and trade systems or carbon taxes), which are primarily related to energy use. It is difficult to estimate the potential impact of these regulatory matters on energy prices.
Reducing Dow's overall energy usage and GHG emissions through new and unfolding projects will decrease the potential impact of these regulatory matters. Dow also has a dedicated commercial group to handle energy contracts and purchases, including managing emissions trading. The Company has not experienced any material impact related to regulated GHG emissions. The Company continues to evaluate and monitor this area for future developments.
Physical Climate Parameters
Many scientific academies throughout the world have concluded that it is very likely that human activities are contributing to global warming. At this point, it is difficult to predict and assess the probability and opportunity of a global warming trend on Dow specifically. Preparedness plans are developed that detail actions needed in the event of severe weather. These measures have historically been in place and these activities and associated costs are driven by normal operational preparedness. Dow continues to study the long-term implications of changing climate parameters on water availability, plant siting issues, and impacts and opportunities for products.
Dow’s Energy business and Public Affairs and Sustainability functions are tasked with developing and implementing a comprehensive strategy that addresses the potential challenges of energy security and GHG emissions on the Company. The Company continues to elevate its internal focus and external positions - to focus on the root causes of GHG emissions - including the unsustainable use of energy. Dow's energy plan provides the roadmap:
• | Conserve - aggressively pursue energy efficiency and conservation |
• | Optimize - increase and diversify energy resources |
• | Accelerate - develop cost-effective, clean, renewable and alternative energy sources |
• | Transition - to a sustainable energy future |
Through corporate energy efficiency programs and focused GHG management efforts, the Company has and is continuing to reduce its GHG emissions footprint. The Company’s manufacturing intensity, measured in Btu per pound of product, has
63
improved by more than 40 percent since 1990. As part of the Company's 2025 Sustainability Goals, Dow will maintain GHG emissions below 2006 levels on an absolute basis for all GHGs.
Environmental Remediation
Dow accrues the costs of remediation of its facilities and formerly owned facilities based on current law and regulatory requirements. The nature of such remediation can include management of soil and groundwater contamination. The accounting policies adopted to properly reflect the monetary impacts of environmental matters are discussed in Note 1 to the Consolidated Financial Statements. To assess the impact on the financial statements, environmental experts review currently available facts to evaluate the probability and scope of potential liabilities. Inherent uncertainties exist in such evaluations primarily due to unknown environmental conditions, changing governmental regulations and legal standards regarding liability, and the ability to apply remediation technologies. These liabilities are adjusted periodically as remediation efforts progress or as additional technical or legal information becomes available. Dow had an accrued liability of $758 million at December 31, 2016, related to the remediation of current or former Dow-owned sites. At December 31, 2015, the liability related to remediation was $596 million.
In addition to current and former Dow-owned sites, under the federal Comprehensive Environmental Response, Compensation and Liability Act ("CERCLA") and equivalent state laws (hereafter referred to collectively as "Superfund Law"), Dow is liable for remediation of other hazardous waste sites where Dow allegedly disposed of, or arranged for the treatment or disposal of, hazardous substances. Because Superfund Law imposes joint and several liability upon each party at a site, Dow has evaluated its potential liability in light of the number of other companies that also have been named potentially responsible parties (“PRPs”) at each site, the estimated apportionment of costs among all PRPs, and the financial ability and commitment of each to pay its expected share. The Company’s remaining liability for the remediation of Superfund sites was $151 million at December 31, 2016 ($74 million at December 31, 2015). The Company has not recorded any third-party recovery related to these sites as a receivable.
Information regarding environmental sites is provided below:
Environmental Sites | Dow-owned Sites (1) | Superfund Sites (2) | ||||||||||
2016 | 2015 | 2016 | 2015 | |||||||||
Number of sites at January 1 | 180 | 184 | 124 | 124 | ||||||||
Sites added during year | 16 | 7 | 10 | 7 | ||||||||
Sites closed during year | (7 | ) | (11 | ) | (3 | ) | (7 | ) | ||||
Number of sites at December 31 | 189 | 180 | 131 | 124 | ||||||||
(1) | Dow-owned sites are sites currently or formerly owned by Dow. In the United States, remediation obligations are imposed by the Resource Conservation and Recovery Act or analogous state law. At December 31, 2016, 38 of these sites (41 sites at December 31, 2015) were formerly owned by Dowell Schlumberger, Inc., a group of companies in which the Company previously owned a 50 percent interest. Dow sold its interest in Dowell Schlumberger in 1992. |
(2) | Superfund sites are sites, including sites not owned by Dow, where remediation obligations are imposed by Superfund Law. |
Additional information is provided below for the Company’s Midland, Michigan, manufacturing site and Midland off-site locations (collectively, the "Midland sites"), as well as a Superfund site in Wood-Ridge, New Jersey, the locations for which the Company has the largest potential environmental liabilities.
In the early days of operations at the Midland manufacturing site, wastes were usually disposed of on-site, resulting in soil and groundwater contamination, which has been contained and managed on-site under a series of Resource Conservation and Recovery Act permits and regulatory agreements. The Hazardous Waste Operating License for the Midland manufacturing site, issued in 2003, and renewed and replaced in September 2015, also included provisions for the Company to conduct an investigation to determine the nature and extent of off-site contamination from historic Midland manufacturing site operations. In January 2010, the Company, the U.S. Environmental Protection Agency ("EPA") and the State of Michigan ("State") entered into an administrative order on consent that requires the Company to conduct a remedial investigation, a feasibility study and a remedial design for the Tittabawassee River, the Saginaw River and the Saginaw Bay, and pay the oversight costs of the EPA and the State under the authority of CERCLA. See Note 15 to the Consolidated Financial Statements for additional information. At December 31, 2016, the Company had an accrual of $137 million ($92 million at December 31, 2015) for environmental remediation and investigation associated with the Midland sites. In 2016, the Company spent $36 million ($28 million in 2015) for environmental remediation at the Midland sites.
64
Rohm and Haas is a PRP at the Wood-Ridge, New Jersey Ventron/Velsicol Superfund Site, and the adjacent Berry’s Creek Study Area ("BCSA") (collectively, the "Wood-Ridge sites"). Rohm and Haas is a successor in interest to a company that owned and operated a mercury processing facility, where wastewater and waste handling resulted in contamination of soils and adjacent creek sediments. The Berry’s Creek Study Area PRP group completed a multi-stage Remedial Investigation ("RI") pursuant to an Administrative Order on Consent with U.S. EPA Region 2 to identify contamination in surface water, sediment and biota related to numerous contaminated sites in the Berry's Creek watershed, and submitted the report to the EPA in June 2016. That same month, the EPA concluded that an "iterative or adaptive approach" is appropriate for cleaning up the BCSA. Thus, each phase of remediation will be followed by a period of monitoring to assess its effectiveness and determine if there is a need for more work. The Feasibility Study ("FS") for the first phase of work will be submitted in the second half of 2018. The EPA will then review the remedial options presented in the FS, select the remedy and issue an interim Record of Decision ("ROD"). The PRP group will then attempt to negotiate agreements among the PRP's to fund the selected remedy and with the EPA to perform the remediation. Although there is currently much uncertainty as to what will ultimately be required to remediate the BCSA and Rohm and Haas's share of these costs has yet to be determined, the range of activities that will be required in the interim ROD is known in general terms. Based on the first phase of the RI and agreement with the EPA, the overall remediation accrual for the Wood-Ridge sites was increased by $80 million in the fourth quarter of 2016. At December 31, 2016, the Company had an accrual of $91 million ($15 million at December 31, 2015) for environmental remediation at the Wood-Ridge sites. In 2016, the Company spent $6 million ($6 million in 2015) on environmental remediation at the Wood-Ridge sites.
In the fourth quarter of 2016, the Company recorded a pretax charge of $295 million for environmental remediation at a number of historical locations, including the Midland manufacturing site/off-site matters and the Wood-Ridge sites, primarily resulting from the culmination of negotiations with regulators and/or final agency approval. This charge was included in "Cost of sales" in the consolidated statements of income. In total, the Company’s accrued liability for probable environmental remediation and restoration costs was $909 million at December 31, 2016, compared with $670 million at the end of 2015. This is management’s best estimate of the costs for remediation and restoration with respect to environmental matters for which the Company has accrued liabilities, although it is reasonably possible that the ultimate cost with respect to these particular matters could range up to approximately two times that amount. Consequently, it is reasonably possible that environmental remediation and restoration costs in excess of amounts accrued could have a material impact on the Company’s results of operations, financial condition and cash flows. It is the opinion of the Company’s management, however, that the possibility is remote that costs in excess of the range disclosed will have a material impact on the Company’s results of operations, financial condition and cash flows.
The amounts charged to income on a pretax basis related to environmental remediation totaled $504 million in 2016, $218 million in 2015 and $227 million in 2014. The amounts charged to income on a pretax basis related to operating the Company’s current pollution abatement facilities, excluding internal recharges, totaled $623 million in 2016, $613 million in 2015 and $637 million in 2014. Capital expenditures for environmental protection were $66 million in 2016, $49 million in 2015 and $78 million in 2014.
65
Asbestos-Related Matters of Union Carbide Corporation
Union Carbide is and has been involved in a large number of asbestos-related suits filed primarily in state courts during the past four decades. These suits principally allege personal injury resulting from exposure to asbestos-containing products and frequently seek both actual and punitive damages. The alleged claims primarily relate to products that Union Carbide sold in the past, alleged exposure to asbestos-containing products located on Union Carbide’s premises, and Union Carbide’s responsibility for asbestos suits filed against a former Union Carbide subsidiary, Amchem. In many cases, plaintiffs are unable to demonstrate that they have suffered any compensable loss as a result of such exposure, or that injuries incurred in fact resulted from exposure to Union Carbide’s products.
The table below provides information regarding asbestos-related claims pending against Union Carbide and Amchem based on criteria developed by Union Carbide and its external consultants. Union Carbide had a significant increase in the number of claims settled, dismissed or otherwise resolved in 2015 resulting from a detailed review of the status of individual claims and an update to criteria used to classify claims.
Asbestos-Related Claim Activity | 2016 | 2015 | 2014 | ||||||
Claims unresolved at January 1 | 18,778 | 26,116 | 29,005 | ||||||
Claims filed | 7,813 | 7,544 | 8,857 | ||||||
Claims settled, dismissed or otherwise resolved | (10,450 | ) | (14,882 | ) | (11,746 | ) | |||
Claims unresolved at December 31 | 16,141 | 18,778 | 26,116 | ||||||
Claimants with claims against both UCC and Amchem | (5,741 | ) | (6,804 | ) | (8,209 | ) | |||
Individual claimants at December 31 | 10,400 | 11,974 | 17,907 | ||||||
Plaintiffs’ lawyers often sue numerous defendants in individual lawsuits or on behalf of numerous claimants. As a result, the damages alleged are not expressly identified as to Union Carbide, Amchem or any other particular defendant, even when specific damages are alleged with respect to a specific disease or injury. In fact, there are no asbestos personal injury cases in which only Union Carbide and/or Amchem are the sole named defendants. For these reasons and based upon Union Carbide’s litigation and settlement experience, Union Carbide does not consider the damages alleged against Union Carbide and Amchem to be a meaningful factor in its determination of any potential asbestos-related liability.
For additional information see Part I, Item 3. Legal Proceedings and Asbestos-Related Matters and Notes 1 and 15 to the Consolidated Financial Statements.
66
The Dow Chemical Company and Subsidiaries |
PART II, Item 7A. Quantitative and Qualitative Disclosures About Market Risk. |
QUANTITATIVE AND QUALITATIVE DISCLOSURES ABOUT MARKET RISK
Dow’s business operations give rise to market risk exposure due to changes in foreign exchange rates, interest rates, commodity prices and other market factors such as equity prices. To manage such risks effectively, the Company enters into hedging transactions, pursuant to established guidelines and policies, that enable it to mitigate the adverse effects of financial market risk. Derivatives used for this purpose are designated as hedges per the accounting guidance related to derivatives and hedging activities, where appropriate. A secondary objective is to add value by creating additional non-specific exposure within established limits and policies; derivatives used for this purpose are not designated as hedges. The potential impact of creating such additional exposures is not material to the Company’s results.
The global nature of Dow’s business requires active participation in the foreign exchange markets. As a result of investments, production facilities and other operations on a global basis, the Company has assets, liabilities and cash flows in currencies other than the U.S. dollar. The primary objective of the Company’s foreign exchange risk management is to optimize the U.S. dollar value of net assets and cash flows, keeping the adverse impact of currency movements to a minimum. To achieve this objective, the Company hedges on a net exposure basis using foreign currency forward contracts, over-the-counter option contracts, cross-currency swaps, and nonderivative instruments in foreign currencies. Exposures primarily relate to assets, liabilities and bonds denominated in foreign currencies, as well as economic exposure, which is derived from the risk that currency fluctuations could affect the dollar value of future cash flows related to operating activities. The largest exposures are denominated in European currencies, the Japanese yen and the Chinese yuan, although exposures also exist in other currencies of Asia Pacific, Latin America, Middle East, Africa and India.
The main objective of interest rate risk management is to reduce the total funding cost to the Company and to alter the interest rate exposure to the desired risk profile. Dow uses interest rate swaps, “swaptions,” and exchange-traded instruments to accomplish this objective. The Company’s primary exposure is to the U.S. dollar yield curve.
Dow has a portfolio of equity securities derived primarily from the investment activities of its insurance subsidiaries. This exposure is managed in a manner consistent with the Company’s market risk policies and procedures.
Inherent in Dow’s business is exposure to price changes for several commodities. Some exposures can be hedged effectively through liquid tradable financial instruments. Feedstocks for ethylene production and natural gas constitute the main commodity exposures. Over-the-counter and exchange traded instruments are used to hedge these risks, when feasible.
Dow uses value-at-risk (“VAR”), stress testing and scenario analysis for risk measurement and control purposes. VAR estimates the maximum potential loss in fair market values, given a certain move in prices over a certain period of time, using specified confidence levels. The VAR methodology used by the Company is a variance/covariance model. This model uses a 97.5 percent confidence level and includes at least one year of historical data. The 2016 and 2015 year-end and average daily VAR for the aggregate of all positions are shown below. These amounts are immaterial relative to the total equity of the Company.
Total Daily VAR by Exposure Type at December 31 | 2016 | 2015 | |||||||||||||
In millions | Year-end | Average | Year-end | Average | |||||||||||
Commodities | $ | 24 | $ | 23 | $ | 21 | $ | 20 | |||||||
Equities | $ | 17 | $ | 16 | $ | 15 | $ | 16 | |||||||
Foreign exchange | $ | 28 | $ | 9 | $ | 1 | $ | 2 | |||||||
Interest rate | $ | 82 | $ | 90 | $ | 96 | $ | 103 | |||||||
Composite | $ | 151 | $ | 138 | $ | 133 | $ | 141 | |||||||
The Company’s daily VAR for the aggregate of all positions increased from a composite VAR of $133 million at December 31, 2015 to a composite VAR of $151 million at December 31, 2016. The primary driver of the higher composite VAR was an increase in the foreign exchange VAR due to increased managed long-term exposures and higher portfolio currency volatilities. The commodities and equities VARs increased due to a rise in the market value of holdings. The interest rate VAR declined due to lower volatility. See Note 11 to the Consolidated Financial Statements for further disclosure regarding market risk.
67
The Dow Chemical Company and Subsidiaries |
PART II, Item 8. Financial Statements and Supplementary Data. |
Report of Independent Registered Public Accounting Firm
To the Board of Directors and Stockholders of
The Dow Chemical Company:
We have audited the accompanying consolidated balance sheets of The Dow Chemical Company and subsidiaries (the “Company”) as of December 31, 2016 and 2015, and the related consolidated statements of income, comprehensive income, equity, and cash flows for each of the three years in the period ended December 31, 2016. Our audits also included the financial statement schedule listed in the Index at Item 15(a)2. These financial statements and financial statement schedule are the responsibility of the Company’s management. Our responsibility is to express an opinion on the financial statements and financial statement schedule based on our audits.
We conducted our audits in accordance with the standards of the Public Company Accounting Oversight Board (United States). Those standards require that we plan and perform the audit to obtain reasonable assurance about whether the financial statements are free of material misstatement. An audit includes examining, on a test basis, evidence supporting the amounts and disclosures in the financial statements. An audit also includes assessing the accounting principles used and significant estimates made by management, as well as evaluating the overall financial statement presentation. We believe that our audits provide a reasonable basis for our opinion.
In our opinion, such consolidated financial statements present fairly, in all material respects, the financial position of The Dow Chemical Company and subsidiaries as of December 31, 2016 and 2015, and the results of their operations and their cash flows for each of the three years in the period ended December 31, 2016, in conformity with accounting principles generally accepted in the United States of America. Also, in our opinion, such financial statement schedule, when considered in relation to the basic consolidated financial statements taken as a whole, presents fairly, in all material respects, the information set forth therein.
As discussed in Note 1 to the consolidated financial statements, in the fourth quarter of 2016, the Company changed its accounting policy from expensing asbestos-related defense and processing costs as incurred to the accrual of asbestos-related defense and processing costs when probable of occurring and estimable.
We have also audited, in accordance with the standards of the Public Company Accounting Oversight Board (United States), the Company's internal control over financial reporting as of December 31, 2016, based on the criteria established in Internal Control-Integrated Framework (2013) issued by the Committee of Sponsoring Organizations of the Treadway Commission and our report dated February 9, 2017 expressed an unqualified opinion on the Company's internal control over financial reporting.
/s/ DELOITTE & TOUCHE LLP |
Deloitte & Touche LLP
Midland, Michigan
February 9, 2017
68
The Dow Chemical Company and Subsidiaries
Consolidated Statements of Income
(In millions, except per share amounts) For the years ended December 31 | 2016 | 2015 | 2014 | ||||||||
Net Sales | $ | 48,158 | $ | 48,778 | $ | 58,167 | |||||
Cost of sales | 37,641 | 37,836 | 47,464 | ||||||||
Research and development expenses | 1,584 | 1,598 | 1,647 | ||||||||
Selling, general and administrative expenses | 3,304 | 2,971 | 3,106 | ||||||||
Amortization of intangibles | 544 | 419 | 436 | ||||||||
Goodwill and other intangible asset impairment losses | — | — | 50 | ||||||||
Restructuring charges (credits) | 452 | 415 | (3 | ) | |||||||
Asbestos-related charge | 1,113 | — | 78 | ||||||||
Equity in earnings of nonconsolidated affiliates | 442 | 674 | 835 | ||||||||
Sundry income (expense) - net | 1,202 | 4,592 | (27 | ) | |||||||
Interest income | 107 | 71 | 51 | ||||||||
Interest expense and amortization of debt discount | 858 | 946 | 983 | ||||||||
Income Before Income Taxes | 4,413 | 9,930 | 5,265 | ||||||||
Provision for income taxes | 9 | 2,147 | 1,426 | ||||||||
Net Income | 4,404 | 7,783 | 3,839 | ||||||||
Net income attributable to noncontrolling interests | 86 | 98 | 67 | ||||||||
Net Income Attributable to The Dow Chemical Company | 4,318 | 7,685 | 3,772 | ||||||||
Preferred stock dividends | 340 | 340 | 340 | ||||||||
Net Income Available for The Dow Chemical Company Common Stockholders | $ | 3,978 | $ | 7,345 | $ | 3,432 | |||||
Per Common Share Data: | |||||||||||
Earnings per common share - basic | $ | 3.57 | $ | 6.45 | $ | 2.91 | |||||
Earnings per common share - diluted | $ | 3.52 | $ | 6.15 | $ | 2.87 | |||||
Dividends declared per share of common stock | $ | 1.84 | $ | 1.72 | $ | 1.53 | |||||
Weighted-average common shares outstanding - basic | 1,108.1 | 1,130.1 | 1,170.9 | ||||||||
Weighted-average common shares outstanding - diluted | 1,123.2 | 1,241.4 | 1,187.0 | ||||||||
See Notes to the Consolidated Financial Statements.
69
The Dow Chemical Company and Subsidiaries
Consolidated Statements of Comprehensive Income
(In millions) For the years ended December 31 | 2016 | 2015 | 2014 | ||||||||
Net Income | $ | 4,404 | $ | 7,783 | $ | 3,839 | |||||
Other Comprehensive Income (Loss), Net of Tax | |||||||||||
Unrealized losses on investments | (4 | ) | (94 | ) | (19 | ) | |||||
Cumulative translation adjustments | (644 | ) | (986 | ) | (1,227 | ) | |||||
Pension and other postretirement benefit plans | (620 | ) | 552 | (1,861 | ) | ||||||
Derivative instruments | 113 | (122 | ) | (83 | ) | ||||||
Total other comprehensive loss | (1,155 | ) | (650 | ) | (3,190 | ) | |||||
Comprehensive Income | 3,249 | 7,133 | 649 | ||||||||
Comprehensive income attributable to noncontrolling interests, net of tax | 83 | 65 | 35 | ||||||||
Comprehensive Income Attributable to The Dow Chemical Company | $ | 3,166 | $ | 7,068 | $ | 614 | |||||
See Notes to the Consolidated Financial Statements.
70
The Dow Chemical Company and Subsidiaries
Consolidated Balance Sheets
(In millions, except share amounts) At December 31 | 2016 | 2015 | |||||
Assets | |||||||
Current Assets | |||||||
Cash and cash equivalents (variable interest entities restricted - 2016: $75; 2015: $158) | $ | 6,607 | $ | 8,577 | |||
Accounts and notes receivable: | |||||||
Trade (net of allowance for doubtful receivables - 2016: $110; 2015: $94) | 4,666 | 4,078 | |||||
Other | 4,358 | 3,768 | |||||
Inventories | 7,363 | 6,871 | |||||
Other current assets | 665 | 647 | |||||
Total current assets | 23,659 | 23,941 | |||||
Investments | |||||||
Investment in nonconsolidated affiliates | 3,747 | 3,958 | |||||
Other investments (investments carried at fair value - 2016: $1,959; 2015: $1,866) | 2,969 | 2,923 | |||||
Noncurrent receivables | 708 | 816 | |||||
Total investments | 7,424 | 7,697 | |||||
Property | |||||||
Property | 57,438 | 50,802 | |||||
Less accumulated depreciation | 33,952 | 32,948 | |||||
Net property (variable interest entities restricted - 2016: $961; 2015: $1,717) | 23,486 | 17,854 | |||||
Other Assets | |||||||
Goodwill | 15,272 | 12,154 | |||||
Other intangible assets (net of accumulated amortization - 2016: $4,295; 2015: $3,770) | 6,026 | 3,617 | |||||
Deferred income tax assets | 3,079 | 2,140 | |||||
Deferred charges and other assets | 565 | 535 | |||||
Total other assets | 24,942 | 18,446 | |||||
Total Assets | $ | 79,511 | $ | 67,938 | |||
Liabilities and Equity | |||||||
Current Liabilities | |||||||
Notes payable | $ | 272 | $ | 454 | |||
Long-term debt due within one year | 635 | 541 | |||||
Accounts payable: | |||||||
Trade | 4,519 | 3,577 | |||||
Other | 2,401 | 2,287 | |||||
Income taxes payable | 600 | 452 | |||||
Dividends payable | 508 | 592 | |||||
Accrued and other current liabilities | 3,669 | 3,212 | |||||
Total current liabilities | 12,604 | 11,115 | |||||
Long-Term Debt (variable interest entities nonrecourse - 2016: $330; 2015: $487) | 20,456 | 16,215 | |||||
Other Noncurrent Liabilities | |||||||
Deferred income tax liabilities | 923 | 587 | |||||
Pension and other postretirement benefits - noncurrent | 11,375 | 9,119 | |||||
Asbestos-related liabilities - noncurrent | 1,364 | 387 | |||||
Other noncurrent obligations | 5,560 | 4,332 | |||||
Total other noncurrent liabilities | 19,222 | 14,425 | |||||
Stockholders’ Equity | |||||||
Preferred stock, series A (issued $1.00 par, $1,000 liquidation preference; outstanding 2016: zero; 2015: 4,000,000 shares) | — | 4,000 | |||||
Common stock (authorized 1,500,000,000 shares of $2.50 par value each; issued 2016: 1,242,794,836 shares; 2015: 1,242,794,836 shares) | 3,107 | 3,107 | |||||
Additional paid-in capital | 4,262 | 4,936 | |||||
Retained earnings | 30,338 | 28,425 | |||||
Accumulated other comprehensive loss | (9,822 | ) | (8,667 | ) | |||
Unearned ESOP shares | (239 | ) | (272 | ) | |||
Treasury stock at cost (2016: 31,661,501 shares; 2015: 125,853,161 shares) | (1,659 | ) | (6,155 | ) | |||
The Dow Chemical Company’s stockholders’ equity | 25,987 | 25,374 | |||||
Noncontrolling interests | 1,242 | 809 | |||||
Total equity | 27,229 | 26,183 | |||||
Total Liabilities and Equity | $ | 79,511 | $ | 67,938 | |||
See Notes to the Consolidated Financial Statements.
71
The Dow Chemical Company and Subsidiaries
Consolidated Statements of Cash Flows
(In millions) For the years ended December 31 | 2016 | 2015 | 2014 | ||||||||
Operating Activities | |||||||||||
Net income | $ | 4,404 | $ | 7,783 | $ | 3,839 | |||||
Adjustments to reconcile net income to net cash provided by operating activities: | |||||||||||
Depreciation and amortization | 2,862 | 2,521 | 2,747 | ||||||||
Provision (Credit) for deferred income tax | (1,259 | ) | 305 | 466 | |||||||
Earnings of nonconsolidated affiliates less than dividends received | 243 | 142 | 121 | ||||||||
Pension contributions | (629 | ) | (844 | ) | (815 | ) | |||||
Net gain on sales of investments | (116 | ) | (95 | ) | (76 | ) | |||||
Net gain on sales of property, businesses and consolidated companies | (88 | ) | (3,811 | ) | (45 | ) | |||||
Net (gain) loss on sales of ownership interests in nonconsolidated affiliates | (10 | ) | (749 | ) | 1 | ||||||
Net gain on step acquisition of nonconsolidated affiliates | (2,445 | ) | (361 | ) | — | ||||||
Goodwill and other intangible asset impairment losses | — | — | 50 | ||||||||
Asset impairments and related costs | 143 | 144 | 23 | ||||||||
Restructuring charges (credits) | 452 | 415 | (3 | ) | |||||||
Loss on early extinguishment of debt | — | 8 | — | ||||||||
Asbestos-related charge | 1,113 | — | 78 | ||||||||
Excess tax benefits from share-based payment arrangements | (57 | ) | (41 | ) | (42 | ) | |||||
Other net loss | 113 | 172 | 70 | ||||||||
Changes in assets and liabilities, net of effects of acquired and divested companies: | |||||||||||
Accounts and notes receivable | (1,539 | ) | (84 | ) | (884 | ) | |||||
Proceeds from interests in trade accounts receivable conduits | 1,257 | 1,034 | 1,079 | ||||||||
Inventories | 610 | 780 | 224 | ||||||||
Accounts payable | 458 | (681 | ) | (79 | ) | ||||||
Other assets and liabilities | (34 | ) | 878 | (252 | ) | ||||||
Cash provided by operating activities | 5,478 | 7,516 | 6,502 | ||||||||
Investing Activities | |||||||||||
Capital expenditures | (3,804 | ) | (3,703 | ) | (3,572 | ) | |||||
Investment in gas field developments | (113 | ) | — | — | |||||||
Construction of assets pending sale / leaseback | (63 | ) | — | (48 | ) | ||||||
Proceeds from sale / leaseback of assets | 87 | 3 | 470 | ||||||||
Payment into escrow account | (835 | ) | — | — | |||||||
Distribution from escrow account | 835 | — | — | ||||||||
Proceeds from sales of property, businesses and consolidated companies, net of cash divested | 284 | 2,383 | 119 | ||||||||
Acquisitions of property, businesses and consolidated companies, net of cash acquired | (187 | ) | (123 | ) | — | ||||||
Purchases of previously leased assets | — | (46 | ) | — | |||||||
Cash acquired in step acquisition of nonconsolidated affiliate | 1,050 | — | — | ||||||||
Investments in consolidated companies, net of cash acquired | — | — | (5 | ) | |||||||
Investments in and loans to nonconsolidated affiliates | (1,020 | ) | (803 | ) | (270 | ) | |||||
Distributions and loan repayments from nonconsolidated affiliates | 109 | 17 | 69 | ||||||||
Proceeds from sales of ownership interests in nonconsolidated affiliates | 22 | 1,528 | 8 | ||||||||
Purchases of investments | (577 | ) | (1,246 | ) | (643 | ) | |||||
Proceeds from sales and maturities of investments | 733 | 640 | 767 | ||||||||
Cash used in investing activities | (3,479 | ) | (1,350 | ) | (3,105 | ) | |||||
Financing Activities | |||||||||||
Changes in short-term notes payable | (33 | ) | (82 | ) | 74 | ||||||
Proceeds from issuance of long-term debt | 32 | 1,383 | 2,448 | ||||||||
Payments on long-term debt | (588 | ) | (1,114 | ) | (747 | ) | |||||
Purchases of treasury stock | (916 | ) | (1,166 | ) | (4,193 | ) | |||||
Proceeds from issuance of common stock | — | — | 679 | ||||||||
Proceeds from sales of common stock | 398 | 508 | 269 | ||||||||
Transaction financing, debt issuance and other costs | (2 | ) | (88 | ) | (20 | ) | |||||
Excess tax benefits from share-based payment arrangements | 57 | 41 | 42 | ||||||||
Distributions to noncontrolling interests | (176 | ) | (112 | ) | (91 | ) | |||||
Contributions from noncontrolling interests | — | 17 | 36 | ||||||||
Purchases of noncontrolling interests | (202 | ) | (175 | ) | (60 | ) | |||||
Dividends paid to stockholders | (2,462 | ) | (2,253 | ) | (2,020 | ) | |||||
Cash used in financing activities | (3,892 | ) | (3,041 | ) | (3,583 | ) | |||||
Effect of Exchange Rate Changes on Cash | (77 | ) | (202 | ) | (100 | ) | |||||
Summary | |||||||||||
Increase (decrease) in cash and cash equivalents | (1,970 | ) | 2,923 | (286 | ) | ||||||
Cash and cash equivalents at beginning of year | 8,577 | 5,654 | 5,940 | ||||||||
Cash and cash equivalents at end of year | $ | 6,607 | $ | 8,577 | $ | 5,654 | |||||
See Notes to the Consolidated Financial Statements.
72
The Dow Chemical Company and Subsidiaries
Consolidated Statements of Equity
(In millions, except per share amounts) For the years ended December 31 | 2016 | 2015 | 2014 | ||||||||
Preferred Stock | |||||||||||
Balance at beginning of year | $ | 4,000 | $ | 4,000 | $ | 4,000 | |||||
Preferred stock converted to common stock | (4,000 | ) | — | — | |||||||
Balance at end of year | — | 4,000 | 4,000 | ||||||||
Common Stock | |||||||||||
Balance at beginning of year | 3,107 | 3,107 | 3,054 | ||||||||
Common stock issued | — | — | 53 | ||||||||
Balance at end of year | 3,107 | 3,107 | 3,107 | ||||||||
Additional Paid-in Capital | |||||||||||
Balance at beginning of year | 4,936 | 4,846 | 3,928 | ||||||||
Common stock issued / sold | 398 | 508 | 895 | ||||||||
Stock-based compensation and allocation of ESOP shares | (376 | ) | (429 | ) | 30 | ||||||
Preferred stock converted to common stock | (695 | ) | — | — | |||||||
Other | (1 | ) | 11 | (7 | ) | ||||||
Balance at end of year | 4,262 | 4,936 | 4,846 | ||||||||
Retained Earnings | |||||||||||
Balance at beginning of year | 28,425 | 23,045 | 21,407 | ||||||||
Net income available for The Dow Chemical Company common stockholders | 3,978 | 7,345 | 3,432 | ||||||||
Dividends declared on common stock (per share - 2016: $1.84; 2015: $1.72; 2014: $1.53) | (2,037 | ) | (1,942 | ) | (1,777 | ) | |||||
Dividend equivalents on participating securities | (28 | ) | (23 | ) | (17 | ) | |||||
Balance at end of year | 30,338 | 28,425 | 23,045 | ||||||||
Accumulated Other Comprehensive Loss | |||||||||||
Balance at beginning of year | (8,667 | ) | (8,017 | ) | (4,827 | ) | |||||
Other comprehensive loss | (1,155 | ) | (650 | ) | (3,190 | ) | |||||
Balance at end of year | (9,822 | ) | (8,667 | ) | (8,017 | ) | |||||
Unearned ESOP Shares | |||||||||||
Balance at beginning of year | (272 | ) | (325 | ) | (357 | ) | |||||
Shares acquired | (18 | ) | — | (11 | ) | ||||||
Shares allocated to ESOP participants | 51 | 53 | 43 | ||||||||
Balance at end of year | (239 | ) | (272 | ) | (325 | ) | |||||
Treasury Stock | |||||||||||
Balance at beginning of year | (6,155 | ) | (4,233 | ) | (307 | ) | |||||
Purchases | (916 | ) | (2,688 | ) | (4,193 | ) | |||||
Issuances - compensation plans | 717 | 766 | 267 | ||||||||
Issuances - Preferred stock converted to common stock | 4,695 | — | — | ||||||||
Balance at end of year | (1,659 | ) | (6,155 | ) | (4,233 | ) | |||||
The Dow Chemical Company’s Stockholders’ Equity | 25,987 | 25,374 | 22,423 | ||||||||
Noncontrolling Interests | 1,242 | 809 | 931 | ||||||||
Total Equity | $ | 27,229 | $ | 26,183 | $ | 23,354 | |||||
73
The Dow Chemical Company and Subsidiaries |
Notes to the Consolidated Financial Statements |
Table of Contents
Note | Page | |
1 | ||
2 | ||
3 | ||
4 | ||
5 | ||
6 | ||
7 | ||
8 | ||
9 | ||
10 | ||
11 | ||
12 | ||
13 | ||
14 | ||
15 | ||
16 | ||
17 | ||
18 | ||
19 | ||
20 | ||
21 | ||
22 | ||
23 | ||
24 | ||
25 | ||
26 | ||
27 | ||
NOTE 1 – SUMMARY OF SIGNIFICANT ACCOUNTING POLICIES
Principles of Consolidation and Basis of Presentation
The accompanying consolidated financial statements of The Dow Chemical Company and its subsidiaries (“Dow” or the “Company”) were prepared in accordance with accounting principles generally accepted in the United States of America (“U.S. GAAP”) and include the assets, liabilities, revenues and expenses of all majority-owned subsidiaries over which the Company exercises control and, when applicable, entities for which the Company has a controlling financial interest or is the primary beneficiary. Intercompany transactions and balances are eliminated in consolidation. Investments in nonconsolidated affiliates (20-50 percent owned companies, joint ventures and partnerships) are accounted for using the equity method.
Adoption of Accounting Standards Update ("ASU") 2015-17, "Income Taxes (Topic 740): Balance Sheet Classification of Deferred Taxes" and Other Prior Year Balance Sheet and Footnote Changes
In the first quarter of 2016, the Company early adopted ASU 2015-17. The Company elected to apply the new guidance on a retrospective basis and, as a result, changes have been made to the presentation of deferred income tax assets and liabilities in the consolidated balance sheets at December 31, 2015. See Note 2 for additional information. A change was also made to the prior year consolidated balance sheets to reclassify prepaid tax assets of $293 million to "Other current assets." In addition, a change was made to the prior year consolidated balance sheets to reclassify $51 million from "Asbestos-related insurance receivables - noncurrent" to "Noncurrent receivables." The change was made to conform with current year presentation. A summary of the changes made to the consolidated balance sheets at December 31, 2015, is included in the table that follows.
74
Summary of Changes to the Consolidated Balance Sheets at December 31, 2015 | |||||||
In millions | As Filed | Updated | |||||
Deferred income tax assets - current | $ | 827 | $ | — | |||
Other current assets | $ | 354 | $ | 647 | |||
Total current assets | $ | 24,475 | $ | 23,941 | |||
Noncurrent receivables | $ | 765 | $ | 816 | |||
Total investments | $ | 7,646 | $ | 7,697 | |||
Deferred income tax assets - noncurrent | $ | 1,694 | $ | 2,140 | |||
Asbestos-related insurance receivables - noncurrent | $ | 51 | $ | — | |||
Total other assets | $ | 18,051 | $ | 18,446 | |||
Total Assets | $ | 68,026 | $ | 67,938 | |||
Deferred income tax liabilities - current | $ | 100 | $ | — | |||
Total current liabilities | $ | 11,215 | $ | 11,115 | |||
Deferred income tax liabilities - noncurrent | $ | 575 | $ | 587 | |||
Total other noncurrent liabilities | $ | 14,413 | $ | 14,425 | |||
Total Liabilities and Equity | $ | 68,026 | $ | 67,938 | |||
Certain reclassifications of prior years' footnote disclosure amounts have been made to conform to the 2016 presentation.
Change in Method of Accounting for Asbestos-Related Matters - Legal Costs
In September 2014, Union Carbide Corporation ("Union Carbide"), a wholly owned subsidiary of the Company, began to implement a strategy designed to reduce and to ultimately stabilize and forecast defense and processing costs associated with asbestos-related matters. The strategy included a number of important changes including: invoicing protocols including capturing costs by plaintiff and review of existing counsel roles, work processes and workflow. Union Carbide also began utilizing enterprise legal management software, which enabled claim-specific tracking of asbestos-related defense costs. Union Carbide reviewed the information generated from this new strategy and determined that it now had the ability to reasonably estimate asbestos-related defense and processing costs for the same periods that it estimates asbestos-related resolution costs for pending and future claims. Union Carbide believes that including estimates of the liability for asbestos-related defense and processing costs provides a more complete assessment and measure of the liability associated with resolving asbestos-related matters, which Union Carbide and the Company believe is preferable in these circumstances.
In the fourth quarter of 2016, the Company elected to change its method of accounting for Union Carbide's asbestos-related defense and processing costs from expensing as incurred to estimating and accruing a liability. The Company believes this change is preferable as asbestos-related defense and processing costs represent expenditures related to legacy activities that do not contribute to current or future revenue generating activities. The change is also reflective of the manner in which Union Carbide manages the asbestos-related exposure, including careful monitoring of the correlation between defense spending and resolution costs. Together, these two sources of cost more accurately represent the “total cost” of resolving asbestos-related claims now and in the future.
In the fourth quarter of 2016, the Company added a new accounting policy for asbestos-related matters and updated its existing accounting policy for legal costs, as follows:
Asbestos-Related Matters
Accruals for asbestos-related matters, including defense and processing costs, are recorded based on an analysis of claim and resolution activity, defense spending, and pending and future claims. These accruals are assessed at each balance sheet date to determine if the asbestos-related liability remains appropriate. Accruals for asbestos-related matters are included in the consolidated balance sheets in “Accrued and other current liabilities” and “Asbestos-related liabilities - noncurrent.”
Legal Costs
The Company expenses legal costs as incurred, with the exception of defense and processing costs associated with asbestos-related matters.
This accounting policy change has been reflected as a change in accounting estimate effected by a change in accounting principle. As a result of this accounting policy change, the Company recorded a pretax charge for asbestos-related defense and processing costs of $1,009 million in the fourth quarter of 2016, included in “Asbestos-related charge” in the consolidated statements of income (after-tax loss of $636 million or $0.57 per share). The Company’s total asbestos-related liability, including defense and processing costs, was $1,490 million at December 31, 2016, and is included in “Accrued and other
75
current liabilities” and “Asbestos-related liabilities - noncurrent” in the consolidated balance sheets. See Note 15 for additional information.
Use of Estimates in Financial Statement Preparation
The preparation of financial statements in accordance with U.S. GAAP requires the use of estimates and assumptions that affect the reported amounts of assets and liabilities, the disclosure of contingent assets and liabilities at the date of the financial statements, and the reported amounts of revenues and expenses during the reporting period. The Company’s consolidated financial statements include amounts that are based on management’s best estimates and judgments. Actual results could differ from those estimates.
Foreign Currency Translation
The local currency has been primarily used as the functional currency throughout the world. Translation gains and losses of those operations that use local currency as the functional currency are included in the consolidated balance sheets in "Accumulated other comprehensive loss" ("AOCL"). For certain subsidiaries, the U.S. dollar is used as the functional currency. This occurs when the subsidiary operates in an economic environment where the products produced and sold are tied to U.S. dollar-denominated markets, or when the foreign subsidiary operates in a hyper-inflationary environment. Where the U.S. dollar is used as the functional currency, foreign currency translation gains and losses are reflected in income.
Environmental Matters
Accruals for environmental matters are recorded when it is probable that a liability has been incurred and the amount of the liability can be reasonably estimated based on current law and existing technologies. These accruals are adjusted periodically as assessment and remediation efforts progress or as additional technical or legal information becomes available. Accruals for environmental liabilities are included in the consolidated balance sheets in “Accrued and other current liabilities” and “Other noncurrent obligations” at undiscounted amounts. Accruals for related insurance or other third-party recoveries for environmental liabilities are recorded when it is probable that a recovery will be realized and are included in the consolidated balance sheets as “Accounts and notes receivable - Other.”
Environmental costs are capitalized if the costs extend the life of the property, increase its capacity, and/or mitigate or prevent contamination from future operations. Environmental costs are also capitalized in recognition of legal asset retirement obligations resulting from the acquisition, construction and/or normal operation of a long-lived asset. Costs related to environmental contamination treatment and cleanup are charged to expense. Estimated future incremental operations, maintenance and management costs directly related to remediation are accrued when such costs are probable and reasonably estimable.
Cash and Cash Equivalents
Cash and cash equivalents include time deposits and investments with maturities of three months or less at the time of purchase.
Financial Instruments
The Company calculates the fair value of financial instruments using quoted market prices whenever available. When quoted market prices are not available for various types of financial instruments (such as forwards, options and swaps), the Company uses standard pricing models with market-based inputs that take into account the present value of estimated future cash flows.
The Company utilizes derivatives to manage exposures to foreign currency exchange rates, commodity prices and interest rate risk. The fair values of all derivatives are recognized as assets or liabilities at the balance sheet date. Changes in the fair value of these instruments are reported in income or AOCL, depending on the use of the derivative and whether it qualifies for hedge accounting treatment.
Gains and losses on derivatives that are designated and qualify as cash flow hedging instruments are recorded in AOCL, to the extent the hedges are effective, until the underlying transactions are recognized in income. To the extent effective, gains and losses on derivative and nonderivative instruments used as hedges of the Company’s net investment in foreign operations are recorded in AOCL as part of the cumulative translation adjustment. The ineffective portions of cash flow hedges and hedges of net investment in foreign operations, if any, are recognized in income immediately.
Gains and losses on derivatives designated and qualifying as fair value hedging instruments, as well as the offsetting losses and gains on the hedged items, are reported in income in the same accounting period. Derivatives not designated as hedging instruments are marked-to-market at the end of each accounting period with the results included in income.
76
Inventories
Inventories are stated at the lower of cost or market. The method of determining cost for each subsidiary varies among last-in, first-out (“LIFO”); first-in, first-out (“FIFO”); and average cost, and is used consistently from year to year.
The Company routinely exchanges and swaps raw materials and finished goods with other companies to reduce delivery time, freight and other transportation costs. These transactions are treated as non-monetary exchanges and are valued at cost.
Property
Land, buildings and equipment, including property under capital lease agreements, are carried at cost less accumulated depreciation. Depreciation is based on the estimated service lives of depreciable assets and is calculated using the straight-line method, unless the asset was capitalized before 1997 when the declining balance method was used. Fully depreciated assets are retained in property and accumulated depreciation accounts until they are removed from service. In the case of disposals, assets and related accumulated depreciation are removed from the accounts, and the net amounts, less proceeds from disposal, are included in income.
Impairment and Disposal of Long-Lived Assets
The Company evaluates long-lived assets and certain identifiable intangible assets for impairment whenever events or changes in circumstances indicate that the carrying amount of an asset may not be recoverable. When undiscounted future cash flows are not expected to be sufficient to recover an asset’s carrying amount, the asset is written down to its fair value based on bids received from third parties or a discounted cash flow analysis based on market participant assumptions.
Long-lived assets to be disposed of by sale, if material, are classified as held for sale and reported at the lower of carrying amount or fair value less cost to sell, and depreciation is ceased. Long-lived assets to be disposed of other than by sale are classified as held and used until they are disposed of and reported at the lower of carrying amount or fair value, and depreciation is recognized over the remaining useful life of the assets.
Goodwill and Other Intangible Assets
The Company records goodwill when the purchase price of a business combination exceeds the estimated fair value of net identified tangible and intangible assets acquired. Goodwill is tested for impairment at the reporting unit level annually, or more frequently when events or changes in circumstances indicate that the fair value of a reporting unit has more likely than not declined below its carrying value. When testing goodwill for impairment, the Company may first assess qualitative factors. If an initial qualitative assessment identifies that it is more likely than not that the carrying value of a reporting unit exceeds its estimated fair value, additional quantitative testing is performed. The Company may also elect to skip the qualitative testing and proceed directly to the quantitative testing. If the quantitative testing indicates that goodwill is impaired, the carrying value of goodwill is written down to fair value. The Company primarily utilizes a discounted cash flow methodology to calculate the fair value of its reporting units. See Note 10 for further information on goodwill.
Finite-lived intangible assets such as purchased customer lists, licenses, intellectual property, patents, trademarks and software, are amortized over their estimated useful lives, generally on a straight-line basis for periods ranging primarily from three to twenty years. Intangible assets are reviewed for impairment or obsolescence annually, or more frequently when events or changes in circumstances indicate that the carrying amount of an intangible asset may not be recoverable. If impaired, intangible assets are written down to fair value based on discounted cash flows.
Asset Retirement Obligations
The Company records asset retirement obligations as incurred and reasonably estimable, including obligations for which the timing and/or method of settlement are conditional on a future event that may or may not be within the control of the Company. The fair values of obligations are recorded as liabilities on a discounted basis and are accreted over time for the change in present value. Costs associated with the liabilities are capitalized and amortized over the estimated remaining useful life of the asset, generally for periods of 10 years or less.
Investments
Investments in debt and marketable equity securities (including warrants), primarily held by the Company’s insurance operations, are classified as trading, available-for-sale or held-to-maturity. Investments classified as trading are reported at fair value with unrealized gains and losses related to mark-to-market adjustments included in income. Those classified as available-for-sale are reported at fair value with unrealized gains and losses recorded in AOCL. Those classified as held-to-maturity are recorded at amortized cost. The cost of investments sold is determined by FIFO or specific identification. The Company routinely reviews available-for-sale and held-to-maturity securities for other-than-temporary declines in fair value below the cost basis. When events or changes in circumstances indicate the carrying value of an asset may not be recoverable, the security is written down to fair value, establishing a new cost basis.
77
Revenue
Sales are recognized when the revenue is realized or realizable, and the earnings process is complete. Approximately 99 percent of the Company’s sales in 2016 related to sales of product (99 percent in 2015 and 99 percent in 2014). The remaining 1 percent in 2016 primarily related to the Company’s insurance operations and licensing of patents and technology (1 percent in 2015 and 1 percent in 2014). Revenue for product sales is recognized as risk and title to the product transfer to the customer, which usually occurs at the time shipment is made. As such, title to the product passes when the product is delivered to the freight carrier. Dow’s standard terms of delivery are included in its contracts of sale, order confirmation documents and invoices. Freight costs and any directly related costs of transporting finished product to customers are recorded as “Cost of sales” in the consolidated statements of income.
Revenue related to the Company’s insurance operations includes third-party insurance premiums, which are earned over the terms of the related insurance policies and reinsurance contracts. Revenue related to the initial licensing of patents and technology is recognized when earned; revenue related to running royalties is recognized according to licensee production levels.
Severance Costs
The Company routinely reviews its operations around the world in an effort to ensure competitiveness across its businesses and geographic areas. When the reviews result in a workforce reduction related to the shutdown of facilities or other optimization activities, severance benefits are provided to employees primarily under Dow’s ongoing benefit arrangements. These severance costs are accrued once management commits to a plan of termination including the number of employees to be terminated, their job classifications or functions, their locations and the expected termination date.
Income Taxes
The Company accounts for income taxes using the asset and liability method. Under this method, deferred tax assets and liabilities are recognized for the future tax consequences of temporary differences between the carrying amounts and tax bases of assets and liabilities using enacted tax rates. The effect of a change in tax rates on deferred tax assets or liabilities is recognized in income in the period that includes the enactment date.
Annual tax provisions include amounts considered sufficient to pay assessments that may result from examinations of prior year tax returns; however, the amount ultimately paid upon resolution of issues raised may differ from the amounts accrued.
The Company recognizes the financial statement effects of an uncertain income tax position when it is more likely than not, based on the technical merits, that the position will be sustained upon examination. The Company accrues for other tax contingencies when it is probable that a liability to a taxing authority has been incurred and the amount of the contingency can be reasonably estimated. The current portion of uncertain income tax positions is included in “Income taxes payable” and the long-term portion is included in “Other noncurrent obligations” in the consolidated balance sheets.
Provision is made for taxes on undistributed earnings of foreign subsidiaries and related companies to the extent that such earnings are not deemed to be permanently invested.
Earnings per Common Share
The calculation of earnings per common share is based on the weighted-average number of the Company’s common shares outstanding for the applicable period. The calculation of diluted earnings per common share reflects the effect of all dilutive potential common shares that were outstanding during the respective periods, unless the effect of doing so is antidilutive.
78
NOTE 2 – RECENT ACCOUNTING GUIDANCE
Recently Adopted Accounting Guidance
In the fourth quarter of 2015, the Company adopted ASU 2015-03, "Interest - Imputation of Interest (Subtopic 835-30): Simplifying the Presentation of Debt Issuance Costs," which requires debt issuance costs to be presented in the balance sheet as a direct deduction from the carrying value of the associated debt liability, and amortization of those costs should be reported as interest expense. This ASU was effective for annual and interim periods beginning after December 15, 2015, and early adoption was permitted for financial statements that had not been previously issued. The new guidance required retrospective application for each period presented in the balance sheet. This change is reflected in "Other current assets," "Deferred charges and other assets," "Long-term debt due within one year" and "Long-Term Debt" in the consolidated balance sheets on a retrospective basis and did not have a material impact on the consolidated financial statements.
In the first quarter of 2016, the Company early adopted ASU 2015-17, "Income Taxes (Topic 740): Balance Sheet Classification of Deferred Taxes," which simplifies the presentation of deferred income taxes by requiring that deferred tax liabilities and assets be classified as noncurrent in a classified statement of financial position. This ASU was effective for financial statements issued for annual periods beginning after December 15, 2016, and interim periods within those annual periods, and may be applied prospectively or retrospectively, and early adoption was permitted. The change is reflected in "Deferred income tax assets" and "Deferred income tax liabilities" in the consolidated balance sheets on a retrospective basis and did not have a material impact on the consolidated financial statements. See Note 1 for additional information.
Accounting Guidance Issued But Not Adopted as of December 31, 2016
In May 2014, the Financial Accounting Standards Board ("FASB") issued ASU 2014-09, "Revenue from Contracts with Customers (Topic 606)," which is the new comprehensive revenue recognition standard that will supersede all existing revenue recognition guidance under U.S. GAAP. The standard's core principle is that a company will recognize revenue when it transfers promised goods or services to a customer in an amount that reflects the consideration to which the company expects to be entitled in exchange for those goods or services. ASU 2015-14, "Revenue from Contracts with Customers (Topic 606): Deferral of the Effective Date," which was issued in August 2015, revised the effective date for this ASU to annual and interim periods beginning on or after December 15, 2017, with early adoption permitted, but not earlier than the original effective date of annual and interim periods beginning on or after December 15, 2016, for public entities. Entities will have the option of using either a full retrospective approach or a modified approach to adopt the guidance in ASU 2014-09.
In May 2014, the FASB and International Accounting Standards Board formed The Joint Transition Resource Group for Revenue Recognition ("TRG"), consisting of financial statement preparers, auditors and users, to seek feedback on potential issues related to the implementation of the new revenue standard. As a result of feedback from the TRG, the FASB has issued additional guidance to provide clarification, implementation guidance and practical expedients to address some of the challenges of implementation. In March 2016, the FASB issued ASU 2016-08, "Revenue from Contracts with Customers (Topic 606): Principal versus Agent Considerations (Reporting Revenue Gross versus Net)," which is an amendment on assessing whether an entity is a principal or an agent in a revenue transaction. This amendment addresses issues to clarify the principal versus agent assessment and lead to more consistent application. In April 2016, the FASB issued ASU 2016-10, "Revenue from Contracts with Customers (Topic 606): Identifying Performance Obligations and Licensing," which contains amendments to the new revenue recognition standard on identifying performance obligations and accounting for licenses of intellectual property. The amendments related to identifying performance obligations clarify when a promised good or service is separately identifiable and allows entities to disregard items that are immaterial in the context of a contract. The licensing implementation amendments clarify how an entity should evaluate the nature of its promise in granting a license of intellectual property, which will determine whether revenue is recognized over time or at a point in time. In May 2016, the FASB issued ASU 2016-12, "Revenue from Contracts with Customers (Topic 606): Narrow-Scope Improvements and Practical Expedients," which provides clarity and implementation guidance on assessing collectibility, presentation of sales taxes, noncash consideration, and completed contracts and contract modifications at transition. The new standards have the same effective date and transition requirements as ASU 2014-09.
The Company has a team in place to analyze the impact of ASU 2014-09, and the related ASU's, across all revenue streams to evaluate the impact of the new standard on revenue contracts. This includes reviewing current accounting policies and practices to identify potential differences that would result from applying the requirements under the new standard. In 2016, the Company made significant progress on contract reviews and expects to complete the contract evaluations and validate results by the end of the first quarter of 2017. The Company has also started drafting its accounting policies and evaluating the new disclosure requirements and expects to complete its evaluations of the impacts of the accounting and disclosure requirements on its business processes, controls and systems by the end of the second quarter of 2017. Full implementation will be completed by the end of 2017. Based on analysis completed to date, the Company expects the potential impact on accounting for product sales and licensing arrangements to remain substantially unchanged. The Company expects to adopt the new
79
standard using the modified retrospective approach, under which the cumulative effect of initially applying the new guidance is recognized as an adjustment to the opening balance of retained earnings in the first quarter of 2018.
In July 2015, the FASB issued ASU 2015-11, "Inventory (Topic 330): Simplifying the Measurement of Inventory," which applies to inventory that is measured using FIFO or average cost. Under the updated guidance, an entity should measure inventory that is within scope at the lower of cost and net realizable value, which is the estimated selling prices in the ordinary course of business, less reasonably predictable costs of completion, disposal and transportation. Subsequent measurement is unchanged for inventory that is measured using LIFO. This ASU is effective for annual and interim periods beginning after December 15, 2016, and should be applied prospectively with early adoption permitted at the beginning of an interim or annual reporting period. The Company will adopt the new guidance in the first quarter of 2017, and the adoption of this guidance will not have a material impact on the consolidated financial statements.
In January 2016, the FASB issued ASU 2016-01, "Financial Instruments - Overall (Subtopic 825-10): Recognition and Measurement of Financial Assets and Financial Liabilities," which amends the guidance in U.S. GAAP on the classification and measurement of financial instruments. Changes to the current guidance primarily affects the accounting for equity investments, financial liabilities under the fair value option, and the presentation and disclosure requirements for financial instruments. In addition, the ASU clarifies guidance related to the valuation allowance assessment when recognizing deferred tax assets resulting from unrealized losses on available-for-sale debt securities. The new standard is effective for fiscal years and interim periods beginning after December 15, 2017, and upon adoption, an entity should apply the amendments by means of a cumulative-effect adjustment to the balance sheet at the beginning of the first reporting period in which the guidance is effective. Early adoption is not permitted except for the provision to record fair value changes for financial liabilities under the fair value option resulting from instrument-specific credit risk in other comprehensive income. The Company is currently evaluating the impact of adopting this guidance.
In February 2016, the FASB issued ASU 2016-02, "Leases (Topic 842)," which requires organizations that lease assets to recognize on the balance sheet the assets and liabilities for the rights and obligations created by those leases. The new guidance requires that a lessee recognize assets and liabilities for leases with lease terms of more than twelve months and recognition, presentation and measurement in the financial statements will depend on its classification as a finance or operating lease. In addition, the new guidance will require disclosures to help investors and other financial statement users better understand the amount, timing and uncertainty of cash flows arising from leases. Lessor accounting remains largely unchanged from current U.S. GAAP but does contain some targeted improvements to align with the new revenue recognition guidance issued in 2014. The new standard is effective for fiscal years, and interim periods within those fiscal years, beginning after December 15, 2018, using a modified retrospective approach, and early adoption is permitted. The Company is currently evaluating the impact of adopting this guidance.
In March 2016, the FASB issued ASU 2016-09, "Compensation - Stock Compensation (Topic 718): Improvements to Employee Share-Based Payment Accounting," which simplifies several aspects of the accounting for share-based payment awards to employees, including the accounting for income taxes, forfeitures, statutory tax withholding requirements and classification in the statement of cash flows. The new standard is effective for fiscal years, and interim periods within those fiscal years, beginning after December 15, 2016. Early adoption is permitted in any annual or interim period for which financial statements have not yet been issued, and all amendments in the ASU that apply must be adopted in the same period. The Company will adopt the new guidance in the first quarter of 2017. Under the new guidance, excess tax benefits related to equity compensation will be recognized in the "Provision for income taxes" in the consolidated statements of income rather than in "Additional paid-in capital" in the consolidated balance sheets and will be applied on a prospective basis. Changes to the statements of cash flows related to the classification of excess tax benefits and employee taxes paid for share-based payment arrangements will be implemented on a retrospective basis. The Company does not expect further impacts from the guidance.
In August 2016, the FASB issued ASU 2016-15, "Statement of Cash Flows (Topic 230): Classification of Certain Cash Receipts and Cash Payments," which addresses the diversity in practice in how certain cash receipts and cash payments are presented and classified in the statement of cash flows with respect to eight specific cash flow issues. The new standard is effective for fiscal years, and interim periods within those fiscal years, beginning after December 15, 2017. The amendments should be applied using a retrospective transition method to each period presented, if practicable. Early adoption is permitted, including adoption in an interim period, and any adjustments should be reflected as of the beginning of the fiscal year that includes the interim period. All amendments must be adopted in the same period. The Company is currently evaluating the impact of adopting this guidance.
In October 2016, the FASB issued ASU 2016-16, "Income Taxes (Topic 740): Intra-Entity Transfers of Assets Other Than Inventory," which requires an entity to recognize the income tax consequences of an intra-entity transfer of an asset other than inventory when the transfer occurs. The amendments are effective for fiscal years, and interim periods within those fiscal years,
80
beginning after December 15, 2017, and should be applied on a modified retrospective basis through a cumulative-effect adjustment directly to retained earnings at the beginning period of adoption. Early adoption is permitted in the first interim period of an annual reporting period for which financial statements have not been issued. The Company is currently evaluating the impact of adopting this guidance.
In November 2016, the FASB issued ASU 2016-18, "Statement of Cash Flows (Topic 230): Restricted Cash (a consensus of the FASB Emerging Issues Task Force)", which clarifies how entities should present restricted cash and restricted cash equivalents in the statement of cash flows, and, as a result, entities will no longer present transfers between cash and cash equivalents and restricted cash and restricted cash equivalents in the statement of cash flows. An entity with a material balance of restricted cash and restricted cash equivalents must disclose information about the nature of the restrictions. The new standard is effective for fiscal years, and interim periods within those fiscal years, beginning after December 15, 2017. Early adoption is permitted and the new guidance must be applied retrospectively to all periods presented. The Company is currently evaluating the impact of adopting this guidance.
In January 2017, the FASB issued ASU 2017-01, "Business Combinations (Topic 805): Clarifying the Definition of a Business," which provides guidance to entities to assist with evaluating when a set of transferred assets and activities (collectively, the "set") is a business and provides a screen to determine when a set is not a business. Under the new guidance, when substantially all of the fair value of gross assets acquired (or disposed of) is concentrated in a single identifiable asset, or group of similar assets, the assets acquired would not represent a business. Also, to be considered a business, an acquisition would have to include an input and a substantive process that together significantly contribute to the ability to produce outputs. The new standard is effective for fiscal years, and interim periods within those fiscal years, beginning after December 15, 2017, and should be applied on a prospective basis to any transactions occurring within the period of adoption. Early adoption is permitted for interim or annual periods in which the financial statements have not been issued. The Company is currently evaluating the impact of adopting this guidance.
In January 2017, the FASB issued ASU 2017-04, “Intangibles - Goodwill and Other (Topic 350): Simplifying the Test for Goodwill Impairment,” which eliminates the requirement to determine the fair value of individual assets and liabilities of a reporting unit to measure goodwill impairment. Under the amendments in the new ASU, goodwill impairment testing will be performed by comparing the fair value of the reporting unit with its carrying amount and recognizing an impairment charge for the amount by which the carrying amount exceeds the reporting unit’s fair value. The new standard is effective for annual and interim goodwill impairment tests in fiscal years beginning after December 15, 2019, and should be applied on a prospective basis. Early adoption is permitted for annual or interim goodwill impairment testing performed after January 1, 2017. The Company is currently evaluating the impact of adopting this guidance.
NOTE 3 – RESTRUCTURING
2016 Restructuring
On June 27, 2016, the Board of Directors of the Company approved a restructuring plan that incorporates actions related to the recent ownership restructure of Dow Corning Corporation ("Dow Corning"). These actions, aligned with Dow’s value growth and synergy targets, will result in a global workforce reduction of approximately 2,500 positions, with most of these positions resulting from synergies related to the Dow Corning transaction. These actions are expected to be substantially completed by June 30, 2018.
As a result of these actions, the Company recorded pretax restructuring charges of $449 million in the second quarter of 2016 consisting of severance charges of $268 million, asset write-downs and write-offs of $153 million and costs associated with exit and disposal activities of $28 million. The impact of these charges is shown as "Restructuring charges (credits)" in the consolidated statements of income and reflected in the Company's segment results in the table that follows. The table also summarizes the activities related to the Company's 2016 restructuring reserve, which is included in "Accrued and other current liabilities" and "Other noncurrent obligations" in the consolidated balance sheets.
81
2016 Restructuring Charges | Severance Costs | Impairment of Long-Lived Assets and Other Assets | Costs Associated with Exit and Disposal Activities | Total | ||||||||||||
In millions | ||||||||||||||||
Consumer Solutions | $ | — | $ | 23 | $ | 5 | $ | 28 | ||||||||
Infrastructure Solutions | — | 74 | 23 | 97 | ||||||||||||
Performance Plastics | — | 10 | — | 10 | ||||||||||||
Corporate | 268 | 46 | — | 314 | ||||||||||||
2016 restructuring charges | $ | 268 | $ | 153 | $ | 28 | $ | 449 | ||||||||
Charges against the reserve | — | (153 | ) | — | (153 | ) | ||||||||||
Cash payments | (67 | ) | — | (1 | ) | (68 | ) | |||||||||
Reserve balance at December 31, 2016 | $ | 201 | $ | — | $ | 27 | $ | 228 | ||||||||
Details regarding the components of the 2016 restructuring charge are discussed below:
Severance Costs
The restructuring charge included severance of $268 million for the separation of approximately 2,500 employees under the terms of the Company's ongoing benefit arrangements, primarily by June 30, 2018. These costs were charged against Corporate. At December 31, 2016, severance of $67 million was paid, leaving a liability of $201 million for approximately 1,700 employees.
Impairment of Long-Lived Assets and Other Assets
The restructuring charges related to the write-down and write-off of assets in the second quarter of 2016 totaled $153 million. Details regarding the write-downs and write-offs are as follows:
• | The Company recorded a charge of $70 million for asset write-downs and write-offs including the shutdown of an Energy & Water Solutions solar manufacturing facility in Midland, Michigan; the write-down of a solar facility in Milpitas, California; and, the write-off of capital projects and in-process research and development. The charge was reflected in the Infrastructure Solutions operating segment. The Midland facility was shut down in the third quarter of 2016. |
• | To enhance competitiveness and streamline costs associated with the ownership restructure of Dow Corning, silicones manufacturing facilities in Yamakita, Japan, and Greensboro, North Carolina, will be shut down by the end of 2018. In addition, an idled facility was shut down in the second quarter of 2016. As a result, the Company recorded a charge of $25 million, reflected in Consumer Solutions ($21 million) and Infrastructure Solutions ($4 million). |
• | The Company will close and/or consolidate certain corporate facilities and data centers. Write-downs of $25 million were charged against Corporate. These facilities will be shut down no later than the end of the second quarter of 2018. |
• | A decision was made to shut down a small manufacturing facility and to write-down other non-manufacturing assets, including a cost method investment and certain aircraft. Write-downs of $33 million were recorded, impacting Consumer Solutions ($2 million), Performance Plastics ($10 million) and Corporate ($21 million). The manufacturing facility was shut down in the second quarter of 2016. |
Costs Associated with Exit and Disposal Activities
The restructuring charges for cost associated with exit and disposal activities, including contract cancellation penalties, environmental remediation and warranty liabilities, totaled $28 million in the second quarter of 2016, impacting Consumer Solutions ($5 million) and Infrastructure Solutions ($23 million).
2015 Restructuring
On April 29, 2015, Dow's Board of Directors approved actions to further streamline the organization and optimize the Company’s footprint as a result of the separation of a significant portion of Dow’s chlorine value chain. These actions, which will further accelerate Dow’s value growth and productivity targets, will result in a reduction of approximately 1,750 positions across a number of businesses and functions and adjustments to the Company's asset footprint to enhance competitiveness. These actions are expected to be completed primarily by June 30, 2017.
As a result of these actions, the Company recorded pretax restructuring charges of $375 million in the second quarter of 2015 consisting of severance costs of $196 million, asset write-downs and write-offs of $169 million and costs associated with exit
82
and disposal activities of $10 million. In the fourth quarter of 2015, the Company recorded restructuring charge adjustments of $40 million, including severance costs of $39 million for the separation of approximately 500 additional positions as part of the Company's efforts to further streamline the organization, and $1 million of costs associated with exit and disposal activities. The impact of these charges is shown as "Restructuring charges (credits)" in the consolidated statements of income and reflected in the Company's segment results in the table that follows. The table also summarizes the activities related to the Company's 2015 restructuring reserve, which is included in "Accrued and other current liabilities" and "Other noncurrent obligations" in the consolidated balance sheets.
2015 Restructuring Charges | Impairment of Long-Lived Assets, Investments and Other Assets | Costs Associated with Exit and Disposal Activities | ||||||||||||||
In millions | Severance Costs | Total | ||||||||||||||
Agricultural Sciences | $ | — | $ | 8 | $ | 6 | $ | 14 | ||||||||
Consumer Solutions | — | 65 | 2 | 67 | ||||||||||||
Infrastructure Solutions | — | 25 | 2 | 27 | ||||||||||||
Performance Plastics | — | 12 | — | 12 | ||||||||||||
Corporate | 196 | 59 | — | 255 | ||||||||||||
2015 restructuring charges | $ | 196 | $ | 169 | $ | 10 | $ | 375 | ||||||||
Charges against the reserve | — | (169 | ) | — | (169 | ) | ||||||||||
Adjustments to the reserve | 39 | — | 1 | 40 | ||||||||||||
Impact of currency | — | — | (1 | ) | (1 | ) | ||||||||||
Cash payments | (92 | ) | — | — | (92 | ) | ||||||||||
Reserve balance at December 31, 2015 | $ | 143 | $ | — | $ | 10 | $ | 153 | ||||||||
Charges against the reserve | — | 3 | — | 3 | ||||||||||||
Adjustments to the reserve | — | (3 | ) | 6 | 3 | |||||||||||
Cash payments | (98 | ) | — | (8 | ) | (106 | ) | |||||||||
Reserve balance at December 31, 2016 | $ | 45 | $ | — | $ | 8 | $ | 53 | ||||||||
The Company also recorded $14 million of restructuring charges to "Net income attributable to noncontrolling interests" in the consolidated statements of income for the noncontrolling interests' portion of the charge.
Details regarding the components of the 2015 restructuring charges are discussed below:
Severance Costs
The restructuring charges recorded in the second quarter of 2015 included severance of $196 million for the separation of approximately 1,750 employees under the terms of the Company's ongoing benefit arrangements. In the fourth quarter of 2015, the Company recorded an additional charge of $39 million related to the separation of approximately 500 additional employees, primarily by June 30, 2017. These costs were charged against Corporate. At December 31, 2015, severance of $92 million was paid, leaving a liability of $143 million for approximately 1,250 employees. At December 31, 2016, severance of $190 million has been paid, leaving a liability of $45 million for approximately 290 employees.
Impairment of Long-Lived Assets, Investments and Other Assets
The restructuring charges related to the write-down and write-off of assets in the second quarter of 2015 totaled $169 million. Details regarding the write-downs and write-offs are as follows:
• | As a result of changing market dynamics in certain end-use markets, select manufacturing facilities and non-core assets aligned with the Dow Electronic Materials business were shut down in 2016. The assets impacted included certain display films and metalorganic precursors, including a metalorganic materials manufacturing site in North Andover, Massachusetts, and related operations in Taoyuan, Taiwan, as well as certain display films’ manufacturing assets aligned with SKC Haas Display Films Co., Ltd., a majority-owned joint venture located in Cheonan, South Korea. The Company recorded a $51 million charge for asset write-downs and write-offs in the Dow Electronic Materials business, which is reflected in the Consumer Solutions segment. |
• | The Company shut down and/or consolidated manufacturing capacity in the Dow Building & Construction business during 2016. As a result, the Company recorded a charge of $15 million for asset write-offs which is reflected in the Infrastructure Solutions segment. |
83
• | A Consumer Care manufacturing facility in Institute, West Virginia, was shut down in the fourth quarter of 2015. As a result, an asset write-down of $14 million was recorded against the Consumer Solutions segment. |
• | A Dow Packaging and Specialty Plastics plant in Schkopau, Germany, was permanently shut down in the second quarter of 2015, resulting in an asset write-off of $12 million against the Performance Plastics segment. |
• | Select operations in Agricultural Sciences were shut down, closed or idled in the second half of 2015, resulting in a pretax charge of $8 million for the write-down of assets. In the fourth quarter of 2015, the Company recorded an additional charge of $1 million related to the impairment of long-lived assets and other assets. |
• | A decision was made to shut down two small manufacturing facilities and an administrative facility to optimize the Company's asset footprint. Write-downs of $14 million were recorded impacting Infrastructure Solutions ($10 million) and Corporate ($4 million). The manufacturing facilities were shut down in 2015 and the administrative facility will be shut down no later than the second quarter of 2017. In the fourth quarter of 2015, the Company recorded a favorable adjustment to the restructuring charge related to the impairment of long-lived assets of $1 million, impacting Infrastructure Solutions. |
• | Due to a change in the Company's strategy to monetize and exit certain Venture Capital portfolio investments, a write-down of $55 million was recorded, reflected in Corporate. |
Costs Associated with Exit and Disposal Activities
The restructuring charges for costs associated with exit and disposal activities, primarily environmental remediation and contract penalties, totaled $10 million in the second quarter of 2015, impacting Agricultural Sciences ($6 million), Consumer Solutions ($2 million) and Infrastructure Solutions ($2 million). In the fourth quarter of 2015, the Company increased the restructuring reserve for costs associated with exit and disposal activities by $1 million, impacting Agricultural Sciences.
2016 Adjustments to the 2015 Restructuring
In 2016, the Company increased the 2015 restructuring reserve related to additional accruals for costs associated with exit and disposal activities by $6 million. In addition, a favorable adjustment was recorded for the impairment of long-lived assets of $3 million. The net change was included in "Restructuring charges (credits)" in the consolidated statements of income and reflected in Agricultural Sciences ($5 million charge), Consumer Solutions ($1 million charge) and Infrastructure Solutions ($3 million gain).
2014 Adjustments to the 4Q12 Restructuring Plan
In 2014, the Company reduced the 4Q12 Restructuring reserve related to contract cancellation fees by $3 million. The impact of this adjustment is shown as "Restructuring charges (credits)" in the consolidated statements of income and reflected in Performance Materials & Chemicals.
Dow expects to incur additional costs in the future related to its restructuring activities, as the Company continually looks for ways to enhance the efficiency and cost effectiveness of its operations, and to ensure competitiveness across its businesses and geographic areas. Future costs are expected to include demolition costs related to closed facilities and restructuring plan implementation costs; these costs will be recognized as incurred. The Company also expects to incur additional employee-related costs, including involuntary termination benefits, related to its other optimization activities. These costs cannot be reasonably estimated at this time.
NOTE 4 – ACQUISITIONS
Ownership Restructure of Dow Corning Corporation
On June 1, 2016, the Company announced the closing of the transaction with Corning Incorporated ("Corning"), Dow Corning and HS Upstate Inc., (“Splitco”), pursuant to which Corning exchanged with Dow Corning its 50 percent equity interest in Dow Corning for 100 percent of the stock of Splitco which held Corning's historical proportional interest in the Hemlock Semiconductor Group ("HSC Group") and approximately $4.8 billion in cash (the “DCC Transaction”). As a result of the DCC Transaction, Dow Corning, previously a 50:50 joint venture between Dow and Corning, became a wholly owned subsidiary of Dow. In connection with the DCC Transaction, on May 31, 2016, Dow Corning incurred $4.5 billion of indebtedness in order to fund the contribution of cash to Splitco. See Notes 9, 10, 17 and 20 for additional information.
At June 1, 2016, the Company's equity interest in Dow Corning, excluding the HSC Group, was $1,968 million and previously classified as "Investment in nonconsolidated affiliates" in the consolidated balance sheets. This equity interest was remeasured
84
to fair value. As a result, the Company recognized a non-taxable gain of $2,445 million in the second quarter of 2016, net of closing costs and other comprehensive loss related to the Company's interest in Dow Corning. The gain was included in "Sundry income (expense) - net" in the consolidated statements of income and reflected in the Consumer Solutions ($1,301 million) and Infrastructure Solutions ($1,144 million) segments. The Company recognized a tax benefit of $141 million on the DCC Transaction in the second quarter of 2016, primarily due to the reassessment of a previously recognized deferred tax liability related to the basis difference in the Company’s investment in Dow Corning.
The Company utilized an income approach with a discounted cash flow model to determine the enterprise fair value of Dow Corning. The valuation process resulted in an enterprise fair value of $9,636 million. The following table summarizes the fair values of Dow Corning's assets and liabilities, excluding the HSC Group, which are now fully consolidated by Dow. The valuation process was complete at December 31, 2016.
Assets Acquired and Liabilities Assumed on June 1, 2016 | |||
In millions | |||
Fair Value of Previously Held Equity Investment, excluding the HSC Group | $ | 4,818 | |
Fair Value of Assets Acquired | |||
Cash and cash equivalents | $ | 1,050 | |
Accounts and notes receivable - Trade | 647 | ||
Accounts and notes receivable - Other | 223 | ||
Inventories | 1,147 | ||
Other current assets | 51 | ||
Investment in nonconsolidated affiliates | 110 | ||
Noncurrent receivables | 112 | ||
Net property | 3,996 | ||
Other intangible assets (1) | 2,987 | ||
Deferred income tax assets | 999 | ||
Other assets | 98 | ||
Total Assets Acquired | $ | 11,420 | |
Fair Value of Liabilities Assumed | |||
Accounts payable - Trade | $ | 374 | |
Income taxes payable | 260 | ||
Accrued and other current liabilities | 404 | ||
Other current liabilities | 112 | ||
Long-Term Debt | 4,672 | ||
Deferred income tax liabilities | 1,858 | ||
Pension and other postretirement benefits - noncurrent (2) | 1,241 | ||
Other noncurrent obligations | 437 | ||
Total Liabilities Assumed | $ | 9,358 | |
Noncontrolling interests | $ | 473 | |
Goodwill | $ | 3,229 | |
(1) | Includes $30 million of trademarks, $1,200 million of licenses and intellectual property, $2 million of software and $1,755 million of customer-related intangibles. See Note 10 for additional information. |
(2) | Includes pension and other postretirement benefits as well as long-term disability obligations. |
The DCC Transaction resulted in the recognition of $3,229 million of goodwill which is not deductible for tax purposes. Goodwill largely consists of expected synergies resulting from the DCC Transaction. Cost synergies will be achieved through a combination of workforce consolidation and savings from actions such as harmonizing energy contracts at large sites, optimizing warehouse and logistics footprints, implementing materials and maintenance best practices, combining information technology service structures and leveraging existing research and development knowledge management systems. See Note 10 for additional information on goodwill, including the allocation by segment.
The fair value of "Accounts and notes receivables - Trade" acquired was $647 million, with gross contractual amounts receivable of $654 million. The fair value step-up in "Inventories" acquired was an increase of $317 million, which was expensed to "Cost of sales" over a three-month period beginning on June 1, 2016, and is reflected in the Consumer Solutions ($147 million) and Infrastructure Solutions ($170 million) segments. Liabilities assumed from Dow Corning on June 1, 2016, included certain contingent liabilities relating to breast implant and other product liability claims which were valued at $290 million and included in "Other noncurrent obligations" and commercial creditor issues which were valued at $105 million
85
and included in “Accrued and other current liabilities” in the consolidated balance sheets. See Note 15 for additional information on these contingent liabilities. Gross operating loss carryforwards of $568 million were assumed from Dow Corning on June 1, 2016. The operating loss carryforwards expire either in years beyond 2020 or have an indefinite carryforward period.
The following table summarizes the major classes of assets and liabilities underlying the deferred tax assets and liabilities resulting from the DCC Transaction:
Deferred Tax Balances at June 1, 2016 | Deferred Tax | Deferred Tax | ||||
In millions | Assets | Liabilities | ||||
Property | $ | 161 | $ | 762 | ||
Tax loss and credit carryforwards | 227 | — | ||||
Postretirement benefit obligations | 474 | — | ||||
Other accruals and reserves | 70 | 47 | ||||
Intangibles | 11 | 1,008 | ||||
Inventory | 2 | 33 | ||||
Long-term debt | 49 | — | ||||
Investments | 23 | 8 | ||||
Subtotal | $ | 1,017 | $ | 1,858 | ||
Valuation allowances | (18 | ) | — | |||
Total Deferred Tax Balances | $ | 999 | $ | 1,858 | ||
The Company evaluated the disclosure requirements under Accounting Standards Codification ("ASC") 805 "Business Combinations" and determined the DCC Transaction was not a material business combination for purposes of disclosing the revenue and earnings of Dow Corning since the date of the ownership restructure as well as supplemental pro forma information.
Beginning in June 2016, the results of Dow Corning, excluding the HSC Group, are fully consolidated in the Company’s consolidated statements of income. Prior to June 2016, the Company’s 50 percent share of Dow Corning’s results of operations was reported in “Equity in earnings of nonconsolidated affiliates” in the consolidated statements of income. The results of the HSC Group continue to be treated as an equity method investment and reported as “Equity in earnings of nonconsolidated affiliates” in the consolidated statements of income.
Acquisition of Cooperativa Central de Pesquisa Agrícola's Seed Business
On January 30, 2015, Dow AgroSciences LLC ("DAS") acquired Cooperativa Central de Pesquisa Agrícola's ("Coodetec") seed business for $169 million, of which $121 million was paid in 2015, $24 million was paid in 2016 and the remaining portion will be paid by the end of the first quarter of 2017. The acquisition of Coodetec's seed business is expected to advance the development of Dow AgroSciences' soybean program and strengthen the Company’s position in the corn market segment.
The following table summarizes the fair values of the assets acquired and liabilities assumed from Coodetec on January 30, 2015. The valuation process was complete at December 31, 2015.
Assets Acquired and Liabilities Assumed on January 30, 2015 | |||
In millions | |||
Purchase Price | $ | 169 | |
Fair Value of Assets Acquired | |||
Inventories | $ | 24 | |
Net property | 35 | ||
Other intangible assets (1) | 81 | ||
Total Assets Acquired | $ | 140 | |
Fair Value of Liabilities Assumed | |||
Accrued and other current liabilities | $ | 2 | |
Goodwill | $ | 31 | |
(1) | Includes $14 million of trademarks, $1 million of customer-related intangibles, $20 million of germplasm and $46 million of in-process research and development. See Note 10 for additional information. |
86
Step Acquisition of Univation Technologies, LLC
On May 5, 2015, Univation Technologies, LLC ("Univation"), previously a 50:50 joint venture between Dow and ExxonMobil Chemical Company ("ExxonMobil"), became a wholly owned subsidiary of Dow as a result of ExxonMobil redeeming its entire equity interest in Univation in exchange for certain assets and liabilities of Univation. The Company's equity interest in Univation of $159 million, previously classified as "Investment in nonconsolidated affiliates" in the consolidated balance sheets, was remeasured to fair value which resulted in a non-taxable gain of $361 million recognized in the second quarter of 2015, included in "Sundry income (expense) - net" in the consolidated statements of income and reflected in the Performance Plastics segment.
The following table summarizes the fair values of Univation's remaining assets and liabilities on May 5, 2015, which are fully consolidated by Dow. The valuation process was complete at December 31, 2015.
Assets Acquired and Liabilities Assumed on May 5, 2015 | |||
In millions | |||
Fair Value of Previously Held Equity Investment | $ | 520 | |
Fair Value of Assets Acquired | |||
Current assets | $ | 113 | |
Net property | 56 | ||
Other intangible assets (1) | 433 | ||
Total Assets Acquired | $ | 602 | |
Fair Value of Liabilities Assumed | |||
Current liabilities | $ | 102 | |
Long-Term Debt | 9 | ||
Deferred income tax liabilities | 126 | ||
Total Liabilities Assumed | $ | 237 | |
Goodwill (2) | $ | 141 | |
(1) | Includes $340 million of licenses and intellectual property, $5 million of software, $12 million of trademarks and $76 million of customer-related intangibles. See Note 10 for additional information. |
(2) | Net of a $14 million settlement of an affiliate's pre-existing obligations and not deductible for tax purposes. |
Beginning in May 2015, Univation's results of operations were fully consolidated in the Company's consolidated statements of income. Prior to May 2015, the Company's 50 percent share of Univation's results of operations was reported as "Equity in earnings of nonconsolidated affiliates" in the consolidated statements of income.
NOTE 5 – DIVESTITURES
Divestiture of the Global Sodium Borohydride Business
On January 30, 2015, the Company sold its global Sodium Borohydride business ("SBH"), part of the Performance Materials & Chemicals segment, to Vertellus Performance Chemicals LLC. The divestiture included a manufacturing facility located in Elma, Washington, as well as the associated business, inventory, customer contracts and lists, process technology, business know-how and certain intellectual property. The sale was completed for $184 million, net of working capital adjustments and costs to sell, with proceeds subject to customary post-closing adjustments.
Post-closing adjustments were finalized in the fourth quarter of 2015. In 2015, the Company recognized a pretax gain of $20 million on the sale, including post-closing adjustments of $2 million. The gain was included in "Sundry income (expense) - net" in the consolidated statements of income and reflected in the Performance Materials & Chemicals segment. The Company recognized an after-tax loss of $10 million on the sale, primarily due to non-deductible goodwill included with this transaction.
87
SBH Assets and Liabilities Divested on January 30, 2015 | |||
In millions | |||
Inventories | $ | 23 | |
Net property | 21 | ||
Goodwill | 45 | ||
Other intangible assets | 75 | ||
Total assets divested | $ | 164 | |
Components of accumulated other comprehensive loss divested | $ | 2 | |
Net carrying value divested | $ | 166 | |
Divestiture of ANGUS Chemical Company
On February 2, 2015, the Company sold ANGUS Chemical Company (“ANGUS”), part of the Performance Materials & Chemicals segment, to Golden Gate Capital. The divestiture included the business headquarters and research and development facility in Buffalo Grove, Illinois; manufacturing facilities located in Sterlington, Louisiana, and Ibbenbueren, Germany; a packaging facility in Niagara Falls, New York; as well as the associated business, inventory, customer contracts, process technology, business know-how and certain intellectual property. The sale was completed for $1,151 million, net of working capital adjustments, costs to sell and other transaction expenses, with proceeds subject to customary post-closing adjustments. The proceeds included a $10 million note receivable included in "Noncurrent receivables" in the consolidated balance sheets.
Post-closing adjustments were finalized in the fourth quarter of 2015. In 2015, the Company recognized a pretax gain of $682 million on the sale, including post-closing adjustments of $12 million. The gain was included in "Sundry income (expense) - net" in the consolidated statements of income and reflected in the Performance Materials & Chemicals segment.
ANGUS Assets and Liabilities Divested on February 2, 2015 | |||
In millions | |||
Current assets | $ | 124 | |
Net property | 101 | ||
Goodwill | 292 | ||
Deferred charges and other assets | 8 | ||
Total assets divested | $ | 525 | |
Current liabilities | $ | 17 | |
Other noncurrent liabilities | 37 | ||
Total liabilities divested | $ | 54 | |
Components of accumulated other comprehensive loss divested | $ | 10 | |
Net carrying value divested | $ | 481 | |
Divestiture of the AgroFresh Business
On July 31, 2015, the Company sold its AgroFresh business, part of the Agricultural Sciences segment, to Boulevard Acquisition Corp., which was subsequently renamed AgroFresh Solutions, Inc. (“AFSI”). The divestiture included trade receivables, inventory, property, customer lists, trademarks and certain intellectual property. The sale was completed for $859 million, net of working capital adjustments, costs to sell and other transaction expenses, with proceeds subject to customary post-closing adjustments. The proceeds included a $635 million cash payment; 17.5 million common shares of AFSI, which represented a 35 percent equity interest valued at $210 million based on the closing stock price on July 31, 2015 and included in “Investment in nonconsolidated affiliates” in the consolidated balance sheets; and, a receivable for six million warrants to purchase common shares of AFSI, which was valued at $14 million and classified as “Accounts and notes receivable - other” in the consolidated balance sheets. The Company is also eligible to receive contingent consideration of $50 million, subject to certain performance conditions. In addition, the Company has an ongoing tax receivable agreement with AFSI, where AFSI is obligated to share with Dow tax savings associated with the purchase of the AgroFresh business. The Company did not recognize the contingent consideration or tax receivable agreement as proceeds.
In 2015, the Company recognized a pretax gain of $626 million on the sale (including post-closing adjustments of $2 million), of which $128 million related to the Company's retained equity interest in AFSI. The pretax gain was included in "Sundry income (expense) - net" in the consolidated statements of income and reflected in the Agricultural Sciences segment.
88
AgroFresh Assets and Liabilities Divested on July 31, 2015 | |||
In millions | |||
Current assets | $ | 40 | |
Inventories | 18 | ||
Net property | 5 | ||
Goodwill | 101 | ||
Other intangible assets | 82 | ||
Deferred charges and other assets | 1 | ||
Total assets divested | $ | 247 | |
Current liabilities | $ | 8 | |
Other noncurrent obligations | 4 | ||
Total liabilities divested | $ | 12 | |
Net carrying value divested | $ | 235 | |
In the fourth quarter of 2016, as a result of a decline in the market value of AFSI, the Company recognized a $143 million pretax impairment charge related to its equity interest in AFSI. The Company also recognized a pretax loss of $20 million for post-closing adjustments related to non-cash consideration. The impairment charge and the post-closing adjustment are both included in "Sundry income (expense) - net" in the consolidated statements of income and reflected in the Agricultural Sciences segment. At December 31, 2016, the Company has yet to receive the warrants. See Notes 9, 12 and 20 for further information on the Company’s equity interest and variable interests in AFSI.
The Company evaluated the divestitures of SBH, ANGUS and AgroFresh and determined they did not represent a strategic shift that had a major effect on the Company’s operations and financial results and did not qualify as individually significant components of the Company. As a result, these divestitures were not reported as discontinued operations.
Divestiture of Investment in MEGlobal
On December 23, 2015, the Company completed the sale of its ownership interest in MEGlobal, a nonconsolidated affiliate, to EQUATE Petrochemical Company K.S.C. ("EQUATE"). The Company received pretax proceeds of $1,472 million, net of costs to sell and other transaction expenses. The Company eliminated 42.5 percent of the gain on the sale (equivalent to Dow's ownership interest in EQUATE), or $555 million. In 2015, the Company recorded a pretax gain of $723 million on the sale, which is included in “Sundry income (expense) – net” in the consolidated statements of income and reflected in Performance Materials & Chemicals. The Company recognized an after-tax gain of $589 million on the sale. See Note 9 for further information on the Company’s equity interest in EQUATE.
Divestiture of Polypropylene Licensing and Catalysts Business
On December 2, 2013, the Company sold its global Polypropylene Licensing and Catalysts business to W. R. Grace & Co. Post-closing adjustments were finalized in the fourth quarter of 2014 and the Company recorded a pretax gain of $5 million ($3 million after tax) for the post-closing adjustments. The gain was included in "Sundry income (expense) - net" in the consolidated statements of income and reflected in Performance Plastics.
NOTE 6 – REVERSE MORRIS TRUST TRANSACTION
On October 5, 2015, (i) the Company completed the transfer of its U.S. Gulf Coast Chlor-Alkali and Vinyl, Global Chlorinated Organics and Global Epoxy businesses ("chlorine value chain") into a new company ("Splitco"), (ii) participating Dow shareholders tendered, and the Company accepted, Dow shares for Splitco shares in a public exchange offer, and (iii) Splitco merged with a wholly owned subsidiary of Olin Corporation ("Olin") in a tax-efficient Reverse Morris Trust transaction (collectively, the “Transaction”). The Transaction was subject to Olin shareholder approval, customary regulatory approvals, tax authority rulings including a favorable private letter ruling from the U.S. Internal Revenue Service which confirms the Transaction to be substantially free of U.S. federal income tax, and expiration of the public exchange offer. Dow does not have an ownership interest in Olin as a result of the Transaction.
Under the terms of a debt exchange offer, Dow received $1,220 million principal amount of new debt instruments from Splitco, which were subsequently transferred to certain investment banks in a non-cash fair value exchange for $1,154 million principal amount of the Company’s outstanding debt instruments owned by such investment banks. As a result of this debt exchange offer and related transactions, the Company retired $1,161 million of certain notes and recognized a $68 million loss on the early extinguishment of debt, included in "Sundry income (expense) - net" in the consolidated statements of income as a
89
component of the pretax gain on the Transaction and reflected in Corporate. See Note 17 for additional information on the early extinguishment of debt.
Dow shareholders who elected to participate in the public exchange offer tendered 34.1 million shares of Dow common stock in exchange for 100 million shares of Splitco. Following the merger of Splitco with Olin, each share of Splitco common stock was automatically converted to the right to receive 0.87482759 shares of Olin common stock, or 87.5 million shares, which represented approximately 52.7 percent of Olin’s common stock outstanding. As a result of this non-cash share exchange offer, the Company recorded an increase of $1,523 million in “Treasury stock at cost” in the consolidated balance sheets, which is valued based on Dow’s opening stock price on October 5, 2015. The Company’s outstanding common shares were reduced by 3 percent as a result of the Transaction.
Under the terms of the Transaction, Dow received cash proceeds of $875 million in the form of a one-time special payment from Splitco from proceeds received from a term loan and included in "Proceeds from issuance of long-term debt" in the consolidated statements of cash flows. The Company also received a $434 million advance payment from Olin, included in "Other assets and liabilities" in the consolidated statements of cash flows, related to a long-term ethylene supply agreement, of which $16 million was classified as "Accrued and other current liabilities" and $418 million was classified as "Other noncurrent obligations" in the consolidated balance sheets at the time of receipt. The Transaction also resulted in numerous long-term supply, service and purchase agreements between Dow and Olin.
In connection with the Transaction, the Company purchased Mitsui & Co. Texas Chlor-Alkali Inc.’s (“Mitsui”) 50 percent equity interest in a membrane chlor-alkali joint venture (“JV Entity”), which resulted in Dow becoming the sole equity owner of the JV Entity. The Company purchased Mitsui's equity interest for $133 million, which resulted in a loss of $25 million included in "Sundry income (expense) - net" in the consolidated statements of income and included as a component of the pretax gain on the Transaction. The JV Entity was included in the transfer of the chlorine value chain to Splitco. See Note 20 for further information on the acquisition of Mitsui’s equity interest in the JV Entity.
The Company also transferred $439 million of net unfunded defined pension and other postretirement benefit obligations in the United States and Germany to Olin. See Note 18 for further details.
The following table presents the major classes of assets and liabilities divested in the Transaction, by operating segment:
Dow Chlorine Value Chain Assets and Liabilities Divested | Performance Materials & Chemicals | Performance Plastics | Corporate | Total | ||||||||||||
In millions | ||||||||||||||||
Accounts and notes receivable - Trade | $ | 269 | $ | — | $ | (6 | ) | $ | 263 | |||||||
Inventories | 297 | 34 | 7 | 338 | ||||||||||||
Other current assets | 5 | 6 | 100 | 111 | ||||||||||||
Net property | 1,268 | 205 | 58 | 1,531 | ||||||||||||
Goodwill | 71 | — | — | 71 | ||||||||||||
Other noncurrent assets | 9 | 1 | 34 | 44 | ||||||||||||
Total assets divested | $ | 1,919 | $ | 246 | $ | 193 | $ | 2,358 | ||||||||
Long-term debt due within one year (1) | $ | — | $ | — | $ | 51 | $ | 51 | ||||||||
Other current liabilities | 99 | 17 | — | 116 | ||||||||||||
Long-Term Debt (1) | — | — | 518 | 518 | ||||||||||||
Deferred income tax liabilities | — | — | 265 | 265 | ||||||||||||
Pension and other postretirement benefits - noncurrent | — | — | 439 | 439 | ||||||||||||
Total liabilities divested | $ | 99 | $ | 17 | $ | 1,273 | $ | 1,389 | ||||||||
Components of accumulated other comprehensive loss divested | $ | — | $ | — | $ | (215 | ) | $ | (215 | ) | ||||||
Net carrying value divested | $ | 1,820 | $ | 229 | $ | (865 | ) | $ | 1,184 | |||||||
(1) | Excludes $1,161 million included as part of the debt exchange offer and $875 million from a term loan entered into under the terms of the Transaction. See Note 17 for additional information. |
In the fourth quarter of 2015, the Company completed the split-off of the chlorine value chain for $3,510 million, net of working capital adjustments and costs to sell, with proceeds subject to post-closing adjustments. The proceeds included cash received from Splitco in the form of a one-time special payment from proceeds received from a term loan, the principal amount of the Splitco debt included in the debt exchange offer and the market value of the Dow common shares tendered in the public exchange offer. The Company recognized a pretax gain of $2,233 million on the Transaction, which is the excess of the sum of
90
the net proceeds received over the chlorine value chain's net book value, a loss on the early extinguishment of debt and a loss on the acquisition of Mitsui's noncontrolling interest. The pretax gain was included in "Sundry income (expense) - net" in the consolidated statements of income and reflected in the following operating segments: Performance Materials & Chemicals (gain of $1,984 million), Performance Plastics (gain of $317 million), and Corporate (loss of $68 million). The Company recognized an after-tax gain of $2,215 million, primarily due to the tax-efficient nature of the Transaction.
In 2016, the Company recognized a pretax gain of $6 million for post-closing adjustments, including a $5 million reduction to the net unfunded defined pension and other postretirement benefit obligation. The gain was included in "Sundry income (expense) - net" in the consolidated statements of income and reflected in the Performance Materials & Chemicals segment. See Note 18 for additional information.
The Company did not report the historical results of the chlorine value chain as discontinued operations in Dow's financial statements as the divestiture of these businesses did not represent a strategic shift that had a major effect on the Company's operations and financial results. However, the chlorine value chain was considered an individually significant component and select income statement information is presented below:
Dow Chlorine Value Chain Income Statement Information | |||||||
In millions | 2015 (1) | 2014 | |||||
Income Before Income Taxes (2) | $ | 139 | $ | 281 | |||
Loss before income taxes attributable to noncontrolling interests | 11 | 5 | |||||
Income Before Income Taxes attributable to The Dow Chemical Company (2) | $ | 150 | $ | 286 | |||
(1) Income statement information for 2015 includes results through September 30, 2015.
(2) Excludes transaction costs associated with the separation of the chlorine value chain, which are reported below.
In 2015, the Company incurred pretax charges of $119 million ($49 million in 2014) for nonrecurring transaction costs associated with the separation of the chlorine value chain, consisting primarily of financial and professional advisory fees, legal fees and information systems infrastructure costs. These charges, which are part of costs associated with transactions and productivity actions, were included in "Sundry income (expense) - net" in the consolidated statements of income and reflected in Corporate.
NOTE 7 – INVENTORIES
The following table provides a breakdown of inventories:
Inventories at December 31 In millions | 2016 | 2015 | |||||
Finished goods | $ | 4,230 | $ | 3,879 | |||
Work in process | 1,510 | 1,502 | |||||
Raw materials | 853 | 730 | |||||
Supplies | 823 | 768 | |||||
Total FIFO inventories | $ | 7,416 | $ | 6,879 | |||
Adjustment of inventories to a LIFO basis | (53 | ) | (8 | ) | |||
Total inventories | $ | 7,363 | $ | 6,871 | |||
Inventories valued on a LIFO basis, principally hydrocarbon and U.S. chemicals and plastics product inventories, represented 27 percent of the total inventories at December 31, 2016 and 30 percent of total inventories at December 31, 2015.
A reduction of certain inventories resulted in the liquidation of some of the Company’s LIFO inventory layers, decreasing pretax income $10 million in 2016, increasing pretax income $3 million in 2015 and decreasing pretax income $23 million in 2014.
91
NOTE 8 – PROPERTY
Property at December 31 In millions | Estimated Useful Lives (Years) | 2016 | 2015 | ||||||||
Land | — | $ | 1,157 | $ | 855 | ||||||
Land and waterway improvements | 15-25 | 1,367 | 1,282 | ||||||||
Buildings | 5-55 | 5,935 | 4,793 | ||||||||
Machinery and equipment | 3-20 | 38,499 | 35,454 | ||||||||
Utility and supply lines | 5-20 | 2,117 | 2,053 | ||||||||
Other property | 3-50 | 2,263 | 2,010 | ||||||||
Construction in progress | — | 6,100 | 4,355 | ||||||||
Total property | $ | 57,438 | $ | 50,802 | |||||||
In millions | 2016 | 2015 | 2014 | |||||||||
Depreciation expense | $ | 2,130 | $ | 1,908 | $ | 2,136 | ||||||
Manufacturing maintenance and repair costs | $ | 1,972 | $ | 1,991 | $ | 2,117 | ||||||
Capitalized interest | $ | 243 | $ | 218 | $ | 125 | ||||||
Total property increased from 2015, primarily due to $4 billion of property assumed in the DCC Transaction. See Note 4 for further information on this transaction.
NOTE 9 – NONCONSOLIDATED AFFILIATES AND RELATED COMPANY TRANSACTIONS
The Company’s investments in companies accounted for using the equity method (“nonconsolidated affiliates”), by classification in the consolidated balance sheets, and dividends received from nonconsolidated affiliates are shown in the following tables:
Investments in Nonconsolidated Affiliates at December 31 | |||||||
In millions | 2016 (1) | 2015 (2) | |||||
Investment in nonconsolidated affiliates | $ | 3,747 | $ | 3,958 | |||
Other noncurrent obligations | (1,030 | ) | (148 | ) | |||
Net investment in nonconsolidated affiliates | $ | 2,717 | $ | 3,810 | |||
(1) | The carrying amount of the Company’s investments in nonconsolidated affiliates was $62 million more than its share of the investees’ net assets, exclusive of additional differences for EQUATE and AFSI, which are discussed separately below. |
(2) | The carrying amount of the Company’s investments in nonconsolidated affiliates was $97 million more than its share of the investees’ net assets, exclusive of additional differences for Dow Corning and EQUATE, which are discussed separately below. |
Dividends Received from Nonconsolidated Affiliates | |||||||||||
In millions | 2016 | 2015 | 2014 (1) | ||||||||
Dividends from nonconsolidated affiliates | $ | 685 | $ | 816 | $ | 961 | |||||
(1) | Includes accrued dividends of $5 million. |
The nonconsolidated affiliates in which the Company has investments, excluding AFSI, are privately held companies; therefore, quoted market prices are not available.
Dow Corning and the HSC Group
As a result of the DCC Transaction, Dow Corning, previously a 50:50 joint venture between Dow and Corning, became a wholly owned subsidiary of Dow as of June 1, 2016. The Company's equity interest in Dow Corning, which was previously classified as "Investment in nonconsolidated affiliates" in the consolidated balance sheets, was remeasured to fair value. See Note 4 for additional information on the DCC Transaction, including details on the fair value of assets acquired and liabilities assumed.
92
Dow Corning continues to maintain an equity interest in the HSC Group. The HSC Group was included as part of the Dow Corning equity method investment and was classified as "Investment in nonconsolidated affiliates" in the consolidated balance sheets. The following table includes the carrying value of the nonconsolidated affiliates included in the HSC Group at June 1, 2016, including the balance sheet classification of each investment:
HSC Group at June 1, 2016 | Ownership Interest | Investment | Balance Sheet Classification | |||||
In millions | ||||||||
Hemlock Semiconductor L.L.C. (1) | 50.1 | % | $ | (958 | ) | Other noncurrent obligations | ||
DC HSC Holdings LLC (2) | 50.0 | % | $ | 571 | Investment in nonconsolidated affiliates | |||
(1) | Hemlock Semiconductor L.L.C. is a nonconsolidated variable interest entity. See Note 20 for additional information. |
(2) | DC HSC Holdings LLC holds an 80.5 percent indirect ownership interest in Hemlock Semiconductor Operations. |
At December 31, 2016, the negative investment balance in Hemlock Semiconductor L.L.C. was $902 million.
At December 31, 2015, the Company’s investment in Dow Corning was $149 million less than the Company’s proportionate share of Dow Corning’s underlying net assets. This amount was considered a permanent difference related to the other-than-temporary decline in the Company's investment in Dow Corning, triggered by Dow Corning's May 15, 1995, bankruptcy filing, and Dow Corning's purchase of additional ownership interests in its HSC Group in 2013.
MEGlobal and EQUATE
On December 23, 2015, the Company sold its interest in MEGlobal to EQUATE. The Company eliminated 42.5 percent of the gain on the sale (equivalent to Dow's ownership interest in EQUATE), or $555 million, against the Company's investment in EQUATE, resulting in a negative investment of $148 million at December 31, 2015, which is classified as "Other noncurrent obligations" in the consolidated balance sheets. The Company's investment in EQUATE was $555 million less than the Company's proportionate share of EQUATE's underlying net assets, which represents the difference between the preliminary fair values of certain MEGlobal assets acquired and the Company's related valuation on a U.S. GAAP basis, of which approximately $250 million was being amortized over the remaining useful lives of the assets and approximately $305 million was considered a permanent difference. At December 31, 2016, the negative investment balance was $128 million and the Company's investment in EQUATE was $536 million less than the Company's proportionate share of EQUATE's underlying net assets, of which $216 million of the difference is being amortized over the remaining useful lives of the assets and the remainder is considered a permanent difference.
AFSI
On July 31, 2015, the Company sold its AgroFresh business to AFSI. Proceeds received on the divestiture of AgroFresh included 17.5 million common shares of AFSI, which were valued at $210 million and represented an approximate 35 percent ownership interest in AFSI. Based on the December 31, 2016 closing stock price of AFSI, the value of this investment would have been lower than the carrying value by $143 million ($80 million based on the closing stock price at December 31, 2015). In the fourth quarter of 2016, the Company determined the decline in market value of AFSI was other-than-temporary and recognized a $143 million pretax impairment charge related to its equity interest in AFSI. The impairment charge was included in "Sundry income (expense) - net" in the consolidated statements of income and reflected in the Agricultural Sciences segment. At December 31, 2016, the Company's investment in AFSI was $96 million less than the Company's proportionate share of AFSI's underlying net assets. This amount primarily relates to the other-than-temporary decline in the Company's investment in AFSI. See Notes 5, 12 and 20 for further information on this investment.
Sadara
The Company and Saudi Arabian Oil Company formed Sadara Chemical Company ("Sadara") to build and operate a world-scale, fully integrated chemicals complex in Jubail Industrial City, Kingdom of Saudi Arabia. Sadara achieved its first polyethylene production in December 2015 and announced the start-up of its mixed feed cracker and a third polyethylene train (which added to the two polyethylene trains already in operation) in August 2016. Sadara will follow a phased approach to start up the remaining manufacturing facilities. At December 31, 2016, the Company had a $258 million note receivable with Sadara, included in "Noncurrent receivables" in the consolidated balance sheets, of which $193 million is expected to be converted to equity in the first quarter of 2017 ($473 million at December 31, 2015, of which $460 million was converted to equity in the first quarter of 2016). During 2016, the Company loaned $1,015 million to Sadara and $1,230 million was converted to equity.
93
Transactions with Nonconsolidated Affiliates
The Company has service agreements with certain nonconsolidated affiliates, including contracts to manage the operations of manufacturing sites and the construction of new facilities; licensing and technology agreements; and marketing, sales, purchase, lease and sublease agreements.
The Company sells excess ethylene glycol produced at Dow's manufacturing facilities in the United States and Europe to MEGlobal, an EQUATE subsidiary since December 23, 2015. The Company also sells ethylene to MEGlobal as a raw material for its ethylene glycol plants in Canada. Sales of these products to MEGlobal represented 1 percent of total net sales in 2016 (1 percent of total net sales in 2015 and 1 percent of total net sales in 2014). Sales of ethylene glycol to MEGlobal are reflected in the Performance Materials & Chemicals segment and represented 2 percent of the segment's sales in 2016 (2 percent in 2015 and 2 percent in 2014). Sales of ethylene to MEGlobal are reflected in the Performance Plastics segment and represented 1 percent of the segment's sales in 2016 (1 percent in 2015 and 1 percent in 2014).
Dow Corning supplies trichlorosilane, a raw material used in the production of polycrystalline silicon, to the HSC Group. Sales of this material to the HSC Group for the period from June 1, 2016 through December 31, 2016, represented less than 1 percent of total net sales in 2016 (2 percent of Infrastructure Solutions sales).
Dow is responsible for marketing the majority of Sadara products outside of the Middle East zone through the Company’s established sales channels. Under this arrangement, the Company purchases and sells Sadara products for a marketing fee. Purchases and sales of Sadara products were not material in 2016.
Sales to and purchases from other nonconsolidated affiliates were not material to the consolidated financial statements.
Balances due to or due from nonconsolidated affiliates at December 31, 2016 and 2015 are as follows:
Balances Due To or Due From Nonconsolidated Affiliates at December 31 | ||||||||
In millions | 2016 | 2015 | ||||||
Accounts and notes receivable - Other | $ | 388 | $ | 389 | ||||
Noncurrent receivables | 267 | 473 | ||||||
Total assets | $ | 655 | $ | 862 | ||||
Notes payable | $ | 44 | $ | 171 | ||||
Accounts payable - Other | 400 | 230 | ||||||
Total current liabilities | $ | 444 | $ | 401 | ||||
94
Principal Nonconsolidated Affiliates
Dow had an ownership interest in 59 nonconsolidated affiliates at December 31, 2016 (55 at December 31, 2015). The Company's principal nonconsolidated affiliates and its ownership interest (direct and indirect) for each at December 31, 2016, 2015 and 2014 are as follows:
Principal Nonconsolidated Affiliates at December 31 | Ownership Interest | ||||||||
2016 | 2015 | 2014 | |||||||
Dow Corning Corporation (1) | N/A | 50 | % | 50 | % | ||||
EQUATE Petrochemical Company K.S.C. | 42.5 | % | 42.5 | % | 42.5 | % | |||
The HSC Group: (2) | |||||||||
DC HSC Holdings LLC | 50 | % | N/A | N/A | |||||
Hemlock Semiconductor L.L.C. | 50.1 | % | N/A | N/A | |||||
The Kuwait Olefins Company K.S.C. ("TKOC") | 42.5 | % | 42.5 | % | 42.5 | % | |||
The Kuwait Styrene Company K.S.C. ("TKSC") | 42.5 | % | 42.5 | % | 42.5 | % | |||
Map Ta Phut Olefins Company Limited (3) | 32.77 | % | 32.77 | % | 32.77 | % | |||
MEGlobal (4) | N/A | N/A | 50 | % | |||||
Sadara Chemical Company | 35 | % | 35 | % | 35 | % | |||
The SCG-Dow Group: | |||||||||
Siam Polyethylene Company Limited | 50 | % | 50 | % | 50 | % | |||
Siam Polystyrene Company Limited | 50 | % | 50 | % | 50 | % | |||
Siam Styrene Monomer Co., Ltd. | 50 | % | 50 | % | 50 | % | |||
Siam Synthetic Latex Company Limited | 50 | % | 50 | % | 50 | % | |||
Univation Technologies, LLC (5) | N/A | N/A | 50 | % | |||||
(1) | On June 1, 2016, Dow became the 100 percent owner of Dow Corning. See Note 4 for additional information. |
(2) | The HSC Group was previously part of the Dow Corning equity method investment and was added as principal nonconsolidated affiliates in the fourth quarter of 2016. |
(3) | The Company's effective ownership of Map Ta Phut Olefins Company Limited is 32.77 percent, of which the Company directly owns 20.27 percent and indirectly owns 12.5 percent through its equity interest in Siam Polyethylene Company Limited and Siam Synthetic Latex Company Limited. |
(4) | On December 23, 2015, the Company sold its 50 percent ownership interest in MEGlobal to EQUATE. MEGlobal is treated as a separate principal nonconsolidated affiliate through the date of divestiture. See Note 5 for additional information. |
(5) | On May 5, 2015, Univation, previously a 50:50 joint venture between Dow and ExxonMobil, became a wholly owned subsidiary of Dow. See Note 4 for additional information. |
The Company’s investment in and equity earnings from its principal nonconsolidated affiliates are shown in the tables below:
Investment in Principal Nonconsolidated Affiliates at December 31 | |||||||
In millions | 2016 | 2015 (1) | |||||
Investment in nonconsolidated affiliates | $ | 3,029 | $ | 3,120 | |||
Other noncurrent obligations | (1,030 | ) | (148 | ) | |||
Net investment in principal nonconsolidated affiliates | $ | 1,999 | $ | 2,972 | |||
(1) | Adjusted to conform to the current year presentation. |
Equity Earnings from Principal Nonconsolidated Affiliates | |||||||||||
In millions | 2016 | 2015 | 2014 | ||||||||
Equity in earnings of nonconsolidated affiliates | $ | 449 | $ | 704 | $ | 845 | |||||
95
The summarized financial information that follows represents the combined accounts (at 100 percent) of the principal nonconsolidated affiliates.
Summarized Balance Sheet Information at December 31 | ||||||||
In millions | 2016 (1) | 2015 (2) | ||||||
Current assets | $ | 6,092 | $ | 8,794 | ||||
Noncurrent assets | 28,588 | 31,723 | ||||||
Total assets | $ | 34,680 | $ | 40,517 | ||||
Current liabilities | $ | 3,953 | $ | 9,850 | ||||
Noncurrent liabilities | 23,223 | 21,461 | ||||||
Total liabilities | $ | 27,176 | $ | 31,311 | ||||
Noncontrolling interests | $ | 300 | $ | 663 | ||||
(1) | The summarized balance sheet information for 2016 does not include Dow Corning. |
(2) | The summarized balance sheet information for 2015 does not include Univation; MEGlobal is included as part of EQUATE. |
Summarized Income Statement Information | ||||||||||||
In millions | 2016 (1) | 2015 (2) | 2014 | |||||||||
Sales | $ | 12,003 | $ | 15,468 | $ | 19,333 | ||||||
Gross profit | $ | 2,518 | $ | 3,206 | $ | 3,526 | ||||||
Net income | $ | 831 | $ | 1,343 | $ | 1,673 | ||||||
(1) | The summarized income statement information for 2016 includes the results of Dow Corning through May 31, 2016. |
(2) | The summarized income statement information for 2015 includes the results of Univation through April 30, 2015 and MEGlobal through November 30, 2015. |
NOTE 10 – GOODWILL AND OTHER INTANGIBLE ASSETS
The following table shows changes in the carrying amount of goodwill for the years ended December 31, 2016 and 2015, by operating segment:
Goodwill | Agricultural Sciences | Consumer Solutions | Infrastructure Solutions | Performance Materials & Chemicals | Performance Plastics | Total | |||||||||||||||||
In millions | |||||||||||||||||||||||
Balance at January 1, 2015 | $ | 1,558 | $ | 4,389 | $ | 4,451 | $ | 809 | $ | 1,425 | $ | 12,632 | |||||||||||
Divestiture of ANGUS Chemical Company | — | — | — | (292 | ) | — | (292 | ) | |||||||||||||||
Divestiture of the Sodium Borohydride business | — | — | — | (45 | ) | — | (45 | ) | |||||||||||||||
Sale of Agricultural Sciences product lines | (16 | ) | — | — | — | — | (16 | ) | |||||||||||||||
Divestiture of AgroFresh | (101 | ) | — | — | — | — | (101 | ) | |||||||||||||||
Split-off of the chlorine value chain | — | — | — | (71 | ) | — | (71 | ) | |||||||||||||||
Goodwill related to the Coodetec acquisition | 31 | — | — | — | — | 31 | |||||||||||||||||
Goodwill related to the Univation step acquisition | — | — | — | — | 141 | 141 | |||||||||||||||||
Foreign currency impact | — | (15 | ) | (69 | ) | (10 | ) | (31 | ) | (125 | ) | ||||||||||||
Balance at December 31, 2015 | $ | 1,472 | $ | 4,374 | $ | 4,382 | $ | 391 | $ | 1,535 | $ | 12,154 | |||||||||||
Acquisition of an aniline plant | — | — | — | 37 | — | 37 | |||||||||||||||||
Sale of product lines | — | (10 | ) | — | — | (5 | ) | (15 | ) | ||||||||||||||
Goodwill related to the DCC Transaction | — | 1,705 | 1,524 | — | — | 3,229 | |||||||||||||||||
Foreign currency impact | — | (52 | ) | (66 | ) | (3 | ) | (12 | ) | (133 | ) | ||||||||||||
Balance at December 31, 2016 | $ | 1,472 | $ | 6,017 | $ | 5,840 | $ | 425 | $ | 1,518 | $ | 15,272 | |||||||||||
96
Goodwill Impairments
The carrying amount of goodwill for all periods presented was net of accumulated impairments of $209 million in Consumer Solutions and $220 million in Performance Materials & Chemicals.
Goodwill Impairment Testing
The Company performs an impairment test for goodwill annually during the fourth quarter. Qualitative factors may be assessed by the Company to determine whether it is more likely than not that the fair value of a reporting unit is less than its carrying value. The qualitative factors assessed at the Company level include, but are not limited to, GDP growth rates, long-term hydrocarbon and energy prices, equity and credit market activity, discount rates, foreign exchange rates and overall financial performance. Qualitative factors assessed at the reporting unit level include, but are not limited to, changes in industry and market structure, competitive environments, planned capacity and new product launches, cost factors such as raw material prices, and financial performance of the reporting unit.
In 2016, the Company assessed qualitative factors for 11 of the 14 reporting units carrying goodwill (9 of 12 reporting units in 2015 and 9 of 14 reporting units in 2014). The qualitative assessment indicated that it was more likely than not that fair value exceeded carrying value for those reporting units included in the qualitative test. The Company performed the first step of the quantitative testing for the remaining three reporting units (three in 2015 and five in 2014). The Company utilized a discounted cash flow methodology to calculate the fair value of the reporting units. Based on the fair value analysis, management concluded that fair value exceeded carrying value for all reporting units in 2016, 2015 and 2014. As a result, no additional quantitative testing was required for the reporting units.
Other Intangible Assets
The following table provides information regarding the Company’s other intangible assets:
Other Intangible Assets at December 31 | 2016 | 2015 | |||||||||||||||||||||
In millions | Gross Carrying Amount | Accumulated Amortization | Net | Gross Carrying Amount | Accumulated Amortization | Net | |||||||||||||||||
Intangible assets with finite lives: | |||||||||||||||||||||||
Licenses and intellectual property | $ | 3,148 | $ | (1,286 | ) | $ | 1,862 | $ | 1,943 | $ | (1,087 | ) | $ | 856 | |||||||||
Patents | 106 | (97 | ) | 9 | 119 | (108 | ) | 11 | |||||||||||||||
Software | 1,336 | (696 | ) | 640 | 1,253 | (628 | ) | 625 | |||||||||||||||
Trademarks | 696 | (503 | ) | 193 | 666 | (441 | ) | 225 | |||||||||||||||
Customer-related | 4,806 | (1,567 | ) | 3,239 | 3,164 | (1,366 | ) | 1,798 | |||||||||||||||
Other | 168 | (146 | ) | 22 | 165 | (140 | ) | 25 | |||||||||||||||
Total other intangible assets, finite lives | $ | 10,260 | $ | (4,295 | ) | $ | 5,965 | $ | 7,310 | $ | (3,770 | ) | $ | 3,540 | |||||||||
IPR&D (1), indefinite lives | 61 | — | 61 | 77 | — | 77 | |||||||||||||||||
Total other intangible assets | $ | 10,321 | $ | (4,295 | ) | $ | 6,026 | $ | 7,387 | $ | (3,770 | ) | $ | 3,617 | |||||||||
(1) In-process research and development ("IPR&D") purchased in a business combination.
Intangible assets assumed in the DCC Transaction are presented in the table below. See Note 4 for additional information on this transaction.
Dow Corning Intangible Assets at June 1, 2016 | Gross Carrying Amount | Weighted-average Amortization Period | |||
In millions | |||||
Intangible assets with finite lives: | |||||
Licenses and intellectual property | $ | 1,200 | 9 years | ||
Software | 2 | 5 years | |||
Trademarks | 30 | 3 years | |||
Customer-related | 1,755 | 19 years | |||
Total | $ | 2,987 | 15 years | ||
97
Intangible assets acquired as part of the Univation step acquisition are presented in the table below. See Note 4 for additional information on this acquisition.
Univation Intangible Assets at May 5, 2015 | Gross Carrying Amount | Weighted-average Amortization Period | |||
In millions | |||||
Intangible assets with finite lives: | |||||
Licenses and intellectual property | $ | 340 | 10 years | ||
Software | 5 | 5 years | |||
Trademarks | 12 | 18 years | |||
Customer-related | 76 | 10 years | |||
Total | $ | 433 | 10 years | ||
On January 30, 2015, DAS acquired Coodetec's seed business resulting in an increase to intangible assets of $81 million, which included $14 million of trademarks, $1 million of customer-related intangibles, $20 million of germplasm (included in "Other") and $46 million of IPR&D. See Note 4 for additional information on this acquisition.
The following table provides information regarding amortization expense related to intangible assets:
Amortization Expense In millions | 2016 | 2015 | 2014 | |||||||||
Other intangible assets, excluding software | $ | 544 | $ | 419 | $ | 436 | ||||||
Software, included in “Cost of sales” | $ | 73 | $ | 72 | $ | 70 | ||||||
In the second quarter of 2016, the Company wrote-off $11 million of IPR&D as part of the 2016 restructuring charge. See Note 3 for additional information.
In 2014, the Company recognized a $50 million asset impairment charge for customer-related, trademarks and intellectual property intangible assets in the Dow Electronic Materials business, which is recorded in "Goodwill and other intangible asset impairment losses" in the consolidated statements of income and reflected in Consumer Solutions.
Total estimated amortization expense for the next five fiscal years is as follows:
Estimated Amortization Expense for Next Five Years In millions | |||
2017 | $ | 716 | |
2018 | $ | 722 | |
2019 | $ | 646 | |
2020 | $ | 609 | |
2021 | $ | 576 | |
98
NOTE 11 – FINANCIAL INSTRUMENTS
The following table summarizes the fair value of financial instruments at December 31, 2016 and 2015:
Fair Value of Financial Instruments at December 31 | |||||||||||||||||||||||||||||||
2016 | 2015 | ||||||||||||||||||||||||||||||
In millions | Cost | Gain | Loss | Fair Value | Cost | Gain | Loss | Fair Value | |||||||||||||||||||||||
Marketable securities: (1) | |||||||||||||||||||||||||||||||
Debt securities: | |||||||||||||||||||||||||||||||
Government debt (2) | $ | 607 | $ | 13 | $ | (12 | ) | $ | 608 | $ | 597 | $ | 22 | $ | (7 | ) | $ | 612 | |||||||||||||
Corporate bonds | 623 | 27 | (5 | ) | 645 | 633 | 26 | (8 | ) | 651 | |||||||||||||||||||||
Total debt securities | $ | 1,230 | $ | 40 | $ | (17 | ) | $ | 1,253 | $ | 1,230 | $ | 48 | $ | (15 | ) | $ | 1,263 | |||||||||||||
Equity securities | 658 | 98 | (50 | ) | 706 | 555 | 108 | (60 | ) | 603 | |||||||||||||||||||||
Total marketable securities | $ | 1,888 | $ | 138 | $ | (67 | ) | $ | 1,959 | $ | 1,785 | $ | 156 | $ | (75 | ) | $ | 1,866 | |||||||||||||
Long-term debt including debt due within one year (3) | $ | (21,091 | ) | $ | 129 | $ | (1,845 | ) | $ | (22,807 | ) | $ | (16,756 | ) | $ | 424 | $ | (1,668 | ) | $ | (18,000 | ) | |||||||||
Derivatives relating to: | |||||||||||||||||||||||||||||||
Interest rates | $ | — | $ | — | $ | (5 | ) | $ | (5 | ) | $ | — | $ | — | $ | (4 | ) | $ | (4 | ) | |||||||||||
Commodities (4) | $ | — | $ | 56 | $ | (213 | ) | $ | (157 | ) | $ | — | $ | 6 | $ | (248 | ) | $ | (242 | ) | |||||||||||
Foreign currency | $ | — | $ | 84 | $ | (30 | ) | $ | 54 | $ | — | $ | 109 | $ | (32 | ) | $ | 77 | |||||||||||||
(1) | Included in “Other investments” in the consolidated balance sheets. |
(2) | U.S. Treasury obligations, U.S. agency obligations, agency mortgage-backed securities and other municipalities’ obligations. |
(3) | Cost includes fair value adjustments of $18 million at December 31, 2016 and $18 million at December 31, 2015. |
(4) | Presented net of cash collateral, as disclosed in Note 12. |
Cost approximates fair value for all other financial instruments.
Investments
The Company’s investments in marketable securities are primarily classified as available-for-sale securities. The following table provides the investing results from available-for-sale securities for the years ended December 31, 2016, 2015 and 2014.
Investing Results | |||||||||||
In millions | 2016 | 2015 | 2014 | ||||||||
Proceeds from sales of available-for-sale securities | $ | 535 | $ | 565 | $ | 675 | |||||
Gross realized gains | $ | 58 | $ | 96 | $ | 99 | |||||
Gross realized losses | $ | (2 | ) | $ | (14 | ) | $ | (6 | ) | ||
The following table summarizes the contractual maturities of the Company’s investments in debt securities:
Contractual Maturities of Debt Securities at December 31, 2016 | |||||||
In millions | Amortized Cost | Fair Value | |||||
Within one year | $ | 33 | $ | 32 | |||
One to five years | 331 | 341 | |||||
Six to ten years | 665 | 664 | |||||
After ten years | 201 | 216 | |||||
Total | $ | 1,230 | $ | 1,253 | |||
At December 31, 2016, the Company had $261 million ($3,354 million at December 31, 2015) of held-to-maturity securities (primarily Treasury Bills) classified as cash equivalents, as these securities had maturities of three months or less at the time of purchase. The Company’s investments in held-to-maturity securities are held at amortized cost, which approximates fair value. At December 31, 2016, the Company had investments in money market funds of $239 million classified as cash equivalents ($1,689 million at December 31, 2015).
The net unrealized gain/loss from mark-to-market adjustments recognized in earnings on trading securities held at the end of the year was a $6 million loss in 2016, a $2 million loss in 2015 and a $3 million gain in 2014.
99
The following tables provide the fair value and gross unrealized losses of the Company’s investments that were deemed to be temporarily impaired at December 31, 2016 and 2015, aggregated by investment category:
Temporarily Impaired Securities at December 31, 2016 | |||||||||||||||||||||||
Less than 12 months | 12 months or more | Total | |||||||||||||||||||||
In millions | Fair Value | Unrealized Losses | Fair Value | Unrealized Losses | Fair Value | Unrealized Losses | |||||||||||||||||
Government debt (1) | $ | 351 | $ | (12 | ) | $ | — | $ | — | $ | 351 | $ | (12 | ) | |||||||||
Corporate bonds | 193 | (4 | ) | 16 | (1 | ) | 209 | (5 | ) | ||||||||||||||
Equity securities | 48 | (6 | ) | 163 | (44 | ) | 211 | (50 | ) | ||||||||||||||
Total temporarily impaired securities | $ | 592 | $ | (22 | ) | $ | 179 | $ | (45 | ) | $ | 771 | $ | (67 | ) | ||||||||
(1) | U.S. Treasury obligations, U.S. agency obligations, agency mortgage-backed securities and other municipalities' obligations. |
Temporarily Impaired Securities at December 31, 2015 | |||||||||||||||||||||||
Less than 12 months | 12 months or more | Total | |||||||||||||||||||||
In millions | Fair Value | Unrealized Losses | Fair Value | Unrealized Losses | Fair Value | Unrealized Losses | |||||||||||||||||
Government debt (1) | $ | 251 | $ | (7 | ) | $ | 1 | $ | — | $ | 252 | $ | (7 | ) | |||||||||
Corporate bonds | 175 | (8 | ) | 1 | — | 176 | (8 | ) | |||||||||||||||
Equity securities | 197 | (54 | ) | 10 | (6 | ) | 207 | (60 | ) | ||||||||||||||
Total temporarily impaired securities | $ | 623 | $ | (69 | ) | $ | 12 | $ | (6 | ) | $ | 635 | $ | (75 | ) | ||||||||
(1) | U.S. Treasury obligations, U.S. agency obligations, agency mortgage-backed securities and other municipalities' obligations. |
Portfolio managers regularly review the Company’s holdings to determine if any investments are other-than-temporarily impaired. The analysis includes reviewing the amount of the impairment, as well as the length of time it has been impaired. In addition, specific guidelines for each instrument type are followed to determine if an other-than-temporary impairment has occurred.
For debt securities, the credit rating of the issuer, current credit rating trends, the trends of the issuer’s overall sector, the ability of the issuer to pay expected cash flows and the length of time the security has been in a loss position are considered in determining whether unrealized losses represent an other-than-temporary impairment. The Company did not have any credit-related losses during 2016, 2015 or 2014.
For equity securities, the Company’s investments are primarily in Standard & Poor’s (“S&P”) 500 companies; however, the Company’s policies allow investments in companies outside of the S&P 500. The largest holdings are Exchange Traded Funds that represent the S&P 500 index or an S&P 500 sector or subset; the Company also has holdings in Exchange Traded Funds that represent emerging markets. The Company considers the evidence to support the recovery of the cost basis of a security including volatility of the stock, the length of time the security has been in a loss position, value and growth expectations, and overall market and sector fundamentals, as well as technical analysis, in determining whether unrealized losses represent an other-than-temporary impairment. In 2016, there were no other-than-temporary impairment write-downs on investments still held by the Company ($2 million in 2015).
The aggregate cost of the Company's cost method investments totaled $120 million at December 31, 2016 ($157 million at December 31, 2015). Due to the nature of these investments, either the cost basis approximates fair market value or fair value is not readily determinable. These investments are reviewed quarterly for impairment indicators. In 2016, a write-down of $4 million was recorded as part of the 2016 restructuring charge. In 2015, a write-down of $55 million was recorded as part of the 2015 restructuring charge. See Note 3 for more information on the Company's restructuring activities. The Company's impairment analysis resulted in no additional reductions in the cost basis of these investments for the year ended December 31, 2016; the analysis in 2015 resulted in additional reductions of less than $1 million for the year ended December 31, 2015.
Risk Management
Dow’s business operations give rise to market risk exposure due to changes in interest rates, foreign currency exchange rates, commodity prices and other market factors such as equity prices. To manage such risks effectively, the Company enters into hedging transactions, pursuant to established guidelines and policies, which enable it to mitigate the adverse effects of financial market risk. Derivatives used for this purpose are designated as cash flow, fair value or net foreign investment hedges where appropriate. Accounting guidance requires companies to recognize all derivative instruments as either assets or liabilities at fair value. A secondary objective is to add value by creating additional nonspecific exposures within established limits and policies;
100
derivatives used for this purpose are not designated as hedges. The potential impact of creating such additional exposures is not material to the Company’s results.
The Company’s risk management program for interest rate, foreign currency and commodity risks is based on fundamental, mathematical and technical models that take into account the implicit cost of hedging. Risks created by derivative instruments and the mark-to-market valuations of positions are strictly monitored at all times, using value-at-risk and stress tests. Counterparty credit risk arising from these contracts is not significant because the Company minimizes counterparty concentration, deals primarily with major financial institutions of solid credit quality, and the majority of its hedging transactions mature in less than three months. In addition, the Company minimizes concentrations of credit risk through its global orientation by transacting with large, internationally diversified financial counterparties. It is the Company’s policy to not have credit-risk-related contingent features in its derivative instruments. No significant concentration of counterparty credit risk existed at December 31, 2016. The Company does not anticipate losses from credit risk, and the net cash requirements arising from counterparty risk associated with risk management activities are not expected to be material in 2017.
The Company revises its strategies as market conditions dictate and management reviews its overall financial strategies and the impacts from using derivatives in its risk management program with the Company’s Board of Directors.
Interest Rate Risk Management
The Company enters into various interest rate contracts with the objective of lowering funding costs or altering interest rate exposures related to fixed and variable rate obligations. In these contracts, the Company agrees with other parties to exchange, at specified intervals, the difference between fixed and floating interest amounts calculated on an agreed-upon notional principal amount. At December 31, 2016, the Company had open interest rate swaps with maturity dates that extend to 2021.
Foreign Currency Risk Management
The Company’s global operations require active participation in foreign exchange markets. The Company enters into foreign exchange forward contracts and options, and cross-currency swaps to hedge various currency exposures or create desired exposures. Exposures primarily relate to assets, liabilities and bonds denominated in foreign currencies, as well as economic exposure, which is derived from the risk that currency fluctuations could affect the dollar value of future cash flows related to operating activities. The primary business objective of the activity is to optimize the U.S. dollar value of the Company’s assets, liabilities and future cash flows with respect to exchange rate fluctuations. Assets and liabilities denominated in the same foreign currency are netted, and only the net exposure is hedged. At December 31, 2016, the Company had forward contracts, options and cross-currency swaps to buy, sell or exchange foreign currencies. These contracts had various expiration dates, through the first quarter of 2018.
Commodity Risk Management
The Company has exposure to the prices of commodities in its procurement of certain raw materials. The primary purpose of commodity hedging activities is to manage the price volatility associated with these forecasted inventory purchases. At December 31, 2016, the Company had futures contracts, options and swaps to buy, sell or exchange commodities. These agreements had various expiration dates through the fourth quarter of 2020.
Accounting for Derivative Instruments and Hedging Activities
Cash Flow Hedges
For derivatives that are designated and qualify as cash flow hedging instruments, the effective portion of the gain or loss on the derivative is recorded in “Accumulated other comprehensive loss” (“AOCL”); it is reclassified to “Cost of sales” in the same period or periods that the hedged transaction affects income. The unrealized amounts in AOCL fluctuate based on changes in the fair value of open contracts at the end of each reporting period. The Company anticipates volatility in AOCL and net income from its cash flow hedges. The amount of volatility varies with the level of derivative activities and market conditions during any period. Gains and losses on the derivatives representing either hedge ineffectiveness or hedge components excluded from the assessment of effectiveness are recognized in current period income.
The Company had open interest rate derivatives designated as cash flow hedges at December 31, 2016, with a net loss of $4 million after tax and a notional U.S. dollar equivalent of $245 million (net loss of $3 million after tax and a notional U.S. dollar equivalent of $338 million at December 31, 2015).
Current open foreign currency forward contracts hedge the currency risk of forecasted feedstock purchase transactions until September 2017. The effective portion of the mark-to-market effects of the foreign currency contracts is recorded in AOCL; it is reclassified to income in the same period or periods that the underlying feedstock purchase affects income. The net gain from the foreign currency hedges included in AOCL at December 31, 2016 was $22 million after tax (net gain of $4 million after tax at December 31, 2015). In 2016, 2015 and 2014, there was no material impact on the consolidated financial statements due to
101
foreign currency hedge ineffectiveness. At December 31, 2016, the Company had open contracts with various expiration dates to buy, sell or exchange foreign currencies with a notional U.S. dollar equivalent of $1,411 million ($398 million at December 31, 2015).
Commodity swaps, futures and option contracts with maturities of not more than 48 months are utilized and designated as cash flow hedges of forecasted commodity purchases. Current open contracts hedge forecasted transactions until December 2020. The effective portion of the mark-to-market effect of the cash flow hedge instrument is recorded in AOCL; it is reclassified to income in the same period or periods that the underlying commodity purchase affects income. The net loss from commodity hedges included in AOCL at December 31, 2016 was $99 million after tax ($180 million after tax loss at December 31, 2015). In 2016, 2015 and 2014, there was no material impact on the consolidated financial statements due to commodity hedge ineffectiveness. At December 31, 2016 and 2015, the Company had the following gross aggregate notionals of outstanding commodity forward, options and futures contracts to hedge forecasted purchases:
Commodity | Dec 31, 2016 | Dec 31, 2015 | Notional Volume Unit | ||||
Corn | 0.4 | 1.0 | million bushels | ||||
Crude Oil | 0.6 | 0.4 | million barrels | ||||
Ethane | 3.6 | — | million barrels | ||||
Natural Gas | 78.6 | 257.4 | million British thermal units | ||||
Propane | 1.5 | — | million barrels | ||||
Soybeans | — | 1.4 | million bushels | ||||
The net after-tax amounts to be reclassified from AOCL to income within the next 12 months are a $14 million gain for commodity contracts, a $22 million gain for foreign currency contracts and a $2 million loss for interest rate contracts.
Fair Value Hedges
For derivative instruments that are designated and qualify as fair value hedges, the gain or loss on the derivative as well as the offsetting loss or gain on the hedged item attributable to the hedged risk are recognized in current period income and reflected as “Interest expense and amortization of debt discount” in the consolidated statements of income. The short-cut method is used when the criteria are met. During 2015, the Company entered into and subsequently terminated an interest rate swap designated as a fair value hedge of an underlying fixed rate debt obligation with a maturity date of May 2019. The fair value adjustment resulting from this swap was a gain on the derivative of less than $1 million. At December 31, 2016 and 2015, the Company had no open interest rate swaps designated as fair value hedges of underlying fixed rate debt obligations.
Net Foreign Investment Hedges
For derivative instruments that are designated and qualify as net foreign investment hedges, the effective portion of the gain or loss on the derivative is included in “Cumulative Translation Adjustments” in AOCL. The Company had open foreign currency contracts designated as net foreign investment hedges with a gross notional U.S. dollar equivalent of $2,641 million at December 31, 2016 (zero at December 31, 2015). In addition, at December 31, 2016, the Company had outstanding foreign-currency denominated debt designated as a hedge of net foreign investment of $172 million ($166 million at December 31, 2015). The results of hedges of the Company’s net investment in foreign operations included in “Cumulative Translation Adjustments” in AOCL was a net gain of $1 million after tax for the period ended December 31, 2016 (net gain of $1 million after tax for the period ended December 31, 2015). In 2016, 2015 and 2014 there was no material impact on the consolidated financial statements due to hedge ineffectiveness. See Note 24 for further detail on changes in AOCL.
Other Derivative Instruments
The Company utilizes futures, options and swap instruments that are effective as economic hedges of commodity price exposures, but do not meet hedge accounting criteria for derivatives and hedging. At December 31, 2016 and 2015, the Company had the following gross aggregate notionals of outstanding commodity contracts:
Commodity | Dec 31, 2016 | Dec 31, 2015 | Notional Volume Unit | |||
Ethane | 2.6 | — | million barrels | |||
Gasoline | 30.0 | — | kilotons | |||
Naphtha Price Spread | 50.0 | 15.0 | kilotons | |||
Propane | 2.7 | 0.5 | million barrels | |||
102
The Company also uses foreign exchange forward contracts, options and cross-currency swaps that are not designated as hedging instruments primarily to manage foreign currency exposure. The Company had open foreign exchange contracts and cross-currency swaps with various expiration dates to buy, sell or exchange foreign currencies with a gross notional U.S. dollar equivalent of $12,388 million at December 31, 2016 ($14,515 million at December 31, 2015) and had no open interest rate swaps at December 31, 2016 and December 31, 2015.
The following table provides the fair value and gross balance sheet classification of derivative instruments at December 31, 2016 and 2015:
Fair Value of Derivative Instruments In millions | Balance Sheet Classification | 2016 | 2015 | ||||||
Asset Derivatives | |||||||||
Derivatives designated as hedges: | |||||||||
Commodities | Other current assets | $ | 42 | $ | 3 | ||||
Commodities | Deferred charges and other assets | 10 | — | ||||||
Foreign currency | Accounts and notes receivable – Other | 90 | 5 | ||||||
Total derivatives designated as hedges | $ | 142 | $ | 8 | |||||
Derivatives not designated as hedges: | |||||||||
Commodities | Other current assets | $ | 13 | $ | 4 | ||||
Commodities | Deferred charges and other assets | 12 | — | ||||||
Foreign currency | Accounts and notes receivable – Other | 103 | 156 | ||||||
Total derivatives not designated as hedges | $ | 128 | $ | 160 | |||||
Total asset derivatives | $ | 270 | $ | 168 | |||||
Liability Derivatives | |||||||||
Derivatives designated as hedges: | |||||||||
Interest rates | Accrued and other current liabilities | $ | 3 | $ | 3 | ||||
Interest rates | Other noncurrent obligations | 2 | 1 | ||||||
Commodities | Accrued and other current liabilities | 32 | 28 | ||||||
Commodities | Other noncurrent obligations | 196 | 234 | ||||||
Foreign currency | Accrued and other current liabilities | 55 | 1 | ||||||
Total derivatives designated as hedges | $ | 288 | $ | 267 | |||||
Derivatives not designated as hedges: | |||||||||
Commodities | Accrued and other current liabilities | $ | 4 | $ | — | ||||
Commodities | Other noncurrent obligations | 2 | — | ||||||
Foreign currency | Accounts payable – Other | 84 | 83 | ||||||
Total derivatives not designated as hedges | $ | 90 | $ | 83 | |||||
Total liability derivatives | $ | 378 | $ | 350 | |||||
Foreign currency derivatives not designated as hedges are offset by foreign exchange gains or losses resulting from the underlying exposures of foreign currency denominated assets and liabilities. The amount charged on a pretax basis related to foreign currency derivatives not designated as a hedge, which is included in "Sundry income (expense) - net" in the consolidated statements of income, was a loss of $180 million for 2016, loss of $318 million for 2015 and loss of $333 million for 2014. See Note 13 for the net impact of foreign exchange transactions.
103
NOTE 12 – FAIR VALUE MEASUREMENTS
Fair Value Measurements on a Recurring Basis
The following tables summarize the bases used to measure certain assets and liabilities at fair value on a recurring basis:
Basis of Fair Value Measurements on a Recurring Basis at December 31, 2016 In millions | Quoted Prices in Active Markets for Identical Items (Level 1) | Significant Other Observable Inputs (Level 2) | Significant Unobservable Inputs (Level 3) | Counterparty and Cash Collateral Netting (1) | Total | ||||||||||||||
Assets at fair value: | |||||||||||||||||||
Cash equivalents (2) | $ | — | $ | 500 | $ | — | $ | — | $ | 500 | |||||||||
Interests in trade accounts receivable conduits (3) | — | — | 1,237 | — | 1,237 | ||||||||||||||
Equity securities (4) | 619 | 87 | — | — | 706 | ||||||||||||||
Debt securities: (4) | |||||||||||||||||||
Government debt (5) | — | 608 | — | — | 608 | ||||||||||||||
Corporate bonds | — | 645 | — | — | 645 | ||||||||||||||
Derivatives relating to: (6) | |||||||||||||||||||
Commodities | 48 | 29 | — | (21 | ) | 56 | |||||||||||||
Foreign currency | — | 193 | — | (109 | ) | 84 | |||||||||||||
Total assets at fair value | $ | 667 | $ | 2,062 | $ | 1,237 | $ | (130 | ) | $ | 3,836 | ||||||||
Liabilities at fair value: | |||||||||||||||||||
Long-term debt (7) | $ | — | $ | 22,807 | $ | — | $ | — | $ | 22,807 | |||||||||
Derivatives relating to: (6) | |||||||||||||||||||
Interest rates | — | 5 | — | — | 5 | ||||||||||||||
Commodities | 20 | 214 | — | (21 | ) | 213 | |||||||||||||
Foreign currency | — | 139 | — | (109 | ) | 30 | |||||||||||||
Total liabilities at fair value | $ | 20 | $ | 23,165 | $ | — | $ | (130 | ) | $ | 23,055 | ||||||||
(1) | Counterparty and cash collateral amounts represent the estimated net settlement amount when applying netting and set-off rights included in master netting arrangements between the Company and its counterparties and the cash collateral placed with the same counterparty. |
(2) | Treasury Bills and money market funds included in "Cash and cash equivalents" in the consolidated balance sheets and held at amortized cost, which approximates fair value. |
(3) | Included in "Accounts and notes receivable – Other" in the consolidated balance sheets. See Note 16 for additional information on transfers of financial assets. |
(4) | The Company’s investments in equity and debt securities are primarily classified as available-for-sale and are included in “Other investments” in the consolidated balance sheets. |
(5) | U.S. Treasury obligations, U.S. agency obligations, agency mortgage-backed securities and other municipalities’ obligations. |
(6) | See Note 11 for the classification of derivatives in the consolidated balance sheets. |
(7) | See Note 11 for information on fair value measurements of long-term debt. |
104
Basis of Fair Value Measurements on a Recurring Basis at December 31, 2015 In millions | Quoted Prices in Active Markets for Identical Items (Level 1) | Significant Other Observable Inputs (Level 2) | Significant Unobservable Inputs (Level 3) | Counterparty and Cash Collateral Netting (1) | Total | ||||||||||||||
Assets at fair value: | |||||||||||||||||||
Cash equivalents (2) | $ | — | $ | 5,043 | $ | — | $ | — | $ | 5,043 | |||||||||
Interests in trade accounts receivable conduits (3) | — | — | 943 | — | 943 | ||||||||||||||
Equity securities (4) | 564 | 39 | — | — | 603 | ||||||||||||||
Debt securities: (4) | |||||||||||||||||||
Government debt (5) | — | 612 | — | — | 612 | ||||||||||||||
Corporate bonds | — | 651 | — | — | 651 | ||||||||||||||
Derivatives relating to: (6) | |||||||||||||||||||
Commodities | 5 | 2 | — | (1 | ) | 6 | |||||||||||||
Foreign currency | — | 161 | — | (52 | ) | 109 | |||||||||||||
Total assets at fair value | $ | 569 | $ | 6,508 | $ | 943 | $ | (53 | ) | $ | 7,967 | ||||||||
Liabilities at fair value: | |||||||||||||||||||
Long-term debt (7) | $ | — | $ | 18,000 | $ | — | $ | — | $ | 18,000 | |||||||||
Derivatives relating to: (6) | |||||||||||||||||||
Interest Rates | — | 4 | — | — | 4 | ||||||||||||||
Commodities | 6 | 256 | — | (14 | ) | 248 | |||||||||||||
Foreign currency | — | 84 | — | (52 | ) | 32 | |||||||||||||
Total liabilities at fair value | $ | 6 | $ | 18,344 | $ | — | $ | (66 | ) | $ | 18,284 | ||||||||
(1) | Counterparty and cash collateral amounts represent the estimated net settlement amount when applying netting and set-off rights included in master netting arrangements between the Company and its counterparties and the cash collateral placed with the same counterparty. |
(2) | Treasury Bills and money market funds included in "Cash and cash equivalents" in the consolidated balance sheets and held at amortized cost, which approximates fair value. |
(3) | Included in "Accounts and notes receivable – Other" in the consolidated balance sheets. See Note 16 for additional information on transfers of financial assets. |
(4) | The Company’s investments in equity and debt securities are primarily classified as available-for-sale and are included in “Other investments” in the consolidated balance sheets. |
(5) | U.S. Treasury obligations, U.S. agency obligations, agency mortgage-backed securities and other municipalities’ obligations. |
(6) | See Note 11 for the classification of derivatives in the consolidated balance sheets. |
(7) | See Note 11 for information on fair value measurements of long-term debt. |
Assets and liabilities related to forward contracts, interest rate swaps, currency swaps, options and other conditional or exchange contracts executed with the same counterparty under a master netting arrangement are netted. Collateral accounts are netted with corresponding liabilities. The Company posted cash collateral of less than $1 million at December 31, 2016 ($26 million of cash collateral at December 31, 2015).
For assets and liabilities classified as Level 1 measurements (measured using quoted prices in active markets), total fair value is either the price of the most recent trade at the time of the market close or the official close price, as defined by the exchange on which the asset is most actively traded on the last trading day of the period, multiplied by the number of units held without consideration of transaction costs.
For assets and liabilities classified as Level 2 measurements, where the security is frequently traded in less active markets, fair value is based on the closing price at the end of the period; where the security is less frequently traded, fair value is based on the price a dealer would pay for the security or similar securities, adjusted for any terms specific to that asset or liability, or by using observable market data points of similar, more liquid securities to imply the price. Market inputs are obtained from well-established and recognized vendors of market data and subjected to tolerance and quality checks.
For derivative assets and liabilities, standard industry models are used to calculate the fair value of the various financial instruments based on significant observable market inputs, such as foreign exchange rates, commodity prices, swap rates, interest rates and implied volatilities obtained from various market sources. Market inputs are obtained from well-established and recognized vendors of market data and subjected to tolerance/quality checks.
For all other assets and liabilities for which observable inputs are used, fair value is derived through the use of fair value models, such as a discounted cash flow model or other standard pricing models. See Note 11 for further information on the types of instruments used by the Company for risk management.
105
There were no transfers between Levels 1 and 2 during the years ended December 31, 2016 and December 31, 2015.
For assets classified as Level 3 measurements, the fair value is based on significant unobservable inputs including assumptions where there is little, if any, market activity. The fair value of the Company’s interests held in trade receivable conduits is determined by calculating the expected amount of cash to be received using the key input of anticipated credit losses in the portfolio of receivables sold that have not yet been collected. Given the short-term nature of the underlying receivables, discount rate and prepayments are not factors in determining the fair value of the interests. See Note 16 for further information on assets classified as Level 3 measurements.
The following table summarizes the changes in fair value measurements using Level 3 inputs for the years ended December 31, 2016 and 2015:
Fair Value Measurements Using Level 3 Inputs for Interests Held in Trade Receivable Conduits (1) | 2016 | 2015 | |||||
In millions | |||||||
Balance at January 1 | $ | 943 | $ | 1,328 | |||
Gain (Loss) included in earnings (2) | (1 | ) | 2 | ||||
Purchases | 1,552 | 647 | |||||
Settlements | (1,257 | ) | (1,034 | ) | |||
Balance at December 31 | $ | 1,237 | $ | 943 | |||
(1) | Included in "Accounts and notes receivable – Other" in the consolidated balance sheets. |
(2) | Included in "Selling, general and administrative expenses" in the consolidated statements of income. |
Fair Value Measurements on a Nonrecurring Basis
The following table summarizes the basis used to measure certain assets and liabilities at fair value on a nonrecurring basis in the consolidated balance sheets in 2016, 2015 and 2014:
Basis of Fair Value Measurements on a Nonrecurring Basis at December 31 | Quoted Prices in Active Markets for Identical Items | Significant Other Unobservable Inputs | ||||||||
In millions | (Level 1) | (Level 3) | Total Losses | |||||||
2016 | ||||||||||
Assets at fair value: | ||||||||||
Long-lived assets, other assets and equity method investments | $ | 46 | $ | — | $ | (296 | ) | |||
2015 | ||||||||||
Assets at fair value: | ||||||||||
Long-lived assets, equity method investments, investments and other assets | $ | — | $ | 24 | $ | (313 | ) | |||
2014 | ||||||||||
Assets at fair value: | ||||||||||
Long-lived assets and other assets | $ | — | $ | 4 | $ | (73 | ) | |||
2016 Fair Value Measurements on a Nonrecurring Basis
As part of the 2016 restructuring plan, the Company has or will shut down a number of manufacturing and corporate facilities. The manufacturing facilities and related assets, corporate facilities and data centers associated with this plan were written down to zero in the second quarter of 2016. The Company also rationalized its aircraft fleet in the second quarter of 2016. Certain aircraft, classified as a Level 3 measurement, were considered held for sale and written down to fair value, using unobservable inputs, including assumptions a market participant would use to measure the fair value of the aircraft. The aircraft were subsequently sold during the second half of 2016. The impairment charges related to the 2016 restructuring plan, totaling$153 million, were included in "Restructuring charges (credits)" in the consolidated statements of income. See Note 3 for additional information on the Company's restructuring activities.
The Company recognized an impairment charge of $143 million in the fourth quarter of 2016, related to its equity interest in AFSI. This investment, classified as a Level 1 measurement, was written down to $46 million using quoted prices in an active market. The impairment charge was included in “Sundry income (expense) - net" in the consolidated statements of income and reflected in Agricultural Sciences. See Notes 5, 9 and 13 for additional information.
106
2015 Fair Value Measurements on a Nonrecurring Basis
As part of the 2015 restructuring plan that was approved on April 29, 2015, the Company has or will shut down a number of manufacturing facilities. The manufacturing assets and facilities associated with this plan, classified as Level 3 measurements, were written down to $7 million using unobservable inputs, including assumptions a market participant would use to measure the fair value of the group of assets. In addition, a change in the Company's strategy to monetize and exit certain Venture Capital portfolio investments resulted in the write-down of certain investments. These investments, also classified as Level 3 measurements, were valued at $17 million using unobservable inputs, including assumptions a market participant would use to measure the fair value of the investment. These impairment charges, totaling $169 million, are included in "Restructuring charges (credits)" in the consolidated statements of income.
As a result of the Company’s continued actions to optimize its footprint, the Company recognized an impairment charge of $144 million in the fourth quarter of 2015, related to manufacturing assets and facilities and an equity method investment. These assets, classified as Level 3 measurements, were written down to zero. The impairment charges were included in "Cost of sales" ($91 million) and "Sundry income (expense) - net" ($53 million) in the consolidated statements of income and reflected in Infrastructure Solutions ($87 million) and Performance Plastics ($57 million).
2014 Fair Value Measurements on a Nonrecurring Basis
As a result of weakening demand for certain optical and ceramic technologies, the Company recognized a $73 million asset impairment charge in the fourth quarter of 2014 in the Dow Electronic Materials business. The charge was included in "Cost of sales" ($23 million) and "Goodwill and other intangible asset impairment losses" ($50 million) in the consolidated statements of income and reflected in Consumer Solutions. The assets, classified as Level 3 measurements, were written down to $4 million based on a valuation using unobservable inputs, including assumptions a market participant would use to measure the fair value of the group of assets, which included projected cash flows.
107
NOTE 13 – SUPPLEMENTARY INFORMATION
Sundry Income (Expense) – Net | ||||||||||||
In millions | 2016 | 2015 | 2014 | |||||||||
Gain on sales of other assets and investments | $ | 170 | $ | 237 | $ | 40 | ||||||
Foreign exchange losses | (126 | ) | (191 | ) | (61 | ) | ||||||
Gain on ownership restructure of Dow Corning (1) | 2,445 | — | — | |||||||||
Settlement of the urethane matters class action lawsuit and opt-out cases (2) | (1,235 | ) | — | — | ||||||||
Loss on partial impairment of equity interest in AgroFresh (3) | (143 | ) | — | — | ||||||||
Costs associated with transactions and productivity actions (4) | (41 | ) | (119 | ) | (49 | ) | ||||||
Implant liability adjustment | 27 | — | — | |||||||||
Gain (Loss) on divestiture of AgroFresh business (3) (5) | (25 | ) | 618 | — | ||||||||
Impact of split-off of chlorine value chain (6) | 6 | 2,233 | — | |||||||||
Gain (Loss) on sale of MEGlobal (3) | (1 | ) | 723 | — | ||||||||
Gain on sale of Agricultural Sciences subsidiary (7) | — | 44 | — | |||||||||
Gain on divestiture of ANGUS Chemical Company (3) | — | 682 | — | |||||||||
Gain on Univation step acquisition (1) | — | 361 | — | |||||||||
Gain on divestiture of Sodium Borohydride business (3) | — | 20 | — | |||||||||
Loss on early extinguishment of debt (8) | — | (8 | ) | — | ||||||||
Gain on termination of ethylene off-take agreement | — | — | 53 | |||||||||
Gain on sale of Polypropylene Licensing and Catalysts business (3) | — | — | 5 | |||||||||
Reclassification of cumulative translation adjustments | — | (4 | ) | (12 | ) | |||||||
Other - net | 125 | (4 | ) | (3 | ) | |||||||
Total sundry income (expense) – net | $ | 1,202 | $ | 4,592 | $ | (27 | ) | |||||
(1) | See Note 4 for additional information. |
(2) | See Note 15 for additional information. |
(3) | See Note 5 for additional information. |
(4) | Transaction costs associated with the separation of the chlorine value chain. |
(5) | Includes a $5 million loss in 2016 ($8 million loss in 2015) on mark-to-market adjustments related to warrants. |
(6) | See Note 6 for additional information. |
(7) | See Note 20 for additional information. |
(8) | Excludes $68 million related to the split-off of the chlorine value chain. See Notes 6 and 17 for additional information. |
Other Income Statement Information | ||||||||||||
In millions | 2016 | 2015 (1) | 2014 | |||||||||
Provision for doubtful receivables (2) | $ | 22 | $ | 1 | $ | 52 | ||||||
(1) | Dow's provision for doubtful accounts was lower in 2015 due to the adjustment of certain reserve rates based on historical write-off experience, the impact of lower selling prices and the impact of divestitures. |
(2) | Included in “Selling, general and administrative expenses” in the consolidated statements of income. |
Supplemental Disclosure of Cash Flow Information | ||||||||||||
In millions | 2016 | 2015 | 2014 | |||||||||
Cash payments for interest | $ | 1,192 | $ | 1,137 | $ | 1,038 | ||||||
Cash payments for income taxes | $ | 1,592 | $ | 1,405 | $ | 1,109 | ||||||
Accrued and Other Current Liabilities
“Accrued and other current liabilities” were $3,669 million at December 31, 2016 and $3,212 million at December 31, 2015. Accrued payroll, which is a component of “Accrued and other current liabilities,” was $1,105 million at December 31, 2016 and $1,120 million at December 31, 2015. No other component of accrued liabilities was more than 5 percent of total current liabilities.
108
Other Investments
The Company has investments in company-owned life insurance policies, which are recorded at their cash surrender value as of each balance sheet date, as provided below:
Investments in Company-owned Life Insurance at December 31 | |||||||
In millions | 2016 | 2015 | |||||
Gross cash value | $ | 834 | $ | 850 | |||
Less: Outstanding borrowings | 59 | 58 | |||||
Investment in Company-owned life insurance (1) | $ | 775 | $ | 792 | |||
(1) Classified as "Other investments" in the consolidated balance sheets.
In 2015, the Company repaid $697 million of principal outstanding loan amounts plus accrued interest, which is reflected in "Purchases of investments" in the consolidated statements of cash flows.
109
NOTE 14 – EARNINGS PER SHARE CALCULATIONS
The following tables provide the earnings per share calculations for the years ended December 31, 2016, 2015 and 2014:
Net Income for Earnings Per Share Calculations - Basic In millions | 2016 | 2015 | 2014 | |||||||||
Net income attributable to The Dow Chemical Company | $ | 4,318 | $ | 7,685 | $ | 3,772 | ||||||
Preferred stock dividends | (340 | ) | (340 | ) | (340 | ) | ||||||
Net income attributable to participating securities (1) | (22 | ) | (51 | ) | (27 | ) | ||||||
Net income attributable to common stockholders | $ | 3,956 | $ | 7,294 | $ | 3,405 | ||||||
Earnings Per Share Calculations - Basic Dollars per share | 2016 | 2015 | 2014 | |||||||||
Net income attributable to The Dow Chemical Company | $ | 3.90 | $ | 6.80 | $ | 3.22 | ||||||
Preferred stock dividends | (0.31 | ) | (0.30 | ) | (0.29 | ) | ||||||
Net income attributable to participating securities (1) | (0.02 | ) | (0.05 | ) | (0.02 | ) | ||||||
Net income attributable to common stockholders | $ | 3.57 | $ | 6.45 | $ | 2.91 | ||||||
Net Income for Earnings Per Share Calculations - Diluted In millions | 2016 | 2015 | 2014 | |||||||||
Net income attributable to The Dow Chemical Company | $ | 4,318 | $ | 7,685 | $ | 3,772 | ||||||
Preferred stock dividends (2) | (340 | ) | — | (340 | ) | |||||||
Net income attributable to participating securities (1) | (22 | ) | (51 | ) | (27 | ) | ||||||
Net income attributable to common stockholders | $ | 3,956 | $ | 7,634 | $ | 3,405 | ||||||
Earnings Per Share Calculations - Diluted Dollars per share | 2016 | 2015 | 2014 | |||||||||
Net income attributable to The Dow Chemical Company | $ | 3.84 | $ | 6.19 | $ | 3.18 | ||||||
Preferred stock dividends (2) | (0.30 | ) | — | (0.29 | ) | |||||||
Net income attributable to participating securities (1) | (0.02 | ) | (0.04 | ) | (0.02 | ) | ||||||
Net income attributable to common stockholders | $ | 3.52 | $ | 6.15 | $ | 2.87 | ||||||
Share Count Information Shares in millions | 2016 | 2015 | 2014 | ||||||
Weighted-average common shares - basic (3) | 1,108.1 | 1,130.1 | 1,170.9 | ||||||
Plus dilutive effect of stock options and awards | 15.1 | 14.5 | 16.1 | ||||||
Plus dilutive effect of preferred stock (4) | — | 96.8 | — | ||||||
Weighted-average common shares - diluted | 1,123.2 | 1,241.4 | 1,187.0 | ||||||
Stock options and deferred stock awards excluded from EPS calculations (5) | 1.9 | 4.6 | 5.8 | ||||||
(1) | Deferred stock awards are considered participating securities due to Dow's practice of paying dividend equivalents on unvested shares. |
(2) | Preferred stock dividends were not added back in the calculation of diluted earnings per share for the periods ended December 31, 2016 and December 31, 2014, because the effect of an assumed conversion of the Company's Cumulative Convertible Perpetual Preferred Stock, Series A ("Preferred Stock") would have been antidilutive. |
(3) | On December 30, 2016, the Company converted 4 million shares of Preferred Stock into 96.8 million shares of the Company's common stock. As a result of this conversion, 0.5 million shares of common stock are included in "Weighted-average common shares - basic" for the period ended December 31, 2016. |
(4) | The calculation of diluted earnings per share for the period ending December 31, 2016, excludes 96.3 million shares of common stock because the effect of an assumed conversion of Preferred Stock for the full period would have been antidilutive (excludes 96.8 million shares for the period ended December 31, 2014). |
(5) | These deferred stock awards and outstanding options to purchase shares of common stock were excluded from the calculation of diluted earnings per share because the effect of including them would have been antidilutive. |
110
NOTE 15 – COMMITMENTS AND CONTINGENT LIABILITIES
Environmental Matters
Introduction
Accruals for environmental matters are recorded when it is probable that a liability has been incurred and the amount of the liability can be reasonably estimated based on current law and existing technologies. At December 31, 2016, the Company had accrued obligations of $909 million for probable environmental remediation and restoration costs, including $151 million for the remediation of Superfund sites. These obligations are included in "Accrued and other current liabilities" and "Other noncurrent obligations" in the consolidated balance sheets. This is management’s best estimate of the costs for remediation and restoration with respect to environmental matters for which the Company has accrued liabilities, although it is reasonably possible that the ultimate cost with respect to these particular matters could range up to approximately two times that amount. Consequently, it is reasonably possible that environmental remediation and restoration costs in excess of amounts accrued could have a material impact on the Company’s results of operations, financial condition and cash flows. It is the opinion of the Company’s management, however, that the possibility is remote that costs in excess of the range disclosed will have a material impact on the Company’s results of operations, financial condition or cash flows. Inherent uncertainties exist in these estimates primarily due to unknown conditions, changing governmental regulations and legal standards regarding liability, and emerging remediation technologies for handling site remediation and restoration. At December 31, 2015, the Company had accrued obligations of $670 million for probable environmental remediation and restoration costs, including $74 million for the remediation of Superfund sites.
In the fourth quarter of 2016, the Company recorded a pretax charge of $295 million for environmental remediation at a number of historical locations, including the Midland manufacturing site/off-site matters and the Wood-Ridge sites, primarily resulting from the culmination of negotiations with regulators and/or final agency approval. These charges are included in "Cost of sales" in the consolidated statements of income and are included in the total accrued obligation of $909 million.
The following table summarizes the activity in the Company's accrued obligations for environmental matters for the years ended December 31, 2016 and 2015:
Accrued Obligations for Environmental Matters | |||||||
In millions | 2016 | 2015 | |||||
Balance at January 1 | $ | 670 | $ | 706 | |||
Accrual adjustment | 479 | 230 | |||||
Payments against reserve | (246 | ) | (233 | ) | |||
Foreign currency impact | 6 | (33 | ) | ||||
Balance at December 31 | $ | 909 | $ | 670 | |||
The amounts charged to income on a pretax basis related to environmental remediation totaled $504 million in 2016, $218 million in 2015 and $227 million in 2014. Capital expenditures for environmental protection were $66 million in 2016, $49 million in 2015 and $78 million in 2014.
Midland Off-Site Environmental Matters
On June 12, 2003, the Michigan Department of Environmental Quality ("MDEQ") issued a Hazardous Waste Operating License (the "License") to the Company’s Midland, Michigan manufacturing site (the “Midland site”), which was renewed and replaced by the MDEQ on September 25, 2015, and included provisions requiring the Company to conduct an investigation to determine the nature and extent of off-site contamination in the City of Midland soils, the Tittabawassee River and Saginaw River sediment and floodplain soils, and the Saginaw Bay, and, if necessary, undertake remedial action.
City of Midland
On March 6, 2012, the Company submitted an Interim Response Activity Plan Designed to Meet Criteria ("Work Plan") to the MDEQ that involved the sampling of soil at residential properties near the Midland site for the presence of dioxins to determine where clean-up may be required and then conducting remediation for properties that sampled above the remediation criteria. The MDEQ approved the Work Plan on June 1, 2012 and implementation of the Work Plan began on June 4, 2012. The Company also submitted and had approved by the MDEQ, amendments to the Work Plan. As of December 31, 2014, remediation was completed on all 132 properties that tested above the remediation criteria, and this completion is noted in the License. On July 21, 2016, the MDEQ approved a Corrective Action report, including a Remedial Action Plan ("RAP"), for the City of Midland. This is the final regulatory approval required for the City of Midland. Dow is implementing the monitoring and maintenance requirements of the RAP.
111
Tittabawassee and Saginaw Rivers, Saginaw Bay
The Company, the U.S. Environmental Protection Agency (“EPA”) and the State of Michigan ("State") entered into an administrative order on consent (“AOC”), effective January 21, 2010, that requires the Company to conduct a remedial investigation, a feasibility study and a remedial design for the Tittabawassee River, the Saginaw River and the Saginaw Bay, and pay the oversight costs of the EPA and the State under the authority of the Comprehensive Environmental Response, Compensation, and Liability Act. These actions, to be conducted under the lead oversight of the EPA, will build upon the investigative work completed under the State Resource Conservation Recovery Act program from 2005 through 2009.
The Tittabawassee River, beginning at the Midland Site and extending down to the first six miles of the Saginaw River, are designated as the first Operable Unit for purposes of conducting the remedial investigation, feasibility study and remedial design work. This work will be performed in a largely upriver to downriver sequence for eight geographic segments of the Tittabawassee and upper Saginaw Rivers. In the first quarter of 2012, the EPA requested the Company address the Tittabawassee River floodplain ("Floodplain") as an additional segment. In August 2014, the EPA proposed for public comment the techniques that can be used to remedy the Floodplain, including proposed site specific clean-up criteria. In January 2015, the Company and the EPA entered into an order to address remediation of the Floodplain. The remedial work is expected to take place over the next five years. The remainder of the Saginaw River and the Saginaw Bay are designated as a second Operable Unit and the work associated with that unit may also be geographically segmented. The AOC does not obligate the Company to perform removal or remedial action; that action can only be required by a separate order. The Company and the EPA will be negotiating orders separate from the AOC that will obligate the Company to perform remedial actions under the scope of work of the AOC. The Company and the EPA have entered into three separate orders to perform limited remedial actions to implement early actions - three separate orders to address remedial actions in three of the nine geographic segments in the first Operable Unit - and the order to address the Floodplain.
Alternative Dispute Resolution Process
The Company, the EPA, the U.S. Department of Justice, and the natural resource damage trustees (which include the Michigan Office of the Attorney General, the MDEQ, the U.S. Fish and Wildlife Service, the U.S. Bureau of Indian Affairs and the Saginaw-Chippewa tribe) have been engaged in negotiations to seek to resolve potential governmental claims against the Company related to historical off-site contamination associated with the City of Midland, the Tittabawassee and Saginaw Rivers and the Saginaw Bay. The Company and the governmental parties started meeting in the fall of 2005 and entered into a Confidentiality Agreement in December 2005. The Company continues to conduct negotiations under the Federal Alternative Dispute Resolution Act with all of the governmental parties, except the EPA which withdrew from the alternative dispute resolution process on September 12, 2007.
On September 28, 2007, the Company and the natural resource damage trustees entered into a Funding and Participation Agreement that addressed the Company’s payment of past costs incurred by the natural resource damage trustees, payment of the costs of a trustee coordinator and a process to review additional cooperative studies that the Company might agree to fund or conduct with the natural resource damage trustees. On March 18, 2008, the Company and the natural resource damage trustees entered into a Memorandum of Understanding ("MOU") to provide a mechanism for the Company to fund cooperative studies related to the assessment of natural resource damages. This MOU was amended and funding of cooperative studies was extended until March 2014. All cooperative studies have been completed. On April 7, 2008, the natural resource damage trustees released their “Natural Resource Damage Assessment Plan for the Tittabawassee River System Assessment Area.”
At December 31, 2016, the accrual for these off-site matters was $93 million (included in the total accrued obligation of $909 million). At December 31, 2015, the Company had an accrual for these off-site matters of $62 million (included in the total accrued obligation of $670 million).
Environmental Matters Summary
It is the opinion of the Company’s management that the possibility is remote that costs in excess of those disclosed will have a material impact on the Company’s results of operations, financial condition or cash flows.
112
Litigation
Asbestos-Related Matters of Union Carbide Corporation
Introduction
Union Carbide is and has been involved in a large number of asbestos-related suits filed primarily in state courts during the past four decades. These suits principally allege personal injury resulting from exposure to asbestos-containing products and frequently seek both actual and punitive damages. The alleged claims primarily relate to products that Union Carbide sold in the past, alleged exposure to asbestos-containing products located on Union Carbide’s premises, and Union Carbide’s responsibility for asbestos suits filed against a former Union Carbide subsidiary, Amchem. In many cases, plaintiffs are unable to demonstrate that they have suffered any compensable loss as a result of such exposure, or that injuries incurred in fact resulted from exposure to Union Carbide’s products.
Union Carbide expects more asbestos-related suits to be filed against Union Carbide and Amchem in the future, and will aggressively defend or reasonably resolve, as appropriate, both pending and future claims.
Estimating the Liability for Asbestos-Related Pending and Future Claims
Based on a study completed in January 2003 by Analysis, Research & Planning Corporation (now known as Ankura Consulting Group, LLC ("Ankura") as a result of the March 2016 merger of Analysis, Research & Planning Corporation and Ankura), Union Carbide increased its December 31, 2002 asbestos-related liability for pending and future claims for a 15-year period ending in 2017 to $2.2 billion, excluding future defense and processing costs. Since then, Union Carbide has compared current asbestos claim and resolution activity to the results of the most recent Ankura study at each balance sheet date to determine whether the accrual continues to be appropriate. In addition, Union Carbide has requested Ankura to review Union Carbide’s historical asbestos claim and resolution activity each year since 2004 to determine the appropriateness of updating the most recent Ankura study.
In October 2014, Union Carbide requested Ankura to review its historical asbestos claim and resolution activity and determine the appropriateness of updating its December 2012 study. In response to that request, Ankura reviewed and analyzed data through September 30, 2014. The resulting study, completed by Ankura in December 2014, estimated the undiscounted cost of disposing of pending and future claims against Union Carbide and Amchem, excluding future defense and processing costs, was between $540 million and $640 million through 2029 based on the data as of September 30, 2014.
In December 2014, based on Ankura's December 2014 study and Union Carbide's own review of the asbestos claim and resolution activity, Union Carbide determined that an adjustment to the accrual was required due to the increase in mesothelioma claim activity compared with what had been forecasted in the December 2012 study. Accordingly, Union Carbide increased its asbestos-related liability for pending and future claims by $78 million, which was included in "Asbestos-related charge" in the consolidated statements of income. At December 31, 2014, the asbestos-related liability for pending and future claims was $513 million, and approximately 22 percent of the recorded liability related to pending claims and approximately 78 percent related to future claims.
In October 2015, Union Carbide requested Ankura to review its historical asbestos claim and resolution activity and determine the appropriateness of updating its December 2014 study. In response to that request, Ankura reviewed and analyzed data through September 30, 2015. In December 2015, Ankura stated that an update of its December 2014 study would not provide a more likely estimate of future events than the estimate reflected in the study and, therefore, the estimate in that study remained applicable. Based on Union Carbide's own review of the asbestos claim and resolution activity and Ankura's response, Union Carbide determined that no change to the accrual was required. At December 31, 2015, the asbestos-related liability for pending and future claims was $437 million, and approximately 21 percent of the recorded liability related to pending claims and approximately 79 percent related to future claims.
In October 2016, Union Carbide requested Ankura to review its historical asbestos claim and resolution activity and determine the appropriateness of updating its December 2014 study. In response to the request, Ankura reviewed and analyzed asbestos-related claim and resolution data through September 30, 2016. The resulting study, completed by Ankura in December 2016, provided estimates for the undiscounted cost of disposing of pending and future claims against Union Carbide and Amchem, excluding future defense and processing costs, for both a 15-year period and through the terminal year of 2049.
Based on the study completed in December 2016 by Ankura, and Union Carbide's own review of the asbestos claim and resolution activity, it was determined that an adjustment to the accrual was necessary. Union Carbide determined that using the estimate through the terminal year of 2049 was more appropriate due to increasing knowledge and data about the costs to resolve claims and diminished volatility in filing rates. Using the range in the Ankura December 2016 study, which was estimated to be between $502 million and $565 million for the undiscounted cost of disposing of pending and future claims, Union Carbide increased its asbestos-related liability for pending and future claims through the terminal year of 2049 by
113
$104 million, included in "Asbestos-related charge" in the consolidated statements of income. At December 31, 2016, Union Carbide's asbestos-related liability for pending and future claims was $486 million, and approximately 14 percent of the recorded liability related to pending claims and approximately 86 percent related to future claims.
Estimating the Asbestos-Related Liability for Defense and Processing Costs
In September 2014, Union Carbide began to implement a strategy designed to reduce and to ultimately stabilize and forecast defense costs associated with asbestos-related matters. The strategy included a number of important changes including: invoicing protocols including capturing costs by plaintiff; review of existing counsel roles, work processes and workflow; and the utilization of enterprise legal management software, which enabled claim-specific tracking of asbestos-related defense and processing costs. Union Carbide reviewed the information generated from this new strategy and determined that it now had the ability to reasonably estimate asbestos-related defense and processing costs for the same periods that it estimates its asbestos-related liability for pending and future claims. Union Carbide believes that including estimates of the liability for asbestos-related defense and processing costs provides a more complete assessment and measure of the liability associated with resolving asbestos-related matters, which Union Carbide and the Company believe is preferable in these circumstances.
In October 2016, in addition to the study for asbestos claim and resolution activity, Union Carbide requested Ankura to review asbestos-related defense and processing costs and provide an estimate of defense and processing costs associated with resolving pending and future asbestos-related claims facing Union Carbide and Amchem for the same periods of time that Union Carbide uses for estimating resolution costs. In December 2016, Ankura conducted the study and provided Union Carbide with an estimate of future defense and processing costs for both a 15-year period and through the terminal year of 2049. The resulting study estimated asbestos-related defense and processing costs for pending and future asbestos claims to be between $1,009 million and $1,081 million through the terminal year of 2049.
In the fourth quarter of 2016, Union Carbide and the Company elected to change their method of accounting for asbestos-related defense and processing costs from expensing as incurred to estimating and accruing a liability. This change is believed to be preferable as asbestos-related defense and processing costs represent expenditures related to legacy activities that do not contribute to current or future revenue generating activities of the Company. The change is also reflective of the manner in which Union Carbide manages its asbestos-related exposure, including careful monitoring of the correlation between defense spending and resolution costs. Together, these two sources of cost more accurately represent the “total cost” of resolving asbestos-related claims now and in the future.
This accounting policy change has been reflected as a change in accounting estimate effected by a change in accounting principle. As a result of this accounting policy change and based on the December 2016 Ankura study of asbestos-related defense and processing costs and Union Carbide's own review of the data, Union Carbide recorded a pretax charge for asbestos-related defense and processing costs of $1,009 million in the fourth quarter of 2016, included in “Asbestos-related charge” in the consolidated statements of income. Union Carbide’s total asbestos-related liability, including defense and processing costs, was $1,490 million at December 31, 2016, and was included in “Accrued and other current liabilities” and “Asbestos-related liabilities - noncurrent” in the consolidated balance sheets.
Insurance Receivables
Union Carbide has receivables for insurance recoveries related to its asbestos liability as well as receivables for defense and resolution costs submitted to insurance carriers that have settlement agreements in place regarding their asbestos-related insurance coverage. Union Carbide continues to believe that its recorded receivable for insurance recoveries from all insurance carriers is probable of collection. At December 31, 2016, Union Carbide’s receivable for insurance recoveries related to its asbestos liability and defense and resolution costs was $41 million ($61 million at December 31, 2015).
Summary
The Company’s management believes the amounts recorded by Union Carbide for the asbestos-related liability (including defense and processing costs) reflect reasonable and probable estimates of the liability based upon current, known facts. However, future events, such as the number of new claims to be filed and/or received each year and the average cost of defending and disposing of each such claim, as well as the numerous uncertainties surrounding asbestos litigation in the United States, could cause the actual costs for Union Carbide to be higher or lower than those projected or those recorded. Any such events could result in an increase or decrease in the recorded liability.
114
Urethane Matters
Class Action Lawsuit
On February 16, 2006, the Company, among others, received a subpoena from the U.S. Department of Justice ("DOJ") as part of a previously announced antitrust investigation of manufacturers of polyurethane chemicals, including methylene diphenyl diisocyanate, toluene diisocyanate, polyether polyols and system house products. The Company cooperated with the DOJ and, following an extensive investigation, on December 10, 2007, the Company received notice from the DOJ that it had closed its investigation of potential antitrust violations involving these products without indictments or pleas.
In 2005, the Company, among others, was named as a defendant in multiple civil class action lawsuits alleging a conspiracy to fix the price of various urethane chemical products, namely the products that were the subject of the above described DOJ antitrust investigation. On July 29, 2008, a Kansas City federal district court (the "district court") certified a class of purchasers of the products for the six-year period from 1999 through 2004 ("plaintiff class"). In January 2013, the class action lawsuit went to trial with the Company as the sole remaining defendant, the other defendants having previously settled. On February 20, 2013, the federal jury returned a damages verdict of approximately $400 million against the Company, which ultimately was trebled under applicable antitrust laws, less offsets from other settling defendants, resulting in a judgment entered in July 2013 in the amount of $1.06 billion. The Company appealed this judgment to the U.S. Tenth Circuit Court of Appeals ("Tenth Circuit" or "Court of Appeals"), and on September 29, 2014, the Court of Appeals issued an opinion affirming the district court judgment.
On March 9, 2015, the Company filed a petition for writ of certiorari ("Writ Petition") with the U.S. Supreme Court, seeking judicial review and requesting that it correct fundamental errors in the Circuit Court opinion. On June 8, 2015, the Supreme Court granted a petition for a writ of certiorari in another case, Tyson Foods, Inc. v. Bouaphakeo, PEG, et al., ("Tyson Foods") (Supreme Court No. 14-1146), which presented an issue core to the questions presented in the Company's Writ Petition: whether class-wide damages can be determined by simply applying the average injury observed in a sample. The Company was advised that its Writ Petition was being held pending the Supreme Court's consideration of the merits in Tyson Foods.
In the first quarter of 2016, the Company changed its risk assessment on this matter as a result of growing political uncertainties due to events within the Supreme Court, including Justice Scalia's death, and the increased likelihood for unfavorable outcomes for businesses involved in class action lawsuits. On February 26, 2016, the Company announced a proposed settlement under which the Company would pay the plaintiff class $835 million, which included damages, class attorney fees and post-judgment interest. The district court granted final approval of the settlement on July 29, 2016, and the settlement amount, having previously been funded by the Company into an escrow account, was released to a court administrator for distribution to the various class members. The settlement resolves the $1.06 billion judgment and any subsequent claim for attorneys' fees, costs and post-judgment interest against the Company. As a result, in the first quarter of 2016, the Company recorded a loss of $835 million, included in "Sundry income (expense) - net" in the consolidated statements of income and reflected in the Performance Materials & Chemicals segment. The Company continues to believe that it was not part of any conspiracy and the judgment was fundamentally flawed as a matter of class action law.
Opt-Out Cases
Shortly after the July 2008 class certification ruling, a series of "opt-out" cases were filed by a number of large volume purchasers who elected not to be class members in the district court case. These opt-out cases were substantively identical to the class action lawsuit, but expanded the period of time to include 1994 through 1998. A consolidated jury trial of the opt-out cases began on March 8, 2016. Prior to a jury verdict, on April 5, 2016, the Company entered into a binding settlement for the opt-out cases under which the Company would pay the named plaintiffs $400 million, inclusive of damages and attorney fees. Payment of this settlement occurred on May 4, 2016. The Company changed its risk assessment on this matter as a result of the class settlement and the uncertainty of a jury trial outcome along with the automatic trebling of an adverse verdict. As a result, the Company recorded a loss of $400 million in the first quarter of 2016, included in "Sundry income (expense) - net" in the consolidated statements of income and reflected in the Performance Materials & Chemicals segment. As with the class action case, the Company continues to deny allegations of price fixing and maintains that it was not part of any conspiracy.
Bayer CropScience v. Dow AgroSciences ICC Arbitration
On August 13, 2012, Bayer CropScience AG and Bayer CropScience NV (together, “Bayer”) filed a request for arbitration with the International Chamber of Commerce ("ICC") International Court of Arbitration against Dow AgroSciences LLC, a wholly owned subsidiary of the Company, and other subsidiaries of the Company (collectively, “DAS”) under a 1992 license agreement executed by predecessors of the parties (the “License Agreement”). In its request for arbitration, Bayer alleged that (i) DAS breached the License Agreement, (ii) the License Agreement was properly terminated with no ongoing rights to DAS, (iii) DAS has infringed and continues to infringe its patent rights related to the use of the pat gene in certain soybean and cotton seed products, and (iv) Bayer is entitled to monetary damages and injunctive relief. DAS denied that it breached the License Agreement and asserted that the License Agreement remained in effect because it was not properly terminated. DAS also
115
asserted that all of Bayer’s patents at issue are invalid and/or not infringed, and, therefore, for these reasons (and others), a license was not required. During the pendency of the arbitration proceeding, DAS filed six re-examination petitions with the United States Patent & Trademark Office (“USPTO”) against the Bayer patents, asserting that each patent is invalid based on the doctrine against double-patenting and/or prior art. The USPTO granted all six petitions, and, on February 26, 2015, the USPTO issued an office action rejecting the patentability of the sole Bayer patent claim in the only asserted Bayer patent that has not expired (the "'962 patent") and that forms the basis for the vast majority of the damages in the arbitral award discussed below.
A three-member arbitration tribunal presided over the arbitration proceeding (the “tribunal”). In a decision dated October 9, 2015, the tribunal determined that (i) DAS breached the License Agreement, (ii) Bayer properly terminated the License Agreement, (iii) all of the patents remaining in the proceeding are valid and infringed, and (iv) that Bayer is entitled to monetary damages in the amount of $455 million inclusive of pre-judgment interest and costs (the “arbitral award”). One of the arbitrators, however, issued a partial dissent finding that all of the patents are invalid based on the double-patenting doctrine. The tribunal also denied Bayer’s request for injunctive relief. The arbitration award is not self-executing, and must be confirmed by a court for it to be enforceable and to have the legal effect of a judgment. On October 16, 2015, Bayer filed a motion in U.S. District Court for the Eastern District of Virginia ("federal district court") seeking to confirm the arbitral award. DAS opposed the motion and filed separate motions to vacate the award, or in the alternative, to stay enforcement of the award until the USPTO issues final office actions with respect to the re-examination proceedings. On January 15, 2016, the federal district court denied DAS' motions and confirmed the award. DAS has appealed the federal district court's decision, and DAS has posted a bond to stay enforcement of the award during the appeal. Briefing for the appeal is complete and oral argument at the U.S. Court of Appeals for the Federal Circuit has been scheduled for February 9, 2017.
The Company believes the arbitral award is fundamentally flawed in numerous respects and is confident that it will be vacated on appeal because it (i) violates U.S. public policy prohibiting enforcement of invalid patents, (ii) manifestly disregards applicable law, and (iii) disregards unambiguous contract provisions and ignores the essence of the applicable contracts. The Company continues to believe that Bayer’s patents are invalid for multiple reasons and that the damages awarded cannot be supported under prevailing patent law, including U.S. Supreme Court precedent. The USPTO has issued office actions rejecting the patentability of all four patents that Bayer asserted in the case. In January 2017, the USPTO issued final office actions for two of the patents asserted in the case, including the ‘962 patent, in which it rejected all relevant claims based on the doctrine against double-patenting. The re-examination proceedings with respect to the other two patents remain pending, although the Company anticipates that the USPTO will likewise invalidate those patents under the double-patenting doctrine. Although Bayer may appeal these decisions to the U.S. Patent Trial and Appeal Board, the Company believes the USPTO final office actions will provide a strong basis to vacate the arbitral award. If the federal appellate court denies the Company's appeal, the Company can seek judicial review by the U.S. Supreme Court.
As part of the Company’s review of the arbitral award, the Company assessed the legal and factual circumstances of the case, the record of the arbitration and USPTO re-examination status, and the applicable law to vacate the arbitral award. Based on this review and the reasons stated above, the Company has concluded it is not probable that a loss has been incurred and, therefore, a liability has not been recorded with respect to this matter. While the Company believes it is not probable that a loss has been incurred, the existence of the arbitral award and the federal district court confirmation of the award indicates that it is reasonably possible that a loss could occur. The estimate of the possible range of loss to the Company is zero to the $455 million amount set forth in the arbitral award (excluding post-judgment interest).
The arbitral award will not impact DAS’s commercialization of its soybean and cotton seed products, including those containing the ENLIST™ technologies.
Rocky Flats Matter
The Company and Rockwell International Corporation ("Rockwell") (collectively, the "defendants") were defendants in a class action lawsuit filed in 1990 on behalf of property owners ("plaintiffs") in Rocky Flats, Colorado, who asserted claims for nuisance and trespass based on alleged property damage caused by plutonium releases from a nuclear weapons facility owned by the U.S. Department of Energy ("DOE") (the "facility"). Dow and Rockwell were both DOE contractors that operated the facility - Dow from 1952 to 1975 and Rockwell from 1975 to 1989. The facility was permanently shut down in 1989.
In 1993, the United States District Court for the District of Colorado ("District Court") certified the class of property owners. The plaintiffs tried their case as a public liability action under the Price Anderson Act ("PAA"). In 2005, the jury returned a damages verdict of $926 million. Dow and Rockwell appealed the jury award to the U.S. Tenth Circuit Court of Appeals ("Court of Appeals") which concluded the PAA had its own injury requirements, on which the jury had not been instructed, and also vacated the District Court's class certification ruling, reversed and remanded the case, and vacated the District Court's judgment (Cook v. Rockwell Int'l Corp., 618 F.3d 1127, 1133 (10th Cir. 2010)). The plaintiffs argued on remand to the District
116
Court that they were entitled to reinstate the judgment as a state law nuisance claim, independent of the PAA. The District Court rejected that argument and entered judgment in favor of the defendants (Cook v. Rockwell Int'l Corp, 13 F. Supp. 3d 1153 (D. Colo. 2014)). The plaintiffs appealed to the Court of Appeals, which reversed the District Court's ruling, holding that the PAA did not preempt the plaintiffs' nuisance claim under Colorado law and that the plaintiffs could seek reinstatement of the prior nuisance verdict under Colorado law, and remanded for additional proceedings, including consideration of whether the District Court could recertify the class (Cook v. Rockwell Int'l Corp., 790 F.3d 1088 (10th Cir. 2015)).
Dow and Rockwell continued to litigate this matter in the District Court and in the United States Supreme Court. On May 18, 2016, Dow, Rockwell and the plaintiffs entered into a settlement agreement for $375 million, of which $131 million was to be paid by Dow and $244 million was to be paid by Rockwell (collectively, the "Settlement Agreement"). The DOE authorized the settlement pursuant to the PAA and the nuclear hazards indemnity provisions contained in Dow and Rockwell's contracts. The District Court granted preliminary approval to the class settlement on August 5, 2016. On December 13, 2016, the United States Civil Board of Contract Appeals unanimously ordered the United States government to pay the amounts stipulated in the Settlement Agreement. At December 31, 2016, the Company had a liability of $130 million related to this matter (having already paid $1 million towards class notice costs), included in "Accrued and other current liabilities" in the consolidated balance sheets and a receivable of $131 million, included in "Accounts and notes receivable - Other" in the consolidated balance sheets. On January 17, 2017, the Company received a full indemnity payment ($131 million) from the United States government for Dow's share of the class settlement. The Company subsequently funded an escrow account for the settlement payment owed to the plaintiffs, which will remain in escrow until the settlement is approved by the District Court and finalized. A fairness hearing on the class settlement is scheduled for April 28, 2017.
Dow Corning Chapter 11 Related Matters
Introduction
In 1995, Dow Corning, then a 50:50 joint venture between Dow and Corning Incorporated, voluntarily filed for protection under Chapter 11 of the U.S. Bankruptcy Code in order to resolve Dow Corning’s breast implant liabilities and related matters (the “Chapter 11 Proceeding”). Dow Corning emerged from the Chapter 11 Proceeding on June 1, 2004 (the “Effective Date”) and is implementing the Joint Plan of Reorganization (the “Plan”). The Plan provides funding for the resolution of breast implant and other product liability litigation covered by the Chapter 11 Proceeding and provides a process for the satisfaction of commercial creditor claims in the Chapter 11 Proceeding. As of June 1, 2016, Dow Corning is a wholly owned subsidiary of Dow.
Breast Implant and Other Product Liability Claims
The centerpiece of the Plan is a product liability settlement program administered by an independent claims office (the “Settlement Facility”). Product liability claimants rejecting the settlement program in favor of pursuing litigation must bring suit against a litigation facility (the “Litigation Facility”). Under the Plan, total payments committed by Dow Corning to resolving product liability claims are capped at a maximum $2,350 million net present value (“NPV”) determined as of the Effective Date using a discount rate of seven percent (approximately $3,600 million undiscounted at December 31, 2016). Of this amount, no more than $400 million NPV determined as of the Effective Date can be used to fund the Litigation Facility.
Dow Corning has an obligation to fund the Settlement Facility and the Litigation Facility over a 16-year period, commencing at the Effective Date. Under the Plan, Dow Corning is not required to remit additional funds to the Settlement Facility unless and until necessary to preserve liquidity. As of December 31, 2016, Dow Corning and its insurers have made life-to-date payments of $1,762 million to the Settlement Facility and the Settlement Facility reported an unexpended balance of $148 million.
On June 1, 2016, as part of the ownership restructure of Dow Corning and in accordance with ASC 450 "Accounting for Contingencies," the Company recorded a liability of $290 million for breast implant and other product liability claims (“Implant Liability”), which reflected the estimated impact of the settlement of future claims primarily based on reported claim filing levels in the Revised Settlement Program (the “RSP”) and on the resolution of almost all cases pending against the Litigation Facility. The RSP was a program sponsored by certain other breast implant manufacturers in the context of multi-district, coordinated federal breast implant cases and was open from 1995 through 2010. The RSP was also a revised successor to an earlier settlement plan involving Dow Corning (prior to its bankruptcy filing). While Dow Corning withdrew from the RSP, many of the benefit categories and payment levels in Dow Corning’s settlement program were drawn from the RSP. Based on the comparability in design and actual claim experience of both plans, management concluded that claim information from the RSP provides a reasonable basis to estimate future claim filing levels for the Settlement Facility.
In 2014, with the assistance of a third party consultant ("consultant"), Dow Corning developed an estimate of its Implant Liability ("2014 Estimate"), primarily based on the assumption that future claim filings in the remaining periods of the Settlement Facility will be similar to claim filing trends observed in the RSP. In the fourth quarter of 2016, Dow Corning requested the consultant review the available data and determine the appropriateness of updating the 2014 Estimate. In response
117
to that request, the consultant reviewed and analyzed data through June 30, 2016, and updated its estimate of the Implant Liability to $263 million, primarily reflecting a decrease in Class 7 costs (claimants who have breast implants made by certain other manufacturers using primarily Dow Corning silicone gel), a decrease resulting from the passage of time (claims forecast as future claims in 2014 had, by 2016, been filed and resolved), decreased claim filing activity and administrative costs compared with the 2014 Estimate, and an increase in investment income resulting from insurance proceeds. In December 2016, based on the consultant's updated estimate and Dow Corning's own review of claim filing activity, Dow Corning determined that an adjustment to the Implant Liability was required. Accordingly, Dow Corning decreased its Implant Liability by $27 million, which is included in "Sundry income (expense) - net" in the consolidated statements of income. At December 31, 2016, the Implant Liability was $263 million, which is included in "Other noncurrent obligations" in the consolidated balance sheets.
Dow Corning is not aware of circumstances that would change the factors used in estimating the Implant Liability and believes the recorded Implant Liability reflects the best estimate of the remaining funding obligations under the Plan; however, the estimate relies upon a number of significant assumptions, including:
• | Future claim filing levels in the Settlement Facility will be similar to the RSP; |
• | Future acceptance rates, disease mix, and payment values will be materially consistent with historical experience; |
• | No material negative outcomes in future controversies or disputes over Plan interpretation will occur; and |
• | The Plan will not be modified. |
If actual outcomes related to any of these assumptions prove to be materially different, the future liability to fund the Plan may be materially different than the amount estimated. If Dow Corning was ultimately required to fund the full liability up to the maximum capped value, the liability would be $1,867 million at December 31, 2016.
Commercial Creditor Issues
The Plan provides that each of Dow Corning’s commercial creditors (the “Commercial Creditors”) would receive in cash the sum of (a) an amount equal to the principal amount of their claims and (b) interest on such claims. The actual amount of interest that will ultimately be paid to these Commercial Creditors is uncertain due to pending litigation between Dow Corning and the Commercial Creditors regarding the appropriate interest rates to be applied to outstanding obligations from the 1995 bankruptcy filing date through the Effective Date, as well as the presence of any recoverable fees, costs, and expenses.
In 2006, the U.S. Court of Appeals for the Sixth Circuit concluded that there is a general presumption that contractually specified default interest should be paid by a solvent debtor to unsecured creditors (the “Interest Rate Presumption”) and permitting Dow Corning’s Commercial Creditors to recover fees, costs, and expenses where allowed by relevant loan agreements and state law. The matter was remanded to the U.S. District Court for the Eastern District of Michigan ("District Court") for further proceedings, including rulings on the facts surrounding specific claims and consideration of any equitable factors that would preclude the application of the Interest Rate Presumption.
Upon the Plan becoming effective, Dow Corning paid approximately $1,500 million to the Commercial Creditors, representing principal and an amount of interest that Dow Corning considers undisputed. At December 31, 2016, Dow Corning has estimated its remaining liability to the Commercial Creditors to be within a range of $108 million to $356 million. However, no single amount within the range appears to be a better estimate than any other amount within the range. Therefore, Dow Corning recorded the minimum liability within the range. At December 31, 2016, the liability related to Dow Corning’s potential obligation to pay additional interest to its Commercial Creditors in the Chapter 11 Proceeding was $108 million and included in "Accrued and other current liabilities" in the consolidated balance sheets. The actual amount of interest that will be paid to these creditors is uncertain and will ultimately be resolved through continued proceedings in the District Court.
Indemnifications
In connection with the DCC Transaction discussed in Note 4, the Company is indemnified for 50 percent of future losses associated with certain pre-closing liabilities, including the Implant Liability and Commercial Creditors matters described above, subject to certain conditions and limits. The maximum amount of indemnified losses which may be recovered are subject to a cap that declines over time. Indemnified losses are capped at (1) $1.5 billion until May 31, 2018, (2) $1 billion between May 31, 2018 and May 31, 2023, and (3) no recoveries are permitted after May 31, 2023. No indemnification assets were recorded at December 31, 2016.
Summary
The amounts recorded by Dow Corning for the Chapter 11 related matters described above were based upon current, known facts, which management believes reflect reasonable and probable estimates of the liability. However, future events could cause
118
the actual costs for Dow Corning to be higher or lower than those projected or those recorded. Any such events could result in an increase or decrease in the recorded liability.
Other Litigation Matters
In addition to the specific matters described above, the Company is party to a number of other claims and lawsuits arising out of the normal course of business with respect to product liability, patent infringement, employment matters, governmental tax and regulation disputes, contract and commercial litigation and other actions. Certain of these actions purport to be class actions and seek damages in very large amounts. All such claims are being contested. Dow has an active risk management program consisting of numerous insurance policies secured from many carriers at various times. These policies may provide coverage that could be utilized to minimize the financial impact, if any, of certain contingencies described above. It is the opinion of the Company’s management that the possibility is remote that the aggregate of all such other claims and lawsuits will have a material adverse impact on the results of operations, financial condition and cash flows of the Company.
Purchase Commitments
The Company has various commitments for take-or-pay and throughput agreements. These commitments are at prices not in excess of current market prices. The remaining terms for all but one of these agreements extend from 1 to 28 years. One agreement has a remaining term of 60 years. The 10-year future commitments for this agreement as well as the fixed and determinable portion of all other obligations under the Company's purchase commitments have been updated as of December 31, 2016, and are included in the following table:
Fixed and Determinable Portion of Take-or-Pay and Throughput Obligations at December 31, 2016 In millions | |||
2017 | $ | 2,600 | |
2018 | 2,498 | ||
2019 | 2,172 | ||
2020 | 2,083 | ||
2021 | 1,725 | ||
2022 and beyond | 7,304 | ||
Total | $ | 18,382 | |
In addition to the take-or-pay obligations at December 31, 2016, the Company had outstanding commitments which ranged from 1 to 25 years for materials, services and other items used in the normal course of business of approximately $732 million. Such commitments were at prices not in excess of current market prices.
Guarantees
The following tables provide a summary of the final expiration, maximum future payments and recorded liability reflected in the consolidated balance sheets for each type of guarantee:
Guarantees at December 31, 2016 In millions | Final Expiration | Maximum Future Payments | Recorded Liability | ||||||
Guarantees | 2021 | $ | 5,096 | $ | 86 | ||||
Residual value guarantees | 2027 | 947 | 134 | ||||||
Total guarantees | $ | 6,043 | $ | 220 | |||||
Guarantees at December 31, 2015 In millions | Final Expiration | Maximum Future Payments | Recorded Liability | ||||||
Guarantees | 2021 | $ | 4,910 | $ | 102 | ||||
Residual value guarantees | 2025 | 912 | 117 | ||||||
Total guarantees | $ | 5,822 | $ | 219 | |||||
Guarantees
Guarantees arise during the ordinary course of business from relationships with customers and nonconsolidated affiliates when the Company undertakes an obligation to guarantee the performance of others (via delivery of cash or other assets) if specified triggering events occur. With guarantees, such as commercial or financial contracts, non-performance by the guaranteed party triggers the obligation of the Company to make payments to the beneficiary of the guarantee. The majority of the Company’s
119
guarantees relate to debt of nonconsolidated affiliates, which have expiration dates ranging from less than one year to five years, and trade financing transactions in Latin America, which typically expire within one year of inception. The Company’s current expectation is that future payment or performance related to the non-performance of others is considered unlikely.
The Company has entered into guarantee agreements (“Guarantees”) related to project financing for Sadara, a nonconsolidated affiliate. The total of an Islamic bond and additional project financing (collectively “Total Project Financing”) obtained by Sadara is approximately $12.5 billion. Sadara had $12.4 billion of Total Project Financing outstanding at December 31, 2016 ($11.9 billion at December 31, 2015). The Company's guarantee of the Total Project Financing is in proportion to the Company's 35 percent ownership interest in Sadara, or up to approximately $4.4 billion when the project financing is fully drawn. The Guarantees will be released upon completion of construction of the Sadara complex and satisfactory fulfillment of certain other conditions, including passage of an extensive operational testing program, which is currently anticipated by the end of the first quarter of 2018 and must occur no later than December 2020.
Residual Value Guarantees
The Company provides guarantees related to leased assets specifying the residual value that will be available to the lessor at lease termination through sale of the assets to the lessee or third parties.
In 2014, the Company entered into a residual value guarantee as part of a sale-leaseback transaction for a significant portion of its North American railcar fleet. The sale transaction resulted in a deferred gain of $102 million, which was recorded as a liability due to the guarantee and will be deferred until expiration of the ten-year lease unless otherwise terminated. The maximum value of the guarantee was $234 million at December 31, 2016 ($236 million at December 31, 2015).
Warranties
The Company provides warranty policies on certain products and accrues liabilities under warranty policies using historical warranty claim experience. Adjustments are made to accruals as claim data and historical experience change. The following table summarizes changes in the Company's warranty liability for the years ended December 31, 2016 and 2015:
Warranty Accrual | |||||||
In millions | 2016 | 2015 | |||||
Balance at January 1 | $ | 93 | $ | 107 | |||
Accruals related to existing warranties (1) | 11 | 5 | |||||
Settlements made during the year | (20 | ) | (19 | ) | |||
Balance at December 31 | $ | 84 | $ | 93 | |||
(1) | In the second quarter of 2016, the Company recorded a pretax charge of $10 million as part of the 2016 restructuring charge. The charge was included in "Restructuring charges (credits)" in the consolidated statements of income and reflected in Infrastructure Solutions. See Note 3 for additional information. |
Asset Retirement Obligations
Dow has 189 manufacturing sites in 34 countries. Most of these sites contain numerous individual manufacturing operations, particularly at the Company’s larger sites. Asset retirement obligations are recorded as incurred and reasonably estimable, including obligations for which the timing and/or method of settlement are conditional on a future event that may or may not be within the control of the Company. The retirement of assets may involve such efforts as remediation and treatment of asbestos, contractually required demolition, and other related activities, depending on the nature and location of the assets; and retirement obligations are typically realized only upon demolition of those facilities. In identifying asset retirement obligations, the Company considers identification of legally enforceable obligations, changes in existing law, estimates of potential settlement dates and the calculation of an appropriate discount rate to be used in calculating the fair value of the obligations. Dow has a well-established global process to identify, approve and track the demolition of retired or to-be-retired facilities; and no assets are retired from service until this process has been followed. Dow typically forecasts demolition projects based on the usefulness of the assets; environmental, health and safety concerns; and other similar considerations. Under this process, as demolition projects are identified and approved, reasonable estimates are determined for the time frames during which any related asset retirement obligations are expected to be settled. For those assets where a range of potential settlement dates may be reasonably estimated, obligations are recorded. Dow routinely reviews all changes to items under consideration for demolition to determine if an adjustment to the value of the asset retirement obligation is required.
The Company has recognized asset retirement obligations for the following activities: demolition and remediation activities at manufacturing sites primarily in the United States, Canada, Brazil, Argentina and Europe; and capping activities at landfill sites in the United States, Canada, Brazil and Italy. The Company has also recognized conditional asset retirement obligations related
120
to asbestos encapsulation as a result of planned demolition and remediation activities at manufacturing and administrative sites primarily in the United States, Canada, Argentina and Europe. The aggregate carrying amount of conditional asset retirement obligations recognized by the Company (included in the asset retirement obligations balance shown below) was $31 million at December 31, 2016 ($33 million at December 31, 2015).
The following table shows changes in the aggregate carrying amount of the Company’s asset retirement obligations for the years ended December 31, 2016 and 2015:
Asset Retirement Obligations | ||||||||
In millions | 2016 | 2015 | ||||||
Balance at January 1 | $ | 96 | $ | 84 | ||||
Additional accruals (1) | 17 | 8 | ||||||
Liabilities settled | (9 | ) | (8 | ) | ||||
Accretion expense | 2 | 1 | ||||||
Revisions in estimated cash flows | 5 | 17 | ||||||
Other | (1 | ) | (6 | ) | ||||
Balance at December 31 | $ | 110 | $ | 96 | ||||
(1) | Includes $14 million of asset retirement obligations from the DCC Transaction. |
The discount rate used to calculate the Company’s asset retirement obligations at December 31, 2016, was 1.87 percent (1.48 percent at December 31, 2015). These obligations are included in the consolidated balance sheets as "Accrued and other current liabilities" and "Other noncurrent obligations."
The Company has not recognized conditional asset retirement obligations for which a fair value cannot be reasonably estimated in its consolidated financial statements. Assets that have not been submitted/reviewed for potential demolition activities are considered to have continued usefulness and are generally still operating normally. Therefore, without a plan to demolish the assets or the expectation of a plan, such as shortening the useful life of assets for depreciation purposes in accordance with the accounting guidance related to property, plant and equipment, the Company is unable to reasonably forecast a time frame to use for present value calculations. As such, the Company has not recognized obligations for individual plants/buildings at its manufacturing sites where estimates of potential settlement dates cannot be reasonably made. In addition, the Company has not recognized conditional asset retirement obligations for the capping of its approximately 42 underground storage wells and 141 underground brine mining and other wells at Dow-owned sites when there are no plans or expectations of plans to exit the sites. It is the opinion of the Company’s management that the possibility is remote that such conditional asset retirement obligations, when estimable, will have a material impact on the Company’s consolidated financial statements based on current costs.
NOTE 16 – TRANSFERS OF FINANCIAL ASSETS
The Company sells trade accounts receivable of select North American entities and qualifying trade accounts receivable of select European entities on a revolving basis to certain multi-seller commercial paper conduit entities ("conduits"). The proceeds received are comprised of cash and interests in specified assets of the conduits (the receivables sold by the Company) that entitle the Company to the residual cash flows of such specified assets in the conduits after the commercial paper has been repaid. Neither the conduits nor the investors in those entities have recourse to other assets of the Company in the event of nonpayment by the debtors.
During the year ended December 31, 2016, the Company recognized a loss of $20 million on the sale of these receivables ($15 million loss for the year ended December 31, 2015 and $16 million loss for the year ended December 31, 2014), which is included in “Interest expense and amortization of debt discount” in the consolidated statements of income.
The Company's interests in the conduits are carried at fair value and included in “Accounts and notes receivable – Other” in the consolidated balance sheets. Fair value of the interests is determined by calculating the expected amount of cash to be received and is based on unobservable inputs (a Level 3 measurement). The key input in the valuation is the percentage of anticipated credit losses in the portfolio of receivables sold that have not yet been collected. Given the short-term nature of the underlying receivables, discount rates and prepayments are not factors in determining the fair value of the interests.
121
The following table summarizes the carrying value of interests held, which represents the Company's maximum exposure to loss related to the receivables sold, and the percentage of anticipated credit losses related to the trade accounts receivable sold. Also provided is the sensitivity of the fair value of the interests held to hypothetical adverse changes in the anticipated credit losses; amounts shown below are the corresponding hypothetical decreases in the carrying value of interests.
Interests Held at December 31 | |||||||
In millions | 2016 | 2015 | |||||
Carrying value of interests held | $ | 1,237 | $ | 943 | |||
Percentage of anticipated credit losses | 0.36 | % | 0.34 | % | |||
Impact to carrying value - 10% adverse change | $ | 1 | $ | 1 | |||
Impact to carrying value - 20% adverse change | $ | 1 | $ | 1 | |||
Credit losses, net of any recoveries, were insignificant for the year ended December 31, 2016 ($1 million for the year ended December 31, 2015, and $7 million for the year ended December 31, 2014).
Following is an analysis of certain cash flows between the Company and the conduits:
Cash Proceeds | |||||||||||
In millions | 2016 | 2015 | 2014 | ||||||||
Sale of receivables | $ | 1 | $ | 18 | $ | 98 | |||||
Collections reinvested in revolving receivables | $ | 21,652 | $ | 22,951 | $ | 26,479 | |||||
Interests in conduits (1) | $ | 1,257 | $ | 1,034 | $ | 1,079 | |||||
(1) Presented in "Operating Activities" in the consolidated statements of cash flows.
Following is additional information related to the sale of receivables under these facilities:
Trade Accounts Receivable Sold at December 31 | |||||||
In millions | 2016 | 2015 | |||||
Delinquencies on sold receivables still outstanding | $ | 86 | $ | 97 | |||
Trade accounts receivable outstanding and derecognized | $ | 2,257 | $ | 2,152 | |||
In 2016, the Company repurchased $4 million of previously sold receivables ($11 million in 2015).
122
NOTE 17 – NOTES PAYABLE, LONG-TERM DEBT AND AVAILABLE CREDIT FACILITIES
Notes Payable at December 31 In millions | 2016 | 2015 | |||||
Notes payable to banks and other lenders | $ | 225 | $ | 277 | |||
Notes payable to related companies | 44 | 171 | |||||
Notes payable trade | 3 | 6 | |||||
Total notes payable | $ | 272 | $ | 454 | |||
Year-end average interest rates | 4.60 | % | 4.00 | % | |||
Long-Term Debt at December 31 In millions | 2016 Average Rate | 2016 | 2015 Average Rate | 2015 | |||||||||
Promissory notes and debentures: | |||||||||||||
Final maturity 2016 | — | % | $ | — | 2.64 | % | $ | 356 | |||||
Final maturity 2017 | 6.06 | % | 442 | 6.06 | % | 442 | |||||||
Final maturity 2018 | 5.78 | % | 339 | 5.78 | % | 339 | |||||||
Final maturity 2019 | 8.55 | % | 2,122 | 8.55 | % | 2,123 | |||||||
Final maturity 2020 | 4.46 | % | 1,547 | 4.46 | % | 1,547 | |||||||
Final maturity 2021 | 4.72 | % | 1,424 | 4.72 | % | 1,424 | |||||||
Final maturity 2022 and thereafter | 5.54 | % | 8,449 | 5.54 | % | 8,448 | |||||||
Other facilities: | |||||||||||||
U.S. dollar loans, various rates and maturities | 1.60 | % | 4,595 | 2.32 | % | 125 | |||||||
Foreign currency loans, various rates and maturities | 3.42 | % | 882 | 2.74 | % | 856 | |||||||
Medium-term notes, varying maturities through 2025 | 3.82 | % | 1,026 | 3.79 | % | 1,082 | |||||||
Tax-exempt bonds, varying maturities through 2038 | 5.66 | % | 343 | 5.66 | % | 343 | |||||||
Capital lease obligations | — | 295 | — | 76 | |||||||||
Unamortized debt discount and issuance costs | — | (373 | ) | — | (405 | ) | |||||||
Long-term debt due within one year (1) | — | (635 | ) | — | (541 | ) | |||||||
Long-term debt | — | $ | 20,456 | — | $ | 16,215 | |||||||
(1) | Presented net of current portion of unamortized debt issuance costs of $24 million at December 31, 2016 and $9 million at |
December 31, 2015.
Annual Installments on Long-Term Debt for Next Five Years (1) In millions | |||
2017 | $ | 659 | |
2018 | $ | 5,237 | |
2019 | $ | 2,391 | |
2020 | $ | 1,825 | |
2021 | $ | 1,567 | |
(1) | Assumes the option to extend a term loan facility |
related to the DCC Transaction will be exercised.
2016 Activity
In 2016, the Company redeemed $349 million of 2.5 percent notes that matured on February 15, 2016, and $52 million principal amount of InterNotes at maturity. In addition, approximately $128 million of long-term debt (net of $28 million of additional borrowings) was repaid by consolidated variable interest entities.
As part of the DCC Transaction, the fair value of debt assumed by Dow was $4,672 million and is reflected in the long-term debt table above. See Note 4 for additional information.
2015 Activity
In the fourth quarter of 2015, the Company redeemed $724 million aggregate principal amount of InterNotes of various interest rates and maturities between 2016 and 2024. As a result of this redemption, the Company realized an $8 million pretax loss
123
related to the early extinguishment of debt, included in "Sundry income (expense) - net" in the consolidated statements of income and reflected in Corporate.
On October 5, 2015, (i) the Company completed the transfer of its U.S. Gulf Coast Chlor-Alkali and Vinyl, Global Chlorinated Organics and Global Epoxy businesses into a new company ("Splitco"), (ii) participating Dow shareholders tendered, and the Company accepted, Dow shares for Splitco shares in a public exchange offer, and (iii) Splitco merged with a wholly owned subsidiary of Olin in a tax-efficient Reverse Morris Trust transaction (collectively, the “Transaction”). Under the terms of a debt exchange offer, the Company received $1,220 million principal amount of new debt instruments from Splitco, which were subsequently transferred to certain investment banks in a non-cash fair value exchange for $1,154 million principal amount of the Company’s outstanding debt instruments owned by such investment banks. As a result of this debt exchange offer and related transactions, the Company retired $1,161 million of certain notes, including $401 million of 2.50 percent notes due 2016, $182 million of 5.70 percent notes due 2018, $278 million of 4.25 percent notes due 2020 and a $300 million Term Loan Facility with a maturity date of 2016. The Company recognized a loss on the early extinguishment of debt of $68 million, included in "Sundry income (expense) - net" in the consolidated statements of income as a component of the pretax gain on the Transaction and reflected in Corporate. In connection with the Transaction, a membrane chlor-alkali joint venture was included as part of the assets and liabilities divested. This resulted in an additional reduction of $569 million principal amount of debt. See Notes 6 and 20 for further information.
In 2015, the Company issued $346 million aggregate principal amount of InterNotes and approximately $163 million of long-term debt (net of $8 million of additional borrowings) was repaid by consolidated variable interest entities.
2014 Activity
On September 16, 2014, the Company issued $2 billion of senior unsecured notes in a public offering. The offering included $900 million aggregate principal amount of 3.5 percent notes due 2024; $600 million aggregate principal amount of 4.25 percent notes due 2034; and $500 million aggregate principal amount of 4.625 percent notes due 2044.
In 2014, the Company issued $390 million aggregate principal amount of InterNotes with varying maturities in 2019, 2021 and 2024, at various interest rates averaging 2.94 percent. The Company also repaid $346 million of long-term debt related to the purchase of an ethylene production facility (see Note 20 for additional information), redeemed $124 million of tax-exempt bonds at maturity and repurchased $51 million of tax-exempt bonds. In addition, approximately $97 million of long-term debt (net of $69 million of additional borrowings) was repaid by consolidated variable interest entities.
Available Credit Facilities
The following table summarizes the Company's credit facilities:
Committed and Available Credit Facilities at December 31, 2016 | ||||||||||||||
In millions | Effective Date | Committed Credit | Credit Available | Maturity Date | Interest | |||||||||
Five Year Competitive Advance and Revolving Credit Facility | March 2015 | $ | 5,000 | $ | 5,000 | March 2020 | Floating rate | |||||||
Bilateral Revolving Credit Facility | August 2015 | 100 | 100 | March 2017 | Floating rate | |||||||||
Bilateral Revolving Credit Facility | August 2015 | 100 | 100 | March 2020 | Floating rate | |||||||||
Bilateral Revolving Credit Facility | August 2015 | 280 | 280 | March 2020 | Floating rate | |||||||||
Bilateral Revolving Credit Facility | August 2015 | 100 | 100 | March 2020 | Floating rate | |||||||||
Bilateral Revolving Credit Facility | August 2015 | 100 | 100 | March 2020 | Floating rate | |||||||||
Bilateral Revolving Credit Facility | August 2015 | 200 | 200 | March 2020 | Floating rate | |||||||||
Bilateral Revolving Credit Facility | May 2016 | 200 | 200 | May 2018 | Floating rate | |||||||||
Bilateral Revolving Credit Facility | July 2016 | 200 | 200 | July 2018 | Floating rate | |||||||||
Bilateral Revolving Credit Facility | August 2016 | 100 | 100 | August 2018 | Floating rate | |||||||||
DCC Term Loan Facility (1) | February 2016 | 4,500 | — | May 2018 | Floating rate | |||||||||
Total Committed and Available Credit Facilities | $ | 10,880 | $ | 6,380 | ||||||||||
(1) | Drawn on May 31, 2016, by Dow Corning, a wholly owned subsidiary of the Company as of June 1, 2016. |
In connection with the DCC Transaction, on May 31, 2016, Dow Corning incurred $4.5 billion of indebtedness under a certain third party credit agreement ("DCC Term Loan Facility") in order to fund the contribution of cash to Splitco. Subsequent to the DCC Transaction, the Company guaranteed the obligations of Dow Corning under the DCC Term Loan Facility and, as a result, the covenants and events of default applicable to the DCC Term Loan Facility are substantially similar to the covenants and events of default set forth in the Company's Five Year Competitive Advance and Revolving Credit Facility. Amounts borrowed
124
under the DCC Term Loan Facility are repayable on May 30, 2017, subject to a 364-day extension option, at Dow Corning's election, upon the satisfaction of certain customary conditions precedent. Dow Corning intends to exercise the 364-day extension option on the DCC Term Loan Facility. See Note 4 for additional information on the DCC Transaction.
Debt Covenants and Default Provisions
The Company’s outstanding long-term debt has been issued under indentures which contain, among other provisions, certain customary restrictive covenants with which the Company must comply while the underlying notes are outstanding. Such covenants include obligations to not allow liens on principal U.S. manufacturing facilities, enter into sale and lease-back transactions with respect to principal U.S. manufacturing facilities, merge or consolidate with any other corporation, or sell or convey all or substantially all of the Company’s assets. The outstanding debt also contains customary default provisions. Failure of the Company to comply with any of these covenants could result in a default under the applicable indenture, which would allow the note holders to accelerate the due date of the outstanding principal and accrued interest on the underlying notes. The Company expects to remain in compliance with these covenants after completion of the all-stock, merger of equals strategic combination with DuPont.
The Company’s primary, private credit agreements also contain certain customary restrictive covenant and default provisions in addition to the covenants set forth above with respect to the Company’s debt. Significant other restrictive covenants and default provisions related to these agreements include:
(a) | the obligation to maintain the ratio of the Company’s consolidated indebtedness to consolidated capitalization at no greater than 0.65 to 1.00 at any time the aggregate outstanding amount of loans under the Five Year Competitive Advance and Revolving Credit Facility Agreement dated March 24, 2015, equals or exceeds $500 million, |
(b) | a default if the Company or an applicable subsidiary fails to make any payment, including principal, premium or interest, under the applicable agreement on other indebtedness of, or guaranteed by, the Company or such applicable subsidiary in an aggregate amount of $100 million or more when due, or any other default or other event under the applicable agreement with respect to such indebtedness occurs which permits or results in the acceleration of $400 million or more in the aggregate of principal, and |
(c) | a default if the Company or any applicable subsidiary fails to discharge or stay within 60 days after the entry of a final judgment against the Company or such applicable subsidiary of more than $400 million. |
Failure of the Company to comply with any of the covenants or default provisions could result in a default under the applicable credit agreement which would allow the lenders to not fund future loan requests and to accelerate the due date of the outstanding principal and accrued interest on any outstanding indebtedness.
NOTE 18 – PENSION PLANS AND OTHER POSTRETIREMENT BENEFITS
Ownership Restructure of Dow Corning
As part of the June 1, 2016 ownership restructure of Dow Corning, the Company assumed sponsorship of qualified and non-qualified pension and other postretirement benefit plans that provide defined benefits to U.S. and non-U.S. employees. Plan assets and obligations for all significant plans assumed from Dow Corning are as follows:
Plan Assets and Obligations for all Significant Plans Assumed from Dow Corning at June 1, 2016 | Defined Benefit Pension Plans | Other Postretirement Benefits | |||||
In millions | |||||||
Fair value of plan assets | $ | 2,327 | $ | — | |||
Projected benefit obligations | 3,252 | 313 | |||||
Net liability assumed | $ | 925 | $ | 313 | |||
Pension Plans
The Company has defined benefit pension plans that cover employees in the United States and a number of other countries. The U.S. qualified plan covering the parent company is the largest plan. Benefits for employees hired before January 1, 2008, are based on length of service and the employee’s three highest consecutive years of compensation. Employees hired after January 1, 2008, earn benefits that are based on a set percentage of annual pay, plus interest.
125
The Company’s funding policy is to contribute to the plans when pension laws and/or economics either require or encourage funding. In 2016, Dow contributed $629 million to its pension plans, including contributions to fund benefit payments for its non-qualified supplemental plans. Dow expects to contribute approximately $500 million to its pension plans in 2017.
The weighted-average assumptions used to determine pension plan obligations and net periodic benefit costs for the plans are provided in the two tables below:
Weighted-Average Assumptions for All Pension Plans | Benefit Obligations at December 31 | Net Periodic Costs for the Year | ||||||||||||||||
2016 | 2015 | 2014 | 2016 | 2015 | 2014 | |||||||||||||
Discount rate | 3.52 | % | 3.88 | % | 3.60 | % | 3.85 | % | 3.60 | % | 4.54 | % | ||||||
Rate of increase in future compensation levels | 3.90 | % | 4.13 | % | 4.13 | % | 4.04 | % | 4.13 | % | 4.15 | % | ||||||
Expected long-term rate of return on plan assets | — | — | — | 7.22 | % | 7.35 | % | 7.40 | % | |||||||||
Weighted-Average Assumptions for U.S. Pension Plans | Benefit Obligations at December 31 | Net Periodic Costs for the Year | ||||||||||||||||
2016 | 2015 | 2014 | 2016 | 2015 | 2014 | |||||||||||||
Discount rate | 4.11 | % | 4.40 | % | 4.04 | % | 4.40 | % | 4.04 | % | 4.92 | % | ||||||
Rate of increase in future compensation levels | 4.25 | % | 4.50 | % | 4.50 | % | 4.50 | % | 4.50 | % | 4.50 | % | ||||||
Expected long-term rate of return on plan assets | — | — | — | 7.77 | % | 7.85 | % | 7.82 | % | |||||||||
The Company determines the expected long-term rate of return on plan assets by performing a detailed analysis of key economic and market factors driving historical returns for each asset class and formulating a projected return based on factors in the current environment. Factors considered include, but are not limited to, inflation, real economic growth, interest rate yield, interest rate spreads, and other valuation measures and market metrics. The expected long-term rate of return for each asset class is then weighted based on the strategic asset allocation approved by the governing body for each plan. The Company’s historical experience with the pension fund asset performance is also considered.
Effective January 1, 2016, the Company adopted the spot rate approach to determine the discount rate utilized to measure the service cost and interest cost components of net periodic pension and other postretirement benefit costs for the U.S. and other selected countries. Under the spot rate approach, the Company calculates service cost and interest cost by applying individual spot rates from the Willis Towers Watson RATE:Link yield curve (based on high-quality corporate bond yields) for each selected country to the separate expected cash flow components of service cost and interest cost; service cost and interest cost for all other plans (including all plans prior to adoption) are determined on the basis of the single equivalent discount rates derived in determining those plan obligations. The Company changed to the new method to provide a more precise measure of interest and service costs for certain countries by improving the correlation between projected benefit cash flows and the discrete spot yield curves. The Company accounted for this change as a change in accounting estimate and it was applied prospectively starting in 2016.
The discount rates utilized to measure the pension and other postretirement obligations of the U.S. qualified plans are based on the yield on high-quality corporate fixed income investments at the measurement date. Future expected actuarially determined cash flows for Dow’s U.S. plans are individually discounted at the spot rates under the Willis Towers Watson U.S. RATE:Link 60-90 corporate yield curve (based on 60th to 90th percentile high-quality corporate bond yields) to arrive at the plan’s obligations as of the measurement date.
In 2014, the Society of Actuaries ("SOA") published updated mortality tables and mortality improvement scales (generational mortality tables), which reflect increased life expectancy. Based on an evaluation of the mortality experience of the Company's U.S. pension plans and the SOA's tables, effective for 2014 and forward, the Company adopted updated generational mortality tables for purposes of measuring U.S. pension and other postretirement obligations.
126
The accumulated benefit obligation for all defined benefit pension plans was $28.8 billion at December 31, 2016 and $24.5 billion at December 31, 2015.
Pension Plans with Accumulated Benefit Obligations in Excess of Plan Assets at December 31 | ||||||||
In millions | 2016 | 2015 | ||||||
Projected benefit obligations | $ | 27,877 | $ | 23,421 | ||||
Accumulated benefit obligations | $ | 26,590 | $ | 22,409 | ||||
Fair value of plan assets | $ | 18,523 | $ | 16,066 | ||||
In addition to the U.S. qualified defined benefit pension plan, U.S. employees may participate in defined contribution plans (Employee Savings Plans or 401(k) plans) by contributing a portion of their compensation, which is partially matched by the Company. Defined contribution plans also cover employees in some subsidiaries in other countries, including Australia, Brazil, Canada, Italy, Spain and the United Kingdom. Expense recognized for all defined contribution plans was $283 million in 2016, $235 million in 2015 and $243 million in 2014.
Other Postretirement Benefits
The Company provides certain health care and life insurance benefits to retired employees. The Company’s plans outside of the United States are not significant; therefore, this discussion relates to the U.S. plans only. The plans provide health care benefits, including hospital, physicians’ services, drug and major medical expense coverage, and life insurance benefits. In general, for employees hired before January 1, 1993, the plans provide benefits supplemental to Medicare when retirees are eligible for these benefits. The Company and the retiree share the cost of these benefits, with the Company portion increasing as the retiree has increased years of credited service, although there is a cap on the Company portion. The Company has the ability to change these benefits at any time. Employees hired after January 1, 2008, are not covered under the plans.
On January 1, 2014, the Company implemented an Employer Group Waiver Plan (“EGWP”) for its Medicare-eligible, retiree medical plan participants. The Medicare Part D Retiree Drug Subsidy program (“RDS”) was eliminated on January 1, 2014. The EGWP does not significantly alter the benefits provided to retiree medical plan participants. Federal subsidies to be earned under the EGWP are expected to exceed those earned under the RDS and will be partially offset by increased costs related to the administration of the EGWP. The net periodic benefit cost decreased by $25 million in 2014 due to the EGWP.
The Company funds most of the cost of these health care and life insurance benefits as incurred. In 2016, Dow did not make any contributions to its other postretirement benefit plan trusts. The trusts did not hold assets at December 31, 2016. Dow does not expect to contribute assets to its other postretirement benefit plan trusts in 2017.
The weighted-average assumptions used to determine other postretirement benefit obligations and net periodic benefit costs for the U.S. plans are provided below:
U.S. Plan Assumptions for Other Postretirement Benefits | Benefit Obligations at December 31 | Net Periodic Costs for the Year | ||||||||||||||||
2016 | 2015 | 2014 | 2016 | 2015 | 2014 | |||||||||||||
Discount rate | 3.83 | % | 3.97 | % | 3.68 | % | 3.96 | % | 3.68 | % | 4.37 | % | ||||||
Initial health care cost trend rate | 7.00 | % | 7.25 | % | 7.06 | % | 7.25 | % | 7.06 | % | 7.45 | % | ||||||
Ultimate health care cost trend rate | 5.00 | % | 5.00 | % | 5.00 | % | 5.00 | % | 5.00 | % | 5.00 | % | ||||||
Year ultimate trend rate to be reached | 2025 | 2025 | 2020 | 2025 | 2020 | 2020 | ||||||||||||
Increasing the assumed medical cost trend rate for all plans by one percentage point in each year would decrease the accumulated postretirement benefit obligation at December 31, 2016, by $7 million and decrease the net periodic postretirement benefit cost for the year by $1 million. Decreasing the assumed medical cost trend rate for all plans by one percentage point in each year would increase the accumulated postretirement benefit obligation at December 31, 2016, by $11 million and the net periodic postretirement benefit cost for the year by $1 million.
127
Net Periodic Benefit Cost for All Significant Plans | ||||||||||||||||||||||||
Defined Benefit Pension Plans | Other Postretirement Benefits | |||||||||||||||||||||||
In millions | 2016 (1) | 2015 | 2014 | 2016 (1) | 2015 | 2014 | ||||||||||||||||||
Service cost | $ | 463 | $ | 484 | $ | 411 | $ | 13 | $ | 14 | $ | 14 | ||||||||||||
Interest cost | 846 | 975 | 1,096 | 52 | 59 | 72 | ||||||||||||||||||
Expected return on plan assets | (1,447 | ) | (1,382 | ) | (1,322 | ) | — | — | — | |||||||||||||||
Amortization of prior service cost (credit) | (24 | ) | (28 | ) | 22 | (3 | ) | (2 | ) | (2 | ) | |||||||||||||
Amortization of unrecognized (gain) loss | 587 | 706 | 500 | (7 | ) | (11 | ) | (14 | ) | |||||||||||||||
Curtailment/settlement/other (2) | (36 | ) | — | (2 | ) | — | — | — | ||||||||||||||||
Net periodic benefit cost | $ | 389 | $ | 755 | $ | 705 | $ | 55 | $ | 60 | $ | 70 | ||||||||||||
(1) | Includes net periodic benefit costs of $26 million for defined benefit pension plans and $8 million of other postretirement benefits for plans assumed from Dow Corning. |
(2) | The 2016 impact relates to the curtailment of benefits for certain participants of a Dow Corning plan in the U.S. The 2014 impact relates to settlements associated with the wind-up of a pension plan in The Netherlands and a pension plan in Canada. |
Other Changes in Plan Assets and Benefit Obligations Recognized in Other Comprehensive (Income) Loss for All Significant Plans | ||||||||||||||||||||||||
Defined Benefit Pension Plans | Other Postretirement Benefits | |||||||||||||||||||||||
In millions | 2016 | 2015 | 2014 | 2016 | 2015 | 2014 | ||||||||||||||||||
Net (gain) loss | $ | 1,954 | $ | (127 | ) | $ | 3,528 | $ | 14 | $ | 11 | $ | 63 | |||||||||||
Prior service cost (credit) arising during period | — | 63 | (500 | ) | — | — | — | |||||||||||||||||
Amortization of prior service (cost) credit | 24 | 28 | (22 | ) | 3 | 2 | 2 | |||||||||||||||||
Amortization of unrecognized gain (loss) | (587 | ) | (706 | ) | (498 | ) | 7 | 11 | 14 | |||||||||||||||
Total recognized in other comprehensive (income) loss | $ | 1,391 | $ | (742 | ) | $ | 2,508 | $ | 24 | $ | 24 | $ | 79 | |||||||||||
Total recognized in net periodic benefit cost and other comprehensive loss | $ | 1,780 | $ | 13 | $ | 3,213 | $ | 79 | $ | 84 | $ | 149 | ||||||||||||
128
Change in Projected Benefit Obligations, Plan Assets and Funded Status of All Significant Plans | ||||||||||||||||
In millions | Defined Benefit Pension Plans | Other Postretirement Benefits | ||||||||||||||
Change in projected benefit obligations: | 2016 | 2015 | 2016 | 2015 | ||||||||||||
Benefit obligations at beginning of year | $ | 25,652 | $ | 27,979 | $ | 1,597 | $ | 1,707 | ||||||||
Service cost | 463 | 484 | 13 | 14 | ||||||||||||
Interest cost | 846 | 975 | 52 | 59 | ||||||||||||
Plan participants’ contributions | 19 | 19 | — | — | ||||||||||||
Plan amendments | — | 30 | — | — | ||||||||||||
Actuarial changes in assumptions and experience | 1,967 | (929 | ) | 13 | 11 | |||||||||||
Acquisition/divestiture/other activity (1) | 3,201 | (894 | ) | 313 | — | |||||||||||
Benefits paid | (1,324 | ) | (1,289 | ) | (154 | ) | (172 | ) | ||||||||
Currency impact | (506 | ) | (723 | ) | 1 | (22 | ) | |||||||||
Termination benefits/curtailment cost/settlements (2) | (38 | ) | — | — | — | |||||||||||
Benefit obligations at end of year | $ | 30,280 | $ | 25,652 | $ | 1,835 | $ | 1,597 | ||||||||
Change in plan assets: | ||||||||||||||||
Fair value of plan assets at beginning of year | $ | 18,774 | $ | 19,629 | $ | — | $ | — | ||||||||
Actual return on plan assets | 1,437 | 314 | — | — | ||||||||||||
Currency impact | (404 | ) | (488 | ) | — | — | ||||||||||
Employer contributions | 629 | 844 | — | — | ||||||||||||
Plan participants’ contributions | 19 | 19 | — | — | ||||||||||||
Acquisition/divestiture/other activity (3) | 2,077 | (255 | ) | — | — | |||||||||||
Benefits paid | (1,324 | ) | (1,289 | ) | — | — | ||||||||||
Fair value of plan assets at end of year | $ | 21,208 | $ | 18,774 | $ | — | $ | — | ||||||||
Less: Fair value of assets due to Olin | $ | — | $ | (179 | ) | $ | — | $ | — | |||||||
Net fair value of plan assets at end of year | $ | 21,208 | $ | 18,595 | $ | — | $ | — | ||||||||
Funded status at end of year | $ | (9,072 | ) | $ | (7,057 | ) | $ | (1,835 | ) | $ | (1,597 | ) | ||||
Net amounts recognized in the consolidated balance sheets at December 31: | ||||||||||||||||
Noncurrent assets | $ | 292 | $ | 317 | $ | — | $ | — | ||||||||
Current liabilities | (74 | ) | (64 | ) | (158 | ) | (146 | ) | ||||||||
Noncurrent liabilities | (9,290 | ) | (7,310 | ) | (1,677 | ) | (1,451 | ) | ||||||||
Net amounts recognized in the consolidated balance sheets | $ | (9,072 | ) | $ | (7,057 | ) | $ | (1,835 | ) | $ | (1,597 | ) | ||||
Pretax amounts recognized in AOCL at December 31: | ||||||||||||||||
Net loss (gain) | $ | 11,379 | $ | 10,012 | $ | (133 | ) | $ | (154 | ) | ||||||
Prior service credit | (304 | ) | (328 | ) | — | (3 | ) | |||||||||
Pretax balance in AOCL at end of year | $ | 11,075 | $ | 9,684 | $ | (133 | ) | $ | (157 | ) | ||||||
(1) | The 2016 impact includes pension benefit obligations of $3,252 million and other postretirement benefit obligations of $313 million assumed with the ownership restructure of Dow Corning. The 2016 impact also includes the transfer of benefit obligations of $53 million in the U.S. through the purchase of annuity contracts from an insurance company. The 2015 impact includes the transfer of benefit obligations associated with the Reverse Morris Trust transaction with Olin of $618 million and the transfer of benefit obligations associated with the divestiture of ANGUS to Golden Gate Capital of $34 million. The 2015 impact also includes the transfer of benefit obligations of $248 million in the U.S. through the purchase of annuity contracts from an insurance company. See Notes 4, 5 and 6 for additional information. |
(2) | The 2016 impact primarily relates to the curtailment of benefits for certain participants of a U.S. Dow Corning plan of $36 million. |
(3) | The 2016 impact includes plan assets assumed with the ownership restructure of Dow Corning of $2,327 million. The 2016 impact also includes the purchase of annuity contracts of $55 million in the U.S. associated with the transfer of benefit obligations to an insurance company and the transfer of plan assets associated with the Reverse Morris Trust transaction with Olin of $184 million. The 2015 impact includes the transfer of plan assets associated with the divestiture of ANGUS to Golden Gate Capital of $9 million. The 2015 impact also includes the purchase of annuity contracts of $247 million in the U.S. associated with the transfer of benefit obligations to an insurance company. |
In 2017, an estimated net loss of $626 million and prior service credit of $24 million for the defined benefit pension plans will be amortized from AOCL to net periodic benefit cost. In 2017, an estimated net gain of $6 million for other postretirement benefit plans will be amortized from AOCL to net periodic benefit cost.
129
Estimated Future Benefit Payments
The estimated future benefit payments, reflecting expected future service, as appropriate, are presented in the following table:
Estimated Future Benefit Payments at December 31, 2016 | ||||||||
In millions | Defined Benefit Pension Plans | Other Postretirement Benefits | ||||||
2017 | $ | 1,433 | $ | 161 | ||||
2018 | 1,460 | 155 | ||||||
2019 | 1,501 | 151 | ||||||
2020 | 1,536 | 146 | ||||||
2021 | 1,571 | 142 | ||||||
2022 through 2026 | 8,374 | 627 | ||||||
Total | $ | 15,875 | $ | 1,382 | ||||
Plan Assets
Plan assets consist primarily of equity and fixed income securities of U.S. and foreign issuers, and include alternative investments such as real estate, private equity and absolute return strategies. At December 31, 2016, plan assets totaled $21.2 billion and included no Company common stock. At December 31, 2015, plan assets totaled $18.8 billion and included no Company common stock.
Investment Strategy and Risk Management for Plan Assets
The Company’s investment strategy for the plan assets is to manage the assets in relation to the liability in order to pay retirement benefits to plan participants over the life of the plans. This is accomplished by identifying and managing the exposure to various market risks, diversifying investments across various asset classes and earning an acceptable long-term rate of return consistent with an acceptable amount of risk, while considering the liquidity needs of the plans.
The plans are permitted to use derivative instruments for investment purposes, as well as for hedging the underlying asset and liability exposure and rebalancing the asset allocation. The plans use value-at-risk, stress testing, scenario analysis and Monte Carlo simulations to monitor and manage both the risk within the portfolios and the surplus risk of the plans.
Equity securities primarily include investments in large- and small-cap companies located in both developed and emerging markets around the world. Fixed income securities include investment and non-investment grade corporate bonds of companies diversified across industries, U.S. treasuries, non-U.S. developed market securities, U.S. agency mortgage-backed securities, emerging market securities and fixed income related funds. Alternative investments primarily include investments in real estate, private equity limited partnerships and absolute return strategies. Other significant investment types include various insurance contracts and interest rate, equity, commodity and foreign exchange derivative investments and hedges.
Strategic Weighted-Average Target Allocation of Plan Assets for All Significant Plans | ||
Asset Category | Target Allocation | |
Equity securities | 35 | % |
Fixed income securities | 34 | % |
Alternative investments | 30 | % |
Other investments | 1 | % |
Total | 100 | % |
Concentration of Risk
The Company mitigates the credit risk of investments by establishing guidelines with investment managers that limit investment in any single issue or issuer to an amount that is not material to the portfolio being managed. These guidelines are monitored for compliance both by the Company and external managers. Credit risk related to derivative activity is mitigated by utilizing multiple counterparties, collateral support agreements and centralized clearing, where appropriate.
The Northern Trust Collective Government Short Term Investment money market fund is utilized as the sweep vehicle for the U.S. plans, which from time to time can represent a significant investment. For one U.S. plan, approximately 40 percent of the liability is covered by a participating group annuity issued by Prudential Insurance Company.
130
The following tables summarize the bases used to measure the Company’s pension plan assets at fair value for the years ended December 31, 2016 and 2015:
Basis of Fair Value Measurements of Pension Plan Assets at December 31, 2016 | Quoted Prices in Active Markets for Identical Items | Significant Other Observable Inputs | Significant Unobservable Inputs | |||||||||||||
In millions | (Level 1) | (Level 2) | (Level 3) | Total | ||||||||||||
Cash and cash equivalents | $ | 73 | $ | 806 | $ | — | $ | 879 | ||||||||
Equity securities: | ||||||||||||||||
U.S. equity (1) | $ | 2,642 | $ | 983 | $ | 1 | $ | 3,626 | ||||||||
Non-U.S. equity – developed countries | 1,955 | 1,232 | 1 | 3,188 | ||||||||||||
Emerging markets | 508 | 557 | 31 | 1,096 | ||||||||||||
Convertible bonds | 21 | 199 | 1 | 221 | ||||||||||||
Total equity securities | $ | 5,126 | $ | 2,971 | $ | 34 | $ | 8,131 | ||||||||
Fixed income securities: | ||||||||||||||||
U.S. government and municipalities | $ | — | $ | 2,091 | $ | — | $ | 2,091 | ||||||||
U.S. agency and agency mortgage-backed securities | — | 309 | — | 309 | ||||||||||||
Corporate bonds – investment grade | — | 1,562 | — | 1,562 | ||||||||||||
Non-U.S. governments – developed countries | — | 1,135 | — | 1,135 | ||||||||||||
Non-U.S. corporate bonds – developed countries | — | 1,176 | — | 1,176 | ||||||||||||
Emerging market debt | — | 131 | — | 131 | ||||||||||||
Other asset-backed securities | — | 95 | 2 | 97 | ||||||||||||
High yield bonds | — | 190 | 13 | 203 | ||||||||||||
Other fixed income funds | — | 351 | 483 | 834 | ||||||||||||
Fixed income derivatives | — | (17 | ) | — | (17 | ) | ||||||||||
Total fixed income securities | $ | — | $ | 7,023 | $ | 498 | $ | 7,521 | ||||||||
Alternative investments: | ||||||||||||||||
Real estate | $ | 21 | $ | 24 | $ | 2,042 | $ | 2,087 | ||||||||
Private equity | — | — | 1,128 | 1,128 | ||||||||||||
Absolute return | — | 723 | 465 | 1,188 | ||||||||||||
Total alternative investments | $ | 21 | $ | 747 | $ | 3,635 | $ | 4,403 | ||||||||
Other investments | $ | — | $ | 179 | $ | 95 | $ | 274 | ||||||||
Total pension plan assets at fair value | $ | 5,220 | $ | 11,726 | $ | 4,262 | $ | 21,208 | ||||||||
(1) | Includes no Company common stock. |
131
Basis of Fair Value Measurements of Pension Plan Assets at December 31, 2015 | Quoted Prices in Active Markets for Identical Items | Significant Other Observable Inputs | Significant Unobservable Inputs | |||||||||||||
In millions | (Level 1) | (Level 2) | (Level 3) | Total | ||||||||||||
Cash and cash equivalents | $ | 84 | $ | 733 | $ | — | $ | 817 | ||||||||
Equity securities: | ||||||||||||||||
U.S. equity (1) | $ | 2,525 | $ | 558 | $ | 1 | $ | 3,084 | ||||||||
Non-U.S. equity – developed countries | 1,877 | 1,167 | — | 3,044 | ||||||||||||
Emerging markets | 462 | 542 | 27 | 1,031 | ||||||||||||
Convertible bonds | 26 | 177 | — | 203 | ||||||||||||
Equity derivatives | — | 8 | — | 8 | ||||||||||||
Total equity securities | $ | 4,890 | $ | 2,452 | $ | 28 | $ | 7,370 | ||||||||
Fixed income securities: | ||||||||||||||||
U.S. government and municipalities | $ | — | $ | 1,320 | $ | — | $ | 1,320 | ||||||||
U.S. agency and agency mortgage-backed securities | — | 279 | — | 279 | ||||||||||||
Corporate bonds – investment grade | — | 1,527 | — | 1,527 | ||||||||||||
Non-U.S. governments – developed countries | — | 1,161 | — | 1,161 | ||||||||||||
Non-U.S. corporate bonds – developed countries | — | 917 | — | 917 | ||||||||||||
Emerging market debt | — | 109 | — | 109 | ||||||||||||
Other asset-backed securities | — | 88 | 1 | 89 | ||||||||||||
High yield bonds | 47 | 166 | 16 | 229 | ||||||||||||
Other fixed income funds | — | 295 | 276 | 571 | ||||||||||||
Fixed income derivatives | — | 33 | — | 33 | ||||||||||||
Total fixed income securities | $ | 47 | $ | 5,895 | $ | 293 | $ | 6,235 | ||||||||
Alternative investments: | ||||||||||||||||
Real estate | $ | 22 | $ | 38 | $ | 1,772 | $ | 1,832 | ||||||||
Private equity | — | — | 1,054 | 1,054 | ||||||||||||
Absolute return | — | 483 | 695 | 1,178 | ||||||||||||
Total alternative investments | $ | 22 | $ | 521 | $ | 3,521 | $ | 4,064 | ||||||||
Other investments | $ | — | $ | 250 | $ | 38 | $ | 288 | ||||||||
Total pension plan assets at fair value | $ | 5,043 | $ | 9,851 | $ | 3,880 | $ | 18,774 | ||||||||
Less: Fair value of pension plan assets due to Olin (2) | (179 | ) | — | — | (179 | ) | ||||||||||
Net pension plan assets at fair value | $ | 4,864 | $ | 9,851 | $ | 3,880 | $ | 18,595 | ||||||||
(1) | Includes no Company common stock. |
(2) | Pension plan assets were transferred to Olin in 2016. The final plan assets transferred totaled $184 million, which reflected return on plan assets and benefits paid to participants from the closing date of the Transaction with Olin to the date of transfer. See Note 6 for additional information. |
For pension plan assets classified as Level 1 measurements (measured using quoted prices in active markets), total fair value is either the price of the most recent trade at the time of the market close or the official close price, as defined by the exchange on which the asset is most actively traded on the last trading day of the period, multiplied by the number of units held without consideration of transaction costs.
For pension plan assets classified as Level 2 measurements, where the security is frequently traded in less active markets, fair value is based on the closing price at the end of the period; where the security is less frequently traded, fair value is based on the price a dealer would pay for the security or similar securities, adjusted for any terms specific to that asset or liability. Market inputs are obtained from well-established and recognized vendors of market data and subjected to tolerance and quality checks. For derivative assets and liabilities, standard industry models are used to calculate the fair value of the various financial instruments based on significant observable market inputs, such as foreign exchange rates, commodity prices, swap rates, interest rates and implied volatilities obtained from various market sources. For other pension plan assets for which observable inputs are used, fair value is derived through the use of fair value models, such as a discounted cash flow model or other standard pricing models.
For pension plan assets classified as Level 3 measurements, total fair value is based on significant unobservable inputs including assumptions where there is little, if any, market activity for the investment. Investment managers or fund managers provide valuations of the investment on a monthly or quarterly basis. These valuations are reviewed for reasonableness based on applicable sector, benchmark and company performance. Adjustments to valuations are made where appropriate. Where available, audited financial statements are obtained and reviewed for the investments as support for the manager’s investment
132
valuation. Some pension plan assets are held in funds where fair value is based on an estimated net asset value per share (or its equivalent) as of the most recently available fund financial statements, and adjusted for estimated earnings and investment activity. These funds are classified as Level 3 due to the significant unobservable inputs inherent in the fair value measurement.
The following table summarizes the changes in fair value of Level 3 pension plan assets for the years ended December 31, 2015 and 2016:
Fair Value Measurement of Level 3 Pension Plan Assets | Equity Securities | Fixed Income Securities | Alternative Investments | Other Investments | Total | |||||||||||||||
In millions | ||||||||||||||||||||
Balance at January 1, 2015 | $ | 32 | $ | 311 | $ | 3,342 | $ | 40 | $ | 3,725 | ||||||||||
Actual return on plan assets: | ||||||||||||||||||||
Relating to assets sold during 2015 | — | 18 | 233 | — | 251 | |||||||||||||||
Relating to assets held at Dec 31, 2015 | — | (9 | ) | 58 | (2 | ) | 47 | |||||||||||||
Purchases, sales and settlements | 2 | (27 | ) | (90 | ) | — | (115 | ) | ||||||||||||
Transfers in (out) of Level 3, net | (6 | ) | (1 | ) | 5 | — | (2 | ) | ||||||||||||
Foreign currency impact | — | 1 | (27 | ) | — | (26 | ) | |||||||||||||
Balance at December 31, 2015 | $ | 28 | $ | 293 | $ | 3,521 | $ | 38 | $ | 3,880 | ||||||||||
Actual return on plan assets: | ||||||||||||||||||||
Relating to assets sold during 2016 | — | 2 | 163 | (7 | ) | 158 | ||||||||||||||
Relating to assets held at Dec 31, 2016 | 9 | (4 | ) | 10 | 11 | 26 | ||||||||||||||
Purchases, sales and settlements (1) | 1 | 202 | (35 | ) | 53 | 221 | ||||||||||||||
Transfers in (out) of Level 3, net | (2 | ) | 3 | — | — | 1 | ||||||||||||||
Foreign currency impact | (2 | ) | 2 | (24 | ) | — | (24 | ) | ||||||||||||
Balance at December 31, 2016 | $ | 34 | $ | 498 | $ | 3,635 | $ | 95 | $ | 4,262 | ||||||||||
(1) | Includes $35 million of alternative investments associated with the ownership restructure of Dow Corning. |
NOTE 19 – LEASED PROPERTY
Leased Property
The Company routinely leases premises for use as sales and administrative offices, warehouses and tanks for product storage, motor vehicles, railcars, computers, office machines and equipment. In addition, the Company leases aircraft in the United States. At the termination of the leases, the Company has the option to purchase certain leased equipment and buildings based on a fair market value determination.
Rental expenses under leases, net of sublease rental income, were $661 million in 2016, $600 million in 2015 and $539 million in 2014. Future minimum rental payments under leases with remaining noncancelable terms in excess of one year are as follows:
Minimum Lease Commitments at December 31, 2016 In millions | |||
2017 | $ | 351 | |
2018 | 300 | ||
2019 | 272 | ||
2020 | 246 | ||
2021 | 221 | ||
2022 and thereafter | 1,064 | ||
Total | $ | 2,454 | |
133
NOTE 20 – VARIABLE INTEREST ENTITIES
Consolidated Variable Interest Entities
At December 31, 2016, the Company holds a variable interest in seven joint ventures or entities for which the Company is the primary beneficiary.
Three joint ventures own and operate manufacturing and logistics facilities, which produce chemicals and provide services in Asia Pacific. The Company’s variable interest in these joint ventures relates to arrangements between the joint ventures and the Company, involving the majority of the output on take-or-pay terms with pricing ensuring a guaranteed return to the joint ventures.
The fourth joint venture manufactures products in Japan for the semiconductor industry. Each joint venture partner holds several equivalent variable interests, with the exception of a royalty agreement held exclusively between the joint venture and the Company. In addition, the entire output of the joint venture is sold to the Company for resale to third-party customers.
The fifth joint venture provides ethylene storage in Alberta, Canada. The Company's variable interests relate to arrangements involving a majority of the joint venture's storage capacity on take-or-pay terms with pricing ensuring a guaranteed return to the joint venture; and favorably priced leases provided to the joint venture. The Company provides the joint venture with operation and maintenance services and utilities.
The Company was a partner in a joint venture located in Brazil that produces ethanol from sugarcane. The Company's variable interests in this joint venture related to an equity option between the partners, a parental loan and guarantee related to debt financing, and contractual arrangements limiting the partner's initial participation in the economics of certain assets and liabilities. After formation of the joint venture, the partners amended the governing documents, including terms of the equity option. Terms of the equity option required the Company to purchase the partner's equity investment at a price based on a specified formula if the partner elected to exit the joint venture. In August 2015, the partner exercised its equity option which required Dow to purchase their equity investment. As a result, the Company reclassified the partner's equity investment from "Redeemable Noncontrolling Interest" to "Accrued and other current liabilities" in the consolidated balance sheets at December 31, 2015. On March 31, 2016, the partner's equity investment transferred to the Company. On July 11, 2016, the Company paid $202 million to the former partner, which is classified as "Purchases of noncontrolling interests" in the consolidated statements of cash flows. This former joint venture is now 100 percent owned by the Company, therefore its asset and liability balances are not included in the December 31, 2016, balances in the "Assets and Liabilities of Consolidated VIEs at December 31" table that follows. The Company continues to hold variable interests in a related entity that owns a cogeneration facility, which represents the sixth entity for which the Company is the primary beneficiary. The Company's variable interests are the result of a tolling arrangement where it provides fuel to the entity and purchases a majority of the cogeneration facility’s output on terms that ensure a return to the entity’s equity holders. The assets and liabilities of the cogeneration facility continue to be included in the table that follows.
The Company previously held an equity interest in a joint venture that owns and operates a membrane chlor-alkali manufacturing facility. The Company’s variable interests in this joint venture related to equity options between the partners and a cost-plus off-take arrangement between the joint venture and the Company, involving proportional purchase commitments on take-or-pay terms and ensuring a guaranteed return to the joint venture. In the second quarter of 2015, Mitsui & Co. Texas Chlor-Alkali Inc. ("Mitsui"), a 50 percent equity owner in this joint venture, provided notice of its intention to transfer its equity interest to Dow as part of the Transaction with Olin. On October 5, 2015, the Company purchased Mitsui's equity interest in the membrane chlor-alkali joint venture for $133 million, which resulted in a loss of $25 million included in "Sundry income (expense) - net" in the consolidated statements of income and included as a component of the pretax gain on the Transaction. The loss is reflected in the Performance Materials & Chemicals segment. See Note 6 for additional information on this Transaction.
The Company previously held a 49 percent equity interest in a joint venture that managed the growth, harvest and conditioning of soybean seed and grain, corn and wheat in the United States. The Company's variable interest in this joint venture related to an equity option between the partners. Terms of the equity option required the Company to purchase the partner's equity investment at a price based on a specified formula, after a specified period of time, and satisfaction of certain conditions, if the partner elected to sell its equity investment. On August 10, 2015, the equity option was determined to be exercisable and the partner provided notice to the Company of its intent to exercise the equity option, which resulted in an after-tax loss of $22 million, included in "Net income attributable to noncontrolling interests" in the consolidated statements of income. The Company purchased the partner's equity investment on September 18, 2015, which resulted in the joint venture becoming a wholly owned subsidiary of Dow. Subsequent to the purchase of the partner's equity investment, the Company sold its entire ownership interest in the subsidiary to a third party and recognized a pretax gain of $44 million on the sale in the third quarter
134
of 2015, included in "Sundry income (expense) - net" in the consolidated statements of income and reflected in the Agricultural Sciences segment.
The Company previously held a variable interest in an owner trust, for which the Company was the primary beneficiary. The owner trust leased an ethylene production facility in The Netherlands to the Company, whereby substantially all of the rights and obligations of ownership were transferred to the Company. The Company’s variable interest in the owner trust related to a fixed purchase price option. On January 2, 2014, the Company purchased the ethylene production facility for $406 million. The Company classified $346 million as "Payments on long-term debt" and $60 million as "Purchases of noncontrolling interests" in the consolidated statements of cash flows.
The Company's consolidated financial statements include the assets, liabilities and results of operations of variable interest entities ("VIEs") for which the Company is the primary beneficiary. The other equity holders’ interests are reflected in "Net income attributable to noncontrolling interests" in the consolidated statements of income and "Noncontrolling interests" and "Accrued and other current liabilities" in the consolidated balance sheets. The following table summarizes the carrying amounts of these entities’ assets and liabilities included in the Company’s consolidated balance sheets at December 31, 2016 and 2015:
Assets and Liabilities of Consolidated VIEs at December 31 In millions | 2016 | 2015 | ||||||
Cash and cash equivalents | $ | 75 | $ | 158 | ||||
Other current assets | 95 | 112 | ||||||
Net property | 961 | 1,717 | ||||||
Other noncurrent assets | 55 | 65 | ||||||
Total assets (1) | $ | 1,186 | $ | 2,052 | ||||
Current liabilities (nonrecourse 2016: $286; 2015: $256) | $ | 286 | $ | 258 | ||||
Long-term debt (nonrecourse 2016: $330; 2015: $487) | 330 | 504 | ||||||
Other noncurrent obligations (nonrecourse 2016: $47; 2015: $51) | 47 | 51 | ||||||
Total liabilities | $ | 663 | $ | 813 | ||||
(1) | All assets were restricted at December 31, 2016 and December 31, 2015. |
In addition, the Company holds a variable interest in an entity created to monetize accounts receivable of select European entities. This is the seventh entity for which the Company is the primary beneficiary and it results from the Company holding subordinated notes while maintaining servicing responsibilities for the accounts receivable. The carrying amounts of assets and liabilities included in the Company’s consolidated balance sheets pertaining to this entity were current assets of $477 million (zero restricted) at December 31, 2016 ($103 million, zero restricted, at December 31, 2015) and current liabilities of less than $1 million (zero nonrecourse) at December 31, 2016 (less than $1 million, zero nonrecourse, at December 31, 2015).
Amounts presented in the consolidated balance sheets and the table above as restricted assets or nonrecourse obligations relating to consolidated VIEs at December 31, 2016 and 2015 are adjusted for intercompany eliminations and parental guarantees.
Nonconsolidated Variable Interest Entities
As a result of the DCC Transaction, the Company holds variable interests in Hemlock Semiconductor L.L.C. The variable interests relate to an equity interest held by the Company and arrangements between the Company and the joint venture to provide services. The Company is not the primary beneficiary, as it does not direct the activities that most significantly impact the economic performance of this entity; therefore, the entity is accounted for under the equity method of accounting. At December 31, 2016, the Company had a negative investment basis of $902 million in this joint venture, which is classified as "Other noncurrent obligations" in the consolidated balance sheets. The Company's maximum exposure to loss was zero at December 31, 2016. See Note 9 for additional information on this variable interest entity.
Also as a result of the DCC Transaction, the Company holds minority voting interests in certain joint ventures that produce silicon inputs for the Company. These joint ventures operate under supply agreements that sell inventory to the equity owners using pricing mechanisms that guarantee a return, therefore shielding the joint ventures from the obligation to absorb expected losses. As a result of the pricing mechanisms of these agreements, these entities are determined to be variable interest entities. The Company is not the primary beneficiary, as it does not hold the power to direct the activities that most significantly impact the economic performance of these entities; therefore, the entities are accounted for under the equity method of accounting. The Company's maximum exposure to loss as a result of its involvement with these variable interest entities is determined to be the carrying value of the investment in these entities. At December 31, 2016, the Company's investment in these joint ventures was $96 million and is classified as "Investment in nonconsolidated affiliates" in the consolidated balance sheets, representing the Company's maximum exposure to loss.
135
The Company holds a variable interest in a joint venture that manufactures crude acrylic acid in the United States and Germany on behalf of the Company and the other joint venture partner. The variable interest relates to a cost-plus arrangement between the joint venture and each joint venture partner. The Company is not the primary beneficiary, as a majority of the joint venture’s output is committed to the other joint venture partner; therefore, the entity is accounted for under the equity method of accounting. At December 31, 2016, the Company’s investment in the joint venture was $171 million ($160 million at December 31, 2015), classified as “Investment in nonconsolidated affiliates” in the consolidated balance sheets, representing the Company’s maximum exposure to loss.
The Company holds variable interests in AFSI, a company that produces and sells proprietary technologies for the horticultural market. The variable interests in AFSI relate to a sublease agreement between Dow and AFSI; a tax receivable agreement that entitles Dow to additional consideration in the form of tax savings, which is contingent on the operations and earnings of AFSI; and contingent consideration, which is subject to certain performance conditions. The Company is not the primary beneficiary, as Dow is a minority shareholder in AFSI and AFSI is governed by a board of directors, the composition of which is mandated by AFSI's corporate governance requirements that a majority of the directors be independent. At December 31, 2016, the Company's investment in AFSI was $46 million ($191 million at December 31, 2015), and is classified as "Investment in nonconsolidated affiliates" in the consolidated balance sheets. In the fourth quarter of 2016, as a result of a decline in the market value of AFSI, the Company recognized a $143 million pretax impairment charge related to its equity interest in AFSI (see Notes 9 and 12 for further information). In addition, the Company has a receivable with AFSI related to the tax receivable agreement of $12 million at December 31, 2016 (zero at December 31, 2015) and a receivable for six million warrants, valued at $1 million at December 31, 2016 ($6 million at December 31, 2015), which are classified as "Accounts and notes receivable - Other" in the consolidated balance sheets. The Company's maximum exposure to loss was $59 million at December 31, 2016 ($197 million at December 31, 2015).
NOTE 21 – STOCK-BASED COMPENSATION
The Company provides stock-based compensation in the form of the Employee Stock Purchase Plan (“ESPP”), which grants eligible employees the right to purchase shares of the Company's common stock at a discounted price. The Company also grants stock-based compensation to employees and non-employee directors in the form of stock incentive plans, which include stock options, deferred stock, performance deferred stock and restricted stock. Information regarding these plans is provided below.
Accounting for Stock-Based Compensation
The Company grants stock-based compensation awards that vest over a specified period or upon employees meeting certain performance and/or retirement eligibility criteria. The fair value of equity instruments issued to employees is measured on the grant date. The fair value of liability instruments issued to employees (specifically, performance deferred stock awards, which are granted to executive employees subject to stock ownership requirements, that provide the recipient the option to elect to receive a cash payment equal to the value of the stock award on the date of delivery) is measured at the end of each quarter. The fair value of equity and liability instruments is expensed over the vesting period or, in the case of retirement, from the grant date to the date on which retirement eligibility provisions have been met and additional service is no longer required.
The Company uses a lattice-based option valuation model to estimate the fair value of stock options, the Black-Scholes option valuation model for subscriptions to purchase shares under the ESPP and Monte Carlo simulation for the market portion of performance deferred stock awards. The weighted-average assumptions used to calculate total stock-based compensation are included in the following table:
Weighted-Average Assumptions | 2016 | 2015 | 2014 | ||||||
Dividend yield | 4.13 | % | 3.54 | % | 3.08 | % | |||
Expected volatility | 31.60 | % | 27.84 | % | 28.11 | % | |||
Risk-free interest rate | 1.12 | % | 1.02 | % | 1.11 | % | |||
Expected life of stock options granted during period (years) | 7.8 | 7.7 | 7.7 | ||||||
Life of Employee Stock Purchase Plan (months) | 4 | 6 | 6 | ||||||
The dividend yield assumption for 2016 and 2015 was equal to the dividend yield on the grant date, which reflected the most recent quarterly dividend payment of $0.46 per share in 2016 ($0.42 per share in 2015). The dividend yield assumption for 2014 was equal to the dividend yield on the grant date, which for stock options was the most recent quarterly dividend declared on the grant date of $0.37 per share and for the ESPP was the first quarter dividend payment of $0.32 per share. The expected volatility assumptions for stock options and ESPP were based on an equal weighting of the historical daily volatility for the
136
term of the awards and current implied volatility from exchange-traded options. The expected volatility assumption for the market portion of the performance deferred stock awards was based on historical daily volatility for the term of the award. The risk-free interest rate was based on the weighted-average of U.S. Treasury strip rates over the contractual term of the options. The expected life of stock options granted was based on an analysis of historical exercise patterns.
Employee Stock Purchase Plan
On February 9, 2012, the Board of Directors authorized The Dow Chemical Company 2012 Employee Stock Purchase Plan which was approved by stockholders at the Company’s annual meeting on May 10, 2012. Under the 2016 annual offering, most employees were eligible to purchase shares of common stock of the Company valued at up to 10 percent of their annual base salary. The value is determined using the plan price multiplied by the number of shares subscribed to by the employee. The plan price of the stock is set at an amount equal to at least 85 percent of the fair market value (closing price) of the common stock on a date during the fourth quarter of the year prior to the offering, or the average fair market value (closing price) of the common stock over a period during the fourth quarter of the year prior to the offering, in each case, specified by the Vice President of Human Resources.
Employee Stock Purchase Plan | 2016 | ||||||
Shares in thousands | Shares | Exercise Price (1) | |||||
Outstanding and exercisable at January 1, 2016 | 7 | $ | 41.49 | ||||
Granted | 2,122 | $ | 40.44 | ||||
Exercised | (2,124 | ) | $ | 40.44 | |||
Forfeited/Expired | (5 | ) | $ | 40.56 | |||
Outstanding and exercisable at December 31, 2016 | — | $ | — | ||||
(1) | Weighted average price per share |
Additional Information about Employee Stock Purchase Plan In millions, except per share amounts | 2016 | 2015 | 2014 | |||||||||
Weighted-average fair value per share of purchase rights granted | $ | 3.40 | $ | 4.62 | $ | 5.45 | ||||||
Total compensation expense for ESPP | $ | 7 | $ | 15 | $ | 20 | ||||||
Related tax benefit | $ | 3 | $ | 5 | $ | 7 | ||||||
Total amount of cash received from the exercise of purchase rights | $ | 86 | $ | 131 | $ | 138 | ||||||
Total intrinsic value of purchase rights exercised (1) | $ | 23 | $ | 25 | $ | 42 | ||||||
Related tax benefit | $ | 9 | $ | 9 | $ | 15 | ||||||
(1) | Difference between the market price at exercise and the price paid by the employee to exercise the purchase rights. |
Stock Incentive Plan
The Company has historically granted equity awards under various plans (the "Prior Plans"). On February 9, 2012, the Board of Directors authorized The Dow Chemical Company 2012 Stock Incentive Plan (the "2012 Plan"), which was approved by stockholders at the Company's annual meeting on May 10, 2012 ("Original Effective Date") and became effective on that date. On February 13, 2014, the Board of Directors adopted The Dow Chemical Company Amended and Restated 2012 Stock Incentive Plan (the "2012 Restated Plan"). The 2012 Restated Plan was approved by stockholders at the Company's annual meeting on May 15, 2014 and became effective on that date. The Prior Plans were superseded by the 2012 Plan and the 2012 Restated Plan (collectively, the "2012 Plan"). Under the 2012 Plan, the Company may grant options, deferred stock, performance deferred stock, restricted stock, stock appreciation rights and stock units to employees and non-employee directors until the tenth anniversary of the Original Effective Date, subject to an aggregate limit and annual individual limits. The terms of the grants are fixed at the grant date. At December 31, 2016, there were approximately 45 million shares available for grant under the 2012 Plan.
Stock Options
The Company grants stock options to certain employees, subject to certain annual and individual limits, with terms of the grants fixed at the grant date. The exercise price of each stock option equals the market price of the Company’s stock on the grant date. Options vest from one to three years, and have a maximum term of 10 years.
137
The following table summarizes stock option activity for 2016:
Stock Options | 2016 | |||||||
Shares in thousands | Shares | Exercise Price (1) | ||||||
Outstanding at January 1, 2016 | 41,461 | $ | 35.50 | |||||
Granted | 2,988 | $ | 46.01 | |||||
Exercised | (9,061 | ) | $ | 35.89 | ||||
Forfeited/Expired | (618 | ) | $ | 41.56 | ||||
Outstanding at December 31, 2016 | 34,770 | $ | 36.20 | |||||
Remaining contractual life in years | 5.24 | |||||||
Aggregate intrinsic value in millions | $ | 731 | ||||||
Exercisable at December 31, 2016 | 28,932 | $ | 33.96 | |||||
Remaining contractual life in years | 4.60 | |||||||
Aggregate intrinsic value in millions | $ | 673 | ||||||
(1) | Weighted-average per share. |
Additional Information about Stock Options In millions, except per share amounts | 2016 | 2015 | 2014 | |||||||||
Weighted-average fair value per share of options granted | $ | 10.95 | $ | 11.61 | $ | 11.49 | ||||||
Total compensation expense for stock option plans | $ | 32 | $ | 55 | $ | 65 | ||||||
Related tax benefit | $ | 12 | $ | 20 | $ | 24 | ||||||
Total amount of cash received from the exercise of options | $ | 312 | $ | 377 | $ | 810 | ||||||
Total intrinsic value of options exercised (1) | $ | 153 | $ | 175 | $ | 300 | ||||||
Related tax benefit | $ | 57 | $ | 65 | $ | 111 | ||||||
(1) | Difference between the market price at exercise and the price paid by the employee to exercise the options. |
Total unrecognized compensation cost related to unvested stock option awards of $16 million at December 31, 2016, is expected to be recognized over a weighted-average period of 0.84 years.
Deferred Stock
The Company grants deferred stock to certain employees. The grants vest after a designated period of time, generally one to three years. The following table shows changes in nonvested deferred stock:
Deferred Stock | 2016 | ||||||
Shares in thousands | Shares | Grant Date Fair Value (1) | |||||
Nonvested at January 1, 2016 | 7,979 | $ | 40.96 | ||||
Granted | 2,134 | $ | 46.25 | ||||
Vested | (3,525 | ) | $ | 32.16 | |||
Canceled | (206 | ) | $ | 43.70 | |||
Nonvested at December 31, 2016 | 6,382 | $ | 47.49 | ||||
(1) | Weighted-average per share. |
Additional Information about Deferred Stock In millions, except per share amounts | 2016 | 2015 | 2014 | |||||||||
Weighted-average fair value per share of deferred stock granted | $ | 46.25 | $ | 49.42 | $ | 46.88 | ||||||
Total fair value of deferred stock vested and delivered (1) | $ | 166 | $ | 162 | $ | 156 | ||||||
Related tax benefit | $ | 61 | $ | 60 | $ | 58 | ||||||
Total compensation expense for deferred stock awards | $ | 97 | $ | 110 | $ | 99 | ||||||
Related tax benefit | $ | 36 | $ | 41 | $ | 37 | ||||||
(1) | Includes the fair value of shares vested in prior years and delivered in the reporting year. |
Total unrecognized compensation cost related to deferred stock awards of $75 million at December 31, 2016, is expected to be recognized over a weighted-average period of 0.86 years. At December 31, 2016, approximately 26,000 deferred shares with a
138
grant date weighted-average fair value per share of $37.19 had previously vested, but were not issued. These shares are scheduled to be issued to employees within one to three years or upon retirement.
Performance Deferred Stock
The Company grants performance deferred stock to certain employees. The grants vest when the Company attains specified performance targets, such as return on capital and relative total shareholder return, over a predetermined period, generally one to three years. Compensation expense related to performance deferred stock awards is recognized over the lesser of the service or performance period. Changes in the fair value of liability instruments are recognized as compensation expense each quarter.
The following table shows the performance deferred stock awards granted:
Performance Deferred Stock Awards | Target Shares Granted (1) | Grant Date Fair Value (2) | |||||||
Shares in thousands | |||||||||
Year | Performance Period | ||||||||
2016 | January 1, 2016 – December 31, 2018 | 2,283 | $ | 52.68 | |||||
2015 | January 1, 2015 – December 31, 2017 | 2,258 | $ | 59.08 | |||||
2014 | January 1, 2014 – December 31, 2016 | 2,425 | $ | 54.42 | |||||
(1) | At the end of the performance period, the actual number of shares issued can range from zero to 200 percent of target shares granted. |
(2) | Weighted-average per share. |
The following table shows changes in nonvested performance deferred stock:
Performance Deferred Stock | 2016 | ||||||
Shares in thousands | Target Shares Granted (1) | Grant Date Fair Value (2) | |||||
Nonvested at January 1, 2016 | 4,621 | $ | 56.68 | ||||
Granted | 2,283 | $ | 52.68 | ||||
Vested (3) | (2,342 | ) | $ | 54.42 | |||
Canceled | (108 | ) | $ | 55.46 | |||
Nonvested at December 31, 2016 | 4,454 | $ | 55.85 | ||||
(1) | At the end of the performance period, the actual number of shares issued can range from zero to 200 percent of target shares granted. |
(2) | Weighted-average per share. |
(3) | Vested shares for the 2014 - 2016 performance period that were earned (i.e., performance conditions were satisfied and the target shares granted for the performance period vested) during the applicable fiscal year. Shares earned will be delivered in February 2017 at the applicable pay-out percentage. Certain executive employees may opt to receive a cash payment equal to the value of the stock award on the date of delivery. |
Additional Information about Performance Deferred Stock | ||||||||||||
In millions | 2016 | 2015 | 2014 | |||||||||
Total fair value of performance deferred stock vested and delivered (1) | $ | 103 | $ | 37 | $ | 12 | ||||||
Related tax benefit | $ | 38 | $ | 14 | $ | 5 | ||||||
Total compensation expense for performance deferred stock awards | $ | 125 | $ | 172 | $ | 67 | ||||||
Related tax benefit | $ | 46 | $ | 63 | $ | 25 | ||||||
Shares of performance deferred stock settled in cash (2) | 0.9 | 0.3 | 0.1 | |||||||||
Total cash paid to settle performance deferred stock awards (3) | $ | 40 | $ | 16 | $ | 6 | ||||||
(1) | Includes the fair value of shares vested in prior years and delivered in the reporting year. |
(2) | Performance deferred stock awards vested in prior years and delivered in the reporting year. |
(3) | Cash paid to certain executive employees for performance deferred stock awards vested in prior periods and delivered in the reporting year, equal to the value of the stock award on the date of delivery. |
Total unrecognized compensation cost related to performance deferred stock awards of $74 million at December 31, 2016, is expected to be recognized over a weighted-average period of 0.81 years. At December 31, 2016, approximately 3.4 million performance deferred shares with a grant date weighted-average fair value of $54.42 per share were vested, but not issued. These shares are scheduled to be issued in February 2017.
139
Restricted Stock
Under the 2012 Plan, the Company may grant shares (including options, stock appreciation rights, stock units and restricted stock) to non-employee directors over the 10-year duration of the program, subject to the plan's aggregate limit as well as annual individual limits. The restricted stock issued under this plan cannot be sold, assigned, pledged or otherwise transferred by the non-employee director, until the director is no longer a member of the Board. The following table shows the restricted stock issued under this plan:
Restricted Stock | Shares Issued | Weighted-Average Fair Value | |||||
Year | |||||||
2016 | 32,160 | $ | 50.55 | ||||
2015 | 31,560 | $ | 51.51 | ||||
2014 | 24,840 | $ | 48.98 | ||||
NOTE 22 – STOCKHOLDERS’ EQUITY
Cumulative Convertible Perpetual Preferred Stock, Series A
Equity securities in the form of Cumulative Convertible Perpetual Preferred Stock, Series A (“preferred series A”) were issued on April 1, 2009 to Berkshire Hathaway Inc. in the amount of $3 billion (3 million shares) and the Kuwait Investment Authority in the amount of $1 billion (1 million shares). Shareholders of preferred series A could convert all or any portion of their shares, at their option, at any time, into shares of the Company’s common stock at an initial conversion ratio of 24.2010 shares of common stock for each share of preferred series A. On or after the fifth anniversary of the issuance date, if the common stock price exceeded $53.72 per share for any 20 trading days in a consecutive 30-day window, the Company had the option, at any time, in whole or in part, to convert preferred series A into common stock at the then applicable conversion rate.
On December 15, 2016, the trading price of Dow's common stock closed at $58.35, marking the 20th trading day in the previous 30 trading days that the common stock closed above $53.72, triggering the right of the Company to exercise its conversion right. On December 16, 2016, the Company sent a Notice of Conversion at the Option of the Company (the "Notice") to all holders of its preferred series A. Pursuant to the Notice, on December 30, 2016 (the "Conversion Date") all 4 million outstanding shares of preferred series A were converted into shares of common stock at a conversion ratio of 24.2010 shares of common stock for each share of preferred series A, resulting in the issuance of 96.8 million shares of common stock from treasury stock. From and after the Conversion Date, no shares of the preferred series A are issued or outstanding and all rights of the holders of the preferred series A have terminated. On January 6, 2017, the Company filed an amendment to the Company’s Restated Certificate of Incorporation by way of a certificate of elimination (the “Certificate of Elimination”) with the Secretary of State of the State of Delaware which had the effect of: (a) eliminating the previously designated 4 million shares of the preferred series A, none of which were outstanding at the time of the filing; (b) upon such elimination, causing such preferred series A to resume the status of authorized and unissued shares of preferred stock, par value $1.00 per share, of the Company, without designation as to series; and (c) eliminating from the Company’s Restated Certificate of Incorporation all references to, and all matters set forth in, the certificates of designations for the preferred series A.
The Company paid cumulative dividends on preferred series A at a rate of 8.5 percent per annum, or $85 million per quarter. The final dividend for the preferred series A was declared on December 15, 2016 and payable on the earlier of the Conversion Date (if applicable) or January 3, 2017, to shareholders of record at December 15, 2016. The accrued dividend was paid in full on the Conversion Date.
Common Stock
The Company may issue common stock shares out of treasury stock or as new common stock shares for purchases under the Employee Stock Purchase Plan, for options exercised and for the release of deferred, performance deferred and restricted stock. New common stock shares issued by the Company are summarized in the table below:
New Common Stock Shares Issued | ||||||
Shares in thousands | 2016 | 2015 | 2014 | |||
To employees | — | — | 21,181 | |||
To non-employee directors | — | 32 | 25 | |||
140
Retained Earnings
There are no significant restrictions limiting the Company’s ability to pay dividends.
Undistributed earnings of nonconsolidated affiliates included in retained earnings were $1,196 million at December 31, 2016 and $2,708 million at December 31, 2015.
Employee Stock Ownership Plan
The Company has the Dow Employee Stock Ownership Plan (the “ESOP”), which is an integral part of The Dow Chemical Company Employees’ Savings Plan (the “Plan”). A significant majority of full-time employees in the United States are eligible to participate in the Plan. The Company uses the ESOP to provide the Company’s matching contribution in the form of the Company’s stock to Plan participants.
In connection with the acquisition of Rohm and Haas on April 1, 2009, the Rohm and Haas Employee Stock Ownership Plan (the "Rohm and Haas ESOP") was merged into the Plan, and the Company assumed the $78 million balance of debt at 9.8 percent interest with final maturity in 2020 that was used to finance share purchases by the Rohm and Haas ESOP in 1990. The outstanding balance of the debt was $24 million at December 31, 2016 and $30 million at December 31, 2015.
Dividends on unallocated shares held by the ESOP are used by the ESOP to make debt service payments and to purchase additional shares if dividends exceed the debt service payments. Dividends on allocated shares are used by the ESOP to make debt service payments to the extent needed; otherwise, they are paid to the Plan participants. Shares are released for allocation to participants based on the ratio of the current year’s debt service to the sum of the principal and interest payments over the life of the loan. The shares are allocated to Plan participants in accordance with the terms of the Plan.
Compensation expense for allocated shares is recorded at the fair value of the shares on the date of allocation. ESOP shares that have not been released or committed to be released are not considered outstanding for purposes of computing basic and diluted earnings per share.
Compensation expense for ESOP shares was $192 million in 2016, $174 million in 2015 and $163 million in 2014. At December 31, 2016, 15.8 million shares out of a total 29.3 million shares held by the ESOP had been allocated to participants’ accounts; 1.9 million shares were released but unallocated; and 11.6 million shares, at a fair value of $661 million, were considered unearned.
Treasury Stock
On February 13, 2013, the Board of Directors approved a share buy-back program, authorizing up to $1.5 billion to be spent on the repurchase of the Company's common stock over a period of time. On January 29, 2014, the Board of Directors announced an expansion of the Company's share buy-back authorization, authorizing an additional amount not to exceed $3 billion to be spent on the repurchase of the Company's common stock over a period of time. On November 12, 2014, the Board of Directors announced a new $5 billion tranche to its share buy-back program, with the repurchase of the Company's common stock timed to proceeds received from portfolio management actions and increases in operating cash flows. As a result of these actions, the total authorized amount of the share repurchase program is $9.5 billion. At December 31, 2016, $1.4 billion of the share buy-back authorization remained available for repurchases. The following table shows the total number of treasury shares purchased by the Company under the share repurchase program for each period presented:
Treasury Shares Repurchased with Cash | ||
Shares in millions | ||
2016 | 17.1 | |
2015 | 23.1 | |
2014 | 84.1 | |
In 2015, the Company also recorded 34.1 million treasury shares as part of the Transaction with Olin, which were tendered as part of a non-cash, public exchange offer. See Note 6 for additional information.
On December 11, 2015, the Company and DuPont announced that their boards of directors unanimously approved a definitive agreement under which the companies will combine in an all-stock merger of equals strategic combination. The combined company will be named DowDuPont. As a result of the planned merger of equals with DuPont, the Company determined that it would not repurchase shares until after the July 20, 2016, shareholder vote on the DowDuPont merger. The Company resumed share repurchases in the third quarter of 2016.
141
The Company may issue shares for purchases under the Employee Stock Purchase Plan, for options exercised as well as for the release of deferred, performance deferred and restricted stock out of treasury stock or as new common stock shares. The number of treasury shares issued to employees and non-employee directors under the Company’s stock-based compensation programs are summarized in the table below:
Treasury Shares Issued to Employees and Non-Employee Directors | ||
Shares in millions | ||
2016 | 14.5 | |
2015 | 16.5 | |
2014 | 7.1 | |
On December 30, 2016, preferred series A shares with a carrying value of $4,000 million were converted to shares of common stock, resulting in the issuance of 96.8 million shares of common stock from treasury stock. The treasury stock issued was carried at an aggregate historical cost of $4,695 million, resulting in a reduction to "Additional paid-in capital" in the consolidated balance sheets of $695 million.
NOTE 23 – INCOME TAXES
Domestic and Foreign Components of Income Before Income Taxes | ||||||||||||
In millions | 2016 | 2015 | 2014 | |||||||||
Domestic (1) (2) | $ | 485 | $ | 5,313 | $ | 1,652 | ||||||
Foreign (1) | 3,928 | 4,617 | 3,613 | |||||||||
Total | $ | 4,413 | $ | 9,930 | $ | 5,265 | ||||||
(1) | In 2016, the domestic component of "Income Before Income Taxes" included approximately $2.1 billion ($3.5 billion in 2015) and the foreign component contained zero ($1.1 billion in 2015) of income from portfolio actions. Amounts include gains from transactions noted below in the Reconciliation to U.S. Statutory Rate table. |
(2) | In 2016, the domestic component of “Income Before Income Taxes” included approximately $2.6 billion of expenses related to the urethane matters class action lawsuit and opt-out cases settlements, asbestos-related charge and charges for environmental matters. |
Provision for Income Taxes | ||||||||||||||||||||||||||||||||||||
2016 | 2015 | 2014 | ||||||||||||||||||||||||||||||||||
In millions | Current | Deferred | Total | Current | Deferred | Total | Current | Deferred | Total | |||||||||||||||||||||||||||
Federal (1) | $ | 91 | $ | (1,255 | ) | $ | (1,164 | ) | $ | 583 | $ | 358 | $ | 941 | $ | (161 | ) | $ | 442 | $ | 281 | |||||||||||||||
State and local | 21 | (10 | ) | 11 | 38 | (8 | ) | 30 | (4 | ) | 43 | 39 | ||||||||||||||||||||||||
Foreign | 1,156 | 6 | 1,162 | 1,221 | (45 | ) | 1,176 | 1,125 | (19 | ) | 1,106 | |||||||||||||||||||||||||
Total | $ | 1,268 | $ | (1,259 | ) | $ | 9 | $ | 1,842 | $ | 305 | $ | 2,147 | $ | 960 | $ | 466 | $ | 1,426 | |||||||||||||||||
(1) | The 2016 amount reflects the tax impact of accrued one-time items and reduced domestic income which limited the utilization of tax credits. The 2014 amount reflects the impact of accelerated deductions. |
142
Reconciliation to U.S. Statutory Rate | ||||||||||||
In millions | 2016 | 2015 | 2014 | |||||||||
Taxes at U.S. statutory rate | $ | 1,545 | $ | 3,476 | $ | 1,843 | ||||||
Equity earnings effect | (52 | ) | (197 | ) | (307 | ) | ||||||
Foreign income taxed at rates other than 35% (1) | (309 | ) | (398 | ) | (195 | ) | ||||||
U.S. tax effect of foreign earnings and dividends | (204 | ) | 130 | 54 | ||||||||
Goodwill impact from divestitures | 5 | 57 | — | |||||||||
Discrete equity earnings (2) | — | 21 | 26 | |||||||||
Change in valuation allowances | 8 | (32 | ) | 33 | ||||||||
Unrecognized tax benefits | (34 | ) | 81 | (30 | ) | |||||||
Federal tax accrual adjustments | (6 | ) | 13 | (3 | ) | |||||||
Gain on ownership restructure of Dow Corning (3) | (993 | ) | — | — | ||||||||
Non-deductible costs associated with transactions and productivity actions | 33 | — | — | |||||||||
Impact from split-off of chlorine value chain (4) | 21 | (763 | ) | — | ||||||||
Gain on Univation step acquisition (3) | — | (124 | ) | — | ||||||||
Gain on sale of MEGlobal (5) | — | (120 | ) | — | ||||||||
Other – net | (5 | ) | 3 | 5 | ||||||||
Total tax provision | $ | 9 | $ | 2,147 | $ | 1,426 | ||||||
Effective tax rate | 0.2 | % | 21.6 | % | 27.1 | % | ||||||
(1) | Includes the tax provision for statutory taxable income in foreign jurisdictions for which there is no corresponding amount in “Income Before Income Taxes.” |
(2) | Includes nonrecurring charges related to equity in earnings of nonconsolidated affiliates in 2015 and 2014. |
(3) | See Note 4 for further information. |
(4) | See Note 6 for further information. |
(5) | See Note 5 for further information. |
The tax rate for 2016 was favorably impacted by the non-taxable gain on the DCC Transaction and a tax benefit on the reassessment of a deferred tax liability related to the basis difference in the Company’s investment in Dow Corning. The tax rate was also favorably impacted by the geographic mix of earnings, the availability of foreign tax credits and the deductibility of both the urethane matters class action lawsuit and opt-out cases settlements and the asbestos-related charge. A reduction in equity earnings and non-deductible costs associated with transactions and productivity actions unfavorably impacted the tax rate. These factors resulted in an effective tax rate of 0.2 percent for 2016.
The tax rate for 2015 was favorably impacted by portfolio actions, specifically the tax-efficient split-off of the chlorine value chain, the non-taxable gain from the Univation step acquisition and the sale of MEGlobal. The geographic mix of earnings favorably impacted the tax rate with the gain from the ANGUS Chemical Company divestiture and continued profitability improvement in Europe and Asia Pacific providing most of the benefit. The tax rate was unfavorably impacted by foreign subsidiaries repatriating cash to the United States, which was primarily derived from divestiture proceeds. Reduced equity earnings and continued increases in statutory income in Latin America and Canada due to local currency devaluations also unfavorably impacted the tax rate. These factors resulted in an effective tax rate of 21.6 percent for 2015.
The tax rate for 2014 was favorably impacted by the geographic mix of earnings, with the most notable components being improved profitability in Europe and Asia Pacific as well as equity earnings providing additional favorable impact on the tax rate. The tax rate was also favorably impacted by a reduction in the tax on remittances by foreign subsidiaries to the United States. The tax rate was unfavorably impacted by a continued increase in statutory income in Latin America due to local currency devaluations, and increase in valuation allowances, primarily in Asia Pacific. These factors resulted in an effective tax rate of 27.1 percent for 2014.
143
Deferred Tax Balances at December 31 | 2016 | 2015 | ||||||||||||||
In millions | Deferred Tax Assets (1) | Deferred Tax Liabilities (1) | Deferred Tax Assets | Deferred Tax Liabilities | ||||||||||||
Property (2) | $ | 307 | $ | 2,860 | $ | 130 | $ | 2,097 | ||||||||
Tax loss and credit carryforwards | 2,450 | — | 1,647 | — | ||||||||||||
Postretirement benefit obligations (2) | 3,715 | 75 | 2,939 | 84 | ||||||||||||
Other accruals and reserves (2) | 1,964 | 883 | 1,389 | 882 | ||||||||||||
Intangibles | 128 | 1,536 | 208 | 692 | ||||||||||||
Inventory (3) | 50 | 197 | 13 | 218 | ||||||||||||
Investments | 179 | 119 | 204 | 242 | ||||||||||||
Other – net (2) | 737 | 643 | 780 | 542 | ||||||||||||
Subtotal | $ | 9,530 | $ | 6,313 | $ | 7,310 | $ | 4,757 | ||||||||
Valuation allowances | (1,061 | ) | — | (1,000 | ) | — | ||||||||||
Total | $ | 8,469 | $ | 6,313 | $ | 6,310 | $ | 4,757 | ||||||||
(1) | The Company assumed $999 million of deferred tax assets and $1,858 million of deferred tax liabilities as part of the DCC Transaction. See Note 4 for additional information. |
(2) | Prior year was adjusted to conform to the current year presentation. |
(3) | Prior year was adjusted to conform to the current year presentation for the reclassification of $293 million of prepaid tax assets to "Other current assets." See Note 1 for additional information. |
Gross operating loss carryforwards amounted to $10,580 million at December 31, 2016 and $10,364 million at December 31, 2015. At December 31, 2016, $1,922 million of the operating loss carryforwards were subject to expiration in 2017 through 2021. The remaining operating loss carryforwards expire in years beyond 2021 or have an indefinite carryforward period. Tax credit carryforwards at December 31, 2016 amounted to $928 million ($128 million at December 31, 2015), net of uncertain tax positions. The increase in tax credit carryforwards in 2016 was primarily due to reduced domestic income which limited the utilization of tax credits. Tax credit carryforwards of $28 million are subject to expiration in 2017 through 2021 and the remaining expire in years beyond 2021 or have an indefinite carryforward period.
The Company had valuation allowances that primarily related to the realization of recorded tax benefits on tax loss carryforwards from operations in the United States, Brazil and Asia Pacific of $1,061 million at December 31, 2016 and $1,000 million at December 31, 2015.
Undistributed earnings of foreign subsidiaries and related companies that are deemed to be permanently invested amounted to $18,668 million at December 31, 2016, $18,773 million at December 31, 2015 and $18,037 million at December 31, 2014. It is not practicable to calculate the unrecognized deferred tax liability on undistributed earnings.
In the fourth quarter of 2016, a settlement of $206 million was reached on a tax matter associated with a historical change in the legal ownership structure of a nonconsolidated affiliate. As a result of the settlement, the Company recorded a net decrease in uncertain tax positions of $67 million, included in “Other noncurrent obligations” in the consolidated balance sheets, and an unfavorable impact of $13 million to “Provision for income taxes” in the consolidated statements of income. The following table provides a reconciliation of the Company's unrecognized tax benefits:
Total Gross Unrecognized Tax Benefits | ||||||||||||
In millions | 2016 | 2015 | 2014 | |||||||||
Balance at January 1 | $ | 280 | $ | 240 | $ | 266 | ||||||
Increases related to positions taken on items from prior years (1) | 153 | 92 | 42 | |||||||||
Decreases related to positions taken on items from prior years | (12 | ) | (6 | ) | (57 | ) | ||||||
Increases related to positions taken in the current year (2) | 135 | 10 | 10 | |||||||||
Settlement of uncertain tax positions with tax authorities (1) | (325 | ) | (56 | ) | (13 | ) | ||||||
Decreases due to expiration of statutes of limitations | — | — | (8 | ) | ||||||||
Balance at December 31 | $ | 231 | $ | 280 | $ | 240 | ||||||
(1) | Includes the impact of a settlement agreement related to a historical change in the legal ownership structure of a nonconsolidated affiliate. |
(2) | Includes $126 million assumed in the DCC Transaction. |
At December 31, 2016, the total amount of unrecognized tax benefits which would impact the effective tax rate if recognized was $223 million ($206 million at December 31, 2015).
144
Interest and penalties are recognized as components of the “Provision for income taxes,” and totaled a benefit of $55 million in 2016, a charge of $80 million in 2015 and a charge of $15 million in 2014. The Company’s accrual for interest and penalties associated with uncertain tax positions was $59 million at December 31, 2016 and $159 million at December 31, 2015.
On January 9, 2017, the U.S. Supreme Court denied certiorari in the Company’s tax treatment of partnerships and transactions associated with Chemtech, a wholly owned subsidiary. The Company has fully accrued the position and does not expect a future impact to “Provision for income taxes” in the consolidated statements of income as a result of the ruling.
Tax years that remain subject to examination for the Company’s major tax jurisdictions are shown below:
Tax Years Subject to Examination by Major Tax Jurisdiction at December 31 | ||||
Earliest Open Year | ||||
Jurisdiction | 2016 | 2015 | ||
Argentina | 2009 | 2008 | ||
Brazil | 2006 | 2006 | ||
Canada | 2012 | 2010 | ||
Germany | 2006 | 2006 | ||
Italy | 2012 | 2011 | ||
The Netherlands | 2015 | 2013 | ||
Switzerland | 2012 | 2012 | ||
United States: | ||||
Federal income tax | 2004 | 2004 | ||
State and local income tax | 2004 | 2004 | ||
The Company is currently under examination in a number of tax jurisdictions. It is reasonably possible that some of these examinations may be resolved within twelve months. As a result, it is reasonably possible that the total gross unrecognized tax benefits of the Company at December 31, 2016, may range from an increase of $10 million to a decrease of $61 million in the next twelve months as a result of these resolved examinations. The impact on the Company’s results of operations is not expected to be material.
The reserve for non-income tax contingencies related to issues in the United States and foreign locations was $108 million at December 31, 2016 and $64 million at December 31, 2015. This is management’s best estimate of the potential liability for non-income tax contingencies. Inherent uncertainties exist in estimates of tax contingencies due to changes in tax law, both legislated and concluded through the various jurisdictions’ tax court systems. It is the opinion of the Company’s management that the possibility is remote that costs in excess of those accrued will have a material impact on the Company’s consolidated financial statements.
145
NOTE 24 – ACCUMULATED OTHER COMPREHENSIVE LOSS
The following table provides an analysis of the changes in accumulated other comprehensive loss for the years ended December 31, 2016, 2015 and 2014:
Accumulated Other Comprehensive Loss | |||||||||||
In millions | 2016 | 2015 | 2014 | ||||||||
Unrealized Gains on Investments at beginning of year | $ | 47 | $ | 141 | $ | 160 | |||||
Net change in unrealized gains (losses) (net of tax of $22, $(22), $22) | 32 | (40 | ) | 41 | |||||||
Reclassification to earnings - Net sales (net of tax of $(19), $(27), $(32)) (1) | (34 | ) | (49 | ) | (59 | ) | |||||
Reclassification to earnings - Sundry income (expense) - net (net of tax of $(1), $(3), $(1)) (1) | (2 | ) | (5 | ) | (1 | ) | |||||
Balance at end of period | $ | 43 | $ | 47 | $ | 141 | |||||
Cumulative Translation Adjustments at beginning of year | $ | (1,737 | ) | $ | (751 | ) | $ | 476 | |||
Translation adjustments (net of tax of $171, $(84), $(28)) | (644 | ) | (990 | ) | (1,239 | ) | |||||
Reclassification to earnings - Sundry income (expense) - net (2) | — | 4 | 12 | ||||||||
Balance at end of period | $ | (2,381 | ) | $ | (1,737 | ) | $ | (751 | ) | ||
Pension and Other Postretirement Benefit Plans at beginning of year | $ | (6,769 | ) | $ | (7,321 | ) | $ | (5,460 | ) | ||
Net gain (loss) arising during period (net of tax of $(617), $70, $(1,228)) (3) | (1,354 | ) | 132 | (2,516 | ) | ||||||
Prior service credit (cost) arising during period (net of tax of $-, $(36), $185) (3) | — | (27 | ) | 315 | |||||||
Amortization of prior service cost (credit) included in net periodic pension costs (net of tax of $(10), $(10), $6) (3) | (17 | ) | (20 | ) | 14 | ||||||
Amortization of net loss included in net periodic pension costs (net of tax of $189, $228, $158) (3) | 391 | 467 | 326 | ||||||||
Reclassification to earnings - Sundry income (expense) - net (4) | 360 | — | — | ||||||||
Balance at end of period | $ | (7,389 | ) | $ | (6,769 | ) | $ | (7,321 | ) | ||
Derivative Instruments at beginning of year | $ | (208 | ) | $ | (86 | ) | $ | (3 | ) | ||
Net hedging results (net of tax of $27, $(79), $(25)) | 84 | (136 | ) | (91 | ) | ||||||
Reclassification to earnings - Cost of sales (net of tax of $5, $9, $2) (1) | 28 | 14 | 8 | ||||||||
Reclassification to earnings - Sundry income (expense) - net | 1 | — | — | ||||||||
Balance at end of period | $ | (95 | ) | $ | (208 | ) | $ | (86 | ) | ||
Total Accumulated Other Comprehensive Loss | $ | (9,822 | ) | $ | (8,667 | ) | $ | (8,017 | ) | ||
(1) | Tax amounts are included in "Provision for income taxes" in the consolidated statements of income. |
(2) | In 2015 and 2014, reclassification resulted from the liquidation and divestiture of subsidiaries. |
(3) | See Note 18 for additional information. |
(4) | Related to the DCC Transaction. See Note 4 for additional information. |
146
NOTE 25 – NONCONTROLLING INTERESTS
Ownership interests in the Company's subsidiaries held by parties other than the Company are presented separately from the Company's equity in the consolidated balance sheets as "Accrued and other current liabilities" and "Noncontrolling interests." The amount of consolidated net income attributable to the Company and the noncontrolling interests are both presented on the face of the consolidated statements of income.
The following table summarizes the activity for equity attributable to noncontrolling interests for the years ended December 31, 2016, 2015 and 2014:
Noncontrolling Interests In millions | 2016 | 2015 | 2014 | ||||||||
Balance at January 1 | $ | 809 | $ | 931 | $ | 1,026 | |||||
Net income attributable to noncontrolling interests | 86 | 98 | 67 | ||||||||
Distributions to noncontrolling interests (1) | (123 | ) | (76 | ) | (64 | ) | |||||
Capital contributions (2) | — | 38 | 36 | ||||||||
Purchases of noncontrolling interests (3) | — | (42 | ) | (56 | ) | ||||||
Transfers of redeemable noncontrolling interest (4) | — | (108 | ) | (46 | ) | ||||||
Acquisition of noncontrolling interests (5) | 473 | — | — | ||||||||
Cumulative translation adjustments | (4 | ) | (34 | ) | (29 | ) | |||||
Other | 1 | 2 | (3 | ) | |||||||
Balance at December 31 | $ | 1,242 | $ | 809 | $ | 931 | |||||
(1) | Distributions to noncontrolling interests is net of $53 million for the year ended 2016 ($36 million in 2015 and $27 million in 2014) in dividends paid to a joint venture, which were reclassified to "Equity in earnings of nonconsolidated affiliates" in the consolidated statements of income. |
(2) | Includes non-cash capital contributions of $21 million in 2015. |
(3) | The 2016 value excludes a $202 million cash payment as the noncontrolling interest was classified as "Accrued and other current liabilities" in the consolidated balance sheets. The 2015 value excludes a $133 million cash payment for the purchase of a Redeemable Noncontrolling Interest. See Notes 6 and 20 for additional information. |
(4) | See Notes 6 and 20 for additional information. |
(5) | Assumed in the DCC Transaction. See Note 4 for additional information. |
NOTE 26 – OPERATING SEGMENTS AND GEOGRAPHIC AREAS
Dow is a diversified, worldwide manufacturer and supplier of products used primarily as raw materials in the manufacture of customer products and services. The Company serves the following industries: appliance; automotive; agricultural; building and construction; chemical processing; electronics; furniture; housewares; oil and gas; packaging; paints, coatings and adhesives; personal care; pharmaceutical; processed foods; pulp and paper; textile and carpet; utilities; and water treatment.
Dow conducts its worldwide operations through global businesses, which are reported in five operating segments. Corporate contains the reconciliation between the totals for the reportable segments and the Company’s totals and includes research and other expenses related to new business development activities, and other corporate items not allocated to the reportable operating segments.
The Company uses EBITDA (which Dow defines as earnings (i.e., "Net Income") before interest, income taxes, depreciation and amortization) as its measure of profit/loss for segment reporting purposes. EBITDA by operating segment includes all operating items relating to the businesses; items that principally apply to the Company as a whole are assigned to Corporate. See the tables at the end of this footnote for depreciation and amortization by segment, as well as a reconciliation of “Income Before Income Taxes” to EBITDA.
Corporate Profile
Dow combines the power of science and technology to passionately innovate what is essential to human progress. The Company is driving innovations that extract value from material, polymer, chemical and biological science to help address many of the world's most challenging problems, such as the need for fresh food, safer and more sustainable transportation, clean water, energy efficiency, more durable infrastructure, and increasing agricultural productivity. Dow's integrated, market-driven portfolio delivers a broad range of technology-based products and solutions to customers in 175 countries and in high-growth sectors such as packaging, infrastructure, transportation, consumer care, electronics and agriculture. In 2016, Dow had
147
annual sales of $48 billion and employed approximately 56,000 people worldwide. The Company's more than 7,000 product families are manufactured at 189 sites in 34 countries across the globe. The Company conducts its worldwide operations through global businesses, which are reported in five operating segments: Agricultural Sciences, Consumer Solutions, Infrastructure Solutions, Performance Materials & Chemicals and Performance Plastics.
Agricultural Sciences
The Agricultural Sciences segment is a global leader in providing crop protection and seed/plant biotechnology products and technologies, urban pest management solutions and healthy oils. The business invents, develops, manufactures and markets products for use in agricultural, industrial and commercial pest management. Agricultural Sciences consists of two businesses - Crop Protection and Seeds.
Acquisition:
On January 30, 2015, DAS acquired Coodetec's seed business. See Note 4 for additional information on this acquisition.
Divestiture:
On July 31, 2015, the Company sold its AgroFresh business to AFSI. The AgroFresh business was reported in the Agricultural Sciences segment through the date of divestiture. The Company has retained a minority interest in AFSI which is reported in the Agricultural Sciences segment and accounted for as an equity method investment. See Note 5 for additional information on this divestiture.
Consumer Solutions
The Consumer Solutions segment consists of four global businesses: Consumer Care, Dow Automotive Systems, Dow Electronic Materials and Consumer Solutions - Silicones. These global businesses develop and market customized materials using advanced technology and unique chemistries for specialty applications - including semiconductors and organic light-emitting diodes, adhesives and foams used by the transportation industry, cellulosics and other polymers for innovative pharmaceutical formulations and food solutions, and silicone solutions used in consumer goods and automotive applications. These businesses serve the needs of market segments as diverse as: automotive; electronics and entertainment; food and pharmaceuticals; and, personal and home care products. The Consumer Solutions segment also includes a portion of the Company's share of the results of Dow Corning, a joint venture of the Company, through May 31, 2016, and the results of the HSC Group.
Dow Corning Ownership Restructure:
As of June 1, 2016, Dow Corning, previously a 50:50 joint venture between Dow and Corning, became a wholly owned subsidiary of Dow as a result of an ownership restructure. Dow and Corning continue to maintain their historical proportional equity interest in the HSC Group. Beginning in June 2016, the results of Dow Corning, excluding the HSC Group, are fully consolidated into the Company's consolidated statements of income and aligned with the Consumer Solutions and Infrastructure Solutions operating segments. The results of the HSC Group will continue to be reported as "Equity in earnings of nonconsolidated affiliates" in the consolidated statements of income and aligned with the Consumer Solutions and Infrastructure Solutions operating segments. See Note 4 for additional information on this transaction.
Infrastructure Solutions
The Infrastructure Solutions segment is comprised of an industry-leading portfolio of businesses utilizing advanced technology to deliver products such as architectural and industrial coatings, construction material ingredients, building insulation and materials, adhesives, microbial protection for the oil and gas industry, telecommunications, light and water technologies. Infrastructure Solutions consists of five global businesses: Dow Building & Construction, Dow Coating Materials, Energy & Water Solutions, Performance Monomers and Infrastructure Solutions - Silicones. The Infrastructure Solutions segment also includes a portion of the Company's share of the results of Dow Corning, a joint venture of the Company, through May 31, 2016, and the results of the HSC Group.
Dow Corning Ownership Restructure:
See discussion above under Consumer Solutions for additional information.
Performance Materials & Chemicals
The Performance Materials & Chemicals segment is comprised of three technology-driven, customer-centric global businesses that are advantaged through integration and driven by innovative technology and solutions: Chlor-Alkali and Vinyl, Industrial Solutions and Polyurethanes. Products produced by this segment are back-integrated into feedstocks, supporting a low-cost manufacturing base and consistent, reliable supply. The Performance Materials & Chemicals segment is positioned for growth through diverse markets and product offerings. The Performance Materials & Chemicals
148
segment also includes a portion of the results of EQUATE, TKOC, Map Ta Phut Olefins Company Limited and Sadara, all joint ventures of the Company.
Divestitures:
On January 30, 2015, the Company sold its global Sodium Borohydride business to Vertellus Specialty Materials LLC. On February 2, 2015, the Company sold ANGUS Chemical Company to Golden Gate Capital. On October 5, 2015, the Company completed the split-off of its U.S. Gulf Coast Chlor-Alkali and Vinyl, Global Chlorinated Organics and Global Epoxy businesses to Olin in a tax-efficient Reverse Morris Trust transaction. These businesses were reported in the Performance Materials & Chemicals segment through the date of divestiture.
On December 23, 2015, the Company sold its 50 percent ownership interest in MEGlobal to EQUATE. MEGlobal was aligned to Performance Materials & Chemicals through the date of divestiture. Dow retained a 42.5 percent ownership stake in MEGlobal through its ownership in EQUATE. See Notes 5, 6 and 9 for additional information on these transactions.
Performance Plastics
The Performance Plastics segment is the world’s leading plastics franchise, and is a market-oriented portfolio composed of five global businesses: Dow Elastomers, Dow Electrical and Telecommunications, Dow Packaging and Specialty Plastics, Energy and Hydrocarbons. The segment is advantaged through its low cost position into key feedstocks and broad geographic reach and benefits from Dow’s R&D expertise to deliver leading-edge technology that provides a competitive benefit to customers in key strategic markets. The Performance Plastics segment also includes the results of TKSC and The SCG-Dow Group as well as a portion of the results of EQUATE, TKOC, Map Ta Phut Olefins Limited and Sadara, all joint ventures of the Company.
Acquisition:
On May 5, 2015, Univation Technologies, LLC, previously a 50:50 joint venture between Dow and ExxonMobil, became a wholly owned subsidiary of Dow. See Note 4 for additional information on this step acquisition.
Corporate
Corporate includes certain enterprise and governance activities (including insurance operations, geographic management, risk management such as foreign currency hedging activities, audit fees, donations, etc.); the results of Ventures (including business incubation platforms and non-business aligned joint ventures); environmental operations; gains and losses on the sales of financial assets; severance costs; non-business aligned litigation expenses (including asbestos-related defense costs and reserve adjustments); and, foreign exchange results.
Product transfers to Agricultural Sciences from other operating segments are generally valued at market-based prices. Other transfers of products between operating segments are generally valued at cost.
The Company operates 189 manufacturing sites in 34 countries. The United States is home to 59 of these sites, representing 63 percent of the Company’s long-lived assets. Sales are attributed to geographic areas based on customer location; long-lived assets are attributed to geographic areas based on asset location.
Geographic Area Information | United States | Europe, Middle East, Africa and India | Rest of World | Total | ||||||||||||
In millions | ||||||||||||||||
2016 | ||||||||||||||||
Sales to external customers | $ | 16,637 | $ | 14,667 | $ | 16,854 | $ | 48,158 | ||||||||
Long-lived assets | $ | 14,812 | $ | 2,751 | $ | 5,923 | $ | 23,486 | ||||||||
2015 | ||||||||||||||||
Sales to external customers | $ | 16,821 | $ | 15,291 | $ | 16,666 | $ | 48,778 | ||||||||
Long-lived assets | $ | 11,062 | $ | 2,172 | $ | 4,620 | $ | 17,854 | ||||||||
2014 | ||||||||||||||||
Sales to external customers | $ | 19,449 | $ | 19,671 | $ | 19,047 | $ | 58,167 | ||||||||
Long-lived assets | $ | 10,605 | $ | 2,628 | $ | 4,818 | $ | 18,051 | ||||||||
149
Operating Segment Information | Agri-cultural Sciences | Consumer Solutions | Infra-structure Solutions | Perf Materials & Chemicals | Perf Plastics | Corp | Total | |||||||||||||||||||||
In millions | ||||||||||||||||||||||||||||
2016 | ||||||||||||||||||||||||||||
Sales to external customers | $ | 6,174 | $ | 5,455 | $ | 8,621 | $ | 9,225 | $ | 18,404 | $ | 279 | $ | 48,158 | ||||||||||||||
Equity in earnings (losses) of nonconsolidated affiliates | 3 | 132 | 215 | (18 | ) | 137 | (27 | ) | 442 | |||||||||||||||||||
Restructuring charges (1) | 5 | 29 | 94 | — | 10 | 314 | 452 | |||||||||||||||||||||
Asbestos-related charge (2) | — | — | — | — | — | 1,113 | 1,113 | |||||||||||||||||||||
EBITDA (3) | 806 | 2,828 | 2,318 | 134 | 4,503 | (2,563 | ) | 8,026 | ||||||||||||||||||||
Total assets (4) (5) | 7,015 | 13,946 | 17,644 | 9,747 | 17,832 | 13,327 | 79,511 | |||||||||||||||||||||
Investment in nonconsolidated affiliates (5) | 130 | 329 | 647 | 1,588 | 881 | 172 | 3,747 | |||||||||||||||||||||
Depreciation and amortization | 186 | 479 | 776 | 530 | 770 | 121 | 2,862 | |||||||||||||||||||||
Capital expenditures | 223 | 157 | 481 | 212 | 2,731 | — | 3,804 | |||||||||||||||||||||
2015 | ||||||||||||||||||||||||||||
Sales to external customers | $ | 6,381 | $ | 4,379 | $ | 7,394 | $ | 11,973 | $ | 18,357 | $ | 294 | $ | 48,778 | ||||||||||||||
Equity in earnings (losses) of nonconsolidated affiliates | (15 | ) | 91 | 203 | 225 | 220 | (50 | ) | 674 | |||||||||||||||||||
Restructuring charges (1) | 16 | 67 | 26 | — | 12 | 294 | 415 | |||||||||||||||||||||
EBITDA (3) | 1,432 | 1,048 | 1,021 | 5,479 | 5,399 | (1,053 | ) | 13,326 | ||||||||||||||||||||
Total assets (4) | 6,333 | 9,234 | 12,186 | 7,694 | 14,310 | 18,181 | 67,938 | |||||||||||||||||||||
Investment in nonconsolidated affiliates | 275 | 732 | 986 | 155 | 304 | 1,506 | 3,958 | |||||||||||||||||||||
Depreciation and amortization | 195 | 354 | 495 | 637 | 746 | 94 | 2,521 | |||||||||||||||||||||
Capital expenditures | 308 | 134 | 355 | 223 | 2,683 | — | 3,703 | |||||||||||||||||||||
2014 | ||||||||||||||||||||||||||||
Sales to external customers | $ | 7,290 | $ | 4,639 | $ | 8,429 | $ | 15,114 | $ | 22,386 | $ | 309 | $ | 58,167 | ||||||||||||||
Equity in earnings (losses) of nonconsolidated affiliates | 4 | 281 | (6 | ) | 322 | 257 | (23 | ) | 835 | |||||||||||||||||||
Goodwill and other intangible asset impairment losses (6) | — | 50 | — | — | — | — | 50 | |||||||||||||||||||||
Restructuring credits (1) | — | — | — | (3 | ) | — | — | (3 | ) | |||||||||||||||||||
Asbestos-related charge (2) | — | — | — | — | — | 78 | 78 | |||||||||||||||||||||
EBITDA (3) | 962 | 1,130 | 817 | 2,193 | 4,422 | (580 | ) | 8,944 | ||||||||||||||||||||
Total assets (4) | 7,292 | 9,629 | 12,245 | 12,166 | 13,459 | 13,848 | 68,639 | |||||||||||||||||||||
Investment in nonconsolidated affiliates | 83 | 691 | 922 | 698 | 705 | 1,102 | 4,201 | |||||||||||||||||||||
Depreciation and amortization | 208 | 396 | 510 | 780 | 759 | 94 | 2,747 | |||||||||||||||||||||
Capital expenditures | 383 | 114 | 269 | 315 | 2,490 | 1 | 3,572 | |||||||||||||||||||||
(1) | See Note 3 for information regarding the Company's restructuring programs. |
(2) | See Note 15 for information regarding the asbestos-related charge. |
(3) | A reconciliation of “Income Before Income Taxes” to EBITDA is provided below. |
(4) | Presented in accordance with newly implemented ASU 2015-17 and ASU 2015-03. See Notes 1 and 2 for additional information. |
(5) | Equity contributions to Sadara, which prior to 2016 were reflected in the Corporate segment, were reallocated to Performance Materials & Chemicals and Performance Plastics in 2016. |
(6) | See Note 12 for information regarding intangible asset impairment losses. |
Reconciliation of “Income Before Income Taxes” to EBITDA In millions | 2016 | 2015 | 2014 | |||||||||
Income Before Income Taxes | $ | 4,413 | $ | 9,930 | $ | 5,265 | ||||||
+ Interest expense and amortization of debt discount | 858 | 946 | 983 | |||||||||
- Interest income | 107 | 71 | 51 | |||||||||
+ Depreciation and amortization | 2,862 | 2,521 | 2,747 | |||||||||
EBITDA | $ | 8,026 | $ | 13,326 | $ | 8,944 | ||||||
150
NOTE 27 – PLANNED MERGER WITH DUPONT
On December 11, 2015, Dow and E.I. du Pont de Nemours and Company ("DuPont") entered into an Agreement and Plan of Merger ("Merger Agreement"), to effect an all-stock, merger of equals strategic combination ("Merger Transaction") resulting in a newly formed corporation named DowDuPont Inc. ("DowDuPont"). Pursuant to the terms of the Merger Agreement, Dow and DuPont will each merge with wholly owned subsidiaries of DowDuPont (the "Mergers") and, as a result of the Mergers, will become subsidiaries of DowDuPont. Following the consummation of the Mergers, Dow and DuPont intend to pursue, subject to the receipt of regulatory approvals and approval by the board of directors of DowDuPont, the separation of the combined company’s agriculture business, specialty products business and material science business through one or more tax-efficient transactions. Additional information about the Merger Agreement is included in the Company's Current Report on Form 8-K filed with the U.S. Securities and Exchange Commission ("SEC") on December 11, 2015.
Subject to the terms and conditions set forth in the Merger Agreement, at the effective time of the Mergers ("Effective Time"), each share of common stock, par value $2.50 per share, of Dow (the "Dow Common Stock") issued and outstanding immediately prior to the Effective Time (excluding any shares of Dow Common Stock that are held in treasury) will be converted into the right to receive one share of common stock, par value $0.01 per share, of DowDuPont (the "DowDuPont Common Stock"). On December 30, 2016, 4 million issued and outstanding shares of Dow's Cumulative Convertible Perpetual Preferred Stock, Series A ("Dow Preferred Stock"), par value $1.00 per share, were converted into 96.8 million shares of Dow Common Stock. As a result of this conversion, no shares of Dow Preferred Stock remain issued or outstanding and all rights of the holders of the Dow Preferred Stock have terminated. See Note 22 for additional information.
Subject to the terms and conditions set forth in the Merger Agreement, at the Effective Time, each share of common stock, par value $0.30 per share, of DuPont (the "DuPont Common Stock") issued and outstanding immediately prior to the Effective Time (excluding any shares of DuPont Common Stock that are held in treasury) will be converted into the right to receive 1.2820 shares of DowDuPont Common Stock, and each share of DuPont Preferred Stock—$4.50 Series and DuPont Preferred Stock—$3.50 Series, in each case issued and outstanding immediately prior to the Effective Time shall remain issued and outstanding and be unaffected by the Mergers. The aforementioned 1.2820 exchange ratio set forth in the Merger Agreement will result in Dow common stockholders and DuPont common stockholders each owning approximately 52 percent and 48 percent, respectively, of the outstanding shares of DowDuPont Common Stock immediately following the Effective Time.
The Merger Agreement provides that, at the Effective Time, the Dow stock options and other equity awards and the DuPont stock options and other equity awards generally will automatically convert into stock options and equity awards with respect to DowDuPont Common Stock, on the same terms and conditions under the applicable plans and award agreements immediately prior to the Effective Time and, in the case of DuPont stock options and equity awards, after giving effect to the exchange ratio and appropriate adjustments to reflect the consummation of the Mergers.
After the Effective Time, DowDuPont Common Stock will be listed on the New York Stock Exchange.
On June 9, 2016, DowDuPont's registration statement filed with the SEC on Form S-4 (File No. 333-209869), as amended, was declared effective. The registration statement was filed in connection with the proposed Mergers and includes a joint proxy statement of Dow and DuPont and a prospectus of DowDuPont. The companies also scheduled special meetings of their respective stockholders to seek adoption of the Merger Agreement and approval of related matters from such stockholders. Each company's common stockholders of record as of the close of business on June 2, 2016, were entitled to vote at the respective meeting. Dow's special meeting of stockholders was held on July 20, 2016, which resulted in a vote for adoption of the Merger Agreement and approval of related matters.
On February 2, 2017, the Company announced it reached an agreement to sell its global ethylene acrylic acid ("EAA") copolymers and ionomers business to SK Global Chemical Co., Ltd. as part of the ongoing regulatory approval process for the Merger Transaction. The divestiture will be conditioned on Dow and DuPont closing the Merger Transaction, in addition to other closing conditions, including regulatory filings, local employment law and governance obligations. On February 7, 2017, Dow and DuPont submitted a proposed remedy package to the European Commission (“EC”) which includes the proposed divestment of Dow’s EAA business and a portion of DuPont’s crop protection business and associated research and development. As a result, the EC’s deadline to review the proposed remedy actions has been extended to April 4, 2017.
Dow and DuPont remain focused on closing the transaction and continue to work constructively with regulatory agencies in all relevant jurisdictions, including the United States, European Union, China, Brazil and Canada. Given current regulatory agency status, closing is expected to occur in the first half of 2017, subject to satisfaction of customary closing conditions, including receipt of all regulatory approvals.
151
The Dow Chemical Company and Subsidiaries |
Selected Quarterly Financial Data |
In millions, except per share amounts (Unaudited) | ||||||||||||||||||||
2016 | 1st | 2nd | 3rd | 4th | Year | |||||||||||||||
Net sales | $ | 10,703 | $ | 11,952 | $ | 12,483 | $ | 13,020 | $ | 48,158 | ||||||||||
Cost of sales | 7,951 | 9,275 | 9,841 | 10,574 | 37,641 | |||||||||||||||
Gross margin | 2,752 | 2,677 | 2,642 | 2,446 | 10,517 | |||||||||||||||
Restructuring charges (credits) | (2 | ) | 454 | — | — | 452 | ||||||||||||||
Asbestos-related charge | — | — | — | 1,113 | 1,113 | |||||||||||||||
Net income | 275 | 3,227 | 818 | 84 | 4,404 | |||||||||||||||
Net income (loss) available for common stockholders | 169 | 3,123 | 719 | (33 | ) | 3,978 | ||||||||||||||
Earnings (Loss) per common share - basic (1) (2) | 0.15 | 2.79 | 0.64 | (0.03 | ) | 3.57 | ||||||||||||||
Earnings (Loss) per common share - diluted (1) (3) (4) | 0.15 | 2.61 | 0.63 | (0.03 | ) | 3.52 | ||||||||||||||
Dividends declared per share of common stock | 0.46 | 0.46 | 0.46 | 0.46 | 1.84 | |||||||||||||||
Market price range of common stock: (5) | ||||||||||||||||||||
High | 52.23 | 53.98 | 54.59 | 59.33 | 59.33 | |||||||||||||||
Low | 40.26 | 47.75 | 47.51 | 51.60 | 40.26 | |||||||||||||||
In millions, except per share amounts (Unaudited) | ||||||||||||||||||||
2015 | 1st | 2nd | 3rd | 4th | Year | |||||||||||||||
Net sales | $ | 12,370 | $ | 12,910 | $ | 12,036 | $ | 11,462 | $ | 48,778 | ||||||||||
Cost of sales | 9,535 | 10,146 | 9,349 | 8,806 | 37,836 | |||||||||||||||
Gross margin | 2,835 | 2,764 | 2,687 | 2,656 | 10,942 | |||||||||||||||
Restructuring charges | — | 375 | — | 40 | 415 | |||||||||||||||
Net income | 1,519 | 1,197 | 1,436 | 3,631 | 7,783 | |||||||||||||||
Net income available for common stockholders | 1,393 | 1,135 | 1,290 | 3,527 | 7,345 | |||||||||||||||
Earnings per common share - basic (1) | 1.22 | 0.99 | 1.12 | 3.17 | 6.45 | |||||||||||||||
Earnings per common share - diluted (1) (4) | 1.18 | 0.97 | 1.09 | 2.94 | 6.15 | |||||||||||||||
Dividends declared per share of common stock | 0.42 | 0.42 | 0.42 | 0.46 | 1.72 | |||||||||||||||
Market price range of common stock: (5) | ||||||||||||||||||||
High | 50.22 | 53.77 | 53.20 | 57.10 | 57.10 | |||||||||||||||
Low | 41.95 | 47.21 | 35.11 | 42.15 | 35.11 | |||||||||||||||
See Notes to the Consolidated Financial Statements.
(1) | Due to quarterly changes in the share count and the allocation of income to participating securities, the sum of the four quarters does not equal the earnings per share amount calculated for the year. |
(2) | On December 30, 2016, the Company converted 4 million shares of Cumulative Convertible Perpetual Preferred Stock, Series A ("Preferred Stock") into 96.8 million shares of the Company's common stock. As a result, the basic share count reflects a two-day averaging effect for the three- and twelve-month periods ended December 31, 2016. |
(3) | "Earnings (Loss) per common share - diluted" for the three-month period ended December 31, 2016, was calculated using "Weighted average common shares outstanding - basic" due to a net loss reported in the period. |
(4) | For the quarters ended June 30, 2016, March 31, 2015, June 30, 2015, September 30, 2015, and December 31, 2015, and the year ended December 31, 2015, an assumed conversion of Preferred Stock into shares of the Company's common stock was included in the calculation of earnings per common share - diluted. The assumed conversion of the Preferred Stock was considered antidilutive for all other periods. See Note 14 for additional information. |
(5) | Composite price as reported by the New York Stock Exchange. |
152
The Dow Chemical Company and Subsidiaries |
PART II, Item 9. Changes in and Disagreements With Accountants on Accounting and Financial Disclosure. |
CHANGES IN AND DISAGREEMENTS WITH ACCOUNTANTS ON ACCOUNTING AND FINANCIAL DISCLOSURE
Not applicable.
153
The Dow Chemical Company and Subsidiaries |
PART II, Item 9A. Controls and Procedures. |
CONTROLS AND PROCEDURES
Evaluation of Disclosure Controls and Procedures
As of the end of the period covered by this Annual Report on Form 10-K, the Company carried out an evaluation, under the supervision and with the participation of the Company’s Disclosure Committee and the Company’s management, including the Chief Executive Officer and the Chief Financial Officer, of the effectiveness of the design and operation of the Company’s disclosure controls and procedures pursuant to paragraph (b) of Exchange Act Rules 13a-15 and 15d-15. Based upon that evaluation, the Chief Executive Officer and the Chief Financial Officer concluded that the Company’s disclosure controls and procedures were effective.
Changes in Internal Control Over Financial Reporting
There were no changes in the Company's internal control over financial reporting identified in connection with the evaluation required by paragraph (d) of Exhange Act Rules 13a-15 and 15d-15 that was conducted during the last fiscal quarter that have materially affected, or are reasonably likely to materially affect, the Company's internal control over financial reporting.
Management’s Report on Internal Control Over Financial Reporting
Management is responsible for establishing and maintaining adequate internal control over financial reporting. The Company’s internal control framework and processes are designed to provide reasonable assurance to management and the Board of Directors regarding the reliability of financial reporting and the preparation of the Company’s consolidated financial statements in accordance with accounting principles generally accepted in the United States of America.
The Company’s internal control over financial reporting includes those policies and procedures that:
• | pertain to the maintenance of records that, in reasonable detail, accurately and fairly reflect the transactions and dispositions of the assets of the Company; |
• | provide reasonable assurance that transactions are recorded as necessary to permit preparation of financial statements in accordance with generally accepted accounting principles, and that receipts and expenditures of the Company are being made only in accordance with authorizations of management and Directors of the Company; and |
• | provide reasonable assurance regarding prevention or timely detection of unauthorized acquisition, use or disposition of the Company’s assets that could have a material effect on the consolidated financial statements. |
Because of its inherent limitations, any system of internal control over financial reporting can provide only reasonable assurance and may not prevent or detect misstatements.
Management assessed the effectiveness of the Company’s internal control over financial reporting and concluded that, as of December 31, 2016, such internal control is effective. In making this assessment, management used the criteria set forth by the Committee of Sponsoring Organizations of the Treadway Commission (“COSO”) in Internal Control—Integrated Framework (2013).
The Company’s independent auditors, Deloitte & Touche LLP, with direct access to the Company’s Board of Directors through its Audit Committee, have audited the consolidated financial statements prepared by the Company. Their report on the consolidated financial statements is included in Part II, Item 8. Financial Statements and Supplementary Data. Deloitte & Touche LLP’s report on the Company’s internal control over financial reporting is referenced therein and included herein.
February 9, 2017
/s/ ANDREW N. LIVERIS | /s/ HOWARD I. UNGERLEIDER | |||
Andrew N. Liveris | Howard I. Ungerleider | |||
Chief Executive Officer and | Vice Chairman and | |||
Chairman of the Board | Chief Financial Officer | |||
/s/ RONALD C. EDMONDS | ||||
Ronald C. Edmonds | ||||
Controller and Vice President of Controllers and Tax | ||||
154
The Dow Chemical Company and Subsidiaries |
PART II |
Report of Independent Registered Public Accounting Firm
To the Board of Directors and Stockholders of
The Dow Chemical Company:
We have audited the internal control over financial reporting of The Dow Chemical Company and subsidiaries (the "Company") as of December 31, 2016, based on criteria established in Internal Control - Integrated Framework (2013) issued by the Committee of Sponsoring Organizations of the Treadway Commission. The Company's management is responsible for maintaining effective internal control over financial reporting and for its assessment of the effectiveness of internal control over financial reporting, included in the accompanying Management's Report on Internal Control over Financial Reporting. Our responsibility is to express an opinion on the Company's internal control over financial reporting based on our audit.
We conducted our audit in accordance with the standards of the Public Company Accounting Oversight Board (United States). Those standards require that we plan and perform the audit to obtain reasonable assurance about whether effective internal control over financial reporting was maintained in all material respects. Our audit included obtaining an understanding of internal control over financial reporting, assessing the risk that a material weakness exists, testing and evaluating the design and operating effectiveness of internal control based on the assessed risk, and performing such other procedures as we considered necessary in the circumstances. We believe that our audit provides a reasonable basis for our opinion.
A company's internal control over financial reporting is a process designed by, or under the supervision of, the company's principal executive and principal financial officers, or persons performing similar functions, and effected by the company's board of directors, management, and other personnel to provide reasonable assurance regarding the reliability of financial reporting and the preparation of financial statements for external purposes in accordance with generally accepted accounting principles. A company's internal control over financial reporting includes those policies and procedures that (1) pertain to the maintenance of records that, in reasonable detail, accurately and fairly reflect the transactions and dispositions of the assets of the company; (2) provide reasonable assurance that transactions are recorded as necessary to permit preparation of financial statements in accordance with generally accepted accounting principles, and that receipts and expenditures of the company are being made only in accordance with authorizations of management and directors of the company; and (3) provide reasonable assurance regarding prevention or timely detection of unauthorized acquisition, use, or disposition of the company's assets that could have a material effect on the financial statements.
Because of the inherent limitations of internal control over financial reporting, including the possibility of collusion or improper management override of controls, material misstatements due to error or fraud may not be prevented or detected on a timely basis. Also, projections of any evaluation of the effectiveness of internal control over financial reporting to future periods are subject to the risk that the controls may become inadequate because of changes in conditions, or that the degree of compliance with the policies or procedures may deteriorate.
In our opinion, the Company maintained, in all material respects, effective internal control over financial reporting as of December 31, 2016, based on the criteria established in Internal Control - Integrated Framework (2013) issued by the Committee of Sponsoring Organizations of the Treadway Commission.
We have also audited, in accordance with the standards of the Public Company Accounting Oversight Board (United States), the consolidated financial statements of the Company and the financial statement schedule listed in the Index at Item 15(a)2 as of and for the year ended December 31, 2016 and our report dated February 9, 2017 expressed an unqualified opinion on those financial statements and financial statement schedule (which also includes an explanatory paragraph regarding a change in accounting policy from expensing asbestos-related defense and processing costs as incurred to the accrual of asbestos-related defense and processing costs when probable of occurring and estimable).
/S/ DELOITTE & TOUCHE LLP |
Deloitte & Touche LLP |
Midland, Michigan |
February 9, 2017 |
155
The Dow Chemical Company and Subsidiaries |
PART II, Item 9B. Other Information. |
OTHER INFORMATION
None.
156
The Dow Chemical Company and Subsidiaries |
PART III |
ITEM 10. DIRECTORS, EXECUTIVE OFFICERS AND CORPORATE GOVERNANCE
Information relating to Directors, certain executive officers and certain corporate governance matters (including identification of Audit Committee members and financial expert(s)) is contained in the definitive Proxy Statement for the 2017 Annual Meeting of Stockholders of The Dow Chemical Company and is incorporated herein by reference. See also the information regarding executive officers of the registrant set forth in Part I, Item 1. Business under the caption “Executive Officers of the Registrant” in reliance on General Instruction G to Form 10-K.
On July 10, 2003, the Board of Directors of the Company adopted a code of ethics that applies to its principal executive officer, principal financial officer and principal accounting officer, and is incorporated herein by reference to Exhibit 14 to the Company’s Annual Report on Form 10-K for the year ended December 31, 2003.
ITEM 11. EXECUTIVE COMPENSATION
Information relating to executive compensation and the Company’s equity compensation plans is contained in the definitive Proxy Statement for the 2017 Annual Meeting of Stockholders of The Dow Chemical Company and is incorporated herein by reference.
ITEM 12. SECURITY OWNERSHIP OF CERTAIN BENEFICIAL OWNERS AND MANAGEMENT AND RELATED STOCKHOLDER MATTERS
Information with respect to beneficial ownership of Dow common stock by each Director and all Directors and executive officers of the Company as a group is contained in the definitive Proxy Statement for the 2017 Annual Meeting of Stockholders of The Dow Chemical Company and is incorporated herein by reference.
Information relating to any person who beneficially owns in excess of 5 percent of the total outstanding shares of Dow common stock is contained in the definitive Proxy Statement for the 2017 Annual Meeting of Stockholders of The Dow Chemical Company and is incorporated herein by reference.
Information with respect to compensation plans under which equity securities are authorized for issuance is contained in the definitive Proxy Statement for the 2017 Annual Meeting of Stockholders of The Dow Chemical Company and is incorporated herein by reference.
ITEM 13. CERTAIN RELATIONSHIPS AND RELATED TRANSACTIONS, AND DIRECTOR INDEPENDENCE
Reportable relationships and related transactions, if any, as well as information relating to director independence are contained in the definitive Proxy Statement for the 2017 Annual Meeting of Stockholders of The Dow Chemical Company and are incorporated herein by reference.
ITEM 14. PRINCIPAL ACCOUNTING FEES AND SERVICES
Information with respect to fees and services related to the Company’s independent auditors, Deloitte & Touche LLP, and the disclosure of the Audit Committee’s pre-approval policies and procedures are contained in the definitive Proxy Statement for the 2017 Annual Meeting of Stockholders of The Dow Chemical Company and are incorporated herein by reference.
157
The Dow Chemical Company and Subsidiaries |
PART IV, Item 15. Exhibits, Financial Statement Schedules. |
EXHIBITS, FINANCIAL STATEMENT SCHEDULES
(a) | The following documents are filed as part of this report: |
(1) | The Company’s 2016 Consolidated Financial Statements and the Report of Independent Registered Public Accounting Firm are included in Part II, Item 8. Financial Statements and Supplementary Data. |
(2) | Financial Statement Schedules – The following Financial Statement Schedule should be read in conjunction with the Consolidated Financial Statements and Report of Independent Registered Public Accounting Firm included in Part II, Item 8. Financial Statements and Supplementary Data: |
Schedule II | Valuation and Qualifying Accounts | |
Schedules other than the one listed above are omitted due to the absence of conditions under which they are required or because the information called for is included in the Consolidated Financial Statements or the Notes to the Consolidated Financial Statements.
(3) | Exhibits – See the Exhibit Index for the exhibits filed with this Annual Report on Form 10-K or incorporated by reference. The following exhibits are filed with this Annual Report on Form 10-K: |
Exhibit No. | Description of Exhibit | |
10(a)(iii) | Amendment to The Dow Chemical Company Executives' Supplemental Retirement Plan. | |
10(dd)(iii) | Amendment to The Dow Chemical Company Elective Deferral Plan (Post 2004). | |
12.1 | Computation of Ratio of Earnings to Fixed Charges and Combined Fixed Charges and Preferred Stock Dividend Requirements. | |
21 | Subsidiaries of The Dow Chemical Company. | |
23(a) | Consent of Independent Registered Public Accounting Firm. | |
23(b) | Ankura Consulting Group, LLC's Consent. | |
31(a) | Certification Pursuant to Section 302 of the Sarbanes-Oxley Act of 2002. | |
31(b) | Certification Pursuant to Section 302 of the Sarbanes-Oxley Act of 2002. | |
32(a) | Certification Pursuant to Section 906 of the Sarbanes-Oxley Act of 2002. | |
32(b) | Certification Pursuant to Section 906 of the Sarbanes-Oxley Act of 2002. | |
101.INS | XBRL Instance Document. | |
101.SCH | XBRL Taxonomy Extension Schema Document. | |
101.CAL | XBRL Taxonomy Extension Calculation Linkbase Document. | |
101.DEF | XBRL Taxonomy Extension Definition Linkbase Document. | |
101.LAB | XBRL Taxonomy Extension Label Linkbase Document. | |
101.PRE | XBRL Taxonomy Extension Presentation Linkbase Document. | |
A copy of any exhibit can be obtained via the Internet through the Investor Relations section of the Company's website (www.dow.com/investor-relations), or the Company will provide a copy of any exhibit upon receipt of a written request for the particular exhibit or exhibits desired. All requests should be addressed to the Controller and Vice President of Controllers and Tax of the Company at the address of the Company’s principal executive offices. The Company's website and its content are not deemed incorporated by reference into this report.
158
The Dow Chemical Company and Subsidiaries | Schedule II | |
Valuation and Qualifying Accounts | ||
In millions | For the Years Ended December 31 | |
COLUMN A | COLUMN B | COLUMN C - Additions | COLUMN D | COLUMN E | ||||||||||||||||
Description | Balance at Beginning of Year | Charged to Costs and Expenses | Charged to Other Accounts | Deductions from Reserves | Balance at End of Year | |||||||||||||||
2016 | ||||||||||||||||||||
RESERVES DEDUCTED FROM ASSETS TO WHICH THEY APPLY: | ||||||||||||||||||||
For doubtful receivables | $ | 94 | $ | 31 | $ | — | $ | 15 | (1) | $ | 110 | |||||||||
Other investments and noncurrent receivables | $ | 494 | $ | 153 | (2) | $ | — | $ | 289 | (3) | $ | 358 | ||||||||
Deferred tax assets | $ | 1,000 | $ | 155 | $ | — | $ | 94 | $ | 1,061 | ||||||||||
2015 | ||||||||||||||||||||
RESERVES DEDUCTED FROM ASSETS TO WHICH THEY APPLY: | ||||||||||||||||||||
For doubtful receivables | $ | 110 | $ | 24 | $ | 2 | (4) | $ | 42 | (1) | $ | 94 | ||||||||
Other investments and noncurrent receivables | $ | 477 | $ | 108 | $ | — | $ | 91 | $ | 494 | ||||||||||
Deferred tax assets | $ | 1,106 | $ | 67 | $ | — | $ | 173 | $ | 1,000 | ||||||||||
2014 | ||||||||||||||||||||
RESERVES DEDUCTED FROM ASSETS TO WHICH THEY APPLY: | ||||||||||||||||||||
For doubtful receivables | $ | 148 | $ | 53 | $ | 8 | (4) | $ | 99 | (1) | $ | 110 | ||||||||
Other investments and noncurrent receivables | $ | 454 | $ | 62 | $ | — | $ | 39 | $ | 477 | ||||||||||
Deferred tax assets | $ | 1,112 | $ | 126 | $ | — | $ | 132 | $ | 1,106 | ||||||||||
(1) | Deductions represent notes and accounts receivable written off, credits to profit and loss and other miscellaneous items. |
(2) | Additions to reserves for "Other investments and noncurrent receivables" charged to costs and expenses include $143 million related to the Company's investment in AgroFresh Solutions, Inc. See Note 5 to the Consolidated Financial Statements for further information. |
(3) | Deductions from reserves for "Other investments and noncurrent receivables" include $237 million related to the DCC Transaction. See Note 4 to the Consolidated Financial Statements for further information. |
(4) | Additions to reserves for doubtful receivables charged to other accounts were classified as "Accounts and notes receivable - Other" in the consolidated balance sheets. These reserves relate to the Company's sale of trade accounts receivable. Anticipated credit losses in the portfolio of receivables sold are used to fair value the Company's interests held in trade accounts receivable conduits. See Notes 12 and 16 to the Consolidated Financial Statements for further information. |
159
The Dow Chemical Company and Subsidiaries | ||||
Signatures | ||||
Pursuant to the requirements of Section 13 or 15(d) of the Securities Exchange Act of 1934, the registrant has duly caused this report to be signed on its behalf by the undersigned, thereunto duly authorized.
THE DOW CHEMICAL COMPANY | ||
By | /s/ R. C. EDMONDS | |
R. C. Edmonds, Controller and Vice President of Controllers and Tax | ||
Date | February 9, 2017 | |
Pursuant to the requirements of the Securities Exchange Act of 1934, this report has been signed below by the following persons on behalf of the registrant and in the capacities and on the dates indicated.
By | /s/ A. BANGA | By | /s/ R. J. MILCHOVICH | |||
A. Banga, Director | R. J. Milchovich, Director | |||||
Date | February 9, 2017 | Date | February 9, 2017 | |||
By | /s/ J. K. BARTON | By | /s/ R. S. MILLER | |||
J. K. Barton, Director | R. S. Miller, Director | |||||
Date | February 9, 2017 | Date | February 9, 2017 | |||
By | /s/ J. A. BELL | By | /s/ P. POLMAN | |||
J. A. Bell, Director | P. Polman, Director | |||||
Date | February 9, 2017 | Date | February 9, 2017 | |||
By | /s/ R. K. DAVIS | By | /s/ D. H. REILLEY | |||
R. K. Davis, Director | D. H. Reilley, Director | |||||
Date | February 9, 2017 | Date | February 9, 2017 | |||
By | /s/ R. C. EDMONDS | By | /s/ J. M. RINGLER | |||
R. C. Edmonds, Controller and Vice President of Controllers and Tax | J. M. Ringler, Director | |||||
Date | February 9, 2017 | Date | February 9, 2017 | |||
By | /s/ J. M. FETTIG | By | /s/ R. G. SHAW | |||
J. M. Fettig, Lead Director | R. G. Shaw, Director | |||||
Date | February 9, 2017 | Date | February 9, 2017 | |||
By | /s/ A. N. LIVERIS | By | /s/ H. I. UNGERLEIDER | |||
A. N. Liveris, Director, Chief Executive Officer and Chairman of the Board | H. I. Ungerleider, Vice Chairman and Chief Financial Officer | |||||
Date | February 9, 2017 | Date | February 9, 2017 | |||
By | /s/ M. LOUGHRIDGE | |||||
M. Loughridge, Director | ||||||
Date | February 9, 2017 | |||||
160
The Dow Chemical Company and Subsidiaries |
Trademark Listing |
The following trademarks or service marks of The Dow Chemical Company and certain affiliated companies of Dow appear in this report: ACOUSTICRYL, ACRYSOL, ADSORBSIA, AFFINITY, AGILITY, AMBERJET, AMBERLYST, AQUASET, AQUCAR, AVANSE, BETAFORCE, BIOBAN, CANVERA, DOW, DOW CORNING, DOWEX, EDI, ELITE, EVOQUE, FILMTEC, FORMASHIELD, FROTH-PAK, GREAT STUFF, LIQUIDARMOR, MAINCOTE, NORDEL, OPTIPORE, PARALOID, PRIMACOR, PRIMAL, RETAIN, RHOPLEX, SAFECHEM, SAFE-TAINER, SILVADUR, STYROFOAM, TAMOL, TEQUATIC, THERMAX, TPSiV, VORAFORCE, VORAFUSE, WALOCEL, WEATHERMATE, XENERGY
The following trademarks or service marks of Dow AgroSciences LLC and certain affiliated companies of Dow AgroSciences LLC appear in this report: ARYLEX, BROADWAY, BRODBECK, CLINCHER, DAIRYLAND SEED, DITHANE, DURANGO, ENLIST, ENLIST DUO, ENLIST E3, EXZACT, FENCER, GARLON, INATREQ, INSTINCT, ISOCLAST, LONTREL, LORSBAN, MILESTONE, MYCOGEN, N-SERVE, NEXERA, PANZER, PARADIGM, PFISTER, PHYTOGEN, PRAIRIE BRAND, PRIMUS, PROPOUND, RADIANT, REFUGE ADVANCED, RESICORE, RINSKOR, SENTRICON, SPIDER, STARANE, SURESTART, TELONE, TORDON, TRACER
ENLIST E3™ soybeans are developed by Dow AgroSciences and MS Technologies
The following trademark of Agromen Sementes Agricolas Ltda appears in this report: AGROMEN
The following registered service mark of American Chemistry Council appears in this report: Responsible Care
The following registered trademark of Monsanto Technology LLC appears in this report: SmartStax, POWERCORE. SmartStax and POWERCORE multi-event technology developed by Dow AgroSciences LLC and Monsanto
® ™Trademark of The Dow Chemical Company (“Dow”) or an affiliated company of Dow
161
The Dow Chemical Company and Subsidiaries | ||||
Exhibit Index | ||||
EXHIBIT NO. | DESCRIPTION | |||
2(b) | Agreement and Plan of Merger, dated as of July 10, 2008, among The Dow Chemical Company, Ramses Acquisition Corp. and Rohm and Haas Company, incorporated by reference to Exhibit 2.1 to The Dow Chemical Company Current Report on Form 8-K filed on July 10, 2008. |
2(e) | Shareholders' Agreement, dated as of October 8, 2011, between Dow Saudi Arabia Holding B.V. and Performance Chemicals Holding Company, incorporated by reference to Exhibit 99.1 to The Dow Chemical Company Current Report on Form 8-K/A filed on June 27, 2012. |
2(e)(i) | First Amendment, effective June 1, 2012, to the Shareholders' Agreement, dated as of October 8, 2011, between Performance Chemicals Holding Company, Dow Saudi Arabia Holding B.V., Saudi Arabian Oil Company, Dow Europe Holding B.V. and The Dow Chemical Company, incorporated by reference to Exhibit 99.1 to The Dow Chemical Company Current Report on Form 8-K filed on February 14, 2013. |
2(f) | Agreement and Plan of Merger, dated as of March 26, 2015, among The Dow Chemical Company, Blue Cube Spinco Inc., Olin Corporation and Blue Cube Acquisition Corp., incorporated by reference to Exhibit 2.1 to The Dow Chemical Company Current Report on Form 8-K filed on March 27, 2015. |
2(f)(i) | Separation Agreement, dated as of March 26, 2015, between The Dow Chemical Company and Blue Cube Spinco Inc., incorporated by reference to Exhibit 2.2 to The Dow Chemical Company Current Report on Form 8-K filed on March 27, 2015. |
2(g) | Transaction Agreement, dated as of December 10, 2015, among The Dow Chemical Company, Corning Incorporated, Dow Corning Corporation and HS Upstate Inc., incorporated by reference to Exhibit 2.1 to The Dow Chemical Company Current Report on Form 8-K filed on December 11, 2015. |
2(g)(i) | Tax Matters Agreement, dated as of December 10, 2015, among The Dow Chemical Company, Corning Incorporated, Dow Corning Corporation and HS Upstate Inc., incorporated by reference to Exhibit 2.2 to The Dow Chemical Company Current Report on Form 8-K filed on December 11, 2015. |
2(h) | Agreement and Plan of Merger, dated as of December 11, 2015, among The Dow Chemical Company, E. I. du Pont de Nemours and Company, Diamond Merger Sub, Inc., Orion Merger Sub, Inc. and Diamond-Orion HoldCo Inc., incorporated by reference to Exhibit 2.1 to The Dow Chemical Company Current Report on Form 8-K filed on December 11, 2015. |
3(i) | The Restated Certificate of Incorporation of The Dow Chemical Company as filed with the Secretary of State, State of Delaware on May 17, 2010, incorporated by reference to Exhibit 3(i) to The Dow Chemical Company Quarterly Report on Form 10-Q for the quarter ended September 30, 2010. |
3(i)(a) | Certificate of Designations for the Cumulative Convertible Perpetual Preferred Stock, Series A, as originally filed with the Secretary of State, State of Delaware on March 31, 2009, incorporated by reference to Exhibit 3.1 to The Dow Chemical Company Current Report on Form 8-K filed on April 1, 2009; and as re-filed with the Secretary of State, State of Delaware on May 17, 2010. |
3(ii) | The Bylaws of The Dow Chemical Company, as amended and re-adopted in full on December 15, 2016, effective December 15, 2016, incorporated by reference to Exhibit 3(ii) to The Dow Chemical Company Current Report on Form 8-K filed on December 16, 2016. |
162
The Dow Chemical Company and Subsidiaries | ||||
Exhibit Index | ||||
EXHIBIT NO. | DESCRIPTION | |||
4 | Indenture, dated as of April 1, 1992, between The Dow Chemical Company and the First National Bank of Chicago, as trustee (incorporated by reference to Exhibit 4.1 to The Dow Chemical Company's Registration Statement on Form S-3, File No. 333-88617 (the "S-3 Registration Statement")), as amended by the Supplemental Indenture, dated as of January 1, 1994, between The Dow Chemical Company and The First National Bank of Chicago, as trustee (incorporated by reference to Exhibit 4.2 to the S-3 Registration Statement), as amended by the Second Supplemental Indenture, dated as of October 1, 1999, between The Dow Chemical Company and Bank One Trust Company, N.A. (formerly The First National Bank of Chicago), as trustee (incorporated by reference to Exhibit 4.3 to the S-3 Registration Statement), as amended by the Third Supplemental Indenture, dated as of May 15, 2001, between The Dow Chemical Company and Bank One Trust Company, N.A. (formerly The First National Bank of Chicago), as trustee (incorporated by reference to Exhibit 4.4 to The Dow Chemical Company's Registration Statement on Form S-4, File No. 333-67368); and all other such indentures that define the rights of holders of long-term debt of The Dow Chemical Company and its consolidated subsidiaries as shall be requested to be furnished to the Securities and Exchange Commission pursuant to Item 601(b)(4)(iii)(A) of Regulation S-K. |
4(a) | Indenture, dated May 1, 2008, between The Dow Chemical Company and The Bank of New York Trust Company, N.A., as trustee, incorporated by reference to Exhibit 4.1 to Post-Effective Amendment No. 1 to The Dow Chemical Company's Registration Statement on Form S-3, File No. 333-140859. |
10(a) | The Dow Chemical Company Executives' Supplemental Retirement Plan, as amended, restated and effective as of April 14, 2010, incorporated by reference to Exhibit 10.1 to The Dow Chemical Company Current Report on Form 8-K filed on May 3, 2010. |
10(a)(i) | An Amendment to The Dow Chemical Company Executives' Supplemental Retirement Plan, effective as of April 14, 2010, incorporated by reference to Exhibit 10.4 to The Dow Chemical Company Current Report on Form 8-K filed on May 3, 2010. |
10(a)(ii) | An Amendment to The Dow Chemical Company Executives' Supplemental Retirement Plan, effective as of July 19, 2013, incorporated by reference to Exhibit 10(a)(ii) to The Dow Chemical Company Annual Report on Form 10-K for the year ended December 31, 2013. |
10(a)(iii) | An Amendment to The Dow Chemical Company Executives' Supplemental Retirement Plan, effective as of January 19, 2017, incorporated by reference to Exhibit 10(a)(iii) to The Dow Chemical Company Annual Report on Form 10-K for the year ended December 31, 2016. |
10(b) | Support Agreement, dated November 20, 2014, by and among The Dow Chemical Company and Third Point LLC, Third Point Partners Qualified L.P., Third Point Partners L.P., Third Point Offshore Master Fund L.P., Third Point Ultra Master Fund L.P. and Third Point Reinsurance Co., Ltd., incorporated by reference to Exhibit 10.1 to the Dow Chemical Company Current Report on Form 8-K filed on November 21, 2014. |
10(c) | The Dow Chemical Company Voluntary Deferred Compensation Plan for Outside Directors (for deferrals made through December 31, 2004), as amended effective as of July 1, 1994, incorporated by reference to Exhibit 10(f) to The Dow Chemical Company Annual Report on Form 10-K for the year ended December 31, 1994, as amended in the manner described in the definitive Proxy Statement for the Annual Meeting of Stockholders of The Dow Chemical Company held on May 14, 1998. |
10(e) | The Dow Chemical Company Dividend Unit Plan, incorporated by reference to Exhibit 10(e) to The Dow Chemical Company Quarterly Report on Form 10-Q for the quarter ended March 31, 2009. |
163
The Dow Chemical Company and Subsidiaries | ||||
Exhibit Index | ||||
EXHIBIT NO. | DESCRIPTION | |||
10(f) | The Dow Chemical Company 1988 Award and Option Plan, as amended and restated on December 10, 2008, effective as of January 1, 2009, incorporated by reference to Exhibit 10(f) to The Dow Chemical Company Annual Report on Form 10-K for the year ended December 31, 2008. |
10(g) | Employment Offer Letter for Joe Harlan, President, Performance Materials and Executive Vice President of The Dow Chemical Company, incorporated by reference to Exhibit 10.3 to The Dow Chemical Company Current Report on Form 8-K filed on February 14, 2012. |
10(h) | The Dow Chemical Company 1994 Executive Performance Plan, as amended and restated on December 10, 2008, effective as of January 1, 2009, incorporated by reference to Exhibit 10(h) to The Dow Chemical Company Annual Report on Form 10-K for the year ended December 31, 2008. |
10(l) | A written description of compensation for Directors of The Dow Chemical Company, incorporated by reference to the definitive Proxy Statement for the 2017 Annual Meeting of Stockholders of The Dow Chemical Company. |
10(m) | A written description of the manner in which compensation is set for the Executive Officers of The Dow Chemical Company, incorporated by reference to the definitive Proxy Statement for the 2017 Annual Meeting of Stockholders of The Dow Chemical Company. |
10(o) | The template used for The Dow Chemical Company Key Employee Insurance Program (“KEIP”), which provides benefits using insurance policies that replace benefits otherwise payable under The Dow Chemical Company Executives' Supplemental Retirement Plan and Company-Paid Life Insurance Plan, incorporated by reference to Exhibit 10(o) to The Dow Chemical Company Annual Report on Form 10-K for the year ended December 31, 2002. KEIP is a component of the annual pension benefits listed in and incorporated by reference to the definitive Proxy Statement for the 2017 Annual Meeting of Stockholders of The Dow Chemical Company. |
10(p) | The Dow Chemical Company Elective Deferral Plan (for deferrals made through December 31, 2004), as amended, restated and effective as of April 14, 2010, incorporated by reference to Exhibit 10.2 to The Dow Chemical Company Current Report on Form 8-K filed on May 3, 2010. |
10(p)(i) | An Amendment to The Dow Chemical Company Elective Deferral Plan (for deferrals made through December 31, 2004), effective as of April 14, 2010, incorporated by reference to Exhibit 10.5 to The Dow Chemical Company Current Report on Form 8-K filed on May 3, 2010. |
10(s) | The Summary Plan Description for The Dow Chemical Company Company-Paid Life Insurance Plan, Employee-Paid Life Insurance Plan, and Dependent Life Insurance Plan, amended and restated effective as of January 1, 2014, incorporated by reference to Exhibit 10.1 to The Dow Chemical Company Current Report on Form 8-K filed on February 13, 2014. |
10(t) | The Summary Plan Description for The Dow Chemical Company Retiree Company-Paid Life Insurance Plan, Retiree Optional Life Insurance Plan, and Retiree Dependent Life Insurance Plan, amended and restated effective as of January 1, 2014, incorporated by reference to Exhibit 10.2 to The Dow Chemical Company Current Report on Form 8-K filed on February 13, 2014. |
10(u) | Amended and Restated 2003 Non-Employee Directors' Stock Incentive Plan, adopted by the Board of Directors of The Dow Chemical Company on December 10, 2007, incorporated by reference to Exhibit 10(u) to The Dow Chemical Company Annual Report on Form 10-K for the year ended December 31, 2007. |
164
The Dow Chemical Company and Subsidiaries | ||||
Exhibit Index | ||||
EXHIBIT NO. | DESCRIPTION | |||
10(w) | Non-Qualified Stock Option Agreement Pursuant to The Dow Chemical Company 2003 Non-Employee Directors' Stock Incentive Plan, incorporated by reference to Exhibit 10(w) to The Dow Chemical Company Quarterly Report on Form 10-Q for the quarter ended September 30, 2004. |
10(x) | The Performance Shares Deferred Stock Agreement Pursuant to The Dow Chemical Company 1988 Award and Option Plan, as amended, restated and effective as of January 1, 2009, incorporated by reference to Exhibit 10(x) to The Dow Chemical Company Annual Report on Form 10-K for the year ended December 31, 2008. |
10(y) | The Deferred Stock Agreement Pursuant to The Dow Chemical Company 1988 Award and Option Plan, as amended, restated and effective as of January 1, 2009, incorporated by reference to Exhibit 10(y) to The Dow Chemical Company Annual Report on Form 10-K for the year ended December 31, 2008. |
10(z) | The Non-Qualified Stock Option Agreement Pursuant to The Dow Chemical Company 1988 Award and Option Plan, as amended, restated and effective as of January 1, 2009, incorporated by reference to Exhibit 10(z) to The Dow Chemical Company Annual Report on Form 10-K for the year ended December 31, 2008. |
10(cc) | The Dow Chemical Company Voluntary Deferred Compensation Plan for Non-Employee Directors, effective for deferrals after January 1, 2005, as amended and restated on December 10, 2008, effective as of January 1, 2009, incorporated by reference to Exhibit 10(cc) to The Dow Chemical Company Annual Report on Form 10-K for the year ended December 31, 2008. |
10(dd) | The Dow Chemical Company Elective Deferral Plan, effective for deferrals after January 1, 2005, as amended, restated and effective as of April 14, 2010, incorporated by reference to Exhibit 10.3 to The Dow Chemical Company Current Report on Form 8-K filed on May 3, 2010. |
10(dd)(i) | An Amendment to The Dow Chemical Company Elective Deferral Plan, effective for deferrals after January 1, 2005, effective as of April 14, 2010, incorporated by reference to Exhibit 10.6 to The Dow Chemical Company Current Report on Form 8-K filed on May 3, 2010. |
10(dd)(ii) | An Amendment to The Dow Chemical Company Elective Deferral Plan, effective for deferrals after January 1, 2005, dated December 11, 2014, incorporated by reference to Exhibit 10(dd)(ii) to The Dow Chemical Company Annual Report on Form 10-K for the year ended December 31, 2014. |
10(dd)(iii) | An Amendment to The Dow Chemical Company Elective Deferral Plan (Post 2004), effective as of January 19, 2017, incorporated by reference to Exhibit 10(dd)(iii) to The Dow Chemical Company Annual Report on Form 10-K for the year ended December 31, 2016. |
10(ii) | Employment agreement dated February 14, 2006, between Heinz Haller and The Dow Chemical Company, incorporated by reference to Exhibit 10(ii) to The Dow Chemical Company Annual Report on Form 10-K for the year ended December 31, 2008. |
10(jj) | Change in Control Executive Severance Agreement - Tier 1, incorporated by reference to Exhibit 10(jj) to The Dow Chemical Company Annual Report on Form 10-K for the year ended December 31, 2007. |
10(kk) | Change in Control Executive Severance Agreement - Tier 2, incorporated by reference to Exhibit 10(kk) to The Dow Chemical Company Annual Report on Form 10-K for the year ended December 31, 2007. |
10(nn) | Investment Agreement, dated as of October 27, 2008, between The Dow Chemical Company and Berkshire Hathaway Inc., incorporated by reference to Exhibit 10.1 to The Dow Chemical Company Current Report on Form 8-K filed on October 27, 2008. |
165
The Dow Chemical Company and Subsidiaries | ||||
Exhibit Index | ||||
EXHIBIT NO. | DESCRIPTION | |||
10(oo) | Investment Agreement, dated as of October 27, 2008, between The Dow Chemical Company and The Kuwait Investment Authority, incorporated by reference to Exhibit 10.2 to The Dow Chemical Company Current Report on Form 8-K filed on October 27, 2008. |
10(ww) | The Deferred Stock Units Agreement Pursuant to The Dow Chemical Company 1988 Award and Option Plan, as amended, restated and effective as of January 1, 2010, incorporated by reference to Exhibit 10.7 to The Dow Chemical Company Current Report on Form 8-K filed on February 18, 2010. |
10(xx) | The Special Deferred Stock Agreement Pursuant to The Dow Chemical Company 1988 Award and Option Plan, as amended, restated and effective as of January 1, 2010, incorporated by reference to Exhibit 10.8 to The Dow Chemical Company Current Report on Form 8-K filed on February 18, 2010. |
10(yy) | The Performance Shares Deferred Stock Units Agreement Pursuant to The Dow Chemical Company 1988 Award and Option Plan, as amended, restated and effective as of January 1, 2010, incorporated by reference to Exhibit 10.9 to The Dow Chemical Company Current Report on Form 8-K filed on February 18, 2010. |
10(zz) | The Special Performance Shares Deferred Stock Agreement Pursuant to The Dow Chemical Company 1988 Award and Option Plan, as amended, restated and effective as of January 1, 2010, incorporated by reference to Exhibit 10.10 to The Dow Chemical Company Current Report on Form 8-K filed on February 18, 2010. |
10(aaa) | The Stock Appreciation Rights Agreement Relating to a Stock Option Granted Under The Dow Chemical Company 1988 Award and Option Plan, as amended, restated and effective as of January 1, 2010, incorporated by reference to Exhibit 10.11 to The Dow Chemical Company Current Report on Form 8-K filed on February 18, 2010. |
10(bbb) | The Dow Chemical Company 2012 Stock Incentive Plan, effective as of May 10, 2012, incorporated by reference to Exhibit 10.1 to The Dow Chemical Company Current Report on Form 8-K filed on May 14, 2012. |
10(ccc) | Performance Shares Deferred Stock Agreement Pursuant to The Dow Chemical Company 2012 Stock Incentive Plan, effective as of May 10, 2012, incorporated by reference to Exhibit 10(ccc) to The Dow Chemical Company Quarterly Report on Form 10-Q for the quarter ended June 30, 2012. |
10(ddd) | Deferred Stock Agreement Pursuant to The Dow Chemical Company 2012 Stock Incentive Plan, effective as of May 10, 2012, incorporated by reference to Exhibit 10(ddd) to The Dow Chemical Company Quarterly Report on Form 10-Q for the quarter ended June 30, 2012. |
10(eee) | Non-Qualified Stock Option Agreement Pursuant to The Dow Chemical Company 2012 Stock Incentive Plan, effective as of May 10, 2012, incorporated by reference to Exhibit 10(eee) to The Dow Chemical Company Quarterly Report on Form 10-Q for the quarter ended June 30, 2012. |
10(fff) | The Dow Chemical Company Amended and Restated 2012 Stock Incentive Plan, effective as of May 15, 2014, incorporated by reference to Exhibit 10.1 to The Dow Chemical Company Current Report on Form 8-K filed on May 20, 2014. |
12.1 | Computation of Ratio of Earnings to Fixed Charges and Combined Fixed Charges and Preferred Stock Dividend Requirements. |
14 | Code of Ethics for Principal Executive Officer, Principal Financial Officer and Principal Accounting Officer, incorporated by reference to Exhibit 14 to The Dow Chemical Company Annual Report on Form 10-K for the year ended December 31, 2003. |
166
The Dow Chemical Company and Subsidiaries | ||||
Exhibit Index | ||||
EXHIBIT NO. | DESCRIPTION | |||
21 | Subsidiaries of The Dow Chemical Company. |
23(a) | Consent of Independent Registered Public Accounting Firm. |
23(b) | Ankura Consulting Group, LLC's Consent. |
31(a) | Certification Pursuant to Section 302 of the Sarbanes-Oxley Act of 2002. |
31(b) | Certification Pursuant to Section 302 of the Sarbanes-Oxley Act of 2002. |
32(a) | Certification Pursuant to Section 906 of the Sarbanes-Oxley Act of 2002. |
32(b) | Certification Pursuant to Section 906 of the Sarbanes-Oxley Act of 2002. |
99.1 | Guarantee relating to the 6.00% Notes of Rohm and Haas Company, incorporated by reference to Exhibit 99.5 to The Dow Chemical Company Current Report on Form 8-K filed on April 1, 2009. |
99.2 | Guarantee relating to the 9.80% Debentures of Rohm and Haas Company, incorporated by reference to Exhibit 99.6 to The Dow Chemical Company Current Report on Form 8-K filed on April 1, 2009. |
101.INS | XBRL Instance Document. |
101.SCH | XBRL Taxonomy Extension Schema Document. |
101.CAL | XBRL Taxonomy Extension Calculation Linkbase Document. |
101.DEF | XBRL Taxonomy Extension Definition Linkbase Document. |
101.LAB | XBRL Taxonomy Extension Label Linkbase Document. |
101.PRE | XBRL Taxonomy Extension Presentation Linkbase Document. |
167