UNITED STATES
SECURITIES AND EXCHANGE COMMISSION
WASHINGTON, D.C. 20549
FORM 10-K
(☒ ) ANNUAL REPORT PURSUANT TO SECTION 13 OR 15(d) OF THE SECURITIES EXCHANGE ACT OF 1934
For the fiscal year ended December 31, 2019
OR
(☐ ) TRANSITION REPORT PURSUANT TO SECTION 13 OR 15(d) OF THE SECURITIES EXCHANGE ACT OF 1934
For the transition period from __________ to __________
Commission File Number 1-8022
(Exact name of registrant as specified in its charter) | ||||||||||
(I.R.S. Employer Identification No.) | ||||||||||
(Address of principal executive offices) | (Zip Code) | (Telephone number, including area code) | ||||||||
Securities registered pursuant to Section 12(b) of the Act: | ||||||||||
Title of each class | Trading Symbol(s) | Name of exchange on which registered | ||||||||
Securities registered pursuant to Section 12(g) of the Act: None
Indicate by check mark if the registrant is a well-known seasoned issuer, as defined in Rule 405 of the Securities Act.
Indicate by check mark if the registrant is not required to file reports pursuant to Section 13 or Section 15(d) of the Act.
Yes ( ) No (X)
Indicate by check mark whether the registrant (1) has filed all reports required to be filed by Section 13 or 15(d) of the Securities Exchange Act of 1934 during the preceding 12 months (or for such shorter period that the registrant was required to file such reports), and (2) has been subject to such filing requirements for the past 90 days.
Indicate by check mark whether the registrant has submitted electronically every Interactive Data File required to be submitted pursuant to Rule 405 of Regulation S-T (§ 232.405 of this chapter) during the preceding 12 months (or for such shorter period that the registrant was required to submit such files).
Indicate by check mark whether the registrant is a large accelerated filer, an accelerated filer, a non-accelerated filer, a smaller reporting company, or an emerging growth company. (as defined in Exchange Act Rule 12b-2).
Emerging growth company (☐ )
If an emerging growth company, indicate by check mark if the registrant has elected not to use the extended transition period for complying with any new or revised financial accounting standards provided pursuant to Section 13(a) of the Exchange Act. ( )
Indicate by check mark whether the registrant is a shell company (as defined in Exchange Act Rule 12b-2).
Yes (☐ ) No (X)
On June 30, 2019 (which is the last day of the second quarter and the required date to use), the aggregate market value of the Registrant’s voting stock held by non-affiliates was approximately $59 billion (based on the close price as reported on the NASDAQ National Market System on such date).
There were 773,825,565 shares of Common Stock outstanding on January 31, 2020 (the latest practicable date that is closest to the filing date).
DOCUMENTS INCORPORATED BY REFERENCE
Portions of the Registrant’s Definitive Proxy Statement (the “Proxy Statement”) to be filed no later than 120 days after the end of the fiscal year with respect to its 2020 annual meeting of shareholders.
CSX 2019 Form 10-K p. 1
CSX CORPORATION | ||||
FORM 10-K | ||||
TABLE OF CONTENTS | ||||
Item No. | Page | |||
PART I | ||||
1. | ||||
2. | ||||
3. | ||||
4. | ||||
PART II | ||||
5. | ||||
6. | ||||
7. | ||||
· Terms Used by CSX | ||||
· 2019 Highlights | ||||
· Labor Agreements | ||||
· Critical Accounting Estimates | ||||
· Forward-Looking Statements | ||||
7A. | ||||
8. | ||||
9. | ||||
9A. | ||||
9B. | ||||
PART III | ||||
10. | Directors, Executive Officers of the Registrant and Corporate Governance | |||
11. | ||||
12. | ||||
13. | ||||
14. | ||||
PART IV | ||||
15. | ||||
CSX 2019 Form 10-K p. 2
CSX CORPORATION
PART I
Item 1. Business
CSX Corporation together with its subsidiaries ("CSX" or the “Company”), based in Jacksonville, Florida, is one of the nation's leading transportation companies. The Company provides rail-based freight transportation services including traditional rail service, the transport of intermodal containers and trailers, as well as other transportation services such as rail-to-truck transfers and bulk commodity operations. CSX and the rail industry provide customers with access to an expansive and interconnected transportation network that plays a key role in North American commerce and is critical to the long-term economic success and improved global competitiveness of the United States. In addition, freight railroads provide the most economical and environmentally efficient means to transport goods over land.
CSX Transportation, Inc.
CSX’s principal operating subsidiary, CSX Transportation, Inc. (“CSXT”), provides an important link to the transportation supply chain through its approximately 20,000 route mile rail network, which serves major population centers in 23 states east of the Mississippi River, the District of Columbia and the Canadian provinces of Ontario and Quebec. It has access to over 70 ocean, river and lake port terminals along the Atlantic and Gulf Coasts, the Mississippi River, the Great Lakes and the St. Lawrence Seaway. This access allows the Company to meet the dynamic transportation needs of manufacturers, industrial producers, the automotive industry, construction companies, farmers and feed mills, wholesalers and retailers, and energy producers. The Company’s intermodal business links customers to railroads via trucks and terminals. CSXT also serves thousands of production and distribution facilities through track connections with other Class I railroads and more than 230 short-line and regional railroads.
CSXT is also responsible for the Company's real estate sales, leasing, acquisition and management and development activities. Substantially all of these activities are focused on supporting railroad operations.
Other Entities
In addition to CSXT, the Company’s subsidiaries include CSX Intermodal Terminals, Inc. (“CSX Intermodal Terminals”), Total Distribution Services, Inc. (“TDSI”), Transflo Terminal Services, Inc. (“Transflo”), CSX Technology, Inc. (“CSX Technology”) and other subsidiaries. CSX Intermodal Terminals owns and operates a system of intermodal terminals, predominantly in the eastern United States and also performs drayage services (the pickup and delivery of intermodal shipments) for certain customers and trucking dispatch operations. TDSI serves the automotive industry with distribution centers and storage locations. Transflo connects non-rail served customers to the many benefits of rail by transferring products from rail to trucks. The biggest Transflo markets are chemicals and agriculture, which includes shipments of plastics and ethanol. CSX Technology and other subsidiaries provide support services for the Company.
CSX 2019 Form 10-K p. 3
CSX CORPORATION
PART I
Lines of Business
During 2019, the Company's services generated $11.9 billion of revenue and served three primary lines of business: merchandise, coal and intermodal.
• | The merchandise business shipped 2.7 million carloads (43 percent of volume) and generated 64 percent of revenue in 2019. The Company’s merchandise business is comprised of shipments in the following diverse markets: chemicals, automotive, agricultural and food products, minerals, fertilizers, forest products, and metals and equipment. |
• | The coal business shipped 843 thousand carloads (14 percent of volume) and generated 17 percent of revenue in 2019. The Company transports domestic coal, coke and iron ore to electricity-generating power plants, steel manufacturers and industrial plants as well as export coal to deep-water port facilities. Roughly one-third of export coal and the majority of the domestic coal that the Company transports is used for generating electricity. |
• | The intermodal business shipped 2.7 million units (43 percent of volume) and generated 15 percent of revenue in 2019. The intermodal business combines the superior economics of rail transportation with the flexibility of trucks and offers a cost and environmental advantage over long-haul trucking. Through a network of approximately 30 terminals, the intermodal business serves all major markets east of the Mississippi River and transports mainly manufactured consumer goods in containers, providing customers with truck-like service for longer shipments. |
Other revenue accounted for 4 percent of the Company’s total revenue in 2019. This category includes revenue from regional subsidiary railroads, demurrage, storage at intermodal facilities, revenue for customer volume commitments not met, switching, other incidental charges and adjustments to revenue reserves. Revenue from regional railroads includes shipments by railroads that the Company does not directly operate. Demurrage represents charges assessed when freight cars or other equipment are held beyond a specified period of time. Switching represents charges assessed when a railroad switches cars for a customer or another railroad.
Employees
The Company's number of employees was nearly 21,000 as of December 2019, which includes approximately 17,000 union employees. Most of the Company’s employees provide or support transportation services.
Operating Model
The Company is focused on developing and strictly maintaining a scheduled service plan with an emphasis on optimizing assets. When this operating model is executed effectively, customer service is improved, enabling the Company to better compete for an increased share of the U.S. freight market. Further, this model leads to reduced costs and strong free cash flow generation.
Financial Information
See Item 7. Management’s Discussion and Analysis of Financial Condition and Results of Operations for operating revenue, operating income and total assets for each of the last three fiscal years.
CSX 2019 Form 10-K p. 4
CSX CORPORATION
PART I
Company History
A leader in freight rail transportation for more than 190 years, the Company’s heritage dates back to the early nineteenth century when The Baltimore and Ohio Railroad Company (“B&O”) – the nation’s first common carrier – was chartered in 1827. Since that time, the Company has built on this foundation to create a railroad that could safely and reliably service the ever-increasing demands of a growing nation.
Since its founding, numerous railroads have combined with the former B&O through merger and consolidation to create what has become CSX. Each of the railroads that combined into the CSX family brought new geographical reach to valuable markets, gateways, cities, ports and transportation corridors.
CSX Corporation was incorporated in 1978 under Virginia law. In 1980, the Company completed the merger of the Chessie System and Seaboard Coast Line Industries into CSX. The merger allowed the Company to connect northern population centers and Appalachian coal fields to growing southeastern markets. Later, the Company’s acquisition of key portions of Conrail, Inc. ("Conrail") allowed CSXT to link the northeast, including New England and the New York metropolitan area, with Chicago and midwestern markets as well as the growing areas in the Southeast already served by CSXT. This current rail network allows the Company to directly serve every major market in the eastern United States with safe, dependable, environmentally responsible and fuel efficient freight transportation and intermodal service.
Competition
The business environment in which the Company operates is highly competitive. Shippers typically select transportation providers that offer the most compelling combination of service and price. Service requirements, both in terms of transit time and reliability, vary by shipper and commodity. As a result, the Company’s primary competition varies by commodity, geographic location and mode of available transportation and includes other railroads, motor carriers that operate similar routes across its service area and, to a less significant extent, barges, ships and pipelines.
CSXT’s primary rail competitor is Norfolk Southern Railway, which operates throughout much of the Company’s territory. Other railroads also operate in parts of the Company’s territory. Depending on the specific market, competing railroads and deregulated motor carriers may exert pressure on price and service levels. For further discussion on the risk of competition to the Company, see Item 1A. Risk Factors.
Regulatory Environment
The Company's operations are subject to various federal, state, provincial (Canada) and local laws and regulations generally applicable to businesses operating in the United States and Canada. In the U.S., the railroad operations conducted by the Company's subsidiaries, including CSXT, are subject to the regulatory jurisdiction of the Surface Transportation Board (“STB”), the Federal Railroad Administration (“FRA”), and its sister agency within the U.S. Department of Transportation ("DOT"), the Pipeline and Hazardous Materials Safety Administration (“PHMSA”). Together, FRA and PHMSA have broad jurisdiction over railroad operating standards and practices, including track, freight cars, locomotives and hazardous materials requirements. In addition, the U.S. Environmental Protection Agency (“EPA”) has regulatory authority with respect to matters that impact the Company's properties and operations.
The Transportation Security Administration (“TSA”), a component of the Department of Homeland Security, has broad authority over railroad operating practices that may have homeland security implications. In Canada, the railroad operations conducted by the Company’s subsidiaries, including CSXT, are subject to the regulatory jurisdiction of the Canadian Transportation Agency.
CSX 2019 Form 10-K p. 5
CSX CORPORATION
PART I
Although the Staggers Act of 1980 significantly deregulated the U.S. rail industry, the STB has broad jurisdiction over rail carriers. The STB regulates routes, fuel surcharges, conditions of service, rates for non-exempt traffic, acquisitions of control over rail common carriers and the transfer, extension or abandonment of rail lines, among other railroad activities. Any new rules from the STB regarding, among other things, competitive access or revenue adequacy could have a material adverse effect on the Company's financial condition, results of operations and liquidity as well as its ability to invest in enhancing and maintaining vital infrastructure. For further discussion on regulatory risks to the Company, see Item 1A. Risk Factors.
Positive Train Control
In 2008, Congress enacted the Rail Safety Improvement Act (the “RSIA”). The legislation included a mandate that all Class I freight railroads implement an interoperable positive train control system (“PTC”) by December 31, 2015. Implementation of a PTC system is designed to prevent train-to-train collisions, over-speed derailments, incursions into established work-zone limits, and train diversions onto another set of tracks. PTC must be installed on all main lines with passenger and commuter operations as well as most of those over which toxic-by-inhalation hazardous materials are transported.
On October 29, 2015, the President of the United States signed the Positive Train Control Enforcement and Implementation Act of 2015 into law extending the deadline. In accordance with this Act, the Company completed installation of all PTC hardware by December 31, 2018. The Company met all criteria required by the Act to be approved for an extension by the FRA. The PTC system is now required to be fully operational by December 31, 2020. CSX remains on track to meet this regulatory requirement.
The Company expects to continue incurring capital costs in connection with the implementation of PTC as well as related ongoing operating expenses. CSX currently estimates that the total multi-year cost of PTC implementation will be approximately $2.4 billion for the Company. Total PTC investment through 2019 was $2.3 billion.
Other Information
CSX makes available on its website www.csx.com, free of charge, its annual reports on Form 10-K, quarterly reports on Form 10-Q, current reports on Form 8-K and all amendments to those reports as soon as reasonably practicable after such reports are filed with or furnished to the Securities and Exchange Commission (“SEC”). The information on the CSX website is not part of this annual report on Form 10-K. Additionally, the Company has posted its code of ethics on its website, which is also available to any shareholder who requests it. This Form 10-K and other SEC filings made by CSX are also accessible through the SEC’s website at www.sec.gov.
CSX has included the certifications of its Chief Executive Officer (“CEO”) and the Chief Financial Officer (“CFO”) required by Section 302 of the Sarbanes-Oxley Act of 2002 (“the Act”) as Exhibit 31, as well as Section 906 of the Act as Exhibit 32 to this Form 10-K report.
The information set forth in Item 6. Selected Financial Data is incorporated herein by reference. For additional information concerning business conducted by the Company during 2019, see Item 7. Management's Discussion and Analysis of Financial Condition and Results of Operations.
CSX 2019 Form 10-K p. 6
CSX CORPORATION
PART I
Item 1A. Risk Factors
The risks set forth in the following risk factors could have a material adverse effect on the Company's financial condition, results of operations or liquidity, and could cause those results to differ materially from those expressed or implied in the Company's forward-looking statements. Additional risks and uncertainties not currently known to the Company or that the Company currently does not deem to be material also may materially impact the Company's financial condition, results of operations or liquidity.
New legislation or regulatory changes could impact the Company's earnings or restrict its ability to independently negotiate prices.
Legislation passed by Congress, new regulations issued by federal agencies or executive orders issued by the President of the United States could significantly affect the revenues, costs and profitability of the Company's business. In addition, statutes or regulations imposing price constraints or affecting rail-to-rail competition could adversely affect the Company's profitability.
Government regulation and compliance risks may adversely affect the Company's operations and financial results.
The Company is subject to the jurisdiction of various regulatory agencies, including the STB, FRA, PHMSA, TSA, EPA and other state, provincial and federal regulatory agencies for a variety of economic, health, safety, labor, environmental, tax, legal and other matters. New or modified rules or regulations by these agencies could increase the Company's operating costs, adversely impact revenue or reduce operating efficiencies and affect service performance. For example, the RSIA, as amended, mandated that the installation of PTC hardware be completed by December 31, 2018, and requires that the PTC system be fully operational by December 31, 2020 on main lines that carry certain hazardous materials and on lines that have commuter or passenger operations. Although CSX remains on track to meet this regulatory requirement, noncompliance with these and other applicable laws or regulations could erode public confidence in the Company and can subject the Company to fines, penalties and other legal or regulatory sanctions.
CSXT, as a common carrier by rail, is required by law to transport hazardous materials, which could expose the Company to significant costs and claims.
A train accident involving the transport of hazardous materials could result in significant claims arising from personal injury, property or natural resource damage, environmental penalties and remediation obligations. Such claims, if insured, could exceed existing insurance coverage or insurance may not continue to be available at commercially reasonable rates. Under federal regulations, CSXT is required to transport hazardous materials under the legal duty referred to as the common carrier mandate.
CSXT is also required to comply with regulations regarding the handling of hazardous materials. In November 2008, the TSA issued final rules placing significant new security and safety requirements on passenger and freight railroad carriers, rail transit systems and facilities that ship hazardous materials by rail. Noncompliance with these rules can subject the Company to significant penalties and could be a factor in litigation arising out of a train accident. Finally, legislation preventing the transport of hazardous materials through certain cities could result in network congestion and increase the length of haul for hazardous substances, which could increase operating costs, reduce operating efficiency or increase the risk of an accident involving the transport of hazardous materials.
CSX 2019 Form 10-K p. 7
CSX CORPORATION
PART I
The Company faces competition from other transportation providers.
The Company experiences competition in pricing, service, reliability and other factors from various transportation providers including railroads and motor carriers that operate similar routes across its service area and, to a less significant extent, barges, ships and pipelines. Other transportation providers generally use public rights-of-way that are built and maintained by governmental entities, while CSXT and other railroads must build and maintain rail networks largely using internal resources. Any future improvements or expenditures materially increasing the quality or reducing the cost of alternative modes of transportation such as through the use of automation, autonomy or electrification, or legislation providing for less stringent size or weight restrictions on trucks, could negatively impact the Company's competitive position. Additionally, any future consolidation in the rail industry could materially affect the regulatory and competitive environment in which the Company operates.
Global economic conditions could negatively affect demand for commodities and other freight.
A decline or disruption in general domestic and global economic conditions that affects demand for the commodities and products the Company transports, including import and export volume, could reduce revenues or have other adverse effects on the Company's cost structure and profitability. For example, slower rates of economic growth in Asia, contraction of European economies, and changes in the global supply of seaborne coal or price of seaborne coal have adverse impacts on U.S. export coal volume and result in lower coal revenue for CSX. Additionally, changes to trade agreements or policies could result in reduced import and export volumes due to increased tariffs and lower consumer demand. If the Company experiences significant declines in demand for its transportation services with respect to one or more commodities and products, the Company may experience reduced revenue and increased operating costs, workforce adjustments, and other related activities, which could have a material adverse effect on the Company's financial condition, results of operations and liquidity.
Changing dynamics in the U.S. and global energy markets could negatively impact profitability.
Increases in production and source locations of natural gas in the U.S. have resulted in lower natural gas prices in CSX’s service territory. As a result of sustained low natural gas prices, many coal-fired power plants have been displaced by natural gas-fired power generation facilities. If natural gas prices were to remain low, additional coal-fired plants could be displaced, which would likely further reduce the Company's domestic coal volumes and revenues. Additionally, crude oil prices combined with increased pipeline activity have resulted in volatility in domestic crude oil production, which has affected crude oil volumes for CSX.
The Company relies on the security, stability and availability of its technology systems to operate its business.
The Company relies on information technology in all aspects of its business. The performance and reliability of the Company's technology systems are critical to its ability to operate and compete safely and effectively. A cybersecurity attack, which is a deliberate theft of data or impairment of information technology systems, or other significant disruption or failure, could result in a service interruption, train accident, misappropriation of confidential information, process failure, security breach or other operational difficulties. Such an event could result in decreased revenues and increased capital, insurance or operating costs, including increased security costs to protect the Company's infrastructure. Insurance maintained by the Company to protect against loss of business and other related consequences resulting from cyber incidents may not be sufficient to cover all damages. A disruption or compromise of the Company's information technology systems, even for short periods of time, could have a material adverse effect.
CSX 2019 Form 10-K p. 8
CSX CORPORATION
PART I
The Company’s operations and financial results could be negatively impacted by climate change and regulatory and legislative responses to climate change.
There is potential for operational impacts from changing weather patterns or rising sea levels in the Company's operational territory, which could impact the Company's network or other assets. Climate change and other emissions-related laws and regulations have been proposed and, in some cases adopted, on the federal, state, provincial and local levels. These final and proposed laws and regulations take the form of restrictions, caps, taxes or other controls on emissions. In particular, the EPA has issued various regulations and may issue additional regulations targeting emissions, including rules and standards governing emissions from certain stationary sources and from vehicles.
Any of these pending or proposed laws or regulations could adversely affect the Company's operations and financial results by, among other things: (i) reducing coal-fired electricity generation due to mandated emission standards; (ii) reducing the consumption of coal as a viable energy resource in the United States and Canada; (iii) increasing the Company's fuel, capital and other operating costs and negatively affecting operating and fuel efficiencies; and (iv) making it difficult for the Company's customers in the U.S. and Canada to produce products in a cost competitive manner. Any of these factors could reduce the amount of shipments the Company handles and have a material adverse effect on the Company's financial condition, results of operations or liquidity.
The Company is subject to environmental laws and regulations that may result in significant costs.
The Company is subject to wide-ranging federal, state, provincial and local environmental laws and regulations concerning, among other things, emissions into the air, ground and water; the handling, storage, use, generation, transportation and disposal of waste and other materials; the clean-up of hazardous material and petroleum releases and the health and safety of our employees. If the Company violates or fails to comply with these laws and regulations, CSX could be fined or otherwise sanctioned by regulators. The Company can also be held liable for consequences arising out of human exposure to any hazardous substances for which CSX is responsible. In certain circumstances, environmental liability can extend to formerly owned or operated properties, leased properties, adjacent properties and properties owned by third parties or Company predecessors, as well as to properties currently owned, leased or used by the Company.
The Company has been, and may in the future be, subject to allegations or findings to the effect that it has violated, or is strictly liable under, environmental laws or regulations, and such violations can result in the Company's incurring fines, penalties or costs relating to the clean-up of environmental contamination. Although the Company believes it has appropriately recorded current and long-term liabilities for known and reasonably estimable future environmental costs, it could incur significant costs that exceed reserves or require unanticipated cash expenditures as a result of any of the foregoing. The Company also may be required to incur significant expenses to investigate and remediate known, unknown or future environmental contamination.
The Company may be subject to various claims and lawsuits that could result in significant expenditures.
As part of its railroad and other operations, the Company is subject to various claims and lawsuits related to disputes over commercial practices, labor and unemployment matters, occupational and personal injury claims, property damage, environmental and other matters. The Company may experience material judgments or incur significant costs to defend existing and future lawsuits. Although the Company maintains insurance to cover some of these types of claims and establishes reserves when appropriate, final amounts determined to be due on any outstanding matters may exceed the Company's insurance coverage or differ materially from the recorded reserves. Additionally, the Company could be impacted by adverse developments not currently reflected in the Company's reserve estimates.
CSX 2019 Form 10-K p. 9
CSX CORPORATION
PART I
Disruption to a key railroad industry supplier could negatively affect operating efficiency and increase costs.
The capital intensive and unique nature of core rail equipment (including rolling stock equipment, locomotives, rail, and ties) limits the number of railroad equipment suppliers. If any of the current manufacturers stops production or experiences a supply shortage, CSXT could experience a significant cost increase or material shortage. In addition, a few critical railroad suppliers are foreign and, as such, adverse developments in international relations, new trade regulations, disruptions in international shipping or increases in global demand could make procurement of these supplies more difficult or increase CSXT's operating costs. Additionally, if a fuel supply shortage were to arise, the Company would be negatively impacted.
Network constraints could have a negative impact on service and operating efficiency.
CSXT could experience rail network difficulties related to: (i) increased volume; (ii) locomotive or crew shortages; (iii) extreme weather conditions; (iv) impacts from changes in yard capacity, or network structure or composition, including train routes; (v) increased passenger activities; or (vi) regulatory changes impacting where and how fast CSXT can transport freight or maintain routes, which could impact CSXT's operational fluidity, leading to deterioration of service, asset utilization and overall efficiency.
Future acts of terrorism, war or regulatory changes to combat the risk of terrorism may cause significant disruptions in the Company's operations.
Terrorist attacks, along with any government response to those attacks, may adversely affect the Company's financial condition, results of operations or liquidity. CSXT's rail lines, other key infrastructure and information technology systems may be targets or indirect casualties of acts of terror or war. This risk could cause significant business interruption and result in increased costs and liabilities and decreased revenues. In addition, premiums charged for some or all of the insurance coverage currently maintained by the Company could increase dramatically, or the coverage may no longer be available.
Furthermore, in response to the heightened risk of terrorism, federal, state and local governmental bodies are proposing and, in some cases, have adopted legislation and regulations relating to security issues that impact the transportation industry. For example, the Department of Homeland Security adopted regulations that require freight railroads to implement additional security protocols when transporting hazardous materials. Complying with these or future regulations could continue to increase the Company's operating costs and reduce operating efficiencies.
Severe weather or other natural occurrences could result in significant business interruptions and expenditures in excess of available insurance coverage.
The Company's operations may be affected by external factors such as severe weather and other natural occurrences, including floods, fires, hurricanes and earthquakes. As a result, the Company's rail network may be damaged, its workforce may be unavailable, fuel costs may rise and significant business interruptions could occur. In addition, the performance of locomotives and railcars could be adversely affected by extreme weather conditions. Insurance maintained by the Company to protect against loss of business and other related consequences resulting from these natural occurrences is subject to coverage limitations, depending on the nature of the risk insured. This insurance may not be sufficient to cover all of the Company's damages or damages to others, and this insurance may not continue to be available at commercially reasonable rates. Even with insurance, if any natural occurrence leads to a catastrophic interruption of service, the Company may not be able to restore service without a significant interruption in operations.
CSX 2019 Form 10-K p. 10
CSX CORPORATION
PART I
Failure to complete negotiations on collective bargaining agreements could result in strikes and/or work stoppages.
Most of CSX's employees are represented by labor unions and are covered by collective bargaining agreements. These agreements are either bargained for nationally by the National Carriers Conference Committee or locally between CSX and the union. Such agreements are negotiated over the course of several years and previously have not resulted in any extended work stoppages. Under the Railway Labor Act's procedures (which include mediation, cooling-off periods and the possibility of an intervention by the President of the United States), during negotiations neither party may take action until the procedures are exhausted. If, however, CSX is unable to negotiate acceptable agreements, the employees covered by the Railway Labor Act could strike, which could result in loss of business and increased operating costs as a result of higher wages or benefits paid to union members.
The unavailability of critical resources could adversely affect the Company’s operational efficiency and ability to meet demand.
Marketplace conditions for resources like locomotives as well as the availability of qualified personnel, particularly engineers and conductors, could each have a negative impact on the Company’s ability to meet demand for rail service. Although the Company believes that it has adequate resources and personnel for the current business environment, unpredictable increases in demand for rail services or extreme weather conditions may exacerbate such risks, which could have a negative impact on the Company’s operational efficiency and otherwise have a material adverse effect on the Company’s financial condition, results of operations, or liquidity in a particular period.
Weaknesses in the capital and credit markets could negatively impact the Company’s access to capital.
The Company regularly relies on capital markets for the issuance of long-term debt instruments, commercial paper and bank financing from time to time. Instability or disruptions of the capital markets, including credit markets, or the deterioration of the Company’s financial condition due to internal or external factors, could restrict or prohibit access and could increase financing costs. A significant deterioration of the Company’s financial condition could also reduce credit ratings and could limit or affect its access to external sources of capital and increase the costs of short and long-term debt financing.
Item 1B. Unresolved Staff Comments
None
CSX 2019 Form 10-K p. 11
CSX CORPORATION
PART I
Item 2. Properties
The Company’s properties primarily consist of track and its related infrastructure, locomotives and freight cars and equipment. These categories and the geography of the network are described below.
Track and Infrastructure
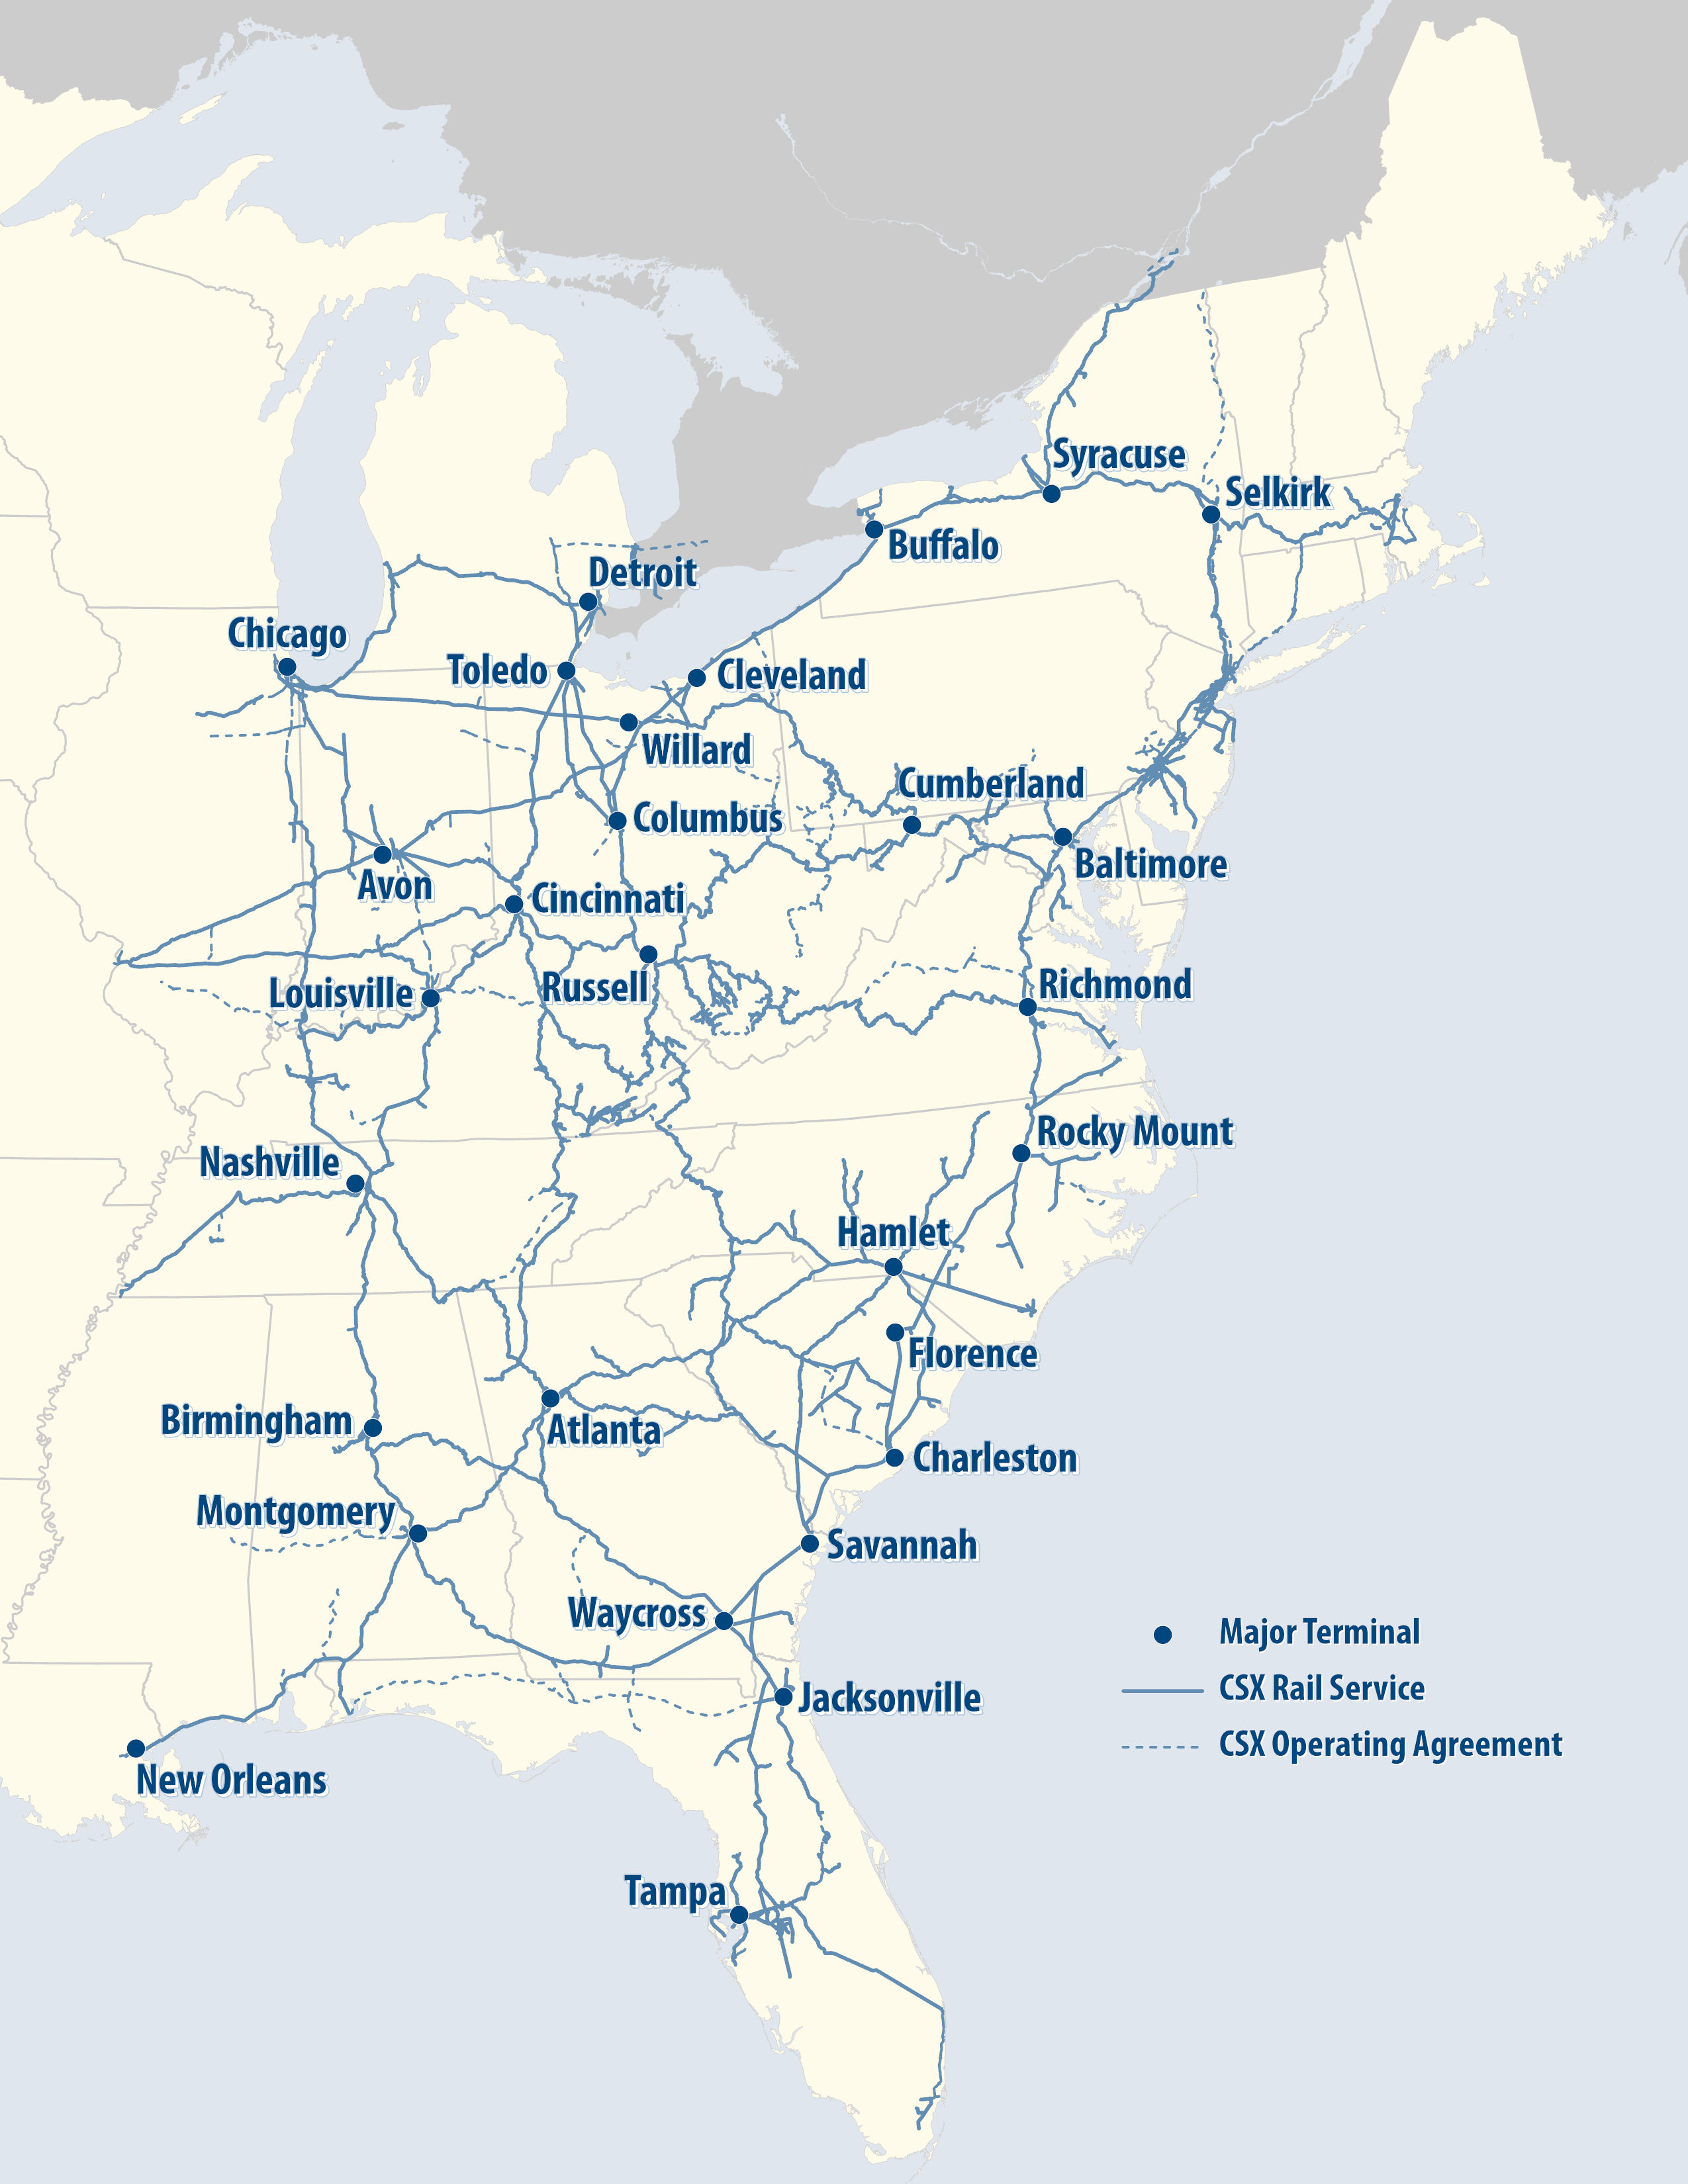
Serving 23 states, the District of Columbia, and the Canadian provinces of Ontario and Quebec, the CSXT rail network serves, among other markets, New York, Philadelphia and Boston in the Northeast and Mid-Atlantic, the southeast markets of Atlanta, Miami and New Orleans, and the midwestern markets of St. Louis, Memphis and Chicago.
CSXT’s track structure includes mainline track, connecting terminals and yards, track within terminals and switching yards, sidings used for passing trains, track connecting CSXT's track to customer locations and track that diverts trains from one track to another known as turnouts. Total track miles, which reflect the size of CSXT’s network that connects markets, customers and western railroads, are greater than CSXT’s approximately 20,000 route miles. At December 2019, the breakdown of track miles was as follows:
Track | ||
Miles | ||
Mainline track | 25,793 | |
Terminals and switching yards | 9,316 | |
Passing sidings and turnouts | 921 | |
Total | 36,030 | |
In addition to its physical track structure, the Company operates numerous yards and terminals for rail and intermodal service. These serve as points of connectivity between the Company and its local customers and as sorting facilities where railcars and intermodal containers are received, classed for destination and placed onto outbound trains, or arrive and are delivered to the customer. The Company’s largest yards and terminals based on 2019 volume (number of railcars or intermodal containers processed) are listed below.
Yards and Terminals | Annual Volume | |
Waycross, GA | 874,474 | |
Bedford Park Intermodal Terminal - Chicago, IL | 820,362 | |
Nashville, TN | 648,311 | |
Selkirk, NY | 642,869 | |
Avon, IN (Indianapolis) | 609,468 | |
Cincinnati, OH | 567,582 | |
Louisville, KY | 397,246 | |
Fairburn, GA Intermodal Terminal | 377,736 | |
Walbridge, OH (Toledo) | 323,672 | |
Chicago, IL | 308,653 | |
CSX 2019 Form 10-K p. 12
CSX CORPORATION
PART I
Network Geography
CSXT’s operations are primarily focused on four major transportation networks and corridors which are defined geographically and by commodity flows below.
Interstate 90 (I-90) Corridor – This CSXT corridor links Chicago and the Midwest to metropolitan areas in New York and New England. This route, also known as the “waterlevel route,” has minimal hills and grades and nearly all of it has two main tracks (referred to as double track). These engineering attributes permit the corridor to support high-speed service across intermodal, automotive and merchandise commodities. This corridor is a primary route for import traffic coming from the far east through western ports moving eastward across the country, through Chicago and into the population centers in the Northeast. The I-90 Corridor is also a critical link between ports in New York, New Jersey, and Pennsylvania and consumption markets in the Midwest. This route carries goods from all three of the Company’s major markets – merchandise, coal and intermodal.
Interstate 95 (I-95) Corridor – The CSXT I-95 Corridor connects Charleston, Jacksonville, Miami and many other cities throughout the Southeast with the heavily populated mid-Atlantic and northeastern cities of Baltimore, Philadelphia and New York. CSXT primarily transports food and consumer products, as well as metals and chemicals along this line. It is the leading rail corridor along the eastern seaboard south of the District of Columbia, and provides access to major eastern ports.
Southeastern Corridor – This critical part of the network runs between CSXT’s western gateways of Chicago, St. Louis and Memphis through the cities of Nashville, Birmingham, and Atlanta and markets in the Southeast. The Southeastern Corridor is the premier rail route connecting these key cities, gateways, and markets and positions CSXT to efficiently handle projected traffic volumes of intermodal, automotive and general merchandise traffic. The corridor also provides direct rail service between the coal reserves of the southern Illinois basin and the demand for coal in the Southeast.
Coal Network – The CSXT coal network connects the coal mining operations in the Appalachian mountain region and Illinois basin with industrial areas in the Southeast, Northeast and Mid-Atlantic, as well as many river, lake, and deep water port facilities. The domestic coal market has declined significantly over the last decade and export coal remains subject to a high degree of volatility. CSXT’s coal network remains well positioned to supply utility markets in both the Northeast and Southeast and to transport coal shipments for export outside of the U.S. Roughly one-third of the tons of export coal and the majority of the domestic coal that the Company transports is used for generating electricity.
See the following page for a map of the CSX Rail Network. Also included on the map, CSX Operating Agreement indicates areas within which CSX can operate through trackage rights beyond the CSX network.
CSX 2019 Form 10-K p. 13
CSX CORPORATION
PART I
CSX Rail Network
CSX 2019 Form 10-K p. 14
CSX CORPORATION
PART I
Locomotives
At December 2019, CSXT owned more than 3,500 locomotives. From time to time, the Company also short-term leases locomotives based on business needs. Freight locomotives are used primarily to pull trains while switching locomotives are used in yards. Auxiliary units are typically used to provide extra traction for heavy trains in hilly terrain. Of owned locomotives, approximately 65% were in active service as of December 31, 2019, and the remainder were in storage to be utilized as needed. Storing locomotives and equipment allows the Company to quickly adjust its active fleet based on demand and other factors while avoiding delays due to supply limitations or excessive lead times to acquire additional equipment. At December 2019, CSXT’s fleet of owned locomotives consisted of the following types:
Locomotives | % | Average Age (years) | ||||||
Freight | 3,162 | 89 | % | 20 | ||||
Switching | 220 | 6 | % | 42 | ||||
Auxiliary Units | 179 | 5 | % | 27 | ||||
Total | 3,561 | 100 | % | 21 | ||||
Equipment
The Company owns or long-term leases equipment, including several types of freight cars and intermodal containers. Of total owned and long-term leased equipment, approximately 65% was in active service on December 31, 2019, and the remainder was in storage to be utilized as needed. At December 2019, the Company’s owned and long-term leased equipment consisted of the following:
Equipment | Number of Units | % | |||
Gondolas | 19,102 | 37 | % | ||
Multi-level flat cars | 11,172 | 22 | % | ||
Covered hoppers | 8,346 | 16 | % | ||
Open-top hoppers | 7,405 | 14 | % | ||
Box cars | 4,509 | 9 | % | ||
Flat cars | 702 | 1 | % | ||
Other cars | 262 | 1 | % | ||
Subtotal freight cars | 51,498 | 100 | % | ||
Containers | 17,981 | ||||
Total equipment | 69,479 | ||||
At any time, over half of the railcars on the CSXT system are not owned or leased by the Company. Examples of these include railcars owned by other railroads (which are utilized by CSXT), shipper-furnished or private cars (which are generally used only in that shipper’s service), multi-level railcars used to transport automobiles (which are shared between railroads) and double-stack railcars, or well cars (which are industry pooled), that allow for two intermodal containers to be loaded one above the other.
CSX 2019 Form 10-K p. 15
CSX CORPORATION
PART I
The Company’s revenue-generating equipment, either owned or long-term leased, consists of freight cars and containers as described below.
Gondolas – Support CSXT’s metals markets and provide transport for woodchips and other bulk commodities. Some gondolas are equipped with special hoods for protecting products like coil and sheet steel.
Multi-level flat cars – Transport finished automobiles and are differentiated by the number of levels: bi-levels for large vehicles such as pickup trucks and SUVs and tri-levels for sedans and smaller automobiles.
Covered hoppers – Have a permanent roof and are segregated based upon commodity density. Lighter bulk commodities such as grain, fertilizer, flour, salt, sugar, clay and lime are shipped in large cars called jumbo covered hoppers. Heavier commodities like cement, ground limestone and industrial sand are shipped in small cube covered hoppers.
Open-top hoppers – Transport heavy dry bulk commodities such as coal, coke, stone, sand, ores and gravel that are resistant to weather conditions.
Box cars – Include a variety of tonnages, sizes, door configurations and heights to accommodate a wide range of finished products, including paper, auto parts, appliances and building materials. Insulated box cars deliver food products, canned goods, beer and wine.
Flat cars – Used for shipping intermodal containers and trailers or bulk and finished goods, such as lumber, pipe, plywood, drywall and pulpwood.
Other cars – Primarily leased refrigerator cars and slab steel cars.
Containers – Weather-proof boxes used for bulk shipment of freight.
Item 3. Legal Proceedings
For further details, please refer to Note 8. Commitments and Contingencies of this annual report on Form 10-K.
Item 4. Mine Safety Disclosure
Not Applicable
CSX 2019 Form 10-K p. 16
CSX CORPORATION
PART I
Executive Officers of the Registrant
Executive officers of the Company are elected by the CSX Board of Directors and generally hold office until the next annual election of officers. There are no family relationships or any arrangement or understanding between any officer and any other person pursuant to which such officer was elected. As of the date of this filing, the executive officers’ names, ages and business experience are:
Name and Age | Business Experience During Past Five Years |
James M. Foote, 66 President and Chief Executive Officer | Foote has served as President and Chief Executive Office since December 2017. He joined CSX in October 2017 as Chief Operating Officer, with responsibility for both operations and sales and marketing. Mr. Foote has more than 40 years of railroad industry experience. Most recently, he was President and Chief Executive Officer of Bright Rail Energy. Before heading Bright Rail, he was Executive Vice President, Sales and Marketing with Canadian National Railway Company. At Canadian National, Mr. Foote also served as Vice President – Investor Relations and Vice President Sales and Marketing – Merchandise. |
Kevin S. Boone, 42 Executive Vice President and Chief Financial Officer | Boone was named Executive Vice President and Chief Financial Officer in October 2019 after serving as Interim Chief Financial Officer since May 2019. In this role, he is responsible for all financial aspects of the Company's business including financial and economic analysis, accounting, tax, treasury, real estate and purchasing activities. Mr. Boone has more than 18 years of experience in finance, accounting, mergers and acquisitions, and transportation performance analysis. He joined CSX in September 2017 as Vice President of Corporate Affairs and Chief Investor Relations Officer and was later named Vice President, Marketing and Strategy leading research and data analysis to advance growth strategies for CSX. Before joining CSX in 2017, Mr. Boone worked as a Senior Equity Research Analyst at Janus Capital. He also served as a Vice President at Morgan Stanley in equity research and an associate at Merrill Lynch in the mergers and acquisitions group. |
Jamie J. Boychuk, 42 Executive Vice President of Operations | Boychuk has served as CSXT's Executive Vice President of Operations since October 2019. In this role, he is responsible for mechanical, engineering, transportation and network operations, including terminals. Since joining CSXT in 2017, he has held the positions of Senior Vice President of Network, Engineering, Mechanical and Intermodal Operations; Vice President of Scheduled Railroading; and Assistant Vice President of Transportation Support. Mr. Boychuk previously worked at Canadian National Railway, where he served for 20 years in various operational roles of increasing responsibility, including sub-region General Manager. |
Edmond L. Harris, 70 Executive Vice President | Harris has served as an Executive Vice President of CSX since October 2019. In this role, he is responsible for safety, performance metrics, operational planning, and facilities. In 2018, he joined CSXT as Executive Vice President of Operations. Mr. Harris has more than 40 years of railroad industry experience, including service as a senior adviser to Global Infrastructure Partners, an independent fund that invests in infrastructure assets worldwide; Chairman of Omnitrax Rail Network; and a member of the board of directors for Universal Rail Services. His previous experience also includes having served as Chief Operations Officer at Canadian Pacific, and subsequently, a member of the Board. He also served as Executive Vice President of Operations at Canadian National. |
CSX 2019 Form 10-K p. 17
CSX CORPORATION
PART I
Name and Age | Business Experience During Past Five Years |
Nathan D. Goldman, 62 Executive Vice President and Chief Legal Officer | Goldman has served as Executive Vice President and Chief Legal Officer, and Corporate Secretary of CSX since November 2017. In this role, he directs the Company’s legal affairs, government relations, corporate communications, risk management, public safety, environmental, and audit functions. During his 16 years with the Company, Mr. Goldman has previously served as Vice President of Risk Compliance and General Counsel and has overseen work in compliance, risk management and safety programs. |
Diana B. Sorfleet, 55 Executive Vice President and Chief Administrative Officer | Sorfleet was named Executive Vice President and Chief Administrative Officer in July 2018. In this role, her responsibilities include human resources, information technology, labor relations, people systems and analytics, total rewards and aviation. During her 8 years with the Company, Ms. Sorfleet has previously served as Chief Human Resources Officer. Prior to joining CSX, she worked in human resources for 20 years. |
Mark K. Wallace, 50 Executive Vice President and Chief Sales & Marketing Officer | Wallace has served as Executive Vice President of Sales and Marketing since July 2018. In his current role, Mr. Wallace is responsible for the commercial organization. He joined the Company in March 2017 and previously served as Executive Vice President and Chief Administrative Officer and Executive Vice President of Corporate Affairs and Chief of Staff to the CEO. Prior to joining CSX, he served as the Vice President of Corporate Affairs at Canadian Pacific Railway Limited with responsibility for the corporate communications and public affairs, investor relations, facilities and real estate functions. Prior to his time at Canadian Pacific, Mr. Wallace spent more than 15 years in various senior management positions with Canadian National Railway Company. |
Angela C. Williams, 45 Vice President and Chief Accounting Officer | Williams has served as Vice President and Chief Accounting Officer of CSX since March 2018. She is responsible for financial and regulatory reporting, freight billing and collections, payroll, accounts payable and various other accounting processes. During her 16 years with the Company, she previously served as Assistant Vice President - Assistant Controller and in other various accounting roles. Prior to joining CSX, she held various accounting and auditing positions for over 6 years. Ms. Williams is a Certified Public Accountant. |
CSX 2019 Form 10-K p. 18
CSX CORPORATION
PART II
Item 5. Market for Registrant’s Common Equity, Related Stockholder Matters and Issuer Purchases of Equity Securities
Market Information
CSX’s common stock is listed on the Nasdaq Global Select Market, which is its principal trading market, and is traded over-the-counter and on exchanges nationwide. The official trading symbol is “CSX.”
Description of Common and Preferred Stock
A total of 1.8 billion shares of common stock are authorized, of which 773,470,825 shares were outstanding as of December 31, 2019. Each share is entitled to one vote in all matters requiring a vote of shareholders. There are no preemptive rights, which are privileges extended to select shareholders that would allow them to purchase additional shares before other members of the general public in the event of an offering. At January 31, 2020, the latest practicable date that is closest to the filing date, there were 25,127 common stock shareholders of record. The weighted average of common shares outstanding, which was used in the calculation of diluted earnings per share, was 798 million as of December 31, 2019. (See Note 2, Earnings Per Share.) A total of 25 million shares of preferred stock is authorized, none of which is currently outstanding.
The following table sets forth, for the quarters indicated, the dividends declared on CSX common stock.
Quarter | |||||||||||||||||||
1st | 2nd | 3rd | 4th | Year | |||||||||||||||
2019 | $ | 0.24 | $ | 0.24 | $ | 0.24 | $ | 0.24 | $ | 0.96 | |||||||||
2018 | $ | 0.22 | $ | 0.22 | $ | 0.22 | $ | 0.22 | $ | 0.88 | |||||||||
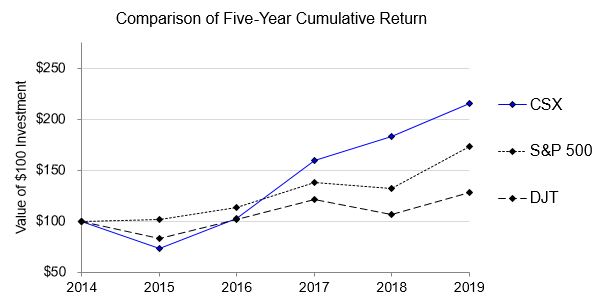
Stock Performance Graph
The cumulative shareholder returns, assuming reinvestment of dividends, on $100 invested at December 31, 2014 are illustrated on the graph below. The Company references the Standard & Poor's 500 Stock Index (“S&P 500 ®”), and the Dow Jones U.S. Transportation Average Index, which provide comparisons to a broad-based market index and other companies in the transportation industry.
CSX 2019 Form 10-K p. 19
CSX CORPORATION
PART II
CSX Purchases of Equity Securities
The Company continues to repurchase shares under the $5 billion program announced in January 2019. For more information about share repurchases, see Note 2 Earnings Per Share. Share repurchase activity of $606 million for the fourth quarter 2019 was as follows:
CSX Purchases of Equity Securities for the Quarter | ||||||||||||
Fourth Quarter | Total Number of Shares Purchased | Average Price Paid per Share | Total Number of Shares Purchased as Part of Publicly Announced Plans or Programs(a) | Approximate Dollar Value of Shares that May Yet Be Purchased Under the Plans or Programs | ||||||||
Beginning Balance | $ | 2,362,512,464 | ||||||||||
October 1 - October 31, 2019 | 7,738,077 | $ | 67.74 | 7,719,147 | 1,839,693,245 | |||||||
November 1 - November 30, 2019 | 1,191,270 | 70.42 | 1,191,270 | 1,755,803,734 | ||||||||
December 1 - December 31, 2019 | — | — | — | 1,755,803,734 | ||||||||
Ending Balance | 8,929,347 | $ | 68.10 | 8,910,417 | $ | 1,755,803,734 | ||||||
CSX 2019 Form 10-K p. 20
CSX CORPORATION
PART II
Item 6. Selected Financial Data
Selected financial data related to the Company’s financial results for the last five fiscal years are listed below.
Fiscal Years | ||||||||||||||||||||
(Dollars and Shares in Millions, Except Per Share Amounts) | 2019 | 2018 | 2017 | 2016 | 2015 | |||||||||||||||
Financial Performance | ||||||||||||||||||||
Revenue | $ | 11,937 | $ | 12,250 | $ | 11,408 | $ | 11,069 | $ | 11,811 | ||||||||||
Expense | 6,972 | 7,381 | 7,688 | 7,656 | 8,183 | |||||||||||||||
Operating Income | $ | 4,965 | $ | 4,869 | $ | 3,720 | $ | 3,413 | $ | 3,628 | ||||||||||
Adjusted Operating Income(a) | 4,965 | 4,869 | 3,818 | 3,413 | 3,628 | |||||||||||||||
Net Earnings from Continuing Operations | $ | 3,331 | $ | 3,309 | $ | 5,471 | $ | 1,714 | $ | 1,968 | ||||||||||
Adjusted Net Earnings from Continuing Operations(a) | 3,331 | 3,309 | 2,097 | 1,714 | 1,968 | |||||||||||||||
Operating Ratio | 58.4 | % | 60.3 | % | 67.4 | % | 69.2 | % | 69.3 | % | ||||||||||
Adjusted Operating Ratio(a) | 58.4 | % | 60.3 | % | 66.5 | % | 69.2 | % | 69.3 | % | ||||||||||
Net Earnings Per Share: | ||||||||||||||||||||
From Continuing Operations, Basic | $ | 4.18 | $ | 3.86 | $ | 6.01 | $ | 1.81 | $ | 2.00 | ||||||||||
From Continuing Operations, Assuming Dilution | 4.17 | 3.84 | 5.99 | 1.81 | 2.00 | |||||||||||||||
Adjusted From Continuing Operations, Assuming Dilution(a) | 4.17 | 3.84 | 2.30 | 1.81 | 2.00 | |||||||||||||||
Average Common Shares Outstanding | ||||||||||||||||||||
Basic | 796 | 857 | 911 | 947 | 983 | |||||||||||||||
Assuming Dilution | 798 | 861 | 914 | 948 | 984 | |||||||||||||||
Financial Position | ||||||||||||||||||||
Cash, Cash Equivalents and Short-term Investments | $ | 1,954 | $ | 1,111 | $ | 419 | $ | 1,020 | $ | 1,438 | ||||||||||
Total Assets | 38,257 | 36,729 | 35,739 | 35,414 | 34,745 | |||||||||||||||
Long-term Debt | 15,993 | 14,739 | 11,790 | 10,962 | 10,515 | |||||||||||||||
Shareholders' Equity | 11,863 | 12,580 | 14,721 | 11,694 | 11,668 | |||||||||||||||
Dividend Per Share | $ | 0.96 | $ | 0.88 | $ | 0.78 | $ | 0.72 | $ | 0.70 | ||||||||||
Additional Data | ||||||||||||||||||||
Capital Expenditures | $ | 1,657 | $ | 1,745 | $ | 2,040 | $ | 2,705 | $ | 2,562 | ||||||||||
Employees -- Annual Averages (estimated) | 21,561 | 22,901 | 25,230 | 27,350 | 31,285 | |||||||||||||||
Employees -- Year-end Count (estimated) | 20,908 | 22,475 | 24,006 | 26,628 | 29,410 | |||||||||||||||
(a) Adjusted operating income, adjusted net earnings and adjusted earnings per share assuming dilution are non-GAAP measures that exclude the impacts of tax reform and restructuring activities in 2017. These non-GAAP measures are unlikely to be comparable to similar measures presented by other companies. The presentation of these non-GAAP measures should not be considered in isolation from, as a substitute for, or as superior to the financial information presented in accordance with GAAP. Reconciliations of non-GAAP measures to corresponding GAAP measures are presented in Item 7. Management's Discussion and Analysis of Financial Condition and Results of Operations.
CSX 2019 Form 10-K p. 21
CSX CORPORATION
PART II
Item 7. Management's Discussion and Analysis of Financial Condition and Results of Operations
TERMS USED BY CSX
When used in this report, unless otherwise indicated by the context, these terms are used to mean the following:
Car hire - A charge paid by one railroad for its use of cars belonging to another railroad or car owner.
Class I freight railroad - One of the largest line haul freight railroads as determined based on operating revenue; the exact revenue required to be in each class is periodically adjusted for inflation by the Surface Transportation Board. Smaller railroads are classified as Class II or Class III.
Common carrier mandate - A federal mandate that requires U.S. railroads to accommodate reasonable requests from shippers to carry any freight, including hazardous materials.
Demurrage - A charge assessed by railroads for the use of rail cars by shippers or receivers of freight beyond a specified free time.
Department of Transportation ("DOT") - A U.S. government agency with jurisdiction over matters of all modes of transportation.
Depreciation study - Conducted by a third-party specialist and analyzed by management, a periodic statistical analysis of fixed asset service lives, salvage values, accumulated depreciation, and other factors for group assets along with a comparison of similar asset groups at other companies.
Double-stack - Stacking containers two-high on specially equipped cars.
Drayage - The pickup or delivery of intermodal shipments by truck.
Environmental Protection Agency (“EPA”) - A U.S. government agency that has regulatory authority with respect to environmental law.
Federal Railroad Administration ("FRA") - The branch of the DOT that is responsible for developing and enforcing railroad safety regulations, including safety standards for rail infrastructure and equipment.
Free cash flow - The calculation of a non-GAAP measure by using net cash provided by operating activities and adjusting for property additions and certain other investing activities. Free cash flow is a measure of cash available for paying dividends, share repurchases and principal reduction on outstanding debt.
Group-life depreciation - A type of depreciation in which assets with similar useful lives and characteristics are aggregated into groups. Instead of calculating depreciation for individual assets, depreciation is calculated as a whole for each group.
Incidental revenue - Revenue for switching, demurrage, storage, etc.
Intermodal - A flexible way of transporting freight over highway, rail and water without being removed from the original transportation equipment, namely a container or trailer.
Mainline - The main track thoroughfare, exclusive of terminals, yards, sidings and turnouts.
CSX 2019 Form 10-K p. 22
CSX CORPORATION
PART II
Pipeline and Hazardous Materials Safety Administration (“PHMSA”) - An agency within the DOT that, together with the FRA, has broad jurisdiction over railroad operating standards and practices, including hazardous materials requirements.
Positive Train Control ("PTC") - An interoperable train control system designed to prevent train-to-train collisions, over-speed derailments, incursions into established work-zone limits, and train diversions onto another set of tracks.
Revenue adequacy - The achievement of a rate of return on investment at least equal to the industry cost of investment capital, as measured by the STB.
Shipper - A customer shipping freight via rail.
Siding - Track adjacent to the mainline used for passing trains.
Staggers Act of 1980 - Congressional law which significantly deregulated the rail industry, replacing the regulatory structure in existence since the 1887 Interstate Commerce Act. Where previously rates were controlled by the Interstate Commerce Commission, the Staggers Act allowed railroads to establish their own rates for shipments, enhancing their ability to compete with other modes of transportation.
Surface Transportation Board ("STB") - An independent governmental adjudicatory body administratively housed within the DOT, responsible for the economic regulation of interstate surface transportation within the United States.
Switching - Putting cars in a specific order, placing cars for loading, retrieving empty cars or adding or removing cars from a train at an intermediate point.
Terminal - A facility, typically owned by a railroad, for the handling of freight and for the breaking up, making up, forwarding and servicing of trains.
Transportation Security Administration (“TSA”) - A component of the Department of Homeland Security with broad authority over railroad operating practices that may have homeland security implications.
TTX Company ("TTX") - A company that provides its owner-railroads with standardized fleets of intermodal, automotive and general use railcars at time and mileage rates. CSX owns about 20 percent of TTX's common stock, and the remainder is owned by the other leading North American railroads and their affiliates.
Turnout - A track that diverts trains from one track to another.
Yard - A system of tracks, other than main tracks and sidings, used for making up trains, storing cars and other purposes.
CSX 2019 Form 10-K p. 23
CSX CORPORATION
PART II
2019 HIGHLIGHTS
• Revenue of $11.9 billion decreased $313 million or 3% versus the prior year.
• Expenses of $7.0 billion decreased $409 million or 6% year over year.
• Operating income of $5.0 billion increased $96 million or 2% year over year.
• Operating ratio of 58.4% improved 190 basis points from 60.3%.
• Earnings per diluted share of $4.17 increased $0.33 or 9% year over year.
RESULTS OF OPERATIONS
2019 vs. 2018 Results of Operations
Fiscal Years | |||||||||||||||
2019 | 2018 | $ Change | % Change | ||||||||||||
(Dollars in Millions) | |||||||||||||||
Revenue | $ | 11,937 | $ | 12,250 | $ | (313 | ) | (3 | )% | ||||||
Expense | |||||||||||||||
Labor and Fringe | 2,616 | 2,738 | 122 | 4 | |||||||||||
Materials, Supplies and Other | 1,784 | 1,967 | 183 | 9 | |||||||||||
Depreciation | 1,349 | 1,331 | (18 | ) | (1 | ) | |||||||||
Fuel | 906 | 1,046 | 140 | 13 | |||||||||||
Equipment and Other Rents | 408 | 395 | (13 | ) | (3 | ) | |||||||||
Equity Earnings of Affiliates | (91 | ) | (96 | ) | (5 | ) | (5 | ) | |||||||
Total Expense | 6,972 | 7,381 | 409 | 6 | |||||||||||
Operating Income | 4,965 | 4,869 | 96 | 2 | |||||||||||
Interest Expense | (737 | ) | (639 | ) | (98 | ) | (15 | ) | |||||||
Other Income - Net | 88 | 74 | 14 | 19 | |||||||||||
Income Tax Expense | (985 | ) | (995 | ) | 10 | 1 | |||||||||
Net Earnings | $ | 3,331 | $ | 3,309 | $ | 22 | 1 | ||||||||
Earnings Per Diluted Share: | |||||||||||||||
Net Earnings | $ | 4.17 | $ | 3.84 | $ | 0.33 | 9 | % | |||||||
Operating Ratio | 58.4 | % | 60.3 | % | 190 | bps | |||||||||
CSX 2019 Form 10-K p. 24
CSX CORPORATION
PART II
2019 vs. 2018 Results of Operations, continued
Volume and Revenue (Unaudited) | ||||||||||||||||||||||||||||||
Volume (Thousands of units); Revenue (Dollars in Millions); Revenue Per Unit (Dollars) | ||||||||||||||||||||||||||||||
Volume | Revenue | Revenue Per Unit | ||||||||||||||||||||||||||||
2019 | 2018 | % Change | 2019 | 2018 | % Change | 2019 | 2018 | % Change | ||||||||||||||||||||||
Chemicals | 668 | 675 | (1 | )% | $ | 2,343 | $ | 2,339 | — | % | $ | 3,507 | $ | 3,465 | 1 | % | ||||||||||||||
Agricultural and Food Products | 469 | 447 | 5 | % | 1,410 | 1,306 | 8 | % | 3,006 | 2,922 | 3 | % | ||||||||||||||||||
Automotive | 456 | 463 | (2 | )% | 1,236 | 1,267 | (2 | )% | 2,711 | 2,737 | (1 | )% | ||||||||||||||||||
Minerals | 335 | 315 | 6 | % | 550 | 518 | 6 | % | 1,642 | 1,644 | — | % | ||||||||||||||||||
Forest Products | 288 | 285 | 1 | % | 878 | 850 | 3 | % | 3,049 | 2,982 | 2 | % | ||||||||||||||||||
Metals and Equipment | 248 | 267 | (7 | )% | 741 | 769 | (4 | )% | 2,988 | 2,880 | 4 | % | ||||||||||||||||||
Fertilizers | 243 | 248 | (2 | )% | 431 | 442 | (2 | )% | 1,774 | 1,782 | — | % | ||||||||||||||||||
Total Merchandise | 2,707 | 2,700 | — | % | 7,589 | 7,491 | 1 | % | 2,803 | 2,774 | 1 | % | ||||||||||||||||||
Coal | 843 | 887 | (5 | )% | 2,070 | 2,246 | (8 | )% | 2,456 | 2,532 | (3 | )% | ||||||||||||||||||
Intermodal | 2,670 | 2,895 | (8 | )% | 1,760 | 1,931 | (9 | )% | 659 | 667 | (1 | )% | ||||||||||||||||||
Other | — | — | — | % | 518 | 582 | (11 | )% | — | — | — | % | ||||||||||||||||||
Total | 6,220 | 6,482 | (4 | )% | $ | 11,937 | $ | 12,250 | (3 | )% | $ | 1,919 | $ | 1,890 | 2 | % | ||||||||||||||
CSX 2019 Form 10-K p. 25
CSX CORPORATION
PART II
Revenue
In 2019, revenue decreased $313 million, or 3%, when compared to the previous year due to volume declines, lower other revenue and decreases in fuel recovery. These decreases were partially offset by merchandise and intermodal pricing gains and favorable mix.
Merchandise Volume
Chemicals - Declined due to reduced natural gas liquids and fly ash shipments, partially offset by growth in crude oil as well as industrial and municipal waste.
Agricultural and Food Products - Increased due to gains in feed grain and ingredients, ethanol, as well as sweeteners and oils.
Automotive - Declined due to lower passenger car shipments, partially offset by higher shipments of trucks and SUVs.
Minerals - Increased due to higher shipments for highway construction and paving projects.
Forest Products - Increased due to higher demand for wood pulp and other fiber products as well as lumber, partially offset by reduced pulpboard shipments.
Metals and Equipment - Declined due to reduced metals shipments, primarily in the steel, construction and scrap markets.
Fertilizers - Declined due to unfavorable weather conditions throughout the year that impacted fertilizer applications.
Coal Volume
Domestic coal declined primarily due to lower shipments of utility coal as a result of continued competition from natural gas, partially offset by stronger shipments for coke, iron ore and other coal. Export coal declined due to lower international shipments of both thermal and metallurgical coal as global benchmark prices declined.
Intermodal Volume
Domestic and international intermodal declined primarily due to rationalization of low-density lanes.
Other
Other revenue decreased $64 million versus prior year primarily due to lower revenue for storage at intermodal facilities and a decrease in settlements from customers that did not meet volume commitments. These decreases were partially offset by a favorable contract settlement with a customer.
CSX 2019 Form 10-K p. 26
CSX CORPORATION
PART II
Expense
In 2019, total expenses decreased $409 million, or 6%, compared to prior year. Descriptions of each expense category as well as significant year-over-year changes are described below.
Labor and Fringe expenses include employee wages and related payroll taxes, health and welfare costs, pension, other post-retirement benefits and incentive compensation. These expenses decreased $122 million due to the following items:
• | Efficiency and volume savings of $157 million primarily resulted from lower headcount and reduced crew starts. |
• | Incentive compensation decreased $12 million primarily due to lower expected annual incentive payouts, partially offset by the acceleration of stock compensation expense for certain retirement-eligible employees. |
• | Other costs increased $47 million primarily due to inflation that was partially offset by several non-significant items. |
Materials, Supplies and Other expenses consist primarily of contracted services to maintain infrastructure and equipment, terminal and pier services and professional services. This category also includes costs related to materials, travel, casualty claims, environmental remediation, train accidents, property and sales tax, utilities and other items including gains on property dispositions. Total materials, supplies and other expenses decreased $183 million driven by the following:
• | Efficiency and volume savings of $201 million primarily resulted from lower operating support costs, reduced equipment maintenance expenses and lower terminal and trucking costs. |
• | Gains from real estate and line sales were $151 million in 2019 compared to $154 million in 2018. |
• | All other costs increased $15 million primarily due to inflation and favorable adjustments to casualty reserves in 2018, partially offset by other items. |
Depreciation expense primarily relates to recognizing the costs of a capital asset, such as locomotives, railcars and track structure, over its useful life. This expense is impacted primarily by the capital expenditures made each year. Depreciation expense increased $18 million due to a larger asset base and a 2019 equipment depreciation study that resulted in $10 million of additional expense, partially offset by other non-significant items.
Fuel expense includes locomotive diesel fuel as well as non-locomotive fuel. This expense is largely driven by the market price and locomotive consumption of diesel fuel. Fuel expense decreased $140 million primarily due to an 8% price decrease that drove savings of $74 million, a 4% improvement in fuel efficiency and volume savings.
Equipment and Other expenses include rent paid for freight cars owned by other railroads or private companies, net of rents received by CSXT for use of its equipment. This category of expenses also includes expenses for short-term and long-term leases of locomotives, railcars, containers and trailers, offices and other rentals. These expenses increased $13 million primarily due to inflation as well as several non-significant items, partially offset by volume and efficiency savings.
Equity Earnings of Affiliates includes earnings from operating equity method investments. Equity earnings of affiliates decreased $5 million primarily due to lower net earnings at TTX.
CSX 2019 Form 10-K p. 27
CSX CORPORATION
PART II
Interest Expense
Interest Expense includes interest on long-term debt, equipment obligations and finance leases. Interest expense increased $98 million to $737 million primarily due to higher average debt balances, partially offset by lower average rates.
Other Income - Net
Other Income - Net includes investment gains, losses and interest income, as well as components of net periodic pension and post-retirement benefit cost and other non-operating activities. Other income increased $14 million to $88 million primarily due to increased interest income as a result of higher average investment balances.
Income Tax Expense
Income Tax Expense decreased $10 million primarily due to tax benefits from the impacts of stock option exercises and the vesting of other equity awards as well as the resolution of certain state tax matters, partially offset by benefits in 2018 related to state legislative changes and a federal deferred tax adjustment.
Net Earnings and Earnings per Diluted Share
Net Earnings increased $22 million to $3.3 billion, and earnings per diluted share increased $0.33 to $4.17, due to the factors mentioned above. Average shares outstanding was lower as a result of share repurchase activity during the year and had a favorable impact on earnings per diluted share.
2018 vs. 2017 Results of Operations
See discussion of 2018 results of operations compared to 2017 results of operations in Part II, Item 7, "Management’s Discussion and Analysis of Financial Condition and Results of Operations" in the Company's Annual Report on Form 10-K for the year ended December 31, 2018.
CSX 2019 Form 10-K p. 28
CSX CORPORATION
PART II
Non-GAAP Measures - Unaudited
CSX reports its financial results in accordance with United States generally accepted accounting principles ("GAAP"). CSX also uses certain non-GAAP measures that fall within the meaning of Securities and Exchange Commission Regulation G and Regulation S-K Item 10(e), which may provide users of the financial information with additional meaningful comparison to prior reported results. Non-GAAP measures do not have standardized definitions and are not defined by GAAP. Therefore, CSX’s non-GAAP measures are unlikely to be comparable to similar measures presented by other companies. The presentation of these non-GAAP measures should not be considered in isolation from, as a substitute for, or as superior to the financial information presented in accordance with GAAP. Reconciliations of non-GAAP measures to corresponding GAAP measures are below.
2017 Adjusted Operating Results
Management believes that adjusted operating income, adjusted operating ratio, adjusted net earnings and adjusted net earnings per share, assuming dilution are important in evaluating the Company’s operating performance and for planning and forecasting future business operations and future profitability. These non-GAAP measures provide meaningful supplemental information regarding operating results because they exclude certain significant items that are not considered indicative of future financial trends.
The impact of tax reform and the restructuring charge on 2017 operating results are shown in the following table. There were no adjustments to operating results in 2018 or 2019.
For the Year ended December 31, 2017 | |||||||||||||||
(in millions, except operating ratio and net earnings per share, assuming dilution) | Operating Income | Operating Ratio | Net Earnings | Net Earnings Per Share, Assuming Dilution | |||||||||||
GAAP Operating Results | 3,720 | 67.4 | 5,471 | 5.99 | |||||||||||
Restructuring Charge (a)(b) | 240 | (2.1 | ) | 203 | 0.22 | ||||||||||
Tax Reform Benefit (net) | (142 | ) | 1.2 | (3,577 | ) | (3.91 | ) | ||||||||
Adjusted Operating Results (non-GAAP) | $ | 3,818 | 66.5 | % | $ | 2,097 | $ | 2.30 | |||||||
(a) The restructuring charge was tax effected using rates reflective of the applicable tax amounts for each component of the restructuring charge.
(b) The total restructuring charge was $325 million, of which $85 million was included in Restructuring Charge - Non-Operating on the consolidated income statement.
CSX 2019 Form 10-K p. 29
CSX CORPORATION
PART II
Free Cash Flow and Adjusted Free Cash Flow
Management believes that free cash flow is useful to investors as it is important in evaluating the Company’s financial performance. More specifically, free cash flow measures cash generated by the business after reinvestment. This measure represents cash available for both equity and bond investors to be used for dividends, share repurchases or principal reduction on outstanding debt. Free cash flow is calculated by using net cash from operations and adjusting for property additions and certain other investing activities, which includes proceeds from property dispositions. Adjusted free cash flow excludes the impact of cash payments for restructuring charge. Free cash flow and adjusted free cash flow should be considered in addition to, rather than a substitute for, cash provided by operating activities. Adjusted free cash flow before dividends increased $279 million year-over-year to $3.5 billion primarily due to an increase in cash provided by operating activities and a decrease in property additions.
The following table reconciles cash provided by operating activities (GAAP measure) to free cash flow and adjusted free cash flow (both non-GAAP measures).
Fiscal Years | |||||||||||
2019 | 2018 | 2017 | |||||||||
(Dollars in Millions) | |||||||||||
Net cash provided by operating activities | $ | 4,850 | $ | 4,641 | $ | 3,472 | |||||
Property additions | (1,657 | ) | (1,745 | ) | (2,040 | ) | |||||
Other investing activities | 285 | 292 | 134 | ||||||||
Free Cash Flow, before dividends (non-GAAP) | $ | 3,478 | $ | 3,188 | $ | 1,566 | |||||
Add back: Cash Payments for Restructuring Charge (after-tax) (a) | $ | — | $ | 11 | $ | 135 | |||||
Adjusted Free Cash Flow, before dividends (non-GAAP) | $ | 3,478 | $ | 3,199 | $ | 1,701 | |||||
(a) The restructuring charge impact to free cash flow was tax effected using the applicable tax rate of the charge. During 2018 and 2017, the Company made cash payments of $15 million and $187 million, respectively, related to the restructuring charge. Also in 2017, the Company made $30 million in payments to a former CEO and a former President for previously accrued non-qualified pension benefits that are not included in the restructuring charge.
CSX 2019 Form 10-K p. 30
CSX CORPORATION
PART II
Operating Statistics (Estimated)
Fiscal Years | ||||||||
2019 | 2018 | Improvement/ (Deterioration) | ||||||
Operations Performance | ||||||||
Train Velocity (Miles per hour)(a) | 20.5 | 18.0 | 14 | % | ||||
Dwell (Hours)(a) | 8.6 | 9.5 | 9 | % | ||||
Revenue Ton- Miles (Billions) | ||||||||
Merchandise | 128.0 | 128.1 | — | % | ||||
Coal | 41.1 | 45.5 | (10 | )% | ||||
Intermodal | 26.9 | 29.3 | (8 | )% | ||||
Total Revenue Ton-Miles | 196.0 | 202.9 | (3 | )% | ||||
Total Gross Ton-Miles (Billions) | 388.3 | 402.7 | (4 | )% | ||||
On-Time Originations | 89 | % | 82 | % | 9 | % | ||
On-Time Arrivals(b) | 79 | % | 75 | % | 5 | % | ||
Safety | ||||||||
FRA Personal Injury Frequency Index | 0.88 | 1.03 | 15 | % | ||||
FRA Train Accident Rate | 2.14 | 3.64 | 41 | % | ||||
(a) The methodology for calculating train velocity and dwell differ from that prescribed by the STB as the Company believes these numbers more accurately reflect railroad performance. CSXT will continue to report train velocity and dwell, using the prescribed methodology, to the STB on a weekly basis. See additional discussion on the Company's website.
(b) During 2019, the calculation of on-time arrivals has changed to consider a train "on time" if it is delivered within two hours of scheduled arrival. Prior year periods have been restated to conform to this change.
Certain operating statistics are estimated and can continue to be updated as actuals settle.
Key Performance Measures Definitions
Train Velocity - Average train speed between origin and destination in miles per hour (does not include locals, yard jobs, work trains or passenger trains). Train velocity measures the profiled schedule of trains (from departure to arrival and all interim time), and train profiles are periodically updated to align with a changing operation.
Dwell - Average amount of time in hours between car arrival to and departure from the yard.
Revenue Ton-Miles (RTM's) - The movement of one revenue-producing ton of freight over a distance of one mile.
Gross Ton-Miles (GTM's) - The movement of one ton of train weight over one mile. GTM's are calculated by multiplying total train weight by distance the train moved. Total train weight is comprised of the weight of the freight cars and their contents.
On-Time Originations - Percent of scheduled road trains that depart the origin yard on-time or ahead of schedule.
On-Time Arrivals - Percent of scheduled road trains that arrive at the destination yard on-time to within two hours of scheduled arrival.
FRA Personal Injury Frequency Index - Number of FRA-reportable injuries per 200,000 man-hours.
FRA Train Accident Rate - Number of FRA-reportable train accidents per million train-miles.
The Company strives for continuous improvement in safety and service performance through training, innovation and investment. Investment in training and technology also is designed to allow the Company's employees to have an additional layer of protection that can detect and avoid many types of human factor incidents. Safety programs are designed to prevent incidents that can adversely impact employees, customers and communities. Continued capital investment in the Company's assets, including track, bridges, signals, equipment and detection technology also supports safety performance.
Operating performance continued to improve in 2019, as train velocity and car dwell achieved all-time record levels for the second consecutive year. The operational plan remains focused on delivering further service gains, improving transit times and driving asset utilization while controlling costs.
From a safety perspective, FRA personal injury index and train-accident rate improved 15% and 41% from the prior year, respectively. In 2019, the number of FRA reportable injuries and the number of train accidents were both all-time record lows. The Company is committed to continuous safety improvement and remains focused on reducing risk and enhancing the overall safety of its employees, customers and the communities in which the Company operates.
CSX 2019 Form 10-K p. 31
CSX CORPORATION
PART II
LIQUIDITY AND CAPITAL RESOURCES
Liquidity is a company’s ability to generate adequate amounts of cash to meet both current and future needs for obligations as they mature and to provide for planned capital expenditures, including those to address regulatory and legislative requirements. To have a complete picture of a company’s liquidity, its sources and uses of cash, balance sheet and external factors should be reviewed.
Significant Cash Flows
The following charts highlight the components of the change in cash and cash equivalents for operating, investing and financing activities for full years 2019, 2018 and 2017.
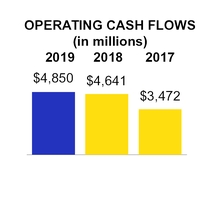
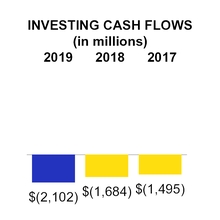
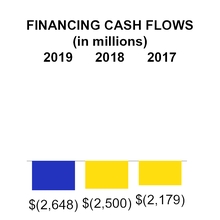
In 2019, the Company generated $4.9 billion of cash provided by operating activities, which was $209 million higher than prior year primarily driven by favorable working capital activities and higher cash-generating income. In 2018, the Company generated $4.6 billion of cash provided by operating activities, which was $1.2 billion higher than the prior year primarily driven by higher cash-generating income which included the impact of a lower income tax rate, partially offset by lower working capital and other activities.
In 2019, net cash used in investing activities was $2.1 billion, an increase in net spend of $418 million from the prior year primarily driven by an increase in net purchases of short-term investments. In 2018, net cash used in investing activities was $1.7 billion, an increase of $189 million from the prior year primarily driven by an increase in net short-term investment purchases, partially offset by lower property additions and higher proceeds from property dispositions.
In 2019, net cash used in financing activities was $2.6 billion, which represents an increase in net spend of $148 million from the prior year primarily due to lower proceeds from debt issuances and higher debt repayments, partially offset by lower share repurchases. In 2018, net cash used in financing activities was $2.5 billion, which represents an increase of $321 million from the prior year primarily driven by higher share repurchases, partially offset by higher net debt issued.
CSX 2019 Form 10-K p. 32
CSX CORPORATION
PART II
Sources of Cash and Liquidity
The Company has multiple sources of liquidity, including cash generated from operations and financing sources. The Company filed a shelf registration statement with the SEC in February 2019 which is unlimited as to amount and may be used to issue debt or equity securities at CSX’s discretion, subject to market conditions and CSX Board authorization. While CSX seeks to give itself flexibility with respect to cash requirements, there can be no assurance that market conditions would permit CSX to sell such securities on acceptable terms at any given time, or at all. In 2019, CSX issued a total of $2.0 billion of new long-term debt.
CSX has access to a $1.2 billion five-year unsecured revolving credit facility backed by a diverse syndicate of banks that expires in March 2024. As of December 31, 2019, the Company had no outstanding balances under this facility. See Note 10, Debt and Credit Agreements for more information. The Company also has a commercial paper program, backed by the revolving credit facility, under which the Company may issue unsecured commercial paper notes up to a maximum aggregate principal amount of $1.0 billion outstanding at any one time. At December 31, 2019, the Company had no outstanding debt under the commercial paper program.
Uses of Cash
CSX uses current cash balances for general corporate purposes, which may include working capital requirements, repayment of additional indebtedness outstanding from time to time, repurchases of CSX's common stock, capital investments, improvements in productivity and other cost reduction initiatives.
In 2019, CSX continued to invest in its business to create long-term value for shareholders. The Company is committed to maintaining and improving its existing infrastructure and to positioning itself for long-term, profitable growth through optimizing network and terminal capacity. Funds used for property additions are further described below.
Fiscal Years | |||||||||||
Capital Expenditures (Dollars in Millions) | 2019 | 2018 | 2017 | ||||||||
Track | $ | 860 | $ | 771 | $ | 733 | |||||
Bridges, Signals and Other | 493 | 491 | 570 | ||||||||
Total Infrastructure | 1,353 | 1,262 | 1,303 | ||||||||
Capacity and Commercial Facilities | 141 | 246 | 417 | ||||||||
Regulatory (including PTC) | 91 | 225 | 284 | ||||||||
Freight Cars | 17 | 9 | 20 | ||||||||
Locomotives | 55 | 3 | 16 | ||||||||
Total Capital Expenditures | $ | 1,657 | 1,745 | 2,040 | |||||||
Planned capital investments for 2020 are expected to be between $1.6 billion and $1.7 billion. Of the 2020 investment, the majority will be used to sustain the core infrastructure. The remaining amounts will be allocated to projects supporting service enhancements, productivity initiatives and profitable growth. CSX intends to fund capital investments through cash generated from operations.
The Company expects to continue incurring capital costs in connection with the implementation of PTC. CSX estimates that the total multi-year cost of PTC implementation will be approximately $2.4 billion. This estimate includes costs for installing the new system along tracks, upgrading locomotives, adding communication equipment and developing new technologies. Total PTC spending through 2019 was $2.3 billion.
CSX 2019 Form 10-K p. 33
CSX CORPORATION
PART II
CSX is continually evaluating market and regulatory conditions that could affect the Company’s ability to generate sufficient returns on capital investments. CSX may revise its future estimates for capital spending as a result of changes in business conditions, tax legislation or the enactment of new laws or regulations, which could have a material adverse effect on the Company’s operations and financial performance in the future (see Risk Factors under Item 1A of this Form 10-K).
The Company also uses cash for scheduled payments of debt and leases, share repurchases and to pay dividends to shareholders. On February 12, 2020, the Company's Board of Directors authorized an 8% increase in the quarterly cash dividend to $0.26 per common share.
Material Changes in the Consolidated Balance Sheets and Working Capital
CSX's balance sheet reflects its strong capital base and the impact of CSX's balanced approach in deploying capital for the benefit of its shareholders, which includes investments in infrastructure, dividend payments and share repurchases. Further, CSX is well positioned from a liquidity standpoint. The Company ended the year with $2.0 billion of cash, cash equivalents and short-term investments.
Total assets as well as total liabilities and shareholders' equity increased $1.5 billion from prior year. The increase in assets was primarily due to the net increase in short-term investments of $743 million, the right-of-use lease asset of $532 million resulting from the adoption of the new lease accounting standard, and property additions net of retirements of $295 million. The increase in total liabilities and shareholders' equity combined was driven by net earnings of $3.3 billion, the issuance of $2.0 billion in long-term debt and the total lease liability of $550 million resulting from the adoption of the new lease accounting standard. These increases were partially offset by share repurchases of $3.4 billion and dividends paid of $763 million.
Working capital is considered a measure of a company’s ability to meet its short-term needs. CSX had a working capital surplus of $1.1 billion at December 2019 and $650 million at December 2018. The increase in current assets was primarily driven by cash proceeds from the $2.0 billion issuance of long-term debt, partially offset by dividend payments of $763 million and the early redemption of long-term debt originally due October 2020 of $500 million. The increase in current assets was offset by an increase in current liabilities primarily due to the reclassification of $245 million from long-term debt to current maturities of long-term debt.
The Company’s working capital balance varies due to factors such as the timing of scheduled debt payments and changes in cash and cash equivalent balances as discussed above. Although the Company currently has a surplus, a working capital deficit is not unusual for CSX or other companies in the industry and does not indicate a lack of liquidity. The Company continues to maintain adequate current assets to satisfy current liabilities and maturing obligations when they come due. Furthermore, CSX has sufficient financial capacity, including its revolving credit facility, commercial paper program and shelf registration statement to manage its day-to-day cash requirements and any anticipated obligations. The Company from time to time accesses the credit markets for additional liquidity.
Credit Ratings
Credit ratings reflect an independent agency’s judgment on the likelihood that a borrower will repay a debt obligation at maturity. The ratings reflect many considerations, such as the nature of the borrower’s industry and its competitive position, the size of the company, its liquidity and access to capital and the sensitivity of a company’s cash flows to changes in the economy. The two largest rating agencies, Standard & Poor’s Ratings Services (“S&P”) and Moody’s Investors Service (“Moody’s”), use alphanumeric codes to designate their ratings. The highest quality rating for long-term credit obligations is AAA and Aaa for S&P and Moody’s, respectively. A credit rating is not a recommendation to buy, sell or hold securities and may be subject to revision or withdrawal at any time by the assigning rating agency.
CSX 2019 Form 10-K p. 34
CSX CORPORATION
PART II
The cost and availability of unsecured financing are materially affected by CSX's long-term credit ratings. CSX's credit ratings remained stable during 2019. As of December 2019 and December 2018, S&P's long-term rating on CSX was BBB+ (Stable), and Moody's was Baa1 (Stable). Ratings of BBB- and Baa3 or better by S&P and Moody’s, respectively, reflect ratings on debt obligations that fall within a band of credit quality considered to be investment grade. If CSX's credit ratings were to decline to below investment grade levels, the Company could experience significant increases in its interest cost for new debt. In addition, a decline in CSX’s credit ratings to below investment grade levels could adversely affect the market’s demand, and thus the Company’s ability to readily issue new debt.
CSX is committed to returning cash to shareholders and maintaining an investment grade credit profile. Capital structure, capital investments and cash distributions, including dividends and share repurchases, are reviewed at least annually by the Board of Directors.
SCHEDULE OF CONTRACTUAL OBLIGATIONS AND COMMERCIAL COMMITMENTS
The following tables set forth maturities of the Company's contractual obligations and other significant commitments:
Type of Obligation | 2020 | 2021 | 2022 | 2023 | 2024 | Thereafter | Total | ||||||||||||||
(Dollars in Millions) (Unaudited) | |||||||||||||||||||||
Contractual Obligations | |||||||||||||||||||||
Total Debt (See Note 10) | $ | 245 | $ | 401 | $ | 162 | $ | 639 | $ | 551 | $ | 14,240 | $ | 16,238 | |||||||
Interest on Debt | 720 | 700 | 686 | 672 | 649 | 10,629 | 14,056 | ||||||||||||||
Purchase Obligations (See Note 8) | 292 | 197 | 229 | 254 | 290 | 2,448 | 3,710 | ||||||||||||||
Other Post-Employment Benefits (See Note 9) (a) | 37 | 29 | 26 | 25 | 25 | 108 | 250 | ||||||||||||||
Operating Leases - Net (See Note 7) | 58 | 54 | 48 | 39 | 37 | 1,208 | 1,444 | ||||||||||||||
Agreements with Conrail (b) | 29 | 29 | 29 | 29 | 22 | — | 138 | ||||||||||||||
Total Contractual Obligations | $ | 1,381 | $ | 1,410 | $ | 1,180 | $ | 1,658 | $ | 1,574 | $ | 28,633 | $ | 35,836 | |||||||
Other Commitments (c) | $ | 78 | $ | 2 | $ | 2 | $ | — | $ | — | $ | — | $ | 82 | |||||||
(a) Other post-employment benefits include estimated other post-retirement medical and life insurance payments and payments under non-qualified pension plans which are unfunded. No amounts are included for funded pension obligations as no contributions are currently required.
(b) Agreements with Conrail represent minimum future payments of $138 million under the shared asset area agreements (see Note 15, Related Party Transactions).
(c) Other commitments of $82 million consisted of surety bonds, letters of credit, uncertain tax positions and public private partnerships. Surety bonds of $36 million and letters of credit of $27 million arise from assurances issued by a third-party that CSX will fulfill certain obligations and are typically a contract, state, federal or court requirement. Uncertain tax positions of $13 million, which include interest and penalties, are all included in year 2020 as the year of settlement cannot be reasonably estimated. Contractual commitments related to public-private partnerships are $6 million.
CSX 2019 Form 10-K p. 35
CSX CORPORATION
PART II
OFF-BALANCE SHEET ARRANGEMENTS
For detailed information about the Company’s guarantees, operating leases and purchase obligations, see Note 8, Commitments and Contingencies. There are no off-balance sheet arrangements that are reasonably likely to have a material effect on the Company’s financial condition, results of operations or liquidity.
LABOR AGREEMENTS
Approximately 17,000 of the Company's nearly 21,000 employees are members of a labor union. In November 2019, notices were served to the 13 rail unions that participate in national bargaining to begin negotiations for benefits, wages and work rules for the next labor bargaining round for 2020. Current agreements remain in place until modified by these negotiations. Typically, such negotiations take several years before agreements are reached.
CRITICAL ACCOUNTING ESTIMATES
The preparation of financial statements in conformity with accounting principles generally accepted in the United States requires that management make estimates in reporting the amounts of certain assets and liabilities, the disclosure of contingent assets and liabilities at the date of the financial statements and certain revenues and expenses during the reporting period. Actual results may differ from those estimates. These estimates and assumptions are discussed with the Audit Committee of the Board of Directors on a regular basis. Significant estimates using management judgment are made for the following areas:
• | personal injury, environmental and legal reserves; |
• | pension and post-retirement medical plan accounting; and |
• | depreciation policies for assets under the group-life method. |
Personal Injury, Environmental and Legal Reserves
Personal Injury
Personal Injury reserves of $129 million and $143 million for 2019 and 2018, respectively, represent liabilities for employee work-related and third-party injuries. CSXT retains an independent actuary to assist management in assessing the value of personal injury claims. The methodology used by the actuary includes a development factor to reflect growth or reduction in the value of these personal injury claims. It is based largely on CSXT's historical claims and settlement experience. Actual results may vary from estimates due to the number, type and severity of the injury, costs of medical treatments and uncertainties in litigation. For additional details, including a description of our related accounting policies, see Note 5, Casualty, Environmental and Other Reserves in the consolidated financial statements.
CSX 2019 Form 10-K p. 36
CSX CORPORATION
PART II
Critical Accounting Estimates, continued
Environmental
Environmental reserves were $74 million and $80 million in 2019 and 2018, respectively. The Company is a party to various proceedings related to environmental issues, including administrative and judicial proceedings involving private parties and regulatory agencies. The Company has been identified as a potentially responsible party at approximately 220 environmentally impaired sites. The Company reviews its potential liability with respect to each site identified, giving consideration to a number of factors such as:
• | type of clean-up required; |
• | nature of the Company’s alleged connection to the location (e.g., generator of waste sent to the site or owner or operator of the site); |
• | extent of the Company’s alleged connection (e.g., volume of waste sent to the location and other relevant factors); and |
• | number, connection and financial viability of other named and unnamed potentially responsible parties at the location. |
Conditions that are currently unknown could, at any given location, result in additional exposure, the amount and materiality of which cannot presently be reasonably estimated. For additional details, including a description of our related accounting policies, see Note 5, Casualty, Environmental and Other Reserves in the consolidated financial statements.
Legal
The Company is involved in litigation incidental to its business and is a party to a number of legal actions and claims, various governmental proceedings and private civil lawsuits. The Company evaluates all exposures relating to legal liabilities at least quarterly and adjusts reserves when appropriate. The amount of a particular reserve may be influenced by factors that include official rulings, newly discovered or developed evidence, or changes in laws, regulations and evidentiary standards. An unexpected adverse resolution of one or more of these items could have a material adverse effect on the Company's financial condition, results of operations or liquidity in that particular period. For additional details, including a description of our related accounting policies, see Note 5, Casualty, Environmental and Other Reserves in the consolidated financial statements. Additionally, see Item 3. Legal Proceedings for further discussion of these items.
Pension and Post-retirement Medical Plan Accounting
The Company sponsors defined benefit pension plans principally for salaried, management personnel. For employees hired prior to 2003, the plans provide eligible employees with retirement benefits based predominantly on years of service and compensation rates near retirement. For employees hired in 2003 or thereafter, benefits are determined based on a cash balance formula, which provides benefits by utilizing interest and pay credits based upon age, service and compensation. Beginning in 2020, the CSX Pension Plan is closed to new participants. As of December 2019, the projected benefit obligation for the Company’s pension plans was $3.1 billion.
In addition to these plans, the Company sponsors a post-retirement medical plan and a non-contributory life insurance plan that provide certain benefits to full-time, salaried, management employees, hired prior to 2003, upon their retirement if certain eligibility requirements are met. Beginning in 2019, both the life insurance benefit for eligible active employees and health savings account contributions made by the Company to eligible retirees younger than 65 were eliminated. Beginning in 2020, the employer-funded health reimbursement arrangements for eligible retirees 65 years or older were eliminated. As a result of these plan amendments, the Company recognized a decrease in 2018 of $102 million in the post-retirement benefit liability. As of December 2019, the projected benefit obligation for the Company’s other post-retirement benefit plans was $117 million.
CSX 2019 Form 10-K p. 37
CSX CORPORATION
PART II
Critical Accounting Estimates, continued
For information related to the funded status of the Company's pension and other post-retirement benefit plans, see Note 9, Employee Benefit Plans.
The accounting for these plans is subject to the guidance provided in the Compensation-Retirement Benefits Topic in the ASC. This rule requires that management make certain assumptions relating to the following:
• | discount rates used to measure future obligations and interest expense; |
• | long-term rate of return on plan assets; |
• | salary scale inflation rates; and |
• | other assumptions. |
The Company engages independent actuaries to compute the amounts of liabilities and expenses relating to these plans subject to the assumptions that the Company determines are appropriate based on historical trends, current market rates and future projections. These amounts are reviewed by management.
Discount Rates
Discount rates affect the amount of liability recorded and the service and interest cost components of pension and post-retirement expense. Discount rates reflect the rates at which pension and other post-retirement benefits could be effectively settled, or in other words, how much it would cost the Company to buy enough high quality bonds to generate cash flow equal to the Company's expected future benefit payments. The Company determines the discount rate based on the market yield as of year-end for high quality corporate bonds whose maturities match the plans' expected benefit payments.
The Company measures the service and interest cost components of the net pension and post-retirement benefits expense by using individual spot rates matched with separate cash flows for each future year. Under the spot rate approach, individual spot discount rates along the same high quality corporate bonds yield curve used to measure the pension and post-retirement benefit liabilities are applied to the relevant projected cash flows at the relevant maturity.
The weighted average discount rates used by the Company to value its 2019 pension and post-retirement obligations are 3.13 percent and 2.87 percent, respectively. For 2018, the weighted average discount rates used by the Company to value its pension and post-retirement obligations were 4.24 percent and 3.98 percent, respectively. Discount rates may differ for pension and post-retirement benefits due to varying duration of the liabilities for projected payments for each plan. As of December 2019, the estimated duration of pensions and post-retirement benefits is approximately 12 years and 7 years, respectively.
Each year, these discount rates are reevaluated and adjusted using the current market interest rates for high quality corporate bonds to reflect the best estimate of the current effective settlement rates. In general, if interest rates decline or rise, the assumed discount rates will change.
CSX 2019 Form 10-K p. 38
CSX CORPORATION
PART II
Critical Accounting Estimates, continued
Long-term Rate of Return on Plan Assets
The expected long-term average rate of return on plan assets reflects the average rate of earnings expected on the funds invested, or to be invested, to provide for benefits included in the projected benefit obligation. In estimating that rate, the Company gives appropriate consideration to the returns being earned by the plan assets in the funds and the rates of return expected to be available for reinvestment as well as the current and projected asset mix of the funds. Management balances market expectations obtained from various investment managers and economists with both market and actual plan historical returns to develop a reasonable estimate of the expected long-term rate of return on assets. As this assumption is long-term, the annual review may result in less frequent adjustment than other assumptions used in pension accounting. The long-term rate of return on plan assets used by the Company to value its benefit cost for the subsequent plan year was 6.75 percent in both 2019 and 2018.
Salary Scale Inflation Rates
Salary scale inflation rates are based on current trends and historical data accumulated by the Company. The Company reviews recent wage increases and management incentive compensation payments over the past five years in its assessment of salary scale inflation rates. The Company used a salary scale rate of 4.60 percent in both 2019 and 2018 to value its pension obligations.
Other Assumptions
The calculations made by the actuaries also include assumptions relating to health care cost trend rates, mortality rates, turnover and retirement age. These assumptions are based upon historical data, recent plan experience and industry trends and are determined by management.
2020 Estimated Pension and Post-retirement Expense
Net periodic pension and post-retirement benefits expenses for 2020 are expected to be a $5 million expense and a $2 million credit, respectively. Net periodic pension and post-retirement benefits expenses for 2020 are expected to include service cost expense of $40 million and $1 million, respectively. Service cost expense is included in labor and fringe on the consolidated income statement and all other components of net pension expense and post-retirement benefits expense are included in other income - net. Net periodic pension expense and post-retirement benefits expense in 2019 were credits of $7 million and $4 million, respectively. The net increase in the expected expense is primarily due to impacts from the decline in discount rates, partially offset by favorable pension asset experience.
The following sensitivity analysis illustrates the effects of a one percent change in certain assumptions like discount rates, long-term rate of return and salaries on the 2020 estimated pension and post-retirement expense:
(Dollars in Millions) | Pension Expense | Post-Retirement Expense | ||||||
Discount Rate | $ | 13 | $ | — | ||||
Long-term Rate of Return | $ | 26 | N/A | |||||
Salary Inflation | $ | 6 | N/A | |||||
CSX 2019 Form 10-K p. 39
CSX CORPORATION
PART II
Critical Accounting Estimates, continued
Depreciation Policies for Assets Utilizing the Group-Life Method
The depreciable assets of the Company are depreciated using either the group-life or straight-line method of accounting, which are both acceptable depreciation methods in accordance with GAAP. The Company depreciates its railroad assets, including main-line track, locomotives and freight cars, using the group-life method of accounting. Assets depreciated under the group-life method comprise 87% of total fixed assets of $45 billion on a gross basis at December 31, 2019. The remaining depreciable assets of the Company, including non-railroad assets and assets under finance leases, are depreciated using the straight-line method on a per asset basis. Land is not depreciated.
Management performs a review of depreciation expense and useful lives on a regular basis. Under the group-life method, the service lives and salvage values for each group of assets are determined by completing periodic depreciation studies and applying management’s methods to determine the service lives of its properties. There are several factors taken into account during the depreciation study and they include:
• | statistical analysis of historical life and salvage data for each group of property; |
• | statistical analysis of historical retirements for each group of property; |
• | evaluation of current operations; |
• | evaluation of technological advances and maintenance schedules; |
• | previous assessment of the condition of the assets; |
• | management's outlook on the future use of certain asset groups; |
• | expected net salvage to be received upon retirement; and |
• | comparison of assets to the same asset groups with other companies. |
In 2019, the Company completed a depreciation study for its equipment assets which resulted in changes to accumulated depreciation, service lives, salvage values, and other related factors for certain assets. The effect of this change in estimate was not material to depreciation expense in 2019. The continued impacts of the study are expected to result in additional depreciation expense of approximately $30 million in 2020. There were no depreciation studies in 2018 or 2017. A one percent change in the average estimated useful life of all group-life assets would result in an approximate $12 million change to the Company’s annual depreciation expense. For additional details, including a more detailed description of our related accounting policies, see Note 6, Properties in the consolidated financial statements.
New Accounting Pronouncements and Changes in Accounting Policy
See Note 1, Nature of Operations and Significant Accounting Policies under the caption, “New Accounting Pronouncements and Changes in Accounting Policy.”
CSX 2019 Form 10-K p. 40
CSX CORPORATION
PART II
FORWARD-LOOKING STATEMENTS
Certain statements in this report and in other materials filed with the Securities and Exchange Commission, as well as information included in oral statements or other written statements made by the Company, are forward-looking statements. The Company intends for all such forward-looking statements to be covered by the safe harbor provisions for forward-looking statements within the meaning of the Private Securities Litigation Reform Act of 1995 and the provisions of Section 27A of the Securities Act of 1933 and Section 21E of the Securities Exchange Act of 1934. These forward-looking statements within the meaning of the Private Securities Litigation Reform Act may contain, among others, statements regarding:
• | projections and estimates of earnings, revenues, margins, volumes, rates, cost-savings, expenses, taxes or other financial items; |
• | expectations as to results of operations and operational initiatives; |
• | expectations as to the effect of claims, lawsuits, environmental costs, commitments, contingent liabilities, labor negotiations or agreements on the Company's financial condition, results of operations or liquidity; |
• | management's plans, strategies and objectives for future operations, capital expenditures, workforce levels, dividends, share repurchases, safety and service performance, proposed new services and other matters that are not historical facts, and management's expectations as to future performance and operations and the time by which objectives will be achieved; and |
• | future economic, industry or market conditions or performance and their effect on the Company's financial condition, results of operations or liquidity. |
Forward-looking statements are typically identified by words or phrases such as "will," "should," “believe,” “expect,” “anticipate,” “project,” “estimate,” “preliminary” and similar expressions. The Company cautions against placing undue reliance on forward-looking statements, which reflect its good faith beliefs with respect to future events and are based on information currently available to it as of the date the forward-looking statement is made. Forward-looking statements should not be read as a guarantee of future performance or results and will not necessarily be accurate indications of the timing when, or by which, such performance or results will be achieved.
Forward-looking statements are subject to a number of risks and uncertainties and actual performance or results could differ materially from those anticipated by any forward-looking statements. The Company undertakes no obligation to update or revise any forward-looking statement. If the Company does update any forward-looking statement, no inference should be drawn that the Company will make additional updates with respect to that statement or any other forward-looking statements.
CSX 2019 Form 10-K p. 41
CSX CORPORATION
PART II
The following important factors, in addition to those discussed in Part II, Item 1A. Risk Factors and elsewhere in this report, may cause actual results to differ materially from those contemplated by any forward-looking statements:
• | legislative, regulatory or legal developments involving transportation, including rail or intermodal transportation, the environment, hazardous materials, taxation, international trade and initiatives to further regulate the rail industry; |
• | the outcome of litigation, claims and other contingent liabilities, including, but not limited to, those related to fuel surcharge, environmental matters, taxes, shipper and rate claims subject to adjudication, personal injuries and occupational illnesses; |
• | changes in domestic or international economic, political or business conditions, including those affecting the transportation industry (such as the impact of industry competition, conditions, performance and consolidation, as well as the impact of international trade agreements and tariffs) and the level of demand for products carried by CSXT; |
• | natural events such as severe weather conditions, including floods, fire, hurricanes and earthquakes, a pandemic crisis affecting the health of the Company's employees, its shippers or the consumers of goods, or other unforeseen disruptions of the Company's operations, systems, property, equipment or supply chain; |
• | competition from other modes of freight transportation, such as trucking, and competition and consolidation or financial distress within the transportation industry generally; |
• | the cost of compliance with laws and regulations that differ from expectations (including those associated with PTC implementation) as well as costs, penalties and operational and liquidity impacts associated with noncompliance with applicable laws or regulations; |
• | the impact of increased passenger activities in capacity-constrained areas, including potential effects of high speed rail initiatives, or regulatory changes affecting when CSXT can transport freight or service routes; |
• | unanticipated conditions in the financial markets that may affect timely access to capital markets and the cost of capital, as well as management's decisions regarding share repurchases; |
• | changes in fuel prices, surcharges for fuel and the availability of fuel; |
• | the impact of natural gas prices on coal-fired electricity generation; |
• | the impact of global supply and price of seaborne coal on CSX's export coal market; |
• | availability of insurance coverage at commercially reasonable rates or insufficient insurance coverage to cover claims or damages; |
• | the inherent business risks associated with safety and security, including the transportation of hazardous materials or a cybersecurity attack which would threaten the availability and vulnerability of information technology; |
• | adverse economic or operational effects from actual or threatened war or terrorist activities and any governmental response; |
CSX 2019 Form 10-K p. 42
CSX CORPORATION
PART II
• | loss of key personnel or the inability to hire and retain qualified employees; |
• | labor and benefit costs and labor difficulties, including stoppages affecting either the Company's operations or customers' ability to deliver goods to the Company for shipment; |
• | the Company's success in implementing its strategic, financial and operational initiatives; |
• | the impact of conditions in the real estate market on the Company's ability to sell assets; |
• | changes in operating conditions and costs or commodity concentrations; and |
• | the inherent uncertainty associated with projecting economic and business conditions. |
Other important assumptions and factors that could cause actual results to differ materially from those in the forward-looking statements are specified elsewhere in this report and in CSX's other SEC reports, which are accessible on the SEC's website at www.sec.gov and the Company's website at www.csx.com. The information on the CSX website is not part of this annual report on Form 10-K.
Item 7A. Quantitative and Qualitative Disclosures about Market Risk
CSX does not hold or issue derivative financial instruments for trading purposes. Historically, the Company has used derivative financial instruments to address market risk exposure to fluctuations in interest rates. As of December 2019, CSX does not have a material amount of floating rate debt obligations outstanding, and therefore fluctuations in the interest rate would not have a material impact on the Company's financial condition, results of operations or liquidity.
Changes in interest rates could impact the fair value of the Company's fixed rate long-term debt. The potential decrease in fair value of the Company's fixed rate long-term debt resulting from a hypothetical 10% increase in interest rates, or approximately 25 basis points, is estimated to be $498 million as of December 31, 2019 and $472 million as of December 31, 2018. The underlying fair values of our long-term debt were estimated based on quoted market prices or on the current rates offered for debt with similar terms and maturities.
CSX 2019 Form 10-K p. 43
CSX CORPORATION
PART II
Item 8. Financial Statements and Supplementary Data
INDEX TO CONSOLIDATED FINANCIAL STATEMENTS | ||
Page | ||
Report of Independent Registered Public Accounting Firm | ||
CSX Corporation | ||
Consolidated Financial Statements and Notes to Consolidated Financial Statements | ||
Herewith: | ||
Consolidated Income Statements for the Fiscal Years Ended: | ||
December 31, 2019 | ||
December 31, 2018 | ||
December 31, 2017 | ||
Consolidated Comprehensive Income Statements for the Fiscal Years Ended: | ||
December 31, 2019 | ||
December 31, 2018 | ||
December 31, 2017 | ||
Consolidated Balance Sheets as of: | ||
December 31, 2019 | ||
December 31, 2018 | ||
Consolidated Cash Flow Statements for Fiscal Years Ended: | ||
December 31, 2019 | ||
December 31, 2018 | ||
December 31, 2017 | ||
Consolidated Statements of Changes in Shareholders' Equity: | ||
December 31, 2019 | ||
December 31, 2018 | ||
December 31, 2017 | ||
Notes to Consolidated Financial Statements | ||
CSX 2019 Form 10-K p. 44
CSX CORPORATION
PART II
Item 8. Financial Statements and Supplementary Data
REPORT OF INDEPENDENT REGISTERED PUBLIC ACCOUNTING FIRM
To the Shareholders and the Board of Directors of CSX Corporation
Opinion on the Financial Statements
We have audited the accompanying consolidated balance sheets of CSX Corporation (the Company) as of December 31, 2019 and 2018, and the related consolidated statements of income, comprehensive income, cash flows, and changes in shareholders’ equity for each of the three years in the period ended December 31, 2019, and the related notes (collectively referred to as the “consolidated financial statements”). In our opinion, the consolidated financial statements present fairly, in all material respects, the financial position of the Company at December 31, 2019 and 2018, and the results of its operations and its cash flows for each of the three years in the period ended December 31, 2019, in conformity with U.S. generally accepted accounting principles.
We also have audited, in accordance with standards of the Public Company Accounting Oversight Board (United States) (PCAOB), the Company’s internal control over financial reporting as of December 31, 2019, based on criteria established in Internal Control-Integrated Framework issued by the Committee of Sponsoring Organizations of the Treadway Commission (2013 framework), and our report dated February 12, 2020 expressed an unqualified opinion thereon.
Basis for Opinion
These financial statements are the responsibility of the Company's management. Our responsibility is to express an opinion on the Company’s financial statements based on our audits. We are a public accounting firm registered with the PCAOB and are required to be independent with respect to the Company in accordance with the U.S. federal securities laws and the applicable rules and regulations of the Securities and Exchange Commission and the PCAOB.
We conducted our audits in accordance with the standards of the PCAOB. Those standards require that we plan and perform the audit to obtain reasonable assurance about whether the financial statements are free of material misstatement, whether due to error or fraud. Our audits included performing procedures to assess the risks of material misstatement of the financial statements, whether due to error or fraud, and performing procedures that respond to those risks. Such procedures included examining, on a test basis, evidence regarding the amounts and disclosures in the financial statements. Our audits also included evaluating the accounting principles used and significant estimates made by management, as well as evaluating the overall presentation of the financial statements. We believe that our audits provide a reasonable basis for our opinion.
Critical Audit Matters
The critical audit matter communicated below is a matter arising from the current period audit of the financial statements that was communicated or required to be communicated to the audit committee and that: (1) relates to accounts or disclosures that are material to the financial statements and (2) involved our especially challenging, subjective, or complex judgments. The communication of the critical audit matter does not alter in any way our opinion on the consolidated financial statements, taken as a whole, and we are not, by communicating the critical audit matter below providing a separate opinion on the critical audit matter or on the accounts or disclosure to which it relates.
CSX 2019 Form 10-K p. 45
CSX CORPORATION
PART II
Item 8. Financial Statements and Supplementary Data
REPORT OF INDEPENDENT REGISTERED PUBLIC ACCOUNTING FIRM, continued
Depreciation Policies for Assets Utilizing the Group-Life Method | |||
Description of the Matter | At December 31, 2019, assets depreciated under the group-life method comprised 87% of total gross fixed assets of $45 billion. As discussed in Note 6 of the consolidated financial statements, the group-life method aggregates assets with similar lives and characteristics into groups and depreciates each of these groups as a whole. When using the group-life method, an underlying assumption is that each group of assets, as a whole, is used and depreciated to the end of the group’s recoverable life. The Company utilizes different depreciable asset categories to account for depreciation expense for the railroad assets that are depreciated under the group-life method. Under the group-life method, depreciation studies are completed to review asset service lives, salvage values, accumulated depreciation and other factors related to group assets. Depreciation studies are performed every three years for equipment assets and every six years for road and track assets. A depreciation study was performed in 2019 for equipment assets and 2014 for road and track assets. The most recent depreciation studies are reviewed by management each year to determine if there have been significant factors that result in changes to the group-life method key assumptions. Auditing depreciation expense for assets subject to the group-life method was complex and required the involvement of specialists due to the nature of the methods used in the depreciation studies to determine the useful service lives and salvage values of the Company’s assets. These methods have a significant effect on depreciation expense. | ||
How We Addressed the Matter in Our Audit | We obtained an understanding, evaluated the design and tested the operating effectiveness of controls over the Company’s process related to the assessment of periodic depreciation studies of its group-life assets. For example, we tested controls over management’s review of the depreciation study for equipment assets and review of depreciation expense and useful lives. We also tested controls over management’s review of asset activity and assumptions that could impact the most recent depreciation study of road and track assets. To test the estimated useful lives and salvage values of the Company’s group-life assets, we performed audit procedures that included, among others: obtaining the periodic depreciation studies provided by the Company’s third-party specialist and subsequent updates by management; assessing the completeness and accuracy of the data provided to the third-party specialist and used by management; and including a specialist on our team to evaluate the methods used by the third-party specialist and management in determining the average service lives and salvage values of assets to perform the depreciation studies. We compared the significant methods used by management to those used throughout the industry and within other useful life studies. We also assessed the historical accuracy of management’s estimates via retrospective review and independently calculated a sample of the annual depreciation rates. | ||
/s/ Ernst & Young LLP
We have served as the Company’s auditor since 1981.
Jacksonville, Florida
February 12, 2020
CSX 2019 Form 10-K p. 46
CSX CORPORATION
PART II
Item 8. Financial Statements and Supplementary Data
CONSOLIDATED INCOME STATEMENTS
(Dollars in Millions, Except Per Share Amounts)
Fiscal Years | |||||||||||
2019 | 2018 | 2017 | |||||||||
Revenue | $ | $ | $ | ||||||||
Expense | |||||||||||
Labor and Fringe | |||||||||||
Materials, Supplies and Other | |||||||||||
Depreciation | |||||||||||
Fuel | |||||||||||
Equipment and Other Rents | |||||||||||
Restructuring Charge (Note 1) | |||||||||||
Equity Earnings of Affiliates | ( | ) | ( | ) | ( | ) | |||||
Total Expense | |||||||||||
Operating Income | |||||||||||
Interest Expense | ( | ) | ( | ) | ( | ) | |||||
Restructuring Charge - Non-Operating (Note 1) | ( | ) | |||||||||
Other Income - Net (Note 14) | |||||||||||
Earnings Before Income Taxes | |||||||||||
Income Tax (Expense) Benefit (Note 12) | ( | ) | ( | ) | |||||||
Net Earnings | $ | $ | $ | ||||||||
Per Common Share (Note 2) | |||||||||||
Net Earnings Per Share | |||||||||||
Basic | $ | $ | $ | ||||||||
Assuming Dilution | $ | $ | $ | ||||||||
Average Common Shares Outstanding (Millions) | |||||||||||
Basic | |||||||||||
Assuming Dilution | |||||||||||
See accompanying Notes to Consolidated Financial Statements.
CSX 2019 Form 10-K p. 47
CSX CORPORATION
PART II
Item 8. Financial Statements and Supplementary Data
CONSOLIDATED COMPREHENSIVE INCOME STATEMENTS
(Dollars in Millions)
Fiscal Years | |||||||||
2019 | 2018 | 2017 | |||||||
Net Earnings | $ | $ | $ | ||||||
Other Comprehensive (Loss) Income - Net of Tax: | |||||||||
Pension and Other Post-Employment Benefits | ( | ) | ( | ) | |||||
Other | ( | ) | |||||||
Total Other Comprehensive (Loss) Income | ( | ) | ( | ) | |||||
Comprehensive Earnings (Note 16) | $ | $ | $ | ||||||
See accompanying Notes to Consolidated Financial Statements.
CSX 2019 Form 10-K p. 48
CSX CORPORATION
PART II
Item 8. Financial Statements and Supplementary Data
CONSOLIDATED BALANCE SHEETS
(Dollars in Millions)
December | December | ||||||
2019 | 2018 | ||||||
ASSETS | |||||||
Current Assets: | |||||||
Cash and Cash Equivalents (Note 1) | $ | $ | |||||
Short-term Investments | |||||||
Accounts Receivable - Net (Note 1) | |||||||
Materials and Supplies | |||||||
Other Current Assets | |||||||
Total Current Assets | |||||||
Properties | |||||||
Accumulated Depreciation | ( | ) | ( | ) | |||
Properties - Net (Note 6) | |||||||
Investment in Conrail (Note 15) | |||||||
Affiliates and Other Companies | |||||||
Right of Use Lease Asset (Note 7) | |||||||
Other Long-term Assets | |||||||
Total Assets | $ | $ | |||||
LIABILITIES AND SHAREHOLDERS' EQUITY | |||||||
Current Liabilities: | |||||||
Accounts Payable | $ | $ | |||||
Labor and Fringe Benefits Payable | |||||||
Casualty, Environmental and Other Reserves (Note 5) | |||||||
Current Maturities of Long-term Debt (Note 10) | |||||||
Income and Other Taxes Payable | |||||||
Other Current Liabilities | |||||||
Total Current Liabilities | |||||||
Casualty, Environmental and Other Reserves (Note 5) | |||||||
Long-term Debt (Note 9) | |||||||
Deferred Income Taxes - Net (Note 12) | |||||||
Long-term Lease Liability (Note 7) | |||||||
Other Long-term Liabilities | |||||||
Total Liabilities | |||||||
Shareholders' Equity: | |||||||
Common Stock, $1 Par Value (Note 3) | |||||||
Other Capital | |||||||
Retained Earnings (Note 1) | |||||||
Accumulated Other Comprehensive Loss (Note 16) | ( | ) | ( | ) | |||
Noncontrolling Minority Interest | |||||||
Total Shareholders' Equity | |||||||
Total Liabilities and Shareholders' Equity | $ | $ | |||||
See accompanying Notes to Consolidated Financial Statements.
CSX 2019 Form 10-K p. 49
CSX CORPORATION
PART II
Item 8. Financial Statements and Supplementary Data
CONSOLIDATED CASH FLOW STATEMENTS
(Dollars in Millions)
Fiscal Years | |||||||||||
2019 | 2018 | 2017 | |||||||||
OPERATING ACTIVITIES | |||||||||||
Net Earnings | $ | $ | $ | ||||||||
Adjustments to Reconcile Net Earnings to Net Cash | |||||||||||
Provided by Operating Activities: | |||||||||||
Depreciation | |||||||||||
Restructuring Charge (Note 1) | |||||||||||
Cash Payments for Restructuring Charge | ( | ) | ( | ) | |||||||
Deferred Income Taxes | ( | ) | |||||||||
Earnings of Equity-method Investments | ( | ) | ( | ) | ( | ) | |||||
Gain on Property Dispositions | ( | ) | ( | ) | ( | ) | |||||
Other Operating Activities | ( | ) | ( | ) | |||||||
Changes in Operating Assets and Liabilities: | |||||||||||
Accounts Receivable | ( | ) | ( | ) | |||||||
Other Current Assets | |||||||||||
Accounts Payable | |||||||||||
Income and Other Taxes Payable | ( | ) | |||||||||
Other Current Liabilities | ( | ) | ( | ) | |||||||
Net Cash Provided by Operating Activities | |||||||||||
INVESTING ACTIVITIES | |||||||||||
Property Additions | ( | ) | ( | ) | ( | ) | |||||
Purchase of Short-term Investments | ( | ) | ( | ) | ( | ) | |||||
Proceeds from Sales of Short-term Investments | |||||||||||
Proceeds from Property Dispositions | |||||||||||
Other Investing Activities | ( | ) | |||||||||
Net Cash Used in Investing Activities | ( | ) | ( | ) | ( | ) | |||||
FINANCING ACTIVITIES | |||||||||||
Long-term Debt Issued (Note 10) | |||||||||||
Long-term Debt Repaid (Note 10) | ( | ) | ( | ) | ( | ) | |||||
Dividends Paid | ( | ) | ( | ) | ( | ) | |||||
Shares Repurchased | ( | ) | ( | ) | ( | ) | |||||
Other Financing Activities | ( | ) | ( | ) | |||||||
Net Cash Used in Financing Activities | ( | ) | ( | ) | ( | ) | |||||
Net Increase (Decrease) in Cash and Cash Equivalents | ( | ) | |||||||||
CASH AND CASH EQUIVALENTS | |||||||||||
Cash and Cash Equivalents at Beginning of Period | |||||||||||
Cash and Cash Equivalents at End of Period | $ | $ | $ | ||||||||
SUPPLEMENTAL CASH FLOW INFORMATION | |||||||||||
Interest Paid - Net of Amounts Capitalized | $ | $ | $ | ||||||||
Income Taxes Paid | $ | $ | $ | ||||||||
See accompanying Notes to Consolidated Financial Statements.
CSX 2019 Form 10-K p. 50
CSX CORPORATION
PART II
Item 8. Financial Statements and Supplementary Data
CONSOLIDATED STATEMENTS OF CHANGES
IN SHAREHOLDERS’ EQUITY
(Dollars in Millions)
Common Shares Outstanding (Thousands) | Common Stock and Other Capital | Retained Earnings | Accumulated Other Comprehensive Income (Loss) (a) | Non- controlling Minority Interest | Total Shareholders' Equity | ||||||||||||
December 30, 2016 | $ | $ | $ | ( | ) | $ | $ | ||||||||||
Comprehensive Earnings: | |||||||||||||||||
Net Earnings | — | — | — | — | |||||||||||||
Other Comprehensive Income (Note 16) | — | — | — | — | |||||||||||||
Total Comprehensive Earnings | |||||||||||||||||
Common stock dividends, $0.78 per share | — | — | ( | ) | — | — | ( | ) | |||||||||
Share Repurchases | ( | ) | ( | ) | ( | ) | — | — | ( | ) | |||||||
Other | ( | ) | — | ||||||||||||||
December 31, 2017 | ( | ) | |||||||||||||||
Comprehensive Earnings: | |||||||||||||||||
Net Earnings | — | — | — | — | |||||||||||||
Other Comprehensive Loss (Note 16) | — | — | — | ( | ) | — | ( | ) | |||||||||
Total Comprehensive Earnings | |||||||||||||||||
Common stock dividends, $0.88 per share | — | — | ( | ) | — | — | ( | ) | |||||||||
Share Repurchases | ( | ) | ( | ) | ( | ) | — | — | ( | ) | |||||||
Other | — | ||||||||||||||||
December 31, 2018 | ( | ) | |||||||||||||||
Comprehensive Earnings: | |||||||||||||||||
Net Earnings | — | — | — | — | |||||||||||||
Other Comprehensive Loss (Note 16) | — | — | — | ( | ) | — | ( | ) | |||||||||
Total Comprehensive Earnings | |||||||||||||||||
Common stock dividends, $0.96 per share | — | — | ( | ) | — | — | ( | ) | |||||||||
Share Repurchases | ( | ) | ( | ) | ( | ) | — | — | ( | ) | |||||||
Other | — | ( | ) | ||||||||||||||
December 31, 2019 | $ | $ | $ | ( | ) | $ | $ | ||||||||||
(a) Accumulated Other Comprehensive Loss year-end balances shown above are net of tax. The associated taxes were $184 million, $180 million and $162 million for 2019, 2018 and 2017, respectively. For additional information see Note 16, Other Comprehensive Income.
See accompanying Notes to Consolidated Financial Statements.
CSX 2019 Form 10-K p. 51
CSX CORPORATION
PART II
Item 8. Financial Statements and Supplementary Data
NOTES TO CONSOLIDATED FINANCIAL STATEMENTS
NOTE 1. Nature of Operations and Significant Accounting Policies
Business
CSX Corporation together with its subsidiaries ("CSX" or the “Company”), based in Jacksonville, Florida, is one of the nation's leading transportation companies. The Company provides rail-based transportation services including traditional rail service, the transport of intermodal containers and trailers, as well as other transportation services such as rail-to-truck transfers and bulk commodity operations.
CSX Transportation, Inc.
CSX’s principal operating subsidiary, CSX Transportation, Inc. (“CSXT”), provides an important link to the transportation supply chain through its approximately 20,000 route mile rail network, which serves major population centers in 23 states east of the Mississippi River, the District of Columbia and the Canadian provinces of Ontario and Quebec. It has access to over 70 ocean, river and lake port terminals along the Atlantic and Gulf Coasts, the Mississippi River, the Great Lakes and the St. Lawrence Seaway. The Company’s intermodal business links customers to railroads via trucks and terminals. CSXT also serves thousands of production and distribution facilities through track connections to more than 230 short-line and regional railroads.
CSXT is also responsible for the Company's real estate sales, leasing, acquisition and management and development activities. Substantially all of these activities are focused on supporting railroad operations.
Other Entities
In addition to CSXT, the Company’s subsidiaries include CSX Intermodal Terminals, Inc. (“CSX Intermodal Terminals”), Total Distribution Services, Inc. (“TDSI”), Transflo Terminal Services, Inc. (“Transflo”), CSX Technology, Inc. (“CSX Technology”) and other subsidiaries. CSX Intermodal Terminals owns and operates a system of intermodal terminals, predominantly in the eastern United States and also performs drayage services (the pickup and delivery of intermodal shipments) for certain customers and trucking dispatch operations. TDSI serves the automotive industry with distribution centers and storage locations. Transflo connects non-rail served customers to the many benefits of rail by transferring products from rail to trucks. The biggest Transflo markets are chemicals and agriculture, which includes shipments of plastics and ethanol. CSX Technology and other subsidiaries provide support services for the Company.
CSX 2019 Form 10-K p. 52
CSX CORPORATION
PART II
Item 8. Financial Statements and Supplementary Data
NOTE 1. Nature of Operations and Significant Accounting Policies, continued
Lines of Business
During 2019, the Company's services generated $11.9 billion of revenue and served three primary lines of business: merchandise, coal and intermodal.
• | The merchandise business shipped |
• | The coal business shipped |
• | The intermodal business shipped |
Other revenue accounted for 4 percent of the Company’s total revenue in 2019. This revenue category includes revenue from regional subsidiary railroads, demurrage, storage at intermodal facilities, revenue for customer volume commitments not met, switching, other incidental charges and adjustments to revenue reserves. Revenue from regional railroads includes shipments by railroads that the Company does not directly operate. Demurrage represents charges assessed when freight cars or other equipment are held beyond a specified period of time. Switching represents charges assessed when a railroad switches cars for a customer or another railroad.
Employees
The Company's number of employees was nearly 21,000 as of December 2019, which includes approximately 17,000 union employees. Most of the Company’s employees provide or support transportation services.
Basis of Presentation
In the opinion of management, the accompanying consolidated financial statements contain all normal, recurring adjustments necessary to fairly present the financial position of CSX and its subsidiaries at December 31, 2019 and December 31, 2018, and the consolidated statements of income, comprehensive income, cash flows and changes in shareholders’ equity for fiscal years 2019, 2018 and 2017. Where applicable, prior year information has been reclassified to conform to current presentation. In addition, management has evaluated and disclosed all material events occurring subsequent to the date of the financial statements up to the date this annual report is filed on Form 10-K.
CSX 2019 Form 10-K p. 53
CSX CORPORATION
PART II
Item 8. Financial Statements and Supplementary Data
NOTE 1. Nature of Operations and Significant Accounting Policies, continued
Fiscal Year
Through the second quarter 2017, CSX followed a 52/53 week fiscal reporting calendar with the last day of each reporting period ending on a Friday. On July 7, 2017, the Board of Directors of CSX approved a change in the fiscal reporting calendar from a 52/53 week year ending on the last Friday of December to a calendar year ending on December 31 each year, effective beginning with fiscal third quarter 2017. Related to the change in the fiscal calendar, 2019 and 2018 both contained 365 days while 2017 contained 366 days.
This change did not materially impact comparability of the Company’s financial results for fiscal year 2017. Accordingly, the change to a calendar fiscal year was made on a prospective basis and operating results for prior periods were not adjusted. The Company was not required to file a transition report because this change was not deemed a change in fiscal year for purposes of reporting subject to Rule 13a-10 or Rule 15d-10 of the Securities Exchange Act of 1934 as the new fiscal year commenced with the end of the prior fiscal year end. Except as otherwise specified, references to full years indicate CSX’s fiscal years ended on December 31, 2019, December 31, 2018 and December 31, 2017.
Principles of Consolidation
The consolidated financial statements include results of operations of CSX and subsidiaries over which CSX has majority ownership or financial control. All significant intercompany accounts and transactions have been eliminated. Most investments in companies that were not majority-owned were carried at cost (if less than 20 % owned and the Company has no significant influence) or were accounted for under the equity method (if the Company has significant influence but does not have control). These investments are reported within Investment in Conrail or Affiliates and Other Companies on the consolidated balance sheets.
Cash and Cash Equivalents
Investments
Investments in instruments with original maturities greater than three months that will mature in less than one year are classified as short-term investments. Investments with original maturities of one year or greater are initially classified within other long-term assets, and the classification is re-evaluated at each balance sheet date.
Materials and Supplies
Materials and supplies in the consolidated balance sheets are carried at average costs and consist primarily of parts used in the repair and maintenance of track structure, equipment, and CSXT’s freight car and locomotive fleets, as well as fuel.
CSX 2019 Form 10-K p. 54
CSX CORPORATION
PART II
Item 8. Financial Statements and Supplementary Data
NOTE 1. Nature of Operations and Significant Accounting Policies, continued
New Accounting Pronouncements
In February 2016, the FASB issued ASU, Leases, which requires lessees to recognize most leases on their balance sheets as a right-of-use asset with a corresponding lease liability. Lessor accounting under the standard is substantially unchanged. Additional qualitative and quantitative disclosures are also required. CSX adopted the standard effective January 1, 2019 using the cumulative-effect adjustment transition method, which applies the provisions of the standard at the effective date without adjusting the comparative periods presented. The Company adopted the following practical expedients and elected the following accounting policies related to this standard update:
• | Carry forward of historical lease classifications and current accounting treatment for existing land easements; |
• | Short-term lease accounting policy election allowing lessees to not recognize right-of-use assets and liabilities for leases with a term of 12 months or less; and |
• | The option to not separate lease and non-lease components for certain equipment lease asset categories such as freight car, vehicles and work equipment. |
Adoption of this standard resulted in the recognition of operating lease right-of-use assets and corresponding lease liabilities of $534 million on the consolidated balance sheet as of January 1, 2019. This amount is lower than previous estimates due to a lease amendment. The Company’s accounting for finance leases remained substantially unchanged. The standard did not materially impact operating results or liquidity. Disclosures related to the amount, timing and uncertainty of cash flows arising from leases are included in Note 7, Leases.
In June 2016, the FASB issued ASU Measurement of Credit Losses on Financial Instruments, which replaces current methods for evaluating impairment of financial instruments not measured at fair value, including trade accounts receivable and certain debt securities, with a current expected credit loss model. CSX adopted this new standard update effective January 1, 2020. Adoption will not have a material effect on the Company's results of operations.
Use of Estimates
The preparation of financial statements in conformity with accounting principles generally accepted in the United States requires that management make estimates in reporting the amounts of certain assets and liabilities, the disclosure of contingent assets and liabilities at the date of the financial statements and the reported amount of certain revenues and expenses during the reporting period. Actual results may differ from those estimates. Critical accounting estimates using management judgment are made for the following areas:
• | personal injury, environmental and legal reserves (see Note 5, Casualty, Environmental and Other Reserves); |
• | pension and post-retirement medical plan accounting (see Note 9, Employee Benefit Plans); and |
• | depreciation policies for assets under the group-life method (see Note 6, Properties). |
CSX 2019 Form 10-K p. 55
CSX CORPORATION
PART II
Item 8. Financial Statements and Supplementary Data
NOTE 1. Nature of Operations and Significant Accounting Policies, continued
Restructuring Charge
Through an involuntary separation program with enhanced benefits to further its strategic objectives, CSX reduced its management workforce by approximately 950 employees during 2017. The Company was focused on driving efficiencies through process improvement and responding to business mix shifts. These management reductions were designed to further streamline general and administrative and operating support functions to speed decision making and further control costs. The involuntary separation program was essentially completed in April 2017.
The restructuring charge in 2017 includes costs related to the management workforce reduction program, executive retirements, reimbursement arrangements with MR Argent Advisor LLC (“Mantle Ridge”) and the Company’s former President and Chief Executive Officer, E. Hunter Harrison, the proration of equity awards and other advisory costs related to the leadership transition. Payments related to the 2017 restructuring charge were substantially complete as of March 31, 2018.
Expenses related to the management workforce reduction and other restructuring costs totaled $325 million in 2017 and are shown in the following table.
Fiscal Year 2017 | |||||||
(Dollars in millions) | Operating Restructuring Charge | Non-Operating Restructuring Charge | |||||
Severance and Pension | $ | $ | |||||
Other Post-Retirement Benefits Curtailment | |||||||
Employee Equity Awards Proration and Other | |||||||
Subtotal Management Workforce Reduction | $ | $ | |||||
Reimbursement Arrangements | |||||||
Executive Equity Awards Proration | |||||||
Pension Settlement Charge | |||||||
Advisory Fees Related to Shareholder Matters | |||||||
Total Restructuring Charge | $ | $ | |||||
CSX 2019 Form 10-K p. 56
CSX CORPORATION
PART II
Item 8. Financial Statements and Supplementary Data
NOTE 2. Earnings Per Share
The following table sets forth the computation of basic earnings per share and earnings per share, assuming dilution:
Fiscal Years | |||||||||||
2019 | 2018 | 2017 | |||||||||
Numerator (Dollars in Millions): | |||||||||||
Net Earnings | $ | $ | $ | ||||||||
Dividend Equivalents on Restricted Stock | ( | ) | ( | ) | |||||||
Net Earnings, Attributable to Common Shareholders | $ | $ | $ | ||||||||
Denominator (Units in Millions): | |||||||||||
Average Common Shares Outstanding | |||||||||||
Other Potentially Dilutive Common Shares | |||||||||||
Average Common Shares Outstanding, Assuming Dilution | |||||||||||
Net Earnings Per Share, Basic | $ | $ | $ | ||||||||
Net Earnings Per Share, Assuming Dilution | $ | $ | $ | ||||||||
Basic earnings per share is based on the weighted-average number of shares of common stock outstanding. Earnings per share, assuming dilution, is based on the weighted-average number of shares of common stock outstanding and common stock equivalents adjusted for the effects of common stock that may be issued as a result of potentially dilutive instruments. CSX's potentially dilutive instruments are made up of equity awards including performance units and employee stock options.
Share Repurchase Programs
In January 2019, the Company announced a $5 billion share repurchase program ("January 2019 program"). At December 31, 2019, approximately $1.8 billion of authority remains under this program. Previously, share repurchases were completed under the following:
• | A share repurchase program originally announced in October 2017 for $ |
• | A share repurchase program originally announced in April 2017 for $ |
• | A $ |
CSX 2019 Form 10-K p. 57
CSX CORPORATION
PART II
Item 8. Financial Statements and Supplementary Data
NOTE 2. Earnings Per Share, continued
Share repurchases may be made through a variety of methods including, but not limited to, open market purchases, purchases pursuant to Rule 10b5-1 plans, accelerated share repurchases and negotiated block purchases. The timing of share repurchases depends upon management's assessment of marketplace conditions and other factors, and the program remains subject to the discretion of the Board of Directors. Future share repurchases are expected to be funded by cash on hand, cash generated from operations and debt issuances. Shares are retired immediately upon repurchase. In accordance with the Equity Topic in the Accounting Standards Codification ("ASC"), the excess of repurchase price over par value is recorded in retained earnings.
Share Repurchase Activity
During 2019, 2018, and 2017, CSX repurchased the following shares:
Fiscal Years | |||||||||||
2019 | 2018 | 2017 | |||||||||
Shares Repurchased (Units in Millions) | |||||||||||
Cost of Shares (Dollars in Millions) | $ | $ | $ | ||||||||
Average Price Paid per Share | $ | $ | $ | ||||||||
On October 17, 2019, the Company repurchased 4.7 million shares for $319 million from MR Argent Advisor LLC, a CSX shareholder, on behalf of certain limited partners of its affiliated funds (“Mantle Ridge”) under the January 2019 program. A member of CSX’s Board of Directors, Paul C. Hilal, founded and controls Mantle Ridge and each of its related entities. The ownership position of Mantle Ridge is detailed in the Company's Proxy Statement on Schedule 14A filed on March 22, 2019, and subsequent Form 4 filings with the SEC. Shares purchased from Mantle Ridge are included in the table above.
In August 2019, the Company entered into an agreement to repurchase shares of the Company’s common stock under the January 2019 program. Under this agreement, the Company made a prepayment of $250 million to a financial institution and settlement occurred in September 2019. At settlement, the Company received approximately 4 million shares, calculated based on the volume-weighted average price of the Company’s common stock over the term of the agreement, less a discount. Shares purchased under this agreement are included in the table above.
During 2018, the Company entered into four accelerated share repurchase agreements to repurchase shares of the Company’s common stock under the October 2017 program. Under these agreements, the Company paid $1.5 billion and received approximately 22 million total shares. Shares purchased under accelerated share repurchase agreements are included in the table above.
CSX 2019 Form 10-K p. 58
CSX CORPORATION
PART II
Item 8. Financial Statements and Supplementary Data
NOTE 3. Shareholders’ Equity
Common and preferred stock consists of the following:
Common Stock, $1 Par Value | December 2019 | |
(Units in Millions) | ||
Common Shares Authorized | ||
Common Shares Issued and Outstanding | ||
Preferred Stock | ||
Preferred Shares Authorized | ||
Preferred Shares Issued and Outstanding | ||
Holders of common stock are entitled to one vote on all matters requiring a vote for each share held. Preferred stock is senior to common stock with respect to dividends and upon liquidation of CSX.
NOTE 4. Stock Plans and Share-Based Compensation
Under CSX's share-based compensation plans, awards consist of performance units, stock options, restricted stock units and restricted stock awards for management and stock grants for directors. Awards granted under the various programs are determined and approved by the Compensation Committee of the Board of Directors or, in certain circumstances, by the full Board for awards to the Chief Executive Officer or by the Chief Executive Officer for awards to management employees other than senior executives. The Board of Directors approves awards granted to CSX's non-management directors upon recommendation of the Governance Committee.
Share-based compensation expense for awards under share-based compensation plans and purchases made as part of the employee stock purchase plan is measured using the fair value of the award on the grant date and is recognized on a straight-line basis over the service period of the respective award. Forfeitures are recognized as they occur. Total pre-tax expense and income tax benefits associated with share-based compensation are shown in the table below. Income tax benefits include impacts from option exercises and the vesting of other equity awards. Modifications to the terms of awards (see Equity Award Modifications below) impacted share-based compensation expense in 2017.
Fiscal Years | |||||||||
(Dollars in Millions) | 2019 | 2018 | 2017 | ||||||
Share-Based Compensation Expense | |||||||||
Performance Units | $ | $ | $ | ||||||
Stock Options | |||||||||
Restricted Stock Units and Awards | |||||||||
Stock Awards for Directors | |||||||||
Employee Stock Purchase Plan | |||||||||
Total Share-based Compensation Expense | $ | $ | $ | ||||||
Income Tax Benefit | $ | $ | $ | ||||||
CSX 2019 Form 10-K p. 59
CSX CORPORATION
PART II
Item 8. Financial Statements and Supplementary Data
NOTE 4. Stock Plans and Share-Based Compensation, continued
Long-term Incentive Plans
The CSX Long-term Incentive Plans (“LTIP”) were adopted under the 2010 CSX Stock and Incentive Award Plan. On May 3, 2019, shareholders approved the CSX 2019 Stock and Incentive Award Plan, under which future awards will be granted. The objective of these plans is to motivate and reward certain employees for achieving and exceeding certain financial goals. Grants were made in performance units, with each unit being equivalent to one share of CSX common stock, and payouts will be made in CSX common stock. The payout range for most participants will be between 0 % and 200 % of the target awards depending on Company performance against predetermined goals for each three-year cycle. In 2019, 2018, and 2017, target performance units were granted to certain employees under three separate LTIP plans covering three-year cycles: the 2019-2021 ("2019-2021 LTIP"), the 2018-2020 (“2018-2020 LTIP”), and the 2017-2019 (“2017-2019 LTIP”) plans.
The key financial targets for the 2017-2019 LTIP plan are based on the achievement of goals related to both operating ratio and return on assets (tax-adjusted operating income divided by net property) excluding certain items as disclosed in the Company's financial statements. The three-year cumulative operating ratio and average return on assets over the performance period will each comprise 50 % of the payout and are measured independently of the other. This plan states that payouts for certain executive officers are subject to downward adjustment by up to 30 % based upon total shareholder return relative to specified comparable groups.
Payouts of performance units for the 2018-2020 and 2019-2021 LTIP plans will be based on the achievement of goals related to both operating ratio and free cash flow, in each case excluding non-recurring items as disclosed in the Company’s financial statements. For the 2018-2020 LTIP plan, the final year operating ratio and cumulative free cash flow over the plan period will each comprise 50 % of the payout and will be measured independently of the other. For the 2019-2021 LTIP plan, the cumulative operating ratio and cumulative free cash flow over the plan period will each comprise 50 % of the payout and will be measured independently of the other. For these plans, payouts for certain executive officers are subject to formulaic upward or downward adjustment by up to 25 %, capped at an overall payout of 200 % for the 2018 plan and 250 % for the 2019 plan, based upon the Company’s total shareholder return relative to specified comparable groups over the performance period.
The fair value of the performance units awarded during the years ended December 2019 and 2018 were calculated using a Monte-Carlo simulation model with the following weighted-average assumptions:
Weighted-average assumptions used: | 2019 | 2018 | ||
Annual dividend yield | % | % | ||
Risk-free interest rate | % | % | ||
Annualized volatility | % | % | ||
Expected life (in years) | ||||
CSX 2019 Form 10-K p. 60
CSX CORPORATION
PART II
Item 8. Financial Statements and Supplementary Data
NOTE 4. Stock Plans and Share-Based Compensation, continued
Performance unit grant and vesting information is summarized as follows:
Fiscal Years | |||||||||||
2019 | 2018 | 2017 | |||||||||
Weighted-average grant date fair value | $ | $ | $ | ||||||||
Fair value of units vested in fiscal year ending (in millions) | $ | $ | $ | ||||||||
The performance unit activity related to the outstanding long-term incentive plans and corresponding fair value is summarized as follows:
Performance Units Outstanding (in Thousands) | Weighted-Average Fair Value at Grant Date | |||||
Unvested at December 31, 2018 | $ | |||||
Granted | ||||||
Forfeited | ( | ) | ||||
Vested | ( | ) | ||||
Unvested at December 31, 2019 | $ | |||||
As of December 2019, there was $23 million of total unrecognized compensation cost related to performance units that is expected to be recognized over a weighted-average period of approximately two years .
Stock Options
Stock options in 2019, 2018, and 2017 were primarily granted along with the corresponding LTIP plans. Under this program, an employee receives an award that provides the opportunity in the future to purchase CSX shares at the closing market price of the stock on the date the award is granted (the strike price). Options granted in 2019 become exercisable either in equal installments on the anniversary of the grant date over a vesting period (three-year graded), or three years after the grant date (three-year cliff), depending on the individual grant. The options granted in 2018 and 2017 vest three years after the grant date (three-year cliff). All options expire 10 years from the grant date if they are not exercised.
The fair value of stock options granted was estimated as of the dates of grant using the Black-Scholes-Merton option model which uses the following assumptions: dividend yield, risk-free interest rate, annualized volatility and expected life. The annual dividend yield is based on the most recent quarterly CSX dividend payment annualized. The risk-free interest rate is based on U.S. Treasury yield curve in effect at the time of grant. The annualized volatility is based on historical volatility of daily CSX stock price returns over a 6.1 year look-back period ending on the grant date. The expected life is calculated using the safe harbor approach due to lack of historical data on CSX options, which is the midpoint between the vesting schedule and contractual term (10 years).
In March 2017, the Company granted 9 million stock options to former CEO E. Hunter Harrison at a fair value of $12.88 per option. These options were granted with a 10-year term and an exercise price equal to the closing market price of the underlying stock on the date of grant. Upon his death in December 2017, all of Mr. Harrison's 9 million options were forfeited.
CSX 2019 Form 10-K p. 61
CSX CORPORATION
PART II
Item 8. Financial Statements and Supplementary Data
NOTE 4. Stock Plans and Share-Based Compensation, continued
Assumptions and inputs used to estimate fair value of stock options are summarized as follows:
Fiscal Years | |||||||||
2019 | 2018 | 2017 | |||||||
Weighted-average grant date fair value | $ | $ | $ | ||||||
Stock options valuation assumptions: | |||||||||
Annual dividend yield | % | % | % | ||||||
Risk-free interest rate | % | % | % | ||||||
Annualized volatility | % | % | % | ||||||
Expected life (in years) | |||||||||
Other pricing model inputs: | |||||||||
Weighted-average grant-date market price of CSX stock (strike price) | $ | $ | $ | ||||||
The stock option activity is summarized as follows:
Stock Options Outstanding (in Thousands) | Weighted-Average Exercise Price | Weighted-Average Remaining Contractual Life (in Years) | Aggregate Intrinsic Value (in Millions) | ||||||
Outstanding at December 31, 2018 | $ | ||||||||
Granted | |||||||||
Forfeited | ( | ) | |||||||
Exercised | ( | ) | |||||||
Outstanding at December 31, 2019 | $ | $ | |||||||
Exercisable at December 31, 2019 | $ | $ | |||||||
Unrecognized compensation expense related to stock options as of December 2019 was $15 million and is expected to be recognized over a weighted-average period of approximately two years . The Company issues new shares upon stock option exercises. There were no significant exercises during 2017 or 2018. Additional information on stock option exercises in 2019 is summarized as follows:
(Dollars in Millions) | 2019 | ||
Intrinsic value of stock options exercised | $ | ||
Cash received from option exercises | $ | ||
CSX 2019 Form 10-K p. 62
CSX CORPORATION
PART II
Item 8. Financial Statements and Supplementary Data
NOTE 4. Stock Plans and Share-Based Compensation, continued
Restricted Stock Grants
Restricted stock grants consist of units and awards, each equivalent to one share of CSX stock. Restricted stock units are primarily issued along with corresponding LTIP plans and vest three years after the date of grant. Separately, restricted stock awards generally vest over an employment period of up to five years . Participants receive cash dividend equivalents on the unvested shares during the restriction period. These awards are time-based and not based upon CSX’s attainment of operational targets.
Restricted stock grant and vesting information is summarized as follows:
Fiscal Years | |||||||||||
2019 | 2018 | 2017 | |||||||||
Weighted-average grant date fair value | $ | $ | $ | ||||||||
Fair value of units and awards vested during fiscal year ended (in millions) | $ | $ | $ | ||||||||
The restricted stock activity related to the outstanding long-term incentive plans and other awards and corresponding fair value is summarized as follows:
Restricted Stock Units and Awards Outstanding (in Thousands) | Weighted-Average Fair Value at Grant Date | |||||
Unvested at December 31, 2018 | $ | |||||
Granted | ||||||
Forfeited | ( | ) | ||||
Vested | ( | ) | ||||
Unvested at December 31, 2019 | $ | |||||
As of December 2019, unrecognized compensation expense for these restricted stock units and awards was approximately $8 million, which will be expensed over a weighted-average remaining period of two years .
Equity Award Modifications
In 2017, as part of an enhanced severance benefit under the management streamlining and realignment initiative discussed in Note 1, unvested performance units, restricted stock units and stock options for separated employees not eligible for retirement were permitted to vest on a pro-rata basis. Additionally, the terms of unvested equity awards for a former Chief Executive Officer, Michael J. Ward, and a former President, Clarence W. Gooden, were modified prior to their retirements on March 6, 2017 to permit prorated vesting through May 31, 2018.
The award modifications impacted approximately 75 employees and resulted in an increase to share-based compensation expense for revaluation of the affected awards of $39 million for the year ended December 31, 2017. The expense associated with these award modifications was included in the 2017 restructuring charge. No significant award modifications took place in 2019 or 2018.
CSX 2019 Form 10-K p. 63
CSX CORPORATION
PART II
Item 8. Financial Statements and Supplementary Data
NOTE 4. Stock Plans and Share-Based Compensation, continued
Stock Awards for Directors
CSX’s non-management directors receive a base annual retainer of $112,500 to be paid quarterly in cash, unless the director chooses to defer the retainer in the form of cash or CSX common stock. Additionally, non-management directors receive an annual grant of common stock in the amount of approximately $162,500 , with the number of shares to be granted based on the average closing price of CSX stock in the months of November, December and January. The independent non-executive Chairman also receives an annual grant of common stock in the amount of approximately $250,000 , with the number of shares to be granted based on the average closing price of CSX stock in the months of November, December, and January.
Employee Stock Purchase Plan
In May 2018, shareholders approved the 2018 CSX Employee Stock Purchase Plan (“ESPP”) for the benefit of Company employees. The Company registered 4 million shares of common stock that may be issued pursuant to this plan. Under the ESPP, employees may contribute between 1 % and 10 % of base compensation, after-tax, to purchase up to $25,000 of CSX common stock per year at 85 % of the closing market price on either the grant date or the last day of the six-month offering period, whichever is lower. During 2019, the Company issued approximately 250 thousand shares under the ESPP.
NOTE 5. Casualty, Environmental and Other Reserves
Activity related to casualty, environmental and other reserves is as follows:
Casualty | Environmental | Other | |||||||||||||
(Dollars in Millions) | Reserves | Reserves | Reserves | Total | |||||||||||
December 30, 2016 | $ | $ | $ | $ | |||||||||||
Charged to Expense | |||||||||||||||
Payments | ( | ) | ( | ) | ( | ) | ( | ) | |||||||
December 31, 2017 | |||||||||||||||
Charged to Expense | |||||||||||||||
Payments | ( | ) | ( | ) | ( | ) | ( | ) | |||||||
December 31, 2018 | |||||||||||||||
Charged to Expense | |||||||||||||||
Payments | ( | ) | ( | ) | ( | ) | ( | ) | |||||||
December 31, 2019 | $ | $ | $ | $ | |||||||||||
CSX 2019 Form 10-K p. 64
CSX CORPORATION
PART II
Item 8. Financial Statements and Supplementary Data
NOTE 5. Casualty, Environmental and Other Reserves, continued
Personal injury and environmental reserves are considered critical accounting estimates due to the need for management judgment. In the table above, the impacts of changes in estimates are included in the charged to expense amount and were not material in 2019, 2018, or 2017. Casualty, environmental and other reserves are provided for in the consolidated balance sheets as shown in the table below.
December 2019 | December 2018 | ||||||||||||||||||||||
(Dollars in Millions) | Current | Long-term | Total | Current | Long-term | Total | |||||||||||||||||
Casualty: | |||||||||||||||||||||||
Personal Injury | $ | $ | $ | $ | $ | $ | |||||||||||||||||
Occupational | |||||||||||||||||||||||
Total Casualty | $ | $ | $ | $ | $ | $ | |||||||||||||||||
Environmental | |||||||||||||||||||||||
Other | |||||||||||||||||||||||
Total | $ | $ | $ | $ | $ | $ | |||||||||||||||||
Casualty
Casualty reserves of $187 million and $199 million for 2019 and 2018, respectively, represent accruals for personal injury, occupational disease and occupational injury claims. The Company increased its self-insured retention amount for these claims from $50 million to $75 million per occurrence for claims occurring on or after June 1, 2018. Currently, no individual claim is expected to exceed the self-insured retention amount. Most of the Company's casualty claims relate to CSXT. In accordance with the Contingencies Topic in the ASC, to the extent the value of an individual claim exceeds the self-insured retention amount, the Company would present the liability on a gross basis with a corresponding receivable for insurance recoveries.
These reserves fluctuate based upon the timing of payments as well as changes in estimate. Actual results may vary from estimates due to the number, type and severity of the injury, costs of medical treatments and uncertainties in litigation. Defense and processing costs, which historically have been insignificant and are anticipated to be insignificant in the future, are not included in the recorded liabilities. Changes in casualty reserves are included in materials, supplies and other on the consolidated income statements.
CSX 2019 Form 10-K p. 65
CSX CORPORATION
PART II
Item 8. Financial Statements and Supplementary Data
NOTE 5. Casualty, Environmental and Other Reserves, continued
Personal Injury
Personal injury reserves represent liabilities for employee work-related and third-party injuries. Work-related injuries for CSXT employees are primarily subject to the Federal Employers' Liability Act ("FELA"). CSXT retains an independent actuary to assist management in assessing the value of personal injury claims. An analysis is performed by the actuary quarterly and is reviewed by management. The methodology used by the actuary includes a development factor to reflect growth or reduction in the value of these personal injury claims based largely on CSXT's historical claims and settlement experience. This analysis did not result in a material adjustment to the personal injury reserve in 2019, 2018 or 2017.
Occupational
Occupational reserves represent liabilities for occupational disease and injury claims. Occupational disease claims arise primarily from allegations of exposure to asbestos in the workplace. Occupational injury claims arise from allegations of exposure to certain other materials in the workplace, such as solvents, soaps, chemicals (collectively referred to as “irritants”) and diesel fuels (like exhaust fumes) or allegations of chronic physical injuries resulting from work conditions, such as repetitive stress injuries. An analysis performed by management did not result in a material adjustment to the occupational reserve in 2019, 2018 or 2017.
Environmental
Environmental reserves were $74 million and $80 million for 2019 and 2018, respectively. The Company is a party to various proceedings related to environmental issues, including administrative and judicial proceedings involving private parties and regulatory agencies. The Company has been identified as a potentially responsible party at approximately 220 environmentally impaired sites. Many of these are, or may be, subject to remedial action under the federal Comprehensive Environmental Response, Compensation and Liability Act of 1980 ("CERCLA"), also known as the Superfund Law, or similar state statutes. Most of these proceedings arose from environmental conditions on properties used for ongoing or discontinued railroad operations. A number of these proceedings, however, are based on allegations that the Company, or its predecessors, sent hazardous substances to facilities owned or operated by others for treatment, recycling or disposal. In addition, some of the Company’s land holdings were leased to others for commercial or industrial uses that may have resulted in releases of hazardous substances or other regulated materials onto the property and could give rise to proceedings against the Company.
In any such proceedings, the Company is subject to environmental clean-up and enforcement actions under the Superfund Law, as well as similar state laws that may impose joint and several liability for clean-up and enforcement costs on current and former owners and operators of a site without regard to fault or the legality of the original conduct. These costs could be substantial.
CSX 2019 Form 10-K p. 66
CSX CORPORATION
PART II
Item 8. Financial Statements and Supplementary Data
NOTE 5. Casualty, Environmental and Other Reserves, continued
In accordance with the Asset Retirement and Environmental Obligations Topic in the ASC, the Company reviews its role with respect to each site identified at least quarterly, giving consideration to a number of factors such as:
• | type of clean-up required; |
• | nature of the Company’s alleged connection to the location (e.g., generator of waste sent to the site or owner or operator of the site); |
• | extent of the Company’s alleged connection (e.g., volume of waste sent to the location and other relevant factors); and |
• | number, connection and financial viability of other named and unnamed potentially responsible parties at the location. |
Based on the review process, the Company has recorded amounts to cover contingent anticipated future environmental remediation costs with respect to each site to the extent such costs are reasonably estimable and probable. The recorded liabilities for estimated future environmental costs are undiscounted. The liability includes future costs for remediation and restoration of sites as well as any significant ongoing monitoring costs, but excludes any anticipated insurance recoveries. Payments related to these liabilities are expected to be made over the next several years. Environmental remediation costs are included in materials, supplies and other on the consolidated income statements.
Currently, the Company does not possess sufficient information to reasonably estimate the amounts of additional liabilities, if any, on some sites until completion of future environmental studies. In addition, conditions that are currently unknown could, at any given location, result in additional exposure, the amount and materiality of which cannot presently be reasonably estimated. Based upon information currently available, however, the Company believes its environmental reserves accurately reflect the estimated cost of remedial actions currently required.
Other
Other reserves were $44 million and $45 million for 2019 and 2018, respectively. These reserves include liabilities for various claims, such as property, automobile and general liability. Also included in other reserves are longshoremen disability claims related to a previously owned international shipping business (these claims are in runoff) as well as claims for current port employees.
CSX 2019 Form 10-K p. 67
CSX CORPORATION
PART II
Item 8. Financial Statements and Supplementary Data
NOTE 6. Properties
A detail of the Company’s net properties are as follows:
(Dollars in Millions) | Accumulated | Net Book | Annual Depreciation | Estimated Useful Life | Depreciation | |||||||||||||||
December 2019 | Cost | Depreciation | Value | Rate | ( Avg. Years) | Method | ||||||||||||||
Road | ||||||||||||||||||||
Rail and Other Track Material | $ | $ | ( | ) | $ | Group Life | ||||||||||||||
Ties | ( | ) | Group Life | |||||||||||||||||
Grading | ( | ) | Group Life | |||||||||||||||||
Ballast | ( | ) | Group Life | |||||||||||||||||
Bridges, Trestles, and Culverts | ( | ) | Group Life | |||||||||||||||||
Signals and Interlockers | ( | ) | Group Life/ Straight Line (a) | |||||||||||||||||
Buildings | ( | ) | Group Life | |||||||||||||||||
Other | ( | ) | Group Life | |||||||||||||||||
Total Road | ( | ) | ||||||||||||||||||
Equipment | ||||||||||||||||||||
Locomotive | ( | ) | Group Life | |||||||||||||||||
Freight Cars | ( | ) | Group Life | |||||||||||||||||
Work Equipment and Other | ( | ) | Group Life/ Straight Line (a) | |||||||||||||||||
Total Equipment | ( | ) | ||||||||||||||||||
Land | — | N/A | N/A | N/A | ||||||||||||||||
Construction In Progress | — | N/A | N/A | N/A | ||||||||||||||||
Total Properties | $ | $ | ( | ) | $ | |||||||||||||||
(a) For depreciation method, certain asset categories contain intermodal terminals or technology-related assets, which are depreciated using the straight-line method.
CSX 2019 Form 10-K p. 68
CSX CORPORATION
PART II
Item 8. Financial Statements and Supplementary Data
NOTE 6. Properties, continued
(Dollars in Millions) | Accumulated | Net Book | Annual Depreciation | Estimated Useful Life | Depreciation | |||||||||||||||
December 2018 | Cost | Depreciation | Value | Rate | (Avg. Years) | Method | ||||||||||||||
Road | ||||||||||||||||||||
Rail and Other Track Material | $ | $ | ( | ) | $ | Group Life | ||||||||||||||
Ties | ( | ) | Group Life | |||||||||||||||||
Grading | ( | ) | Group Life | |||||||||||||||||
Ballast | ( | ) | Group Life | |||||||||||||||||
Bridges, Trestles, and Culverts | ( | ) | Group Life | |||||||||||||||||
Signals and Interlockers | ( | ) | Group Life/ Straight Line (a) | |||||||||||||||||
Buildings | ( | ) | Group Life | |||||||||||||||||
Other | ( | ) | Group Life | |||||||||||||||||
Total Road | ( | ) | ||||||||||||||||||
Equipment | ||||||||||||||||||||
Locomotive | ( | ) | Group Life | |||||||||||||||||
Freight Cars | ( | ) | Group Life | |||||||||||||||||
Work Equipment and Other | ( | ) | Group Life/ Straight Line (a) | |||||||||||||||||
Total Equipment | ( | ) | ||||||||||||||||||
Land | — | N/A | N/A | N/A | ||||||||||||||||
Construction In Progress | — | N/A | N/A | N/A | ||||||||||||||||
Total Properties | $ | $ | ( | ) | $ | |||||||||||||||
(a) For depreciation method, certain asset categories contain intermodal terminals or technology-related assets, which are depreciated using the straight-line method.
CSX 2019 Form 10-K p. 69
CSX CORPORATION
PART II
Item 8. Financial Statements and Supplementary Data
NOTE 6. Properties, continued
Capital Expenditures
The Company’s capital investment includes purchased and self-constructed assets and property additions that substantially extend the service life or increase the utility of those assets. Indirect costs that can be specifically traced to capital projects are also capitalized. The Company is committed to maintaining and improving its existing infrastructure and expanding its network capacity for long-term growth. Rail operations are capital intensive and CSX accounts for these costs in accordance with GAAP and the Company’s capitalization policy. All properties are stated at historical cost less an allowance for accumulated depreciation.
The Company’s largest category of capital investment is the replacement of track assets and the acquisition or construction of new assets that enable CSX to enhance its operations or provide new capacity offerings to its customers. These construction projects are primarily completed by CSXT employees. Costs for track asset replacement and capacity projects that are capitalized include:
• | labor costs, because many of the assets are self-constructed; |
• | costs to purchase or construct new track or to prepare ground for the laying of track; |
• | welding (rail, field and plant) which are processes used to connect segments of rail; |
• | new ballast, which is gravel and crushed stone that holds track in line; |
• | fuels and lubricants associated with tie, rail and surfacing work which is the process of raising track to a designated elevation over an extended distance; |
• | cross, switch and bridge ties which are the braces that support the rails on a track; |
• | gauging which is the process of standardizing the distance between rails; |
• | handling costs associated with installing rail, ties or ballast; |
• | usage charge of machinery and equipment utilized in construction or installation; and |
• | other track materials. |
Labor is a significant cost in self-constructed track replacement work. CSXT engineering employees directly charge their labor to the track replacement project (the capitalized depreciable property). In replacing track, these employees concurrently perform deconstruction and installation of track material. Because of this concurrent process, CSX must estimate the amount of labor that is related to deconstruction versus installation. As a component of the depreciation study for road and track assets, management performs an analysis of labor costs related to the self-constructed track replacement work, which includes direct observation of track replacement processes. Through this analysis, CSX determined that approximately 20 % of labor costs associated with track replacement is related to the deconstruction of old track, for which certain elements are expensed, and 80 % is associated with the installation of new track, which is capitalized.
Capital investment related to locomotives and freight cars comprises the second largest category of the Company’s capital assets. This category includes purchases of locomotives and freight cars as well as certain equipment leases that are considered to be finance leases in accordance with the Leases Topic in the ASC. In addition, costs to modify or rebuild these assets are capitalized if the investment incurred extends the asset’s service life or improves utilization. Improvement projects must meet specified dollar thresholds to be capitalized and are reviewed by management to determine proper accounting treatment. Routine repairs, overhauls and other maintenance costs, for all asset categories, are expensed as incurred.
CSX 2019 Form 10-K p. 70
CSX CORPORATION
PART II
Item 8. Financial Statements and Supplementary Data
NOTE 6. Properties, continued
Depreciation Method
The depreciable assets of the Company are depreciated using either the group-life or straight-line method of accounting, which are both acceptable depreciation methods in accordance with GAAP. The Company depreciates its railroad assets, including main-line track, locomotives and freight cars, using the group-life method. Assets depreciated under the group-life method comprise 87 % of total fixed assets of $45.1 billion on a gross basis as of December 2019. The remaining depreciable assets of the Company, including non-railroad assets and assets under finance leases, are depreciated using the straight-line method on a per asset basis. Land is not depreciated.
The group-life method aggregates assets with similar lives and characteristics into groups and depreciates each of these groups as a whole. When using the group-life method, an underlying assumption is that each group of assets, as a whole, is used and depreciated to the end of its group’s recoverable life. The Company currently utilizes different depreciable asset categories to account for depreciation expense for the railroad assets that are depreciated under the group-life method. By utilizing various depreciable categories, the Company can more accurately account for the use of its assets. All assets of the Company are depreciated on a time or life basis.
The group-life method of depreciation closely approximates the straight-line method of depreciation. Additionally, due to the nature of most of its assets (e.g. track is one contiguous, connected asset), the Company believes that this is the most accurate and effective way to properly depreciate its assets.
Estimated Useful Life
Management performs a review of depreciation expense and useful lives on a regular basis. Under the group-life method, the service lives and salvage values for each group of assets are determined by completing periodic depreciation studies and applying management’s methods to determine the service lives of its properties. A depreciation study is the periodic review of asset service lives, salvage values, accumulated depreciation, and other related factors for group assets conducted by a third-party specialist, analyzed by the Company’s management and approved by the STB, the regulatory board that has broad jurisdiction over railroad practices. The STB requires depreciation studies be performed every three years for equipment assets (e.g. locomotives and freight cars) and every six years for road and track assets (e.g. bridges, signals, rail, ties, and ballast). The Company believes the frequency of depreciation studies currently required by the STB, complemented by annual data reviews conducted by a third-party specialist and analyzed by the Company's management, provides adequate review of asset service lives and that a more frequent review would not result in a material change due to the long-lived nature of most of the assets.
In 2019, the Company completed a depreciation study for its equipment assets which resulted in changes to accumulated depreciation, service lives, salvage values, and other related factors for certain assets. The effect of this change in estimate was not material to depreciation expense in 2019. The continued impacts of the study are expected to result in additional depreciation expense of approximately $30 million in 2020. The Company plans to complete the next depreciation study for road and track assets in 2020 and equipment assets in 2022.
CSX 2019 Form 10-K p. 71
CSX CORPORATION
PART II
Item 8. Financial Statements and Supplementary Data
NOTE 6. Properties, continued
Group-Life Assets Sales and Retirements
Since the rail network is one contiguous, connected network it is impractical to maintain specific identification records for these assets. For track assets (e.g. rail, ties, and ballast), CSX utilizes a first-in, first-out approach to asset retirements. Equipment assets (e.g. locomotives and freight cars) are specifically identified at retirement. When an equipment asset is retired that has been depreciated using the group-life method, the cost is reduced from the cost base and recorded in accumulated depreciation.
For sales or retirements of assets depreciated under the group-life method that occur in the ordinary course of business, the asset cost (net of salvage value or sales proceeds) is charged to accumulated depreciation and no gain or loss is immediately recognized. This practice is consistent with accounting treatment prescribed under the group-life method. As part of the depreciation study, an assessment of the recorded amount of accumulated depreciation is made to determine if it is deficient (or in excess) of the appropriate amount indicated by the study. Any such deficiency (or excess), including any deferred gains or losses, is amortized as a component of depreciation expense over the remaining service life of the asset group until the next required depreciation study. Since the overall assumption with the group-life method is that the assets within the group on average have the same service life and characteristics, it is therefore concluded that the deferred gains and losses offset over time.
For sales or retirements of assets depreciated under the group-life method that do not occur in the ordinary course of business, a gain or loss may be recognized if the sale or retirement meets each of the following three criteria: (i) it is unusual, (ii) it is material in amount, and (iii) it varies significantly from the retirement profile identified through our depreciation studies. No material gains or losses were recognized on the sale of assets depreciated using the group-life method in 2019, 2018, or 2017 as no sales met the criteria described above.
Land and Straight-line Assets Sales and Retirements
Impairment Review
CSX 2019 Form 10-K p. 72
CSX CORPORATION
PART II
Item 8. Financial Statements and Supplementary Data
NOTE 7. Leases
CSX has various lease agreements with terms up to 50 years, including leases of land, land with integral equipment (e.g. track), buildings and various equipment. Some leases include options to purchase, terminate or extend for one or more years. These options are included in the lease term when it is reasonably certain that the option will be exercised.
At inception, the Company determines if an arrangement contains a lease and whether that lease meets the classification criteria of a finance or operating lease. Some of the Company’s lease arrangements contain lease components (e.g. minimum rent payments) and non-lease components (e.g. maintenance, labor charges, etc.). The Company generally accounts for each component separately based on the estimated standalone price of each component. For certain equipment leases, such as freight car, vehicles and work equipment, the Company accounts for the lease and non-lease components as a single lease component.
Certain of the Company’s lease agreements include rental payments that are adjusted periodically for an index or rate. The leases are initially measured using the projected payments adjusted for the index or rate in effect at the commencement date. The Company’s lease agreements do not contain any material residual value guarantees or material restrictive covenants.
Operating Leases
Operating leases are included in right-of-use lease assets, other current liabilities and long-term lease liabilities on the consolidated balance sheets. These assets and liabilities are recognized at the commencement date based on the present value of remaining lease payments over the lease term using the Company’s secured incremental borrowing rates or implicit rates, when readily determinable. Short-term operating leases, which have an initial term of 12 months or less, are not recorded on the balance sheet.
The Company has various lease agreements with other parties with terms up to 50 years. Non-cancelable, long-term leases may include provisions for maintenance, options to purchase and options to extend the terms. Lease expense for operating leases, including leases with escalations over their terms, is recognized on a straight-line basis over the lease term. Variable lease expense is recognized in the period in which the obligation for those payments is incurred. Lease expense is included in equipment and other rents on the consolidated income statements and is reported net of lease income. Lease income was not material to the results of operations for 2019, 2018 or 2017.
CSX 2019 Form 10-K p. 73
CSX CORPORATION
PART II
Item 8. Financial Statements and Supplementary Data
NOTE 7. Leases, continued
A significant operating lease was renewed in 2018 with the State of Georgia for approximately 137 miles of right-of-way with integral equipment for an additional term of 50 years with an annual 2.5 % increase. The following table presents information about the amount, timing and uncertainty of cash flows arising from the Company’s operating leases as of December 31, 2019.
(Dollars in Millions) | December 2019 | ||
Maturity of Lease Liabilities | Lease Payments | ||
2020 | |||
2021 | |||
2022 | |||
2023 | |||
2024 | |||
Thereafter | |||
Total undiscounted operating lease payments | $ | ||
Less: Imputed interest | ( | ) | |
Present value of operating lease liabilities | $ | ||
Balance Sheet Classification | |||
Current lease liabilities (recorded in other current liabilities) | $ | ||
Long-term lease liabilities | |||
Total operating lease liabilities | $ | ||
Other Information | |||
Weighted-average remaining lease term for operating leases | |||
Weighted-average discount rate for operating leases | % | ||
Cash Flows
An initial right-of-use asset of $534 million was recognized as a non-cash asset addition upon adoption of the new lease accounting standard effective January 1, 2019. Additional right-of-use assets of $51 million were recognized as non-cash asset additions that resulted from new operating lease liabilities during the year ended December 31, 2019. Cash paid for amounts included in the present value of operating lease liabilities was $60 million during the year ended December 31, 2019 and is included in operating cash flows.
Operating Lease Costs
These costs are primarily related to long-term operating leases, but also include immaterial amounts for variable leases and short-term leases with terms greater than 30 days. These amounts are shown in the table below.
Fiscal Years | |||||||||||
(Dollars in Millions) | 2019 | 2018 | 2017 | ||||||||
Rent Expense on Operating Leases | $ | $ | $ | ||||||||
CSX 2019 Form 10-K p. 74
CSX CORPORATION
PART II
Item 8. Financial Statements and Supplementary Data
NOTE 7. Leases, continued
Finance Leases
NOTE 8. Commitments and Contingencies
Purchase Commitments
CSXT's long-term locomotive maintenance program agreement with a third-party contains commitments related to specific locomotive rebuilds and a long-term maintenance program that covers a portion of CSXT’s fleet of locomotives. The maintenance program costs are based on the maintenance cycle for each covered locomotive, which is determined by the asset's age and type. Expected future costs may change as required maintenance schedules are revised and locomotives are placed into or removed from service. Under CSXT’s current obligations, the agreement will expire no earlier than 2035.
The following table summarizes the number of locomotives covered and CSXT’s payments under the long-term maintenance program.
Fiscal Years | |||||||||||
(Dollars in Millions) | 2019 | 2018 | 2017 | ||||||||
Amounts Paid | $ | $ | $ | ||||||||
Number of Locomotives | |||||||||||
The total of annual payments under the agreement, including those related to locomotive rebuilds and the long-term locomotive maintenance program, are estimated in the table below.
Additionally, the Company has various other commitments to purchase technology, communications, railcar maintenance and other services from various suppliers. Total annual payments under all of these purchase commitments are also estimated in the table below.
(Dollars in Millions) | Locomotive Maintenance & Rebuild Payments | Other Commitments | Total | ||||||||
2020 | $ | $ | $ | ||||||||
2021 | |||||||||||
2022 | |||||||||||
2023 | |||||||||||
2024 | |||||||||||
Thereafter | |||||||||||
Total | $ | $ | $ | ||||||||
CSX 2019 Form 10-K p. 75
CSX CORPORATION
PART II
Item 8. Financial Statements and Supplementary Data
NOTE 8. Commitments and Contingencies, continued
Insurance
The Company maintains insurance programs with substantial limits for property damage (which includes business interruption) and third-party liability. A certain amount of risk is retained by the Company on each of the property and liability programs. The Company has a $50 million per occurrence retention for floods and named windstorms and a $25 million per occurrence retention for property losses other than floods and named windstorms. For claims occurring on or after June 1, 2018, the Company increased its self-insured retention for third-party liability claims from $50 million to $75 million per occurrence. While the Company believes its insurance coverage is adequate, future claims could exceed existing insurance coverage or insurance may not continue to be available at commercially reasonable rates.
Legal
The Company is involved in litigation incidental to its business and is a party to a number of legal actions and claims, various governmental proceedings and private civil lawsuits, including, but not limited to, those related to fuel surcharge practices, tax matters, environmental and hazardous material exposure matters, FELA and labor claims by current or former employees, other personal injury or property claims and disputes and complaints involving certain transportation rates and charges. Some of the legal proceedings include claims for compensatory as well as punitive damages and others are, or are purported to be, class actions. While the final outcome of these matters cannot be predicted with certainty, considering, among other things, the legal defenses available and liabilities that have been recorded along with applicable insurance, it is currently the opinion of management that none of these pending items will have a material adverse effect on the Company's financial condition, results of operations or liquidity. An unexpected adverse resolution of one or more of these items, however, could have a material adverse effect on the Company's financial condition, results of operations or liquidity in that particular period.
The Company is able to estimate a range of possible loss for certain legal proceedings for which a loss is reasonably possible in excess of reserves established. The Company has estimated this range to be $1 million to $29 million in aggregate at December 31, 2019. This estimated aggregate range is based upon currently available information and is subject to significant judgment and a variety of assumptions. Accordingly, the Company's estimate will change from time to time, and actual losses may vary significantly from the current estimate.
Fuel Surcharge Antitrust Litigation
In May 2007, class action lawsuits were filed against CSXT and three other U.S.-based Class I railroads alleging that the defendants' fuel surcharge practices relating to contract and unregulated traffic resulted from an illegal conspiracy in violation of antitrust laws. The class action lawsuits were consolidated into one case in federal court in the District of Columbia. In 2017, the District Court issued its decision denying class certification. On August 16, 2019, the U.S. Court of Appeals for the D.C. Circuit affirmed the District Court’s ruling.
The District Court had delayed proceedings on the merits of the consolidated case pending the outcome of the class certification proceedings. The consolidated case is now moving forward without class certification. Because a class was not certified, shippers other than those who brought the original lawsuit in 2007 must decide whether to bring their own individual claim against one or more railroads. Some individual shipper claims have been filed.
CSX 2019 Form 10-K p. 76
CSX CORPORATION
PART II
Item 8. Financial Statements and Supplementary Data
NOTE 8. Commitments and Contingencies, continued
CSXT believes that its fuel surcharge practices were arrived at and applied lawfully and that the case is without merit. Accordingly, the Company intends to defend itself vigorously. However, penalties for violating antitrust laws can be severe, and resolution of these matters individually or when aggregated could have a material adverse effect on the Company's financial condition, results of operations or liquidity in that particular period.
Environmental
CSXT is indemnifying Pharmacia LLC (formerly known as Monsanto Company) for certain liabilities associated with real estate located in Kearny, New Jersey along the Lower Passaic River (the “Property”). The Property, which was formerly owned by Pharmacia, is now owned by CSXT. CSXT's indemnification and defense duties arise with respect to several matters. The U.S. Environmental Protection Agency ("EPA"), using its CERCLA authority, seeks the investigation and cleanup of hazardous substances in the 17 -mile Lower Passaic River Study Area (the "Study Area”). CSXT, on behalf of Pharmacia, and a significant number of other potentially responsible parties are together conducting a Remedial Investigation and Feasibility Study of the Study Area pursuant to an Administrative Settlement Agreement and Order on Consent with the EPA. Pharmacia’s share of responsibility, indemnified by CSXT, for the investigation and cleanup costs of the Study Area may be determined through various mechanisms including (a) an allocation and settlement with EPA; (b) litigation brought by EPA against non-settling parties; or (c) litigation among the responsible parties.
In March 2016, EPA issued its Record of Decision detailing the agency’s mandated remedial process for the lower 8 miles of the Study Area. Approximately 80 parties, including Pharmacia, are participating in an EPA-directed allocation process to assign responsibility for costs to be incurred implementing the remedy selected for the lower 8 miles of the Study Area. CSXT is participating in the allocation process on behalf of Pharmacia. At a later date, EPA will select a remedy for the remainder of the Study Area and is expected to again seek the participation of private parties to implement the selected remedy using EPA’s CERCLA authority to compel such participation, if necessary.
CSXT is also defending and indemnifying Pharmacia with regard to the Property in litigation filed by Occidental Chemical Corporation, which is seeking to recover various costs. These costs include costs for the remedial design of the lower 8 miles of the Study Area, as well as anticipated costs associated with the future remediation of the lower 8 miles of the Study Area and potentially the entire Study Area. Alternatively, Occidental seeks to compel some, or all of the defendants to participate in the remediation of the Study Area. Pharmacia is one of approximately 110 defendants in this federal lawsuit filed by Occidental on June 30, 2018.
CSX 2019 Form 10-K p. 77
CSX CORPORATION
PART II
Item 8. Financial Statements and Supplementary Data
NOTE 9. Employee Benefit Plans
The Company sponsors defined benefit pension plans principally for salaried, management personnel. For employees hired prior to 2003, the plans provide eligible employees with retirement benefits based predominantly on years of service and compensation rates near retirement. For employees hired in 2003 to 2019, benefits are determined based on a cash balance formula, which provides benefits by utilizing interest and pay credits based upon age, service and compensation. Beginning in 2020, the CSX Pension Plan is closed to new participants.
In addition to these plans, the Company sponsors a post-retirement medical plan and a life insurance plan that provide certain benefits to full-time, salaried, management employees hired prior to 2003, upon their retirement if certain eligibility requirements are met. Changes to the post-retirement medical and life insurance plans were communicated to participants in October 2018. Beginning January 2019, both the life insurance benefit for eligible active employees and health savings account contributions made by the Company to eligible retirees younger than 65 were eliminated. Beginning in 2020, the employer-funded health reimbursement arrangements for eligible retirees 65 years or older have been eliminated. As a result of these plan amendments, the company recognized a decrease of $102 million in the post-retirement benefit liability and a corresponding gain in other comprehensive income in 2018. These changes did not result in a curtailment loss as there was no material impact to service costs for active plan participants.
The Company engages independent actuaries to compute the amounts of liabilities and expenses relating to these plans subject to the assumptions that the Company determines are appropriate based on historical trends, current market rates and future projections. These amounts are reviewed by management. In order to perform this valuation, the actuaries are provided with the details of the population covered at the beginning of the year, summarized in the table below, and projects that population forward to the end of the year .
Summary of Participants as of | |||||
January 1, 2019 | |||||
Pension Plans | Post-retirement Medical Plan | ||||
Active Employees | |||||
Retirees and Beneficiaries | |||||
Other(a) | |||||
Total | |||||
(a) For pension plans, the other category consists mostly of terminated but vested former employees. For post-retirement plans, the other category consists of employees on long-term disability that have not yet retired.
CSX 2019 Form 10-K p. 78
CSX CORPORATION
PART II
Item 8. Financial Statements and Supplementary Data
NOTE 9. Employee Benefit Plans, continued
The benefit obligation for these plans represents the liability of the Company for current and retired employees and is affected primarily by the following:
• | service cost (benefits attributed to employee service during the period); |
• | interest cost (interest on the liability due to the passage of time); |
• | actuarial gains/losses (experience during the year different from that assumed and changes in plan assumptions); and |
• | benefits paid to participants. |
Cash Flows
Plan assets are amounts that have been segregated and restricted to provide qualified pension plan benefits and include amounts contributed by the Company and amounts earned from invested contributions, net of benefits paid. Qualified pension plan obligations are funded in accordance with regulatory requirements and with an objective of meeting or exceeding minimum funding requirements necessary to avoid restrictions on flexibility of plan operation and benefit payments. The Company funds the cost of the post-retirement medical and life insurance benefits as well as nonqualified pension benefits on a pay-as-you go basis. No qualified pension plan contributions were made during 2019, 2018 and 2017. No contributions to the Company's qualified pension plans are expected in 2020.
Future expected benefit payments are as follows:
Expected Cash Flows | |||||||
(Dollars in Millions) | Pension Benefits | Post-retirement Benefits | |||||
2020 | $ | $ | |||||
2021 | |||||||
2022 | |||||||
2023 | |||||||
2024 | |||||||
2025-2029 | |||||||
Total | $ | $ | |||||
CSX 2019 Form 10-K p. 79
CSX CORPORATION
PART II
Item 8. Financial Statements and Supplementary Data
NOTE 9. Employee Benefit Plans, continued
Plan Assets
The CSX Investment Committee (the “Investment Committee”), whose members are selected by the Chief Financial Officer, is responsible for oversight and investment of plan assets. The Investment Committee utilizes an investment asset allocation strategy that is monitored on an ongoing basis and updated periodically in consideration of plan or employee changes, or changing market conditions. Periodic studies provide an extensive modeling of asset investment return in conjunction with projected plan liabilities and seek to evaluate how to maximize return within the constraints of acceptable risk. The current asset allocation targets 60 % equity investments and 40 % fixed income investments and cash. Within equity, a further target is currently established for 37 % of total plan assets in domestic equity and 23 % in international equity. Allocations are evaluated for levels within 3 % of targeted allocations and are adjusted quarterly as necessary.
The distribution of pension plan assets as of the measurement date is shown in the table below, and these assets are reported net of pension liabilities on the balance sheet.
December 2019 | December 2018 | ||||||||||||
Percent of | Percent of | ||||||||||||
(Dollars in Millions) | Amount | Total Assets | Amount | Total Assets | |||||||||
Equity | $ | % | $ | % | |||||||||
Fixed Income | |||||||||||||
Cash and Cash Equivalents | |||||||||||||
Total | $ | % | $ | % | |||||||||
Under the supervision of the Investment Committee, individual investments or fund managers are selected in accordance with standards of prudence applicable to asset diversification and investment suitability. The Company also selects fund managers with differing investment styles and benchmarks their investment returns against appropriate indices. Fund investment performance is continuously monitored. Acceptable performance is determined in the context of the long-term return objectives of the fund and appropriate asset class benchmarks.
Within the Company's equity funds, domestic stock is diversified among large and small capitalization stocks. International stock is diversified in a similar manner as well as in developed versus emerging markets stocks. Guidelines established with individual managers limit investment by industry sectors, individual stock issuer concentration and the use of derivatives and CSX securities.
Fixed income securities guidelines established with individual managers specify the types of allowable investments, such as government, corporate and asset-backed bonds, target certain allocation ranges for domestic and foreign investments and limit the use of certain derivatives. Additionally, guidelines stipulate minimum credit quality constraints and any prohibited securities. For detailed information regarding the fair value of pension assets, see Note 13, Fair Value Measurements.
CSX 2019 Form 10-K p. 80
CSX CORPORATION
PART II
Item 8. Financial Statements and Supplementary Data
NOTE 9. Employee Benefit Plans, continued
Benefit Obligation, Plan Assets and Funded Status
Changes in benefit obligation and the fair value of plan assets for the 2019 and 2018 calendar plan years are as follows:
Pension Benefits | Post-retirement Benefits | ||||||||||||||
Plan Year | Plan Year | Plan Year | Plan Year | ||||||||||||
(Dollars in Millions) | 2019 | 2018 | 2019 | 2018 | |||||||||||
Actuarial Present Value of Benefit Obligation | |||||||||||||||
Accumulated Benefit Obligation | $ | $ | N/A | N/A | |||||||||||
Projected Benefit Obligation | $ | $ | |||||||||||||
Change in Projected Benefit Obligation: | |||||||||||||||
Projected Benefit Obligation at Beginning of Plan Year | $ | $ | $ | $ | |||||||||||
Service Cost (a) | |||||||||||||||
Interest Cost | |||||||||||||||
Plan Participants' Contributions | |||||||||||||||
Post-retirement Plan Amendment | ( | ) | |||||||||||||
Actuarial Loss (Gain) | ( | ) | ( | ) | |||||||||||
Benefits Paid | ( | ) | ( | ) | ( | ) | ( | ) | |||||||
Benefit Obligation at End of Plan Year | $ | $ | $ | $ | |||||||||||
Change in Plan Assets: | |||||||||||||||
Fair Value of Plan Assets at Beginning of Plan Year | $ | $ | $ | $ | |||||||||||
Actual Return on Plan Assets Gain (Loss) | ( | ) | |||||||||||||
Non-qualified Employer Contributions | |||||||||||||||
Plan Participants' Contributions | |||||||||||||||
Benefits Paid | ( | ) | ( | ) | ( | ) | ( | ) | |||||||
Fair Value of Plan Assets at End of Plan Year | |||||||||||||||
Funded Status at End of Plan Year | $ | ( | ) | $ | ( | ) | $ | ( | ) | $ | ( | ) | |||
(a) | Service cost for each 2019 and 2018 includes capitalized service costs of $ |
CSX 2019 Form 10-K p. 81
CSX CORPORATION
PART II
Item 8. Financial Statements and Supplementary Data
NOTE 9. Employee Benefit Plans, continued
For qualified plan funding purposes, assets and discounted liabilities are measured in accordance with the Employee Retirement Income Security Act ("ERISA"), as well as other related provisions of the Internal Revenue Code and related regulations. Under these funding provisions and the alternative measurements available thereunder, the Company estimates its unfunded obligation for qualified plans on an annual basis.
In accordance with Compensation-Retirement Benefits Topic in the ASC, an employer must recognize the funded status of a pension or other post-retirement benefit plan by recording a liability (underfunded plan) or asset (overfunded plan) for the difference between the projected benefit obligation (or the accumulated post-retirement benefit obligation for a post-retirement benefit plan) and the fair value of plan assets at the plan measurement date. Amounts related to pension and post-retirement benefits recorded in other long-term assets, labor and fringe benefits payable and other long-term liabilities on the balance sheet are as follows:
Pension Benefits | Post-retirement Benefits | ||||||||||||||
December | December | December | December | ||||||||||||
(Dollars in Millions) | 2019 | 2018 | 2019 | 2018 | |||||||||||
Amounts Recorded in Consolidated | |||||||||||||||
Balance Sheets: | |||||||||||||||
Long-term Assets (a) | $ | $ | $ | $ | |||||||||||
Current Liabilities | ( | ) | ( | ) | ( | ) | ( | ) | |||||||
Long-term Liabilities | ( | ) | ( | ) | ( | ) | ( | ) | |||||||
Net Amount Recognized in | |||||||||||||||
Consolidated Balance Sheets | $ | ( | ) | $ | ( | ) | $ | ( | ) | $ | ( | ) | |||
(a) | Long-term assets as of December 2019 and 2018 relate to qualified pension plans where assets exceed projected benefit obligations. |
The funded status, or amount by which the benefit obligation exceeds the fair value of plan assets, represents a liability. At December 2019, the status of CSX plans with a net liability only is disclosed below. The total fair value of all plan assets as of December 2019 was $2.8 billion, which includes the qualified pension plans with net assets.
Aggregate | ||||||
(Dollars in Millions) | Fair Value | Aggregate | ||||
Benefit Obligations in Excess of Plan Assets | of Plan Assets | Benefit Obligation | ||||
Projected Benefit Obligation | $ | $ | ( | ) | ||
Accumulated Benefit Obligation | ( | ) | ||||
CSX 2019 Form 10-K p. 82
CSX CORPORATION
PART II
Item 8. Financial Statements and Supplementary Data
NOTE 9. Employee Benefit Plans, continued
Net Benefit Expense
Only the service cost component of net periodic benefit costs is included in labor and fringe expense on the consolidated income statement. All other components of net periodic benefit cost are included in other income - net or, if related to prior year restructuring activities, in restructuring charge - non-operating. The following table describes the components of expense/(income) related to net benefit expense recorded on the income statement.
Pension Benefits Fiscal Years | Post-retirement Benefits Fiscal Years | ||||||||||||||||||||||
(Dollars in Millions) | 2019 | 2018 | 2017 | 2019 | 2018 | 2017 | |||||||||||||||||
Service Cost Included in Labor and Fringe | $ | $ | $ | $ | $ | $ | |||||||||||||||||
Interest Cost | |||||||||||||||||||||||
Expected Return on Plan Assets | ( | ) | ( | ) | ( | ) | |||||||||||||||||
Amortization of Net Loss | |||||||||||||||||||||||
Amortization of Prior Service Cost | ( | ) | ( | ) | |||||||||||||||||||
Total Income Included in Other Income - Net | ( | ) | ( | ) | ( | ) | ( | ) | |||||||||||||||
Net Periodic Benefit (Credit) Expense | $ | ( | ) | $ | ( | ) | $ | ( | ) | $ | ( | ) | $ | $ | |||||||||
Restructuring Charge - Non Operating(a) | |||||||||||||||||||||||
Settlement (Gain) Loss | ( | ) | |||||||||||||||||||||
Total (Credit) Expense | $ | ( | ) | $ | ( | ) | $ | $ | ( | ) | $ | $ | |||||||||||
(a) Charges related to special termination benefits and curtailment costs were the result of the management workforce reductions in first quarter 2017. See Restructuring Charge in Note 1, Nature of Operations and Significant Accounting Policies.
As a result of the management workforce reduction programs initiated in 2017, $85 million in charges were incurred related to special termination benefits, curtailment and settlement changes. In 2017, the Company recorded special termination pension benefits of $56 million and remeasured the pension and other post-retirement benefits assets and obligations and recorded a curtailment loss of $4 million and $13 million, respectively, in restructuring charge - non-operating on the income statement.
Pension settlement (gains) losses were recognized as a result of lump-sum payments to retirees exceeding the sum of the plan’s service and interest cost. The Company recorded an $11 million net settlement loss in 2017, of which a $12 million loss resulted from the retirements of former executives and is reported in restructuring charge - non-operating on the income statement. The other settlement gains in 2018 and 2017 were from one of the Company’s qualified pension plans with insignificant balances and were recorded in other income - net on the income statement.
CSX 2019 Form 10-K p. 83
CSX CORPORATION
PART II
Item 8. Financial Statements and Supplementary Data
NOTE 9. Employee Benefit Plans, continued
Pension and Other Post-retirement Benefits Adjustments
The following table shows the pre-tax change in other comprehensive loss (income) attributable to certain components of net benefit expense and the change in benefit obligation for CSX for pension and other post-employment benefits.
(Dollars in Millions) | Pension Benefits | Post-retirement Benefits | |||||||||||||
Components of Other Comprehensive | December | December | December | December | |||||||||||
Loss (Income) | 2019 | 2018 | 2019 | 2018 | |||||||||||
Recognized in the Balance Sheet | |||||||||||||||
Losses (Gains) | $ | $ | $ | $ | ( | ) | |||||||||
Expense (Income) Recognized in the Income Statement | |||||||||||||||
Amortization of Net Losses (a) | $ | $ | $ | $ | |||||||||||
Settlement (Gain) Loss | ( | ) | |||||||||||||
Amortization of Prior Service Costs | ( | ) | ( | ) | |||||||||||
(a) | Amortization of net losses estimated to be expensed for 2020 is approximately $ |
As of December 2019, the balances to be amortized related to the Company's pension obligations is a pre-tax loss of $879 million and related to post-retirement obligations is a pre-tax gain of $74 million. These amounts are included in accumulated other comprehensive loss, a component of shareholders’ equity.
Assumptions
The expected long-term average rate of return on plan assets reflects the average rate of earnings expected on the funds invested, or to be invested, to provide for benefits included in the projected benefit obligation. In estimating that rate, the Company gives appropriate consideration to the returns being earned by the plan assets in the funds and the rates of return expected to be available for reinvestment as well as the current and projected asset mix of the funds. Management balances market expectations obtained from various investment managers and economists with both market and actual plan historical returns to develop a reasonable estimate of the expected long-term rate of return on assets. This assumption is reviewed annually and adjusted as deemed appropriate.
The Company measures the service cost and interest cost components of the net pension and post-retirement benefits expense by using individual spot rates matched with separate cash flows for each future year.
CSX 2019 Form 10-K p. 84
CSX CORPORATION
PART II
Item 8. Financial Statements and Supplementary Data
NOTE 9. Employee Benefit Plans, continued
The weighted averages of assumptions used by the Company to value its pension and post-retirement obligations were as follows:
Pension Benefits | Post-retirement Benefits | |||||||||||
2019 | 2018 | 2019 | 2018 | |||||||||
Expected Long-term Return on Plan Assets: | ||||||||||||
Benefit Cost for Current Plan Year | % | % | N/A | N/A | ||||||||
Benefit Cost for Subsequent Plan Year | % | % | N/A | N/A | ||||||||
Discount Rates: | ||||||||||||
Benefit Cost for Plan Year | ||||||||||||
Service Cost for Plan Year | % | % | % | % | (a) | |||||||
Interest Cost for Plan Year | % | % | % | % | (a) | |||||||
Benefit Obligation at End of Plan Year | % | % | % | % | ||||||||
Salary Scale Inflation | % | % | N/A | N/A | ||||||||
(a) | The post-retirement benefits service cost and interest cost for 2018 were based on a weighted average discount rate of |
The impact of the health care cost trend rate is immaterial to the post-retirement benefit cost and obligation due to the plan's health reimbursement arrangement that covers Medicare-eligible retirees.
Other Plans
Under collective bargaining agreements, the Company participates in a multi-employer benefit plan, which provides certain post-retirement health care and life insurance benefits to eligible contract employees. Premiums under this plan are expensed as incurred and amounted to $26 million, $30 million and $40 million in 2019, 2018 and 2017, respectively.
The Company maintains savings plans for virtually all full-time salaried employees and certain employees covered by collective bargaining agreements. Expense associated with these plans was $41 million, $41 million and $39 million for 2019, 2018 and 2017, respectively, and is included in labor and fringe expense on the consolidated income statement.
CSX 2019 Form 10-K p. 85
CSX CORPORATION
PART II
Item 8. Financial Statements and Supplementary Data
NOTE 10. Debt and Credit Agreements
Debt at December 2019 and December 2018 is shown in the table below. For information regarding the fair value of debt, see Note 13, Fair Value Measurements.
Maturity at December | Average Interest Rates at December | December | December | |||||
(Dollars in Millions) | 2019 | 2019 | 2019 | 2018 | ||||
Notes | 2020-2068 | $ | $ | |||||
Equipment Obligations(a) | 2020-2023 | |||||||
Finance Leases | 2020-2026 | |||||||
Subtotal Long-term Debt (including current portion) | $ | $ | ||||||
Less Debt Due within One Year | ( | ) | ( | ) | ||||
Long-term Debt (excluding current portion) | $ | $ | ||||||
(a) Equipment obligations are secured by an interest in certain railroad equipment.
Debt Issuance & Early Redemption of Long-term Debt
CSX issued the following notes which are included in the consolidated balance sheets under long-term debt and may be redeemed by the Company at any time, subject to payment of certain make-whole premiums:
• | On September 12, 2019, issued $ |
• | On February 28, 2019, issued $ |
• | On November 15, 2018, issued $ |
• | On February 20, 2018, issued $ |
The net proceeds from debt issuances were used for general corporate purposes, which may include repurchases of CSX's common stock, capital investment, working capital requirements, improvements in productivity and other cost reductions at the Company’s major transportation units.
CSX 2019 Form 10-K p. 86
CSX CORPORATION
PART II
Item 8. Financial Statements and Supplementary Data
NOTE 10. Debt and Credit Agreements, continued
Long-term Debt Maturities (Net of Discounts, Premiums and Issuance Costs)
(Dollars in Millions) | Maturities at | ||
Fiscal Years Ending | December 2019 | ||
2020 | $ | ||
2021 | |||
2022 | |||
2023 | |||
2024 | |||
Thereafter | |||
Total Long-term Debt Maturities, including current portion | $ | ||
Credit Facilities
In March 2019, CSX replaced its existing $1.0 billion unsecured, revolving credit facility with a new $1.2 billion unsecured, revolving credit facility backed by a diverse syndicate of banks. The new facility allows same-day borrowings at floating interest rates, based on LIBOR or an agreed-upon replacement, plus a spread that depends upon CSX's senior unsecured debt ratings. LIBOR is the London Interbank Offered Rate which is a daily reference rate based on the interest rates at which banks offer to lend unsecured funds. This facility expires in March 2024, and as of December 31, 2019, the Company had no outstanding
balances under this facility.
Commitment fees and interest rates payable under the facility were similar to fees and rates available to comparably rated investment-grade borrowers. As of December 31, 2019, CSX was in compliance with all covenant requirements under the facility.
Commercial Paper
CSX 2019 Form 10-K p. 87
CSX CORPORATION
PART II
Item 8. Financial Statements and Supplementary Data
NOTE 11. Revenues
The Company’s revenues are primarily derived from the transportation of freight as performance obligations that arise from its contracts with customers are satisfied. The following table presents the Company’s revenues disaggregated by market as this best depicts how the nature, amount, timing and uncertainty of revenue and cash flows are affected by economic factors.
Fiscal Years | |||||||||
(Dollars in millions) | 2019 | 2018 | 2017 | ||||||
Chemicals | $ | $ | $ | ||||||
Agricultural and Food Products | |||||||||
Automotive | |||||||||
Forest Products | |||||||||
Metals and Equipment | |||||||||
Minerals | |||||||||
Fertilizers | |||||||||
Total Merchandise | |||||||||
Coal | |||||||||
Intermodal | |||||||||
Other | |||||||||
Total | $ | $ | $ | ||||||
Revenue Recognition
The Company generates revenue from freight billings under contracts with customers generally on a rate per carload, container or ton-basis based on length of haul and commodities carried. The Company’s performance obligation arises when it receives a bill of lading (“BOL”) to transport a customer's commodities at a negotiated price contained in a transportation services agreement or a publicly disclosed tariff rate. Once a BOL is received, a contract is formed whereby the parties are committed to perform, collectability of consideration is probable and the rights of the parties, shipping terms and conditions, and payment terms are identified. A customer may submit several BOLs for transportation services at various times throughout a service agreement term but each shipment represents a distinct service that is a separately identified performance obligation.
The average transit time to complete a shipment is between 3 to 8 days depending on market. Payments for transportation services are normally billed once a BOL is received and are generally due within 15 days after the invoice date. The Company recognizes revenue over transit time of freight as it moves from origin to destination. Revenue for services started but not completed at the reporting date is allocated based on the relative transit time in each reporting period, with the portion allocated for services subsequent to the reporting date considered remaining performance obligations.
CSX 2019 Form 10-K p. 88
CSX CORPORATION
PART II
Item 8. Financial Statements and Supplementary Data
NOTE 11. Revenues, continued
The certain key estimates included in the recognition and measurement of revenue and related accounts receivable are as follows:
• | Revenue associated with shipments in transit is recognized ratably over transit time and is based on average cycle times to move commodities and products from their origin to their final destination or interchange; |
• | Adjustments to revenue for billing corrections and billing discounts; |
• | Adjustments to revenue for overcharge claims filed by customers, which are based on historical payments to customers for rate overcharges as a percentage of total billing; and |
• | Incentive-based refunds to customers, which are primarily volume-related, are recorded as a reduction to revenue on the basis of the projected liability (this estimate is based on historical activity, current volume levels and forecasted future volume). |
Revenue related to interline transportation services that involve the services of another party, such as another railroad, is reported on a net basis. The portion of the gross amount billed to customers that is remitted by the Company to another party is not reflected as revenue.
Other revenue is comprised of revenue from regional subsidiary railroads and incidental charges, including demurrage and switching. It is recorded upon completion of the service and accounts for an immaterial percentage of the Company’s total revenue. Revenue from regional subsidiary railroads includes shipments by railroads that the Company does not directly operate. Demurrage represents charges assessed when freight cars are held by a customer beyond a specified period of time. Switching represents charges assessed when a railroad switches cars for a customer or another railroad.
During 2019, 2018 and 2017, revenue recognized from performance obligations related to prior periods (for example, due to changes in transaction price), was not material.
Remaining Performance Obligations
Remaining performance obligations represent the transaction price allocated to future reporting periods for freight services started but not completed at the reporting date. This includes the unearned portion of billed and unbilled amounts for cancellable freight shipments in transit. The Company expects to recognize the unearned portion of revenue for freight services in transit within one week of the reporting date. As of December 31, 2019, remaining performance obligations were not material.
Contract Balances and Accounts Receivable
CSX 2019 Form 10-K p. 89
CSX CORPORATION
PART II
Item 8. Financial Statements and Supplementary Data
NOTE 11. Revenues, continued
The Company’s accounts receivable - net consists of freight and non-freight receivables, reduced by an allowance for doubtful accounts.
(Dollars in millions) | December 31, 2019 | December 31, 2018 | ||||
Freight Receivables | $ | $ | ||||
Freight Allowance for Doubtful Accounts | ( | ) | ( | ) | ||
Freight Receivables, net | ||||||
Non-Freight Receivables | ||||||
Non-Freight Allowance for Doubtful Accounts | ( | ) | ( | ) | ||
Non-Freight Receivables, net | ||||||
Total Accounts Receivable, net | $ | $ | ||||
Freight receivables include amounts earned, billed and unbilled, and currently due from customers for transportation-related services. Non-freight receivables include amounts billed and unbilled and currently due related to government reimbursement receivables and other non-revenue receivables. The Company maintains an allowance for doubtful accounts to provide for the estimated amount of receivables that will not be collected. The allowance is based upon an assessment of customer creditworthiness, historical payment experience, the age of outstanding receivables and economic conditions. Impairment losses recognized on the Company’s accounts receivable were not material in 2019 and 2018.
NOTE 12. Income Taxes
Earnings before income taxes of $4.3 billion, $4.3 billion and $3.1 billion for fiscal years 2019, 2018 and 2017, respectively, represent earnings from domestic operations. The breakdown of income tax expense between current and deferred is as follows:
Fiscal Years | |||||||||||
(Dollars in Millions) | 2019 | 2018 | 2017 | ||||||||
Current: | |||||||||||
Federal | $ | $ | $ | ||||||||
State | |||||||||||
Subtotal Current | |||||||||||
Deferred: | |||||||||||
Federal | ( | ) | |||||||||
State | |||||||||||
Subtotal Deferred | ( | ) | |||||||||
Total | $ | $ | $ | ( | ) | ||||||
CSX 2019 Form 10-K p. 90
CSX CORPORATION
PART II
Item 8. Financial Statements and Supplementary Data
NOTE 12. Income Taxes, continued
The Company recorded a 2019 income tax benefit of $77 million primarily as a result of the additional tax benefit associated with vesting of share-based awards, the settlement of certain state tax matters, federal and state legislative change, and a change in the valuation of deferred taxes as a result of filing the 2018 tax returns.
The Company recorded a 2018 income tax benefit of $62 million primarily as a result of the additional tax benefit associated with vesting of share-based awards, state legislative changes, the settlement of certain state tax matters and a change in the valuation of deferred taxes as a result of filing the 2017 tax returns.
With the enactment of the Tax Cuts and Jobs Act (the "Act" or "tax reform") on December 22, 2017, the Company's 2017 financial results included a $3.5 billion, or $3.81 per share, non-cash reduction in income tax expense, primarily resulting from revaluing the Company's net deferred tax liabilities to reflect the enacted 21 % federal corporate tax rate effective January 1, 2018. During third quarter 2018, the Company filed its 2017 Federal Income Tax return which resulted in an immaterial adjustment to the deferred tax liability and tax expense. Accordingly, the Company's accounting for the federal rate reduction under the the Act is now complete.
The Company's affiliates also revalued their deferred tax liabilities to reflect the lower federal corporate tax rate, which resulted in the Company recognizing a benefit in 2017 of $142 million, or $0.10 per share after-tax, in equity earnings of affiliates, which is included in operating income. (See additional discussion over equity earnings of affiliates in Note 15, Related Parties and Affiliates.)
In addition to the tax benefit related to tax reform, the Company recorded a 2017 income tax benefit of $21 million primarily as a result of the additional tax benefit associated with vesting of share-based awards, state legislative changes, a change in the apportionment of state taxable income and the related impact on the valuation of deferred taxes and the settlement of certain state tax matters.
Income tax expense reconciled to the tax computed at statutory rates is presented in the following table.
Fiscal Years | ||||||||||||||||||||
(Dollars In Millions) | 2019 | 2018 | 2017 | |||||||||||||||||
Federal Income Taxes | $ | % | $ | % | $ | % | ||||||||||||||
State Income Taxes | % | % | % | |||||||||||||||||
Deferred Tax Rate Change | % | % | ( | ) | ( | )% | ||||||||||||||
Other | ( | ) | ( | )% | ( | ) | ( | )% | ( | ) | ( | )% | ||||||||
Income Tax (Benefit) Expense/Rate | $ | % | $ | % | $ | ( | ) | ( | )% | |||||||||||
CSX 2019 Form 10-K p. 91
CSX CORPORATION
PART II
Item 8. Financial Statements and Supplementary Data
NOTE 12. Income Taxes, continued
The primary factors in the change in year-end net deferred income tax liability balances include the annual provision for deferred income tax expense and accumulated other comprehensive income/loss. The significant components of deferred income tax assets and liabilities include:
2019 | 2018 | ||||||||||||||
(Dollars in Millions) | Assets | Liabilities | Assets | Liabilities | |||||||||||
Pension Plans | $ | $ | — | $ | $ | — | |||||||||
Other Employee Benefit Plans | — | — | |||||||||||||
Accelerated Depreciation | — | — | |||||||||||||
Other | |||||||||||||||
Total | $ | $ | $ | $ | |||||||||||
Net Deferred Income Tax Liabilities | $ | $ | |||||||||||||
The Company files a consolidated federal income tax return, which includes its principal domestic subsidiaries. CSX and its subsidiaries are subject to U.S. federal income tax as well as income tax of multiple state jurisdictions. CSX participated in a contemporaneous IRS audit of tax years 2019 and 2018. Federal examinations of original federal income tax returns for all years through 2017 are resolved.
As of December 2019, 2018 and 2017, the Company had approximately $13 million, $12 million and $24 million, respectively, of total unrecognized tax benefits as a result of uncertain tax positions. Net tax benefits of $10 million, $9 million and $19 million in 2019, 2018 and 2017, respectively, could favorably impact the effective income tax rate in each year. The Company does not expect that unrecognized tax benefits as of December 2019 for various state and federal income tax matters will significantly change over the next 12 months. The final outcome of these uncertain tax positions is not yet determinable. There were no material changes to the total gross unrecognized tax benefits and prior year audit resolutions of the Company during the fiscal year ended December 2019.
CSX’s continuing practice is to recognize net interest and penalties related to income tax matters in income tax expense. Included in the consolidated income statements is expense of $1 million in 2019, a benefit of $3 million in 2018, and expense of $3 million in 2017 for changes to reserves for interest and penalties for all prior year tax positions. The Company had $2 million, $2 million and $6 million accrued for interest and penalties at 2019, 2018 and 2017, respectively, for all prior year tax positions.
CSX 2019 Form 10-K p. 92
CSX CORPORATION
PART II
Item 8. Financial Statements and Supplementary Data
NOTE 13. Fair Value Measurements
The Financial Instruments Topic in the ASC requires disclosures about fair value of financial instruments in annual reports as well as in quarterly reports. For CSX, this statement applies to certain investments, pension plan assets and long-term debt. Also, the Fair Value Measurements and Disclosures Topic in the ASC clarifies the definition of fair value for financial reporting, establishes a framework for measuring fair value and requires additional disclosures about the use of fair value measurements.
Various inputs are considered when determining the value of the Company's investments, pension plan assets and long-term debt. The inputs or methodologies used for valuing securities are not necessarily an indication of the risk associated with investing in these securities. These inputs are summarized in the three broad levels listed below:
• | Level 1 – observable market inputs that are unadjusted quoted prices for identical assets or liabilities in active markets; |
• | Level 2 – other significant observable inputs (including quoted prices for similar securities, interest rates, credit risk, etc.); and |
• | Level 3 – significant unobservable inputs (including the Company’s own assumptions about the assumptions market participants would use in determining the fair value of investments). |
The valuation methods described below may produce a fair value calculation that may not be indicative of net realizable value or reflective of future fair values. Furthermore, while the Company believes its valuation methods are appropriate and consistent with other market participants, the use of different methodologies or assumptions to determine the fair value of certain financial instruments could result in a different fair value measurement at the reporting date.
Investments
The Company's investment assets, valued with assistance from a third-party trustee, consist of certificates of deposits, commercial paper, corporate bonds and government securities and are carried at fair value on the consolidated balance sheet per the Fair Value Measurements and Disclosures Topic in the ASC. There are several valuation methodologies used for those assets as described below:
• | Certificates of Deposit and Commercial Paper (Level 2): Valued at amortized cost, which approximates fair value; and |
• | Corporate Bonds and Government Securities (Level 2): Valued using broker quotes that utilize observable market inputs. |
CSX 2019 Form 10-K p. 93
CSX CORPORATION
PART II
Item 8. Financial Statements and Supplementary Data
NOTE 13. Fair Value Measurements, continued
The Company's investment assets are carried at fair value on the consolidated balance sheets as summarized in the following table. All of the inputs used to determine the fair value of the Company's investments are Level 2 inputs. The amortized cost basis of these investments was $1.1 billion and $340 million as of December 31, 2019 and December 31, 2018, respectively.
Fiscal Years | |||||||
2019 | 2018 | ||||||
(Dollars in Millions) | Level 2 | Level 2 | |||||
Certificates of Deposit and Commercial Paper | $ | $ | |||||
Corporate Bonds | |||||||
Government Securities | |||||||
Total investments at fair value | $ | $ | |||||
These investments have the following maturities and are represented on the consolidated balance sheet within short-term investments for investments with maturities of less than one year, and other long-term assets for investments with maturities of one year and greater:
(Dollars in Millions) | December 2019 | December 2018 | |||||
Less than 1 year | $ | $ | |||||
1 - 5 years | |||||||
5 - 10 years | |||||||
Greater than 10 years | |||||||
Total investments at fair value | $ | $ | |||||
Long-term Debt
Long-term debt is reported at carrying amount on the consolidated balance sheets and is the Company's only financial instrument with fair values significantly different from their carrying amounts. The majority of the Company's long-term debt is valued with assistance from a third party that utilizes closing transactions, market quotes or market values of comparable debt. For those instruments not valued by the third party, the fair value has been estimated by applying market rates of similar instruments to the scheduled contractual debt payments and maturities. These market rates are provided by the same third party. All of the inputs used to determine the fair value of the Company's long-term debt are Level 2 inputs.
The fair value of outstanding debt fluctuates with changes in a number of factors. Such factors include, but are not limited to, interest rates, market conditions, credit ratings, values of similar financial instruments, size of the transaction, cash flow projections and comparable trades. Fair value will exceed carrying value when the current market interest rate is lower than the interest rate at which the debt was originally issued. The fair value of a company's debt is a measure of its current value under present market conditions. It does not impact the financial statements under current accounting rules.
CSX 2019 Form 10-K p. 94
CSX CORPORATION
PART II
Item 8. Financial Statements and Supplementary Data
NOTE 13. Fair Value Measurements, continued
The fair value and carrying value of the Company's long-term debt is as follows:
(Dollars in Millions) | December 2019 | December 2018 | |||||
Long-term Debt (Including Current Maturities): | |||||||
Fair Value | $ | $ | |||||
Carrying Value | |||||||
Pension Plan Assets
Pension plan assets are reported at fair value, net of pension liabilities, on the consolidated balance sheet. The Investment Committee targets an allocation of pension assets to be generally 60 % equity and 40 % fixed income. There are several valuation methodologies used for those assets as described below.
Investments in the Fair Value Hierarchy
• | Common stock (Level 1): Valued at the closing price reported on the active market on which the individual securities are traded on the last day of the year and classified in Level 1 of the fair value hierarchy. |
• | Mutual funds (Level 1): Valued at the net asset value of shares held at year end based on quoted market prices determined in an active market. These assets are classified in Level 1 of the fair value hierarchy. |
• | Cash and cash equivalents (Level 1): Includes cash and short term investments with an original maturity of three months or less. The carrying value of cash and cash equivalents at year end approximates fair value. These assets are classified in Level 1 of the fair value hierarchy. |
• | Corporate bonds, government securities, asset-backed securities and derivatives (Level 2): Valued using price evaluations reflecting the bid and/or ask sides of the market for a similar investment at year end. Asset-backed securities include commercial mortgage-backed securities and collateralized mortgage obligations. These assets are classified in Level 2 of the fair value hierarchy. |
Investments Measured at Net Asset Value
• | Partnerships: Net asset value of private equity is based on the fair market values associated with the underlying investments at year end. These funds have redemption restrictions that require advanced notice of 15 business days. |
• | Common collective trust funds: This class consists of private funds that invest in government and corporate securities and various short-term debt instruments and are measured at net asset value to estimate the fair value of the investments. The net asset value of the investments is determined by reference to the fair value of the underlying securities, which are valued primarily through the use of directly or indirectly observable inputs. These funds have redemption restrictions that require advanced notice of up to 15 business days. |
CSX 2019 Form 10-K p. 95
CSX CORPORATION
PART II
Item 8. Financial Statements and Supplementary Data
NOTE 13. Fair Value Measurements, continued
The pension plan assets at fair value by level, within the fair value hierarchy, as of calendar plan years 2019 and 2018 are shown in the table below. For additional information related to pension assets, see Note 9, Employee Benefit Plans.
Fiscal Years | |||||||||||||||||||||||
2019 | 2018 | ||||||||||||||||||||||
(Dollars in Millions) | Level 1 | Level 2 | Total | Level 1 | Level 2 | Total | |||||||||||||||||
Common Stock | $ | $ | $ | $ | $ | $ | |||||||||||||||||
Mutual funds | |||||||||||||||||||||||
Cash and cash equivalents | |||||||||||||||||||||||
Corporate bonds | |||||||||||||||||||||||
Government securities | |||||||||||||||||||||||
Asset-backed securities | |||||||||||||||||||||||
Derivatives and other | |||||||||||||||||||||||
Total investments in the fair value hierarchy | $ | $ | $ | $ | $ | $ | |||||||||||||||||
Investments measured at net asset value (a) | n/a | n/a | $ | n/a | n/a | $ | |||||||||||||||||
Investments at fair value | $ | $ | $ | $ | $ | $ | |||||||||||||||||
NOTE 14. Other Income - Net
The Company derives income from items that are not considered operating activities. Income from these items is reported net of related expense. All components of net periodic pension and post-retirement benefit costs, excluding service cost, are included in other income - net on the consolidated income statement. Miscellaneous income (expense) may fluctuate due to timing and includes investment gains, losses and interest income as well as other non-operating activities.
Interest income increased from 2018 to 2019, and from 2017 to 2018, primarily as a result of higher average investment balances. Miscellaneous expense in 2019 includes $10 million of costs associated with the early redemption of long-term debt. Other income – net consisted of the following:
Fiscal Years | |||||||||||
(Dollars in Millions) | 2019 | 2018 | 2017 | ||||||||
Net Periodic Pension and Post-retirement Benefit Credit (a) | $ | $ | $ | ||||||||
Interest Income | |||||||||||
Miscellaneous (Expense) Income | ( | ) | |||||||||
Total Other Income - Net | $ | $ | $ | ||||||||
CSX 2019 Form 10-K p. 96
CSX CORPORATION
PART II
Item 8. Financial Statements and Supplementary Data
NOTE 15. Related Parties and Affiliates
Conrail
Through a limited liability company, CSX and Norfolk Southern Corporation (“NS”) jointly own Conrail. CSX has a 42 % economic interest and 50 % voting interest in the jointly-owned entity, and NS has the remainder of the economic and voting interests. CSX's investment of $982 million is included on the consolidated balance sheet as investment in Conrail. Pursuant to the Investments-Equity Method and Joint Venture Topic in the ASC, CSX applies the equity method of accounting to its investment in Conrail.
Conrail owns rail infrastructure and operates for the joint benefit of CSX and NS. This is known as the shared asset area. Conrail charges fees for right-of-way usage, equipment rentals and transportation, switching and terminal service charges in the shared asset area. These expenses are included in materials, supplies and other on the consolidated income statements. Future payments due to Conrail under the shared asset area agreements are shown in the table below.
(Dollars in Millions) | Conrail Shared | ||
Years | Asset Agreement | ||
2020 | $ | ||
2021 | |||
2022 | |||
2023 | |||
2024 | |||
Thereafter | |||
Total | $ | ||
Also, included in equity earnings of affiliates are CSX’s 42 percent share of Conrail’s income and its amortization of the fair value write-up arising from the acquisition of Conrail and certain other adjustments. The amortization primarily represents the additional after-tax depreciation expense related to the write-up of Conrail’s fixed assets when the original purchase price, from the 1997 acquisition of Conrail, was allocated based on fair value. This write-up of fixed assets resulted in a difference between CSX's investment in Conrail and its share of Conrail's underlying net equity, which is $339 million as of December 2019.
CSX 2019 Form 10-K p. 97
CSX CORPORATION
PART II
Item 8. Financial Statements and Supplementary Data
NOTE 15. Related Parties and Affiliates, continued
The following table discloses amounts related to Conrail. Purchase price amortization and equity earnings are included in equity earnings of affiliates and all other amounts in the table are included in materials, supplies and other expenses on the Company’s consolidated income statements.
Fiscal Years | |||||||||||
(Dollars in Millions) | 2019 | 2018 | 2017 | ||||||||
Rents, fees and services | $ | $ | $ | ||||||||
Purchase price amortization and other | |||||||||||
Equity earnings of Conrail | ( | ) | ( | ) | ( | ) | |||||
Total Conrail Expense | $ | $ | $ | ||||||||
As required by the Related Party Disclosures Topic in the ASC, the Company has identified amounts below owed to Conrail, or its subsidiaries, representing liabilities under the operating, equipment and shared area agreements with Conrail. In 2014, the Company executed two promissory notes with a subsidiary of Conrail which were included in long-term debt on the consolidated balance sheets. Interest expense from these promissory notes was $6 million in each 2019, 2018 and 2017.
December | December | ||||||
(Dollars in Millions) | 2019 | 2018 | |||||
Balance Sheet Information: | |||||||
CSX accounts payable to Conrail | $ | $ | |||||
Promissory notes payable to Conrail subsidiary | |||||||
2.89% CSX promissory note due October 2044 | |||||||
2.89% CSXT promissory note due October 2044 | |||||||
TTX Company
TTX Company ("TTX") is a privately-held corporation engaged in the business of providing its owner-railroads with standardized fleets of intermodal, automotive and general use railcars at time and mileage rates. CSX owns about 20 percent of TTX's common stock, and the remaining is owned by the other leading North American railroads and their affiliates. CSX's investment in TTX is $743 million and is included in affiliates and other companies in the consolidated balance sheet. Pursuant to the Investments-Equity Method topic in the ASC, CSX applies the equity method of accounting to its investment in TTX.
CSX 2019 Form 10-K p. 98
CSX CORPORATION
PART II
Item 8. Financial Statements and Supplementary Data
NOTE 15. Related Parties and Affiliates, continued
As required by the Related Party Disclosures Topic in the ASC, the following table discloses amounts related to TTX. Car hire rents are included in equipment and other rents expense and equity earnings are included in equity earnings of affiliates in the Company’s consolidated income statements. Also included below is balance sheet information related to CSX's payable to TTX, which represents car rental liabilities.
Fiscal Years | |||||||||||
(Dollars in Millions) | 2019 | 2018 | 2017 | ||||||||
Income statement information: | |||||||||||
Car hire rents | $ | $ | $ | ||||||||
Equity earnings of TTX | ( | ) | ( | ) | ( | ) | |||||
Total TTX expense | $ | $ | $ | ||||||||
December | December | |||||||
Balance sheet information: | 2019 | 2018 | ||||||
CSX payable to TTX | $ | $ | ||||||
Tax Reform Effect on Equity Earnings of Affiliates
Due to the enactment of tax reform, the Company recognized a benefit in 2017 of $142 million, or $0.10 per share after-tax, in its equity earnings of affiliates. This benefit was primarily the result of the Company's affiliates (primarily TTX and Conrail) revaluing their deferred tax liabilities to reflect the lower federal corporate tax rate, which favorably impacted their net earnings for 2017. See additional discussion of tax reform in Note 12, Income Taxes.
Other Related Party Transactions
On October 17, 2019, the Company repurchased 4.7 million shares for $319 million from MR Argent Advisor LLC, a CSX shareholder. See additional discussion in Note 2, Earnings Per Share.
NOTE 16. Other Comprehensive Income / (Loss)
CSX reports comprehensive earnings or loss in accordance with the Comprehensive Income Topic in the ASC in the consolidated comprehensive income statement. Total comprehensive earnings are defined as all changes in shareholders' equity during a period, other than those resulting from investments by and distributions to shareholders (e.g. issuance of equity securities and dividends). Generally, for CSX, total comprehensive earnings equal net earnings plus or minus adjustments for pension and other post-retirement liabilities. Total comprehensive earnings represent the activity for a period net of tax and were $3.3 billion, $3.1 billion and $5.6 billion for 2019, 2018 and 2017, respectively.
CSX 2019 Form 10-K p. 99
CSX CORPORATION
PART II
Item 8. Financial Statements and Supplementary Data
NOTE 16. Other Comprehensive Income / (Loss), continued
While total comprehensive earnings is the activity in a period and is largely driven by net earnings in that period, accumulated other comprehensive income or loss (“AOCI”) represents the cumulative balance of other comprehensive income, net of tax, as of the balance sheet date. For CSX, AOCI is primarily the cumulative balance related to pension and other post-retirement benefit adjustments and CSX's share of AOCI of equity method investees.
Changes in the AOCI balance by component are shown in the following table. Amounts reclassified in pension and other post-employment benefits to net earnings relate to the amortization of actuarial losses and are included in other income-net on the consolidated income statements. See Note 9. Employee Benefit Plans for further information. Other primarily represents CSX's share of AOCI of equity method investees. Amounts reclassified in other to net earnings are included in equity earnings of affiliates on the consolidated income statements.
Pension and Other Post-Employment Benefits | Other | Accumulated Other Comprehensive Income (Loss) | |||||||
(Dollars in millions) | |||||||||
Balance December 30, 2016 - Net of Tax | $ | ( | ) | $ | ( | ) | $ | ( | ) |
Other Comprehensive Income (Loss) | |||||||||
Income Before Reclassifications | |||||||||
Amounts Reclassified to Net Earnings | |||||||||
Tax Expense | ( | ) | ( | ) | ( | ) | |||
Total Other Comprehensive Income | |||||||||
Balance December 31, 2017 - Net of Tax | ( | ) | ( | ) | ( | ) | |||
Other Comprehensive Income (Loss) | |||||||||
Reclassification of Stranded Tax Effects (a) | ( | ) | ( | ) | |||||
Loss Before Reclassifications | ( | ) | ( | ) | ( | ) | |||
Amounts Reclassified to Net Earnings | ( | ) | |||||||
Tax Benefit | |||||||||
Total Other Comprehensive Loss | ( | ) | ( | ) | ( | ) | |||
Balance December 31, 2018 - Net of Tax | ( | ) | ( | ) | ( | ) | |||
Other Comprehensive Income (Loss) | |||||||||
Loss Before Reclassifications | ( | ) | ( | ) | ( | ) | |||
Amounts Reclassified to Net Earnings | |||||||||
Tax Benefit | ( | ) | |||||||
Total Other Comprehensive (Loss) Income | ( | ) | ( | ) | |||||
Balance December 31, 2019 - Net of Tax | $ | ( | ) | $ | ( | ) | $ | ( | ) |
CSX 2019 Form 10-K p. 100
CSX CORPORATION
PART II
Item 8. Financial Statements and Supplementary Data
NOTE 17. Quarterly Financial Data (Unaudited)
Pursuant to Article 3 of the SEC’s Regulation S-X, the following are selected quarterly financial data:
Fiscal Year Ended December 2019 | Quarters | ||||||||||||||||||
(Dollars in Millions, Except Per Share Amounts) | 1st | 2nd | 3rd | 4th | Full Year | ||||||||||||||
Revenue | $ | $ | $ | $ | $ | ||||||||||||||
Operating Income | |||||||||||||||||||
Net Earnings | |||||||||||||||||||
Earnings Per Share, Basic | $ | $ | $ | $ | $ | ||||||||||||||
Earnings Per Share, Assuming Dilution | |||||||||||||||||||
Fiscal Year Ended December 2018 | |||||||||||||||||||
Revenue | $ | $ | $ | $ | $ | ||||||||||||||
Operating Income | |||||||||||||||||||
Net Earnings | |||||||||||||||||||
Earnings Per Share, Basic | $ | $ | $ | $ | $ | ||||||||||||||
Earnings Per Share, Assuming Dilution | |||||||||||||||||||
NOTE 18. Summarized Consolidating Financial Data
In 2007, CSXT, a wholly-owned subsidiary of CSX Corporation, sold secured equipment notes maturing in 2023 in a registered public offering. CSX has fully and unconditionally guaranteed the notes. In connection with the notes, the Company is providing the following condensed consolidating financial information in accordance with SEC disclosure requirements. Each entity in the consolidating financial information follows the same accounting policies as described in the consolidated financial statements, except for the use of the equity method of accounting to reflect ownership interests in subsidiaries which are eliminated upon consolidation and the allocation of certain expenses of CSX incurred for the benefit of its subsidiaries. Condensed consolidating financial information for the obligor, CSXT, and parent guarantor, CSX, is shown in the following tables.
CSX 2019 Form 10-K p. 101
CSX CORPORATION
PART II
Item 8. Financial Statements and Supplementary Data
NOTE 18. Summarized Consolidating Financial Data, continued
Consolidating Income Statements
(Dollars in Millions)
Fiscal Year Ended December 2019 | CSX Corporation | CSX Transportation | Eliminations and Other | CSX Consolidated | |||||||||||
Revenue | $ | $ | $ | $ | |||||||||||
Expense | ( | ) | ( | ) | |||||||||||
Operating Income | |||||||||||||||
Equity in Earnings of Subsidiaries | ( | ) | |||||||||||||
Interest Expense | ( | ) | ( | ) | ( | ) | |||||||||
Other Income - Net | ( | ) | |||||||||||||
Earnings Before Income Taxes | ( | ) | |||||||||||||
Income Tax Benefit (Expense) | ( | ) | ( | ) | ( | ) | |||||||||
Net Earnings | $ | $ | $ | ( | ) | $ | |||||||||
Total Comprehensive Earnings | $ | $ | $ | ( | ) | $ | |||||||||
Fiscal Year Ended December 2018 | |||||||||||||||
Revenue | $ | $ | $ | $ | |||||||||||
Expense | ( | ) | ( | ) | |||||||||||
Operating Income | |||||||||||||||
Equity in Earnings of Subsidiaries | ( | ) | |||||||||||||
Interest Expense | ( | ) | ( | ) | ( | ) | |||||||||
Other Income - Net | ( | ) | |||||||||||||
Earnings Before Income Taxes | ( | ) | |||||||||||||
Income Tax Benefit (Expense) | ( | ) | ( | ) | ( | ) | |||||||||
Net Earnings | $ | $ | $ | ( | ) | $ | |||||||||
Total Comprehensive Earnings | $ | $ | $ | ( | ) | $ | |||||||||
Fiscal Year Ended December 2017 | |||||||||||||||
Revenue | $ | $ | $ | $ | |||||||||||
Expense | ( | ) | ( | ) | |||||||||||
Operating Income | |||||||||||||||
Equity in Earnings of Subsidiaries | ( | ) | |||||||||||||
Interest Expense | ( | ) | ( | ) | ( | ) | |||||||||
Other Income - Net | ( | ) | ( | ) | ( | ) | |||||||||
Earnings Before Income Taxes | ( | ) | |||||||||||||
Income Tax Benefit | |||||||||||||||
Net Earnings | $ | $ | $ | ( | ) | $ | |||||||||
Total Comprehensive Earnings | $ | $ | $ | ( | ) | $ | |||||||||
CSX 2019 Form 10-K p. 102
CSX CORPORATION
PART II
Item 8. Financial Statements and Supplementary Data
NOTE 18. Summarized Consolidating Financial Data, continued
Consolidating Balance Sheets
(Dollars in Millions)
As of December 31, 2019 | CSX Corporation | CSX Transportation | Eliminations and Other | CSX Consolidated | |||||||||||
ASSETS | |||||||||||||||
Current Assets: | |||||||||||||||
Cash and Cash Equivalents | $ | $ | $ | $ | |||||||||||
Short-term Investments | |||||||||||||||
Accounts Receivable - Net | |||||||||||||||
Receivable from Affiliates | ( | ) | |||||||||||||
Materials and Supplies | |||||||||||||||
Other Current Assets | |||||||||||||||
Total Current Assets | ( | ) | |||||||||||||
Properties | |||||||||||||||
Accumulated Depreciation | ( | ) | ( | ) | ( | ) | ( | ) | |||||||
Properties - Net | |||||||||||||||
Investments in Conrail | |||||||||||||||
Affiliates and Other Companies | ( | ) | |||||||||||||
Investment in Consolidated Subsidiaries | ( | ) | |||||||||||||
Right of Use Lease Asset | |||||||||||||||
Other Long-term Assets | ( | ) | |||||||||||||
Total Assets | $ | $ | $ | ( | ) | $ | |||||||||
LIABILITIES AND SHAREHOLDERS' EQUITY | |||||||||||||||
Current Liabilities: | |||||||||||||||
Accounts Payable | $ | $ | $ | $ | |||||||||||
Labor and Fringe Benefits Payable | |||||||||||||||
Payable to Affiliates | ( | ) | |||||||||||||
Casualty, Environmental and Other Reserves | |||||||||||||||
Current Maturities of Long-term Debt | |||||||||||||||
Income and Other Taxes Payable | ( | ) | |||||||||||||
Other Current Liabilities | |||||||||||||||
Total Current Liabilities | ( | ) | |||||||||||||
Casualty, Environmental and Other Reserves | |||||||||||||||
Long-term Debt | |||||||||||||||
Deferred Income Taxes - Net | ( | ) | |||||||||||||
Long-term Lease Liability | |||||||||||||||
Other Long-term Liabilities | ( | ) | |||||||||||||
Total Liabilities | ( | ) | |||||||||||||
Shareholders' Equity: | |||||||||||||||
Common Stock, $1 Par Value | ( | ) | |||||||||||||
Other Capital | ( | ) | |||||||||||||
Retained Earnings | ( | ) | |||||||||||||
Accumulated Other Comprehensive Loss | ( | ) | ( | ) | ( | ) | |||||||||
Noncontrolling Minority Interest | |||||||||||||||
Total Shareholders' Equity | ( | ) | |||||||||||||
Total Liabilities and Shareholders' Equity | $ | $ | $ | ( | ) | $ | |||||||||
CSX 2019 Form 10-K p. 103
CSX CORPORATION
PART II
Item 8. Financial Statements and Supplementary Data
NOTE 18. Summarized Consolidating Financial Data, continued
Consolidating Balance Sheets
(Dollars in Millions)
As of December 31, 2018 | CSX Corporation | CSX Transportation | Eliminations and Other | CSX Consolidated | |||||||||||
ASSETS | |||||||||||||||
Current Assets | |||||||||||||||
Cash and Cash Equivalents | $ | $ | $ | $ | |||||||||||
Short-term Investments | |||||||||||||||
Accounts Receivable - Net | |||||||||||||||
Receivable from Affiliates | ( | ) | |||||||||||||
Materials and Supplies | |||||||||||||||
Other Current Assets | |||||||||||||||
Total Current Assets | ( | ) | |||||||||||||
Properties | |||||||||||||||
Accumulated Depreciation | ( | ) | ( | ) | ( | ) | ( | ) | |||||||
Properties - Net | |||||||||||||||
Investments in Conrail | |||||||||||||||
Affiliates and Other Companies | ( | ) | |||||||||||||
Investment in Consolidated Subsidiaries | ( | ) | |||||||||||||
Other Long-term Assets | ( | ) | |||||||||||||
Total Assets | $ | $ | $ | ( | ) | $ | |||||||||
LIABILITIES AND SHAREHOLDERS' EQUITY | |||||||||||||||
Current Liabilities | |||||||||||||||
Accounts Payable | $ | $ | $ | $ | |||||||||||
Labor and Fringe Benefits Payable | |||||||||||||||
Payable to Affiliates | ( | ) | |||||||||||||
Casualty, Environmental and Other Reserves | |||||||||||||||
Current Maturities of Long-term Debt | |||||||||||||||
Income and Other Taxes Payable | ( | ) | |||||||||||||
Other Current Liabilities | |||||||||||||||
Total Current Liabilities | ( | ) | |||||||||||||
Casualty, Environmental and Other Reserves | |||||||||||||||
Long-term Debt | |||||||||||||||
Deferred Income Taxes - Net | ( | ) | |||||||||||||
Other Long-term Liabilities | ( | ) | |||||||||||||
Total Liabilities | ( | ) | |||||||||||||
Shareholders' Equity | |||||||||||||||
Common Stock, $1 Par Value | ( | ) | |||||||||||||
Other Capital | ( | ) | |||||||||||||
Retained Earnings | ( | ) | |||||||||||||
Accumulated Other Comprehensive Loss | ( | ) | ( | ) | ( | ) | |||||||||
Noncontrolling Minority Interest | |||||||||||||||
Total Shareholders' Equity | ( | ) | |||||||||||||
Total Liabilities and Shareholders' Equity | $ | $ | $ | ( | ) | $ | |||||||||
CSX 2019 Form 10-K p. 104
CSX CORPORATION
PART II
Item 8. Financial Statements and Supplementary Data
NOTE 18. Summarized Consolidating Financial Data, continued
Consolidating Cash Flow Statements
(Dollars in Millions)
Fiscal Year Ended December 2019 | CSX Corporation | CSX Transportation | Eliminations and Other | CSX Consolidated | |||||||||||
Operating Activities | |||||||||||||||
Net Cash Provided by (Used in) Operating Activities | $ | $ | $ | ( | ) | $ | |||||||||
Investing Activities | |||||||||||||||
Property Additions | ( | ) | ( | ) | ( | ) | |||||||||
Purchases of Short-term Investments | ( | ) | ( | ) | |||||||||||
Proceeds from Sales of Short-term Investments | |||||||||||||||
Proceeds from Property Dispositions | |||||||||||||||
Other Investing Activities | |||||||||||||||
Net Cash Used in Investing Activities | ( | ) | ( | ) | ( | ) | ( | ) | |||||||
Financing Activities | |||||||||||||||
Long-term Debt Issued | |||||||||||||||
Long-term Debt Repaid | ( | ) | ( | ) | ( | ) | |||||||||
Dividends Paid | ( | ) | ( | ) | ( | ) | |||||||||
Shares Repurchased | ( | ) | ( | ) | |||||||||||
Other Financing Activities | ( | ) | |||||||||||||
Net Cash (Used in) Provided by Financing Activities | ( | ) | ( | ) | ( | ) | |||||||||
Net Increase in Cash and Cash Equivalents | ( | ) | |||||||||||||
Cash and Cash Equivalents at Beginning of Period | |||||||||||||||
Cash and Cash Equivalents at End of Period | $ | $ | $ | $ | |||||||||||
CSX 2019 Form 10-K p. 105
CSX CORPORATION
PART II
Item 8. Financial Statements and Supplementary Data
NOTE 18. Summarized Consolidating Financial Data, continued
Consolidating Cash Flow Statements
(Dollars in Millions)
Fiscal Year Ended December 2018 | CSX Corporation | CSX Transportation | Eliminations and Other | CSX Consolidated | |||||||||||
Operating Activities | |||||||||||||||
Net Cash Provided by (Used in) Operating Activities | $ | $ | $ | ( | ) | $ | |||||||||
Investing Activities | |||||||||||||||
Property Additions | ( | ) | ( | ) | ( | ) | |||||||||
Purchases of Short-term Investments | ( | ) | ( | ) | ( | ) | |||||||||
Proceeds from Sales of Short-term Investments | |||||||||||||||
Proceeds from Property Dispositions | |||||||||||||||
Other Investing Activities | ( | ) | ( | ) | ( | ) | |||||||||
Net Cash Used in Investing Activities | ( | ) | ( | ) | ( | ) | ( | ) | |||||||
Financing Activities | |||||||||||||||
Long-term Debt Issued | |||||||||||||||
Long-term Debt Repaid | ( | ) | ( | ) | |||||||||||
Dividends Paid | ( | ) | ( | ) | ( | ) | |||||||||
Shares Repurchased | ( | ) | ( | ) | |||||||||||
Other Financing Activities | ( | ) | ( | ) | ( | ) | |||||||||
Net Cash (Used in) Provided by Financing Activities | ( | ) | ( | ) | ( | ) | |||||||||
Net Decrease in Cash and Cash Equivalents | |||||||||||||||
Cash and Cash Equivalents at Beginning of Period | |||||||||||||||
Cash and Cash Equivalents at End of Period | $ | $ | $ | $ | |||||||||||
CSX 2019 Form 10-K p. 106
CSX CORPORATION
PART II
Item 8. Financial Statements and Supplementary Data
NOTE 18. Summarized Consolidating Financial Data, continued
Consolidating Cash Flow Statements
(Dollars in Millions)
Fiscal Year Ended December 2017 | CSX Corporation | CSX Transportation | Eliminations and Other | CSX Consolidated | |||||||||||
Operating Activities | |||||||||||||||
Net Cash Provided by (Used in) Operating Activities | $ | $ | $ | ( | ) | $ | |||||||||
Investing Activities | |||||||||||||||
Property Additions | ( | ) | ( | ) | ( | ) | |||||||||
Purchases of Short-term Investments | ( | ) | ( | ) | ( | ) | |||||||||
Proceeds from Sales of Short-term Investments | |||||||||||||||
Proceeds from Property Dispositions | |||||||||||||||
Other Investing Activities | ( | ) | ( | ) | |||||||||||
Net Cash Provided by (Used in) Investing Activities | ( | ) | ( | ) | ( | ) | |||||||||
Financing Activities | |||||||||||||||
Long-term Debt Issued | |||||||||||||||
Long-term Debt Repaid | ( | ) | ( | ) | ( | ) | |||||||||
Dividends Paid | ( | ) | ( | ) | ( | ) | |||||||||
Shares Repurchased | ( | ) | ( | ) | |||||||||||
Other Financing Activities | ( | ) | ( | ) | |||||||||||
Net Cash (Used in) Provided by Financing Activities | ( | ) | ( | ) | ( | ) | |||||||||
Net (Decrease) Increase in Cash and Cash Equivalents | ( | ) | ( | ) | ( | ) | ( | ) | |||||||
Cash and Cash Equivalents at Beginning of Period | |||||||||||||||
Cash and Cash Equivalents at End of Period | $ | $ | $ | $ | |||||||||||
CSX 2019 Form 10-K p. 107
CSX CORPORATION
PART II
Item 9. Changes in and Disagreements with Accountants on Accounting and Financial Disclosure
None
Item 9A. Controls and Procedures
Evaluation of Disclosure Controls and Procedures
As of December 31, 2019, under the supervision and with the participation of CSX's Chief Executive Officer (“CEO”) and Chief Financial Officer (“CFO”), management has evaluated the effectiveness of the design and operation of the Company's disclosure controls and procedures. Based on that evaluation, the CEO and CFO concluded that, as of December 31, 2019, the Company's disclosure controls and procedures were effective at the reasonable assurance level in timely alerting them to material information required to be included in CSX’s periodic SEC reports.
Management's Report on Internal Control over Financial Reporting
CSX’s management is responsible for establishing and maintaining adequate internal control over financial reporting, as such term is defined in Exchange Act Rules 13a-15(f) and 15d-15(f). Under the supervision and with the participation of the management of CSX, including CSX’s CEO and CFO, CSX conducted an evaluation of the effectiveness of the Company’s internal control over financial reporting as of December 31, 2019 based on the 2013 framework in Internal Control – Integrated Framework issued by the Committee of Sponsoring Organizations of the Treadway Commission, which is also referred to as COSO. Based on that evaluation, management of CSX concluded that the Company’s internal control over financial reporting was effective as of December 31, 2019. Management's assessment of the effectiveness of internal control over financial reporting is expressed at the level of reasonable assurance because a control system, no matter how well designed and operated, can provide only reasonable, but not absolute, assurance that the control system's objectives will be met.
The Company’s internal control over financial reporting as of December 31, 2019 has been audited by Ernst & Young LLP, an independent registered public accounting firm, as stated in their report which is included elsewhere herein.
CSX 2019 Form 10-K p. 108
CSX CORPORATION
PART II
REPORT OF INDEPENDENT REGISTERED PUBLIC ACCOUNTING FIRM
To the Shareholders and the Board of Directors of CSX Corporation
Opinion on Internal Control Over Financial Reporting
We have audited CSX Corporation’s internal control over financial reporting as of December 31, 2019, based on criteria established in Internal Control-Integrated Framework issued by the Committee of Sponsoring Organizations of the Treadway Commission (2013 framework) (the COSO criteria). In our opinion, CSX Corporation (the Company) maintained, in all material respects, effective internal control over financial reporting as of December 31, 2019, based on the COSO criteria.
We also have audited, in accordance with the standards of the Public Company Accounting Oversight Board (United States) (PCAOB), the consolidated balance sheets of CSX Corporation as of December 31, 2019 and 2018, and the related consolidated statements of income, comprehensive income, cash flows, and changes in shareholders’ equity for each of the three years in the period ended December 31, 2019, and the related notes of the Company and our report dated February 12, 2020 expressed an unqualified opinion thereon.
Basis for Opinion
The Company’s management is responsible for maintaining effective internal control over financial reporting and for its assessment of the effectiveness of internal control over financial reporting included in the accompanying Management’s Report on Internal Control over Financial Reporting. Our responsibility is to express an opinion on the Company’s internal control over financial reporting based on our audit. We are a public accounting firm registered with the PCAOB and are required to be independent with respect to the Company in accordance with the U.S. federal securities laws and the applicable rules and regulations of the Securities and Exchange Commission and the PCAOB.
We conducted our audit in accordance with the standards of the PCAOB. Those standards require that we plan and perform the audit to obtain reasonable assurance about whether effective internal control over financial reporting was maintained in all material respects.
Our audit included obtaining an understanding of internal control over financial reporting, assessing the risk that a material weakness exists, testing and evaluating the design and operating effectiveness of internal control based on the assessed risk, and performing such other procedures as we considered necessary in the circumstances. We believe that our audit provides a reasonable basis for our opinion.
CSX 2019 Form 10-K p. 109
CSX CORPORATION
PART II
REPORT OF INDEPENDENT REGISTERED PUBLIC ACCOUNTING FIRM, continued
Definition and Limitations of Internal Control over Financial Reporting
A company’s internal control over financial reporting is a process designed to provide reasonable assurance regarding the reliability of financial reporting and the preparation of financial statements for external purposes in accordance with generally accepted accounting principles. A company’s internal control over financial reporting includes those policies and procedures that (1) pertain to the maintenance of records that, in reasonable detail, accurately and fairly reflect the transactions and dispositions of the assets of the company; (2) provide reasonable assurance that transactions are recorded as necessary to permit preparation of financial statements in accordance with generally accepted accounting principles, and that receipts and expenditures of the company are being made only in accordance with authorizations of management and directors of the company; and (3) provide reasonable assurance regarding prevention or timely detection of unauthorized acquisition, use, or disposition of the company’s assets that could have a material effect on the financial statements.
Because of its inherent limitations, internal control over financial reporting may not prevent or detect misstatements. Also, projections of any evaluation of effectiveness to future periods are subject to the risk that controls may become inadequate because of changes in conditions, or that the degree of compliance with the policies or procedures may deteriorate.
/s/ Ernst & Young LLP
Jacksonville, Florida
February 12, 2020
CSX 2019 Form 10-K p. 110
CSX CORPORATION
PART II
Changes in Internal Control over Financial Reporting
There were no material changes in the Company’s internal control over financial reporting.
Item 9B. Other Information
None
PART III
Item 10. Directors, Executive Officers of the Registrant and Corporate Governance
In accordance with Instruction G(3) of Form 10-K, the information required by this item is incorporated herein by reference to the Proxy Statement. The Proxy Statement will be filed not later than April 30, 2020 with respect to the 2020 annual meeting of shareholders, except for the information regarding the executive officers of the Company. Information regarding executive officers is included in Part I of this report under the caption "Executive Officers of the Registrant."
Item 11. Executive Compensation
In accordance with Instruction G(3) of Form 10-K, the information required by this Item is incorporated herein by reference to the Proxy Statement (see Item 10 above).
Item 12. Security Ownership of Certain Beneficial Owners and Management and Related Stockholder Matters
In accordance with Instruction G(3) of Form 10-K, the information required by this Item is incorporated herein by reference to the Proxy Statement (see Item 10 above).
Item 13. Certain Relationships and Related Transactions, and Director Independence
In accordance with Instruction G(3) of Form 10-K, the information required by this Item is incorporated herein by reference to the Proxy Statement (see Item 10 above).
Item 14. Principal Accounting Fees and Services
In accordance with Instruction G(3) of Form 10-K, the information required by this Item is incorporated herein by reference to the Proxy Statement (see Item 10 above).
PART IV
Item 15. Exhibits, Financial Statement Schedules
(a)(1) Financial Statements
See Index to Consolidated Financial Statements on page | 44. |
(2) Financial Statement Schedules
The information required by Schedule II, Valuation and Qualifying Accounts, is included in Note 5 to the Consolidated Financial Statements, Casualty, Environmental and Other Reserves. All other financial statement schedules are not applicable.
(3) Exhibits
The documents listed below are being filed or have previously been filed on behalf of CSX and are incorporated herein by reference from the documents indicated and made a part hereof. Exhibits not previously filed are filed herewith.
Pursuant to Regulation S-K, Item 601(b)(4)(iii), instruments that define the rights of holders of the Registrant's long-term debt securities, where the long-term debt securities authorized under each such instrument do not exceed 10% of the Registrant's total assets, have been omitted and will be furnished to the Commission upon request.
CSX 2019 Form 10-K p. 111
CSX CORPORATION
PART IV
Exhibit designation | Nature of exhibit | Previously filed as exhibit to |
2.1 | September 2, 2004, Exhibit 2.1, Form 8-K | |
3.1 | October 9, 2015, Exhibit 3.1, Form 8-K | |
3.2 | July 11, 2017, Exhibit 3.1, Form 8-K | |
Instruments Defining the Rights of Security Holders, Including Debentures: | ||
4.1(a)(P) | Indenture, dated August 1, 1990, between the Registrant and The Chase Manhattan Bank, as Trustee | September 7, 1990, Form SE |
4.1(b)(P) | First Supplemental Indenture, dated as of June 15, 1991, between the Registrant and The Chase Manhattan Bank, as Trustee | May 28, 1992, Exhibit 4(c), Form SE |
4.1(c) | June 5, 1997, Exhibit 4.3, Form S-4 (Registration No. 333-28523) | |
4.1(d) | May 12, 1998, Exhibit 4.2, Form 8-K | |
4.1(e) | November 7, 2001, Exhibit 4.1, Form 10-Q | |
4.1(f) | October 27, 2003, Exhibit 4.1, Form 8-K | |
4.1(g) | November 3, 2004, Exhibit 4.1, Form 10-Q | |
4.1(h) | April 26, 2007, Exhibit 4.4, Form 8-K | |
4.1(i) | April 19, 2010, Exhibit 4.1, Form 10-Q | |
4.2 | July 19, 2018 Form 8-K | |
Material Contracts: | ||
10.1** | February 22, 2008, Exhibit 10.2, Form 10-K | |
10.2** | February 22, 2008, Exhibit 10.3, Form 10-K | |
10.3** | March 4, 1994, Exhibit 10.4, Form 10-K | |
10.4** | March 4, 1994, Exhibit 10.5, Form 10-K | |
CSX 2019 Form 10-K p. 112
CSX CORPORATION
PART IV
Exhibit designation | Nature of exhibit | Previously filed as exhibit to |
10.5** | March 4, 2002, Exhibit 10.23, Form 10-K | |
10.6** | March 4, 2002, Exhibit 10.24, Form 10-K | |
10.7 | July 8, 1997, Exhibit 10, Form 8-K | |
10.8 | June 11, 1999, Exhibit 10.1, Form 8-K | |
10.9 | June 11, 1999, Exhibit 10.2, Form 8-K | |
10.10 | March 1, 2001, Exhibit 10.34, Form 10-K | |
10.11 | August 6, 2004, Exhibit 99.1, Form 8-K | |
10.12 | September 2, 2004, Exhibit 10.1, Form 8-K | |
10.13 | June 11, 1999, Exhibit 10.6, Form 8-K, | |
10.14 | June 11, 1999, Exhibit 10.4, Form 8-K | |
10.15 | June 11, 1999, Exhibit 10.5, Form 8-K | |
10.16 | June 11, 1999, Exhibit 10.7, Form 8-K | |
CSX 2019 Form 10-K p. 113
CSX CORPORATION
PART IV
Exhibit designation | Nature of exhibit | Previously filed as exhibit to |
10.17 | September 2, 2004, Exhibit 10.2, Form 8-K | |
10.18** | May 7, 2010, Exhibit 10.1, Form 8-K | |
10.19** | February 16, 2016, Exhibit 10.5, Form 8-K | |
10.20** | October 12, 2016, Exhibit 10.1, Form 10-Q | |
10.21** | February 27, 2017 Exhibit 10.1, Form 8-K | |
10.22** | February 27, 2017 Exhibit 10.4, Form 8-K | |
10.23** | January 12, 2018 Exhibit 10.1, Form 8-K | |
10.24** | February 7, 2018 Exhibit 10.41, Form 10-K | |
10.25** | February 7, 2018 Exhibit 10.42, Form 10-K | |
10.26** | February 7, 2018 Exhibit 10.43, Form 10-K | |
10.27** | February 12, 2018 Exhibit 10.1, Form 8-K | |
10.28** | February 12, 2019 Exhibit 10.1, Form 8-K | |
10.29** | February 12, 2019 Exhibit 10.2, Form 8-K | |
10.30 | April 3, 2019 Exhibit 10.1, Form 8-K | |
10.31** | May 8, 2019 Exhibit 10.1, Form 8-K | |
10.32** | June 4, 2019 Exhibit 10.1, Form 8-K/A | |
10.33** | October 8, 2019 Exhibit 10.1, Form 8-K | |
Officer certifications: | ||
31* | ||
32* | ||
Interactive data files: | ||
CSX 2019 Form 10-K p. 114
CSX CORPORATION
PART IV
Exhibit designation | Nature of exhibit | Previously filed as exhibit to |
101* | The following financial information from CSX Corporation’s Annual Report on Form 10-K for the year ended December 31, 2019 filed with the SEC on February 12, 2020, formatted in XBRL includes: (i) Consolidated Income Statements for the fiscal periods ended December 31, 2019, December 31, 2018, and December 31, 2017, (ii) Consolidated Comprehensive Income Statements for the fiscal periods ended December 31, 2019, December 31, 2018, and December 31, 2017, (iii) Consolidated Balance Sheets at December 31, 2019 and December 31, 2018, (iv) Consolidated Cash Flow Statements for the fiscal periods ended December 31, 2019, December 31, 2018 and December 31, 2017, (v) Consolidated Statements of Changes in Shareholders' Equity for the fiscal periods ended December 31, 2019, December 31, 2018 and December 31, 2017, and (vi) the Notes to Consolidated Financial Statements. | |
Other exhibits: | ||
21* | ||
23* | ||
24* | ||
* Filed herewith | ||
** Management Contract or Compensatory Plan or Arrangement | ||
(P) This Exhibit has been paper filed and is not subject to Item 601 of Reg S-K for hyperlinks. | ||
Note: Items not filed herewith have been submitted in previous SEC filings. | ||
CSX 2019 Form 10-K p. 115
SIGNATURES
Pursuant to the requirements of Section 13 or 15(d) of the Securities Exchange Act of 1934, the Registrant has duly caused this report to be signed on its behalf by the undersigned, thereunto duly authorized.
CSX CORPORATION
(Registrant)
By: /s/ ANGELA C. WILLIAMS
Angela C. Williams
Vice President and Chief Accounting Officer
(Principal Accounting Officer)
Dated: February 12, 2020
Pursuant to the requirements of the Securities Exchange Act of 1934, this report has been signed below by the following persons on behalf of the Registrant and in the capacities indicated on February 12, 2020.
Signature | Title | |
/s/ JAMES M. FOOTE | President, Chief Executive Officer and Director | |
James M. Foote | (Principal Executive Officer) | |
/s/ KEVIN S. BOONE | Executive Vice President and Chief Financial | |
Kevin S. Boone | Officer (Principal Financial Officer) | |
/s/ ANGELA C. WILLIAMS | Vice President and Chief Accounting Officer | |
Angela C. Williams | (Principal Accounting Officer) | |
/s/ NATHAN D. GOLDMAN | Executive Vice President and Chief Legal Officer, Corporate Secretary | |
Nathan D. Goldman | *Attorney-in-Fact | |
CSX 2019 Form 10-K p. 116
SIGNATURES
Signature | Title | |
* | Chairman of the Board and Director | |
John J. Zillmer | ||
* | Director | |
Donna M. Alvarado | ||
* | Director | |
Pamela L. Carter | ||
* | Director | |
Steven T. Halverson | ||
* | Director | |
Paul C. Hilal | ||
* | Director | |
John D. McPherson | ||
* | Director | |
David M. Moffett | ||
* | Director | |
Linda H. Riefler | ||
* | Director | |
Suzanne M. Vautrinot | ||
* | Director | |
J. Steven Whisler | ||
CSX 2019 Form 10-K p. 117