|
|
Exhibit 99.2
|

FEBRUARY 24, 2022 Q4 2021 EARNINGS CONFERENCE CALL Listen-Only dial-in numbers:(844) 220-4970
(domestic)(262) 558-6349 (international)Conference ID: 1619366 Conference Call Replay:(855) 859-2056 (domestic)(404) 537-3406 (international)Conference ID: 1619366
SAFE HARBOR STATEMENT Please note that the information provided in this presentation is accurate as of
the date of the original presentation. The presentation will remain posted on this website from one to twelve months following the initial presentation, but content will not be updated to reflect new information that may become available
after the original presentation posting. The presentation contains forward-looking statements within the meaning of Section 27A of the Securities Act of 1933, as amended ("Securities Act"), Section 21E of the Securities Exchange Act of 1934,
as amended ("Exchange Act"), and the Private Securities Litigation Reform Act of 1995. Such forward-looking statements only speak as of the date of this report and Curtiss-Wright Corporation assumes no obligation to update the information
included in this report. Such forward-looking statements include, among other things, management's estimates of future performance, revenue and earnings, our management's growth objectives, our management’s ability to integrate our
acquisition, and our management's ability to produce consistent operating improvements. These forward-looking statements are based on expectations as of the time the statements were made only, and are subject to a number of risks and
uncertainties which could cause us to fail to achieve our then-current financial projections and other expectations, including the impact of a global pandemic or national epidemic. This presentation also includes certain non-GAAP financial
measures with reconciliations to GAAP financial measures being made available in the earnings release and this presentation that are posted to our website and furnished with the SEC. We undertake no duty to update this information. More
information about potential factors that could affect our business and financial results is included in our filings with the Securities and Exchange Commission, including our Annual Reports on Form 10-K and Quarterly Reports on Form 10-Q,
including, among other sections, under the captions, "Risk Factors" and "Management's Discussion and Analysis of Financial Condition and Results of Operations," which is on file with the SEC and available at the SEC's website at
www.sec.gov. 2
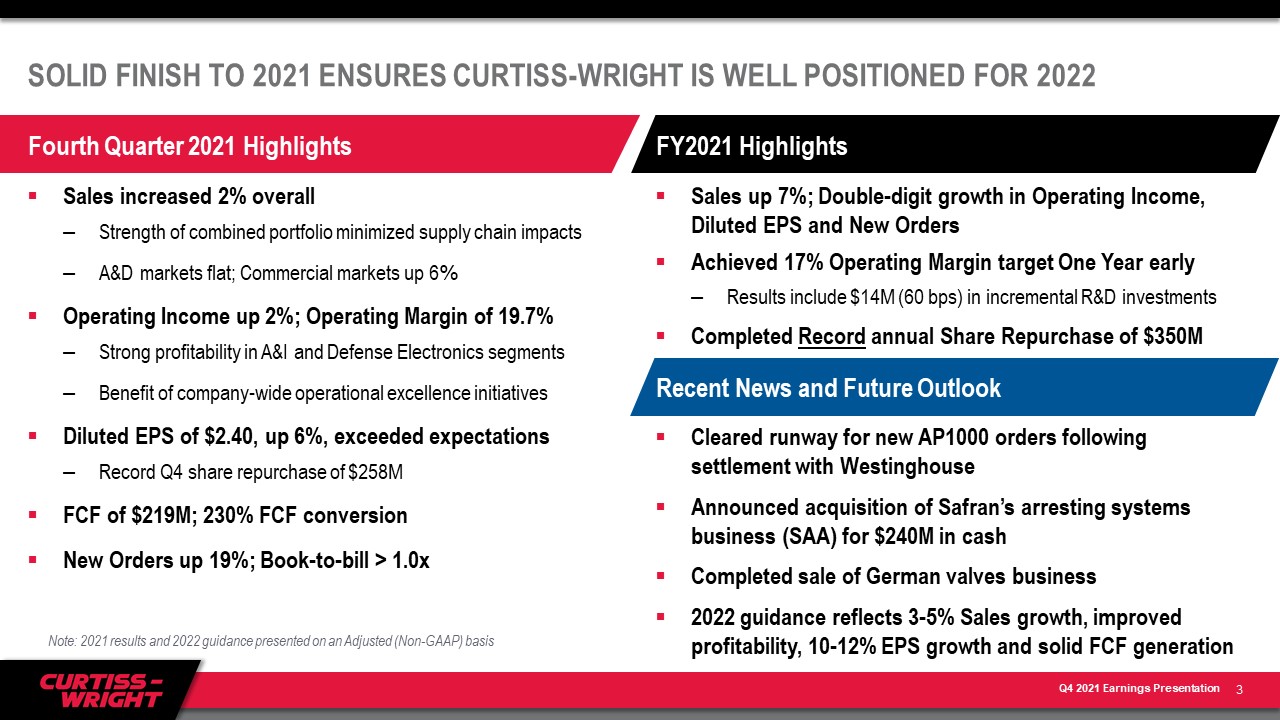
SOLID FINISH TO 2021 ENSURES CURTISS-WRIGHT IS WELL POSITIONED FOR 2022 Sales up 7%; Double-digit
growth in Operating Income, Diluted EPS and New OrdersAchieved 17% Operating Margin target One Year earlyResults include $14M (60 bps) in incremental R&D investmentsCompleted Record annual Share Repurchase of $350MCleared runway for new
AP1000 orders following settlement with WestinghouseAnnounced acquisition of Safran’s arresting systems business (SAA) for $240M in cashCompleted sale of German valves business2022 guidance reflects 3-5% Sales growth, improved profitability,
10-12% EPS growth and solid FCF generation Sales increased 2% overallStrength of combined portfolio minimized supply chain impactsA&D markets flat; Commercial markets up 6%Operating Income up 2%; Operating Margin of 19.7% Strong
profitability in A&I and Defense Electronics segmentsBenefit of company-wide operational excellence initiativesDiluted EPS of $2.40, up 6%, exceeded expectationsRecord Q4 share repurchase of $258MFCF of $219M; 230% FCF conversionNew
Orders up 19%; Book-to-bill > 1.0x 3 Fourth Quarter 2021 Highlights FY2021 Highlights Recent News and Future Outlook Note: 2021 results and 2022 guidance presented on an Adjusted (Non-GAAP) basis
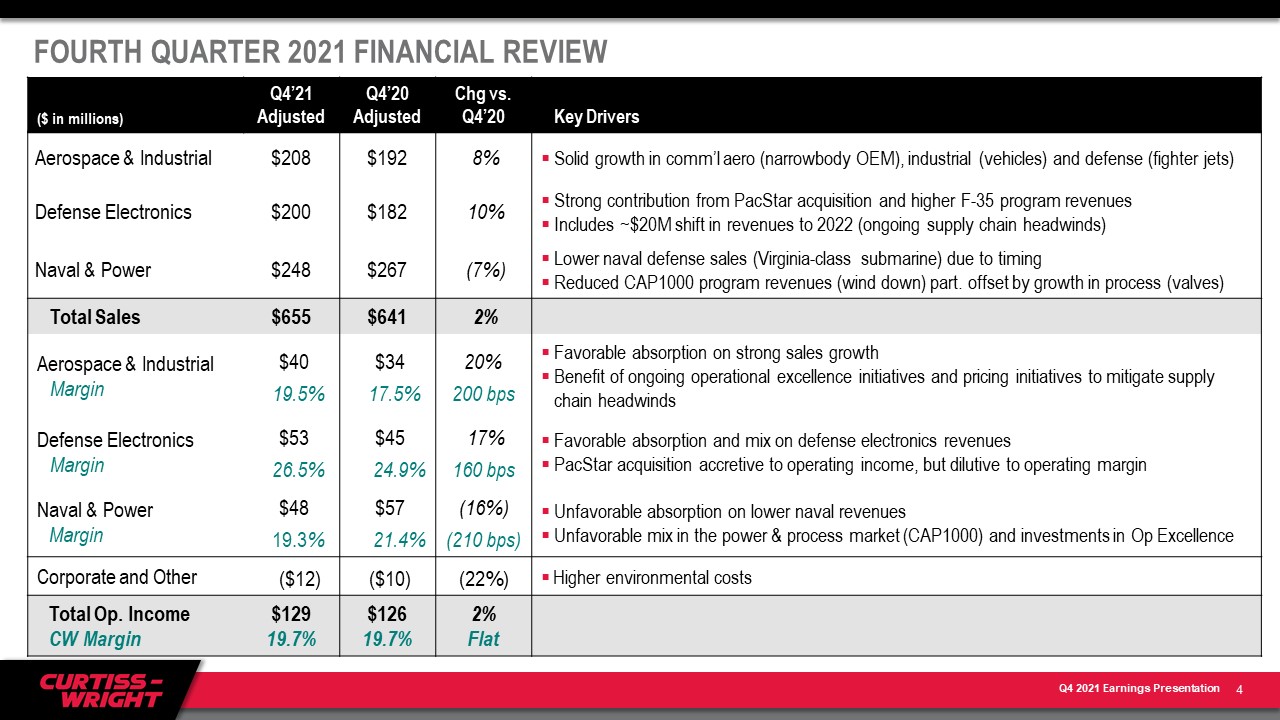
FOURTH QUARTER 2021 FINANCIAL REVIEW ($ in millions) Q4’21 Adjusted Q4’20 Adjusted Chg vs.
Q4’20 Key Drivers Aerospace & Industrial $208 $192 8% Solid growth in comm’l aero (narrowbody OEM), industrial (vehicles) and defense (fighter jets) Defense Electronics $200 $182 10% Strong contribution from PacStar
acquisition and higher F-35 program revenuesIncludes ~$20M shift in revenues to 2022 (ongoing supply chain headwinds) Naval & Power $248 $267 (7%) Lower naval defense sales (Virginia-class submarine) due to timingReduced CAP1000
program revenues (wind down) part. offset by growth in process (valves) Total Sales $655 $641 2% Aerospace & Industrial Margin $40 19.5% $34 17.5% 20%200 bps Favorable absorption on strong sales growthBenefit of ongoing
operational excellence initiatives and pricing initiatives to mitigate supply chain headwinds Defense Electronics Margin $53 26.5% $45 24.9% 17%160 bps Favorable absorption and mix on defense electronics revenuesPacStar acquisition
accretive to operating income, but dilutive to operating margin Naval & Power Margin $48 19.3% $57 21.4% (16%)(210 bps) Unfavorable absorption on lower naval revenuesUnfavorable mix in the power & process market (CAP1000) and
investments in Op Excellence Corporate and Other ($12) ($10) (22%) Higher environmental costs Total Op. IncomeCW Margin $12919.7% $12619.7% 2%Flat 4
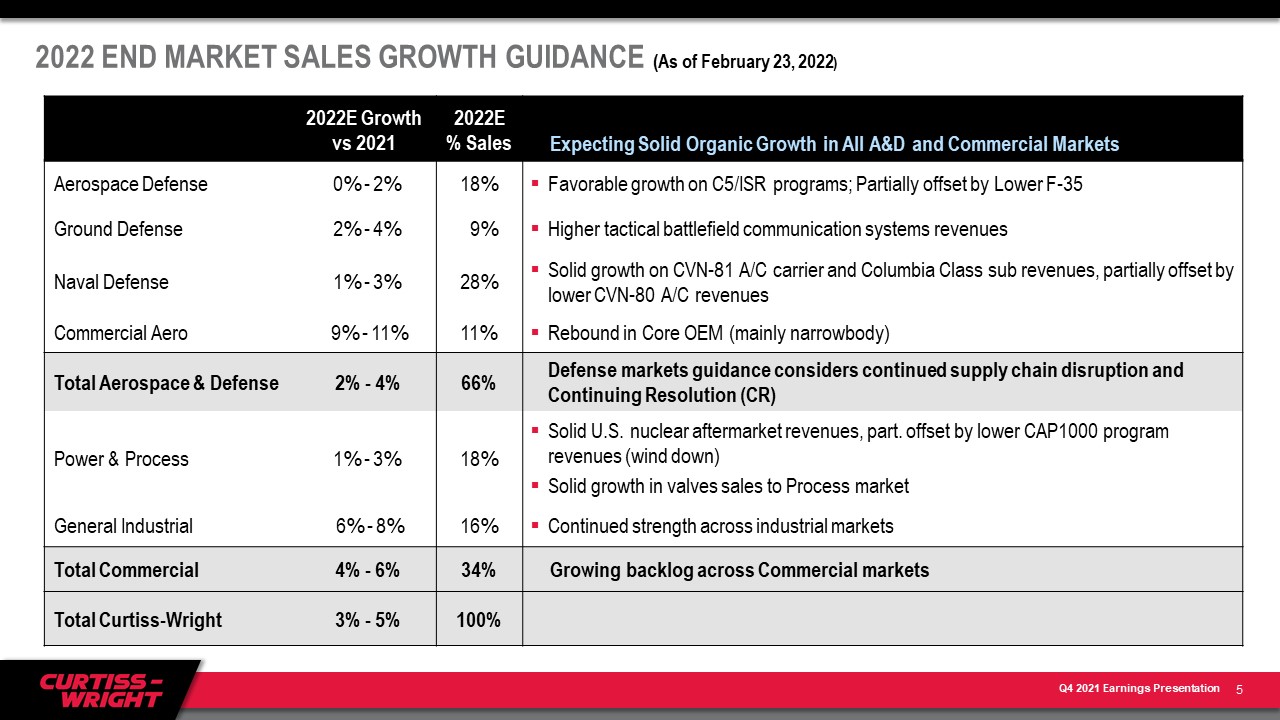
2022 END MARKET SALES GROWTH GUIDANCE (As of February 23, 2022) 2022E Growth vs 2021 2022E %
Sales Expecting Solid Organic Growth in All A&D and Commercial Markets Aerospace Defense 0% - 2% 18% Favorable growth on C5/ISR programs; Partially offset by Lower F-35 Ground Defense 2% - 4% 9% Higher tactical battlefield
communication systems revenues Naval Defense 1% - 3% 28% Solid growth on CVN-81 A/C carrier and Columbia Class sub revenues, partially offset by lower CVN-80 A/C revenues Commercial Aero 9% - 11% 11% Rebound in Core OEM (mainly
narrowbody) Total Aerospace & Defense 2% - 4% 66% Defense markets guidance considers continued supply chain disruption and Continuing Resolution (CR) Power & Process 1% - 3% 18% Solid U.S. nuclear aftermarket revenues, part.
offset by lower CAP1000 program revenues (wind down) Solid growth in valves sales to Process market General Industrial 6% - 8% 16% Continued strength across industrial markets Total Commercial 4% - 6% 34% Growing backlog across
Commercial markets Total Curtiss-Wright 3% - 5% 100% 5
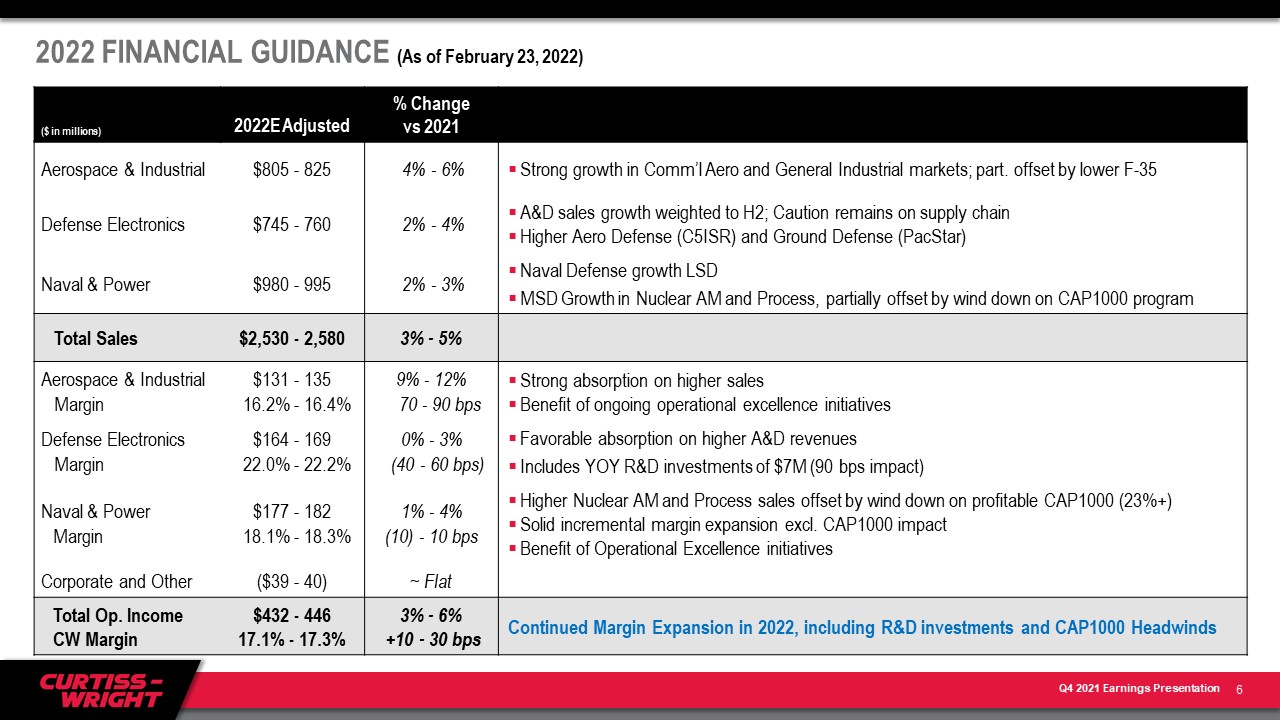
($ in millions) 2022E Adjusted % Change vs 2021 Aerospace & Industrial $805 - 825 4% -
6% Strong growth in Comm’l Aero and General Industrial markets; part. offset by lower F-35 Defense Electronics $745 - 760 2% - 4% A&D sales growth weighted to H2; Caution remains on supply chainHigher Aero Defense (C5ISR) and Ground
Defense (PacStar) Naval & Power $980 - 995 2% - 3% Naval Defense growth LSDMSD Growth in Nuclear AM and Process, partially offset by wind down on CAP1000 program Total Sales $2,530 - 2,580 3% - 5% Aerospace &
IndustrialMargin $131 - 135 16.2% - 16.4% 9% - 12% 70 - 90 bps Strong absorption on higher salesBenefit of ongoing operational excellence initiatives Defense ElectronicsMargin $164 - 169 22.0% - 22.2% 0% - 3% (40 - 60 bps) Favorable
absorption on higher A&D revenuesIncludes YOY R&D investments of $7M (90 bps impact) Naval & PowerMargin $177 - 182 18.1% - 18.3% 1% - 4%(10) - 10 bps Higher Nuclear AM and Process sales offset by wind down on profitable
CAP1000 (23%+)Solid incremental margin expansion excl. CAP1000 impactBenefit of Operational Excellence initiatives Corporate and Other ($39 - 40) ~ Flat Total Op. IncomeCW Margin $432 - 44617.1% - 17.3% 3% - 6% +10 - 30 bps Continued
Margin Expansion in 2022, including R&D investments and CAP1000 Headwinds 2022 FINANCIAL GUIDANCE (As of February 23, 2022) 6

2022 FINANCIAL GUIDANCE (As of February 23, 2022) ($ in millions, except EPS) 2022E Adjusted %
Change vs 2021 Total Sales $2,530 - 2,580 3% - 5% Total Operating Income $432 - 446 3% - 6% Other Income $17 - 18 Higher Discount Rates Interest Expense ($39 - 40) Diluted EPS $8.05 - 8.25 10% - 12% Benefit of
Record $350M in ‘21 Share Repurchases; Expect Q1’22 EPS below PY level Diluted Shares Outstanding 38.8 - 39.0 Min. $50 million share repurchase in ’22 Free Cash Flow $345 - 365 0% - 5% Cash Flow from Operations up 2% - 10% Free
Cash Flow Conversion >110% Remain above 110% long-term target Capital Expenditures $50 - 60 Return to normal discretionary spending (vs $41M in 2021) Depreciation & Amortization $110 - 120 7
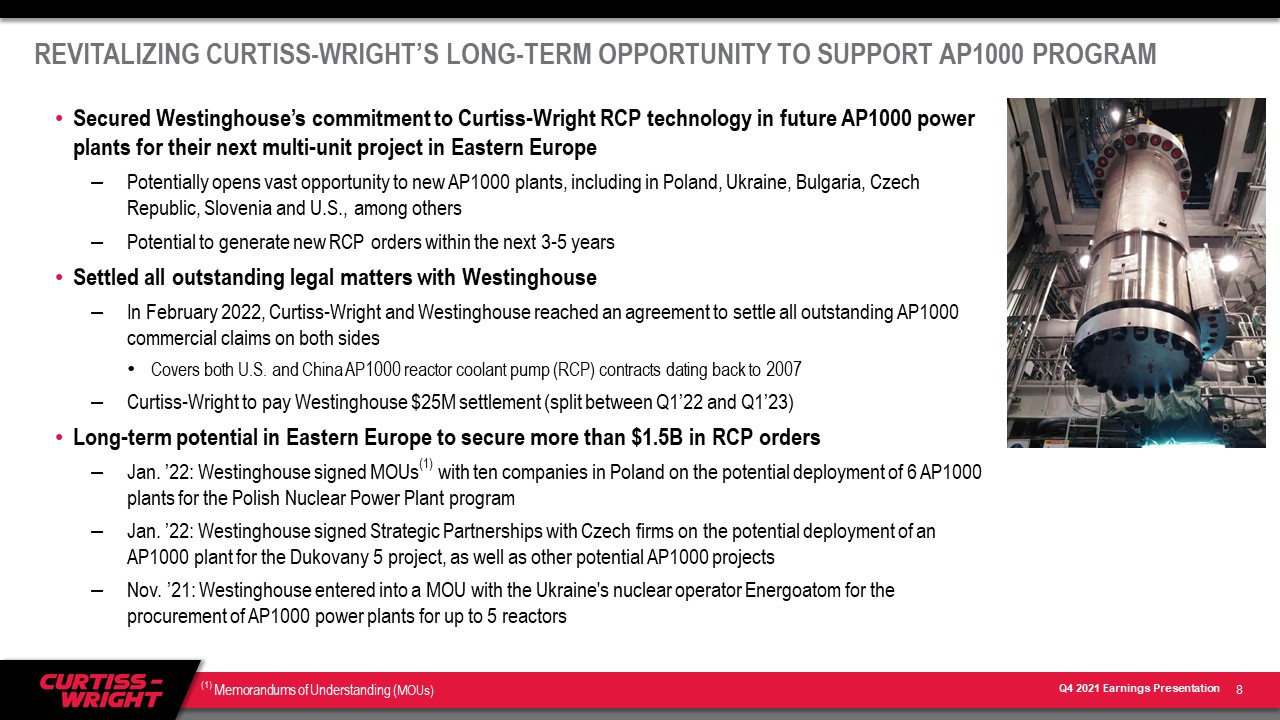
REVITALIZING CURTISS-WRIGHT’S LONG-TERM OPPORTUNITY TO SUPPORT AP1000 PROGRAM 8 Secured
Westinghouse’s commitment to Curtiss-Wright RCP technology in future AP1000 power plants for their next multi-unit project in Eastern EuropePotentially opens vast opportunity to new AP1000 plants, including in Poland, Ukraine, Bulgaria, Czech
Republic, Slovenia and U.S., among othersPotential to generate new RCP orders within the next 3-5 yearsSettled all outstanding legal matters with WestinghouseIn February 2022, Curtiss-Wright and Westinghouse reached an agreement to settle all
outstanding AP1000 commercial claims on both sidesCovers both U.S. and China AP1000 reactor coolant pump (RCP) contracts dating back to 2007Curtiss-Wright to pay Westinghouse $25M settlement (split between Q1’22 and Q1’23)Long-term potential
in Eastern Europe to secure more than $1.5B in RCP ordersJan. ’22: Westinghouse signed MOUs(1) with ten companies in Poland on the potential deployment of 6 AP1000 plants for the Polish Nuclear Power Plant programJan. ’22: Westinghouse signed
Strategic Partnerships with Czech firms on the potential deployment of an AP1000 plant for the Dukovany 5 project, as well as other potential AP1000 projectsNov. ’21: Westinghouse entered into a MOU with the Ukraine's nuclear operator
Energoatom for the procurement of AP1000 power plants for up to 5 reactors (1) Memorandums of Understanding (MOUs)
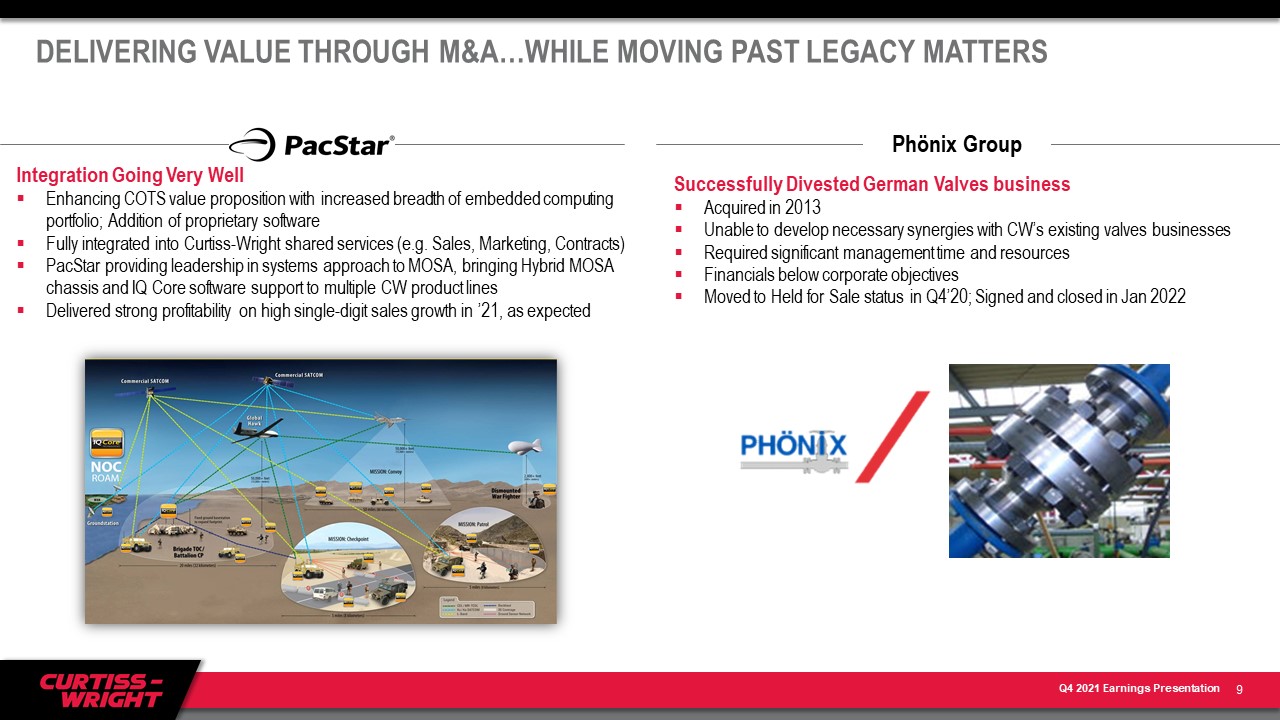
DELIVERING VALUE THROUGH M&A…WHILE MOVING PAST LEGACY MATTERS 9 Integration Going Very
WellEnhancing COTS value proposition with increased breadth of embedded computing portfolio; Addition of proprietary softwareFully integrated into Curtiss-Wright shared services (e.g. Sales, Marketing, Contracts)PacStar providing leadership
in systems approach to MOSA, bringing Hybrid MOSA chassis and IQ Core software support to multiple CW product linesDelivered strong profitability on high single-digit sales growth in ’21, as expected Successfully Divested German Valves
businessAcquired in 2013Unable to develop necessary synergies with CW’s existing valves businessesRequired significant management time and resources Financials below corporate objectivesMoved to Held for Sale status in Q4’20; Signed and
closed in Jan 2022 Phönix Group
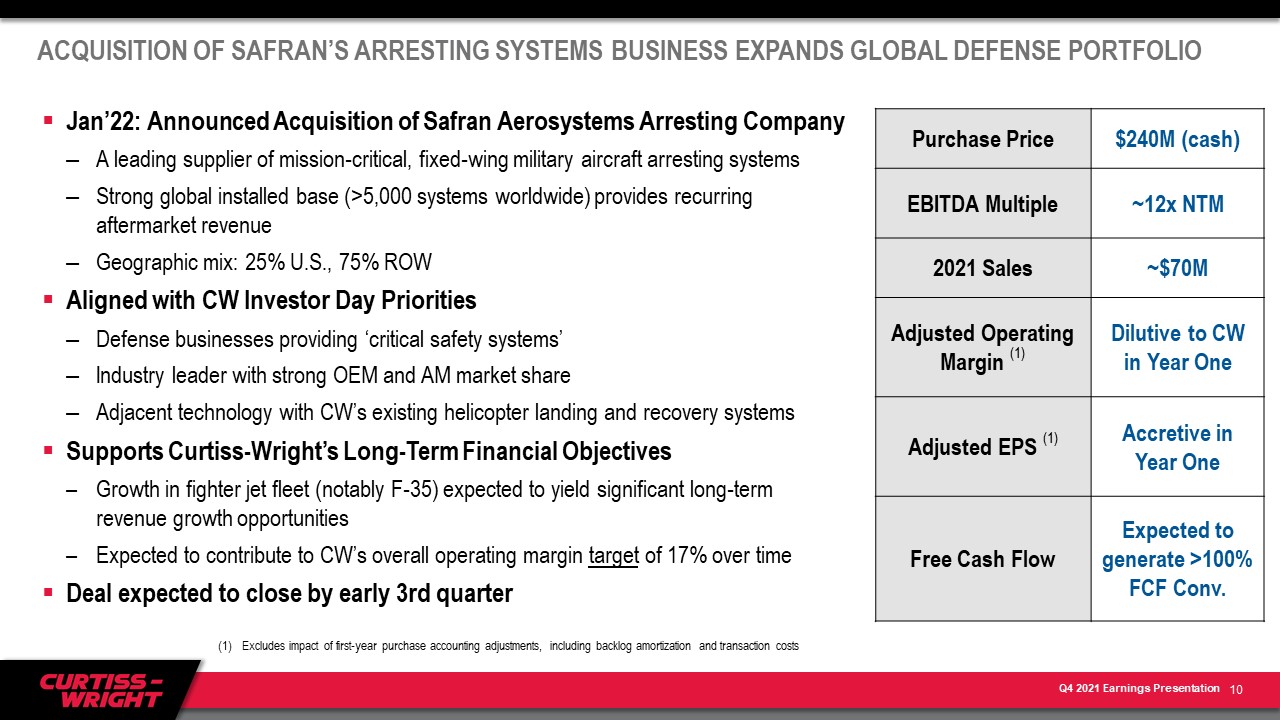
ACQUISITION OF SAFRAN’S ARRESTING SYSTEMS BUSINESS EXPANDS GLOBAL DEFENSE PORTFOLIO 10 Jan’22:
Announced Acquisition of Safran Aerosystems Arresting Company A leading supplier of mission-critical, fixed-wing military aircraft arresting systemsStrong global installed base (>5,000 systems worldwide) provides recurring aftermarket
revenueGeographic mix: 25% U.S., 75% ROWAligned with CW Investor Day PrioritiesDefense businesses providing ‘critical safety systems’Industry leader with strong OEM and AM market shareAdjacent technology with CW’s existing helicopter landing
and recovery systemsSupports Curtiss-Wright’s Long-Term Financial ObjectivesGrowth in fighter jet fleet (notably F-35) expected to yield significant long-term revenue growth opportunitiesExpected to contribute to CW’s overall operating margin
target of 17% over timeDeal expected to close by early 3rd quarter Purchase Price $240M (cash) EBITDA Multiple ~12x NTM 2021 Sales ~$70M Adjusted Operating Margin (1) Dilutive to CW in Year One Adjusted EPS (1) Accretive in Year
One Free Cash Flow Expected to generate >100% FCF Conv. Excludes impact of first-year purchase accounting adjustments, including backlog amortization and transaction costs
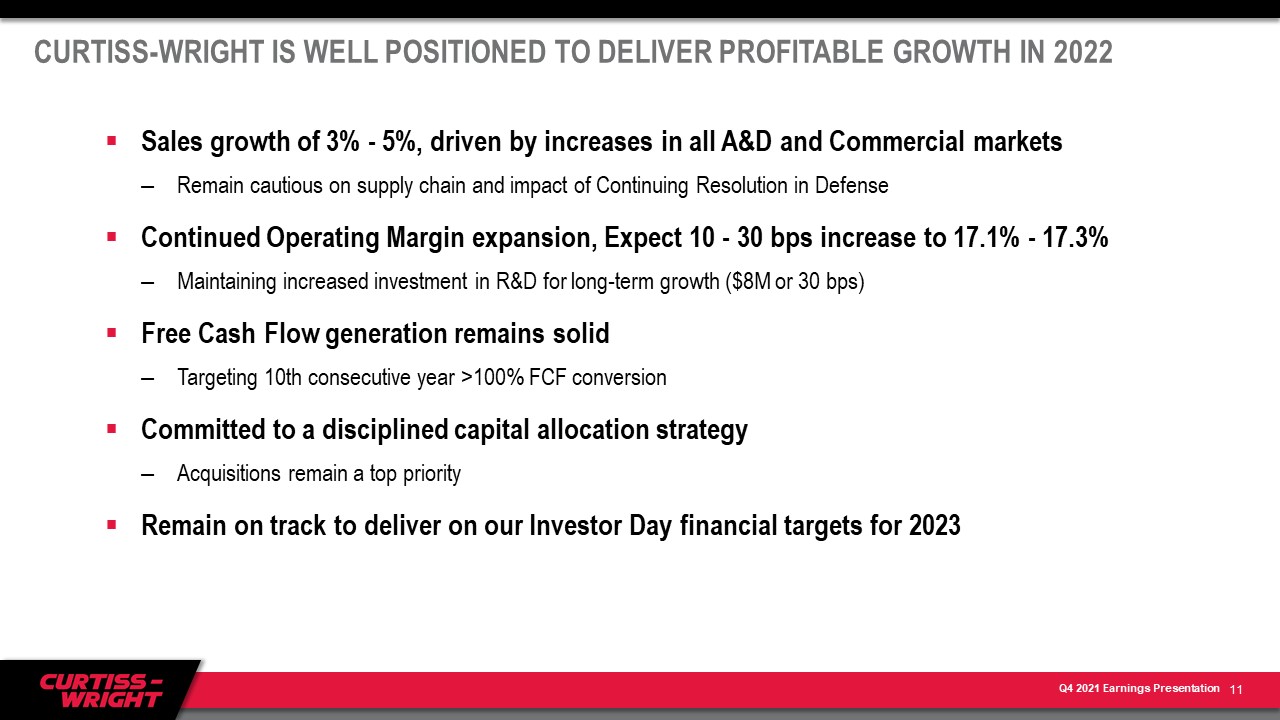
CURTISS-WRIGHT IS WELL POSITIONED TO DELIVER PROFITABLE GROWTH IN 2022 11 Sales growth of 3% - 5%,
driven by increases in all A&D and Commercial marketsRemain cautious on supply chain and impact of Continuing Resolution in DefenseContinued Operating Margin expansion, Expect 10 - 30 bps increase to 17.1% - 17.3%Maintaining increased
investment in R&D for long-term growth ($8M or 30 bps)Free Cash Flow generation remains solid Targeting 10th consecutive year >100% FCF conversionCommitted to a disciplined capital allocation strategyAcquisitions remain a top
priorityRemain on track to deliver on our Investor Day financial targets for 2023
Appendix 12
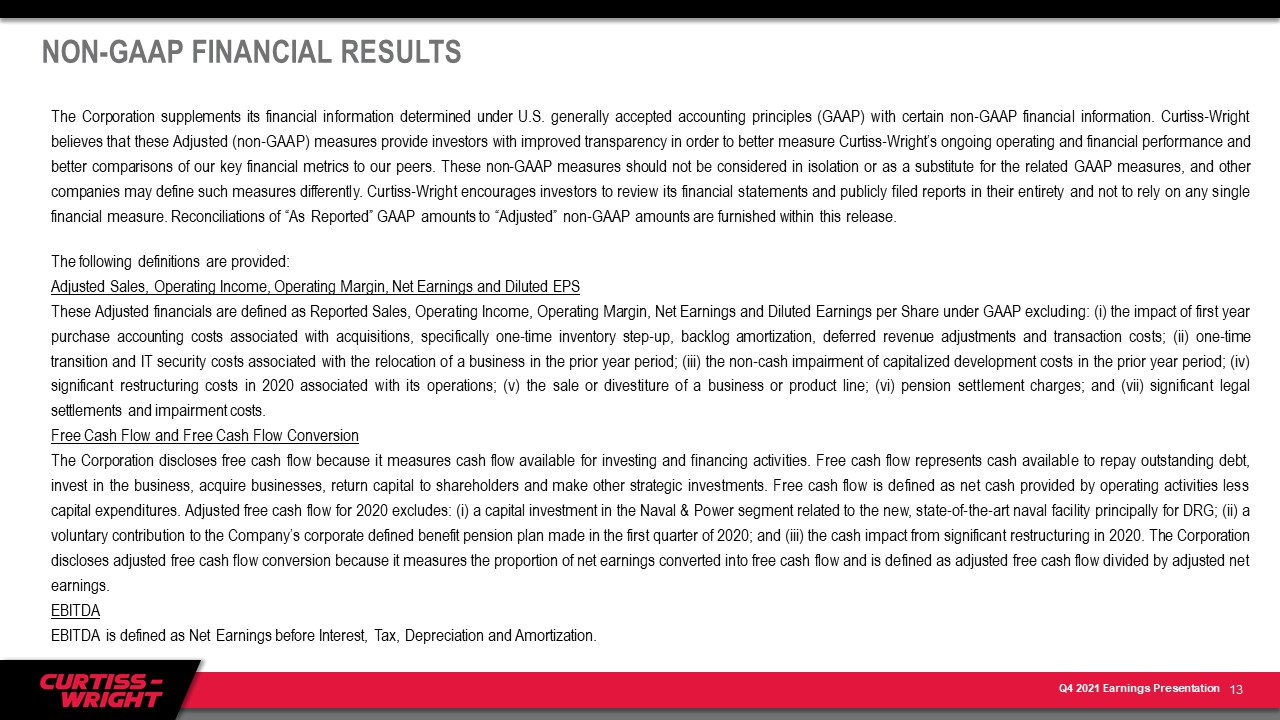
NON-GAAP FINANCIAL RESULTS The Corporation supplements its financial information determined under U.S.
generally accepted accounting principles (GAAP) with certain non-GAAP financial information. Curtiss-Wright believes that these Adjusted (non-GAAP) measures provide investors with improved transparency in order to better measure
Curtiss-Wright’s ongoing operating and financial performance and better comparisons of our key financial metrics to our peers. These non-GAAP measures should not be considered in isolation or as a substitute for the related GAAP measures, and
other companies may define such measures differently. Curtiss-Wright encourages investors to review its financial statements and publicly filed reports in their entirety and not to rely on any single financial measure. Reconciliations of “As
Reported” GAAP amounts to “Adjusted” non-GAAP amounts are furnished within this release. The following definitions are provided:Adjusted Sales, Operating Income, Operating Margin, Net Earnings and Diluted EPSThese Adjusted financials are
defined as Reported Sales, Operating Income, Operating Margin, Net Earnings and Diluted Earnings per Share under GAAP excluding: (i) the impact of first year purchase accounting costs associated with acquisitions, specifically one-time
inventory step-up, backlog amortization, deferred revenue adjustments and transaction costs; (ii) one-time transition and IT security costs associated with the relocation of a business in the prior year period; (iii) the non-cash impairment
of capitalized development costs in the prior year period; (iv) significant restructuring costs in 2020 associated with its operations; (v) the sale or divestiture of a business or product line; (vi) pension settlement charges; and (vii)
significant legal settlements and impairment costs. Free Cash Flow and Free Cash Flow ConversionThe Corporation discloses free cash flow because it measures cash flow available for investing and financing activities. Free cash flow represents
cash available to repay outstanding debt, invest in the business, acquire businesses, return capital to shareholders and make other strategic investments. Free cash flow is defined as net cash provided by operating activities less capital
expenditures. Adjusted free cash flow for 2020 excludes: (i) a capital investment in the Naval & Power segment related to the new, state-of-the-art naval facility principally for DRG; (ii) a voluntary contribution to the Company’s
corporate defined benefit pension plan made in the first quarter of 2020; and (iii) the cash impact from significant restructuring in 2020. The Corporation discloses adjusted free cash flow conversion because it measures the proportion of net
earnings converted into free cash flow and is defined as adjusted free cash flow divided by adjusted net earnings. EBITDAEBITDA is defined as Net Earnings before Interest, Tax, Depreciation and Amortization. 13
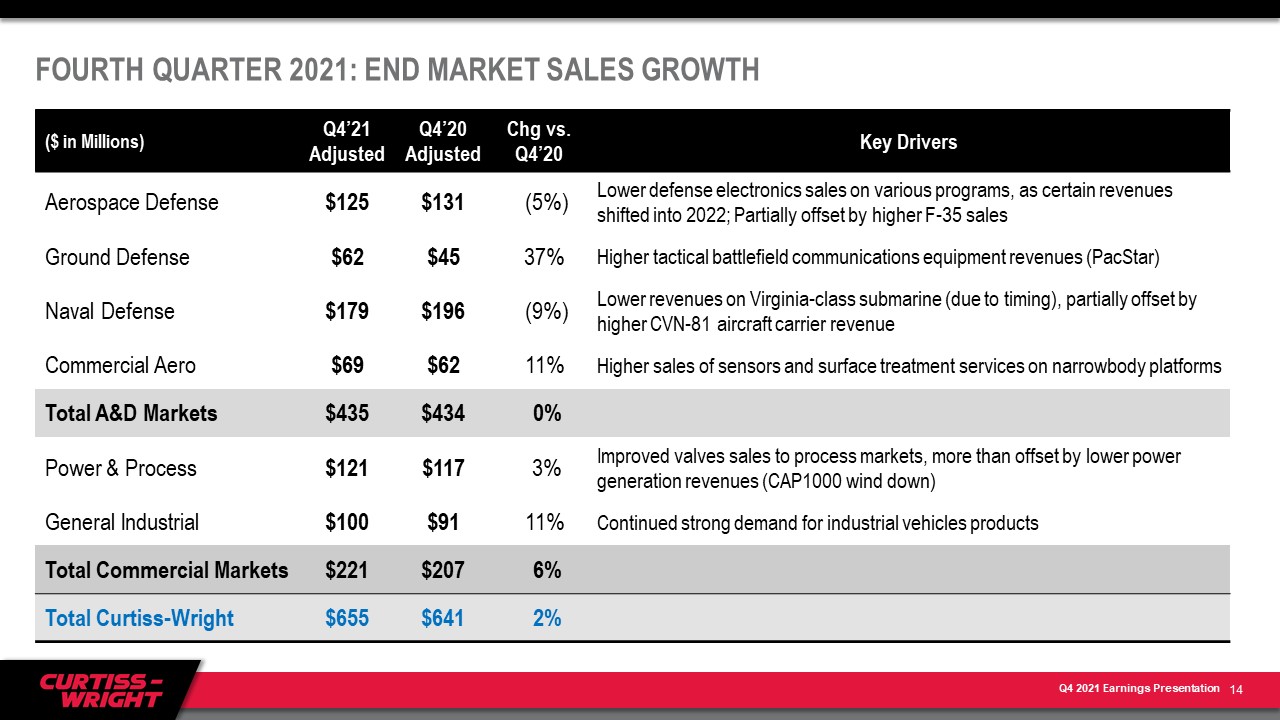
FOURTH QUARTER 2021: END MARKET SALES GROWTH ($ in Millions) Q4’21 Adjusted Q4’20 Adjusted Chg vs.
Q4’20 Key Drivers Aerospace Defense $125 $131 (5%) Lower defense electronics sales on various programs, as certain revenues shifted into 2022; Partially offset by higher F-35 sales Ground Defense $62 $45 37% Higher tactical
battlefield communications equipment revenues (PacStar) Naval Defense $179 $196 (9%) Lower revenues on Virginia-class submarine (due to timing), partially offset by higher CVN-81 aircraft carrier revenue Commercial Aero $69 $62
11% Higher sales of sensors and surface treatment services on narrowbody platforms Total A&D Markets $435 $434 0% Power & Process $121 $117 3% Improved valves sales to process markets, more than offset by lower power
generation revenues (CAP1000 wind down) General Industrial $100 $91 11% Continued strong demand for industrial vehicles products Total Commercial Markets $221 $207 6% Total Curtiss-Wright $655 $641 2% 14
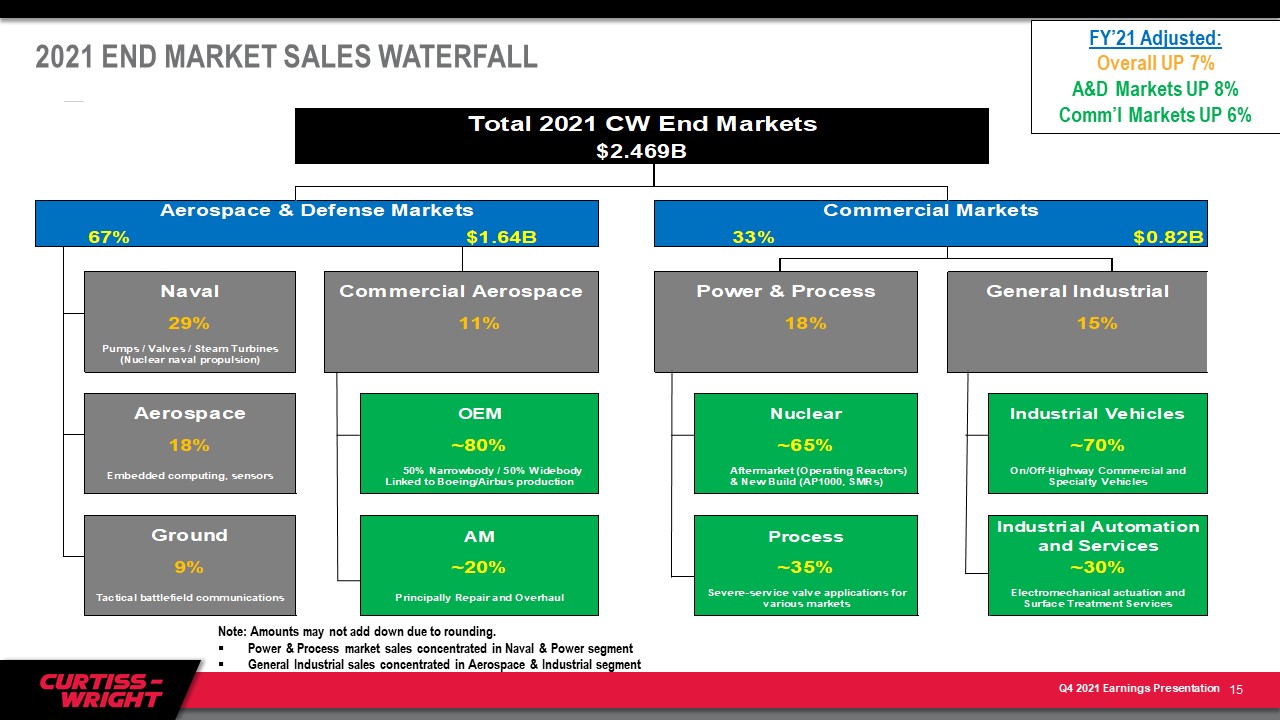
2021 END MARKET SALES WATERFALL FY’21 Adjusted:Overall UP 7%A&D Markets UP 8%Comm’l Markets UP
6% Note: Amounts may not add down due to rounding.Power & Process market sales concentrated in Naval & Power segmentGeneral Industrial sales concentrated in Aerospace & Industrial segment 15
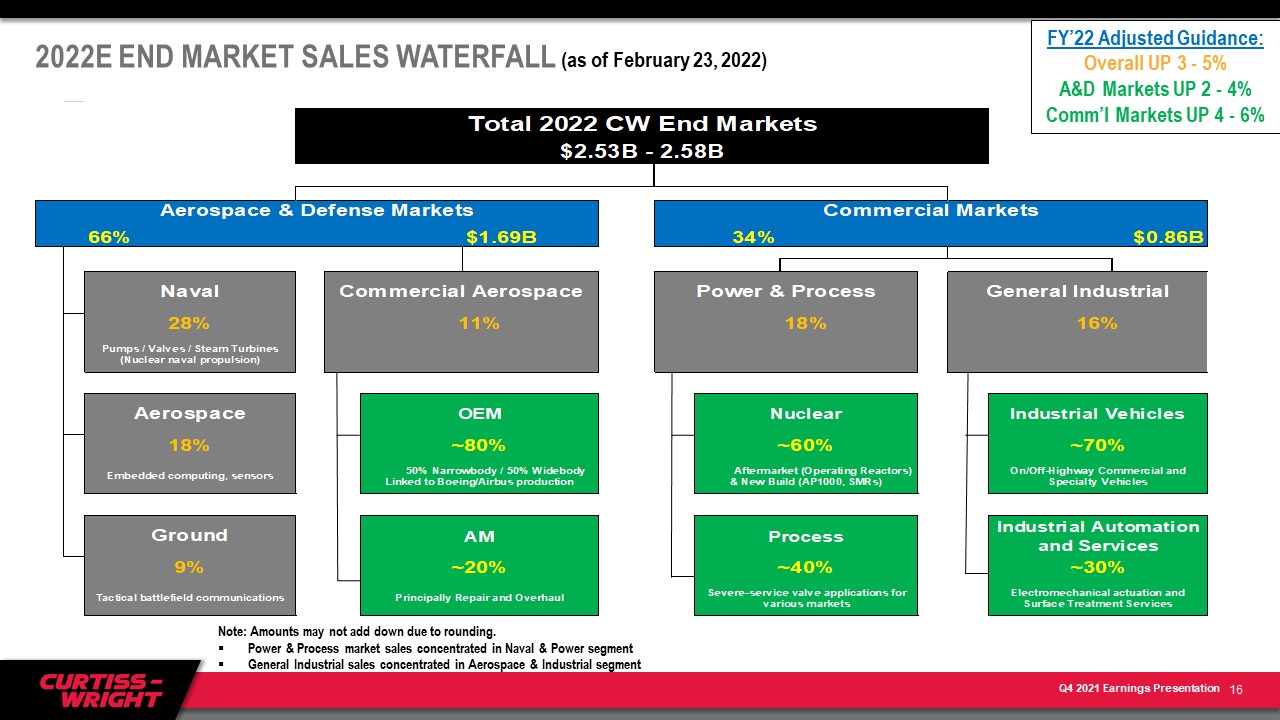
2022E END MARKET SALES WATERFALL (as of February 23, 2022) FY’22 Adjusted Guidance:Overall UP 3 -
5%A&D Markets UP 2 - 4%Comm’l Markets UP 4 - 6% Note: Amounts may not add down due to rounding.Power & Process market sales concentrated in Naval & Power segmentGeneral Industrial sales concentrated in Aerospace & Industrial
segment 16

NON-GAAP RECONCILIATION – 2022 VS 2021 (ADJUSTED) 17