00000263242021FYfalsehttp://fasb.org/us-gaap/2021-01-31#AccountingStandardsUpdate201802Memberhttp://fasb.org/us-gaap/2021-01-31#OtherLiabilitiesCurrenthttp://fasb.org/us-gaap/2021-01-31#OtherLiabilitiesCurrenthttp://fasb.org/us-gaap/2021-01-31#PropertyPlantAndEquipmentNethttp://fasb.org/us-gaap/2021-01-31#PropertyPlantAndEquipmentNethttp://fasb.org/us-gaap/2021-01-31#OtherLiabilitiesCurrenthttp://fasb.org/us-gaap/2021-01-31#OtherLiabilitiesCurrenthttp://fasb.org/us-gaap/2021-01-31#OtherLiabilitiesNoncurrenthttp://fasb.org/us-gaap/2021-01-31#OtherLiabilitiesNoncurrent2028-12-312040-12-3100000263242021-01-012021-12-3100000263242021-06-30iso4217:USD00000263242022-01-31xbrli:shares0000026324us-gaap:ProductMember2021-01-012021-12-310000026324us-gaap:ProductMember2020-01-012020-12-310000026324us-gaap:ProductMember2019-01-012019-12-310000026324us-gaap:ServiceMember2021-01-012021-12-310000026324us-gaap:ServiceMember2020-01-012020-12-310000026324us-gaap:ServiceMember2019-01-012019-12-3100000263242020-01-012020-12-3100000263242019-01-012019-12-31iso4217:USDxbrli:shares00000263242021-12-3100000263242020-12-3100000263242019-12-3100000263242018-12-310000026324us-gaap:CommonStockMember2018-12-310000026324us-gaap:AdditionalPaidInCapitalMember2018-12-310000026324us-gaap:RetainedEarningsMember2018-12-310000026324us-gaap:AccumulatedOtherComprehensiveIncomeMember2018-12-310000026324us-gaap:TreasuryStockMember2018-12-310000026324srt:CumulativeEffectPeriodOfAdoptionAdjustmentMemberus-gaap:RetainedEarningsMember2019-12-310000026324srt:CumulativeEffectPeriodOfAdoptionAdjustmentMemberus-gaap:AccumulatedOtherComprehensiveIncomeMember2019-12-310000026324us-gaap:RetainedEarningsMember2019-01-012019-12-310000026324us-gaap:AccumulatedOtherComprehensiveIncomeMember2019-01-012019-12-310000026324us-gaap:AdditionalPaidInCapitalMember2019-01-012019-12-310000026324us-gaap:TreasuryStockMember2019-01-012019-12-310000026324us-gaap:CommonStockMember2019-12-310000026324us-gaap:AdditionalPaidInCapitalMember2019-12-310000026324us-gaap:RetainedEarningsMember2019-12-310000026324us-gaap:AccumulatedOtherComprehensiveIncomeMember2019-12-310000026324us-gaap:TreasuryStockMember2019-12-310000026324us-gaap:RetainedEarningsMember2020-01-012020-12-310000026324us-gaap:AccumulatedOtherComprehensiveIncomeMember2020-01-012020-12-310000026324us-gaap:AdditionalPaidInCapitalMember2020-01-012020-12-310000026324us-gaap:TreasuryStockMember2020-01-012020-12-310000026324us-gaap:CommonStockMember2020-12-310000026324us-gaap:AdditionalPaidInCapitalMember2020-12-310000026324us-gaap:RetainedEarningsMember2020-12-310000026324us-gaap:AccumulatedOtherComprehensiveIncomeMember2020-12-310000026324us-gaap:TreasuryStockMember2020-12-310000026324us-gaap:AccumulatedOtherComprehensiveIncomeMember2021-01-012021-12-310000026324us-gaap:RetainedEarningsMember2021-01-012021-12-310000026324us-gaap:AdditionalPaidInCapitalMember2021-01-012021-12-310000026324us-gaap:TreasuryStockMember2021-01-012021-12-310000026324us-gaap:CommonStockMember2021-12-310000026324us-gaap:AdditionalPaidInCapitalMember2021-12-310000026324us-gaap:RetainedEarningsMember2021-12-310000026324us-gaap:AccumulatedOtherComprehensiveIncomeMember2021-12-310000026324us-gaap:TreasuryStockMember2021-12-310000026324srt:MinimumMemberus-gaap:BuildingMember2021-01-012021-12-310000026324us-gaap:BuildingMembersrt:MaximumMember2021-01-012021-12-310000026324srt:MinimumMemberus-gaap:EquipmentMember2021-01-012021-12-310000026324us-gaap:EquipmentMembersrt:MaximumMember2021-01-012021-12-310000026324srt:MinimumMember2021-01-012021-12-310000026324srt:MaximumMember2021-01-012021-12-310000026324us-gaap:TransferredOverTimeMember2021-01-012021-12-31xbrli:pure0000026324us-gaap:TransferredOverTimeMember2020-01-012020-12-310000026324us-gaap:TransferredOverTimeMember2019-01-012019-12-310000026324us-gaap:TransferredAtPointInTimeMember2021-01-012021-12-310000026324us-gaap:TransferredAtPointInTimeMember2020-01-012020-12-310000026324us-gaap:TransferredAtPointInTimeMember2019-01-012019-12-310000026324cw:AerospaceDefenseCustomersMembercw:AerospaceDefenseMember2021-01-012021-12-310000026324cw:AerospaceDefenseCustomersMembercw:AerospaceDefenseMember2020-01-012020-12-310000026324cw:AerospaceDefenseCustomersMembercw:AerospaceDefenseMember2019-01-012019-12-310000026324cw:GroundDefenseMembercw:AerospaceDefenseCustomersMember2021-01-012021-12-310000026324cw:GroundDefenseMembercw:AerospaceDefenseCustomersMember2020-01-012020-12-310000026324cw:GroundDefenseMembercw:AerospaceDefenseCustomersMember2019-01-012019-12-310000026324cw:NavalDefenseMembercw:AerospaceDefenseCustomersMember2021-01-012021-12-310000026324cw:NavalDefenseMembercw:AerospaceDefenseCustomersMember2020-01-012020-12-310000026324cw:NavalDefenseMembercw:AerospaceDefenseCustomersMember2019-01-012019-12-310000026324cw:CommercialAerospaceMembercw:AerospaceDefenseCustomersMember2021-01-012021-12-310000026324cw:CommercialAerospaceMembercw:AerospaceDefenseCustomersMember2020-01-012020-12-310000026324cw:CommercialAerospaceMembercw:AerospaceDefenseCustomersMember2019-01-012019-12-310000026324cw:AerospaceDefenseCustomersMember2021-01-012021-12-310000026324cw:AerospaceDefenseCustomersMember2020-01-012020-12-310000026324cw:AerospaceDefenseCustomersMember2019-01-012019-12-310000026324cw:CommercialCustomersMembercw:PowerProcessMember2021-01-012021-12-310000026324cw:CommercialCustomersMembercw:PowerProcessMember2020-01-012020-12-310000026324cw:CommercialCustomersMembercw:PowerProcessMember2019-01-012019-12-310000026324cw:GeneralIndustrialMembercw:CommercialCustomersMember2021-01-012021-12-310000026324cw:GeneralIndustrialMembercw:CommercialCustomersMember2020-01-012020-12-310000026324cw:GeneralIndustrialMembercw:CommercialCustomersMember2019-01-012019-12-310000026324cw:CommercialCustomersMember2021-01-012021-12-310000026324cw:CommercialCustomersMember2020-01-012020-12-310000026324cw:CommercialCustomersMember2019-01-012019-12-31cw:NumberAcquisitions0000026324cw:A2020AcquisitionsMember2020-01-012020-12-310000026324cw:A2020AcquisitionsMember2020-12-310000026324cw:DefenseElectronicsMembercw:PacificStarCommunicationsIncPacStarMember2020-10-302020-10-300000026324cw:DefenseElectronicsMembercw:InteractiveAnalysisAndDisplaySystemIADSMember2020-04-202020-04-200000026324cw:NavalPowerMembercw:DynaFloValveServicesLtdDynaFloMember2020-02-282020-02-280000026324us-gaap:SalesRevenueNetMemberus-gaap:GovernmentContractsConcentrationRiskMembercw:ConcentrationRiskThresholdPercentageMember2021-01-012021-12-310000026324us-gaap:SalesRevenueNetMemberus-gaap:GovernmentContractsConcentrationRiskMembercw:ConcentrationRiskThresholdPercentageMember2020-01-012020-12-310000026324us-gaap:GovernmentContractsConcentrationRiskMember2021-12-310000026324us-gaap:GovernmentContractsConcentrationRiskMember2020-12-310000026324cw:AerospaceIndustrialMember2019-12-310000026324cw:DefenseElectronicsMember2019-12-310000026324cw:NavalPowerMember2019-12-310000026324cw:DefenseElectronicsMember2020-01-012020-12-310000026324cw:NavalPowerMember2020-01-012020-12-310000026324cw:AerospaceIndustrialMember2020-01-012020-12-310000026324cw:AerospaceIndustrialMember2020-12-310000026324cw:DefenseElectronicsMember2020-12-310000026324cw:NavalPowerMember2020-12-310000026324cw:DefenseElectronicsMember2021-01-012021-12-310000026324cw:AerospaceIndustrialMember2021-01-012021-12-310000026324cw:NavalPowerMember2021-01-012021-12-310000026324cw:AerospaceIndustrialMember2021-12-310000026324cw:DefenseElectronicsMember2021-12-310000026324cw:NavalPowerMember2021-12-310000026324us-gaap:DevelopedTechnologyRightsMember2021-12-310000026324us-gaap:DevelopedTechnologyRightsMember2020-12-310000026324us-gaap:CustomerRelationshipsMember2021-12-310000026324us-gaap:CustomerRelationshipsMember2020-12-310000026324cw:ContractandProgramIntangibleAssetsMember2021-12-310000026324cw:ContractandProgramIntangibleAssetsMember2020-12-310000026324us-gaap:OtherIntangibleAssetsMember2021-12-310000026324us-gaap:OtherIntangibleAssetsMember2020-12-310000026324cw:IndustrialValveBusinessMembercw:DevelopedTechnologyRightsCustomerRelationshipsMember2020-01-012020-12-310000026324us-gaap:CustomerRelationshipsMember2020-01-012020-12-310000026324us-gaap:DevelopedTechnologyRightsMember2020-01-012020-12-310000026324us-gaap:OtherIntangibleAssetsMember2020-01-012020-12-310000026324srt:MinimumMember2021-12-310000026324srt:MaximumMember2021-12-310000026324us-gaap:GeneralAndAdministrativeExpenseMember2021-01-012021-12-310000026324us-gaap:GeneralAndAdministrativeExpenseMember2020-01-012020-12-310000026324us-gaap:GeneralAndAdministrativeExpenseMember2019-01-012019-12-310000026324us-gaap:EstimateOfFairValueFairValueDisclosureMember2021-12-310000026324us-gaap:CarryingReportedAmountFairValueDisclosureMember2021-12-310000026324us-gaap:EstimateOfFairValueFairValueDisclosureMember2020-12-310000026324us-gaap:CarryingReportedAmountFairValueDisclosureMember2020-12-3100000263242017-01-012017-12-31cw:numberOfTransitionTaxYears0000026324us-gaap:ForeignCountryMember2021-12-310000026324us-gaap:StateAndLocalJurisdictionMember2021-12-310000026324cw:IndustrialValveBusinessMember2021-12-310000026324us-gaap:OtherLiabilitiesMember2021-12-310000026324us-gaap:DomesticCountryMemberus-gaap:InternalRevenueServiceIRSMember2021-01-012021-12-310000026324us-gaap:StateAndLocalJurisdictionMember2021-01-012021-12-310000026324us-gaap:HerMajestysRevenueAndCustomsHMRCMemberus-gaap:ForeignCountryMember2021-01-012021-12-310000026324us-gaap:CanadaRevenueAgencyMemberus-gaap:ForeignCountryMember2021-01-012021-12-310000026324us-gaap:ForeignCountryMember2021-01-012021-12-310000026324us-gaap:RevolvingCreditFacilityMember2021-12-310000026324cw:SeniorNotesThreeEightyFourMember2021-12-310000026324cw:SeniorNotesThreeEightyFourMemberus-gaap:CarryingReportedAmountFairValueDisclosureMember2021-12-310000026324cw:SeniorNotesThreeEightyFourMemberus-gaap:EstimateOfFairValueFairValueDisclosureMember2021-12-310000026324cw:SeniorNotesThreeEightyFourMemberus-gaap:CarryingReportedAmountFairValueDisclosureMember2020-12-310000026324cw:SeniorNotesThreeEightyFourMemberus-gaap:EstimateOfFairValueFairValueDisclosureMember2020-12-310000026324cw:SeniorNotesThreeSeventyMember2021-12-310000026324us-gaap:CarryingReportedAmountFairValueDisclosureMembercw:SeniorNotesThreeSeventyMember2021-12-310000026324cw:SeniorNotesThreeSeventyMemberus-gaap:EstimateOfFairValueFairValueDisclosureMember2021-12-310000026324us-gaap:CarryingReportedAmountFairValueDisclosureMembercw:SeniorNotesThreeSeventyMember2020-12-310000026324cw:SeniorNotesThreeSeventyMemberus-gaap:EstimateOfFairValueFairValueDisclosureMember2020-12-310000026324cw:SeniorNotesThreeEightyFiveMember2021-12-310000026324cw:SeniorNotesThreeEightyFiveMemberus-gaap:CarryingReportedAmountFairValueDisclosureMember2021-12-310000026324cw:SeniorNotesThreeEightyFiveMemberus-gaap:EstimateOfFairValueFairValueDisclosureMember2021-12-310000026324cw:SeniorNotesThreeEightyFiveMemberus-gaap:CarryingReportedAmountFairValueDisclosureMember2020-12-310000026324cw:SeniorNotesThreeEightyFiveMemberus-gaap:EstimateOfFairValueFairValueDisclosureMember2020-12-310000026324cw:SeniorNotesFourTwentyFourMember2021-12-310000026324us-gaap:CarryingReportedAmountFairValueDisclosureMembercw:SeniorNotesFourTwentyFourMember2021-12-310000026324cw:SeniorNotesFourTwentyFourMemberus-gaap:EstimateOfFairValueFairValueDisclosureMember2021-12-310000026324us-gaap:CarryingReportedAmountFairValueDisclosureMembercw:SeniorNotesFourTwentyFourMember2020-12-310000026324cw:SeniorNotesFourTwentyFourMemberus-gaap:EstimateOfFairValueFairValueDisclosureMember2020-12-310000026324cw:SeniorNotesFourZeroFiveMember2021-12-310000026324cw:SeniorNotesFourZeroFiveMemberus-gaap:CarryingReportedAmountFairValueDisclosureMember2021-12-310000026324cw:SeniorNotesFourZeroFiveMemberus-gaap:EstimateOfFairValueFairValueDisclosureMember2021-12-310000026324cw:SeniorNotesFourZeroFiveMemberus-gaap:CarryingReportedAmountFairValueDisclosureMember2020-12-310000026324cw:SeniorNotesFourZeroFiveMemberus-gaap:EstimateOfFairValueFairValueDisclosureMember2020-12-310000026324cw:SeniorNotesFourElevenMember2021-12-310000026324cw:SeniorNotesFourElevenMemberus-gaap:CarryingReportedAmountFairValueDisclosureMember2021-12-310000026324cw:SeniorNotesFourElevenMemberus-gaap:EstimateOfFairValueFairValueDisclosureMember2021-12-310000026324cw:SeniorNotesFourElevenMemberus-gaap:CarryingReportedAmountFairValueDisclosureMember2020-12-310000026324cw:SeniorNotesFourElevenMemberus-gaap:EstimateOfFairValueFairValueDisclosureMember2020-12-310000026324cw:SeniorNotesThreeTenMember2021-12-310000026324cw:SeniorNotesThreeTenMemberus-gaap:CarryingReportedAmountFairValueDisclosureMember2021-12-310000026324cw:SeniorNotesThreeTenMemberus-gaap:EstimateOfFairValueFairValueDisclosureMember2021-12-310000026324cw:SeniorNotesThreeTenMemberus-gaap:CarryingReportedAmountFairValueDisclosureMember2020-12-310000026324cw:SeniorNotesThreeTenMemberus-gaap:EstimateOfFairValueFairValueDisclosureMember2020-12-310000026324cw:SeniorNotesThreeTwentyMember2021-12-310000026324cw:SeniorNotesThreeTwentyMemberus-gaap:CarryingReportedAmountFairValueDisclosureMember2021-12-310000026324cw:SeniorNotesThreeTwentyMemberus-gaap:EstimateOfFairValueFairValueDisclosureMember2021-12-310000026324cw:SeniorNotesThreeTwentyMemberus-gaap:CarryingReportedAmountFairValueDisclosureMember2020-12-310000026324cw:SeniorNotesThreeTwentyMemberus-gaap:EstimateOfFairValueFairValueDisclosureMember2020-12-310000026324cw:LongtermDebtgrossMember2021-12-310000026324cw:LongtermDebtgrossMember2020-12-310000026324cw:SeniorNotesThreeEightyFiveMember2013-02-260000026324cw:SeniorNotesFourTwentyFourMember2011-12-080000026324us-gaap:RevolvingCreditFacilityMember2021-12-310000026324us-gaap:RevolvingCreditFacilityMember2020-12-310000026324us-gaap:LongTermDebtMember2021-12-310000026324us-gaap:RevolvingCreditFacilityMember2018-10-310000026324us-gaap:RevolvingCreditFacilityMember2018-09-300000026324us-gaap:StandbyLettersOfCreditMember2021-12-310000026324cw:TwoThousandTwentySeniorNotesMember2021-01-012021-12-310000026324cw:TwoThousandTwentySeniorNotesMember2020-08-130000026324cw:SeniorNotesThreeTenMember2020-08-130000026324cw:SeniorNotesThreeTwentyMember2020-08-130000026324cw:TwoThousandThirteenSeniorNotesMember2021-01-012021-12-310000026324cw:TwoThousandThirteenSeniorNotesMember2013-02-260000026324cw:SeniorNotesThreeSeventyMember2013-02-260000026324cw:SeniorNotesThreeSeventyMember2021-01-012021-12-310000026324cw:SeniorNotesThreeEightyFiveMember2021-01-012021-12-310000026324cw:SeniorNotesFourZeroFiveMember2013-02-260000026324cw:SeniorNotesFourZeroFiveMember2021-01-012021-12-310000026324cw:SeniorNotesFourElevenMember2013-09-260000026324cw:SeniorNotesFourElevenMember2021-01-012021-12-310000026324cw:TwoThousandThirteenSeniorNotesMember2018-10-152018-10-150000026324cw:TwoThousandElevenNotesMember2021-01-012021-12-310000026324cw:TwoThousandElevenNotesMember2011-12-080000026324cw:SeniorNotesThreeEightyFourMember2011-12-080000026324cw:SeniorNotesThreeEightyFourMember2021-01-012021-12-310000026324cw:SeniorNotesFourTwentyFourMember2021-01-012021-12-310000026324cw:A2014OmnibusPlanMember2021-12-310000026324cw:NonQualfiedStockOptionsMember2020-01-012020-12-310000026324cw:NonQualfiedStockOptionsMember2019-01-012019-12-310000026324us-gaap:PerformanceSharesMember2021-01-012021-12-310000026324us-gaap:RestrictedStockUnitsRSUMember2021-01-012021-12-310000026324us-gaap:PerformanceSharesMember2020-12-310000026324us-gaap:RestrictedStockUnitsRSUMember2020-12-310000026324us-gaap:PerformanceSharesMember2021-12-310000026324us-gaap:RestrictedStockUnitsRSUMember2021-12-310000026324us-gaap:EmployeeStockMember2021-01-012021-12-31cw:pension_plan0000026324us-gaap:PensionPlansDefinedBenefitMembercountry:CH2021-01-012021-12-310000026324us-gaap:PensionPlansDefinedBenefitMembercountry:GB2021-01-012021-12-310000026324us-gaap:PensionPlansDefinedBenefitMembercountry:CA2021-01-012021-12-310000026324us-gaap:PensionPlansDefinedBenefitMembercountry:DE2021-01-012021-12-310000026324us-gaap:PensionPlansDefinedBenefitMembercountry:MX2021-01-012021-12-310000026324cw:ParentCompanysRetirementBenefitPlanMember2021-01-012021-12-310000026324cw:EMDMember2021-01-012021-12-310000026324us-gaap:PensionPlansDefinedBenefitMembercountry:UScw:ParentCompanysRetirementBenefitPlanMember2021-12-310000026324us-gaap:PensionPlansDefinedBenefitMembercountry:UScw:ParentCompanysRetirementBenefitPlanMember2020-12-310000026324country:USus-gaap:OtherPensionPlansDefinedBenefitMembercw:ParentCompanysRetirementBenefitPlanMember2021-12-310000026324country:USus-gaap:OtherPensionPlansDefinedBenefitMembercw:ParentCompanysRetirementBenefitPlanMember2020-12-310000026324country:UScw:ParentCompanysRetirementBenefitPlanMember2021-12-310000026324country:UScw:ParentCompanysRetirementBenefitPlanMember2020-12-310000026324cw:ForeignCompanysRetirementBenefitPlanMemberus-gaap:ForeignPlanMember2021-12-310000026324cw:ForeignCompanysRetirementBenefitPlanMemberus-gaap:ForeignPlanMember2020-12-310000026324us-gaap:PensionPlansDefinedBenefitMember2021-01-012021-12-310000026324us-gaap:PensionPlansDefinedBenefitMember2020-01-012020-12-310000026324us-gaap:PensionPlansDefinedBenefitMember2019-01-012019-12-310000026324us-gaap:OtherPostretirementBenefitPlansDefinedBenefitMember2021-01-012021-12-310000026324us-gaap:OtherPostretirementBenefitPlansDefinedBenefitMember2020-01-012020-12-310000026324us-gaap:OtherPostretirementBenefitPlansDefinedBenefitMember2019-01-012019-12-310000026324us-gaap:PensionPlansDefinedBenefitMember2020-12-310000026324us-gaap:PensionPlansDefinedBenefitMember2019-12-310000026324us-gaap:OtherPostretirementBenefitPlansDefinedBenefitMember2020-12-310000026324us-gaap:OtherPostretirementBenefitPlansDefinedBenefitMember2019-12-310000026324us-gaap:PensionPlansDefinedBenefitMember2021-12-310000026324us-gaap:OtherPostretirementBenefitPlansDefinedBenefitMember2021-12-310000026324us-gaap:PensionPlansDefinedBenefitMemberus-gaap:DiscontinuedOperationsHeldforsaleMember2021-12-310000026324us-gaap:PensionPlansDefinedBenefitMemberus-gaap:DiscontinuedOperationsHeldforsaleMember2020-12-310000026324country:US2021-12-310000026324cw:DomesticEquitiesMember2021-12-310000026324cw:DomesticEquitiesMember2020-12-310000026324cw:DomesticEquitiesMembersrt:MinimumMember2021-12-310000026324cw:DomesticEquitiesMembersrt:MaximumMember2021-12-310000026324cw:InternationalEquitiesMember2021-12-310000026324cw:InternationalEquitiesMember2020-12-310000026324cw:InternationalEquitiesMembersrt:MinimumMember2021-12-310000026324cw:InternationalEquitiesMembersrt:MaximumMember2021-12-310000026324us-gaap:EquitySecuritiesMember2021-12-310000026324us-gaap:EquitySecuritiesMember2020-12-310000026324srt:MinimumMemberus-gaap:EquitySecuritiesMember2021-12-310000026324srt:MaximumMemberus-gaap:EquitySecuritiesMember2021-12-310000026324us-gaap:FixedIncomeFundsMember2021-12-310000026324us-gaap:FixedIncomeFundsMember2020-12-310000026324us-gaap:FixedIncomeFundsMembersrt:MinimumMember2021-12-310000026324us-gaap:FixedIncomeFundsMembersrt:MaximumMember2021-12-310000026324us-gaap:PensionPlansDefinedBenefitMembercountry:USus-gaap:CashAndCashEquivalentsMember2021-01-012021-12-310000026324us-gaap:PensionPlansDefinedBenefitMembercountry:USus-gaap:CashAndCashEquivalentsMember2020-01-012020-12-310000026324us-gaap:PensionPlansDefinedBenefitMemberus-gaap:ForeignPlanMember2021-01-012021-12-310000026324us-gaap:CashAndCashEquivalentsMember2020-12-310000026324us-gaap:CashAndCashEquivalentsMemberus-gaap:FairValueInputsLevel1Member2020-12-310000026324us-gaap:FairValueInputsLevel2Memberus-gaap:CashAndCashEquivalentsMember2020-12-310000026324us-gaap:FairValueInputsLevel1Memberus-gaap:EquitySecuritiesMember2020-12-310000026324us-gaap:FairValueInputsLevel2Memberus-gaap:EquitySecuritiesMember2020-12-310000026324us-gaap:DebtSecuritiesMember2020-12-310000026324us-gaap:FairValueInputsLevel1Memberus-gaap:DebtSecuritiesMember2020-12-310000026324us-gaap:FairValueInputsLevel2Memberus-gaap:DebtSecuritiesMember2020-12-310000026324cw:OtherPlanAssetsMember2020-12-310000026324cw:OtherPlanAssetsMemberus-gaap:FairValueInputsLevel3Member2020-12-310000026324us-gaap:FairValueInputsLevel1Member2020-12-310000026324us-gaap:FairValueInputsLevel2Member2020-12-310000026324us-gaap:FairValueInputsLevel3Member2020-12-310000026324us-gaap:CashAndCashEquivalentsMember2021-12-310000026324us-gaap:CashAndCashEquivalentsMemberus-gaap:FairValueInputsLevel1Member2021-12-310000026324us-gaap:FairValueInputsLevel2Memberus-gaap:CashAndCashEquivalentsMember2021-12-310000026324us-gaap:FairValueInputsLevel1Memberus-gaap:EquitySecuritiesMember2021-12-310000026324us-gaap:FairValueInputsLevel2Memberus-gaap:EquitySecuritiesMember2021-12-310000026324us-gaap:DebtSecuritiesMember2021-12-310000026324us-gaap:FairValueInputsLevel1Memberus-gaap:DebtSecuritiesMember2021-12-310000026324us-gaap:FairValueInputsLevel2Memberus-gaap:DebtSecuritiesMember2021-12-310000026324cw:OtherPlanAssetsMember2021-12-310000026324cw:OtherPlanAssetsMemberus-gaap:FairValueInputsLevel3Member2021-12-310000026324us-gaap:FairValueInputsLevel1Member2021-12-310000026324us-gaap:FairValueInputsLevel2Member2021-12-310000026324us-gaap:FairValueInputsLevel3Member2021-12-310000026324us-gaap:FairValueInputsLevel3Memberus-gaap:DefinedBenefitPlanRealEstateMember2019-12-310000026324us-gaap:FairValueInputsLevel3Member2019-12-310000026324us-gaap:FairValueInputsLevel3Membercw:InsuranceContractsMember2020-01-012020-12-310000026324us-gaap:FairValueInputsLevel3Memberus-gaap:DefinedBenefitPlanRealEstateMember2020-01-012020-12-310000026324us-gaap:FairValueInputsLevel3Member2020-01-012020-12-310000026324us-gaap:FairValueInputsLevel3Membercw:InsuranceContractsMember2020-12-310000026324us-gaap:FairValueInputsLevel3Memberus-gaap:DefinedBenefitPlanRealEstateMember2020-12-310000026324us-gaap:FairValueInputsLevel3Memberus-gaap:DefinedBenefitPlanRealEstateMember2021-01-012021-12-310000026324us-gaap:FairValueInputsLevel3Memberus-gaap:OtherAssetsMember2021-01-012021-12-310000026324us-gaap:FairValueInputsLevel3Member2021-01-012021-12-310000026324us-gaap:FairValueInputsLevel3Membercw:InsuranceContractsMember2021-01-012021-12-310000026324us-gaap:FairValueInputsLevel3Membercw:InsuranceContractsMember2021-12-310000026324us-gaap:FairValueInputsLevel3Memberus-gaap:DefinedBenefitPlanRealEstateMember2021-12-310000026324us-gaap:FairValueInputsLevel3Memberus-gaap:OtherAssetsMember2021-12-310000026324country:USus-gaap:OtherPostretirementBenefitPlansDefinedBenefitMember2021-12-310000026324country:UScw:ParentCompanysRetirementBenefitPlanMemberus-gaap:OtherPensionPlansPostretirementOrSupplementalPlansDefinedBenefitMembersrt:MaximumMember2021-01-012021-12-310000026324country:UScw:ParentCompanysRetirementBenefitPlanMemberus-gaap:OtherPensionPlansPostretirementOrSupplementalPlansDefinedBenefitMember2021-01-012021-12-310000026324cw:ParentCompanysRetirementBenefitPlanMemberus-gaap:ForeignPlanMemberus-gaap:OtherPensionPlansPostretirementOrSupplementalPlansDefinedBenefitMember2021-01-012021-12-310000026324cw:ParentCompanysRetirementBenefitPlanMemberus-gaap:ForeignPlanMemberus-gaap:OtherPensionPlansPostretirementOrSupplementalPlansDefinedBenefitMember2020-01-012020-12-310000026324cw:ParentCompanysRetirementBenefitPlanMemberus-gaap:ForeignPlanMemberus-gaap:OtherPensionPlansPostretirementOrSupplementalPlansDefinedBenefitMember2019-01-012019-12-310000026324us-gaap:OperatingSegmentsMembercw:AerospaceIndustrialMember2021-01-012021-12-310000026324us-gaap:OperatingSegmentsMembercw:AerospaceIndustrialMember2020-01-012020-12-310000026324us-gaap:OperatingSegmentsMembercw:AerospaceIndustrialMember2019-01-012019-12-310000026324cw:DefenseElectronicsMemberus-gaap:OperatingSegmentsMember2021-01-012021-12-310000026324cw:DefenseElectronicsMemberus-gaap:OperatingSegmentsMember2020-01-012020-12-310000026324cw:DefenseElectronicsMemberus-gaap:OperatingSegmentsMember2019-01-012019-12-310000026324cw:NavalPowerMemberus-gaap:OperatingSegmentsMember2021-01-012021-12-310000026324cw:NavalPowerMemberus-gaap:OperatingSegmentsMember2020-01-012020-12-310000026324cw:NavalPowerMemberus-gaap:OperatingSegmentsMember2019-01-012019-12-310000026324us-gaap:IntersegmentEliminationMember2021-01-012021-12-310000026324us-gaap:IntersegmentEliminationMember2020-01-012020-12-310000026324us-gaap:IntersegmentEliminationMember2019-01-012019-12-310000026324us-gaap:CorporateAndOtherMemberus-gaap:OperatingSegmentsMember2021-01-012021-12-310000026324us-gaap:CorporateAndOtherMemberus-gaap:OperatingSegmentsMember2020-01-012020-12-310000026324us-gaap:CorporateAndOtherMemberus-gaap:OperatingSegmentsMember2019-01-012019-12-310000026324us-gaap:OperatingSegmentsMembercw:AerospaceIndustrialMember2021-12-310000026324us-gaap:OperatingSegmentsMembercw:AerospaceIndustrialMember2020-12-310000026324us-gaap:OperatingSegmentsMembercw:AerospaceIndustrialMember2019-12-310000026324cw:DefenseElectronicsMemberus-gaap:OperatingSegmentsMember2021-12-310000026324cw:DefenseElectronicsMemberus-gaap:OperatingSegmentsMember2020-12-310000026324cw:DefenseElectronicsMemberus-gaap:OperatingSegmentsMember2019-12-310000026324cw:NavalPowerMemberus-gaap:OperatingSegmentsMember2021-12-310000026324cw:NavalPowerMemberus-gaap:OperatingSegmentsMember2020-12-310000026324cw:NavalPowerMemberus-gaap:OperatingSegmentsMember2019-12-310000026324us-gaap:CorporateAndOtherMemberus-gaap:OperatingSegmentsMember2021-12-310000026324us-gaap:CorporateAndOtherMemberus-gaap:OperatingSegmentsMember2020-12-310000026324us-gaap:CorporateAndOtherMemberus-gaap:OperatingSegmentsMember2019-12-310000026324us-gaap:OperatingSegmentsMembercw:AssetsHeldForSaleMember2021-12-310000026324us-gaap:OperatingSegmentsMembercw:AssetsHeldForSaleMember2020-12-310000026324us-gaap:OperatingSegmentsMembercw:AssetsHeldForSaleMember2019-12-310000026324us-gaap:OperatingSegmentsMember2021-01-012021-12-310000026324us-gaap:OperatingSegmentsMember2020-01-012020-12-310000026324us-gaap:OperatingSegmentsMember2019-01-012019-12-310000026324us-gaap:OperatingSegmentsMember2021-12-310000026324us-gaap:OperatingSegmentsMember2020-12-310000026324us-gaap:OperatingSegmentsMember2019-12-310000026324us-gaap:CorporateNonSegmentMember2021-12-310000026324us-gaap:CorporateNonSegmentMember2020-12-310000026324us-gaap:CorporateNonSegmentMember2019-12-310000026324cw:NonSegmentOtherAssetsMember2021-12-310000026324cw:NonSegmentOtherAssetsMember2020-12-310000026324cw:NonSegmentOtherAssetsMember2019-12-310000026324country:US2021-01-012021-12-310000026324country:US2020-01-012020-12-310000026324country:US2019-01-012019-12-310000026324country:GB2021-01-012021-12-310000026324country:GB2020-01-012020-12-310000026324country:GB2019-01-012019-12-310000026324cw:OtherForeignCountriesMember2021-01-012021-12-310000026324cw:OtherForeignCountriesMember2020-01-012020-12-310000026324cw:OtherForeignCountriesMember2019-01-012019-12-310000026324country:US2021-12-310000026324country:US2020-12-310000026324country:US2019-12-310000026324country:GB2021-12-310000026324country:GB2020-12-310000026324country:GB2019-12-310000026324cw:OtherForeignCountriesMember2021-12-310000026324cw:OtherForeignCountriesMember2020-12-310000026324cw:OtherForeignCountriesMember2019-12-310000026324us-gaap:StandbyLettersOfCreditMember2020-12-310000026324us-gaap:FinancialStandbyLetterOfCreditMember2021-12-310000026324us-gaap:FinancialStandbyLetterOfCreditMember2020-12-310000026324us-gaap:AccumulatedTranslationAdjustmentMember2019-12-310000026324us-gaap:AccumulatedDefinedBenefitPlansAdjustmentMember2019-12-310000026324us-gaap:AccumulatedTranslationAdjustmentMember2020-01-012020-12-310000026324us-gaap:AccumulatedDefinedBenefitPlansAdjustmentMember2020-01-012020-12-310000026324us-gaap:AccumulatedTranslationAdjustmentMember2020-12-310000026324us-gaap:AccumulatedDefinedBenefitPlansAdjustmentMember2020-12-310000026324us-gaap:AccumulatedTranslationAdjustmentMember2021-01-012021-12-310000026324us-gaap:AccumulatedDefinedBenefitPlansAdjustmentMember2021-01-012021-12-310000026324us-gaap:AccumulatedTranslationAdjustmentMember2021-12-310000026324us-gaap:AccumulatedDefinedBenefitPlansAdjustmentMember2021-12-310000026324us-gaap:AccumulatedDefinedBenefitPlansAdjustmentMemberus-gaap:ReclassificationOutOfAccumulatedOtherComprehensiveIncomeMember2021-01-012021-12-310000026324us-gaap:AccumulatedDefinedBenefitPlansAdjustmentMemberus-gaap:ReclassificationOutOfAccumulatedOtherComprehensiveIncomeMember2020-01-012020-12-310000026324cw:NavalPowerMemberus-gaap:SubsequentEventMembercw:SafranAerosystemsArrestingCompanySAAMember2022-01-212022-01-210000026324cw:NavalPowerMembercw:SafranAerosystemsArrestingCompanySAAMember2021-01-012021-12-310000026324cw:NavalPowerMemberus-gaap:SubsequentEventMember2022-01-282022-01-280000026324us-gaap:ValuationAllowanceOfDeferredTaxAssetsMember2020-12-310000026324us-gaap:ValuationAllowanceOfDeferredTaxAssetsMember2021-01-012021-12-310000026324us-gaap:ValuationAllowanceOfDeferredTaxAssetsMember2021-12-310000026324us-gaap:ValuationAllowanceOfDeferredTaxAssetsMember2019-12-310000026324us-gaap:ValuationAllowanceOfDeferredTaxAssetsMember2020-01-012020-12-310000026324us-gaap:ValuationAllowanceOfDeferredTaxAssetsMember2018-12-310000026324us-gaap:ValuationAllowanceOfDeferredTaxAssetsMember2019-01-012019-12-310000026324cw:IndustrialValveBusinessMember2020-12-31
UNITED STATES SECURITIES AND EXCHANGE COMMISSION
WASHINGTON, D.C. 20549
FORM 10-K
☒ ANNUAL REPORT PURSUANT TO SECTION 13 OR 15(d) OF THE SECURITIES EXCHANGE ACT OF 1934
For the fiscal year ended December 31, 2021
or
☐ TRANSITION REPORT PURSUANT TO SECTION 13 OR 15(d) OF THE SECURITIES EXCHANGE ACT OF 1934
For the transition period from _______ to _______
Commission File Number 1-134
CURTISS-WRIGHT CORPORATION
(Exact name of Registrant as specified in its charter)
| | | | | | | | |
| Delaware | | 13-0612970 |
| (State or other jurisdiction of incorporation or organization) | | (I.R.S. Employer Identification No.) |
| | | | | | | | | | | |
| 130 Harbour Place Drive, Suite 300 | | |
| Davidson, | North Carolina | | 28036 |
| (Address of principal executive offices) | | (Zip Code) |
Registrant's telephone number, including area code: (704) 869-4600
Securities registered pursuant to Section 12(b) of the Act: | | | | | | | | |
| Title of each class | Trading Symbol(s) | Name of each exchange on which registered |
| Common Stock | CW | New York Stock Exchange |
Securities registered pursuant to Section 12(g) of the Act: None
Indicate by check mark if the registrant is a well-known seasoned issuer, as defined in Rule 405 of the Securities Act.
Yes ☒ No ☐
Indicate by check mark if the registrant is not required to file reports pursuant to Section 13 or Section 15(d) of the Act.
Yes ☐ No ☒
Indicate by check mark whether the registrant (1) has filed all reports required to be filed by Section 13 or 15(d) of the Securities Exchange Act of 1934 during the preceding 12 months (or for such shorter period that the registrant was required to file such reports), and (2) has been subject to such filing requirements for the past 90 days.
Yes ☒ No ☐
Indicate by check mark whether the registrant has submitted electronically every Interactive Data File required to be submitted pursuant to Rule 405 of Regulation S-T (§ 232.405 of this chapter) during the preceding 12 months (or for such shorter period that the registrant was required to submit such files).
Yes ☒ No ☐
Indicate by check mark whether the registrant is a large accelerated filer, an accelerated filer, a non-accelerated filer, a smaller reporting company, or an emerging growth company. See the definitions of “large accelerated filer,” “accelerated filer,”
“smaller reporting company,” and "emerging growth company" in Rule 12b-2 of the Exchange Act. | | | | | | | | | | | | | | |
| Large accelerated filer | ☒ | | Accelerated filer | ☐ |
| Non-accelerated filer | ☐ | | Smaller reporting company | ☐ |
| | | Emerging growth company | ☐ |
| If an emerging growth company, indicate by check mark if the registrant has elected not to use the extended transition period for complying with any new or revised financial accounting standards provided pursuant to Section 13(a) of the Exchange Act. | ☐ |
Indicate by check mark whether the registrant has filed a report on and attestation to its management’s assessment of the effectiveness of its internal control over financial reporting under Section 404(b) of the Sarbanes-Oxley Act (15 U.S.C. 7262(b)) by the registered public accounting firm that prepared or issued its audit report. | ☒ |
Indicate by check mark whether the registrant is a shell company (as defined in Rule 12b-2 of the Exchange Act).
Yes ☐ No ☒
The aggregate market value of the voting and non-voting Common stock held by non-affiliates of the Registrant as of June 30, 2021 was approximately $4.8 billion.
The number of shares outstanding of the Registrant’s Common stock as of January 31, 2022: | | | | | | | | |
| | |
| Class | | Number of shares |
| | |
| Common stock, par value $1 per share | | 38,440,236 |
DOCUMENTS INCORPORATED BY REFERENCE
Portions of the Proxy Statement of the Registrant with respect to the 2022 Annual Meeting of Stockholders to be held on May 5, 2022 are incorporated by reference into Part III of this Form 10-K.
INDEX TO FORM 10-K | | | | | | | | | | | |
| | | |
| PART I | | |
| Item 1. | | | |
| Item 1A. | | | |
| Item 1B. | | | |
| Item 2. | | | |
| Item 3. | | | |
| Item 4. | | | |
| | | |
| PART II | | |
| Item 5. | | | |
| Item 6. | | | |
| Item 7. | | | |
| Item 7A. | | | |
| Item 8. | | | |
| Item 9. | | | |
| Item 9A. | | | |
| Item 9B. | | | |
| | | | |
| PART III | | |
| Item 10. | | | |
| Item 11. | | | |
| Item 12. | | | |
| Item 13. | | | |
| Item 14. | | | |
| | | | |
| PART IV | | |
| Item 15. | | | |
| | | |
| | | |
PART I
FORWARD-LOOKING STATEMENTS
Except for historical information, this Annual Report on Form 10-K may be deemed to contain “forward-looking statements” within the meaning of the Private Litigation Reform Act of 1995. Examples of forward-looking statements include, but are not limited to: (a) projections of or statements regarding return on investment, future earnings, interest income, sales, volume, other income, earnings or loss per share, growth prospects, capital structure, liquidity requirements, and other financial terms, (b) statements of plans and objectives of management, (c) statements of future economic performance and potential impacts from COVID-19, including the impacts to supply and demand, and measures taken by governments and private industry in response, (d) the effect of laws, rules, regulations, new accounting pronouncements, and outstanding litigation on our business and future performance, and (e) statements of assumptions, such as economic conditions underlying other statements. Such forward-looking statements can be identified by the use of forward-looking terminology such as “anticipates,” “believes,” “continue,” “could,” “estimate,” “expects,” “intend,” “may,” “might,” “outlook,” “potential,” “predict,” “should,” “will,” as well as the negative of any of the foregoing or variations of such terms or comparable terminology, or by discussion of strategy. No assurance may be given that the future results described by the forward-looking statements will be achieved. While we believe these forward-looking statements are reasonable, they are only predictions and are subject to known and unknown risks, uncertainties, and other factors, many of which are beyond our control, which could cause actual results, performance or achievement to differ materially from anticipated future results, performance or achievement expressed or implied by such forward-looking statements. In addition, other risks, uncertainties, assumptions, and factors that could affect our results and prospects are described in this report, including under the heading “Item 1A. Risk Factors” and elsewhere, and may further be described in our prior and future filings with the Securities and Exchange Commission and other written and oral statements made or released by us. Such forward-looking statements in this Annual Report on Form 10-K include, without limitation, those contained in Item 1. Business, Item 7. Management’s Discussion and Analysis of Financial Condition and Results of Operations, and Item 8. Financial Statements and Supplementary Data, including, without limitation, the Notes to Consolidated Financial Statements.
Given these risks and uncertainties, you are cautioned not to place undue reliance on such forward-looking statements. These forward-looking statements speak only as of the date they were made, and we assume no obligation to update forward-looking statements to reflect actual results or changes in or additions to the factors affecting such forward-looking statements.
Item 1. Business.
BUSINESS DESCRIPTION
Curtiss-Wright Corporation and its subsidiaries (we, the Corporation, or the Company) is a global integrated business that provides highly engineered products, solutions, and services mainly to aerospace & defense markets, as well as critical technologies in demanding commercial power, process, and industrial markets. We expect that the diversification and breadth of our portfolio should improve our competitive positions in our core markets, mitigate the impact of business cycle or economic volatility, and allow us to drive growth in new products and markets. We believe we are well positioned in the markets in which we operate as we seek to leverage and build upon our critical mass to expand our global engineering, sales, support and manufacturing footprint.
We believe we are well positioned on high-performance platforms and critical applications that require our technical sophistication and benefit from decades of engineering expertise and knowledge transfer. Our portfolio of highly competitive technologies are relied upon to improve safety, operating efficiency, and reliability, while meeting performance requirements in the most demanding environments. Our ability to provide mission critical, niche products and services on a cost-effective basis is fundamental to our strategy to drive increased value to our customers. We compete globally, primarily based on technology and pricing.
We strive for consistent growth in sales, operating margin, diluted earnings per share and free cash flow, steady reinvestment back into the business, and a disciplined capital deployment strategy consisting of acquisitions and returns to shareholders, to drive long-term shareholder value.
Business Segments
We manage and evaluate our operations based on the products and services we offer and the different markets we serve. Based on this approach, we operate through three reportable segments: Aerospace & Industrial, Defense Electronics, and Naval & Power.
Our principal domestic manufacturing facilities are located in Arizona, California, New York, North Carolina, Ohio, Pennsylvania, and South Carolina, and internationally in Canada, Mexico, and the United Kingdom.
Aerospace & Industrial
Sales in the Aerospace & Industrial segment are primarily generated from the general industrial and commercial aerospace markets and, to a lesser extent, the defense markets. The businesses in this segment provide a diversified offering of highly engineered products and services including: (i.) industrial and specialty vehicle products, such as electronic throttle control devices, joysticks, and transmission shifters, (ii.) sensors, controls, and electro-mechanical actuation components used on commercial and military aircraft, and (iii.) surface technology services, such as shot peening, laser peening, and engineered coatings. Certain industrial businesses within our Aerospace & Industrial segment are impacted primarily by general economic conditions, which may include consumer consumption or commercial construction rates, as the nature of their products and services primarily support global industrial, commercial vehicles, medical, and transportation industries. The commercial aerospace business is primarily impacted by original equipment manufacturers (OEM) production rates of new aircraft, while the defense business is primarily impacted by government funding and spending on new programs, primarily driven by the U.S. Government. The production and service processes rest primarily within material modification, machining, assembly, and testing and inspection at commercial grade specifications. The businesses distribute products through commercial sales and marketing channels.
Defense Electronics
Sales in the Defense Electronics segment are primarily to the defense markets and, to a lesser extent, the commercial aerospace market. The defense businesses in this segment provide a diversified offering of products including: Commercial Off-the-Shelf (COTS) embedded computing board-level modules, data acquisition and flight test instrumentation equipment, integrated subsystems, instrumentation and control systems, tactical communications solutions for battlefield network management, and electronic stabilization products. The defense businesses within our Defense Electronics segment are impacted primarily by government funding and spending, driven primarily by the U.S. Government. Our products typically support government entities in the aerospace defense, ground defense, and naval defense industries. As a result, we have varying degrees of platform-level content on fighter jets, helicopters, unmanned aerial vehicles (UAVs), ground vehicles, and nuclear and non-nuclear surface ships and submarines. Additionally, we provide avionics and electronics, flight test equipment, and aircraft data management solutions to the commercial aerospace market. Our defense businesses supporting government contractors typically utilize more advanced and ruggedized production and service processes compared to our commercial businesses and have more stringent specifications and performance requirements. The businesses in this segment typically market and distribute products through regulated government contracting channels.
Naval & Power
Sales in the Naval & Power segment are primarily to the naval defense and power & process markets. For the naval defense market, we provide naval propulsion and auxiliary equipment, including main coolant pumps, power-dense compact motors, generators, steam turbines, valves, and secondary propulsion systems, primarily to the U.S. Navy. We also provide ship repair and maintenance for the U.S. Navy’s Atlantic and Pacific fleets through three service centers. The defense businesses in this segment are primarily impacted by government funding and spending on shipbuilding programs, primarily driven by the U.S. Government. For the power & process markets, we provide a diversified offering of products for commercial nuclear power plants and nuclear equipment manufacturers, including hardware, pumps, valves, fastening systems, specialized containment doors, airlock hatches, and spent fuel management products supporting the continued performance, safety and modernization of operating reactors. We also provide Reactor Coolant Pumps (RCPs) and control rod drive mechanisms for commercial nuclear power plants, most notably to support the Generation III+ Westinghouse AP1000 reactor design. In addition, we furnish specialized and innovative severe-service valve technologies and services, heat exchanger repair, and piping test and isolation products to the oil and gas, chemical, petrochemical and industrial markets worldwide. The businesses in this segment are dependent upon the need for ongoing maintenance, repair and overhaul of existing power plants, as well as the construction of new power plants globally, and typically market and distribute products through regulated or government contracting channels.
OTHER INFORMATION
Certain Financial Information
For information regarding sales by geographic region, see Note 18 to the Consolidated Financial Statements contained in Part II, Item 8, of this Annual Report on Form 10-K.
In 2021, 2020, and 2019, our foreign operations as a percentage of pre-tax earnings were 27%, 28%, and 31%, respectively, adjusted for impairment losses associated with our industrial valves business in Germany in 2021 and 2020.
Government Sales
Our sales to the U.S. Government and foreign government end use represented 55%, 53%, and 43% of total net sales during 2021, 2020, and 2019, respectively.
In accordance with normal U.S. Government business practices, contracts and orders are subject to partial or complete termination at any time at the option of the customer. In the event of a termination for convenience by the government, there generally are provisions for recovery of our allowable incurred costs and a proportionate share of the profit or fee on the work completed, consistent with regulations of the U.S. Government. Fixed-price redeterminable contracts usually provide that we absorb the majority of any cost overrun. In the event that there is a cost underrun, the customer recoups a portion of the underrun based upon a formula in which the customer’s portion increases as the underrun exceeds certain established levels.
Generally, long-term contracts with the U.S. Government require us to invest in and carry significant levels of inventory. However, where allowable, we utilize progress payments and other interim billing practices on nearly all of these contracts, thus reducing working capital requirements. It is our policy to seek customary progress payments on certain contracts. Where we obtain such payments under U.S. Government prime contracts or subcontracts, the U.S. Government generally has control of the materials and work in process allocable or chargeable to the respective contracts. (See Notes 1, 5, and 6 to the Consolidated Financial Statements, contained in Part II, Item 8, of this Annual Report on Form 10-K).
Customers
We have hundreds of customers in the various industries that we serve. No commercial customer accounted for more than 10% of our total net sales during 2021, 2020, or 2019.
Approximately 50% of our total net sales for 2021, 47% for 2020, and 38% for 2019 were derived from contracts with agencies of, and prime contractors to, the U.S. Government. Information on our sales to the U.S. Government, including both direct sales as a prime contractor and indirect sales as a subcontractor, is as follows:
| | | | | | | | | | | | | | | | | | | | |
| | Year Ended December 31, |
| (In thousands) | | 2021 | | 2020 | | 2019 |
| Aerospace & Industrial | | $ | 155,276 | | | $ | 156,981 | | | $ | 142,666 | |
| Defense Electronics | | 600,085 | | | 470,949 | | | 367,923 | |
| Naval & Power | | 499,486 | | | 491,388 | | | 426,116 | |
| Total U.S. Government sales | | $ | 1,254,847 | | | $ | 1,119,318 | | | $ | 936,705 | |
Patents
We own and license a number of United States and foreign patents and patent applications, which have been obtained or filed over a period of years. We also license intellectual property to and from third parties. Specifically, the U.S. Government receives licenses to our patents that are developed in performance of government contracts, and it may use or authorize others to use the technology covered by such patents for government purposes. Additionally, trade secrets, unpatented research and development, and engineering, some of which have been acquired by the company through business acquisitions, make an important contribution to our business. While our intellectual property rights in the aggregate are important to the operation of our business, we do not consider the success of our business or business segments to be materially dependent upon the timing of expiration or protection of any one or group of patents, patent applications, or patent license agreements under which we now operate.
Executive Officers
| | | | | | | | | | | | | | | | | | | | | | | | | | |
| Name | | Current Position | | Business Experience | | Age | | Executive
Officer Since |
| David C. Adams | | Executive Chairman | | Executive Chairman of the Board of Directors since January 1, 2021. Prior to this, he served as Chairman and Chief Executive Officer of the Corporation from January 1, 2015 until his resignation from that position on January 1, 2021. He served as President and Chief Executive Officer of the Corporation from August 2013. He also served as President and Chief Operating Officer of the Corporation from October 2012 and as Co-Chief Operating Officer of the Corporation from November 2008. He has been a Director of the Corporation since August 2013. | | 67 | | 2005 |
| Lynn M. Bamford | | President and Chief Executive Officer | | President and Chief Executive Officer of the Corporation since January 1, 2021. Prior to this, she served as President of the former Defense and Power segments of the Corporation from January 2020. She also served as Senior Vice President and General Manager of the Company’s Defense Solutions and Nuclear divisions from 2018, and Senior Vice President and General Manager of the Defense Solutions division from 2013. She has held various leadership positions in the Corporation since 2004. She has been a Director of the Corporation since January 1, 2021. | | 58 | | 2021 |
| Kevin M. Rayment | | Vice President and Chief Operating Officer | | Vice President & Chief Operating Officer of the Corporation since April 1, 2021. Prior to this, he served as President of the Aerospace & Industrial segment (f/k/a Commercial/Industrial) of the Corporation from January 2020. He has held various leadership positions in the Corporation since 2004. | | 52 | | 2021 |
| K. Christopher Farkas | | Vice President and Chief Financial Officer | | Vice President and Chief Financial Officer of the Corporation since May 2020. Prior to this, he served as Vice President of Finance from December 2017 and served as Vice President and Corporate Controller of the Corporation from September 2014. He also served as Assistant Corporate Controller of the Corporation from May 2009. | | 53 | | 2014 |
| Paul J. Ferdenzi | | Vice President, General Counsel, and Corporate Secretary
| | Vice President, General Counsel, and Corporate Secretary of the Corporation since March 2014. Prior to this, he served as Vice President of Human Resources of the Corporation from November 2011 and also served as Associate General Counsel and Assistant Secretary of the Corporation from June 1999 and May 2001, respectively. | | 54 | | 2011 |
| Robert F. Freda | | Vice President and Treasurer | | Vice President and Treasurer of the Corporation since January 2021. Prior to this, he served as Assistant Corporate Controller of the Corporation from June 2017 and also served as Director of Finance from September 2006. | | 54 | | 2021 |
| Gary A. Ogilby | | Vice President and Corporate Controller | | Vice President and Controller of the Corporation since May 2020. Prior to this, he served as Vice President of Finance and Administration of the Company’s Surface Technologies division from November 2016. He also served as Assistant Corporate Controller of the Corporation from 2014. | | 40 | | 2020 |
Available information
We file annual reports on Form 10-K, quarterly reports on Form 10-Q, current reports on Form 8-K, and proxy statements for our annual stockholders’ meetings, as well as any amendments to those reports, with the Securities and Exchange Commission (SEC). The SEC maintains an Internet site at www.sec.gov that contains reports, proxy and information statements, and other information regarding issuers that file electronically with the SEC, including our filings. These reports are also available free of charge through the Investor Relations section of our website at www.curtisswright.com as soon as reasonably practicable after we electronically file.
Human Capital
At the end of 2021, we had approximately 7,800 employees in more than 20 countries, 7% of which are represented by labor unions and covered by collective bargaining agreements.
Set forth below are some of the key aspects of Curtiss-Wright’s human capital strategy:
Compensation Programs and Employee Benefits
Our success as an organization is ultimately dependent upon the success of our employees. As a result, we have made significant investments in order to attract, develop, and retain talented personnel, inclusive of competitive pay, equity-based compensation, benefits, training, and professional development opportunities. Notable programs offered include the following:
•Employer 401(k) matching contributions;
•Employee Stock Purchase Plan;
•Employer-sponsored health insurance;
•Tuition reimbursement program; and
•Training and professional development
In addition to the above, we also offer equity-based compensation plans to certain employees through the issuance of performance share units, restricted stock units, and cash-based performance units. Our equity compensation plans ultimately act as a key lever for rewarding and retaining key employees, while also aligning the interests of our key employees and shareholders. See Note 16 to the Consolidated Financial Statements for more information regarding our equity-based compensation plans.
Diversity and Inclusion
Curtiss-Wright believes in a diverse and inclusive workforce, where diverse backgrounds are represented, engaged, and empowered to inspire and innovate. Discrimination is not tolerated at Curtiss-Wright. We are committed to high ethical standards and equal employment opportunities in all personnel actions without regard to race, color, religion, gender, national origin, citizenship status, age, marital status, gender identity or expression, sexual orientation, physical or mental disability, or veteran status. We maintain a Code of Conduct, an anti-harassment policy, and an equal employment opportunity policy, and provide training on these policies annually. We do business in more than 20 countries, and our employees operate across cultures, functions, language barriers, and time zones to solve the technical and logistical challenges presented by its worldwide customer base. To foster a more diverse and inclusive culture, Curtiss-Wright is focused on (1) promoting a culture of diversity and inclusion that leverages the talents of all employees, and (2) implementing practices that attract, recruit, and retain diverse top talent. Our succession plans are geared at retaining and promoting our existing employees to provide equal opportunity and access to promotion within the organization.
Health and Safety
The health and safety of our employees is a top priority for Curtiss-Wright. We take steps to ensure that we comply with applicable legal, regulatory, and other requirements in all material respects related to preventing pollution, injury, and ill health, and employ industry-leading, technologically sound, and economically feasible control mechanisms, procedures, and processes. In addition, we provide training, education, safety monitoring and auditing, and health-awareness programs in our offices and factories. We track total recordable rate (TRR) and days away, restriction and transfer rate (DART) for all sites worldwide. For the year ended December 31, 2021, our TRR and DART rates were 1.49 and 0.99, respectively. For the year ended December 31, 2020, our TRR and DART rates were 0.98 and 0.65, respectively.
In response to the COVID-19 pandemic, we continue to promote the importance of being vaccinated and execute safety measures at all facilities to protect the health and safety of our employees and visitors. We have implemented rigorous hygiene and social distancing practices, inclusive of mask requirements and staggered shifts. Additionally, we implemented requirements regarding mandatory vaccines for U.S. based covered employees, subject to approved exemptions. Furthermore, a significant portion of our non-manufacturing employees are currently working remotely on a hybrid basis, where practicable to do so, in an effort to minimize any potential spread of COVID-19. These working conditions have been designed to allow for the continuation of key business-critical operations and controls.
Ethics and Integrity
Curtiss-Wright is deeply committed to ensuring that all of its employees conduct business with the highest levels of ethics and integrity and to complying with all laws and regulations applicable to Curtiss-Wright’s businesses. To support and articulate our commitment and responsibility in this regard, Curtiss-Wright has adopted a Code of Conduct (the “Code”). The Code addresses several topics, including conflicts of interest, safeguarding assets, financial reporting, the protection of confidential information, insider trading, and general adherence to laws and regulations. All employees, including executive officers, must comply with the Code. The Code is available within the Corporate Governance section of the Company’s website at https://investors.curtisswright.com/governance/governance-documents. In order to enhance understanding of and compliance with the Code, all employees are required to complete a training program annually which details ethical business practices, an inclusive workforce, and respectful treatment of our employees. In addition, the Corporation maintains an ethics-related global hotline through which employees can report any issues of concern. The hotline facilitates the communication of ethical, financial, discrimination, and health and safety concerns and serves as the vehicle through which employees may communicate with the Audit Committee of the Board of Directors confidentially and anonymously regarding any accounting, internal controls, or auditing concerns.
Item 1A. Risk Factors.
We have summarized the known, material risks to our business below. Our business, financial condition, and results of operations and cash flows could be materially and adversely impacted if any of these risks materialize. Additional risk factors not currently known to us or that we believe are immaterial may also impair our business, financial condition, and results of operations and cash flows, and require significant management time and attention. In addition to the risks and uncertainties set forth in section below entitled “Risks Related to the Coronavirus (COVID-19) Pandemic," many of the risks and uncertainties set forth in the other risk factors are exacerbated by the COVID-19 pandemic, corresponding government and business responses, and any further resulting decline in the global business and economic environment, and may be impacted by the extent and speed of the global economic recovery. The risk factors below should be considered together with information included elsewhere in this Annual Report on Form 10-K as well as other required filings by us to the Securities Exchange Commission, such as our Form 10-Q’s, Form 8-K’s, proxy statements for our annual shareholder meetings, and subsequent amendments, if any.
RISKS RELATED TO THE CORONAVIRUS (COVID-19) PANDEMIC
The COVID-19 pandemic has adversely impacted, and is expected to continue to pose risks to our business, the nature and extent of which are highly uncertain and unpredictable.
In March 2020, the World Health Organization characterized the outbreak of COVID-19 as a pandemic. The COVID-19 pandemic and the associated pandemic-related responses continue to cause significant and volatile disruptions in global economies, in capital markets, and across industries. While we continue to actively monitor the pandemic and take steps to mitigate the risks posed by its spread, there is no guarantee that our efforts will mitigate the adverse impacts of COVID-19 or will be effective.
The pandemic has adversely affected, and is expected to continue to adversely affect, certain elements of our business, including our supply chain and production levels. As of December 31, 2021, all of our manufacturing operations are operational. However, we are unable to predict if there will be additional government-imposed restrictions on our ability to operate in future periods. Additionally, our ability to continue to manufacture products is highly dependent on our ability to maintain the safety and health of our factory employees. The ability of our employees to work may be significantly impacted by the individuals contracting or being exposed to COVID-19 and its variants. While we are following the requirements of governmental authorities and taking preventative and protective measures to prioritize the safety of our employees, these measures are not always successful, and we may be required to temporarily close facilities or take other measures. Potential future directives curtailing in-person operations due to illness, quarantines, government actions, facility closures or other restrictions in connection with the COVID-19 pandemic could change at any time. This could have an adverse effect on the productivity and profitability of such manufacturing facilities, which could in turn adversely impact our business and operations.
The COVID-19 pandemic has disrupted the global supply chain to a certain extent and availability of raw materials, particularly electronic parts. Because we strive to limit the volume of raw materials and component parts on hand, our business could be adversely affected if we were unable to obtain these raw materials and components from our suppliers in the quantities we require or on favorable terms.
We continue to monitor the situation, assessing possible implications on our operations, supply chain, liquidity, cash flow and customer orders, and will continue taking actions in an effort to mitigate adverse consequences. Recognizing the unprecedented
nature, scale and uncertainty associated with this global health crisis, the duration and extent of the ongoing impacts cannot be reasonably estimated at this time.
RISKS RELATED TO OUR OPERATIONS
Intrusion on our systems could damage our business.
We store sensitive data, including intellectual property, proprietary business information, and confidential employee information on our servers and databases. The COVID-19 pandemic has caused us to modify our business practices, including empowering many of our office-based associates to work productively from home on a hybrid basis when appropriate to do so. As a result, we are increasingly dependent upon our information systems to operate our business. Our ability to effectively manage our business depends on the security, reliability, and adequacy of our information systems. In addition, various privacy and securities laws require us to manage and protect sensitive and confidential information, including personal data of our employees, from disclosure. For example, the European Union's General Data Protection Regulation, which became effective in May 2018, extends the scope of the European Union data protection laws to all companies processing data of European Union residents, regardless of the company's location. Despite our implementation of firewalls, switchgear, and other network security measures, our servers, databases, and other systems may be vulnerable to computer hackers, physical or electronic break-ins, sabotage, computer viruses, worms, and similar disruptions from unauthorized tampering with our computer systems. We continue to review and enhance our computer systems as well as provide training to our employees in an attempt to prevent unauthorized and unlawful intrusions, but in the future, it is possible that we may not be able to prevent all intrusions. Such intrusions could result in our network security or computer systems being compromised and possibly result in the misappropriation or corruption of sensitive information or cause disruptions in our services. While we carry cyber insurance, we still may be required to expend significant capital and resources to protect against, remediate, or alleviate problems caused by such intrusions. Any such intrusion could cause us to be non-compliant with applicable laws or regulations, subject us to legal claims or proceedings, disrupt our operations, damage our reputation, and cause a loss of confidence in our products and services, any of which could have a material adverse effect on our business, financial condition, and results of operations.
Potential product liability risks exist from the products that we sell.
We may be exposed to liabilities for personal injury, death, or property damage due to the failure of a product that we have sold. We typically agree to indemnify our customers against certain liabilities resulting from the products we sell, and any third-party indemnification we seek from our suppliers and our liability insurance may not fully cover our indemnification obligations to customers. We may also not be able to maintain insurance coverage in the future at an acceptable cost. Any liability for which third-party indemnification is not available that is not covered by insurance could have a material adverse effect on our business, financial condition, and results of operations.
In addition, an accident caused by one of our products could damage our reputation for selling quality products. We believe that our customers consider safety and reliability as key criteria in selecting our products and believe that our reputation for quality assurance is a significant competitive strength. If an accident were to be caused by one of our products, or if we were to otherwise fail to maintain a satisfactory record of safety and reliability, our ability to retain and attract customers may be materially adversely affected.
We are subject to liability under warranty obligations.
The majority of our contracts contain provisions which expose us to potential liability for warranty claims made by customers or third parties with respect to products that have been designed, manufactured, or serviced by us or our suppliers. Material product warranty obligations could have a material adverse effect on our business, financial condition, and results of operations.
If we fail to satisfy our contractual obligations, our contracts may be terminated and we may incur significant costs or liabilities, including liquidated damages and penalties.
In general, our contracts may be terminated for our failure to satisfy our contractual obligations. In addition, some of our contracts contain substantial liquidated damages provisions and financial penalties related to our failure to satisfy our contractual obligations. Our inability to sufficiently satisfy contractual obligations could have a material adverse effect on our reputation, business, financial condition, results of operations, and cash flows.
Our earnings and margins depend in part on subcontractor performance, as well as raw material and component availability and pricing.
Our businesses depend on suppliers and subcontractors for raw materials and components. At times subcontractors perform services that we provide to our customers. Our supply chain has been and may continue to be impacted by the COVID-19
pandemic. We depend on these subcontractors and suppliers to meet their contractual obligations in full compliance with customer requirements. Nonperformance or underperformance by subcontractors and suppliers could materially impact our ability to perform obligations to our customers, which could result in a customer terminating our contract for default, expose us to liability, and substantially impair our ability to compete for future contracts and orders. Generally, raw materials and purchased components are available from a number of different suppliers, though several suppliers are our sole source of certain components. If a sole-source supplier should cease or otherwise be unable to deliver such components, our operating results could be adversely impacted. In addition, our supply networks can sometimes experience price fluctuations. Our ability to perform our obligations as a prime contractor may be adversely affected if one or more of these suppliers are unable to provide the agreed-upon supplies or perform the agreed-upon services in a timely and cost-effective manner. While we have attempted to mitigate the effects of increased costs through price increases, there are no assurances that higher prices can effectively be passed through to our customers or that we will be able to fully offset the effects of higher raw materials costs through price increases on a timely basis.
Our business involves risks associated with complex manufacturing processes.
Our manufacturing processes depend on certain sophisticated and high-value equipment. Unexpected failures of this equipment may result in production delays, revenue loss, and significant repair costs. In addition, equipment failures could result in injuries to our employees. Moreover, the competitive nature of our businesses requires us to continuously implement process changes intended to achieve product improvements and manufacturing efficiencies. These process changes may at times result in production delays, quality concerns, and increased costs. Any disruption of operations at our facilities due to equipment failures or process interruptions could have a material adverse effect on our business.
RISKS RELATED TO OUR STRATEGY
Implementing our acquisition strategy involves risks, and our failure to successfully implement this strategy could have a material adverse effect on our business.
As part of our capital allocation strategy, we aim to grow our business by selectively pursuing acquisitions and technologies that supplement our organic growth. We are continuing to actively pursue additional acquisition opportunities, some of which may be material to our business and financial performance. Although we have been successful with this strategy in the past, we may not be able to grow our business in the future through acquisitions for several reasons, including:
•Encountering difficulties identifying and executing acquisitions;
•Increased competition for targets, which may increase acquisition costs;
•Consolidation in our industry, reducing the number of acquisition targets;
•Competition laws and regulations preventing us from making certain acquisitions; and
•Acquisition financing not being available on acceptable terms, or at all.
In addition, there are potential risks associated with growing our business through acquisitions, including the failure to successfully integrate and realize the expected benefits of an acquisition, which could be exacerbated by the impact of the COVID-19 pandemic. For example, with any past or future acquisition, there is the possibility that:
•The business culture of the acquired business may not match well with our culture;
•Technological and product synergies, economies of scale, or cost reductions may not occur as expected;
•Management may be distracted from overseeing existing operations by the need to integrate acquired businesses;
•We may acquire or assume unexpected liabilities;
•We may experience unforeseen difficulties in integrating operations and systems;
•We may fail to retain or assimilate employees of the acquired business;
•We may experience problems in retaining customers or integrating customer bases; and
•We may encounter difficulties in entering new markets in which we may have little or no experience.
Failure to successfully implement our acquisition strategy, including successfully integrating acquired businesses, could have a material adverse effect on our business, financial condition, and results of operations.
Our future success will depend, in part, on our ability to develop new technologies.
Virtually all products produced and sold by us are highly engineered and require sophisticated manufacturing and system-integration techniques and capabilities. The commercial and government markets in which we operate are characterized by rapidly changing technologies. The product and program needs of our government and commercial customers change and evolve regularly. Accordingly, our future performance depends in part on our ability to: identify emerging technological trends in our current and target markets; develop and manufacture competitive products, systems, and services; enhance our offerings by adding technological innovations that differentiate our products, systems, and services from those of our competitors; and develop, manufacture, and bring those products, systems, and service to market quickly at cost-effective prices.
We operate in highly competitive markets.
Many of our products and services are sold in highly competitive markets and are affected by varying degrees of competition. We compete against companies that often have higher sales volumes and greater financial, technological, research and development, human, and marketing resources than we have. As a result, they may be better able to withstand the effects of periodic economic downturns, including withstanding the current global pandemic. In addition, some of our largest customers could develop the capability to manufacture products or provide services similar to products that we manufacture or services that we provide. This would result in these customers supplying their own products or services and competing directly with us for sales of these products or services, all of which could significantly reduce our revenues. Furthermore, we are facing increased international competition and cross-border consolidation of competition. Our management believes that the principal points of competition in our markets are technology, product quality, product performance, price, technical expertise, timeliness of delivery, superior customer service and support, and continued certification under customer quality requirements and assurance programs. If we are unable to compete successfully with existing or new competitors in these areas, we may experience a material adverse effect on our business, financial condition, and results of operations.
We may be unable to protect the value of our intellectual property.
Obtaining, maintaining, and enforcing our intellectual property rights and avoiding infringing on the intellectual property rights of others are important factors to the operation of our business. While we take precautionary steps to protect our technological advantages and intellectual property and rely in part on patent, trademark, trade secret, and copyright laws, we cannot assure that the precautionary steps we have taken will completely protect our intellectual property rights. Because patent applications in the United States are maintained in secrecy until either the patent application is published or a patent is issued, we may not be aware of third-party patents, patent applications, and other intellectual property relevant to our products that may block our use of our intellectual property or may be used in third-party products that compete with our products and processes. When others infringe on our intellectual property rights, the value of our products is diminished, and we may incur substantial litigation costs to enforce our rights. Similarly, we may incur substantial litigation costs and the obligation to pay royalties if others claim we infringed on their intellectual property rights. When we develop intellectual property and technologies with funding from U.S. Government contracts, the government has the royalty-free right to use that property.
In addition to our patent rights, we also rely on unpatented technology, trade secrets, and confidential information. Others may independently develop substantially equivalent information and techniques or otherwise gain access to or disclose our technology. We may not be able to protect our rights in unpatented technology, trade secrets, and confidential information effectively. We generally require each of our employees and consultants to execute a confidentiality agreement at the commencement of an employment or consulting relationship with us. There is no guarantee that we will succeed in obtaining and retaining executed agreements from all employees or consultants. Moreover, these agreements may not provide effective protection of our information or, in the event of unauthorized use or disclosure, they may not provide adequate remedies.
RISKS RELATED TO MARKET CONDITIONS
A substantial portion of our revenues and earnings depends upon the continued willingness of the U.S. Government and other customers in the defense industry to buy our products and services.
In 2021, approximately 50% of our total net sales were derived from or related to U.S. defense programs. U.S. defense spending has historically been cyclical, and defense budgets tend to rise when perceived threats to national security increase the level of concern over the country’s safety. At other times, spending by the military can decrease. In August 2011, Congress enacted the Budget Control Act of 2011 (BCA), which imposed spending caps and certain reductions in defense spending over a ten-year
period through 2021. These spending caps and reductions, referred to as sequestration, went into effect in March 2013. Through a series of bipartisan agreements, Congress has been able to temporarily lift discretionary spending limits every year through 2019. On August 2, 2019, the Bipartisan Budget Act of 2019 (BBA) was signed into law, which raised the BCA budget caps for both defense and non-defense discretionary spending in 2020 and 2021 and extended the mandatory BCA spending reductions through 2029. Absent additional legislative or other remedial action, the sequestration could require reduced U.S. federal government spending from fiscal 2022 through fiscal 2029. As a result of this uncertainty, a decrease in U.S. Government defense spending or changes in spending allocation could result in one or more of our programs being reduced, delayed, or terminated. In the event that one or more of our programs are reduced, delayed, or terminated for which we provide products and services, we may experience a reduction in our revenues and earnings and a material adverse effect on our business, financial condition, and results of operations.
The BBA also temporarily suspended the public debt limit through July 31, 2021, which Congress temporarily extended through December 3, 2021. However, on December 16, 2021, President Biden signed legislation into law increasing the debt ceiling by $2.5 trillion, which is expected to allow the U.S. government to cover its debt obligations into fiscal year 2023. Failure by Congress to further suspend or increase the debt ceiling could delay or result in the loss of contracts for the procurement of our products and services, and we may be asked or required to continue to perform for some period of time on certain of our U.S. government contracts, even if the U.S. government is unable to make timely payments.
A downturn in the aircraft market could adversely affect our business.
Our sales to large commercial aircraft manufacturers are cyclical in nature and can be adversely affected by a number of factors, including current and future passenger traffic levels, increasing fuel and labor costs, environmental concerns, inclusive of climate change, intense price competition, the retirement of older aircraft, regulatory changes, outbreak of infectious disease such as the COVID-19 pandemic, terrorist attacks, general economic conditions, worldwide airline profits, and backlog levels, all of which can be unpredictable and are outside our control. For example, the COVID-19 pandemic drastically reduced air traffic as travel restrictions and social distancing measures were implemented to help control the spread of the virus. The reduced air traffic applied financial pressures on airlines, who, in order to preserve cash and liquidity, dramatically reduced flight hours and delayed the purchases of new aircraft. Although U.S. domestic air travel has increased during 2021, international travel has not yet begun to recover at the same pace. Given the uncertain length of this pandemic and associated restrictions to travel long distances, the commercial market may shift away from wide-body aircraft. Furthermore, as companies and employees become accustomed to working remotely, business travel and the associated flight hours may not reach the pre-pandemic levels. Any decrease in demand resulting from a downturn in the aerospace market could adversely affect our business, financial condition, and results of operations.
Our backlog is subject to reduction and cancellation, which could negatively impact our revenues and results of operations.
Backlog represents products or services that our customers have contractually committed to purchase from us. Total backlog includes both funded (unfilled orders for which funding is authorized, appropriated, and contractually obligated by the customer) and unfunded backlog (firm orders for which funding has not been appropriated and/or contractually obligated by the customer). We are a subcontractor to prime contractors for the vast majority of our government business; as such, substantially all amounts in backlog are funded. Backlog excludes unexercised contract options and potential orders under ordering type contracts (e.g. Indefinite Delivery / Indefinite Quantity). Backlog is adjusted for changes in foreign exchange rates and is reduced for contract cancellations and terminations in the period in which they occur. Backlog as of December 31, 2021 was $2.2 billion. Backlog is subject to fluctuations and is not necessarily indicative of future sales. The timing of backlog may be impacted by project delays. The U.S. Government may unilaterally modify or cancel its contracts. In addition, under certain of our commercial contracts, our customers may unilaterally modify or terminate their orders at any time for their convenience. Accordingly, certain portions of our backlog can be cancelled or reduced at the option of the U.S. Government and commercial customers. We believe that these risks are heightened due to the global economic impact of the COVID-19 pandemic. Our failure to replace cancelled or reduced backlog could negatively impact our results of operations.
RISKS RELATED TO LEGAL AND REGULATORY MATTERS
As a U.S. Government contractor, we are subject to numerous procurement rules and regulations.
We must comply with and are affected by laws and regulations relating to the award, administration, and performance of U.S. Government contracts. Government contract laws and regulations affect how we do business with our customers and, in some instances, impose added costs on our business. A violation of specific laws and regulations could result in the imposition of fines and penalties, the termination of our contracts, or debarment from bidding on contracts. These fines and penalties could be imposed for failing to follow procurement integrity and bidding rules, employing improper billing practices or otherwise failing to follow cost accounting standards, receiving or paying kickbacks, or filing false claims. We have been, and expect to continue to be, subjected to audits and investigations by government agencies. The failure to comply with the terms of our government
contracts could harm our business reputation. It could also result in our progress payments being withheld. In some instances, these laws and regulations impose terms or rights that are more favorable to the government than those typically available to commercial parties in negotiated transactions. For example, the U.S. Government may terminate any of our government contracts and, in general, subcontracts, at its convenience as well as for default based on performance. Upon termination for convenience of a fixed-price type contract, we normally are entitled to receive the purchase price for delivered items, reimbursement for allowable costs for work-in-process, and an allowance for profit on work actually completed on the contract or adjustment for loss if completion of performance would have resulted in a loss. Upon termination for convenience of a cost reimbursement contract, we normally are entitled to reimbursement of allowable costs plus a portion of the fee. Such allowable costs would normally include our cost to terminate agreements with our suppliers and subcontractors. The amount of the fee recovered, if any, is related to the portion of the work accomplished prior to termination and is determined by negotiation.
A termination arising out of our default could have a material adverse effect on our ability to compete for future contracts and orders. In addition, on those contracts for which we are teamed with others and are not the prime contractor, the U.S. Government could terminate a prime contract under which we are a subcontractor, irrespective of the quality of our services as a subcontractor.
Our U.S. Government contracts typically span one or more base years and multiple option years. The U.S. Government generally has the right to not exercise option periods and may not exercise an option period if the agency is not satisfied with our performance on the contract or does not receive funding to continue the program. U.S. Government procurement may adversely affect our cash flow or program profitability.
Furthermore, we are subject to other risks in connection with government contracts, including without limitation:
•the frequent need to bid on programs prior to completing the necessary design, which may result in unforeseen technological difficulties and/or cost overruns;
•the difficulty in forecasting long-term costs and schedules and the potential obsolescence of products related to long-term, fixed price contracts;
•contracts with varying fixed terms that may not be renewed or followed by follow-on contracts upon expiration;
•cancellation of the follow-on production phase of contracts if program requirements are not met in the development phase; and
•the fact that government contract wins can be contested by other contractors.
Our operations are subject to numerous domestic and international laws, regulations, and restrictions. Noncompliance with these laws, regulations, and restrictions could expose us to fines, penalties, suspension, or debarment, which could have a material adverse effect on our profitability and overall financial condition.
We have contracts and operations in many parts of the world subject to United States and foreign laws and regulations, including the False Claims Act, regulations relating to import-export control (including the International Traffic in Arms Regulation promulgated under the Arms Export Control Act), sanctions programs implemented by the Office of Foreign Assets Control of the U.S. Department of Treasury, technology transfer restrictions, repatriation of earnings, exchange controls, the Foreign Corrupt Practices Act, the U.K. Anti-Bribery Act, and the anti-boycott provisions of the U.S. Export Administration Act. Because the COVID-19 pandemic has so negatively impacted local economies, government intervention has increased, which in turn can create elevated risk and opportunity for corruption. Although we have implemented policies and procedures and provided training that we believe are sufficient to address these risks, we cannot guarantee that our operations will always comply with these laws and regulations. From time to time, we may file voluntary disclosure reports with the U.S. Department of State, the Department of Energy, and the Department of Commerce regarding certain violations of U.S. export control laws and regulations discovered by us in the course of our business activities, employee training, or internal reviews and audits. To date, our voluntary disclosures have not resulted in a fine, penalty, or export privilege denial or restriction that has had a material adverse impact on our financial condition or ability to export. Our failure, or failure by our sales representatives or consultants to comply with these laws and regulations could result in administrative, civil, or criminal liabilities and could, in the extreme case, result in suspension or debarment from government contracts or suspension of our export privileges, which could have a material adverse effect on our business.
The airline industry is heavily regulated, and if we fail to comply with applicable requirements, our results of operations could suffer.
Governmental agencies throughout the world, including the U.S. Federal Aviation Administration (FAA) and the European Aviation Safety Agency, prescribe standards and qualification requirements for aircraft components, including virtually all commercial airline and general aviation products. Specific regulations vary from country to country, although compliance with FAA requirements generally satisfies regulatory requirements in other countries. We include documentation with our products sold to aircraft manufacturing customers certifying that each part complies with applicable regulatory requirements and meets applicable standards of airworthiness established by the FAA or the equivalent regulatory agencies in other countries. In order to sell our products, the Corporation as well as the products that we manufacture must also be certified by our individual OEM customers. If any of the material authorizations or approvals qualifying us to supply our products is revoked or suspended, then the sale of such product would be prohibited by law, which would have an adverse effect on our business, financial condition, and results of operations.
From time to time, the FAA or equivalent regulatory agencies in other countries propose new regulations or changes to existing regulations, which are usually more stringent than existing regulations. If these proposed regulations are adopted and enacted, we may incur significant additional costs to achieve compliance, which could have a material adverse effect on our business, financial condition, and results of operations.
We are subject to liability under environmental and health and safety laws and regulations.
Our business and facilities are subject to numerous federal, state, local, and foreign laws and regulations relating to the use, manufacture, storage, handling, and disposal of hazardous materials and other waste products. Environmental laws generally impose liability for investigation, remediation, and removal of hazardous materials and other waste products on property owners and those who dispose of materials at waste sites, whether or not the waste was disposed of legally at the time in question. We are currently addressing environmental remediation at certain current and former facilities, and we have been named as a potentially responsible party along with other organizations in a number of environmental clean-up sites and may be named in connection with future sites. We are required to contribute to the costs of the investigation and remediation and to establish reserves in our financial statements for future costs deemed probable and estimable. Although we have estimated and reserved for future environmental remediation costs, the final resolution of these liabilities may significantly vary from our estimates and could potentially have an adverse effect on our results of operations and financial position. We are also subject to worker health and safety requirements as well as various state and local public health laws, rules, regulations and orders related to COVID-19, including mask and social distancing requirements. While we are in compliance with government health and safety regulations related to COVID-19, the cost of complying, or failing to comply, with these regulations could have an adverse effect on our operating results.
We may be subject to periodic litigation and regulatory proceedings, which may adversely affect our business and financial performance.
From time to time, we are involved in lawsuits and regulatory actions brought or threatened against us in the ordinary course of business. These actions and proceedings may involve claims for, among other things, compensation for alleged personal injury, workers’ compensation, employment discrimination, or breach of contract. Due to the inherent uncertainties of litigation, we cannot accurately predict the ultimate outcome of any such actions or proceedings. The outcome of litigation, particularly class action lawsuits and regulatory actions, is difficult to assess or quantify, as plaintiffs may seek recovery of very large or indeterminate amounts in these types of lawsuits, and the magnitude of the potential loss may remain unknown for substantial periods of time. In addition, plaintiffs in many types of actions may seek punitive damages, civil penalties, consequential damages or other losses, or injunctive or declaratory relief. These proceedings could result in substantial cost and may require us to devote substantial resources to defend ourselves. The ultimate resolution of these matters through settlement, mediation, or court judgment could have a material impact on our financial condition, results of operations, and cash flows.
Our business, financial condition, and results of operations could be materially adversely affected by climate change regulations.
Climate change regulations at the federal, state, or local level or in international jurisdictions could require us to limit emissions, change our manufacturing processes, obtain substitute materials which may cost more or be less available, increase our investment in control technology for greenhouse gas emissions, fund offset projects, or undertake other costly activities. These regulations could significantly increase our costs and restrict our manufacturing operations by virtue of requirements for new equipment. New permits may be required for our current operations, or expansions thereof. Failure to timely receive permits could result in fines, suspension of production, or cessation of operations at one or more facilities. In addition, restrictions on carbon dioxide or other greenhouse gas emissions could result in significant costs such as higher energy costs and the passing down of carbon taxes, emission cap and trade programs, and renewable portfolio standards by utility companies. The cost of complying, or of failing to comply, with these and other climate change and emissions regulations could have an adverse effect on our operating results.
Increasing focus on environmental, social, and governance responsibility may impose additional costs on us and expose us to new risks.
Increasing focus on environmental, social, and governance responsibility may impose additional costs on us and expose us to new risks. Regulators, stockholders, and other interested constituencies have focused increasingly on the environmental, social, and governance practices of companies. Our customers may require us to implement environmental, social, or governance responsibility procedures or standards before they continue to do business with us. Additionally, we may face reputational challenges in the event that our environmental, social, or governance responsibility procedures or standards do not meet the standards set by certain constituencies. The occurrence of any of the foregoing could have a material adverse effect on our business, financial condition, and results of operations.
RISKS RELATED TO FINANCIAL MATTERS
Political and economic changes in foreign countries and markets, including foreign currency fluctuations, may have a material effect on our operating results.
During 2021, approximately 26% of our total net sales were to customers outside of the United States. Additionally, we also have operating facilities located in foreign countries. Doing business in foreign countries is subject to numerous risks, including without limitation: political and economic instability and potential for social unrest, the uncertainty of the ability of non-U.S. customers to finance purchases, restrictions on the repatriation of funds, restrictive trade policies, tariff regulations, difficulties in obtaining export and import licenses, government financed competition, changes in the local labor-relations climate, economic conditions in local markets, health concerns (including the COVID-19 pandemic), complying with foreign regulatory and tax requirements that are subject to change, and limitations on our ability to enforce legal rights and remedies. While these factors or the impact of these factors are difficult to predict, any one or more of these factors could adversely affect our operations. To the extent that foreign sales are transacted in foreign currencies and we do not enter into currency hedge transactions, we are exposed to risk of losses due to fluctuations in foreign currency exchange rates, particularly for the British Pound, Euro, and Canadian dollar. Significant fluctuations in the value of the currencies of the countries in which we do business could have an adverse effect on our results of operations.
Unanticipated changes in our tax provisions or exposure to additional income tax liabilities could affect our cash flows and financial condition.
Our business operates in many locations under government jurisdictions that impose income taxes. Changes in domestic or foreign income tax laws and regulations, or their interpretation, could result in higher or lower income tax rates assessed or changes in the taxability of certain revenues or the deductibility of certain expenses, thereby affecting our income tax expense and profitability. The Biden administration announced in 2021 several tax proposals to fund new government investments in infrastructure, healthcare, and education, among others. Certain of these proposals involve an increase in the domestic corporate tax rate, which if implemented could have a material impact on our future results of operations and cash flows. In addition, on March 27, 2020, the Coronavirus Aid, Relief, and Economic Security Act (CARES Act) was enacted in response to the COVID-19 pandemic. The CARES Act, among other things, included certain changes in tax law intended to stimulate the U.S. economy in light of the COVID-19 pandemic, including temporary beneficial changes to the treatment of net operating losses, interest deductibility limitations, and payroll tax matters. The CARES Act is subject to interpretation and implementation guidance by both federal and state tax authorities, as well as amendments and technical corrections. Any or all of these could impact our business unfavorably. Additionally, tax rates in various jurisdictions in which we operate or sell into may increase as a means of funding the significant cost of governmental stimulus measures enacted to assist and protect individuals and businesses impacted by the COVID-19 pandemic. It cannot be predicted whether, when, in what form, or with what effective dates, new tax laws or changes in tax rates may be enacted, or regulations and rulings may be enacted, promulgated or issued under existing or new tax laws, which could result in an increase in our tax liability or require changes in the manner in which we operate in order to minimize or mitigate any adverse effects of changes in tax law or in the interpretation thereof.
Furthermore, the amount of income taxes paid by us is subject to examination by U.S. federal, state, and local tax authorities and by non-U.S. tax authorities. We regularly assess the likelihood of an adverse outcome resulting from such examinations to determine the adequacy of our provision for taxes. There can be no assurance as to the outcome of any such examinations. If the ultimate determination of our taxes owed were for an amount in excess of amounts reserved, our operating results, cash flows, and financial condition could be materially and adversely affected.
We use estimates when accounting for long-term contracts. Changes in estimates could affect our profitability and overall financial position.
Long-term contract accounting requires judgment relative to assessing risks, estimating contract revenues and costs, and making assumptions for schedule and technical issues. Due to the size and nature of many of our contracts, the estimation of total
revenues and costs at completion is complicated and subject to many variables. For example, assumptions have to be made regarding the length of time to complete the contract as costs also include expected increases in wages and prices for materials. Similarly, assumptions have to be made regarding the future impact of efficiency initiatives and cost reduction efforts. Incentives, awards, price escalations, liquidated damages, or penalties related to performance on contracts are considered in estimating revenue and profit rates and are recorded when there is sufficient information to assess anticipated performance. It is possible that materially different amounts could be obtained, because of the significance of the judgments and estimation processes described above, if different assumptions were used or if the underlying circumstances were to change. Changes in underlying assumptions, circumstances, or estimates may have a material adverse effect upon future period financial reporting and performance. See “Critical Accounting Estimates and Policies” in Part II, Item 7 of this Form 10-K.
Our future financial results could be adversely impacted by asset impairment charges.
As of December 31, 2021, we had goodwill and other intangible assets, net of accumulated amortization, of approximately $2.0 billion, which represented approximately 49% of our total assets. Our goodwill is subject to an impairment test on an annual basis and is also tested whenever events and circumstances indicate that goodwill may be impaired. Intangible assets (other than goodwill) are generally amortized over the useful life of such assets. In addition, from time to time, we may acquire or make an investment in a business that will require us to record goodwill based on the purchase price and the value of the acquired assets. We may subsequently experience unforeseen issues with such business that adversely affect the anticipated returns of the business or value of the intangible assets and trigger an evaluation of the recoverability of the recorded goodwill and intangible assets for such business. For example, if the financial performance of such business was to decline significantly, we could incur a material non-cash charge to our income statement for the impairment of goodwill and other intangible assets. Future determinations of significant write-offs of goodwill or intangible assets as a result of an impairment test or any accelerated amortization of other intangible assets could have a material adverse impact on our financial condition and results of operations.
Our current debt, and debt we may incur in the future, could adversely affect our business and financial position.
As of December 31, 2021, we had $1.0 billion of debt outstanding. Our level of debt could have significant consequences for our business including: requiring us to use our cash flow to pay the principal and interest on our debt; reducing funds available for acquisitions and other investments in our business; making us vulnerable to economic downturns and increases in interest rates; limiting us from obtaining additional debt; and impacting our ability to pay dividends.
We self-insure health benefits and may be adversely impacted by unfavorable claims experience.
We are primarily self-insured for our health benefits. If the number or severity of claims increases, or we are required to accrue or pay additional amounts because the claims prove to be more severe than our original assessment, our operating results would be adversely affected. Our future claims expense might exceed historical levels, which could reduce our earnings. We expect to periodically assess our self-insurance strategy. We are required to periodically evaluate and adjust our claims reserves to reflect our experience. However, ultimate results may differ from our estimates, which could result in losses over our reserved amounts. In addition, because we do not carry “stop loss” insurance, a significant increase in the number of claims that we must cover under our self-insurance retainage could adversely affect our profitability.
Increasing costs of certain employee and retiree benefits could adversely affect our financial position, results of operations, or cash flows.
Our earnings may be positively or negatively impacted by the amount of income or expense we record for our pension and other postretirement benefit plans. U.S. GAAP requires that we calculate income or expense for the plans using actuarial valuations. These valuations reflect assumptions relating to financial markets and other economic conditions. Changes in key economic indicators can change the assumptions. The most significant year-end assumptions used to estimate pension or other postretirement benefit expense for the following year are the discount rate, the expected long-term rate of return on plan assets, expected future medical cost inflation, and expected compensation increases. In addition, we are required to make an annual measurement of plan assets and liabilities, which may result in a significant change to equity through a reduction or increase to other comprehensive income. For a discussion regarding how our financial statements can be affected by pension and other postretirement benefit plans accounting policies, see “Management’s Discussion and Analysis—Critical Accounting Estimates and Policies—Pension and Other Postretirement Benefits” in Part II, Item 7 of this Form 10-K. Although U.S. GAAP expense and pension or other postretirement contributions are not directly related, the key economic factors that affect U.S. GAAP expense would also likely affect the amount of cash we would contribute to the pension or other postretirement plans. Potential pension contributions include both mandatory amounts required under federal law, Employee Retirement Income Security Act, and discretionary contributions to improve the plans’ funded status. An obligation to make contributions to pension plans could reduce the cash available for working capital and other corporate uses.
GENERAL RISKS
Our future growth and continued success are dependent upon our key personnel.
Our success is dependent upon the efforts of our senior management personnel and our ability to attract and retain other highly qualified management and technical personnel. We face competition for management and qualified technical personnel from other companies and organizations. Additionally, it is particularly difficult to hire new employees during the COVID-19 pandemic as conducting interviews remotely makes it more difficult to ensure that we are recruiting and hiring high-quality employees. Further, the uncertainty created by the COVID-19 pandemic makes it less likely that potential candidates will be willing to leave a stable job to explore a new opportunity. Therefore, we may not be able to retain our existing management and technical personnel or fill new management or technical positions or vacancies created by expansion or turnover at our existing compensation levels. Although we have entered into change of control agreements with some members of senior management, we do not have employment contracts with our key executives. As some of our key executives approach retirement age, we have made a concerted effort to reduce the effect of the loss of our senior management personnel through management succession planning. However, we may be required to devote significant time and resources to identify and integrate key new personnel should key management losses occur earlier than anticipated. The loss of members of our senior management and qualified technical personnel could have a material adverse effect on our business.
On September 9, 2021, President Biden directed the Department of Labor’s Occupational Safety and Health Administration (“OSHA”) to issue an Emergency Temporary Standard (“ETS”) requiring that all employers with at least 100 employees ensure that their employees are fully vaccinated for COVID-19 or obtain a negative COVID-19 test at least once a week. President Biden also issued an Executive Order requiring certain COVID-19 precautions for government contractors and their subcontractors, including mandatory employee vaccination, with exemptions only for medical or religious reasons. On November 4, 2021, the OSHA issued an emergency regulation to carry out this mandate, which was expected to take effect on January 4, 2022. However, the U.S. Supreme Court issued a nationwide stay prohibiting OSHA from enforcing or implementing the ETS. But many states and localities are free to impose vaccine requirements. Despite the previous legal and timing uncertainties relating to these regulations, we implemented requirements regarding mandatory vaccines for U.S. based covered employees, subject to approved exemptions. It is possible that additional vaccine and testing mandates may be announced in other jurisdictions in which we operate our business. While it is not currently possible to predict with any certainty the exact impact any new state, local or foreign vaccine regulations would have on our operations, our suppliers and our customers, the implementation of such state, local or foreign government mandated vaccination or testing mandates may impact our ability to retain current employees, attract new employees, and result in labor disruptions and may have an adverse effect on future profitability. Further, implementation could also have similar consequences for our subcontractors, which may impact their ability to deliver the goods and services we need from them. In addition, any requirement to impose obligations on our suppliers under the Executive Order covering government contractors and their subcontractors could impact the price and continuity of supply of raw materials, whereby our results of operations and financial condition could be adversely affected.
Our business, financial condition, and results of operations could be materially adversely affected if the United States were to withdraw from or materially modify certain international trade agreements, or if tariffs or other restrictions on the foreign-sourced goods that we sell were to increase.
A significant portion of our business activities are conducted in foreign countries, including Mexico and Canada. Our business benefits from free trade agreements such as the United States-Mexico-Canada Trade Agreement (USMCA) and relies on various U.S. corporate tax provisions related to international commerce as we build, market, and sell our products globally. Although there are no immediate effects on our operations with respect to USMCA, we cannot predict future developments in the political climate involving the United States, Mexico and Canada, and thus, these may have an adverse and material impact on our operations and financial growth.
The United States and other countries have levied tariffs and taxes on certain goods (such as those implemented by the United States and China in recent years). Some of our products are included in these tariffs. All of this could lead to increased costs and diminished sales opportunities in the U.S. and abroad. Media and political reactions in the affected countries could potentially exacerbate the impact on our operations in those countries. The imposition of new or increased tariffs, duties, border adjustment taxes or other trade restrictions by the United States could also result in the adoption of new or increased tariffs or other trade restrictions by other countries. The tariffs may in the future increase our cost of materials and may cause us to increase prices to our customers which we believe may reduce demand for our products. Our price increases may not be sufficient to fully offset the impact of the tariffs and result in lowering our margin on products sold. If the U.S. government increases or implements additional tariffs, or if additional tariffs or trade restrictions are implemented by other countries, the resulting trade barriers could have a significant adverse impact on our suppliers, our customers and on our business. We are not able to predict future trade policy of the U.S. or of any foreign countries in which we operate or purchase goods, or the terms of any renegotiated trade agreements, or their impact on our business.
Global economic conditions may adversely affect our business, operating results and financial condition.
Although we currently generate significant operating cash flows, which combined with access to the credit markets provides us with significant discretionary funding capacity, global macroeconomic uncertainty, including the economic downturn caused by the COVID-19 pandemic, the ongoing trade disputes between the United States and China, the United Kingdom’s withdrawal from the European Union, and uncertainty regarding the stability of global credit and financial markets could affect our ability to fund our operations. In addition, certain of our customers and suppliers could be affected directly by an economic downturn and could face credit issues or cash flow problems that could give rise to payment delays, increased credit risk, bankruptcies, and other financial hardships, which could impact customer demand for our products as well as our ability to manage normal commercial relationships with our customers and suppliers. Depending on their severity and duration, the effects and consequences of a global economic downturn could have an adverse impact on our results of operations and financial condition.
A percentage of our workforce is employed under collective bargaining agreements.
Approximately 7% of our workforce is employed under collective bargaining agreements, which from time to time are subject to renewal and negotiation. We cannot ensure that we will be successful in negotiating new collective bargaining agreements, that such negotiations will not result in significant increases in the cost of labor, or that a breakdown in such negotiations will not result in the disruption of our operations. Although we have generally enjoyed good relations with both our unionized and non-unionized employees, we may experience an adverse impact on our operating results if we are subject to labor actions.
Future terror attacks, war, natural disasters, climate change-related events, pandemic diseases (including the COVID-19 pandemic), or other events beyond our control could adversely impact our businesses.
Despite our concerted effort to minimize risk to our production capabilities and corporate information systems and to reduce the effect of unforeseen interruptions through insurance or other risk transfer mechanisms, such as our business continuity planning and disaster recovery plans, we could be adversely impacted by terror attacks, war, natural disasters such as hurricanes, floods, tornadoes, climate change-related events, pandemic diseases such as COVID-19, or other events such as strikes by the workforce of a significant customer or supplier. These risks could negatively impact demand for or supply of our products and could also cause disruption to our facilities or systems, which could also interrupt operational processes and adversely impact our ability to manufacture our products and provide services and support to our customers. We operate facilities in areas of the world that are exposed to natural disasters. Financial difficulties of our customers, delays by our customers in production of their products, high fuel prices, the concern of another major terrorist attack, and the overall decreased demand for our products could adversely affect our operating results and financial condition.
Item 1B. Unresolved Staff Comments.
None.
Item 2. Properties.
Our corporate headquarters is located at a leased facility in Davidson, North Carolina. As of December 31, 2021, we had 154 facilities worldwide, including four corporate and shared-services facilities. Approximately 80% of our facilities operate as manufacturing and engineering, metal treatment, or aerospace overhaul plants, while the remaining 20% operate as selling and administrative office facilities. The number and type of facilities utilized by each of our reportable segments are summarized below:
| | | | | | | | | | | | | | | | | | | | | | | | | | |
| Owned Facilities Location | | Aerospace & Industrial | | Defense Electronics | | Naval & Power | | Total |
| North America | | 8 | | 1 | | 9 | | 18 |
| Europe | | 9 | | — | | 1 | | 10 |
| Total | | 17 | | 1 | | 10 | | 28 |
| | | | | | | | | | | | | | | | | | | | | | | | | | |
| Leased Facilities Location | | Aerospace & Industrial | | Defense Electronics | | Naval & Power | | Total |
| North America | | 42 | | 17 | | 24 | | 83 |
| Europe | | 18 | | 5 | | 3 | | 26 |
| Asia | | 10 | | 1 | | 2 | | 13 |
| Total | | 70 | | 23 | | 29 | | 122 |
The buildings on the properties referred to in this Item are well maintained, in good condition, and are suitable and adequate for current needs. Management believes that the productive capacity of our properties is adequate to meet our anticipated volume for the foreseeable future.
Item 3. Legal Proceedings.
From time to time, we are involved in legal proceedings that are incidental to the operation of our business. Some of these proceedings allege damages relating to asbestos and environmental exposures, intellectual property matters, copyright infringement, personal injury claims, employment and employee benefit matters, government contract issues, commercial or contractual disputes, and acquisitions or divestitures. We continue to defend vigorously against all claims. Although the ultimate outcome of any legal matter cannot be predicted with certainty, based on present information, including assessment of the merits of the particular claim, as well as current accruals and insurance coverage, we do not believe that the disposition of any of these matters, individually or in the aggregate, will have a material adverse effect on our consolidated financial condition, results of operations, and cash flows.
We have been named in pending lawsuits that allege injury from exposure to asbestos. To date, we have not been found liable or paid any material sum of money in settlement in any asbestos-related case. We believe that the minimal use of asbestos in our past operations and the relatively non-friable condition of asbestos in our products make it unlikely that we will face material liability in any asbestos litigation, whether individually or in the aggregate. We maintain insurance coverage for these potential liabilities and we believe adequate coverage exists to cover any unanticipated asbestos liability.
Item 4. Mine Safety Disclosures.
Not applicable.
PART II
Item 5. Market for the Registrant’s Common Equity, Related Stockholder Matters and Issuer Purchases of Equity Securities.
MARKET INFORMATION
Our common stock is listed and traded on the New York Stock Exchange (NYSE) under the symbol CW. As of January 1, 2022, we had approximately 2,800 registered shareholders of our common stock, $1.00 par value.
DIVIDENDS
During 2021 and 2020, the Company paid quarterly dividends as follows: | | | | | | | | | | | | | | |
| | 2021 | | 2020 |
| Common Stock | | | | |
| First Quarter | | $ | 0.17 | | | $ | 0.17 | |
| Second Quarter | | 0.18 | | | 0.17 | |
| Third Quarter | | 0.18 | | | 0.17 | |
| Fourth Quarter | | 0.18 | | | 0.17 | |
SECURITIES AUTHORIZED FOR ISSUANCE UNDER EQUITY COMPENSATION PLANS
The following table sets forth information regarding our equity compensation plans as of December 31, 2021, the end of our most recently completed fiscal year: | | | | | | | | | | | | | | | | | | | | | | | | | | |
| Plan category | | Number of securities to
be issued under equity compensation plans | | | Weighted-average
fair value of outstanding equity-based awards | | Number of securities remaining
available for future issuance under
equity compensation plans
(excluding securities reflected in
the first column) | |
| Equity compensation plans approved by security holders | | 421,066 | (a) | | $111.54 | | 1,942,123 | (b) |
| Equity compensation plans not approved by security holders | | None | | | Not applicable | | Not applicable | |
(a)Consists of 380,479 shares issuable upon vesting of performance share units, restricted shares, restricted stock units, and shares to non-employee directors under the 2005 and 2014 Omnibus Incentive Plan, and 40,587 shares issuable under the Employee Stock Purchase Plan.
(b)Consists of 1,270,665 shares available for share-based awards under the 2014 Omnibus Incentive Plan, and 671,458 shares remaining available for issuance under the Employee Stock Purchase Plan.
Issuer Purchases of Equity Securities
The following table provides information about our repurchases of equity securities that are registered by us pursuant to Section 12 of the Securities Exchange Act of 1934, as amended, during the quarter ended December 31, 2021. | | | | | | | | | | | | | | | | | | | | | | | | | | |
| | Total Number of
shares purchased | | Average Price
Paid per Share | | Total Number of
Shares Purchased
as Part of a
Publicly
Announced
Program | | Maximum
Dollar amount of shares that may
yet be
Purchased
Under the
Program |
| October 1 – October 31 | | 1,233,989 | | $131.17 | | 1,882,840 | | $359,177,280 |
| November 1 – November 30 | | 185,346 | | 132.54 | | 2,068,186 | | 334,611,359 |
| December 1 – December 31 | | 584,582 | | 132.75 | | 2,652,768 | | 257,008,939 |
| For the quarter ended December 31 | | 2,003,917 | | $131.76 | | 2,652,768 | | $257,008,939 |
In December 2021, the Corporation adopted two written trading plans in connection with its previously authorized share repurchase program, which allows for the purchase of its outstanding common stock up to $550 million, of which approximately $250 million remains available for repurchase. The first trading plan includes share repurchases of $50 million, to be executed equally throughout the 2022 calendar year. The second trading plan includes opportunistic share repurchases up to $100 million to be executed through a 10b5-1 program.
The following performance graph does not constitute soliciting material and should not be deemed filed or incorporated by reference into any of our other filings under the Securities Act or the Securities Exchange Act of 1934, except to the extent we specifically incorporate this information by reference therein.
PERFORMANCE GRAPH
The following graph compares the annual change in the cumulative total return on our common stock during the last five fiscal years with the annual change in the cumulative total return of the Russell 2000 Index and the S&P MidCap 400 Index. The graph assumes an investment of $100 on December 31, 2016 and the reinvestment of all dividends paid during the following five fiscal years.
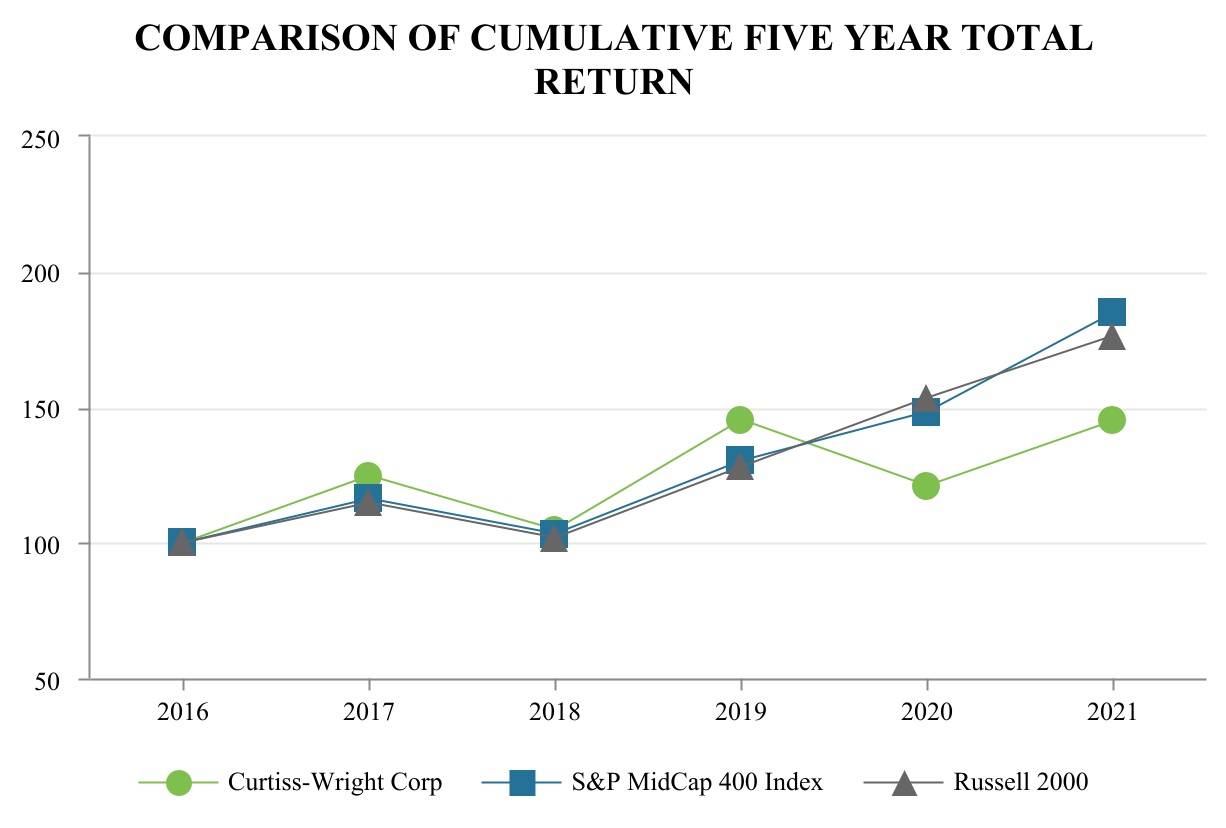
| | | | | | | | | | | | | | | | | | | | | | | | | | | | | | | | | | | | | | |
| Company / Index | | 2016 | | 2017 | | 2018 | | 2019 | | 2020 | | 2021 |
| Curtiss-Wright Corp | | 100 | | | 124.56 | | | 104.90 | | | 145.50 | | | 121.01 | | | 145.05 | |
| S&P MidCap 400 Index | | 100 | | | 116.24 | | | 103.36 | | | 130.44 | | | 148.26 | | | 184.97 | |
| Russell 2000 | | 100 | | | 114.65 | | | 102.02 | | | 128.06 | | | 153.62 | | | 176.39 | |
Item 6. Selected Financial Data.
[Reserved]
Item 7. Management’s Discussion and Analysis of Financial Condition and Results of Operations.
Our Management’s Discussion and Analysis of Financial Condition and Results of Operations (MD&A) begins with an overview of our company, followed by economic and industry-wide factors impacting our company and the markets we serve, a discussion of the overall results of operations, and finally a more detailed discussion of those results within each of our reportable segments.
COMPANY ORGANIZATION
Curtiss-Wright Corporation and its subsidiaries is a global integrated business that provides highly engineered products, solutions, and services mainly to aerospace & defense markets, as well as critical technologies in demanding commercial power, process, and industrial markets. We report our operations through our Aerospace & Industrial, Defense Electronics, and Naval & Power segments. We are positioned as a market leader, or hold a significant market share position, across a diversified array of niche markets through engineering and technological leadership, precision manufacturing, and strong relationships with our customers.
Impacts of inflation, pricing, and volume
Historically, we have not been significantly impacted by inflation. Increases in raw material costs or payroll costs have generally been offset through lean manufacturing activities or price increases. A portion of our contracts contain terms and conditions that enable us to pass inflationary price increases to our customers. In those cases whereby inflationary increases are not contractually stipulated, we actively negotiate price increases. We have consistently made annual investments in capital that
deliver efficiencies and cost savings. While the historical benefits of these efforts have generally offset the margin impact of competitive pricing conditions in the markets that we serve, there are no assurances that higher prices can effectively be passed through to our customers or that we will be able to fully offset the effects of higher raw materials costs through price increases on a timely basis.
Analytical Definitions
Throughout MD&A, the terms “incremental” and “organic” are used to explain changes from period to period. The term “incremental” is used to highlight the impact that acquisitions and divestitures had on the current year results. The results of operations for acquisitions are incremental for the first twelve months from the date of acquisition. Additionally, the results of operations of divested businesses are removed from the comparable prior year period for purposes of calculating “organic” and “incremental” results. The definition of “organic” also excludes the effects of total restructuring charges, impairment of assets held for sale, and foreign currency translation.
Market Analysis and Economic Factors
Economic Factors Impacting Our Markets
Curtiss-Wright Corporation is a global integrated business that provides highly engineered products, solutions, and services mainly to aerospace & defense markets, as well as critical technologies in demanding commercial power, process, and industrial markets. Many of Curtiss-Wright’s commercial businesses are driven in large part by global economic growth, primarily led by operations in the U.S., Canada, Europe, and China. In March 2020, the World Health Organization characterized the global outbreak of COVID-19 as a pandemic, which resulted in significant disruption to travel, transportation of goods and services, and financial markets globally, and caused adverse and residual impacts to both industry supply chains and production levels. Though the onset of COVID-19 variants continues to cause supply-chain disruptions to global economies, including our business, as well as our customers and suppliers, U.S. economic activity rebounded quite dramatically in 2021, due in part to the availability of vaccines and increased government support to rebuild the country’s infrastructure.
In the last decade, the U.S. economy, as measured by real gross domestic product (GDP), has slowly improved, aided by decreased levels of unemployment, improvements in the housing market, and a low interest rate environment. 2020 U.S. GDP declined 3.4% from the prior year period, principally due to the impact of the COVID-19 pandemic. However, U.S. GDP rebounded sharply in 2021, up 5.7% and at the fastest pace since 1984, according to the most recent estimate, led by an acceleration in industrial activity. In 2022, economists expect growth in the broader U.S. economy to moderate due to concerns about continued supply chain disruptions and rising inflation, with current estimates for U.S. GDP ranging from 3.5% to 4.0% growth.
Similarly, the global environment, which is typically influenced by international trade, economic conditions, and geopolitical uncertainty, had also been greatly impacted by the pandemic in 2020 before dramatically rebounding in 2021. According to the International Monetary Fund’s World Economic Outlook - 2021, global GDP in world economies grew 5.9% in 2021. Looking ahead to the next few years, we remain cautiously optimistic that our economically-sensitive commercial and industrial markets will improve based upon a return to normalized global growth conditions.
Defense
We have a well-diversified portfolio of products and services that supply all branches of the U.S. military, with content on critical high-performance programs and platforms, as well as a growing international defense business. A significant portion of our defense business operations is attributed to the United States market, and characterized by long-term programs and contracts driven primarily by the U.S. Department of Defense (DoD) budgets and funding levels. As such, the U.S. Defense budget serves as a leading indicator of our growth in the defense market.
We derive revenue from the naval defense, aerospace defense, and ground defense markets, which collectively represent more than 50% of our total net sales. In the naval defense market, we expect continued funding for U.S. shipbuilding programs, particularly as it relates to production on the Ford class aircraft carrier, as well as Columbia class and Virginia class submarines, which have received strong bipartisan support from Congress. We have a long legacy of providing products that support nuclear propulsion systems on naval vessels. In addition, through our service centers, we are a critical provider of ship repair and maintenance for the U.S. Navy’s Atlantic and Pacific fleets. In the aerospace defense market, we expect to benefit from increased funding levels on Command, Control, Communications, Computers, Intelligence, Surveillance, and Reconnaissance (C4ISR), electronic warfare, cyber, encryption, unmanned systems, and communications programs. As a supplier of COTS and
COTS+ solutions, we continue to demonstrate that electronics technology will enhance our ability to design and develop future generations of advanced systems and products for high performance applications, while also meeting the military’s Size, Weight, and Power considerations. We are also a designer and manufacturer of high-technology data acquisition and comprehensive flight test instrumentation systems. In the ground defense market, we are a supplier of advanced tactical communications solutions for battlefield network management, including COTS-based rugged, small form factor communications systems, and integrated network communications management software. The modernization of the existing U.S. ground vehicle fleet is expected to recover slowly, while international demand should remain strong, particularly for our electronics stabilization systems.
In May 2021, the President’s FY22 budget request was released, calling for $715 billion in defense spending, which represented a 1.6% increase over the FY21 enacted level of $704 billion. In December 2021, Congress passed the National Defense Authorization Act (NDAA) for FY22, which authorizes a $25 billion increase to the President’s defense budget proposal ($740 billion vs. $715 billion) and represents a ~5% increase over FY21 enacted levels. As of the date of filing, the DoD is currently operating under a Continuing Resolution until the FY22 budget is approved by Congress. Looking ahead, in conjunction with the President’s FY23 budget request, the DoD is expected to submit the Future Years Defense Program (FYDP), which outlines expectations about its key programs over the next five years. Based on industry research, the FYDP is expected to reflect modest increases in total defense budget funding. Through continued innovation as well as incremental research and development investments, Curtiss-Wright remains aligned with high growth DoD priorities and emerging technological trends, including security, cyber, hypersonics, net-centric connected battlefield, soldier survivability, and Modular Open Systems Approach (MOSA) capabilities.
Commercial Aerospace
Curtiss-Wright derives revenue from the global commercial aerospace market, principally to the commercial jet market, and to a lesser extent the regional jet and commercial helicopter markets. Our primary focus in this market is OEM products and services for commercial jets, which is highly dependent on new aircraft production from our primary customers, Boeing and Airbus. We provide a combination of flight control and utility actuation systems, sensors, and other sophisticated electronics, as well as shot and laser peening services utilized on highly stressed components of turbine engine fan blades, and aircraft structures. In 2020, we exited the build-to-print actuation product line supporting the Boeing 737 MAX program to ensure our long-term positioning and profitability as it applies to the Company’s commercial aerospace exposure.
Passenger travel and freight logistics, along with the demand for and delivery of new aircraft, are the key drivers in the commercial aerospace market. Over the prior decade, there was an extended production up-cycle for the commercial aerospace market, which was driven by increases in production by Boeing and Airbus on both legacy and new aircraft, particularly narrow-body aircraft. Additionally, sustained low oil prices contributed to declining fuel prices, which in turn led to cheaper airfares for consumers and increased passenger growth.
In 2020, the onset of the COVID-19 pandemic abruptly halted the industry’s growth as fewer and fewer passengers traveled, and business operations were disrupted globally, stunting the production of new aircraft as well as the maintenance of existing aircraft well into 2021. Changes in the propensity for the general public to travel by air as a result of the COVID-19 pandemic will likely be driven by the onset of COVID variants and the availability and implementation of vaccines. According to industry reports, air travel demand based on passenger growth is expected to continue to modestly recover in 2022, with domestic travel recovering faster than international travel, and fully recover by 2025.
While we closely monitor these industry metrics, our success and future growth in the commercial aerospace market is primarily tied to the growth in aircraft production rates, the timing of our order placement, and continued partnering with aerospace original equipment manufacturers on both the current fleet and the next-generation of single aisle programs and engines, as well as more fuel efficient and all-electric aircraft.
Power & Process
In the power market, Curtiss-Wright is a global supplier of nuclear reactor technologies. We derive sales from the commercial nuclear power generation market, whereby we supply a variety of highly engineered products and services, including reactor coolant pumps, control rod drive mechanisms, valves, motors, spent fuel management, containment doors, bolting solutions, enterprise resource planning, plant process controls, and coating services. We provide equipment and services to both the aftermarket and new build markets, and have content on every reactor operating in the U.S. today.
According to the Nuclear Regulatory Commission (NRC), nuclear power comprises approximately 20% of all electric power produced in the United States, with 93 reactors operating across 55 nuclear power plants in 28 states. Our growth opportunities for aftermarket products and services are driven by plant aging, plant closures, requirements for planned outages, plant life extensions (from the end of their original 40-year operating lives to 60-year and now 80-year lives), the levying of regulatory requirements, suppliers abandoning the commercial nuclear market, and plants seeking technology and innovation advances, such as digitalization, that further enable plant modernization.
One of the industry’s most significant challenges is electricity market competitiveness, primarily driven by sustained low natural gas prices. In addition, in 2016, the industry was tasked with reassessing operating practices, improving efficiency, and reducing costs to help keep nuclear power competitive in a changing electricity market, which was collectively referred to as "Delivering the Nuclear Promise." U.S. reactor operators were also faced with increased security measures and post-Fukushima regulatory requirements over most of the past decade. All of those factors contributed to plant operators diverting and deferring their typical plant capital expenditure budgets significantly away from planned maintenance. However, since late 2017, as those necessary requirements abated and plant operators resumed a more normalized maintenance schedule, the industry began to turn the corner. As a result, we have experienced and continue to expect increased opportunities for our vast portfolio of advanced nuclear technologies to aid safety, extend the reliability and ensure the ongoing viability of nuclear plants.
Longer term, global commercial nuclear power demand will be driven by the ongoing need for increased capacity especially in developing countries with growing populations but limited power supply, as well as the clean energy transition. In addition, the continued supply constraints and environmental concerns attributed to the current dependence on fossil fuels have led to a greater appreciation of the value of nuclear technology as the most efficient and environmentally friendly source of energy available today. As a result, we expect growth opportunities in this market both domestically and internationally, although the timing of new orders remains uncertain.
We play an important role in the new build market for the Generation III+ Westinghouse AP1000 reactor design, for which we are a supplier of RCPs, and also expect to supply a variety of ancillary plant products and services. Domestically, two new build reactors remain under construction in Georgia utilizing the AP1000 design. On a global basis, nuclear plant construction remains active. Currently, there are 57 new reactors under construction across 19 countries, with 97 planned and 325 proposed over the next several decades according to the World Nuclear Organization. We continue to expect to play a role in new build nuclear plant construction, with our largest opportunities in China, India and throughout eastern Europe, including Ukraine, Poland, Romania, Bulgaria and the Czech Republic. We are also well positioned to take advantage of market opportunities to support the ongoing design and development, and future construction, of next-generation advanced and small modular reactors, driven by support from the U.S. Department of Energy as well as internationally.
In the process market, we service the oil and gas, chemical, and petrochemical industries through numerous industrial valve products, in which the majority of our industrial valve sales are to the downstream markets. We maintain a global maintenance, repair, and overhaul (MRO) business for our pressure-relief valve technologies as refineries opportunistically service or upgrade equipment that has been operating at or near full capacity. We also produce severe service, operation-critical valves for the power and process industries. We also have the opportunity to support the oil exploration industry’s need and desire for more reliable subsea pumping systems. Sales in these industries are driven by global supply and demand, crude oil prices, industry regulations, and the natural gas market. Over the long run, we believe improved economic conditions and continued global expansion will be key drivers for future growth of our severe service and operation-critical valves serving the process industry.
General Industrial
Revenue derived from our widely diversified offering to the general industrial market primarily consists of electronic sensors and control systems, electro-mechanical actuation, and surface treatment services. We supply our products and services to OEMs and aftermarket industrial customers, including the transportation, commercial trucking, off-road equipment, agriculture, construction, and automotive industries. Our performance in these markets is typically aligned with the performance of the U.S. and global economies, with changes in global GDP rates and industrial production driving our sales, particularly for our surface treatment services.
One of the key drivers within our general industrial market is our focus on electronification and electrification, where our electronic sensors and controls systems products serve the on-and-off highway, medical mobility, and specialty vehicles markets. Notable products include electronic throttle controls, shift controls, joysticks, power management systems, and traction inverter systems, driving our ability to provide a full suite of in-cab operator control systems to our customers. Increased industry demand for electronic control systems and sensors has been driven by the need for improved operational
efficiency, safety, repeatability, reduced emissions, enhanced functionality, and greater fuel efficiencies to customers worldwide. Key to our future growth is expanding the human-machine interface (HMI) technology portfolio and providing a complete system solution to our customers. Existing and emerging trends in commercial vehicle safety, emissions control, and improved driver efficiency are propelling commercial vehicle OEMs toward higher performance subsystems. These trends are accelerating the evolution from discrete HMI components towards a more integrated vehicle interface architecture. Growth opportunities also exist with a range of intelligent actuators for industrial automation and robotics which help our customers quickly leverage data and utilize analytics within the Internet of Things environment. Meanwhile, our surface treatment services, which include shot and laser peening, engineered coatings, and analytical testing services across an extensive global network, are used to increase the safety, reliability, and longevity of components operating in harsh environments. Sales are primarily driven by global demand from general industrial customers.
RESULTS OF OPERATIONS
The following MD&A is intended to help the reader understand the results of operations and financial condition of the Corporation for the year ended December 31, 2021, as compared to the year ended December 31, 2020. Discussion and analysis of our financial condition and results of operations for the year ended December 31, 2020, as compared to the year ended December 31, 2019, is contained in our 2020 Annual Report on Form 10-K, filed with the SEC on February 25, 2021.
| | | | | | | | | | | | | | | | | | | | |
| | Year Ended December 31, | | Percent
change |
| (In thousands, except percentages) | | 2021 | | 2020 | | 2021 vs. 2020 |
| | | | | | |
| Sales: | | | | | | |
| Aerospace & Industrial | | $ | 786,334 | | | $ | 805,673 | | | (2) | % |
| Defense Electronics | | 724,326 | | | 608,757 | | | 19 | % |
| Naval & Power | | 995,271 | | | 976,906 | | | 2 | % |
| Total sales | | $ | 2,505,931 | | | $ | 2,391,336 | | | 5 | % |
| | | | | | |
| Operating income: | | | | | | |
| Aerospace & Industrial | | $ | 121,817 | | | $ | 99,714 | | | 22 | % |
| Defense Electronics | | 159,089 | | | 118,748 | | | 34 | % |
| Naval & Power | | 141,660 | | | 108,151 | | | 31 | % |
| Corporate and eliminations | | (39,883) | | | (37,765) | | | (6) | % |
| Total operating income | | $ | 382,683 | | | $ | 288,848 | | | 32 | % |
| | | | | | |
| Interest expense | | 40,240 | | | 35,545 | | | (13) | % |
| Other income, net | | 12,067 | | | 9,748 | | | 24 | % |
| | | | | | |
| Earnings before income taxes | | 354,510 | | | 263,051 | | | 35 | % |
| Provision for income taxes | | (87,351) | | | (61,659) | | | (42) | % |
| Net earnings | | $ | 267,159 | | | $ | 201,392 | | | 33 | % |
| | | | | | |
| Impairment of assets held for sale | | $ | 19,088 | | | $ | 33,043 | | | NM |
| Total restructuring charges | | $ | — | | | $ | 42,725 | | | NM |
| | | | | | |
| New orders | | $ | 2,579,881 | | | $ | 2,321,481 | | | 11 | % |
| Backlog | | $ | 2,228,924 | | | $ | 2,163,750 | | | 3 | % |
NM - Not meaningful
Components of sales and operating income growth (decrease): | | | | | | | | | | | | | | |
| | 2021 vs. 2020 |
| | Sales | | Operating
Income |
| Organic | | (1) | % | | 11 | % |
| Acquisitions | | 5 | % | | 5 | % |
| Impairment of assets held for sale | | — | % | | 5 | % |
| Restructuring | | — | % | | 14 | % |
| Foreign currency | | 1 | % | | (3) | % |
| Total | | 5 | % | | 32 | % |
Sales for the year increased $115 million, or 5%, to $2,506 million, compared with the prior year period. On a segment basis, sales from the Defense Electronics and Naval & Power segments increased $116 million and $18 million, respectively, with sales from the Aerospace & Industrial segment decreasing $19 million. Changes in sales by segment are discussed in further detail in the "Results by Business Segment" section below.
Operating income for the year increased $94 million, or 32%, to $383 million, and operating margin increased 320 basis points compared with 2020. In the Aerospace & Industrial segment, increases in operating income and operating margin were primarily due to current year savings recognized as a result of our prior year restructuring initiatives, as well as favorable overhead absorption on higher general industrial sales. Operating income in the Defense Electronics segment increased primarily due to the benefits from our ongoing operational excellence initiatives, the incremental impact of our PacStar acquisition, as well as the absence of first year purchase accounting costs from our 901D acquisition. These increases were partially offset by higher research and development costs and unfavorable foreign currency translation. Operating margin in the Defense Electronics segment was negatively impacted by first year purchase accounting costs from our PacStar acquisition. In the Naval & Power segment, increases in operating income and operating margin were primarily due to current year savings recognized as a result of our prior year restructuring initiatives, as well as lower current period impairment losses on assets held for sale in our German industrial valves business compared to the prior year period.
Non-segment operating expense for the year increased $2 million, or 6%, to $40 million, primarily due to higher environmental costs.
Interest expense for the year increased $5 million, or 13%, to $40 million, primarily due to the issuance of $300 million Senior Notes in August 2020.
Other income, net for the year increased $2 million, or 24%, to $12 million, primarily due to the prior year recognition of accumulated foreign currency translation losses of $10 million related to the substantial liquidation of our Norwegian subsidiary. This increase was partially offset by higher pension costs, including one-time pension settlement charges recognized in the current year period related to the retirement of former executives.
The effective tax rate of 24.6% for the year ended December 31, 2021, increased as compared to an effective tax rate of 23.4% in the prior year period. This increase was primarily due to higher current period non-deductible impairment losses related to our held for sale industrial valve business in Germany, as impairment losses recorded during the prior year period were partially offset against deferred tax liabilities.
New orders increased $258 million, or 11%, from the prior year period to $2,580 million, primarily due to an increase in new orders for industrial vehicles and sensors and actuation equipment in the Aerospace & Industrial segment, as well as the incremental impact of our PacStar acquisition in the Defense Electronics segment. In the Naval & Power segment, higher demand for industrial valve products was partially offset by the timing of naval defense orders. Changes in new orders by segment are discussed in further detail in the "Results by Business Segment" section below.
Comprehensive income (loss)
Pension and postretirement adjustments within comprehensive income during the year ended December 31, 2021 were a $131 million gain, compared to a $27 million loss for the prior year period. The gain in the current period was primarily attributed to higher asset returns and increases in the discount rate. The loss in the prior period was primarily due to decreases in the discount rate, partially offset by higher asset returns.
Foreign currency translation adjustments during the year ended December 31, 2021 resulted in a comprehensive loss of $11 million, compared to a comprehensive gain of $41 million in the comparable prior period. The comprehensive loss during the current period was primarily attributed to decreases in the British Pound and Canadian Dollar, with the prior period comprehensive gain primarily attributed to increases in the Euro and British Pound.
RESULTS BY BUSINESS SEGMENT
Aerospace & Industrial
Sales in the Aerospace & Industrial segment are primarily generated from the commercial aerospace and general industrial markets and, to a lesser extent, the defense and power & process markets.
The following tables summarize sales, operating income and margin, total restructuring charges, and new orders within the Aerospace & Industrial segment. | | | | | | | | | | | | | | | | | | | | |
| | Year Ended December 31, | | Percent Change |
| (In thousands, except percentages) | | 2021 | | 2020 | | 2021 vs. 2020 |
| | | | | | |
| Sales | | $ | 786,334 | | | $ | 805,673 | | | (2 | %) |
| Operating income | | 121,817 | | | 99,714 | | | 22 | % |
| Operating margin | | 15.5 | % | | 12.4 | % | | 310 | bps |
| Total restructuring charges | | $ | — | | | $ | 16,186 | | | NM |
| New orders | | $ | 853,077 | | | $ | 651,187 | | | 31 | % |
| Backlog | | $ | 338,581 | | | $ | 277,031 | | | 22 | % |
Components of sales and operating income growth (decrease): | | | | | | | | | | | | | | |
| | 2021 vs. 2020 |
| | Sales | | Operating
Income |
| Organic | | (4) | % | | 9 | % |
| Restructuring | | — | % | | 14 | % |
| Foreign currency | | 2 | % | | (1) | % |
| Total | | (2) | % | | 22 | % |
Sales decreased $19 million, or 2%, to $786 million, from the comparable prior year period, as lower sales in the commercial aerospace market were partially offset by sales increases in the general industrial market. In the commercial aerospace market, sales decreased $72 million primarily due to the exit of our build-to-print product line in the fourth quarter of 2020. These decreases were partially offset by sales increases of $50 million in the general industrial market, primarily due to higher demand for industrial vehicle products and surface treatment services.
Operating income increased $22 million, or 22%, to $122 million, and operating margin increased 310 basis points to 15.5%. The increases in operating income and operating margin were primarily due to current year savings recognized as a result of our prior year restructuring initiatives, as well as favorable overhead absorption on higher sales in the general industrial market.
New orders increased $202 million as compared to the prior year, primarily due to an increase in new orders for industrial vehicles as well as higher demand for sensors and actuation equipment.
Defense Electronics
Sales in the Defense Electronics segment are primarily to the defense markets and, to a lesser extent, the commercial aerospace market.
The following tables summarize sales, operating income and margin, total restructuring charges, and new orders, within the Defense Electronics segment. | | | | | | | | | | | | | | | | | | | | |
| | Year Ended December 31, | Percent Change |
| (In thousands, except percentages) | | 2021 | | 2020 | | 2021 vs. 2020 |
| | | | | | |
| Sales | | $ | 724,326 | | | $ | 608,757 | | | 19 | % |
| Operating income | | 159,089 | | | 118,748 | | | 34 | % |
| Operating margin | | 22.0 | % | | 19.5 | % | | 250 | bps |
| Total restructuring charges | | $ | — | | | $ | 3,190 | | | NM |
| New orders | | $ | 743,199 | | | $ | 704,989 | | | 5 | % |
| Backlog | | $ | 667,510 | | | $ | 652,957 | | | 2 | % |
| | | | | | |
Components of sales and operating income growth (decrease): | | | | | | | | | | | | | | |
| | 2021 vs. 2020 |
| | Sales | | Operating
Income |
| Organic | | — | % | | 24 | % |
| Acquisitions | | 19 | % | | 12 | % |
| Restructuring | | — | % | | 3 | % |
| Foreign currency | | — | % | | (5) | % |
| Total | | 19 | % | | 34 | % |
Sales increased $116 million, or 19%, to $724 million, from the comparable prior year period, primarily due to the incremental impact of our PacStar acquisition in the ground defense market, which contributed incremental sales of $115 million. Higher sales of avionics and test equipment in the commercial aerospace market were more than offset by the timing of sales on embedded computing equipment on various programs in the aerospace defense market.
Operating income increased $40 million, or 34%, to $159 million compared with the same period in 2020, while operating margin increased 250 basis points to 22.0%. The increase in operating income was primarily due to the benefits from our ongoing operational excellence initiatives as well as the incremental impact of our PacStar acquisition. Operating income also benefited from the absence of first year purchase accounting costs from our 901D acquisition as well as our prior year restructuring initiatives, partially offset by higher research and development costs and unfavorable foreign currency translation. The increase in operating margin was primarily due to our ongoing operational excellence initiatives as well as the absence of first year purchase accounting costs from our 901D acquisition, partially offset by first year purchase accounting costs from our PacStar acquisition.
New orders increased $38 million as compared to the prior year, primarily due to the incremental impact of our PacStar acquisition. This increase was partially offset by the timing of naval defense and aerospace defense orders.
Naval & Power
Sales in the Naval & Power segment are primarily to the naval defense and power & process markets.
The following tables summarize sales, operating income and margin, impairment of assets held for sale, total restructuring charges, and new orders, within the Naval & Power segment. | | | | | | | | | | | | | | | | | | | | |
| | Year Ended December 31, | Percent Change |
| (In thousands, except percentages) | | 2021 | | 2020 | | 2021 vs. 2020 |
| | | | | | |
| Sales | | $ | 995,271 | | | $ | 976,906 | | | 2 | % |
| Operating income | | 141,660 | | | 108,151 | | | 31 | % |
| Operating margin | | 14.2 | % | | 11.1 | % | | 310 | bps |
| Impairment of assets held for sale | | 19,088 | | | 33,043 | | | NM |
| Total restructuring charges | | $ | — | | | $ | 23,349 | | | NM |
| New orders | | $ | 983,605 | | | $ | 965,305 | | | 2 | % |
| Backlog | | $ | 1,222,833 | | | $ | 1,233,762 | | | (1 | %) |
Components of sales and operating income growth (decrease): | | | | | | | | | | | | | | |
| | 2021 vs. 2020 |
| | Sales | | Operating
Income |
| Organic | | 1 | % | | (3) | % |
| Impairment of assets held for sale | | — | % | | 13 | % |
| Restructuring | | — | % | | 22 | % |
| Foreign currency | | 1 | % | | (1) | % |
| Total | | 2 | % | | 31 | % |
Sales increased $18 million, or 2%, to $995 million, from the comparable prior year period. In the naval defense market, sales increased $20 million primarily due to increased production on the CVN-81 aircraft carrier program, as well as higher foreign military and service center sales. Sales in the power & process market were essentially flat, as higher demand for industrial valve products was more than offset by the timing of production on the China Direct AP1000 program.
Operating income increased $34 million, or 31%, to $142 million and operating margin increased 310 basis points to 14.2%. The increases in operating income and operating margin were primarily due to current year savings recognized as a result of our prior year restructuring initiatives, as well as lower current period impairment losses on assets held for sale in our German industrial valves business compared to the prior year period.
New orders increased $18 million as compared to the prior year, as higher demand for industrial valve products was partially offset by the timing of naval defense orders.
SUPPLEMENTARY INFORMATION
The table below depicts sales by end market and customer type, as it helps provide an enhanced understanding of our businesses and the markets in which we operate. The table has been included to supplement the discussion of our consolidated operating results.
Net Sales by End Market and Customer Type | | | | | | | | | | | | | | | | | | | | |
| | Year Ended December 31, | | Percent change |
| (In thousands, except percentages) | | 2021 | | 2020 | | 2021 vs. 2020 |
| | | | | | |
| Aerospace & Defense markets: | | | | | | |
| Aerospace Defense | | $ | 452,661 | | | $ | 463,690 | | | (2) | % |
| Ground Defense | | 220,290 | | | 107,448 | | | 105 | % |
| Naval Defense | | 710,688 | | | 692,152 | | | 3 | % |
| Commercial Aerospace | | $ | 267,722 | | | $ | 325,518 | | | (18) | % |
| Total Aerospace & Defense | | $ | 1,651,361 | | | $ | 1,588,808 | | | 4 | % |
| | | | | | |
| Commercial markets: | | | | | | |
| Power & Process | | 473,489 | | | 474,842 | | | — | % |
| General Industrial | | 381,081 | | | 327,686 | | | 16 | % |
| Total Commercial | | $ | 854,570 | | | $ | 802,528 | | | 6 | % |
| | | | | | |
| Total Curtiss-Wright | | $ | 2,505,931 | | | $ | 2,391,336 | | | 5 | % |
Aerospace & Defense Markets
Sales increased $63 million, or 4%, to $1,651 million, as compared to the prior year period, primarily due to higher sales in the ground defense and naval defense markets. The ground defense market benefited from the impact of our PacStar acquisition, which contributed incremental sales of $115 million. Sales in the naval defense market increased primarily due to higher sales of $27 million on the CVN-81 aircraft carrier program. These increases were partially offset by lower sales in the commercial aerospace market, primarily due to the exit of our build-to-print product line in the fourth quarter of 2020.
Commercial Markets
Commercial sales increased $52 million, or 6%, to $855 million, primarily due to increased demand for our industrial vehicle products in the general industrial market, which contributed higher sales of $50 million. Sales in the power & process market were essentially flat, as higher demand for our industrial valve products was more than offset by the timing of production on the China Direct AP1000 program.
Liquidity and Capital Resources
Sources and Uses of Cash
We derive the majority of our operating cash inflow from receipts on the sale of goods and services and cash outflow for the procurement of materials and labor; cash flow is therefore subject to market fluctuations and conditions. Most of our long-term contracts allow for several billing points (progress or milestone) that provide us with cash receipts as costs are incurred throughout the project rather than upon contract completion, thereby reducing working capital requirements.
Consolidated Statement of Cash Flows | | | | | | | | | | | |
| Year ended December 31, |
| (In thousands) | 2021 | | 2020 |
| Net cash provided by (used in): | | | |
| Operating activities | $ | 387,668 | | | $ | 261,180 | |
| Investing activities | (42,403) | | | (532,530) | |
| Financing activities | (369,129) | | | 82,081 | |
| Effect of exchange rates | (3,380) | | | (3,516) | |
| Net increase (decrease) in cash and cash equivalents | $ | (27,244) | | | $ | (192,785) | |
Operating Activities
Cash provided by operating activities increased $126 million to $388 million from the comparable prior year period, primarily due to a prior year voluntary pension contribution of $150 million as well as the timing of advanced cash receipts and lower disbursements in the current period. These increases were partially offset by higher outstanding receivables during the current period.
Investing Activities
Capital Expenditures
Our capital expenditures were $41 million and $47 million for 2021 and 2020, respectively. The decrease in capital expenditures was primarily due to lower capital spending during the current period as well as lower current period investment related to the new DRG facility. For 2022, we anticipate capital expenditures of approximately $50 million to $60 million.
Divestitures
No material divestitures took place during 2021 or 2020.
Acquisitions
In 2021, we did not complete any acquisitions. In 2020, we acquired three businesses for $488 million in cash paid.
Future acquisitions will depend, in part, on the availability of financial resources at a cost of capital that meet our stringent criteria. As such, future acquisitions, if any, may be funded through the use of our cash and cash equivalents, through additional financing available under the credit agreement, or through new financing alternatives.
Financing Activities
Debt Issuances and Repayments
There were no debt issuances in 2021.
In the fourth quarter of 2021, we repaid $100 million of the 2011 Notes that matured on December 1, 2021.
On August 13, 2020, the Corporation issued $300 million of Senior Notes (the “2020 Notes”), consisting of $150 million of 3.10% Senior Notes that mature on August 13, 2030 and $150 million of 3.20% Senior Notes that mature on August 13, 2032.
Revolving Credit Agreement
As of December 31, 2021, the Corporation had $94 million of borrowings outstanding under the Revolving Credit Agreement (the Credit Agreement or credit facility) and $21 million in letters of credit supported by the credit facility. The unused credit available under the Credit Agreement as of December 31, 2021 was $385 million, which could be borrowed in full without violating any of our debt covenants. As of December 31, 2020, the Corporation had no borrowings outstanding under the Credit Agreement.
Repurchase of Common Stock
During 2021, the Company repurchased approximately 2.7 million shares of its common stock for $343 million. In 2020, the Company repurchased approximately 2.0 million shares of its common stock for $200 million.
Dividends
The Company made dividend payments of approximately $29 million and $28 million during 2021 and 2020, respectively.
Capital Resources
Cash in U.S. and Foreign Jurisdictions
| | | | | | | | | | | |
| As of December 31, |
| (In thousands) | 2021 | | 2020 |
| United States of America | $ | 37,361 | | | $ | 55,391 | |
| United Kingdom | 69,732 | | | 49,258 | |
| European Union | 12,154 | | | 21,156 | |
| Canada | 24,019 | | | 34,795 | |
| China | 13,403 | | | 20,692 | |
| Other foreign countries | 14,335 | | | 16,956 | |
| Total cash and cash equivalents | $ | 171,004 | | | $ | 198,248 | |
Cash and cash equivalents as of December 31, 2021 and December 31, 2020 were $171 million and $198 million, respectively. The decrease in cash held by U.S. subsidiaries during 2021 as compared to 2020 was primarily due to higher current period share repurchase activity, the principal payment of $100 million on the 2011 Notes that matured in December 2021, and lower foreign cash repatriation, partially offset by higher net borrowings on our credit facility during the current period. The decrease in cash held by foreign subsidiaries during 2021 as compared to 2020 was primarily due to lower net cash receipts during the current period. There are no legal or economic restrictions on the ability of any of our subsidiaries to transfer funds, absent certain regulatory approvals in China, where approximately $13 million of our foreign cash resides.
Cash Utilization
Management continually evaluates cash utilization alternatives, including share repurchases, acquisitions, and increased dividends to determine the most beneficial use of available capital resources. We believe that our cash and cash equivalents, cash flow from operations, available borrowings under the credit facility, and ability to raise additional capital through the credit markets are sufficient to meet both the short-term and long-term capital needs of the organization, including the return of capital to shareholders through dividends and share repurchases and growing our business through acquisitions.
Debt Compliance
As of December 31, 2021, we were in compliance with all debt agreements and credit facility covenants, including our most restrictive covenant, which is our debt to capitalization ratio limit of 60%. As of December 31, 2021, we had the ability to incur total additional indebtedness of $1.6 billion without violating our debt to capitalization covenant.
Future Commitments
Cash generated from operations should be adequate to meet our planned capital expenditures of approximately $50 million to $60 million and expected dividend payments of approximately $29 million in 2022. There can be no assurance, however, that we will continue to generate cash from operations at the current level, or that these projections will remain constant throughout 2022. If cash generated from operations is not sufficient to support these operating requirements and investing activities, we may be required to reduce capital expenditures, borrow from our existing credit line, refinance a portion of our existing debt, or obtain additional financing. While all companies are subject to economic risk, we believe that our cash and cash equivalents, cash flow from operations, and available borrowings are sufficient to meet both the short-term and long-term capital needs of the organization.
The following table quantifies our significant future contractual obligations and commercial commitments as of December 31, 2021:
| | | | | | | | | | | | | | | | | | | | | | | | | | | | | | | | | | | | | | | | | | | | |
| (In thousands) | | Total | | 2022 | | 2023 | | 2024 | | 2025 | | 2026 | | Thereafter |
| Debt Principal Repayments | | $ | 1,043,900 | | | $ | — | | | $ | 296,400 | | | $ | — | | | $ | 90,000 | | | $ | 200,000 | | | $ | 457,500 | |
| Operating Leases | | 186,596 | | | 31,698 | | | 29,037 | | | 26,166 | | | 19,811 | | | 16,161 | | | 63,723 | |
| Interest Payments on Fixed Rate Debt | | 200,621 | | | 35,320 | | | 32,698 | | | 27,828 | | | 26,615 | | | 23,821 | | | 54,339 | |
| Total | | $ | 1,431,117 | | | $ | 67,018 | | | $ | 358,135 | | | $ | 53,994 | | | $ | 136,426 | | | $ | 239,982 | | | $ | 575,562 | |
We do not have material purchase obligations. Most of our raw material purchase commitments are made directly pursuant to specific contract requirements.
We enter into standby letters of credit agreements and guarantees with financial institutions and customers primarily relating to future performance on certain contracts to provide products and services and to secure advance payments we have received from certain international customers. As of December 31, 2021, we had contingent liabilities on outstanding letters of credit due as follows:
| | | | | | | | | | | | | | | | | | | | | | | | | | | | | | | | | | | | | | | | | | | | |
| (In thousands) | | Total | | 2022 | | 2023 | | 2024 | | 2025 | | 2026 | | Thereafter |
Letters of Credit (1) | | $ | 21,083 | | | $ | 11,553 | | | $ | 4,191 | | | $ | 3,421 | | | $ | 1,313 | | | $ | 55 | | | $ | 550 | |
(1) Amounts exclude bank guarantees of approximately $4.5 million.
Critical Accounting Estimates and Policies
Our consolidated financial statements and accompanying notes are prepared in accordance with accounting principles generally accepted in the United States of America. Preparing consolidated financial statements requires us to make estimates and assumptions that affect the reported amounts of assets, liabilities, revenues, and expenses. These estimates and assumptions are affected by the application of our accounting policies. Critical accounting policies are those that require application of management’s most difficult, subjective, or complex judgments, often as a result of the need to make estimates about the effects of matters that are inherently uncertain and may change in subsequent periods. We believe that the following are some of the more critical judgment areas in the application of our accounting policies that affect our financial condition and results of operations:
Revenue Recognition
We account for revenues in accordance with ASC 606, Revenue from Contracts with Customers. Under ASC 606, revenue is recognized when control of a promised good and/or service is transferred to a customer at a transaction price that reflects the consideration that we expect to be entitled to in exchange for that good and/or service. The unit of account is a performance obligation whereby a contract's transaction price is allocated to each distinct performance obligation and recognized as revenue when the respective performance obligation is satisfied. In certain instances, the transaction price may include estimated amounts of variable consideration including but not limited to incentives, awards, price escalations, liquidated damages, and penalties, only to the extent that it is probable that a significant reversal of cumulative revenue recognized to date around such variable consideration will not occur. We estimate variable consideration to be included in the transaction price using either the expected value method or most likely amount method, contingent upon the facts and circumstances of the specific arrangement. Variable consideration associated with our respective arrangements is not typically constrained.
Performance obligations are satisfied either at a point-in-time or on an over-time basis. Contracts that qualify for over-time revenue recognition are generally associated with the design, development, and manufacture of highly engineered industrial products used in commercial and defense applications and generally span between 2-5 years in duration. Revenue recognized on an over-time basis for the year ended December 31, 2021 accounted for approximately 50% of total net sales. Typically, over-time revenue recognition is based on the utilization of an input measure used to measure progress, such as costs incurred to date relative to total estimated costs. Application of an over-time revenue recognition method requires the use of reasonable and dependable estimates of future material, labor, and overhead costs that will be incurred as well as a disciplined cost estimating system in which all functions of the business are integrally involved. These estimates are determined based on industry knowledge and experience of our engineers, project managers, and financial staff. Changes in total estimated costs are recognized using the cumulative catch-up method of accounting which recognizes the cumulative effect of the changes on current and prior periods in the current period. During the years ended December 31, 2021, 2020, and 2019, there were no significant changes in estimated contract costs.
If a performance obligation does not qualify for over-time revenue recognition, revenue is then recognized at the point-in-time in which control of the distinct good or service is transferred to the customer, typically based upon the terms of delivery. Revenue recognized at a point-in-time for the year ended December 31, 2021 accounted for approximately 50% of total net sales.
Timing of revenue recognition and cash collection may result in billed receivables, unbilled receivables (contract assets), and deferred revenue (contract liabilities) on the Consolidated Balance Sheet. Contract assets primarily relate to our right to consideration for work completed but not billed as of the reporting date. Contract assets are transferred to billed receivables when the rights to consideration become unconditional. Contract liabilities primarily consist of customer advances received prior to revenue being earned. Contract assets and contract liabilities are reported in the "Receivables, net" and "Deferred revenue" lines, respectively, within the Consolidated Balance Sheet.
Inventory
Inventory costs include materials, direct labor, purchasing, and manufacturing overhead costs, which are stated at the lower of cost or net realizable value. We estimate the net realizable value of our inventories and establish reserves to reduce the carrying amount of these inventories to net realizable value, as necessary. We continually evaluate the adequacy of the inventory reserves by reviewing historical scrap rates, on-hand quantities as compared with historical and projected usage levels, and other anticipated contractual requirements. We generally hold reserved inventory for extended periods before scrapping and disposing of the reserved inventory, which contributes to a higher level of reserved inventory relative to the level of annual inventory write-offs.
We purchase materials for the manufacture of components for sale. The decision to purchase a set quantity of a particular item is influenced by several factors including: current and projected price, future estimated availability, existing and projected contracts to produce certain items, and the estimated needs for our businesses.
Pension and Other Postretirement Benefits
In consultation with our actuaries, we determine the appropriate assumptions for use in determining the liability for future pension and other postretirement benefits. The most significant of these assumptions include the discount rates used to determine plan obligations, the expected return on plan assets, and the number of employees who will receive benefits, their tenure, their salary levels, and their projected mortality. Changes in these assumptions, if significant in future years, may have an effect on our pension and postretirement expense, associated pension and postretirement assets and liabilities, and our annual cash requirements to fund these plans.
The discount rate used to determine the plan benefit obligations as of December 31, 2021, and the annual periodic costs for 2022, was increased from 2.53% to 2.87% for the Curtiss-Wright Pension Plan, and from 2.30% to 2.70% for the nonqualified benefit plan, to reflect current economic conditions. The rates reflect the hypothetical rates at which the projected benefit obligations could be effectively settled or paid out to participants on that date. We determine our discount rates for past service liabilities and service cost by utilizing a select bond yield curve developed by our actuaries, which is based on the rates of return on high-quality, fixed-income corporate bonds available at the measurement date with maturities that match the plan’s expected cash outflows for benefit payments. Interest cost is determined by applying the spot rate from the full yield curve to each anticipated benefit payment. The discount rate changes contributed to a decrease in the benefit obligation of $37 million in the CW plans.
The rate of compensation increase for base pay in the pension plans was unchanged at a weighted average of 3.5% based upon a graded scale of 4.9% to 2.9% that decrements as pay increases, which reflects the experience over past years and the Company’s expectation of future salary increases. We also retained our mortality assumptions from prior year utilizing the Pri-2012 tables published by the Society of Actuaries in October 2019, and the MP-2020 projected mortality scale published in October 2020.
The overall expected return on assets assumption is based primarily on the expectations of future performance. Expected future performance is determined by weighting the expected returns for each asset class by the plan’s asset allocation. The expected returns are based on long-term capital market assumptions provided by our investment consultants. Based on a review of market trends, actual returns on plan assets, and other factors, the Company’s expected long-term rate of return on plan assets was reduced to 5.8% as of December 31, 2021, which will be utilized for determining 2022 pension cost. An expected long-term rate of return of 6.5% was used for determining 2021 expense, with 7.5% used for 2020 pension expense and 8.0% used for 2019 pension expense.
The timing and amount of future pension income or expense to be recognized each year is dependent on the demographics and expected compensation of the plan participants, the expected interest rates in effect in future years, inflation, and the actual and expected investment returns of the assets in the pension trust.
The funded status of the Curtiss-Wright Pension Plan increased by $153 million in 2021, primarily driven by favorable asset experience due to strong market performance in 2021.
The following table reflects the impact of changes in selected assumptions used to determine the funded status of the Company’s U.S. qualified and nonqualified pension plans as of December 31, 2021 (in thousands, except for percentage point change):
| | | | | | | | | | | | | | | | | | | | |
| Assumption | | Percentage
Point Change | | Increase in
Benefit
Obligation | | Increase in
Expense |
| Discount rate | | (0.25) | % | | $26,059 | | | $2,599 | |
| Expected return on assets | | (0.25) | % | | — | | | $2,268 | |
See Note 17 to the Consolidated Financial Statements for further information on our pension and postretirement plans.
Goodwill
We have $1.5 billion in goodwill as of December 31, 2021. Generally, the largest separately identifiable asset from the businesses that we acquire is the value of their assembled workforces, which includes the additional benefit received from management, administrative, marketing, business development, engineering, and technical employees of the acquired businesses. The success of our acquisitions, including the ability to retain existing business and to successfully compete for and win new business, is based on the additional benefit received from management, administrative, marketing, and business development, scientific, engineering, and technical skills and knowledge of our employees rather than on productive capital (plant and equipment, technology, and intellectual property). Therefore, since intangible assets for assembled workforces are part of goodwill, the substantial majority of the intangible assets for our acquired business acquisitions are recognized as goodwill.
We test for goodwill impairment annually, at the reporting unit level, in the fourth quarter, which coincides with the preparation of our strategic operating plan. Additionally, goodwill is tested for impairment when an event occurs or if circumstances change that would more likely than not reduce the fair value of a reporting unit below its carrying amount.
We perform either a quantitative or qualitative assessment to assess if the fair value of the respective reporting unit exceeds its carrying value. The qualitative goodwill impairment assessment requires evaluating factors to determine whether it is more likely than not that the fair value of a reporting unit is less than its carrying amount. As part of our goodwill qualitative assessment process for each reporting unit, when utilized, we evaluate various factors that are specific to the reporting unit as well as industry and macroeconomic factors in order to determine whether it is reasonably likely to have a material impact on the fair value of our reporting units. Examples of the factors that are considered include the results of the most recent impairment test, current and long-range forecasts, and changes in the strategic outlook or organizational structure of the reporting units. The long-range financial forecasts of the reporting units are compared to the forecasts used in the prior year analysis to determine if management expectations for the business have changed.
Actual results may differ from those estimates. When performing the quantitative assessment to calculate the fair value of a reporting unit, we consider both comparative market multiples as well as estimated discounted cash flows for the reporting unit. The significant estimates and assumptions include, but are not limited to, revenue growth rates, operating margins, and future economic and market conditions. The discount rates are based upon the reporting unit’s weighted average cost of capital. As a supplement, we conduct additional sensitivity analysis to assess the risk for potential impairment based upon changes in the key assumptions such as the discount rate, expected long-term growth rate, and cash flow projections. Based upon the completion of our annual test as of October 31, 2021, we determined that there was no impairment of goodwill and that all reporting units’ estimated fair values were substantially in excess of their carrying amounts.
Other Intangible Assets
Other intangible assets are generally the result of acquisitions and consist primarily of purchased technology, customer related intangibles, and trademarks. Intangible assets are recorded at their fair values as determined through purchase accounting, based on estimates and judgments regarding expectations for the estimated future after-tax earnings and cash flows arising from follow-on sales. Definite-lived intangible assets are amortized on a straight-line basis over their estimated useful lives, which generally range from 1 to 20 years. Customer-related intangibles primarily consist of customer relationships, which reflect the value of the benefit derived from the incremental revenue and related cash flows as a direct result of the customer relationship. We review the recoverability of all intangible assets, including the related useful lives, whenever events or changes in circumstances indicate that the carrying amount might not be recoverable. We would record any impairment in the reporting period in which it has been identified.
Item 7A. Quantitative and Qualitative Disclosures about Market Risk.
We are exposed to certain market risks from changes in interest rates and foreign currency exchange rates as a result of our global operating and financing activities. We seek to minimize any material risks from foreign currency exchange rate fluctuations through our normal operating and financing activities and, when deemed appropriate, through the use of derivative financial instruments. We used forward foreign currency contracts to manage our currency rate exposures during the year ended December 31, 2021, and, in order to manage our interest rate risk, we may, from time to time, enter into interest rate swaps to balance the ratio of fixed to floating rate debt. We do not use such instruments for trading or other speculative purposes. Information regarding our accounting policy on financial instruments is contained in Note 1 to the Consolidated Financial Statements.
Interest Rates
The market risk for a change in interest rates relates primarily to our debt obligations. Our fixed rate interest exposure was 91% and 100% as of December 31, 2021 and December 31, 2020, respectively. As of December 31, 2021, a change in interest rates of 1% would not have a material impact on consolidated interest expense. Information regarding our Senior Notes and Revolving Credit Agreement is contained in Note 14 to the Consolidated Financial Statements.
Foreign Currency Exchange Rates
Although the majority of our business is transacted in U.S. dollars, we do have market risk exposure to changes in foreign currency exchange rates, primarily as it relates to the value of the U.S. dollar versus the British Pound, Canadian dollar, and Euro. Any significant change against the U.S. dollar in the value of the currencies of those countries in which we do business could have an effect on our business, financial condition, and results of operations. If foreign exchange rates were to collectively weaken or strengthen against the U.S. dollar by 10%, net earnings would have decreased or increased, respectively, by approximately $11 million as it relates exclusively to foreign currency exchange rate exposures.
Financial instruments expose us to counter-party credit risk for non-performance and to market risk for changes in interest and foreign currency rates. We manage exposure to counter-party credit risk through specific minimum credit standards, diversification of counter-parties, and procedures to monitor concentrations of credit risk. We monitor the impact of market risk on the fair value and cash flows of our investments by investing primarily in investment grade interest-bearing securities, which have short-term maturities. We attempt to minimize possible changes in interest and currency exchange rates to amounts that are not material to our results of operations and cash flows.
Item 8. Financial Statements and Supplementary Data.
CONSOLIDATED STATEMENTS OF EARNINGS | | | | | | | | | | | | | | | | | | | | |
| | For the years ended December 31, |
| (In thousands, except per share data) | | 2021 | | 2020 | | 2019 |
| | | | | | |
| Net sales | | | | | | |
| Product sales | | $ | 2,109,617 | | | $ | 2,041,086 | | | $ | 2,073,530 | |
| Service sales | | 396,314 | | | 350,250 | | | 414,431 | |
| Total net sales | | 2,505,931 | | | 2,391,336 | | | 2,487,961 | |
| | | | | | |
| Cost of sales | | | | | | |
| Cost of product sales | | 1,330,191 | | | 1,319,562 | | | 1,329,761 | |
| Cost of service sales | | 242,384 | | | 230,547 | | | 259,455 | |
| Total cost of sales | | 1,572,575 | | | 1,550,109 | | | 1,589,216 | |
| Gross profit | | 933,356 | | | 841,227 | | | 898,745 | |
| | | | | | |
| Research and development expenses | | 88,489 | | | 74,816 | | | 72,520 | |
| Selling expenses | | 116,956 | | | 109,537 | | | 120,861 | |
| General and administrative expenses | | 326,140 | | | 303,288 | | | 301,411 | |
| Impairment of assets held for sale | | 19,088 | | | 33,043 | | | — | |
| Restructuring expenses | | — | | | 31,695 | | | — | |
| Operating income | | 382,683 | | | 288,848 | | | 403,953 | |
| Interest expense | | 40,240 | | | 35,545 | | | 31,347 | |
| Other income, net | | 12,067 | | | 9,748 | | | 23,856 | |
| Earnings before income taxes | | 354,510 | | | 263,051 | | | 396,462 | |
| Provision for income taxes | | (87,351) | | | (61,659) | | | (88,879) | |
| Net earnings | | $ | 267,159 | | | $ | 201,392 | | | $ | 307,583 | |
| | | | | | |
| Basic earnings per share | | $ | 6.61 | | | $ | 4.83 | | | $ | 7.20 | |
| Diluted earnings per share | | $ | 6.58 | | | $ | 4.80 | | | $ | 7.15 | |
| | | | | | |
| Dividends per share | | $ | 0.71 | | | $ | 0.68 | | | $ | 0.66 | |
| | | | | | |
| Weighted average shares outstanding: | | | | | | |
| Basic | | 40,417 | | | 41,738 | | | 42,739 | |
| Diluted | | 40,602 | | | 41,999 | | | 43,016 | |
See notes to consolidated financial statements
CONSOLIDATED STATEMENTS OF COMPREHENSIVE INCOME | | | | | | | | | | | | | | | | | | | | |
| | For the years ended December 31, |
| (In thousands) | | 2021 | | 2020 | | 2019 |
| | | | | | |
| Net earnings | | $ | 267,159 | | | $ | 201,392 | | | $ | 307,583 | |
| Other comprehensive income | | | | | | |
Foreign currency translation, net of tax (1) | | (10,829) | | | 41,282 | | | 18,447 | |
Pension and postretirement adjustments, net of tax (2) | | 131,220 | | | (26,864) | | | (29,017) | |
| Other comprehensive income (loss), net of tax | | 120,391 | | | 14,418 | | | (10,570) | |
| Comprehensive income | | $ | 387,550 | | | $ | 215,810 | | | $ | 297,013 | |
(1)The tax benefit (expense) included in other comprehensive income for foreign currency translation adjustments for 2021, 2020, and 2019 was immaterial.
(2)The tax benefit (expense) included in other comprehensive income for pension and postretirement adjustments for 2021, 2020, and 2019 was ($42.3) million, $8.3 million, and $8.5 million, respectively.
See notes to consolidated financial statements
CONSOLIDATED BALANCE SHEETS | | | | | | | | | | | | | | |
| | As of December 31, |
| (In thousands, except share data) | | 2021 | | 2020 |
| | | | |
| ASSETS | | | | |
| Current assets: | | | | |
| Cash and cash equivalents | | $ | 171,004 | | | $ | 198,248 | |
| Receivables, net | | 647,148 | | | 588,718 | |
| Inventories, net | | 411,567 | | | 428,879 | |
| Assets held for sale | | 10,988 | | | 27,584 | |
| Other current assets | | 67,101 | | | 57,395 | |
| Total current assets | | 1,307,808 | | | 1,300,824 | |
| Property, plant, and equipment, net | | 360,031 | | | 378,200 | |
| Goodwill | | 1,463,026 | | | 1,455,137 | |
| Other intangible assets, net | | 538,077 | | | 609,630 | |
| Operating lease right-of-use assets, net | | 143,613 | | | 150,898 | |
| Prepaid pension asset | | 256,422 | | | 92,531 | |
| Other assets | | 34,568 | | | 34,114 | |
| Total assets | | $ | 4,103,545 | | | $ | 4,021,334 | |
| LIABILITIES | | | | |
| Current liabilities: | | | | |
| Current portion of long-term and short-term debt | | $ | — | | | $ | 100,000 | |
| Accounts payable | | 211,640 | | | 201,237 | |
| Accrued expenses | | 144,466 | | | 140,200 | |
| Income taxes payable | | 3,235 | | | 6,633 | |
| Deferred revenue | | 260,157 | | | 253,411 | |
| Liabilities held for sale | | 12,655 | | | 10,141 | |
| Other current liabilities | | 102,714 | | | 98,755 | |
| Total current liabilities | | 734,867 | | | 810,377 | |
| Long-term debt | | 1,050,610 | | | 958,292 | |
| Deferred tax liabilities | | 147,349 | | | 115,007 | |
| Accrued pension and other postretirement benefit costs | | 91,329 | | | 98,345 | |
| Long-term operating lease liability | | 127,152 | | | 133,069 | |
| Long-term portion of environmental reserves | | 13,656 | | | 15,422 | |
| Other liabilities | | 112,092 | | | 103,248 | |
| Total liabilities | | 2,277,055 | | | 2,233,760 | |
Contingencies and Commitments (Notes 10, 14, and 19) | | | | |
| STOCKHOLDERS’ EQUITY | | | | |
Common stock, $1 par value, 100,000,000 shares authorized as of December 31, 2021 and December 31, 2020; 49,187,378 shares issued as of December 31, 2021 and December 31, 2020; outstanding shares were 38,469,778 as of December 31, 2021 and 40,916,429 as of December 31, 2020 | | 49,187 | | | 49,187 | |
| Additional paid in capital | | 127,104 | | | 122,535 | |
| Retained earnings | | 2,908,827 | | | 2,670,328 | |
| Accumulated other comprehensive loss | | (190,465) | | | (310,856) | |
Common treasury stock, at cost (10,717,600 shares as of December 31, 2021 and 8,270,949 shares as of December 31, 2020) | | (1,068,163) | | | (743,620) | |
| Total stockholders' equity | | 1,826,490 | | | 1,787,574 | |
| Total liabilities and stockholders’ equity | | $ | 4,103,545 | | | $ | 4,021,334 | |
See notes to consolidated financial statements
CONSOLIDATED STATEMENTS OF CASH FLOWS | | | | | | | | | | | | | | | | | | | | |
| | For the years ended December 31, |
| (In thousands) | | 2021 | | 2020 | | 2019 |
| Cash flows from operating activities: | | | | | | |
| Net earnings | | $ | 267,159 | | | $ | 201,392 | | | $ | 307,583 | |
| Adjustments to reconcile net earnings to net cash provided by operating activities: | | | | | | |
| Depreciation and amortization | | 114,384 | | | 115,903 | | | 102,412 | |
| (Gain) on sale/disposal of long-lived assets | | (568) | | | — | | | (11,054) | |
| Deferred income taxes | | (10,200) | | | (7,048) | | | 40,787 | |
| Share-based compensation | | 13,450 | | | 14,437 | | | 13,669 | |
| Impairment of assets held for sale | | 19,088 | | | 33,043 | | | — | |
| Foreign exchange loss on substantial liquidation of subsidiary | | — | | | 9,351 | | | — | |
| Non-cash restructuring charges | | — | | | 15,628 | | | — | |
| Changes in operating assets and liabilities, net of businesses acquired and disposed of: | | | | | | |
| Receivables, net | | (59,372) | | | 71,147 | | | (12,613) | |
| Inventories, net | | 15,321 | | | 15,535 | | | (3,485) | |
| Progress payments | | (3,672) | | | (7,689) | | | (4,834) | |
| Accounts payable and accrued expenses | | 17,713 | | | (55,513) | | | (18,629) | |
| Deferred revenue | | 9,584 | | | (33,179) | | | 36,134 | |
| Income taxes | | (12,988) | | | 15,171 | | | (15,625) | |
| Pension and postretirement, net | | (1,236) | | | (153,375) | | | (1,310) | |
| Other | | 19,005 | | | 26,377 | | | (11,631) | |
| Net cash provided by operating activities | | 387,668 | | | 261,180 | | | 421,404 | |
| Cash flows from investing activities: | | | | | | |
| Proceeds from sales and disposals of long-lived assets | | 4,045 | | | 2,930 | | | 15,093 | |
| Additions to property, plant, and equipment | | (41,108) | | | (47,499) | | | (69,752) | |
| Acquisition of businesses, net of cash acquired | | — | | | (487,944) | | | (185,209) | |
| Additional consideration paid on prior year acquisitions | | (5,340) | | | — | | | — | |
| Other | | — | | | (17) | | | (172) | |
| Net cash used for investing activities | | (42,403) | | | (532,530) | | | (240,040) | |
| Cash flows from financing activities: | | | | | | |
| Borrowings under revolving credit facilities | | 455,950 | | | 570,675 | | | 37,692 | |
| Payment of revolving credit facilities | | (362,050) | | | (570,675) | | | (37,934) | |
| Borrowings of debt | | — | | | 300,000 | | | — | |
| Principal payments on debt | | (100,000) | | | — | | | — | |
| Repurchases of company stock | | (343,129) | | | (200,018) | | | (50,661) | |
| Proceeds from share-based compensation plans | | 9,705 | | | 11,148 | | | 11,770 | |
| Dividends paid | | (28,660) | | | (28,175) | | | (28,200) | |
| Other | | (945) | | | (874) | | | (812) | |
| Net cash provided by (used for) financing activities | | (369,129) | | | 82,081 | | | (68,145) | |
| Effect of exchange-rate changes on cash | | (3,380) | | | (3,516) | | | 1,748 | |
| Net increase (decrease) in cash and cash equivalents | | (27,244) | | | (192,785) | | | 114,967 | |
| Cash and cash equivalents at beginning of year | | 198,248 | | | 391,033 | | | 276,066 | |
| Cash and cash equivalents at end of year | | 171,004 | | | 198,248 | | | 391,033 | |
See notes to consolidated financial statements
CONSOLIDATED STATEMENTS OF STOCKHOLDERS’ EQUITY
(In thousands) | | | | | | | | | | | | | | | | | | | | | | | | | | | | | | | | |
| | Common Stock | | Additional
Paid
in Capital | | Retained
Earnings | | Accumulated Other Comprehensive Income (Loss) | | Treasury Stock |
| January 1, 2019 | | $ | 49,187 | | | $ | 118,234 | | | $ | 2,191,471 | | | $ | (288,447) | | | $ | (539,664) | |
| Cumulative effect from adoption of ASU 2018-02 | | — | | | — | | | 26,257 | | | (26,257) | | | — | |
| Net earnings | | — | | | — | | | 307,583 | | | — | | | — | |
| Other comprehensive loss, net of tax | | — | | | — | | | — | | | (10,570) | | | — | |
| Dividends paid | | — | | | — | | | (28,200) | | | — | | | — | |
| Restricted stock | | — | | | (10,483) | | | — | | | — | | | 10,483 | |
| Employee stock purchase plan and stock options exercised | | — | | | (4,226) | | | — | | | — | | | 15,996 | |
| Share-based compensation | | — | | | 13,264 | | | — | | | — | | | 405 | |
Repurchase of common stock (1) | | — | | | — | | | — | | | — | | | (50,661) | |
| Other | | — | | | (719) | | | — | | | — | | | 719 | |
| December 31, 2019 | | $ | 49,187 | | | $ | 116,070 | | | $ | 2,497,111 | | | $ | (325,274) | | | $ | (562,722) | |
| Net earnings | | — | | | — | | | 201,392 | | | — | | | — | |
| Other comprehensive income, net of tax | | — | | | — | | | — | | | 14,418 | | | — | |
| Dividends paid | | — | | | — | | | (28,175) | | | — | | | — | |
| Restricted stock | | — | | | (4,115) | | | — | | | — | | | 4,115 | |
| Employee stock purchase plan and stock options exercised | | — | | | (3,286) | | | — | | | — | | | 14,434 | |
| Share-based compensation | | — | | | 14,383 | | | — | | | — | | | 54 | |
Repurchase of common stock (1) | | — | | | — | | | — | | | — | | | (200,018) | |
| Other | | — | | | (517) | | | — | | | — | | | 517 | |
| December 31, 2020 | | $ | 49,187 | | | $ | 122,535 | | | $ | 2,670,328 | | | $ | (310,856) | | | $ | (743,620) | |
| Net earnings | | — | | | — | | | 267,159 | | | — | | | — | |
| Other comprehensive income, net of tax | | — | | | — | | | — | | | 120,391 | | | — | |
| Dividends paid | | — | | | — | | | (28,660) | | | — | | | — | |
| Restricted stock | | — | | | (9,007) | | | — | | | — | | | 9,007 | |
| Employee stock purchase plan | | — | | | 877 | | | — | | | — | | | 8,828 | |
| Share-based compensation | | — | | | 13,296 | | | — | | | — | | | 154 | |
Repurchase of common stock (1) | | — | | | — | | | — | | | — | | | (343,129) | |
| Other | | — | | | (597) | | | — | | | — | | | 597 | |
| December 31, 2021 | | $ | 49,187 | | | $ | 127,104 | | | $ | 2,908,827 | | | $ | (190,465) | | | $ | (1,068,163) | |
(1) For the years ended December 31, 2021, 2020, and 2019, the Corporation repurchased approximately 2.7 million, 2.0 million, and 0.4 million shares of its common stock, respectively.
See notes to consolidated financial statements
NOTES TO CONSOLIDATED FINANCIAL STATEMENTS
1. SUMMARY OF SIGNIFICANT ACCOUNTING POLICIES
Nature of Operations
Curtiss-Wright Corporation and its subsidiaries (the Corporation or the Company) is a global integrated business that provides highly engineered products, solutions, and services mainly to aerospace & defense markets, as well as critical technologies in demanding commercial power, process, and industrial markets.
Principles of Consolidation
The consolidated financial statements include the accounts of the Corporation and its majority-owned subsidiaries. All intercompany transactions and accounts have been eliminated.
Use of Estimates
The financial statements of the Corporation have been prepared in conformity with accounting principles generally accepted in the United States of America (U.S. GAAP), which requires management to make estimates and judgments that affect the reported amount of assets, liabilities, revenue, and expenses and disclosure of contingent assets and liabilities in the accompanying financial statements. The most significant of these estimates includes the estimate of costs to complete on certain contracts using the over-time revenue recognition accounting method, cash flow estimates used for testing the recoverability of assets, pension plan and postretirement obligation assumptions, estimates for inventory obsolescence, fair value estimates around assets and assumed liabilities from acquisitions, estimates for the valuation and useful lives of intangible assets, legal reserves, and the estimate of future environmental costs. Actual results may differ from these estimates.
Cash and Cash Equivalents
Cash equivalents consist of money market funds and commercial paper that are readily convertible into cash, all with original maturity dates of three months or less.
Inventory
Inventories are stated at lower of cost or net realizable value. Production costs are comprised of direct material and labor and applicable manufacturing overhead.
Progress Payments
Certain long-term contracts provide for interim billings as costs are incurred on the respective contracts. Pursuant to contract provisions, agencies of the U.S. Government and other customers obtain control of promised goods or services to the extent that progress payments are received. Accordingly, these receipts have been reported as a reduction of unbilled receivables as presented in Note 5 to the Consolidated Financial Statements. In the event that progress payments received exceed revenue recognized to date on a specific contract, a contract liability has been established with such amount reported in the "Deferred revenue" line within the Consolidated Balance Sheet.
The Corporation also receives progress payments on development contracts related to certain aerospace and defense programs. Progress payments received on partially funded development contracts have been reported as a reduction of inventories, as presented in Note 6 to the Consolidated Financial Statements.
Property, Plant, and Equipment
Property, plant, and equipment are carried at cost less accumulated depreciation. Major renewals and betterments are capitalized, while maintenance and repairs that do not improve or extend the life of the asset are expensed in the period that they are incurred. Depreciation is computed using the straight-line method over the estimated useful lives of the respective assets.
Average useful lives for property, plant, and equipment are as follows:
| | | | | |
| Buildings and improvements | 5 to 40 years |
| Machinery, equipment, and other | 3 to 15 years |
See Note 7 to the Consolidated Financial Statements for further information on property, plant, and equipment.
Intangible Assets
Intangible assets are generally the result of acquisitions and consist primarily of purchased technology, customer related intangibles, trademarks, and technology licenses. Intangible assets are amortized on a straight-line basis over their estimated useful lives, which range from 1 to 20 years. See Note 9 to the Consolidated Financial Statements for further information on other intangible assets.
Impairment of Long-Lived Assets
The Corporation reviews the recoverability of all long-lived assets, including the related useful lives, whenever events or changes in circumstances indicate that the carrying amount of a long-lived asset might not be recoverable. If required, the Corporation compares the estimated fair value determined by either the undiscounted future net cash flows or appraised value to the related asset’s carrying value to determine whether there has been an impairment. If an asset is considered impaired, the asset is written down to fair value in the period in which the impairment becomes known. The Corporation recognized no significant impairment charges on assets held in use during the years ended December 31, 2021, 2020, and 2019.
Goodwill
Goodwill results from business acquisitions. The Corporation accounts for business acquisitions by allocating the purchase price to the tangible and intangible assets acquired and liabilities assumed. Assets acquired and liabilities assumed are recorded at their fair values, and the excess of the purchase price over the amounts allocated is recorded as goodwill. The recoverability of goodwill is subject to an annual impairment test or whenever an event occurs or circumstances change that would more likely than not result in an impairment. The impairment test is based on the estimated fair value of the underlying businesses. The Corporation’s goodwill impairment test is performed annually in the fourth quarter of each year. See Note 8 to the Consolidated Financial Statements for further information on goodwill.
Fair Value of Financial Instruments
Accounting guidance requires certain disclosures regarding the fair value of financial instruments. Due to the short maturities of cash and cash equivalents, accounts receivable, accounts payable, and accrued expenses, the net book value of these financial instruments is deemed to approximate fair value. See Notes 11 and 14 to the Consolidated Financial Statements for further information on the Corporation's financial instruments.
Research and Development
The Corporation funds research and development programs for commercial products and independent research and development and bid and proposal work related to government contracts. Development costs include engineering for new customer requirements. Corporation-sponsored research and development costs are expensed as incurred.
Research and development costs associated with customer-sponsored programs are capitalized to inventory and are recorded in cost of sales when products are delivered or services performed. Funds received under shared development contracts are a reduction of the total development expenditures under the shared contract and are shown net as research and development costs.
Accounting for Share-Based Payments
The Corporation follows the fair value based method of accounting for share-based employee compensation, which requires the Corporation to expense all share-based employee compensation. Share-based employee compensation is a non-cash expense since the Corporation settles these obligations by issuing the shares of Curtiss-Wright Corporation instead of settling such obligations with cash payments.
Compensation expense for performance shares and time-based restricted stock is recognized over the requisite service period for the entire award based on the grant date fair value.
Income Taxes
The Corporation accounts for income taxes using the asset and liability method. Under the asset and liability method, deferred tax assets and liabilities are recognized for future tax consequences attributable to differences between the financial statement carrying amounts of existing assets and liabilities and their respective tax bases. The effect on deferred tax assets and liabilities of a change in tax laws is recognized in the results of operations in the period the new laws are enacted. A valuation allowance is recorded to reduce the carrying amounts of deferred tax assets unless it is more likely than not that such assets will be realized.
The Corporation records amounts related to uncertain income tax positions by 1) prescribing a minimum recognition threshold a tax position is required to meet before being recognized in the financial statements and 2) the measurement of the income tax benefits recognized from such positions. The Corporation’s accounting policy is to classify uncertain income tax positions that are not expected to be resolved in one year as a non-current income tax liability and to classify interest and penalties as a component of interest expense and general and administrative expenses, respectively. See Note 13 to the Consolidated Financial Statements for further information.
Foreign Currency
For operations outside the United States of America that prepare financial statements in currencies other than the U.S. dollar, the Corporation translates assets and liabilities at period-end exchange rates and income statement amounts using weighted-average exchange rates for the period. The cumulative effect of translation adjustments is presented as a component of accumulated other comprehensive income (loss) within stockholders’ equity. This balance is primarily affected by foreign currency exchange rate fluctuations. Losses from foreign currency transactions are included in general and administrative expenses in the Consolidated Statement of Earnings, which amounted to $1.8 million, $3.9 million, and $7.2 million for the years ended December 31, 2021, 2020, and 2019, respectively.
Derivatives
Forward Foreign Exchange and Currency Option Contracts
The Corporation uses financial instruments, such as forward exchange and currency option contracts, to hedge a portion of existing and anticipated foreign currency denominated transactions. The purpose of the Corporation’s foreign currency risk management program is to reduce volatility in earnings caused by exchange rate fluctuations. All derivative financial instruments are recorded at fair value based upon quoted market prices for comparable instruments, with the gain or loss on these transactions recorded into earnings in the period in which they occur. The Corporation does not use derivative financial instruments for trading or speculative purposes.
Interest Rate Risks and Related Strategies
The Corporation’s primary interest rate exposure results from changes in U.S. dollar interest rates. The Corporation’s policy is to manage interest cost using a mix of fixed and variable rate debt. The Corporation periodically uses interest rate swaps to manage such exposures. Under these interest rate swaps, the Corporation exchanges, at specified intervals, the difference between fixed and floating interest amounts calculated by reference to an agreed-upon notional principal amount.
For interest rate swaps designated as fair value hedges (i.e., hedges against the exposure to changes in the fair value of an asset or a liability or an identified portion thereof that is attributable to a particular risk), changes in the fair value of the interest rate swaps offset changes in the fair value of the fixed rate debt due to changes in market interest rates.
Recently Issued Accounting Standards
Recent accounting standards adopted
ASU 2016-13- Financial Instruments—Credit Losses (Topic 326), Measurement of Credit Losses on Financial Instruments. On January 1, 2020, the Company adopted ASU 2016-13 -Financial Instruments—Credit Losses (Topic 326), Measurement of Credit Losses on Financial Instruments. This ASU added a current expected credit loss impairment model to U.S. GAAP based on expected losses rather than incurred losses. As the Corporation is not subject to material trade credit risk given that a significant portion of its sales are generated from contracts with agencies of or prime contractors to the U.S. Government, the adoption of this standard did not have a material impact on the Corporation's consolidated financial statements as of January 1, 2020. As a result of adoption, the Corporation utilizes current and historical collection data as well as assesses current economic conditions in order to determine expected trade credit losses on a prospective basis.
2. REVENUE
The Corporation accounts for revenues in accordance with ASC 606, Revenue from Contracts with Customers. Under ASC 606, revenue is recognized when control of a promised good and/or service is transferred to a customer at a transaction price that reflects the consideration that the Corporation expects to be entitled to in exchange for that good and/or service.
Performance Obligations
The Corporation identifies a performance obligation for each promise in a contract to transfer a distinct good or service to the customer. As part of its assessment, the Corporation considers all goods and/or services promised in the contract, regardless of whether they are explicitly stated or implied by customary business practices. The Corporation’s contracts may contain either a single performance obligation, including the promise to transfer individual goods or services that are not separately distinct within the context of the respective contracts, or multiple performance obligations. For contracts with multiple performance obligations, the Corporation allocates the overall transaction price to each performance obligation using standalone selling prices, where available, or utilizes estimates for each distinct good or service in the contract where standalone prices are not available. In certain instances, the transaction price may include estimated amounts of variable consideration including but not limited to incentives, awards, price escalations, liquidated damages, and penalties, only to the extent that it is probable that a significant reversal of cumulative revenue recognized to date around such variable consideration will not occur. The Corporation estimates variable consideration to be included in the transaction price using either the expected value method or most likely amount method, contingent upon the facts and circumstances of the specific arrangement. Variable consideration associated with the Corporation’s respective arrangements is not typically constrained.
The Corporation’s performance obligations are satisfied either at a point-in-time or on an over-time basis. Typically, over-time revenue recognition is based on the utilization of an input measure used to measure progress, such as costs incurred to date relative to total estimated costs. Changes in total estimated costs are recognized using the cumulative catch-up method of accounting which recognizes the cumulative effect of the changes on current and prior periods in the current period. Accordingly, the effect of the changes on future periods of contract performance is recognized as if the revised estimate had been the original estimate. A significant change in an estimate on one or more contracts could have a material effect on the Corporation's consolidated financial position, results or operations, or cash flows. There were no significant changes in estimated contract costs during 2021, 2020, or 2019. If a performance obligation does not qualify for over-time revenue recognition, revenue is then recognized at the point-in-time in which control of the distinct good or service is transferred to the customer, typically based upon the terms of delivery.
The following table illustrates the approximate percentage of revenue recognized for performance obligations satisfied over-time versus at a point-in-time for the years ended December 31, 2021, 2020, and 2019:
| | | | | | | | | | | | | | | | | |
| Year Ended |
| December 31, |
| 2021 | | 2020 | | 2019 |
| Over-time | 50 | % | | 52 | % | | 49 | % |
| Point-in-time | 50 | % | | 48 | % | | 51 | % |
Contract backlog represents the remaining performance obligations that have not yet been recognized as revenue. Backlog includes deferred revenue and amounts that will be invoiced and recognized as revenue in future periods. Total backlog was approximately $2.2 billion as of December 31, 2021, of which the Corporation expects to recognize approximately 87% as net sales over the next 36 months. The remainder will be recognized thereafter.
Disaggregation of Revenue
The following table presents the Corporation’s total net sales disaggregated by end market and customer type:
| | | | | | | | | | | | | | | | | | | | |
| Total Net Sales by End Market and Customer Type | | | | | | |
| | Year Ended December 31, |
| (In thousands) | | 2021 | | 2020 | | 2019 |
| Aerospace & Defense | | | | | | |
| Aerospace Defense | | $ | 452,661 | | | $ | 463,690 | | | $ | 416,841 | |
| Ground Defense | | 220,290 | | | 107,448 | | | 93,432 | |
| Naval Defense | | 710,688 | | | 692,152 | | | 568,776 | |
| Commercial Aerospace | | 267,722 | | | 325,518 | | | 433,038 | |
| Total Aerospace & Defense Customers | | $ | 1,651,361 | | | $ | 1,588,808 | | | $ | 1,512,087 | |
| | | | | | |
| Commercial | | | | | | |
| Power & Process | | $ | 473,489 | | | $ | 474,842 | | | $ | 572,950 | |
| General Industrial | | 381,081 | | | 327,686 | | | 402,924 | |
| Total Commercial Customers | | $ | 854,570 | | | $ | 802,528 | | | $ | 975,874 | |
| | | | | | |
| Total | | $ | 2,505,931 | | | $ | 2,391,336 | | | $ | 2,487,961 | |
Contract Balances
Timing of revenue recognition and cash collection may result in billed receivables, unbilled receivables (contract assets), and deferred revenue (contract liabilities) on the Consolidated Balance Sheet. The Corporation’s contract assets primarily relate to its rights to consideration for work completed but not billed as of the reporting date. Contract assets are transferred to billed receivables when the rights to consideration become unconditional. This is typical in situations where amounts are billed as work progresses in accordance with agreed-upon contractual terms or upon achievement of contractual milestones. The Corporation’s contract liabilities primarily consist of customer advances received prior to revenue being earned. Revenues recognized for the years ended December 31, 2021, 2020, and 2019 included in the contract liabilities balance at the beginning of the respective years were approximately $210 million, $224 million, and $198 million, respectively. Changes in contract assets and contract liabilities as of December 31, 2021 were not materially impacted by any other factors. Contract assets and contract liabilities are reported in the "Receivables, net" and "Deferred revenue" lines, respectively, within the Consolidated Balance Sheet.
3. ACQUISITIONS
The Corporation continually evaluates potential acquisitions that either strategically fit within the Corporation’s existing portfolio or expand the Corporation’s portfolio into new product lines or adjacent markets. The Corporation has completed numerous acquisitions that have been accounted for as business combinations and have resulted in the recognition of goodwill in the Corporation's financial statements. This goodwill arises because the purchase prices for these businesses reflect the future earnings and cash flow potential in excess of the earnings and cash flows attributable to the current product and customer set at the time of acquisition. Thus, goodwill inherently includes the know-how of the assembled workforce, the ability of the workforce to further improve the technology and product offerings, and the expected cash flows resulting from these efforts. Goodwill may also include expected synergies resulting from the complementary strategic fit these businesses bring to existing operations.
The Corporation allocates the purchase price at the date of acquisition based upon its understanding of the fair value of the acquired assets and assumed liabilities. Only items identified as of the acquisition date are considered for subsequent adjustment. The Corporation will make appropriate adjustments to the purchase price allocation prior to completion of the measurement period, as required.
For the year ended December 31, 2021, the Corporation did not complete any acquisitions. However, the Corporation paid $5 million during the twelve months ended December 31, 2021 in regard to prior period acquisitions, which included a working capital adjustment on the acquisition of Pacific Star Communications, Inc. (PacStar), as well as a portion of the purchase price on the acquisition of Dyna-Flo Control Valve Services Ltd. (Dyna-Flo), which was initially held back as security for potential indemnification claims against the seller in accordance with the terms of the Purchase Agreement.
For the year ended December 31, 2020, the Corporation acquired three businesses for an aggregate purchase price of $496 million, net of cash acquired. The Corporation's prior period acquisitions contributed $40 million of total net sales and $5 million of net losses for the year ended December 31, 2020 which are included in the Consolidated Statement of Earnings.
The following table summarizes the estimated fair values of the assets acquired and liabilities assumed at the date of acquisition for all acquisitions consummated in 2020: | | | | | | | | |
| (In thousands) | | 2020 |
| Accounts receivable | | $ | 25,488 | |
| Inventory | | 37,840 | |
| Property, plant, and equipment | | 5,280 | |
| Intangible assets | | 204,384 | |
| Operating lease right-of-use assets, net | | 5,562 | |
| Other current and non-current assets | | 7,050 | |
| Current and non-current liabilities | | (75,257) | |
| Net tangible and intangible assets | | 210,347 | |
| Goodwill | | 285,200 | |
| Total Purchase price | | $ | 495,547 | |
| | |
| Goodwill deductible for tax purposes | | $ | 37,234 | |
2020 Acquisitions
PacStar
On October 30, 2020, the Corporation acquired 100% of the issued and outstanding stock of PacStar for $406 million. The Purchase Agreement contains a purchase price adjustment mechanism and representations and warranties customary for a transaction of this type, including a portion of the purchase price deposited in escrow as security for potential indemnification claims against the seller. PacStar is a provider of tactical communications solutions for battlefield network management. The acquired business operates within the Defense Electronics segment.
Interactive Analysis and Display System (IADS)
On April 20, 2020, the Corporation acquired the IADS product line for approximately $29 million. The Asset Purchase Agreement contains representations and warranties customary for a transaction of this type, including a portion of the purchase price deposited in escrow as security for potential indemnification claims against the seller. IADS is a real-time display and post-test analysis product for flight tests. The acquired product line operates within the Defense Electronics segment.
Dyna-Flo
On February 28, 2020, the Corporation acquired 100% of the issued and outstanding share capital of Dyna-Flo for approximately $60 million, net of cash acquired. The Purchase Agreement contains representations and warranties customary for a transaction of this type, including a portion of the purchase price held back as security for potential indemnification claims against the seller. Dyna-Flo specializes in control valves, actuators, and control systems for the chemical, petrochemical, and oil and gas markets. The acquired business operates within the Naval & Power segment.
4. ASSETS HELD FOR SALE
During the fourth quarter of 2020, the Corporation committed to a plan to sell its industrial valve business in Germany, which is reported within its Naval & Power segment. The business met the criteria to be classified as held for sale in the fourth quarter of 2020. Accordingly, the assets and liabilities of the business are presented as held for sale in the Corporation's Consolidated Balance Sheet as of December 31, 2021. The aforementioned assets and liabilities classified as held for sale have been measured at the lower of carrying value or fair value less costs to sell, which resulted in impairment losses of $19 million and $33 million for the years ended December 31, 2021 and 2020, respectively. Such amounts have been reported in the "Impairment of assets held for sale" caption within the Corporation’s Consolidated Statement of Earnings.
The aggregate components of assets and liabilities classified as held for sale as of December 31 are as follows: | | | | | | | | | | | |
| (In thousands) | 2021 | | 2020 |
| Assets held for sale: | | | |
| Receivables, net | $ | 11,038 | | | $ | 9,902 | |
| Inventories, net | 18,373 | | | 16,401 | |
| Other current assets | 1,181 | | | 1,798 | |
| Property, plant, and equipment, net | 4,220 | | | 4,821 | |
| Reserve for assets held for sale | (23,824) | | | (5,338) | |
| Total assets held for sale, current | $ | 10,988 | | | $ | 27,584 | |
| Liabilities held for sale: | | | |
| Accounts payable | $ | (4,450) | | | (2,654) | |
| Accrued expenses | (1,165) | | | (1,375) | |
| Other current liabilities | (2,631) | | | (748) | |
| Accrued pension and other postretirement benefit costs | (4,409) | | | (5,364) | |
| Total liabilities held for sale, current | $ | (12,655) | | | $ | (10,141) | |
5. RECEIVABLES
Receivables include current notes, amounts billed to customers, claims, other receivables, and unbilled revenue on long-term contracts, which consists of amounts recognized as sales but not billed. Substantially all amounts of unbilled receivables are expected to be billed and collected in the subsequent year. An immaterial amount of billed receivables are subject to retainage provisions. The amount of claims and unapproved change orders within our receivables balances is immaterial.
The Corporation is either a prime contractor or subcontractor to various agencies of the U.S. Government. Revenues derived directly and indirectly from government sources (primarily the U.S. Government) were 55% and 53% of total net sales in 2021 and 2020, respectively. Total receivables due from government sources (primarily the U.S Government) were $401.0 million and $352.7 million as of December 31, 2021 and 2020, respectively. Government (primarily the U.S. Government) unbilled receivables, net of progress payments, were $253.5 million and $198.6 million as of December 31, 2021 and 2020, respectively.
The composition of receivables as of December 31 is as follows: | | | | | | | | | | | | | | |
| (In thousands) | | 2021 | | 2020 |
| Billed receivables: | | | | |
| Trade and other receivables | | $ | 362,007 | | | $ | 361,460 | |
| Unbilled receivables: | | | | |
| Recoverable costs and estimated earnings not billed | | 291,758 | | | 238,309 | |
| Less: Progress payments applied | | (1,297) | | | (3,291) | |
| Net unbilled receivables | | 290,461 | | | 235,018 | |
| Less: Allowance for doubtful accounts | | (5,320) | | | (7,760) | |
| Receivables, net | | $ | 647,148 | | | $ | 588,718 | |
6. INVENTORIES
Inventoried costs contain amounts relating to long-term contracts and programs with long production cycles, a portion of which will not be realized within one year. The caption "Inventoried costs related to U.S. Government and other long-term contracts" includes an immaterial amount of claims or other similar items subject to uncertainty concerning their determination or realization. Inventories are valued at the lower of cost or net realizable value.
The composition of inventories as of December 31 is as follows: | | | | | | | | | | | | | | |
| (In thousands) | | 2021 | | 2020 |
| Raw materials | | $ | 191,066 | | | $ | 177,828 | |
| Work-in-process | | 78,221 | | | 80,729 | |
| Finished goods | | 98,944 | | | 120,767 | |
Inventoried costs related to U.S. Government and other long-term contracts (1) | | 48,619 | | | 56,599 | |
| Inventories, net of reserves | | 416,850 | | | 435,923 | |
| Less: Progress payments applied | | (5,283) | | | (7,044) | |
| Inventories, net | | $ | 411,567 | | | $ | 428,879 | |
(1) As of December 31, 2021 and 2020, this caption also includes capitalized development costs of $25.7 million and $29.7 million, respectively, related to certain aerospace and defense programs. These capitalized costs will be liquidated as units are produced and sold under contract. As of December 31, 2021 and 2020, capitalized development costs of $12.1 million and $13.0 million, respectively, are not currently supported by existing firm orders.
7. PROPERTY, PLANT, AND EQUIPMENT
The composition of property, plant, and equipment as of December 31 is as follows: | | | | | | | | | | | | | | |
| (In thousands) | | 2021 | | 2020 |
| Land | | $ | 17,615 | | | $ | 17,660 | |
| Buildings and improvements | | 239,217 | | | 236,355 | |
| Machinery, equipment, and other | | 885,970 | | | 881,110 | |
| Property, plant, and equipment, at cost | | 1,142,802 | | | 1,135,125 | |
| Less: Accumulated depreciation | | (782,771) | | | (756,925) | |
| Property, plant, and equipment, net | | $ | 360,031 | | | $ | 378,200 | |
Depreciation expense for the years ended December 31, 2021, 2020, and 2019 was $54.8 million, $55.3 million, and $57.4 million, respectively.
8. GOODWILL
In connection with the change in reportable segments on January 1, 2021, the Corporation recast its previously reported
goodwill balances as of December 31, 2020 and December 31, 2019 on a relative fair value basis. Refer to Note 18 to the Consolidated Financial Statements for additional information on the Corporation’s reportable segments.
The changes in the carrying amount of goodwill for 2021 and 2020 are as follows:
| | | | | | | | | | | | | | | | | | | | | | | | | | |
| (In thousands) | | Aerospace & Industrial | | Defense Electronics | | Naval & Power | | Consolidated |
| December 31, 2019 | | $ | 314,667 | | | $ | 441,291 | | | $ | 410,722 | | | $ | 1,166,680 | |
| Acquisitions | | — | | | 256,733 | | | 28,467 | | | 285,200 | |
Impairment on assets held for sale (1) | | — | | | — | | | (9,598) | | | (9,598) | |
| Adjustments | | — | | | (1,385) | | | — | | | (1,385) | |
| Foreign currency translation adjustment | | 2,254 | | | 7,276 | | | 4,710 | | | 14,240 | |
| December 31, 2020 | | $ | 316,921 | | | $ | 703,915 | | | $ | 434,301 | | | $ | 1,455,137 | |
Adjustments (2) | | — | | | 12,943 | | | — | | | 12,943 | |
| Foreign currency translation adjustment | | (774) | | | (2,844) | | | (1,436) | | | (5,054) | |
| December 31, 2021 | | $ | 316,147 | | | $ | 714,014 | | | $ | 432,865 | | | $ | 1,463,026 | |
(1) Amount relates to the Corporation's industrial valves business in Germany, which was classified as held for sale as of December 31, 2020.
(2) Amount primarily relates to post-closing adjustments on the Corporation's acquisition of PacStar in October 2020.
The purchase price allocations relating to the businesses acquired are initially based on estimates. The Corporation adjusts these estimates based upon final analysis, including input from third party appraisals when deemed appropriate. The determination of fair value is finalized no later than twelve months from acquisition. Goodwill adjustments represent subsequent adjustments to the purchase price allocation for acquisitions.
The Corporation completed its annual goodwill impairment testing as of October 31, 2021, 2020, and 2019 and concluded that there was no impairment of goodwill.
9. OTHER INTANGIBLE ASSETS, NET
Intangible assets are generally the result of acquisitions and consist primarily of purchased technology, customer related intangibles, and trademarks. Intangible assets are amortized over useful lives that generally range between 1 and 20 years.
The following tables present the cumulative composition of the Corporation’s intangible assets as of December 31, 2021 and December 31, 2020, respectively. | | | | | | | | | | | | | | | | | | | | | | | | | | | | | | | | | | | | | | |
| | 2021 | | 2020 |
| (In thousands) | | Gross | | Accumulated Amortization | | Net | | Gross | | Accumulated Amortization | | Net |
Technology (2) | | $ | 274,615 | | | $ | (164,077) | | | $ | 110,538 | | | $ | 280,595 | | | $ | (148,064) | | | $ | 132,531 | |
Customer related intangibles (2) | | 568,720 | | | (270,816) | | | 297,904 | | | 573,722 | | | (239,798) | | | 333,924 | |
Programs (1) | | 144,000 | | | (27,000) | | | 117,000 | | | 144,000 | | | (19,800) | | | 124,200 | |
Other intangible assets | | 49,559 | | | (36,924) | | | 12,635 | | | 51,493 | | | (32,518) | | | 18,975 | |
| Total | | $ | 1,036,894 | | | $ | (498,817) | | | $ | 538,077 | | | $ | 1,049,810 | | | $ | (440,180) | | | $ | 609,630 | |
(1) Programs include values assigned to major programs of acquired businesses and represent the aggregate value associated with the customer relationships, contracts, technology, and trademarks underlying the associated program.
(2) During the year ended December 31, 2020, the Corporation recognized an impairment loss of $18 million pertaining to technology and customer-related intangibles of its industrial valve business in Germany, which was classified as held for sale during the fourth quarter of 2020.
During the year ended December 31, 2020, the Corporation acquired intangible assets of $204.4 million as a result of the Corporation's PacStar, IADS, and Dyna-Flo acquisitions, which included Customer-related intangibles of $159.9 million, Technology of $34.6 million, and Other intangible assets of $9.9 million. The weighted average amortization periods for these aforementioned intangible assets are 16.4 years, 8.9 years, and 7.1 years, respectively. During the year ended December 31, 2021, the Corporation did not acquire any intangible assets. However, as a result of finalizing the purchase price allocation related to the Corporation's acquisition of PacStar, approximately $12 million of intangible assets were reclassified to goodwill during 2021.
Amortization expense for the years ended December 31, 2021, 2020, and 2019 was $60 million, $61 million, and $45 million, respectively. The estimated future amortization expense of intangible assets over the next five years is as follows:
| | | | | | | | |
| (In millions) | | |
| 2022 | | $ | 55 | |
| 2023 | | $ | 52 | |
| 2024 | | $ | 48 | |
| 2025 | | $ | 45 | |
| 2026 | | $ | 44 | |
10. LEASES
The Corporation conducts a portion of its operations from leased facilities, which include manufacturing and service facilities, administrative offices, and warehouses. In addition, the Corporation leases vehicles, machinery, and office equipment under operating leases. Our leases have remaining lease terms ranging from approximately 1 year to 15 years, some of which include options for renewals, escalations, or terminations. Rental expenses for all operating leases amounted to $42 million, $41 million, and $37 million for the years ended December 31, 2021, 2020, and 2019, respectively.
Generally, the Corporation's lease contracts do not provide a readily determinable interest rate. Accordingly, the Corporation determines the incremental borrowing rate as of the lease commencement date in order to calculate the present value of its lease payments. The incremental borrowing rate is determined based on information available at the lease commencement date, including the lease term, market rates for the Corporation’s outstanding debt, as well as market rates for debt of companies with similar credit ratings.
The components of lease expense were as follows: | | | | | | | | | | | |
| Year Ended |
| (In thousands) | December 31, 2021 | | December 31, 2020 |
| Operating lease cost | $ | 41,663 | | | $ | 40,961 | |
| | | |
| Finance lease cost: | | | |
| Depreciation of finance leases | $ | 1,037 | | | $ | 1,037 | |
| Interest on lease liabilities | 431 | | | 468 | |
| Total finance lease cost | $ | 1,468 | | | $ | 1,505 | |
Supplemental cash flow information related to leases was as follows: | | | | | | | | | | | |
| Year Ended |
| (In thousands) | December 31, 2021 | | December 31, 2020 |
| Cash used for operating activities: | | | |
| Operating cash flows used for operating leases | $ | (33,352) | | | $ | (33,842) | |
| Operating cash flows used for finance leases | (431) | | | (468) | |
| Non-cash activity: | | | |
| Right-of-use assets obtained in exchange for operating lease obligations | $ | 9,040 | | | $ | 8,714 | |
Supplemental balance sheet information related to leases was as follows: | | | | | | | | | | | |
| As of December 31, |
| (In thousands, except lease term and discount rate) | 2021 | | 2020 |
| Operating Leases | | | |
| Operating lease right-of-use assets, net | $ | 143,613 | | | $ | 150,898 | |
| | | |
| Other current liabilities | $ | 25,389 | | | $ | 27,263 | |
| Long-term operating lease liability | 127,152 | | | 133,069 | |
| Total operating lease liabilities | $ | 152,541 | | | $ | 160,332 | |
| | | |
| Finance Leases | | | |
| Property, plant, and equipment | $ | 15,561 | | | $ | 15,561 | |
| Accumulated depreciation | (7,608) | | | (6,570) | |
| Property, plant, and equipment, net | $ | 7,953 | | | $ | 8,991 | |
| | | |
| Other current liabilities | $ | 1,019 | | | $ | 945 | |
| Other liabilities | 9,022 | | | 10,041 | |
| Total finance lease liabilities | $ | 10,041 | | | $ | 10,986 | |
| | | |
| Weighted average remaining lease term | | | |
| Operating leases | 8.3 years | | 8.6 years |
| Finance leases | 7.7 years | | 8.7 years |
| Weighted average discount rate | | | |
| Operating leases | 3.51 | % | | 3.67 | % |
| Finance leases | 4.05 | % | | 4.05 | % |
Maturities of lease liabilities were as follows: | | | | | | | | |
| As of December 31, 2021 |
| (In thousands) | Operating Leases | Finance Leases |
| 2022 | $ | 31,698 | | $ | 1,410 | |
| 2023 | 29,037 | | 1,445 | |
| 2024 | 26,166 | | 1,481 | |
| 2025 | 19,811 | | 1,518 | |
| 2026 | 16,161 | | 1,556 | |
| Thereafter | 63,723 | | 4,337 | |
| Total lease payments | 186,596 | | 11,747 | |
| Less: imputed interest | (34,055) | | (1,706) | |
| Total | $ | 152,541 | | $ | 10,041 | |
11. FAIR VALUE OF FINANCIAL INSTRUMENTS
Forward Foreign Exchange and Currency Option Contracts
The Corporation has foreign currency exposure, primarily in the United Kingdom, Canada, and Europe. The Corporation uses financial instruments, such as forward and option contracts, to hedge a portion of existing and anticipated foreign currency denominated transactions. The purpose of the Corporation’s foreign currency risk management program is to reduce volatility in earnings caused by exchange rate fluctuations. Guidance on accounting for derivative instruments and hedging activities requires companies to recognize all of the derivative financial instruments as either assets or liabilities at fair value in the Consolidated Balance Sheets.
Interest Rate Risks and Related Strategies
The Corporation’s primary interest rate exposure results from changes in U.S. dollar interest rates. The Corporation’s policy is to manage interest cost using a mix of fixed and variable rate debt. The Corporation periodically uses interest rate swaps to manage such exposures. Under these interest rate swaps, the Corporation exchanges, at specified intervals, the difference between fixed and floating interest amounts calculated by reference to an agreed-upon notional principal amount. The Corporation’s foreign exchange contracts and interest rate swaps are considered Level 2 instruments which are based on market based inputs or unobservable inputs and corroborated by market data such as quoted prices, interest rates, or yield curves.
For interest rate swaps designated as fair value hedges (i.e., hedges against the exposure to changes in the fair value of an asset or a liability or an identified portion thereof that is attributable to a particular risk), changes in the fair value of the interest rate swaps offset changes in the fair value of the fixed rate debt due to changes in market interest rates.
As of December 31, 2021 and December 31, 2020, the Corporation did not have any active interest rate swaps.
Effects on Consolidated Balance Sheet
As of December 31, 2021 and December 31, 2020, the fair values of the asset and liability derivative instruments were immaterial.
Effects on Consolidated Statement of Earnings
Undesignated hedges
The location and amount of (gains) and losses recognized in income on forward exchange derivative contracts not designated for hedge accounting for the years ended December 31, were as follows: | | | | | | | | | | | | | | | | | | | | |
| (In thousands) | | 2021 | | 2020 | | 2019 |
| Forward exchange contracts: | | | | | | |
| General and administrative expenses | | $ | 1,499 | | | $ | 2,312 | | | $ | (2,072) | |
Debt
The estimated fair value amounts were determined by the Corporation using available market information, which is primarily based on quoted market prices for the same or similar issues as of December 31, 2021. The fair values of our debt instruments are characterized as Level 2 measurements which are based on market-based inputs or unobservable inputs and corroborated by market data such as quoted prices, interest rates, or yield curves. The estimated fair values of the Corporation’s fixed rate debt instruments as of December 31, 2021, net of debt issuance costs, totaled $1,003 million compared to a carrying value, net of debt issuance costs, of $949 million. The estimated fair values of the Corporation’s fixed rate debt instruments as of December 31, 2020, net of debt issuance costs, totaled $1,122 million compared to a carrying value, net of debt issuance costs, of $1,049 million.
The fair values described above may not be indicative of net realizable value or reflective of future fair values. Furthermore, the use of different methodologies to determine the fair value of certain financial instruments could result in a different estimate of fair value at the reporting date.
12. ACCRUED EXPENSES AND OTHER CURRENT LIABILITIES
Accrued expenses consist of the following as of December 31: | | | | | | | | | | | | | | |
| (In thousands) | | 2021 | | 2020 |
| Accrued compensation | | $ | 99,835 | | | $ | 96,228 | |
| Accrued commissions | | 5,533 | | | 6,050 | |
| Accrued interest | | 13,092 | | | 13,327 | |
| Accrued insurance | | 6,202 | | | 7,215 | |
| | | | |
| Other | | 19,804 | | | 17,380 | |
| Total accrued expenses | | $ | 144,466 | | | $ | 140,200 | |
Other current liabilities consist of the following as of December 31: | | | | | | | | | | | | | | |
| (In thousands) | | 2021 | | 2020 |
| Short-term lease liabilities | | $ | 25,389 | | | $ | 27,263 | |
| Warranty reserves | | 15,268 | | | 14,491 | |
WEC legal reserve(1) | | 15,000 | | | 11,600 | |
| Pension and other postretirement liabilities | | 8,054 | | | 7,715 | |
| Restructuring liability | | 279 | | | 6,944 | |
| Other | | 38,724 | | | 30,742 | |
| Total other current liabilities | | $ | 102,714 | | | $ | 98,755 | |
(1) As of December 31, 2021, the Corporation reclassified prior year amounts associated with its ongoing legal matter with Westinghouse Electric Company (WEC) regarding the AP1000 program. As a result, amounts previously captured within the "warranty reserves" and "other" captions were reclassified into the "WEC legal reserve" caption. See Note 19 to the Consolidated Financial Statements for more information regarding the Corporation's WEC legal reserve.
13. INCOME TAXES
2017 Tax Cuts and Jobs Act
In conjunction with the enactment of the 2017 Tax Cuts and Jobs Act (the Tax Act), the Corporation recorded provisional income tax expense of $18.2 million for the year ended December 31, 2017 related to the one-time transition tax on certain foreign earnings. The finalized transition tax of $23.6 million was to be paid over 8 years pursuant to the Tax Act. The transition tax liability, which is expected to be paid in 2024 and 2025, was $7.4 million and $9.0 million as of December 31, 2021 and December 31, 2020, respectively.
As of December 31, 2021, the Corporation reassessed its assertion around whether foreign undistributed earnings should continue to no longer be considered permanently reinvested. Based on such assessment, Corporation revised its assertion with respect to prior and current earnings of a foreign subsidiary, which resulted in the reversal of $2.8 million of tax liabilities previously recorded. The Corporation maintains its previous assertion for all other foreign subsidiaries, and has recorded a liability for withholding taxes that would arise upon distribution of the Corporation’s foreign undistributed earnings.
During the fourth quarter of 2020, the Corporation committed to a plan to sell its industrial valve business in Germany. As a result, the tax consequences from those temporary differences resulting from the held for sale designation are no longer considered to be permanently reinvested. However, the Corporation has not recorded any provision, as it expects under tax law to recover the outside basis difference in a tax-free manner. With respect to the sale of the German industrial valves business in January 2022, the Corporation has determined that the global intangible low-taxed income (GILTI)-related impact associated with the sale is immaterial.
Except as noted above, the Corporation remains permanently reinvested to the extent of any outside basis differences in its foreign subsidiaries in excess of the amount of undistributed earnings as it is not practicable to determine the provision impact, if any, due to the complexities associated with this calculation.
Earnings before income taxes for the years ended December 31 consist of: | | | | | | | | | | | | | | | | | | | | |
| (In thousands) | | 2021 | | 2020 | | 2019 |
| Domestic | | $ | 271,694 | | | $ | 212,613 | | | $ | 273,036 | |
Foreign(1) | | 82,816 | | | 50,438 | | | 123,426 | |
| | $ | 354,510 | | | $ | 263,051 | | | $ | 396,462 | |
(1) The Corporation recognized pre-tax impairment losses of $19 million in 2021 and $33 million in 2020 pertaining to its industrial valve business in Germany, which was classified as held for sale during the fourth quarter of 2020.
The provision for income taxes for the years ended December 31 consists of: | | | | | | | | | | | | | | | | | | | | |
| (In thousands) | | 2021 | | 2020 | | 2019 |
| Current: | | | | | | |
| Federal | | $ | 57,910 | | | $ | 36,793 | | | $ | 14,195 | |
| State | | 15,477 | | | 11,882 | | | 3,766 | |
| Foreign | | 22,034 | | | 21,841 | | | 24,816 | |
| Total current | | 95,421 | | | 70,516 | | | 42,777 | |
| | | | | | |
| Deferred: | | | | | | |
| Federal | | (7,167) | | | 1,043 | | | 38,647 | |
| State | | (477) | | | (527) | | | 6,632 | |
| Foreign | | (426) | | | (9,373) | | | 823 | |
| Total deferred | | (8,070) | | | (8,857) | | | 46,102 | |
| Provision for income taxes | | $ | 87,351 | | | $ | 61,659 | | | $ | 88,879 | |
The effective tax rate varies from the U.S. federal statutory tax rate for the years ended December 31, principally: | | | | | | | | | | | | | | | | | | | | |
| | 2021 | | 2020 | | 2019 |
| U.S. federal statutory tax rate | | 21.0 | % | | 21.0 | % | | 21.0 | % |
| Add (deduct): | | | | | | |
| State and local taxes, net of federal benefit | | 3.6 | | | 3.7 | | | 2.4 | |
| Foreign asset impairment (held for sale) | | 1.6 | | | 1.2 | | | — | |
| Valuation allowance for foreign assets held for sale | | 0.2 | | | 1.3 | | | — | |
| R&D tax credits | | (1.3) | | | (0.9) | | | (1.2) | |
Foreign earnings(1) | | 0.2 | | | (0.9) | | | 1.4 | |
| Foreign-derived intangible income | | (1.4) | | | (2.8) | | | (1.3) | |
| All other, net | | 0.7 | | | 0.8 | | | 0.1 | |
| Effective tax rate | | 24.6 | % | | 23.4 | % | | 22.4 | % |
(1) Foreign earnings primarily include the net impact of differences between local statutory rates and the U.S. Federal statutory rate, the cost of repatriating foreign earnings, and the impact of changes to foreign valuation allowances, excluding items related to foreign assets classified as held for sale.
The components of the Corporation’s deferred tax assets and liabilities as of December 31 are as follows: | | | | | | | | | | | | | | |
| (In thousands) | | 2021 | | 2020 |
| Deferred tax assets: | | | | |
| Operating lease liabilities | | $ | 32,868 | | | $ | 33,371 | |
| Inventories, net | | 17,237 | | | 16,734 | |
| Net operating loss | | 5,384 | | | 5,518 | |
| Environmental reserves | | 9,262 | | | 8,698 | |
| Incentive compensation | | 6,936 | | | 8,102 | |
| Pension and other postretirement liabilities | | — | | | 13,533 | |
| Legal reserves | | 6,991 | | | — | |
| Other | | 32,665 | | | 33,401 | |
| Total deferred tax assets | | 111,343 | | | 119,357 | |
| Deferred tax liabilities: | | | | |
| Goodwill amortization | | 98,947 | | | 90,112 | |
| Operating lease right-of-use assets, net | | 30,911 | | | 31,292 | |
| Other intangible amortization | | 59,056 | | | 65,549 | |
| Depreciation | | 13,694 | | | 22,780 | |
| Withholding taxes | | 12,776 | | | 12,549 | |
| Pension and other postretirement assets | | 29,385 | | | — | |
| Other | | 7,149 | | | 8,757 | |
| Total deferred tax liabilities | | 251,918 | | | 231,039 | |
| Valuation allowance | | 2,625 | | | 1,240 | |
| Net deferred tax liabilities | | $ | 143,200 | | | $ | 112,922 | |
Deferred tax assets and liabilities are reflected on the Corporation’s consolidated balance sheet as of December 31 as follows: | | | | | | | | | | | | | | |
| (In thousands) | | 2021 | | 2020 |
| Net noncurrent deferred tax assets | | $ | 4,149 | | | $ | 2,085 | |
| Net noncurrent deferred tax liabilities | | 147,349 | | | 115,007 | |
| Net deferred tax liabilities | | $ | 143,200 | | | $ | 112,922 | |
The Corporation has income tax net operating loss carryforwards related to international operations of $6.1 million, of which $3.4 million have an indefinite life and $2.7 million which expire through 2028. The Corporation has federal and state income tax net loss carryforwards of $61.8 million, all of which are net operating losses that expire through 2040. The Corporation has recorded a deferred tax asset of $5.4 million, reflecting the benefit of the loss carryforwards related to international and domestic operations.
Management assesses the available positive and negative evidence to estimate if sufficient future taxable income will be generated to utilize the existing deferred tax assets. A significant piece of objective negative evidence evaluated was the cumulative loss incurred over the three-year period ended December 31, 2021 in certain of the Corporation’s foreign locations. Such objective evidence limits the ability to consider other subjective evidence, such as projections for future growth. As of December 31, 2021, the Corporation increased its valuation allowance by $1.4 million to $2.6 million, in order to measure only the portion of the deferred tax asset that more likely than not will be realized. The amount of the deferred tax asset considered realizable, however, could be adjusted if estimates of future taxable income during the carryforward period are reduced or if objective negative evidence in the form of cumulative losses is no longer present and additional weight may be given to subjective evidence such as projections for growth.
As of December 31, 2021, the Corporation recorded a deferred tax asset of $4.4 million on net operating losses of $14.7 million related to the held for sale industrial valve business in Germany. A provision of $0.7 million was recorded during the year ended December 31, 2021, resulting in a full valuation allowance against the deferred tax asset, as it is more likely than not that the losses will be forfeited.
Income tax payments, net of refunds, of $107.1 million, $54.0 million, and $63.9 million were made in 2021, 2020, and 2019, respectively.
The Corporation has recorded a liability in Other liabilities for interest of $3.9 million and penalties of $2.0 million as of December 31, 2021.
A reconciliation of the beginning and ending amount of unrecognized tax benefits is as follows: | | | | | | | | | | | | | | | | | | | | |
| (In thousands) | | 2021 | | 2020 | | 2019 |
| Balance as of January 1, | | $ | 15,585 | | | $ | 12,676 | | | $ | 13,563 | |
| Additions for tax positions of prior periods | | 2,877 | | | 1,497 | | | 581 | |
| Reductions for tax positions of prior periods | | (1,861) | | | (615) | | | (2,184) | |
| Additions for tax positions related to the current year | | 655 | | | 2,041 | | | 936 | |
| Settlements | | (238) | | | (14) | | | (220) | |
| Balance as of December 31, | | $ | 17,018 | | | $ | 15,585 | | | $ | 12,676 | |
In many cases, the Corporation’s uncertain tax positions are related to tax years that remain subject to examination by tax authorities.
The following describes the open tax years, by major tax jurisdiction, as of December 31, 2021: | | | | | | | | | | | |
| United States (Federal) | 2018 | - | present |
| United States (Various states) | 2010 | - | present |
| United Kingdom | 2020 | - | present |
| Canada | 2018 | - | present |
The Corporation does not expect any significant changes to the estimated amount of liability associated with its uncertain tax positions through the next twelve months. Included in total unrecognized tax benefits as of December 31, 2021, 2020, and 2019 is $14.1 million, $13.0 million, and $10.2 million, respectively, which if recognized, would favorably impact the effective income tax rate.
14. DEBT
Debt consists of the following as of December 31: | | | | | | | | | | | | | | | | | | | | | | | | | | |
| (In thousands) | | 2021 | | 2021 | | 2020 | | 2020 |
| | Carrying Value | | Estimated Fair Value | | Carrying Value | | Estimated Fair Value |
| Revolving credit agreement, due 2023 | | $ | 93,900 | | | $ | 93,900 | | | $ | — | | | $ | — | |
3.84% Senior notes due 2021 | | — | | | — | | | 100,000 | | | 102,173 | |
3.70% Senior notes due 2023 | | 202,500 | | | 208,086 | | | 202,500 | | | 211,790 | |
3.85% Senior notes due 2025 | | 90,000 | | | 95,246 | | | 90,000 | | | 97,429 | |
4.24% Senior notes due 2026 | | 200,000 | | | 218,421 | | | 200,000 | | | 224,390 | |
4.05% Senior notes due 2028 | | 67,500 | | | 73,783 | | | 67,500 | | | 75,440 | |
4.11% Senior notes due 2028 | | 90,000 | | | 98,854 | | | 90,000 | | | 101,047 | |
3.10% Senior notes due 2030 | | 150,000 | | | 154,832 | | | 150,000 | | | 155,805 | |
3.20% Senior notes due 2032 | | 150,000 | | | 154,875 | | | 150,000 | | | 155,048 | |
| Total debt | | 1,043,900 | | | 1,097,997 | | | 1,050,000 | | | 1,123,122 | |
| Debt issuance costs, net | | (949) | | | (949) | | | (1,147) | | | (1,147) | |
Unamortized interest rate swap proceeds (1) | | 7,659 | | | 7,659 | | | 9,439 | | | 9,439 | |
| Total debt, net | | 1,050,610 | | | 1,104,707 | | | 1,058,292 | | | 1,131,414 | |
| Less: current portion of long-term debt | | — | | | — | | | 100,000 | | | 100,000 | |
| Total long-term debt | | $ | 1,050,610 | | | $ | 1,104,707 | | | $ | 958,292 | | | $ | 1,031,414 | |
(1) Represents the gain from termination of the Corporation's interest rate swap agreements on its 3.85% and 4.24% Senior Notes in February 2016, which will be amortized into interest expense over the remaining terms of the respective notes.
The weighted-average interest rate of the Corporation's Revolving Credit Agreement in 2021 and 2020 was 1.0% and 1.4%, respectively.
The Corporation's total debt outstanding had a weighted-average interest rate of 3.4% in both 2021 and 2020.
Aggregate maturities of debt are as follows: | | | | | |
| (In thousands) | |
| 2022 | $ | — | |
| 2023 | 296,400 | |
| 2024 | — | |
| 2025 | 90,000 | |
| 2026 | 200,000 | |
| Thereafter | 457,500 | |
| Total | $ | 1,043,900 | |
Interest payments of $40 million, $31 million, and $30 million were made in 2021, 2020, and 2019, respectively.
Revolving Credit Agreement
In October 2018, the Corporation amended the terms of its existing Credit Agreement (Credit Agreement) with a syndicate of financial institutions, led by Bank of America N.A., Wells Fargo, N.A., and JP Morgan Chase Bank, N.A.. The amended agreement, which provides the Corporation with a borrowing capacity of $500 million, extended the maturity date from November 2019 to October 2023 and expanded the accordion feature from $100 million to $200 million. The proceeds available under the Credit Agreement are to be used for working capital, internal growth initiatives, funding of future acquisitions, and general corporate purposes. As of December 31, 2021, the Corporation had $21 million in letters of credit supported by the credit facility and $94 million borrowings outstanding under the credit facility. The unused credit available under the credit facility as of December 31, 2021 was $385 million, which the Corporation had the ability to borrow in full without violating its debt to capitalization covenant.
The Credit Agreement contains covenants that the Corporation considers usual and customary for an agreement of this type for comparable commercial borrowers, including a maximum consolidated debt to capitalization ratio of 60%. The Credit Agreement has customary events of default, such as non-payment of principal when due; nonpayment of interest, fees, or other amounts; cross-payment default and cross-acceleration.
Borrowings under the credit agreement accrue interest based on (i) Libor or (ii) a base rate of the highest of (a) the federal funds rate plus 0.5%, (b) BofA’s announced prime rate, or (c) the Eurocurrency rate plus 1%, plus a margin. The interest rate and level of facility fees are dependent on certain financial ratios, as defined in the Credit Agreement. The Credit Agreement also provides customary fees, including administrative agent and commitment fees. In connection with the Credit Agreement, the Corporation paid customary transaction fees that have been deferred and are being amortized over the term of the Credit Agreement.
Senior Notes
On August 13, 2020, the Corporation issued $300 million of Senior Notes (the “2020 Notes”), consisting of $150 million of 3.10% Senior Notes that mature on August 13, 2030 and $150 million of 3.20% Senior Notes that mature on August 13, 2032. The 2020 Notes are senior unsecured obligations, equal in right of payment to the Corporation’s existing senior indebtedness. The Corporation, at its option, can prepay at any time all or any part of the 2020 Notes, subject to a make-whole payment in accordance with the terms of the Note Purchase Agreement. In connection with the issuance of the 2020 Notes, the Corporation paid customary fees that have been deferred and are being amortized over the term of the 2020 Notes. Under the terms of the Note Purchase Agreements, the Corporation is required to maintain certain financial ratios, the most restrictive of which are a debt to capitalization limit of 60% and an interest coverage ratio of less than 3 to 1. The debt to capitalization ratio (as defined per the Notes Purchase Agreement and Credit Agreement) is calculated using the same formula for all of the Corporation’s debt agreements and is a measure of the Corporation’s indebtedness to capitalization, where capitalization equals debt plus equity. The 2020 Notes also contain a cross default provision with respect to the Corporation’s other senior indebtedness.
On February 26, 2013, the Corporation issued $500 million of Senior Notes (the “2013 Notes”). The 2013 Notes consisted of $225 million of 3.70% Senior Notes that mature on February 26, 2023, $100 million of 3.85% Senior Notes that mature on February 26, 2025, and $75 million of 4.05% Senior Notes that mature on February 26, 2028. $100 million of additional 4.11% Senior Notes were deferred and subsequently issued on September 26, 2013 that mature on September 26, 2028. On October 15, 2018, the Corporation made a discretionary $50 million prepayment on the $500 million 2013 Notes. The 2013 Notes are senior unsecured obligations, equal in right of payment to the Corporation’s existing senior indebtedness. The Corporation, at its option, can prepay at any time all or any part of the 2013 Notes, subject to a make-whole payment in
accordance with the terms of the Note Purchase Agreement. In connection with the issuance of the 2013 Notes, the Corporation paid customary fees that have been deferred and are being amortized over the term of the 2013 Notes. The 2013 Notes also contain a cross default provision with respect to the Corporation’s other senior indebtedness.
On December 8, 2011, the Corporation issued $300 million of Senior Notes (the “2011 Notes”). The 2011 Notes consist of $100 million of 3.84% Senior Notes that matured on December 1, 2021 and $200 million of 4.24% Senior Series Notes that mature on December 1, 2026. The 2011 Notes are senior unsecured obligations, equal in right of payment to our existing senior indebtedness. The Corporation, at its option, can prepay at any time all or any part of our 2011 Notes, subject to a make-whole payment in accordance with the terms of the Note Purchase Agreement. In connection with the 2011 Notes, the Corporation paid customary fees that have been deferred and are being amortized over the term of the 2011 Notes. Under the Note Purchase Agreement, the Corporation is required to maintain certain financial ratios, the most restrictive of which is a debt to capitalization limit of 60%. The 2011 Notes also contain a cross default provision with our other senior indebtedness.
As of December 31, 2021, the Corporation had the ability to borrow additional debt of $1.6 billion without violating our debt to capitalization covenant.
15. EARNINGS PER SHARE
The Corporation is required to report both basic earnings per share (EPS), based on the weighted-average number of common shares outstanding, and diluted earnings per share, based on the basic EPS adjusted for all potentially dilutive shares issuable.
As of December 31, 2021, 2020 and 2019, there were no anti-dilutive equity-based awards excluded from the calculation of diluted earnings per share.
Earnings per share calculations for the years ended December 31, 2021, 2020, and 2019, were as follows: | | | | | | | | | | | | | | | | | | | | |
| (In thousands, except per share data) | | Net Earnings | | Weighted-
Average Shares
Outstanding | | Earnings per Share |
| 2021 | | | | | | |
| Basic earnings per share | | $ | 267,159 | | | 40,417 | | | $ | 6.61 | |
| Dilutive effect of deferred stock compensation | | | | 185 | | | |
| Diluted earnings per share | | $ | 267,159 | | | 40,602 | | | $ | 6.58 | |
| 2020 | | | | | | |
| Basic earnings per share | | $ | 201,392 | | | 41,738 | | | $ | 4.83 | |
| Dilutive effect of stock options and deferred stock compensation | | | | 261 | | | |
| Diluted earnings per share | | $ | 201,392 | | | 41,999 | | | $ | 4.80 | |
| 2019 | | | | | | |
| Basic earnings per share | | $ | 307,583 | | | 42,739 | | | $ | 7.20 | |
| Dilutive effect of stock options and deferred stock compensation | | | | 277 | | | |
| Diluted earnings per share | | $ | 307,583 | | | 43,016 | | | $ | 7.15 | |
16. SHARE-BASED COMPENSATION PLANS
In May 2014, the Corporation adopted the Curtiss-Wright 2014 Omnibus Incentive Plan (the “2014 Omnibus Plan”). The plan replaced the Corporation's existing 2005 Long Term Incentive Plan and the 2005 Stock Plan for Non-Employee Directors (collectively the “2005 Stock Plans”). Beginning in May 2014, all awards were granted under the 2014 Omnibus Plan. The maximum aggregate number of shares of common stock that may be issued under the 2014 Omnibus Plan are 2,400,000 less one share of common stock for every one share of common stock granted under any prior plan after December 31, 2013 and prior to the effective date of the 2014 Omnibus Plan. In addition, any awards that were previously granted under any prior plan that terminate without issuance of shares shall be eligible for issuance under the 2014 Omnibus Plan. Awards under the 2014 Omnibus Plan may be in the form of stock options, stock appreciation rights, restricted stock units (RSU), other stock-based awards, performance share units (PSU), or cash-based performance units (PU).
During 2021, the Corporation granted share-based awards in the form of RSUs and PSUs. Previous grants under the 2005 Stock Plans included non-qualified stock options. Under our employee benefit program, the Corporation also provides an Employee
Stock Purchase Plan (ESPP) to most active employees. Certain awards provide for accelerated vesting if there is a change in control.
The compensation cost for employee and non-employee director share-based compensation programs during 2021, 2020, and 2019 is as follows: | | | | | | | | | | | | | | | | | | | | |
| (In thousands) | | 2021 | | 2020 | | 2019 |
| Employee Stock Purchase Plan | | $ | 1,710 | | | $ | 1,625 | | | $ | 1,585 | |
| Performance Share Units | | 4,850 | | | 4,909 | | | 4,853 | |
| Restricted Share Units | | 5,661 | | | 6,978 | | | 6,061 | |
| Other share-based payments | | 1,229 | | | 925 | | | 1,170 | |
| Total share-based compensation expense before income taxes | | $ | 13,450 | | | $ | 14,437 | | | $ | 13,669 | |
Other share-based grants include service-based restricted stock awards to non-employee directors, who are treated as employees as prescribed by the accounting guidance on share-based payments. The compensation cost recognized follows the cost of the employee, which is primarily reflected as general and administrative expense in the Consolidated Statement of Earnings. No share-based compensation costs were capitalized during 2021, 2020, or 2019.
The following table summarizes the cash received from share-based awards on share-based compensation: | | | | | | | | | | | | | | | | | | | | |
| (In thousands) | | 2021 | | 2020 | | 2019 |
| Cash received from share-based awards | | $ | 9,705 | | | $ | 11,148 | | | $ | 11,770 | |
Stock Options
As of December 31, 2021, the Corporation's did not have any stock options outstanding. The total intrinsic value of stock options exercised during 2020 and 2019 was $5.2 million, and $8.7 million, respectively.
Performance Share Units
The Corporation has granted performance share units to certain employees, whose three year cliff vesting is contingent upon the Corporation's total shareholder return over the three-year term beginning at the start of the fiscal year following the date of grant. Performance is measured by determining the percentile rank of the total shareholder return of the Corporation's common stock in relation to the total shareholder return of the S&P Midcap 400 Index (for awards granted in 2020 through 2021) or compared to a self-constructed peer group (for awards granted in 2019). The non-vested shares are subject to forfeiture if established performance goals are not met or employment is terminated other than due to death, disability, or retirement. Share plans are denominated in share-based units based on the fair market value of the Corporation’s common stock on the date of grant. The performance share unit’s compensation cost is amortized to expense on a straight-line basis over the three-year requisite service period.
Restricted Share Units
Restricted share units cliff vest at the end of the awards’ vesting period. The restricted share units are service-based and thus compensation cost is amortized to expense on a straight-line basis over the requisite service period, which is typically three years. The non-vested restricted units are subject to forfeiture if employment is terminated other than due to death, disability, or retirement.
A summary of the Corporation’s 2021 activity related to performance share units and restricted share units are as follows: | | | | | | | | | | | | | | | | | | | | | | | | | | |
| | Performance Share Units (PSUs) | | Restricted Share Units (RSUs) |
| | Shares/Units
(000’s) | | Weighted-
Average
Fair Value | | Shares/Units
(000’s) | | Weighted-
Average
Fair Value |
| Nonvested as of December 31, 2020 | 107 | | | $ | 138.37 | | | 227 | | | $ | 97.24 | |
| Granted | | 34 | | | 150.23 | | | 74 | | | 123.34 | |
| Vested | | (27) | | | 197.19 | | | (72) | | | 95.13 | |
| Forfeited | | (1) | | | 103.86 | | | (6) | | | 105.70 | |
| Nonvested as of December 31, 2021 | 113 | | | $ | 128.05 | | | 223 | | | $ | 106.34 | |
| Expected to vest as of December 31, 2021 | 113 | | | $ | 128.05 | | | 223 | | | $ | 106.34 | |
Nonvested PSUs had an intrinsic value of $15.7 million and unrecognized compensation costs of $5.0 million as of December 31, 2021. Nonvested RSUs had an intrinsic value of $31.0 million and unrecognized compensation costs of $10.7 million as of December 31, 2021. Unrecognized compensation costs related to PSUs and RSUs are expected to be recognized over 1.7 years and 2.6 years, respectively.
Employee Stock Purchase Plan
The Corporation’s ESPP enables eligible employees to purchase the Corporation’s common stock at a price per share equal to 85% of the fair market value at the end of each offering period. Each offering period of the ESPP lasts six months, commencing on January 1st and July 1st of each year. Compensation cost is recognized on a straight-line basis over the six-month vesting period during which employees perform related services.
17. PENSION AND OTHER POSTRETIREMENT BENEFIT PLANS
The Corporation maintains ten separate and distinct pension and other post-retirement defined benefit plans, consisting of three domestic plans and seven separate foreign pension plans. The domestic plans include a qualified pension plan, a non-qualified pension plan, and a postretirement health-benefits plan. The foreign plans consist of one defined benefit pension plan each in the United Kingdom, Canada, and Switzerland, two in Germany, and two in Mexico.
Domestic Plans
Qualified Pension Plan
The Corporation maintains a defined benefit pension plan (the “CW Pension Plan”) covering certain employee populations under six benefit formulas: a non-contributory non-union and union formula for certain Curtiss-Wright (CW) employees, a contributory union and non-union benefit formula for employees at the EMD business unit, and two benefit formulas providing annuity benefits for participants in the former Williams Controls salaried and union plans.
CW non-union employees hired prior to February 1, 2010 receive a “traditional” benefit based on years of credited service, using the five highest consecutive years’ compensation during the last ten years of service. These employees became participants under the CW Pension Plan after one year of service and were vested after three years of service. CW non-union employees hired on or after the effective date were eligible for a cash balance benefit through December 31, 2013, and were transitioned to the new defined contribution plan, further described below. CW union employees who have negotiated a benefit under the CW Pension Plan are entitled to a benefit based on years of service multiplied by a monthly pension rate.
The formula for EMD employees covers both union and non-union employees and is designed to satisfy the requirements of relevant collective bargaining agreements. Employee contributions are withheld each pay period and are equal to 1.5% of salary. The benefits for the EMD employees are based on years of service and compensation. On December 31, 2012, the Corporation amended the CW Pension Plan to close the benefit to EMD employees hired after January 1, 2014.
Participants of the former Williams Controls Retirement Income Plan for salaried employees are either deferred vested participants or currently receiving benefits, as benefit accruals under the plan were frozen to future accruals effective January 1, 2003. Benefits in the salaried plan are based on average compensation and years of service.
Participants of the former Williams Controls UAW Local 492 Plan for union employees are entitled to a benefit based on years of service multiplied by a monthly pension rate, and may be eligible for supplemental benefits based upon attainment of certain age and service requirements.
Effective January 1, 2014, all active non-union employees participating in the final and career average pay formulas in the defined benefit plan will cease accruals 15 years from the effective date of the amendment. In addition to the sunset provision, cash balance benefit accruals for non-union participants ceased as of January 1, 2014. Non-union employees who were not currently receiving final or career average pay benefits became eligible to participate in a new defined contribution plan which provides both employer match and non-elective contribution components. Subsequent to the original amendment, the Corporation successfully negotiated the sunset provision into the bargaining agreements for all represented employees that received benefits through this plan.
As of December 31, 2021, and 2020, the Corporation had a noncurrent pension asset of $233.8 million and $80.8 million, respectively. The change in balance was primarily due to a higher return on plan assets during 2021.
Nonqualified Pension Plan
The Corporation also maintains a non-qualified restoration plan (the “CW Restoration Plan”) covering those employees of CW and EMD whose compensation or benefits exceed the IRS limitation for pension benefits. Benefits under the CW Restoration Plan are not funded, and, as such, the Corporation had an accrued pension liability of $69.1 million and $71.8 million as of December 31, 2021 and 2020, respectively. The Corporation’s contributions to the CW Restoration Plan are expected to be $5.9 million in 2022.
Other Post-Employment Benefits (OPEB) Plan
The Corporation provides post-employment benefits consisting of retiree health and life insurance to three distinct groups of employees/retirees: the CW Grandfathered plan, and plans assumed in the acquisitions of EMD and Williams Controls.
The Corporation also provides retiree health and life insurance benefits for substantially all Curtiss-Wright EMD employees. The plan provides basic health and welfare coverage for pre-65 participants based on years of service and are subject to certain caps. Effective January 1, 2011, the Corporation modified the benefit design for post-65 retirees by introducing Retiree Reimbursement Accounts (RRAs) to participants in lieu of the traditional benefit delivery. Participant accounts are funded a set amount annually that can be used to purchase supplemental coverage on the open market, effectively capping the benefit.
The plan also provides retiree health and life insurance benefits for certain retirees of the Williams Controls salaried and union pension plans. Effective August 31, 2013, the Corporation modified the benefit design for post-65 retirees by introducing RRAs to align with the EMD delivery model.
The Corporation had an accrued postretirement benefit liability as of December 31, 2021 and 2020 of $25.2 million and $25.7 million, respectively. The Corporation expects to contribute $2.1 million to the plan during 2022.
Foreign Plans
As of December 31, 2021 and 2020, the total projected benefit obligation related to all foreign plans was $107.2 million and $115.5 million, respectively. As of December 31, 2021 the Corporation had a net pension asset of $12.9 million. As of December 31, 2020, the Corporation had a net pension liability of $2.6 million. The Corporation's contributions to the foreign plans are expected to be $2.4 million in 2022.
Components of net periodic benefit expense
The net pension and net postretirement benefit costs consisted of the following: | | | | | | | | | | | | | | | | | | | | | | | | | | | | | | | | | | | | | | |
| | Pension Benefits | | Postretirement Benefits |
| (In thousands) | | 2021 | | 2020 | | 2019 | | 2021 | | 2020 | | 2019 |
| Service cost | | $ | 26,735 | | | $ | 26,013 | | | $ | 23,664 | | | $ | 472 | | | $ | 506 | | | $ | 432 | |
| Interest cost | | 17,419 | | | 23,847 | | | 29,019 | | | 426 | | | 609 | | | 796 | |
| Expected return on plan assets | | (60,286) | | | (67,217) | | | (59,153) | | | — | | | — | | | — | |
| Amortization of prior service cost | | (251) | | | (269) | | | (283) | | | (304) | | | (657) | | | (656) | |
| Recognized net actuarial loss/(gain) | | 28,905 | | | 23,062 | | | 9,310 | | | — | | | (5) | | | (198) | |
| Special termination benefits | | 52 | | | — | | | — | | | 367 | | | — | | | — | |
| Cost of settlements/curtailments | | 3,310 | | | 2,395 | | | — | | | — | | | — | | | — | |
| Net periodic benefit cost | | $ | 15,884 | | | $ | 7,831 | | | $ | 2,557 | | | $ | 961 | | | $ | 453 | | | $ | 374 | |
The cost of settlements/curtailments indicated above represents events that are accounted for under guidance on employers’ accounting for settlements and curtailments of defined benefit pension plans. In 2021, special termination benefits were recognized as a result of early retirement benefits offered to employees in the US and Switzerland. In addition, the Company recognized settlement charges in 2021 related to the retirement of former executives. In 2020, settlement charges were incurred in Mexico and Switzerland. In addition, a curtailment was recognized in Mexico in 2020 as a result of the Corporation's restructuring initiatives.
The following table outlines the Corporation's consolidated disclosure of the pension benefits and postretirement benefits information described previously. The Corporation had no foreign postretirement plans. All plans were valued using a December 31, 2021 measurement date. | | | | | | | | | | | | | | | | | | | | | | | | | | |
| | Pension Benefits | | Postretirement Benefits |
| (In thousands) | | 2021 | | 2020 | | 2021 | | 2020 |
| Change in benefit obligation: | | | | | | | | |
| Beginning of year | | $ | 1,044,035 | | | $ | 945,187 | | | $ | 25,670 | | | $ | 23,566 | |
| Service cost | | 26,735 | | | 26,013 | | | 472 | | | 506 | |
| Interest cost | | 17,419 | | | 23,847 | | | 426 | | | 609 | |
| Plan participants’ contributions | | 1,304 | | | 1,366 | | | 294 | | | 331 | |
| Amendments | | (477) | | | — | | | 309 | | | — | |
| Actuarial (gain) loss | | (37,825) | | | 92,596 | | | (41) | | | 3,048 | |
| Benefits paid | | (68,965) | | | (46,607) | | | (2,303) | | | (2,390) | |
| Special Termination Benefits | | 52 | | | — | | | 367 | | | — | |
| Actual expenses | | (1,491) | | | (1,526) | | | — | | | — | |
| Curtailments | | — | | | 1,636 | | | — | | | — | |
| Settlements | | — | | | (3,867) | | | — | | | — | |
| Currency translation adjustments | | (1,717) | | | 5,390 | | | — | | | — | |
| End of year | | $ | 979,070 | | | $ | 1,044,035 | | | $ | 25,194 | | | $ | 25,670 | |
| | | | | | | | | | | | | | | | | | | | | | | | | | |
| Change in plan assets: | | | | | | | | |
| Beginning of year | | $ | 1,050,509 | | | $ | 835,139 | | | $ | — | | | $ | — | |
| Actual return on plan assets | | 163,881 | | | 105,810 | | | — | | | — | |
| Employer contribution | | 12,766 | | | 155,359 | | | 2,009 | | | 2,059 | |
| Plan participants’ contributions | | 1,304 | | | 1,366 | | | 294 | | | 331 | |
| Benefits paid | | (68,965) | | | (46,607) | | | (2,303) | | | (2,390) | |
| Actual expenses | | (1,491) | | | (1,526) | | | — | | | — | |
| Settlements | | — | | | (3,867) | | | — | | | — | |
| Currency translation adjustments | | (1,388) | | | 4,835 | | | — | | | — | |
| End of year | | $ | 1,156,616 | | | $ | 1,050,509 | | | $ | — | | | $ | — | |
| | | | | | | | |
| Funded status | | $ | 177,546 | | | $ | 6,474 | | | $ | (25,194) | | | $ | (25,670) | |
| | | | | | | | | | | | | | | | | | | | | | | | | | |
| | Pension Benefits | | Postretirement Benefits |
| (In thousands) | | 2021 | | 2020 | | 2021 | | 2020 |
| Amounts recognized on the balance sheet | | | | | | | | |
| Noncurrent assets | | $ | 256,422 | | | $ | 92,554 | | | $ | — | | | $ | — | |
| Current liabilities | | (6,257) | | | (6,444) | | | (2,076) | | | (1,596) | |
Noncurrent liabilities(1) | | (72,619) | | | (79,636) | | | (23,118) | | | (24,074) | |
| Total | | $ | 177,546 | | | $ | 6,474 | | | $ | (25,194) | | | $ | (25,670) | |
| Amounts recognized in accumulated other comprehensive income (AOCI) | | | | | | | | |
| Net actuarial loss (gain) | | $ | 120,676 | | | $ | 294,545 | | | $ | 584 | | | $ | 624 | |
| Prior service cost | | (544) | | | (321) | | | (135) | | | (747) | |
| Total | | $ | 120,132 | | | $ | 294,224 | | | $ | 449 | | | $ | (123) | |
| Information for plans with an accumulated benefit obligation in excess of plan assets: | | | | | | | | |
| Projected benefit obligation | | $ | 101,667 | | | $ | 114,297 | | | $ | 25,193 | | | N/A |
| Accumulated benefit obligation | | 95,755 | | | 111,807 | | | 25,193 | | | N/A |
| Fair value of plan assets | | 22,792 | | | 28,217 | | | — | | | N/A |
(1) As of December 31, 2021 and 2020, this caption includes accrued pension and other postretirement benefit costs of $4.4 million and $5.4 million, respectively, reflected in the "Liabilities held for sale" caption within the Consolidated Balance Sheet.
Plan Assumptions | | | | | | | | | | | | | | | | | | | | | | | | | | |
| | Pension Benefits | | Postretirement Benefits |
| | 2021 | | 2020 | | 2021 | | 2020 |
| Weighted-average assumptions in determination of benefit obligation: | | | | | | | | |
| Discount rate | | 2.72 | % | | 2.36 | % | | 2.79 | % | | 2.43 | % |
| Rate of compensation increase | | 3.40 | % | | 3.41 | % | | N/A | | N/A |
| Health care cost trends: | | | | | | | | |
| Rate assumed for subsequent year | | N/A | | N/A | | 7.00 | % | | 7.25 | % |
Ultimate rate reached in 2032 | | N/A | | N/A | | 4.50 | % | | 4.50 | % |
| Weighted-average assumptions in determination of net periodic benefit cost: | | | | | | | | |
| Discount rate | | 2.36 | % | | 3.05 | % | | 2.43 | % | | 3.15 | % |
| Expected return on plan assets | | 6.18 | % | | 7.11 | % | | N/A | | N/A |
| Rate of compensation increase | | 3.41 | % | | 3.46 | % | | N/A | | N/A |
| Health care cost trends: | | | | | | | | |
| Rate assumed for subsequent year | | N/A | | N/A | | 7.25 | % | | 7.50 | % |
Ultimate rate reached in 2032 | | N/A | | N/A | | 4.50 | % | | 4.50 | % |
The Corporation applies the spot rate, or full yield curve, approach for developing discount rates. The discount rate for each plan's past service liabilities and service cost is determined by discounting the plan’s expected future benefit payments using a yield curve developed from high quality bonds that are rated Aa or better by Moody’s as of the measurement date. The yield curve calculation matches the notional cash inflows of the hypothetical bond portfolio with the expected benefit payments to arrive at one effective rate for these components. Interest cost is determined by applying the spot rate from the full yield curve to each anticipated benefit payment, based on the anticipated optional form elections.
The overall expected return on assets assumption is based on a combination of historical performance of the pension fund and expectations of future performance. Expected future performance is determined by weighting the expected returns for each asset class by the plan’s asset allocation. The expected returns are based on long-term capital market assumptions utilizing a ten-year time horizon through consultation with investment advisors. While consideration is given to recent performance and historical returns, the assumption represents a long-term prospective return.
Pension Plan Assets
The overall objective for plan assets is to earn a rate of return over time to meet anticipated benefit payments in accordance with plan provisions. The long-term investment objective of the domestic retirement plans is to achieve a total rate of return, net of fees, which exceeds the actuarial overall expected return on asset assumptions used for funding purposes and which provides an appropriate premium over inflation. The intermediate-term objective of the domestic retirement plans, defined as three to five years, is to outperform each of the capital markets in which assets are invested, net of fees. During periods of extreme market volatility, preservation of capital takes a higher precedence than outperforming the capital markets.
The Finance Committee of the Corporation’s Board of Directors is responsible for formulating investment policies, developing investment manager guidelines and objectives, and approving and managing qualified advisors and investment managers. The guidelines established define permitted investments within each asset class and apply certain restrictions such as limits on concentrated holdings, and prohibits selling securities short, buying on margin, and the purchase of any securities issued by the Corporation.
The Corporation maintains the funds of the CW Pension Plan under a trust that is diversified across investment classes and among investment managers to achieve an optimal balance between risk and return. As a part of its diversification strategy, the Corporation has established target allocations for each of the following assets classes: domestic equity securities, international equity securities, and debt securities. Below are the Corporation’s actual and established target allocations for the CW Pension Plan, representing 90% of consolidated assets: | | | | | | | | | | | | | | | | | | | | | | | | | | |
| | As of December 31, | | Target | | Expected |
| | 2021 | | 2020 | | Exposure | | Range |
| Asset class | | | | | | | | |
| Domestic equities | | 56% | | 54% | | 50% | | 40%-60% |
| International equities | | 15% | | 15% | | 15% | | 10%-20% |
| Total equity | | 71% | | 69% | | 65% | | 55%-75% |
| Fixed income | | 29% | | 31% | | 35% | | 25%-45% |
As of December 31, 2021 and 2020, cash funds in the CW Pension Plan represented approximately 3% and 2% of portfolio assets, respectively.
Foreign plan assets represent 10% of consolidated plan assets, with most of the assets supporting the U.K. plan. Generally, the foreign plans follow a similar asset allocation strategy and are more heavily weighted in fixed income resulting in a weighted expected return on assets assumption of 3% for all foreign plans.
The Corporation may from time to time require the reallocation of assets in order to bring the retirement plans into conformity with these ranges. The Corporation may also authorize alterations or deviations from these ranges where appropriate for achieving the objectives of the retirement plans.
Fair Value Measurements
The following table presents consolidated plan assets (in thousands) using the fair value hierarchy as of December 31, 2021. | | | | | | | | | | | | | | | | | | | | | | | | | | |
| Asset Category | | Total | | Quoted Prices
in Active
Markets for
Identical
Assets
(Level 1) | | Significant
Observable
Inputs
(Level 2) | | Significant
Unobservable
Inputs
(Level 3) |
| Cash and cash equivalents | | $ | 16,710 | | | $ | 1,376 | | | $ | 15,334 | | | $ | — | |
Equity securities- Mutual funds (1) | | 688,257 | | | 570,293 | | | 117,964 | | | — | |
Bond funds (2) | | 341,140 | | | 242,627 | | | 98,513 | | | — | |
Other (3) | | 4,402 | | | — | | | — | | | 4,402 | |
| December 31, 2020 | | $ | 1,050,509 | | | $ | 814,296 | | | $ | 231,811 | | | $ | 4,402 | |
| Cash and cash equivalents | | $ | 36,788 | | | $ | 3,632 | | | $ | 33,156 | | | $ | — | |
Equity securities - Mutual funds (1) | | 771,655 | | | 655,995 | | | 115,660 | | | — | |
Bond funds (2) | | 343,630 | | | 229,973 | | | 113,657 | | | — | |
Other (3) | | 4,543 | | | — | | | — | | | 4,543 | |
| December 31, 2021 | | $ | 1,156,616 | | | $ | 889,600 | | | $ | 262,473 | | | $ | 4,543 | |
(1)This category consists of domestic and international equity securities. It is comprised of U.S. securities benchmarked against the S&P 500 index and Russell 2000 index, international mutual funds benchmarked against the MSCI EAFE index, global equity index mutual funds associated with our U.K. based pension plans and balanced funds associated with the U.K. and Canadian based pension plans.
(2)This category consists of domestic and international bonds. The domestic fixed income securities are benchmarked against the Bloomberg Barclays Capital Aggregate Bond index, actively-managed bond mutual funds comprised of domestic investment grade debt, fixed income derivatives, and below investment-grade issues, U.S. mortgage backed securities, asset backed securities, municipal bonds, and convertible debt. International bonds consist of bond mutual funds for institutional investors associated with the CW Pension Plan, Switzerland, and U.K. based pension plans.
(3)This category consists primarily of real estate investment trusts in Switzerland.
Valuation
Equity securities and exchange-traded equity and bond mutual funds are valued using a market approach based on the quoted market prices of identical instruments. Pooled institutional funds are valued at their net asset values and are calculated by the sponsor of the fund.
Fixed income securities are primarily valued using a market approach utilizing various underlying pricing sources and methodologies. Real estate investment trusts are priced at net asset value based on valuations of the underlying real estate holdings using inputs such as discounted cash flows, independent appraisals, and market-based comparable data.
Cash balances in the United States are held in a pooled fund and classified as a Level 2 asset. Non-U.S. cash is valued using a market approach based on quoted market prices of identical instruments.
The following table presents a reconciliation of Level 3 assets held during the years ended December 31, 2021 and 2020: | | | | | | | | | | | | | | | | | | | | | | | | | | |
| (In thousands) | | Insurance
Contracts | | Real
Estate | | Other | | Total |
| December 31, 2019 | | $ | — | | | $ | 4,224 | | | $ | — | | | $ | 4,224 | |
| Actual return on plan assets: | | | | | | | | |
| Relating to assets still held at the reporting date | | 5 | | | (20) | | | — | | | (15) | |
| Relating to assets sold during the period | | — | | | (58) | | | — | | | (58) | |
| Purchases, sales, and settlements | | 523 | | | (680) | | | — | | | (157) | |
| Foreign currency translation adjustment | | 49 | | | 359 | | | — | | | 408 | |
| December 31, 2020 | | 577 | | | 3,825 | | | — | | | 4,402 | |
| Actual return on plan assets: | | | | | | | | |
| Relating to assets still held at the reporting date | | — | | | 125 | | | 16 | | | 141 | |
| Relating to assets sold during the period | | 32 | | | — | | | — | | | 32 | |
| Purchases, sales, and settlements | | (592) | | | 226 | | | 464 | | | 98 | |
| Foreign currency translation adjustment | | (17) | | | (102) | | | (11) | | | (130) | |
| December 31, 2021 | | — | | | 4,074 | | | 469 | | | 4,543 | |
Benefit Payments
The following benefit payments, which reflect expected future service, as appropriate, are expected to be paid from the plans: | | | | | | | | | | | | | | | | | | | | |
| (In thousands) | | Pension
Plans | | Postretirement
Plans | | Total |
| 2022 | | $ | 55,062 | | | $ | 2,076 | | | $ | 57,138 | |
| 2023 | | 55,349 | | | 1,699 | | | 57,048 | |
| 2024 | | 60,035 | | | 1,645 | | | 61,680 | |
| 2025 | | 55,531 | | | 1,602 | | | 57,133 | |
| 2026 | | 56,269 | | | 1,532 | | | 57,801 | |
| 2027 — 2031 | | 285,666 | | | 7,065 | | | 292,731 | |
Defined Contribution Retirement Plans
The Corporation offers all of its full-time domestic employees the opportunity to participate in a defined contribution plan. Effective January 1, 2014, all non-union employees who were not currently receiving final or career average pay benefits became eligible to receive employer contributions in the Corporation's sponsored 401(k) plan. The employer contributions include both employer match and non-elective contribution components, up to a maximum employer contribution of 7% of eligible compensation. During the year ended December 31, 2021, the expense relating to the plan was $18.7 million, consisting of $10.0 million in matching contributions to the plan in 2021, and $8.7 million in non-elective contributions, primarily paid in January 2022. Cumulative contributions of approximately $100 million are expected to be made from 2022 through 2026.
In addition, the Corporation had foreign pension costs under various defined contribution plans of $5.4 million in 2021, and $5.3 million in both 2020 and 2019.
18. SEGMENT INFORMATION
Prior to the first quarter of 2021, the Corporation reported its results of operations through three reportable segments: Commercial/Industrial, Defense, and Power. On January 1, 2021, the Corporation implemented an organizational change to simplify its reportable segments and align its product sales with its end market structure. As a result, the Corporation now reports its results of operations through the following reportable segments: Aerospace & Industrial, Defense Electronics, and Naval & Power. While this organizational change resulted in the recasting of previously reported amounts across all reportable segments, it did not impact the Corporation’s previously reported consolidated financial statements.
The Aerospace & Industrial reportable segment is comprised of businesses that provide a diversified offering of highly engineered products and services supporting critical applications primarily across the commercial aerospace and general industrial markets. The products offered include electronic throttle control devices and transmission shifters, electro-mechanical actuation control components, and surface technology services such as shot peening, laser peening and engineered coatings.
The Defense Electronics reportable segment is comprised of businesses that primarily provide products to the defense markets and to a lesser extent the commercial aerospace market. The products offered include commercial off-the-shelf (COTS) embedded computing board level modules, integrated subsystems, turret aiming and stabilization products, weapons handling systems, avionics and electronics, flight test equipment, and aircraft data management solutions.
The Naval & Power reportable segment is comprised of businesses that provide products to the naval defense market and to a lesser extent the power & process markets. The products offered include main coolant pumps, power-dense compact motors, generators, secondary propulsion systems, pumps, pump seals, valves, control rod drive mechanisms, fastening systems, specialized containment doors, airlock hatches, spent fuel management products, and fluid sealing products.
The Corporation’s measure of segment profit or loss is operating income. Interest expense and income taxes are not reported on an operating segment basis as they are not considered in the segments’ performance evaluation by the Corporation’s chief operating decision-maker, its Chief Executive Officer.
Operating results by reportable segment are as follows: | | | | | | | | | | | | | | | | | | | | |
| | Year Ended December 31, |
| (In thousands) | | 2021 | | 2020 | | 2019 |
| Net sales | | | | | | |
| Aerospace & Industrial | | $ | 789,054 | | | $ | 807,144 | | | $ | 963,649 | |
| Defense Electronics | | 727,828 | | | 610,413 | | | 525,393 | |
| Naval & Power | | 995,509 | | | 977,109 | | | 1,001,662 | |
| Less: Intersegment Revenues | | (6,460) | | | (3,330) | | | (2,743) | |
| Total Consolidated | | $ | 2,505,931 | | | $ | 2,391,336 | | | $ | 2,487,961 | |
| | | | | | | | | | | | | | | | | | | | |
| (In thousands) | | 2021 | | 2020 | | 2019 |
| Operating income (expense) | | | | | | |
| Aerospace & Industrial | | $ | 121,817 | | | $ | 99,714 | | | $ | 149,135 | |
| Defense Electronics | | 159,089 | | | 118,748 | | | 119,044 | |
| Naval & Power | | 141,660 | | | 108,151 | | | 170,883 | |
Corporate and Eliminations (1) | | (39,883) | | | (37,765) | | | (35,109) | |
| Total Consolidated | | $ | 382,683 | | | $ | 288,848 | | | $ | 403,953 | |
| | | | | | | | | | | | | | | | | | | | |
| Depreciation and amortization expense | | | | | | |
| Aerospace & Industrial | | $ | 36,999 | | | $ | 37,690 | | | $ | 39,526 | |
| Defense Electronics | | 38,136 | | | 36,188 | | | 19,872 | |
| Naval & Power | | 35,937 | | | 37,894 | | | 38,914 | |
| Corporate | | 3,312 | | | 4,131 | | | 4,100 | |
| Total Consolidated | | $ | 114,384 | | | $ | 115,903 | | | $ | 102,412 | |
| | | | | | | | | | | | | | | | | | | | |
| Segment assets | | | | | | |
| Aerospace & Industrial | | $ | 991,508 | | | $ | 1,019,203 | | | $ | 1,078,324 | |
| Defense Electronics | | 1,536,369 | | | 1,542,686 | | | 1,102,821 | |
| Naval & Power | | 1,270,099 | | | 1,256,416 | | | 1,277,880 | |
| Corporate | | 294,581 | | | 175,445 | | | 305,236 | |
| Assets held for sale | | 10,988 | | | 27,584 | | | — | |
| Total Consolidated | | $ | 4,103,545 | | | $ | 4,021,334 | | | $ | 3,764,261 | |
| | | | | | | | | | | | | | | | | | | | |
| Capital expenditures | | | | | | |
| Aerospace & Industrial | | $ | 16,799 | | | $ | 20,025 | | | $ | 26,679 | |
| Defense Electronics | | 3,922 | | | 3,317 | | | 3,385 | |
| Naval & Power | | 18,106 | | | 21,283 | | | 36,098 | |
| Corporate | | 2,281 | | | 2,874 | | | 3,590 | |
| Total Consolidated | | $ | 41,108 | | | $ | 47,499 | | | $ | 69,752 | |
(1) Corporate and Eliminations includes pension expense, environmental remediation and administrative expenses, legal, foreign currency transactional gains and losses, and other expenses.
Reconciliations | | | | | | | | | | | | | | | | | | | | |
| | Year Ended December 31, |
| (In thousands) | | 2021 | | 2020 | | 2019 |
| Earnings before taxes: | | | | | | |
| Total reportable segment operating income | | $ | 422,566 | | | $ | 326,613 | | | $ | 439,062 | |
| Corporate and Eliminations | | (39,883) | | | (37,765) | | | (35,109) | |
| Interest expense | | 40,240 | | | 35,545 | | | 31,347 | |
| Other income, net | | 12,067 | | | 9,748 | | | 23,856 | |
| Total consolidated earnings before tax | | $ | 354,510 | | | $ | 263,051 | | | $ | 396,462 | |
| | | | | | | | | | | | | | | | | | | | |
| | As of December 31, |
| (In thousands) | | 2021 | | 2020 | | 2019 |
| Assets: | | | | | | |
| Total assets for reportable segments | | $ | 3,797,976 | | | $ | 3,818,305 | | | $ | 3,459,025 | |
| Assets held for sale | | 10,988 | | | 27,584 | | | — | |
| Non-segment cash | | 7,537 | | | 49,157 | | | 235,260 | |
| Other assets | | 287,044 | | | 126,288 | | | 69,976 | |
| Total consolidated assets | | $ | 4,103,545 | | | $ | 4,021,334 | | | $ | 3,764,261 | |
Geographic Information | | | | | | | | | | | | | | | | | | | | |
| | Year Ended December 31, |
| (In thousands) | | 2021 | | 2020 | | 2019 |
| Revenues | | | | | | |
| United States of America | | $ | 1,856,997 | | | $ | 1,758,424 | | | $ | 1,710,371 | |
| United Kingdom | | 93,154 | | | 90,628 | | | 120,297 | |
| Other foreign countries | | 555,780 | | | 542,284 | | | 657,293 | |
| Consolidated total | | $ | 2,505,931 | | | $ | 2,391,336 | | | $ | 2,487,961 | |
| | | | | | | | | | | | | | | | | | | | |
| | As of December 31, |
| (In thousands) | | 2021 | | 2020 | | 2019 |
| Long-Lived Assets - Property, plant, and equipment, net | | | | | | |
| United States of America | | $ | 261,658 | | | $ | 271,299 | | | $ | 271,609 | |
| United Kingdom | | 31,594 | | | 34,221 | | | 34,228 | |
| Other foreign countries | | 66,779 | | | 72,680 | | | 79,756 | |
| Consolidated total | | $ | 360,031 | | | $ | 378,200 | | | $ | 385,593 | |
19. CONTINGENCIES AND COMMITMENTS
From time to time, the Corporation and its subsidiaries are involved in legal proceedings that are incidental to the operation of our business. Some of these proceedings allege damages relating to asbestos and environmental exposures, intellectual property matters, copyright infringement, personal injury claims, employment and employee benefit matters, government contract issues, commercial or contractual disputes, and acquisitions or divestitures. The Corporation continues to defend vigorously against all claims. Although the ultimate outcome of any legal matter cannot be predicted with certainty, based on present information, including assessment of the merits of the particular claim, as well as current accruals and insurance coverage, the Corporation does not believe that the disposition of any of these matters, individually or in the aggregate, will have a material adverse effect on its consolidated financial condition, results of operations, and cash flows.
Legal Proceedings
The Corporation has been named in a number of lawsuits that allege injury from exposure to asbestos. To date, the Corporation has not been found liable for or paid any material sum of money in settlement in any asbestos-related case. The Corporation believes its minimal use of asbestos in its past operations and the relatively non-friable condition of asbestos in its products make it unlikely that it will face material liability in any asbestos litigation, whether individually or in the aggregate. The Corporation maintains insurance coverage for these potential liabilities and believes adequate coverage exists to cover any unanticipated asbestos liability. The Corporation is party to a number of other legal actions and claims, none of which individually or in the aggregate, in the opinion of management, are expected to have a material effect on the Corporation’s results of operations or financial position.
Letters of Credit and Other Arrangements
The Corporation enters into standby letters of credit agreements and guarantees with financial institutions and customers primarily relating to guarantees of repayment, future performance on certain contracts to provide products and services, and to secure advance payments from certain international customers. There were $21.1 million of stand-by letters of credit outstanding for both December 31, 2021 and 2020. As of December 31, 2021 and 2020 there were $4.5 million and $5.6 million of bank guarantees outstanding, respectively.
The Corporation, through its Electro-Mechanical Division (EMD) business unit, has three Pennsylvania Department of Environmental Protection (PADEP) radioactive materials licenses that are utilized in the continued operation of the EMD business. In connection with these licenses, the Corporation has known conditional asset retirement obligations related to asset decommissioning activities to be performed in the future, when the Corporation terminates these licenses. For two of the three licenses, the Corporation has recorded an asset retirement obligation of approximately $7.7 million. For its third license, the Corporation has not recorded an asset retirement obligation as it is not reasonably estimable due to insufficient information about the timing and method of settlement of the obligation. Accordingly, this obligation has not been recorded in the Consolidated Financial Statements. A liability for this obligation will be recorded in the period when sufficient information regarding timing and method of settlement becomes available to make a reasonable estimate of the liability’s fair value. The Corporation is required to provide the Nuclear Regulatory Commission financial assurance demonstrating its ability to cover the cost of decommissioning its Cheswick, Pennsylvania facility upon closure, though the Corporation does not intend to close this facility. The Corporation has provided this financial assurance in the form of a $45.6 million surety bond.
AP1000 Program
Within the Corporation’s Naval & Power segment, Electro-Mechanical Division (EMD) is the reactor coolant pump (RCP) supplier for the Westinghouse Electric Company (WEC) AP1000 nuclear power plants in China and the United States. The terms of the AP1000 U.S. and China contracts include liquidated damage provisions for failure to meet contractual delivery dates if the Corporation caused the delay and the delay was not excusable. While the Corporation did not meet certain contractual delivery dates under its AP1000 U.S. and China contracts, there are significant counterclaims and uncertainties as to which parties are responsible for the delay.
In February 2022, the Corporation and WEC reached an agreement to settle all open claims and counterclaims under the AP1000 U.S. and China contracts. The settlement agreement requires the Corporation to pay WEC $15 million during the first quarter of 2022 and $10 million during the first quarter of 2023 in exchange for the Corporation's full release from all open claims under such contracts, whether known or unknown, as well as negotiating and executing a right of first refusal for all future AP1000 projects. As a result of the settlement, the Corporation recorded charges of $13 million related to this matter for the year ended December 31, 2021.
20. ACCUMULATED OTHER COMPREHENSIVE INCOME (LOSS)
The total cumulative balance of each component of accumulated other comprehensive income (loss), net of tax, is as follows: | | | | | | | | | | | | | | | | | | | | |
| (In thousands) | | Foreign currency translation adjustments, net | | Total pension and postretirement adjustments, net | | Accumulated other comprehensive income (loss) |
| December 31, 2019 | | $ | (130,019) | | | $ | (195,255) | | | $ | (325,274) | |
Other comprehensive loss before reclassifications (1) | | 41,282 | | | (44,513) | | | (3,231) | |
Amounts reclassified from accumulated other comprehensive income (1) | | — | | | 17,649 | | | 17,649 | |
| Net current period other comprehensive income (loss) | | 41,282 | | | (26,864) | | | 14,418 | |
| December 31, 2020 | | $ | (88,737) | | | $ | (222,119) | | | $ | (310,856) | |
Other comprehensive loss before reclassifications (1) | | (10,829) | | | 107,211 | | | 96,382 | |
Amounts reclassified from accumulated other comprehensive income (1) | | — | | | 24,009 | | | 24,009 | |
| Net current period other comprehensive income (loss) | | (10,829) | | | 131,220 | | | 120,391 | |
| December 31, 2021 | | $ | (99,566) | | | $ | (90,899) | | | $ | (190,465) | |
(1)All amounts are after tax.
Details of amounts reclassified from accumulated other comprehensive income (loss) are below: | | | | | | | | | | | | | | | | | | | | |
| | Amount reclassified from Accumulated other comprehensive income (loss) | | Affected line item in the Consolidated Statement of Earnings |
| (In thousands) | | 2021 | | 2020 | | |
| Defined benefit pension and postretirement plans | | | | | | |
| Amortization of prior service costs | | $ | 555 | | | $ | 926 | | | Other income, net |
| Recognized net actuarial losses | | (28,905) | | | (23,057) | | | Other income, net |
| Settlements | | (3,310) | | | (1,086) | | | Other income, net |
| | (31,660) | | | (23,217) | | | Earnings before income taxes |
| | 7,651 | | | 5,568 | | | Provision for income taxes |
| Total reclassifications | | $ | (24,009) | | | $ | (17,649) | | | Net earnings |
21. RESTRUCTURING COSTS
During the year ended December 31, 2020, the Corporation executed restructuring activities across all of its segments to support its ongoing effort of improving capacity utilization and operating efficiency. These restructuring activities, which included workforce reductions and consolidation of facilities, were substantially completed as of December 31, 2021. As of December 31, 2021 and 2020, the restructuring liability associated with these restructuring activities was $0.3 million and $6.9 million, respectively. This balance is reported within Other Current Liabilities on the Consolidated Balance Sheet.
22. SUBSEQUENT EVENTS
On January 21, 2022, the Corporation announced that it has entered into an agreement to acquire the assets that comprise the Safran Aerosystems Arresting Company ("SAA") for $240 million in cash. SAA is a designer and manufacturer of aircraft emergency arresting systems with more than 5,000 systems worldwide. For the year ended December 31, 2021, SAA generated sales of approximately $70 million. The acquisition is expected to close in the third quarter of 2022, subject to regulatory approval and other closing conditions. Upon close, the acquired business will operate within the Corporation's Naval & Power segment.
On January 28, 2022, the Corporation completed the sale of its industrial valve business in Germany, which was classified as held for sale as of December 31, 2021, for approximately $3 million of gross cash proceeds.
* * * * * *
Report of the Corporation
The Consolidated Financial Statements appearing in Item 8 of this Annual Report on Form 10-K have been prepared by the Corporation in conformity with accounting principles generally accepted in the United States of America. The financial statements necessarily include some amounts that are based on the best estimates and judgments of the Corporation. Other financial information in this Annual Report on Form 10-K is consistent with that in the Consolidated Financial Statements.
The Corporation maintains accounting systems, procedures, and internal accounting controls designed to provide reasonable assurance that assets are safeguarded and that transactions are executed in accordance with the appropriate corporate authorization and are properly recorded. The accounting systems and internal accounting controls are augmented by written policies and procedures, organizational structure providing for a division of responsibilities, selection and training of qualified personnel, and an internal audit program. Management of the Corporation has completed an assessment of the Corporation’s internal controls over financial reporting and has included “Management’s Annual Report on Internal Control Over Financial Reporting” in Item 9A of this Annual Report on Form 10-K.
Deloitte & Touche LLP, our independent registered public accounting firm, performed an integrated audit of the Corporation’s Consolidated Financial Statements that also included forming an opinion on the internal controls over financial reporting of the Corporation for the year ended December 31, 2021. An audit includes examining, on a test basis, evidence regarding the amounts and disclosures in the financial statements. An audit also includes assessing the accounting principles used and significant estimates made by management, as well as evaluating the overall financial statement presentation. The objective of their audit is the expression of an opinion on the Corporation’s Consolidated Financial Statements in conformity with accounting principles generally accepted in the United States of America, in all material respects, and on the internal controls over financial reporting as of December 31, 2021.
The Audit Committee of the Board of Directors, composed entirely of directors who are independent of the Corporation, appoints the independent registered public accounting firm for ratification by stockholders and, among other things, considers the scope of the independent registered public accounting firm’s examination, the audit results, and the adequacy of internal accounting controls of the Corporation. The independent registered public accounting firm and the internal auditor have direct access to the Audit Committee, and they meet with the committee from time to time, with and without management present, to discuss accounting, auditing, non-audit consulting services, internal control, and financial reporting matters.
Report of Independent Registered Public Accounting Firm
To the shareholders and the Board of Directors of Curtiss-Wright Corporation
Opinion on the Financial Statements
We have audited the accompanying consolidated balance sheets of Curtiss-Wright Corporation and subsidiaries (the "Company") as of December 31, 2021 and 2020, the related consolidated statements of earnings, comprehensive income, cash flows and shareholders' equity, for each of the three years in the period ended December 31, 2021, and the related notes and the schedule listed in the Index at Item 15 (collectively referred to as the "financial statements"). In our opinion, the financial statements present fairly, in all material respects, the financial position of the Company as of December 31, 2021 and 2020, and the results of its operations and its cash flows for each of the three years in the period ended December 31, 2021, in conformity with accounting principles generally accepted in the United States of America.
We have also audited, in accordance with the standards of the Public Company Accounting Oversight Board (United States) (PCAOB), the Company's internal control over financial reporting as of December 31, 2021, based on criteria established in Internal Control — Integrated Framework (2013) issued by the Committee of Sponsoring Organizations of the Treadway Commission and our report dated February 24, 2022, expressed an unqualified opinion on the Company's internal control over financial reporting.
Basis for Opinion
These financial statements are the responsibility of the Company's management. Our responsibility is to express an opinion on the Company's financial statements based on our audits. We are a public accounting firm registered with the PCAOB and are required to be independent with respect to the Company in accordance with the U.S. federal securities laws and the applicable rules and regulations of the Securities and Exchange Commission and the PCAOB.
We conducted our audits in accordance with the standards of the PCAOB. Those standards require that we plan and perform the audit to obtain reasonable assurance about whether the financial statements are free of material misstatement, whether due to error or fraud. Our audits included performing procedures to assess the risks of material misstatement of the financial statements, whether due to error or fraud, and performing procedures that respond to those risks. Such procedures included examining, on a test basis, evidence regarding the amounts and disclosures in the financial statements. Our audits also included evaluating the accounting principles used and significant estimates made by management, as well as evaluating the overall presentation of the financial statements. We believe that our audits provide a reasonable basis for our opinion.
Critical Audit Matter
The critical audit matters communicated below are matters arising from the current-period audit of the financial statements that were communicated or required to be communicated to the audit committee and that (1) relate to accounts or disclosures that are material to the financial statements and (2) involved our especially challenging, subjective, or complex judgments. The communication of critical audit matters does not alter in any way our opinion on the financial statements, taken as a whole, and we are not, by communicating the critical audit matters below, providing separate opinions on the critical audit matters or on the accounts or disclosures to which they relate.
Revenue – Over-Time Basis – Refer to Note 2 to the financial statements
Critical Audit Matter Description
The Company recognizes revenue when control of a promised good and/or service is transferred to a customer. The Company identifies a performance obligation for each promise in a contract to transfer a distinct good or service to the customer. Contracts that qualify for over-time revenue recognition are generally associated with the design, development, and manufacture of highly engineered industrial products used in commercial and defense applications and generally span between 2-5 years in duration. The Company uses over-time revenue recognition based on the utilization of an input measure used to measure progress of performance obligations, such as costs incurred to date relative to total estimated costs.
Application of an over-time revenue recognition method requires the use of reasonable and dependable estimates of costs that will be incurred to complete production of goods or provision of services. As of December 31, 2021, revenue was $2.506 billion, of which 50% relates to over-time revenue.
Certain of the Company’s contracts have limited amount of historical data available requiring the Company to make judgments to estimate future costs that will be incurred for these contracts. Related to these contracts, auditing these estimates required both extensive audit effort due to a high degree of auditor judgment, especially given the limited historical data for certain contracts, when performing audit procedures and evaluating the results of those procedures.
How the Critical Audit Matter Was Addressed in the Audit
Our audit procedures related to management’s estimates of total costs that will be incurred for certain of the contracts (as discussed above) included the following:
•We tested the effectiveness of controls over the long-term contract revenue, including those over the estimates of total costs for the performance obligation.
•We performed the following:
◦Evaluated the appropriateness and consistency of the methods and assumptions used by management to develop the estimates of future costs that will be incurred for contracts with limited historical experience.
◦Evaluated management’s ability to achieve the estimates of costs that will be incurred by performing corroborating inquiries with the Company’s project managers and engineers, and comparing the estimates to management’s work plans, engineering specifications, and supplier contracts.
◦Tested the accuracy and completeness of the costs incurred to date.
◦Compared the actual costs incurred to date to management’s estimated costs to be incurred to date.
◦Due to the limited historical data available for certain contracts, we tested changes in management’s total cost estimates.
◦Tested the mathematical accuracy of management’s estimates of future costs to be incurred.
◦Tested the mathematical accuracy of management’s calculation of revenue for the contract.
/s/ Deloitte & Touche LLP
Parsippany, New Jersey
February 24, 2022
We have served as the Company's auditor since 2003.
Report of Independent Registered Public Accounting Firm
To the shareholders and the Board of Directors of Curtiss-Wright Corporation
Opinion on Internal Control over Financial Reporting
We have audited the internal control over financial reporting of Curtiss-Wright Corporation and subsidiaries (the “Company”) as of December 31, 2021, based on criteria established in Internal Control — Integrated Framework (2013) issued by the Committee of Sponsoring Organizations of the Treadway Commission (COSO). In our opinion, the Company maintained, in all material respects, effective internal control over financial reporting as of December 31, 2021, based on criteria established in Internal Control — Integrated Framework (2013) issued by COSO.
We have also audited, in accordance with the standards of the Public Company Accounting Oversight Board (United States) (PCAOB), the consolidated financial statements as of and for the year ended December 31, 2021, of the Company and our report dated February 24, 2022, expressed an unqualified opinion on those financial statements.
Basis for Opinion
The Company’s management is responsible for maintaining effective internal control over financial reporting and for its assessment of the effectiveness of internal control over financial reporting, included in the accompanying Management's Annual Report on Internal Control Over Financial Reporting. Our responsibility is to express an opinion on the Company’s internal control over financial reporting based on our audit. We are a public accounting firm registered with the PCAOB and are required to be independent with respect to the Company in accordance with the U.S. federal securities laws and the applicable rules and regulations of the Securities and Exchange Commission and the PCAOB.
We conducted our audit in accordance with the standards of the PCAOB. Those standards require that we plan and perform the audit to obtain reasonable assurance about whether effective internal control over financial reporting was maintained in all material respects. Our audit included obtaining an understanding of internal control over financial reporting, assessing the risk that a material weakness exists, testing and evaluating the design and operating effectiveness of internal control based on the assessed risk, and performing such other procedures as we considered necessary in the circumstances. We believe that our audit provides a reasonable basis for our opinion.
Definition and Limitations of Internal Control over Financial Reporting
A company’s internal control over financial reporting is a process designed to provide reasonable assurance regarding the reliability of financial reporting and the preparation of financial statements for external purposes in accordance with generally accepted accounting principles. A company’s internal control over financial reporting includes those policies and procedures that (1) pertain to the maintenance of records that, in reasonable detail, accurately and fairly reflect the transactions and dispositions of the assets of the company; (2) provide reasonable assurance that transactions are recorded as necessary to permit preparation of financial statements in accordance with generally accepted accounting principles, and that receipts and expenditures of the company are being made only in accordance with authorizations of management and directors of the company; and (3) provide reasonable assurance regarding prevention or timely detection of unauthorized acquisition, use, or disposition of the company’s assets that could have a material effect on the financial statements.
Because of its inherent limitations, internal control over financial reporting may not prevent or detect misstatements. Also, projections of any evaluation of effectiveness to future periods are subject to the risk that controls may become inadequate because of changes in conditions, or that the degree of compliance with the policies or procedures may deteriorate.
/s/ Deloitte & Touche LLP
Parsippany, New Jersey
February 24, 2022
Item 9. Changes in and Disagreements with Accountants on Accounting and Financial Disclosure.
None.
Item 9A. Controls and Procedures.
Disclosure Controls and Procedures
As of December 31, 2021, the Corporation’s management, including the Corporation’s Chief Executive Officer and Chief Financial Officer, conducted an evaluation of the Corporation’s disclosure controls and procedures, as such term is defined in Rules 13a-15(e) and 15d-15(e) under the Securities Exchange Act of 1934, as amended (the “Exchange Act”). Based on such evaluation, the Corporation’s Chief Executive Officer and Chief Financial Officer concluded that the Corporation’s disclosure controls and procedures are effective as of December 31, 2021 insofar as they are designed to ensure that information required to be disclosed by us in the reports that we file or submit under the Exchange Act is recorded, processed, summarized and reported, within the time periods specified in the Commission’s rules and forms, and they include, without limitation, controls and procedures designed to ensure that information required to be disclosed by us in the reports we file or submit under the Exchange Act is accumulated and communicated to our management, including our principal executive and principal financial officers, or persons performing similar functions, as appropriate to allow timely decisions regarding required disclosure.
Management’s Annual Report On Internal Control Over Financial Reporting
The Corporation’s management is responsible for establishing and maintaining adequate internal control over financial reporting, as defined in Rules 13a-15(f) and 15d-15(f) under the Securities Exchange Act of 1934, as amended.
Because of its inherent limitations, internal control over financial reporting may not prevent or detect misstatements. Also, projections of the future effectiveness of controls currently deemed effective are subject to the risk that controls may become inadequate because of changes in conditions or deterioration in the degree of compliance with the policies or procedures.
The Corporation’s management assessed the effectiveness of the Corporation’s internal control over financial reporting as of December 31, 2021. In making this assessment, the Corporation’s management used the criteria established in Internal Control - Integrated Framework (2013) issued by the Committee of Sponsoring Organizations of the Treadway Commission. Based on management’s assessment, management believes that as of December 31, 2021, the Corporation’s internal control over financial reporting is effective based on the established criteria.
The Corporation’s internal controls over financial reporting as of December 31, 2021 have been audited by Deloitte & Touche LLP (PCAOB ID No. 34), an independent registered public accounting firm, and their report thereon is included in Item 8 of this Annual Report on Form 10-K.
Changes in Internal Control over Financial Reporting
There were no changes in our internal control over financial reporting during the quarter ended December 31, 2021 that have materially affected, or are reasonably likely to materially affect, our internal control over financial reporting.
Item 9B. Other Information.
None.
PART III
The information required by Items 10, 11, 12, 13, and 14 of Part III of this Annual Report on Form 10-K, to the extent not set forth herein, is incorporated herein by reference from the registrant’s definitive proxy statement relating to the annual meeting of stockholders to be held on May 5, 2022 which definitive proxy statement shall be filed with the Securities and Exchange Commission within 120 days after the end of the fiscal year to which this report relates. Information required by Item 401(b) of Regulation S-K is included in Part I of this report under the caption "Executive Officers" and information required by Item 201(d) of Regulation S-K is included in Part II of this report under the caption "Securities Authorized For Issuance Under Equity Compensation Plans."
PART IV
Item 15. Exhibits, Financial Statement Schedule. | | | | | | | | | | | | | | | | | | | | | | | | | | | | | | | | | | | |
| (a) | Financial Statements and Footnotes | | Page | | |
| | | | | | | | | | | | | | | | | | | | | | | | | | | | | | | | | | | |
| 1. | | The following are documents filed as part of this report in Part II, Item 8: | | | | | | | | |
| | | Consolidated Statements of Earnings | | | | | | | | |
| | | Consolidated Statements of Comprehensive Income | | | | | | | | |
| | | Consolidated Balance Sheets | | | | | | | | |
| | | Consolidated Statements of Cash Flows | | | | | | | | |
| | | Consolidated Statements of Stockholders' Equity | | | | | | | | |
| | | Notes to Consolidated Financial Statements | | | | | | | | |
| 2. | | Financial Statement Schedule | | | | | | | | |
| | | Schedule II-Valuation and Qualifying Accounts | | | | | | | | |
| | | All other financial statement schedules have been omitted because they are either not required, not applicable or the required information is shown in the Consolidated Financial Statements or Notes thereto. | | | | | | | | |
| | | | | | | | | | | |
| (b) | Exhibits | | |
| | | | | | | | | | | |
| | | | | Incorporated by Reference | | Filed | | |
| Exhibit No. | | Exhibit Description | | Form | | Filing Date | | Herewith | | |
| | | | | | | | | | | |
| 2.1 | | | | 8-K | | February 3, 2005 | | | | |
| 3.1 | | | | 8-A12B/A | | May 24, 2005 | | | | |
| 3.2 | | | | 8-K | | May 18, 2015 | | | | |
| 4.1 | | | | 8-A12B/A | | May 24, 2005 | | | | |
| 4.2 | | | | DEF 14A | | May 24, 2005 | | | | |
| 10.1 | | | | 10-K | | March 7, 2006 | | | | |
| 10.2 | | | | 10-K | | February 25, 2021 | | | | |
| 10.3 | | | | 10-K | | February 25, 2011 | | | | |
| 10.4 | | | | 10-K | | February 24, 2012 | | | | |
| 10.5 | | | | 10-K | | February 19, 2015 | | | | |
| 10.6 | | | | 10-K | | February 19, 2015 | | | | |
| 10.7 | | | | 10-K | | February 25, 2016 | | | | |
| | | | | | | | | | | | | | | | | | | | | | | | | | | | | | | | | | | |
| 10.8 | | | | | | | | X | | |
| 10.9 | | | | | | | | X | | |
| 10.10 | | | | 10-K | | February 25, 2016 | | | | |
| 10.11 | | | | 10-K | | February 25, 2016 | | | | |
| 10.12 | | | | 10-K | | February 21, 2017 | | | | |
| 10.13 | | | | 10-K | | February 21, 2017 | | | | |
| 10.14 | | | | 10-K | | February 21, 2017 | | | | |
| 10.15 | | | | 10-K | | February 22, 2018 | | | | |
| 10.16 | | | | 10-K | | February 22, 2018 | | | | |
| 10.17 | | | | 10-K | | February 27, 2019 | | | | |
| 10.18 | | | | 10-K | | February 27, 2019 | | | | |
| 10.19 | | | | 10-K | | February 27, 2019 | | | | |
| 10.20 | | | | 10-Q | | August 1, 2019 | | | | |
| 10.21 | | | | 10-Q | | August 1, 2019 | | | | |
| 10.22 | | | | 10-K | | February 27, 2020 | | | | |
| 10.23 | | | | 10-K | | February 25, 2021 | | | | |
| 10.24 | | | | | | | | X | | |
| 10.25 | | | | | | | | X | | |
| 10.26 | | | | 14A | | March 21, 2014 | | | | |
| 10.27 | | | | 10-K | | February 19, 2015 | | | | |
| | | | | | | | | | | | | | | | | | | | | | | | | | | | | | | | | | | |
| 10.28 | | | | 10-K | | February 25, 2016 | | | | |
| 10.29 | | | | 10-Q | | May 7, 2012 | | | | |
| 10.30 | | | | 10-K | | February 25, 2011 | | | | |
| 10.31 | | | | 10-K | | February 24, 2012 | | | | |
| 10.32 | | | | 10-K | | February 21, 2013 | | | | |
| 10.33 | | | | 10-K | | February 21, 2013 | | | | |
| 10.34 | | | | 10-K | | February 21, 2014 | | | | |
| 10.35 | | | | 14A | | April 5, 2005 | | | | |
| 10.36 | | | | 10-K | | February 27, 2007 | | | | |
| 10.37 | | | | 10-K | | February 24, 2012 | | | | |
| 10.38 | | | | 10-K | | February 19, 2015 | | | | |
| 10.39 | | | | 10-K | | February 25, 2016 | | | | |
| 10.40 | | | | 10-K | | February 25, 2021 | | | | |
| 10.41 | | | | 14A | | March 23, 2018 | | | | |
| 10.42 | | | | 14A | | March 24, 2011 | | | | |
| 10.43 | | | | | | | | X | | |
| 10.44 | | | | | | | | X | | |
| 10.45 | | | | | | | | X | | |
| 10.46 | | | | | | | | X | | |
| 10.47 | | | | | | | | X | | |
| | | | | | | | | | | | | | | | | | | | | | | | | | | | | | | | | | | |
| 10.48 | | | | | | | | X | | |
| 10.49 | | | | 10-Q | | May 13, 1998 | | | | |
| 10.50 | | | | 8-K | | December 13, 2011 | | | | |
| 10.51 | | | | 8-K | | December 13, 2011 | | | | |
| 10.52 | | | | 8-K | | February 27, 2013 | | | | |
| 10.53 | | | | 8-K | | February 27, 2013 | | | | |
| 10.54 | | Fourth Amended and Restated Credit Agreement dated as of October 17, 2018 among the Company and Certain Subsidiaries as Borrowers; the Lenders party thereto; Bank of America N.A., as Administrative Agent, Swingline Lender, and L/C Issuer; Merrill Lynch, Pierce, Fenner & Smith Incorporated, JPMorgan Chase Bank, N.A., and Wells Fargo Securities, LLC, as Joint Lead Arrangers and Joint Bookrunners; JPMorgan Chase Bank, N.A., and Wells Fargo, N.A., as Syndication Agents; and Citizens Bank, N.A., as Documentation Agents | | 8-K | | October 17, 2018 | | | | |
| 10.55 | | | | 8-K | | August 19, 2020 | | | | |
| 10.56 | | | | 8-K | | August 19, 2020 | | | | |
| 21.00 | | | | | | | | X | | |
| 23.00 | | | | | | | | X | | |
| 31.10 | | | | | | | | X | | |
| 31.20 | | | | | | | | X | | |
| 32.00 | | | | | | | | X | | |
| | | | | | | | | | | |
| * | | Indicates contract or compensatory plan or arrangement | | |
| | | | | | | | | | | |
| 101.INS | | XBRL Instance Document | | | | | | | | |
| 101.SCH | | XBRL Taxonomy Extension Schema Document | | | | | | | | |
| 101.CAL | | XBRL Taxonomy Extension Calculation Linkbase Document | | | | | | | | |
| 101.DEF | | XBRL Taxonomy Extension Definition Linkbase Document | | | | | | | | |
| | | | | | | | | | | | | | | | | | | | | | | | | | | | | | | | | | | |
| 101.LAB | | XBRL Taxonomy Extension Label Linkbase Document | | | | | | | | |
| 101.PRE | | XBRL Taxonomy Extension Presentation Linkbase Document | | | | | | | | |
CURTISS-WRIGHT CORPORATION and SUBSIDIARIES
SCHEDULE II – VALUATION and QUALIFYING ACCOUNTS
for the years ended December 31, 2021, 2020, and 2019
(In thousands) | | | | | | | | | | | | | | | | | | | | | | | | | | | | | | | | | | | | | | | | | | | | |
| | | | Additions | | | | | | | | |
| Description | | Balance at
Beginning of
Period | | Charged to
Costs and
Expenses | | Charged to Other
Accounts | | | | Deductions | | | | Balance at
End of Period |
| | | | | | | | | | | | | | |
| Deducted from assets to which they apply: | | | | | | | | | | | | |
| December 31, 2021 | | | | | | | | | | | | | | |
| Tax valuation allowance | | 1,240 | | | 1,864 | | | (22) | | | (1) | | 457 | | | | | 2,625 | |
| Total | | $ | 1,240 | | | $ | 1,864 | | | $ | (22) | | | | | $ | 457 | | | | | $ | 2,625 | |
| December 31, 2020 | | | | | | | | | | | | | | |
| Tax valuation allowance | | 3,386 | | | 3,439 | | | 50 | | | (1) | | 5,635 | | | (2) | | 1,240 | |
| Total | | $ | 3,386 | | | $ | 3,439 | | | $ | 50 | | | | | $ | 5,635 | | | | | $ | 1,240 | |
| December 31, 2019 | | | | | | | | | | | | | | |
| Tax valuation allowance | | 11,646 | | | 1,305 | | | (22) | | | (1) | | 9,543 | | | (3) | | 3,386 | |
| Total | | $ | 11,646 | | | $ | 1,305 | | | $ | (22) | | | | | $ | 9,543 | | | | | $ | 3,386 | |
(1) Primarily foreign currency translation adjustments.
(2) $3.8 million relates to net operating losses reclassified as held for sale.
(3) $5.7 million relates to the capital loss carryforward expiration from the sale of the Downstream oil and gas business.
SIGNATURES
Pursuant to the requirements of Section 13 or 15(d) of the Securities Exchange Act of 1934, the Registrant has duly caused this report to be signed on its behalf by the undersigned, thereunto duly authorized.
CURTISS-WRIGHT CORPORATION
(Registrant)
Date: February 24, 2022 By: /s/ Lynn M. Bamford
Lynn M. Bamford
President and Chief Executive Officer
Pursuant to the requirements of the Securities Exchange Act of 1934, this report has been signed below by the following persons on behalf of the Registrant and in the capacities and on the dates indicated.
Date: February 24, 2022 By: /s/ K. Christopher Farkas
K. Christopher Farkas
Vice President and Chief Financial Officer
Date: February 24, 2022 By: /s/ Gary A. Ogilby
Gary A. Ogilby
Vice President and Corporate Controller
Date: February 24, 2022 By: /s/ David C. Adams
David C. Adams
Executive Chairman
Date: February 24, 2022 By: /s/ Dean M. Flatt
Dean M. Flatt
Director
Date: February 24, 2022 By: /s/ S. Marce Fuller
S. Marce Fuller
Director
Date: February 24, 2022 By: /s/ Bruce D. Hoechner
Bruce D. Hoechner
Director
Date: February 24, 2022 By: /s/ Glenda J. Minor
Glenda J. Minor
Director
Date: February 24, 2022 By: /s/ Anthony J. Moraco
Anthony J. Moraco
Director
Date: February 24, 2022 By: /s/ John B. Nathman
John B. Nathman
Director
Date: February 24, 2022 By: /s/ Robert J. Rivet
Robert J. Rivet
Director
Date: February 24, 2022 By: /s/ Peter C. Wallace
Peter C. Wallace
Director