UNITED STATES
SECURITIES AND EXCHANGE COMMISSION
Washington, D.C. 20549
FORM 10-K
ý ANNUAL REPORT PURSUANT TO SECTION 13 OR 15(d) OF THE SECURITIES EXCHANGE ACT OF 1934
For the fiscal year ended: December 31, 2017
¨ TRANSITION REPORT PURSUANT TO SECTION 13 OR 15(d) OF THE SECURITIES EXCHANGE ACT OF 1934
Commission file number 1-1657
CRANE CO.
Delaware State of or other jurisdiction of incorporation or organization: | 13-1952290 (I.R.S. Employer identification No.) | |
100 First Stamford Place, Stamford, CT (Address of principal executive offices) | 06902 (Zip Code) | |
Registrant’s telephone number, including area code: (203) 363-7300
Securities registered pursuant to Section 12(b) of the Act:
Title of each class | Name of each exchange on which registered | |
Common Stock, par value $1.00 | New York Stock Exchange | |
Securities registered pursuant to Section 12(g) of the Act:
None
Indicate by check mark if the registrant is a well-known seasoned issuer, as defined in Rule 405 of the Securities Act Yes ý No ¨
Indicate by check mark if the registrant is not required to file reports pursuant to Section 13 or Section 15 (d) of the Act
Yes ¨ No ý
Indicate by check mark whether the registrant (1) has filed all reports required to be filed by Section 13 or 15(d) of the Securities Exchange Act of 1934 during the preceding 12 months (or for such shorter period that the registrant was required to file such reports), and (2) has been subject to such filing requirements for the past 90 days.
Yes ý No ¨
Indicate by check mark whether the registrant has submitted electronically and posted on its corporate Web site, if any, every Interactive Data File required to be submitted and posted pursuant to Rule 405 of Regulation S-T (§232.405 of this chapter) during the preceding 12 months (or for such shorter period that the registrant was required to submit and post such files).
Yes ý No ¨
Indicate by check mark if disclosure of delinquent filers pursuant to Item 405 of Regulation S-K is not contained herein, and will not be contained, to the best of the registrant’s knowledge, in definitive proxy or information statements incorporated by reference in Part III of this Form 10-K or any amendment to this Form 10-K. ý
Indicate by check mark whether the registrant is a large accelerated filer, an accelerated filer, a non-accelerated filer, a smaller reporting company, or an emerging growth company. See the definitions of “large accelerated filer”, “accelerated filer”, “non-accelerated filer,”, “smaller reporting company” and "emerging growth company" in Rule 12b-2 of the Exchange Act). (Check one):
Large accelerated filer x | Accelerated filer o | |
Non-accelerated filer o (Do not check if a smaller reporting company) | Smaller reporting company o | |
Emerging growth company o | ||
If an emerging growth company, indicate by check mark if the registrant has elected not to use the extended transition period for complying with any new or revised financial accounting standards provided pursuant to Section 13(a) of the Exchange Act. o
Indicate by check mark whether the registrant is a shell company (as defined in Rule 12b-2 of the Exchange Act). Yes ¨ No ý
Based on the closing stock price of $79.38 on June 30, 2017, the last business day of the registrant’s most recently completed second fiscal quarter, the aggregate market value of the voting common equity held by nonaffiliates of the registrant was $4,728,455,211
The number of shares outstanding of the registrant’s common stock, par value $1.00, was 59,645,117 at January 31, 2018.
DOCUMENTS INCORPORATED BY REFERENCE
Portions of the proxy statement for the annual shareholders’ meeting to be held on April 23, 2018
are incorporated by reference into Part III of this Form 10-K.
Index
Page | ||||
Part I | ||||
Item 1. | ||||
Item 1A. | ||||
Item 1B. | ||||
Item 2. | ||||
Item 3. | ||||
Item 4. | ||||
Part II | ||||
Item 5. | ||||
Item 6. | ||||
Item 7. | ||||
Item 7A. | ||||
Item 8. | ||||
Item 9. | ||||
Item 9A. | ||||
Item 9B. | ||||
Part III | ||||
Item 10. | ||||
Item 11. | ||||
Item 12. | ||||
Item 13. | ||||
Item 14. | ||||
Part IV | ||||
Item 15. | ||||
Item 16. | Form 10-K Summary | |||
FORWARD-LOOKING INFORMATION
This Annual Report on Form 10-K contains information about us, some of which includes “forward-looking statements” within the meaning of the Private Securities Litigation Reform Act of 1995. Forward-looking statements are statements other than historical information or statements about our current condition. You can identify forward-looking statements by the use of terms such as: “believes”, “contemplates”, “expects”, “may”, “will”, “could”, “should”, “would”, or “anticipates”, other similar phrases, or the negatives of these terms.
We have based the forward-looking statements relating to our operations on our current expectations, estimates and projections about us and the markets we serve. We caution you that these statements are not guarantees of future performance and involve risks and uncertainties. These statements should be considered in conjunction with the discussion in Part I, the information set forth under Item 1A, “Risk Factors” and with the discussion of the business included in Part II, Item 7, “Management’s Discussion and Analysis of Financial Condition and Results of Operations.” We have based many of these forward-looking statements on assumptions about future events that may prove to be inaccurate. Accordingly, our actual outcomes and results may differ materially from what we have expressed or forecast in the forward-looking statements. Any differences could result from a variety of factors, including the following:
• | The effect of changes in economic conditions in the markets in which we operate, including financial market conditions, end markets for our products, fluctuations in raw material prices and the financial condition of our customers and suppliers; |
• | Economic, social and political instability, currency fluctuation and other risks of doing business outside of the United States; |
• | Competitive pressures, including the need for technology improvement, successful new product development and introduction and any inability to pass increased costs of raw materials to customers; |
• | Our ability to successfully integrate acquisitions and to realize synergies and opportunities for growth and innovation; |
• | Our ability to successfully value acquisitions; |
• | Our ongoing need to attract and retain highly qualified personnel and key management; |
• | The ability of the U.S. government to terminate our government contracts; |
• | Our ability to predict the timing and award of substantial contracts in our recently acquired banknote business; |
• | A reduction in congressional appropriations that affect defense spending; |
• | The outcomes of legal proceedings, claims and contract disputes; |
• | Adverse effects on our business and results of operations, as a whole, as a result of increases in asbestos claims or the cost of defending and settling such claims; |
• | Adverse effects as a result of further increases in environmental remediation activities, costs and related claims; |
• | Investment performance of our pension plan assets and fluctuations in interest rates, which may affect the amount and timing of future pension plan contributions; |
• | Adverse effects of changes in tax, environmental and other laws and regulations in the United States and other countries in which we operate. |
1
Part I
Reference herein to “Crane”, “we”, “us” and “our” refer to Crane Co. and its subsidiaries unless the context specifically states or implies otherwise. Amounts in the following discussion are presented in millions, except employee, square feet, number of properties, share and per share data, or unless otherwise stated.
Item 1. Business
General
We are a diversified manufacturer of highly engineered industrial products comprised of four segments: Fluid Handling, Payment & Merchandising Technologies, Aerospace & Electronics and Engineered Materials. Our primary markets are chemicals, oil & gas, power, automated payment solutions, banknote design and production and aerospace & defense, along with a wide range of general industrial and consumer related end markets.
We have been committed to the highest standards of business conduct since 1855 when our founder, R.T. Crane, resolved “to conduct my business in the strictest honesty and fairness; to avoid all deception and trickery; to deal fairly with both customers and competitors; to be liberal and just toward employees; and to put my whole mind upon the business.”
Our strategy is to grow earnings and cash flow by focusing on the manufacturing of highly engineered industrial products for specific markets where our scale is a relative advantage, and where we can compete based on our proprietary and differentiated technology, our deep vertical expertise, and our responsiveness to unique and diverse customer needs. We continuously evaluate our portfolio, pursue acquisitions that complement our existing businesses and are accretive to our growth profile, selectively divest businesses where appropriate, and pursue internal mergers to improve efficiency. We strive to foster a performance-based culture focused on productivity and continuous improvement, to attract and retain a committed management team whose interests are directly aligned with those of our shareholders, and to maintain a focused, efficient corporate structure.
We deploy a comprehensive set of business processes, philosophies and operational excellence tools to drive continuous improvement throughout our businesses. Beginning with a core value of integrity, we incorporate “Voice of the Customer” teachings (specific processes designed to capture our customers’ requirements) and a broad range of tools into a disciplined strategy deployment process that drives profitable growth by focusing on continuously improving safety, quality, delivery and cost. An embedded intellectual capital development process ensures that we attract, develop, promote and retain talent to drive continuity and repeatable results.
Revenues from outside the United States were approximately 37% and 36% in 2017 and 2016, respectively. For more information regarding our sales and assets by geographical region, see Part II, Item 8 under Note 13, “Segment Information,” in the Notes to Consolidated Financial Statements.
Reportable Segments
For additional information on recent business developments and other information about us and our business, you should refer to the information set forth under the captions, “Management’s Discussion and Analysis of Financial Condition and Results of Operations,” in Part II, Item 7 of this report, as well as in Part II, Item 8 under Note 13, “Segment Information,” in the Notes to Consolidated Financial Statements for sales, operating profit and assets employed by each segment.
Fluid Handling
The Fluid Handling segment is a provider of highly engineered fluid handling equipment for critical performance applications that require high reliability. The segment is comprised of Process Valves and Related Products, Commercial Valves and Other Products.
Process Valves and Related Products includes on/off valves and related products for critical and demanding applications in the chemical, oil & gas, power and general industrial end markets globally. Products are sold under the trade names Crane, Saunders, Jenkins, Pacific, Xomox, Krombach, DEPA, ELRO, REVO, Flowseal, Centerline, Resistoflex, Duochek, Barksdale, Westlock and WTA. Manufacturing locations, along with sales and service centers, are located across the Americas, Europe, the Middle East, Asia and Australia.
Commercial Valves is engaged primarily in the manufacturing and distribution of valves and related products for the non-residential construction, general industrial, and to a lesser extent, municipal markets. The primary geographies served include Canada, the United Kingdom, the Middle East and continental Europe. Brands include Stockham, Wask, Viking Johnson, IAT, Hattersley, NABIC, Sperryn, Wade, Rhodes and Brownall. Manufacturing facilities are located in the United Kingdom and China, with additional sales offices in continental Europe and the Middle East; distribution facilities are located throughout Canada.
Page 2
Other Products includes pumps and related products for water and wastewater applications in the industrial, municipal, commercial and military markets, primarily in the United States. Products are sold under the trade names Deming, Weinman, Burks and Barnes. Facilities are located in the United States and Canada.
Payment & Merchandising Technologies
The Payment & Merchandising Technologies segment consists of Crane Payment Innovations (“CPI”) and Merchandising Systems.
CPI provides high technology payment acceptance products that improve our customers’ productivity in numerous global markets including retail self-checkout, vending, casino gaming, government lotteries, parking, transit fare collection, payment kiosks and banking. Products for these markets include coin acceptors and dispensers, coin hoppers, coin recyclers, bill validators, bill recyclers and cashless systems. CPI facilities are located in the United States, Mexico, Japan, Switzerland, Germany and the Ukraine, with additional sales offices across the world.
Merchandising Systems is primarily engaged in the design and manufacture of vending equipment and related solutions. Merchandising Systems’ innovative products and solutions create value by improving the consumer experience, and driving higher same store, or vendor machine, profitability. Products include a full line of vending equipment that dispenses food, snack, and hot and cold beverages. Other solutions include vending management software, cashless payment products, and wireless connectivity to enable our customers to operate their businesses more profitably. Primary customers include vending operators and food and beverage companies, primarily in the United States and Europe. Facilities are located in the United States and the United Kingdom.
On January 10, 2018, we completed the acquisition of Crane & Co., Inc. (“Crane Currency”), a supplier of banknotes and highly engineered banknote security features. The base purchase price of the acquisition was $800 million on a cash-free, debt-free basis, subject to a later adjustment reflecting Crane Currency’s net working capital, cash, the assumption by Crane Co. of certain debt-like items, and Crane Currency’s transaction expenses. Founded in 1801, Crane Currency is a pioneer in advanced micro-optic security technology, and a fully integrated supplier of secure and highly engineered banknotes for central banks all over the world.
Aerospace & Electronics
The Aerospace & Electronics segment supplies critical components and systems, including original equipment and aftermarket parts, primarily for the commercial aerospace and military aerospace and defense markets. The commercial market and military market accounted for 69% and 31%, respectively, of total segment sales in 2017. Sales to original equipment manufacturers ("OEM") and aftermarket customers were 73% and 27%, respectively, in 2017.
Crane Aerospace & Electronics has strong brands which have been supplying products to these end markets for several decades. Brands include Hydro-Aire, ELDEC, Lear Romec, P.L. Porter, Keltec, Interpoint, Signal Technology, Merrimac Industries, and Polyflon.
Products include a wide range of custom designed, highly engineered products used in landing systems, sensing and utility systems, fluid management, seat actuation, power and microelectronic applications, and microwave systems.
Our products are sold directly to aircraft manufacturers, commercial Tier 1 integrators (companies which make products specifically for an aircraft manufacturer), defense and space prime contractors, airlines, government agencies including the United States ("U.S.") Department of Defense, foreign allied defense organizations, aircraft seat manufacturers, and aircraft maintenance, repair and overhaul organizations.
Facilities are located in the United States, Taiwan, and France.
Engineered Materials
The Engineered Materials segment manufactures fiberglass-reinforced plastic ("FRP") panels and coils, primarily for use in the manufacturing of recreational vehicles ("RVs"), truck bodies, truck trailers, with additional applications in commercial and industrial buildings. Engineered Materials sells the majority of its products directly to RV, trailer, and truck manufacturers, and it uses distributors and retailers to serve the commercial and industrial construction markets. Manufacturing facilities are located in the United States.
Acquisitions
On January 10, 2018, we completed the acquisition of Crane Currency, a supplier of banknotes and highly engineered banknote security features. See Part II, Item 8 under Note 16, “Subsequent Events,” in the Notes to Consolidated Financial Statements.
Page 3
In April 2017, we acquired all of the outstanding stock of Westlock Controls (“Westlock”) from Emerson Electric Co. for cash consideration of $40 million. Westlock is a global leader in the manufacturing and sale of switchboxes, position transmitters and other solutions for networking, monitoring and controlling process valves. With primary operations located in Saddle Brook, New Jersey, Westlock had 2016 sales of approximately $32 million. Allocation of the purchase price resulted in us recording goodwill of $23 million. This acquisition has been integrated into our Fluid Handling segment.
In June 2017, we acquired all of the outstanding stock of Microtronic AG (“Microtronic”) for cash consideration of approximately $18 million. With operations in Oensingen, Switzerland, Microtronic develops and manufactures closed electronic payment systems, primarily for the European vending market, strengthening our portfolio of cashless solutions. Allocation of the purchase price resulted in us recording goodwill of $9 million. This acquisition has been integrated into our Payment & Merchandising Technologies segment.
In December 2013, we completed the acquisition of MEI Conlux Holdings (U.S.), Inc. and its affiliate MEI Conlux Holdings (Japan), Inc. (together, “MEI”), a leading provider of payment solutions for unattended transaction systems, which serves customers in the transportation, gaming, retail, service payment and vending markets, for a purchase price of $804 million for all of the outstanding equity interests of MEI. Goodwill for this acquisition amounted to $438 million. MEI was integrated into our CPI business within our Payment & Merchandising Technologies segment.
Divestitures
In 2017, we sold a portion of an investment in a joint venture of which our ownership interest was 70%, within our Fluid Handling segment, for $14 million. As of December 31, 2017, our ownership interest in this joint venture was 4.9%. The sale resulted in the deconsolidation of such business and a gain in the amount of $1 million in the fourth quarter of 2017.
In 2014, we sold Crane Water, which was formerly part of our Fluid Handling segment, for $2 million and recorded a $1 million net loss. The business had sales of approximately $15 million in 2013.
In December 2013, as part of the execution of regulatory remedies associated with the MEI acquisition, we sold a product line, which was formerly part of our Payment & Merchandising Technologies segment, to Suzo-Happ Group for $7 million and recorded a $2 million gain. Sales of this product line were $15 million in 2013.
Other Matters Relating to Our Business as a Whole
Competitive Conditions
Our businesses participate in markets that are highly competitive. Because of the diversity of products manufactured and sold, our businesses typically have a different set of competitors in each geographic area and end market in which they participate. Accordingly, it is not possible to estimate the number of competitors, or precise market share; however, we believe that we are a principal competitor in most of our markets. Our primary basis of competition is providing high quality products, with technological differentiation, at competitive prices, with superior customer service and timely delivery.
Our products are sold into markets, including chemicals, oil & gas, power, automated payment solutions, banknote design and production and aerospace & defense, along with a wide range of general industrial and consumer related end markets. As such, our revenues depend on numerous unpredictable factors, including changes in market demand, general economic conditions, customer capital spending, timing and amount of contract awards and credit availability. Because our products are sold in such a wide variety of markets, we do not believe that we can reliably quantify or predict the potential effects of changes in any of the aforementioned factors.
Our engineering and product development activities are focused on improving existing products, customizing existing products for particular customer requirements, as well as the development of new products. We own numerous patents, trademarks, copyrights, trade secrets and licenses to intellectual property, no one of which is of such importance that termination would materially affect our business. From time to time, however, we do engage in litigation to protect our intellectual property.
Research and Development
Research and development costs are expensed when incurred. These costs were $59 million, $62 million and $63 million in 2017, 2016 and 2015, respectively, and were incurred primarily by our Aerospace & Electronics and Payment & Merchandising Technologies segments.
Page 4
Our Customers
No customer accounted for more than 10% of our consolidated revenues in 2017, 2016 or 2015.
Backlog
The following sets forth the unfulfilled orders attributable to each of our segments as of the indicated dates:
(in millions) | December 31, 2017 | December 31, 2016 | ||||||
Fluid Handling | $ | 262 | $ | 228 | ||||
Payment & Merchandising Technologies | 76 | 94 | ||||||
Aerospace & Electronics | 374 | 353 | ||||||
Engineered Materials | 14 | 16 | ||||||
Total Backlog | $ | 726 | $ | 691 | ||||
Our Employees
As of December 31, 2017, we employed approximately 10,600 people in the Americas, Europe, the Middle East, Asia and Australia. For a discussion of risks related to employee relations, please refer to Item 1A. “Risk Factors.”
Raw Materials
Our manufacturing operations employ a wide variety of raw materials, including steel, copper, cast iron, electronic components, aluminum, plastics, cotton, flax and various petroleum-based products. We purchase raw materials from a large number of independent sources around the world. Although market forces have at times caused increases in the costs of steel, copper and petroleum-based products, there have been no raw materials shortages that have had a material adverse impact on our business, and we believe that we will generally be able to obtain adequate supplies of major raw material requirements or reasonable substitutes at acceptable costs.
Seasonal Nature of Business
In aggregate, our business does not experience significant seasonality.
Government Contracts
We have agreements relating to the sale of products to government entities, primarily involving products in our Aerospace & Electronics and Payment & Merchandising Technologies segments and, to a lesser extent, our Fluid Handling segment. As a result, we are subject to various statutes and regulations that apply to companies doing business with the government. The laws and regulations governing government contracts differ from those governing private contracts. For example, some government contracts require disclosure of cost and pricing data and impose certain sourcing conditions that are not applicable to private contracts. Our failure to comply with these laws could result in suspension of these contracts, criminal or civil sanctions, administrative penalties and fines or suspension or debarment from government contracting or subcontracting for a period of time. For a further discussion of risks related to compliance with government contracting requirements; please refer to Item 1A. “Risk Factors.”
Recent Financing Arrangements
On December 20, 2017, we entered into a $150 million 364-day credit agreement (the "364-day Credit Agreement") and a $200 million 3-year term loan credit agreement (the "3-year Term Loan Credit Agreement") to fund our acquisition of Crane Currency. On January 10, 2018, the date we completed the acquisition, we used $340 million under our existing commercial paper program (the "CP Program"), drew $100 million and $200 million from the 364-day Credit Agreement and 3-year Term Loan Credit Agreement, respectively, and used cash on hand to fund the acquisition. See Part II, Item 8 under Note 8, “Long-Term Debt,” and Note 16, “Subsequent Events,” in the Notes to Consolidated Financial Statements.
On February 5, 2018, we completed a public offering of $350 million aggregate principal amount of 4.20% Senior Notes due 2048 (the "Public Offering"). We used the net proceeds from the Public Offering, together with cash on hand, to repay all of the then outstanding $100 million under the 364-day Credit Agreement. We also issued a notice of redemption on February 7, 2018, with an effective date of March 7, 2018, for our 2.75% notes due in December 2018 with an outstanding principal value of $250 million. See Part II, Item 8 under Note 16, “Subsequent Events,” in the Notes to Consolidated Financial Statements.
Page 5
Available Information
We file annual, quarterly and current reports and amendments to these reports, proxy statements and other information with the U.S. Securities and Exchange Commission (“SEC”). You may read and copy any materials we file with the SEC at the SEC’s Public Reference Room at 100 F Street, NE, Washington, DC 20549. You may obtain information on the operation of the Public Reference Room by calling the SEC at 1-800-SEC-0330. The SEC maintains an Internet site that contains reports, proxy and information statements and other information regarding issuers, like us, that file electronically with the SEC. The address of the SEC’s website is www.sec.gov.
We also make our filings available free of charge through our Internet website, as soon as reasonably practicable after filing such material electronically with, or furnishing such material, to the SEC. Also posted on our website are our Corporate Governance Guidelines, Standards for Director Independence, Crane Co. Code of Ethics and the charters and a brief description of each of the Audit Committee, the Management Organization and Compensation Committee and the Nominating and Governance Committee. These items are available in the “Investors – Corporate Governance” section of our website at www.craneco.com. The content of our website is not part of this report.
Page 6
Executive Officers of the Registrant
Name | Position | Business Experience During Past Five Years | Age | Executive Officer Since | ||||
Max H. Mitchell | President and Chief Executive Officer | Chief Executive Officer since January 2014. President since January 2013. Chief Operating Officer from 2011 through January 2013. | 54 | 2004 | ||||
Curtis A. Baron, Jr. | Vice President, Controller | Vice President, Controller since 2011. | 48 | 2011 | ||||
Brendan J. Curran | President, Aerospace & Electronics | President, Aerospace & Electronics since February 2015. Group President, Aerospace from May 2013 through February 2015. Vice President, Business Development, Strategy & Partnerships, Commercial Engines, United Technologies Corporation from 2012 through June 2013. | 55 | 2013 | ||||
Anthony M. D'Iorio | Vice President, General Counsel and Secretary | Vice President, General Counsel and Secretary since February 2018. Deputy General Counsel from January 2014 through February 2018. Assistant General Counsel from 2005 through January 2014. | 54 | 2018 | ||||
Bradley L. Ellis | Senior Vice President | Senior Vice President since December 2014. Group President, Merchandising Systems from 2003 through December 2014. | 49 | 1997 - 2003 2007 - present | ||||
James A. Lavish | Vice President, CBS, People & Performance | Vice President, CBS, People & Performance since January 2016. Vice President, Crane Business System from March 2013 through January 2016. President, Crane Pumps & Systems from 2008 to March 2013. | 51 | 2016 | ||||
Richard A. Maue | Vice President - Finance and Chief Financial Officer | Vice President - Finance and Chief Financial Officer since January 2013. Principal Accounting Officer since 2007. | 47 | 2007 | ||||
Anthony D. Pantaleoni | Vice President, Environment, Health and Safety | Vice President, Environment, Health and Safety since 1989. | 63 | 1989 | ||||
Louis V. Pinkham | Senior Vice President | Senior Vice President since December 2014. Group President, Fluid Handling from 2012 through December 2014. | 46 | 2012 | ||||
Kristian R. Salovaara | Vice President of Business Development and Strategy | Vice President of Business Development and Strategy since March 2014. Vice President, Business Development from 2011 to March 2014. | 57 | 2011 | ||||
Edward S. Switter | Vice President, Treasurer and Tax | Vice President, Treasurer and Tax since September 2016. Vice President, Tax from 2011 through September 2016. | 43 | 2011 | ||||
Page 7
Item 1A. Risk Factors
The following is a description of what we consider the key challenges and risks confronting our business. This discussion should be considered in conjunction with the discussion under the caption “Forward-Looking Information” preceding Part I, the information set forth under Item 1, “Business” and with the discussion of the business included in Part II, Item 7, “Management’s Discussion and Analysis of Financial Condition and Results of Operations.” These risks comprise the material risks of which we are aware. If any of the events or developments described below or elsewhere in this Annual Report on Form 10-K, or in any documents that we subsequently file publicly were to occur, it could have a material adverse effect on our business, financial condition or results of operations.
Risks Relating to Our Business
We are subject to numerous lawsuits for asbestos-related personal injury, and costs associated with these lawsuits may adversely affect our results of operations, cash flow and financial position.
We are subject to numerous lawsuits for asbestos-related personal injury. Estimation of our ultimate exposure for asbestos-related claims is subject to significant uncertainties, as there are multiple variables that can affect the timing, severity and quantity of claims. Our estimate of the future expense of these claims is derived from assumptions with respect to future claims, settlement and defense costs which are based on experience during the last few years and which may not prove reliable as predictors. A significant upward or downward trend in the number of claims filed, depending on the nature of the alleged injury, the jurisdiction where filed and the quality of the product identification, or a significant upward or downward trend in the costs of defending claims, could change the estimated liability, as would substantial adverse verdicts at trial or on appeal. A legislative solution or a structured settlement transaction could also change the estimated liability. These uncertainties may result in our incurring future charges or increases to income to adjust the carrying value of recorded liabilities and assets, particularly if the number of claims and settlements and defense costs escalates or if legislation or another alternative solution is implemented; however, we are currently unable to predict such future events. The resolution of these claims may take many years, and the effect our results of operations, cash flow and financial position in any given period from a revision to these estimates could be material.
As of December 31, 2017, we were one of a number of defendants in cases involving 32,234 pending claims filed in various state and federal courts that allege injury or death as a result of exposure to asbestos. See Part II, Item 8 under Note 11, “Commitments and Contingencies,” in the Notes to Consolidated Financial Statements for additional information on:
• | Our pending claims; |
• | Our historical settlement and defense costs for asbestos claims; |
• | The liability we have recorded in our financial statements for pending and reasonably anticipated asbestos claims through 2059; |
• | The asset we have recorded in our financial statements related to our estimated insurance coverage for asbestos claims; and |
• | Uncertainties related to our net asbestos liability. |
In the fourth quarter of 2016, we updated and extended the estimate of our asbestos liability and recorded a pre-tax charge of $192 million ($125 million after tax). Our updated liability estimate is for pending and reasonably anticipated asbestos claims through the generally accepted end point of such claims in 2059. Due to uncertainties in the tort system, as well as uncertainties inherent in the estimation process, future reviews may result in adjustments to our total asbestos-related liability. The aggregate liability was $605 million as of December 31, 2017.
Macroeconomic fluctuations may harm our business, results of operations and stock price.
Our business, financial condition, operating results and cash flows may be adversely affected by changes in global economic conditions and geopolitical risks, including credit market conditions, levels of consumer and business confidence, commodity prices, exchange rates, levels of government spending and deficits, political conditions and other challenges that could affect the global economy. These economic conditions could affect businesses such as ours in a number of ways. Such conditions could have an adverse impact on our flexibility to react to changing economic and business conditions and on our ability to fund our operations or refinance maturing debt balances at economically favorable interest rates. In addition, restrictions on credit availability could adversely affect the ability of our customers to obtain financing for significant purchases and could result in decreases in or cancellation of orders for our products and services as well as impact the ability of our customers to make payments. Similarly, credit restrictions may adversely affect our supplier base and increase the potential for one or more of our suppliers to experience financial distress or bankruptcy. See “Specific Risks Related to Our Business Segments”.
Page 8
Demand for our products is variable and subject to factors beyond our control, which could result in unanticipated events significantly impacting our results of operations.
A substantial portion of our sales is concentrated in industries that are cyclical in nature or subject to market conditions which may cause customer demand for our products to be volatile. These industries often are subject to fluctuations in domestic and international economies as well as to currency fluctuations and inflationary pressures. Reductions in demand by these industries would reduce the sales and profitability of the affected business segments. Our Fluid Handling business is dependent on global economic conditions, customer capital spending and commodity prices. Deterioration in any of these economic factors could result in sales and profits falling below our current outlook. Results at our Payment & Merchandising Technologies segment could be affected by sustained weakness in certain geographic markets such as China or certain end markets such as gaming, retail or banking, as well as low employment levels, office occupancy rates and factors affecting vending operator profitability such as higher fuel, food and equipment financing costs; results could also be impacted by unforeseen advances in payment processing technologies. In addition, our results in this segment are subject to significant variability due to the timing and size of contract awards by central banks for banknote production. In our Aerospace & Electronics segment, a significant decline in demand for air travel, or a decline in airline profitability generally, could result in reduced orders for aircraft and could also cause airlines to reduce their purchases of repair parts from our businesses. In addition, our Aerospace & Electronics segment could also be impacted to the extent that major aircraft manufacturers encountered production problems, or if pricing pressure from aircraft customers caused the manufacturers to press their suppliers to lower prices and/or extend payment terms; in addition, demand for military and defense products is dependent upon government spending, which remains uncertain. In our Engineered Materials segment, sales and profits could be affected by declines in demand for truck trailers, RVs, or building products; results could also be impacted by unforeseen capacity constraints or price increases related to certain raw materials, in particular, resin.
We may be unable to identify or to complete acquisitions, or to successfully integrate the businesses we acquire.
We have evaluated, and expect to continue to evaluate, a wide array of potential acquisition transactions. Our acquisition program attempts to address the potential risks inherent in assessing the value, strengths, weaknesses, contingent or other liabilities, systems of internal control and potential profitability of acquisition candidates, as well as other challenges such as retaining the employees and integrating the operations of the businesses we acquire. Integrating acquired operations, such as our 2018 acquisition of Crane Currency, involves significant risks and uncertainties, including:
• | Maintenance of uniform standards, controls, policies and procedures; |
• | Diversion of management’s attention from normal business operations during the integration process; |
• | Unplanned expenses associated with the integration efforts; |
• | Inability to achieve planned facility repositioning savings or related efficiencies from recent and ongoing investments in our Malta facility; and |
• | Unidentified issues not discovered in the due diligence process, including legal contingencies |
There can be no assurance that suitable acquisition opportunities will be available in the future, that we will continue to acquire businesses or that any business acquired will be integrated successfully or prove profitable, which could adversely impact our growth rate. Our ability to achieve our growth goals depends in part upon our ability to identify and successfully acquire and integrate companies and businesses at appropriate prices and realize anticipated cost savings.
Our operations expose us to the risk of environmental liabilities, costs, litigation and violations that could adversely affect our financial condition, results of operations, cash flow and reputation.
Our operations are subject to environmental laws and regulations in the jurisdictions in which they operate, which impose limitations on the discharge of pollutants into the ground, air and water and establish standards for the generation, treatment, use, storage and disposal of solid and hazardous wastes. We must also comply with various health and safety regulations in the U.S. and abroad in connection with our operations. Failure to comply with any of these laws could result in civil and criminal liability, monetary and non-monetary penalties and damage to our reputation. In addition, we cannot provide assurance that our costs related to remedial efforts or alleged environmental damage associated with past or current waste disposal practices or other hazardous materials handling practices will not exceed our estimates or adversely affect our financial condition, results of operations and cash flow. For example, in 2014, the U.S. Environmental Protection Agency issued a Record of Decision amendment requiring, among other things, additional source area remediation resulting in us recording a charge of $49 million pertaining to the Phoenix-Goodyear Airport North Superfund Site (the "Goodyear Site"), extending the accrued costs through 2022. The total estimated gross liability was $41 million as of December 31, 2017, of which we have recorded a receivable of $9 million for the expected reimbursements from the U.S. Government in respect of the aggregate liability as at that date.
Page 9
Additional tax expense or exposures could affect our financial condition, results of operations and cash flow.
We are subject to income taxes in the U.S. and various international jurisdictions. Our future results of operations could be affected by changes in our effective tax rate and/or cash paid for income taxes as a result of a change in the mix of earnings in countries with differing statutory tax rates, changes in tax laws, regulations and judicial rulings, including the recently enacted Tax Cuts and Jobs Act of 2017 (the “TCJA”). In addition, changes in the valuation of deferred tax assets and liabilities, changes in the amount of earnings permanently reinvested offshore, and the results of audits and examinations of previously filed tax returns could also have an effect on our financial conditions, results of operations and cash flow.
Enactment of the TCJA on December 22, 2017 brought significant changes to existing U.S. federal corporate income tax laws, including the reduction of the federal corporate income tax rate from 35% to 21%, modifying how distributions from our foreign subsidiaries are taxed in the U.S., and imposing a one-time tax on cumulative undistributed foreign earnings. The ultimate impact of the TCJA may differ from our provisional estimates due to changes in interpretations and assumptions made by us, as well as the issuance of further regulations or guidance by U.S. regulatory and standard-setting bodies. In addition, uncertainty exists as to how U.S. states and other countries within which we operate will react to the changes brought about by the TCJA. Any significant changes to our provisional estimates resulting from these items may result in a material adverse effect on our business, financial condition, results of operations, or cash flows.
Our businesses are subject to extensive governmental regulation; failure to comply with those regulations could adversely affect our financial condition, results of operations, cash flow and reputation.
We are required to comply with various import and export control laws, which may affect our transactions with certain customers, particularly in our Aerospace & Electronics, Fluid Handling and Payment & Merchandising Technology segments, as discussed more fully under “Specific Risks Relating to Our Business Segments”. In certain circumstances, export control and economic sanctions regulations may prohibit the export of certain products, services and technologies, and in other circumstances we may be required to obtain an export license before exporting the controlled item. A failure to comply with these requirements might result in suspension of these contracts and suspension or debarment from government contracting or subcontracting. In addition, we are subject to the Foreign Corrupt Practices Act, which prohibits U.S. companies and their intermediaries from making improper payments to foreign officials for the purpose of obtaining or retaining business, or securing any improper advantage. We are also subject to the anti-bribery laws of other jurisdictions. Failure to comply with any of these regulations could result in civil and criminal liability, monetary and non-monetary penalties, fines, disruptions to our business, limitations on our ability to export products and services, and damage to our reputation.
The prices of our raw materials could fluctuate dramatically, which may adversely affect our profitability.
The costs of certain raw materials that are critical to our profitability are volatile. This volatility can have a significant impact on our profitability. The costs in our Engineered Materials segment are affected by fluctuations in the price of resin, with lesser exposure to other input costs. The costs in our Fluid Handling, Payment & Merchandising Technologies and Aerospace & Electronics segments are affected by fluctuations in the price of cotton, flax and metals such as steel and copper. While we have taken actions aimed at securing an adequate supply of raw materials at prices which are favorable to us, if the prices of critical raw materials increase, our operating costs could be negatively affected.
Our ability to source parts and raw materials from our suppliers is uncertain, and any disruptions or delays in our supply chain could negatively affect our results of operations.
Our operations require significant amounts of necessary parts and raw materials. We are engaged in a continuous, company-wide effort to source our parts and raw materials from fewer suppliers, and to obtain parts from suppliers in low-cost countries where possible. If we are unable to source these parts or raw materials, our operations may be disrupted, or we could experience a delay or halt in certain of our manufacturing operations. We believe that our supply management and production practices are based on an appropriate balancing of the foreseeable risks and the costs of alternative practices. Nonetheless, supplier capacity constraints, supplier production disruptions, supplier financial condition, increases in duties and tariff costs, price volatility or the unavailability of some raw materials could have an adverse effect on our operating results and financial condition.
We could face potential product liability or warranty claims, we may not accurately estimate costs related to such claims, and we may not have sufficient insurance coverage available to cover such claims.
Our products are used in a wide variety of commercial applications and certain residential applications. We face an inherent business risk of exposure to product liability or other claims in the event our products are alleged to be defective or that the use of our products is alleged to have resulted in harm to others or to property. We may in the future incur liability if product liability lawsuits against us are successful. Moreover, any such lawsuits, whether or not successful, could result in adverse publicity to us, which could cause our sales to decline.
Page 10
In addition, consistent with industry practice, we provide warranties on many of our products and we may experience costs of warranty or breach of contract claims if our products have defects in manufacture or design or they do not meet contractual specifications. We estimate our future warranty costs based on historical trends and product sales, but we may fail to accurately estimate those costs and thereby fail to establish adequate warranty reserves for them.
We maintain insurance coverage to protect us against product liability claims, but that coverage may not be adequate to cover all claims that may arise or we may not be able to maintain adequate insurance coverage in the future at an acceptable cost. Any liabilities not covered by insurance or that exceed our established reserves could materially and adversely impact our financial condition and results of operations.
We may be unable to improve productivity, reduce costs and align manufacturing capacity with customer demand.
We are committed to continuous productivity improvement, and we continue to evaluate opportunities to reduce costs, simplify or improve global processes, and increase the reliability of order fulfillment and satisfaction of customer needs. In order to operate more efficiently and control costs, from time to time we execute restructuring activities, which include workforce reductions and facility consolidations. For example, we recorded a pre-tax restructuring charge, net of gain on property sale, of $13 million in 2017 associated with broad-based repositioning actions designed to improve profitability. Together with additional restructuring costs of approximately $17 million, we expect to achieve $30 million in annualized savings by 2020. While these are proactive actions to increase our productivity and operating effectiveness, our failure to respond to potential declines in global demand for our products and services and properly align our cost base could have an adverse effect on our financial condition, results of operations and cash flow.
We may be unable to successfully develop and introduce new products, which would limit our ability to grow and maintain our competitive position and adversely affect our financial condition, results of operations and cash flow.
Our growth depends, in part, on continued sales of existing products, as well as the successful development and introduction of new products or technologies, which face the uncertainty of customer acceptance and reaction from competitors. Any delay in the development or launch of a new product could result in our not being the first to market, which could compromise our competitive position. Further, the development and introduction of new products may require us to make investments in specialized personnel and capital equipment, increase marketing efforts and reallocate resources away from other uses. We also may need to modify our systems and strategy in light of new products that we develop. If we are unable to develop and introduce new products in a cost-effective manner or otherwise manage effectively the operations related to new products, our results of operations and financial condition could be adversely impacted.
Our business could be harmed if we are unable to protect our intellectual property.
We rely on a combination of trade secrets, patents, trademarks, copyrights and confidentiality procedures to protect our products and technology. Existing trade secret, patent, trademark and copyright laws offer only limited protection. Our patents could be invalidated or circumvented. In addition, others may develop substantially equivalent, or superseding proprietary technology, or competitors may offer equivalent non-infringing products in competition with our products, thereby substantially reducing the value of our proprietary rights. The laws of some foreign countries in which our products are or may be manufactured or sold may not protect our products or intellectual property rights to the same extent as do the laws of the U.S. We cannot assure that the steps we take to protect our intellectual property will be adequate to prevent misappropriation of our technology. Our inability to protect our intellectual property could have a negative impact on our operations and financial results.
Pension expense and pension contributions associated with our retirement benefit plans may fluctuate significantly depending upon changes in actuarial assumptions and future market performance of plan assets.
Total pension benefit and pension contributions were $8 million and $13 million, respectively, in 2017. The costs of our defined benefit pension plans are dependent upon various factors, including rates of return on investment assets, discount rates for future payment obligations, and expected mortality, among other things. In addition, funding requirements for benefit obligations of our pension plans are subject to legislative and other government regulatory actions. Variances in related estimates could have an impact on our consolidated financial position, results of operations and cash flow.
We face significant competition which may adversely impact our results of operations and financial position in the future.
While we are a principal competitor in most of our markets, all of our markets are highly competitive. The competitors in many of our business segments can be expected in the future to improve technologies, reduce costs and develop and introduce new products. The ability of our business segments to achieve similar advances will be important to our competitive positions. Competitive pressures, including those discussed above, could cause one or more of our business segments to lose market share or could result in significant price erosion, either of which could have an adverse effect on our results of operations.
Page 11
We conduct a substantial portion of our business outside the U.S. and face risks inherent in non-domestic operations.
Net sales and assets related to our operations outside the U.S. were 37% and 36% of our consolidated amounts, respectively, in 2017. These operations and transactions are subject to the risks associated with conducting business internationally, including the risks of currency fluctuations, slower payment of invoices, adverse trade regulations and possible social, economic and political instability in the countries and regions in which we operate. In addition, we expect that non-U.S. sales will continue to account for a significant portion of our revenues for the foreseeable future. Accordingly, fluctuations in foreign currency exchange rates, primarily the euro, the British pound, the Canadian dollar and the Japanese yen, could adversely affect our reported results, primarily in our Fluid Handling and Payment & Merchandising Technologies segments, as amounts earned in other countries are translated into U.S. dollars for reporting purposes.
We are dependent on key personnel, and we may not be able to retain our key personnel or hire and retain additional personnel needed for us to sustain and grow our business as planned.
Certain of our business segments and corporate offices are dependent upon highly qualified personnel, and we generally are dependent upon the continued efforts of key management employees. We may have difficulty retaining such personnel or locating and hiring additional qualified personnel. The loss of the services of any of our key personnel or our failure to attract and retain other qualified and experienced personnel on acceptable terms could impair our ability to successfully sustain and grow our business, which could impact our results of operations in a materially adverse manner.
If our internal controls are found to be ineffective, our financial results or our stock price may be adversely affected.
We believe that we currently have adequate internal control procedures in place for future periods, including processes related to newly acquired businesses; however, increased risk of internal control breakdowns generally exists in a business environment that is decentralized. In addition, if our internal control over financial reporting is found to be ineffective, investors may lose confidence in the reliability of our financial statements, which may adversely affect our stock price.
Failure to maintain the security of our information systems and technology networks, including personally identifiable and other information, non-compliance with our contractual or other legal obligations regarding such information, or a violation of our privacy and security policies with respect to such information, could adversely affect us.
We are dependent on information technology networks and systems, including the Internet, to process, transmit and store electronic information, and, in the normal course of our business, we collect and retain certain types of personally identifiable and other information pertaining to our customers, stockholders and employees. The legal, regulatory and contractual environment surrounding information security and privacy is constantly evolving and companies that collect and retain such information are under increasing attack by cyber-criminals around the world. A theft, loss, fraudulent use or misuse of customer, stockholder, employee or our proprietary data by cybercrime or otherwise, non-compliance with our contractual or other legal obligations regarding such data or a violation of our privacy and security policies with respect to such data could adversely impact our reputation and could result in costs, fines, litigation or regulatory action against us. Security breaches can create system disruptions and shutdowns that could result in disruptions to our operations. We cannot be certain that advances in criminal capabilities, new vulnerabilities or other developments will not compromise or breach the security solutions protecting our information technology, networks and systems.
The results of the United Kingdom’s (“UK”) European Union (“EU”) membership referendum could adversely affect customer demand, our relationships with customers and suppliers and our business and financial statements.
Approximately 37% of our sales are conducted outside of the U.S., the majority of which is in the UK and the EU. The results of the UK’s June 2016 EU membership referendum (commonly referred to as "Brexit"), advising for the exit of the UK from the EU, has caused and may continue to cause volatility in global stock markets, currency exchange rate fluctuations and global economic uncertainty, which could adversely affect customer demand, our relationships with customers and suppliers and our business and financial statements.
Our future results of operations and financial condition could be adversely impacted by intangible asset impairment charges.
As of December 31, 2017, we had goodwill and other intangible assets, net of accumulated amortization, of approximately $1,484 million, which represented approximately 41% of our total assets. Our goodwill is subject to an impairment test on an annual basis and is also tested whenever events and circumstances indicate that goodwill may be impaired. Any excess goodwill resulting from the impairment test must be written off in the period of determination. Intangible assets (other than goodwill) are generally amortized over the useful life of such assets. In addition, from time to time, we may acquire or make an investment in a business that will require us to record goodwill based on the purchase price and the value of the acquired assets. We may subsequently experience unforeseen issues with such business that adversely affect the anticipated returns of the business or value of the intangible assets and trigger an evaluation of the recoverability of the recorded goodwill
Page 12
and intangible assets for such business. Future determinations of significant write-offs of goodwill or intangible assets as a result of an impairment test or any accelerated amortization of other intangible assets could adversely affect our results of operations and financial condition.
Specific Risks Relating to Our Reportable Segments
Fluid Handling
Our Fluid Handling segment competes in markets that are fragmented and highly competitive. The business competes against large, well established global companies, as well as smaller regional and local companies. We compete based on our products’ quality, reliability and safety, our brand reputation, value-added technical expertise and customer support and consistent on-time delivery. However, pricing can be highly competitive, particularly in regions and end markets with weakening levels of demand, or in markets where our value proposition - quality, reliability, and safety - is not valued as highly.
Demand for our Fluid Handling products is heavily dependent on our customers’ level of new capital investment and planned maintenance expenditures. Customer spending typically depends on general economic conditions, availability of credit, and expectations of future demand. Slowing global economic growth, volatility in commodity prices, including continued weakness in oil prices could all contribute to lower levels of customer spending, and project delays or cancellations.
A portion of this segment’s business is subject to government contracting rules and regulations. Failure to comply with these requirements could result in suspension or debarment from government contracting or subcontracting, civil and criminal liability, monetary and non-monetary penalties, disruptions to our business, limitations on our ability to export products and services, or damage to our reputation. At our foreign operations, results could also be adversely impacted by a weakening of local currencies against the U.S. dollar; our Fluid Handling business has the greatest exposure to the euro, British pound, and Canadian dollar, although there is lesser exposure to several other currencies.
Payment & Merchandising Technologies
Our Payment & Merchandising Technologies segment sales are dependent on capital spending in a variety of end markets and across numerous geographies. The level of capital expenditures by our customers depends on general economic conditions, availability of credit, and expectations of future demand. In addition, our results in this segment are subject to significant variability due to the timing and size of contract awards by central banks for banknote production. Our results in this segment could be adversely impacted if our recently acquired Crane Currency business is not integrated successfully, including achieving planned cost savings from ongoing repositioning actions.
This business regularly develops and markets new products. Delays in the product development process, or the inability of new products to meet targeted performance measures, could hurt future sales. This business is also directly and indirectly exposed to changes in government regulations; for example, changes in gaming regulations could influence the spending patterns of our casino operator customers, or changes in anti-money laundering regulations could result in additional technical requirements for our products.
At our foreign operations, results could also be adversely impacted by a weakening of local currencies against the U.S. dollar; the business has the greatest exposure to the euro, British pound, the Japanese yen, the Mexican peso, and the Canadian dollar, although there is lesser exposure to several other currencies. In addition, our facility in Mexico operates under the Mexican Maquiladora program. This program provides for reduced tariffs and eased import regulations; we could be adversely affected by changes in such program, or by our failure to comply with its requirements.
Aerospace & Electronics
Our Aerospace & Electronics segment sales are primarily affected by conditions in the commercial aerospace industry which is cyclical in nature, and by changes in defense spending by the U.S. government.
Commercial aircraft are procured primarily by airlines, and airline capital spending can be affected by a number of factors including credit availability, current and expected fuel prices, and current and forecast air traffic demand levels. Air traffic levels are affected by a different array of factors including general economic conditions and global corporate travel spending, although other non-economic events can also adversely impact airline traffic, including terrorism or pandemic health concerns. Our commercial business is also affected by the market for business jets where demand is typically tied to corporate profitability levels, and the freight markets which are most heavily influenced by general economic conditions. Demand for our commercial aftermarket business is closely tied to total aircraft flight hours. Any decrease in demand for new aircraft or equipment, or use of existing aircraft and equipment, would likely result in decreased sales of our products and services.
The defense portion of the segment’s business is dependent primarily on U.S. government spending, and to a lesser extent, foreign government spending, on the specific military platforms and programs where our business participates. Any reduction
Page 13
in appropriations for these platforms or programs could impact the performance of our business. Our sales to defense customers are also affected by the level of activity in military flight operations.
We are required to comply with various export control laws, which may affect our transactions with certain customers. In certain circumstances, export control and economic sanctions regulations may prohibit the export of certain products, services and technologies, and in other circumstances we may be required to obtain an export license before exporting the controlled item. We are also subject to investigation and audit for compliance with the requirements governing government contracts, including requirements related to procurement integrity, manufacturing practices and quality procedures, export control, employment practices, the accuracy of records and the recording of costs and information security requirements. A failure to comply with these requirements could result in suspension of these contracts, and suspension or debarment from government contracting or subcontracting. Failure to comply with any of these regulations could result in civil and criminal liability, monetary and non-monetary penalties, fines, disruptions to our business, limitations on our ability to export products and services, and damage to our reputation.
Due to the lengthy research and development cycle involved in bringing commercial and military products to market, we cannot accurately predict the demand levels that will exist once a given new product is ready for market. In addition, if we are unable to develop and introduce new products in a cost-effective manner or otherwise effectively manage the introduction of new products and/or programs, our results of operations and financial condition could be adversely impacted. Demand for our products could also be adversely impacted by industry consolidation that could result in greater acceptance of competitors' products.
Engineered Materials
Our Engineered Materials segment manufactures and sells FRP panels and coils, primarily for use in the manufacturing of RVs, trucks, and trailers, with additional applications in commercial and industrial building construction. Demand in these end markets is dependent on general economic conditions, credit availability, and consumer and corporate spending levels. A decline in demand in any of these end markets, a loss of market share, or customer pricing pressure, would result in lower sales and profits for this business. Profitability could also be adversely affected by an increase in the price of resin or fiberglass if we are unable to pass the incremental costs on to our customers. Additional risks include the loss of a principal supplier, and potential loss of market share to competing materials, such as wood or aluminum.
Item 1B. Unresolved Staff Comments
None
Page 14
Item 2. Properties
The following is a summary of Crane Co.'s principal facilities as of December 31, 2017:
Facilities - Owned | ||||||||||||||||||||||||||||||||||||
Location | Fluid Handling | Payment & Merchandising Technologies | Aerospace & Electronics | Engineered Materials | Corporate | Total | ||||||||||||||||||||||||||||||
Number | Area (sq. ft.) | Number | Area (sq. ft.) | Number | Area (sq. ft.) | Number | Area (sq. ft.) | Number | Area (sq. ft.) | Number | Area (sq. ft.) | |||||||||||||||||||||||||
Manufacturing: | ||||||||||||||||||||||||||||||||||||
United States | 6 | 784,000 | 2 | 568,000 | 6 | 708,000 | 4 | 644,000 | — | — | 18 | 2,704,000 | ||||||||||||||||||||||||
Canada | — | — | — | — | — | — | — | — | — | — | — | — | ||||||||||||||||||||||||
Europe | 7 | 1,081,000 | 3 | 338,000 | — | — | — | — | — | — | 10 | 1,419,000 | ||||||||||||||||||||||||
Other international | 5 | 469,000 | 2 | 295,000 | — | — | — | — | — | — | 7 | 764,000 | ||||||||||||||||||||||||
18 | 2,334,000 | 7 | 1,201,000 | 6 | 708,000 | 4 | 644,000 | — | — | 35 | 4,887,000 | |||||||||||||||||||||||||
Non-Manufacturing: | — | — | ||||||||||||||||||||||||||||||||||
United States | 3 | 138,000 | 1 | 15,000 | — | — | — | — | — | — | 4 | 153,000 | ||||||||||||||||||||||||
Canada | 7 | 155,000 | — | — | — | — | — | — | — | — | 7 | 155,000 | ||||||||||||||||||||||||
Europe | 2 | 74,000 | — | — | — | — | — | — | — | — | 2 | 74,000 | ||||||||||||||||||||||||
Other international | — | — | — | — | — | — | — | — | — | — | — | — | ||||||||||||||||||||||||
12 | 367,000 | 1 | 15,000 | — | — | — | — | — | — | 13 | 382,000 | |||||||||||||||||||||||||
Facilities - Leased | ||||||||||||||||||||||||||||||||||||
Location | Fluid Handling | Payment & Merchandising Technologies | Aerospace & Electronics | Engineered Materials | Corporate | Total | ||||||||||||||||||||||||||||||
Number | Area (sq. ft.) | Number | Area (sq. ft.) | Number | Area (sq. ft.) | Number | Area (sq. ft.) | Number | Area (sq. ft.) | Number | Area (sq. ft.) | |||||||||||||||||||||||||
Manufacturing | ||||||||||||||||||||||||||||||||||||
United States | 3 | 130,000 | — | — | 2 | 97,000 | — | — | — | — | 5 | 227,000 | ||||||||||||||||||||||||
Canada | 1 | 21,000 | 1 | 61,000 | — | — | — | — | — | — | 2 | 82,000 | ||||||||||||||||||||||||
Europe | 3 | 518,000 | — | — | — | — | — | — | — | — | 3 | 518,000 | ||||||||||||||||||||||||
Other international | 2 | 112,000 | — | — | 2 | 116,000 | — | — | — | — | 4 | 228,000 | ||||||||||||||||||||||||
9 | 781,000 | 1 | 61,000 | 4 | 213,000 | — | — | — | — | 14 | 1,055,000 | |||||||||||||||||||||||||
Non-Manufacturing | ||||||||||||||||||||||||||||||||||||
United States | 3 | 43,000 | 7 | 138,000 | 2 | 13,000 | 3 | 79,000 | 2 | 40,000 | 17 | 313,000 | ||||||||||||||||||||||||
Canada | 23 | 477,000 | — | — | — | — | — | — | — | — | 23 | 477,000 | ||||||||||||||||||||||||
Europe | 6 | 50,000 | 8 | 66,000 | 3 | 22,000 | — | — | — | — | 17 | 138,000 | ||||||||||||||||||||||||
Other international | 19 | 147,000 | 7 | 55,000 | — | — | — | — | — | — | 26 | 202,000 | ||||||||||||||||||||||||
51 | 717,000 | 22 | 259,000 | 5 | 35,000 | 3 | 79,000 | 2 | 40,000 | 83 | 1,130,000 | |||||||||||||||||||||||||
In our opinion, these properties have been well maintained, are in good operating condition and contain all necessary equipment and facilities for their intended purposes.
Item 3. Legal Proceedings.
Discussion of legal matters is incorporated by reference to Part II, Item 8 under Note 11, “Commitments and Contingencies,” in the Notes to Consolidated Financial Statements.
Item 4. Mine Safety Disclosures.
Not applicable.
Page 15
Part II
Item 5. Market for the Registrant’s Common Equity, Related Stockholder Matters and Issuer Purchases of Equity Securities
Crane Co. common stock is traded on the New York Stock Exchange (“NYSE”) under the symbol CR. The following are the high and low sale prices as reported by the NYSE and the quarterly dividends declared per share for each quarter of 2017 and 2016.
MARKET AND DIVIDEND INFORMATION — CRANE CO. COMMON SHARES
New York Stock Exchange Composite Price per Share | Dividends per Share | |||||||||||||||||||||||
Quarter | 2017 High | 2017 Low | 2016 High | 2016 Low | 2017 | 2016 | ||||||||||||||||||
First | $ | 75.36 | $ | 71.55 | $ | 54.91 | $ | 43.14 | $ | 0.33 | $ | 0.33 | ||||||||||||
Second | $ | 80.45 | $ | 73.25 | $ | 59.90 | $ | 52.31 | 0.33 | 0.33 | ||||||||||||||
Third | $ | 84.22 | $ | 72.19 | $ | 65.44 | $ | 55.65 | 0.33 | 0.33 | ||||||||||||||
Fourth | $ | 90.46 | $ | 80.63 | $ | 77.36 | $ | 60.43 | 0.33 | 0.33 | ||||||||||||||
$ | 1.32 | $ | 1.32 | |||||||||||||||||||||
On December 31, 2017, there were approximately 2,074 holders of record of Crane Co. common stock. | ||||||||||||||||||||||||
We did not make any open-market share repurchases of our common stock during the three months ended December 31, 2017. We receive shares of our common stock as payment for stock option exercises and the withholding taxes due on stock option exercises and the vesting of restricted stock awards from stock-based compensation program participants.
Page 16
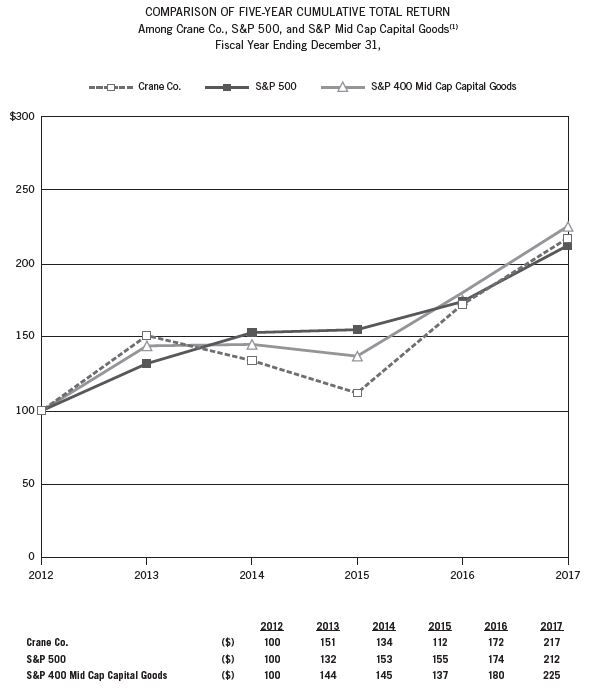
Stock Performance Graph
The following chart compares the total stockholder returns (stock price increase plus reinvested dividends) on our common stock from December 31, 2012 through December 31, 2017 with the total stockholder returns for the S&P 500 Index and the S&P MidCap Capital Goods Index. The graph assumes that the value of the investment in the common stock and each index was $100 on December 31, 2012 and that all dividends were reinvested.
Page 17
Item 6. Selected Financial Data.
FIVE YEAR SUMMARY OF SELECTED FINANCIAL DATA
For the year ended December 31, | ||||||||||||||||||||
(in millions, except per share data) | 2017 | 2016 | 2015 | 2014 | 2013 | |||||||||||||||
Net sales | $ | 2,786.0 | $ | 2,748.0 | $ | 2,740.5 | $ | 2,925.0 | $ | 2,595.3 | ||||||||||
Operating profit (a) | 401.9 | 200.3 | 372.9 | 316.3 | 347.9 | |||||||||||||||
Interest expense | (36.1 | ) | (36.5 | ) | (37.6 | ) | (39.2 | ) | (26.5 | ) | ||||||||||
Income before taxes (a) | 367.5 | 164.1 | 336.5 | 281.2 | 326.0 | |||||||||||||||
Provision for income taxes (b) | 195.0 | 40.3 | 106.5 | 87.6 | 105.1 | |||||||||||||||
Net income before allocation to noncontrolling interests | 172.5 | 123.8 | 230.0 | 193.6 | 220.9 | |||||||||||||||
Net income attributable to common shareholders (b) | $ | 171.8 | $ | 122.8 | $ | 228.9 | $ | 192.7 | $ | 219.5 | ||||||||||
Earnings per basic share (b) | $ | 2.89 | $ | 2.10 | $ | 3.94 | $ | 3.28 | $ | 3.79 | ||||||||||
Earnings per diluted share (b) | $ | 2.84 | $ | 2.07 | $ | 3.89 | $ | 3.23 | $ | 3.73 | ||||||||||
Cash dividends per common share | $ | 1.32 | $ | 1.32 | $ | 1.32 | $ | 1.26 | $ | 1.16 | ||||||||||
Total assets | $ | 3,593.5 | $ | 3,428.0 | $ | 3,336.9 | $ | 3,445.5 | $ | 3,555.2 | ||||||||||
Long-term debt and Current maturities of long-term debt | $ | 743.5 | $ | 745.3 | $ | 744.6 | $ | 743.9 | $ | 744.8 | ||||||||||
Accrued pension and postretirement benefits | $ | 240.5 | $ | 249.1 | $ | 235.4 | $ | 278.3 | $ | 151.1 | ||||||||||
Long-term asbestos liability | $ | 520.3 | $ | 624.9 | $ | 470.5 | $ | 534.5 | $ | 610.5 | ||||||||||
Long-term insurance receivable — asbestos | $ | 90.1 | $ | 125.2 | $ | 108.7 | $ | 126.8 | $ | 148.2 | ||||||||||
(a) | Includes i) transaction related charges of $7.8 in 2017; ii) restructuring charges, net of gain on property sale, of $13.0 in 2017; iii) an asbestos provision, net of insurance recoveries, of $192.4 in 2016; iv) a legal settlement charge of $5.0 in 2016; v) an environmental liability provision of $55.8 in 2014; and vi) a lawsuit settlement of $6.5 in 2014. |
(b) | Includes the tax effect of items cited in note (a) as well as i) the impact of the TCJA of $87.1 in 2017; ii) a gain of $1.0 related to the deconsolidation of a joint venture in 2017 iii) loss on divestiture of a small business of $1.1 in 2014; iv) gain on divestiture of real estate of $4.2 in 2014; v) withholding taxes related to acquisition funding of $2.9 in 2013; and vi) gain on the sale of a product line of $2.0 in 2013. |
Page 18
MANAGEMENT’S DISCUSSION AND ANALYSIS OF FINANCIAL CONDITION AND RESULTS OF OPERATIONS
Item 7. Management’s Discussion and Analysis of Financial Condition and Results of Operations
The following discussion and analysis of our financial condition and results of operations should be read together with our consolidated financial statements and related notes included under Item 8 of this Annual Report on Form 10-K.
We are a diversified manufacturer of highly engineered industrial products. Our business consists of four segments: Fluid Handling, Payment & Merchandising Technologies, Aerospace & Electronics and Engineered Materials. Our primary markets are chemicals, oil & gas, power, automated payment solutions, banknote design and production and aerospace & defense, along with a wide range of general industrial and consumer related end markets.
Our strategy is to grow earnings and cash flow by focusing on the manufacturing of highly engineered industrial products for specific markets where our scale is a relative advantage, and where we can compete based on our proprietary and differentiated technology, our deep vertical expertise, and our responsiveness to unique and diverse customer needs. We continuously evaluate our portfolio, pursue acquisitions that complement our existing businesses and are accretive to our growth profile, selectively divest businesses where appropriate, and pursue internal mergers to improve efficiency. We strive to foster a performance-based culture focused on productivity and continuous improvement, to attract and retain a committed management team whose interests are directly aligned with those of our shareholders, and to maintain a focused, efficient corporate structure.
We will continue to execute this strategy while remaining committed to the values of our founder, R.T. Crane, who resolved to conduct business "in the strictest honesty and fairness; to avoid all deception and trickery; to deal fairly with both customers and competitors; to be liberal and just toward employees; and to put my whole mind upon the business."
Due to rounding, numbers presented throughout this report may not add up precisely to totals we provide and percentages may not precisely reflect the absolute figures.
Page 19
MANAGEMENT’S DISCUSSION AND ANALYSIS OF FINANCIAL CONDITION AND RESULTS OF OPERATIONS
Results of Operations — For the Years Ended December 31, 2017, 2016 and 2015
For the year ended December 31, | 2017 vs 2016 Favorable / (Unfavorable) Change | 2016 vs 2015 Favorable / (Unfavorable) Change | ||||||||||||||||||||||||
(in millions, except %) | 2017 | 2016 | 2015 | $ | % | $ | % | |||||||||||||||||||
Net sales: | ||||||||||||||||||||||||||
Fluid Handling | $ | 1,043 | $ | 999 | $ | 1,091 | $ | 44 | 4 | % | $ | (92 | ) | (8 | )% | |||||||||||
Payment & Merchandising Technologies | 777 | 746 | 703 | 31 | 4 | % | 43 | 6 | % | |||||||||||||||||
Aerospace & Electronics | 691 | 746 | 691 | (55 | ) | (7 | )% | 55 | 8 | % | ||||||||||||||||
Engineered Materials | 275 | 257 | 255 | 18 | 7 | % | 2 | 1 | % | |||||||||||||||||
Total net sales | $ | 2,786 | $ | 2,748 | $ | 2,741 | $ | 38 | 1 | % | $ | 8 | — | % | ||||||||||||
Sales growth: | ||||||||||||||||||||||||||
Core business | $ | 31 | 1 | % | $ | 56 | 2 | % | ||||||||||||||||||
Foreign exchange | (7 | ) | — | % | (48 | ) | (2 | )% | ||||||||||||||||||
Acquisitions/dispositions | 14 | — | % | — | — | % | ||||||||||||||||||||
Total sales growth | $ | 38 | 1 | % | $ | 8 | — | % | ||||||||||||||||||
Operating profit: | ||||||||||||||||||||||||||
Fluid Handling | $ | 112 | $ | 120 | $ | 125 | $ | (8 | ) | (6 | )% | $ | (5 | ) | (5 | )% | ||||||||||
Payment & Merchandising Technologies | 149 | 136 | 101 | 13 | 10 | % | 35 | 34 | % | |||||||||||||||||
Aerospace & Electronics | 160 | 150 | 145 | 10 | 7 | % | 5 | 3 | % | |||||||||||||||||
Engineered Materials | 50 | 49 | 48 | 1 | 1 | % | 1 | 1 | % | |||||||||||||||||
Corporate expense | (68 | ) | (61 | ) | (48 | ) | (7 | ) | (11 | )% | (13 | ) | (29 | )% | ||||||||||||
Corporate expense — Asbestos | — | (192 | ) | — | 192 | NM | (192 | ) | NM | |||||||||||||||||
Total operating profit | $ | 402 | $ | 200 | $ | 373 | $ | 202 | 101 | % | $ | (173 | ) | (46 | )% | |||||||||||
Operating margin a: | ||||||||||||||||||||||||||
Fluid Handling | 10.7 | % | 12.0 | % | 11.5 | % | ||||||||||||||||||||
Payment & Merchandising Technologies | 19.1 | % | 18.2 | % | 14.4 | % | ||||||||||||||||||||
Aerospace & Electronics | 23.2 | % | 20.1 | % | 21.0 | % | ||||||||||||||||||||
Engineered Materials | 18.0 | % | 19.1 | % | 19.0 | % | ||||||||||||||||||||
Total operating margin b | 14.4 | % | 7.3 | % | 13.6 | % | ||||||||||||||||||||
a Operating profit and margin for 2017 include restructuring charges/(gains) of $11, $12 and ($10) in our Fluid Handling, Payment and Merchandising Technologies and Aerospace and Electronics segments, respectively.
b Total operating margin includes corporate and related charges, which include an asbestos charge of $192 recorded in 2016.
Page 20
MANAGEMENT’S DISCUSSION AND ANALYSIS OF FINANCIAL CONDITION AND RESULTS OF OPERATIONS
Items Affecting Comparability of Reported Results
The comparability of our results from operations for the years ended December 31, 2017, 2016 and 2015 is affected by the following significant items:
Transaction Related Charges
During 2017, we recorded pre-tax transaction related charges of $8 million related to acquisition activity.
Restructuring and Related Charges
In 2017, we recorded pre-tax restructuring charges, net of gain on property sale, of $13 million related to repositioning activities in our Fluid Handling, Payment & Merchandising Technologies and Aerospace & Electronics segments. In 2015, we recorded pre-tax restructuring charges and related costs of $11 million, substantially all of which was related to the repositioning activities in our Fluid Handling and Aerospace & Electronics segments. See Part II, Item 8 under Note 15, “Restructuring Charges,” in the Notes to Consolidated Financial Statements.
Asbestos Charge
In 2016, we recorded a pre-tax charge of $192 million associated with extending the time horizon of our estimated asbestos liability through the generally accepted end point in 2059. Please refer to Part II, Item 8 under Note 11, "Commitments and Contingencies" in the Notes to Consolidated Financial Statements for further discussion of the asbestos charge.
Huttig Legal Settlement Charge
In 2016, we recorded a pre-tax charge of $5 million associated with settlement of a legal matter with Huttig Building Products, Inc. (“Huttig”).
Acquisition-Related Costs - MEI
During 2015, we recorded pre-tax acquisition and integration costs of $7 million related to our acquisition of MEI in 2013.
2017 compared with 2016
Sales increased by $38 million to $2,786 million in 2017. Net sales related to operations outside the U.S. for the years ended December 31, 2017 and 2016 were 37% and 36% of total net sales, respectively. The year-over-year change in sales included:
• | an increase in core sales of $31 million, or 1%; and |
• | a net acquisition benefit of $14 million; partially offset by |
• | unfavorable foreign currency translation of $7 million. |
Operating profit increased by $202 million, or 101%, to $402 million in 2017. The increase primarily related to the absence of a $192 million asbestos charge recorded in 2016, together with higher operating profit in our Payment & Merchandising Technologies, Aerospace & Electronics and Engineered Materials segments. These increases were partially offset by lower operating profit in our Fluid Handling segment, a $13 million pre-tax restructuring charge, net of gain on property sale, and higher corporate costs.
2016 compared with 2015
Sales increased by $8 million to $2,748 million in 2016. Net sales related to operations outside the U.S. for the years ended December 31, 2016 and 2015 were 36% and 38% of total net sales, respectively. The year-over-year change in sales included:
• | an increase in core sales of $56 million, or 2%; largely offset by |
• | unfavorable foreign currency translation of $48 million, or 2%. |
Operating profit decreased by $173 million, or 46%, to $200 million in 2016. The decrease primarily related to the $192 million asbestos charge recorded in 2016, together with lower operating profit in our Fluid Handling segment and higher corporate costs, which included the $5 million Huttig legal settlement charge. These decreases were partially offset by increases in our Payment & Merchandising Technologies, Aerospace & Electronics and Engineered Materials segments.
Page 21
MANAGEMENT’S DISCUSSION AND ANALYSIS OF FINANCIAL CONDITION AND RESULTS OF OPERATIONS
Comprehensive income
(in millions) | 2017 | 2016 | 2015 | |||||||||
Net income before allocation to noncontrolling interests | $ | 173 | $ | 124 | $ | 230 | ||||||
Other comprehensive income (loss), net of tax | ||||||||||||
Currency translation adjustment | 87 | (65 | ) | (70 | ) | |||||||
Changes in pension and postretirement plan assets and benefit obligation, net of tax benefit | 9 | (35 | ) | (8 | ) | |||||||
Other comprehensive income (loss), net of tax | 96 | (100 | ) | (79 | ) | |||||||
Comprehensive income before allocation to noncontrolling interests | 269 | 24 | 152 | |||||||||
Less: Noncontrolling interests in comprehensive income | 1 | 1 | 1 | |||||||||
Comprehensive income attributable to common shareholders | $ | 268 | $ | 23 | $ | 150 | ||||||
2017 compared with 2016
For the year ended December 31, 2017, comprehensive income before allocations to noncontrolling interests was $269 million compared to $24 million in 2016. The $245 million increase was primarily driven by a $152 million favorable impact of foreign currency translation adjustments year over year including fluctuations in the British pound, Canadian dollar, euro and Japanese yen. The change was also attributable to a $49 million increase in net income before allocation to noncontrolling interests,
2016 compared with 2015
For the year ended December 31, 2016, comprehensive income before allocations to noncontrolling interests was $24 million compared to $152 million in 2015. The change was primarily driven by a $106 million decrease in net income before allocation to noncontrolling interests, which included a $125 million after-tax asbestos charge, and to a lesser extent, an increase in unamortized losses on pension plans. The unrealized loss on foreign currency translation adjustments of the balance sheets of foreign subsidiaries from local currencies to U.S. dollars was primarily due to weakening of the British pound and Canadian dollar against the U.S. dollar, partially offset by the strengthening of the Japanese yen against the U.S. dollar.
Page 22
MANAGEMENT’S DISCUSSION AND ANALYSIS OF FINANCIAL CONDITION AND RESULTS OF OPERATIONS
FLUID HANDLING
(in millions, except %) | 2017 | 2016 | 2015 | |||||||||
Net sales by product line: | ||||||||||||
Process Valves and Related Products | $ | 640 | $ | 619 | $ | 681 | ||||||
Commercial Valves | 310 | 291 | 316 | |||||||||
Other Products | 93 | 89 | 94 | |||||||||
Total net sales | $ | 1,043 | $ | 999 | $ | 1,091 | ||||||
Operating profit | $ | 112 | $ | 120 | $ | 125 | ||||||
Transaction related charges* | $ | 3 | $ | — | $ | — | ||||||
Restructuring and related charges* | $ | 11 | $ | — | $ | 10 | ||||||
Assets | $ | 942 | $ | 846 | $ | 888 | ||||||
Operating margin | 10.7 | % | 12.0 | % | 11.5 | % | ||||||
* | Transaction related charges and restructuring and related charges are included in operating profit and operating margin. |
2017 compared with 2016
Fluid Handling sales increased by $44 million, or 4%, to $1,043 million, driven by a core sales increase of $23 million, or 2%, a favorable net impact from acquisitions of $20 million, or 2%, and favorable foreign currency translation of $1 million.
• | Sales of Process Valves and Related Products increased by $21 million, or 3%, to $640 million in 2017, primarily related to a $21 million, or 3%, increase in sales related to an acquisition and, to a lesser extent, favorable foreign currency translation of $4 million, or 1%. These increases were partially offset by a core sales decline of $4 million, or 1%, primarily related to weaker conventional power end markets. |
• | Sales of Commercial Valves increased by $19 million, or 7%, to $310 million in 2017, primarily driven by a core sales increase of $22 million, or 8%, partially offset by unfavorable foreign currency translation of $3 million, or 1%. The core sales increase primarily reflected stronger sales to the U.K. gas market and Canadian non-residential construction markets. |
• | Sales of Other Products increased by $4 million, or 3%, to $93 million in 2017, primarily reflecting a core sales increase of $5 million, or 5%, partially offset by the loss of sales due to the deconsolidation of a joint venture of $1 million, or 2%. The higher core sales were primarily a result of greater demand from U.S. municipal end markets. |
Fluid Handling operating profit decreased by $8 million, or 6%, to $112 million in 2017. The decrease was driven by the impact of unfavorable mix, higher restructuring and related charges of $11 million, higher material costs and higher transaction related expenses of $3 million, partially offset by productivity, price increases and the impact of higher volumes.
2016 compared with 2015
Fluid Handling sales decreased by $92 million, or 8%, to $999 million, driven by a core sales decline of $61 million, or 6%, and unfavorable foreign currency translation of $31 million, or 2%.
• | Sales of Process Valves and Related Products decreased by $62 million, or 9%, to $619 million in 2016, including a core sales decline of $55 million, or 8%, and unfavorable foreign currency translation of $7 million, or 1%. The decrease in core sales primarily reflected lower sales in oil & gas, chemical, power and general industrial end markets. The unfavorable foreign currency translation was primarily a result of the British pound weakening against the U.S. dollar. |
• | Sales of Commercial Valves decreased by $25 million, or 8%, to $291 million in 2016, primarily driven by unfavorable foreign currency translation of $23 million, or 7%, primarily reflecting the British pound weakening against the U.S. dollar, with an additional impact from the weakening of the Canadian dollar. Core sales decreased $2 million, or 1%, primarily reflecting lower sales in non-residential construction end markets in Canada. |
• | Sales of Other Products decreased by $5 million, or 5%, to $89 million in 2016, primarily reflecting a core sales decline of $4 million, or 4%, and unfavorable foreign currency translation of $1 million, or 1%. The lower core sales were primarily a result of lower sales to military customers following particularly strong sales to that market in 2015, as well as lower sales to non-residential construction markets. |
Page 23
MANAGEMENT’S DISCUSSION AND ANALYSIS OF FINANCIAL CONDITION AND RESULTS OF OPERATIONS
Fluid Handling operating profit decreased by $5 million, or 5%, to $120 million in 2016. The decrease was primarily a result of lower volume, competitive pricing and unfavorable foreign exchange, largely offset by productivity, savings from repositioning actions, favorable mix, and lower restructuring and related charges.
PAYMENT & MERCHANDISING TECHNOLOGIES
(in millions, except %) | 2017 | 2016 | 2015 | |||||||||
Net sales by product line: | ||||||||||||
Payment Acceptance and Dispensing Products | $ | 576 | $ | 512 | $ | 496 | ||||||
Merchandising Equipment | 201 | 234 | 207 | |||||||||
Total net sales | $ | 777 | $ | 746 | $ | 703 | ||||||
Operating profit | $ | 149 | $ | 136 | $ | 101 | ||||||
Transaction related charges* | $ | 1 | $ | — | $ | — | ||||||
Acquisition and integration charges* | $ | — | $ | — | $ | 7 | ||||||
Restructuring and related charges* | $ | 12 | $ | — | $ | — | ||||||
Assets | $ | 1,216 | $ | 1,189 | $ | 1,178 | ||||||
Operating margin | 19.1 | % | 18.2 | % | 14.4 | % | ||||||
* | Transaction related charges, acquisition and integration charges and restructuring and related charges are included in operating profit and operating margin. | |||||
2017 compared with 2016
Payment & Merchandising Technologies sales increased by $31 million, or 4%, to $777 million in 2017, reflecting a core sales increase of $44 million, or 6%, partially offset by unfavorable foreign currency translation of $7 million, or 1%, and a decrease in sales related to divestitures, net of acquisitions, of $6 million, or 1%.
• | Sales of Payment Acceptance and Dispensing Products increased $64 million, or 13%, to $576 million in 2017, driven by a core sales increase of $76 million, or 15%, reflecting strength across several end markets, but most notably in the retail vertical. Core sales were partially offset by unfavorable foreign currency translation of $6 million, or 1%, and a net divestiture/acquisition impact $6 million, or 1%. Unfavorable foreign currency translation was primarily a result of the British pound and, to a lesser extent, the Japanese yen weakening against the U.S. dollar. |
• | Sales of Merchandising Equipment decreased $33 million, or 14%, to $201 million in 2017, reflecting a core sales decrease of $32 million, or 14%, and unfavorable foreign currency translation of $1 million. The decrease in core sales was primarily related to lower capital spending by certain of our U.S. bottler customers. |
Payment & Merchandising Technologies operating profit increased by $13 million, or 10%, to $149 million in 2017. The increase was primarily driven by the impact from the higher core sales and productivity, partially offset by unfavorable mix and an increase of $12 million in restructuring and related charges.
2016 compared with 2015
Payment & Merchandising Technologies sales increased by $43 million, or 6%, to $746 million in 2016, reflecting a core sales increase of $60 million, or 8%, partially offset by unfavorable foreign currency translation of $17 million, or 2%.
• | Sales of Payment Acceptance and Dispensing Products increased $16 million, or 3%, to $512 million in 2016, driven by a core sales increase of $28 million, or 6%, primarily reflecting strength in the retail vertical. Core sales were partially offset by unfavorable foreign currency translation of $12 million, or 3%, primarily as a result of the British pound weakening against the U.S. dollar, partially offset by the strengthening of the Japanese yen against the U.S. dollar. |
• | Sales of Merchandising Equipment increased $27 million, or 13%, to $234 million in 2016, reflecting a core sales increase of $32 million, or 15%, partially offset by unfavorable foreign currency translation of $5 million, or 2%, primarily as a result of the British pound weakening against the U.S. dollar. The increase in core sales was primarily related to stronger sales to large bottler customers as well as full-line operators. |
Payment & Merchandising Technologies operating profit increased by $35 million, or 34%, to $136 million in 2016. The increase was primarily driven by the benefit from the higher core sales, the impact from MEI related synergy savings of $10 million and lower acquisition and integration charges of $7 million.
Page 24
MANAGEMENT’S DISCUSSION AND ANALYSIS OF FINANCIAL CONDITION AND RESULTS OF OPERATIONS
AEROSPACE & ELECTRONICS
(in millions, except %) | 2017 | 2016 | 2015 | |||||||||
Net sales by product line: | ||||||||||||
Commercial Original Equipment | $ | 346 | $ | 355 | $ | 349 | ||||||
Military Original Equipment | 159 | 200 | 153 | |||||||||
Commercial Aftermarket | 134 | 133 | 132 | |||||||||
Military Aftermarket | 52 | 58 | 57 | |||||||||
Total net sales | $ | 691 | $ | 746 | $ | 691 | ||||||
Operating profit | $ | 160 | $ | 150 | $ | 145 | ||||||
Gain on sale of property, net of restructuring charges* | $ | 10 | $ | — | $ | — | ||||||
Assets | $ | 573 | $ | 556 | $ | 559 | ||||||
Operating margin | 23.2 | % | 20.1 | % | 21.0 | % | ||||||
* | Gain on sale of property, net of restructuring charges, is included in operating profit and operating margin. |
2017 compared with 2016
Aerospace & Electronics sales decreased $55 million, or 7%, to $691 million in 2017. The commercial market and military market accounted for 69% and 31%, respectively, of total segment sales in 2017. Sales to OEM and aftermarket customers in 2017 were 73% and 27% of total sales, respectively.
• | Sales of Commercial Original Equipment decreased by $9 million, or 2%, to $346 million in 2017. The sales decrease was primarily driven by weaker sales to business jet and wide body end markets. |
• | Sales of Military Original Equipment decreased by $41 million, or 21%, to $159 million in 2017. The sales decrease primarily reflected the non-repeat of a large military program that shipped in 2016. |
• | Sales of Commercial Aftermarket increased by $1 million or 1%, to $134 million in 2017. |
• | Sales of Military Aftermarket decreased by $6 million, or 9%, to $52 million in 2017. The sales decrease primarily reflected higher sales of modernization & upgrade programs in 2016. |
Aerospace & Electronics operating profit increased by $10 million, or 7%, to $160 million in 2017, primarily as a result of strong productivity and a gain on sale of property, net of restructuring charges, related to repositioning activities in the fourth quarter of 2017, partially offset by the impact of the lower sales volume.
2016 compared with 2015
Aerospace & Electronics sales increased $55 million, or 8%, to $746 million in 2016. The commercial market and military market accounted for 65% and 35%, respectively, of total segment sales in 2016. Sales to OEM and aftermarket customers in 2016 were 74% and 26% of total sales, respectively.
• | Sales of Commercial Original Equipment increased by $6 million, or 2%, to $355 million in 2016. The increase was driven by strength from commercial transport markets, partially offset by weaker business jet related sales. |
• | Sales of Military Original Equipment increased by $47 million, or 31%, to $200 million in 2016. The increase primarily reflected shipments related to a large military program. |
• | Sales of Commercial Aftermarket increased by $1 million, or 1%, to $133 million in 2016. |
• | Sales of Military Aftermarket increased by $1 million, or 1%, to $58 million in 2016. |
Aerospace & Electronics operating profit increased by $5 million, or 3%, to $150 million in 2016, primarily as a result of the impact from the higher volume and strong productivity, partially offset by unfavorable product mix associated with deliveries for the large military program which had lower relative margins.
Page 25
MANAGEMENT’S DISCUSSION AND ANALYSIS OF FINANCIAL CONDITION AND RESULTS OF OPERATIONS
ENGINEERED MATERIALS
(in millions, except %) | 2017 | 2016 | 2015 | |||||||||
Net sales by product line: | ||||||||||||
FRP- Recreational Vehicles | $ | 150 | $ | 131 | $ | 134 | ||||||
FRP- Building Products | 95 | 90 | 83 | |||||||||
FRP- Transportation | 30 | 36 | 38 | |||||||||
Total net sales | $ | 275 | $ | 257 | $ | 255 | ||||||
Operating profit | $ | 50 | $ | 49 | $ | 48 | ||||||
Assets | $ | 221 | $ | 225 | $ | 228 | ||||||
Operating margin | 18.0 | % | 19.1 | % | 19.0 | % | ||||||
2017 compared with 2016
Engineered Materials sales increased by $18 million, or 7%, to $275 million in 2017.
• | Sales of FRP panels to RV manufacturers increased by $19 million, or 15%, to $150 million in 2017, resulting primarily from market share gains and underlying market growth. |
• | Sales of FRP to building products customers increased $5 million, or 6%, to $95 million in 2017, primarily reflecting higher sales in international markets and in the domestic retail channel, reflecting improved non-residential construction activity. |
• | Sales of FRP to transportation customers decreased $6 million, or 18%, to $30 million in 2017, primarily reflecting lower sales of side skirts and tank cladding products. |
Engineered Materials operating profit increased by $1 million, or 1%, to $50 million in 2017, reflecting higher volumes and strong productivity, partially offset by higher material costs.
2016 compared with 2015
Engineered Materials sales increased by $2 million, or 1%, to $257 million in 2016.
• | Sales of FRP panels to RV manufacturers decreased by $3 million, or 2%, to $131 million, resulting from lower sales to RV manufacturers primarily due to competitive pricing. |
• | Sales of FRP to building products customers increased $7 million, or 8%, to $90 million in 2016, primarily reflecting higher sales in international markets and in the domestic retail channel. |
• | Sales of FRP to transportation customers decreased $2 million, or 4%, to $36 million in 2016, primarily reflecting lower sales of side skirts and tank cladding products. |
Engineered Materials operating profit increased by $1 million, or 1%, to $49 million in 2016, reflecting strong productivity and higher volumes, partially offset by competitive pricing.
Page 26
MANAGEMENT’S DISCUSSION AND ANALYSIS OF FINANCIAL CONDITION AND RESULTS OF OPERATIONS
CORPORATE
(in millions) | 2017 | 2016 | 2015 | |||||||||
Corporate expense | $ | (68 | ) | $ | (61 | ) | $ | (48 | ) | |||
Corporate expense — Asbestos | — | (192 | ) | — | ||||||||
Total Corporate expense | $ | (68 | ) | $ | (254 | ) | $ | (48 | ) | |||
Interest income | $ | 3 | $ | 2 | $ | 2 | ||||||
Interest expense | $ | (36 | ) | $ | (37 | ) | $ | (38 | ) | |||
Miscellaneous expense | $ | (1 | ) | $ | (2 | ) | $ | (1 | ) | |||
2017 compared with 2016
Total Corporate expense was lower by $186 million in 2017 primarily due to the absence of a $192 million asbestos charge and a $5 million legal settlement charge, both recorded in 2016. This decline was partially offset by transaction costs of $4 million related to the acquisition of Crane Currency. See Part II, Item 8 under Note 11, "Commitments and Contingencies" in the Notes to Consolidated Financial Statements for further discussion on the 2016 asbestos and legal settlement charges. See Part II, Item 8 under Note 16, “Subsequent Events,” in the Notes to Consolidated Financial Statements for further discussion on the acquisition of Crane Currency.
2016 compared with 2015
Total Corporate expense increased by $206 million in 2016, primarily due to an asbestos charge of $192 million and to a lesser extent, a $5 million legal settlement charge recorded in 2016, higher compensation costs and higher benefit costs.
Income Tax
(in millions, except %) | 2017 | 2016 | 2015 | |||||||||
Income before tax — U.S. | $ | 270 | $ | 63 | $ | 262 | ||||||
Income before tax — non-U.S. | 97 | 101 | 75 | |||||||||
Income before tax — worldwide | $ | 367 | $ | 164 | $ | 337 | ||||||
Provision for income taxes | $ | 195 | $ | 40 | $ | 107 | ||||||
Effective tax rate | 53.1 | % | 24.6 | % | 31.7 | % | ||||||
Our effective tax rate is affected by a number of items, both recurring and discrete, including the amount of income we earn in different jurisdictions and their respective statutory tax rates, acquisitions and dispositions, changes in the valuation of our deferred tax assets and liabilities, changes in tax laws, regulations and accounting principles, the continued availability of statutory tax credits and deductions, and examinations initiated by tax authorities around the world. See Application of Critical Accounting Policies included later in this Item 7 for additional information about our provision for income taxes. A reconciliation of the statutory U.S. federal tax rate to our effective tax rate is set forth in Part II, Item 8 under Note 3, "Income Taxes" in the Notes to Consolidated Financial Statements.
2017 compared with 2016
On December 22, 2017, the TCJA significantly changed U.S. corporate income tax law by reducing federal statutory tax rates from 35% to 21%, instituting a territorial tax system that provides a 100% exemption on future repatriations from certain foreign subsidiaries, and imposing a one-time transition tax on previously deferred non-U.S. earnings. Our effective tax rate in 2017 was significantly affected by TCJA. Specifically, we recorded a one-time charge of $87 million primarily consisting of:
• | A re-measurement of our net deferred tax assets due to a reduction in U.S. corporate income tax rate from 35% to 21% effective January 1, 2018, totaling $75 million; and |
• | A one-time mandatory transition tax on previous deferred earnings of foreign subsidiaries and a reassessment of our assertion regarding re-investment of our non-US subsidiaries' undistributed earnings, together totaling $12 million. |
We calculated this charge based on our understanding of both the TCJA as drafted and interpretative guidance issued as of the time of this filing.
On December 22, 2017, the U.S. Securities and Exchange Commission (“SEC”) released Staff Accounting Bulletin No. 118 (“SAB 118”) which allows registrants that do not have the necessary information available, prepared, or analyzed to complete the accounting for the TCJA to report provisional amounts in their SEC filings based on reasonable estimates. Further, it provides a one year measurement period for registrants to complete their accounting for the TCJA.
Page 27
MANAGEMENT’S DISCUSSION AND ANALYSIS OF FINANCIAL CONDITION AND RESULTS OF OPERATIONS
In accordance with SAB 118, we considered the entire $87 million charge to be a provisional estimate. During 2018, we will gather outstanding information (e.g., the effects of the TCJA on the tax bases of our non-U.S. subsidiaries), further analyze our computations (e.g., non-U.S. withholding, corporate income, and distribution taxes), and incorporate any new guidance issued by U.S. federal, U.S. state or non-U.S. regulatory authorities related to the TCJA. We will record any changes to our provisional estimate in the quarter in which we complete our analysis, but no later than the quarter ending December 31, 2018.
2016 compared with 2015
Our effective tax rate decreased from 2015 to 2016 largely due to proportionately more earnings realized in countries that have lower statutory tax rates, greater U.S. federal tax benefits from domestic manufacturing and R&D activities, and a discrete benefit recognized in 2016 as a result of the resolution of a tax examination. These items were partially offset by higher U.S. state taxes.
Page 28
MANAGEMENT’S DISCUSSION AND ANALYSIS OF FINANCIAL CONDITION AND RESULTS OF OPERATIONS
LIQUIDITY AND CAPITAL RESOURCES
(in millions) | 2017 | 2016 | 2015 | |||||||||
Net cash provided by (used in): | ||||||||||||
Operating activities | $ | 318 | $ | 318 | $ | 229 | ||||||
Investing activities | (87 | ) | (51 | ) | (35 | ) | ||||||
Financing activities | (81 | ) | (100 | ) | (144 | ) | ||||||
Effect of foreign currency exchange rate changes on cash and cash equivalents | 47 | (21 | ) | (33 | ) | |||||||
Increase in cash and cash equivalents | $ | 197 | $ | 146 | $ | 17 | ||||||
Our operating philosophy is to deploy cash provided from operating activities, when appropriate, to provide value to shareholders by reinvesting in existing businesses, by making acquisitions that will complement our portfolio of businesses, by divesting businesses that are no longer strategic and by paying dividends and/or repurchasing shares.
Our current cash balance, together with cash we expect to generate from future operations along with our CP Program or borrowings available under our revolving credit facility, is expected to be sufficient to finance our short- and long-term capital requirements, as well as to fund payments associated with our asbestos and environmental liabilities and expected pension contributions. In addition, we believe our investment grade credit ratings afford us adequate access to public and private debt markets. We had no borrowings outstanding under our CP Program as of December 31, 2017.
On December 20, 2017, we entered into a $150 million 364-day credit agreement (the "364-day Credit Agreement") and a $200 million 3-year term loan credit agreement (the "3-year Term Loan Credit Agreement"). On January 10, 2018, we completed the acquisition of Crane Currency, a supplier of banknotes and highly engineered banknote security features. The base purchase price of the acquisition was $800 million on a cash-free and debt-free basis. To fund the acquisition, we issued $340 million of commercial paper under our current CP Program, drew $100 million and $200 million from the 364-day Term Loan Credit Agreement and 3-year Term Loan Credit Agreement, respectively, and used cash on hand. See Part II, Item 8 under Note 8, “Long-Term Debt,” in the Notes to Consolidated Financial Statements.
On February 5, 2018, we completed a public offering of $350 million aggregate principal amount of 4.20% Senior Notes due 2048 (the "Public Offering"). We used the net proceeds from the Public Offering, together with cash on hand, to repay all of the $100 million outstanding under the 364-day Credit Agreement. We also issued a notice of redemption on February 7, 2018 for the $250 million of outstanding 2.75% notes due in December 2018 with an effective date of March 7, 2018. See Part II, Item 8 under Note 16, “Subsequent Events,” in the Notes to Consolidated Financial Statements.
As of December 31, 2017, our non-U.S. subsidiaries held approximately $559 million of cash. The TCJA significantly changed U.S. tax law by reducing the U.S. corporate income tax rate to 21%, imposing a one-time transition tax on previously deferred non-U.S. earnings, and instituting a 100% U.S. corporate income tax exemption on repatriations from certain non-U.S. subsidiaries occurring after December 31, 2017.
While our current plans do not forecast the need to use funds generated from our non-U.S. operations to fund our day-to-day U.S. operations, we provisionally determined that, based on this significant change in U.S. tax law, our non-U.S. earnings are no longer permanently reinvested offshore. As a result, we recorded a $4 million charge, increasing our deferred tax liability to $6 million, which represents our best estimate of the non-U.S. withholding, corporate income and distribution taxes due upon the repatriation of these earnings to the U.S. as of December 31, 2017.
In accordance with SAB 118, we will finalize our calculations and record any resulting adjustment to our year-end 2017 deferred tax liability no later than the fourth quarter of 2018.
Operating Activities
Cash provided by operating activities, a key source of our liquidity, was $318 million in both 2017 and 2016. Increases in cash generated resulted primarily from lower working capital requirements and lower environmental payments. These increases were offset by higher income tax payments, higher net asbestos-related payments and higher defined benefit plan and postretirement plan contributions. Net asbestos-related payments in 2017 and 2016 were $63 million and $56 million, respectively. In 2018, we expect to make payments related to asbestos settlement and defense costs, net of related insurance recoveries, of approximately $60 million, environmental payments, net of reimbursements, of approximately $7 million and contributions to our defined benefit plans of approximately $25 million.
Page 29
MANAGEMENT’S DISCUSSION AND ANALYSIS OF FINANCIAL CONDITION AND RESULTS OF OPERATIONS
Investing Activities
Cash flows relating to investing activities consist primarily of cash used for acquisitions and capital expenditures and cash provided by divestitures of businesses or assets. Cash used for investing activities was $87 million in 2017, compared to $51 million in 2016. The increase in cash used for investing activities was driven by amounts paid (net of cash acquired) of $55 million for the acquisitions of Westlock and Microtronic during 2017 and, to a lesser extent, a $5 million decrease in cash due to the deconsolidation of a joint venture. These reductions were partially offset by proceeds from dispositions of capital assets and slightly lower capital expenditures year over year. Capital expenditures are made primarily for increasing capacity, replacing equipment, supporting new product development and improving information systems. We expect our capital expenditures to approximate $125 million in 2018, reflecting $56 million of capital requirements resulting from the recently acquired Crane Currency business, as well as continued investments in new product development initiatives, primarily in our Aerospace & Electronics, Payment & Merchandising Technologies and Fluid Handling segments.
Financing Activities
Financing cash flows consist primarily of dividend payments to shareholders, share repurchases, repayments of indebtedness, proceeds from the issuance of commercial paper and proceeds from the issuance of common stock. Cash used for financing activities was $81 million in 2017, compared to $100 million in 2016. The lower levels of cash used for financing activities was primarily due to the higher repayments of commercial paper in 2016, partially offset by an increase in cash used for open market share repurchases. We repurchased 331,632 shares of our common stock at a cost of $25 million in 2017.
Financing Arrangements
On February 5, 2018, we completed a Public Offering of $350 million aggregate principal amount of 4.20% Senior Notes due 2048. See Part II, Item 8 under Note 16, “Subsequent Events,” in the Notes to Consolidated Financial Statements.
In December 2017, we entered into a $550 million five year Revolving Credit Agreement (the “2017 Facility”), which replaced the existing $500 million revolving credit facility. The 2017 Facility allows us to borrow, repay, or to the extent permitted by the agreement, prepay and re-borrow funds at any time prior to the stated maturity date. The loan proceeds may be used for general corporate purposes including financing for acquisitions. Interest is based on, at our option, (1) a base rate, plus a margin ranging from 0.0% to 0.50% depending upon the ratings by S&P and Moody’s of our senior unsecured long-term debt (the "Index Debt Rating"), or (2) an adjusted LIBOR for an interest period to be selected by us, plus a margin ranging from 0.805% to 1.50% depending upon the Index Debt Rating (such margin, the “Applicable LIBOR Margin”). The 2017 Facility contains customary affirmative and negative covenants for credit facilities of this type, including limitations on us and our subsidiaries with respect to indebtedness, liens, mergers, consolidations, liquidations and dissolutions, sales of all or substantially all assets, transactions with affiliates and hedging arrangements. We must also maintain a debt to capitalization ratio not to exceed 0.65 to 1.00 at all times. The 2017 Facility also provides for customary events of default, including failure to pay principal, interest or fees when due, failure to comply with covenants, any representation or warranty made by us or any of our material subsidiaries being false in any material respect, default under certain other material indebtedness, certain insolvency or receivership events affecting us and our material subsidiaries, certain ERISA events, material judgments and a change in control of us. There were no outstanding borrowings under the 2017 Facility as of December 31, 2017.
In December 2017, we also entered into the $150 million 364-day credit agreement and the $200 million 3-year term loan credit agreement. Borrowings are available under each of the 364-day Credit Agreement and the 3-Year Term Loan Credit Agreement once certain conditions precedent have been satisfied, including consummation of our acquisition of Crane Currency. Interest on loans made under each of the 364-day Credit Agreement and the 3-Year Term Loan Credit Agreement accrues, at our option, at a rate per annum equal to (1) a base rate (determined in a customary manner), plus a margin ranging from 0.0% to 0.75% depending upon the Index Debt Rating or (2) an adjusted LIBOR (determined in a customary manner) for an interest period to be selected by us plus a margin ranging from 0.875% to 1.75% depending upon the Index Debt Rating. A commitment fee begins to accrue on March 5, 2018 (with respect to the 364-day Credit Agreement) and on January 19, 2018 (with respect to the 3-Year Term Loan Credit Agreement) on the daily unused portion of the commitments under each of the 364-day Credit Agreement and the 3-Year Term Loan Credit Agreement, respectively, at a rate per annum ranging from 0.07% to 0.25% depending on the Index Debt Rating. Each of the 364-day Credit Agreement and the 3-Year Term Loan Credit Agreement contain substantially the same affirmative and negative covenants, including the maximum debt to capitalization ratio, and events of default, as the 2017 Facility. There were no outstanding borrowings under the 364-day Credit Agreement and 3-Year Term Loan Credit Agreement as of December 31, 2017. In January 2018, we drew $100 million from our 364-day Credit Agreement and $200 million from our 3-Year Term Loan Credit Agreement to fund our acquisition of Crane Currency. In February 2018, we paid $100 million outstanding under the 364-day Credit Agreement after completion of the Public Offering.
Page 30
MANAGEMENT’S DISCUSSION AND ANALYSIS OF FINANCIAL CONDITION AND RESULTS OF OPERATIONS
Total debt was $744 million and $745 million as of December 31, 2017 and 2016, respectively. Our indebtedness as of December 31, 2017 was as follows:
• | $249 million of 2.75% notes due 2018; |
• | $298 million of 4.45% notes due 2023; |
• | $198 million of 6.55% notes due 2036; |
2.75% notes due December 2018 - In December 2013, we issued five year notes having an aggregate principal amount of $250 million. The notes are unsecured, senior obligations that mature on December 15, 2018 and bear interest at 2.75% per annum, payable semi-annually on June 15 and December 15 of each year. The notes have no sinking fund requirement, but may be redeemed, in whole or part, at our option. These notes do not contain any material debt covenants or cross default provisions. If there is a change in control of the Company, and if as a consequence, the notes are rated below investment grade by both Moody’s Investors Service and Standard & Poor’s, then holders of the notes may require us to repurchase them, in whole or in part, for 101% of the principal amount plus accrued and unpaid interest. Debt issuance costs are deferred and included in long-term debt and are amortized as a component of interest expense over the term of the notes. Including debt issuance cost amortization, these notes have an effective annualized interest rate of 2.92%. We issued a notice of redemption on February 7, 2018 for the $250 million of outstanding 2.75% notes due in December 2018 with an effective date of March 7, 2018.
4.45% notes due December 2023 - In December 2013, we issued 10 year notes having an aggregate principal amount of $300 million. The notes are unsecured, senior obligations that mature on December 15, 2023 and bear interest at 4.45% per annum, payable semi-annually on June 15 and December 15 of each year. The notes have no sinking fund requirement, but may be redeemed, in whole or part, at our option. These notes do not contain any material debt covenants or cross default provisions. If there is a change in control of the Company, and if as a consequence, the notes are rated below investment grade by both Moody’s Investors Service and Standard & Poor’s, then holders of the notes may require us to repurchase them, in whole or in part, for 101% of the principal amount plus accrued and unpaid interest. Debt issuance costs are deferred and included in long-term debt and are amortized as a component of interest expense over the term of the notes. Including debt issuance cost amortization, these notes have an effective annualized interest rate of 4.56%.
6.55% notes due November 2036 - In November 2006, we issued 30 year notes having an aggregate principal amount of $200 million. The notes are unsecured, senior obligations that mature on November 15, 2036 and bear interest at 6.55% per annum, payable semi-annually on May 15 and November 15 of each year. The notes have no sinking fund requirement, but may be redeemed, in whole or in part, at our option. These notes do not contain any material debt covenants or cross default provisions. If there is a change in control of the Company, and if as a consequence, the notes are rated below investment grade by both Moody’s Investors Service and Standard & Poor’s, then holders of the notes may require us to repurchase them, in whole or in part, for 101% of the principal amount plus accrued and unpaid interest. Debt issuance costs are deferred and included in long-term debt and are amortized as a component of interest expense over the term of the notes. Including debt issuance cost amortization; these notes have an effective annualized interest rate of 6.67%.
Commercial paper program - On March 2, 2015, we entered into the CP Program pursuant to which we may issue short-term, unsecured commercial paper notes (the “Notes”) pursuant to the exemption from registration contained in Section 4(a)(2) of the Securities Act of 1933, as amended. Amounts available under the CP Program may be borrowed, repaid and re-borrowed from time to time, with the aggregate principal amount of the Notes outstanding under the CP Program at any time not to exceed $500 million. The Notes will have maturities of up to 397 days from date of issue. The Notes will rank at least pari passu with all of our other unsecured and unsubordinated indebtedness. The net proceeds of the issuances of the Notes can be used to repay amounts under our revolving credit facility and for general corporate purposes. As of December 31, 2017, we had no amounts outstanding under the Notes. In January 2018, we issued $340 million under the CP Program to fund our acquisition of Crane Currency.
As of December 31, 2017, our total debt to total capitalization ratio was 36%, computed as follows:
(in millions) | December 31, 2017 | ||
Current maturities of long-term debt | $ | 249.4 | |
Long-term debt | 494.1 | ||
Total indebtedness | $ | 743.5 | |
Total shareholders’ equity | 1,345.2 | ||
Capitalization | $ | 2,088.7 | |
Total indebtedness to capitalization | 36 | % | |
Page 31
MANAGEMENT’S DISCUSSION AND ANALYSIS OF FINANCIAL CONDITION AND RESULTS OF OPERATIONS
All outstanding senior, unsecured notes were issued under an indenture dated as of April 1, 1991. The indenture contains certain limitations on liens and sale and lease-back transactions.
As of December 31, 2017, we had open standby letters of credit of $21 million issued pursuant to a $47 million uncommitted Letter of Credit Reimbursement Agreement, and certain other credit lines.
Credit Ratings
As of December 31, 2017, our senior unsecured debt was rated BBB by Standard & Poor’s with a Stable outlook and Baa2 with a Stable outlook by Moody’s Investors Service. We believe that these ratings afford us adequate access to the public and private debt markets.
Contractual Obligations
Under various agreements, we are obligated to make future cash payments in fixed amounts. These include payments under our long-term debt agreements and rent payments required under operating lease agreements. The following table summarizes our fixed cash obligations as of December 31, 2017:
Payment due by Period | ||||||||||||||||||||
(in millions) | Total | 2018 | 2019 -2020 | 2021 -2022 | 2023 and after | |||||||||||||||
Long-term debt (1) | $ | 750.0 | $ | 250.0 | $ | — | $ | — | $ | 500.0 | ||||||||||
Fixed interest payments | 335.9 | 33.3 | 52.9 | 52.9 | 196.8 | |||||||||||||||
Operating lease payments | 95.0 | 21.3 | 29.0 | 17.7 | 27.0 | |||||||||||||||
Purchase obligations | 103.8 | 101.0 | 2.0 | 0.7 | 0.1 | |||||||||||||||
Pension benefits (2) | 493.1 | 42.7 | 88.2 | 95.8 | 266.4 | |||||||||||||||
Other long-term liabilities reflected on Consolidated Balance Sheets (3) | — | — | — | — | — | |||||||||||||||
Total | $ | 1,777.8 | $ | 448.3 | $ | 172.1 | $ | 167.1 | $ | 990.3 | ||||||||||
(1) | Excludes original issue discount. |
(2) | Pension benefits are funded by the respective pension trusts. The postretirement benefit component of the obligation is approximately $1 million per year for which there is no trust and will be directly funded by us. Pension benefits are included through 2027. |
(3) | As the timing of future cash outflows is uncertain, the following long-term liabilities (and related balances) are excluded from the above table: Long-term asbestos liability ($520 million), long-term environmental liability ($32 million) and gross unrecognized tax benefits ($49 million) and related gross interest and penalties ($7 million). |
Capital Structure
The following table sets forth our capitalization:
(in millions, except %) December 31, | 2017 | 2016 | ||||||
Current maturities of long-term debt | $ | 249.4 | $ | — | ||||
Long-term debt | 494.1 | 745.3 | ||||||
Total debt | 743.5 | 745.3 | ||||||
Less cash and cash equivalents | 706.2 | 509.7 | ||||||
Net debt * | 37.3 | 235.6 | ||||||
Equity | 1,348.5 | 1,145.7 | ||||||
Net capitalization* | $ | 1,385.8 | $ | 1,381.3 | ||||
Net debt to equity* | 2.8 | % | 20.6 | % | ||||
Net debt to net capitalization* | 2.7 | % | 17.1 | % | ||||
* | Net debt, a non-GAAP measure, represents total debt less cash and cash equivalents. Net debt is comprised of components disclosed above which are presented on the Consolidated Balance Sheets. We report our financial results in accordance with U.S. generally accepted accounting principles (U.S. GAAP). However, management believes that certain non-GAAP financial measures, which include the presentation of net debt, provide useful information about our ability to satisfy our debt obligation with currently available funds. Management also uses these non-GAAP financial measures in making financial, operating, planning and compensation decisions and in evaluating our performance. Non-GAAP financial measures, which may be inconsistent with similarly captioned measures presented by other companies, should be viewed in the context of the definitions of the elements of such measures we provide and in addition to, and not as a substitute for, our reported results prepared and presented in accordance with U.S. GAAP. |
In 2017, equity increased $203 million as a result of net income attributable to common shareholders of $172 million, changes in currency translation adjustment of $87 million, changes in stock option exercises of $31 million, partially offset by cash dividends of $78 million and share repurchases of $25 million.
Page 32
MANAGEMENT’S DISCUSSION AND ANALYSIS OF FINANCIAL CONDITION AND RESULTS OF OPERATIONS
Off Balance Sheet Arrangements
We do not have any majority-owned subsidiaries that are not included in the consolidated financial statements, nor do we have any interests in or relationships with any special purpose off balance sheet financing entities.
Page 33
MANAGEMENT’S DISCUSSION AND ANALYSIS OF FINANCIAL CONDITION AND RESULTS OF OPERATIONS
OUTLOOK
Overall
Our sales depend heavily on industries that are cyclical in nature or are subject to market conditions which may cause customer demand for our products to be volatile and unpredictable. Demand in these industries is affected by fluctuations in domestic and international economic conditions, as well as currency fluctuations, commodity costs, and a variety of other factors.
For 2018, we expect a total year-over-year sales increase of approximately 18.5%, driven by acquisition benefits of 15%, core sales growth of approximately 3%, and a 0.5% benefit from favorable foreign exchange. We expect an improvement in operating profit, driven primarily by improved productivity and benefits from repositioning actions, higher core sales volume, and operating profit contributed by acquisitions, partially offset by higher transaction, acquisition integration related costs and accelerated strategic growth investments.
Fluid Handling
In 2018, we expect Fluid Handling sales to increase in the mid single-digit range compared to 2017, driven by low to mid single-digit core sales growth and favorable foreign currency translation.
We expect Process Valves and Related Products sales to increase in the mid single-digit range compared to 2017, driven by a low to mid single-digit core sales increase, a low single-digit increase from an acquisition, and a modest benefit from favorable foreign currency translation. Excluding foreign exchange, we expect order rates in 2018 to improve compared to 2017 as our end markets continue to gradually improve.
We expect Commercial Valves sales to increase in the mid single-digit range compared to 2017, driven by both core sales growth and favorable foreign exchange, reflecting modest growth in our end markets.
We expect Other Products sales to decline in the mid to high single-digit range compared to 2017 with modest growth in the U.S. municipal market which are more than offset by lost sales related to the deconsolidation of a joint venture.
For the segment, we expect an improvement in both operating profit and operating margins compared to 2017, driven by benefits from core sales growth, strong productivity, and lower restructuring and related costs.
Payment & Merchandising Technologies
We expect Payment & Merchandising Technologies sales to increase more than 50%, driven primarily by the acquisition of Crane Currency, with a low single-digit improvement in core sales. We expect core sales to improve across both CPI and Merchandising Systems, with a higher core growth rate at Merchandising Systems. At CPI, we expect core sales growth to be slightly positive, with growth driven by several vertical end markets largely offset by very challenging comparisons in the gaming and retail vertical markets. At Merchandising Systems, we expect an improvement in core sales driven primarily by better demand from large bottler customers and full-line operators. We expect the segment’s operating profit to be comparable to 2017, with substantially higher acquisition integration costs and accelerated strategic growth investments approximately offset by lower repositioning and related charges, as well as benefits from higher core volumes and benefits from the Crane Currency acquisition.
Aerospace & Electronics
We expect Aerospace & Electronics core sales to increase in the mid single-digit range compared to 2017. For 2018, we expect that commercial market conditions will remain generally positive, and we expect sales growth from both our commercial and military OEM business. However, we expect aftermarket sales to decline, primarily as a result of lower modernization and upgrade sales. We expect segment operating profit in 2018 to decrease compared to 2017 driven primarily by the absence of the 2017 gain on the sale of a property and due to accelerated strategic growth investments, partially offset by higher volume and improved productivity and benefits from repositioning actions.
Engineered Materials
In 2018, we expect the Engineered Materials segment sales will increase slightly compared to the prior year. We expect modest growth in sales to RV manufacturers and to our building product customers, partially offset by a decline in sales to the Transportation market. Segment operating profit is expected to be relatively flat compared to 2017.
Page 34
MANAGEMENT’S DISCUSSION AND ANALYSIS OF FINANCIAL CONDITION AND RESULTS OF OPERATIONS
APPLICATION OF CRITICAL ACCOUNTING POLICIES
Our consolidated financial statements are prepared in accordance with accounting principles generally accepted in the United States. Our significant accounting policies are more fully described in Part II, Item 8 under Note 1, “Nature of Operations and Significant Accounting Policies” in the Notes to Consolidated Financial Statements. Certain accounting policies require us to make estimates and assumptions that affect the reported amounts of assets and liabilities at the date of the financial statements and the reported amounts of revenue and expense during the reporting period. On an ongoing basis, we evaluate our estimates and assumptions, and the effects of revisions are reflected in the financial statements in the period in which they are determined to be necessary. The accounting policies described below are those that most frequently require us to make estimates and judgments and, therefore, are critical to understanding our results of operations. We have discussed the development and selection of these accounting estimates and the related disclosures with the Audit Committee of our Board of Directors.
Revenue Recognition. Revenue is recorded when title (risk of loss) passes to the customer and collection of the resulting receivable is reasonably assured. Revenue on long-term, fixed-price contracts is recorded on a percentage of completion basis using units of delivery as the measurement basis for progress toward completion. Sales under cost-reimbursement-type contracts are recorded as costs are incurred.
In May 2014, the Financial Accounting Standards Board (the "FASB") issued new accounting guidance related to revenue recognition. This new standard will replace all current U.S. GAAP guidance on this topic and eliminate all current industry-specific guidance. The new revenue recognition standard provides a unified model to determine when and how revenue is recognized. The core principle is that an entity should recognize revenue to depict the transfer of promised goods or services to customers in an amount that reflects the consideration for which the entity expects to be entitled in exchange for those goods or services. In July 2015, the FASB agreed to a one-year deferral of the effective date; the new standard is now effective for reporting periods beginning after December 15, 2017, including interim periods within that reporting period. Effective January 1, 2018, we adopted the new standard using the modified retrospective transition method. The adoption of the new guidance will not have a material impact to our consolidated financial statements (we expect the adjustment to retained earnings to be less than $10 million). The majority of our revenue will continue to be recognized at a point in time when the customer obtains control of the product. Revenue on certain contracts that were previously recognized at a point in time upon product delivery will now be recognized as costs are incurred. This change generally results in an acceleration of revenue as compared with our previous revenue recognition method for those contracts.
Inventories. Inventories include the costs of material, labor and overhead and are stated at the lower of cost and net realizable value. We regularly review inventory values on hand and record a provision for excess and obsolete inventory primarily based on historical performance and our forecast of product demand over the next two years. The reserve for excess and obsolete inventory was $58 million and $54 million as of December 31, 2017 and 2016, respectively.
Income Taxes. We account for income taxes in accordance with Accounting Standards Codification (“ASC”) Topic 740 “Income Taxes” (“ASC 740”), which requires an asset and liability approach for the financial accounting and reporting of income taxes. Under this method, deferred income taxes are recognized for the expected future tax consequences of differences between the tax bases of assets and liabilities and their reported amounts in the financial statements. These balances are measured using the enacted tax rates expected to apply in the year(s) in which these temporary differences are expected to reverse. The effect of a change in tax rates on deferred income taxes is recognized in income in the period when the change is enacted.
Based on consideration of all available evidence regarding their utilization, we record net deferred tax assets to the extent that it is more likely than not that they will be realized. Where, based on the weight of all available evidence, it is more likely than not that some amount of a deferred tax asset will not be realized, we establish a valuation allowance for the amount that, in our judgment, is sufficient to reduce the deferred tax asset to an amount that is more likely than not to be realized. The evidence we consider in reaching such conclusions includes, but is not limited to; (1) future reversals of existing taxable temporary differences, (2) future taxable income exclusive of reversing taxable temporary differences, (3) taxable income in prior carryback year(s) if carryback is permitted under the tax law, (4) cumulative losses in recent years, (5) a history of tax losses or credit carryforwards expiring unused, (6) a carryback or carryforward period that is so brief it limits realization of tax benefits, and (7) a strong earnings history exclusive of the loss that created the carryforward and support showing that the loss is an aberration rather than a continuing condition.
We account for unrecognized tax benefits in accordance with ASC 740, which prescribes a minimum probability threshold that a tax position must meet before a financial statement benefit is recognized. The minimum threshold is defined as a tax position that is more likely than not to be sustained upon examination by the applicable taxing authority, including resolution of any related appeals or litigation, based solely on the technical merits of the position. The tax benefit recognized is the largest amount of benefit that is greater than 50% likely of being realized upon ultimate settlement.
Page 35
MANAGEMENT’S DISCUSSION AND ANALYSIS OF FINANCIAL CONDITION AND RESULTS OF OPERATIONS
We recognize interest and penalties related to unrecognized tax benefits within the income tax expense line of the Consolidated Statement of Operations, while accrued interest and penalties are included within the related tax liability line of the Consolidated Balance Sheets.
Goodwill and Other Long-Lived Assets. As of December 31, 2017, we had $1,207 million of goodwill. Our business acquisitions typically result in the generation of goodwill and other intangible assets. We follow the provisions under ASC Topic 350, “Intangibles – Goodwill and Other” (“ASC 350”) as it relates to the accounting for goodwill in our consolidated financial statements. These provisions require that we, on at least an annual basis, evaluate the fair value of the reporting units to which goodwill is assigned and attributed and compare that fair value to the carrying value of the reporting unit to determine if impairment exists. Impairment testing takes place more often than annually if events or circumstances indicate a change in the impairment status. A reporting unit is an operating segment unless discrete financial information is prepared and reviewed by segment management for businesses one level below that operating segment (a “component”), in which case the component would be the reporting unit. As of December 31, 2017, we had seven reporting units.
When performing our annual impairment assessment, we compare the fair value of each of our reporting units to their respective carrying value. Goodwill is considered to be potentially impaired when the net book value of a reporting unit exceeds its estimated fair value. Fair values are established primarily by discounting estimated future cash flows at an estimated cost of capital which varies for each reporting unit and which, as of our most recent annual impairment assessment, ranged between 10.0% and 13.0% (a weighted average of 11.0%), reflecting the respective inherent business risk of each of the reporting units tested. This methodology for valuing our reporting units (commonly referred to as the Income Method) has not changed from the prior year. The determination of discounted cash flows is based on the businesses’ strategic plans and long-range planning forecasts, which change from year to year. The revenue growth rates included in the forecasts represent our best estimates based on current and forecasted market conditions, and the profit margin assumptions are projected by each reporting unit based on the current cost structure and anticipated net cost increases/reductions. There are inherent uncertainties related to these assumptions, including changes in market conditions, and management’s judgment in applying them to the analysis of goodwill impairment. In addition to the foregoing, for each reporting unit, market multiples are used to corroborate our discounted cash flow results where fair value is estimated based on earnings before income taxes, depreciation, and amortization ("EBITDA") and revenue multiples determined by available public information of comparable businesses. While we believe we have made reasonable estimates and assumptions to calculate the fair value of our reporting units, it is possible a material change could occur. If actual results are not consistent with management’s estimates and assumptions, goodwill and other intangible assets may be overstated and a charge would need to be taken against net earnings. Furthermore, in order to evaluate the sensitivity of the fair value calculations on the goodwill impairment test, we applied a hypothetical, reasonably possible 10% decrease to the fair values of each reporting unit. The effects of this hypothetical 10% decrease would still result in a fair value calculation exceeding our carrying value for each of our reporting units. No impairment charges have been required during 2017, 2016 or 2015.
As of December 31, 2017, we had $277 million of net intangible assets, of which $29 million were intangibles with indefinite useful lives, consisting of trade names. Intangibles with indefinite useful lives are tested annually for impairment, or when events or changes in circumstances indicate the potential for impairment. If the carrying amount of an indefinite lived intangible asset exceeds its fair value, the intangible asset is written down to its fair value. Fair value is calculated using relief of royalty method. We amortize the cost of definite-lived intangibles over their estimated useful lives.
In addition to annual testing for impairment of indefinite-lived intangible assets, we review all of our definite-lived intangible assets for impairment whenever events or changes in circumstances indicate the carrying amount of an asset may not be recoverable. Examples of events or changes in circumstances could include, but are not limited to, a prolonged economic downturn, current period operating or cash flow losses combined with a history of losses or a forecast of continuing losses associated with the use of an asset or asset group, or a current expectation that an asset or asset group will be sold or disposed of before the end of its previously estimated useful life. Recoverability is based upon projections of anticipated future undiscounted cash flows associated with the use and eventual disposal of the definite-lived intangible asset (or asset group), as well as specific appraisal in certain instances. Reviews occur at the lowest level for which identifiable cash flows are largely independent of cash flows associated with other long-lived assets or asset groups and include estimated future revenues, gross profit margins, operating profit margins and capital expenditures which are based on the businesses’ strategic plans and long-range planning forecasts, which change from year to year. The revenue growth rates included in the forecasts represent our best estimates based on current and forecasted market conditions, and the profit margin assumptions are based on the current cost structure and anticipated net cost increases/reductions. There are inherent uncertainties related to these assumptions, including changes in market conditions, and management’s judgment in applying them to the analysis. If the future undiscounted cash flows are less than the carrying value, then the definite-lived intangible asset is considered impaired and a charge would be taken against net earnings based on the amount by which the carrying amount exceeds the estimated recoverable amount. Judgments that we make which impact these assessments relate to the expected useful lives of definite-lived assets and our ability to realize any undiscounted cash flows in excess of the carrying amounts of such assets, and are affected primarily by
Page 36
MANAGEMENT’S DISCUSSION AND ANALYSIS OF FINANCIAL CONDITION AND RESULTS OF OPERATIONS
changes in the expected use of the assets, changes in technology or development of alternative assets, changes in economic conditions, changes in operating performance and changes in expected future cash flows. Since judgment is involved in determining the recoverable amount of definite-lived intangible assets, there is risk that the carrying value of our definite-lived intangible assets may require adjustment in future periods. Historical results to date have generally approximated expected cash flows for the identifiable cash flow generating level. We believe there have been no events or circumstances which would more likely than not reduce the fair value of our indefinite-lived or definite-lived intangible assets below their carrying value.
Contingencies. The categories of claims for which we have estimated our liability, the amount of our liability accruals, and the estimates of our related insurance receivables are critical accounting estimates related to legal proceedings and other contingencies. Please refer to Part II, Item 8 under Note 11, “Commitments and Contingencies,” in the Notes to Consolidated Financial Statements for further discussion.
Asbestos Liability and Related Insurance Coverage and Receivable. As of December 31, 2017, we had an aggregate asbestos
liability of $605 million for pending claims and future claims projected to be filed against us through 2059. Estimation of our exposure for asbestos-related claims is subject to significant uncertainties, as there are multiple variables that can affect the timing, severity and quantity of claims and the manner of their resolution. We have retained the firm of Hamilton, Rabinovitz & Associates, Inc. (“HR&A”), a nationally recognized expert in the field, to assist management in estimating our asbestos liability in the tort system. HR&A reviews information provided by us concerning claims filed, settled and dismissed, amounts paid in settlements and relevant claim information such as the nature of the asbestos-related disease asserted by the claimant, the jurisdiction where filed and the time lag from filing to disposition of the claim. The methodology used by HR&A to project future asbestos costs is based on our recent historical experience for claims filed, settled and dismissed during a base reference period. Our experience is then compared to estimates of the number of individuals likely to develop asbestos-related diseases determined based on widely used previously conducted epidemiological studies augmented with current data inputs. Those studies were undertaken in connection with national analyses of the population of workers believed to have been exposed to asbestos. Using that information, HR&A estimates the number of future claims that would be filed against us and estimates the aggregate settlement or indemnity costs that would be incurred to resolve both pending and future claims based upon the average settlement costs by disease during the reference period. Our liability estimate is augmented for the costs of defending asbestos claims in the tort system using a forecast from us which is based upon discussions with its defense counsel. Based on this information, HR&A compiles an estimate of our asbestos liability for pending and future claims using a range of reference periods based on claim experience and covering claims expected to be filed through the indicated forecast period. The most significant factors affecting the liability estimate are (1) the number of new mesothelioma claims filed against us, (2) the average settlement costs for mesothelioma claims, (3) the percentage of mesothelioma claims dismissed against us and (4) the aggregate defense costs incurred by us. These factors are interdependent, and no one factor predominates in determining the liability estimate. These trend factors have both positive and negative effects on the dynamics of asbestos litigation in the tort system and the related best estimate of our asbestos liability, and these effects do not move in a linear fashion but rather change over multi-year periods. In our view, the forecast period used to provide the best estimate for asbestos claims and related liabilities and costs is a judgment based upon a number of trend factors, including the number and type of claims being filed each year; the jurisdictions where such claims are filed, and the effect of any legislation or judicial orders in such jurisdictions restricting the types of claims that can proceed to trial on the merits; and the likelihood of any comprehensive asbestos legislation at the federal level. Accordingly, we continue to monitor these trend factors over time and periodically assesses whether an alternative forecast period is appropriate.
With the assistance of HR&A, effective as of December 31, 2016, we extended our estimate of the asbestos liability, including the costs of settlement or indemnity payments and defense costs relating to currently pending claims and future claims projected to be filed against us through the generally accepted end point of such claims in 2059. Our previous estimate was for asbestos claims filed or projected to be filed through 2021. Our estimate of the asbestos liability for pending and future claims through 2059 is based on the projected future asbestos costs resulting from our experience using a range of reference periods for claims filed, settled and dismissed. Based on this estimate, we recorded an additional liability of $227 million (an aggregate asbestos liability of $696 million) as of December 31, 2016.
Management has made its best estimate of the costs through 2059 based on the analysis by HR&A completed in January 2017. Through December 31, 2017, our actual experience during the updated reference period for mesothelioma claims filed and dismissed generally approximated the assumptions in our liability estimate. In addition to this claims experience, we considered additional quantitative and qualitative factors such as the nature of the aging of pending claims, significant appellate rulings and legislative developments, and their respective effects on expected future settlement values. Based on this evaluation, we determined that no change in the estimate was warranted for the period ended December 31, 2017.
In conjunction with developing the aggregate liability estimate referenced above, we also developed an estimate of probable insurance recoveries for our asbestos liabilities. As of December 31, 2016, we had an aggregate asbestos insurance receivable of
Page 37
MANAGEMENT’S DISCUSSION AND ANALYSIS OF FINANCIAL CONDITION AND RESULTS OF OPERATIONS
$143 million. In developing this estimate, we considered our coverage-in-place and other settlement agreements, as well as a number of additional factors. These additional factors include the financial viability of the insurance companies, the method by which losses will be allocated to the various insurance policies and the years covered by those policies, how settlement and defense costs will be covered by the insurance policies and interpretation of the effect on coverage of various policy terms and limits and their interrelationships. The insurance receivable was $115 million as of December 31, 2017.
Environmental. For environmental matters, we record a liability for estimated remediation costs when it is probable that we will be responsible for such costs and they can be reasonably estimated. Generally, third party specialists assist in the estimation of remediation costs. The environmental remediation liability as of December 31, 2017 is substantially all for the Goodyear Site. Estimates of our environmental liabilities at the Goodyear Site are based on currently available facts, present laws and regulations and current technology available for remediation, and are recorded on an undiscounted basis. These estimates consider our prior experience in the Goodyear Site investigation and remediation, as well as available data from, and in consultation with, our environmental specialists. Estimates at the Goodyear Site are subject to significant uncertainties caused primarily by the dynamic nature of the Goodyear Site conditions, the range of remediation alternatives available, together with the corresponding estimates of cleanup methodology and costs, as well as ongoing, required regulatory approvals, primarily from the EPA. During the third quarter of 2014, the EPA issued a Record of Decision amendment requiring, among other things, additional source area remediation resulting in us recording a charge of $49 million, extending the accrued costs through 2022. As of December 31, 2017, the total estimated gross liability for the Goodyear Site was $41 million.
On July 31, 2006, we entered into a consent decree with the U.S. Department of Justice on behalf of the Department of Defense and the Department of Energy pursuant to which, among other things, the U.S. Government reimburses us for 21% of qualifying costs of investigation and remediation activities at the Goodyear Site.
Pension Plans. In the U.S., we sponsor a defined benefit pension plan that covers approximately 17% of all U.S. employees. The benefits are based on years of service and compensation on a final average pay basis, except for certain hourly employees where benefits are fixed per year of service. This plan is funded with a trustee in respect to past and current service. Charges to expense are based upon costs computed by an independent actuary. Contributions are intended to provide for future benefits earned to date. A number of our non-U.S. subsidiaries sponsor defined benefit pension plans that cover approximately 12% of all non-U.S. employees. The benefits are typically based upon years of service and compensation. These plans are generally funded with trustees in respect to past and current service.
The expected return on plan assets component of net periodic benefit cost is determined by applying the assumed expected return on plan assets to the fair value of plan assets. For one of the U.K. pension plans, a market-related value of assets is used in lieu of the fair value of plan assets for this purpose. The net actuarial loss (gain) is amortized to the extent that it exceeds 10% of the greater of the fair value of plan assets and the projected benefit obligation. The amortization period is the average life expectancy of plan participants for most plans. The amortization period for plans with a significant number of active participants accruing benefits is the average future working lifetime of plan participants. The prior service cost (credit) is amortized over the average future working lifetime of plan participants whose prior service benefits were changed.
The net periodic pension benefit was $8 million, $9 million and $11 million in 2017, 2016 and 2015, respectively. The net periodic pension benefit was $1 million less in 2017 compared to 2016, driven by lower discount rates for both U.S. and non U.S. plans. Employer cash contributions were $13 million, $8 million and $17 million in 2017, 2016 and 2015, respectively, to our U.S. defined benefit pension plan. We expect, based on current actuarial calculations, to contribute cash of approximately $25 million to our pension plans in 2018. Cash contributions in subsequent years will depend on a number of factors including the investment performance of plan assets.
Holding all other factors constant, a decrease in the expected long-term rate of return of plan assets by 0.25 percentage points would have increased 2017 pension expense by $1.0 million for U.S. pension plans and $1.2 million for non-U.S. pension plans. Also, holding all other factors constant, a decrease in the discount rate used to determine net periodic pension cost by 0.25 percentage points would have increased 2017 pension expense by $0.1 million for U.S. pension plans and $0.6 million for non-U.S. pension plans.
Page 38
MANAGEMENT’S DISCUSSION AND ANALYSIS OF FINANCIAL CONDITION AND RESULTS OF OPERATIONS
The following key assumptions were used to calculate the benefit obligation and net periodic cost for the periods indicated:
Pension Benefits | |||||||||
2017 | 2016 | 2015 | |||||||
Benefit Obligations | |||||||||
U.S. Plans: | |||||||||
Discount rate | 3.75 | % | 4.29 | % | 4.41 | % | |||
Rate of compensation increase | N/A | N/A | N/A | ||||||
Non-U.S. Plans: | |||||||||
Discount rate | 2.15 | % | 2.29 | % | 3.30 | % | |||
Rate of compensation increase | 2.80 | % | 2.85 | % | 2.81 | % | |||
Net Periodic Benefit Cost | |||||||||
U.S. Plans: | |||||||||
Discount rate | 4.29 | % | 4.41 | % | 4.10 | % | |||
Expected rate of return on plan assets | 7.75 | % | 7.75 | % | 7.75 | % | |||
Rate of compensation increase | N/A | N/A | N/A | ||||||
Non-U.S. Plans: | |||||||||
Discount rate | 2.29 | % | 3.30 | % | 3.01 | % | |||
Expected rate of return on plan assets | 6.45 | % | 6.77 | % | 6.94 | % | |||
Rate of compensation increase | 2.85 | % | 2.81 | % | 2.40 | % | |||
The long-term expected rate of return on plan assets assumptions were determined with input from independent investment consultants and plan actuaries, utilizing asset pricing models and considering historic returns. The discount rates we used for valuing pension liabilities are based on a review of high quality corporate bond yields with maturities approximating the remaining life of the projected benefit obligation.
Recent Accounting Pronouncements
Information regarding new accounting pronouncements is included in Part II, Item 8 under Note 1 to the consolidated financial statements.
Item 7A. Quantitative and Qualitative Disclosures About Market Risk.
Our cash flows and earnings are subject to fluctuations from changes in interest rates and foreign currency exchange rates. We manage our exposures to these market risks through internally established policies and procedures and, when deemed appropriate, through the use of interest-rate swap agreements and forward exchange contracts. We do not enter into derivatives or other financial instruments for trading or speculative purposes.
Total debt outstanding was $744 million as of December 31, 2017, which was at fixed rates of interest ranging from 2.75% to 6.55%.
The following is an analysis of the potential changes in interest rates and currency exchange rates based upon sensitivity analysis that models effects of shifts in rates. These are not forecasts.
• | Our year-end portfolio is comprised of fixed-rate debt; therefore, the effect of a market change in interest rates would not be significant. |
• | Based on a sensitivity analysis as of December 31, 2017, a 10% change in the foreign currency exchange rates for the year ended December 31, 2017 would have impacted our net earnings by approximately $6 million, due primarily to the euro, British pound, Canadian dollar and Japanese yen. This calculation assumes that all currencies change in the same direction and proportion relative to the U.S. dollar and there are no indirect effects, such as changes in non-U.S. dollar sales volumes or prices. |
Page 39
Item 8. Financial Statements and Supplementary Data
MANAGEMENT’S RESPONSIBILITY
FOR FINANCIAL REPORTING
The accompanying consolidated financial statements of Crane Co. and subsidiaries have been prepared by management in conformity with accounting principles generally accepted in the United States of America and, in the judgment of management, present fairly and consistently the Company’s financial position and results of operations and cash flows. These statements by necessity include amounts that are based on management’s best estimates and judgments and give due consideration to materiality.
Management is responsible for establishing and maintaining adequate internal control over financial reporting. The Company’s internal control system was designed to provide reasonable assurance to the Company’s management and board of directors regarding the preparation and fair presentation of published financial statements.
All internal control systems, no matter how well designed, have inherent limitations. Therefore, even those systems determined to be effective can provide only reasonable assurance with respect to financial statement preparation and presentation.
Management assessed the effectiveness of the Company’s internal control over financial reporting as of December 31, 2017. In making its assessment, management has utilized the criteria set forth by the Committee of Sponsoring Organizations of the Treadway Commission in its Internal Control—Integrated Framework, released in 2013. Based on our assessment we believe that, as of December 31, 2017, the Company’s internal control over financial reporting is effective based on those criteria.
Deloitte & Touche LLP, the independent registered public accounting firm that also audited the Company’s consolidated financial statements included in this Annual Report on Form 10-K, audited the internal control over financial reporting as of December 31, 2017, and issued their related attestation report which is included herein.
/s/ Max H. Mitchell
Max H. Mitchell
President and Chief Executive Officer
/s/ Richard A. Maue
Richard A. Maue
Vice President - Finance and Chief Financial Officer
(Principal Financial Officer)
The Section 302 certifications of the Company’s Chief Executive Officer and its Principal Financial Officer have been filed as Exhibit 31 to the Company’s Annual Report on Form 10-K for the fiscal year ended December 31, 2017.
Page 40
REPORT OF INDEPENDENT REGISTERED PUBLIC ACCOUNTING FIRM
To the shareholders and the Board of Directors of Crane Co.
Opinion on the Financial Statements
We have audited the accompanying consolidated balance sheets of Crane Co. and subsidiaries (the "Company") as of December 31, 2017 and 2016, the related consolidated statements of operations, comprehensive income (loss), cash flows, and changes in equity, for each of the three years in the period ended December 31, 2017, and the related notes and the schedules listed in the Index at Item 8 (collectively referred to as the "financial statements"). In our opinion, the financial statements present fairly, in all material respects, the financial position of the Company as of December 31, 2017 and 2016, and the results of its operations and its cash flows for each of the three years in the period ended December 31, 2017, in conformity with the applicable financial reporting framework, e.g., accounting principles generally accepted in the United States of America.
We have also audited, in accordance with the standards of the Public Company Accounting Oversight Board (United States) (PCAOB), the Company's internal control over financial reporting as of December 31, 2017, based on criteria established in Internal Control - Integrated Framework (2013) issued by the Committee of Sponsoring Organizations of the Treadway Commission and our report dated February 26, 2018, expressed an unqualified opinion on the Company's internal control over financial reporting.
Basis for Opinion
These financial statements are the responsibility of the Company's management. Our responsibility is to express an opinion on the Company's financial statements based on our audits. We are a public accounting firm registered with the PCAOB and are required to be independent with respect to the Company in accordance with the U.S. federal securities laws and the applicable rules and regulations of the Securities and Exchange Commission and the PCAOB.
We conducted our audits in accordance with the standards of the PCAOB. Those standards require that we plan and perform the audit to obtain reasonable assurance about whether the financial statements are free of material misstatement, whether due to error or fraud. Our audits included performing procedures to assess the risks of material misstatement of the financial statements, whether due to error or fraud, and performing procedures that respond to those risks. Such procedures included examining, on a test basis, evidence regarding the amounts and disclosures in the financial statements. Our audits also included evaluating the accounting principles used and significant estimates made by management, as well as evaluating the overall presentation of the financial statements. We believe that our audits provide a reasonable basis for our opinion.
/s/ Deloitte & Touche LLP
Stamford, CT
February 26, 2018
We have served as the Company's auditor since 1979.
Page 41
CONSOLIDATED STATEMENTS OF OPERATIONS
For the year ended December 31, | |||||||||||
(in millions, except per share data) | 2017 | 2016 | 2015 | ||||||||
Net sales | $ | 2,786.0 | $ | 2,748.0 | $ | 2,740.5 | |||||
Operating costs and expenses: | |||||||||||
Cost of sales | 1,770.9 | 1,758.3 | 1,786.1 | ||||||||
Selling, general and administrative | 592.4 | 597.0 | 566.5 | ||||||||
Asbestos provision | — | 192.4 | — | ||||||||
Transaction related charges | 7.8 | — | — | ||||||||
Restructuring charges | 13.0 | — | 7.8 | ||||||||
Acquisition integration related charges | — | — | 7.2 | ||||||||
2,384.1 | 2,547.7 | 2,367.6 | |||||||||
Operating profit | 401.9 | 200.3 | 372.9 | ||||||||
Other income (expense): | |||||||||||
Interest income | 2.5 | 1.9 | 1.9 | ||||||||
Interest expense | (36.1 | ) | (36.5 | ) | (37.6 | ) | |||||
Miscellaneous expense | (0.8 | ) | (1.6 | ) | (0.7 | ) | |||||
(34.4 | ) | (36.2 | ) | (36.4 | ) | ||||||
Income before income taxes | 367.5 | 164.1 | 336.5 | ||||||||
Provision for income taxes | 195.0 | 40.3 | 106.5 | ||||||||
Net income before allocation to noncontrolling interests | 172.5 | 123.8 | 230.0 | ||||||||
Less: Noncontrolling interest in subsidiaries’ earnings | 0.7 | 1.0 | 1.1 | ||||||||
Net income attributable to common shareholders | $ | 171.8 | $ | 122.8 | $ | 228.9 | |||||
Basic earnings per share | $ | 2.89 | $ | 2.10 | $ | 3.94 | |||||
Weighted average basic shares outstanding | 59.4 | 58.5 | 58.1 | ||||||||
Diluted earnings per share | $ | 2.84 | $ | 2.07 | $ | 3.89 | |||||
Weighted average diluted shares outstanding | 60.4 | 59.3 | 58.8 | ||||||||
See Notes to Consolidated Financial Statements
Page 42
CONSOLIDATED STATEMENTS OF COMPREHENSIVE INCOME
For the year ended December 31, | ||||||||||||
(in millions) | 2017 | 2016 | 2015 | |||||||||
Net income before allocation to noncontrolling interests | $ | 172.5 | $ | 123.8 | $ | 230.0 | ||||||
Other comprehensive income (loss), net of tax | ||||||||||||
Currency translation adjustment | 86.9 | (64.7 | ) | (70.1 | ) | |||||||
Changes in pension and postretirement plan assets and benefit obligation, net of tax benefit | 9.2 | (35.2 | ) | (8.4 | ) | |||||||
Other comprehensive income (loss), net of tax | 96.1 | (99.9 | ) | (78.5 | ) | |||||||
Comprehensive income before allocation to noncontrolling interests | 268.6 | 23.9 | 151.5 | |||||||||
Less: Noncontrolling interests in comprehensive income | 0.7 | 1.0 | 1.1 | |||||||||
Comprehensive income attributable to common shareholders | $ | 267.9 | $ | 22.9 | $ | 150.4 | ||||||
See Notes to Consolidated Financial Statements
Page 43
CONSOLIDATED BALANCE SHEETS
Balance as of December 31, | ||||||||
(in millions, except shares and per share data) | 2017 | 2016 | ||||||
Assets | ||||||||
Current assets: | ||||||||
Cash and cash equivalents | $ | 706.2 | $ | 509.7 | ||||
Current insurance receivable — asbestos | 25.0 | 18.0 | ||||||
Accounts receivable, net | 418.4 | 396.4 | ||||||
Inventories | 349.3 | 342.5 | ||||||
Current deferred tax assets | — | 29.6 | ||||||
Other current assets | 19.6 | 19.5 | ||||||
Total current assets | 1,518.5 | 1,315.7 | ||||||
Property, plant and equipment, net | 282.4 | 278.9 | ||||||
Insurance receivable — asbestos | 90.1 | 125.2 | ||||||
Long-term deferred tax assets | 104.2 | 181.8 | ||||||
Other assets | 114.6 | 95.0 | ||||||
Intangible assets, net | 276.8 | 282.2 | ||||||
Goodwill | 1,206.9 | 1,149.2 | ||||||
Total assets | $ | 3,593.5 | $ | 3,428.0 | ||||
Liabilities and equity | ||||||||
Current liabilities: | ||||||||
Current maturities of long-term debt | $ | 249.4 | $ | — | ||||
Accounts payable | 247.4 | 223.2 | ||||||
Current asbestos liability | 85.0 | 71.0 | ||||||
Accrued liabilities | 252.1 | 223.1 | ||||||
U.S. and foreign taxes on income | 3.6 | 3.5 | ||||||
Total current liabilities | 837.5 | 520.8 | ||||||
Long-term debt | 494.1 | 745.3 | ||||||
Accrued pension and postretirement benefits | 240.5 | 249.1 | ||||||
Long-term deferred tax liability | 44.9 | 42.4 | ||||||
Long-term asbestos liability | 520.3 | 624.9 | ||||||
Other liabilities | 107.7 | 99.8 | ||||||
Commitments and contingencies (Note 11) | ||||||||
Equity: | ||||||||
Preferred shares, par value $.01; 5,000,000 shares authorized | — | — | ||||||
Common shares, par value $1.00; 200,000,000 shares authorized; 72,426,139 shares issued; 59,411,636 shares outstanding (58,964,859 in 2016) | 72.4 | 72.4 | ||||||
Capital surplus | 291.7 | 276.9 | ||||||
Retained earnings | 1,813.3 | 1,719.9 | ||||||
Accumulated other comprehensive loss | (380.1 | ) | (476.1 | ) | ||||
Treasury stock; 13,014,503 treasury shares (13,461,280 in 2016) | (452.1 | ) | (459.3 | ) | ||||
Total shareholders’ equity | 1,345.2 | 1,133.8 | ||||||
Noncontrolling interest | 3.3 | 11.9 | ||||||
Total equity | 1,348.5 | 1,145.7 | ||||||
Total liabilities and equity | $ | 3,593.5 | $ | 3,428.0 | ||||
Page 44
CONSOLIDATED STATEMENTS OF CASH FLOWS
For year ended December 31, | |||||||||||
(in millions) | 2017 | 2016 | 2015 | ||||||||
Operating activities: | |||||||||||
Net income attributable to common shareholders | $ | 171.8 | $ | 122.8 | $ | 228.9 | |||||
Noncontrolling interest in subsidiaries' earnings | 0.7 | 1.0 | 1.1 | ||||||||
Net income before allocations to noncontrolling interests | 172.5 | 123.8 | 230.0 | ||||||||
Asbestos provision | — | 192.4 | — | ||||||||
Gain on deconsolidation of joint venture | (1.0 | ) | — | — | |||||||
Gain on sale of property related to facility consolidation | (11.1 | ) | — | — | |||||||
Restructuring - Non Cash | — | — | 2.0 | ||||||||
Depreciation and amortization | 72.7 | 67.4 | 67.0 | ||||||||
Stock-based compensation expense | 21.8 | 21.7 | 21.3 | ||||||||
Defined benefit plans and postretirement credit | (8.5 | ) | (9.1 | ) | (11.6 | ) | |||||
Deferred income taxes | 102.3 | (25.1 | ) | 39.7 | |||||||
Cash provided by (used for) operating working capital | 54.0 | 27.0 | (16.1 | ) | |||||||
Defined benefit plans and postretirement contributions | (13.2 | ) | (8.8 | ) | (17.9 | ) | |||||
Environmental payments, net of reimbursements | (6.3 | ) | (11.6 | ) | (18.2 | ) | |||||
Payments for asbestos-related fees and costs, net of insurance recoveries | (62.5 | ) | (56.0 | ) | (49.9 | ) | |||||
Other | (3.2 | ) | (3.6 | ) | (17.0 | ) | |||||
Total provided by operating activities | 317.5 | 318.1 | 229.3 | ||||||||
Investing activities: | |||||||||||
Capital expenditures | (49.0 | ) | (51.5 | ) | (39.6 | ) | |||||
Proceeds from disposition of capital assets | 22.3 | 0.9 | 4.4 | ||||||||
Impact of deconsolidation of joint ventures | (5.2 | ) | — | — | |||||||
Payments for acquisitions, net of cash acquired | (54.8 | ) | — | — | |||||||
Total used for investing activities | (86.7 | ) | (50.6 | ) | (35.2 | ) | |||||
Financing activities: | |||||||||||
Dividends paid | (78.4 | ) | (77.2 | ) | (76.6 | ) | |||||
Reacquisition of shares on open market | (25.0 | ) | — | (25.0 | ) | ||||||
Stock options exercised - net of shares reacquired | 25.2 | 26.4 | 8.9 | ||||||||
Excess tax benefit from stock-based compensation | — | — | 0.1 | ||||||||
Repayment of credit facility | — | — | (100.0 | ) | |||||||
(Repayments) proceeds from issuance of commercial paper - net | — | (49.6 | ) | 48.8 | |||||||
Debt issuance costs | (2.6 | ) | — | — | |||||||
Total used for financing activities | (80.8 | ) | (100.4 | ) | (143.8 | ) | |||||
Effect of exchange rates on cash and cash equivalents | 46.5 | (20.9 | ) | (33.1 | ) | ||||||
Increase in cash and cash equivalents | 196.5 | 146.2 | 17.2 | ||||||||
Cash and cash equivalents at beginning of period | 509.7 | 363.5 | 346.3 | ||||||||
Cash and cash equivalents at end of period | $ | 706.2 | $ | 509.7 | $ | 363.5 | |||||
Detail of cash provided by (used for) working capital: | |||||||||||
Accounts receivable | $ | (10.1 | ) | $ | (6.2 | ) | $ | (2.4 | ) | ||
Inventories | 6.4 | 24.9 | (23.0 | ) | |||||||
Other current assets | 0.8 | (2.4 | ) | (3.0 | ) | ||||||
Accounts payable | 17.5 | 5.5 | 3.3 | ||||||||
Accrued liabilities | 30.8 | 9.6 | 6.1 | ||||||||
U.S. and foreign taxes on income | 8.6 | (4.4 | ) | 2.9 | |||||||
Total | $ | 54.0 | $ | 27.0 | $ | (16.1 | ) | ||||
Supplemental disclosure of cash flow information: | |||||||||||
Interest paid | $ | 36.0 | $ | 36.8 | $ | 37.5 | |||||
Income taxes paid | $ | 84.1 | $ | 69.8 | $ | 51.1 | |||||
See Notes to Consolidated Financial Statements.
Page 45
CONSOLIDATED STATEMENTS OF CHANGES IN EQUITY
(in millions, except share data) | Common Shares Issued at Par Value | Capital Surplus | Retained Earnings | Accumulated Other Comprehensive Income (Loss) | Treasury Stock | Total Shareholders’ Equity | Noncontrolling Interest | Total Equity | ||||||||||||||||||||||
BALANCE DECEMBER 31, 2014 | 72.4 | $ | 249.2 | $ | 1,522.0 | $ | (298.8 | ) | $ | (485.1 | ) | $ | 1,059.8 | $ | 10.8 | $ | 1,070.6 | |||||||||||||
Net income | 228.9 | 228.9 | 1.1 | 230.0 | ||||||||||||||||||||||||||
Cash dividends ($1.32 per share) | (76.6 | ) | (76.6 | ) | (76.6 | ) | ||||||||||||||||||||||||
Reacquisition on open market 398,095 shares | (25.0 | ) | (25.0 | ) | (25.0 | ) | ||||||||||||||||||||||||
Exercise of stock options, net of shares reacquired, 302,521 | 11.1 | 11.1 | 11.1 | |||||||||||||||||||||||||||
Stock option amortization | 7.8 | 7.8 | 7.8 | |||||||||||||||||||||||||||
Tax benefit — stock options and restricted stock | 0.1 | 0.1 | 0.1 | |||||||||||||||||||||||||||
Restricted stock, net | 6.5 | 4.8 | 11.3 | 11.3 | ||||||||||||||||||||||||||
Changes in pension and postretirement plan assets and benefit obligation, net of tax | (8.4 | ) | (8.4 | ) | (8.4 | ) | ||||||||||||||||||||||||
Currency translation adjustment | (69.6 | ) | (69.6 | ) | (0.5 | ) | (70.1 | ) | ||||||||||||||||||||||
BALANCE DECEMBER 31, 2015 | 72.4 | $ | 263.6 | $ | 1,674.3 | $ | (376.7 | ) | $ | (494.2 | ) | $ | 1,139.4 | $ | 11.4 | $ | 1,150.8 | |||||||||||||
Net income | 122.8 | 122.8 | 1.0 | $ | 123.8 | |||||||||||||||||||||||||
Cash dividends ($1.32 per share) | (77.2 | ) | (77.2 | ) | (77.2 | ) | ||||||||||||||||||||||||
Exercise of stock options, net of shares reacquired, 681,173 | 30.4 | 30.4 | 30.4 | |||||||||||||||||||||||||||
Stock option amortization | 6.3 | 6.3 | 6.3 | |||||||||||||||||||||||||||
Restricted stock, net | 7.0 | 4.5 | 11.5 | 11.5 | ||||||||||||||||||||||||||
Changes in pension and postretirement plan assets and benefit obligation, net of tax | (35.2 | ) | (35.2 | ) | (35.2 | ) | ||||||||||||||||||||||||
Currency translation adjustment | (64.2 | ) | (64.2 | ) | (0.5 | ) | (64.7 | ) | ||||||||||||||||||||||
BALANCE DECEMBER 31, 2016 | 72.4 | $ | 276.9 | $ | 1,719.9 | $ | (476.1 | ) | $ | (459.3 | ) | $ | 1,133.8 | $ | 11.9 | $ | 1,145.7 | |||||||||||||
Net income | 171.8 | 171.8 | 0.7 | 172.5 | ||||||||||||||||||||||||||
Cash dividends ($1.32 per share) | (78.4 | ) | (78.4 | ) | (78.4 | ) | ||||||||||||||||||||||||
Reacquisition on open market 331,632 shares | (25.0 | ) | (25.0 | ) | (25.0 | ) | ||||||||||||||||||||||||
Exercise of stock options, net of shares reacquired, 620,927 | 30.6 | 30.6 | 30.6 | |||||||||||||||||||||||||||
Stock option amortization | 6.1 | 6.1 | 6.1 | |||||||||||||||||||||||||||
Restricted stock, net | 8.7 | 1.6 | 10.3 | 10.3 | ||||||||||||||||||||||||||
Deconsolidation of a joint venture | — | (9.4 | ) | (9.4 | ) | |||||||||||||||||||||||||
Changes in pension and postretirement plan assets and benefit obligation, net of tax | 9.2 | 9.2 | 9.2 | |||||||||||||||||||||||||||
Currency translation adjustment | 86.8 | 86.8 | 0.1 | 86.9 | ||||||||||||||||||||||||||
BALANCE DECEMBER 31, 2017 | 72.4 | $ | 291.7 | $ | 1,813.3 | $ | (380.1 | ) | $ | (452.1 | ) | $ | 1,345.2 | $ | 3.3 | $ | 1,348.5 | |||||||||||||
See Notes to Consolidated Financial Statements
Page 46
NOTES TO CONSOLIDATED FINANCIAL STATEMENTS
Note 1 – Nature of Operations and Significant Accounting Policies
Nature of Operations
Crane Co. (the “Company”) is a diversified manufacturer of highly engineered industrial products comprised of four reporting segments: Fluid Handling, Payment & Merchandising Technologies, Aerospace & Electronics and Engineered Materials. The primary markets are chemicals, oil & gas, power, automated payment solutions, banknote design and production and aerospace & defense, along with a wide range of general industrial and consumer related end markets.
See Note 13, “Segment Information” for the relative size of these segments in relation to the total company (both net sales and total assets).
Due to rounding, numbers presented throughout this report may not add up precisely to totals the Company provides, and percentages may not precisely reflect the absolute figures.
Significant Accounting Policies
Accounting Principles. The Company’s consolidated financial statements are prepared in conformity with accounting principles generally accepted in the United States of America (“U.S. GAAP”). The consolidated financial statements include the accounts of the Company and its subsidiaries. All intercompany balances and transactions have been eliminated upon consolidation.
Use of Estimates. These accounting principles require management to make estimates and assumptions that affect the reported amounts of assets and liabilities at the date of the financial statements and the reported amounts of revenue and expense during the reporting period. Actual results may differ from those estimated. Estimates and assumptions are reviewed periodically, and the effects of revisions are reflected in the financial statements in the period in which they are determined to be necessary. Estimates are used when accounting for such items as asset valuations, allowance for doubtful accounts, depreciation and amortization, impairment assessments, reserve for excess and obsolete inventory, reserve for warranty provision, restructuring provisions, employee benefits, taxes, asbestos liability and related insurance receivable, environmental liability and contingencies.
Currency Translation. Assets and liabilities of subsidiaries that prepare financial statements in currencies other than the U.S. dollar are translated at the rate of exchange in effect on the balance sheet date; results of operations are translated at the monthly average rates of exchange prevailing during the year. The related translation adjustments are included in accumulated other comprehensive income (loss) in a separate component of equity.
Revenue Recognition. Revenue is recorded when title (risk of loss) passes to the customer and collection of the resulting receivable is reasonably assured. Revenue on long-term, fixed-price contracts is recorded on a percentage of completion basis using units of delivery as the measurement basis for progress toward completion. Sales under cost reimbursement type contracts are recorded as costs are incurred.
Cost of Goods Sold. Cost of goods sold includes the costs of inventory sold and the related purchase and distribution costs. In addition to material, labor and direct overhead and inventoried cost, cost of goods sold include allocations of other expenses that are part of the production process, such as inbound freight charges, purchasing and receiving costs, inspection costs, warehousing costs, amortization of production related intangible assets and depreciation expense. The Company also includes costs directly associated with products sold, such as warranty provisions.
Selling, General and Administrative Expenses. Selling, general and administrative expenses are charged to income as incurred. Such expenses include the costs of promoting and selling products and include such items as compensation, advertising, sales commissions and travel. Also included are costs related to compensation for other operating activities such as executive office administrative and engineering functions, as well as general operating expenses such as office supplies, non-income taxes, insurance and office equipment rentals.
Income Taxes. The Company accounts for income taxes in accordance with Accounting Standards Codification (“ASC”) Topic 740 “Income Taxes” (“ASC 740”) which requires an asset and liability approach for the financial accounting and reporting of income taxes. Under this method, deferred income taxes are recognized for the expected future tax consequences of differences between the tax bases of assets and liabilities and their reported amounts in the financial statements. These balances are measured using the enacted tax rates expected to apply in the year(s) in which these temporary differences are expected to reverse. The effect of a change in tax rates on deferred income taxes is recognized in income in the period when the change is enacted.
Based on consideration of all available evidence regarding their utilization, the Company records net deferred tax assets to the extent that it is more likely than not that they will be realized. Where, based on the weight of all available evidence, it is more
Page 47
NOTES TO CONSOLIDATED FINANCIAL STATEMENTS
likely than not that some amount of a deferred tax asset will not be realized, the Company establishes a valuation allowance for the amount that, in management's judgment, is sufficient to reduce the deferred tax asset to an amount that is more likely than not to be realized. The evidence the Company considers in reaching such conclusions includes, but is not limited to, (1) future reversals of existing taxable temporary differences, (2) future taxable income exclusive of reversing taxable temporary differences, (3) taxable income in prior carryback year(s) if carryback is permitted under the tax law, (4) cumulative losses in recent years, (5) a history of tax losses or credit carryforwards expiring unused, (6) a carryback or carryforward period that is so brief it limits realization of tax benefits, and (7) a strong earnings history exclusive of the loss that created the carryforward and support showing that the loss is an aberration rather than a continuing condition.
The Company accounts for unrecognized tax benefits in accordance with ASC 740, which prescribes a minimum probability threshold that a tax position must meet before a financial statement benefit is recognized. The minimum threshold is defined as a tax position that is more likely than not to be sustained upon examination by the applicable taxing authority, including resolution of any related appeals or litigation, based solely on the technical merits of the position. The tax benefit recognized is the largest amount of benefit that is greater than 50% likely of being realized upon ultimate settlement.
The Company recognizes interest and penalties related to unrecognized tax benefits within the income tax expense line of its Consolidated Statement of Operations, while accrued interest and penalties are included within the related tax liability line of its Consolidated Balance Sheets.
Earnings Per Share. The Company’s basic earnings per share calculations are based on the weighted average number of common shares outstanding during the year. Shares of restricted stock are included in the computation of both basic and diluted earnings per share. Potentially dilutive securities include outstanding stock options, restricted share units, deferred stock units and performance-based restricted share units. The dilutive effect of potentially dilutive securities is reflected in diluted earnings per common share by application of the treasury method. Diluted earnings per share gives effect to all potential dilutive common shares outstanding during the year.
(in millions, except per share data) For the year ended December 31, | 2017 | 2016 | 2015 | |||||||||
Net income attributable to common shareholders | $ | 171.8 | $ | 122.8 | $ | 228.9 | ||||||
Weighted average basic shares outstanding | 59.4 | 58.5 | 58.1 | |||||||||
Effect of dilutive stock options | 1.0 | 0.8 | 0.7 | |||||||||
Weighted average diluted shares outstanding | 60.4 | 59.3 | 58.8 | |||||||||
Earnings per basic share | $ | 2.89 | $ | 2.10 | $ | 3.94 | ||||||
Earnings per diluted share | $ | 2.84 | $ | 2.07 | $ | 3.89 | ||||||
The computation of diluted earnings per share excludes the effect of the potential exercise of stock options when the average market price of the common stock is lower than the exercise price of the related stock options. During 2017, 2016 and 2015, 0.4 million, 0.9 million and 1.1 million average options were excluded, respectively.
Cash and Cash Equivalents. Cash and cash equivalents include highly liquid investments with original maturities of three months or less that are readily convertible to cash and are not subject to significant risk from fluctuations in interest rates. As a result, the carrying amount of cash and cash equivalents approximates fair value.
Accounts Receivable. Receivables are carried at net realizable value.
A summary of allowance for doubtful accounts activity follows:
(in millions) December 31, | 2017 | 2016 | 2015 | |||||||||
Balance at beginning of year | $ | 7.3 | $ | 4.7 | $ | 4.9 | ||||||
Provisions | 2.2 | 6.1 | 3.0 | |||||||||
Deductions | (2.3 | ) | (3.5 | ) | (3.2 | ) | ||||||
Balance at end of year | $ | 7.2 | $ | 7.3 | $ | 4.7 | ||||||
Concentrations of credit risk with respect to accounts receivable are limited due to the large number of customers and relatively small account balances within the majority of the Company’s customer base and their dispersion across different businesses. The Company periodically evaluates the financial strength of its customers and believes that its credit risk exposure is limited.
Page 48
NOTES TO CONSOLIDATED FINANCIAL STATEMENTS
Inventories. Inventories consist of the following:
(in millions) December 31, | 2017 | 2016 | ||||||
Finished goods | $ | 101.1 | $ | 97.7 | ||||
Finished parts and subassemblies | 46.1 | 38.2 | ||||||
Work in process | 51.6 | 56.0 | ||||||
Raw materials | 150.5 | 150.6 | ||||||
Total inventories | $ | 349.3 | $ | 342.5 | ||||
Inventories include the costs of material, labor and overhead and are stated at the lower of cost or market. Domestic inventories are stated at either the lower of cost or net realizable value using the last-in, first-out (“LIFO”) method or the lower of cost or net realizable value using the first-in, first-out (“FIFO”) method. Inventories held in foreign locations are primarily stated at the lower of cost or market using the FIFO method. The LIFO method is not being used at the Company’s foreign locations as such a method is not allowable for tax purposes. Changes in the levels of LIFO inventories have increased cost of sales by $0.4 million, reduced cost of sales by $1.8 million and reduced cost of sales by $1.5 million for the years ended December 31, 2017, 2016 and 2015, respectively. The portion of inventories costed using the LIFO method was 32% and 34% of consolidated inventories as of December 31, 2017 and 2016, respectively. If inventories that were valued using the LIFO method had been valued under the FIFO method, they would have been higher by $13.6 million and $13.3 million as of December 31, 2017 and 2016, respectively. The reserve for excess and obsolete inventory was $57.9 million and $54.1 million as of December 31, 2017 and 2016, respectively.
Property, Plant and Equipment, net. Property, plant and equipment, net consist of the following:
(in millions) December 31, | 2017 | 2016 | ||||||
Land | $ | 62.7 | $ | 66.6 | ||||
Buildings and improvements | 183.4 | 193.5 | ||||||
Machinery and equipment | 593.3 | 566.8 | ||||||
Gross property, plant and equipment | 839.4 | 826.9 | ||||||
Less: accumulated depreciation | 557.0 | 548.0 | ||||||
Property, plant and equipment, net | $ | 282.4 | $ | 278.9 | ||||
Property, plant and equipment are stated at cost and depreciation is calculated by the straight-line method over the estimated useful lives of the respective assets, which range from 10 to 25 years for buildings and improvements and three to ten years for machinery and equipment. Depreciation expense was $41.0 million, $40.2 million and $39.1 million for the years ended December 31, 2017, 2016 and 2015, respectively.
Goodwill and Intangible Assets. The Company’s business acquisitions have typically resulted in the recognition of goodwill and other intangible assets. The Company follows the provisions under ASC Topic 350, “Intangibles – Goodwill and Other” (“ASC 350”) as it relates to the accounting for goodwill in the Consolidated Financial Statements. These provisions require that the Company, on at least an annual basis, evaluate the fair value of the reporting units to which goodwill is assigned and attributed and compare that fair value to the carrying value of the reporting unit to determine if an impairment has occurred. The Company performs its annual impairment testing during the fourth quarter. Impairment testing takes place more often than annually if events or circumstances indicate a change in status that would indicate a potential impairment. The Company believes that there have been no events or circumstances which would more likely than not reduce the fair value for its reporting units below its carrying value. A reporting unit is an operating segment unless discrete financial information is prepared and reviewed by segment management for businesses one level below that operating segment (a “component”), in which case the component would be the reporting unit. As of December 31, 2017, the Company had seven reporting units.
When performing its annual impairment assessment, the Company compares the fair value of each of its reporting units to its respective carrying value. Goodwill is considered to be potentially impaired when the net book value of the reporting unit exceeds its estimated fair value. Fair values are established primarily by discounting estimated future cash flows at an estimated cost of capital which varies for each reporting unit and which, as of the Company’s most recent annual impairment assessment, ranged between 10.0% and 13.0% (a weighted average of 11.0%), reflecting the respective inherent business risk of each of the reporting units tested. This methodology for valuing the Company’s reporting units (commonly referred to as the Income Method) has not changed since the adoption of the provisions under ASC 350. The determination of discounted cash flows is based on the businesses’ strategic plans and long-range planning forecasts, which change from year to year. The revenue growth rates included in the forecasts represent best estimates based on current and forecasted market conditions. Profit margin assumptions are projected by each reporting unit based on the current cost structure and anticipated net cost increases/reductions. There are inherent uncertainties related to these assumptions, including changes in market conditions, and
Page 49
NOTES TO CONSOLIDATED FINANCIAL STATEMENTS
management judgment is necessary in applying them to the analysis of goodwill impairment. In addition to the foregoing, for each reporting unit, market multiples are used to corroborate its discounted cash flow results where fair value is estimated based on earnings multiples determined by available public information of comparable businesses. While the Company believes it has made reasonable estimates and assumptions to calculate the fair value of its reporting units, it is possible a material change could occur. If actual results are not consistent with management’s estimates and assumptions, goodwill and other intangible assets may then be determined to be overstated and a charge would need to be taken against net earnings. Furthermore, in order to evaluate the sensitivity of the fair value calculations on the goodwill impairment test performed during the fourth quarter of 2017, the Company applied a hypothetical, reasonably possible 10% decrease to the fair values of each reporting unit. The effects of this hypothetical 10% decrease would still result in the fair value calculation exceeding the carrying value for each reporting unit. No impairment charges have been required during 2017, 2016 or 2015.
Changes to goodwill are as follows:
(in millions) | Fluid Handling | Payment & Merchandising Technologies | Aerospace & Electronics | Engineered Materials | Total | ||||||||||
Balance as of December 31, 2015 | $ | 218.7 | $ | 575.2 | $ | 202.6 | $ | 171.4 | $ | 1,167.9 | |||||
Currency translation | (6.4 | ) | (11.9 | ) | (0.3 | ) | (0.1 | ) | (18.7 | ) | |||||
Balance at December 31, 2016 | $ | 212.3 | $ | 563.3 | $ | 202.3 | $ | 171.3 | $ | 1,149.2 | |||||
Additions | 22.6 | 8.9 | — | — | 31.5 | ||||||||||
Currency translation | 10.5 | 15.5 | 0.1 | 0.1 | 26.2 | ||||||||||
Balance as of December 31, 2017 | $ | 245.4 | $ | 587.7 | $ | 202.4 | $ | 171.4 | $ | 1,206.9 | |||||
For the year ended December 31, 2017, additions to goodwill represent the purchase price allocation related to the April 2017 acquisition of Westlock and the June 2017 acquisition of Microtronic. See discussion in Note 2, "Acquisitions and Divestitures" for further details.
As of December 31, 2017, the Company had $276.8 million of net intangible assets, of which $28.7 million were intangibles with indefinite useful lives, consisting of trade names. Intangibles with indefinite useful lives are tested annually for impairment, or when events or changes in circumstances indicate the potential for impairment. If the carrying amount of an indefinite lived intangible asset exceeds its fair value, the intangible asset is written down to its fair value. Fair value is calculated using relief from royalty method. The Company amortizes the cost of definite-lived intangibles over their estimated useful lives.
In addition to annual testing for impairment of indefinite-lived intangible assets, the Company reviews all of its definite-lived intangible assets for impairment whenever events or changes in circumstances indicate the carrying amount of an asset may not be recoverable. Examples of events or changes in circumstances could include, but are not limited to, a prolonged economic downturn, current period operating or cash flow losses combined with a history of losses or a forecast of continuing losses associated with the use of an asset or asset group, or a current expectation that an asset or asset group will be sold or disposed of before the end of its previously estimated useful life. Recoverability is based upon projections of anticipated future undiscounted cash flows associated with the use and eventual disposal of the definite-lived intangible asset (or asset group), as well as specific appraisal in certain instances. Reviews occur at the lowest level for which identifiable cash flows are largely independent of cash flows associated with other long-lived assets or asset groups and include estimated future revenues, gross profit margins, operating profit margins and capital expenditures which are based on the businesses’ strategic plans and long-range planning forecasts, which change from year to year. The revenue growth rates included in the forecasts represent the Company's best estimates based on current and forecasted market conditions, and the profit margin assumptions are based on the current cost structure and anticipated net cost increases/reductions. There are inherent uncertainties related to these assumptions, including changes in market conditions, and management’s judgment in applying them to the analysis. If the future undiscounted cash flows are less than the carrying value, then the definite-lived intangible asset is considered impaired and a charge would be taken against net earnings based on the amount by which the carrying amount exceeds the estimated recoverable amount. Judgments that the Company makes which impact these assessments relate to the expected useful lives of definite-lived assets and its ability to realize any undiscounted cash flows in excess of the carrying amounts of such assets, and are affected primarily by changes in the expected use of the assets, changes in technology or development of alternative assets, changes in economic conditions, changes in operating performance and changes in expected future cash flows. Since judgment is involved in determining the recoverable amount of definite-lived intangible assets, there is risk that the carrying value of the Company's definite-lived intangible assets may require adjustment in future periods. Historical results to date have generally approximated expected cash flows for the identifiable cash flow generating level. The Company believes there have been no
Page 50
NOTES TO CONSOLIDATED FINANCIAL STATEMENTS
events or circumstances which would more likely than not reduce the fair value of its indefinite-lived or definite-lived intangible assets below their carrying value.
Changes to intangible assets are as follows:
(in millions) December 31, | 2017 | 2016 | 2015 | |||||||
Balance at beginning of period, net of accumulated amortization | $ | 282.2 | $ | 317.1 | $ | 353.5 | ||||
Additions | 18.2 | — | — | |||||||
Amortization expense | (30.9 | ) | (30.7 | ) | (31.5 | ) | ||||
Currency translation and other | 7.3 | (4.2 | ) | (4.9 | ) | |||||
Balance at end of period, net of accumulated amortization | $ | 276.8 | $ | 282.2 | $ | 317.1 | ||||
For the year ended December 31, 2017, additions to intangible assets represent the purchase price allocation related to the April 2017 acquisition of Westlock and the June 2017 acquisition of Microtronic. See discussion in Note 2, "Acquisitions and Divestitures" for further details.
A summary of intangible assets follows:
(in millions) | Weighted Average Amortization Period of Finite Lived Assets (in years) | December 31, 2017 | December 31, 2016 | ||||||||||||||||||||||
Gross Asset | Accumulated Amortization | Net | Gross Asset | Accumulated Amortization | Net | ||||||||||||||||||||
Intellectual property rights | 15.8 | $ | 91.7 | $ | 54.8 | $ | 36.9 | $ | 86.4 | $ | 52.1 | $ | 34.3 | ||||||||||||
Customer relationships and backlog | 15.6 | 414.7 | 183.4 | 231.3 | 388.9 | 153.4 | 235.5 | ||||||||||||||||||
Drawings | 37.9 | 11.1 | 10.4 | 0.7 | 11.1 | 10.3 | 0.8 | ||||||||||||||||||
Other | 13.0 | 61.8 | 53.9 | 7.9 | 60.3 | 48.7 | 11.6 | ||||||||||||||||||
Total | 15.8 | $ | 579.3 | $ | 302.5 | $ | 276.8 | $ | 546.7 | $ | 264.5 | $ | 282.2 | ||||||||||||
Future amortization expense associated with intangibles is expected to be:
Year | (in millions) | ||
2018 | $ | 28.9 | |
2019 | 26.2 | ||
2020 | 22.0 | ||
2021 | 19.6 | ||
2022 and after | 151.4 | ||
Valuation of Long-Lived Assets. The Company reviews its long-lived assets for impairment whenever events or changes in circumstances indicate the carrying amount of an asset may not be recoverable. Examples of events or changes in circumstances could include, but are not limited to, a prolonged economic downturn, current period operating or cash flow losses combined with a history of losses or a forecast of continuing losses associated with the use of an asset or asset group, or a current expectation that an asset or asset group will be sold or disposed of before the end of its previously estimated useful life. Recoverability is based upon projections of anticipated future undiscounted cash flows associated with the use and eventual disposal of the long-lived asset (or asset group), as well as specific appraisal in certain instances. Reviews occur at the lowest level for which identifiable cash flows are largely independent of cash flows associated with other long-lived assets or asset groups. If the future undiscounted cash flows are less than the carrying value, then the long-lived asset is considered impaired and a loss is recognized based on the amount by which the carrying amount exceeds the estimated recoverable amount. Judgments that the Company makes which impact these assessments relate to the expected useful lives of long-lived assets and its ability to realize any undiscounted cash flows in excess of the carrying amounts of such assets, and are affected primarily by changes in the expected use of the assets, changes in technology or development of alternative assets, changes in economic conditions, changes in operating performance and changes in expected future cash flows. Since judgment is involved in determining the recoverable amount of long-lived assets, there is risk that the carrying value of the Company's long-lived assets may require adjustment in future periods.
Page 51
NOTES TO CONSOLIDATED FINANCIAL STATEMENTS
Financial Instruments. The Company does not hold or issue derivative financial instruments for trading or speculative purposes. The Company periodically uses forward foreign exchange contracts as economic hedges of anticipated transactions and firm purchase and sale commitments. These contracts are marked to fair value on a current basis and the respective gains and losses are recognized in other income (expense). The Company also periodically enters into interest-rate swap agreements to moderate its exposure to interest rate changes. Interest-rate swaps are agreements to exchange fixed and variable rate payments based on the notional principal amounts. The changes in the fair value of these derivatives are recognized in other comprehensive income (loss) for qualifying cash flow hedges.
Accumulated Other Comprehensive Income (Loss)
The tables below provide the accumulated balances for each classification of accumulated other comprehensive loss, as reflected on the Consolidated Balance Sheets.
(in millions) | Defined Benefit Pension and Other Postretirement Items* | Currency Translation Adjustment | Total | |||||||||
Balance as of December 31, 2016 | $ | (301.3 | ) | $ | (174.8 | ) | $ | (476.1 | ) | |||
Other comprehensive (loss) income before reclassifications | — | 86.8 | 86.8 | |||||||||
Amounts reclassified from accumulated other comprehensive income (loss) | 9.2 | — | 9.2 | |||||||||
Net period other comprehensive (loss) income | 9.2 | 86.8 | 96.0 | |||||||||
Balance as of December 31, 2017 | $ | (292.1 | ) | $ | (88.0 | ) | $ | (380.1 | ) | |||
(in millions) | Defined Benefit Pension and Other Postretirement Items* | Currency Translation Adjustment | Total | |||||||||
Balance as of December 31, 2015 | $ | (266.2 | ) | $ | (110.6 | ) | $ | (376.7 | ) | |||
Other comprehensive loss before reclassifications | (42.3 | ) | (64.2 | ) | (106.5 | ) | ||||||
Amounts reclassified from accumulated other comprehensive income (loss) | 7.1 | — | 7.1 | |||||||||
Net period other comprehensive loss | (35.2 | ) | (64.2 | ) | (99.4 | ) | ||||||
Balance as of December 31, 2016 | $ | (301.3 | ) | $ | (174.8 | ) | $ | (476.1 | ) | |||
* Net of tax benefit of $115.8, $119.8 and $109.8 for 2017, 2016, and 2015, respectively.
Page 52
NOTES TO CONSOLIDATED FINANCIAL STATEMENTS
The table below illustrates the amounts reclassified out of each component of accumulated other comprehensive income (loss) for the years ended December 31, 2017 and 2016.
Details of Accumulated Other Comprehensive Loss Components (in millions) | Amount Reclassified from Accumulated Other Comprehensive Loss | Affected Line Item in the Statements of Operations | ||||||||
December 31, | 2017 | 2016 | ||||||||
Amortization of defined benefit pension items: | ||||||||||
Prior-service costs | $ | (0.6 | ) | $ | (0.6 | ) | ($0.8) has been recorded within Cost of Sales for each of the years ended December 31, 2017 and 2016 and $0.2 has been recorded within Selling, General & Administrative for each of the years ended December 31, 2017 and 2016. | |||
Net loss | 14.3 | 11.3 | $19.4 and $15.3 have been recorded within Cost of Sales for the years ended December 31, 2017 and 2016, respectively and ($5.1) and ($4.0) have been recorded within Selling, General & Administrative for the years ended December 31, 2017 and 2016, respectively. | |||||||
Amortization of other postretirement items: | ||||||||||
Prior-service costs | (0.2 | ) | (0.2 | ) | Recorded within Selling, General & Administrative | |||||
Net gain | (0.3 | ) | (0.3 | ) | Recorded within Selling, General & Administrative | |||||
$ | 13.2 | $ | 10.2 | Total before tax | ||||||
4.0 | 3.1 | Tax benefit | ||||||||
Total reclassifications for the period | $ | 9.2 | $ | 7.1 | Net of tax | |||||
Recent Accounting Pronouncements - Not Yet Adopted as of December 31, 2017
Reclassification of Certain Tax Effects from Accumulated Other Comprehensive Income
Reclassification of Certain Tax Effects from Accumulated Other Comprehensive Income. In February 2018, the Financial Accounting Standard Board (“FASB”) issued amended guidance to allow a reclassification from accumulated other comprehensive income to retained earnings for stranded tax effects resulting from the Tax Cuts and Jobs Act ("TCJA"). This amended guidance is effective for fiscal years beginning after December 15, 2018, and interim periods within those fiscal years, with early adoption permitted. The Company is currently evaluating whether to adopt the amended guidance and, if so, the impact that it will have on its consolidated financial statements.
Presentation of Net Periodic Pension Cost and Net Periodic Postretirement Benefit Cost
In March 2017, the FASB issued amended guidance to improve the presentation of net periodic pension cost and net periodic postretirement benefit cost. The amended guidance requires the disaggregation of the service cost component from the other components of net periodic benefit costs and present it with other current compensation costs for related employees in the income statement, and present the other components elsewhere in the income statement and outside of income from operations if that subtotal is presented. This amended guidance is effective for fiscal years beginning after December 15, 2017, and interim periods within those fiscal years. The Company adopted the new standard on January 1, 2018 using the retrospective method. The adoption of this standard will result in a reclassification of the non-service cost components of net benefit cost from cost of sales and selling, general and administrative expenses to other income (expense). The adoption of this standard will not impact consolidated net income, the consolidated balance sheets or consolidated statements of cash flows.
Restricted Cash
In November 2016, the FASB issued amended guidance to address diversity in the classification and presentation of changes in restricted cash on the statement of cash flows. The amended guidance requires restricted cash and restricted cash equivalents to be classified in the statements of cash flows as cash and cash equivalents. This amended guidance is effective for fiscal years beginning after December 15, 2017, and interim periods within those fiscal years, using a retrospective transition method. The Company adopted the new standard on January 1, 2018. The adoption of this standard will not have a material impact to the Company’s consolidated statements of cash flows.
Page 53
NOTES TO CONSOLIDATED FINANCIAL STATEMENTS
Income Taxes on Intra-Entity Transfers of Assets
In October 2016, the FASB issued amended guidance related to the recognition of income taxes resulting from intra-entity transfers of assets other than inventory. The guidance requires companies to recognize the income tax consequences of an intra-entity transfer of an asset other than inventory when the transfer occurs. Income tax effects of intra-entity transfers of inventory will continue to be deferred until the inventory has been sold to a third party. This amended guidance is effective for annual reporting periods beginning after December 15, 2017, including interim reporting periods within those annual reporting periods, using a modified retrospective approach, with the cumulative effect recognized through retained earnings at the date of adoption. The Company adopted the new standard on January 1, 2018. The adoption of this standard will not have a material impact to the Company’s consolidated financial statements.
Cash Flow Simplification
In August 2016, the FASB issued amended guidance that clarifies how companies present and classify certain cash receipts and cash payments in the statement of cash flows. The amended guidance is effective for fiscal years beginning after December 15, 2017, including interim periods within those fiscal years. The Company adopted the new standard on January 1, 2018. The adoption of this standard will not have a material impact to the Company’s consolidated statements of cash flows.
Measurement of Credit Losses on Financial Instruments
In June 2016, the FASB issued amended guidance that changes the impairment model for most financial assets and certain other instruments. For trade and other receivables, held-to-maturity debt securities, loans and other instruments, entities will be required to use a new forward-looking “expected loss” model that will replace today’s “incurred loss” model and generally will result in the earlier recognition of allowances for losses. For available-for-sale debt securities with unrealized losses, entities will measure credit losses in a manner similar to current practice, except that the losses will be recognized as an allowance. This amended guidance is effective for fiscal years beginning after December 15, 2019, including interim periods within those fiscal years. Entities will apply the standard’s provisions as a cumulative-effect adjustment to retained earnings as of the beginning of the first effective reporting period. The Company does not expect that the amended guidance will have a material effect on its consolidated financial statements and related disclosures.
Leases
In February 2016, the FASB issued amended guidance on accounting for leases. The amended guidance requires the recognition of a right-of-use asset and a lease liability for all leases by lessees with the exception of short-term leases and amends disclosure requirements associated with leasing arrangements. The new standard is effective for fiscal years and interim periods within those fiscal years beginning after December 15, 2018 using a modified retrospective transition approach. Early adoption is permitted. The Company is currently evaluating the impact that the amended guidance will have on its consolidated financial statements and related disclosures.
Revenue Recognition
In May 2014, the FASB issued new accounting guidance related to revenue recognition. This new standard will replace all current U.S. GAAP guidance on this topic and eliminate all current industry-specific guidance. The new revenue recognition standard provides a unified model to determine when and how revenue is recognized. The core principle is that an entity should recognize revenue to depict the transfer of promised goods or services to customers in an amount that reflects the consideration for which the entity expects to be entitled in exchange for those goods or services. In July 2015, the FASB agreed to a one-year deferral of the effective date; the new standard is now effective for reporting periods beginning after December 15, 2017, including interim periods within that reporting period.
Effective January 1, 2018, the Company adopted the new standard using the modified retrospective transition method. A cumulative-effect adjustment to equity will be fully presented in its Quarterly Report on Form 10-Q for the three months ended March 31, 2018. The adoption of the new guidance will not have a material impact to its consolidated financial statements (the Company expects this adjustment to retained earnings to be less than $10 million). During 2017, the Company completed its evaluation of the new standard, including the impact on its business processes, systems and controls, and differences in the timing and/or method of revenue recognition for its contracts. As a result of its evaluation, the Company identified changes to and modified certain of its accounting policies and practices. The Company also designed and implemented specific controls over its evaluation of the impact of the new standard, including its calculation of the cumulative effect of adopting the new standard. Although there were no significant changes to its accounting systems or controls upon adoption of the new standard, the Company modified certain existing controls to incorporate the revisions the Company made to its accounting policies and practices.
Page 54
NOTES TO CONSOLIDATED FINANCIAL STATEMENTS
Based on its evaluation of the new standard, the Company does not expect it to have a material impact on its consolidated financial statements in the periods after adoption. The majority of its revenues will continue to be recognized at a point in time when the customer obtains control of the product. Revenue for certain contracts previously recognized at a point in time upon product delivery will now be recognized over time based on a cost to cost measure of progress. This change generally results in an acceleration of revenue as compared with its previous revenue recognition method for those contracts.
The Company has evaluated the disclosure requirements and incorporated the collection of relevant data into its reporting process.
Recent Accounting Pronouncements - Adopted
Balance Sheet Classification of Deferred Taxes
In November 2015, the FASB issued amended guidance to simplify the presentation of deferred income taxes. The amendments require deferred tax liabilities and assets to be classified as noncurrent. The amended guidance is effective for financial statements issued for annual periods beginning after December 15, 2016, and interim periods within those annual periods. The Company adopted this guidance on a prospective basis in the first quarter of 2017. Prior periods in its consolidated financial statements were not retrospectively adjusted.
Inventory
In July 2015, the FASB issued amended guidance, which changes the measurement principle for inventory from the lower of cost or market to the lower of cost and net realizable value. The guidance defines net realizable value as estimated selling price in the ordinary course of business, less reasonably predictable costs of completion, disposal, and transportation. The new guidance must be applied on a prospective basis and is effective for fiscal years beginning after December 15, 2016, and interim periods within those years. The Company adopted the guidance in the first quarter of 2017. The adoption of the guidance did not have a material impact on its consolidated financial statements.
Share-Based Payments
In March 2016, the FASB issued amended guidance related to employee share-based payment accounting. The amended guidance simplifies several aspects related to the accounting for share-based payment transactions, including the accounting for income taxes, statutory tax withholding requirements, forfeitures and classification on the statement of cash flows. This amended guidance was effective for fiscal years beginning after December 15, 2016, and interim periods within those fiscal years. The Company elected to early adopt this guidance in the fourth quarter of 2016. The primary impact of adoption was the recognition of excess tax benefits in the provision for income taxes, rather than paid-in capital, of $0.4 million for the year ended December 31, 2016. Cash flows related to excess tax benefits for share-based payments are now included in the consolidated statements of cash flows as net operating activities rather than net financing activities. The changes have been applied prospectively and prior periods have not been adjusted. The presentation requirements for cash flows related to employee taxes paid for withheld shares had no impact to any of the periods presented on the consolidated statement of cash flows since such cash flows have historically been presented as a financing activity. Furthermore, the Company elected to continue to estimate expected forfeitures of employee equity awards to determine the amount of compensation expense to be recognized in each period.
Other Recently Issued Pronouncements
On December 22, 2017, the U.S. Securities and Exchange Commission (“SEC”) released Staff Accounting Bulletin No. 118 (“SAB 118”) which allows registrants that do not have the necessary information available, prepared, or analyzed to complete the accounting for the TCJA to report provisional amounts in their SEC filings based on reasonable estimates. Further, it provides a one year measurement period for registrants to complete their accounting for the TCJA. If provisional amounts are recorded, SAB 118 requires registrants to include additional qualitative and quantitative disclosures in their SEC filings. Included in the Company's tax provision for the year ended December 31, 2017 are provisional amounts related to the TCJA. Further detail and disclosures are discussed in Note 3, "Income Taxes".
Note 2 – Acquisitions and Divestitures
In January 2018, the Company completed the acquisition of Crane & Co., Inc. (“Crane Currency”), a supplier of banknotes and highly engineered banknote security features. See Note 16, “Subsequent Events,” in the Notes to Consolidated Financial Statements.
In April 2017, the Company acquired all of the outstanding stock of Westlock Controls (“Westlock”) from Emerson Electric Co. for cash consideration of $40.0 million. Westlock is a global leader in the manufacturing and sale of switchboxes, position
Page 55
NOTES TO CONSOLIDATED FINANCIAL STATEMENTS
transmitters and other solutions for networking, monitoring and controlling process valves, a new product space which is closely adjacent to the Company’s existing operations in its Fluid Handling segment. With primary operations located in Saddle Brook, New Jersey, Westlock had 2016 sales of approximately $32.0 million. Allocation of the purchase price resulted in the Company recording goodwill of $22.6 million. Acquisition-related costs are being expensed as incurred. For the year ended December 31, 2017, the Company recorded $2.0 million of transaction costs. This acquisition has been integrated into the Company’s Fluid Handling segment, and the pro-forma impact is not material.
In June 2017, the Company acquired all of the outstanding stock of Microtronic AG (“Microtronic”) for cash consideration of approximately $18.0 million. With operations in Oensingen, Switzerland, Microtronic develops and manufactures closed electronic payment systems, primarily for the European vending market, strengthening the Company’s portfolio of cashless solutions. Allocation of the purchase price resulted in the Company recording goodwill of $8.9 million. Acquisition-related costs are being expensed as incurred. For the year ended December 31, 2017, the Company recorded $1.0 million of transaction costs. This acquisition has been integrated into the Company’s Payment & Merchandising Technologies segment, and the pro-forma impact is not material.
In December 2017, the Company sold a portion of an investment in a joint venture of which the Company's ownership interest was 70% within the Fluid Handling segment for $14.1 million. As of December 31, 2017, the Company's ownership interest in this joint venture was 4.9%. The sale resulted in the deconsolidation of such business and a gain in the amount of $1.0 million ($0.7 million after-tax) in 2017, of which $0.9 million was attributable to the remeasurement of the remaining investment. The fair value of the remaining investment in the joint venture of $2.3 million was established by discounting estimated future cash flows at an estimated cost of capital of 10% reflecting the respective inherent business risk of the joint venture arrangement, commonly referred to as the Income Method. The total gain is included in Miscellaneous expense.
Page 56
NOTES TO CONSOLIDATED FINANCIAL STATEMENTS
Note 3 – Income Taxes
Impact of the Tax Cuts and Jobs Act
Enacted on December 22, 2017, the TCJA significantly changed U.S. corporate income tax law by reducing federal statutory tax rates from 35% to 21%, instituting a territorial tax system that provides a 100% exemption on future repatriations from certain foreign subsidiaries, and imposing a one-time transition tax on previously deferred non-U.S. earnings. The Company recorded a one-time charge of $87 million in the fourth quarter of 2017 primarily consisting of:
• | A re-measurement of the Company's net deferred tax assets due to a reduction in U.S. corporate income tax rate from 35% to 21% effective January 1, 2018, totaling $75 million. |
• | A one-time mandatory transition tax on previously deferred earnings of foreign subsidiaries and a reassessment of the Company's assertion regarding re-investment of its non-US subsidiaries' undistributed earnings, together totaling $12 million. |
The Company calculated this $87 million charge based on its understanding of both the TCJA as drafted and interpretative guidance issued as of the time of this filing. In accordance with SAB 118, the Company considers the entire $87 million charge to be a provisional estimate. The TCJA includes provisions effective beginning on January 1, 2018, which include a tax on 50% of global intangible low-taxed income (“GILTI”), which is income determined to be in excess of a specified routine rate of return, as well as a base erosion and anti-abuse tax (“BEAT”) aimed at preventing the erosion of the U.S. tax base. The Company continues to review GILTI and BEAT provisions and expects further guidance on the application of these provisions. The Company has not yet adopted an accounting policy as to whether the Company will treat taxes on GILTI as period costs or whether the Company will recognize deferred tax assets and liabilities when basis differences exist that are expected to affect the amount of GILTI inclusion upon reversal.
During 2018, the Company will gather outstanding information, further analyze its computations, and incorporate any guidance issued by U.S. federal, U.S. state or non-U.S. regulatory authorities related to the TCJA. The Company will record any changes to its provisional estimate in the quarter in which it completes its analysis, but no later than the quarter ending December 31, 2018.
Provision for Income Taxes
The Company’s income before taxes is as follows:
(in millions) For year ended December 31, | 2017 | 2016 | 2015 | |||||||||
U.S. operations | $ | 270.1 | $ | 63.5 | $ | 261.9 | ||||||
Non-U.S. operations | 97.4 | 100.6 | 74.6 | |||||||||
Total | $ | 367.5 | $ | 164.1 | $ | 336.5 | ||||||
The Company’s provision (benefit) for income taxes consists of:
(in millions) For the year ended December 31, | 2017 | 2016 | 2015 | |||||||||
Current: | ||||||||||||
U.S. federal tax | $ | 58.4 | $ | 38.7 | $ | 43.0 | ||||||
U.S. state and local tax | 5.0 | 5.1 | 5.4 | |||||||||
Non-U.S. tax | 29.3 | 21.6 | 18.4 | |||||||||
Total current | 92.7 | 65.4 | 66.8 | |||||||||
Deferred: | ||||||||||||
U.S. federal tax | 99.2 | (28.0 | ) | 36.5 | ||||||||
U.S. state and local tax | 0.1 | 1.5 | (0.4 | ) | ||||||||
Non-U.S. tax | 3.0 | 1.4 | 3.6 | |||||||||
Total deferred | 102.3 | (25.1 | ) | 39.7 | ||||||||
Total provision for income taxes | $ | 195.0 | $ | 40.3 | $ | 106.5 | ||||||
Page 57
NOTES TO CONSOLIDATED FINANCIAL STATEMENTS
A reconciliation of the statutory U.S. federal tax rate to the Company’s effective tax rate is as follows:
(in millions) For the year ended December 31, | 2017 | 2016 | 2015 | ||||||
Statutory U.S. federal tax rate | 35.0 | % | 35.0 | % | 35.0 | % | |||
Increase (reduction) from: | |||||||||
Income taxed at non-U.S. rates | (0.5 | )% | (7.4 | )% | (2.0 | )% | |||
Non-U.S. income inclusion, net of tax credits | (1.6 | )% | (1.0 | )% | — | % | |||
State and local taxes, net of federal benefit | 1.0 | % | 3.1 | % | 1.3 | % | |||
U.S. research and development tax credit | (1.0 | )% | (3.2 | )% | (0.9 | )% | |||
U.S. domestic manufacturing deduction | (1.6 | )% | (3.2 | )% | (1.3 | )% | |||
Enactment of Tax Cuts and Jobs Act | 23.8 | % | — | % | — | % | |||
Other | (2.0 | )% | 1.3 | % | (0.4 | )% | |||
Effective tax rate | 53.1 | % | 24.6 | % | 31.7 | % | |||
At December 31, 2016, the Company had not provided deferred taxes of $725 million of non-U.S. subsidiaries' undistributed earnings because the Company intended to permanently reinvest these earnings. Due to the 100% tax exemption on certain foreign dividends provided by the TCJA, the Company has provisionally determined that it no longer plans to permanently reinvest its non-U.S. subsidiaries' earnings. Accordingly, the Company recorded a charge of $3.8 million to reflect this change. In order to finalize this provisional deferred tax liability during 2018, the Company will (1) complete its analysis of the effects of the TCJA on the tax bases of its non-U.S. subsidiaries, (2) complete its computations related to non-U.S. withholding, corporate income, and distribution taxes, and (3) analyze expected responses by U.S. states to the TCJA.
During the fourth quarter of 2016, the Company adopted the FASB's amended guidance related to employee share-based payment accounting. The primary impact of adoption was the recognition of excess tax benefits in the Company's provision for income taxes rather than capital surplus. The Company had excess tax benefits from share-based compensation of $4.3 million, $0.4 million and $1.6 million in 2017, 2016 and 2015, respectively, which were reflected as reductions in the Company's provision for income taxes in 2017 and 2016, and an increase to the Company's capital surplus in 2015.
During 2017, 2016 and 2015, tax provision (benefit) of $3.5 million, $(8.4) million, and $4.6 million, respectively, related to changes in pension and post-retirement plan assets and benefit obligations, were recorded to accumulated other comprehensive loss.
Page 58
NOTES TO CONSOLIDATED FINANCIAL STATEMENTS
Deferred Taxes and Valuation Allowances
The components of deferred tax assets and liabilities included on the Company’s Consolidated Balance Sheets are as follows:
(in millions) December 31, | 2017 | 2016 | ||||||
Deferred tax assets: | ||||||||
Asbestos-related liabilities | $ | 127.0 | $ | 215.4 | ||||
Tax loss and credit carryforwards | 104.2 | 101.3 | ||||||
Pension and post-retirement benefits | 41.6 | 74.3 | ||||||
Inventories | 18.3 | 25.0 | ||||||
Accrued bonus and stock-based compensation | 11.5 | 16.9 | ||||||
Environmental reserves | 8.0 | 12.3 | ||||||
Restructuring reserves | 6.4 | 3.0 | ||||||
Warranty | 4.9 | 8.0 | ||||||
Compensated Absences | 4.8 | 7.4 | ||||||
Other | — | 18.3 | ||||||
Total | $ | 326.7 | $ | 481.9 | ||||
Less: valuation allowance | 123.0 | 148.2 | ||||||
Total deferred tax assets, net of valuation allowance | $ | 203.7 | $ | 333.7 | ||||
Deferred tax liabilities: | ||||||||
Basis difference in fixed assets | $ | (6.0 | ) | $ | (17.6 | ) | ||
Basis difference in intangible assets | (116.9 | ) | (147.2 | ) | ||||
Other | (21.5 | ) | — | |||||
Total deferred tax liabilities | $ | (144.4 | ) | $ | (164.8 | ) | ||
Net deferred tax asset | $ | 59.3 | $ | 168.9 | ||||
Balance sheet classification: | ||||||||
Current deferred tax assets | $ | — | $ | 29.6 | ||||
Long-term deferred tax assets | 104.2 | 181.8 | ||||||
Accrued liabilities | — | (0.1 | ) | |||||
Long-term deferred tax liability | (44.9 | ) | (42.4 | ) | ||||
Net deferred tax asset | $ | 59.3 | $ | 168.9 | ||||
As of December 31, 2017, the Company had U.S. federal, U.S. state and non-U.S. tax loss and credit carryforwards that will expire, if unused, as follows:
(in millions) Year of expiration | U.S. Federal Tax Credits | U.S. Federal Tax Losses | U.S. State Tax Credits | U.S. State Tax Losses | Non- U.S. Tax Losses | Total | ||||||||||||||||||
2018-2022 | $ | — | $ | — | $ | 3.6 | $ | 43.3 | $ | 48.8 | ||||||||||||||
After 2022 | 2.2 | 1.0 | 1.8 | 808.3 | 4.5 | |||||||||||||||||||
Indefinite | — | — | 20.6 | — | 132.0 | |||||||||||||||||||
Total tax carryforwards | $ | 2.2 | $ | 1.0 | $ | 26.0 | $ | 851.6 | $ | 185.3 | ||||||||||||||
Deferred tax asset on tax carryforwards | $ | 2.2 | $ | 0.2 | $ | 20.5 | $ | 45.3 | $ | 36.0 | $ | 104.2 | ||||||||||||
Valuation allowance on tax carryforwards | (1.8 | ) | (0.2 | ) | (19.9 | ) | (44.6 | ) | (33.2 | ) | (99.7 | ) | ||||||||||||
Net deferred tax asset on tax carryforwards | $ | 0.4 | $ | — | $ | 0.6 | $ | 0.7 | $ | 2.8 | $ | 4.5 | ||||||||||||
As of December 31, 2017 and 2016, the Company determined that it was more likely than not that $99.7 million and $96.5 million, respectively, of its deferred tax assets related to tax loss and credit carryforwards will not be realized. As a result, the Company recorded a valuation allowance against these deferred tax assets. The Company also determined that it is more likely than not that a portion of the benefit related to U.S. state and non-U.S. deferred tax assets other than tax loss and credit carryforwards will be not realized. Accordingly, as of December 31, 2017 and 2016, a valuation allowance of $23.3 million and $51.7 million, respectively, was established against these U.S. state and non-U.S. deferred tax assets. The Company’s total valuation allowance as of December 31, 2017 and 2016 was $123.0 million and $148.2 million, respectively.
Page 59
NOTES TO CONSOLIDATED FINANCIAL STATEMENTS
Unrecognized Tax Benefits
A reconciliation of the beginning and ending amount of the Company’s gross unrecognized tax benefits, excluding interest and penalties, is as follows:
(in millions) | 2017 | 2016 | 2015 | |||||||||
Balance of liability as of January 1 | $ | 46.5 | $ | 45.2 | $ | 40.7 | ||||||
Increase as a result of tax positions taken during a prior year | 2.5 | 0.5 | 1.5 | |||||||||
Decrease as a result of tax positions taken during a prior year | (1.5 | ) | (7.3 | ) | (2.1 | ) | ||||||
Increase as a result of tax positions taken during the current year | 5.2 | 10.3 | 9.2 | |||||||||
Decrease as a result of settlements with taxing authorities | (0.3 | ) | (1.2 | ) | — | |||||||
Reduction as a result of a lapse of the statute of limitations | (6.0 | ) | (1.0 | ) | (4.1 | ) | ||||||
Balance of liability as of December 31 | $ | 46.4 | $ | 46.5 | $ | 45.2 | ||||||
As of December 31, 2017, 2016 and 2015, the amount of the Company’s unrecognized tax benefits that, if recognized, would affect its effective tax rate was $49.2 million, $47.6 million, and $46.6 million, respectively. The difference between these amounts and those reflected in the table above relates to (1) offsetting tax effects from other tax jurisdictions, and (2) interest expense, net of deferred taxes.
The Company recognizes interest and penalties related to unrecognized tax benefits as a component of its income tax expense. During the years ended December 31, 2017, 2016 and 2015, the Company recognized interest and penalty expense of $0.3 million, $0.4 million, and $1.1 million, respectively, in its Consolidated Statements of Operations. As of December 31, 2017 and 2016, the Company had accrued $6.5 million and $6.2 million, respectively, of interest and penalties related to unrecognized tax benefits in its Consolidated Balance Sheets.
During the next twelve months, it is reasonably possible that the Company's unrecognized tax benefits could change by $11.4 million due to settlements of income tax examinations, the expiration of statutes of limitations or other resolution of uncertainties. However, if the ultimate resolution of income tax examinations results in amounts that differ from this estimate, the Company will record additional income tax expense or benefit in the period in which such matters are effectively settled.
Income Tax Examinations
The Company's income tax returns are subject to examination by the U.S. federal, U.S. state and local, and non-U.S. tax authorities.
The Company’s consolidated federal income tax returns for the years 2014 through 2016 remain subject to examination by the Internal Revenue Service (“IRS”). In addition, acquired subsidiaries’ federal tax carryforwards (2007 through 2012) remain subject to IRS examination.
With few exceptions, the Company is no longer subject to U.S. state and local or non-U.S. income tax examinations for years before 2011. Currently the Company and its subsidiaries are under examination in various jurisdictions, including Germany (2010 through 2012), Canada (2013 through 2015) and California (2012 and 2013).
Note 4 – Accrued Liabilities
Accrued liabilities consist of:
(in millions) December 31, | 2017 | 2016 | |||||
Employee related expenses | $ | 99.1 | $ | 95.4 | |||
Warranty | 14.6 | 15.5 | |||||
Advanced payment from customers | 27.0 | 19.0 | |||||
Other | 111.4 | 93.2 | |||||
Total | $ | 252.1 | $ | 223.1 | |||
The Company accrues warranty liabilities when it is probable that a liability has been incurred and the amount of the loss can be reasonably estimated. Warranty provision is included in cost of sales in the Consolidated Statements of Operations.
Page 60
NOTES TO CONSOLIDATED FINANCIAL STATEMENTS
A summary of the warranty liabilities is as follows:
(in millions) December 31, | 2017 | 2016 | |||||
Balance at beginning of period | $ | 15.5 | $ | 15.1 | |||
Expense | 13.4 | 14.5 | |||||
Changes due to acquisitions/divestitures | 0.1 | — | |||||
Payments / deductions | (14.7 | ) | (13.4 | ) | |||
Currency translation | 0.3 | (0.7 | ) | ||||
Balance at end of period | $ | 14.6 | $ | 15.5 | |||
Note 5 – Other Liabilities
(in millions) December 31, | 2017 | 2016 | ||||||
Environmental | $ | 31.9 | $ | 34.0 | ||||
Other | 75.8 | 65.8 | ||||||
$ | 107.7 | $ | 99.8 | |||||
Note 6 – Research and Development
Research and development costs are expensed when incurred. These costs were $58.5 million, $61.5 million and $62.8 million in 2017, 2016 and 2015, respectively.
Note 7 – Pension and Postretirement Benefits
In the United States, the Company sponsors a defined benefit pension plan that covers approximately 17% of all U.S. employees. In the fourth quarter of 2012, the Company announced that pension eligible employees will no longer earn future benefits in the domestic defined benefit pension plan effective January 1, 2013. The benefits are based on years of service and compensation on a final average pay basis, except for certain hourly employees where benefits are fixed per year of service. This plan is funded with a trustee in respect of past and current service. Charges to expense are based upon costs computed by an independent actuary. Contributions are intended to provide for future benefits earned to date. Additionally, a number of the Company’s non-U.S. subsidiaries sponsor defined benefit pension plans that cover approximately 12% of all non-U.S. employees. The benefits are typically based upon years of service and compensation. These plans are funded with trustees in respect of past and current service.
Non-union employees hired after December 31, 2005 are no longer eligible for participation in the ELDEC Corporation (“ELDEC”) and Interpoint Corporation (“Interpoint”) money purchase plan. Qualifying employees receive an additional 3% Company contribution to their 401(k) plan accounts. Certain of the Company’s non-U.S. defined benefit pension plans were also amended whereby eligibility for new participants will cease.
Postretirement health care and life insurance benefits are provided for certain employees hired before January 1, 1990, who meet minimum age and service requirements. The Company does not pre-fund these benefits and has the right to modify or terminate the plan. The Company recorded a pre-tax gain related to postretirement benefits of $0.2 million in both 2017 and 2016. Accrued postretirement benefits were $7.8 million and $8.1 million as of December 31, 2017 and 2016, respectively.
Page 61
A summary of the projected benefit obligations, fair value of plan assets and funded status is as follows:
(in millions) December 31, | 2017 | 2016 | ||||||
Change in benefit obligation: | ||||||||
Benefit obligation at beginning of year | $ | 1,004.0 | $ | 988.0 | ||||
Service cost | 5.4 | 4.7 | ||||||
Interest cost | 29.5 | 31.8 | ||||||
Plan participants’ contributions | 0.5 | 0.5 | ||||||
Amendments | — | 0.4 | ||||||
Actuarial loss | 31.6 | 88.4 | ||||||
Settlement | (2.3 | ) | (1.7 | ) | ||||
Benefits paid | (40.8 | ) | (42.4 | ) | ||||
Foreign currency exchange impact | 41.8 | (65.1 | ) | |||||
Acquisitions/curtailments | 5.4 | — | ||||||
Adjustment for expenses/tax contained in service cost | (0.4 | ) | (0.6 | ) | ||||
Benefit obligation at end of year | $ | 1,074.7 | $ | 1,004.0 | ||||
Change in plan assets: | ||||||||
Fair value of plan assets at beginning of year | $ | 808.5 | $ | 816.5 | ||||
Actual return on plan assets | 87.4 | 87.4 | ||||||
Foreign currency exchange impact | 37.8 | (59.1 | ) | |||||
Employer contributions | 12.7 | 8.3 | ||||||
Administrative expenses paid | (0.7 | ) | (1.0 | ) | ||||
Acquisitions | 5.0 | — | ||||||
Plan participants’ contributions | 0.5 | 0.5 | ||||||
Settlement | (2.3 | ) | (1.7 | ) | ||||
Benefits paid | (40.8 | ) | (42.4 | ) | ||||
Fair value of plan assets at end of year | $ | 908.1 | $ | 808.5 | ||||
Funded status | $ | (166.6 | ) | $ | (195.5 | ) | ||
Amounts recognized in the Consolidated Balance Sheets consist of:
(in millions) December 31, | 2017 | 2016 | ||||||
Other assets | $ | 66.1 | $ | 46.0 | ||||
Current liabilities | (1.3 | ) | (1.2 | ) | ||||
Accrued pension and postretirement benefits | (231.4 | ) | (240.3 | ) | ||||
Funded status | $ | (166.6 | ) | $ | (195.5 | ) | ||
Amounts recognized in accumulated other comprehensive loss consist of:
(in millions) December 31, | 2017 | 2016 | ||||||
Net actuarial loss | $ | 372.3 | $ | 373.2 | ||||
Prior service credit | (10.0 | ) | (10.1 | ) | ||||
Total recognized in accumulated other comprehensive loss | $ | 362.3 | $ | 363.1 | ||||
The projected benefit obligation, accumulated benefit obligation and fair value of plan assets for the U.S. and Non-U.S. plans, are as follows:
Pension Obligations/Assets | ||||||||||||||||||||||||
U.S. | Non-U.S. | Total | ||||||||||||||||||||||
(in millions) December 31, | 2017 | 2016 | 2017 | 2016 | 2017 | 2016 | ||||||||||||||||||
Projected benefit obligation | $ | 579.8 | $ | 545.8 | $ | 494.9 | $ | 458.2 | $ | 1,074.7 | $ | 1,004.0 | ||||||||||||
Accumulated benefit obligation | 579.8 | 545.8 | 486.7 | 450.9 | 1,066.5 | 996.7 | ||||||||||||||||||
Fair value of plan assets | 407.9 | 379.8 | 500.2 | 428.7 | 908.1 | 808.5 | ||||||||||||||||||
Page 62
Information for pension plans with an accumulated benefit obligation in excess of plan assets is as follows:
(in millions) December 31, | 2017 | 2016 | ||||||
Projected benefit obligation | $ | 860.0 | $ | 834.8 | ||||
Accumulated benefit obligation | 852.2 | 827.8 | ||||||
Fair value of plan assets | 627.3 | 593.3 | ||||||
Components of net periodic benefit are as follows:
(in millions) For the year ended December 31, | 2017 | 2016 | 2015 | |||||||||
Net Periodic (Benefit) Cost: | ||||||||||||
Service cost | $ | 5.4 | $ | 4.7 | $ | 5.2 | ||||||
Interest cost | 29.5 | 31.8 | 37.9 | |||||||||
Expected return on plan assets | (57.0 | ) | (56.1 | ) | (62.0 | ) | ||||||
Amortization of prior service cost | (0.6 | ) | (0.6 | ) | (0.4 | ) | ||||||
Amortization of net loss | 14.3 | 11.3 | 12.3 | |||||||||
Recognized curtailment loss | (0.3 | ) | — | (5.2 | ) | |||||||
Settlement costs | 0.5 | — | 0.8 | |||||||||
Net periodic benefit | $ | (8.2 | ) | $ | (8.9 | ) | $ | (11.4 | ) | |||
The estimated net loss and prior service benefit for the defined benefit pension plans that will be amortized from accumulated other comprehensive income into net periodic benefit over the next fiscal year are $14.2 million and $0.6 million, respectively.
The weighted average assumptions used to determine benefit obligations are as follows:
For the year ended December 31, | 2017 | 2016 | 2015 | ||||||
U.S. Plans: | |||||||||
Discount rate | 3.75 | % | 4.29 | % | 4.41 | % | |||
Rate of compensation increase | N/A | N/A | N/A | ||||||
Non-U.S. Plans: | |||||||||
Discount rate | 2.15 | % | 2.29 | % | 3.30 | % | |||
Rate of compensation increase | 2.80 | % | 2.85 | % | 2.81 | % | |||
The weighted-average assumptions used to determine net periodic benefit are as follows:
For the year ended December 31, | 2017 | 2016 | 2015 | ||||||
U.S. Plans: | |||||||||
Discount rate | 4.29 | % | 4.41 | % | 4.10 | % | |||
Expected rate of return on plan assets | 7.75 | % | 7.75 | % | 7.75 | % | |||
Rate of compensation increase | N/A | N/A | N/A | ||||||
Non-U.S. Plans: | |||||||||
Discount rate | 2.29 | % | 3.30 | % | 3.01 | % | |||
Expected rate of return on plan assets | 6.45 | % | 6.77 | % | 6.94 | % | |||
Rate of compensation increase | 2.85 | % | 2.81 | % | 2.40 | % | |||
The long-term expected rate of return on plan assets assumptions were determined by the Company with input from independent investment consultants and plan actuaries, utilizing asset pricing models and considering historical returns. The discount rates used by the Company for valuing pension liabilities are based on a review of high quality corporate bond yields with maturities approximating the remaining life of the projected benefit obligations.
In the U.S. Plan, the 7.75% expected rate of return on assets assumption for 2017 reflected a long-term target comprised of an asset allocation range of 25%-75% equity securities, 15%-35% fixed income securities, 10%-35% alternative assets and 0%-10% cash. As of December 31, 2017, the actual asset allocation for the U.S. plan was 61% equity securities, 15% fixed income securities, 22% alternative assets and 2% cash and cash equivalents.
For the non-U.S. Plans, the 6.45% expected rate of return on assets assumption for 2017 reflected a weighted average of the long-term asset allocation targets for the Company's various international plans. As of December 31, 2017, the actual weighted
Page 63
average asset allocation for the non-U.S. plans was 35% equity securities, 30% fixed income securities, 34% alternative assets/other and 1% cash and cash equivalents.
Plan Assets
The Company’s pension plan target allocations and weighted-average asset allocations by asset category are as follows:
Target Allocation | Actual Allocation | |||||||
Asset Category December 31, | 2017 | 2016 | ||||||
Equity securities | 35%-75% | 47 | % | 47 | % | |||
Fixed income securities | 20%-50% | 23 | % | 23 | % | |||
Alternative assets/Other | 0%-35% | 29 | % | 28 | % | |||
Money market | 0%-10% | 1 | % | 2 | % | |||
The Company’s pension investment committee and trustees, as applicable, exercise reasonable care, skill and caution in making investment decisions. Independent investment consultants are retained to assist in executing the plans’ investment strategies. A number of factors are evaluated in determining if an investment strategy will be implemented in the Company’s pension trusts. These factors include, but are not limited to, investment style, investment risk, investment manager performance and costs.
The primary investment objective of the Company’s various pension trusts is to maximize the value of plan assets, focusing on capital preservation, current income and long-term growth of capital and income. The plans’ assets are typically invested in a broad range of equity securities, fixed income securities, alternative assets and cash instruments. The Company’s investment strategies across its pension plans worldwide results in a global target asset allocation range of 35%-75% equity securities, 20%-50% fixed income securities, 0%-35% alternative assets and 0%-10% money market, as noted in the table above.
Equity securities include investments in large-cap, mid-cap, and small-cap companies located in both developed countries and emerging markets around the world. Fixed income securities include government bonds of various countries, corporate bonds that are primarily investment-grade, and mortgage-backed securities. Alternative assets include investments in real estate and hedge funds employing a wide variety of strategies.
The Company periodically reviews investment managers and their performance in relation to the plans’ investment objectives. The Company expects its pension trust investments to meet or exceed their predetermined benchmark indices, net of fees. Generally, however, the Company realizes that investment strategies should be given a full market cycle, normally over a three to five year time period, to achieve stated objectives.
Equity securities include Crane Co. common stock, which represents 6% and 5% of plan assets as of December 31, 2017 and 2016, respectively.
Page 64
The fair value of the Company’s pension plan assets as of December 31, 2017, by asset category are as follows:
(in millions) | Active Markets for Identical Assets Level 1 | Other Observable Inputs Level 2 | Unobservable Inputs Level 3 | NAV Practical Expedient* | Total Fair Value | |||||||||||||||
Cash and Money Markets | $ | 13.2 | $ | — | $ | — | $ | — | $ | 13.2 | ||||||||||
Common Stocks | ||||||||||||||||||||
Actively Managed U.S. Equities | 134.4 | — | — | — | 134.4 | |||||||||||||||
Fixed Income Bonds and Notes | — | 0.3 | — | — | 0.3 | |||||||||||||||
Commingled and Mutual Funds | ||||||||||||||||||||
U.S. Equity Funds | — | — | — | 39.1 | 39.1 | |||||||||||||||
Non-U.S. Equity Funds | — | — | — | 249.6 | 249.6 | |||||||||||||||
U.S. Fixed Income, Government and Corporate | — | — | — | 59.6 | 59.6 | |||||||||||||||
Non-U.S. Fixed Income, Government and Corporate | — | — | — | 190.7 | 190.7 | |||||||||||||||
International Balanced Funds | — | — | — | 11.8 | 11.8 | |||||||||||||||
Collective Trust | — | — | 21.8 | 19.4 | 41.2 | |||||||||||||||
Alternative Investments | ||||||||||||||||||||
Hedge Funds | — | — | — | 116.2 | 116.2 | |||||||||||||||
International Property Funds | — | — | — | 47.1 | 47.1 | |||||||||||||||
Annuity Contract | — | 4.9 | — | — | 4.9 | |||||||||||||||
Total Fair Value | $ | 147.6 | $ | 5.2 | $ | 21.8 | $ | 733.5 | $ | 908.1 | ||||||||||
* Investments are measured at fair value using the net asset value per share practical expedient, and therefore, are not classified in the fair value hierarchy.
In 2017, the Pension Plan's asset classified as Level 3 constitutes an insurance contract valued annually on an actuarial basis.
The fair value of the Company’s pension plan assets as of December 31, 2016, by asset category are as follows:
(in millions) | Active Markets for Identical Assets Level 1 | Other Observable Inputs Level 2 | Unobservable Inputs Level 3 | NAV Practical Expedient* | Total Fair Value | |||||||||||||||
Cash and Money Markets | $ | 16.1 | $ | — | $ | — | $ | — | $ | 16.1 | ||||||||||
Common Stocks | ||||||||||||||||||||
Actively Managed U.S. Equities | 112.0 | — | — | — | 112.0 | |||||||||||||||
Fixed Income Bonds and Notes | — | 44.3 | — | — | 44.3 | |||||||||||||||
Commingled and Mutual Funds | ||||||||||||||||||||
U.S. Equity Funds | — | — | — | 62.3 | 62.3 | |||||||||||||||
Non-U.S. Equity Funds | — | — | — | 201.9 | 201.9 | |||||||||||||||
U.S. Fixed Income, Government and Corporate | — | — | — | 12.4 | 12.4 | |||||||||||||||
Non-U.S. Fixed Income, Government and Corporate | — | — | — | 165.3 | 165.3 | |||||||||||||||
International Balanced Funds | — | — | — | 10.1 | 10.1 | |||||||||||||||
Collective Trust | — | — | 21.7 | 17.4 | 39.1 | |||||||||||||||
Alternative Investments | ||||||||||||||||||||
Hedge Funds | — | — | — | 106.4 | 106.4 | |||||||||||||||
International Property Funds | — | — | — | 37.6 | 37.6 | |||||||||||||||
Annuity Contract | — | 1.0 | — | — | 1.0 | |||||||||||||||
Total Fair Value | $ | 128.1 | $ | 45.3 | $ | 21.7 | $ | 613.4 | $ | 808.5 | ||||||||||
* Investments are measured at fair value using the net asset value per share practical expedient, and therefore, are not classified in the fair value hierarchy.
In 2016, the Pension Plan's asset classified as Level 3 constitutes an insurance contract valued annually on an actuarial basis.
Page 65
The following table sets forth a summary of pension plan assets valued using Net Asset Value ("NAV") or its equivalent as of December 31, 2017:
Redemption Frequency | Unfunded Commitment | Other Redemption Restrictions | Redemption Notice Period | |||||
U.S. Equity Funds (a) | Immediate | None | None | None | ||||
Non-U.S. Equity Funds (b) | Immediate | None | None | None | ||||
U.S. Fixed Income, Government and Corporate (c) | Immediate | None | None | None | ||||
Non-U.S. Fixed Income, Government and Corporate (d) | Immediate | None | None | None | ||||
International Balanced Funds (e) | Immediate | None | None | None | ||||
Collective Trust Fund (f) | Immediate | None | None | None | ||||
Hedge Funds (g) | Quarterly | None | None | 65 days written | ||||
Hedge Funds (g) | Quarterly | None | None | 30 days written | ||||
Hedge Funds (g) | Immediate | None | None | None | ||||
International Property Funds (h) | Immediate | None | None | None | ||||
Non-US Tactical/Diversified Alternative Funds (i) | Immediate | None | None | None | ||||
(a) | These funds invest in Corporate equity securities within the U.S. markets and seek to meet or exceed relative benchmarks |
(b) | These funds invest in Corporate equity securities outside the U.S. and seek to meet or exceed relative benchmarks |
(c) | These funds invest in U.S. fixed income securities, corporate, government and agency, and seek to outperform the Barclays Capital Aggregate Index |
(d) | These funds invest in Corporate and Governments fixed income securities outside the U.S. and seek to meet or exceed relative benchmarks |
(e) | These funds invest in a blend of equities, fixed income, cash and property outside the U.S. and seek to outperform a similarly weighted index |
(f) | This fund invests in a combination of U.S. and non-U.S. stocks and bonds and is managed by a third party to track liability |
(g) | These funds are direct investment alternative investments/hedge funds that deploy a multi-strategy approach to investing (e.g. long/short/event-driven, credit) |
(h) | These funds invest in real property outside the U.S. |
(i) | These funds invest in traditional and alternative strategies and seek to add diversification while adding returns greater than equity in a non-correlated approach |
The following table sets forth a summary of pension plan assets valued using Net Asset Value ("NAV") or its equivalent as of December 31, 2016:
Redemption Frequency | Unfunded Commitment | Other Redemption Restrictions | Redemption Notice Period | |||||
U.S. Equity Funds (a) | Immediate | None | None | None | ||||
Non-U.S. Equity Funds (b) | Immediate | None | None | None | ||||
U.S. Fixed Income, Government and Corporate (c) | Immediate | None | None | None | ||||
Non-U.S. Fixed Income, Gov't and Corp. (d) | Immediate | None | None | None | ||||
International Balanced Funds (e) | Immediate | None | None | None | ||||
Collective Trust Fund (f) | Immediate | None | None | None | ||||
Hedge Funds (g) | 12 Months | None | None | 65 days written | ||||
Hedge Funds (h) | Quarterly | None | None | 65 days written | ||||
Hedge Funds (h) | Quarterly | None | None | 30 days written | ||||
Hedge Funds (h) | Immediate | None | None | None | ||||
International Property Funds (i) | Immediate | None | None | None | ||||
Non-US Tactical/Diversified Alternative Funds (j) | Immediate | None | None | None | ||||
(a) | These funds invest in Corporate equity securities within the U.S. markets and seek to meet or exceed relative benchmarks |
(b) | These funds invest in Corporate equity securities outside the U.S. and seek to meet or exceed relative benchmarks |
(c) | These funds invest in U.S. fixed income securities, corporate, government and agency, and seek to outperform the Barclays Capital Aggregate Index |
(d) | These funds invest in Corporate and Governments fixed income securities outside the U.S. and seek to meet or exceed relative benchmarks |
(e) | These funds invest in a blend of equities, fixed income, cash and property outside the U.S. and seek to outperform a similarly weighted index |
(f) | This fund invests in a combination of U.S. and non-U.S. stocks and bonds and is managed by a third party to track liability |
(g) | This fund is alternative asset in process of liquidation. Amounts included represent funds hold back expected to be distributed in early 2017 |
(h) | These funds are direct investment alternative investments/hedge funds that deploy a multi-strategy approach to investing (e.g. long/short/event-driven, credit) |
(i) | These funds invest in real property outside the U.S. |
(j) | These funds invest in traditional and alternative strategies and seek to add diversification while adding returns greater than equity in a non-correlated approach |
Page 66
Cash Flows
The Company expects, based on current actuarial calculations, to contribute cash of approximately $25 million to its defined benefit pension plans during 2018. Cash contributions in subsequent years will depend on a number of factors including the investment performance of plan assets.
Estimated Future Benefit Payments
The following benefit payments, which reflect expected future service, as appropriate, are expected to be paid:
Estimated future payments (in millions) | Pension Benefits | ||
2018 | $ | 42.7 | |
2019 | 43.1 | ||
2020 | 45.1 | ||
2021 | 46.7 | ||
2022 | 49.1 | ||
2023-2027 | 266.4 | ||
Total payments | $ | 493.1 | |
The Company and its subsidiaries sponsor savings and investment plans that are available to eligible employees of the Company and its subsidiaries. The Company made contributions to the plans of $8.5 million, $8.0 million and $7.9 million in 2017, 2016 and 2015, respectively.
In addition to participant deferral contributions and company matching contributions on those deferrals, the Company provides a 3% non-matching contribution to eligible participants. The Company made non-matching contributions to these plans of $11.0 million, $10.7 million and $8.7 million in 2017, 2016 and 2015, respectively.
Page 67
NOTES TO CONSOLIDATED FINANCIAL STATEMENTS
Note 8 – Long-Term Debt
The following table summarizes the Company’s debt as of December 31, 2017 and 2016:
(in millions) December 31, | 2017 | 2016 | |||||
Current maturities of long-term debt consists of: | |||||||
2.75% notes due December 2018 | |||||||
Principal amount | $ | 250.0 | $ | — | |||
Other deferred financing costs associated with credit facilities | (0.6 | ) | — | ||||
Total current maturities of long-term debt | $ | 249.4 | $ | — | |||
Long-term debt consists of: | |||||||
2.75% notes due December 2018 | |||||||
Principal amount | — | $ | 250.0 | ||||
Less debt issuance costs | — | (0.8 | ) | ||||
Carrying Value | — | $ | 249.2 | ||||
4.45% notes due December 2023 | |||||||
Principal amount | $ | 300.0 | $ | 300.0 | |||
Less debt issuance costs | (1.6 | ) | (1.9 | ) | |||
Carrying Value | $ | 298.4 | $ | 298.1 | |||
6.55% notes due November 2036 | |||||||
Principal Amount | $ | 200.0 | $ | 200.0 | |||
Less unamortized discount | (0.6 | ) | (0.7 | ) | |||
Less debt issuance costs | (1.3 | ) | (1.3 | ) | |||
Carrying Value | $ | 198.1 | $ | 198.0 | |||
Other deferred financing costs associated with credit facilities | $ | (2.4 | ) | $ | — | ||
Total long-term debt | $ | 494.1 | $ | 745.3 | |||
2.75% notes due December 2018 - In December 2013, the Company issued five year notes having an aggregate principal amount of $250 million. The notes are unsecured, senior obligations that mature on December 15, 2018 and bear interest at 2.75% per annum, payable semi-annually on June 15 and December 15 of each year. The notes have no sinking fund requirement, but may be redeemed, in whole or part, at the Company's option. These notes do not contain any material debt covenants or cross default provisions. If there is a change in control of the Company, and if as a consequence, the notes are rated below investment grade by both Moody’s Investors Service and Standard & Poor’s, then holders of the notes may require the Company to repurchase them, in whole or in part, for 101% of the principal amount plus accrued and unpaid interest. Debt issuance costs are deferred and included in long-term debt and are amortized as a component of interest expense over the term of the notes. Including debt issuance cost amortization, these notes have an effective annualized interest rate of 2.92%. The Company issued a notice of redemption on February 7, 2018, with an effective date of March 7, 2018, for its 2.75% notes due in December 2018 with an outstanding principal value of $250 million. See Note 16, "Subsequent Events," in the Notes to Consolidated Financial Statements.
4.45% notes due December 2023 - In December 2013, the Company issued 10 year notes having an aggregate principal amount of $300 million. The notes are unsecured, senior obligations that mature on December 15, 2023 and bear interest at 4.45% per annum, payable semi-annually on June 15 and December 15 of each year. The notes have no sinking fund requirement, but may be redeemed, in whole or part, at the Company's option. These notes do not contain any material debt covenants or cross default provisions. If there is a change in control of the Company, and if as a consequence, the notes are rated below investment grade by both Moody’s Investors Service and Standard & Poor’s, then holders of the notes may require the Company to repurchase them, in whole or in part, for 101% of the principal amount plus accrued and unpaid interest. Debt issuance costs are deferred
Page 68
NOTES TO CONSOLIDATED FINANCIAL STATEMENTS
and included in long-term debt and are amortized as a component of interest expense over the term of the notes. Including debt issuance cost amortization, these notes have an effective annualized interest rate of 4.56%.
6.55% notes due November 2036 - In November 2006, the Company issued 30 year notes having an aggregate principal amount of $200 million. The notes are unsecured, senior obligations of the Company that mature on November 15, 2036 and bear interest at 6.55% per annum, payable semi-annually on May 15 and November 15 of each year. The notes have no sinking fund requirement, but may be redeemed, in whole or in part, at the option of the Company. These notes do not contain any material debt covenants or cross default provisions. If there is a change in control of the Company, and if as a consequence, the notes are rated below investment grade by both Moody’s Investors Service and Standard & Poor’s, then holders of the notes may require the Company to repurchase them, in whole or in part, for 101% of the principal amount plus accrued and unpaid interest. Debt issuance costs are deferred and included in long-term debt and are amortized as a component of interest expense over the term of the notes. Including debt issuance cost amortization, these notes have an effective annualized interest rate of 6.67%.
All outstanding senior, unsecured notes were issued under an indenture dated as of April 1, 1991. The indenture contains certain limitations on liens and sale and lease-back transactions.
Commercial paper program - On March 2, 2015, the Company entered into a commercial paper program (the “CP Program”) pursuant to which it may issue short-term, unsecured commercial paper notes (the “Notes”) pursuant to the exemption from registration contained in Section 4(a)(2) of the Securities Act of 1933, as amended. Amounts available under the CP Program may be borrowed, repaid and re-borrowed from time to time, with the aggregate principal amount of the Notes outstanding under the CP Program at any time not to exceed $500 million. The Notes will have maturities of up to 397 days from date of issue. The Notes will rank at least pari passu with all of the Company's other unsecured and unsubordinated indebtedness. As of December 31, 2017, there were no outstanding borrowings. In January 2018, the Company issued $340 million under the CP Program to fund the acquisition of Crane Currency.
Revolving Credit Facility - In May 2012, the Company entered into a five year, $300 million Amended and Restated Credit Agreement (as subsequently amended in March 2013 and increased to $500 million (the “Facility”)). The Facility allows the Company to borrow, repay, or to the extent permitted by the agreement, prepay and re-borrow funds at any time prior to the stated maturity date. The loan proceeds may be used for general corporate purposes including financing for acquisitions. Interest is based on, at its option, (1) a LIBOR-based formula that is dependent in part on the Company's credit rating (LIBOR plus 105 basis points as of the date of this report; up to a maximum of LIBOR plus 147.5 basis points), or (2) the greatest of (i) the JPMorgan Chase Bank, N.A.'s prime rate, (ii) the Federal Funds rate plus 50 basis points, or (iii) an adjusted LIBOR plus 100 basis points, plus a spread dependent on the Company’s credit rating (5 basis points as of the date of this report; up to a maximum of 47.5 basis points). The Facility contains customary affirmative and negative covenants for credit facilities of this type, including a total debt to total capitalization ratio of less than or equal to 65%, the absence of a material adverse effect and limitations on the Company and its subsidiaries with respect to indebtedness, liens, mergers, consolidations, liquidations and dissolutions, sales of all or substantially all assets, transactions with affiliates and hedging arrangements. The Facility also provides for customary events of default, including failure to pay principal, interest or fees when due, failure to comply with covenants, the fact that any representation or warranty made by the Company is false in any material respect, default under certain other indebtedness, certain insolvency or receivership events affecting the Company and its subsidiaries, certain ERISA events, material judgments and a change in control of the Company.
In May 2015, the Company entered into an amendment ("Amendment No. 2") to the Facility. Amendment No. 2, among other things, (i) extends the maturity date under the Facility to May 2020 and (ii) amends the fee and applicable margins on the revolving loans made pursuant to the Facility.
In December 2017, the Company entered into a $550 million five year Revolving Credit Agreement (the “2017 Facility”), which replaces the existing $500 million revolving credit facility. The 2017 Facility allows the Company to borrow, repay, or to the extent permitted by the agreement, prepay and re-borrow funds at any time prior to the stated maturity date. The loan proceeds may be used for general corporate purposes including financing for acquisitions. Interest is based on, at the Company's option, (1) a base rate, plus a margin ranging from 0.0% to 0.50% depending upon the ratings by S&P and Moody’s of its senior unsecured long-term debt (the "Index Debt Rating"), or (2) an adjusted LIBOR for an interest period to be selected by the Company, plus a margin ranging from 0.805% to 1.50% depending upon the Index Debt Rating (such margin, the “Applicable LIBOR Margin”). The 2017 Facility contains customary affirmative and negative covenants for credit facilities of this type, including limitations on the Company and its subsidiaries with respect to indebtedness, liens, mergers, consolidations, liquidations and dissolutions, sales of all or substantially all assets, transactions with affiliates and hedging arrangements. The Company must also maintain a debt to capitalization ratio not to exceed 0.65 to 1.00 at all times. The 2017 Facility also provides for customary events of default, including failure to pay principal, interest or fees when due, failure to comply with covenants, any representation or warranty made by the Company or any of its material subsidiaries being false in any material respect, default under certain other material indebtedness, certain insolvency or receivership events affecting the Company and
Page 69
NOTES TO CONSOLIDATED FINANCIAL STATEMENTS
its material subsidiaries, certain ERISA events, material judgments and a change in control of the Company. There were no outstanding borrowings under the 2017 Facility as of December 31, 2017.
As of December 31, 2017, the Company's total debt to total capitalization ratio was 36%, computed as follows:
(in millions) December 31, | 2017 | ||
Current maturities of long-term debt | $ | 249.4 | |
Long-term debt | 494.1 | ||
Total indebtedness | 743.5 | ||
Total shareholders’ equity | 1,345.2 | ||
Capitalization | $ | 2,088.7 | |
Total indebtedness to capitalization | 36 | % | |
Other - As of December 31, 2017, the Company had open standby letters of credit of $21 million issued pursuant to a $47 million uncommitted Letter of Credit Reimbursement Agreement, and certain other credit lines.
364-day Credit Agreement and 3-Year Term Loan Credit Agreement - In December 2017, the Company also entered into (1) a new $150 million 364-day Credit Agreement (the “364-day Credit Agreement”), and (2) a new $200 million 3-Year Term Loan Credit Agreement (the “3-Year Term Loan Credit Agreement”). Borrowings are available under each of the 364-day Credit Agreement and the 3-Year Term Loan Credit Agreement once certain conditions precedent have been satisfied, including consummation of the Company's acquisition of Crane Currency. Interest on loans made under each of the 364-day Credit Agreement and the 3-Year Term Loan Credit Agreement accrues, at the Company’s option, at a rate per annum equal to (1) a base rate (determined in a customary manner), plus a margin ranging from 0.0% to 0.75% depending upon the Index Debt Rating or (2) an adjusted LIBOR (determined in a customary manner) for an interest period to be selected by the Company plus a margin ranging from 0.875% to 1.75% depending upon the Index Debt Rating. A commitment fee begins to accrue on March 5, 2018 (with respect to the 364-day Credit Agreement) and on January 19, 2018 (with respect to the 3-Year Term Loan Credit Agreement) on the daily unused portion of the commitments under each of the 364-day Credit Agreement and the 3-Year Term Loan Credit Agreement, respectively, at a rate per annum ranging from 0.07% to 0.25% depending on the Index Debt Rating. Each of the 364-day Credit Agreement and the 3-Year Term Loan Credit Agreement contain substantially the same affirmative and negative covenants, including the maximum debt to capitalization ratio, and events of default, as the 2017 Facility. There were no outstanding borrowings under the 364-day Credit Agreement and 3-Year Term Loan Credit Agreement as of December 31, 2017. In January 2018, the Company drew $100 million from the 364-day Credit Agreement and $200 million from the 3-Year Term Loan Credit Agreement to fund the acquisition of Crane Currency. In February 2018, the Company paid $100 million outstanding under the 364-day Credit Agreement loan after the completion of the Public Offering on February 5, 2018 referenced below.
4.20% notes due March 2048 - On February 5, 2018, the Company completed a public offering of $350 million aggregate principal amount of 4.20% Senior Notes due in 2048. See Note 16, “Subsequent Events,” in the Notes to Consolidated Financial Statements.
Note 9 - Fair Value Measurements
Accounting standards define fair value as the price that would be received to sell an asset or paid to transfer a liability in an orderly transaction between market participants at the measurement date. Fair value measurements are to be considered from the perspective of a market participant that holds the asset or owes the liability. The standards also establish a fair value hierarchy which requires an entity to maximize the use of observable inputs and minimize the use of unobservable inputs when measuring fair value.
The standards describe three levels of inputs that may be used to measure fair value:
Level 1: Quoted prices in active markets for identical or similar assets and liabilities.
Level 2: Quoted prices for identical or similar assets and liabilities in markets that are not active or observable inputs other than quoted prices in active markets for identical or similar assets and liabilities. Level 2 assets and liabilities include over-the-counter derivatives, principally forward foreign exchange contracts, whose value is determined using pricing models with inputs that are generally based on published foreign exchange rates and exchange traded prices, adjusted for other specific inputs that are primarily observable in the market or can be derived principally from or corroborated by observable market data.
Level 3: Unobservable inputs that are supported by little or no market activity and that are significant to the fair value of the assets or liabilities.
Page 70
NOTES TO CONSOLIDATED FINANCIAL STATEMENTS
Valuation Technique - The Company’s derivative assets and liabilities include foreign exchange contract derivatives that are measured at fair value using internal models based on observable market inputs such as forward rates and interest rates. Based on these inputs, the derivatives are classified within Level 2 of the valuation hierarchy. Such derivative receivable amounts are recorded within other current assets and were less than $0.1 million as of each of the periods ending December 31, 2017 and December 31, 2016. Such derivative liability amounts are recorded within accrued liabilities and were $0.0 million and $0.1 million as of December 31, 2017 and 2016, respectively.
The carrying value of the Company’s financial assets and liabilities, including cash and cash equivalents, accounts receivable, short-term debt and accounts payable approximate fair value, without being discounted, due to the short periods during which these amounts are outstanding. Long-term debt rates currently available to the Company for debt with similar terms and remaining maturities are used to estimate the fair value for debt issues that are not quoted on an exchange. The estimated fair value of long-term debt is measured using Level 2 inputs and was $816.0 million and $801.8 million as of December 31, 2017 and 2016, respectively.
Note 10 - Derivative Instruments and Hedging Activities
The Company is exposed to certain risks related to its ongoing business operations, including market risks related to fluctuation in currency exchange. The Company uses foreign exchange contracts to manage the risk of certain cross-currency business relationships to minimize the impact of currency exchange fluctuations on the Company’s earnings and cash flows. The Company does not hold or issue derivative financial instruments for trading or speculative purposes. As of December 31, 2017, the foreign exchange contracts designated as hedging instruments did not have a material impact on the Company’s consolidated statement of operations, balance sheet or cash flows. Foreign exchange contracts not designated as hedging instruments, which primarily pertain to foreign exchange fluctuation risk of intercompany positions, had a notional value of $0.8 million and $8 million as of December 31, 2017 and December 31, 2016, respectively. The settlement of derivative contracts for the years ended December 31, 2017, 2016 and 2015 resulted in net cash inflows (outflows) of $0.0 million, $0.0 million and $(13.6) million, respectively, and is reported within “Total provided by operating activities” on the Consolidated Statements of Cash Flows. As of each of the periods ending December 31, 2017 and December 31, 2016, the Company's receivable position for the foreign exchange contracts were less than $0.1 million. As of December 31, 2017 and 2016, the Company's payable position for the foreign exchange contracts was $0.0 million and $0.1 million, respectively.
Page 71
NOTES TO CONSOLIDATED FINANCIAL STATEMENTS
Note 11 - Commitments and Contingencies
Leases
The Company leases certain facilities, vehicles and equipment. Future minimum payments, by year and in the aggregate, under leases with initial or remaining terms of one year or more consisted of the following as of December 31, 2017:
(in millions) | Operating Leases | |||
2018 | $ | 21.3 | ||
2019 | 17.5 | |||
2020 | 11.6 | |||
2021 | 9.6 | |||
2022 | 8.0 | |||
Thereafter | 27.0 | |||
Total minimum lease payments | $ | 95.0 | ||
Rental expense was $26.6 million, $25.4 million and $25.7 million for 2017, 2016 and 2015, respectively.
In the third quarter of 2017, the Company entered into a seven year lease for a used airplane which includes a maximum residual value guarantee of $11.1 million by the Company if the fair value of the airplane is less than $14.4 million at the end of the lease term. In the third quarter of 2017, the Company made payments of $6.7 million related to the termination and residual value guarantee of a previous airplane lease. These payments were previously accrued, over the life of the former lease and reported within “Other” in the “Total provided by operating activities” on the Consolidated Statement of Cash Flows.
Asbestos Liability
Information Regarding Claims and Costs in the Tort System
As of December 31, 2017, the Company was a defendant in cases filed in numerous state and federal courts alleging injury or death as a result of exposure to asbestos. Activity related to asbestos claims during the periods indicated was as follows:
For the year ended December 31, | 2017 | 2016 | 2015 | ||||||
Beginning claims | 36,052 | 41,090 | 47,507 | ||||||
New claims | 2,819 | 2,826 | 2,572 | ||||||
Settlements | (1,038 | ) | (924 | ) | (954 | ) | |||
Dismissals | (5,599 | ) | (6,940 | ) | (8,035 | ) | |||
Ending claims | 32,234 | 36,052 | 41,090 | ||||||
Of the 32,234 pending claims as of December 31, 2017, approximately 18,200 claims were pending in New York, approximately 600 claims were pending in Texas, approximately 1,500 claims were pending in Mississippi, and approximately 200 claims were pending in Ohio, all jurisdictions in which legislation or judicial orders restrict the types of claims that can proceed to trial on the merits.
The Company has tried several cases resulting in defense verdicts by the jury or directed verdicts for the defense by the court. The Company further has pursued appeals of certain adverse jury verdicts that have resulted in reversals in favor of the defense.
On March 23, 2010, a Philadelphia, Pennsylvania, state court jury found the Company responsible for a 1/11th share of a $14.5 million verdict in the James Nelson claim. On February 23, 2011, the court entered judgment on the verdict in the amount of $4.0 million, jointly, against the Company and two other defendants, with additional interest in the amount of $0.01 million being assessed against the Company, only. All defendants, including the Company, and the plaintiffs took timely appeals of certain aspects of those judgments. On September 5, 2013, a panel of the Pennsylvania Superior Court, in a 2-1 decision, vacated the Nelson verdict against all defendants, reversing and remanding for a new trial. Plaintiffs requested a rehearing in the Superior Court and by order dated November 18, 2013, the Superior Court vacated the panel opinion, and granted en banc reargument. On December 23, 2014, the Superior Court issued a second opinion reversing the jury verdict. Plaintiffs sought leave to appeal to the Pennsylvania Supreme Court, which defendants have opposed. By order dated June 21, 2017, the Supreme Court of Pennsylvania denied plaintiffs’ petition for leave to appeal. The case is set for a new trial in April 2018.
Page 72
NOTES TO CONSOLIDATED FINANCIAL STATEMENTS
On August 17, 2011, a New York City state court jury found the Company responsible for a 99% share of a $32 million verdict on the Ronald Dummitt claim. The Company filed post-trial motions seeking to overturn the verdict, to grant a new trial, or to reduce the damages, which the Company argued were excessive under New York appellate case law governing awards for non-economic losses. The Court held oral argument on these motions on October 18, 2011 and issued a written decision on August 21, 2012 confirming the jury’s liability findings but reducing the award of damages to $8 million. At plaintiffs’ request, the Court entered a judgment in the amount of $4.9 million against the Company, taking into account settlement offsets and accrued interest under New York law. The Company appealed, and the judgment was affirmed in a 3-2 decision and order dated July 3, 2014. The Company appealed to the New York Court of Appeals. The court heard oral arguments on May 3, 2016 and affirmed the judgment in a decision dated June 28, 2016. The judgment, with interest, in the amount of $6.6 million was paid in the third quarter 2016.
On October 23, 2012, the Company received an adverse verdict in the Gerald Suttner claim in Buffalo, New York. The jury found that the Company was responsible for four percent (4%) of plaintiffs’ damages of $3 million. The Company filed post-trial motions requesting judgment in the Company’s favor notwithstanding the jury’s verdict, which were denied. The court entered a judgment of $0.1 million against the Company. The Company appealed, and the judgment was affirmed by order dated March 21, 2014. The Company sought reargument of this decision, which was denied. The Company sought review before the New York Court of Appeals, which was accepted in the fourth quarter of 2014. The court heard oral arguments on May 3, 2016 and affirmed the judgment in a decision dated June 28, 2016. The judgment, with interest, in the amount of $0.2 million was paid in the third quarter 2016.
On November 28, 2012, the Company received an adverse verdict in the James Hellam claim in Oakland, CA. The jury found that the Company was responsible for seven percent (7%) of plaintiffs’ non-economic damages of $4.5 million, plus a portion of their economic damages of $0.9 million. Based on California court rules regarding allocation of damages, judgment was entered against the Company in the amount of $1.282 million. The Company filed post-trial motions requesting judgment in the Company’s favor notwithstanding the jury’s verdict and also requesting that settlement offsets be applied to reduce the judgment in accordance with California law. On January 31, 2013, the court entered an order disposing partially of that motion. On March 1, 2013, the Company filed an appeal regarding the portions of the motion that were denied. The court entered judgment against the Company in the amount of $1.1 million. The Company appealed. By opinion dated April 16, 2014, the Court of Appeal affirmed the finding of liability against the Company, and the California Supreme Court denied review of this ruling. The Court of Appeal reserved the arguments relating to recoverable damages to a subsequent appeal that remains pending. On August 21, 2015, the Court of Appeal reversed the trial court with respect to a $20,000 damages item, but affirmed the trial court in all other respects. The Company sought review of that ruling before the Supreme Court of California, which was denied. The Company settled the matter in December 2015. The settlement was reflected in the fourth quarter 2015 indemnity amount.
On February 25, 2013, a Philadelphia, Pennsylvania, state court jury found the Company responsible for a 1/10th share of a $2.5 million verdict in the Thomas Amato claim and a 1/5th share of a $2.3 million verdict in the Frank Vinciguerra claim, which were consolidated for trial. The Company filed post-trial motions requesting judgments in the Company’s favor notwithstanding the jury’s verdicts or new trials, and also requesting that settlement offsets be applied to reduce the judgment in accordance with Pennsylvania law. These motions were denied. The Company appealed, and on April 17, 2015, a panel of the Superior Court of Pennsylvania affirmed the trial court’s ruling. The Supreme Court of Pennsylvania accepted the Company’s petition for review and heard oral arguments on September 13, 2016. On November 22, 2016, the Court dismissed the Company’s appeal as improvidently granted. The Company paid the Vinciguerra judgment in the amount of $0.6 million in the fourth quarter 2016. The Company paid the Amato judgment, with interest, in the amount of $0.3 million in the second quarter of 2017.
On March 1, 2013, a New York City state court jury entered a $35 million verdict against the Company in the Ivo Peraica claim. The Company filed post-trial motions seeking to overturn the verdict, to grant a new trial, or to reduce the damages, which the Company argues were excessive under New York appellate case law governing awards for non-economic losses and further were subject to settlement offsets. After the trial court remitted the verdict to $18 million, but otherwise denied the Company’s post-trial motion, judgment was entered against the Company in the amount of $10.6 million (including interest). The Company appealed. The Company took a separate appeal of the trial court’s denial of its summary judgment motion. The Court consolidated the appeals, which were heard in the fourth quarter of 2014. In July 2016 the Company supplemented its briefing based on the New York Court of Appeals Dummitt/Suttner decision. On October 6, 2016, a panel of the Appellate Division, First Department, affirmed the rulings of the trial court on liability issues but further reduced the damages award to $4.25 million, which after settlement offsets is calculated to be $1.94 million. Plaintiff has the option of accepting the reduced amount or having a new trial on damages. The Company filed a motion with the Appellate Division requesting a rehearing on liability issues. The motion was denied. The New York Court of Appeals also denied review. The Company paid in the first quarter of 2017 the Peraica plaintiffs $2.7 million, which was the amount owed under the judgment.
Page 73
NOTES TO CONSOLIDATED FINANCIAL STATEMENTS
On July 31, 2013, a Buffalo, New York state court jury entered a $3.1 million verdict against the Company in the Lee Holdsworth claim. The Company filed post-trial motions seeking to overturn the verdict, to grant a new trial, or to reduce the damages, which the Company argues were excessive under New York appellate case law governing awards for non-economic losses and further were subject to settlement offsets. Post-trial motions were denied, and the court entered judgment in the amount of $1.7 million. On June 12, 2015, the Appellate Division, Fourth Department, affirmed the trial court’s ruling denying the Company’s motion for summary judgment. The court denied reargument of that ruling. The Company pursued a further appeal of the trial court rulings and judgment, which was argued on May 16, 2016. On July 8, 2016, the Court vacated the judgment and granted the Company a new trial on the issue of whether the Company is subject to joint-and-several liability under New York law. Plaintiff filed a motion to enter judgment in the trial court in the amount allegedly unaffected by the appellate ruling, approximately $1.0 million, and the Company opposed the motion. The Company settled the matter. The settlement was reflected in the fourth quarter 2016 indemnity amount.
On September 11, 2013, a Columbia, South Carolina state court jury in the Lloyd Garvin claim entered an $11 million verdict for compensatory damages against the Company and two other defendants jointly, and also awarded exemplary damages against the Company in the amount of $11 million. The jury also awarded exemplary damages against both other defendants. The Company filed post-trial motions seeking to overturn the verdict, which were denied, except that the Court remitted the compensatory damages award to $2.5 million and exemplary damages award to $3.5 million. Considering settlement offsets, the Court further reduced the total damages award to $3.5 million. The Company settled the matter. The settlement is reflected in the first quarter 2015 indemnity amount.
On September 17, 2013, a Fort Lauderdale, Florida state court jury in the Richard DeLisle claim found the Company responsible for 16 percent of an $8 million verdict. The trial court denied all parties’ post-trial motions, and entered judgment against the Company in the amount of $1.3 million. The Company has appealed. Oral argument on the appeal took place on February 16, 2016. On September 14, 2016 a panel of the Florida Court of Appeals reversed and entered judgment in favor of the Company. Plaintiff filed with the Court of Appeals a motion for rehearing and/or certification of an appeal to the Florida Supreme Court, which the Court denied on November 9, 2016. Plaintiffs subsequently requested review by the Supreme Court of Florida. Plaintiffs' motion was granted on July 11, 2017. The briefing in this matter has concluded, and oral argument is set for March 6, 2018.
On June 16, 2014, a New York City state court jury entered a $15 million verdict against the Company in the Ivan Sweberg claim and a $10 million verdict against the Company in the Selwyn Hackshaw claim. The two claims were consolidated for trial. The Company filed post-trial motions seeking to overturn the verdicts, to grant new trials, or to reduce the damages, which were denied, except that the Court reduced the Sweberg award to $10 million, and reduced the Hackshaw award to $6 million. Judgments have been entered in the amount of $5.3 million in Sweberg and $3.1 million in Hackshaw. The Company appealed. Oral argument on Sweberg took place on February 16, 2016, and oral argument on Hackshaw took place on March 9, 2016. On October 6, 2016, two panels of the Appellate Division, First Department, affirmed the rulings of the trial court on liability issues but further reduced the Sweberg damages award to $9.5 million and further reduced the Hackshaw damages award to $3 million, which after settlement offsets are calculated to be $4.73 million in Sweberg and $0 in Hackshaw. Plaintiffs were given the option of accepting the reduced awards or having new trials on damages. Plaintiffs subsequently brought an appeal in Hackshaw before the New York Court of Appeals, which the Court denied. The Company filed a motion with the Appellate Division requesting a rehearing on liability issues in Sweberg. That motion was denied. The New York Court of Appeals also denied review. The Company paid in the first quarter of 2017 the Sweberg plaintiffs $5.7 million, which was the amount owed under this judgment. No damages are owed in Hackshaw.
On July 2, 2015, a St. Louis, Missouri state court jury in the James Poage claim entered a $1.5 million verdict for compensatory damages against the Company. The jury also awarded exemplary damages against the Company in the amount of $10 million. The Company filed a motion seeking to reduce the verdict to account for the verdict set-offs. That motion was denied, and judgment was entered against the Company in the amount of $10.8 million. The Company initiated an appeal. Oral argument was held on December 13, 2016. In an opinion dated May 2, 2017, a Missouri Court of Appeals panel affirmed the judgment in all respects. The Court of Appeals denied the Company’s motion to transfer the case to the Supreme Court of Missouri. The Company sought leave to appeal before the Supreme Court of Missouri, which denied that request. The Company is seeking further review of that ruling by the Supreme Court of the United States.
On February 9, 2016, a Philadelphia, Pennsylvania, federal court jury found the Company responsible for a 30 percent share of a $1.085 million verdict in the Valent Rabovsky claim. The court ordered briefing on the amount of the judgment. The Company argued, among other things, that settlement offsets reduce the award to plaintiff under Pennsylvania law. A further hearing was held April 26, 2016, after which the court denied the Company’s request and entered judgment in the amount of $0.4 million. The Company filed post-trial motions, which were denied in two decisions issued on August 26, 2016 and September 28, 2016. The Company is pursuing an appeal to the Third Circuit Court of Appeals, which was argued on June 12,
Page 74
NOTES TO CONSOLIDATED FINANCIAL STATEMENTS
2017. On September 27, 2017, the Court entered an order asking the Supreme Court of Pennsylvania to decide one of the issues raised in the Company’s appeal. The Supreme Court of Pennsylvania accepted the request, and the Company settled the matter. The settlement was reflected in the fourth quarter 2017 indemnity amount.
On April 22, 2016, a Phoenix, Arizona federal court jury found the Company responsible for a 20 percent share of a $9 million verdict in the George Coulbourn claim, and further awarded exemplary damages against the Company in the amount of $5 million. The jury also awarded compensatory and exemplary damages against the other defendant present at trial. The court entered judgment against the Company in the amount of $6.8 million. The Company filed post-trial motions, which were denied on September 20, 2016. The Company is pursuing an appeal to the Ninth Circuit Court of Appeals. Briefing is complete, and oral argument is set for March 15, 2018.
On June 30, 2017, a New York City state court jury entered a $20 million verdict against the Company in the Geoffrey Anisansel claim. The Company settled the matter in August 2017. The settlement is reflected in the third quarter 2017 indemnity amount.
Such judgment amounts are not included in the Company’s incurred costs until all available appeals are exhausted and the final payment amount is determined.
The gross settlement and defense costs incurred (before insurance recoveries and tax effects) for the Company for the years ended December 31, 2017, 2016 and 2015 totaled $88.3 million, $73.5 million and $69.4 million. In contrast to the recognition of settlement and defense costs, which reflect the current level of activity in the tort system, cash payments and receipts generally lag the tort system activity by several months or more, and may show some fluctuation from quarter to quarter. Cash payments of settlement amounts are not made until all releases and other required documentation are received by the Company, and reimbursements of both settlement amounts and defense costs by insurers may be uneven due to insurer payment practices, transitions from one insurance layer to the next excess layer and the payment terms of certain reimbursement agreements. The Company’s total pre-tax payments for settlement and defense costs, net of funds received from insurers, for the years ended December 31, 2017, 2016 and 2015 totaled $62.5 million, $56.0 million and $49.9 million, respectively. Detailed below are the comparable amounts for the periods indicated.
(in millions) | ||||||||||||
For the year ended December 31, | 2017 | 2016 | 2015 | |||||||||
Settlement / indemnity costs incurred (1) | $ | 51.8 | $ | 30.5 | $ | 27.7 | ||||||
Defense costs incurred (1) | 36.5 | 43.0 | 41.7 | |||||||||
Total costs incurred | $ | 88.3 | $ | 73.5 | $ | 69.4 | ||||||
Settlement / indemnity payments | $ | 51.7 | $ | 32.4 | $ | 24.5 | ||||||
Defense payments | 38.9 | 43.7 | 43.5 | |||||||||
Insurance receipts | (28.1 | ) | (20.1 | ) | (18.1 | ) | ||||||
Pre-tax cash payments | $ | 62.5 | $ | 56.0 | $ | 49.9 | ||||||
(1) Before insurance recoveries and tax effects.
The amounts shown for settlement and defense costs incurred, and cash payments, are not necessarily indicative of future period amounts, which may be higher or lower than those reported.
Cumulatively through December 31, 2017, the Company has resolved (by settlement or dismissal) approximately 130,000 claims. The related settlement cost incurred by the Company and its insurance carriers is approximately $535 million, for an average settlement cost per resolved claim of approximately $4,100. The average settlement cost per claim resolved during the years ended December 31, 2017, 2016 and 2015 was $7,800, $3,900 and $3,100, respectively. Because claims are sometimes dismissed in large groups, the average cost per resolved claim, as well as the number of open claims, can fluctuate significantly from period to period. In addition to large group dismissals, the nature of the disease and corresponding settlement amounts for each claim resolved will also drive changes from period to period in the average settlement cost per claim. Accordingly, the average cost per resolved claim is not considered in the Company’s periodic review of its estimated asbestos liability. For a discussion regarding the four most significant factors affecting the liability estimate, see “Effects on the Consolidated Financial Statements”.
Page 75
NOTES TO CONSOLIDATED FINANCIAL STATEMENTS
Effects on the Consolidated Financial Statements
The Company has retained the firm of Hamilton, Rabinovitz & Associates, Inc. (“HR&A”), a nationally recognized expert in the field, to assist management in estimating the Company’s asbestos liability in the tort system. HR&A reviews information provided by the Company concerning claims filed, settled and dismissed, amounts paid in settlements and relevant claim information such as the nature of the asbestos-related disease asserted by the claimant, the jurisdiction where filed and the time lag from filing to disposition of the claim. The methodology used by HR&A to project future asbestos costs is based on the Company’s recent historical experience for claims filed, settled and dismissed during a base reference period. The Company’s experience is then compared to estimates of the number of individuals likely to develop asbestos-related diseases determined based on widely used previously conducted epidemiological studies augmented with current data inputs. Those studies were undertaken in connection with national analyses of the population of workers believed to have been exposed to asbestos. Using that information, HR&A estimates the number of future claims that would be filed against the Company and estimates the aggregate settlement or indemnity costs that would be incurred to resolve both pending and future claims based upon the average settlement costs by disease during the reference period. This methodology has been accepted by numerous courts. After discussions with the Company, HR&A augments its liability estimate for the costs of defending asbestos claims in the tort system using a forecast from the Company which is based upon discussions with its defense counsel. Based on this information, HR&A compiles an estimate of the Company’s asbestos liability for pending and future claims using a range of reference periods based on claim experience and covering claims expected to be filed through the indicated forecast period. The most significant factors affecting the liability estimate are (1) the number of new mesothelioma claims filed against the Company, (2) the average settlement costs for mesothelioma claims, (3) the percentage of mesothelioma claims dismissed against the Company and (4) the aggregate defense costs incurred by the Company. These factors are interdependent, and no one factor predominates in determining the liability estimate.
In the Company’s view, the forecast period used to provide the best estimate for asbestos claims and related liabilities and costs is a judgment based upon a number of trend factors, including the number and type of claims being filed each year; the jurisdictions where such claims are filed, and the effect of any legislation or judicial orders in such jurisdictions restricting the types of claims that can proceed to trial on the merits; and the likelihood of any comprehensive asbestos legislation at the federal level. In addition, the dynamics of asbestos litigation in the tort system have been significantly affected by the substantial number of companies that have filed for bankruptcy protection, thereby staying any asbestos claims against them until the conclusion of such proceedings, and the establishment of a number of post-bankruptcy trusts for asbestos claimants, which have been estimated to provide $36 billion for payments to current and future claimants. These trend factors have both positive and negative effects on the dynamics of asbestos litigation in the tort system and the related best estimate of the Company’s asbestos liability, and these effects do not move in a linear fashion but rather change over multi-year periods. Accordingly, the Company’s management continues to monitor these trend factors over time and periodically assesses whether an alternative forecast period is appropriate.
Each quarter, HR&A compiles an update based upon the Company’s experience in claims filed, settled and dismissed as well as average settlement costs by disease category (mesothelioma, lung cancer, other cancer, and non-malignant conditions including asbestosis). In addition to this claims experience, the Company also considers additional quantitative and qualitative factors such as the nature of the aging of pending claims, significant appellate rulings and legislative developments, and their respective effects on expected future settlement values. As part of this process, the Company also takes into account trends in the tort system such as those enumerated above. Management considers all these factors in conjunction with the liability estimate of HR&A and determines whether a change in the estimate is warranted.
Liability Estimate. With the assistance of HR&A, effective as of December 31, 2016, the Company extended its estimate of the asbestos liability, including the costs of settlement or indemnity payments and defense costs relating to currently pending claims and future claims projected to be filed against the Company through the generally accepted end point of such claims in 2059. The Company’s previous estimate was for asbestos claims filed or projected to be filed through 2021. The Company’s estimate of the asbestos liability for pending and future claims through 2059 is based on the projected future asbestos costs resulting from the Company’s experience using a range of reference periods for claims filed, settled and dismissed. Based on this estimate, the Company recorded an additional liability of $227 million as of December 31, 2016. This action was based on several factors which contribute to the Company’s ability to reasonably estimate this liability through 2059. First, the number of mesothelioma claims (which although constituting approximately 10% of the Company’s total pending asbestos claims, have consistently accounted for approximately 90% of the Company’s aggregate settlement and defense costs) being filed against the Company and associated settlement costs have stabilized. Second, there have been generally favorable developments in the trend of case law which has been a contributing factor in stabilizing the asbestos claims activity and related settlement costs. Third, there have been significant actions taken by certain state legislatures and courts that have reduced the number and types of claims that can proceed to trial, which has been a significant factor in stabilizing the asbestos claims activity. Fourth, recent court decisions in certain jurisdictions have provided additional clarity regarding the nature of claims that may proceed to trial
Page 76
NOTES TO CONSOLIDATED FINANCIAL STATEMENTS
in those jurisdictions and greater predictability regarding future claim activity. Fifth, the Company has coverage-in-place agreements with almost all of its excess insurers, which enables the Company to project a stable relationship between settlement and defense costs paid by the Company and reimbursements from its insurers. Sixth, annual settlements with respect to groups of cases with certain plaintiff firms have helped to stabilize indemnity payments and defense costs. Taking these factors into account, the Company believes that it can reasonably estimate the asbestos liability for pending claims and future claims to be filed through 2059.
Management has made its best estimate of the costs through 2059 based on the analysis by HR&A completed in January 2017. Through December 31, 2017, the Company’s actual experience during the updated reference period for mesothelioma claims filed and dismissed generally approximated the assumptions in the Company’s liability estimate. In addition to this claims experience, the Company considered additional quantitative and qualitative factors such as the nature of the aging of pending claims, significant appellate rulings and legislative developments, and their respective effects on expected future settlement values. Based on this evaluation, the Company determined that no change in the estimate was warranted for the period ended December 31, 2017.
A liability of $696 million was recorded as of December 31, 2016 to cover the estimated cost of asbestos claims now pending or subsequently asserted through 2059, of which approximately 80% is attributable to settlement and defense costs for future claims projected to be filed through 2059. The liability is reduced when cash payments are made in respect of settled claims and defense costs. The liability was $605 million as of December 31, 2017. It is not possible to forecast when cash payments related to the asbestos liability will be fully expended; however, it is expected such cash payments will continue for a number of years past 2059, due to the significant proportion of future claims included in the estimated asbestos liability and the lag time between the date a claim is filed and when it is resolved. None of these estimated costs have been discounted to present value due to the inability to reliably forecast the timing of payments. The current portion of the total estimated liability at December 31, 2017 was $85 million and represents the Company’s best estimate of total asbestos costs expected to be paid during the twelve-month period. Such amount is based upon the HR&A model together with the Company’s prior year payment experience for both settlement and defense costs.
Insurance Coverage and Receivables. Prior to 2005, a significant portion of the Company’s settlement and defense costs were paid by its primary insurers. With the exhaustion of that primary coverage, the Company began negotiations with its excess insurers to reimburse the Company for a portion of its settlement and/or defense costs as incurred. To date, the Company has entered into agreements providing for such reimbursements, known as “coverage-in-place”, with eleven of its excess insurer groups. Under such coverage-in-place agreements, an insurer’s policies remain in force and the insurer undertakes to provide coverage for the Company’s present and future asbestos claims on specified terms and conditions that address, among other things, the share of asbestos claims costs to be paid by the insurer, payment terms, claims handling procedures and the expiration of the insurer’s obligations. Similarly, under a variant of coverage-in-place, the Company has entered into an agreement with a group of insurers confirming the aggregate amount of available coverage under the subject policies and setting forth a schedule for future reimbursement payments to the Company based on aggregate indemnity and defense payments made. In addition, with ten of its excess insurer groups, the Company entered into agreements settling all asbestos and other coverage obligations for an agreed sum, totaling $82.5 million in aggregate. Reimbursements from insurers for past and ongoing settlement and defense costs allocable to their policies have been made in accordance with these coverage-in-place and other agreements. All of these agreements include provisions for mutual releases, indemnification of the insurer and, for coverage-in-place, claims handling procedures. With the agreements referenced above, the Company has concluded settlements with all but one of its solvent excess insurers whose policies are expected to respond to the aggregate costs included in the liability estimate. That insurer, which issued a single applicable policy, has been paying the shares of defense and indemnity costs the Company has allocated to it, subject to a reservation of rights. There are no pending legal proceedings between the Company and any insurer contesting the Company’s asbestos claims under its insurance policies.
In conjunction with developing the aggregate liability estimate referenced above, the Company also developed an estimate of probable insurance recoveries for its asbestos liabilities. In developing this estimate, the Company considered its coverage-in-place and other settlement agreements described above, as well as a number of additional factors. These additional factors include the financial viability of the insurance companies, the method by which losses will be allocated to the various insurance policies and the years covered by those policies, how settlement and defense costs will be covered by the insurance policies and interpretation of the effect on coverage of various policy terms and limits and their interrelationships. In addition, the timing and amount of reimbursements will vary because the Company’s insurance coverage for asbestos claims involves multiple insurers, with different policy terms and certain gaps in coverage. In addition to consulting with legal counsel on these insurance matters, the Company retained insurance consultants to assist management in the estimation of probable insurance recoveries based upon the aggregate liability estimate described above and assuming the continued viability of all solvent insurance carriers. Based upon the analysis of policy terms and other factors noted above by the Company’s legal counsel, and incorporating risk mitigation judgments by the Company where policy terms or other factors were not certain, the Company’s
Page 77
NOTES TO CONSOLIDATED FINANCIAL STATEMENTS
insurance consultants compiled a model indicating how the Company’s historical insurance policies would respond to varying levels of asbestos settlement and defense costs and the allocation of such costs between such insurers and the Company. Using the estimated liability as of December 31, 2016 (for claims filed or expected to be filed through 2059), the insurance consultant’s model forecasted that approximately 21% of the liability would be reimbursed by the Company’s insurers. While there are overall limits on the aggregate amount of insurance available to the Company with respect to asbestos claims, those overall limits were not reached by the total estimated liability currently recorded by the Company, and such overall limits did not influence the Company in its determination of the asset amount to record. The proportion of the asbestos liability that is allocated to certain insurance coverage years, however, exceeds the limits of available insurance in those years. The Company allocates to itself the amount of the asbestos liability (for claims filed or expected to be filed through 2059) that is in excess of available insurance coverage allocated to such years. An asset of $143 million was recorded as of December 31, 2016 representing the probable insurance reimbursement for such claims expected through 2059. The asset is reduced as reimbursements and other payments from insurers are received. The asset was $115 million as of December 31, 2017.
The Company reviews the aforementioned estimated reimbursement rate with its insurance consultants on a periodic basis in order to confirm its overall consistency with the Company’s established reserves. The reviews encompass consideration of the performance of the insurers under coverage-in-place agreements and the effect of any additional lump-sum payments under other insurer agreements. Actual insurance reimbursements vary from period to period, and will decline over time, for the reasons cited above.
Uncertainties. Estimation of the Company’s ultimate exposure for asbestos-related claims is subject to significant uncertainties, as there are multiple variables that can affect the timing, severity and quantity of claims and the manner of their resolution. The Company cautions that its estimated liability is based on assumptions with respect to future claims, settlement and defense costs based on past experience that may not prove reliable as predictors; the assumptions are interdependent and no single factor predominates in determining the liability estimate. A significant upward or downward trend in the number of claims filed, depending on the nature of the alleged injury, the jurisdiction where filed and the quality of the product identification, or a significant upward or downward trend in the costs of defending claims, could change the estimated liability, as would substantial adverse verdicts at trial that withstand appeal. A legislative solution, structured settlement transaction, or significant change in relevant case law could also change the estimated liability.
The same factors that affect developing estimates of probable settlement and defense costs for asbestos-related liabilities also affect estimates of the probable insurance reimbursements, as do a number of additional factors. These additional factors include the financial viability of the insurance companies, the method by which losses will be allocated to the various insurance policies and the years covered by those policies, how settlement and defense costs will be covered by the insurance policies and interpretation of the effect on coverage of various policy terms and limits and their interrelationships. In addition, due to the uncertainties inherent in litigation matters, no assurances can be given regarding the outcome of any litigation, if necessary, to enforce the Company’s rights under its insurance policies or settlement agreements.
Many uncertainties exist surrounding asbestos litigation, and the Company will continue to evaluate its estimated asbestos-related liability and corresponding estimated insurance reimbursement as well as the underlying assumptions and process used to derive these amounts. These uncertainties may result in the Company incurring future charges or increases to income to adjust the carrying value of recorded liabilities and assets, particularly if the number of claims and settlement and defense costs change significantly, or if there are significant developments in the trend of case law or court procedures, or if legislation or another alternative solution is implemented. Although the resolution of these claims will likely take many years, the effect on the results of operations, financial position and cash flow in any given period from a revision to these estimates could be material.
Other Contingencies
Environmental Matters
For environmental matters, the Company records a liability for estimated remediation costs when it is probable that the Company will be responsible for such costs and they can be reasonably estimated. Generally, third party specialists assist in the estimation of remediation costs. The environmental remediation liability as of December 31, 2017 is substantially related to the former manufacturing sites in Goodyear, Arizona (the “Goodyear Site”) discussed below.
Page 78
NOTES TO CONSOLIDATED FINANCIAL STATEMENTS
Goodyear Site
The Goodyear Site was operated by Unidynamics/Phoenix, Inc. (“UPI”), which became an indirect subsidiary of the Company in 1985 when the Company acquired UPI’s parent company, Unidynamics Corporation. UPI manufactured explosive and pyrotechnic compounds, including components for critical military programs, for the U.S. government at the Goodyear Site from 1962 to 1993, under contracts with the Department of Defense and other government agencies and certain of their prime contractors. In 1990, the U.S. Environmental Protection Agency (“EPA”) issued administrative orders requiring UPI to design and carry out certain remedial actions, which UPI has done. Groundwater extraction and treatment systems have been in operation at the Goodyear Site since 1994. On July 26, 2006, the Company entered into a consent decree with the EPA with respect to the Goodyear Site providing for, among other things, a work plan for further investigation and remediation activities (inclusive of a supplemental remediation investigation and feasibility study). During the third quarter of 2014, the EPA issued a Record of Decision amendment permitting, among other things, additional source area remediation resulting in the Company recording a charge of $49.0 million, extending the accrued costs through 2022. The total estimated gross liability was $41.2 million as of December 31, 2017, and as described below, a portion is reimbursable by the U.S. Government. The current portion of the total estimated liability was $9.4 million and represents the Company’s best estimate, in consultation with its technical advisors, of total remediation costs expected to be paid during the twelve month period.
It is not possible at this point to reasonably estimate the amount of any obligation in excess of the Company’s current accruals through the 2022 forecast period because of the aforementioned uncertainties, in particular, the continued significant changes in the Goodyear Site conditions and additional expectations of remediation activities experienced in recent years.
On July 31, 2006, the Company entered into a consent decree with the U.S. Department of Justice on behalf of the Department of Defense and the Department of Energy pursuant to which, among other things, the U.S. Government reimburses the Company for 21% of qualifying costs of investigation and remediation activities at the Goodyear Site. As of December 31, 2017, the Company has recorded a receivable of $8.5 million for the expected reimbursements from the U.S. Government in respect of the aggregate liability as at that date. The receivable is reduced as reimbursements and other payments from the U.S. Government are received.
Other Environmental Matters
The Company has been identified as a potentially responsible party (“PRP”) with respect to environmental contamination at the Crab Orchard National Wildlife Refuge Superfund Site (the “Crab Orchard Site”). The Crab Orchard Site is located near Marion, Illinois, and consists of approximately 55,000 acres. Beginning in 1941, the United States used the Crab Orchard Site for the production of ordnance and other related products for use in World War II. In 1947 about half of the Crab Orchard Site was leased to a variety of industrial tenants whose activities (which continue to this day) included manufacturing ordnance and explosives. A predecessor to the Company formerly leased portions of the Crab Orchard Site, and conducted manufacturing operations at the Crab Orchard Site from 1952 until 1964. General Dynamics Ordnance and Tactical Systems, Inc. (“GD-OTS”) is in the process of conducting a remedial investigation and feasibility study for a portion of the Crab Orchard Site (referred to as the “AUS-OU”), which includes an area where the Company maintained operations, pursuant to an Administrative Order on Consent. A remedial investigation report was approved in February 2015, and work on the feasibility study is underway. It is unclear when the final feasibility study will be completed, or when a final Record of Decision may be issued.
GD-OTS has asked the Company to participate in a voluntary cost allocation/mediation exercise with respect to response costs it has incurred or will incur with respect to the AUS-OU. The Company, along with a number of other PRPs that were contacted, initially declined, but in light of the ongoing investigative activities, and the willingness of the U.S. government to participate in a mediation proceeding, the Company and a number of PRPs have agreed to participate in a non-binding mediation process. The Company and other PRPs executed a mediation agreement on March 16, 2015, and the U.S. government, following the resolution of an inter-agency dispute, executed the mediation agreement on August 6, 2015. The participants have selected a mediator, are exchanging relevant information, and have agreed upon a framework for the mediation to address the numerous sub-areas at the Site in a coherent fashion. The first phase of the mediation, involving former munitions or ordnance storage areas, began in November 2017, and continues, with another mediation session tentatively scheduled for March 2018. The Company at present cannot predict whether this mediation proceeding will result in an agreement, or when any determination of the allocable share of the various PRPs, including the U.S. Government, is likely to be completed. Although a loss is probable, it is not possible at this time to reasonably estimate the amount of any obligation for remediation of the Crab Orchard Site because the extent of the environmental impact, allocation among PRPs, remediation alternatives, and concurrence of regulatory authorities have not yet advanced to the stage where a reasonable estimate can be made. The Company notified its insurers of this potential liability and has obtained coverage, subject to reservations of rights, under certain of its insurance policies.
Page 79
NOTES TO CONSOLIDATED FINANCIAL STATEMENTS
Other Proceedings
The Company was named as a defendant in a suit filed in June 2015 by a small group of homeowners in Missoula, Montana, whose homes are near the site of a former lumber mill and wood processing facility (the “White Pine Site”) that operated from approximately 1920 to 1996. The suit alleges that the homeowners’ property was damaged by coming into contact with certain hazardous substances that migrated from the White Pine Site. The White Pine Site was owned and operated by a predecessor to Huttig Building Products, Inc. (“Huttig”), which was a subsidiary of the Company from 1968 until Huttig’s shares were distributed to the Company’s shareholders in 1999. Under the terms of the distribution agreement, Huttig retained the liability for its prior operations. The Company tendered the defense of this matter to Huttig, and Huttig agreed to defend and indemnify the Company. That matter was resolved through a settlement agreement reached between Huttig and the individual plaintiffs, and the case was dismissed as against the Company. In a related matter, Huttig filed suit against certain insurers who Huttig claimed were obligated to provide insurance coverage for the environmental remediation costs and other damages caused by the operations at the White Pine Site. The Company was brought into that case in October 2015 as a third party defendant by two of the insurers seeking declaratory relief that no coverage obligations are owed to Huttig or the Company with respect to the White Pine Site. In late 2015, Huttig notified the Company of its intention to pursue an action against the Company for damages related to Huttig’s environmental liability at the White Pine Site and the scope of coverage under the Company’s historical insurance policies available to Huttig for such liability. The Company settled its dispute with Huttig in exchange for a complete release by Huttig of all claims against the Company in connection with the distribution agreement, and a release by Huttig of any and all rights it has or may have had under any of the Company’s insurance policies. As a result of this settlement, the Company recorded a $5 million net pre-tax charge in the second quarter of 2016. In addition, Huttig retained all of its indemnity obligations to the Company as set forth in the distribution agreement, including its indemnity obligations relating to the White Pine Site.
The Company regularly reviews the status of lawsuits, claims and proceedings that have been or may be asserted against the Company relating to the conduct of its business, including those pertaining to product liability, patent infringement, commercial, employment, employee benefits, environmental and stockholder matters. The Company records a provision for a liability for such matters when it is considered probable that a liability has been incurred and the amount of the loss can be reasonably estimated. These provisions, if any, are reviewed quarterly and adjusted as additional information becomes available. If either or both of the criteria are not met, the Company assesses whether there is at least a reasonable possibility that a loss, or additional losses, may have been incurred. If there is a reasonable possibility that a loss or additional loss may have been incurred for such matters, the Company discloses the estimate of the amount of loss or range of loss, discloses that the amount is immaterial, or discloses that an estimate of loss cannot be made, as applicable. The Company believes that as of December 31, 2017, there was no reasonable possibility that a material loss, or any additional material losses, may have been incurred for such matters, and that adequate provision has been made in its financial statements for the potential impact of all such matters.
Page 80
NOTES TO CONSOLIDATED FINANCIAL STATEMENTS
Note 12 – Stock-Based Compensation Plans
Effective February 2013, the Company terminated its two existing stock compensation plans, the Stock Incentive Plan and the Non-Employee Director Stock Compensation Plan, and created a single plan, the 2013 Stock Incentive Plan, to cover all employees and directors (the "Stock Incentive Plan"). The Stock Incentive Plan is used to provide long-term incentive compensation through stock options, restricted share units, performance-based restricted share units and deferred stock units.
Stock Options
Options are granted under the Stock Incentive Plan to officers and other key employees and directors at an exercise price equal to the closing price on the date of grant. For grants prior to April 23, 2007, the exercise price is equal to the fair market value of the shares on the date of grant, which is defined for purposes of the plans as the average of the high and low prices for the Company’s common stock on the 10 trading days ending on the date of grant. Unless otherwise determined by the Compensation Committee which administers the plan, options become exercisable at a rate of 25% after the first year, 50% after the second year, 75% after the third year and 100% after the fourth year from the date of grant. Options granted to officers and employees from 2004 to 2013 expire six years after the date of grant. All options granted to directors and options granted to officers and employees after 2014 expire ten years after the date of grant.
The Company determines the fair value of each grant using the Black-Scholes option pricing model. The weighted-average assumptions for grants made during the years ended December 31, 2017, 2016 and 2015 are as follows:
2017 | 2016 | 2015 | |||||||
Dividend yield | 2.27 | % | 4.08 | % | 2.95 | % | |||
Volatility | 23.32 | % | 23.41 | % | 24.97 | % | |||
Risk-free interest rate | 1.94 | % | 1.59 | % | 1.32 | % | |||
Expected lives in years | 4.2 | 4.2 | 4.2 | ||||||
Expected dividend yield is based on the Company’s dividend rate. Expected stock volatility was determined based upon the historical volatility for the four year period preceding the date of grant. The risk-free interest rate was based on the yield curve in effect at the time the options were granted, using U.S. constant maturities over the expected life of the option. The expected lives of the awards represents the period of time that options granted are expected to be outstanding.
Activity in the Company’s stock option plans for the year ended December 31, 2017 was as follows:
Option Activity | Number of Shares (in 000’s) | Weighted Average Exercise Price | Weighted Average Remaining Life (Years) | ||||||
Options outstanding as of January 1, 2017 | 2,724 | $ | 51.41 | ||||||
Granted | 563 | 73.90 | |||||||
Exercised | (663 | ) | 50.82 | ||||||
Canceled | (74 | ) | 54.02 | ||||||
Options outstanding as of December 31, 2017 | 2,550 | $ | 56.45 | 7.17 | |||||
Options exercisable as of December 31, 2017 | 861 | $ | 54.51 | 5.34 | |||||
The weighted-average fair value of options granted during 2017, 2016 and 2015 was $12.98, $6.52 and $9.80, respectively. The total fair value of shares vested during 2017, 2016 and 2015 was $6.3 million, $7.8 million and $9.0 million, respectively. The total intrinsic value of options exercised during 2017, 2016 and 2015 was $16.9 million, $14.8 million and $7.9 million, respectively. The total cash received from these option exercises was $31.2 million, $31.8 million and $11.9 million, respectively. The tax benefit realized for the tax deductions from option exercises and vesting of restricted stock was $0.4 million and $1.6 million as of December 31, 2016 and December 31, 2015, respectively. The aggregate intrinsic value of exercisable options was $29.9 million, $15.8 million and $2.1 million as of December 31, 2017, 2016 and 2015, respectively. As of December 31, 2017, there was $10.2 million of total future compensation cost related to unvested share-based awards to be recognized over a weighted-average period of 1.26 years.
Restricted Stock and Performance-Based Restricted Share Units
Restricted share units vest at a rate of 25% after the first year, 50% after the second year, 75% after the third year and 100% after the fourth year from the date of grant and are subject to forfeiture restrictions which lapse over time. The vesting of performance-based restricted share units is determined in three years based on relative total shareholder return for Crane Co.
Page 81
NOTES TO CONSOLIDATED FINANCIAL STATEMENTS
compared to the S&P Midcap 400 Capital Goods Group, with payout potential ranging from 0% to 200% but capped at 100% if the Company’s three year total shareholder return is negative.
Included in the Company’s share-based compensation was expense recognized for its restricted stock, restricted share unit and performance-based restricted share unit awards of $13.9 million, $13.8 million and $12.2 million in 2017, 2016 and 2015, respectively. As of December 31, 2017, there was $20.2 million of total future compensation cost related to restricted stock, restricted share unit and performance-based restricted share unit awards over a weighted-average period of 1.20 years.
Changes in the Company’s restricted stock and restricted share units for the year ended December 31, 2017 were as follows:
Restricted Stock and Restricted Share Unit Activity | Restricted Stock and Restricted Share Units (in 000’s) | Weighted Average Grant-Date Fair Value | |||||
Restricted Stock and Restricted Share Units as of January 1, 2017 | 679 | $ | 52.44 | ||||
Restricted Share Units granted | 165 | 74.33 | |||||
Restricted Share Units vested | (152 | ) | 74.97 | ||||
Restricted Share Units forfeited | (18 | ) | 75.42 | ||||
Performance-based Restricted Share Units granted | 70 | 80.00 | |||||
Performance-based Restricted Share Units vested | (68 | ) | 61.16 | ||||
Performance-based Restricted Share Units forfeited | (6 | ) | 53.28 | ||||
Restricted Stock and Restricted Share Units as of December 31, 2017 | 670 | $ | 59.69 | ||||
Page 82
NOTES TO CONSOLIDATED FINANCIAL STATEMENTS
Note 13 – Segment Information
In accordance with ASC Topic 280, “Segment Reporting”, for purposes of segment performance measurement, the Company does not allocate to the business segments items that are of a non-operating nature, including charges which occur from time to time related to the Company’s asbestos liability and its legacy environmental liabilities, as such items are not related to current business activities; or corporate organizational and functional expenses of a governance nature. “Corporate expenses-before asbestos and environmental charges” consist of corporate office expenses including compensation, benefits, occupancy, depreciation, and other administrative costs. Assets of the business segments exclude general corporate assets, which principally consist of cash and cash equivalents, deferred tax assets, insurance receivables, certain property, plant and equipment, and certain other assets.
The accounting policies of the segments are the same as those described in the summary of significant accounting policies. The Company accounts for intersegment sales and transfers as if the sales or transfers were to third parties at current market prices.
The Company’s segments are reported on the same basis used internally for evaluating performance and for allocating resources. The Company has four reporting segments: Fluid Handling, Payment & Merchandising Technologies, Aerospace & Electronics and Engineered Materials.
A brief description of each of the Company's segments are as follows:
Fluid Handling
The Fluid Handling segment is a provider of highly engineered fluid handling equipment for critical performance applications that require high reliability. The segment is comprised of Process Valves and Related Products, Commercial Valves, and Other Products. Process Valves and Related Products include on/off valves and related products for critical and demanding applications in the chemical, oil & gas, power, and general industrial end markets globally. Commercial Valves includes the manufacturing and distribution of valves and related products for the non-residential construction, general industrial, and to a lesser extent, municipal markets. Other Products include pumps and related products primarily for water and wastewater applications in the industrial, municipal, commercial and military markets.
Payment & Merchandising Technologies
The Payment & Merchandising Technologies segment consists of Crane Payment Innovations, which provide high technology payment acceptance and dispensing products to original equipment manufacturers, including coin accepters and dispensers, coin hoppers, coin recyclers, bill validators and bill recyclers and, Merchandising Systems, which provide merchandising equipment, including include food, snack and beverage vending machines and vending machine software and online solutions.
Aerospace & Electronics
Aerospace & Electronics segment supplies critical components and systems, including original equipment and aftermarket parts, primarily for the commercial aerospace and military aerospace and defense markets.
Engineered Materials
Engineered Materials segment manufactures FRP panels and coils, primarily for use in the manufacturing of recreational vehicles, truck bodies and trailers (Transportation), with additional applications in commercial and industrial buildings (Building Products).
Page 83
NOTES TO CONSOLIDATED FINANCIAL STATEMENTS
Financial information by reportable segment is set forth below:
(in millions) December 31, | 2017 | 2016 | 2015 | |||||||||
Fluid Handling | ||||||||||||
Net sales | $ | 1,042.5 | $ | 999.5 | $ | 1,091.3 | ||||||
Operating profit | 111.8 | 119.5 | 125.4 | |||||||||
Assets | 941.6 | 845.9 | 888.0 | |||||||||
Goodwill | 245.4 | 212.3 | 218.7 | |||||||||
Capital expenditures | 14.7 | 10.3 | 10.0 | |||||||||
Depreciation and amortization | 16.2 | 10.8 | 12.6 | |||||||||
Payment & Merchandising Technologies | ||||||||||||
Net sales | $ | 776.7 | $ | 745.8 | $ | 703.0 | ||||||
Operating profit | 148.5 | 135.5 | 101.4 | |||||||||
Assets | 1,215.7 | 1,188.9 | 1,178.0 | |||||||||
Goodwill | 587.7 | 563.3 | 575.2 | |||||||||
Capital expenditures | 14.2 | 8.7 | 9.8 | |||||||||
Depreciation and amortization | 34.2 | 33.9 | 34.5 | |||||||||
Aerospace & Electronics | ||||||||||||
Net sales | $ | 691.4 | $ | 745.7 | $ | 691.3 | ||||||
Operating profit | 160.2 | 149.8 | 145.1 | |||||||||
Assets | 573.0 | 555.5 | 559.4 | |||||||||
Goodwill | 202.4 | 202.3 | 202.6 | |||||||||
Capital expenditures | 16.7 | 28.7 | 16.2 | |||||||||
Depreciation and amortization | 14.0 | 11.7 | 11.3 | |||||||||
Engineered Materials | ||||||||||||
Net sales | $ | 275.4 | $ | 257.0 | $ | 254.8 | ||||||
Operating profit | 49.5 | 49.0 | 48.4 | |||||||||
Assets | 220.8 | 224.7 | 227.6 | |||||||||
Goodwill | 171.4 | 171.3 | 171.4 | |||||||||
Capital expenditures | 3.1 | 3.5 | 3.3 | |||||||||
Depreciation and amortization | 6.7 | 6.1 | 6.2 | |||||||||
Page 84
NOTES TO CONSOLIDATED FINANCIAL STATEMENTS
Information by reportable segment (continued):
(in millions) December 31, | 2017 | 2016 | 2015 | |||||||||
TOTAL NET SALES | $ | 2,786.0 | $ | 2,748.0 | $ | 2,740.5 | ||||||
Operating profit (loss) | ||||||||||||
Reporting segments a | $ | 470.0 | $ | 453.8 | $ | 420.3 | ||||||
Corporate expense — before asbestos b | (68.1 | ) | (61.2 | ) | (47.5 | ) | ||||||
Corporate expense — asbestos | — | (192.4 | ) | — | ||||||||
TOTAL OPERATING PROFIT | $ | 401.9 | $ | 200.3 | $ | 372.9 | ||||||
Interest income | 2.5 | 1.9 | 1.9 | |||||||||
Interest expense | (36.1 | ) | (36.5 | ) | (37.6 | ) | ||||||
Miscellaneous — net | (0.8 | ) | (1.6 | ) | (0.7 | ) | ||||||
INCOME BEFORE INCOME TAXES | $ | 367.5 | $ | 164.1 | $ | 336.5 | ||||||
Assets | ||||||||||||
Reporting segments | $ | 2,951.1 | $ | 2,815.0 | $ | 2,853.0 | ||||||
Corporate | 642.4 | 613.0 | 483.9 | |||||||||
TOTAL ASSETS | $ | 3,593.5 | $ | 3,428.0 | $ | 3,336.9 | ||||||
Goodwill | ||||||||||||
Reporting segments | $ | 1,206.9 | $ | 1,149.2 | $ | 1,167.9 | ||||||
Capital expenditures | ||||||||||||
Reporting segments | $ | 48.7 | $ | 51.2 | $ | 39.3 | ||||||
Corporate | 0.3 | 0.3 | 0.3 | |||||||||
TOTAL CAPITAL EXPENDITURES | $ | 49.0 | $ | 51.5 | $ | 39.6 | ||||||
Depreciation and amortization | ||||||||||||
Reporting segments | $ | 71.1 | $ | 62.5 | $ | 64.6 | ||||||
Corporate | 1.6 | 4.9 | 2.4 | |||||||||
TOTAL DEPRECIATION AND AMORTIZATION | $ | 72.7 | $ | 67.4 | $ | 67.0 | ||||||
a Includes transaction related charges of $3.6 in 2017.
b Includes transaction related charges of $4.2 and a restructuring charge, net of gain on property sale of $13.0 in 2017 and charges of $5.0 for legal settlements in 2016.
Page 85
NOTES TO CONSOLIDATED FINANCIAL STATEMENTS
Information by geographic region:
(in millions) December 31, | 2017 | 2016 | 2015 | |||||||||
Net sales* | ||||||||||||
United States | $ | 1,767.3 | $ | 1,769.7 | $ | 1,698.6 | ||||||
Canada | 169.0 | 163.2 | 212.7 | |||||||||
United Kingdom | 388.2 | 357.6 | 350.9 | |||||||||
Continental Europe | 268.6 | 279.6 | 282.2 | |||||||||
Other international | 192.9 | 177.9 | 196.1 | |||||||||
TOTAL NET SALES | $ | 2,786.0 | $ | 2,748.0 | $ | 2,740.5 | ||||||
Assets* | ||||||||||||
United States | $ | 1,645.3 | $ | 1,609.4 | $ | 1,648.3 | ||||||
Canada | 170.0 | 159.8 | 160.8 | |||||||||
Europe | 702.9 | 588.0 | 599.2 | |||||||||
Other international | 432.9 | 457.8 | 444.7 | |||||||||
Corporate | 642.4 | 613.0 | 483.9 | |||||||||
TOTAL ASSETS | $ | 3,593.5 | $ | 3,428.0 | $ | 3,336.9 | ||||||
Tangible Assets* | ||||||||||||
United States | $ | 645.8 | $ | 621.3 | $ | 642.0 | ||||||
Canada | 115.8 | 109.0 | 111.5 | |||||||||
Europe | 436.6 | 357.9 | 335.7 | |||||||||
Other international | 269.2 | 292.4 | 278.8 | |||||||||
Corporate | 642.4 | 613.0 | 488.6 | |||||||||
TOTAL TANGIBLE ASSETS | $ | 2,109.8 | $ | 1,993.6 | $ | 1,856.6 | ||||||
* Net sales and assets by geographic region are based on the location of the business unit.
Page 86
NOTES TO CONSOLIDATED FINANCIAL STATEMENTS
The table below presents net sales by product line for each segment:
(in millions) December 31, | 2017 | 2016 | 2015 | |||||||||
Fluid Handling | ||||||||||||
Process Valves and Related Products | $ | 640.1 | $ | 619.2 | $ | 681.2 | ||||||
Commercial Valves | 310.1 | 290.9 | 316.5 | |||||||||
Other Products | 92.3 | 89.4 | 93.7 | |||||||||
Total Fluid Handling | $ | 1,042.5 | $ | 999.5 | $ | 1,091.3 | ||||||
Payment & Merchandising Technologies | ||||||||||||
Payment Acceptance and Dispensing Products | $ | 575.9 | $ | 511.8 | $ | 496.1 | ||||||
Merchandising Equipment | 200.8 | 234.0 | 207.0 | |||||||||
Total Payment & Merchandising Technologies | $ | 776.7 | $ | 745.8 | $ | 703.0 | ||||||
Aerospace & Electronics | ||||||||||||
Commercial Original Equipment | $ | 346.1 | $ | 354.9 | $ | 349.3 | ||||||
Military Original Equipment | 159.0 | 200.3 | 152.6 | |||||||||
Commercial Aftermarket Products | 134.0 | 132.8 | 132.1 | |||||||||
Military Aftermarket Products | 52.3 | 57.7 | 57.1 | |||||||||
Total Aerospace & Electronics | $ | 691.4 | $ | 745.7 | $ | 691.3 | ||||||
Engineered Materials | ||||||||||||
FRP - Recreational Vehicles | $ | 150.5 | $ | 131.2 | $ | 133.9 | ||||||
FRP - Building Products | 95.2 | 89.6 | 83.1 | |||||||||
FRP - Transportation | 29.7 | 36.2 | 37.8 | |||||||||
Total Engineered Materials | $ | 275.4 | $ | 257.0 | $ | 254.8 | ||||||
Total Net Sales | $ | 2,786.0 | $ | 2,748.0 | $ | 2,740.5 | ||||||
Page 87
NOTES TO CONSOLIDATED FINANCIAL STATEMENTS
Note 14 – Quarterly Results (Unaudited)
(in millions, except per share data) For year ended December 31, | First | Second | Third | Fourth | Year | |||||||||||||||
2017 | ||||||||||||||||||||
Net sales | $ | 673.4 | $ | 702.5 | $ | 695.9 | $ | 714.2 | $ | 2,786.0 | ||||||||||
Cost of sales | 429.5 | 444.3 | 441.5 | 455.6 | 1,770.9 | |||||||||||||||
Gross profit | 243.9 | 258.2 | 254.4 | 258.6 | 1,015.1 | |||||||||||||||
Operating profit | 96.6 | 109.0 | (a) | 105.4 | (c) | 90.9 | (e) | 401.9 | ||||||||||||
Net income (loss) attributable to common shareholders | 63.1 | 69.2 | (b) | 68.2 | (d) | (28.7 | ) | (f) | 171.8 | |||||||||||
Earnings (loss) per basic share | $ | 1.06 | $ | 1.16 | $ | 1.15 | $ | (0.48 | ) | $ | 2.89 | |||||||||
Earnings (loss) per diluted share | $ | 1.05 | $ | 1.14 | $ | 1.13 | $ | (0.48 | ) | $ | 2.84 | |||||||||
2016 | ||||||||||||||||||||
Net sales | $ | 660.0 | $ | 712.2 | $ | 694.2 | $ | 681.6 | $ | 2,748.0 | ||||||||||
Cost of sales | 426.1 | 449.1 | 449.2 | 433.9 | 1,758.3 | |||||||||||||||
Gross profit | 233.9 | 263.1 | 245.0 | 247.7 | 989.7 | |||||||||||||||
Operating profit | 85.5 | 102.6 | (g) | 103.8 | (91.6 | ) | (i) | 200.3 | ||||||||||||
Net income (loss) attributable to common shareholders | 55.0 | 68.2 | (h) | 63.5 | (63.9 | ) | (j) | 122.8 | ||||||||||||
Earnings (loss) per basic share | $ | 0.95 | $ | 1.17 | $ | 1.09 | $ | (1.11 | ) | $ | 2.10 | |||||||||
Earnings (loss) per diluted share | $ | 0.93 | $ | 1.15 | $ | 1.07 | $ | (1.08 | ) | $ | 2.07 | |||||||||
(a) | Includes $2.6 of transaction related charges |
(b) | Includes the impact of item (a) cited above, net of tax |
(c) | Includes $0.5 of transaction related charges |
(d) | Includes the impact of item (c) cited above, net of tax |
(e) | Includes $4.7 of transaction related charges |
(f) | Includes the impact of item (e) cited above, net of tax and an $87.1 million impact from a tax law change |
(g) | Includes a $5.0 legal settlement charge |
(h) | Includes the impact of item (g) cited above, net of tax |
(i) | Includes a $192.4 million asbestos provision |
(j) | Includes the impact of item (i) cited above, net of tax |
Page 88
NOTES TO CONSOLIDATED FINANCIAL STATEMENTS
Note 15 – Restructuring Charges
During the fourth quarter of 2017, the Company recorded a net pre-tax restructuring charge of $13.0 million associated with broad-based repositioning actions designed to improve profitability. These actions include headcount reductions of approximately 300 employees, or about 3% of the Company’s global workforce and select facility consolidations in North America and Europe. The charge included severance of $24.1 million related to the consolidation of certain manufacturing operations, all of which are cash costs.
The following table summarizes the restructuring charge by business segment:
(in millions) December 31, | Severance | ||
Fluid Handling | $ | 10.6 | |
Payment & Merchandising Technologies | 12.2 | ||
Aerospace & Electronics | 1.3 | ||
$ | 24.1 | ||
Related to the repositioning actions the Company recorded a pre-tax gain in the fourth quarter of 2017 of $11.1 million related to the sale of a facility in the Aerospace & Electronics segment.
To complete these actions, the Company expects to incur a total of $16.7 million of additional restructuring and facility consolidation related charges from 2018 to 2020 in each of the business segments as follows:
(in millions) December 31, | 2018 | 2019 | 2020 | Total | ||||||||
Fluid Handling | $ | 5.5 | $ | 4.6 | $ | 1.6 | $ | 11.7 | ||||
Payment & Merchandising Technologies | 4.5 | (3.2 | ) | — | 1.3 | |||||||
Aerospace & Electronics | 0.6 | 3.1 | — | 3.7 | ||||||||
$ | 10.6 | $ | 4.5 | $ | 1.6 | $ | 16.7 | |||||
The following table summarizes the expected costs by nature of costs and year:
(in millions) December 31, | 2018 | 2019 | 2020 | Total | ||||||||
Restructuring | $ | 3.3 | $ | (1.0 | ) | $ | — | $ | 2.3 | |||
Facility Consolidation | 7.3 | 5.5 | 1.6 | 14.4 | ||||||||
$ | 10.6 | $ | 4.5 | $ | 1.6 | $ | 16.7 | |||||
The Company expects recurring pre-tax savings subsequent to initiating all actions to approximate $30 million annually.
Page 89
NOTES TO CONSOLIDATED FINANCIAL STATEMENTS
Note 16 – Subsequent Events
Crane Currency Acquisition
On January 10, 2018, the Company completed the acquisition of Crane Currency. The base purchase price of the acquisition was $800 million on a cash-free, debt-free basis, subject to a later adjustment reflecting Crane Currency’s net working capital, cash, the assumption by Crane Co. of certain debt-like items, and Crane Currency’s transaction expenses. At the closing, the transitory subsidiary of Crane Co. merged with and into Crane Currency, with Crane Currency surviving as a wholly owned subsidiary of Crane Co. Crane Currency is a supplier of banknotes and highly engineered banknote security features which complements our existing portfolio of currency and payment products within the Payment and Merchandising Technologies segment. Acquisition-related costs are being expensed as incurred. For the year ended December 31, 2017, the Company recorded $4.2 million of transaction costs.
Due to the closing of this acquisition subsequent to the period end, the Company is currently determining the fair value of assets acquired and liabilities assumed necessary to develop the purchase price allocation. Therefore, disclosure of the purchase price allocation to the tangible and intangible assets acquired and liabilities assumed and supplemental pro forma information is not practicable. The pro forma revenue and earnings of the combined financial results will be included in our Form 10-Q for the fiscal quarter ended March 31, 2018.
Recent Financing Arrangements
On February 5, 2018, the Company completed a public offering of $350 million aggregate principal amount of 4.20% Senior Notes due 2048 (the "2048 Notes"). The 2048 Notes will bear interest at a rate of 4.20% per annum and mature on March 15, 2048. Interest will accrue on the Notes from February 5, 2018. Interest on the 2048 Notes is payable on March 15 and September 15 of each year, commencing on September 15, 2018. The 2048 Notes were issued under an indenture, dated as of February 5, 2018. The Indenture contains certain restrictions, including a limitation that restricts the Company’s ability and the ability of certain of its subsidiaries to create or incur secured indebtedness, enter into sale and leaseback transactions, and consolidate, merge or transfer all or substantially all of the Company’s assets and the assets of its subsidiaries. The Company used the net proceeds from the offering, together with cash on hand, to repay all of the $100 million outstanding under the 364-day Credit Agreement. The Company also issued a notice of redemption on February 7, 2018 with an effective date of March 7, 2018 for its 2.75% notes due in December 2018 with an outstanding principal value of $250 million.
Item 9. Changes in and Disagreements with Accountants on Accounting and Financial Disclosure
None
Item 9A. Controls and Procedures
Evaluation of Disclosure Controls and Procedures. The Company’s Chief Executive Officer and Principal Financial Officer evaluated the effectiveness of the design and operation of the Company’s disclosure controls and procedures as of the end of the year covered by this annual report. The Company’s disclosure controls and procedures are designed to ensure that information required to be disclosed by the Company in the reports that are filed or submitted under the Securities Exchange Act of 1934 is recorded, processed, summarized, and reported within the time periods specified in the Securities and Exchange Commission’s ("SEC") rules and forms and the information is accumulated and communicated to the Company’s Chief Executive Officer and Principal Financial Officer to allow timely decisions regarding required disclosure. Based on this evaluation, the Company’s Chief Executive Officer and Principal Financial Officer have concluded that these controls are effective as of the end of the year covered by this annual report.
Change in Internal Controls over Financial Reporting. During the fiscal quarter ended December 31, 2017, there have been no changes in the Company’s internal control over financial reporting, identified in connection with our evaluation thereof, that have materially affected, or are reasonably likely to materially affect, its internal control over financial reporting.
Design and Evaluation of Internal Control over Financial Reporting. Pursuant to Section 404 of the Sarbanes-Oxley Act of 2002, we included a report of our management’s assessment of the design and effectiveness of our internal controls as part of this Annual Report on Form 10-K for the year ended December 31, 2017. Our independent registered public accounting firm also attested to, and reported on, our management’s assessment of the effectiveness of internal control over financial reporting. Our management’s report and our independent registered public accounting firm’s attestation report are set forth in Part II, Item 8 of this Annual Report on Form 10-K under the captions entitled “Management’s Responsibility for Financial Reporting” and “Report of Independent Registered Public Accounting Firm.”
Page 90
REPORT OF INDEPENDENT REGISTERED PUBLIC ACCOUNTING FIRM
To the shareholders and the Board of Directors of Crane Co.
Opinion on Internal Control over Financial Reporting
We have audited the internal control over financial reporting of Crane Co. and subsidiaries (the “Company”) as of December 31, 2017, based on criteria established in Internal Control -Integrated Framework (2013) issued by the Committee of Sponsoring Organizations of the Treadway Commission (COSO). In our opinion, the Company maintained, in all material respects, effective internal control over financial reporting as of December 31, 2017, based on criteria established in Internal Control - Integrated Framework (2013) issued by COSO. We have also audited, in accordance with the standards of the Public Company Accounting Oversight Board (United States) (PCAOB), the consolidated financial statements as of and for the year ended December 31, 2017, of the Company and our report dated February 26, 2018, expressed an unqualified opinion on those financial statements.
Basis for Opinion
The Company’s management is responsible for maintaining effective internal control over financial reporting and for its assessment of the effectiveness of internal control over financial reporting, included in the accompanying “Management’s Responsibility for Financial Reporting” appearing in Item 8. Our responsibility is to express an opinion on the Company’s internal control over financial reporting based on our audit. We are a public accounting firm registered with the PCAOB and are required to be independent with respect to the Company in accordance with the U.S. federal securities laws and the applicable rules and regulations of the Securities and Exchange Commission and the PCAOB.
We conducted our audit in accordance with the standards of the PCAOB. Those standards require that we plan and perform the audit to obtain reasonable assurance about whether effective internal control over financial reporting was maintained in all material respects. Our audit included obtaining an understanding of internal control over financial reporting, assessing the risk that a material weakness exists, testing and evaluating the design and operating effectiveness of internal control based on the assessed risk, and performing such other procedures as we considered necessary in the circumstances. We believe that our audit provides a reasonable basis for our opinion.
Definition and Limitations of Internal Control over Financial Reporting
A company’s internal control over financial reporting is a process designed to provide reasonable assurance regarding the reliability of financial reporting and the preparation of financial statements for external purposes in accordance with generally accepted accounting principles. A company’s internal control over financial reporting includes those policies and procedures that (1) pertain to the maintenance of records that, in reasonable detail, accurately and fairly reflect the transactions and dispositions of the assets of the company; (2) provide reasonable assurance that transactions are recorded as necessary to permit preparation of financial statements in accordance with generally accepted accounting principles, and that receipts and expenditures of the company are being made only in accordance with authorizations of management and directors of the company; and (3) provide reasonable assurance regarding prevention or timely detection of unauthorized acquisition, use, or disposition of the company’s assets that could have a material effect on the financial statements.
Because of its inherent limitations, internal control over financial reporting may not prevent or detect misstatements. Also, projections of any evaluation of effectiveness to future periods are subject to the risk that controls may become inadequate because of changes in conditions, or that the degree of compliance with the policies or procedures may deteriorate.
/s/ Deloitte & Touche LLP
Stamford, CT
February 26, 2018
Page 91
Item 9B. Other Information
None
Part III
Item 10. Directors, Executive Officers and Corporate Governance
The information required by Item 10 is incorporated by reference to the definitive proxy statement with respect to the 2018 Annual Meeting of Shareholders which the Company expects to file with the Commission pursuant to Regulation l4A on or about March 15, 2018 except that such information with respect to Executive Officers of the Registrant is included, pursuant to Instruction 3, paragraph (b) of Item 401 of Regulation S-K, under Part I. The Company’s Corporate Governance Guidelines, the charters of its Management Organization and Compensation Committee, its Nominating and Governance Committee and its Audit Committee and its Code of Ethics are available at www.craneco.com/governance. The information on our website is not part of this report.
Item 11. Executive Compensation
The information required by Item 11 is incorporated by reference to the definitive proxy statement with respect to the 2018 Annual Meeting of Shareholders which the Company expects to file with the Commission pursuant to Regulation 14A on or about March 15, 2018.
Item 12. Security Ownership of Certain Beneficial Owners and Management and Related Stockholder Matters
Except the information required by Section 201(d) of Regulation S-K which is set forth below, the information required by Item 12 is incorporated by reference to the definitive proxy statement with respect to the 2018 Annual Meeting of Shareholders which the Company expects to file with the Commission pursuant to Regulation 14A on or about March 15, 2018.
As of December 31, 2017: | Number of securities to be issued upon exercise of outstanding options, warrants and rights | Weighted average exercise price of outstanding options | Number of securities remaining available for future issuance under equity compensation plans | |||||||
(a) | (b) | (c) | ||||||||
Equity compensation plans approved by security holders: | ||||||||||
2013 Stock Incentive Plan (and predecessor plans) | 3,623,918 | a | 56.45 | 3,877,388 | ||||||
Equity compensation plans not approved by security holders | — | — | — | |||||||
Total | 3,623,918 | $ | 56.45 | 3,877,388 | ||||||
a Includes 408,895 RSUs, 163,364 DSUs and 501,827 PRSUs, assuming the maximum potential payout percentage. Actual numbers of shares may vary, depending on actual performance. If the PRSUs included in this total vest at the target performance level as opposed to the maximum level, the aggregate awards outstanding would be 3,383,060. Column (b) does not take RSUs, PRSUs or DSUs into account because they do not have an exercise price.
Item 13. Certain Relationships and Related Transactions, and Director Independence
The information required by Item 13 is incorporated by reference to the definitive proxy statement with respect to the 2018 Annual Meeting of Shareholders which the Company expects to file with the Commission pursuant to Regulation 14A on or about March 15, 2018.
Item 14. Principal Accounting Fees and Services
The information required by Item 14 is incorporated by reference to the definitive proxy statement with respect to the 2018 Annual Meeting of Shareholders which the Company expects to file with the Commission pursuant to Regulation 14A on or about March 15, 2018.
Page 92
Item 15. Exhibits and Financial Statement Schedules
(a) Consolidated Financial Statements:
Page Number | |
Report of Independent Registered Public Accounting Firm | |
Consolidated Statements of Operations | |
Consolidated Statements of Comprehensive Income (Loss) | |
Consolidated Balance Sheets | |
Consolidated Statements of Cash Flows | |
Consolidated Statements of Changes in Equity | |
Notes to Consolidated Financial Statements | |
(b) Exhibits
Exhibit No. | Description | |
Exhibit 101.INS | XBRL Instance Document | |
Exhibit 101.SCH | XBRL Taxonomy Extension Schema Document | |
Exhibit 101.CAL | XBRL Taxonomy Calculation Linkbase Document | |
Exhibit 101.DEF | XBRL Taxonomy Extension Definition Linkbase Document | |
Exhibit 101.LAB | XBRL Taxonomy Label Linkbase Document | |
Exhibit 101.PRE | XBRL Taxonomy Presentation Linkbase Document | |
Exhibits to Form 10-K — Documents incorporated by reference:
(2) | Instruments Defining the Rights of Security Holders: |
(3) | Certificate of Incorporation and Bylaws: |
(4) | Instruments Defining the Rights of Security Holders: |
(10) | Material Contracts: |
Page 93
(iii) | Compensatory Plans |
(a) | |
(b) | |
(c) | |
(d) | |
(e) | |
(f) | |
(g) | |
(h) | |
(i) | |
(j) | |
(k) | |
(l) | |
(m) | |
(n) | |
(o) | |
(p) | |
(q) | |
Item 16. Form 10-K Summary
Not applicable.
Page 94
Part IV
Signatures
Pursuant to the requirements of Section l3 or l5 (d) of the Securities Exchange Act of l934, the registrant has duly caused this report to be signed on its behalf by the undersigned, thereunto duly authorized.
CRANE CO. (Registrant) |
By /s/ MAX H. MITCHELL |
Max H. Mitchell President, Chief Executive Officer and Director Date 2/26/2018 |
Pursuant to the requirements of the Securities Exchange Act of 1934, this report has been signed below by the following persons on behalf of the registrant and in the capacities and on the dates indicated.
Officers
/s/ MAX H. MITCHELL | /s/ RICHARD A. MAUE | /s/ RICHARD A. MAUE | ||||||||
Max H. Mitchell President, Chief Executive Officer and Director | Richard A. Maue Vice President - Finance Chief Financial Officer (Principal Financial Officer) | Richard A. Maue Vice President - Finance Chief Financial Officer (Principal Accounting Officer) | ||||||||
Date 2/26/2018 | Date 2/26/2018 | Date 2/26/2018 | ||||||||
Directors
/s/ R.S. EVANS | /s/ MARTIN R. BENANTE | /s/ E.THAYER BIGELOW | |||
R.S. Evans, Chairman of the Board | Martin R. Benante | E. Thayer Bigelow | |||
Date 2/26/2018 | Date 2/26/2018 | Date 2/26/2018 | |||
/s/ DONALD G. COOK | /s/ RONALD C. LINDSAY | /s/ PHILIP R. LOCHNER, JR. | |||
Donald G. Cook | Ronald C. Lindsay | Philip R. Lochner, Jr. | |||
Date 2/26/2018 | Date 2/26/2018 | Date 2/26/2018 | |||
/s/ ELLEN MCCLAIN | /s/ CHARLES G. MCCLURE, JR. | /s/ JENNIFER M. POLLINO | |||
Ellen McClain | Charles G. McClure, Jr. | Jennifer M. Pollino | |||
Date 2/26/2018 | Date 2/26/2018 | Date 2/26/2018 | |||
/s/ PETER O. SCANNELL | /s/ JAMES L.L. TULLIS | ||||
Peter O. Scannell | James L.L. Tullis | ||||
Date 2/26/2018 | Date 2/26/2018 | ||||
Page 95