UNITED STATES
SECURITIES AND EXCHANGE COMMISSION
Washington, D.C. 20549
_______________________________________________________________________
FORM 10-K
ANNUAL REPORT PURSUANT TO SECTION 13 OR 15(d) OF THE SECURITIES EXCHANGE ACT OF 1934 | |
For the fiscal year ended December 31, 2019
or
TRANSITION REPORT PURSUANT TO SECTION 13 OR 15(d) OF THE SECURITIES EXCHANGE ACT OF 1934 | |
For the transition period from to
Commission file number 001-11312
___________________________________________________
(Exact name of registrant as specified in its charter)
(State or other jurisdiction of incorporation or organization) | (I.R.S. Employer Identification No.) | ||||
(Address of principal executive offices) | (Zip Code) | ||||
(Registrant’s telephone number, including area code) | |||||
Securities registered pursuant to Section 12(b) of the Act:
Title of each class | Trading Symbol(s) | Name of Exchange on which registered |
___________________________________________________________
Indicate by check mark if the registrant is a well-known seasoned issuer, as defined in Rule 405 of the Securities Act. Yes ý No ¨
Indicate by check mark if the registrant is not required to file reports pursuant to Section 13 or Section 15(d) of the Exchange Act. Yes ¨ No ý
Indicate by check mark whether the registrant (1) has filed all reports required to be filed by Section 13 or 15(d) of the Securities Exchange Act of 1934 during the preceding 12 months (or for such shorter period that the registrant was required to file such reports), and (2) has been subject to such filing requirements for the past 90 days. Yes ý No ¨
Indicate by check mark whether the registrant has submitted electronically every Interactive Data File required to be submitted pursuant to Rule 405 of Regulation S-T (§232.405 of this chapter) during the preceding 12 months (or for such shorter period that the registrant was required to submit such files). Yes ý No ¨
Indicate by check mark whether the registrant is a large accelerated filer, an accelerated filer, a non-accelerated filer, a smaller reporting company, or an emerging growth company. See the definitions of “large accelerated filer,” “accelerated filer,” “smaller reporting company," and "emerging growth company" in Rule 12b-2 of the Exchange Act. (Check one):
ý | Accelerated filer | ☐ | |
Non-accelerated filer | ☐ (Do not check if a smaller reporting company) | Smaller reporting company | |
Emerging growth company | |||
If an emerging growth company, indicate by check mark if the registrant has elected not to use the extended transition period for complying with any new or revised financial accounting standards provided pursuant to Section 13(a) of the Exchange Act. ¨
Indicate by check mark whether the registrant is a shell company (as defined in Rule 12b-2 of the Exchange Act). Yes ☐ No ý
As of June 30, 2019, the aggregate market value of the common stock of Cousins Properties Incorporated held by non-affiliates was $5,333,335,006 based on the closing sales price as reported on the New York Stock Exchange. As of January 29, 2020, 146,766,272 shares of common stock were outstanding.
DOCUMENTS INCORPORATED BY REFERENCE
Table of Contents
PART I | ||
Item 1. | ||
Item 1A. | ||
Item 1B. | ||
Item 2. | ||
Item 3. | ||
Item 4. | ||
Item X. | ||
PART II | ||
Item 5. | ||
Item 6. | ||
Item 7. | ||
Item 7A. | ||
Item 8. | ||
Item 9. | ||
Item 9A. | ||
PART III | ||
Item 10. | ||
Item 11. | ||
Item 12. | ||
Item 13. | ||
Item 14. | ||
PART IV | ||
Item 15. | ||
FORWARD-LOOKING STATEMENTS
Certain matters contained in this report are “forward-looking statements” within the meaning of the federal securities laws and are subject to uncertainties and risks, as itemized herein. These forward-looking statements include information about possible or assumed future results of the business and our financial condition, liquidity, results of operations, plans, and objectives. They also include, among other things, statements regarding subjects that are forward-looking by their nature, such as:
• | guidance and underlying assumptions; |
• | business and financial strategy; |
•future debt financings;
•future acquisitions and dispositions of operating assets or joint venture interests;
•future acquisitions and dispositions of land, including ground leases;
•future development and redevelopment opportunities, including fee development opportunities;
•future issuances and repurchases of common stock;
•future distributions;
•projected capital expenditures;
•market and industry trends;
•entry into new markets;
•future changes in interest rates; and
• | all statements that address operating performance, events, or developments that we expect or anticipate will occur in the future — including statements relating to creating value for stockholders. |
Any forward-looking statements are based upon management's beliefs, assumptions, and expectations of our future performance, taking into account information that is currently available. These beliefs, assumptions, and expectations may change as a result of possible events or factors, not all of which are known. If a change occurs, our business, financial condition, liquidity, and results of operations may vary materially from those expressed in forward-looking statements. Actual results may vary from forward-looking statements due to, but not limited to, the following:
• | the availability and terms of capital; |
• | the ability to refinance or repay indebtedness as it matures; |
• | the failure of purchase, sale, or other contracts to ultimately close; |
• | the failure to achieve anticipated benefits from acquisitions, investments, or dispositions; |
• | the potential dilutive effect of common stock or operating partnership unit issuances; |
• | the availability of buyers and pricing with respect to the disposition of assets; |
• | changes in national and local economic conditions, the real estate industry, and the commercial real estate markets in which we operate (including supply and demand changes), particularly in Atlanta, Austin, Charlotte, Phoenix, Tampa, and Dallas where we have high concentrations of our lease revenues; |
• | changes to our strategy with regard to land and other non-core holdings that may require impairment losses to be recognized; |
• | leasing risks, including the ability to obtain new tenants or renew expiring tenants, the ability to lease newly developed and/or recently acquired space, the failure of a tenant to occupy leased space, and the risk of declining leasing rates; |
• | changes in the needs of our tenants brought about by the desire for co-working arrangements, trends toward utilizing less office space per employee, and the effect of telecommuting; |
• | the adverse change in the financial condition of one or more of our major tenants; |
• | volatility in interest rates and insurance rates; |
• | competition from other developers or investors; |
• | the risks associated with real estate developments (such as zoning approval, receipt of required permits, construction delays, cost overruns, and leasing risk); |
• | cyber security breaches; |
• | changes in senior management, changes in the Board of Directors, and the loss of key personnel; |
• | the potential liability for uninsured losses, condemnation, or environmental issues; |
• | the potential liability for a failure to meet regulatory requirements; |
• | the financial condition and liquidity of, or disputes with, joint venture partners; |
• | any failure to comply with debt covenants under credit agreements; |
• | any failure to continue to qualify for taxation as a real estate investment trust and meet regulatory requirements; |
• | potential changes to state, local, or federal regulations applicable to our business; |
• | material changes in the rates, or the ability to pay, dividends on common shares or other securities; |
• | potential changes to the tax laws impacting REITs and real estate in general; |
• | the ability to realize anticipated benefits of the merger with TIER REIT, Inc. ("TIER"); and |
• | those additional risks and factors discussed in reports filed with the Securities and Exchange Commission ("SEC") by the Company. |
The words “believes,” “expects,” “anticipates,” “estimates,” “plans,” “may,” “intend,” “will,” or similar expressions are intended to identify forward-looking statements. Although we believe that our plans, intentions, and expectations reflected in any forward-looking statements are reasonable, we can give no assurance that such plans, intentions, or expectations will be achieved. We undertake no obligation to publicly update or revise any forward-looking statement, whether as a result of future events, new information, or otherwise, except as required under U.S. federal securities laws.
PART I
Item 1. | Business |
Corporate Profile
Cousins Properties Incorporated (the “Registrant” or “Cousins”) is a Georgia corporation, which has elected to be taxed as a real estate investment trust (“REIT”). Cousins conducts substantially all of its business through Cousins Properties LP ("CPLP"), a Delaware limited partnership. Cousins owns approximately 99% of CPLP, and CPLP is consolidated with Cousins for financial reporting purposes. CPLP also owns Cousins TRS Services LLC ("CTRS"), a taxable entity which owns and manages its own real estate portfolio and performs certain real estate related services for other parties. Cousins, CPLP, their subsidiaries, and CTRS combined are hereafter referred to as “we,” “us,” “our,” and the “Company.” Our common stock trades on the New York Stock Exchange under the symbol “CUZ.”
Our operations are conducted through a number of segments based on our method of internal reporting, which classifies operations by property type and geographical area.
Company Strategy
Our strategy is to create value for our stockholders through ownership of the premier urban office portfolio in the Sunbelt markets of the United States, with a particular focus on Georgia, Texas, North Carolina, Arizona, and Florida. This strategy is based on a disciplined approach to capital allocation that includes value-add acquisitions, selective development projects, and timely dispositions of non-core assets. This strategy is also based on a simple, flexible, and low-leveraged balance sheet that allows us to pursue compelling growth opportunities at the most advantageous points in the cycle. To implement this strategy, we leverage our strong local operating platforms within each of our major markets.
2019 Activities
Our 2019 activities were highlighted by the merger with TIER REIT, Inc. ("TIER") on June 14, 2019 (the "Merger"). As a result of the Merger, we added nine operating office properties containing 5.8 million square feet of space, two office properties under development that are expected to add 620,000 square feet of space upon completion, and land parcels on which up to 2.5 million square feet of additional space may be developed. Strategically, we believe that the Merger created an unmatched portfolio of trophy office assets balanced across the premier Sunbelt markets. In addition, we believe that the Merger has enhanced our position in our existing markets of Austin and Charlotte, provided a strategic entry into Dallas, and balanced our exposure in Atlanta. The Merger is also expected to enhance growth and to provide value-add opportunities as a result of TIER's active and attractive development portfolio and land bank. As a part of this transaction, we issued $650 million in senior unsecured debt at a weighted average interest rate of 3.88%, which effectively replaced the majority of the TIER debt assumed and repaid in the Merger.
Immediately following the Merger, on June 14, 2019, we restated and amended our articles of incorporation to effect a reverse stock split of the issued and outstanding shares of our common stock pursuant to which, (1) each four shares of our issued and outstanding common stock were combined into one share of our common stock, and (2) the authorized number of our common stock was proportionally reduced to 175 million shares. Fractional shares of common stock resulting from the reverse stock split were settled in cash. Each four shares of our issued and outstanding preferred stock were combined into one share of our preferred stock; fractional shares of preferred stock were redeemed without payout. Immediately thereafter, we further amended our articles of incorporation to increase the number of authorized shares of our common stock from 175 million to 300 million shares.
In addition, during 2019 we engaged in other activities that were not directly related to the Merger. The following is a summary of these activities:
Investment Activity
• | Completed the development and commenced operations of Dimensional Place, a 281,000 square foot office building in the South End submarket of Charlotte, that is the East Coast headquarters of Dimensional Fund Advisors ("DFA"). The project was developed and is operated in a 50-50 joint venture with DFA. |
• | We purchased our partner's interest in Terminus Office Holdings LLC ("TOH") for $148 million in a transaction that valued Terminus 100 and Terminus 200 at $503 million, consolidated TOH, recorded the assets and liabilities at fair value, and recognized a gain of $92.8 million on this acquisition achieved in stages. |
• | Continued development of 10000 Avalon, a 251,000 square foot building in Atlanta, adjacent to our existing 8000 Avalon building. This project is being developed in a joint venture in which we hold a 90% interest, and the project is expected to begin operations in the first quarter of 2020. |
2
• | Continued development of Domain 12, a 320,000 square foot office building in Austin that was acquired in the Merger. This project is expected to begin operation in the second quarter of 2020. |
• | Continued development of Domain 10, a 300,000 square foot office building in Austin that was acquired in the Merger. This project is expected to begin operations in the fourth quarter of 2020. |
• | Continued development of 300 Colorado, a 358,000 square foot office building in downtown Austin. This project is being developed in a joint venture in which we hold a 50% interest, and is expected to begin operations in early 2021. |
• | Commenced development of 100 Mill, a 287,000 square foot office building in Tempe, Arizona. This project is expected to begin operations in early 2022. |
Portfolio Activity
• | Leased or renewed 3.1 million square feet of office space. |
• | Increased second generation net rent per square foot by 21.3% on a GAAP basis and 7.7% on a cash basis. |
• | Increased same property net operating income by 2.6% on a GAAP basis and 4.8% on a cash basis. |
Other Activity
• | Entered into a series of agreements and executed related transactions with Norfolk Southern Railway Company ("NS") in which we sold land to NS for $52.5 million, executed agreements to provide development and consulting services for NS's corporate headquarters for $37 million, and purchased 1200 Peachtree from NS for $82 million that is subject to a three-year lease with NS. |
• | Executed a 15-year, 561,000 square foot lease for the corporate headquarters of Truist Financial Corporation ("Truist") at Hearst Tower in Uptown Charlotte. The lease contained an option for Truist to purchase the building for $455.5 million. This option has been exercised by Truist and the sale is expected to close in March 2020. |
• | Sold air rights that cover eight acres in Downtown Atlanta for $13.25 million. |
• | Disposed of various non-core land holdings, including a 9-acre tract of land in Atlanta. |
Sustainability
We have been an advocate and practitioner of energy conservation measures and sustainability initiatives for many years, and we operate our business in a manner that seeks to advance energy efficiency and sustainability practices in every area of our Company. We pride ourselves on investing in trophy office buildings located in high-growth Sunbelt markets and managing these properties in a first-class manner while achieving outstanding operational efficiency. We are committed to developing and acquiring high quality assets, operating them responsibly, and seizing innovative opportunities wherever possible. In evaluating new acquisition opportunities, we focus carefully on the existing performance of the building in consumption of energy and water resources and the mitigation of resource consumption through recycling and other efforts. We also evaluate the opportunities for improvement in these areas on a near and long term basis. In addition, we carefully evaluate the proximity to transit options, with a strong preference for nearby bus and rail transit. When planning development projects, we take all of the foregoing into account, and we strive to design highly-sustainable buildings, generally taking advantage of the LEED and/or BOMA 360 certification process and designation. For us, sustainability means developing and maintaining durable buildings that are operated in an environmentally and socially responsible manner, thereby encouraging office users to select us for their corporate operations, while enhancing the communities in which our buildings are located. Over the long term, we believe properties that reflect these priorities will remain attractive to office users and investors, and as a result, we anticipate that this philosophy will continue to generate high-quality returns for our stockholders.
In the development and operation of our office buildings, we look to relevant industry standards for guidelines on energy performance and other measures. In particular, we are influenced by EnergyStar, LEED, and BOMA 360. As part of our pragmatic approach to sustainability, we carefully consider the guidelines and ratings when designing our new developments and improvements to existing office buildings, and we seek to include the guidelines or ratings where we believe adoption of the guidelines or receipt of ratings will have a positive effect on our operational excellence and resource consumption.
We maintain a report reflecting our corporate social responsibility practices (including sustainability), which is available on the Sustainability page of our website at www.cousins.com. Since 2016, we have participated in the Global Real Estate Sustainability Benchmark ("GRESB") Annual Survey, which measures the environmental performance of property portfolios around the world and is endorsed by many large institutional investors. In each of these GRESB Surveys, we received a rating of "Green Star," the highest rating within the Survey, with a total score each year above the GRESB overall participant average. Our scores have steadily improved since 2016. Since 2017, our total scores for each year have been above the GRESB average for the publicly listed office companies. In addition, in each of 2019, 2018, and 2017, we scored above our peer group in the GRESB Public Disclosure assessment, which GRESB has indicated is intended to represent an overall measure of disclosure
3
by listed real estate companies on matters related to the environment, social, and governance practices, based on a selection of indicators aligned with the GRESB Annual Sustainability Benchmark assessment. Our 2019 scores along with additional information on our sustainability and other corporate social responsibility initiatives is included under the caption “Sustainability and Corporate Responsibility" in the Proxy Statement relating to our 2020 Annual Meeting of Stockholders. Except for the documents specifically incorporated by reference into this Annual report on Form 10-K, information contained on our website or that can be accessed through our website is not incorporated by reference into this Annual Report on Form 10-K.
Environmental Matters
Our business operations are subject to various federal, state, and local environmental laws and regulations governing land, water, and wetlands resources. Among these are certain laws and regulations under which an owner or operator of real estate could become liable for the costs of removal or remediation of certain hazardous or toxic substances present on or in such property. Such laws often impose liability without regard to whether the owner knew of, or was responsible for, the presence of such hazardous or toxic substances. The presence of such substances, or the failure to properly remediate such substances, may subject the owner to substantial liability and may adversely affect the owner’s ability to develop the property or to borrow using such real estate as collateral.
We typically manage this potential liability through performance of Phase I Environmental Site Assessments and, as necessary, Phase II environmental sampling on properties we acquire or develop. Even with these assessments and testings, no assurance can be given that environmental liabilities do not exist, that the reports revealed all environmental liabilities, or that no prior owner created or permitted any material environmental condition not known to us. In certain situations, we have also sought to avail ourselves of legal and regulatory protections offered by federal and state authorities to prospective purchasers of property. Where applicable studies have resulted in the determination that remediation was required by applicable law, the necessary remediation is typically incorporated into the operational or development activity of the relevant property. We are not aware of any environmental liability that we believe would have a material adverse effect on our business, assets, or results of operations.
Certain environmental laws impose liability on a previous owner of a property to the extent that hazardous or toxic substances were present during the prior ownership period. A transfer of the property does not necessarily relieve an owner of such liability. Thus, although we are not aware of any such situation, we may have such liabilities on properties previously sold. We believe that we and our properties are in compliance in all material respects with applicable federal, state, and local laws, ordinances, and regulations governing the environment. For additional information, see Item 1A. Risk Factors - "Environmental issues."
Competition
We compete with other real estate owners with similar properties located in our markets and distinguish ourselves to tenants/buyers primarily on the basis of location, rental rates/sales prices, services provided, reputation, design and condition of our facilities, operational efficiencies, and availability of amenities. We also compete with other real estate companies, financial institutions, pension funds, partnerships, individual investors, and others when attempting to acquire and develop properties.
Executive Offices; Employees
Our executive offices are located at 3344 Peachtree Road NE, Suite 1800, Atlanta, Georgia 30326-4802. On December 31, 2019, we employed 331 people.
Available Information
We make available free of charge on the “Investor Relations” page of our website, www.cousins.com, our reports on Forms 10-K, 10-Q, and 8-K, and all amendments thereto, as soon as reasonably practicable after the reports are filed with, or furnished to, the Securities and Exchange Commission (the “SEC”).
Our Corporate Governance Guidelines, Director Independence Standards, Code of Business Conduct and Ethics, and the Charters of the Audit Committee, and the Compensation, Succession, Nominating and Governance Committee of the Board of Directors are also available on the “Investor Relations” page of our website. The information contained on our website is not incorporated herein by reference. Copies of these documents (without exhibits, when applicable) are also available free of charge upon request to us at 3344 Peachtree Road NE, Suite 1800, Atlanta, Georgia 30326-4802, Attention: Investor Relations or by telephone at (404) 407-1104 or by facsimile at (404) 407-1105. In addition, the SEC maintains a website that contains reports, proxy and information statements, and other information regarding issuers, including us, that file electronically with the SEC at www.sec.gov.
4
Item 1A. | Risk Factors |
Set forth below are the risks we believe investors should consider carefully in evaluating an investment in the securities of Cousins Properties Incorporated.
General Risks of Owning and Operating Real Estate
Our ownership of commercial real estate involves a number of risks, the effects of which could adversely affect our business.
General economic and market risks. In a general economic decline or recessionary climate, our commercial real estate assets may not generate sufficient cash to pay expenses, service debt, or cover operational, improvement, or maintenance costs, and, as a result, our results of operations and cash flows may be adversely affected. Factors that may adversely affect the economic performance and value of our properties include, among other things:
• | changes in the national, regional, and local economic climate; |
• | local real estate conditions such as an oversupply of rentable space caused by increased development of new properties or a reduction in demand for rentable space caused by a change in the wants and needs of our tenants or economic conditions making our locations undesirable; |
• | the attractiveness of our properties to tenants or buyers; |
• | competition from other available properties; |
• | changes in market rental rates and related concessions granted to tenants including, but not limited to, free rent, and tenant improvement allowances; |
• | uninsured losses as a result of casualty events; |
• | the need to periodically repair, renovate, and re-lease properties; and |
• | changes in federal and state income tax laws as they affect real estate companies and real estate investors. |
Uncertain economic conditions may adversely impact current tenants in our various markets and, accordingly, could affect their ability to pay rent owed to us pursuant to their leases. In periods of economic uncertainty, tenants are more likely to downsize and/or to declare bankruptcy; and, pursuant to various bankruptcy laws, leases may be rejected and thereby terminated. Furthermore, our ability to sell or lease our properties at favorable rates, or at all, may be negatively impacted by general or local economic conditions.
Our ability to collect rent from tenants may affect our ability to pay for adequate maintenance, insurance, and other operating costs (including real estate taxes). Also, the expense of owning and operating a property is not necessarily reduced when circumstances such as market factors cause a reduction in income from the property. If a property is mortgaged and we are unable to meet the mortgage payments, the lender could foreclose on the mortgage and take title to the property. In addition, interest rates, financing availability, law changes, and governmental regulations (including those governing usage, zoning, and taxes) may adversely affect our financial condition.
Impairment risks. We regularly review our real estate assets for impairment; and based on these reviews, we may record impairment losses that have an adverse effect on our results of operations. Negative or uncertain market and economic conditions, as well as market volatility, increase the likelihood of incurring impairment losses. If we decide to sell a real estate asset rather than holding it for long term investment or if we reduce our estimates of future cash flows on a real estate asset, the risk of impairment increases. The magnitude and frequency with which these charges occur could materially and adversely affect our business, financial condition, and results of operations.
Leasing risk. Our properties were 93.6% leased at December 31, 2019. Our operating revenues are dependent upon entering into leases with, and collecting rents from, our tenants. Tenants whose leases are expiring may want to decrease the space they lease and/or may be unwilling to continue their lease. When leases expire or are terminated, replacement tenants may not be available upon acceptable terms and market rental rates may be lower than the previous contractual rental rates. Also, our tenants may approach us for additional concessions in order to remain open and operating. The granting of these concessions may adversely affect our results of operations and cash flows to the extent that they result in reduced rental rates, additional capital improvements, or allowances paid to, or on behalf of, the tenants.
Tenant and property concentration risk. As of December 31, 2019, our top 20 tenants represented 32% of our annualized base rental revenues with no single tenant accounting for more than 6% of our annualized base rental revenues. The inability of any of our significant tenants to pay rent or a decision by a significant tenant to vacate their premises prior to, or at the conclusion
5
of, their lease term could have a significant negative impact on our results of operations or financial condition if a suitable replacement tenant is not secured in a timely manner.
For the three months ended December 31, 2019, 33.8% of our net operating income for properties owned was derived from the metropolitan Atlanta area, 23.2% was derived from the Austin area, and 16.9% was derived from the Charlotte area. Any adverse economic conditions impacting Atlanta, Austin, or Charlotte could adversely affect our overall results of operations and financial condition.
Uninsured losses and condemnation costs. Accidents, earthquakes, hurricanes, floods, terrorism incidents, and other losses at our properties could adversely affect our operating results. Casualties may occur that significantly damage an operating property or property under development, and insurance proceeds may be less than the total loss incurred by us. Although we, or our joint venture partners where applicable, maintain casualty insurance under policies we believe to be adequate and appropriate, including rent loss insurance on operating properties, some types of losses, such as those related to the termination of longer-term leases and other contracts, generally are not insured. Certain types of insurance may not be available or may be available on terms that could result in large uninsured losses, and insurers may not pay a claim as required under a policy. Property ownership also involves potential liability to third parties for such matters as personal injuries occurring on the property. Such losses may not be fully insured. In addition to uninsured losses, various government authorities may condemn all or parts of operating properties. Such condemnations could adversely affect the viability of such projects.
Environmental issues. Federal, state, and local laws and regulations relating to the protection of the environment may require a current or previous owner or operator of real estate to investigate and clean up hazardous or toxic substances or petroleum product released at a property. If determined to be liable, the owner or operator may have to pay a governmental entity or third parties for property damage and for investigation and clean-up costs incurred by such parties in connection with the contamination, or perform such investigation and clean-up itself. Although certain legal protections may be available to prospective purchasers of property, these laws typically impose clean-up responsibility and liability without regard to whether the owner or operator knew of or caused the presence of the regulated substances. Even if more than one person may have been responsible for the release of regulated substances at the property, each person covered by the environmental laws may be held responsible for all of the clean-up costs incurred. In addition, third parties may sue the owner or operator of a site for damages and costs resulting from regulated substances emanating from that site. We manage this risk through Phase I Environmental Site Assessments and, as necessary, Phase II environmental sampling on properties we acquire or develop.
We are not currently aware of any environmental liabilities at locations that we believe could have a material adverse effect on our business, assets, financial condition, or results of operations. Unidentified environmental liabilities could arise, however, and could have an adverse effect on our financial condition and results of operations.
Inquiries about indoor air quality may necessitate special investigation and, depending on the results, remediation beyond our regular indoor air quality testing and maintenance programs. Indoor air quality issues can stem from inadequate ventilation, chemical contaminants from indoor or outdoor sources, and biological contaminants such as molds, pollen, viruses, and bacteria. Indoor exposure to chemical or biological contaminants above certain levels can be alleged to be connected to allergic reactions or other health effects and symptoms in susceptible individuals. If these conditions were to occur at one of our properties, we may be subject to third-party claims for personal injury or may need to undertake a targeted remediation program, including without limitation, steps to increase indoor ventilation rates and eliminate sources of contaminants. Such remediation programs could be costly, necessitate the temporary relocation of some or all of the property’s tenants, or require rehabilitation of the affected property.
Sustainability strategies. Our sustainability strategy is to develop and maintain durable buildings that are operated in an environmentally and socially responsible manner, encouraging office users to select us for their corporate operations while enhancing the communities in which our buildings are located. Failure to develop and maintain sustainable buildings relative to our peers could adversely impact our ability to lease space at competitive rates and negatively impact our results of operations and portfolio attractiveness.
Climate change risks. The physical effects of climate change could have a material adverse effect on our properties, operations, and business. To the extent climate change causes changes in weather patterns, our markets could experience increases in storm intensity, rising sea-levels, and changes in precipitation, temperature, and air quality. Over time, these conditions could result in physical damage to, or declining demand for, our properties or our inability to operate the buildings at all. Climate change may also indirectly affect our business by increasing the cost of (or making unavailable) property insurance on terms we find acceptable, increasing the cost of energy, and increasing the risk of flood at our properties. Should the impact of climate change be severe or occur for lengthy periods of time, our financial condition or results of operations could be adversely affected.
6
Risks associated with the development of mixed-use commercial properties. We operate, are currently developing, and may in the future develop properties, either alone or through joint ventures, that are known as "mixed-use" developments. This means that, in addition to the development of office space, the project may also include space for retail, residential, or other commercial purposes. We do not have as much experience in developing and managing non-office real estate as we do office real estate and, as a result, we may seek to develop the non-office component ourselves, sell the right to that component to a third-party developer, or we may partner with a third party who has more non-office real estate experience. If we do choose to develop the other component ourselves, we would be exposed not only to those risks typically associated with the development of commercial real estate generally, but also to specific risks associated with the development and ownership of non-office real estate. In addition, even if we sell the rights to develop the other component or elect to participate in the development through a joint venture, we may be exposed to the risks associated with the failure of the other party to complete the development as expected. These include the risk that the other party would default on its obligations necessitating that we complete the other component ourselves, including potential financing of the project. If we decide not to sell or participate in a joint venture and instead hire a third party manager, we would be dependent on them and their key personnel to provide services to us and we may not find a suitable replacement if the management agreement is terminated, or if key personnel leave or otherwise become unavailable to us.
Joint venture structure risks. We hold ownership interests in a number of joint ventures with varying structures and may in the future invest in real estate through such structures. Our venture partners may have rights to take actions over which we have no control, or the right to withhold approval of actions that we propose, either of which could adversely affect our interests in the related joint ventures, and in some cases, our overall financial condition and results of operations. These structures involve participation by other parties whose interests and rights may not be the same as ours. For example, a venture partner may have economic and/or other business interests or goals which are incompatible with our business interests or goals and that venture partner may be in a position to take action contrary to our interests. In addition, such venture partners may default on their obligations, which could have an adverse impact on the financial condition and operations of the joint venture. Such defaults may result in our fulfilling their obligations that may, in some cases, require us to contribute additional capital to the ventures. Furthermore, the success of a project may be dependent upon the expertise, business judgment, diligence, and effectiveness of our venture partners in matters that are outside our control. Thus, the involvement of venture partners could adversely impact the development, operation, ownership, financing, or disposition of the underlying properties.
Title insurance risk. We did not acquire new title insurance policies in connection with the mergers with Parkway Properties, Inc. ("Parkway") in 2016 and with TIER in 2019, instead relying on existing policies benefiting those entities' subsidiaries. We generally do acquire title insurance policies for all developed and acquired properties; however, these policies may be for amounts less than the current or future values of the covered properties. If there were a title defect related to any of these properties, or to any of the properties acquired in connection with the mergers with Parkway and TIER where title insurance policies are ruled unenforceable, we could lose both our capital invested in and our anticipated profits from such property.
Liquidity risk. Real estate investments are relatively illiquid and can be difficult to sell and convert to cash quickly. As a result, our ability to sell one or more of our properties, whether in response to any changes in economic or other conditions or in response to a change in strategy, may be limited. In the event we want to sell a property, we may not be able to do so in the desired time period, the sales price of the property may not meet our expectations or requirements, and/or we may be required to record an impairment loss on the property as a result.
Ground lease risks. As of December 31, 2019, we had interests in thirteen land parcels in various markets which we lease individually on a long-term basis. As of December 31, 2019, we had 2.3 million aggregate rentable square feet of rental space located on these leased parcels, from which we recognized 11.2% of total Net Operating Income ("NOI") in the fourth quarter of 2019. In the future, we may invest in additional properties on some of these parcels or additional parcels subject to ground leases. Many of these ground leases and other restrictive agreements impose significant limitations on our uses of the subject property, restrict our ability to sell or otherwise transfer our interests in the property, or restrict our use of the property. These restrictions may limit our ability to timely sell or exchange the property, impair the property's value, or negatively impact our ability to find suitable tenants for the property. In addition, if we default under the terms of any particular lease, we may lose the ownership rights to the property subject to the lease. Upon expiration of a lease, we may not be able to renegotiate a new lease on favorable terms, if at all. The loss of the ownership rights to these properties or an increase of rental expense could have an adverse effect on our financial condition and results.
Compliance or failure to comply with the Americans with Disabilities Act or other federal, state, and local regulatory requirements could result in substantial costs.
The Americans with Disabilities Act generally requires that certain buildings, including office buildings, be made accessible to disabled persons. Noncompliance could result in the imposition of fines by the federal government or the award of damages to private litigants. If, under the Americans with Disabilities Act, we are required to make substantial alterations and capital
7
expenditures in one or more of our properties, including the removal of access barriers, it could adversely impact our earnings and cash flows, thereby impacting our ability to service debt and make distributions to our stockholders.
Our properties are subject to various federal, state, and local regulatory requirements, such as state and local fire, health, and life safety requirements. If we fail to comply with these requirements, we could incur fines or other monetary damages. We do not know whether existing requirements will change or whether compliance with future requirements will require significant unanticipated expenditures that will affect our cash flow and results of operations.
Financing Risks
At certain times, interest rates and other market conditions for obtaining capital are unfavorable, and, as a result, we may be unable to raise the capital needed to invest in acquisition or development opportunities, maintain our properties, or otherwise satisfy our commitments on a timely basis, or we may be forced to raise capital at a higher cost or under restrictive terms, which could adversely affect returns on our investments, our cash flows, and results of operations.
We generally finance our acquisition and development projects through one or more of the following: our Credit Facility, unsecured debt, non-recourse mortgages, construction loans, the sale of assets, joint venture equity, the issuance of common stock, the issuance of preferred stock, and the issuance of units of CPLP. Each of these sources may be constrained from time to time because of market conditions, and the related cost of raising this capital may be unfavorable at any given point in time. These sources of capital, and the risks associated with each, include the following:
• | Credit Facility. Terms and conditions available in the marketplace for unsecured credit facilities vary over time. We can provide no assurance that the amount we need from our Credit Facility will be available at any given time, or at all, or that the rates and fees charged by the lenders will be reasonable. We incur interest under our Credit Facility at a variable rate. Variable rate debt creates higher debt service requirements if market interest rates increase, which would adversely affect our cash flow and results of operations. Our Credit Facility contains customary restrictions, requirements, and other limitations on our ability to incur indebtedness, including restrictions on unsecured debt outstanding, restrictions on secured recourse debt outstanding, and requirements to maintain a minimum fixed charge coverage ratio. Our continued ability to borrow under our Credit Facility is subject to compliance with these covenants. |
• | Unsecured Debt. Terms and conditions available in the marketplace for unsecured debt vary over time. The availability of unsecured debt may vary based on the capital markets and capital market activity. Unsecured debt generally contains restrictive covenants that may place limitations on our ability to conduct our business similar to those placed upon us by our Credit Facility. |
• | Non-recourse mortgages. The availability of non-recourse mortgages is dependent upon various conditions, including the willingness of mortgage lenders to lend at any given point in time. Interest rates and loan-to-value ratios may also be volatile, and we may from time to time elect not to proceed with mortgage financing due to unfavorable terms offered by lenders. If a property is mortgaged to secure payment of indebtedness and we are unable to make the mortgage payments, the lender may foreclose. Further, at the time a mortgage matures, the property may be worth less than the mortgage amount and, as a result, we may determine not to refinance the mortgage and permit foreclosure, potentially generating defaults on other debt. |
• | Asset sales. Real estate markets tend to experience market cycles. Because of such cycles, the potential terms and conditions of sales, including prices, may be unfavorable for extended periods of time. In addition, our status as a REIT can limit our ability to sell properties, which may affect our ability to liquidate an investment. As a result, our ability to raise capital through asset sales could be limited. In addition, mortgage financing on an asset may prohibit prepayment and/or impose a prepayment penalty upon the sale of that property, which may decrease the proceeds from a sale or make the sale impractical. |
• | Construction loans. Construction loans generally relate to specific assets under construction and fund costs above an initial equity amount deemed acceptable by the lender. Terms and conditions of construction loans vary, but they generally carry a term of two to five years, charge interest at variable rates, require the lender to be satisfied with the nature and amount of construction costs prior to funding, and require the lender to be satisfied with the level of pre-leasing prior to funding. Construction loans can require a portion of the loan to be recourse to us. In addition, construction loans generally require a completion guarantee by the borrower and may require a limited payment guarantee from the Company which may be disproportionate to any guaranty required from a joint venture partner. There may be times when construction loans are not available, or are only available upon unfavorable terms, which could have an adverse effect on our ability to fund development projects or on our ability to achieve the returns we expect. |
8
• | Joint ventures. Joint ventures, including partnerships or limited liability companies, tend to be complex arrangements, and there are only a limited number of parties willing to undertake such investment structures. There is no guarantee that we will be able to undertake these ventures at the times we need capital and at favorable terms. |
• | Common stock. Common stock issuances may have a dilutive effect on our earnings per share and funds from operations per share. The actual amount of dilution, if any, from any future offering of common stock will be based on numerous factors, particularly the use of proceeds and any return generated from these proceeds. The per share trading price of our common stock could decline as a result of the sale of shares of our common stock in the market in connection with an offering, or as a result of the perception or expectation that such sales could occur. We can also provide no assurance that conditions will be favorable for future issuances of common stock when we need capital. |
• | Preferred stock. The availability of preferred stock at favorable terms and conditions is dependent upon a number of factors including the general condition of the economy, the overall interest rate environment, the condition of the capital markets, and the demand for this product by potential holders of the securities. Issuance of preferred stock could be dilutive to earnings per share and have an adverse effect on the trading price of common stock. We can provide no assurance that conditions will be favorable for future issuances of preferred stock when we need the capital, which could have an adverse effect on our ability to fund acquisition and development activities. |
• | Operating partnership units. The issuance of units of CPLP in connection with property, portfolio, or business acquisitions could be dilutive to our earnings per share and could have an adverse effect on the per share trading price of our common stock. |
Any additional indebtedness incurred may have a material adverse effect on our financial condition and results of operations.
As of December 31, 2019, we had $2.2 billion of outstanding indebtedness. The incurrence of additional indebtedness could have adverse consequences on our business, such as:
• | requiring us to use a substantial portion of our cash flow from operations to service our indebtedness, which would reduce the available cash flow to fund working capital, capital expenditures, development projects, distributions, and other general corporate purposes; |
• | limiting our ability to obtain additional financing to fund our working capital needs, acquisitions, capital expenditures, or other debt service requirements or for other purposes; |
• | increasing our exposure to floating interest rates; |
• | limiting our ability to compete with other companies who have less leverage, as we may be less capable of responding to adverse economic and industry conditions; |
• | restricting us from making strategic acquisitions, developing properties, or capitalizing on business opportunities; |
• | restricting the way in which we conduct our business due to financial and operating covenants in the agreements governing our existing and future indebtedness; |
• | exposing us to potential events of default (if not cured or waived) under covenants contained in our debt instruments; |
• | increasing our vulnerability to a downturn in general economic conditions; and |
• | limiting our ability to react to changing market conditions in our industry. |
The impact of any of these potential adverse consequences could have a material adverse effect on our results of operations, financial condition, and liquidity.
Covenants contained in our Credit Facility, senior unsecured notes, term loans, and mortgages could restrict our operational flexibility, which could adversely affect our results of operations.
Our Credit Facility, senior unsecured notes, and our unsecured term loan impose financial and operating restrictions on us. These restrictions may be modified from time to time, but restrictions of this type include limitations on our ability to incur debt, as well as limitations on the amount of our secured debt, unsecured debt, and on the amount of joint venture activity in which we may engage. These covenants may limit our flexibility in making business decisions. If we fail to comply with these covenants, our ability to borrow may be impaired, which could potentially make it more difficult to fund our capital and operating needs. Our failure to comply with such covenants could cause a default, and we may then be required to repay our outstanding debt with capital from other sources. Under those circumstances, other sources of capital may not be available to us or may be available only on unattractive terms, which could materially and adversely affect our financial condition and results of operations.
9
In addition, the cross default provisions on the Credit Facility, senior unsecured notes, and term loan may affect business decisions on other debt.
Some of our mortgages contain customary negative covenants, including limitations on our ability, without the lender’s prior consent, to further mortgage that specific property, to enter into new leases, to modify existing leases, or to redevelop or sell the property. Compliance with these covenants and requirements could harm our operational flexibility and financial condition.
Our degree of leverage could limit our ability to obtain additional financing or affect the market price of our securities.
Net debt as a percentage of either total asset value or total market capitalization and net debt as a multiple of annualized EBITDA is often used by analysts to gauge the financial health of equity REITs like us. If our degree of leverage is viewed unfavorably by lenders or potential joint venture partners, it could affect our ability to obtain additional financing. In general, our degree of leverage could also make us more vulnerable to a downturn in business or the economy. In addition, increases in our net debt to market capitalization ratio, which is in part a function of our stock price, or to other measures of asset value used by financial analysts may have an adverse effect on the market price of common stock.
Changes in, or a discontinuation of, LIBOR could have an adverse impact on operations.
Changes in, or a discontinuation of, LIBOR would cause changes in how interest is calculated on our variable rate debt including our Credit Facility and term loan. All of our variable rate debt has provisions allowing for interest to be calculated based off of rates other than LIBOR. These alternative rates could be higher than LIBOR causing an increase in interest expense and negative impact on operations.
Real Estate Acquisition and Development Risks
We face risks associated with operating property acquisitions.
Operating property acquisitions contain inherent risks. These risks may include:
• | difficulty in leasing vacant space or renewing existing tenants at the acquired property; |
• | the costs and timing of repositioning or redeveloping acquisitions; |
• | the acquisitions may fail to meet internal projections or otherwise fail to perform as expected; |
• | the acquisitions may be in markets that are unfamiliar to us and could present unforeseen business challenges; |
• | the timing of acquisitions may not match the timing of dispositions, leading to periods of time where proceeds are not invested as profitably as we desire or where we increase short-term borrowings until sales proceeds become available; |
• | the inability to obtain financing for acquisitions on favorable terms, or at all; |
• | the inability to successfully integrate the operations, maintain consistent standards, controls, policies, and procedures, or realize the anticipated benefits of acquisitions within the anticipated time frames, or at all; |
• | the inability to effectively monitor and manage our expanded portfolio of properties, retain key employees, or attract highly qualified new employees; |
• | the possible decline in value of the acquired asset; |
• | the diversion of our management’s attention away from other business concerns; and |
• | the exposure to any undisclosed or unknown issues, expenses, or potential liabilities relating to acquisitions. |
In addition, we may acquire properties subject to liabilities with no, or limited, recourse against the prior owners or other third parties. As a result, if a liability were asserted against us based upon ownership of those properties, we might have to pay substantial sums to settle or contest it, which might not be fully covered by owner's title insurance policies or other insurance policies.
Any of these risks could cause a failure to realize the intended benefits of our acquisitions and could have a material adverse effect on our financial condition, results of operations, and the market price of our common stock.
We face risks associated with the development of real estate.
Development activities contain certain inherent risks. Although we seek to minimize risks from development through various management controls and procedures, development risks cannot be eliminated. Some of the key factors affecting development of property are as follows:
10
• | Abandoned predevelopment costs. The development process inherently requires that a large number of opportunities be pursued with only a few actually being developed. We may incur significant costs for predevelopment activity for projects that are abandoned, which would directly affect our results of operations. For projects that are abandoned, we must expense certain costs, such as salaries, that would have otherwise been capitalized. We have procedures and controls in place that are intended to minimize this risk, but it is likely that we will incur predevelopment expense on abandoned projects on an ongoing basis. |
• | Project costs. Construction and leasing of a project involves a variety of costs that cannot always be identified at the beginning of a project. Costs may arise that have not been anticipated or actual costs may exceed estimated costs. These additional costs can be significant and could adversely impact our return on a project and the expected results of operations upon completion of the project. Also, construction costs vary over time based upon many factors, including the cost of labor and building materials. We attempt to mitigate the risk of unanticipated increases in construction costs on our development projects through guaranteed maximum price contracts and pre-ordering of certain materials, but we may be adversely affected by increased construction costs on our current and future projects. |
• | Construction delays. Real estate development carries the risk that a project could be delayed due to a number of issues that may arise including, but not limited to, weather and other forces of nature, availability of materials, availability of skilled labor, and the financial health of general contractors or sub-contractors. Construction delays could cause adverse financial impacts to us which could include higher interest and other carrying costs than originally budgeted, monetary penalties from tenants pursuant to their leases, and higher construction costs. Delays could also result in a violation of terms of construction loans that could increase fees, interest, or trigger additional recourse of a construction loan to us. |
• | Leasing risk. The success of a commercial real estate development project is heavily dependent upon entering into leases with acceptable terms within a predefined lease-up period. Although our policy is generally to achieve certain pre-leasing goals (which vary by market, product type, and circumstances) before committing to a project, it is expected that sometimes not all the space in a project will be leased at the time we commit to the project. If the additional space is not leased on schedule and upon the expected terms and conditions, our returns, future earnings, and results of operations from the project could be adversely impacted. Whether or not tenants are willing to enter into leases on the terms and conditions we project and on the timetable we expect will depend upon a number of factors, many of which are outside our control. These factors may include: |
• | general business conditions in the local or broader economy or in the prospective tenants’ industries; |
• | supply and demand conditions for space in the marketplace; and |
• | level of competition in the marketplace. |
• | Reputation risks. We have historically developed and managed a significant portion of our real estate portfolio and believe that we have built a positive reputation for quality and service with our lenders, joint venture partners, and tenants. If we developed under-performing properties, suffered sustained losses on our investments, defaulted on a significant level of loans or experienced significant foreclosure or deed in lieu of foreclosure of our properties, our reputation could be damaged. Damage to our reputation could make it more difficult to successfully develop properties in the future and to continue to grow and expand our relationships with our lenders, joint venture partners, and tenants, which could adversely affect our business, financial condition, and results of operations. |
• | Governmental approvals. All necessary zoning, land-use, building, occupancy, and other required governmental permits and authorization may not be obtained, may only be obtained subject to onerous conditions, or may not be obtained on a timely basis resulting in possible delays, decreased profitability, and increased management time and attention. |
• | Competition. We compete for tenants in our Sunbelt markets by highlighting our locations, rental rates, services, amenities, reputation, and the design and condition of our facilities including operational efficiencies and sustainability improvements. As the competition for tenants is intense, we may be required to provide rent abatements, incur charges for tenant improvements and other concessions, or we may not be able to lease vacant space in a timely manner. |
We may be unable to integrate the business of TIER successfully and realize the related benefits, or do so within the anticipated time frame.
The ongoing integration of the TIER business into our own will require significant management and resources. We
11
may encounter difficulties in the integration process, or in realizing any of the expected benefits from the Merger, including the following:
• | lost sales and tenants as a result of certain tenants deciding not to do business with us; |
• | the complexities associated with integrating personnel; |
• | the additional complexities of combining two companies with different histories, cultures, regulatory restrictions, markets, and customer bases; |
• | our failure to retain key employees; |
• | potential unknown liabilities and unforeseen increased expenses, delays, or regulatory conditions associated with the Merger; and |
• | performance shortfalls as a result of the diversion of management's attention caused by completing the Merger. |
For all these reasons, it is possible that the integration process could result in the distraction of our management, the disruption or our ongoing business, or inconsistencies in our services, standards, controls, procedures and policies, any of which could adversely affect our ability to maintain relationships with tenants, customers, vendors, and employees.
As a result of the Merger, the composition of our Board of Directors has changed.
Concurrent with the closing of the Merger, the Board of Directors has changed and currently consists of ten members, eight of which served on our Board of Directors prior to the Merger and two of which served on TIER's Board of Directors prior to the Merger. Our success is dependent on our Board of Directors' experience, skills, and ability to work together and with our management team to implement a successful strategy. If our Board of Directors is not successful, our ability to execute our business strategy could be adversely affected.
Our future results will suffer if we do not effectively manage our operations following the Merger.
Following the Merger, we may continue to expand our operations through additional acquisitions, development opportunities, and other strategic transactions, some of which involve complex challenges. Our future success will depend, in part, upon our ability to manage our expansion opportunities. This poses substantial challenges for us to integrate new operations into our existing business in an efficient and timely manner; and to monitor successfully our operations, costs, regulatory compliance, and service quality; and to maintain other necessary internal controls. We cannot assure you that our expansion or acquisition opportunities will be successful, or that they will realize their expected operating efficiencies, cost savings, revenue enhancements, synergies, or other benefits.
General Business Risks
We are dependent upon the services of certain key personnel, including members of the Board of Directors, the loss of any of whom could adversely impact our ability to execute our business.
One of our objectives is to develop and maintain a strong management group at all levels. At any given time, we could lose the services of key executives, members of the Board of Directors, and other employees. None of our Board members, key executives, or other employees are subject to employment contracts. Further, we do not carry key person insurance on any of our executive officers or other key employees. The loss of services of any of these key persons could have an adverse effect upon our results of operations, financial condition, and our ability to execute our business strategy.
Employee misconduct or misconduct by members of the Board of Directors could adversely impact our ability to execute our business.
Our reputation is critical to maintaining and developing relationships with tenants, vendors, and investors and there is a risk that our employees or members of the Board of Directors could engage, deliberately or recklessly, in misconduct that creates legal exposure for us and adversely impacts our business. Employees or members of the Board becoming subject to allegations of illegal activity, sexual harassment, or racial and gender discrimination, regardless of the outcome, could result in adverse publicity that could harm our reputation and brand. The loss of reputation could impact our ability to develop and manage relationships with tenants, vendors, and investors and have an adverse impact on the price of our common stock.
Our restated and amended articles of incorporation contain limitations on ownership of our stock, which may prevent a change in control that might otherwise be in the best interest of our stockholders.
Our restated and amended articles of incorporation impose limitations on the ownership of our stock. In general, except for certain individuals who owned stock at the time of adoption of these limitations, and except for persons or organizations that
12
are granted waivers by our Board of Directors, no individual or entity may own more than 3.9% of the value of our outstanding stock. We provide waivers to this limitation on a case by case basis, which could result in increased voting control by a shareholder. The ownership limitation may have the effect of delaying, inhibiting, or preventing a transaction or a change in control that might involve a premium price for our stock or otherwise be in the best interest of our stockholders.
The market price of our common stock may fluctuate.
The market prices of shares of our common stock have been, and may continue to be, subject to fluctuation due to many events and factors such as those described in this report including:
• | actual or anticipated variations in our operating results, funds from operations, or liquidity; |
• | the general reputation of real estate as an attractive investment in comparison to other equity securities and/or the reputation of the product types of our assets compared to other sectors of the real estate industry; |
• | material changes in any significant tenant industry concentration; |
• | material changes in market concentrations, |
• | the general stock and bond market conditions, including changes in interest rates or fixed income securities; |
• | changes in tax laws; |
• | changes to our dividend policy; |
• | changes in market valuations of our properties; |
• | adverse market reaction to the amount of our outstanding debt at any time, the amount of our maturing debt, and our ability to refinance such debt on favorable terms; |
• | any failure to comply with existing debt covenants; |
• | any foreclosure or deed in lieu of foreclosure of our properties; |
• | additions or departures of directors, key executives, and other employees; |
• | actions by institutional stockholders; |
• | uncertainties in world financial markets; |
• | the realization of any of the other risk factors described in this report; and |
• | general market and economic conditions; in particular, market and economic conditions of Atlanta, Charlotte, Austin, Phoenix, Tampa, and Dallas. |
Many of the factors listed above are beyond our control. Those factors may cause market prices of shares of our common stock to decline, regardless of our financial performance, condition, and prospects. The market price of shares of our common stock may fall significantly in the future, and it may be difficult for our stockholders to resell our common stock at prices they find attractive.
If our future operating performance does not meet the projections of our analysts or investors, our stock price could decline.
Securities analysts publish quarterly and annual projections of our financial performance. These projections are developed independently based on their own analyses, and we undertake no obligation to monitor, and take no responsibility for, such projections. Such estimates are inherently subject to uncertainty and should not be relied upon as being indicative of the performance that we anticipate for any applicable period. Our actual revenues, net income, and funds from operations may differ materially from what is projected by securities analysts. If our actual results do not meet analysts’ guidance, our stock price could decline significantly.
We face risks associated with security breaches through cyber attacks, cyber intrusions, or otherwise, as well as other significant disruptions of our information technology (IT) networks and related systems.
We face risks associated with security breaches or disruptions, whether through cyber attacks or cyber intrusions over the internet, malware, computer viruses, attachments to emails, persons inside our organization, persons with access to systems inside our organization, and other significant disruptions of our IT networks and related systems. The risk of a security breach or disruption, particularly through cyber attacks or cyber intrusion, including by computer hackers, foreign governments, and cyber terrorists, has generally increased as the number, intensity, and sophistication of attempted attacks and intrusions from around the world have increased. Our IT networks and related systems are essential to the operation of our business and our ability to perform day-to-day operations (including managing our building systems) and, in some cases, may be critical to the operations of certain of our tenants. While, to date, we have not had a significant cyber breach or attack that had a material impact on our business or results of operations, there can be no assurance that our efforts to maintain the security and integrity
13
of these types of IT networks and related systems will be effective or that attempted security breaches or disruptions would not be successful or damaging. A security breach or other significant disruption involving our IT networks and related systems could adversely impact our financial condition, results of operations, cash flows, liquidity, and the market price of our common stock. Further, one or more of our tenants could experience a cyber incident which could impact their operations and ability to perform under the terms of their lease with us. While we maintain insurance coverage that may, subject to policy terms and conditions including deductibles, cover specific aspects of cyber risks, such insurance coverage may be insufficient to cover all losses. As cyber threats continue to evolve, we may be required to expend additional resources to continue to enhance our information security measures and to investigate and remediate any information security vulnerabilities.
Federal Income Tax Risks
Any failure to continue to qualify as a REIT for federal income tax purposes could have a material adverse impact on us and our stockholders.
We intend to continue to operate in a manner to qualify as a REIT for federal income tax purposes. Qualification as a REIT involves the application of highly technical and complex provisions of the Internal Revenue Code (the “Code”), for which there are only limited judicial or administrative interpretations. Certain facts and circumstances not entirely within our control may affect our ability to qualify as a REIT. In addition, we can provide no assurance that legislation, new regulations, administrative interpretations, or court decisions will not adversely affect our qualification as a REIT or the federal income tax consequences of our REIT status.
If we were to fail to qualify as a REIT, we would not be allowed a deduction for distributions to stockholders in computing our taxable income. In this case, we would be subject to federal income tax on our taxable income at regular corporate rates. Unless entitled to relief under certain Code provisions, we also would be disqualified from operating as a REIT for the four taxable years following the year during which qualification was lost. As a result, we would be subject to federal and state income taxes which could adversely affect our results of operations and distributions to stockholders. Although we currently intend to operate in a manner designed to qualify as a REIT, it is possible that future economic, market, legal, tax, or other considerations may cause us to revoke the REIT election.
In order to qualify as a REIT, under current law, we generally are required each taxable year to distribute to our stockholders at least 90% of our net taxable income (excluding any net capital gain). To the extent that we do not distribute all of our net capital gain or distribute at least 90%, but less than 100%, of our other taxable income, we are subject to tax on the undistributed amounts at regular corporate rates. In addition, we are subject to a 4% nondeductible excise tax to the extent that distributions paid by us during the calendar year are less than the sum of the following:
• | 85% of our ordinary income; |
• | 95% of our net capital gain income for that year; and |
• | 100% of our undistributed taxable income (including any net capital gains) from prior years. |
We generally intend to make distributions to our stockholders to comply with the 90% distribution requirement to avoid corporate-level tax on undistributed taxable income and to avoid the nondeductible excise tax. Distributions could be made in cash, in stock, or in a combination of cash and stock. Differences in timing between taxable income and cash available for distribution could require us to borrow funds to meet the 90% distribution requirement, to avoid corporate-level tax on undistributed taxable income, and to avoid the nondeductible excise tax.
Certain property transfers may be characterized as prohibited transactions.
From time to time, we may transfer or otherwise dispose of some of our properties. Under the Code, any gains resulting from transfers or dispositions, from other than a taxable REIT subsidiary, that are deemed to be prohibited transactions would be subject to a 100% tax on any gain associated with the transaction. Prohibited transactions generally include sales of assets that constitute inventory or other property held for sale to customers in the ordinary course of business. Since we acquire properties primarily for investment purposes, we do not believe that our occasional transfers or disposals of property are deemed to be prohibited transactions. However, whether or not a transfer or sale of property qualifies as a prohibited transaction depends on all the facts and circumstances surrounding the particular transaction. The Internal Revenue Service may contend that certain transfers or disposals of properties by us are prohibited transactions. While we believe that the Internal Revenue Service would not prevail in any such dispute, if the Internal Revenue Service were to argue successfully that a transfer or disposition of property constituted a prohibited transaction, we would be required to pay a tax equal to 100% of any gain allocable to us from the prohibited transaction. In addition, income from a prohibited transaction might adversely affect our ability to satisfy the income tests for qualification as a REIT for federal income tax purposes.
14
We may face risks in connection with Section 1031 Exchanges.
When possible, we dispose of and acquire properties in transactions that are intended to qualify as Section 1031 Exchanges. If a transaction's gain that is intended to qualify as a Section 1031 deferral is later determined to be taxable, we may face adverse consequences, and if the laws applicable to such transactions are amended or repealed, we may not be able to dispose of properties on a tax-deferred basis. In such case, our taxable income and earnings and profits would increase. This could increase the dividend income to our stockholders by reducing any return of capital they received. In some circumstances, we may be required to pay additional dividends or, in lieu of that, corporate income tax, possibly including interest and penalties. In addition, if a Section 1031 Exchange were later to be determined to be taxable, we may be required to amend our tax returns for the applicable year in question.
Recent changes to the U.S. tax laws could have an adverse impact on our business operations, financial condition, and earnings.
In recent years, numerous legislative, judicial, and administrative changes have been made in the provisions of federal and state income tax laws applicable to investments similar to an investment in our shares. In particular, the comprehensive tax reform legislation enacted in December 2017 and commonly known as the Tax Cuts and Jobs Act, or TCJA, makes many significant changes to the U.S. federal income tax laws that will profoundly impact the taxation of individuals and corporations (including both regular C corporations and corporations that have elected to be taxed as REITs). A number of changes that affect noncorporate taxpayers will expire at the end of 2025 unless Congress acts to extend them. These changes will impact us and our shareholders in various ways, some of which are adverse or potentially adverse compared to prior law. Although the IRS has issued guidance with respect to certain of the new provisions, there are numerous interpretive issues that will require further guidance. It is highly likely that technical corrections legislation will be needed to clarify certain aspects of the new law and give proper effect to Congressional intent. There can be no assurance, however, that technical clarifications or changes needed to prevent unintended or unforeseen tax consequences will be enacted by Congress in the near future. Additional changes to tax laws are likely to continue to occur in the future, and we cannot assure investors that any such changes will not adversely affect the taxation of our stockholders. Any such changes could have an adverse effect on an investment in shares or on the market value or the resale potential of our properties. Investors are urged to consult with their own tax advisor with respect to the impact of recent legislation on ownership of shares and the status of legislative, regulatory, or administrative developments and proposals, and their potential effect on ownership of shares.
Disclosure Controls and Internal Control over Financial Reporting Risks
Our business could be adversely impacted if we have deficiencies in our disclosure controls and procedures or internal control over financial reporting.
The design and effectiveness of our disclosure controls and procedures and internal control over financial reporting may not prevent all errors, misstatements, or misrepresentations. While management will continue to review the effectiveness of our disclosure controls and procedures and internal control over financial reporting, there can be no guarantee that our internal control over financial reporting will be effective in accomplishing all control objectives at all times. Deficiencies, including any material weakness, in our internal control over financial reporting which may occur in the future could result in misstatements of our results of operations, restatements of our financial statements, a decline in our stock price, or otherwise materially adversely affect our business, reputation, results of operations, financial condition, or liquidity.
Item 1B. | Unresolved Staff Comments |
Not applicable.
15
Item 2. | Properties |
The following table sets forth certain information related to operating properties in which we have an ownership interest. Except as noted, all information presented is as of December 31, 2019 ($ in thousands):
Operating Properties
Company's Share | |||||||||||||
Office Properties | Rentable Square Feet | Financial Statement Presentation | Company's Ownership Interest | End of Period Leased | Weighted Average Occupancy (1) | % of Total Net Operating Income (2) | Property Level Debt (3) | Annualized Rent (4) | |||||
Spring & 8th (5) | 765,000 | Consolidated | 100% | 100.0% | 100.0% | 5.9% | $ | — | |||||
Terminus (5) | 1,226,000 | Consolidated | 100% | 83.3% | 81.8% | 5.8% | 203,309 | ||||||
Northpark (5) | 1,539,000 | Consolidated | 100% | 92.8% | 85.9% | 5.0% | — | ||||||
Promenade | 777,000 | Consolidated | 100% | 90.5% | 89.5% | 3.6% | 95,824 | ||||||
3344 Peachtree | 484,000 | Consolidated | 100% | 94.2% | 91.7% | 2.8% | — | ||||||
Buckhead Plaza (5) | 671,000 | Consolidated | 100% | 75.6% | 78.9% | 2.6% | — | ||||||
3350 Peachtree | 413,000 | Consolidated | 100% | 95.2% | 93.1% | 1.8% | — | ||||||
1200 Peachtree | 370,000 | Consolidated | 100% | 100.0% | 100.0% | 1.8% | — | ||||||
8000 Avalon | 229,000 | Consolidated | 90% | 100.0% | 100.0% | 1.5% | — | ||||||
3348 Peachtree | 258,000 | Consolidated | 100% | 92.3% | 91.7% | 1.2% | — | ||||||
Emory University Hospital Midtown | 358,000 | Unconsolidated | 50% | 99.1% | 98.6% | 0.9% | 33,973 | ||||||
Meridian Mark Plaza | 160,000 | Consolidated | 100% | 100.0% | 100.0% | 0.9% | 22,964 | ||||||
ATLANTA | 7,250,000 | 91.2% | 89.8% | 33.8% | 356,070 | ||||||||
The Domain (5) | 1,287,000 | Consolidated | 100% | 99.7% | 90.9% | 7.3% | — | ||||||
One Eleven Congress | 519,000 | Consolidated | 100% | 97.1% | 89.9% | 3.3% | — | ||||||
The Terrace (5) | 619,000 | Consolidated | 100% | 89.9% | 88.3% | 3.1% | — | ||||||
San Jacinto Center | 395,000 | Consolidated | 100% | 97.9% | 91.1% | 2.9% | — | ||||||
Colorado Tower | 373,000 | Consolidated | 100% | 100.0% | 99.8% | 2.8% | 116,443 | ||||||
816 Congress | 435,000 | Consolidated | 100% | 88.8% | 92.1% | 2.1% | 79,590 | ||||||
Domain Point (5) | 242,000 | Consolidated | 96.5% | 88.1% | 89.7% | 0.9% | — | ||||||
Research Park V | 173,000 | Consolidated | 100% | 97.1% | 97.1% | 0.8% | — | ||||||
AUSTIN | 4,043,000 | 95.8% | 91.5% | 23.2% | 196,033 | ||||||||
Hearst Tower | 966,000 | Consolidated | 100% | 98.5% | 94.6% | 4.8% | — | ||||||
Bank of America Plaza | 891,000 | Consolidated | 100% | 90.4% | 87.4% | 3.6% | — | ||||||
Fifth Third Center | 692,000 | Consolidated | 100% | 96.2% | 94.4% | 3.4% | 139,884 | ||||||
NASCAR Plaza | 395,000 | Consolidated | 100% | 100.0% | 96.1% | 2.1% | — | ||||||
Dimensional Place | 281,000 | Unconsolidated | 50% | 95.6% | 94.4% | 1.5% | — | ||||||
Gateway Village (5) | 1,061,000 | Unconsolidated | 50% | 99.4% | 99.4% | 1.5% | — | ||||||
CHARLOTTE | 4,286,000 | 96.2% | 93.7% | 16.9% | 139,884 | ||||||||
Hayden Ferry (5) | 789,000 | Consolidated | 100% | 97.8% | 92.9% | 4.9% | — | ||||||
Tempe Gateway | 264,000 | Consolidated | 100% | 94.8% | 90.9% | 1.6% | — | ||||||
111 West Rio | 225,000 | Consolidated | 100% | 100.0% | 100.0% | 1.1% | — | ||||||
PHOENIX | 1,278,000 | 97.6% | 93.8% | 7.6% | — | ||||||||
Corporate Center (5) | 1,224,000 | Consolidated | 100% | 98.6% | 96.4% | 5.3% | — | ||||||
The Pointe | 253,000 | Consolidated | 100% | 94.9% | 96.6% | 1.1% | — | ||||||
Harborview Plaza | 205,000 | Consolidated | 100% | 80.0% | 62.2% | 0.5% | — | ||||||
TAMPA | 1,682,000 | 95.7% | 92.2% | 6.9% | — | ||||||||
Legacy Union One | 319,000 | Consolidated | 100% | 100.0% | 100.0% | 1.9% | 68,155 | ||||||
5950 Sherry Lane | 197,000 | Consolidated | 100% | 90.3% | 88.8% | 0.8% | — | ||||||
DALLAS | 516,000 | 96.3% | 95.7% | 2.7% | 68,155 | ||||||||
BriarLake Plaza - Houston (5) | 835,000 | Consolidated | 100% | 89.2% | 85.3% | 3.8% | — | ||||||
Burnett Plaza - Fort Worth | 1,023,000 | Consolidated | 100% | 86.4% | 85.4% | 3.1% | — | ||||||
Woodcrest - Cherry Hill (5) | 386,000 | Consolidated | 100% | 92.0% | 84.5% | 1.0% | — | ||||||
Carolina Square - Chapel Hill | 158,000 | Unconsolidated | 50% | 93.4% | 79.3% | 0.3% | 12,772 | ||||||
OTHER OFFICE | 2,402,000 | 88.6% | 85.0% | 8.2% | 12,772 | ||||||||
TOTAL OFFICE | 21,457,000 | 93.6% | 90.9% | 99.3% | $ | 772,914 | $ | 688,889 | |||||
Table continued on next page
16
Company's Share | |||||||||||||
Office Properties | Rentable Square Feet | Financial Statement Presentation | Company's Ownership Interest | End of Period Leased | Weighted Average Occupancy (1) | % of Total Net Operating Income (2) | Property Level Debt (3) | Annualized Rent (4) | |||||
Other Properties | |||||||||||||
Carolina Square Apartment - Chapel Hill (246 units) | 266,000 | Unconsolidated | 50% | 99.6% | 96.7% | 0.6% | $ | 21,502 | |||||
Carolina Square Retail - Chapel Hill | 44,000 | Unconsolidated | 50% | 89.3% | 83.4% | 0.1% | 3,557 | ||||||
TOTAL OTHER | 310,000 | 98.1% | 94.8% | 0.7% | $ | 25,059 | $ | 4,125 | |||||
TOTAL | 21,767,000 | 93.6% | 90.9% | 100.0% | $ | 797,973 | $ | 693,014 | |||||
(1) | Represents the weighted average occupancy of the property over the period for which the property was available for occupancy during the year. |
(2) | The Company's share of net operating income for the three months ended December 31, 2019. |
(3) | The Company's share of property specific mortgage debt, including premiums and net of unamortized loan costs, as of December 31, 2019. |
(4) | The Company's share of annualized rent represents the sum of the annualized rent including tenant's share of estimated operating expenses, if applicable, each tenant is paying as of the end of the reporting period. If a tenant is not paying rent due to a free rent concession, annualized rent is calculated based on the annualized contractual rent the tenant will pay in the first period it is required to pay rent. Included in this amount is $20.7 million of annualized base rent for tenants in a free rent period. |
(5) | Contains two or more buildings that are grouped together for reporting purposes. |
Office Lease Expirations
As of December 31, 2019, our leases expire as follows:
Year of Expiration | Square Feet Expiring (1) | % of Leased Space (1) | Annual Contractual Rent ($000) (1) (2) | % of Annual Contractual Rent (1) | Annual Contractual Rent/Sq. Ft. | ||||||||||||
2020 | 1,470,908 | 7.7 | % | $ | 47,658 | 5.9 | % | $ | 32.53 | ||||||||
2021 | 2,135,471 | 11.2 | % | 77,864 | 9.6 | % | 36.46 | ||||||||||
2022 | 1,385,805 | 7.3 | % | 56,590 | 6.9 | % | 40.84 | ||||||||||
2023 | 1,700,019 | 8.9 | % | 69,947 | 8.6 | % | 41.14 | ||||||||||
2024 | 1,216,461 | 6.4 | % | 48,970 | 6.0 | % | 40.26 | ||||||||||
2025 | 1,993,279 | 10.4 | % | 87,994 | 10.9 | % | 44.15 | ||||||||||
2026 | 2,068,688 | 10.8 | % | 83,204 | 10.3 | % | 40.22 | ||||||||||
2027 | 1,471,736 | 7.6 | % | 60,873 | 7.4 | % | 41.16 | ||||||||||
2028 | 1,172,249 | 6.1 | % | 49,825 | 6.1 | % | 42.38 | ||||||||||
2029 &Thereafter | 4,495,284 | 23.6 | % | 229,494 | 28.3 | % | 51.06 | ||||||||||
Total | 19,109,900 | 100.0 | % | $ | 812,419 | 100.0 | % | $ 42.51 | |||||||||
(1) Company's share. | |||
(2) Annual Contractual Rent is the estimated rent in the year of expiration. It includes the minimum base rent and an estimate of operating expenses, if applicable, as defined in the respective leases. | |||
17
Top 20 Office Tenants
As of December 31, 2019, our top 20 office tenants were as follows:
Tenant (1) | Number of Properties Occupied | Number of Markets Occupied | Company's Share of Square Footage | Company's Share of Annualized Rent (2) | Percentage of Company's Share of Annualized Rent | Weighted Average Remaining Lease Term (Years) | |||||||||||
1 | Bank of America | 4 | 1 | 1,393,086 | $ | 38,611,659 | 5.6% | 4 | |||||||||
2 | NCR Corporation | 1 | 1 | 762,090 | 36,166,613 | 5.3% | 14 | ||||||||||
3 | Amazon | 4 | 3 | 391,187 | 17,810,008 | 2.6% | 6 | ||||||||||
4 | Expedia, Inc. | 1 | 1 | 296,955 | 13,407,563 | 2.0% | 9 | ||||||||||
5 | Norfolk Southern Corporation | 2 | 1 | 394,621 | 11,271,065 | 1.6% | 2 | ||||||||||
6 | Apache Corporation | 1 | 1 | 210,012 | 9,232,036 | 1.3% | 5 | ||||||||||
7 | Wells Fargo Bank, NA | 4 | 3 | 212,662 | 8,961,318 | 1.3% | 3 | ||||||||||
8 | Americredit Financial Services (dba GM Financial) | 2 | 2 | 333,782 | 8,520,825 | 1.2% | 10 | ||||||||||
9 | Parsley Energy, L.P. | 1 | 1 | 135,107 | 7,944,527 | 1.2% | 5 | ||||||||||
10 | Encana Oil & Gas (USA) Inc. | 1 | 1 | 318,582 | 7,831,964 | 1.1% | 8 | ||||||||||
11 | ADP, LLC | 1 | 1 | 225,000 | 7,307,064 | 1.0% | 8 | ||||||||||
12 | McGuirewoods LLP | 3 | 3 | 197,282 | 6,742,246 | 1.0% | 7 | ||||||||||
13 | Westrock Shared Services, LLC | 1 | 1 | 205,185 | 6,701,263 | 0.9% | 10 | ||||||||||
14 | Dimensional Fund Advisors LP | 1 | 1 | 132,434 | 6,235,230 | 0.9% | 14 | ||||||||||
15 | Morgan Stanley | 2 | 2 | 130,863 | 5,925,364 | 0.9% | 8 | ||||||||||
16 | Regus Equity Business Centers, LLC | 6 | 4 | 146,852 | 5,894,747 | 0.9% | 5 | ||||||||||
17 | Samsung Engineering America | 1 | 1 | 133,860 | 5,857,544 | 0.9% | 7 | ||||||||||
18 | Anthem | 1 | 1 | 198,834 | 5,642,481 | 0.8% | 1 | ||||||||||
19 | General Services Administration | 3 | 3 | 220,600 | 5,613,079 | 0.8% | 3 | ||||||||||
20 | NASCAR Media Group, LLC | 1 | 1 | 139,861 | 5,518,368 | 0.8% | 1 | ||||||||||
Total | 6,178,855 | $ | 221,194,964 | 32.1% | 7 | ||||||||||||
(1) | In some cases, the actual tenant may be an affiliate of the entity shown. | ||||||||||||
(2) | Annualized Rent represents the annualized rent including tenant's share of estimated operating expenses, if applicable, paid by the tenant as of the date of this report. If the tenant is in a free rent period as of the date of this report, Annualized Rent represents the annualized contractual rent the tenant will pay in the first month it is required to pay rent. | ||||||||||||
Note: | This schedule includes tenants whose leases have commenced and/or who have taken occupancy. Leases that have been signed but have not commenced are excluded. | ||||||||||||
18
Tenant Industry Diversification (1)
As of December 31, 2019, our tenant industry diversification was as follows:
Industry | Percentage of Total Revenues (2) | ||
Financial | 20.2 | % | |
Technology | 18.1 | % | |
Professional Services | 13.3 | % | |
Legal | 11.3 | % | |
Consumer Goods & Services | 6.7 | % | |
Energy | 5.8 | % | |
Real Estate | 4.8 | % | |
Health Care | 4.6 | % | |
Insurance | 3.5 | % | |
Other | 3.5 | % | |
Marketing/Media/Creative | 2.6 | % | |
Construction/Design | 2.2 | % | |
Transportation | 1.9 | % | |
Government | 1.5 | % | |
Total | 100 | % | |
(1) Management uses SIC codes when available, along with judgment, to determine tenant industry classification.
(2) Company's share.
Development Pipeline (1)
As of December 31, 2019, information on our projects under development was as follows ($ in thousands):
Project | Type | Market | Company's Ownership Interest | Construction Start Date | Number of Square Feet /Apartment Units | Estimated Project Cost (1) (2) | Company's Share of Estimated Project Cost (2) | Project Cost Incurred to Date (2) | Company's Share of Project Cost Incurred to Date (2) | Percent Leased | Initial Occupancy / Estimated Stabilization (3) (4) (5) | |||||||||||
120 West Trinity | Mixed | Atlanta | 20 | % | 1Q17 | $ | 85,000 | $ | 17,000 | $ | 77,449 | $ | 15,490 | |||||||||
Office | 33,000 | 100 | % | 3Q20/3Q20 | ||||||||||||||||||
Retail | 19,000 | 12 | % | 3Q20/4Q20 | ||||||||||||||||||
Apartments | 330 | 12 | % | 4Q19/4Q20 | ||||||||||||||||||
10000 Avalon | Office | Atlanta | 90 | % | 3Q18 | 251,000 | 96,000 | 86,400 | 87,331 | 78,598 | 59 | % | 1Q20/1Q21 | |||||||||
300 Colorado | Office | Austin | 50 | % | 4Q18 | 358,000 | 193,000 | 96,500 | 106,022 | 53,011 | 87 | % | 1Q21/1Q22 | |||||||||
Domain 10 | Office | Austin | 100 | % | 4Q18 | 300,000 | 111,000 | 111,000 | 73,152 | 73,152 | 98 | % | 4Q20/3Q21 | |||||||||
Domain 12 | Office | Austin | 100 | % | 2Q18 | 320,000 | 117,000 | 117,000 | 87,189 | 87,189 | 100 | % | 2Q20/3Q20 | |||||||||
100 Mill | Office | Phoenix | 90 | % | 1Q20 | 287,000 | 153,000 | 137,700 | 28,441 | 25,597 | 44 | % | 1Q22/1Q23 | |||||||||
Total | $ | 755,000 | $ | 565,600 | $ | 459,584 | $ | 333,037 | ||||||||||||||
(1) | This schedule shows projects currently under active development through the substantial completion of construction. Amounts included in the estimated project cost column are the estimated costs of the project through stabilization. Significant estimation is required to derive these costs, and the final costs may differ from these estimates. |
(2) | Estimated and incurred project costs include financing costs only on project-specific debt, and exclude certain allocated capitalized costs required by GAAP that are not incurred in a joint venture and fair value adjustments for legacy TIER projects that were recorded as a result of the Merger. |
(3) | Initial occupancy represents the quarter within which the Company estimates the first tenant will take occupancy. |
(4) | Estimated stabilization is the quarter within which the Company estimates it will achieve 90% economic occupancy. Interest, taxes, and operating expenses are capitalized on the unoccupied portion of the building for the period beginning with initial occupancy until the earlier of the achievement of 90% economic occupancy or one year. |
(5) | Initial occupancy and estimated stabilization are based, in part, on when the space is ready for its intended use, which is dependent upon the commencement and completion of tenant improvements. Since tenants in these properties generally control the timing of tenant improvements, timing of these estimates is subject to change. |
19
Land Holdings
As of December 31, 2019, we owned the following land holdings, either directly or indirectly through joint ventures:
Market | Type | Company's Ownership Interest | Total Developable Land (Acres) | Cost Basis of Land ($000) | |||||||||
3354 Peachtree | Atlanta | Commercial | 95% | 3.0 | |||||||||
901 West Peachtree (1) (2) | Atlanta | Commercial | 100% | 1.0 | |||||||||
The Avenue Forsyth-Adjacent Land | Atlanta | Commercial | 100% | 10.4 | |||||||||
Wildwood Office Park - Joint Venture (3) | Atlanta | Commercial | 50% | 6.3 | |||||||||
Domain 9 | Austin | Commercial | 100% | 2.5 | |||||||||
Domain 14 & 15 | Austin | Commercial | 100% | 5.6 | |||||||||
Legacy Union 2 & 3 | Dallas | Commercial | 95% | 4.0 | |||||||||
Victory Center | Dallas | Commercial | 75% | 3.0 | |||||||||
Burnett Plaza-Adjacent Land | Fort Worth | Commercial | 100% | 1.4 | |||||||||
Corporate Center 5 & 6 (4) | Tampa | Commercial | 100% | 14.1 | |||||||||
Padre Island | Corpus Christi | Residential | 50% | 15.0 | |||||||||
Total | 66.3 | $ | 130,176 | ||||||||||
Company's Share | 54.5 | $ | 110,150 | ||||||||||
(1) | Includes two ground leases with future obligations to purchase. |
(2) | During the fourth quarter of 2019, the Company purchased two adjacent land parcels bringing the assemblage to approximately 1 acre. |
(3) | During January 2020, the Company sold its remaining interest in the Wildwood Associates joint venture to its venture partner and recognized a gain of $1.4 million. |
(4) | Corporate Center 5 is controlled through a long-term ground lease. |
Item 3. | Legal Proceedings |
We are subject to various legal proceedings, claims, and administrative proceedings arising in the ordinary course of business, some of which are expected to be covered by liability insurance. Management makes assumptions and estimates concerning the likelihood and amount of any potential loss relating to these matters using the latest information available. We record a liability for litigation if an unfavorable outcome is probable and the amount of loss or range of loss can be reasonably estimated. If an unfavorable outcome is probable and a reasonable estimate of the loss is a range, we accrue the best estimate within the range. If no amount within the range is a better estimate than any other amount, we accrue the minimum amount within the range. If an unfavorable outcome is probable but the amount of the loss cannot be reasonably estimated, we disclose the nature of the litigation and indicate that an estimate of the loss or range of loss cannot be made. If an unfavorable outcome is reasonably possible and the estimated loss is material, we disclose the nature and estimate of the possible loss of the litigation. We do not disclose information with respect to litigation where an unfavorable outcome is considered to be remote or where the estimated loss would not be material. Based on current expectations, such matters, both individually and in the aggregate, are not expected to have a material adverse effect on our liquidity, results of operations, business, or financial condition.
Item 4. | Mine Safety Disclosures |
Not applicable.
20
Item X. | Information about our Executive Officers |
The Executive Officers of the Registrant, as of the date hereof, are as follow:
Name | Age | Office Held | ||
Lawrence L. Gellerstedt III | 63 | Executive Chairman of the Board | ||
M. Colin Connolly | 43 | President, Chief Executive Officer, and Director | ||
Gregg D. Adzema | 54 | Executive Vice President, Chief Financial Officer | ||
Richard G. Hickson IV | 45 | Executive Vice President, Operations | ||
John S. McColl | 57 | Executive Vice President | ||
Pamela F. Roper | 46 | Executive Vice President, General Counsel, and Corporate Secretary | ||
John D. Harris, Jr. | 60 | Senior Vice President, Chief Accounting Officer, Treasurer, and Assistant Secretary | ||
Family Relationships
There are no family relationships among the Executive Officers or Directors.
Term of Office
The term of office for all officers expires at the annual stockholders’ meeting. The Board retains the power to remove any officer at any time.
Business Experience
Mr. Gellerstedt was appointed Executive Chairman of the Board effective January 2019. From July 2017 to December 2018, Mr. Gellerstedt served as Chairman of the Board and Chief Executive Officer. From July 2009 to July 2017, Mr. Gellerstedt served as President, Chief Executive Officer, and Director. From February 2009 to July 2009, Mr. Gellerstedt served as President and Chief Operating Officer. From May 2008 to February 2009, Mr. Gellerstedt served as Executive Vice President and Chief Development Officer.
Mr. Connolly was appointed Chief Executive Officer and President by the Company's Board of Directors effective January 2019. From July 2017 to December 2018, Mr. Connolly served as President and Chief Operating Officer. From July 2016 to July 2017, Mr. Connolly served as Executive Vice President and Chief Operating Officer. From December 2015 to July 2016, Mr. Connolly served as Executive Vice President and Chief Investment Officer. From May 2013 to December 2015, Mr. Connolly served as Senior Vice President and Chief Investment Officer.
Mr. Adzema was appointed Executive Vice President and Chief Financial Officer in November 2010.
Mr. Hickson was appointed Executive Vice President of Operations in October 2018. Mr. Hickson joined Cousins in September 2016 as Senior Vice President responsible for Asset Management. Prior to joining the Company, from May 2012 to September 2016, Mr. Hickson was self-employed in private investment.
Mr. McColl was appointed Executive Vice President in December 2011. From February 2010 to December 2011, Mr. McColl served as Executive Vice President-Development, Office Leasing and Asset Management. From May 1997 to February 2010, Mr. McColl served as Senior Vice President.
Ms. Roper was appointed Executive Vice President, General Counsel and Corporate Secretary in February 2017. From October 2012 to February 2017, Ms. Roper served as Senior Vice President, General Counsel and Corporate Secretary. From February 2008 to October 2012, Ms. Roper served as Senior Vice President, Associate General Counsel and Assistant Secretary.
Mr. Harris was appointed Senior Vice President and Chief Accounting Officer in February 2005. In May 2005, Mr. Harris was appointed Assistant Secretary. In December 2014, Mr. Harris was appointed Treasurer.
21
PART II
Item 5. Market for Registrant’s Common Stock and Related Stockholder Matters
Market Information and Holders
Our common stock trades on the New York Stock Exchange (ticker symbol CUZ). On January 29, 2020, there were 10,995 stockholders of record of our common stock.
Purchases of Equity Securities
There were no purchases of common stock by the Company during the fourth quarter of 2019.
Performance Graph
The following graph compares the five-year cumulative total return of our common stock with the NYSE Composite Index, the FTSE NAREIT Equity Index, and the SNL US REIT Office Index. The graph assumes a $100 investment in each of the indices on December 31, 2014 and the reinvestment of all dividends.
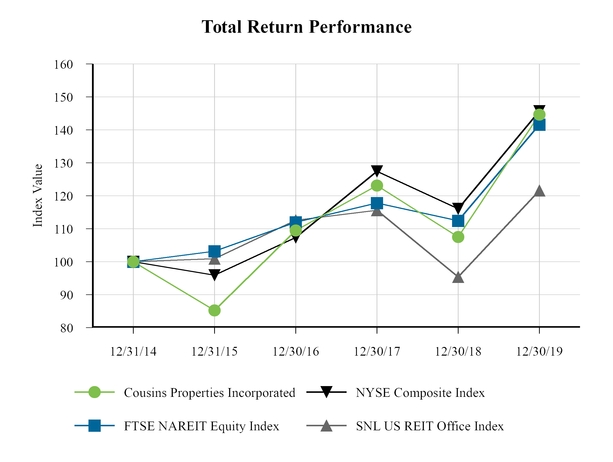
COMPARISON OF CUMULATIVE TOTAL RETURN OF ONE OR MORE COMPANIES, PEER
GROUPS, INDUSTRY INDICES, AND/OR BROAD MARKETS
Fiscal Year Ended | |||||||||||||||||
Index | 12/31/2014 | 12/31/2015 | 12/31/2016 | 12/31/2017 | 12/31/2018 | 12/31/2019 | |||||||||||
Cousins Properties Incorporated | 100.00 | 85.25 | 109.45 | 123.12 | 107.47 | 144.61 | |||||||||||
NYSE Composite Index | 100.00 | 95.91 | 107.36 | 127.46 | 116.06 | 145.66 | |||||||||||
FTSE NAREIT Equity Index | 100.00 | 103.20 | 111.99 | 117.84 | 112.39 | 141.61 | |||||||||||
SNL US REIT Office Index | 100.00 | 100.88 | 112.58 | 115.61 | 95.36 | 121.57 | |||||||||||
22
Item 6. | Selected Financial Data |
The following selected financial data sets forth consolidated financial and operating information on a historical basis. This data has been derived from our consolidated financial statements and should be read in conjunction with the consolidated financial statements and notes thereto. Prior year disclosures have been restated for the reclassification of termination fees from other revenues to rental property revenues as well as for the effect of the one-for-four reverse stock split described in note 1 of the consolidated financial statements.
Year Ended December 31, | |||||||||||||||||||
2019 | 2018 | 2017 | 2016 | 2015 | |||||||||||||||
(in thousands, except per share amounts) | |||||||||||||||||||
Revenues: | |||||||||||||||||||
Rental property revenues | $ | 628,751 | $ | 463,401 | $ | 455,305 | $ | 249,936 | $ | 196,642 | |||||||||
Fee income | 28,518 | 10,089 | 8,632 | 8,347 | 7,297 | ||||||||||||||
Other | 246 | 1,722 | 2,248 | 928 | 430 | ||||||||||||||
657,515 | 475,212 | 466,185 | 259,211 | 204,369 | |||||||||||||||
Expenses: | |||||||||||||||||||
Rental property operating expenses | 222,146 | 164,678 | 163,882 | 96,908 | 82,545 | ||||||||||||||
Reimbursed expenses | 4,004 | 3,782 | 3,527 | 3,259 | 3,430 | ||||||||||||||
General and administrative expenses | 37,007 | 22,040 | 27,523 | 25,592 | 16,918 | ||||||||||||||
Interest expense | 53,963 | 39,430 | 33,524 | 26,650 | 22,735 | ||||||||||||||
Depreciation and amortization | 257,149 | 181,382 | 196,745 | 97,948 | 71,625 | ||||||||||||||
Acquisition and merger costs | 52,881 | 248 | 1,661 | 24,521 | 299 | ||||||||||||||
Other | 1,109 | 556 | 1,796 | 5,888 | 1,181 | ||||||||||||||
628,259 | 412,116 | 428,658 | 280,766 | 198,733 | |||||||||||||||
Income from unconsolidated joint ventures | 12,666 | 12,224 | 47,115 | 10,562 | 8,302 | ||||||||||||||
Gain on investment property transactions | 110,761 | 5,437 | 133,059 | 77,114 | 80,394 | ||||||||||||||
Gain (loss) on extinguishment of debt | — | 8 | 2,258 | (5,180 | ) | — | |||||||||||||
Income from continuing operations | 152,683 | 80,765 | 219,959 | 60,941 | 94,332 | ||||||||||||||
Income from discontinued operations: | |||||||||||||||||||
Income from discontinued operations | — | — | — | 19,163 | 31,848 | ||||||||||||||
Loss on sale from discontinued operations | — | — | — | — | (551 | ) | |||||||||||||
Income from discontinued operations | — | — | — | 19,163 | 31,297 | ||||||||||||||
Net income | 152,683 | 80,765 | 219,959 | 80,104 | 125,629 | ||||||||||||||
Net income attributable to noncontrolling interests | (2,265 | ) | (1,601 | ) | (3,684 | ) | (995 | ) | (111 | ) | |||||||||
Net income available to common stockholders | $ | 150,418 | $ | 79,164 | $ | 216,275 | $ | 79,109 | $ | 125,518 | |||||||||
Net income from continuing operations attributable to controlling interest per common share - basic and diluted | $ | 1.17 | $ | 0.75 | $ | 2.08 | $ | 0.94 | $ | 1.75 | |||||||||
Net income per common share - basic and diluted | $ | 1.17 | $ | 0.75 | $ | 2.08 | $ | 1.25 | $ | 2.33 | |||||||||
Dividends declared per common share | $ | 1.16 | $ | 1.04 | $ | 1.20 | $ | 0.96 | $ | 1.28 | |||||||||
Total assets (at year-end) | $ | 7,151,447 | $ | 4,146,296 | $ | 4,204,619 | $ | 4,171,607 | $ | 2,595,320 | |||||||||
Notes payable (at year-end) | $ | 2,222,975 | $ | 1,062,570 | $ | 1,093,228 | $ | 1,380,920 | $ | 718,810 | |||||||||
Stockholders' investment (at year-end) | $ | 4,359,274 | $ | 2,765,865 | $ | 2,771,973 | $ | 2,455,557 | $ | 1,683,415 | |||||||||
Common shares outstanding (at year-end) | 146,762 | 105,096 | 105,005 | 98,354 | 52,878 | ||||||||||||||
23
Item 7. | Management's Discussion and Analysis of Financial Condition and Results of Operations |
The following discussion and analysis should be read in conjunction with the selected financial data and the consolidated financial statements and notes.
Overview of 2019 Performance and Company and Industry Trends
Our strategy is to create value for our stockholders through ownership of the premier urban office portfolio in the Sunbelt markets of the United States, with a particular focus on Georgia, Texas, North Carolina, Arizona, and Florida. This strategy is based on a disciplined approach to capital allocation that includes value-add acquisitions, selective development projects, and timely dispositions of non-core assets. This strategy is also based on a simple, flexible, and low-leveraged balance sheet that allows us to pursue compelling growth opportunities at the most advantageous points in the cycle. To implement this strategy, we leverage our strong local operating platforms within each of our major markets.
Consistent with our strategy, on June 14, 2019, we merged with TIER REIT, Inc. (“TIER”) in a stock-for-stock transaction (the "Merger"). As a result, we acquired an interest in nine operating office properties containing 5.8 million square feet of space, two office properties under development that are expected to add 620,000 square feet of space upon completion, and land parcels on which up to 2.5 million square feet of additional space may be developed. Strategically, we believe that the Merger created an unmatched portfolio of trophy office assets balanced across the premier Sunbelt markets. In addition, we believe that the Merger has enhanced our position in our existing markets of Austin and Charlotte, provided a strategic entry into Dallas, and balanced our exposure in Atlanta. The Merger is also expected to enhance growth and to provide value-add opportunities as a result of TIER's active and attractive development portfolio and land bank. As a part of this transaction, we issued $650 million in senior unsecured debt at a weighted average interest rate of 3.88%, which effectively replaced the majority of the TIER debt assumed in the Merger.
In addition to the Merger, we engaged in a number of transactions during 2019 that both individually and collectively advanced our strategy. On March 1, 2019, we entered into a series of agreements and executed related transactions with Norfolk Southern Railway Company ("NS") in which we sold land to NS, executed agreements to provide development and consulting services for NS's corporate headquarters that is being constructed on that land, and purchased a 370,000 square foot office building in Midtown Atlanta from NS ("1200 Peachtree") that is subject to a three-year market rate lease covering the entire building. These transactions are not only accretive to earnings over the period of construction of NS’s new headquarters, but the addition of 1200 Peachtree at an attractive price in the growing Midtown Atlanta submarket provides an excellent opportunity to re-lease the space at attractive rates when NS moves to its new headquarters.
In June 2019, we entered into a 561,000 square foot lease with Truist Financial Corporation ("Truist") at Hearst Tower that enhanced the value of the building with a 15-year lease to a high credit tenant covering 58% of the building. Included in the lease was an option for Truist to purchase the building for $455.5 million. In late 2019, Truist notified us of their intent to exercise this option, and we expect to close on the sale of Hearst Tower at the end of the first quarter of 2020.
In October 2019, we purchased our partner’s interest in Terminus Office Holdings ("TOH") in a transaction that values Terminus 100 and Terminus 200 at $503 million. At 83% leased and at a purchase price below replacement cost, we believe that this purchase provides an opportunity to create value through the lease-up of vacant space in one of the most highly amenitized office properties in Buckhead Atlanta.
As noted above, in the Merger, we added two active development projects to our development pipeline: Domain 10 and Domain 12 in Austin. Domain 12 is 100% leased and on track to deliver in the first half of 2020. With the execution of an expansion with Amazon in the third quarter of 2019, we increased the percent leased of Domain 10 from 63% upon acquisition to 98%. Domain 10 is scheduled to deliver in late 2020. We continued to make progress on our existing development projects that include 120 West Trinity in Decatur, Georgia, 10000 Avalon in Atlanta, and 300 Colorado in Austin. These projects are on track to deliver in 2020 and early 2021 and the office portion of these properties is a combined 77% pre-leased. We commenced development of 100 Mill, a 287,000 square foot office property in Tempe, Arizona. This project has estimated construction costs of $153 million, is scheduled for delivery in early 2022, and is 44% pre-leased. In the first quarter of 2019, Dimensional Place, a 281,000 square foot office building in Charlotte commenced operations. We continue to look for additional development opportunities with our robust land bank.
In 2019, we leased or renewed 3.1 million square feet of office space. The weighted average net effective rent per square foot, representing base rent less operating expense reimbursements and leasing costs, for new or renewed non-amenity leases with terms greater than one year was $23.82 per square foot. Cash basis net effective rent per square foot increased 7.7% on spaces that had been previously occupied in the past year. Cash basis net effective rent represents net rent at the end of the term paid by the prior tenant compared to the net rent at the beginning of the term paid by the current tenant. Our same property net operating income for the year increased 2.6% on a GAAP basis and 4.8% on a cash basis.
24
Market Conditions
We believe that the Sunbelt region, and in particular the six core Sunbelt markets in which we operate, possess some of the most attractive economic and real estate fundamentals in the nation. Our markets are located in states that lead the nation in new job growth and net migration as residents relocate from the Northeast, Midwest, and West Coast to our markets. This migration, when combined with low levels of new supply, has led to steady office absorption and positive rent growth, supporting healthy office fundamentals. We believe that we are well positioned to benefit from, and ultimately outperform in, the current real estate environment.
Our Atlanta portfolio totals 7.3 million square feet, representing 33.8% of our Net Operating Income for the fourth quarter of 2019 and was 91.2% leased at December 31, 2019. In addition, we had two projects under development in Atlanta at December 31, 2019, one office property and one mixed use property, in which we hold 90% and 20% interests, respectively. Job growth in Atlanta for the year ended December 31, 2019 was 2.2%, above the national average, and construction as a percentage of the total market square footage was 2.6% at year end. Our portfolio is well located primarily in the Midtown, Buckhead, and Central Perimeter submarkets with direct access to mass transit.
Our Austin portfolio totals 4.0 million square feet, representing 23.2% of our Net Operating Income for the fourth quarter of 2019 and was 95.8% leased at December 31, 2019. In addition, we have three projects under development in Austin, one owned in a 50-50 joint venture and two wholly-owned that together total 978,000 square feet and are a combined 95% leased. Job growth in Austin for the year ended December 31, 2019 was 2.7% and construction as a percentage of the total market square footage was 9.1%. Our portfolio is predominantly in the central business district and Northwest submarket where vacancy is 5.6% and 6.8%, respectively. We believe that our dominant presence in Austin, combined with strong job growth and low unemployment are favorable for our existing portfolio.
Our Charlotte portfolio totals 4.3 million square feet, representing 16.9% of our Net Operating Income for the fourth quarter of 2019 and was 96.2% leased at December 31, 2019. Job growth in Charlotte for the year ended December 31, 2019 was 2.4% and construction as a percentage of the total market square footage was 5.1%. Our portfolio is located in the Uptown and South End submarkets where rent growth has significantly surpassed the national average. The overall market has benefitted from Charlotte's strong population growth, which has increased at three times the national rate over the past decade. Strong demand and favorable economics have spurred a high level of new development across the market, specifically in Uptown where approximately 2.7 million square feet is currently under construction.
Our Phoenix portfolio totals 1.3 million square feet, representing 7.6% of our Net Operating Income for the fourth quarter of 2019 and was 97.6% leased at December 31, 2019. Job growth in Phoenix for the year ended December 31, 2019 was 2.6% and construction as a percentage of the total market square footage was 1.7%. Phoenix has experienced population growth at more than twice the national average, more than two-thirds of which was from new residents from outside the metropolitan area. Our portfolio is located in the Tempe submarket, in close proximity to Arizona State University and its 80,000 students, where Class A office vacancy is 5.4%.
Our Tampa portfolio totals 1.7 million square feet, representing 6.9% of Net Operating Income for the fourth quarter of 2019 and was 95.7% leased at December 31, 2019. Job growth in Tampa for the year ended December 31, 2019 was 2.2%, and construction as a percentage of the total market square footage was 1.6%. Metro-wide, the Tampa office market is experiencing low vacancy rates, and the Westshore submarket, where our portfolio is located, continues to achieve some of the highest rents in the metropolitan area, in part due to its central location and proximity to the Tampa airport.
Our Dallas portfolio totals 516,000 square feet, representing 2.7% of Net Operating Income for the fourth quarter of 2019 and was 96.3% leased at December 31, 2019. Job growth in Dallas for the year ended December 31, 2019 was 2.1%, and construction as a percentage of the total market square footage was 4.0%.
Critical Accounting Policies
Our financial statements are prepared in accordance with GAAP as outlined in the Financial Accounting Standards Board’s ("FASB") Accounting Standards Codification ("ASC"), and the notes to consolidated financial statements include a summary of the significant accounting policies for the Company. The preparation of financial statements in accordance with GAAP requires the use of certain estimates, a change in which could materially affect revenues, expenses, assets, or liabilities. Some of our accounting policies are considered to be critical accounting policies, which are ones that are both important to the portrayal of our financial condition, results of operations, and cash flows, and ones that also require significant judgment or complex estimation processes. Our critical accounting policies are as follows:
25
Development Cost Capitalization
We are involved in all stages of real estate ownership, including development. Prior to the point at which a project becomes probable of being developed (defined as more likely than not), we expense predevelopment costs. After we determine a project is probable, all subsequently incurred predevelopment costs, as well as interest and real estate taxes on qualifying assets and certain internal personnel and associated costs directly related to the project under development, are capitalized in accordance with accounting rules. If we abandon development of a project that had earlier been deemed probable, we charge all previously capitalized costs to expense. If this occurs, our predevelopment expenses could rise significantly. The determination of whether a project is probable requires judgment. If we determine that a project is probable, interest, general and administrative, and other expenses could be materially different than if we determine the project is not probable.
During the predevelopment period of a probable project and the period in which a project is under construction, we capitalize all direct and indirect costs associated with planning, developing, and constructing the project. Determination of what costs constitute direct and indirect project costs requires us, in some cases, to exercise judgment. If we determine certain costs to be direct or indirect project costs, amounts recorded in projects under development on the balance sheet and amounts recorded in general and administrative and other expenses on the statements of operations could be materially different than if we determine these costs are not directly or indirectly associated with the project.
Once a certain project is constructed and deemed substantially complete and ready for occupancy, carrying costs, such as real estate taxes, interest, internal personnel costs, and associated costs, are expensed as incurred. Determination of when construction of a project is substantially complete and held available for occupancy requires judgment. We consider projects and/or project phases to be both substantially complete and held for occupancy at the earlier of the date on which the project or phase reached economic occupancy of 90% or one year after its initial occupancy. Our judgment of the date the project is substantially complete has a direct impact on our operating expenses and net income for the period.
Acquisitions
We evaluate all real estate acquisitions to determine if the transactions qualify as an acquisition of assets or of a business within the framework of ASU 2017-01 and guidance in ASC 805, "Business Combinations". Generally, the acquisition of operating properties will not meet the definition of a business. In cases where we acquire a pool of properties of varying property types in different markets, we must determine whether the acquisition qualifies as an asset acquisition or an acquisition of a business. In making this determination, we first must evaluate whether substantially all of the assets are concentrated in a single identifiable asset or group of similar identifiable assets. For purposes of this review, we separate the assets acquired based on their unique and different risk characteristics, which may be by property type, geographic concentration, or other factors. If we determine that substantially all of the fair value is concentrated in a single identifiable asset or group of similar assets, generally 90% of total fair value of assets acquired, we account for the acquisition as an acquisition of assets. If we determine that there is no single or group of assets that make up substantially all of the fair value of assets acquired, we then evaluate whether the acquired set of assets include an input and substantial process which create an output as outlined in ASC 805. If we determine that an input and substantial process creating an output are present, we account for the acquisition as an acquisition of a business. Otherwise, we account for the acquisition as an acquisition of assets.
We use considerable judgment in determining whether the acquisition of a pool of assets is an acquisition of assets or of a business. Because acquisition costs are expensed for an acquisition of a business and capitalized for an acquisition of assets, results of operations could be materially different based on these determinations.
For acquisitions that are accounted for as an acquisition of an asset, we record the acquired tangible and intangible assets and assumed liabilities based on each asset and liability's relative fair value at the acquisition date to the total purchase price plus capitalized acquisition costs. For acquisitions that are accounted for as an acquisition of a business, we record the acquired tangible and intangible assets and assumed liabilities at fair value at the acquisition date. Fair value is based on estimated cash flow projections that utilize available market information and discount and/or capitalization rates as appropriate. Estimates of future cash flows are based on a number of factors including historical operating results, known and anticipated trends, and market and economic conditions. The acquired assets and assumed liabilities for an acquired operating property generally include, but are not limited to: land, buildings, and identified tangible and intangible assets and liabilities associated with in-place leases, including tenant improvements, leasing costs, value of above-market and below-market leases, and value of acquired in-place leases.
The fair value of land is derived from comparable sales of land within the same submarket and/or region. The fair value of buildings, tenant improvements, and leasing costs are based upon current market replacement costs and other relevant market rate information.
26
The fair value of the above-market or below-market component of an acquired lease is based upon the present value (calculated using a market discount rate) of the difference between (i) the contractual rents to be paid pursuant to the lease over its remaining term and (ii) management’s estimate of the rents that would be paid using fair market rental rates and rent escalations at the date of acquisition over the remaining term of the lease. An identifiable intangible asset or liability is recorded if there is an above-market or below-market lease at an acquired property.
The fair value of acquired in-place leases is derived based on our assessment of lost revenue and costs incurred for the period required to lease the “assumed vacant” property to the occupancy level when purchased. This fair value is based on a variety of considerations including, but not necessarily limited to: (1) the value associated with avoiding the cost of originating the acquired in-place leases; (2) the value associated with lost revenue related to tenant reimbursable operating costs estimated to be incurred during the assumed lease-up period; and (3) the value associated with lost rental revenue from existing leases during the assumed lease-up period. Factors considered in performing these analyses include an estimate of the carrying costs during the expected lease-up periods, such as real estate taxes, insurance, and other operating expenses, current market conditions, and costs to execute similar leases, such as leasing commissions, legal, and other related expenses.
The amounts recorded for above-market leases are included in other assets on the balance sheets, and the amounts for below-market leases are included in other liabilities on the balance sheets. These amounts are amortized on a straight-line basis as an adjustment to rental income over the remaining term of the applicable leases.
The amounts recorded for in-place leases are included in intangible assets on the balance sheets. These amounts are amortized as an increase to depreciation and amortization expense over the remaining term of the applicable leases.
The determination of the fair value of the acquired tangible and intangible assets and assumed liabilities of acquisitions requires significant judgment about the numerous inputs discussed above. The use of different assumptions in these fair value calculations could significantly affect the reported amounts of the allocation of the acquisition related assets and liabilities and the related amortization and depreciation expense recorded for such assets and liabilities. In addition, since the values of above-market and below-market leases are amortized as either a reduction or increase to rental income, respectively, the judgments for these intangibles could have a significant impact on reported rental revenues and results of operations.
Depreciation and Amortization
We depreciate or amortize operating real estate assets over their estimated useful lives using the straight-line method of depreciation. We use judgment when estimating the useful life of real estate assets and when allocating certain indirect project costs to projects under development, which are amortized over the useful life of the property once it becomes operational. Historical data, comparable properties, and replacement costs are some of the factors considered in determining useful lives and cost allocations. The use of different assumptions for the estimated useful life of assets or cost allocations could significantly affect depreciation and amortization expense and the carrying amount of our real estate assets.
Impairment
We review our real estate assets on a property-by-property basis for impairment. This review includes our operating properties, properties under development, and land holdings.
The first step in this process is for us to determine whether an asset is considered to be held and used or held for sale, in accordance with accounting guidance. In order to be considered a real estate asset held for sale, we must, among other things, have the authority to commit to a plan to sell the asset in its current condition, have commenced the plan to sell the asset, and have determined that it is probable that the asset will sell within one year. If we determine that an asset is held for sale, we must record an impairment loss if the fair value less costs to sell is less than the carrying amount. All real estate assets not meeting the held for sale criteria are considered to be held and used.
In the impairment analysis for assets held and used, we must determine whether there are indicators of impairment. For operating properties, these indicators could include a decline in a property’s leasing percentage; a current period operating loss or negative cash flows combined with a history of losses at the property; a decline in lease rates for that property or others in the property’s market; a significant change in the market value of the property; or an adverse change in the financial condition of significant tenants. For land holdings, indicators could include an overall decline in the market value of land in the region, a decline in development activity for the intended use of the land, or other adverse economic and market conditions. For projects under development, indicators could include material budget overruns without a corresponding funding source, significant delays in construction, occupancy, or stabilization schedule, regulatory changes or economic trends that have a significant impact on the market, or an adverse change in the financial condition of a significant tenant.
27
If we determine that an asset that is held and used has indicators of impairment, we must determine whether the undiscounted cash flows associated with the asset exceed the carrying amount of the asset. If the undiscounted cash flows are less than the carrying amount of the asset, we must reduce the carrying amount of the asset to fair value.
In calculating the undiscounted net cash flows of an asset, we must estimate a number of inputs. For operating properties, we must estimate future rental rates, expenditures for future leases, future operating expenses, and market capitalization rates for residual values, among other things. For land holdings, we must estimate future sales prices as well as operating income, carrying costs, and residual capitalization rates for land held for future development. For projects under development, we must estimate the cost to complete construction, time period of lease-up, future rental rates, expenditures for future leases, future operating expenses, market capitalization rates for residual values, and future sales price, among other things. In addition, if there are alternative strategies for the future use of the asset, we must assess the probability of each alternative strategy and perform a probability-weighted undiscounted cash flow analysis to assess the recoverability of the asset. We must use considerable judgment in determining the alternative strategies and in assessing the probability of each strategy selected.
In determining the fair value of an asset, we exercise judgment on a number of factors. We may determine fair value by using a discounted cash flow calculation or by utilizing comparable market information. We must determine an appropriate discount rate to apply to the cash flows in the discounted cash flow calculation. We must use judgment in analyzing comparable market information because no two real estate assets are identical in location and price.
The estimates and judgments used in the impairment process are highly subjective and susceptible to frequent change. If we determine that an asset is held and used, the results of operations could be materially different than if we determine that an asset is held for sale. Different assumptions we use in the calculation of undiscounted net cash flows of a project, including the assumptions associated with alternative strategies and the probabilities associated with alternative strategies, could cause a material impairment loss to be recognized when no impairment is otherwise warranted. Our assumptions about the discount rate used in a discounted cash flow estimate of fair value and our judgment with respect to market information could materially affect the decision to record impairment losses or, if required, the amount of the impairment losses.
In addition to our real estate assets, we review each of our investments in unconsolidated joint ventures for impairment. As part of this analysis, we first determine whether there are any indicators of impairment at any property held in a joint venture investment. If indicators of impairment are present for any of our investments in joint ventures, we calculate the fair value of the investment. If the fair value of the investment is less than the carrying value of the investment, we must determine whether the impairment is temporary or other than temporary, as outlined in GAAP. If we assesses the impairment to be temporary, we do not record an impairment charge. If we conclude that the impairment is other than temporary, we record an impairment charge.
We use considerable judgment in the determination of whether there are indicators of impairment present and in the assumptions, estimations, and inputs used in calculating the fair value of the investment. These judgments are similar to those outlined above in the impairment of real estate assets. We also use judgment in making the determination as to whether the impairment is temporary or other than temporary by considering, among other things, the length of time that the impairment has existed, the financial condition of the joint venture, and the ability and intent of the holder to retain the investment long enough for a recovery in market value. Our judgment as to the fair value of the investment or on the conclusion of the nature of the impairment could have a material impact on our financial condition, results of operations, and cash flows.
Stock-based Compensation
We have several types of stock-based compensation plans. These plans are described in note 15, as are the accounting policies by type of award. Compensation cost for all stock-based awards requires measurement at estimated fair value on the grant date, and compensation cost is recognized over the service vesting period, which represents the requisite service period. For compensation plans that contain market performance measures, we must estimate the fair value of the awards on a quarterly basis and must adjust compensation expense accordingly. The fair values of these awards are estimated using complex pricing valuation models that require a number of estimates and assumptions. For awards that are based on our future earnings, we must estimate future earnings and adjust the estimated fair value of the awards accordingly.
We use considerable judgments in determining the fair value of these awards. Compensation expense associated with these awards could vary significantly based upon these estimates.
Discussion of New Accounting Pronouncements
On January 1, 2019, we adopted ASC 842, which amended the previous standard for lease accounting by requiring lessees to record most leases on their balance sheets and by making targeted changes to lessor accounting and reporting. The new standard requires lessees to record a right-of-use asset and a lease liability for leases and classify such leases as either finance or operating leases based on the principle of whether the lease is effectively a financed purchase of the leased asset by the lessee.
28
The classification of the leases determines whether the lease expense is recognized based on an effective interest method (finance leases) or on a straight-line basis over the term of the lease (operating leases). The new standard also revised the treatment of indirect leasing costs and permits the capitalization and amortization of direct leasing costs only. For the years ended December 31, 2018 and 2017, we capitalized $3.8 million and $3.0 million of indirect leasing costs, respectively.
The Company adopted the following optional practical expedients provided in ASC 842:
•no reassessment of any expired or existing contracts to determine if they contain a lease;
•no reassessment of initial direct costs for any existing leases;
•no recognition of right-of-use assets and lease liabilities for leases with a term of one year or less;
• | no separate classification and disclosure of non-lease components of revenue in lease contracts from the related lease components provided certain conditions are met; and |
• | no reassessment of the lease classification. |
For those leases where we were the lessee, specifically ground leases, the adoption of ASC 842 required us to record a right-of-use asset and a lease liability in the amount of $56.3 million on the condensed consolidated balance sheet. In calculating the right of use asset and lease liability, we used a weighted average discount rate of 4.49%, which represented our incremental borrowing rate related to the ground lease assets as of January 1, 2019. Ground leases executed before the adoption of ASC 842 are accounted for as operating leases and did not result in a materially different ground lease expense. However, most ground leases executed after the adoption of ASC 842 are expected to be accounted for as finance leases, which will result in ground lease expense being recorded using the effective interest method instead of the straight-line method over the term of the lease, resulting in higher expense associated with the ground lease in the earlier years of a ground lease when compared to the straight line method. We elected to use the "modified retrospective" method upon adoption of ASC 842, which permitted application of the new standard on the adoption date as opposed to the earliest comparative period presented in its financial statements.
On January 1, 2018, we adopted ASU 2017-05, “Other Income - Gains and Losses from the Derecognition of Nonfinancial Assets (Subtopic 610-20): Clarifying the Scope of Asset Derecognition Guidance and Accounting for Partial Sales of Nonfinancial Assets” (“ASU 2017-05"). As a result of the adoption of ASU 2017-05, we recorded a cumulative effect from change in accounting principle, which credited distributions in excess of cumulative net income by $22.3 million. This cumulative effect adjustment resulted from the 2013 transfer of a wholly-owned property to an entity in which it had a noncontrolling interest.
Results of Operations For The Year Ended December 31, 2019
General
Our financial results for the year ended December 31, 2019 have been significantly affected by the Merger, the transactions with NS, and various acquisitions, dispositions, and developments during the 2019 and 2018. Net income available to common stockholders for the year ended 2019 and 2018 was $150.4 million and $79.2 million, respectively. We detail below material changes in the components of net income available to common stockholders for the year ended 2019 compared to 2018.
See "Item 7. Management's Discussion and Analysis of Financial Condition and Results of Operations - Results of Operations" from our 2018 Annual Report on Form 10-K for a comparison of 2018 to 2017 financial results.
Rental Property Revenues and Rental Property Operating Expenses
The following results include the performance of our Same Property portfolios. Our Same Property portfolios include office properties that have been fully operational in each of the comparable reporting periods. A fully operational property is one that has achieved 90% economic occupancy for each of the periods presented or has been substantially complete and owned by us for each of the periods presented. Same Property amounts for the 2019 versus 2018 comparison are from properties that were owned as of January 1, 2018 through December 31, 2019.
We use Net Operating Income ("NOI"), a non-GAAP financial measure, to measure the operating performance of our properties. NOI is also widely used by industry analysts and investors to evaluate performance. NOI, which is rental property revenues less rental property operating expenses, excludes certain components from net income in order to provide results that are more closely related to a property's results of operations. Certain items, such as interest expense, while included in net income, do not affect the operating performance of a real estate asset and are often incurred at the corporate level as opposed to the property level. As a result, we use only those income and expense items that are incurred at the property level to evaluate a property's performance. Depreciation, amortization, and termination fees are also excluded from NOI. Same Property NOI allows analysts, investors, and management to analyze continuing operations and evaluate the growth trend of our portfolio.
29
Rental property revenues, rental property operating expenses, and NOI changed between the 2019 and 2018 periods as follows (dollars in thousands):
Year Ended December 31, | ||||||||||||||
2019 | 2018 | $ Change | % Change | |||||||||||
Rental Property Revenues | ||||||||||||||
Same Property | $ | 446,707 | $ | 403,434 | $ | 43,273 | 10.7 | % | ||||||
Legacy TIER Properties | 113,115 | — | 113,115 | 100.0 | % | |||||||||
Other Non-Same Property | 68,929 | 59,967 | 8,962 | 14.9 | % | |||||||||
$ | 628,751 | $ | 463,401 | $ | 165,350 | 35.7 | % | |||||||
Rental Property Operating Expenses | ||||||||||||||
Same Property | $ | 162,575 | $ | 156,174 | $ | 6,401 | 4.1 | % | ||||||
Legacy TIER Properties | 42,441 | — | 42,441 | 100.0 | % | |||||||||
Other Non-Same Property | 17,130 | 8,504 | 8,626 | 101.4 | % | |||||||||
$ | 222,146 | $ | 164,678 | $ | 57,468 | 34.9 | % | |||||||
Same Property NOI | $ | 277,508 | $ | 270,293 | $ | 7,215 | 2.7 | % | ||||||
Legacy TIER Property NOI | 70,071 | — | 70,071 | 100.0 | % | |||||||||
Non-Same Property NOI | 51,798 | 26,882 | 24,916 | 92.7 | % | |||||||||
Total NOI | $ | 399,377 | $ | 297,175 | $ | 102,202 | 34.4 | % | ||||||
Same property rental property revenues increased between 2019 and 2018 primarily as a result of termination fees recognized at Hearst Tower from tenants who terminated their leases in connection with the Truist lease, as well as higher occupancy at Northpark, Corporate Center, and Hayden Ferry. Same property rental property operating expenses increased between 2019 and 2018 primarily as a result of an increase in real estate taxes due to higher assessments of value, particularly in the Austin and Charlotte markets.
Revenues and expenses for Legacy TIER properties represent amounts recorded for the properties acquired in the Merger.
Revenues and expenses of Other Non-Same Property increased between 2019 and 2018 primarily as a result of the addition of 1200 Peachtree, which was acquired in the first quarter of 2019; Spring & 8th, whose final phase commenced operations in the fourth quarter of 2018; and Terminus, which was consolidated in the fourth quarter of 2019 when we purchased our partner's interest in TOH.
Fee Income
Fee income increased $18.4 million (182.7%) between 2019 and 2018 primarily driven by fee income related to the transactions with NS.
General and Administrative Expenses
General and administrative expenses increased $15.0 million (67.9%) between 2019 and 2018 primarily driven by long-term compensation expense increases as a result of fluctuations in our common stock price relative to our office peers included in the SNL US Office REIT Index.
Interest Expense
Interest expense, net of amounts capitalized, increased $14.5 million (36.9%) between 2019 and 2018 primarily due to interest incurred on the unsecured senior notes that were issued on June 19, 2019 in connection with the Merger, interest incurred on a mortgage loan assumed in the Merger, interest incurred on the mortgage loan assumed in purchase of our partner's interest in TOH, and an increase in the average outstanding balance on our credit facility.
30
Depreciation and Amortization
Depreciation and amortization changed between the 2019 and 2018 periods as follows (dollars in thousands):
Year Ended December 31, | ||||||||||||||
2019 | 2018 | $ Change | % Change | |||||||||||
Depreciation and Amortization | ||||||||||||||
Same Property | $ | 175,333 | $ | 168,395 | $ | 6,938 | 4.1 | % | ||||||
Legacy TIER Properties | 55,192 | — | 55,192 | 100.0 | % | |||||||||
Other Non-Same Property | 26,624 | 12,987 | 13,637 | 105.0 | % | |||||||||
Total Depreciation and Amortization | $ | 257,149 | $ | 181,382 | $ | 75,767 | 41.8 | % | ||||||
Same property depreciation and amortization increased between 2019 and 2018 primarily due to the acceleration of amortization of tenant improvements and in-place leases on tenants who terminated their leases at Hearst Tower in connection with the Truist lease, partially offset by the acceleration of amortization of tenant improvements and in-place leases on tenants who terminated their leases in early 2018.
Depreciation and amortization for Legacy TIER properties represent amounts recorded on the properties acquired in the Merger.
Depreciation and amortization of Other Non-Same Property increased between 2019 and 2018 primarily as a result of depreciation and amortization of 1200 Peachtree, which was acquired in the first quarter of 2019; Spring & 8th, whose final phase commenced operations in the fourth quarter of 2018; and Terminus, which was consolidated in the fourth quarter of 2019 when we purchased our partner's interest in TOH.
Acquisition and Related Costs
Included in acquisition and related costs in 2019 are the costs associated with the Merger. These costs included legal, accounting, and financial advisory fees as well as the cost of due diligence work and the costs of combining the operations of TIER with the Company.
Income from Unconsolidated Joint Ventures
Income from unconsolidated joint ventures consisted of the following in 2019 and 2018 (in thousands):
Year Ended December 31, | ||||||||||||||
2019 | 2018 | $ Change | % Change | |||||||||||
Net operating income | $ | 32,413 | $ | 28,888 | $ | 3,525 | 12.2 | % | ||||||
Termination fee income | 16 | — | 16 | 100.0 | % | |||||||||
Other income | 148 | 2,899 | (2,751 | ) | (94.9 | )% | ||||||||
Depreciation and amortization | (14,158 | ) | (13,078 | ) | (1,080 | ) | 8.3 | % | ||||||
Interest expense | (5,738 | ) | (6,456 | ) | 718 | (11.1 | )% | |||||||
Net loss on sales | (15 | ) | (29 | ) | 14 | (48.3 | )% | |||||||
Income from unconsolidated joint ventures | $ | 12,666 | $ | 12,224 | $ | 442 | 3.6 | % | ||||||
Net operating income and depreciation and amortization increased between 2019 and 2018 primarily due to the commencement of operations in the first quarter of 2019 of Dimensional Place, the office building owned by the DC Charlotte Plaza LLLP joint venture, offset by the purchase of our partner's interest in TOH and our consolidation of TOH in the fourth quarter of 2019. Interest expenses decreased between 2019 and 2018 due to the consolidation of TOH in the fourth quarter of 2019.
Gain on Investment Property Transactions
The gain on investment property transactions for the year ended December 31, 2019 include the sale of our air rights that covered eight acres in Downtown Atlanta as well as the gain on the acquisition of TOH achieved in stages. Gain on investment property transactions in 2018 related primarily to the gain on the sale of land at the North Point project.
31
Net Income Attributable to Noncontrolling Interests
Net income attributable to noncontrolling interests includes the outside parties' share of the net income of CPLP as well as that of certain other consolidated entities.
Funds from Operations
The table below shows Funds from Operations Available to Common Stockholders (“FFO”), a non-GAAP financial measure, and the related reconciliation to net income available to common stockholders for the Company. The Company calculates FFO in accordance with the National Association of Real Estate Investment Trusts’ ("NAREIT") definition, which is net income available to common stockholders (computed in accordance with GAAP), excluding extraordinary items, cumulative effect of change in accounting principle and gains on sale or impairment losses on depreciable property, plus depreciation and amortization of real estate assets, and after adjustments for unconsolidated partnerships and joint ventures to reflect FFO on the same basis.
FFO is used by industry analysts and investors as a supplemental measure of a REIT’s operating performance. Historical cost accounting for real estate assets implicitly assumes that the value of real estate assets diminishes predictably over time. Since real estate values instead have historically risen or fallen with market conditions, many industry investors and analysts have considered presentation of operating results for real estate companies that use historical cost accounting to be insufficient by themselves. Thus, NAREIT created FFO as a supplemental measure of REIT operating performance that excludes historical cost depreciation, among other items, from GAAP net income. The use of FFO, combined with the required primary GAAP presentations, has been fundamentally beneficial, improving the understanding of operating results of REITs among the investing public and making comparisons of REIT operating results more meaningful. Our management evaluates operating performance in part based on FFO. Additionally, our management uses FFO, along with other measures, to assess performance in connection with evaluating and granting incentive compensation to our officers and other key employees.
The reconciliation of net income available to common stockholders to FFO is as follows for the years ended December 31, 2019 and 2018 (in thousands, except per share information):
Year Ended December 31, | |||||||
2019 | 2018 | ||||||
Net Income Available to Common Stockholders | $ | 150,418 | $ | 79,164 | |||
Depreciation and amortization of real estate assets: | |||||||
Consolidated properties | 255,349 | 179,510 | |||||
Share of unconsolidated joint ventures | 14,158 | 13,078 | |||||
Partners' share of real estate depreciation | (521 | ) | (302 | ) | |||
(Gain) loss on depreciated property transactions: | |||||||
Consolidated properties | (92,578 | ) | (4,925 | ) | |||
Share of unconsolidated joint ventures | 15 | 29 | |||||
Non-controlling interest related to unit holders | 1,952 | 1,345 | |||||
Funds From Operations | $ | 328,793 | $ | 267,899 | |||
Per Common Share — Diluted: | |||||||
Net Income Available | $ | 1.17 | $ | 0.75 | |||
Funds From Operations | $ | 2.53 | $ | 2.51 | |||
Weighted Average Shares — Diluted | 129,831 | 106,868 | |||||
Net Income and Net Operating Income
Company management evaluates the performance of its property portfolio in part based on NOI. NOI represents rental property revenues less rental property operating expenses. NOI is not a measure of cash flows or operating results as measured by GAAP, is not indicative of cash available to fund cash needs, and should not be considered an alternative to cash flows as a measure of liquidity. All companies may not calculate NOI in the same manner. The Company considers NOI to be an appropriate supplemental measure to net income as it helps both management and investors understand the core operations of the Company's operating assets. NOI excludes corporate general and administrative expenses, interest expense, depreciation and amortization, impairments, gains/loss on sales of real estate, and other non-operating items.
32
The following reconciles Net Income to Net Operating income for each of the periods presented (in thousands):
Year Ended December 31, | |||||||
2019 | 2018 | ||||||
Net income | $ | 152,683 | $ | 80,765 | |||
Fee income | (28,518 | ) | (10,089 | ) | |||
Termination fee income | (7,228 | ) | (1,548 | ) | |||
Other income | (246 | ) | (1,722 | ) | |||
Reimbursed expenses | 4,004 | 3,782 | |||||
General and administrative expenses | 37,007 | 22,040 | |||||
Interest expense | 53,963 | 39,430 | |||||
Depreciation and amortization | 257,149 | 181,382 | |||||
Acquisition and transaction costs | 52,881 | 248 | |||||
Other expenses | 1,109 | 556 | |||||
Gain on extinguishment of debt | — | (8 | ) | ||||
Income from unconsolidated joint ventures | (12,666 | ) | (12,224 | ) | |||
Gain on sale of investment properties | (110,761 | ) | (5,437 | ) | |||
Net Operating Income | $ | 399,377 | $ | 297,175 | |||
Liquidity and Capital Resources
Our primary short-term and long-term liquidity needs include the following:
• | property and land acquisitions; |
• | expenditures on development projects; |
• | building improvements, tenant improvements, and leasing costs; |
• | principal and interest payments on indebtedness; and |
• | common stock dividends and distributions to outside unitholders of CPLP. |
We may satisfy these needs with one or more of the following:
• | cash and cash equivalents on hand; |
• | net cash from operations; |
• | proceeds from the sale of assets; |
• | borrowings under our credit facility; |
• | proceeds from mortgage notes payable; |
• | proceeds from construction loans; |
• | proceeds from unsecured loans; |
• | proceeds from offerings of equity securities; and |
• | joint venture formations. |
Financial Condition
A key component of our strategy is to maintain a conservative balance sheet with leverage and liquidity that enables us to be positioned for future growth. Our leverage metrics at December 31, 2019, which include net debt to EBITDA, net debt to undepreciated assets, and net debt to total market capitalization, were among the strongest within our sector of public office REITS. As of December 31, 2019, and we had $251.5 million outstanding under our credit facility with the ability to borrow an additional $748.5 million under our credit facility. We also had $17.6 million in cash, cash equivalents, and restricted cash on hand at December 31, 2019.
33
Contractual Obligations and Commitments
At December 31, 2019, we were subject to the following contractual obligations and commitments (in thousands):
Total | Less than 1 Year | 1-3 Years | 3-5 Years | More than 5 Years | |||||||||||||||
Contractual Obligations: | |||||||||||||||||||
Company debt: | |||||||||||||||||||
Mortgage notes payable | $ | 716,593 | $ | 38,699 | $ | 118,770 | $ | 332,242 | $ | 226,882 | |||||||||
Unsecured Senior Notes | 1,000,000 | — | — | — | 1,000,000 | ||||||||||||||
Interest commitments (1) | 453,218 | 75,062 | 135,596 | 99,912 | 142,648 | ||||||||||||||
Unsecured term loan | 250,000 | — | 250,000 | — | — | ||||||||||||||
Unsecured Credit Facility | 251,500 | — | — | 251,500 | — | ||||||||||||||
Ground leases | 225,210 | 3,637 | 12,355 | 5,435 | 203,783 | ||||||||||||||
Other operating leases | 404 | 212 | 192 | — | — | ||||||||||||||
Total contractual obligations | $ | 2,896,925 | $ | 117,610 | $ | 516,913 | $ | 689,089 | $ | 1,573,313 | |||||||||
Commitments: | |||||||||||||||||||
Unfunded development and tenant improvement commitments | $ | 205,404 | $ | 205,404 | $ | — | $ | — | $ | — | |||||||||
Performance bonds | 1,102 | 1,076 | 26 | — | — | ||||||||||||||
Total commitments | $ | 206,506 | $ | 206,480 | $ | 26 | $ | — | $ | — | |||||||||
(1) | Interest on variable rate obligations is based on rates effective as of December 31, 2019. |
In addition, we have several standing or renewable service contracts mainly related to the operation of our buildings. These contracts were entered into in the ordinary course of business and are generally one year or less. These contracts are not included in the above table and are usually reimbursed in whole or in part by tenants.
Debt Associated with the Merger
In connection with the Merger, we assumed and immediately repaid $679.0 million in unsecured variable rate debt of TIER with our credit facility. We also assumed the Legacy Union One mortgage note with a $66.0 million principal balance and a fixed interest rate of 4.24%. Subsequent to the Merger, we closed a $650 million private placement of unsecured senior notes which were issued in three tranches with maturities from eight to ten years and a weighted average fixed interest rate of 3.88%. Proceeds from the unsecured senior notes were used to repay amounts outstanding under the credit facility incurred in the Merger.
Other Mortgage Loan Information
In 2019, we purchased our partner's interest in TOH. With this transaction, we consolidated TOH and recorded the assets and liabilities as fair value, assuming the venture's mortgage notes. Terminus 100 has a $118.1 million mortgage note, which is due in 2023 and has a 5.25% fixed interest rate. Terminus 200 has a $76.1 million mortgage note, which is due in 2023 and has a 3.79% fixed interest rate.
In 2018, we repaid in full the $22.2 million The Pointe mortgage note, without penalty.
In February 2020, we prepaid in full the $23.0 million Meridian Mark Plaza mortgage note, without penalty.
Our existing mortgage debt is non-recourse, fixed-rate mortgage loans secured by various real estate assets. We expect to either refinance our non-recourse mortgage loans at maturity or repay the mortgage loans with other capital resources, including our credit facility, unsecured debt, non-recourse mortgages, construction loans, the sale of assets, joint venture equity, the issuance of common stock, the issuance of preferred stock, or the issuance of units of CPLP.
Credit Facility Information
We have a $1 billion senior unsecured line of credit (the "Credit Facility") that matures on January 3, 2023. The Credit Facility contains financial covenants that require, among other things, the maintenance of an unencumbered interest coverage ratio of at least 1.75; a fixed charge coverage ratio of at least 1.50; a secured leverage ratio of no more than 40%; and an overall leverage ratio of no more than 60%. The Credit Facility also contains customary representations and warranties and affirmative
34
and negative covenants, as well as customary events of default. The amounts outstanding under the Credit Facility may be accelerated upon the occurrence of any events of default.
The interest rate applicable to the Credit Facility varies according to our leverage ratio, and may, at our election, be determined based on either (1) the current LIBOR plus a spread of between 1.05% and 1.45%, or (2) the greater of Bank of America's prime rate, the federal funds rate plus 0.50%, or the one-month LIBOR plus 1.0% (the "Base Rate"), plus a spread of between 0.10% or 0.45%, based on leverage.
At December 31, 2019, the Credit Facility's spread over LIBOR was 1.05%. The amount that we may draw under the Credit Facility is a defined calculation based on the Company's unencumbered assets and other factors. The total available borrowing capacity under the Credit Facility was $748.5 million at December 31, 2019.
Unsecured Senior Notes
At December 31, 2019, we had $1 billion in unsecured senior notes outstanding that were issued in five tranches with maturity dates that range from 2025 to 2029. The weighted average fixed interest rates on these notes is 3.91%.
The unsecured senior notes contain financial covenants that require, among other things, the maintenance of an unencumbered interest coverage ratio of at least 1.75; a fixed charge coverage ratio of at least 1.50; an overall leverage ratio of no more than 60%; and a secured leverage ratio of no more than 40%. The senior notes also contain customary representations and warranties and affirmative and negative covenants, as well as customary events of default.
Term Loan
We have a $250 million term loan that matures on December 2, 2021 (the "Term Loan"). The Term Loan contains financial covenants substantially consistent with those of the Credit Facility. The Term Loan bears interest at LIBOR plus a spread, based on our leverage ratio, as defined in the Term Loan.
Future Capital Requirements
To meet capital requirements for future investment activities over the long term, we intend to actively manage our portfolio of properties and strategically sell assets to exit our non-core holdings and reposition our portfolio of income-producing assets geographically. We expect to continue to utilize cash retained from operations as well third-party sources of capital such as indebtedness to fund future commitments as well as utilize construction facilities for some development assets, if available and under appropriate terms.
We may also generate capital through the issuance of securities that include common or preferred stock, warrants, debt securities, depositary shares or the issuance of CPLP limited partnership units.
Our business model is dependent upon raising or recycling capital to meet obligations and to fund development and acquisition activity. If one or more sources of capital are not available when required, we may be forced to reduce the number of projects we acquire or develop and/or raise capital on potentially unfavorable terms, or we may be unable to raise capital, which could have an adverse effect on our financial position or results of operations.
Cash Flows
We report and analyze our cash flows based on operating activities, investing activities, and financing activities. Cash, cash equivalents, and restricted cash totaled $17.6 million and $2.7 million at December 31, 2019 and 2018, respectively. See "Item 7. Management's Discussion and Analysis of Financial Condition and Results of Operations - Cash Flows" from our 2018 Annual Report on Form 10-K for a discussion of the changes in cash flows between 2018 and 2017. The following table sets forth the changes in cash flows (in thousands):
Year Ended December 31, | $ Change | ||||||||||
2019 | 2018 | ||||||||||
Net cash provided by operating activities | $ | 303,177 | $ | 229,034 | $ | 74,143 | |||||
Net cash used in investing activities | (357,424 | ) | (284,484 | ) | (72,940 | ) | |||||
Net cash provided by (used in) financing activities | 69,160 | (147,600 | ) | 216,760 | |||||||
The reasons for significant increases and decreases in cash flows between the periods are as follows:
Cash Flows from Operating Activities. Cash provided by operating activities increased $74.1 million between the 2019 and 2018 periods primarily due to net cash received from operations of properties acquired in the Merger, completed during the
35
second quarter of 2019, the commencement of operations at the second and final phase of Spring & 8th in the fourth quarter of 2018, and operations of 1200 Peachtree, which was acquired in the first quarter of 2019, offset by cash paid for Merger transaction costs.
Cash Flows from Investing Activities. Cash used in investing activities increased $72.9 million between the 2019 and 2018 periods primarily due to an increase in cash used for acquisitions and development due to the purchase of 1200 Peachtree, the purchase our partner's interest in Terminus Office Holdings LLC, and the development of new projects, offset by cash received in the Merger and cash received from the sale of land and air rights sales.
Cash Flows from Financing Activities. Cash flows from financing activities increased $216.8 million between the 2019 and 2018 periods primarily due to the increase in net borrowings during 2019, partially offset by an increase in dividends paid.
Capital Expenditures. We incur capital expenditures related to our real estate assets that include the acquisition of properties, the development of new properties, the redevelopment of existing or newly purchased properties, leasing costs for new or replacement tenants and ongoing property repairs and maintenance.
Capital expenditures for assets we develop or acquire and then hold and operate are included in the property acquisition, development, and tenant asset expenditures line item within investing activities on the statements of cash flows. Components of expenditures included in this line item for the years ended December 31, 2019 and 2018 are as follows (in thousands):
2019 | 2018 | ||||||
Acquisition of properties | 221,686 | — | |||||
Projects under development | 118,301 | 53,911 | |||||
Operating properties—building improvements | 27,970 | 20,027 | |||||
Operating properties—leasing costs | 91,726 | 65,164 | |||||
Purchase of land held for investment | 10,290 | 58,360 | |||||
Capitalized interest | 11,220 | 4,902 | |||||
Capitalized salaries | 6,331 | 3,168 | |||||
Accrued capital expenditures adjustment | (4,891 | ) | 18,104 | ||||
Total property acquisition, development and tenant asset expenditures | $ | 482,633 | $ | 223,636 | |||
Capital expenditures increased $259.0 million between December 31, 2019 and 2018 primarily due to the purchase of 1200 Peachtree, the purchase of our partner's interest in Terminus Office Holdings LLC, increases in spending for projects under development, and increases in building improvements on existing properties. Leasing costs, as well as some of the tenant improvements and capitalized personnel costs, are a function of the number and size of executed new leases or renewals of existing leases. The amount of tenant improvements and leasing costs on a per square foot basis for 2019 and 2018 were as follows:
2019 | 2018 | |||
New leases | $6.29 | $9.48 | ||
Renewal leases | $6.24 | $5.80 | ||
Expansion leases | $8.64 | $8.66 | ||
The amounts of tenant improvement and leasing costs on a per square foot basis vary by lease and by market. During the first quarter of 2019, the Company executed a new full-building lease at 1200 Peachtree with NS that had lower than average tenant improvement and leasing costs.
Dividends. We paid common dividends of $142.9 million and $107.2 million in 2019 and 2018, respectively. We funded these dividends with cash provided by operating activities. We expect to fund our future quarterly common dividends with cash provided by operating activities, also using proceeds from investment property sales, distributions from unconsolidated joint ventures, and indebtedness, if necessary.
On a quarterly basis, we review the amount of our common dividend in light of current and projected future cash provided by operating activities and also consider the requirements needed to maintain our REIT status. In addition, we have certain covenants under our Credit Facility which could limit the amount of common dividends paid. In general, common dividends of any amount can be paid as long as leverage, as defined in our credit agreements, is less than 60% and we are not in default under our facility. Certain conditions also apply in which we can still pay common dividends if leverage is above that amount. We routinely monitor the status of our common dividend payments in light of the covenants of our credit agreements.
36
Effects of Inflation. We attempt to minimize the effects of inflation on income from operating properties by providing periodic fixed-rent increases and/or pass-through of certain operating expenses of properties to tenants or, in certain circumstances, rents tied to tenants’ sales.
Off Balance Sheet Arrangements
General. We have a number of off balance sheet joint ventures with varying structures, as described in note 8 to our consolidated financial statements. The joint ventures in which we have an interest are involved in the ownership and/or development of real estate. A venture will fund capital requirements or operational needs with cash from operations or financing proceeds. If additional capital is deemed necessary, a venture may request a contribution from the partners, and we will evaluate such request. Except as previously discussed, based on the nature of the activities conducted in these ventures, management cannot estimate with any degree of accuracy amounts that we may be required to fund in the short or long-term. However, management does not believe that additional funding of these ventures will have a material adverse effect on our financial condition or results of operations.
Debt. At December 31, 2019, our unconsolidated joint ventures had aggregate outstanding indebtedness to third parties of $165.0 million. This debt represents mortgage or construction loans, most of which are non-recourse to us. In addition, in certain instances, we provide “non-recourse carve-out guarantees” on these non-recourse loans. We guarantee 12.5% of the loan amount related to the Carolina Square construction loan, which has a lending capacity of $79.8 million, and $75.7 million outstanding as of December 31, 2019.
Item 7A. | Quantitative and Qualitative Disclosure about Market Risk |
Our primary exposure to market risk results from our debt, which bears interest at both fixed and variable rates. We attempt to mitigate this risk by limiting our debt exposure in total and our maturities in any one year and weighting more towards fixed-rate debt in our portfolio. The fixed rate debt obligations limit the risk of fluctuating interest rates. At December 31, 2019, we had $1.7 billion of fixed rate debt outstanding at a weighted average interest rate of 3.97%. At December 31, 2018, we had $817.4 million of fixed rate debt outstanding at a weighted average interest rate of 3.86%. The amount of fixed-rate debt outstanding increased from 2018 to 2019 primarily due to the 2019 fundings of three tranches of senior unsecured notes for a total of $650 million, the assumption of the $66 million Legacy Union One mortgage note in the Merger with TIER, and the assumption of the $195 million mortgage notes when we purchased our partner's interest in TOH.
At December 31, 2019, we had $501.5 million of variable rate debt outstanding, which consisted of the Credit Facility with $251.5 million outstanding at an interest rate of 2.81% and the $250.0 million Term Loan with an interest rate of 2.96%. As of December 31, 2018, we had $250.0 million of variable rate debt outstanding, which consisted of the $250.0 million Term Loan with an interest rate of 3.70%. Based on our average variable rate debt balances in 2019, interest incurred would have increased by $3.9 million in 2019 if these interest rates had been 1% higher.
The information presented above should be read in conjunction with note 11 of notes to consolidated financial statements included in this Annual Report on Form 10-K. We did not have a significant level of notes receivable at December 31, 2019.
37
Item 8. | Financial Statements and Supplementary Data |
The consolidated financial statements, notes to consolidated financial statements, and report of independent registered public accounting firm are included on pages F-1 through F-33.
The following selected quarterly financial information (unaudited) for the years ended December 31, 2019 and 2018 should be read in conjunction with the consolidated financial statements and notes thereto included herein (in thousands, except per share amounts):
Quarters | |||||||||||||||
First | Second | Third | Fourth | ||||||||||||
2019 | (Unaudited) | ||||||||||||||
Revenues | $ | 132,733 | $ | 142,020 | $ | 188,323 | $ | 194,439 | |||||||
Income from unconsolidated joint ventures | 2,904 | 3,634 | 3,241 | 2,887 | |||||||||||
Gain (loss) on investment property transactions | 13,111 | 1,304 | (27 | ) | 96,373 | ||||||||||
Net income | 36,005 | (22,582 | ) | 20,692 | 118,568 | ||||||||||
Net income available to common stockholders | 35,341 | (22,409 | ) | 20,374 | 117,112 | ||||||||||
Basic and diluted net income per common share | $ | 0.34 | $ | (0.20 | ) | $ | 0.14 | $ | 0.80 | ||||||
Quarters | |||||||||||||||
First | Second | Third | Fourth | ||||||||||||
2018 | (Unaudited) | ||||||||||||||
Revenues | $ | 117,202 | $ | 116,628 | $ | 118,706 | $ | 122,676 | |||||||
Income from unconsolidated joint ventures | 2,885 | 5,036 | 2,252 | 2,051 | |||||||||||
Gain (loss) on investment property transactions | (372 | ) | 5,317 | (33 | ) | 525 | |||||||||
Net income | 16,406 | 21,749 | 19,859 | 22,751 | |||||||||||
Net income available to common stockholders | 16,043 | 21,276 | 19,485 | 22,360 | |||||||||||
Basic and diluted net income per common share | $ | 0.15 | $ | 0.20 | $ | 0.19 | $ | 0.21 | |||||||
Other financial statements and financial statement schedules required under Regulation S-X are filed pursuant to Item 15 of Part IV of this report.
During 2019, our quarterly results varied primarily as a result of the Merger with TIER, transactions with NS, acquisition of our partner's interest in TOH, as well as sales of assets. During 2018, our quarterly results varied as a result of the timing of the sales of assets, which generated gains within quarters of each year. Gains (losses) from sales of assets and investment property transactions were recorded within gain (loss) on investment property transactions and income from unconsolidated joint ventures.
Item 9. | Changes in and Disagreements with Accountants on Accounting and Financial Disclosure |
Not applicable.
Item 9A. | Controls and Procedures |
We maintain disclosure controls and procedures that are designed to ensure that information required to be disclosed in our Exchange Act reports is recorded, processed, summarized and reported within the time periods specified in the SEC’s rules and forms, and that such information is accumulated and communicated to management, including the Chief Executive Officer and Chief Financial Officer, as appropriate, to allow timely decisions regarding required disclosure. Management necessarily applied judgment in assessing the costs and benefits of such controls and procedures, which, by their nature, can provide only reasonable assurance regarding our control objectives.
As of the end of the period covered by this annual report, we carried out an evaluation, under the supervision and with the participation of management, including the Chief Executive Officer along with the Chief Financial Officer, of the effectiveness, design and operation of our disclosure controls and procedures (as defined in Exchange Act Rules 13a-15(e) and 15d-15(e)). Based upon the foregoing, the Chief Executive Officer along with the Chief Financial Officer concluded that our disclosure controls and procedures were effective. In addition, based on such evaluation we have identified no changes in our internal control over financial reporting that occurred during the most recent fiscal quarter that have materially affected, or are reasonably likely to materially affect, our internal control over financial reporting.
38
Report of Management on Internal Control over Financial Reporting
Management of the Company is responsible for establishing and maintaining adequate internal control over financial reporting, as such term is defined in Exchange Act Rule 13a-15(f). Internal control over financial reporting is a process designed to provide reasonable assurance regarding the reliability of financial reporting and the preparation of financial statements for external reporting purposes in accordance with GAAP. Internal control over financial reporting includes those policies and procedures that (1) pertain to the maintenance of records that, in reasonable detail, accurately and fairly reflect the transactions and dispositions of our assets; (2) provide reasonable assurance that transactions are recorded as necessary to permit preparation of financial statements in accordance with GAAP and that our receipts and expenditures are being made only in accordance with authorizations of our management and directors; and (3) provide reasonable assurance regarding prevention or timely detection of unauthorized acquisition, use or disposition of our assets that could have a material effect on the financial statements.
Management, under the supervision of and with the participation of the Chief Executive Officer and the Chief Financial Officer, assessed the effectiveness of our internal control over financial reporting as of December 31, 2019. The framework on which the assessment was based is described in “Internal Control – Integrated Framework” (2013) issued by the Committee of Sponsoring Organizations of the Treadway Commission. Based on this assessment, we concluded that we maintained effective internal control over financial reporting as of December 31, 2019. Deloitte & Touche LLP, our independent registered public accounting firm, issued an opinion on the effectiveness of our internal control over financial reporting as of December 31, 2019, which follows this report of management.
39
REPORT OF INDEPENDENT REGISTERED PUBLIC ACCOUNTING FIRM
To the Stockholders and Board of Directors of Cousins Properties Incorporated
Opinion on Internal Control over Financial Reporting
We have audited the internal control over financial reporting of Cousins Properties Incorporated and subsidiaries (the "Company") as of December 31, 2019, based on criteria established in Internal Control - Integrated Framework (2013) issued by the Committee of Sponsoring Organizations of the Treadway Commission (COSO). In our opinion, the Company maintained, in all material respects, effective internal control over financial reporting as of December 31, 2019, based on criteria established in Internal Control - Integrated Framework (2013) issued by COSO.
We have also audited, in accordance with the standards of the Public Company Accounting Oversight Board (United States) (PCAOB), the consolidated financial statements as of and for the year ended December 31, 2019, of the Company and our report dated February 5, 2020, expressed an unqualified opinion on those consolidated financial statements.
Basis for Opinion
The Company’s management is responsible for maintaining effective internal control over financial reporting and for its assessment of the effectiveness of internal control over financial reporting, included in the accompanying Report of Management on Internal Control over Financial Reporting. Our responsibility is to express an opinion on the Company’s internal control over financial reporting based on our audit. We are a public accounting firm registered with the PCAOB and are required to be independent with respect to the Company in accordance with the U.S. federal securities laws and the applicable rules and regulations of the Securities and Exchange Commission and the PCAOB.
We conducted our audit in accordance with the standards of the PCAOB. Those standards require that we plan and perform the audit to obtain reasonable assurance about whether effective internal control over financial reporting was maintained in all material respects. Our audit included obtaining an understanding of internal control over financial reporting, assessing the risk that a material weakness exists, testing and evaluating the design and operating effectiveness of internal control based on the assessed risk, and performing such other procedures as we considered necessary in the circumstances. We believe that our audit provides a reasonable basis for our opinion.
Definition and Limitations of Internal Control over Financial Reporting
A company’s internal control over financial reporting is a process designed to provide reasonable assurance regarding the reliability of financial reporting and the preparation of financial statements for external purposes in accordance with generally accepted accounting principles. A company’s internal control over financial reporting includes those policies and procedures that (1) pertain to the maintenance of records that, in reasonable detail, accurately and fairly reflect the transactions and dispositions of the assets of the company; (2) provide reasonable assurance that transactions are recorded as necessary to permit preparation of financial statements in accordance with generally accepted accounting principles, and that receipts and expenditures of the company are being made only in accordance with authorizations of management and directors of the company; and (3) provide reasonable assurance regarding prevention or timely detection of unauthorized acquisition, use, or disposition of the company’s assets that could have a material effect on the financial statements.
Because of its inherent limitations, internal control over financial reporting may not prevent or detect misstatements. Also, projections of any evaluation of effectiveness to future periods are subject to the risk that controls may become inadequate because of changes in conditions, or that the degree of compliance with the policies or procedures may deteriorate.
/s/ Deloitte & Touche LLP
Atlanta, Georgia
February 5, 2020
40
PART III
Item 10. | Directors, Executive Officers and Corporate Governance |
The information required by Items 401, 405, 406, and 407 of Regulation S-K is presented in item X in part I above and is included under the captions “Proposal 1 - Election of Directors” and “Delinquent Section 16(a) Reports” in the Proxy Statement relating to the 2020 Annual Meeting of the Registrant’s Stockholders, and is incorporated herein by reference. The Company has a Code of Business Conduct and Ethics (the “Code”) applicable to its Board of Directors and all of its employees. The Code is publicly available on the “Investor Relations” page of its website site at www.cousins.com. Section 1 of the Code applies to the Company’s senior executive and financial officers and is a “code of ethics” as defined by applicable SEC rules and regulations. If the Company makes any amendments to the Code other than technical, administrative or other non-substantive amendments, or grants any waivers, including implicit waivers, from a provision of the Code to the Company’s senior executive or financial officers, the Company will disclose on its website the nature of the amendment or waiver, its effective date and to whom it applies.
Item 11. | Executive Compensation |
The information required by Items 402 and 407 of Regulation S-K is included under the captions “Executive Compensation” “Director Compensation” and "Compensation Committee Interlocks and Insider Participation" in the Proxy Statement relating to the 2020 Annual Meeting of the Registrant’s Stockholders and is incorporated herein by reference.
Item 12. | Security Ownership of Certain Beneficial Owners and Management and Related Stockholder Matters |
The information under the captions “Beneficial Ownership of Common Stock” and "Equity Compensation Plan Information" in the Proxy Statement relating to the 2020 Annual Meeting of the Registrant’s Stockholders is incorporated herein by reference.
Item 13. | Certain Relationships and Related Transactions, and Director Independence |
The information under the caption “Certain Transactions” and “Director Independence” in the Proxy Statement relating to the 2020 Annual Meeting of the Registrant’s Stockholders is incorporated herein by reference.
Item 14. | Principal Accountant Fees and Services |
The information under the caption “Summary of Fees to Independent Registered Public Accounting Firm” in the Proxy Statement relating to the 2020 Annual Meeting of the Registrant’s Stockholders has fee information for fiscal years 2019 and 2018 and is incorporated herein by reference.
41
PART IV
Item 15. Exhibits and Financial Statement Schedules
(a) | 1. Financial Statements |
A. | The following consolidated financial statements of the Registrant, together with the applicable report of independent registered public accounting firm, are filed as a part of this report: |
Page Number | ||
Report of Independent Registered Public Accounting Firm | F-2 | |
Consolidated Balance Sheets—December 31, 2019 and 2018 | F-5 | |
Consolidated Statements of Operations for the Years Ended December 31, 2019, 2018, and 2017 | F-6 | |
Consolidated Statements of Equity for the Years Ended December 31, 2019, 2018, and 2017 | F-7 | |
Consolidated Statements of Cash Flows for the Years Ended December 31, 2019, 2018, and 2017 | F-8 | |
Notes to Consolidated Financial Statements | F-9 | |
2. | Financial Statement Schedule |
The following financial statement schedule for the Registrant is filed as a part of this report:
Page Number | ||
A. Schedule III—Real Estate and Accumulated Depreciation—December 31, 2019 | S-1 through S-4 | |
NOTE: Other schedules are omitted because of the absence of conditions under which they are required or because the required information is given in the financial statements or notes thereto.
(b) | Exhibits |
42
43
Cousins Properties Incorporated 2005 Restricted Stock Unit Plan — Form of Restricted Stock Unit Certificate for 2014-2016 Performance Period, filed as Exhibit 10(a)(xxxi) to the Registrant's Form 10-K for the year ended December 31, 2013, and incorporated herein by reference. | ||
44
45
101† | The following financial information for the Registrant, formatted in XBRL (Extensible Business Reporting Language): (i) the condensed consolidated balance sheets, (ii) the condensed consolidated statements of operations, (iii) the condensed consolidated statements of equity, (iv) the condensed consolidated statements of cash flows, and (v) the notes to condensed consolidated financial statements. | |
104† | Cover Page Interactive Data File. | |
* | Indicates a management contract or compensatory plan or arrangement. |
† | Filed herewith. |
46
SIGNATURES
Pursuant to the requirements of Section 13 or 15(d) of the Securities Exchange Act of 1934, the Registrant has duly caused this report to be signed on its behalf by the undersigned, thereunto duly authorized.
Cousins Properties Incorporated (Registrant) | ||||
Dated: | February 5, 2020 | |||
BY: | /s/ Gregg D. Adzema | |||
Gregg D. Adzema | ||||
Executive Vice President and Chief Financial Officer (Duly Authorized Officer and Principal Financial Officer) | ||||
Pursuant to the requirements of the Securities Exchange Act of 1934, this report has been signed below by the following persons on behalf of the Registrant and in the capacities and on the date indicated.
Signature | Capacity | Date | ||
/s/ M. Colin Connolly | Chief Executive Officer, President, and Director | February 5, 2020 | ||
M. Colin Connolly | (Principal Executive Officer) | |||
/s/ Gregg D. Adzema | Executive Vice President and Chief Financial Officer | February 5, 2020 | ||
Gregg D. Adzema | (Principal Financial Officer) | |||
/s/ John D. Harris, Jr. | Senior Vice President, Chief Accounting Officer, | February 5, 2020 | ||
John D. Harris, Jr. | Treasurer, and Assistant Secretary (Principal Accounting Officer) | |||
/s/ Lawrence L. Gellerstedt III | Executive Chairman of the Board | February 5, 2020 | ||
Lawrence L. Gellerstedt III | ||||
/s/ Charles T. Cannada | Director | February 5, 2020 | ||
Charles T. Cannada | ||||
/s/ Robert M. Chapman | Director | February 5, 2020 | ||
Robert M. Chapman | ||||
/s/ Scott W. Fordham | Director | February 5, 2020 | ||
Scott W. Fordham | ||||
/s/ Lillian C. Giornelli | Director | February 5, 2020 | ||
Lillian C. Giornelli | ||||
/s/ S. Taylor Glover | Lead Independent Director | February 5, 2020 | ||
S. Taylor Glover | ||||
/s/ R. Kent Griffin | Director | February 5, 2020 | ||
R. Kent Griffin | ||||
/s/ Donna W. Hyland | Director | February 5, 2020 | ||
Donna W. Hyland | ||||
/s/ R. Dary Stone | Director | February 5, 2020 | ||
R. Dary Stone | ||||
47
INDEX TO CONSOLIDATED FINANCIAL STATEMENTS
Cousins Properties Incorporated | Page |
Report of Independent Registered Public Accounting Firm | |
Consolidated Balance Sheets—December 31, 2019 and 2018 | |
Consolidated Statements of Operations for the Years Ended December 31, 2019, 2018, and 2017 | |
Consolidated Statements of Equity for the Years Ended December 31, 2019, 2018, and 2017 | |
Consolidated Statements of Cash Flows for the Years Ended December 31, 2019, 2018, and 2017 | |
Notes to Consolidated Financial Statements | |
REPORT OF INDEPENDENT REGISTERED PUBLIC ACCOUNTING FIRM
To the Stockholders and Board of Directors of
Cousins Properties Incorporated
Opinion on the Financial Statements
We have audited the accompanying consolidated balance sheets of Cousins Properties Incorporated and subsidiaries (the "Company") as of December 31, 2019 and 2018, the related consolidated statements of operations, stockholders' equity, and cash flows for each of the three years in the period ended December 31, 2019, and the related notes and the financial statement schedule listed in the Index at Item 15 (collectively referred to as the "financial statements"). In our opinion, the financial statements present fairly, in all material respects, the financial position of the Company as of December 31, 2019 and 2018, and the results of its operations and its cash flows for each of the three years in the period ended December 31, 2019, in conformity with accounting principles generally accepted in the United States of America.
We have also audited, in accordance with the standards of the Public Company Accounting Oversight Board (United States) (PCAOB), the Company's internal control over financial reporting as of December 31, 2019, based on criteria established in Internal Control - Integrated Framework (2013) issued by the Committee of Sponsoring Organizations of the Treadway Commission and our report dated February 5, 2020, expressed an unqualified opinion on the Company's internal control over financial reporting.
Basis for Opinion
These financial statements are the responsibility of the Company's management. Our responsibility is to express an opinion on the Company's financial statements based on our audits. We are a public accounting firm registered with the PCAOB and are required to be independent with respect to the Company in accordance with the U.S. federal securities laws and the applicable rules and regulations of the Securities and Exchange Commission and the PCAOB.
We conducted our audits in accordance with the standards of the PCAOB. Those standards require that we plan and perform the audit to obtain reasonable assurance about whether the financial statements are free of material misstatement, whether due to error or fraud. Our audits included performing procedures to assess the risks of material misstatement of the financial statements, whether due to error or fraud, and performing procedures that respond to those risks. Such procedures included examining, on a test basis, evidence regarding the amounts and disclosures in the financial statements. Our audits also included evaluating the accounting principles used and significant estimates made by management, as well as evaluating the overall presentation of the financial statements. We believe that our audits provide a reasonable basis for our opinion.
Critical Audit Matters
The critical audit matters communicated below are matters arising from the current-period audit of the financial statements that were communicated or required to be communicated to the audit committee and that (1) relate to accounts or disclosures that are material to the financial statements and (2) involved our especially challenging, subjective, or complex judgments. The communication of critical audit matters does not alter in any way our opinion on the financial statements, taken as a whole, and we are not, by communicating the critical audit matters below, providing separate opinions on the critical audit matters or on the accounts or disclosures to which they relate.
Operating Properties and Investments in Unconsolidated Joint Ventures - Impairment - Refer to Notes 2 and 8 to the financial statements
Critical Audit Matter Description
The Company’s operating properties and investments in unconsolidated joint ventures are evaluated for potential impairment on a quarterly basis or whenever events or changes in circumstances indicate that an operating property’s carrying amount may not be recoverable, or an investment in an unconsolidated joint venture may be other than temporarily impaired. As part of the Company’s quarterly impairment indicator analysis, management considers numerous potential indicators of impairment of operating properties, including operating properties held by unconsolidated joint ventures. These indicators could include a decline in a property’s leasing percentage, a current period operating loss or negative cash flows combined with a history of losses at the property, a decline in lease rates for that property or others in the property's market, a significant change in the market value of the property, or an adverse change in the financial conditions of significant tenants at the property. As of December 31, 2019, the carrying value of the Company’s operating properties totaled $5.7 billion and the carrying value of its investments
F-2
in unconsolidated joint ventures, net of certain negative balances included in deferred income on the consolidated balance sheet, totaled $114.2 million.
The identification of impairment indicators for operating properties and investments in unconsolidated joint ventures requires management to make significant judgments with respect to the operating properties and market conditions. Given the subjectivity in identifying those events and changes in circumstances, the audit procedures involve especially subjective judgment and an increased extent of effort.
How the Critical Audit Matter Was Addressed in the Audit
Our audit procedures related to our evaluation of the Company’s determination of the presence of impairment indicators at operating properties and investments in unconsolidated joint ventures included the following, among others:
◦ | We tested the effectiveness of controls over the quarterly impairment indicator analysis for operating properties and investments in unconsolidated joint ventures. |
◦ | We tested the completeness and accuracy of management’s impairment analysis by: |
• | Evaluating whether all operating properties and investments in joint ventures are included in the impairment analysis. |
• | Evaluating management's process for identifying impairment indicators at operating properties and operating properties within unconsolidated joint ventures. |
• | Developing an independent expectation of potential impairment indicators and compared such expectations to those included in the impairment analysis. |
Transactions with Norfolk Southern Railway Company - Refer to Note 4 to the financial statements
Critical Audit Matter Description
On March 1, 2019, the Company entered into a series of agreements and executed related transactions with Norfolk Southern Railway Company (“NS”) including the sale of land to NS, the execution of development and consulting agreements, and the acquisition of a building from NS (“1200 Peachtree”) subject to a three-year market rate lease with NS. The Company determined that all contracts and transactions associated with NS should be combined for accounting purposes and that the amounts exchanged under the combined contracts should be allocated to the various components of the overall transaction at fair value or market value. The consideration related to the various services provided to NS (which totaled $52.3 million) included non-cash consideration of the $10.3 million discount on the purchase of 1200 Peachtree and cash consideration of $5 million from the land sale contract (the difference between the fair value and the contract value.) Since all of the agreements and contracts above were executed for the purpose of delivering and constructing a corporate headquarters for NS and all of the services and deliverables are highly interdependent, the Company determined that the services represent a single performance obligation. The acquisition date fair value of 1200 Peachtree was $92.3 million and the revenue recognized related to the services provided to NS during the year ended December 31, 2019 was $21.4 million.
Given the complexities associated with the accounting for the transactions with NS, and the related management judgments, including combining the contracts for accounting purposes, allocating the amounts exchanged under the combined contracts to the various components, and including the $10.3 million discount on 1200 Peachtree as non-cash consideration for services provided to NS, performing the audit procedures to evaluate the transactions with NS involved a high degree of auditor judgment and an increased extent of effort.
How the Critical Audit Matter Was Addressed in the Audit
Our audit procedures related to our evaluation of the Company’s accounting for the transactions with NS included the following, among others:
◦ | We tested the effectiveness of controls over the Company’s accounting analysis for the NS contracts, including combining the contracts for accounting purposes, allocating the amounts exchanged under the combined contracts to the various components, and including the $10.3 million discount on 1200 Peachtree as non-cash consideration for services provided to NS. |
◦ | With the assistance of professionals in our firm having expertise in the revenue and lease accounting, we evaluated management’s conclusions related to the transactions with NS in accordance with the applicable accounting standards. |
◦ | With the assistance of our fair value specialists, we assessed the reasonableness of the valuation assumptions, including the discount and capitalization rates, used to determine the fair value of 1200 Peachtree. |
F-3
Merger with TIER REIT Inc. - Refer to Notes 2 and 3 to the financial statements
Critical Audit Matter Description
On June 14, 2019, TIER REIT, Inc. (“TIER”) merged with and in to a subsidiary of the Company (the “Merger”). Each share of TIER common stock issued and outstanding immediately prior to the Merger, was converted into 2.98 newly issued, pre-reverse split shares of the Company’s common stock with fractional shares being settled in cash. In the Merger, former TIER common stockholders received approximately 166 million pre-reverse split shares of common stock of the Company. The Merger has been accounted for as a business combination with the Company as the accounting acquirer, which requires, among other things, that the assets acquired and liabilities assumed be recognized at their acquisition date fair value. The total purchase price for the Merger was $1.6 billion, which included real estate assets, net of intangible liabilities, of $2.2 billion.
A key accounting judgment in evaluating the Merger transaction is the conclusion to account for the transaction as a business combination. Given the complexity of evaluating the applicable accounting guidance, this aspect of the accounting for the Merger required especially subjective auditor judgment and an increased extent of effort.
Additionally, the real estate assets were recorded at their fair market values based on the purchase price allocations prepared by management (who engaged a third-party valuation specialist). The determination of fair value of each real estate asset acquired and liability assumed by management requires judgment and is based on estimated cash flow projections that utilize available market information, including discount rates and capitalization rates. Performing audit procedures to evaluate the reasonableness of such assumptions required a high degree of auditor judgment and an increased extent of effort, including the need to involve internal fair value specialists.
How the Critical Audit Matter Was Addressed in the Audit
Our audit procedures related to our evaluation of the Company’s accounting for the Merger and the relative fair value of the real estate assets acquired and liabilities assumed in the Merger included the following, among others:
◦ | We tested the effectiveness of the Company’s controls over the accounting for the Merger which included testing of management’s controls related to the conclusion to account for the Merger as a business combination and related to the purchase price allocation, including management’s engagement and supervision of a third-party valuation specialist to assist with valuing the real estate assets acquired and liabilities assumed in the Merger. |
◦ | With the assistance of professionals in our firm having expertise in the accounting for business combinations, we evaluated management’s conclusion to account for the Merger as a business combination. |
◦ | With the assistance of our fair value specialists, we assessed the reasonableness of the valuation assumptions utilized by management, specifically the discount and capitalization rates, in the fair value analysis. |
/s/ Deloitte & Touche LLP
Atlanta, Georgia
February 5, 2020
We have served as the Company's auditor since 2002.
F-4
COUSINS PROPERTIES INCORPORATED AND SUBSIDIARIES CONSOLIDATED BALANCE SHEETS (In thousands, except share and per share amounts) | |||||||
December 31, | |||||||
2019 | 2018 | ||||||
Assets: | |||||||
Real estate assets: | |||||||
Operating properties, net of accumulated depreciation of $577,139 and $421,495 in 2019 and 2018, respectively | $ | $ | |||||
Projects under development | |||||||
Land | |||||||
Real estate assets and other assets held for sale, net of accumulated depreciation and amortization of $61,093 in 2019 | |||||||
Cash and cash equivalents | |||||||
Restricted cash | |||||||
Notes and accounts receivable | |||||||
Deferred rents receivable | |||||||
Investment in unconsolidated joint ventures | |||||||
Intangible assets, net | |||||||
Other assets | |||||||
Total assets | $ | $ | |||||
Liabilities: | |||||||
Notes payable | $ | $ | |||||
Accounts payable and accrued expenses | |||||||
Deferred income | |||||||
Intangible liabilities, net of accumulated amortization of $55,798 and $42,473 in 2019 and 2018, respectively | |||||||
Other liabilities | |||||||
Liabilities of real estate assets held for sale, net of accumulated amortization of $7,771 in 2019 | |||||||
Total liabilities | |||||||
Commitments and contingencies | |||||||
Equity: | |||||||
Stockholders' investment: | |||||||
Preferred stock, $1 par value, 20,000,000 shares authorized, 1,716,837 shares issued and outstanding in 2019 and 2018 | |||||||
Common stock, $1 par value, 300,000,000 and 175,000,000 shares authorized in 2019 and 2018, respectively, and 149,347,382 and 107,681,130 shares issued in 2019 and 2018, respectively | |||||||
Additional paid-in capital | |||||||
Treasury stock at cost, 2,584,933 shares in 2019 and 2018 | ( | ) | ( | ) | |||
Distributions in excess of cumulative net income | ( | ) | ( | ) | |||
Total stockholders' investment | |||||||
Nonredeemable noncontrolling interests | |||||||
Total equity | |||||||
Total liabilities and equity | $ | $ | |||||
See notes to consolidated financial statements.
F-5
COUSINS PROPERTIES INCORPORATED AND SUBSIDIARIES CONSOLIDATED STATEMENTS OF OPERATIONS (In thousands, except per share amounts) | |||||||||||
Year Ended December 31, | |||||||||||
2019 | 2018 | 2017 | |||||||||
Revenues: | |||||||||||
Rental property revenues | $ | $ | $ | ||||||||
Fee income | |||||||||||
Other | |||||||||||
Expenses: | |||||||||||
Rental property operating expenses | |||||||||||
Reimbursed expenses | |||||||||||
General and administrative expenses | |||||||||||
Interest expense | |||||||||||
Depreciation and amortization | |||||||||||
Transaction costs | |||||||||||
Other | |||||||||||
Income from unconsolidated joint ventures | |||||||||||
Gain on investment property transactions | |||||||||||
Gain on extinguishment of debt | |||||||||||
Net income | |||||||||||
Net income attributable to noncontrolling interests | ( | ) | ( | ) | ( | ) | |||||
Net income available to common stockholders | $ | $ | $ | ||||||||
Net income per common share — basic and diluted | $ | $ | $ | ||||||||
Weighted average shares — basic | |||||||||||
Weighted average shares — diluted | |||||||||||
Dividends declared per common share | $ | $ | $ | ||||||||
See notes to consolidated financial statements.
F-6
COUSINS PROPERTIES INCORPORATED AND SUBSIDIARIES
CONSOLIDATED STATEMENTS OF EQUITY
(In thousands, except per share data)
Preferred Stock | Common Stock | Additional Paid-In Capital | Treasury Stock | Distributions in Excess of Cumulative Net Income | Stockholders’ Investment | Nonredeemable Noncontrolling Interests | Total Equity | |||||||||||||||||||||||||
Balance December 31, 2016 | $ | $ | $ | $ | ( | ) | $ | ( | ) | $ | $ | $ | ||||||||||||||||||||
Net income | — | — | — | — | ||||||||||||||||||||||||||||
Common stock offering, net of issuance costs | — | — | — | — | ||||||||||||||||||||||||||||
Common stock issuance pursuant to stock based compensation | — | — | — | — | ||||||||||||||||||||||||||||
Spin-off of Parkway, Inc. | — | — | — | — | — | |||||||||||||||||||||||||||
Common stock redemption by unit holders | — | — | — | ( | ) | |||||||||||||||||||||||||||
Amortization of stock options and restricted stock, net of forfeitures | — | — | — | — | — | |||||||||||||||||||||||||||
Contributions from nonredeemable noncontrolling interests | — | — | — | — | — | — | ||||||||||||||||||||||||||
Distributions to nonredeemable noncontrolling interests | — | — | — | — | — | — | ( | ) | ( | ) | ||||||||||||||||||||||
Common dividends ($1.20 per share) | — | — | — | — | ( | ) | ( | ) | — | ( | ) | |||||||||||||||||||||
Balance December 31, 2017 | ( | ) | ( | ) | ||||||||||||||||||||||||||||
Net income | — | — | — | — | ||||||||||||||||||||||||||||
Common stock issued pursuant to stock based -- compensation | — | ( | ) | ( | ) | — | ( | ) | — | ( | ) | |||||||||||||||||||||
Cumulative effect of change in accounting principle | — | — | — | — | — | |||||||||||||||||||||||||||
Amortization of stock options and restricted stock, net of forfeitures | — | ( | ) | — | — | — | ||||||||||||||||||||||||||
Contributions from nonredeemable noncontrolling interest | — | — | — | — | — | — | ||||||||||||||||||||||||||
Distributions to nonredeemable noncontrolling interest | — | — | — | — | — | — | ( | ) | ( | ) | ||||||||||||||||||||||
Common dividends ($1.04 per share) | — | — | — | — | ( | ) | ( | ) | — | ( | ) | |||||||||||||||||||||
Balance December 31, 2018 | ( | ) | ( | ) | ||||||||||||||||||||||||||||
Net income | — | — | — | — | ||||||||||||||||||||||||||||
Common stock issued in merger | — | — | — | — | ||||||||||||||||||||||||||||
Common stock issued pursuant to stock based compensation | — | — | — | — | ||||||||||||||||||||||||||||
Amortization of stock options and restricted stock, net of forfeitures | — | ( | ) | — | — | — | ||||||||||||||||||||||||||
Nonredeemable noncontrolling interests acquired in merger | — | — | — | — | — | — | ||||||||||||||||||||||||||
Contributions from nonredeemable noncontrolling interests | — | — | — | — | — | — | ||||||||||||||||||||||||||
Distributions to nonredeemable noncontrolling interests | — | — | — | — | — | — | ( | ) | ( | ) | ||||||||||||||||||||||
Common dividends ($1.16 per share) | — | — | — | — | ( | ) | ( | ) | — | ( | ) | |||||||||||||||||||||
Balance December 31, 2019 | $ | $ | $ | $ | ( | ) | $ | ( | ) | $ | $ | $ | ||||||||||||||||||||
See notes to consolidated financial statements.
F-7
COUSINS PROPERTIES INCORPORATED AND SUBSIDIARIES CONSOLIDATED STATEMENTS OF CASH FLOWS (In thousands) | |||||||||||
Year Ended December 31, | |||||||||||
2019 | 2018 | 2017 | |||||||||
CASH FLOWS FROM OPERATING ACTIVITIES: | |||||||||||
Net income | $ | $ | $ | ||||||||
Adjustments to reconcile net income to net cash provided by operating activities: | |||||||||||
Gain on investment property transactions | ( | ) | ( | ) | ( | ) | |||||
Depreciation and amortization | |||||||||||
Amortization of deferred financing costs and premium on notes payable | ( | ) | |||||||||
Stock-based compensation expense, net of forfeitures | |||||||||||
Effect of non-cash adjustments to rental revenues | ( | ) | ( | ) | ( | ) | |||||
Income from unconsolidated joint ventures | ( | ) | ( | ) | ( | ) | |||||
Operating distributions from unconsolidated joint ventures | |||||||||||
Gain on extinguishment of debt | ( | ) | ( | ) | |||||||
Changes in other operating assets and liabilities: | |||||||||||
Change in other receivables and other assets, net | ( | ) | ( | ) | |||||||
Change in operating liabilities, net | ( | ) | |||||||||
Net cash provided by operating activities | |||||||||||
CASH FLOWS FROM INVESTING ACTIVITIES: | |||||||||||
Proceeds from investment property sales | |||||||||||
Proceeds from sale of interest in unconsolidated joint venture | |||||||||||
Property acquisition, development, and tenant asset expenditures | ( | ) | ( | ) | ( | ) | |||||
Cash and restricted cash acquired in merger | |||||||||||
Purchase of tenant-in-common interest | ( | ) | |||||||||
Investment in unconsolidated joint ventures | ( | ) | ( | ) | ( | ) | |||||
Distributions from unconsolidated joint ventures | |||||||||||
Change in notes receivable and other assets | ( | ) | ( | ) | |||||||
Other | ( | ) | |||||||||
Net cash provided by (used in) investing activities | ( | ) | ( | ) | |||||||
CASH FLOWS FROM FINANCING ACTIVITIES: | |||||||||||
Proceeds from credit facility | |||||||||||
Repayment of credit facility | ( | ) | ( | ) | ( | ) | |||||
Repayment of notes payable | ( | ) | ( | ) | ( | ) | |||||
Issuance of unsecured senior notes | |||||||||||
Payment of deferred financing costs | ( | ) | ( | ) | ( | ) | |||||
Common stock issued, net of expenses | |||||||||||
Contributions from noncontrolling interests | |||||||||||
Distributions to nonredeemable noncontrolling interests | ( | ) | ( | ) | ( | ) | |||||
Common dividends paid | ( | ) | ( | ) | ( | ) | |||||
Other | ( | ) | ( | ) | ( | ) | |||||
Net cash provided by (used in) financing activities | ( | ) | ( | ) | |||||||
NET INCREASE (DECREASE) IN CASH, CASH EQUIVALENTS, AND RESTRICTED CASH | ( | ) | |||||||||
CASH, CASH EQUIVALENTS, AND RESTRICTED CASH AT BEGINNING OF PERIOD | |||||||||||
CASH, CASH EQUIVALENTS, AND RESTRICTED CASH AT END OF PERIOD | $ | $ | $ | ||||||||
See notes to consolidated financial statements.
F-8
COUSINS PROPERTIES INCORPORATED AND SUBSIDIARIES
NOTES TO CONSOLIDATED FINANCIAL STATEMENTS
1. | DESCRIPTION OF BUSINESS AND BASIS OF PRESENTATION |
Description of Business: Cousins Properties Incorporated (“Cousins”), a Georgia corporation, is a self-administered and self-managed real estate investment trust (“REIT”). Cousins conducts substantially all of its business through Cousins Properties, LP ("CPLP"). Cousins owns approximately 99 % of CPLP and consolidates CPLP. CPLP owns Cousins TRS Services LLC ("CTRS") a taxable entity which owns and manages its own real estate portfolio and performs certain real estate related services for other parties.
Cousins, CPLP, CTRS, and their subsidiaries (collectively, the “Company”) develop, acquire, lease, manage, and own primarily Class A office properties and opportunistic mixed-use developments in the Sunbelt markets of the United States with a focus on Georgia, Texas, North Carolina, Arizona, and Florida. Cousins has elected to be taxed as a REIT and intends to, among other things, distribute at least 100 % of its net taxable income to stockholders, thereby eliminating any liability for federal income taxes under current law. Therefore, the results included herein do not include a federal income tax provision for Cousins. As of December 31, 2019, the Company’s portfolio of real estate assets consisted of interests in 21.5 million square feet of office space and 310,000 square feet of mixed-use space.
Basis of Presentation: The consolidated financial statements include the accounts of the Company and its consolidated partnerships and wholly-owned subsidiaries. Intercompany transactions and balances have been eliminated in consolidation. The Company presents its financial statements in accordance with accounting principles generally accepted in the United States (“GAAP”) as outlined in the Financial Accounting Standard Board’s Accounting Standards Codification (the “Codification” or “ASC”). The Codification is the single source of authoritative accounting principles applied by nongovernmental entities in the preparation of financial statements in conformity with GAAP.
On June 14, 2019, the Company restated and amended its articles of incorporation to effect a reverse stock split of the issued and outstanding shares of its common and preferred stock pursuant to which (1) each four shares of the Company's issued and outstanding common stock were combined into one share of the Company's common or preferred stock, respectively, and (2) the authorized number of the Company's common stock was proportionally reduced to 175 million shares. Fractional shares of common stock resulting from the reverse stock split were settled in cash. Preferred stock was redeemed with each four shares combined into one share; fractional shares of preferred stock were redeemed without payout. Immediately thereafter, the Company further amended its articles of incorporation to increase the number of authorized shares of its common stock from 175 million to 300 million shares. All shares of common stock, stock options, restricted stock units, and per share information presented in the consolidated financial statements have been adjusted to reflect the reverse stock split on a retroactive basis for all periods presented.
For the three years ended December 31, 2019, there were no items of other comprehensive income. Therefore, the Company did not present comprehensive income. Additionally, certain subtotals within the consolidated statements of operations for the years ended December 31, 2018 and 2017 were removed to conform to the current period presentation.
On January 1, 2019, the Company began recording lease termination fees in rental property revenues on the consolidated statements of operations as a result of the adoption of Accounting Standards Update ("ASU") 2016-02, "Leases," ("ASC 842"). The prior period amounts, which were included in other revenues, were reclassified to conform to the current period presentation.
Recently Issued Accounting Standards: On January 1, 2019, the Company adopted ASC 842, which amended the previous standard for lease accounting by requiring lessees to record most leases on their balance sheets and by making targeted changes to lessor accounting and reporting. The new standard requires lessees to record a right-of-use asset and a lease liability for leases and classify such leases as either finance or operating leases based on the principle of whether the lease is effectively a financed purchase of the leased asset by the lessee. The classification of the leases determines whether the lease expense is recognized based on an effective interest method (finance leases) or on a straight-line basis over the term of the lease (operating leases). The new standard also revised the treatment of indirect leasing costs and permits the capitalization and amortization of direct leasing costs only. For the years ended December 31, 2018 and 2017, the Company capitalized $3.8 million and $3.0 million of indirect leasing costs, respectively.
F-9
The Company adopted the following optional practical expedients provided in ASC 842:
•no reassessment of any expired or existing contracts to determine if they contain a lease;
•no reassessment of initial direct costs for any existing leases;
•no recognition of right-of-use assets and lease liabilities for leases with a term of one year or less;
• | no separate classification and disclosure of non-lease components of revenue in lease contracts from the related lease components provided certain conditions are met; and |
• | no reassessment of the lease classification. |
For those leases where the Company was the lessee, specifically ground leases, the adoption of ASC 842 required the Company to record a right-of-use asset and a lease liability in the amount of $56.3 million on the condensed consolidated balance sheet. In calculating the right of use asset and lease liability, the Company used a weighted average discount rate of 4.49 %, which represented the Company's incremental borrowing rate related to the ground lease assets as of January 1, 2019. Ground leases executed before the adoption of ASC 842 are accounted for as operating leases and did not result in a materially different ground lease expense. However, most ground leases executed after the adoption of ASC 842 are expected to be accounted for as finance leases, which will result in ground lease expense being recorded using the effective interest method instead of the straight-line method over the term of the lease, resulting in higher expense associated with the ground lease in the earlier years of a ground lease when compared to the straight line method. The Company used the "modified retrospective" method upon adoption of ASC 842, which permitted application of the new standard on the adoption date as opposed to the earliest comparative period presented in its financial statements. For additional disclosures, see note 6 "Leases" and note 14 "Revenue Recognition"
On January 1, 2018, the Company adopted ASU 2017-05, “Other Income - Gains and Losses from the Derecognition of Nonfinancial Assets (Subtopic 610-20): Clarifying the Scope of Asset Derecognition Guidance and Accounting for Partial Sales of Nonfinancial Assets” (“ASU 2017-05"). As a result of the adoption of ASU 2017-05, the Company recorded a cumulative effect from change in accounting principle, which credited distributions in excess of cumulative net income by $22.3 million. This cumulative effect adjustment resulted from the 2013 transfer of a wholly-owned property to an entity in which it had a noncontrolling interest.
2. | SIGNIFICANT ACCOUNTING POLICIES |
Real Estate Assets
Cost Capitalization: Costs related to planning, developing, leasing, and constructing a property, including costs of development personnel working directly on projects under development, are capitalized. In addition, the Company capitalizes interest to qualifying assets under development based on average accumulated expenditures outstanding during the period. In capitalizing interest to qualifying assets, the Company first uses the interest incurred on specific project debt, if any, and next uses the Company’s weighted average interest rate for non-project specific debt. The Company also capitalizes interest to investments accounted for under the equity method when the investee has property under development with a carrying value in excess of the investee’s borrowings. To the extent debt exists within an unconsolidated joint venture during the construction period, the venture capitalizes interest on that venture-specific debt.
The Company capitalizes interest, real estate taxes, and certain operating expenses on the unoccupied portion of recently completed development properties from the date a project is substantially complete to the earlier of (1) the date on which the project achieves 90 % economic occupancy or (2) one year after it is substantially complete.
Impairment: For real estate assets that are considered to be held for sale according to accounting guidance, the Company records impairment losses if the fair value of the asset or disposal group net of estimated selling costs is less than the carrying amount. For those long-lived assets that are held and used according to accounting guidance, management reviews each asset for the existence of any indicators of impairment. If indicators of impairment are present, the Company calculates the expected undiscounted future cash flows to be derived from such assets. If the undiscounted cash flows are less than the carrying amount of the asset, the Company reduces the asset to its fair value and records an impairment loss.
F-10
Acquisition of Real Estate Assets: The Company evaluates all real estate acquisitions to determine if the transactions qualify as an acquisition of assets or of a business within the framework of ASU 2017-01 and guidance in ASC 805. If the Company determines that substantially all of the fair value is concentrated in a single identifiable asset or group of similar assets, the Company will account for the acquisition as an acquisition of assets and not a business. If the Company determines that there is no single or group of assets that make up substantially all of the fair value of assets acquired, the Company must determine whether the acquired set of assets includes an input and substantial processes which create an output. Based on the facts of the transactions and guidance in ASC 805, if the Company determines that an input and substantial processes that create an output are present, the Company will account for the acquisition as an acquisition of a business.
For acquisitions that are accounted for as an acquisition of an asset, the Company records the acquired tangible and intangible assets and assumed liabilities based on each asset and liability's relative fair value at the acquisition date to the total purchase price plus capitalized acquisition costs. For acquisitions that are accounted for as an acquisition of a business, the Company records the acquired tangible and intangible assets and assumed liabilities at fair value at the acquisition date. The acquired assets and assumed liabilities for an operating property acquisition generally include but are not limited to: land, buildings and improvements, and identified tangible and intangible assets and liabilities associated with in-place leases, including leasing costs, value of above-market and below-market tenant leases, value of above-market and below-market ground leases, acquired in-place lease values, and tenant relationships, if any.
The fair value of land is derived from comparable sales of land within the same submarket and/or region. The fair value of buildings and improvements, tenant improvements, and leasing costs are based upon current market replacement costs and other relevant market rate information.
The fair value of the above-market or below-market component of an acquired lease is based upon the present value (calculated using a market discount rate) of the difference between (i) the contractual rents to be paid pursuant to the lease over its remaining term and (ii) management’s estimate of the rents that would be paid using fair market rental rates and rent escalations at the date of acquisition over the remaining term of the lease. The amounts recorded for above-market and below-market ground leases are included in intangible liabilities and intangible assets, respectively, and are amortized on a straight-line basis into rental property revenues over the remaining terms of the applicable leases.
The fair value of acquired in-place leases is derived based on management’s assessment of lost revenue and costs incurred for the period required to lease the “assumed vacant” property to the occupancy level when purchased. The amount recorded for acquired in-place leases is included in intangible assets and amortized as an increase to depreciation and amortization expense over the remaining term of the applicable leases.
Depreciation and Amortization: Real estate assets are stated at depreciated cost less impairment losses, if any. Buildings are depreciated over their estimated useful lives, which range generally from 30 to 42 years. The life of a particular building depends upon a number of factors including whether the building was developed or acquired and the condition of the building upon acquisition. Furniture, fixtures, and equipment are depreciated over their estimated useful lives of three to five years . Tenant improvements, leasing costs, and leasehold improvements are amortized over the term of the applicable leases or the estimated useful life of the assets, whichever is shorter. The Company accelerates the depreciation of tenant assets if it estimates that the lease term will end prior to the termination date. This acceleration may occur if a tenant files for bankruptcy, vacates its premises, or defaults in another manner on its lease. Deferred expenses are amortized over the period of estimated benefit. The Company uses the straight-line method for all depreciation and amortization.
Investment in Joint Ventures
For joint ventures that the Company does not control, but over which it exercises significant influence, the Company uses the equity method of accounting. The Company's judgment with regard to its level of influence or control of an entity involves consideration of various factors including the form of its ownership interest; its representation in the entity's governance; its ability to participate in policy-making decisions; and the rights of other investors to participate in the decision-making process, to replace the Company as manager, and/or to liquidate the venture. These ventures are recorded at cost and adjusted for equity in earnings (losses) and cash contributions and distributions. Any difference between the carrying amount of these investments on the Company’s balance sheet and the underlying equity in net assets on the joint venture’s balance sheet is adjusted as the related underlying assets are depreciated, amortized, or sold. The Company generally allocates income and loss from an unconsolidated joint venture based on the venture's distribution priorities, which may be different from its stated ownership percentage.
The Company evaluates the recoverability of its investment in unconsolidated joint ventures in accordance with accounting standards for equity investments by first reviewing each investment for any indicators of impairment. If indicators are present, the Company estimates the fair value of the investment. If the carrying value of the investment is greater than the estimated fair
F-11
value, management makes an assessment of whether the impairment is “temporary” or “other-than-temporary.” In making this assessment, management considers the following: (1) the length of time and the extent to which fair value has been less than cost, (2) the financial condition and near-term prospects of the entity, and (3) the Company’s intent and ability to retain its interest long enough for a recovery in market value. If management concludes that the impairment is "other than temporary," the Company reduces the investment to its estimated fair value.
Noncontrolling Interest
The Company consolidates CPLP and certain joint ventures in which it owns a controlling interest. In cases where the entity’s documents do not contain a required redemption clause, the Company records the partner’s share of the entity in the equity section of the balance sheets in nonredeemable noncontrolling interests. In cases where the entity’s documents contain a provision requiring the Company to purchase the partner’s share of the venture at a certain value upon demand or at a future date, if any, the Company records the partner’s share of the entity in redeemable noncontrolling interests on the balance sheets. The outside partners' interests in CPLP are redeemable into shares of cash or common stock of the Company at the Company's sole discretion. Therefore, noncontrolling interests associated with CPLP are considered nonredeemable noncontrolling interests. The noncontrolling partners' share of all consolidated entities' income is reflected in net income attributable to noncontrolling interest on the statements of operations.
Revenue Recognition
Rental Property Revenues: The Company recognizes contractual revenues from leases on a straight-line basis over the term of the respective lease. The Company records the costs of the tenant improvements, including costs paid for or reimbursed by the tenants, as an asset. The Company records deferred revenue for the portion of tenant improvements funded or reimbursed by tenants and amortizes this amount on a straight-line basis into rental income over the term of the related lease. As of December 31, 2019 and 2018, the Company had unamortized deferred income related to tenant funded tenant improvements of $17.8 million and $16.2 million, respectively, included in deferred income on the consolidated balance sheets.
Certain leases also provide for percentage rents based upon the level of sales achieved by the lessee. Percentage rents are recognized once the specified sales target is achieved. In addition, leases typically provide for reimbursement of the tenants' share of real estate taxes, insurance, and other operating expenses to the Company. Operating expense reimbursements are recognized as the related expenses are incurred. During 2019, 2018, and 2017, the Company recognized $122.4 million, $79.8 million, and $67.2 million, respectively, in revenues from tenants related to operating expenses.
The Company makes valuation adjustments to all tenant-related accounts receivable based upon its estimate of the likelihood of collectibility of amounts due from the tenant. The amount of any valuation adjustment is based on the tenant’s credit and business risk, history of payment, and other factors considered by management.
Fee Income: The Company recognizes development, management, and leasing fees as it satisfies the related performance obligations under the respective contracts. The Company recognizes development and leasing fees received from unconsolidated joint ventures and related salaries and other direct costs incurred by the Company as income and expense based on the percentage of the joint venture which the Company does not own. Correspondingly, the Company adjusts its investment in unconsolidated joint ventures when fees are paid to the Company by a joint venture in which the Company has an ownership interest.
Gain on Investment Property Transactions: Through December 31, 2017, the Company recognized gains or losses on sale of investment property when the sale of a property was consummated, the buyer’s initial and continuing investment was adequate to demonstrate commitment to pay, any receivable obtained was not subject to future subordination, the usual risks and rewards of ownership were transferred, and the Company had no substantial continuing involvement with the property. If the Company had a commitment to the buyer and that commitment was a specific dollar amount, this commitment was accrued and the gain on sale that the Company recognized was reduced. If the Company had a construction commitment to the buyer, management made an estimate of this commitment, deferred a portion of the profit from the sale, and recognized the deferred profit when the commitment was fulfilled. Beginning January 1, 2018, in connection with the adoption of ASC 606, the Company recognizes a gain on the sale of investment property at the time the buyer obtains control of the investment property. If the Company maintains any continuing involvement with the investment property, that continuing involvement is considered to be one or more additional performance obligations and additional gains or losses will be recognized as these performance obligations are satisfied.
Income Taxes
The Company has elected to be taxed as a REIT under the Internal Revenue Code of 1986, as amended (the “Code”). To qualify as a REIT, the Company must distribute annually at least 90% of its adjusted taxable income, as defined in the Code, to its stockholders and satisfy certain other organizational and operating requirements. It is management’s current intention to
F-12
adhere to these requirements and maintain the Company's REIT status. As a REIT, the Company generally will not be subject to federal income tax at the corporate level on the taxable income it distributes to its stockholders. If the Company fails to qualify as a REIT in any taxable year, it will be subject to federal income taxes at regular corporate rates and may not be able to qualify as a REIT for four subsequent taxable years. The Company may be subject to certain state and local taxes on its income and property, and to federal income taxes on its undistributed taxable income.
CTRS is a C-Corporation for federal income tax purposes and uses the liability method for accounting for income taxes. Tax return positions are recognized in the financial statements when they are “more-likely-than-not” to be sustained upon examination by the taxing authority. Deferred income tax assets and liabilities result from temporary differences. Temporary differences are differences between the tax bases of assets and liabilities and their reported amounts in the financial statements that will result in taxable or deductible amounts in future periods. A valuation allowance may be placed on deferred income tax assets, if it is determined that it is more likely than not that a deferred tax asset may not be realized.
Earnings per Share
Net income per share-basic is calculated as net income available to common stockholders divided by the weighted average number of common shares outstanding during the period, including nonvested restricted stock which has nonforfeitable dividend rights. Net income per share-diluted is calculated as net income available to common stockholders plus noncontrolling interests in CPLP divided by the diluted weighted average number of common shares outstanding during the period. Diluted weighted average number of common shares uses the same weighted average share number as in the basic calculation and adds the potential dilution that would occur if the outside units in CPLP were converted into the Company's common stock and stock options (or any other contracts to issue common stock) were exercised and resulted in additional common shares outstanding, calculated using the treasury stock method. Stock options are dilutive when the average market price of the Company’s stock during the period exceeds the option exercise price.
Restricted Cash
Use of Estimates
The preparation of financial statements in conformity with GAAP requires management to make estimates and assumptions that affect the reported amounts of assets and liabilities and disclosure of contingent assets and liabilities at the date of the financial statements and the reported amounts of revenues and expenses during the reporting period. Actual results could differ from those estimates.
3. TRANSACTIONS WITH TIER REIT, INC.
On June 14, 2019, pursuant to the Agreement and Plan of Merger dated March 25, 2019 (the “Merger Agreement”), by and among the Company and TIER REIT, Inc. (“TIER”), TIER merged with and into a subsidiary of the Company (the “Merger”) with this subsidiary continuing as the surviving corporation of the Merger. The Merger has enhanced the Company's position in its existing markets of Austin and Charlotte, provided a strategic entry into Dallas, and rebalanced the Company's portfolio across its markets. In accordance with the terms and conditions of the Merger Agreement, each share of TIER common stock issued and outstanding immediately prior to the Merger, was converted into 2.98 newly issued, pre-reverse split shares of the Company’s common stock with fractional shares being settled in cash. In the Merger, former TIER common stockholders received approximately 166 million pre-reverse split shares of common stock of the Company. As discussed in note 1 to the consolidated financial statements, immediately following the Merger, the Company completed a 1-for-4 reverse stock split.
The Merger has been accounted for as a business combination with the Company as the accounting acquirer, which requires, among other things, that the assets acquired and liabilities assumed be recognized at their acquisition date fair value. The total value of the transaction is based on the closing stock price of the Company's common stock on June 13, 2019, the day immediately prior to the closing of the Merger. Based on the shares issued in the transaction, the total fair value of the assets acquired net of liabilities assumed in the Merger was $1.6 billion. During the year ended December 31, 2019, the Company incurred expenses related to the Merger of $52.9 million.
F-13
Management engaged a third party valuation specialist to assist with valuing the real estate assets acquired and liabilities assumed in the Merger. The third party used cash flow analyses, as well as a market approach, an income approach, and a cost approach to determine the fair value of real estate assets acquired. Based on additional information that may become available, subsequent adjustments may be made to the purchase price allocation within the measurement period, which typically does not exceed one year.
The purchase price was allocated as follows (in thousands):
Real estate assets | $ | ||
Real estate assets held for sale | |||
Cash and cash equivalents | |||
Restricted cash | |||
Notes and other receivables | |||
Investment in unconsolidated joint ventures | |||
Intangible assets | |||
Other assets | |||
Notes payable | |||
Accounts payable and accrued expenses | |||
Deferred income | |||
Intangible liabilities | |||
Other liabilities | |||
Nonredeemable noncontrolling interests | |||
Total purchase price | $ | ||
During the year ended December 31, 2019, the Company recorded revenues and net income of $113.1 million and $291,000 , respectively, from the operations of the assets acquired in the Merger. The following unaudited supplemental pro forma information is based upon the Company's historical consolidated statements of operations, adjusted as if the Merger had occurred on January 1, 2018. The supplemental pro forma information is not necessarily indicative of future results, or of actual results, that would have been achieved had the Merger been consummated at the beginning of the period.
Year ended December 31, | ||||||||
2019 | 2018 | |||||||
(unaudited, in thousands) | ||||||||
Revenues | $ | $ | ||||||
Net income | ||||||||
Net income available to common stockholders | ||||||||
2019 supplemental pro forma earnings were adjusted to exclude the $52.9 million of transaction costs incurred in the year ended December 31, 2019. Supplemental pro forma earnings for the year ended December 31, 2018 were adjusted to include this charge.
4. TRANSACTIONS WITH NORFOLK SOUTHERN RAILWAY COMPANY
On March 1, 2019, the Company entered into a series of agreements and executed related transactions with Norfolk Southern Railway Company (“NS”) as follows:
• | Sold land to NS for $ |
• | Executed a Development Agreement with NS whereby the Company will receive fees totaling $ |
F-14
• | Executed a Consulting Agreement with NS whereby the Company will receive fees totaling $ |
• | Purchased a building from NS (“1200 Peachtree”) for $ |
The Company sold the land to NS for $5.0 million above its carrying amount, which included $37.0 million of land purchased in 2018, $6.5 million of land purchased in 2019, and $4.0 million of site preparation work. The Company purchased 1200 Peachtree from NS for an amount it determined to be $10.3 million below the building’s fair value.
The Company determined that all contracts and transactions associated with NS should be combined for accounting purposes, and the amounts exchanged under the combined contracts should be allocated to the various components of the overall transaction at fair value or market value as discussed below. The Company determined that the purchase of 1200 Peachtree should be recorded at fair value of $92.3 million (see note 5 for allocation of the purchase price). The Company determined that the lease with NS at the 1200 Peachtree building was at market value under ASC 842. The land sale was accounted for under ASC 610-20, and no gain or loss was recorded on the derecognition of this non-financial asset as the fair value was determined to equal the carrying amount. Consideration related to various services provided to NS, and accounted for under ASC 606, was determined to be $52.3 million and represents the negotiated market value for the services agreed to by the Company and NS in the contracts. This amount included non-cash consideration of the $10.3 million discount on the purchase of 1200 Peachtree as well as cash consideration of $5 million from the land sale contract (difference between fair value and contract amount), $5 million from the Development Agreement, and $32 million from the Consulting Agreement. Since all of the agreements and contracts above were executed for the purpose of delivering and constructing a corporate headquarters for NS and all of the services and deliverables are highly interdependent, the Company determined that the services represent a single performance obligation under ASC 606.
The Company determined that control of the services to be provided is being transferred over time and, thus, the Company must recognize the $52.3 million contract price in revenue as it satisfies the performance obligation. The Company determined that the inputs method of measuring progress of satisfying the performance obligation was the most appropriate method of recognizing revenue for the services component. Therefore, the Company began recognizing revenue on March 1, 2019, based upon the time spent by the Company’s employees in providing these services as compared to the total estimated time required to satisfy the performance obligation. During the year ended December 31, 2019, the Company recognized $21.4 million in fee income in the statement of operations related to the services provided to NS. As of December 31, 2019, the Company had deferred income included in the consolidated balance sheet of $11.3 million related to NS.
5. REAL ESTATE TRANSACTIONS
Dispositions
The Company had no dispositions of operating properties in 2019 or 2018. The Company sold the following properties in 2017 ($ in thousands):
Property | Property Type | Location | Square Feet | Sales Price | |||||||
American Cancer Society Center | Office | Atlanta, GA | $ | ||||||||
Bank of America Center, One Orlando Centre, --and Citrus Center | Office | Orlando, FL | $ | ||||||||
The Company sold the properties noted above as part of its ongoing investment strategy of exiting non-core markets and selling non-core assets, using these proceeds to fund new investment activity.
During February 2019, the Company sold air rights that cover eight acres in Downtown Atlanta for a gross sales price of $13.25 million and recorded a gain of $13.1 million.
F-15
As of December 31, 2019, the Company's Woodcrest and Hearst Tower properties were classified as held for sale. The major classes of assets and liabilities of these properties held for sale were as follows (in thousands):
Real estate assets and other assets held for sale | |||
Operating properties, net of accumulated depreciation of $44,478 | $ | ||
Notes and accounts receivable | |||
Deferred rents receivable | |||
Intangible assets, net of accumulated amortization of $16,615 | |||
Other assets | |||
$ | |||
Liabilities of real estate assets held for sale | |||
Accounts payable and accrued expenses | $ | ||
Deferred income | |||
Intangible liabilities, net of accumulated amortization of $7,771 | |||
Other liabilities | |||
$ | |||
Acquisitions
During 2019, the Company acquired 1200 Peachtree as discussed in note 4 and acquired its partner's interest in Terminus Office Holdings LLC as discussed in note 8. The Company accounted for these transactions as an acquisition of assets and the following table summarizes the allocation of the purchase price of these properties (in thousands):
1200 Peachtree | Terminus | ||||||
Tangible assets: | |||||||
Building and improvements | $ | $ | |||||
Land and improvements | |||||||
Tangible assets | |||||||
Intangible assets: | |||||||
In-place leases | |||||||
Above market leases | |||||||
Intangible assets | |||||||
Intangible liabilities: | |||||||
Below market leases | |||||||
Intangible liabilities | |||||||
Total net assets acquired | $ | $ | |||||
6. LEASES
At December 31, 2019, the Company had five properties subject to operating ground leases with a weighted average remaining term of 72 years and two finance ground leases with a weighted average remaining term of four years . At December 31, 2019, the Company had right-of-use assets from operating ground leases of $57.3 million included in operating properties, projects under development, or land on the consolidated balance sheet and right-of-use assets from finance ground leases of $11.9 million included in land on the consolidated balance sheet. At December 31, 2019, the Company had lease liabilities for operating and finance ground leases of $59.4 million and $9.7 million, respectively, included in other liabilities on the consolidated balance sheet. The weighted average discount rate on these ground leases at December 31, 2019 was 4.5 %.
Rental payments on these ground leases are adjusted periodically based on either the Consumer Price Index, changes in developed square feet on the underlying leased asset, or on a pre-determined schedule. The monthly payments on a pre-determined schedule are recognized on a straight-line basis over the terms of the respective leases while payments resulting from changes in the Consumer Price Index or future development are reflected in the statement of operations at the time of the change.
F-16
For the years ended December 31, 2019, 2018, and 2017, the Company recognized operating ground lease expense of $3.9 million, $3.5 million, and $3.2 million, respectively. For the year ended December 31, 2019 the Company had no variable lease expenses related to ground lease expense, and recognized interest expense related to finance ground leases of $462,000 . For the year ended December 31, 2019, the Company paid $2.6 million in cash related to operating ground leases and made $462,000 in cash payments related to financing ground leases.
The following table represents the undiscounted cash flows of our scheduled obligations for future minimum payments for ground leases as of December 31, 2019, with a reconciliation of these cash flows to the related ground lease liabilities in accordance with ASC 842 (in thousands):
Operating Ground Leases | Finance Ground Leases | ||||||
2020 | $ | $ | |||||
2021 | |||||||
2022 | |||||||
2023 | |||||||
2024 | |||||||
Thereafter | |||||||
$ | $ | ||||||
Discount | ( | ) | ( | ) | |||
Lease liability | $ | $ | |||||
The following table represents undiscounted cash flows of our scheduled obligations for future minimum payments on ground leases as of December 31, 2018, in accordance with ASC 840 (in thousands):
Operating Ground Leases | Finance Ground Leases | ||||||
2019 | $ | $ | |||||
2020 | |||||||
2021 | |||||||
2022 | |||||||
2023 | |||||||
Thereafter | |||||||
$ | $ | ||||||
7. NOTES AND ACCOUNTS RECEIVABLE
At December 31, 2019 and 2018, notes and accounts receivables included the following (in thousands):
2019 | 2018 | ||||||
Notes receivable | $ | $ | |||||
Tenant and other receivables | |||||||
$ | $ | ||||||
At December 31, 2019 and 2018, the fair value of the Company’s notes receivable approximated the cost basis. Fair value was calculated by discounting future cash flows from the notes receivable at estimated rates in which similar loans would have been made at December 31, 2019 and 2018. The estimate of the rate, which is the most significant input in the discounted cash flow calculation, is intended to replicate notes of similar type and maturity. This fair value calculation is considered to be Level 3 under the guidelines as set forth in ASC 820, as the Company utilizes internally generated assumptions regarding current interest rates at which similar instruments would be executed.
8. INVESTMENT IN UNCONSOLIDATED JOINT VENTURES
The following information summarizes financial data and principal activities of the Company’s unconsolidated joint ventures. The information included in the following table entitled summary of financial position is as of December 31, 2019
F-17
and 2018 (in thousands). The information included in the summary of operations table is for the years ended December 31, 2019, 2018, and 2017 (in thousands).
Total Assets | Total Debt | Total Equity (Deficit) | Company's Investment | |||||||||||||||||||||||||||||
SUMMARY OF FINANCIAL POSITION | 2019 | 2018 | 2019 | 2018 | 2019 | 2018 | 2019 | 2018 | ||||||||||||||||||||||||
DC Charlotte Plaza LLLP | $ | $ | $ | $ | $ | $ | $ | $ | ||||||||||||||||||||||||
Austin 300 Colorado Project, LP | ||||||||||||||||||||||||||||||||
Carolina Square Holdings LP | ||||||||||||||||||||||||||||||||
AMCO 120 WT Holdings, LLC | ||||||||||||||||||||||||||||||||
HICO Victory Center LP | ||||||||||||||||||||||||||||||||
Charlotte Gateway Village, LLC | ||||||||||||||||||||||||||||||||
Terminus Office Holdings LLC | ||||||||||||||||||||||||||||||||
Wildwood Associates | ( | ) | (1) | ( | ) | (1) | ||||||||||||||||||||||||||
Crawford Long - CPI, LLC | ( | ) | ( | ) | ( | ) | (1) | ( | ) | (1) | ||||||||||||||||||||||
Other | ||||||||||||||||||||||||||||||||
$ | $ | $ | $ | $ | $ | $ | $ | |||||||||||||||||||||||||
Total Revenues | Net Income (Loss) | Company's Share of Net Income (Loss) | |||||||||||||||||||||||||||||||||
SUMMARY OF OPERATIONS | 2019 | 2018 | 2017 | 2019 | 2018 | 2017 | 2019 | 2018 | 2017 | ||||||||||||||||||||||||||
Charlotte Gateway Village, LLC | $ | $ | $ | $ | $ | $ | $ | $ | $ | ||||||||||||||||||||||||||
DC Charlotte Plaza LLLP | ( | ) | |||||||||||||||||||||||||||||||||
Terminus Office Holdings LLC | |||||||||||||||||||||||||||||||||||
Crawford Long - CPI, LLC | |||||||||||||||||||||||||||||||||||
HICO Victory Center LP | |||||||||||||||||||||||||||||||||||
Carolina Square Holdings LP | ( | ) | ( | ) | ( | ) | |||||||||||||||||||||||||||||
Austin 300 Colorado Project, LP | |||||||||||||||||||||||||||||||||||
Wildwood Associates | ( | ) | ( | ) | ( | ) | ( | ) | ( | ) | |||||||||||||||||||||||||
AMCO 120 WT Holdings, LLC | ( | ) | ( | ) | |||||||||||||||||||||||||||||||
Other (2) | ( | ) | ( | ) | ( | ) | ( | ) | |||||||||||||||||||||||||||
$ | $ | $ | $ | $ | $ | $ | $ | $ | |||||||||||||||||||||||||||
(1) Negative balances are included in deferred income on the consolidated balance sheets.
(2) Revenues in 2017 primarily relate to a joint venture acquired in the transactions with Parkway Properties, Inc. and sold during the year. Net income and Company's share of net income in 2017 primarily relate to the sale of the Emory Point properties.
Austin 300 Colorado Project, LP ("300 Colorado") – 300 Colorado is a joint venture between the Company, 3C Block 28 Partners, LP ("3CB"), and 3C RR Xylem, LP ("3CRR"), formed for the purpose of developing a 358,000 square foot office building in Austin, Texas. The Company owns a 50 % interest in the venture, 3CB owns a 34.5 % interest, and 3CRR owns a 15.5 % interest. 300 Colorado has a construction loan, secured by the project, whereby it may borrow up to $126 million to fund the construction of the building. The loan had an outstanding balance of $21.4 million at December 31, 2019. The loan bears interest at LIBOR plus 2.25 % and matures on January 17, 2022. The assets of the venture in the above table include a cash balance of $593,000 at December 31, 2019.
Carolina Square Holdings LP ("Carolina Square") – Carolina Square is a 50 -50 joint venture between the Company and NR 123 Franklin LLC ("Northwood Ravin"), which owns and operates a mixed-use property in Chapel Hill, North Carolina. This property contains 158,000 square feet of office space, 44,000 square feet of retail space, and 246 apartment units. Carolina Square has a construction loan, secured by the project, with an outstanding balance of $75.7 million. The loan bears interest at LIBOR plus 1.90 % and matures on May 1, 2020. The Company and Northwood Ravin each guarantee 12.5 % of the outstanding loan amount and guarantee completion of the project. The assets of the venture in the table above include a cash balance of $4.7 million at December 31, 2019.
F-18
AMCO 120 WT Holdings, LLC ("AMCO") – AMCO is a joint venture between the Company, with a 20 % interest, and affiliates of AMLI Residential (“AMLI”), with an 80 % interest, formed to develop 120 West Trinity, a mixed-use property in Decatur, Georgia. The property is expected to contain 33,000 square feet of office space, 19,000 square feet of retail space, and 330 apartment units. Initial contributions to the joint venture for the purchase of land were funded entirely by AMLI. Subsequent contributions are funded in proportion to the members' percentage interests. The assets of the venture in the above table include a cash balance of $49,000 at December 31, 2019.
HICO Victory Center LP ("HICO") – HICO is a joint venture between the Company and Hines Victory Center Associates Limited Partnership ("Hines Victory"), formed for the purpose of acquiring and subsequently developing an office parcel in Dallas, Texas. Pursuant to the joint venture agreement, all pre-development expenditures, other than land, are funded equally by the partners. The Company funded 75 % of the cost of land while Hines Victory funded 25 %. If the partners decide to commence construction of an office building, the capital accounts and economics of the venture will be adjusted such that the Company will own at least 90 % of the venture and Hines will own up to 10 %. As of December 31, 2019, the Company accounted for its investment in HICO under the equity method because it does not control the activities of the venture. If the partners decide to construct an office building within the venture, the Company expects to consolidate the venture. The assets of the venture in the table above include a cash balance of $775,000 at December 31, 2019.
Charlotte Gateway Village, LLC ("Gateway") – Gateway is a 50 -50 joint venture between the Company and Bank of America Corporation (“BOA”), which owns and operates Gateway Village, a 1.1 million square foot office building in Charlotte, North Carolina. Net income and cash flows are allocated 50 % to each partner until the Company receives a 17 % internal rate of return; thereafter, cash flows are allocated 80 % to BOA and 20 % to the Company. In January 2020, the Company entered into an agreement to sell its interest in Gateway to BOA for $52.2 million and is expected to close the sale in the first quarter of 2020. The assets of the venture in the above table include a cash balance of $3.8 million at December 31, 2019.
Terminus Office Holdings LLC ("TOH") – TOH was a 50 -50 joint venture between the Company and institutional investors advised by J.P. Morgan Asset Management ("JPM"), which owned and operated two office buildings in Atlanta, Georgia. On October 1, 2019 the Company purchased JPM's 50 % interest in TOH for $148 million in a transaction that valued Terminus 100 and Terminus 200 at $503 million. As a result, the Company consolidated TOH and recorded the assets and liabilities at fair value. Upon consolidation, the Company recognized a $92.8 million gain on this acquisition achieved in stages and recorded this amount in gain on investment property transactions.
Wildwood Associates ("Wildwood") – Wildwood is a 50 -50 joint venture between the Company and IBM which owns undeveloped land in the Wildwood Office Park in Atlanta, Georgia. At December 31, 2019, the Company’s investment in Wildwood was a credit balance of $521,000 . This credit balance resulted from cumulative distributions from Wildwood over time that exceeded the Company’s basis in its contributions, and represents deferred gain not recognized at venture formation. The assets of the venture in the above table include a cash balance of $38,000 at December 31, 2019. In January 2020, the Company sold substantially all of its remaining interest in Wildwood to IBM for $900,000 and recognized a gain on the sale of $1.4 million, which included recognition of the remaining credit balance of $521,000 .
Crawford Long—CPI, LLC ("Crawford Long") – Crawford Long is a 50 -50 joint venture between the Company and Emory University that owns Emory University Hospital Midtown, a 358,000 square foot medical office building located in Atlanta, Georgia. Crawford Long has a $67.9 million, 3.5 % fixed rate mortgage note which matures on June 1, 2023. The assets of the venture in the above table include a cash balance of $4.5 million at December 31, 2019.
At December 31, 2019, the Company's unconsolidated joint ventures had aggregate outstanding indebtedness to third parties of $165.0 million. These loans are mortgage or construction loans, most of which are non-recourse to the Company, except as described above. In addition, in certain instances, the Company provides “non-recourse carve-out guarantees” on these non-recourse loans.
The Company recognized $7.1 million, $9.3 million, and $7.2 million of development, leasing, and management fees, including salary and expense reimbursements, from unconsolidated joint ventures in 2019, 2018, and 2017, respectively.
F-19
9. INTANGIBLE ASSETS
At December 31, 2019 and 2018, intangible assets included the following (in thousands):
2019 | 2018 | |||||||
In-place leases, net of accumulated amortization of $163,867 and $125,130 in 2019 and 2018, respectively | $ | $ | ||||||
Above-market tenant leases, net of accumulated amortization of $26,487 and $19,502 in 2019 and 2018, respectively | ||||||||
Below-market ground lease, net of accumulated amortization of $897 and $621 in 2019 and 2018, respectively | ||||||||
Goodwill | ||||||||
$ | $ | |||||||
Aggregate net amortization expense related to intangible assets and liabilities was $45.6 million, $27.0 million, and $42.4 million for the years ended December 31, 2019, 2018, and 2017, respectively. Over the next five years and thereafter, aggregate amortization of these intangible assets and liabilities is anticipated to be as follows (in thousands):
Below Market Rents | Above Market Ground Lease | Below Market Ground Lease | Above Market Rents | In Place Leases | Total | ||||||||||||||||||
2020 | $ | ( | ) | $ | ( | ) | $ | $ | $ | $ | |||||||||||||
2021 | ( | ) | ( | ) | |||||||||||||||||||
2022 | ( | ) | ( | ) | |||||||||||||||||||
2023 | ( | ) | ( | ) | |||||||||||||||||||
2024 | ( | ) | ( | ) | |||||||||||||||||||
Thereafter | ( | ) | ( | ) | |||||||||||||||||||
$ | ( | ) | $ | ( | ) | $ | $ | $ | $ | ||||||||||||||
Weighted average remaining lease term | |||||||||||||||||||||||
The carrying amount of goodwill did not change during the years ended December 31, 2019 and 2018.
10. OTHER ASSETS
At December 31, 2019 and 2018, other assets included the following (in thousands):
2019 | 2018 | |||||||
Predevelopment costs and earnest money | $ | $ | ||||||
Furniture, fixtures and equipment, leasehold improvements, and other deferred costs, net of accumulated depreciation of $29,131 and $25,193 in 2019 and 2018, respectively | ||||||||
Prepaid expenses and other assets | ||||||||
Lease inducements, net of accumulated amortization of $2,333 and $1,545 in 2019 and 2018, respectively | ||||||||
Line of credit deferred financing costs, net of accumulated amortization of $2,952 and $1,451 in 2019 and 2018, respectively | ||||||||
$ | $ | |||||||
Predevelopment costs represent amounts that are capitalized related to predevelopment projects that the Company determined are probable of future development.
Lease inducements are incentives paid to tenants in conjunction with leasing space, such as moving costs, sublease arrangements of prior space, and other costs. These amounts are amortized into rental revenues over the individual underlying lease terms.
F-20
11. NOTES PAYABLE
The following table summarizes the terms of notes payable outstanding at December 31, 2019 and 2018 (in thousands):
Description | Interest Rate | Maturity | 2019 | 2018 | ||||||||
2019 Senior Notes, Unsecured | 2029 | $ | $ | |||||||||
Credit Facility, Unsecured | 2023 | |||||||||||
Term Loan, Unsecured | 2021 | |||||||||||
2017 Senior Notes, Unsecured | 2025 | |||||||||||
2019 Senior Notes, Unsecured | 2028 | |||||||||||
Fifth Third Center | 2026 | |||||||||||
2019 Senior Notes, Unsecured | 2027 | |||||||||||
Terminus 100 | 2023 | |||||||||||
Colorado Tower | 2026 | |||||||||||
2017 Senior Notes, Unsecured | 2027 | |||||||||||
Promenade | 2022 | |||||||||||
816 Congress | 2024 | |||||||||||
Terminus 200 | 2023 | |||||||||||
Legacy Union One | 2023 | |||||||||||
Meridian Mark Plaza | 2020 | |||||||||||
$ | $ | |||||||||||
Unamortized premium | ||||||||||||
Unamortized loan costs | ( | ) | ( | ) | ||||||||
Total Notes Payable | $ | $ | ||||||||||
Weighted average maturity of notes payable outstanding at December 31, 2019 was 5.5 years.
Credit Facility
The Company has a $1 billion senior unsecured line of credit (the "Credit Facility") that matures on January 3, 2023. The Credit Facility contains financial covenants that require, among other things, the maintenance of an unencumbered interest coverage ratio of at least 1.75 ; a fixed charge coverage ratio of at least 1.50 ; a secured leverage ratio of no more than 40 %; and an overall leverage ratio of no more than 60 %. The Credit Facility also contains customary representations and warranties and affirmative and negative covenants, as well as customary events of default. The amounts outstanding under the Credit Facility may be accelerated upon the occurrence of any events of default.
The interest rate applicable to the Credit Facility varies according to the Company's leverage ratio, and may, at the election of the Company, be determined based on either (1) the current LIBOR plus a spread of between 1.05 % and 1.45 %, or (2) the greater of Bank of America's prime rate, the federal funds rate plus 0.50 %, or the one-month LIBOR plus 1.0 % (the "Base Rate"), plus a spread of between 0.10 % or 0.45 %, based on leverage.
At December 31, 2019, the Credit Facility's spread over LIBOR was 1.05 %. The amount that the Company may draw under the Credit Facility is a defined calculation based on the Company's unencumbered assets and other factors. The total available borrowing capacity under the Credit Facility was $748.5 million at December 31, 2019.
Term Loan
The Company has a $250 million unsecured term loan (the "Term Loan") that matures on December 2, 2021. Through January 21, 2018, the Term Loan contained financial covenants substantially consistent with those of the Credit Facility. On January 22, 2018, the Term Loan was amended to make the financial covenants consistent with those of the Credit Facility. The interest rate applicable to the Term Loan varies according to the Company’s leverage ratio, and may, at the election of the Company, be determined based on either (1) the current LIBOR plus a spread of between 1.20 % and 1.70 %, based on leverage or (2) the greater of Bank of America's prime rate, the federal funds rate plus 0.50 % or the one-month LIBOR plus 1.00 % (the “Base Rate”), plus a spread of between 0.00 % and 0.75 %, based on leverage. At December 31, 2019, the Term Loan's spread over LIBOR was 1.20 %.
F-21
Unsecured Senior Notes
In June 2019, the Company closed a $650 million private placement of unsecured senior notes, which were issued in three tranches. The first tranche of $125 million has an 8-year maturity and a fixed annual interest rate of 3.78 %. The second tranche of $250 million has a 9-year maturity and a fixed annual interest rate of 3.86 %. The third tranche of $275 million has a 10-year maturity and a fixed annual interest rate of 3.95 %.
The Company has two existing tranches of unsecured senior notes, totaling $350 million, that were funded in two tranches. The first tranche of $100 million is due in 2027 and has a fixed annual interest rate of 4.09 %. The second tranche of $250 million is due in 2025 and has a fixed annual interest rate of 3.91 %.
The unsecured senior notes contain financial covenants that require, among other things, the maintenance of an unencumbered interest coverage ratio of at least 1.75 ; a fixed charge coverage ratio of at least 1.50 ; an overall leverage ratio of no more than 60 %; and a secured leverage ratio of no more than 40 %. The senior notes also contain customary representations and warranties and affirmative and negative covenants, as well as customary events of default.
Mortgage Loan Information
In connection with the purchase of its partner's interest in TOH, the Company consolidated TOH and recorded the assets and liabilities as fair value, including the venture's mortgage notes. Terminus 100 has a $118.1 million mortgage note, which is due in 2023 and has a 5.25 % fixed rate. Terminus 200 has a $76.1 million mortgage note, which is due in 2023 and has a 3.79 % fixed rate.
In 2018, the Company repaid in full the $22.2 million The Pointe mortgage note, without penalty.
As of December 31, 2019, the Company had $716.6 million outstanding on eight non-recourse mortgage notes. Assets with depreciated carrying values of $1.1 billion were pledged as security on these mortgage notes payable.
In February 2020, the Company prepaid in full the $23.0 million Meridian Mark Plaza mortgage note, without penalty.
Debt Associated with the Merger
In connection with the Merger, the Company assumed and immediately repaid $679.0 million in unsecured variable rate debt of TIER with proceeds from its Credit Facility. The Company also assumed the Legacy Union One mortgage loan with a $66.0 million principal balance and a fixed interest rate of 4.24 %. Subsequent to the Merger, the Company repaid the majority of the Credit Facility borrowings related to the Merger with proceeds from the $650 million private placement of unsecured senior notes discussed above.
Other Debt Information
At December 31, 2019 and 2018, the estimated fair value of the Company’s notes payable was $2.3 billion and $1.1 billion, respectively, calculated by discounting the debt's remaining contractual cash flows at estimated rates at which similar loans could have been obtained at December 31, 2019 and 2018. The estimate of the current market rate, which is the most significant input in the discounted cash flow calculation, is intended to replicate debt of similar maturity and loan-to-value relationship. These fair value calculations are considered to be Level 2 under the guidelines as set forth in ASC 820 as the Company utilizes market rates for similar type loans from third party brokers.
For the years ended December 31, 2019, 2018, and 2017, interest was recorded as follows (in thousands):
2019 | 2018 | 2017 | |||||||||
Total interest incurred | $ | $ | $ | ||||||||
Interest capitalized | ( | ) | ( | ) | ( | ) | |||||
Total interest expense | $ | $ | $ | ||||||||
F-22
Debt Maturities
Future principal payments due (including scheduled amortization payments and payments due upon maturity) on the Company's notes payable at December 31, 2019 are as follows (in thousands):
2020 | $ | ||
2021 | |||
2022 | |||
2023 | |||
2024 | |||
Thereafter | |||
$ | |||
12. COMMITMENTS AND CONTINGENCIES
Commitments
The Company had no letters of credit outstanding at year end and outstanding performance bonds totaling $1.1 million at December 31, 2019. As a lessor, the Company had a total of $205.4 million in future obligations under leases to fund tenant improvements and other future construction obligations at December 31, 2019. As a lessee, the Company had future obligations for operating leases other than ground leases of $404,000 at December 31, 2019.
Litigation
The Company is subject to various legal proceedings, claims and administrative proceedings arising in the ordinary course of business, some of which are expected to be covered by liability insurance. Management makes assumptions and estimates concerning the likelihood and amount of any potential loss relating to these matters using the latest information available. The Company records a liability for litigation if an unfavorable outcome is probable and the amount of loss or range of loss can be reasonably estimated. If an unfavorable outcome is probable and a reasonable estimate of the loss is a range, the Company accrues the best estimate within the range. If no amount within the range is a better estimate than any other amount, the Company accrues the minimum amount within the range. If an unfavorable outcome is probable but the amount of the loss cannot be reasonably estimated, the Company discloses the nature of the litigation and indicates that an estimate of the loss or range of loss cannot be made. If an unfavorable outcome is reasonably possible and the estimated loss is material, the Company discloses the nature and estimate of the possible loss of the litigation. The Company does not disclose information with respect to litigation where an unfavorable outcome is considered to be remote or where the estimated loss would not be material. Based on current expectations, such matters, both individually and in the aggregate, are not expected to have a material adverse effect on the liquidity, results of operations, business or financial condition of the Company.
13. STOCKHOLDERS' EQUITY
In 2019, the Company issued 41.6 million shares of common stock in connection with the Merger.
In 2017, the Company issued 6.3 million shares of common stock, resulting in gross proceeds to the Company of $212.9 million. The Company recorded $1.1 million in legal, accounting, and other expenses associated with the issuance resulting in net proceeds of $211.8 million. The Company used the net proceeds from this offering to reduce indebtedness. During the year ended December 31, 2017, certain holders of CPLP units redeemed 300,821 units in exchange for shares of the Company's common stock. The aggregate value at the time of these transactions was $10.1 million based upon the value of the Company's common stock at the time of the transactions.
As of December 31, 2019, the Company had 1.7 million shares of limited voting preferred stock outstanding. Each share of limited voting preferred stock has a par value of $1 per share and is "paired" with a limited partnership unit in CPLP. A share of Cousins limited voting preferred stock will be automatically redeemed by Cousins without consideration if such share's paired limited partnership unit in CPLP is transferred or redeemed. Holders of the limited voting preferred stock are entitled to one vote on the following matters only: the election of directors, any proposed amendment of the Company's Articles of Incorporation, any merger or other business combination of the Company, any sale of substantially all of the Company's assets, and any liquidation of the Company. Holders of limited voting preferred stock are not entitled to any dividends or distributions and the limited voting preferred stock is not convertible into or exchangeable for any other property or securities of the Company.
Ownership Limitations — In order to minimize the risk that the Company will not meet one of the requirements for qualification as a REIT, the Company's Articles of Incorporation include certain restrictions on the ownership of more than 3.9 % of the Company’s total common and preferred stock, subject to waiver by the Board of Directors.
F-23
Distribution of REIT Taxable Income — The following reconciles dividends paid and dividends applied in 2019, 2018, and 2017 to meet REIT distribution requirements (in thousands):
2019 | 2018 | 2017 | |||||||||
Common and preferred dividends | $ | $ | $ | ||||||||
Dividends treated as taxable compensation | ( | ) | ( | ) | ( | ) | |||||
Dividends applied to meet current year REIT distribution requirements | $ | $ | $ | ||||||||
Tax Status of Distributions — The following summarizes the components of the taxability of the Company’s common stock distributions for the years ended December 31, 2019, 2018, and 2017:
Total Distributions Per Share | Ordinary Dividends | Long-Term Capital Gain | Unrecaptured Section 1250 Gain (1) | Nondividend Distributions | AMT Adjustment (2) | ||||||||||||||||||
2019 | $ | $ | $ | $ | $ | $ | |||||||||||||||||
2018 | $ | $ | $ | $ | $ | $ | |||||||||||||||||
2017 | $ | $ | $ | $ | $ | $ | |||||||||||||||||
(1) | Represents a portion of the dividend allocated to long-term capital gain. |
(2) | The Company apportioned certain 2017 alternative minimum tax adjustments to its shareholders. Individual taxpayers should refer to Internal Revenue Service Form 6251, Alternative Minimum Tax - Individuals. Corporate taxpayers should refer to Internal Revenue Service Form 4626, Alternative Minimum Tax - Corporations. |
14. REVENUE RECOGNITION
The Company categorizes its primary sources of revenue into revenue from contracts with customers and other revenue accounted for as leases under ASC 842 as follows:
• | Rental property revenues consist of (1) contractual revenues from leases recognized on a straight-line basis over the term of the respective lease; (2) percentage rents recognized once a specified sales target is achieved; (3) parking revenue; (4) termination fees; and (5) the reimbursement of the tenants' share of real estate taxes, insurance, and other operating expenses. The Company's leases typically include renewal options and are classified and accounted for as operating leases. Rental property revenues are accounted for in accordance with the guidance set forth in ASC 842. |
• | Fee income consists of development fees, management fees, and leasing fees earned from unconsolidated joint ventures and from third parties. Fee income is accounted for in accordance with the guidance set forth in ASC 606. |
For the years ended December 31, 2019, 2018, and 2017, the Company recognized rental property revenues of $628.8 million, $463.4 million, and $455.3 million, respectively, of which $176.6 million, $119.3 million, and $115.9 million, respectively, represented variable rental revenue. For the years ended December 31, 2019, 2018, and 2017, the Company recognized fee and other revenue of $28.8 million, $11.8 million, and $10.9 million, respectively. The following tables set forth the future minimum rents to be received by consolidated entities under existing non-cancellable leases as of December 31, 2019, accounted for in accordance with ASC 842 and as of December 31, 2018, accounted for in accordance with ASC 840, respectively (in thousands):
December 31, 2019 | ||||
2020 | $ | |||
2021 | ||||
2022 | ||||
2023 | ||||
2024 | ||||
Thereafter | ||||
$ | ||||
F-24
December 31, 2018 | ||||
2019 | $ | |||
2020 | ||||
2021 | ||||
2022 | ||||
2023 | ||||
Thereafter | ||||
$ | ||||
15. STOCK-BASED COMPENSATION
On April 23, 2019, the Company's stockholders approved the Cousins Properties Incorporated 2019 Omnibus Incentive Stock Plan (the "2019 Plan") which allows the Company to issue awards of stock options, stock grants, or stock appreciation rights to employees and directors. The 2019 Plan also allows the Company to issue awards to employees that are paid in cash or stock on the vesting date in an amount equal to the fair market value, as defined, of one share of the Company’s stock. As of December 31, 2019, 3,714,993 shares were authorized to be awarded pursuant to the 2019 Plan. The Company also maintains the Cousins Properties Incorporated 2009 Incentive Stock Plan (the "2009 Plan") and the Cousins Properties Incorporated 2005 Restricted Stock Unit Plan (the “RSU Plan”), as amended, although no further issuances are permitted under the 2009 Plan or RSU Plan.
Information on stock options, restricted stock, and restricted stock units granted to employees and directors is discussed below.
Stock Options
At December 31, 2019, the Company had 66,999 stock options outstanding to key employees and outside directors, which are exercisable for common stock, all of which are fully vested. In 2019, 2018, and 2017, there were no stock option grants to employees or directors, and the Company recognized no compensation expense related to stock options. During 2019, the Company issued 10,451 shares for option exercises. During 2018, the Company issued 11,827 shares and paid $945,000 for option exercises. As of December 31, 2019, the intrinsic value of the options outstanding and exercisable was $1.2 million. The intrinsic value is calculated using the exercise prices of the options compared to the market value of the Company’s stock. At December 31, 2019 and 2018, the weighted-average contractual lives for the options outstanding and exercisable were 0.6 years and 1.1 years, respectively.
The following is a summary of stock option activity for the years ended December 31, 2019, 2018, and 2017 (options in thousands):
Number of Options | Weighted Average Exercise Price Per Option | |||||
Outstanding at December 31, 2016 | $ | |||||
Exercised | ( | ) | ||||
Forfeited/Expired | ( | ) | ||||
Outstanding at December 31, 2017 | ||||||
Exercised | ( | ) | ||||
Forfeited/Expired | ( | ) | ||||
Outstanding at December 31, 2018 | ||||||
Exercised | ( | ) | ||||
Forfeited/Expired | ( | ) | ||||
Outstanding at December 31, 2019 | $ | |||||
Options Exercisable at December 31, 2019 | $ | |||||
Restricted Stock
In 2019, 2018, and 2017, the Company issued 65,824 , 78,799 , and 77,072 shares, respectively, of restricted stock to employees, which vest ratably over three years from the issuance date. In 2019, 2018, and 2017, the Company also issued 37,166 , 29,638 , and 30,219 shares, respectively, of stock to independent members of the board of directors which vested immediately
F-25
on the issuance date. All shares of restricted stock receive dividends and have voting rights during the vesting period. The Company records restricted stock in common stock and additional paid-in capital at fair value on the grant date, with the offsetting deferred compensation also recorded in additional paid-in capital. The Company records compensation expense over the vesting period. Compensation expense related to restricted stock was $2.5 million, $2.3 million, and $2.0 million in 2019, 2018, and 2017, respectively.
As of December 31, 2019, the Company had $2.7 million of unrecognized compensation cost included in additional paid-in capital related to restricted stock, which will be recognized over a weighted average period of 1.7 years. The total fair value of the restricted stock which vested during 2019, 2018, and 2017 was $2.6 million, $2.3 million, and $2.0 million, respectively. The following table summarizes restricted stock activity for the years ended December 31, 2019, 2018, and 2017 (shares in thousands):
Number of Shares | Weighted-Average Grant Date Fair Value | |||||
Non-vested restricted stock at December 31, 2016 | $ | |||||
Granted | ||||||
Vested | ( | ) | ||||
Forfeited | ( | ) | ||||
Non-vested restricted stock at December 31, 2017 | ||||||
Granted | ||||||
Vested | ( | ) | ||||
Forfeited | ( | ) | ||||
Non-vested restricted stock at December 31, 2018 | ||||||
Granted | ||||||
Vested | ( | ) | ||||
Forfeited | ( | ) | ||||
Non-vested restricted stock at December 31, 2019 | $ | |||||
Restricted Stock Units
During 2019, 2018, and 2017, the Company awarded two types of performance-based RSUs to key employees: one based on the total stockholder return of the Company, as defined, relative to that of office peers included in the SNL US Office REIT Index (the "TSR RSUs") and the other based on the ratio of cumulative funds from operations per share to targeted cumulative funds from operations per share (the “FFO RSUs”). The performance period for these awards is three years and the ultimate payout of these awards can range from 0 % to 200 % of the targeted number of units depending on the achievement of the performance metrics described above. Both of these RSUs are to be settled in cash with payment dependent upon the attainment of required service, market, and performance criteria. The Company expenses an estimate of the fair value of the TSR RSUs over the performance period using a quarterly Monte Carlo valuation. The Company expenses the FFO RSUs over the vesting period using the fair market value of the Company’s stock at the reporting date multiplied by the anticipated number of units to be paid based on the current estimate of what the ratio is expected to be upon vesting. Dividend equivalents on the TSR RSUs and FFO RSUs will also be paid based upon the percentage vested. The targeted number of performance-based RSUs outstanding at December 31, 2019 are 92,649 , 110,488 , and 94,845 related to the 2019, 2018, and 2017 grants, respectively.
F-26
The following table summarizes the performance-based RSU activity for the years ended December 31, 2019, 2018, and 2017 (in thousands):
Outstanding at December 31, 2016 | ||
Granted | ||
Vested | ( | ) |
Forfeited | ( | ) |
Outstanding at December 31, 2017 | ||
Granted | ||
Vested | ( | ) |
Forfeited | ( | ) |
Outstanding at December 31, 2018 | ||
Granted | ||
Vested | ( | ) |
Forfeited | ( | ) |
Outstanding at December 31, 2019 | ||
During 2019, 2018, and 2017, the Company granted 42,809 , 4,459 , and 66,181 time-vested RSUs, respectively, to key employees. The vesting period for these awards is three years . The value of each unit is equal to the fair market value of one share of common stock. These RSUs are to be settled in cash with payment dependent upon the attainment of the required service criteria. Dividend equivalent units will be paid based on the number of RSUs granted. For the 2018 and 2017 time-vested RSU grants, these dividend payments have been and will continue to be made concurrently with the payment of common dividends. For the 2019 time-vested RSU grants, dividend equivalent units will be paid out at the time of vesting.
The Company estimates future expense for all types of RSUs outstanding at December 31, 2019 to be $6.5 million (using stock prices and estimated target percentages as of December 31, 2019), which will be recognized over a weighted-average period of 1.1 years. During 2019, total cash paid for all types of RSUs and related dividend payments was $6.1 million.
During 2019, 2018, and 2017, $9.9 million, $4.6 million, and $7.0 million, respectively, was recognized as compensation expense related to RSUs.
16. RETIREMENT SAVINGS PLAN
The Company maintains a defined contribution plan (the “Retirement Savings Plan”) pursuant to Section 401 of the Internal Revenue Code (the “Code”) which covers active regular employees. Employees are eligible to participate in the Retirement Savings Plan immediately upon hire, and pre-tax contributions are allowed up to the limits set by the Code. Through December 31, 2018, the Company matched up to 3 % of an employee’s eligible pre-tax Retirement Savings Plan contributions up to certain Code limits, and employees vested in Company contributions over a three-year period. On January 1, 2019, the Company began contributing 3 % of an employee's eligible compensation to the plan, which is fully vested after the employee has been with the company for two years . The Company may change this percentage at its discretion; and, in addition, the Company could decide to make discretionary contributions in the future. The Company contributed $913,000 , $647,000 , and $764,000 to the Retirement Savings Plan for the 2019, 2018, and 2017 plan years, respectively.
F-27
17. INCOME TAXES
The net income tax benefit differs from the amount computed by applying the statutory federal income tax rate to CTRS' income before taxes follows ($ in thousands):
2019 | 2018 | 2017 | ||||||||||||||||||
Amount | Rate | Amount | Rate | Amount | Rate | |||||||||||||||
Federal income tax benefit (expense) | $ | ( | ) | ( | )% | $ | % | $ | % | |||||||||||
State income tax benefit (expense), net of federal income tax effect | ( | ) | ( | )% | % | % | ||||||||||||||
Deferred tax adjustment | % | |||||||||||||||||||
Change in deferred tax assets as a result of change in tax law | % | % | ( | ) | ( | )% | ||||||||||||||
Valuation allowance | ( | ) | ( | )% | ( | ) | ( | )% | % | |||||||||||
Other | ( | ) | ( | )% | % | % | ||||||||||||||
Benefit applicable to income (loss) from continuing operations | $ | % | $ | % | $ | % | ||||||||||||||
The tax effect of significant temporary differences representing deferred tax assets and liabilities of CTRS as of December 31, 2019 and 2018 are as follows (in thousands):
2019 | 2018 | ||||||
Income from unconsolidated joint ventures | $ | $ | |||||
Federal and state tax carryforwards | |||||||
Other | |||||||
Total deferred tax assets | |||||||
Valuation allowance | ( | ) | ( | ) | |||
Net deferred tax asset | $ | $ | |||||
A valuation allowance is required to be recorded against deferred tax assets if, based on the available evidence, it is more likely than not that such assets will not be realized. When assessing the need for a valuation allowance, appropriate consideration should be given to all positive and negative evidence related to this realization. This evidence includes, among other things, the existence of current and recent cumulative losses, forecasts of future profitability, the length of statutory carryforward periods, the Company’s history with loss carryforwards and available tax planning strategies.
F-28
18. EARNINGS PER SHARE
The following table sets forth the computation of the basic and diluted earnings per share of the Company's consolidated statements of operations for the years ended December 31, 2019, 2018 and 2017 (in thousands, except per share amounts):
Year Ended December 31 | ||||||||||||
2019 | 2018 | 2017 | ||||||||||
Earnings per common share - basic: | ||||||||||||
Numerator: | ||||||||||||
Net income | $ | $ | $ | |||||||||
Net income attributable to noncontrolling interests in CPLP | ( | ) | ( | ) | ( | ) | ||||||
Net income attributable to other noncontrolling interests | ( | ) | ( | ) | ( | ) | ||||||
Net income available for common stockholders | $ | $ | $ | |||||||||
Denominator: | ||||||||||||
Weighted average common shares - basic | ||||||||||||
Net income per common share - basic | $ | $ | $ | |||||||||
Earnings per common share - diluted: | ||||||||||||
Numerator: | ||||||||||||
Net income | $ | $ | $ | |||||||||
Net income attributable to other noncontrolling interests | ( | ) | ( | ) | ( | ) | ||||||
Net income available for common stockholders before net income attributable to noncontrolling interests in CPLP | $ | $ | $ | |||||||||
Denominator: | ||||||||||||
Weighted average common shares - basic | ||||||||||||
Add: | ||||||||||||
Potential dilutive common shares - stock options | ||||||||||||
Weighted average units of CPLP convertible into common shares | ||||||||||||
Weighted average common shares - diluted | ||||||||||||
Net income per common share - diluted | $ | $ | $ | |||||||||
Anti-dilutive stock options represent stock options whose exercise price exceeds the average market value of the Company’s stock. These anti-dilutive stock options are not included in the current calculation of dilutive weighted average shares, but could be dilutive in the future. As of December 31, 2017, the number of anti-dilutive stock options was 6,000 , respectively. There were no anti-dilutive stock options outstanding as of December 31, 2019 and 2018.
F-29
19. CONSOLIDATED STATEMENTS OF CASH FLOWS - SUPPLEMENTAL INFORMATION
Supplemental information related to cash flows, including significant non-cash activity affecting the consolidated statements of cash flows, for the years ended December 31, 2019, 2018, and 2017 is as follows (in thousands):
2019 | 2018 | 2017 | |||||||||
Interest paid, net of amounts capitalized | $ | $ | $ | ||||||||
Income taxes paid | |||||||||||
Non-Cash Transactions: | |||||||||||
Non-cash assets and liabilities assumed in TIER transaction | |||||||||||
Transfer from operating properties and related liabilities to assets and liabilities of real estate assets held for sale | |||||||||||
Ground lease right-of-use assets and associated liabilities | |||||||||||
Transfer from investment in unconsolidated joint venture to operating properties | |||||||||||
Common stock dividends declared and accrued | |||||||||||
Change in accrued property acquisition, development, and tenant asset expenditures | ( | ) | |||||||||
Non-cash consideration for property acquisition | |||||||||||
Transfer from projects under development to operating properties | |||||||||||
Cumulative effect of change in accounting principle | |||||||||||
Transfer from investment in unconsolidated joint ventures to projects under development | |||||||||||
The following table provides a reconciliation of cash, cash equivalents, and restricted cash recorded on the balance sheet to cash, cash equivalents, and restricted cash in the statements of cash flows (in thousands):
Year Ended December 31, | |||||||||||
2019 | 2018 | 2017 | |||||||||
Cash and cash equivalents | $ | $ | $ | ||||||||
Restricted cash | |||||||||||
Total cash, cash equivalents, and restricted cash | $ | $ | $ | ||||||||
20. REPORTABLE SEGMENTS
The Company's segments are based on the method of internal reporting which classifies operations by property type and geographical area. The segments by property type are: Office and Mixed-Use. The segments by geographical region are: Atlanta, Austin, Charlotte, Phoenix, Tampa, Dallas, Orlando, and Other. In 2017, the Company sold its Orlando Properties. These reportable segments represent an aggregation of operating segments reported to the Chief Operating Decision Maker based on similar economic characteristics that include the type of product and the geographical location. Each segment includes both consolidated operations and the Company's share of joint venture operations.
Company management evaluates the performance of its reportable segments in part based on net operating income (“NOI”). NOI represents rental property revenues, less termination fee income, less rental property operating expenses. NOI is not a measure of cash flows or operating results as measured by GAAP, is not indicative of cash available to fund cash needs and should not be considered an alternative to cash flows as a measure of liquidity. All companies may not calculate NOI in the same manner. The Company considers NOI to be an appropriate supplemental measure to net income as it helps both management and investors understand the core operations of the Company's operating assets. NOI excludes corporate general and administrative expenses, interest expense, depreciation and amortization, impairments, gains/loss on sales of real estate, and other non-operating items.
F-30
Year Ended December 31, 2019 | Office | Mixed-Use | Total | |||||||||
Net Operating Income: | ||||||||||||
Atlanta | $ | $ | ( | ) | $ | |||||||
Austin | ||||||||||||
Charlotte | ||||||||||||
Phoenix | ||||||||||||
Tampa | ||||||||||||
Dallas | ||||||||||||
Other | ||||||||||||
Total Net Operating Income | $ | $ | $ | |||||||||
Year Ended December 31, 2018 | Office | Mixed-Use | Total | |||||||||
Net Operating Income: | ||||||||||||
Atlanta | $ | $ | $ | |||||||||
Charlotte | ||||||||||||
Austin | ||||||||||||
Phoenix | ||||||||||||
Tampa | ||||||||||||
Other | ||||||||||||
Total Net Operating Income | $ | $ | $ | |||||||||
Year Ended December 31, 2017 | Office | Mixed-Use | Total | |||||||||
Net Operating Income: | ||||||||||||
Atlanta | $ | $ | $ | |||||||||
Charlotte | ||||||||||||
Austin | ||||||||||||
Phoenix | ||||||||||||
Tampa | ||||||||||||
Orlando | ||||||||||||
Other | ||||||||||||
Total Net Operating Income | $ | $ | $ | |||||||||
F-31
The following reconciles Net Income to Net Operating Income for each of the periods presented (in thousands):
Year Ended December 31, | |||||||||||
2019 | 2018 | 2017 | |||||||||
Net income | $ | $ | $ | ||||||||
Net operating income from unconsolidated joint ventures | |||||||||||
Fee income | ( | ) | ( | ) | ( | ) | |||||
Termination fee income | ( | ) | ( | ) | ( | ) | |||||
Other income | ( | ) | ( | ) | ( | ) | |||||
Reimbursed expenses | |||||||||||
General and administrative expenses | |||||||||||
Interest expense | |||||||||||
Depreciation and amortization | |||||||||||
Acquisition and transaction costs | |||||||||||
Other expenses | |||||||||||
Gain on extinguishment of debt | ( | ) | ( | ) | |||||||
Income from unconsolidated joint ventures | ( | ) | ( | ) | ( | ) | |||||
Gain on sale of investment properties | ( | ) | ( | ) | ( | ) | |||||
Net Operating Income | $ | $ | $ | ||||||||
Revenues by reportable segment, including a reconciliation to total rental property revenues on the consolidated statements of operations for years ended December 31, 2019, 2018, and 2017 are as follows (in thousands):
Year Ended December 31, 2019 | Office | Mixed-Use | Total | |||||||||
Revenues: | ||||||||||||
Atlanta | $ | $ | $ | |||||||||
Austin | ||||||||||||
Charlotte | ||||||||||||
Tampa | ||||||||||||
Phoenix | ||||||||||||
Dallas | ||||||||||||
Other | ||||||||||||
Total segment revenues | ||||||||||||
Less: Company's share of rental property revenues from unconsolidated joint ventures | ( | ) | ( | ) | ( | ) | ||||||
Total rental property revenues | $ | $ | $ | |||||||||
Year Ended December 31, 2018 | Office | Mixed-Use | Total | |||||||||
Revenues: | ||||||||||||
Atlanta | $ | $ | $ | |||||||||
Austin | ||||||||||||
Charlotte | ||||||||||||
Phoenix | ||||||||||||
Tampa | ||||||||||||
Other | ||||||||||||
Total segment revenues | ||||||||||||
Less: Company's share of rental property revenues from unconsolidated joint ventures | ( | ) | ( | ) | ( | ) | ||||||
Total rental property revenues | $ | $ | $ | |||||||||
F-32
Year Ended December 31, 2017 | Office | Mixed-Use | Total | |||||||||
Revenues: | ||||||||||||
Atlanta | $ | $ | $ | |||||||||
Austin | ||||||||||||
Charlotte | ||||||||||||
Phoenix | ||||||||||||
Tampa | ||||||||||||
Orlando | ||||||||||||
Other | ||||||||||||
Total segment revenues | ||||||||||||
Less: Company's share of rental property revenues from unconsolidated joint ventures | ( | ) | ( | ) | ( | ) | ||||||
Total rental property revenues | $ | $ | $ | |||||||||
F-33
SCHEDULE III
COUSINS PROPERTIES INCORPORATED AND SUBSIDIARIES
REAL ESTATE AND ACCUMULATED DEPRECIATION
December 31, 2019
($ in thousands)
Initial Cost to Company | Costs Capitalized Subsequent to Acquisition | Gross Amount at Which Carried at Close of Period | |||||||||||||||||||||||||||||||||||||||
Description/Metropolitan Area | Encumbrances | Land and Improvements | Buildings and Improvements | Land and Improvements less Cost of Sales, Transfers and Other | Building and Improvements less Cost of Sales, Transfers and Other | Land and Improvements less Cost of Sales, Transfers and Other | Building and Improvements less Cost of Sales, Transfers and Other | Total (a)(b) | Accumulated Depreciation (a)(b) | Date of Construction/ Renovation | Date Acquired | Life on Which Depreciation in 2018 Statement of Operations is Computed (c) | |||||||||||||||||||||||||||||
OPERATING PROPERTIES | |||||||||||||||||||||||||||||||||||||||||
The Domain | $ | $ | $ | $ | $ | $ | $ | $ | $ | — | 2019 | ||||||||||||||||||||||||||||||
Austin, TX | |||||||||||||||||||||||||||||||||||||||||
Terminus | — | 2019 | |||||||||||||||||||||||||||||||||||||||
Atlanta, GA | |||||||||||||||||||||||||||||||||||||||||
Northpark | — | 2014 | |||||||||||||||||||||||||||||||||||||||
Atlanta, GA | |||||||||||||||||||||||||||||||||||||||||
Corporate Center | — | 2016 | |||||||||||||||||||||||||||||||||||||||
Tampa, FL | |||||||||||||||||||||||||||||||||||||||||
Spring & 8th | 2015 | 2015 | |||||||||||||||||||||||||||||||||||||||
Atlanta, GA | |||||||||||||||||||||||||||||||||||||||||
Hayden Ferry | ( | ) | — | 2016 | |||||||||||||||||||||||||||||||||||||
Phoenix, AZ | |||||||||||||||||||||||||||||||||||||||||
Buckhead Plaza | — | 2016 | |||||||||||||||||||||||||||||||||||||||
Atlanta, GA | |||||||||||||||||||||||||||||||||||||||||
The Terrace | — | 2019 | |||||||||||||||||||||||||||||||||||||||
Austin, TX | |||||||||||||||||||||||||||||||||||||||||
One Eleven Congress | — | 2016 | |||||||||||||||||||||||||||||||||||||||
Austin, TX | |||||||||||||||||||||||||||||||||||||||||
Bank of America Plaza | ( | ) | — | 2019 | |||||||||||||||||||||||||||||||||||||
Charlotte, NC | |||||||||||||||||||||||||||||||||||||||||
Briarlake Plaza | — | 2019 | |||||||||||||||||||||||||||||||||||||||
Houston, TX | |||||||||||||||||||||||||||||||||||||||||
Fifth Third Center | — | 2014 | |||||||||||||||||||||||||||||||||||||||
Charlotte, NC | |||||||||||||||||||||||||||||||||||||||||
San Jacinto Center | ( | ) | — | 2016 | |||||||||||||||||||||||||||||||||||||
Austin, TX | |||||||||||||||||||||||||||||||||||||||||
3344 Peachtree | — | 2016 | |||||||||||||||||||||||||||||||||||||||
Atlanta, GA | |||||||||||||||||||||||||||||||||||||||||
Promenade | — | 2011 | |||||||||||||||||||||||||||||||||||||||
Atlanta, GA | |||||||||||||||||||||||||||||||||||||||||
816 Congress | $ | $ | $ | $ | $ | $ | $ | $ | $ | — | 2013 | ||||||||||||||||||||||||||||||
Austin, TX | |||||||||||||||||||||||||||||||||||||||||
Colorado Tower | 2013 | 2013 | |||||||||||||||||||||||||||||||||||||||
Austin, TX | |||||||||||||||||||||||||||||||||||||||||
Legacy Union One | — | 2019 | |||||||||||||||||||||||||||||||||||||||
Dallas, GA | |||||||||||||||||||||||||||||||||||||||||
3350 Peachtree | — | 2016 | |||||||||||||||||||||||||||||||||||||||
Atlanta, GA | |||||||||||||||||||||||||||||||||||||||||
Burnett Plaza | ( | ) | — | 2019 | |||||||||||||||||||||||||||||||||||||
Fort Worth, TX | |||||||||||||||||||||||||||||||||||||||||
NASCAR Plaza | — | 2016 | |||||||||||||||||||||||||||||||||||||||
Charlotte, NC | |||||||||||||||||||||||||||||||||||||||||
Tempe Gateway | — | 2016 | |||||||||||||||||||||||||||||||||||||||
Phoenix, AZ | |||||||||||||||||||||||||||||||||||||||||
Domain Point | — | 2019 | |||||||||||||||||||||||||||||||||||||||
Austin, TX | |||||||||||||||||||||||||||||||||||||||||
1200 Peachtree | — | 2019 | |||||||||||||||||||||||||||||||||||||||
Atlanta, GA | |||||||||||||||||||||||||||||||||||||||||
111 West Rio | ( | ) | — | 2017 | |||||||||||||||||||||||||||||||||||||
Phoenix, AZ | |||||||||||||||||||||||||||||||||||||||||
3348 Peachtree | — | 2016 | |||||||||||||||||||||||||||||||||||||||
Atlanta, GA | |||||||||||||||||||||||||||||||||||||||||
8000 Avalon | 2016 | 2016 | |||||||||||||||||||||||||||||||||||||||
Atlanta, GA | |||||||||||||||||||||||||||||||||||||||||
5950 Sherry Lane | — | 2019 | |||||||||||||||||||||||||||||||||||||||
Dallas, GA | |||||||||||||||||||||||||||||||||||||||||
The Pointe | — | 2016 | |||||||||||||||||||||||||||||||||||||||
Tampa, FL | |||||||||||||||||||||||||||||||||||||||||
Harborview Plaza | — | 2016 | |||||||||||||||||||||||||||||||||||||||
Tampa, FL | |||||||||||||||||||||||||||||||||||||||||
Research Park V | 2014 | 1998 | |||||||||||||||||||||||||||||||||||||||
Austin, TX | |||||||||||||||||||||||||||||||||||||||||
Meridian Mark Plaza | 1997 | 1997 | |||||||||||||||||||||||||||||||||||||||
Atlanta, GA | |||||||||||||||||||||||||||||||||||||||||
Total Operating Properties | |||||||||||||||||||||||||||||||||||||||||
S-1
Initial Cost to Company | Costs Capitalized Subsequent to Acquisition | Gross Amount at Which Carried at Close of Period | |||||||||||||||||||||||||||||||||||||||
Description/Metropolitan Area | Encumbrances | Land and Improvements | Buildings and Improvements | Land and Improvements less Cost of Sales, Transfers and Other | Building and Improvements less Cost of Sales, Transfers and Other | Land and Improvements less Cost of Sales, Transfers and Other | Building and Improvements less Cost of Sales, Transfers and Other | Total (a)(b) | Accumulated Depreciation (a)(b) | Date of Construction/ Renovation | Date Acquired | Life on Which Depreciation in 2018 Statement of Operations is Computed (c) | |||||||||||||||||||||||||||||
HELD FOR SALE | |||||||||||||||||||||||||||||||||||||||||
Hearst Tower | $ | $ | $ | $ | $ | $ | $ | $ | $ | 2013 | 2013 | ||||||||||||||||||||||||||||||
Charlotte, NC | |||||||||||||||||||||||||||||||||||||||||
Woodcrest | — | 2019 | |||||||||||||||||||||||||||||||||||||||
Cherry Hill, NJ | |||||||||||||||||||||||||||||||||||||||||
Total Properties Held for Sale | |||||||||||||||||||||||||||||||||||||||||
PROJECTS UNDER DEVELOPMENT | |||||||||||||||||||||||||||||||||||||||||
Domain 12 | 2019 | 2019 | |||||||||||||||||||||||||||||||||||||||
Austin, TX | |||||||||||||||||||||||||||||||||||||||||
Domain 10 | 2019 | 2019 | |||||||||||||||||||||||||||||||||||||||
Austin, TX | |||||||||||||||||||||||||||||||||||||||||
10000 Avalon | 2018 | 2016 | |||||||||||||||||||||||||||||||||||||||
Suburban Atlanta, GA | |||||||||||||||||||||||||||||||||||||||||
Total Projects Under Development | |||||||||||||||||||||||||||||||||||||||||
LAND | |||||||||||||||||||||||||||||||||||||||||
Legacy Union 2 & 3 | — | 2019 | |||||||||||||||||||||||||||||||||||||||
Dallas, GA | |||||||||||||||||||||||||||||||||||||||||
Domain 14 & 15 | — | 2019 | |||||||||||||||||||||||||||||||||||||||
Austin, TX | |||||||||||||||||||||||||||||||||||||||||
100 Mill | — | 2018 | |||||||||||||||||||||||||||||||||||||||
Phoenix, AZ | |||||||||||||||||||||||||||||||||||||||||
Domain 9 | — | 2019 | |||||||||||||||||||||||||||||||||||||||
Austin, TX | |||||||||||||||||||||||||||||||||||||||||
901 West Peachtree | — | 2018 | |||||||||||||||||||||||||||||||||||||||
Atlanta, GA | |||||||||||||||||||||||||||||||||||||||||
3354 Peachtree | — | 2019 | |||||||||||||||||||||||||||||||||||||||
Atlanta, GA | |||||||||||||||||||||||||||||||||||||||||
Burnett Plaza - Adjacent Land | — | 2019 | |||||||||||||||||||||||||||||||||||||||
Fort Worth, TX | |||||||||||||||||||||||||||||||||||||||||
The Avenue Forsyth - Adjacent Land | ( | ) | — | 2007 | |||||||||||||||||||||||||||||||||||||
Suburban Atlanta, GA | |||||||||||||||||||||||||||||||||||||||||
Corporate Center 5 | — | 2019 | |||||||||||||||||||||||||||||||||||||||
Tampa, FL | |||||||||||||||||||||||||||||||||||||||||
Total Commercial Land | ( | ) | |||||||||||||||||||||||||||||||||||||||
Total Properties | $ | $ | $ | $ | $ | $ | $ | $ | $ | ||||||||||||||||||||||||||||||||
S-2
SCHEDULE III
COUSINS PROPERTIES INCORPORATED AND SUBSIDIARIES
REAL ESTATE AND ACCUMULATED DEPRECIATION
December 31, 2019
(in thousands)
NOTES:
(a) | Reconciliations of total real estate carrying value and accumulated depreciation for the three years ended December 31, 2019 are as follows: |
Real Estate | Accumulated Depreciation | ||||||||||||||||||||||
2019 | 2018 | 2017 | 2019 | 2018 | 2017 | ||||||||||||||||||
Balance at beginning of period | $ | $ | $ | $ | $ | $ | |||||||||||||||||
Additions during the period: | |||||||||||||||||||||||
TIER merger | — | — | — | ||||||||||||||||||||
Acquisitions | — | — | — | ||||||||||||||||||||
Improvements and other capitalized costs | — | — | — | ||||||||||||||||||||
Depreciation expense | — | — | — | ||||||||||||||||||||
Total Additions | |||||||||||||||||||||||
Deductions during the period: | |||||||||||||||||||||||
Cost of real estate sold | ( | ) | ( | ) | ( | ) | |||||||||||||||||
Total Deductions | ( | ) | ( | ) | ( | ) | |||||||||||||||||
Balance at end of period | $ | $ | $ | $ | $ | $ | |||||||||||||||||
(b) | The aggregate cost for federal income tax purposes, net of depreciation, was $ |
(c) | Buildings and improvements are depreciated over |
S-3