o Written communications pursuant to Rule 425 under the Securities Act (17 CFR 230.425) |
o Soliciting material pursuant to Rule 14a-12 under the Exchange Act (17 CFR 240.14a-12) |
o Pre-commencement communications pursuant to Rule 14d-2(b) under the Exchange Act (17 CFR 240.14d-2(b)) |
o Pre-commencement communications pursuant to Rule 13e-4(c) under the Exchange Act (17 CFR 240.13e-4(c)) |
By: | /s/ Gregg D. Adzema |
Gregg D. Adzema | Marli Quesinberry | |
Executive Vice President and | Vice President, Investor Relations and | |
Chief Financial Officer | Corporate Communications | |
(404) 407-1116 | (404) 407-1898 | |
greggadzema@cousinsproperties.com | marliquesinberry@cousinsproperties.com |
• | Net income available to common stockholders for the first quarter was $0.01 per share, $0.02 per share before transaction costs. |
• | Funds From Operations for the first quarter were $0.16 per share, $0.17 per share before transaction costs. |
• | Same property net operating income on a cash basis increased 5.4% during the first quarter. |
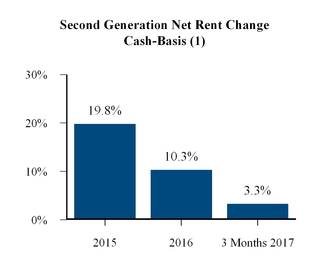
• | Second generation net rent per square foot on a cash basis increased 3.3% during the first quarter. |
• | Leased or renewed 570,744 square feet of office space during the first quarter. |
• | Completed an issuance of 63.6 million shares of common stock during the first quarter, consisting of 25.0 million newly issued shares and 38.6 million shares owned by existing stockholders, resulting in gross proceeds to the Company of $212.9 million. |
• | Acquired the remaining 25.4% interest in 111 West Rio, a 225,000 square foot office building in Tempe, Arizona, for a purchase price of $19.6 million during the first quarter. |
• | Subsequent to quarter end, the Company closed a $350 million private placement of senior unsecured debt, which will be drawn in two tranches. The first tranche of $100 million was drawn in April 2017, has a 10-year maturity and a fixed rate of 4.09%. The second tranche of $250 million will be drawn in July 2017, will have an 8-year maturity and a fixed rate of 3.91%. |
• | Fee and other income of $15 million to $17 million, up from the previous range of $9 million to $11 million, due to the $6 million of termination fees recorded during the first quarter. Guidance does not include any additional termination fees in 2017. |
• | One development project, 120 West Trinity, started during the first quarter. Guidance does not include any additional development starts in 2017. |
• | Disposition activity of $300 million to $325 million, before transaction costs and debt payments, down from the previous range of $450 million to $550 million, primarily due to the common equity issuance completed during the first quarter. |
• | GAAP straight-lined rental income of $29 million to $31 million, up from the previous range of $28 million to $30 million. |
Full Year 2017 Range | |||||||
Low | High | ||||||
Net income per share | $ | 0.41 | $ | 0.49 | |||
Add: Real estate depreciation and amortization | 0.50 | 0.53 | |||||
Less: Gain on sale of real estate assets | (0.33 | ) | (0.39 | ) | |||
Funds From Operations per share | $ | 0.58 | $ | 0.63 |
Three Months Ended March 31, | |||||||
2017 | 2016 | ||||||
Revenues: | |||||||
Rental property revenues | $ | 112,517 | $ | 45,353 | |||
Fee income | 1,936 | 2,199 | |||||
Other | 5,426 | 390 | |||||
119,879 | 47,942 | ||||||
Costs and expenses: | |||||||
Rental property operating expenses | 41,526 | 17,804 | |||||
Reimbursed expenses | 865 | 870 | |||||
General and administrative expenses | 6,182 | 8,243 | |||||
Interest expense | 9,741 | 5,439 | |||||
Depreciation and amortization | 54,884 | 16,541 | |||||
Acquisition and transaction costs | 1,930 | 19 | |||||
Other | 404 | 355 | |||||
115,532 | 49,271 | ||||||
Income (loss) from continuing operations before unconsolidated joint ventures and gain (loss) on sale of investment properties | 4,347 | (1,329 | ) | ||||
Income from unconsolidated joint ventures | 581 | 1,834 | |||||
Income from continuing operations before gain (loss) on sale of investment properties | 4,928 | 505 | |||||
Gain (loss) on sale of investment properties | (70 | ) | 14,190 | ||||
Income from continuing operations | 4,858 | 14,695 | |||||
Income from discontinued operations | — | 8,101 | |||||
Net income | 4,858 | 22,796 | |||||
Net income attributable to noncontrolling interests | (107 | ) | — | ||||
Net income available to common stockholders | $ | 4,751 | $ | 22,796 | |||
Per common share information — basic: | |||||||
Income from continuing operations for common stockholders | $ | 0.01 | $ | 0.07 | |||
Income from discontinued operations for common stockholders | — | 0.04 | |||||
Net income available to common stockholders | $ | 0.01 | $ | 0.11 | |||
Per common share information — diluted: | |||||||
Income from continuing operations for common stockholders | $ | 0.01 | $ | 0.07 | |||
Income from discontinued operations for common stockholders | — | 0.04 | |||||
Net income available to common stockholders | $ | 0.01 | $ | 0.11 | |||
Weighted average shares — basic | 402,781 | 210,904 | |||||
Weighted average shares — diluted | 411,186 | 210,974 |
Three Months Ended March 31, | |||||||
2017 | 2016 | ||||||
Net Income Available to Common Stockholders | $ | 4,751 | $ | 22,796 | |||
Depreciation and amortization of real estate assets: | |||||||
Consolidated properties | 54,433 | 16,164 | |||||
Discontinued properties | — | 15,428 | |||||
Share of unconsolidated joint ventures | 4,195 | 3,259 | |||||
(Gain) loss on sale of depreciated properties: | |||||||
Consolidated properties | 18 | (14,190 | ) | ||||
Share of unconsolidated joint ventures | 3,539 | — | |||||
Non-controlling interest related to unit holders | 101 | — | |||||
Funds From Operations | 67,037 | 43,457 | |||||
Transaction Costs | 1,930 | — | |||||
Funds From Operations before Transaction Costs | $ | 68,967 | $ | 43,457 | |||
Per Common Share — Diluted: | |||||||
Funds from Operations | $ | 0.16 | $ | 0.21 | |||
Funds From Operations before Transaction Costs | $ | 0.17 | $ | 0.21 | |||
Weighted Average Shares — Diluted | 411,186 | 210,974 |
Three Months Ended March 31, | |||||||
2017 | 2016 | ||||||
Net Income Available to Common Stockholders | $ | 4,751 | $ | 22,796 | |||
Transaction Costs | 1,930 | — | |||||
Net Income Available to Common Stockholders before Transaction Costs | $ | 6,681 | $ | 22,796 | |||
Per Common Share — Diluted: | |||||||
Net Income Available to Common Stockholders before Transaction Costs | $ | 0.02 | $ | 0.11 | |||
Weighted Average Shares — Diluted | 411,186 | 210,974 |
March 31, 2017 | December 31, 2016 | ||||||
(unaudited) | |||||||
Assets: | |||||||
Real estate assets: | |||||||
Operating properties, net of accumulated depreciation of $181,928 and $215,856 in 2017 and 2016, respectively | $ | 3,437,591 | $ | 3,432,522 | |||
Projects under development | 203,509 | 162,387 | |||||
Land | 4,221 | 4,221 | |||||
3,645,321 | 3,599,130 | ||||||
Real estate assets and other assets held for sale, net of accumulated depreciation and amortization of $73,525 in 2017 | 44,653 | — | |||||
Cash and cash equivalents | 35,755 | 35,687 | |||||
Restricted cash | 13,485 | 15,634 | |||||
Notes and accounts receivable, net of allowance for doubtful accounts of $1,410 and $1,167 in 2017 and 2016, respectively | 25,426 | 27,683 | |||||
Deferred rents receivable | 39,833 | 39,464 | |||||
Investment in unconsolidated joint ventures | 128,589 | 179,397 | |||||
Intangible assets, net of accumulated amortization of $70,588 and $53,483 in 2017 and 2016, respectively | 240,770 | 245,529 | |||||
Other assets | 32,457 | 29,083 | |||||
Total assets | $ | 4,206,289 | $ | 4,171,607 | |||
Liabilities: | |||||||
Notes payable | $ | 1,113,766 | $ | 1,380,920 | |||
Liabilities of real estate assets held for sale | 130,691 | — | |||||
Accounts payable and accrued expenses | 119,803 | 109,278 | |||||
Deferred income | 35,401 | 33,304 | |||||
Intangible liabilities, net of accumulated amortization of $16,904 and $12,227 in 2017 and 2016, respectively | 85,105 | 89,781 | |||||
Other liabilities | 39,007 | 44,084 | |||||
Total liabilities | 1,523,773 | 1,657,367 | |||||
Commitments and contingencies | |||||||
Equity: | |||||||
Stockholders' investment: | |||||||
Preferred stock, $1 par value, 20,000,000 shares authorized, 6,867,357 shares issued and outstanding in 2017 and 2016 | 6,867 | 6,867 | |||||
Common stock, $1 par value, 700,000,000 shares authorized, 429,225,700 and 403,746,938 shares issued in 2017 and 2016, respectively | 429,226 | 403,747 | |||||
Additional paid-in capital | 3,595,581 | 3,407,430 | |||||
Treasury stock at cost, 10,329,082 shares in 2017 and 2016 | (148,373 | ) | (148,373 | ) | |||
Distributions in excess of cumulative net income | (1,257,697 | ) | (1,214,114 | ) | |||
Total stockholders' investment | 2,625,604 | 2,455,557 | |||||
Nonredeemable noncontrolling interests | 56,912 | 58,683 | |||||
Total equity | 2,682,516 | 2,514,240 | |||||
Total liabilities and equity | $ | 4,206,289 | $ | 4,171,607 |
Three Months Ended March 31, | |||||||
2017 | 2016 | ||||||
Net income | $ | 4,858 | $ | 22,796 | |||
Net operating income from unconsolidated joint ventures | 9,176 | 6,646 | |||||
Net operating income from discontinued operations | — | 25,318 | |||||
Fee income | (1,936 | ) | (2,199 | ) | |||
Other income | (5,426 | ) | (390 | ) | |||
Reimbursed expenses | 865 | 870 | |||||
General and administrative expenses | 6,182 | 8,243 | |||||
Interest expense | 9,741 | 5,439 | |||||
Depreciation and amortization | 54,884 | 16,541 | |||||
Acquisition and transaction costs | 1,930 | 19 | |||||
Other expenses | 404 | 355 | |||||
Income from unconsolidated joint ventures | (581 | ) | (1,834 | ) | |||
Gain (loss) on sale of investment properties | 70 | (14,190 | ) | ||||
Income from discontinued operations | — | (8,101 | ) | ||||
Net Operating Income | $ | 80,167 | $ | 59,513 | |||
Net Operating Income | |||||||
Same Property | $ | 26,146 | $ | 24,786 | |||
Non-Same Property | 54,021 | 34,727 | |||||
$ | 80,167 | $ | 59,513 | ||||
Non-Cash Items | |||||||
Straight-line rent | $ | 9,608 | $ | 3,595 | |||
Non-cash income | 2,227 | 2,130 | |||||
Non-cash expense | (283 | ) | (444 | ) | |||
$ | 11,552 | $ | 5,281 | ||||
Cash Basis Net Operating Income | |||||||
Same Property | $ | 23,731 | $ | 22,514 | |||
Non-Same Property | 44,884 | 31,718 | |||||
$ | 68,615 | $ | 54,232 |
TABLE OF CONTENTS |
Forward-Looking Statements | |
Key Performance Metrics | |
Funds From Operations - Detail | |
Portfolio Statistics | |
Office Leasing Activity | |
Office Lease Expirations | |
Top 20 Office Tenants | |
Tenant Industry Diversification | |
Investment Activity | |
Land Inventory | |
Debt Schedule | |
Non-GAAP Financial Measures - Calculations and Reconciliations | |
Non-GAAP Financial Measures - Discussion | |
Cousins Properties Incorporated | Q1 2017 Supplemental Information |
FORWARD-LOOKING STATEMENTS |
Cousins Properties Incorporated | 3 | Q1 2017 Supplemental Information |
KEY PERFORMANCE METRICS |
2015 | 2016 1st | 2016 2nd | 2016 3rd | 2016 4th | 2016 | 2017 1st | ||||||||
Property Statistics | ||||||||||||||
Consolidated Operating Properties | 12 | 11 | 11 | 11 | 25 | 25 | 26 | |||||||
Consolidated Rentable Square Feet (in thousands) | 12,122 | 11,993 | 11,993 | 11,993 | 13,024 | 13,024 | 13,249 | |||||||
Unconsolidated Operating Properties | 6 | 6 | 6 | 6 | 8 | 8 | 7 | |||||||
Unconsolidated Rentable Square Feet (in thousands) | 3,434 | 3,435 | 3,435 | 3,435 | 3,999 | 3,999 | 3,774 | |||||||
Total Operating Properties | 18 | 17 | 17 | 17 | 33 | 33 | 33 | |||||||
Total Rentable Square Feet (in thousands) | 15,556 | 15,428 | 15,428 | 15,428 | 17,023 | 17,023 | 17,023 | |||||||
Office Leasing Activity (1) | ||||||||||||||
Net Leased during the period (square feet in thousands) | 2,972 | 220 | 402 | 971 | 761 | 2,354 | 571 | |||||||
Net Rent (per square foot) | $18.30 | $23.55 | $22.73 | $23.51 | $26.32 | $24.52 | $26.10 | |||||||
Total Leasing Costs (per square foot) | (3.64) | (6.31) | (7.08) | (6.18) | (6.08) | (6.35) | (7.44) | |||||||
Net Effective Rent (per square foot) | $14.66 | $17.24 | $15.65 | $17.33 | $20.24 | $18.17 | $18.66 | |||||||
Change in Second Generation Net Rent | 36.7 | % | 18.9 | % | 17.2 | % | 27.9 | % | 18.7 | % | 20.0 | % | 15.8 | % |
Change in Cash-Basis Second Generation Net Rent | 19.8 | % | 1.8% | 4.3 | % | 9.1 | % | 14.7 | % | 10.3 | % | 3.3 | % | |
Same Property Information (2) | ||||||||||||||
Percent Leased (period end) | 91.6 | % | 90.3 | % | 90.7 | % | 91.2 | % | 91.8 | % | 91.8 | % | 92.1 | % |
Weighted Average Occupancy | 90.7 | % | 89.4 | % | 89.2 | % | 89.5 | % | 89.4 | % | 89.4 | % | 89.9 | % |
Change in Net Operating Income (over prior year period) | 3.3 | % | 4.3 | % | 1.4 | % | 3.6 | % | 4.4 | % | 6.1 | % | 5.5 | % |
Change in Cash-Basis Net Operating Income (over prior year period) | 7.3 | % | 8.6 | % | 3.9 | % | 4.3 | % | 7.1 | % | 8.4 | % | 5.4 | % |
Development Pipeline | ||||||||||||||
Estimated Project Costs (in thousands) (3) | $261,500 | $326,300 | $340,200 | $506,200 | $512,200 | $512,200 | $529,200 | |||||||
Estimated Project Costs (3) / Total Undepreciated Assets | 7.6 | % | 9.5 | % | 9.6 | % | 13.7 | % | 10.5 | % | 10.5 | % | 10.6 | % |
Market Capitalization (4) | ||||||||||||||
Common Stock Price (period end) | $9.43 | $10.38 | $10.40 | $10.44 | $8.51 | $8.51 | $8.27 | |||||||
Common Shares/Units Outstanding (period end in thousands) | 211,513 | 210,107 | 210,171 | 210,170 | 401,596 | 401,596 | 426,823 | |||||||
Equity Market Capitalization (in thousands) | $1,994,568 | $2,180,911 | $2,185,778 | $2,194,175 | $3,417,582 | $3,417,582 | $3,529,826 | |||||||
Debt (in thousands) | 947,017 | 992,241 | 999,999 | 1,112,322 | 1,632,270 | 1,632,270 | 1,498,044 | |||||||
Total Market Capitalization (in thousands) | $2,941,585 | $3,173,152 | $3,185,777 | $3,306,497 | $5,049,852 | $5,049,852 | $5,027,870 | |||||||
Credit Ratios (4) | ||||||||||||||
Debt/Total Market Capitalization | 32.2 | % | 31.3 | % | 31.4 | % | 33.6 | % | 32.3 | % | 32.3 | % | 29.8 | % |
Debt/Total Undepreciated Assets | 27.5 | % | 28.8 | % | 28.3 | % | 30.1 | % | 33.5 | % | 33.5 | % | 30.1 | % |
Fixed Charges Coverage | 4.84 | 4.49 | 4.43 | 4.46 | 5.04 | 4.63 | 5.13 | |||||||
Debt/Annualized EBITDA | 4.00 | 4.66 | 4.51 | 4.76 | 5.33 | 5.33 | 4.60 | |||||||
Net Debt/Annualized EBITDA | 3.99 | 4.63 | 4.51 | 4.34 | 5.22 | 5.22 | 4.49 |
Cousins Properties Incorporated | 4 | Q1 2017 Supplemental Information |
KEY PERFORMANCE METRICS |
2015 | 2016 1st | 2016 2nd | 2016 3rd | 2016 4th | 2016 | 2017 1st | ||||||||
Dividend Information (4) | ||||||||||||||
Common Dividend per Share | $0.32 | $0.08 | $0.08 | $0.08 | $0.06 | $0.30 | $0.06 | |||||||
FFO Payout Ratio | 35.9 | % | 38.9 | % | 38.8 | % | 36.2 | % | 85.9 | % | 46.1 | % | 37.5 | % |
FAD Payout Ratio | 62.5 | % | 56.7 | % | 62.8 | % | 59.0 | % | 61.7 | % | 60.1 | % | 58.6 | % |
Operations Ratios (4) | ||||||||||||||
Annualized General and Administrative Expenses/Total Undepreciated Assets | 0.49 | % | 0.96 | % | 0.53 | % | 0.47 | % | 0.68 | % | 0.53 | % | 0.50 | % |
Additional Information (4) | ||||||||||||||
Straight Line Rental Revenue | $20,009 | $3,595 | $3,434 | $3,449 | $8,489 | $18,967 | $9,282 | |||||||
Above and Below Market Rents Amortization | $7,981 | $1,834 | $1,854 | $1,907 | $1,502 | $7,097 | $1,526 | |||||||
Second Generation Capital Expenditures | $54,214 | $7,904 | $13,166 | $13,968 | $11,838 | $46,876 | $10,971 | |||||||
Cousins Properties Incorporated | 5 | Q1 2017 Supplemental Information |
KEY PERFORMANCE METRICS |
Cousins Properties Incorporated | 6 | Q1 2017 Supplemental Information |
FUNDS FROM OPERATIONS - SUMMARY |
2015 | 2016 1st | 2016 2nd | 2016 3rd | 2016 4th | 2016 | 2017 1st | |||||||||||||||
Net Operating Income | |||||||||||||||||||||
Office | $ | 235,210 | $ | 57,894 | $ | 57,275 | $ | 59,873 | $ | 77,837 | $ | 252,879 | $ | 77,942 | |||||||
Other | 6,022 | 1,619 | 1,733 | 1,748 | 2,302 | 7,402 | 2,225 | ||||||||||||||
Total Net Operating Income | 241,232 | 59,513 | 59,008 | 61,621 | 80,139 | 260,281 | 80,167 | ||||||||||||||
Sales Less Cost of Sales | 3,905 | — | — | — | 3,770 | 3,770 | — | ||||||||||||||
Fee Income | 7,297 | 2,199 | 1,824 | 1,945 | 2,379 | 8,347 | 1,936 | ||||||||||||||
Other Income | 2,451 | 1,121 | 280 | 287 | 3,837 | 5,525 | 6,889 | ||||||||||||||
Reimbursed Expenses | (3,430 | ) | (870 | ) | (798 | ) | (795 | ) | (796 | ) | (3,259 | ) | (865 | ) | |||||||
General and Administrative Expenses | (16,918 | ) | (8,243 | ) | (4,691 | ) | (4,368 | ) | (8,290 | ) | (25,592 | ) | (6,182 | ) | |||||||
Interest Expense | (38,178 | ) | (9,421 | ) | (9,360 | ) | (9,748 | ) | (12,566 | ) | (41,095 | ) | (12,066 | ) | |||||||
Other Expenses | (1,941 | ) | (465 | ) | (2,640 | ) | (2,175 | ) | (40,704 | ) | (45,984 | ) | (2,391 | ) | |||||||
Depreciation and Amortization of Non-Real Estate Assets | (1,669 | ) | (377 | ) | (335 | ) | (328 | ) | (325 | ) | (1,365 | ) | (451 | ) | |||||||
FFO | $ | 192,749 | $ | 43,457 | $ | 43,288 | $ | 46,439 | $ | 27,444 | $ | 160,628 | $ | 67,037 | |||||||
Weighted Average Shares - Diluted | 215,979 | 210,974 | 210,362 | 210,326 | 391,413 | 256,023 | 411,186 | ||||||||||||||
FFO per Share | 0.89 | 0.21 | 0.21 | 0.22 | 0.07 | 0.63 | 0.16 |
Cousins Properties Incorporated | 7 | Q1 2017 Supplemental Information |
FUNDS FROM OPERATIONS - DETAIL |
2015 | 2016 1st | 2016 2nd | 2016 3rd | 2016 4th | 2016 | 2017 1st | |||||||||||||||
Net Operating Income | |||||||||||||||||||||
Office | |||||||||||||||||||||
Consolidated Properties | |||||||||||||||||||||
Hearst Tower | $ | — | $ | — | $ | — | $ | — | $ | 5,957 | $ | 5,957 | $ | 6,356 | |||||||
Northpark Town Center (1) | 22,400 | 5,607 | 5,097 | 5,599 | 5,841 | 22,144 | 5,410 | ||||||||||||||
Hayden Ferry (1) | — | — | — | — | 3,881 | 3,881 | 5,209 | ||||||||||||||
Fifth Third Center | 14,956 | 4,238 | 4,349 | 4,451 | 4,463 | 17,501 | 4,842 | ||||||||||||||
Corporate Center (1) | — | — | — | — | 5,005 | 5,005 | 4,761 | ||||||||||||||
Promenade | 13,985 | 3,740 | 3,419 | 3,839 | 3,557 | 14,555 | 4,173 | ||||||||||||||
San Jacinto Center | — | — | — | — | 3,456 | 3,456 | 4,038 | ||||||||||||||
One Eleven Congress | — | — | — | — | 3,256 | 3,256 | 3,713 | ||||||||||||||
Colorado Tower | 6,768 | 2,724 | 3,064 | 3,221 | 3,399 | 12,408 | 3,383 | ||||||||||||||
The American Cancer Society Center | 12,432 | 3,310 | 3,151 | 3,198 | 3,231 | 12,890 | 3,342 | ||||||||||||||
3344 Peachtree | — | — | — | — | 3,505 | 3,505 | 3,235 | ||||||||||||||
One Buckhead Plaza | — | — | — | — | 2,817 | 2,817 | 3,097 | ||||||||||||||
816 Congress Avenue | 8,526 | 2,468 | 2,555 | 2,514 | 2,363 | 9,900 | 2,694 | ||||||||||||||
NASCAR Plaza | — | — | — | — | 2,507 | 2,507 | 2,477 | ||||||||||||||
3350 Peachtree | — | — | — | — | 2,006 | 2,006 | 2,264 | ||||||||||||||
Tempe Gateway | — | — | — | — | 1,966 | 1,966 | 2,008 | ||||||||||||||
Bank of America Center | — | — | — | — | 1,451 | 1,451 | 1,507 | ||||||||||||||
3348 Peachtree | — | — | — | — | 1,541 | 1,541 | 1,491 | ||||||||||||||
Two Buckhead Plaza | — | — | — | — | 1,369 | 1,369 | 1,321 | ||||||||||||||
One Orlando Centre | — | — | — | — | 795 | 795 | 1,277 | ||||||||||||||
The Pointe | — | — | — | — | 1,227 | 1,227 | 1,146 | ||||||||||||||
Citrus Center | — | — | — | — | 1,019 | 1,019 | 1,006 | ||||||||||||||
Meridian Mark Plaza | 3,777 | 908 | 857 | 954 | 955 | 3,674 | 989 | ||||||||||||||
Harborview Plaza | — | — | — | — | 898 | 898 | 930 | ||||||||||||||
Research Park V | — | — | 144 | 288 | 412 | 844 | 359 | ||||||||||||||
Other (2) | 30,664 | 4,531 | 4,300 | 4,388 | 3,097 | 16,316 | 6 | ||||||||||||||
Subtotal - Office Consolidated | 113,508 | 27,526 | 26,936 | 28,452 | 69,974 | 152,888 | 71,034 | ||||||||||||||
Unconsolidated Properties (3) | |||||||||||||||||||||
Terminus 100 | 7,268 | 1,872 | 1,978 | 1,899 | 1,837 | 7,586 | 1,912 | ||||||||||||||
Terminus 200 | 6,069 | 1,658 | 1,770 | 1,678 | 1,648 | 6,754 | 1,798 | ||||||||||||||
Gateway Village (4) | 1,208 | 536 | 451 | 460 | 1,003 | 2,450 | 1,751 | ||||||||||||||
Emory University Hospital Midtown Medical Office Tower | 3,974 | 987 | 1,000 | 975 | 1,008 | 3,970 | 989 | ||||||||||||||
Courvoisier Centre | — | — | — | — | 410 | 410 | 462 | ||||||||||||||
111 West Rio (US Airways Bldg) | — | — | — | — | 220 | 220 | — | ||||||||||||||
Other | (18 | ) | (3 | ) | 14 | 1 | (2 | ) | 10 | (4 | ) | ||||||||||
Subtotal - Office Unconsolidated | 18,501 | 5,050 | 5,213 | 5,013 | 6,124 | 21,400 | 6,908 | ||||||||||||||
Discontinued Operations (5) | 103,201 | 25,318 | 25,126 | 26,408 | 1,739 | 78,591 | — | ||||||||||||||
Total Office Net Operating Income | 235,210 | 57,894 | 57,275 | 59,873 | 77,837 | 252,879 | 77,942 | ||||||||||||||
Other | |||||||||||||||||||||
Consolidated Properties | |||||||||||||||||||||
Other | 191 | 23 | (8 | ) | 1 | — | 16 | (43 | ) | ||||||||||||
Cousins Properties Incorporated | 8 | Q1 2017 Supplemental Information |
FUNDS FROM OPERATIONS - DETAIL |
2015 | 2016 1st | 2016 2nd | 2016 3rd | 2016 4th | 2016 | 2017 1st | |||||||||||||||
Unconsolidated Properties (3) | |||||||||||||||||||||
Emory Point Apartments (Phase I) | 4,699 | 1,185 | 1,250 | 1,014 | 1,092 | 4,541 | 1,133 | ||||||||||||||
Emory Point Apartments (Phase II) | 181 | 96 | 204 | 408 | 768 | 1,476 | 745 | ||||||||||||||
Emory Point Retail (Phase I) | 894 | 248 | 218 | 247 | 277 | 990 | 293 | ||||||||||||||
Emory Point Retail (Phase II) | 80 | 72 | 75 | 84 | 171 | 402 | 103 | ||||||||||||||
Other | (20 | ) | (5 | ) | (6 | ) | (6 | ) | (6 | ) | (23 | ) | (6 | ) | |||||||
Subtotal - Other Unconsolidated | 5,834 | 1,596 | 1,741 | 1,747 | 2,302 | 7,386 | 2,268 | ||||||||||||||
Discontinued Operations | (3 | ) | — | — | — | — | — | — | |||||||||||||
Total Other Net Operating Income | 6,022 | 1,619 | 1,733 | 1,748 | 2,302 | 7,402 | 2,225 | ||||||||||||||
Total Net Operating Income | 241,232 | 59,513 | 59,008 | 61,621 | 80,139 | 260,281 | 80,167 | ||||||||||||||
Sales Less Cost of Sales | |||||||||||||||||||||
Land Sales Less Cost of Sales - Consolidated | 1,625 | — | — | — | 3,580 | 3,580 | — | ||||||||||||||
Land Sales Less Cost of Sales - Unconsolidated (3) | 2,280 | — | — | — | 190 | 190 | — | ||||||||||||||
Total Sales Less Cost of Sales | 3,905 | — | — | — | 3,770 | 3,770 | — | ||||||||||||||
Fee Income | |||||||||||||||||||||
Management Fees (6) | 5,188 | 1,325 | 1,263 | 1,253 | 1,317 | 5,158 | 1,402 | ||||||||||||||
Development Fees | 1,778 | 608 | 486 | 549 | 634 | 2,277 | 432 | ||||||||||||||
Leasing & Other Fees | 331 | 266 | 75 | 143 | 428 | 912 | 102 | ||||||||||||||
Total Fee Income | 7,297 | 2,199 | 1,824 | 1,945 | 2,379 | 8,347 | 1,936 | ||||||||||||||
Other Income | |||||||||||||||||||||
Termination Fees | 817 | — | — | — | 3,122 | 3,122 | 6,197 | ||||||||||||||
Interest and Other Income | 460 | 390 | 27 | 153 | 358 | 928 | 347 | ||||||||||||||
Other - Unconsolidated (3) | 747 | 546 | 151 | 134 | 357 | 1,188 | 345 | ||||||||||||||
Interest and Other Income - Discontinued Operations | (23 | ) | (1 | ) | — | — | — | (1 | ) | — | |||||||||||
Termination Fees - Discontinued Operations (5) | 450 | 186 | 102 | — | — | 288 | — | ||||||||||||||
Total Other Income | 2,451 | 1,121 | 280 | 287 | 3,837 | 5,525 | 6,889 | ||||||||||||||
Total Fee and Other Income | 9,748 | 3,320 | 2,104 | 2,232 | 6,216 | 13,872 | 8,825 | ||||||||||||||
Reimbursed Expenses | (3,430 | ) | (870 | ) | (798 | ) | (795 | ) | (796 | ) | (3,259 | ) | (865 | ) | |||||||
General and Administrative Expenses | (16,918 | ) | (8,243 | ) | (4,691 | ) | (4,368 | ) | (8,290 | ) | (25,592 | ) | (6,182 | ) | |||||||
Cousins Properties Incorporated | 9 | Q1 2017 Supplemental Information |
FUNDS FROM OPERATIONS - DETAIL |
2015 | 2016 1st | 2016 2nd | 2016 3rd | 2016 4th | 2016 | 2017 1st | |||||||||||||||
Interest Expense | |||||||||||||||||||||
Consolidated Debt | |||||||||||||||||||||
The American Cancer Society Center | (8,599 | ) | (2,126 | ) | (2,119 | ) | (2,134 | ) | (2,127 | ) | (8,506 | ) | (2,073 | ) | |||||||
Term Loan | — | — | — | — | (386 | ) | (386 | ) | (1,288 | ) | |||||||||||
Fifth Third Center | — | — | — | (427 | ) | (1,275 | ) | (1,702 | ) | (1,272 | ) | ||||||||||
Promenade | (4,734 | ) | (1,165 | ) | (1,157 | ) | (1,150 | ) | (1,142 | ) | (4,614 | ) | (1,134 | ) | |||||||
Colorado Tower | — | — | — | (353 | ) | (1,059 | ) | (1,412 | ) | (1,059 | ) | ||||||||||
Unsecured Credit Facility | (4,089 | ) | (832 | ) | (1,053 | ) | (870 | ) | (1,159 | ) | (3,914 | ) | (1,035 | ) | |||||||
816 Congress Avenue | (3,269 | ) | (817 | ) | (817 | ) | (817 | ) | (817 | ) | (3,268 | ) | (814 | ) | |||||||
One Eleven Congress | — | — | — | — | (800 | ) | (800 | ) | (716 | ) | |||||||||||
San Jacinto Center | — | — | — | — | (632 | ) | (632 | ) | (567 | ) | |||||||||||
3344 Peachtree | — | — | — | — | (460 | ) | (460 | ) | (505 | ) | |||||||||||
Meridian Mark Plaza | (1,538 | ) | (381 | ) | (379 | ) | (377 | ) | (375 | ) | (1,512 | ) | (373 | ) | |||||||
Two Buckhead Plaza | — | — | — | — | (324 | ) | (324 | ) | (319 | ) | |||||||||||
The Pointe | — | — | — | — | (171 | ) | (171 | ) | (176 | ) | |||||||||||
Other | (4,085 | ) | (861 | ) | (860 | ) | (856 | ) | (1,070 | ) | (3,647 | ) | — | ||||||||
Capitalized | 3,577 | 742 | 1,016 | 1,230 | 1,709 | 4,697 | 1,590 | ||||||||||||||
Subtotal - Consolidated | (22,737 | ) | (5,440 | ) | (5,369 | ) | (5,754 | ) | (10,088 | ) | (26,651 | ) | (9,741 | ) | |||||||
Unconsolidated Debt (3) | |||||||||||||||||||||
Terminus 100 | (3,436 | ) | (848 | ) | (844 | ) | (840 | ) | (836 | ) | (3,368 | ) | (831 | ) | |||||||
Emory Point | (1,126 | ) | (439 | ) | (464 | ) | (484 | ) | (542 | ) | (1,929 | ) | (535 | ) | |||||||
Terminus 200 | (1,560 | ) | (390 | ) | (389 | ) | (387 | ) | (385 | ) | (1,551 | ) | (383 | ) | |||||||
Emory University Hospital Midtown Medical Office Tower | (1,333 | ) | (330 | ) | (329 | ) | (327 | ) | (325 | ) | (1,311 | ) | (324 | ) | |||||||
Courvoisier Centre | — | — | — | — | (239 | ) | (239 | ) | (252 | ) | |||||||||||
Other | — | — | — | — | (25 | ) | (25 | ) | — | ||||||||||||
Subtotal - Unconsolidated | (7,455 | ) | (2,007 | ) | (2,026 | ) | (2,038 | ) | (2,352 | ) | (8,423 | ) | (2,325 | ) | |||||||
Discontinued Operations (5) | (7,986 | ) | (1,974 | ) | (1,965 | ) | (1,956 | ) | (126 | ) | (6,021 | ) | — | ||||||||
Total Interest Expense | (38,178 | ) | (9,421 | ) | (9,360 | ) | (9,748 | ) | (12,566 | ) | (41,095 | ) | (12,066 | ) | |||||||
Other Expenses | |||||||||||||||||||||
Transaction Costs - Merger | — | (19 | ) | (2,424 | ) | (1,446 | ) | (20,633 | ) | (24,522 | ) | (1,930 | ) | ||||||||
Property Taxes and Other Holding Costs | (828 | ) | (89 | ) | (98 | ) | (95 | ) | (158 | ) | (440 | ) | (304 | ) | |||||||
Predevelopment & Other | (522 | ) | (108 | ) | (118 | ) | (140 | ) | (577 | ) | (943 | ) | (129 | ) | |||||||
Severance | (181 | ) | (249 | ) | — | — | — | (249 | ) | (28 | ) | ||||||||||
Transaction Costs - Spin-off | — | — | — | (494 | ) | (5,855 | ) | (6,349 | ) | — | |||||||||||
Loss on Extinguishment of Debt | — | — | — | — | (5,180 | ) | (5,180 | ) | — | ||||||||||||
Impairment Losses (7) | — | — | — | — | (4,526 | ) | (4,526 | ) | — | ||||||||||||
Acquisition Costs | (299 | ) | — | — | — | — | — | — | |||||||||||||
Partners' share of FFO in consolidated joint ventures | (111 | ) | — | — | — | (3,775 | ) | (3,775 | ) | — | |||||||||||
Total Other Expenses | (1,941 | ) | (465 | ) | (2,640 | ) | (2,175 | ) | (40,704 | ) | (45,984 | ) | (2,391 | ) | |||||||
Cousins Properties Incorporated | 10 | Q1 2017 Supplemental Information |
FUNDS FROM OPERATIONS - DETAIL |
2015 | 2016 1st | 2016 2nd | 2016 3rd | 2016 4th | 2016 | 2017 1st | |||||||||||||||
Depreciation and Amortization of Non-Real Estate Assets | |||||||||||||||||||||
Consolidated | (1,621 | ) | (377 | ) | (335 | ) | (328 | ) | (325 | ) | (1,365 | ) | (451 | ) | |||||||
Unconsolidated (3) | (48 | ) | — | — | — | — | — | — | |||||||||||||
Total Depreciation and Amortization of Non-Real Estate Assets | (1,669 | ) | (377 | ) | (335 | ) | (328 | ) | (325 | ) | (1,365 | ) | (451 | ) | |||||||
FFO | 192,749 | 43,457 | 43,288 | 46,439 | 27,444 | 160,628 | 67,037 | ||||||||||||||
Weighted Average Shares - Diluted | 215,979 | 210,974 | 210,362 | 210,326 | 391,413 | 256,023 | 411,186 | ||||||||||||||
FFO per Share | 0.89 | 0.21 | 0.21 | 0.22 | 0.07 | 0.63 | 0.16 |
Note: Amounts may differ slightly from other schedules contained herein due to rounding. | |||||||||||||||||
(1) Contains multiple buildings that are grouped together for reporting purposes. | |||||||||||||||||
(2) Represents properties sold and loans repaid prior to March 31, 2017 that are not considered discontinued operations. | |||||||||||||||||
(3) Unconsolidated amounts include amounts recorded in unconsolidated joint ventures for the respective category multiplied by the Company's ownership interest. The Company does not control the operations of the unconsolidated joint ventures, but believes including these amounts in the categories indicated is meaningful to investors and analysts. | |||||||||||||||||
(4) Through December 1, 2016, the Company received an 11.46% current return on its $11.1 million investment in Gateway Village and, when certain other revenue criteria were met, received additional returns. The Company recognized these amounts as NOI from this venture. After December 1, 2016, net income and cash flows were allocated 50% to each joint venture member. | |||||||||||||||||
(5) Primarily represents Greenway Plaza and Post Oak Central. | |||||||||||||||||
(6) Management Fees include reimbursement of expenses that are included in the "Reimbursed Expenses" line item. | |||||||||||||||||
(7) Represents an impairment charge on Callaway Gardens land as a result of the Company withdrawing from the joint venture. |
Cousins Properties Incorporated | 11 | Q1 2017 Supplemental Information |
PORTFOLIO STATISTICS |
Property Description | Metropolitan Area | Rentable Square Feet | Financial Statement Presentation | Company's Ownership Interest | End of Period Leased 1Q17 | End of Period Leased 4Q16 | Weighted Average Occupancy 1Q17 | Weighted Average Occupancy 4Q16 | % of Total Net Operating Income (1) | Property Level Debt ($000) (2) | ||||||||||||||
OFFICE PROPERTIES | ||||||||||||||||||||||||
Northpark Town Center (3) | Atlanta | 1,528,000 | Consolidated | 100% | 90.6% | 85.2% | 84.5% | 85.1% | 6.8% | $ | — | |||||||||||||
Promenade | Atlanta | 777,000 | Consolidated | 100% | 94.4% | 94.5% | 93.4% | 91.6% | 5.2% | 104,278 | ||||||||||||||
The American Cancer Society Center | Atlanta | 996,000 | Consolidated | 100% | 85.9% | 85.9% | 85.6% | 83.2% | 4.2% | 126,961 | ||||||||||||||
3344 Peachtree | Atlanta | 484,000 | Consolidated | 100% | 90.6% | 96.1% | 90.1% | 93.4% | 4.0% | 79,311 | ||||||||||||||
One Buckhead Plaza | Atlanta | 461,000 | Consolidated | 100% | 94.3% | 94.2% | 92.5% | 94.0% | 3.9% | — | ||||||||||||||
3350 Peachtree | Atlanta | 413,000 | Consolidated | 100% | 92.9% | 92.9% | 92.9% | 92.9% | 2.8% | — | ||||||||||||||
Terminus 100 | Atlanta | 660,000 | Unconsolidated | 50% | 90.6% | 90.6% | 88.2% | 90.0% | 2.4% | 62,929 | ||||||||||||||
Terminus 200 | Atlanta | 566,000 | Unconsolidated | 50% | 96.4% | 96.4% | 95.8% | 91.3% | 2.2% | 40,219 | ||||||||||||||
3348 Peachtree | Atlanta | 258,000 | Consolidated | 100% | 90.6% | 91.2% | 91.0% | 92.8% | 1.9% | — | ||||||||||||||
Two Buckhead Plaza | Atlanta | 210,000 | Consolidated | 100% | 84.5% | 83.1% | 83.1% | 81.1% | 1.6% | 52,999 | ||||||||||||||
Meridian Mark Plaza | Atlanta | 160,000 | Consolidated | 100% | 100.0% | 100.0% | 100.0% | 100.0% | 1.2% | 24,315 | ||||||||||||||
Emory University Hospital Midtown Medical Office Tower | Atlanta | 358,000 | Unconsolidated | 50% | 94.9% | 96.2% | 95.6% | 97.0% | 1.2% | 36,077 | ||||||||||||||
ATLANTA | 6,871,000 | 91.2% | 90.3% | 89.1% | 89.0% | 37.4% | 527,089 | |||||||||||||||||
Hearst Tower | Charlotte | 966,000 | Consolidated | 100% | 98.7% | 98.7% | 98.4% | 97.1% | 7.9% | — | ||||||||||||||
Fifth Third Center | Charlotte | 698,000 | Consolidated | 100% | 96.7% | 96.7% | 96.6% | 95.9% | 6.0% | 148,153 | ||||||||||||||
NASCAR Plaza | Charlotte | 394,000 | Consolidated | 100% | 98.2% | 98.2% | 98.2% | 95.3% | 3.1% | — | ||||||||||||||
Gateway Village | Charlotte | 1,061,000 | Unconsolidated | 50% | 99.4% | 99.3% | 99.4% | 94.9% | 2.2% | — | ||||||||||||||
CHARLOTTE | 3,119,000 | 98.2% | 98.2% | 98.1% | 96.0% | 19.2% | 148,153 | |||||||||||||||||
San Jacinto Center | Austin | 406,000 | Consolidated | 100% | 99.7% | 99.8% | 99.7% | 99.4% | 5.0% | 101,602 | ||||||||||||||
One Eleven Congress | Austin | 519,000 | Consolidated | 100% | 90.5% | 90.6% | 82.0% | 81.7% | 4.6% | 128,771 | ||||||||||||||
Colorado Tower | Austin | 373,000 | Consolidated | 100% | 100.0% | 100.0% | 100.0% | 100.0% | 4.2% | 119,093 | ||||||||||||||
816 Congress | Austin | 435,000 | Consolidated | 100% | 95.0% | 93.2% | 92.8% | 91.1% | 3.4% | 83,862 | ||||||||||||||
Research Park V | Austin | 173,000 | Consolidated | 100% | 97.1% | 97.1% | 56.1% | 41.3% | 0.5% | — | ||||||||||||||
AUSTIN | 1,906,000 | 95.9% | 95.6% | 89.4% | 87.5% | 17.7% | 433,328 | |||||||||||||||||
Corporate Center (3) | Tampa | 1,224,000 | Consolidated | 100% | 94.2% | 84.4% | 84.0% | 81.8% | 5.9% | — | ||||||||||||||
The Pointe | Tampa | 253,000 | Consolidated | 100% | 92.7% | 96.2% | 90.7% | 96.1% | 1.4% | 23,209 | ||||||||||||||
Harborview Plaza | Tampa | 205,000 | Consolidated | 100% | 98.0% | 98.0% | 98.0% | 98.0% | 1.2% | — | ||||||||||||||
TAMPA | 1,682,000 | 94.5% | 87.8% | 86.8% | 85.9% | 8.5% | 23,209 | |||||||||||||||||
Hayden Ferry (3) | Phoenix | 789,000 | Consolidated | 100% | 93.8% | 93.8% | 88.4% | 88.0% | 6.5% | — | ||||||||||||||
Tempe Gateway | Phoenix | 264,000 | Consolidated | 100% | 98.4% | 98.4% | 98.4% | 98.4% | 2.5% | — | ||||||||||||||
111 West Rio (US Airways Bldg) | Phoenix | 225,000 | Consolidated | 100% | 100.0% | 100.0% | —% | —% | —% | — | ||||||||||||||
PHOENIX | 1,278,000 | 95.9% | 95.9% | 74.9% | 74.7% | 9.0% | — | |||||||||||||||||
Bank of America Center | Orlando | 421,000 | Consolidated | 100% | 87.2% | 87.7% | 86.9% | 88.3% | 1.9% | — | ||||||||||||||
One Orlando Centre | Orlando | 356,000 | Consolidated | 100% | 82.6% | 82.4% | 80.2% | 73.2% | 1.6% | — | ||||||||||||||
Citrus Center | Orlando | 261,000 | Consolidated | 100% | 92.1% | 94.3% | 91.5% | 91.6% | 1.3% | — | ||||||||||||||
ORLANDO | 1,038,000 | 86.8% | 87.5% | 85.7% | 84.0% | 4.8% | — | |||||||||||||||||
Courvoisier Centre (3) | Miami | 343,000 | Unconsolidated | 20% | 87.7% | 86.5% | 86.0% | 84.1% | 0.6% | 22,282 | ||||||||||||||
MIAMI | 343,000 | 87.7% | 86.5% | 86.0% | 84.1% | 0.6% | 22,282 | |||||||||||||||||
TOTAL OFFICE PROPERTIES | 16,237,000 | 93.5% | 92.4% | 89.0% | 88.1% | 97.2% | $ | 1,154,061 | ||||||||||||||||
Cousins Properties Incorporated | 12 | Q1 2017 Supplemental Information |
PORTFOLIO STATISTICS |
Property Description | Metropolitan Area | Rentable Square Feet | Financial Statement Presentation | Company's Ownership Interest | End of Period Leased 1Q17 | End of Period Leased 4Q16 | Weighted Average Occupancy 1Q17 | Weighted Average Occupancy 4Q16 | % of Total Net Operating Income (1) | Property Level Debt ($000) (2) | ||||||||||||||
OTHER PROPERTIES | ||||||||||||||||||||||||
Emory Point Apartments (Phase I) (4) | Atlanta | 404,000 | Unconsolidated | 75% | 95.0% | 95.9% | 95.2% | 95.3% | 1.4% | 36,231 | ||||||||||||||
Emory Point Apartments (Phase II) (4) | Atlanta | 257,000 | Unconsolidated | 75% | 94.1% | 91.9% | 92.6% | 87.9% | 0.9% | 28,676 | ||||||||||||||
Emory Point Retail (Phase I) | Atlanta | 80,000 | Unconsolidated | 75% | 78.8% | 90.0% | 82.6% | 86.5% | 0.4% | 7,175 | ||||||||||||||
Emory Point Retail (Phase II) | Atlanta | 45,000 | Unconsolidated | 75% | 79.1% | 78.9% | 77.0% | 75.0% | 0.1% | 5,021 | ||||||||||||||
TOTAL OTHER PROPERTIES | 786,000 | 92.1% | 93.0% | 92.0% | 90.8% | 2.8% | 77,103 | |||||||||||||||||
TOTAL PORTFOLIO | 17,023,000 | 100% | 1,231,164 | |||||||||||||||||||||
(1) | Net Operating Income represents the Company's share of rental property revenues less rental property operating expenses for the three months ended March 31, 2017. | |||||||||||||||||||||||
(2) | Property level debt represents the Company's share of total debt as of March 31, 2017. | |||||||||||||||||||||||
(3) | Contains multiple buildings that are grouped together for reporting purposes. | |||||||||||||||||||||||
(4) | Phase I consists of 443 units, and Phase II consists of 307 units. |
Cousins Properties Incorporated | 13 | Q1 2017 Supplemental Information |
PORTFOLIO STATISTICS |
Cousins Properties Incorporated | 14 | Q1 2017 Supplemental Information |
SAME PROPERTY PERFORMANCE (1) |
COUSINS PROPERTIES INCORPORATED | ||||||||||
Net Operating Income ($ in thousands) | ||||||||||
Three Months Ended | ||||||||||
March 31, 2017 | March 31, 2016 | 1Q17 vs. 1Q16 % Change | ||||||||
Property Revenues (2) | $ | 41,754 | $ | 39,699 | 5.2 | % | ||||
Property Operating Expenses (2) | 15,608 | 14,913 | 4.7 | % | ||||||
Property Net Operating Income | $ | 26,146 | $ | 24,786 | 5.5 | % | ||||
Cash Basis Property Revenues (3) | $ | 39,351 | $ | 37,439 | 5.1 | % | ||||
Cash Basis Property Operating Expenses (4) | 15,620 | 14,925 | 4.7 | % | ||||||
Cash Basis Property Net Operating Income | $ | 23,731 | $ | 22,514 | 5.4 | % | ||||
End of Period Leased | 92.1 | % | 89.5 | % | ||||||
Weighted Average Occupancy | 89.9 | % | 88.8 | % | ||||||
(1) | Same Properties include those office properties that were operational and stabilized on January 1, 2016, excluding properties subsequently sold. See Non-GAAP Financial Measures - Calculation and Reconciliations. Properties included in this reporting period are as follows: | ||
North Park Town Center | Emory University Hospital Midtown Medical Office Tower | Meridian Mark Plaza | |
Promenade | Terminus 100 | Terminus 200 | |
816 Congress | Fifth Third Center | The American Cancer Society Center | |
(2) | Property Revenues and Expenses include results for the Company and its share of unconsolidated joint ventures. Net operating income for unconsolidated joint ventures is calculated as property revenue less property expenses at the joint ventures multiplied by the Company's ownership interest. The Company does not control the operations of the unconsolidated joint ventures, but believes that including these amounts with consolidated net operating income is meaningful to investors and analysts. | ||
(3) | Cash Basis Same Property Revenues include that of the Company and its share of unconsolidated joint ventures. It represents Property Revenues, excluding straight-line rents, amortization of lease inducements, and amortization of acquired above and below market rents. | ||
(4) | Cash Basis Same Property Operating Expenses include that of the Company and its share of unconsolidated joint ventures. It represents Property Operating Expenses, excluding straight-line ground rent expense and amortization of above and below market ground rent expense. |
Cousins Properties Incorporated | 15 | Q1 2017 Supplemental Information |
SAME PROPERTY PERFORMANCE (1) |
LEGACY PARKWAY PROPERTIES | ||||||||||
Net Operating Income ($ in thousands) | ||||||||||
Three Months Ended | ||||||||||
March 31, 2017 | March 31, 2016 | 1Q17 vs. 1Q16 % Change | ||||||||
Cash Basis Property Revenues (2) | $ | 60,977 | $ | 55,953 | 9.0 | % | ||||
Cash Basis Property Operating Expenses (3) | 24,206 | 23,007 | 5.2 | % | ||||||
Cash Basis Property Net Operating Income | $ | 36,771 | $ | 32,946 | 11.6 | % | ||||
End of Period Leased | 93.6 | % | 89.3 | % | ||||||
Weighted Average Occupancy | 90.8 | % | 88.8 | % |
(1) | Same Properties include those office properties that were operational and stabilized on January 1, 2016, excluding properties subsequently sold. Properties included in this reporting period are as follows: | ||
3344 Peachtree | Harborview Plaza | One Orlando Centre | |
3348 Peachtree | Hayden Ferry (4) | San Jacinto Center | |
3350 Peachtree | Hearst Tower | Tempe Gateway | |
Bank of America Center | NASCAR Plaza | The Pointe | |
Citrus Center | One Buckhead Plaza | Two Buckhead Plaza | |
Corporate Center | One Eleven Congress | ||
(2) | Cash Basis Same Property Revenues include that of the Company and its share of unconsolidated joint ventures. It represents Property Revenues, excluding straight-line rents, amortization of lease inducements, and amortization of acquired above and below market rents. | ||
(3) | Cash Basis Same Property Operating Expenses include that of the Company and its share of unconsolidated joint ventures. It represents Property Operating Expenses, excluding straight-line ground rent expense and amortization of above and below market ground rent expense. | ||
(4) | Hayden Ferry Building III commenced operations in November 2015 and is excluded from Same Property pool. |
Cousins Properties Incorporated | 16 | Q1 2017 Supplemental Information |
OFFICE LEASING ACTIVITY(1) |
Three Months Ended March 31, 2017 | |||||||||||||||
New | Renewal | Expansion | Total | ||||||||||||
Gross leased (square feet) | 633,236 | ||||||||||||||
Less: Leases one year or less, amenity leases, percentage rent leases, storage leases, intercompany leases, and license agreements | (62,492) | ||||||||||||||
Net leased (square feet) | 423,428 | 107,262 | 40,054 | 570,744 | |||||||||||
Number of transactions | 21 | 16 | 3 | 40 | |||||||||||
Lease term (years) (2) | 10.6 | 4.5 | 5.0 | 9.1 | |||||||||||
Net rent (per square foot) (3) | $ | 25.71 | $ | 27.70 | $ | 25.94 | $ | 26.10 | |||||||
Total leasing costs (per square foot) (4) | (7.99 | ) | (4.95 | ) | (8.22 | ) | (7.44 | ) | |||||||
Net effective rent (per square foot) | $ | 17.72 | $ | 22.75 | $ | 17.72 | $ | 18.66 | |||||||
Second generation leased square feet (5) | 311,772 | ||||||||||||||
Increase in second generation net rent (2)(3)(5) | 15.8 | % | |||||||||||||
Increase in cash basis second generation net rent (2)(5)(6) | 3.3 | % | |||||||||||||
(1) Excludes apartment and retail leasing at our mixed-use projects. | |||||||||||||||
(2) Weighted average. | |||||||||||||||
(3) Represents straight-lined net rent per square foot (operating expenses deducted from gross leases) over the lease term. | |||||||||||||||
(4) Includes tenant improvements, external leasing commissions, and free rent. | |||||||||||||||
(5) Excludes leases executed for spaces that were vacant upon acquisition, new leases in development properties, and leases for spaces that have been vacant for one year or more. | |||||||||||||||
(6) Represents increase in net rent at the end of term paid by the prior tenant compared to net rent at beginning of term paid by the current tenant. For early renewals, represents increase in net rent at the end of the term of the original lease compared to net rent at the beginning of the extended term of the lease. |
Cousins Properties Incorporated | 17 | Q1 2017 Supplemental Information |
OFFICE LEASE EXPIRATIONS (1) |
Year of Expiration | Square Feet Expiring | % of Leased Space | Annual Contractual Rents ($000's) (2) | % of Total Annual Contractual Rents | Annual Contractual Rent/Sq. Ft. (2) | ||||||||||||
2017 | 586,147 | 4.3 | % | $ | 15,683 | 3.7 | % | $ | 26.76 | ||||||||
2018 | 936,805 | 6.8 | % | 27,544 | 6.6 | % | 29.40 | ||||||||||
2019 | 1,103,756 | 8.1 | % | 32,771 | 7.8 | % | 29.69 | ||||||||||
2020 | 1,048,718 | 7.7 | % | 31,498 | 7.5 | % | 30.03 | ||||||||||
2021 | 1,731,910 | 12.7 | % | 51,750 | 12.3 | % | 29.88 | ||||||||||
2022 | 2,108,217 | 15.4 | % | 59,697 | 14.1 | % | 28.32 | ||||||||||
2023 | 1,007,105 | 7.4 | % | 30,801 | 7.3 | % | 30.58 | ||||||||||
2024 | 945,998 | 6.9 | % | 34,067 | 8.1 | % | 36.01 | ||||||||||
2025 | 1,035,367 | 7.6 | % | 35,132 | 8.3 | % | 33.93 | ||||||||||
2026 & Thereafter | 3,186,328 | 23.1 | % | 102,854 | 24.3 | % | 32.28 | ||||||||||
Total | 13,690,351 | 100.0 | % | $ | 421,797 | 100.0 | % | $ | 30.81 |
Expiration Date | Tenant | Market | Building | Square Feet Expiring | |||||
January 2019 | National Union Fire Insurance Company | Atlanta | Northpark Town Center | 105,362 | |||||
April 2020 | CO Space Properties LLC | Atlanta | American Cancer Society Center | 120,298 |
(1) Company's share. | |||
(2) Annual Contractual Rent shown is the rate in the year of expiration. It includes the minimum contractual rent paid by the tenant which may or may not include a base year of operating expenses depending upon the terms of the lease. | |||
Cousins Properties Incorporated | 18 | Q1 2017 Supplemental Information |
OFFICE LEASE EXPIRATIONS (1) |
Cousins Properties Incorporated | 19 | Q1 2017 Supplemental Information |
TOP 20 OFFICE TENANTS |
Tenant (1) | Number of Buildings Occupied | Number of Markets Occupied | Company's Share of Square Footage | Company's Share of Annualized Base Rent (2) | Percentage of Total Company's Share of Annualized Base Rent | Average Remaining Lease Term (Years) (3) | |||||||||||
1 | Bank of America | 4 | 2 | 1,139,724 | $ | 19,427,031 | 5.5% | 6 | |||||||||
2 | Wells Fargo Bank, N.A. | 6 | 5 | 304,310 | 8,705,408 | 2.5% | 5 | ||||||||||
3 | Blue Cross Blue Shield | 1 | 1 | 227,592 | 6,133,605 | 1.8% | 4 | ||||||||||
4 | McGuireWoods LLP | 3 | 3 | 198,648 | 5,743,205 | 1.6% | 9 | ||||||||||
5 | Hearst Communications, Inc. | 1 | 1 | 181,323 | 5,558,666 | 1.6% | 10 | ||||||||||
6 | Smith, Gambrell & Russell, LLP | 1 | 1 | 159,136 | 4,959,620 | 1.4% | 4 | ||||||||||
7 | OSI Restaurant Partners, LLC (dba Outback Steakhouse) | 1 | 1 | 167,723 | 4,886,131 | 1.4% | 8 | ||||||||||
8 | American Cancer Society, Inc. | 1 | 1 | 275,160 | 4,831,741 | 1.4% | 3 | ||||||||||
9 | NASCAR Media Group, LLC | 1 | 1 | 139,461 | 4,658,907 | 1.3% | 4 | ||||||||||
10 | Parsley Energy, LP | 1 | 1 | 135,107 | 4,116,710 | 1.2% | 8 | ||||||||||
11 | Board of Regents of the University System of Georgia (dba Georgia State University) | 1 | 1 | 135,124 | 3,884,815 | 1.1% | 7 | ||||||||||
12 | US South Communications (dba InComm) | 1 | 1 | 191,709 | 3,853,276 | 1.1% | 5 | ||||||||||
13 | K & L Gates LLP | 1 | 1 | 110,914 | 3,736,155 | 1.1% | 11 | ||||||||||
14 | Amazon | 3 | 2 | 107,788 | 3,728,168 | 1.1% | 6 | ||||||||||
15 | Carlton Fields Jorden Burt, PA | 1 | 1 | 93,868 | 3,661,791 | 1.0% | 9 | ||||||||||
16 | CO Space Properties, LLC (dba Internap) | 1 | 1 | 120,298 | 3,611,153 | 1.0% | 3 | ||||||||||
17 | Fifth Third Bank | 2 | 2 | 120,436 | 3,383,671 | 1.0% | 4 | ||||||||||
18 | Regus Equity Business Centers, LLC | 7 | 5 | 119,041 | 3,307,136 | 1.0% | 3 | ||||||||||
19 | National Union Fire Insurance Company (dba AIG) | 1 | 1 | 105,362 | 3,037,233 | 0.9% | 2 | ||||||||||
20 | SVB Financial Group (dba Silicon Valley Bank) | 1 | 1 | 100,532 | 2,987,108 | 0.9% | 7 | ||||||||||
Grand Total | 4,133,256 | $ | 104,211,530 | 29.7% | 6 | ||||||||||||
(1) | In some cases, the actual tenant may be an affiliate of the entity shown. | ||||||||||||||||
(2) | Annualized Base Rent represents the annualized minimum rent paid by the tenant as of the date of this report. If the tenant is in a free rent period as of the date of this report, Annualized Base Rent represents the annualized minimum contractual rent the tenant will pay in the first month it is required to pay rent which may or may not include a base year of operating expenses depending upon the terms of the lease. | ||||||||||||||||
(3) | Weighted average. | ||||||||||||||||
Note: | This schedule includes tenants whose leases have commenced and/or who have taken occupancy. Leases that have been signed but have not commenced are excluded from this schedule. |
Cousins Properties Incorporated | 20 | Q1 2017 Supplemental Information |
TENANT INDUSTRY DIVERSIFICATION |
Cousins Properties Incorporated | 21 | Q1 2017 Supplemental Information |
INVESTMENT ACTIVITY |
Property | Type | Metropolitan Area | Company's Ownership Interest | Timing | Square Feet | Gross Purchase Price ($ in thousands) | |||||||||
2017 | |||||||||||||||
111 West Rio (1) | Office | Phoenix | 100.0% | 1Q | 225,000 | $ | 19,600 | ||||||||
2016 | |||||||||||||||
Parkway Properties | Office | Various | Various | 4Q | 8,819,000 | (2 | ) | ||||||||
Cousins Fund II, L.P. (3) | Office | Various | 100.0% | 4Q | (3 | ) | 279,100 | ||||||||
2014 | |||||||||||||||
Fifth Third Center | Office | Charlotte | 100.0% | 3Q | 698,000 | 215,000 | |||||||||
Northpark Town Center | Office | Atlanta | 100.0% | 4Q | 1,528,000 | 348,000 | |||||||||
2013 | |||||||||||||||
Post Oak Central | Office | Houston | 100.0% | 1Q | 1,280,000 | 230,900 | |||||||||
Terminus 200 | Office | Atlanta | 50.0% | 1Q | 566,000 | 164,000 | |||||||||
816 Congress | Office | Austin | 100.0% | 2Q | 435,000 | 102,400 | |||||||||
Greenway Plaza | Office | Houston | 100.0% | 3Q | 4,348,000 | 950,000 | |||||||||
777 Main | Office | Fort Worth | 100.0% | 3Q | 980,000 | 160,000 | |||||||||
2012 | |||||||||||||||
2100 Ross | Office | Dallas | 100.0% | 3Q | 844,000 | 59,200 | |||||||||
19,723,000 | $ | 2,528,200 | |||||||||||||
Project | Type | Metropolitan Area | Company's Ownership Interest | Timing | Square Feet | Total Project Cost ($ in thousands) | |||||||||
2015 | |||||||||||||||
Colorado Tower | Office | Austin | 100.0% | 1Q | 373,000 | $ | 126,100 | ||||||||
Emory Point - Phase II | Mixed | Atlanta | 75.0% | 3Q | 302,000 | 75,400 | |||||||||
Research Park V | Office | Austin | 100.0% | 4Q | 173,000 | 45,000 | |||||||||
2013 | |||||||||||||||
Emory Point - Phase I | Mixed | Atlanta | 75.0% | 4Q | 484,000 | 102,300 | |||||||||
2012 | |||||||||||||||
Mahan Village | Retail | Tallahassee | 50.5% | 4Q | 147,000 | 25,800 | |||||||||
1,479,000 | $ | 374,600 |
Cousins Properties Incorporated | 22 | Q1 2017 Supplemental Information |
INVESTMENT ACTIVITY |
Property | Type | Metropolitan Area | Company's Ownership Interest | Timing | Square Feet | Gross Sales Price ($ in thousands) | |||||||||
2016 | |||||||||||||||
100 North Point Center East | Office | Atlanta | 100.0% | 1Q | 129,000 | $ | 22,000 | ||||||||
Post Oak Central | Office | Houston | 100.0% | 4Q | 1,280,000 | (2 | ) | ||||||||
Greenway Plaza | Office | Houston | 100.0% | 4Q | 4,348,000 | (2 | ) | ||||||||
Two Liberty Place | Office | Philadelphia | 100.0% | 4Q | 941,000 | 219,000 | |||||||||
191 Peachtree | Office | Atlanta | 100.0% | 4Q | 1,225,000 | 267,500 | |||||||||
Lincoln Place | Office | Miami | 100.0% | 4Q | 140,000 | 80,000 | |||||||||
The Forum | Office | Atlanta | 100.0% | 4Q | 220,000 | 70,000 | |||||||||
2015 | |||||||||||||||
2100 Ross | Office | Dallas | 100.0% | 3Q | 844,000 | 131,000 | |||||||||
200, 333, and 555 North Point Center East | Office | Atlanta | 100.0% | 4Q | 411,000 | 70,300 | |||||||||
The Points at Waterview | Office | Dallas | 100.0% | 4Q | 203,000 | 26,800 | |||||||||
2014 | |||||||||||||||
600 University Park Place | Office | Birmingham | 100.0% | 1Q | 123,000 | 19,700 | |||||||||
Lakeshore Park Plaza | Office | Birmingham | 100.0% | 3Q | 197,000 | 25,000 | |||||||||
Mahan Village | Retail | Florida | 50.5% | 4Q | 147,000 | 29,500 | |||||||||
Cousins Watkins LLC | Retail | Other | 50.5% | 4Q | 339,000 | 50,000 | |||||||||
777 Main | Office | Fort Worth | 100.0% | 4Q | 980,000 | 167,000 | |||||||||
2013 | |||||||||||||||
Terminus 100 | Office | Atlanta | 100.0% | 1Q | 656,000 | 209,200 | |||||||||
Tiffany Springs MarketCenter | Retail | Kansas City | 88.5% | 3Q | 238,000 | 53,500 | |||||||||
The Avenue Murfreesboro | Retail | Nashville | 50.0% | 3Q | 752,000 | 164,000 | |||||||||
CP Venture Two LLC | Retail | Other | 10.3% | 3Q | 934,000 | 226,100 | |||||||||
CP Venture Five LLC | Retail | Other | 11.5% | 3Q | 1,179,000 | 296,200 | |||||||||
Inhibitex | Office | Atlanta | 100.0% | 4Q | 51,000 | 8,300 | |||||||||
2012 | |||||||||||||||
The Avenue Collierville | Retail | Memphis | 100.0% | 2Q | 511,000 | 55,000 | |||||||||
Galleria 75 | Office | Atlanta | 100.0% | 2Q | 111,000 | 9,200 | |||||||||
Ten Peachtree Place | Office | Atlanta | 50.0% | 2Q | 260,000 | 45,300 | |||||||||
The Avenue Webb Gin | Retail | Atlanta | 100.0% | 4Q | 322,000 | 59,600 | |||||||||
The Avenue Forsyth | Retail | Atlanta | 88.5% | 4Q | 524,000 | 119,000 | |||||||||
Cosmopolitan Center | Office | Atlanta | 100.0% | 4Q | 51,000 | 7,000 | |||||||||
Palisades West | Office | Austin | 50.0% | 4Q | 373,000 | 64,800 | |||||||||
Presbyterian Medical Plaza | Office | Charlotte | 11.5% | 4Q | 69,000 | 4,500 | |||||||||
17,558,000 | $ | 2,499,500 |
Cousins Properties Incorporated | 23 | Q1 2017 Supplemental Information |
DEVELOPMENT PIPELINE (1) |
Project | Type | Metropolitan Area | Company's Ownership Interest | Project Start Date | Number of Square Feet /Apartment Units | Estimated Project Cost (2) ($ in thousands) | Company's Share of Estimated Project Costs | Project Cost Incurred to Date ($ in thousands) | Company's Share of Project Costs Incurred to Date | Percent Leased | Initial Occupancy (3) | Estimated Stabilization (4) | |||||||||||||||||||||||
Carolina Square | Mixed | Chapel Hill, NC | 50 | % | 2Q15 | $ | 123,000 | $ | 61,500 | $ | 80,109 | $ | 40,055 | ||||||||||||||||||||||
Office | 158,000 | 74 | % | 3Q17 | 3Q18 | ||||||||||||||||||||||||||||||
Retail | 44,000 | 61 | % | 3Q17 | 3Q18 | ||||||||||||||||||||||||||||||
Apartments | 246 | — | % | 3Q17 | 3Q18 | ||||||||||||||||||||||||||||||
864 Spring Street (NCR Phase I) | Office | Atlanta, GA | 100 | % | 3Q15 | 502,000 | 219,000 | 219,000 | 130,184 | 130,184 | 100 | % | 1Q18 | 1Q18 | |||||||||||||||||||||
8000 Avalon | Office | Atlanta, GA | 90 | % | 1Q16 | 224,000 | 73,000 | 65,700 | 48,915 | 44,024 | 40 | % | 2Q17 | 2Q18 | |||||||||||||||||||||
858 Spring Street (NCR Phase II) | Office | Atlanta, GA | 100 | % | 4Q16 | 260,000 | 119,000 | 119,000 | 24,410 | 24,410 | 100 | % | 4Q18 | 4Q18 | |||||||||||||||||||||
Dimensional Place | Office | Charlotte, NC | 50 | % | 4Q16 | 94,000 | 47,000 | 22,486 | 11,243 | ||||||||||||||||||||||||||
Office | 266,000 | 100 | % | 4Q18 | 4Q18 | ||||||||||||||||||||||||||||||
Retail | 16,000 | — | % | 4Q18 | 4Q18 | ||||||||||||||||||||||||||||||
120 West Trinity | Mixed | Atlanta, GA | 20 | % | 1Q17 | 85,000 | 17,000 | 11,192 | 2,238 | ||||||||||||||||||||||||||
Office | 33,000 | — | % | 1Q19 | 1Q20 | ||||||||||||||||||||||||||||||
Retail | 19,000 | — | % | 1Q19 | 1Q20 | ||||||||||||||||||||||||||||||
Apartments | 330 | — | % | 1Q19 | 1Q20 | ||||||||||||||||||||||||||||||
Total | $ | 713,000 | $ | 529,200 | $ | 317,296 | $ | 252,154 |
(1) | This schedule shows projects currently under active development and/or projects with a contractual obligation through the substantial completion of construction. Amounts included in the estimated project cost column represent the estimated costs of the project through stabilization. Significant estimation is required to derive these costs, and the final costs may differ from these estimates. The projected stabilization dates are also estimates and are subject to change as the project proceeds through the development process. | ||||
(2) | Amount represents 100% of the estimated project cost. Carolina Square is expected to be funded with a combination of equity from the partners and up to $79.8 million from a construction loan, which has $37.4 million outstanding as of March 31, 2017. | ||||
(3) | Represents the quarter which the Company estimates the first tenant occupies space. | ||||
(4) | Stabilization represents the earlier of the quarter in which the Company estimates it will achieve 90% economic occupancy or one year from initial occupancy. |
Cousins Properties Incorporated | 24 | Q1 2017 Supplemental Information |
LAND INVENTORY |
Metropolitan Area | Type | Company's Ownership Interest | Total Developable Land (Acres) | Company's Share | ||||||||||
North Point | Atlanta | Commercial | 100% | 12 | ||||||||||
Wildwood Office Park | Atlanta | Commercial | 50% | 22 | ||||||||||
The Avenue Forsyth-Adjacent Land | Atlanta | Commercial | 100% | 10 | ||||||||||
Georgia | 44 | |||||||||||||
Victory Center | Dallas | Commercial | 75% | 3 | ||||||||||
Texas | 3 | |||||||||||||
Corporate Center | Tampa | Commercial | 100% | 7 | ||||||||||
Florida | 7 | |||||||||||||
Padre Island | Corpus Christi | Residential | 50% | 15 | ||||||||||
Texas | 15 | |||||||||||||
Total Land Held (Acres) | 69 | 51 | ||||||||||||
Total Land Held (Cost Basis) | $ | 49,272 | $ | 19,265 | ||||||||||
Cousins Properties Incorporated | 25 | Q1 2017 Supplemental Information |
DEBT SCHEDULE |
Company's Share of Debt Maturities and Principal Payments | |||||||||||||||||||||||||||||||||||||||||||||
Description (Interest Rate Base, if not fixed) | Company's Ownership Interest | Rate at End of Quarter | Maturity Date | 2017 | 2018 | 2019 | 2020 | 2021 | Thereafter | Total Principal | Deferred Loan Costs | Above/Below Market Value | Total | ||||||||||||||||||||||||||||||||
Consolidated Debt | |||||||||||||||||||||||||||||||||||||||||||||
Floating Rate | |||||||||||||||||||||||||||||||||||||||||||||
Term Loan, Unsecured (LIBOR + 1.20%-1.70%) (1) | 100% | 2.18% | 12/2/21 | $ | — | $ | — | $ | — | $ | — | $ | 250,000 | $ | — | $ | 250,000 | $ | (1,826 | ) | $ | — | $ | 248,174 | |||||||||||||||||||||
Credit Facility, Unsecured (LIBOR + 1.10%-1.45%) (2) | 100% | 2.08% | 5/28/19 | — | — | — | — | — | — | — | — | — | — | ||||||||||||||||||||||||||||||||
Total Floating Rate Debt | — | — | — | — | 250,000 | — | 250,000 | (1,826 | ) | — | 248,174 | ||||||||||||||||||||||||||||||||||
Fixed Rate | |||||||||||||||||||||||||||||||||||||||||||||
Fifth Third Center | 100% | 3.37% | 10/1/26 | 2,229 | 3,061 | 3,165 | 3,274 | 3,386 | 133,671 | 148,786 | (633 | ) | — | 148,153 | |||||||||||||||||||||||||||||||
One Eleven Congress (6) | 100% | 6.08% | 6/11/17 | 128,000 | — | — | — | — | — | 128,000 | — | 771 | 128,771 | ||||||||||||||||||||||||||||||||
The American Cancer Society Center (3) | 100% | 6.45% | 9/1/17 | 126,997 | — | — | — | — | — | 126,997 | (36 | ) | — | 126,961 | |||||||||||||||||||||||||||||||
Colorado Tower | 100% | 3.45% | 9/1/26 | — | 573 | 2,343 | 2,425 | 2,510 | 112,149 | 120,000 | (907 | ) | — | 119,093 | |||||||||||||||||||||||||||||||
Promenade | 100% | 4.27% | 10/1/22 | 2,252 | 3,116 | 3,252 | 3,394 | 3,541 | 89,052 | 104,607 | (329 | ) | — | 104,278 | |||||||||||||||||||||||||||||||
San Jacinto (6) | 100% | 6.05% | 6/11/17 | 101,000 | — | — | — | — | — | 101,000 | — | 602 | 101,602 | ||||||||||||||||||||||||||||||||
816 Congress | 100% | 3.75% | 11/1/24 | 1,181 | 1,629 | 1,690 | 1,754 | 1,821 | 76,411 | 84,486 | (624 | ) | — | 83,862 | |||||||||||||||||||||||||||||||
3344 Peachtree | 100% | 4.75% | 10/1/17 | 78,453 | — | — | — | — | — | 78,453 | — | 858 | 79,311 | ||||||||||||||||||||||||||||||||
Two Buckhead Plaza | 100% | 6.43% | 10/1/17 | 52,000 | — | — | — | — | — | 52,000 | — | 999 | 52,999 | ||||||||||||||||||||||||||||||||
Meridian Mark Plaza | 100% | 6.00% | 8/1/20 | 366 | 514 | 546 | 22,978 | — | — | 24,404 | (89 | ) | — | 24,315 | |||||||||||||||||||||||||||||||
The Pointe | 100% | 4.01% | 2/10/19 | 326 | 456 | 22,056 | — | — | — | 22,838 | — | 371 | 23,209 | ||||||||||||||||||||||||||||||||
Total Fixed Rate Debt | 492,804 | 9,349 | 33,052 | 33,825 | 11,258 | 411,283 | 991,571 | (2,618 | ) | 3,601 | 992,554 | ||||||||||||||||||||||||||||||||||
Total Consolidated Debt | $ | 492,804 | $ | 9,349 | $ | 33,052 | $ | 33,825 | $ | 261,258 | $ | 411,283 | $ | 1,241,571 | $ | (4,444 | ) | $ | 3,601 | $ | 1,240,728 | ||||||||||||||||||||||||
Unconsolidated Debt | |||||||||||||||||||||||||||||||||||||||||||||
Floating Rate | |||||||||||||||||||||||||||||||||||||||||||||
Emory Point I (LIBOR + 1.75%, $61.1mm facility) (4) | 75% | 2.73% | 10/9/17 | 43,522 | — | — | — | — | — | 43,522 | (116 | ) | — | 43,406 | |||||||||||||||||||||||||||||||
Emory Point II (LIBOR + 1.85%, $46mm facility) (4) | 75% | 2.83% | 10/9/17 | 33,796 | — | — | — | — | — | 33,796 | (99 | ) | — | 33,697 | |||||||||||||||||||||||||||||||
Carolina Square (LIBOR + 1.90%, $79.8mm facility) | 50% | 2.70% | 5/1/18 | — | 18,706 | — | — | — | — | 18,706 | — | — | 18,706 | ||||||||||||||||||||||||||||||||
Total Floating Rate Debt | 77,318 | 18,706 | — | — | — | — | 96,024 | (215 | ) | — | 95,809 | ||||||||||||||||||||||||||||||||||
. | |||||||||||||||||||||||||||||||||||||||||||||
Fixed Rate | |||||||||||||||||||||||||||||||||||||||||||||
Terminus 100 | 50% | 5.25% | 1/1/23 | 1,016 | 1,418 | 1,494 | 1,575 | 1,659 | 55,840 | 63,002 | (73 | ) | — | 62,929 | |||||||||||||||||||||||||||||||
Terminus 200 | 50% | 3.79% | 1/1/23 | 580 | 800 | 831 | 863 | 896 | 36,281 | 40,251 | (32 | ) | — | 40,219 | |||||||||||||||||||||||||||||||
Emory University Hospital Midtown Medical Office Tower | 50% | 3.50% | 6/1/23 | 571 | 785 | 814 | 842 | 872 | 32,340 | 36,224 | (147 | ) | — | 36,077 | |||||||||||||||||||||||||||||||
Courvoisier Centre | 20% | 4.60% | 3/1/26 | — | — | — | — | — | 21,300 | 21,300 | — | 982 | 22,282 | ||||||||||||||||||||||||||||||||
Total Fixed Rate Debt | 2,167 | 3,003 | 3,139 | 3,280 | 3,427 | 145,761 | 160,777 | (252 | ) | 982 | 161,507 | ||||||||||||||||||||||||||||||||||
Total Unconsolidated Debt | 79,485 | 21,709 | 3,139 | 3,280 | 3,427 | 145,761 | 256,801 | (467 | ) | 982 | 257,316 | ||||||||||||||||||||||||||||||||||
Total Debt | $ | 572,289 | $ | 31,058 | $ | 36,191 | $ | 37,105 | $ | 264,685 | $ | 557,044 | $ | 1,498,372 | $ | (4,911 | ) | $ | 4,583 | $ | 1,498,044 | ||||||||||||||||||||||||
Total Maturities (5) | $ | 561,909 | $ | 18,706 | $ | 22,018 | $ | 22,644 | $ | 250,000 | $ | 514,110 | $ | 1,389,387 | |||||||||||||||||||||||||||||||
% of Maturities | 40 | % | 1 | % | 2 | % | 2 | % | 18 | % | 37 | % | 100 | % |
Cousins Properties Incorporated | 26 | Q1 2017 Supplemental Information |
DEBT SCHEDULE |
Total Debt ($) | Total Debt (%) | Weighted Average Interest Rate | Weighted Average Maturity (Yrs.) | ||||||||||
Floating Rate Debt | $ | 346,024 | 23 | % | 2.34 | % | 3.6 | ||||||
Fixed Rate Debt | 1,152,348 | 77 | % | 4.81 | % | 4.4 | |||||||
Total Debt | $ | 1,498,372 | 100 | % | 4.24 | % | 4.2 |
Cousins Properties Incorporated | 27 | Q1 2017 Supplemental Information |
DEBT SCHEDULE |
Cousins Properties Incorporated | 28 | Q1 2017 Supplemental Information |
NON-GAAP FINANCIAL MEASURES - CALCULATIONS AND RECONCILIATIONS |
2015 | 2016 1st | 2016 2nd | 2016 3rd | 2016 4th | 2016 | 2017 1st | ||||||||
Income from Discontinued Operations | ||||||||||||||
Rental Property Revenues | 176,828 | 43,123 | 44,281 | 46,046 | 3,477 | 136,927 | — | |||||||
Rental Property Operating Expenses | (73,630 | ) | (17,805 | ) | (19,155 | ) | (19,638 | ) | (1,738 | ) | (58,336 | ) | — | |
Net Operating Income | 103,198 | 25,318 | 25,126 | 26,408 | 1,739 | 78,591 | — | |||||||
Termination Fees | 450 | 186 | 102 | — | — | 288 | — | |||||||
Interest and Other Expense | (8,009 | ) | (1,975 | ) | (1,965 | ) | (1,956 | ) | (126 | ) | (6,022 | ) | — | |
Transaction Costs | — | — | — | (494 | ) | (5,855 | ) | (6,349 | ) | — | ||||
FFO from Discontinued Operations | 95,639 | 23,529 | 23,263 | 23,958 | (4,242 | ) | 66,508 | — | ||||||
Depreciation and Amortization of Real Estate | (63,791 | ) | (15,428 | ) | (15,740 | ) | (15,221 | ) | (956 | ) | (47,345 | ) | — | |
Income (Loss) from Discontinued Operations | 31,848 | 8,101 | 7,523 | 8,737 | (5,198 | ) | 19,163 | — | ||||||
FFO and EBITDA | ||||||||||||||
Net income available to common stockholders | 125,518 | 22,796 | 7,765 | 11,657 | 36,892 | 79,109 | 4,751 | |||||||
Depreciation and amortization of real estate assets: | ||||||||||||||
Consolidated properties | 70,003 | 16,164 | 16,306 | 16,293 | 47,819 | 96,583 | 54,433 | |||||||
Discontinued properties | 63,791 | 15,428 | 15,740 | 15,221 | 956 | 47,345 | — | |||||||
Share of unconsolidated joint ventures | 11,645 | 3,259 | 3,231 | 3,268 | 4,146 | 13,904 | 4,195 | |||||||
Partners' share of real estate depreciation | — | — | — | — | (3,564 | ) | (3,564 | ) | — | |||||
(Gain) loss on sale of depreciated properties: | ||||||||||||||
Consolidated properties | (78,759 | ) | (14,190 | ) | 246 | — | (59,589 | ) | (73,533 | ) | 18 | |||
Loss on purchase of tenant in common interest | — | — | — | — | — | — | 3,539 | |||||||
Discontinued properties | 551 | — | — | — | — | — | — | |||||||
Non-controlling interest related to unit holders | — | — | — | — | 784 | 784 | 101 | |||||||
FFO | 192,749 | 43,457 | 43,288 | 46,439 | 27,444 | 160,628 | 67,037 | |||||||
Interest Expense | 38,178 | 9,421 | 9,359 | 9,748 | 12,566 | 41,094 | 12,066 | |||||||
Non-Real Estate Depreciation and Amortization | 1,621 | 377 | 335 | 328 | 325 | 1,365 | 451 | |||||||
Acquisition and Merger Costs | 299 | 19 | 2,424 | 1,940 | 26,488 | 30,871 | 1,930 | |||||||
Loss on Extinguishment of Debt | — | — | — | — | 5,180 | 5,180 | — | |||||||
Impairment Loss | — | — | — | — | 4,526 | 4,526 | — | |||||||
EBITDA (1) | 232,847 | 53,274 | 55,406 | 58,455 | 76,529 | 243,664 | 81,484 | |||||||
Income (Loss) from Unconsolidated Joint Ventures | ||||||||||||||
Net Operating Income | ||||||||||||||
Office Properties | 18,501 | 5,050 | 5,213 | 5,013 | 6,123 | 21,400 | 6,909 | |||||||
Other Properties | 5,834 | 1,596 | 1,741 | 1,747 | 2,302 | 7,386 | 2,267 | |||||||
Net Operating Income | 24,335 | 6,646 | 6,954 | 6,760 | 8,425 | 28,785 | 9,176 | |||||||
Sales Less Cost of Sales | 2,280 | — | — | — | 190 | 190 | — | |||||||
Termination Fees | 419 | — | — | — | 3,000 | 3,000 | 959 | |||||||
Interest Expense | (7,455 | ) | (2,007 | ) | (2,026 | ) | (2,038 | ) | (2,352 | ) | (8,423 | ) | (2,325 | ) |
Other Income/(Expense) | 368 | 454 | 87 | 72 | 303 | 916 | 505 | |||||||
Funds from Operations - Unconsolidated Joint Ventures | 19,947 | 5,093 | 5,015 | 4,794 | 9,566 | 24,468 | 8,315 |
Cousins Properties Incorporated | 29 | Q1 2017 Supplemental Information |
NON-GAAP FINANCIAL MEASURES - CALCULATIONS AND RECONCILIATIONS |
2015 | 2016 1st | 2016 2nd | 2016 3rd | 2016 4th | 2016 | 2017 1st | ||||||||
Loss on purchase of tenant in common interest | — | — | — | — | — | — | (3,539 | ) | ||||||
Depreciation and Amortization of Real Estate | (11,645 | ) | (3,259 | ) | (3,231 | ) | (3,268 | ) | (4,147 | ) | (13,905 | ) | (4,195 | ) |
Net Income from Unconsolidated Joint Ventures | 8,302 | 1,834 | 1,784 | 1,526 | 5,419 | 10,563 | 581 | |||||||
Market Capitalization | ||||||||||||||
Common Stock price at Period End | 9.43 | 10.38 | 10.40 | 10.44 | 8.51 | 8.51 | 8.27 | |||||||
Number of Common Shares/Units Outstanding at Period End | 211,513 | 210,107 | 210,171 | 210,170 | 401,596 | 401,596 | 426,823 | |||||||
Common Stock Capitalization | 1,994,568 | 2,180,911 | 2,185,778 | 2,194,175 | 3,417,582 | 3,417,582 | 3,529,826 | |||||||
Debt | 721,293 | 767,811 | 777,485 | 888,378 | 1,380,920 | 1,380,920 | 1,240,728 | |||||||
Share of Unconsolidated Debt | 225,724 | 224,430 | 222,514 | 223,944 | 251,350 | 251,350 | 257,316 | |||||||
Debt (1) | 947,017 | 992,241 | 999,999 | 1,112,322 | 1,632,270 | 1,632,270 | 1,498,044 | |||||||
Total Market Capitalization | 2,941,585 | 3,173,152 | 3,185,777 | 3,306,497 | 5,049,852 | 5,049,852 | 5,027,870 | |||||||
Credit Ratios | ||||||||||||||
Debt (1) | 947,017 | 992,241 | 999,999 | 1,112,322 | 1,632,270 | 1,632,270 | 1,498,044 | |||||||
Total Market Capitalization | 2,941,585 | 3,173,152 | 3,185,777 | 3,306,497 | 5,049,852 | 5,049,852 | 5,027,870 | |||||||
Debt (1) / Total Market Capitalization | 32.2 | % | 31.3 | % | 31.4 | % | 33.6 | % | 32.3 | % | 32.3 | % | 29.8 | % |
Total Assets - Consolidated | 2,597,803 | 2,610,408 | 2,622,995 | 2,760,732 | 4,171,607 | 4,171,607 | 4,206,289 | |||||||
Accumulated Depreciation - Consolidated | 463,008 | 486,747 | 519,075 | 539,719 | 269,339 | 269,339 | 326,039 | |||||||
Undepreciated Assets - Unconsolidated (1) | 486,941 | 460,516 | 504,408 | 507,611 | 604,236 | 604,236 | 578,207 | |||||||
Less: Investment in Unconsolidated Joint Ventures | (102,577 | ) | (110,138 | ) | (114,455 | ) | (116,933 | ) | (179,397 | ) | (179,397 | ) | (128,589 | ) |
Total Undepreciated Assets (1) | 3,445,175 | 3,447,533 | 3,532,023 | 3,691,129 | 4,865,785 | 4,865,785 | 4,981,946 | |||||||
Debt (1) | 947,017 | 992,241 | 999,999 | 1,112,322 | 1,632,270 | 1,632,270 | 1,498,044 | |||||||
Undepreciated Assets (1) | 3,445,175 | 3,447,533 | 3,532,023 | 3,691,129 | 4,865,785 | 4,865,785 | 4,981,946 | |||||||
Debt (1) / Total Undepreciated Assets (1) | 27.5 | % | 28.8 | % | 28.3 | % | 30.1 | % | 33.5 | % | 33.5 | % | 30.1 | % |
Coverage Ratios (1) | ||||||||||||||
Interest Expense | 38,178 | 9,421 | 9,359 | 9,748 | 12,566 | 41,094 | 12,066 | |||||||
Scheduled Principal Payments | 9,892 | 2,444 | 3,143 | 3,344 | 2,632 | 11,563 | 3,810 | |||||||
Fixed Charges | 48,070 | 11,865 | 12,502 | 13,092 | 15,198 | 52,657 | 15,876 | |||||||
EBITDA | 232,847 | 53,274 | 55,406 | 58,455 | 76,529 | 243,664 | 81,484 | |||||||
Fixed Charges Coverage Ratio (1) | 4.84 | 4.49 | 4.43 | 4.46 | 5.04 | 4.63 | 5.13 | |||||||
Debt (1) | 947,017 | 992,241 | 999,999 | 1,112,322 | 1,632,270 | 1,632,270 | 1,498,044 | |||||||
Net Debt (Debt (2) minus Cash) | 945,014 | 986,777 | 999,053 | 1,015,081 | 1,596,583 | 1,596,583 | 1,462,289 | |||||||
Annualized EBITDA (2) | 236,754 | 213,096 | 221,624 | 233,820 | 306,116 | 306,116 | 325,936 | |||||||
Debt (1) / Annualized EBITDA (2) | 4.00 | 4.66 | 4.51 | 4.76 | 5.33 | 5.33 | 4.60 | |||||||
Net Debt / Annualized EBITDA (3) | 3.99 | 4.63 | 4.51 | 4.34 | 5.22 | 5.22 | 4.49 | |||||||
Cousins Properties Incorporated | 30 | Q1 2017 Supplemental Information |
NON-GAAP FINANCIAL MEASURES - CALCULATIONS AND RECONCILIATIONS |
2015 | 2016 1st | 2016 2nd | 2016 3rd | 2016 4th | 2016 | 2017 1st | ||||||||
Dividend Information | ||||||||||||||
Common Dividends (3) | 69,196 | 16,918 | 16,810 | 16,821 | 23,577 | 74,126 | 25,161 | |||||||
FFO | 192,749 | 43,457 | 43,288 | 46,439 | 27,444 | 160,628 | 67,037 | |||||||
FFO Payout Ratio | 35.9 | % | 38.9 | % | 38.8 | % | 36.2 | % | 85.9 | % | 46.1 | % | 37.5 | % |
FFO | 192,749 | 43,457 | 43,288 | 46,439 | 27,444 | 160,628 | 67,037 | |||||||
Straight Line Rental Revenue | (20,009 | ) | (3,595 | ) | (3,434 | ) | (3,449 | ) | (8,489 | ) | (18,967 | ) | (9,608 | ) |
Above and Below Market Rents | (7,981 | ) | (1,834 | ) | (1,854 | ) | (1,907 | ) | (1,502 | ) | (7,097 | ) | (1,602 | ) |
Amortization of Above and Below Market Debt | — | — | — | — | (2,999 | ) | (2,999 | ) | (3,190 | ) | ||||
Acquisition and Merger Costs | 299 | 19 | 2,424 | 1,940 | 26,488 | 30,871 | 1,930 | |||||||
Loss on Extinguishment of Debt | — | — | — | — | 5,180 | 5,180 | — | |||||||
Impairment Loss | — | — | — | — | 4,526 | 4,526 | — | |||||||
Second Generation CAPEX | (54,214 | ) | (7,904 | ) | (13,166 | ) | (13,968 | ) | (11,838 | ) | (46,876 | ) | (10,971 | ) |
Deferred Income - Tenant Improvements | (48 | ) | (280 | ) | (488 | ) | (564 | ) | (594 | ) | (1,926 | ) | (625 | ) |
FAD (1) | 110,796 | 29,863 | 26,770 | 28,491 | 38,216 | 123,340 | 42,971 | |||||||
Cash Common Dividends (3) | 69,196 | 16,918 | 16,810 | 16,821 | 23,577 | 74,126 | 25,161 | |||||||
FAD Payout Ratio (1) | 62.5 | % | 56.7 | % | 62.8 | % | 59.0 | % | 61.7 | % | 60.1 | % | 58.6 | % |
Operations Ratios | ||||||||||||||
Total Undepreciated Assets (1) | 3,445,175 | 3,447,533 | 3,532,023 | 3,691,129 | 4,865,785 | 4,865,785 | 4,981,946 | |||||||
General and Administrative Expenses | 16,918 | 8,242 | 4,691 | 4,368 | 8,290 | 25,591 | 6,182 | |||||||
Annualized General and Administrative Expenses (4) / Total Undepreciated Assets | 0.49 | % | 0.96 | % | 0.53 | % | 0.47 | % | 0.68 | % | 0.53 | % | 0.50 | % |
2nd Generation TI & Leasing Costs & Building CAPEX | ||||||||||||||
Second Generation Leasing Related Costs | 46,821 | 4,867 | 10,356 | 7,992 | 10,021 | 33,236 | 10,710 | |||||||
Second Generation Building Improvements | 7,393 | 3,037 | 2,810 | 5,976 | 1,817 | 13,640 | 261 | |||||||
54,214 | 7,904 | 13,166 | 13,968 | 11,838 | 46,876 | 10,971 | ||||||||
Cousins Properties Incorporated | 31 | Q1 2017 Supplemental Information |
NON-GAAP FINANCIAL MEASURES - CALCULATIONS AND RECONCILIATIONS |
Three Months Ended | ||||||||
Cousins Net Operating Income (in thousands) | March 31, 2017 | March 31, 2016 | ||||||
Net income | $ | 4,858 | $ | 22,796 | ||||
Net operating income from unconsolidated joint ventures | 9,176 | 6,646 | ||||||
Net operating income from discontinued operations | — | 25,318 | ||||||
Fee income | (1,936 | ) | (2,199 | ) | ||||
Other income | (5,426 | ) | (390 | ) | ||||
Reimbursed expenses | 865 | 870 | ||||||
General and administrative expenses | 6,182 | 8,243 | ||||||
Interest expense | 9,741 | 5,439 | ||||||
Depreciation and amortization | 54,884 | 16,541 | ||||||
Acquisition and transaction costs | 1,930 | 19 | ||||||
Other expenses | 404 | 355 | ||||||
Income from unconsolidated joint ventures | (581 | ) | (1,834 | ) | ||||
Gain (loss) on sale of investment properties | 70 | (14,190 | ) | |||||
Income from discontinued operations | — | (8,101 | ) | |||||
Net Operating Income | $ | 80,167 | $ | 59,513 | ||||
Straight line rent | 9,608 | 3,595 | ||||||
Non-cash income | 2,227 | 2,130 | ||||||
Non-cash expense | (283 | ) | (444 | ) | ||||
Cash Basis Net Operating Income | $ | 68,615 | $ | 54,232 | ||||
Net Operating Income | ||||||||
Same Property | $ | 26,146 | $ | 24,786 | ||||
Non-Same Property | 54,021 | 34,727 | ||||||
$ | 80,167 | $ | 59,513 | |||||
Cash Basis Net Operating Income | ||||||||
Same Property | $ | 23,731 | $ | 22,514 | ||||
Non-Same Property | 44,884 | 31,718 | ||||||
$ | 68,615 | $ | 54,232 | |||||
(1) Includes Company share of unconsolidated joint ventures. These amounts are derived from the amounts in the categories indicated that are recorded at the joint venture multiplied by the Company's ownership interest. The Company does not control the operations of the unconsolidated joint ventures, but believes that including these amounts in the categories indicated is meaningful to investors and analysts. | ||||||||
(2) Annualized equals quarter amount annualized. | ||||||||
(3) The fourth quarter 2016 dividend was declared and paid in the first quarter of 2017, and is included in the first quarter 2017 GAAP financial statements and disclosures. | ||||||||
(4) Quarter amount represents quarter annualized; year-to-date represents year-to-date actual. | ||||||||
Note: Amounts may differ slightly from other schedules contained herein due to rounding. | ||||||||
Cousins Properties Incorporated | 32 | Q1 2017 Supplemental Information |
NON-GAAP FINANCIAL MEASURES - CALCULATIONS AND RECONCILIATIONS |
Three Months Ended | ||||||||
Legacy Parkway Properties Net Operating Income (in thousands) | March 31, 2017 | March 31, 2016 | ||||||
Net Operating Income | $ | 45,836 | (1) | $ | 66,695 | (2) | ||
Straight line rent | (7,364 | ) | (9,696 | ) | ||||
Non-cash income | (1,055 | ) | (2,229 | ) | ||||
Non-cash expense | 163 | 169 | ||||||
Other Adjustment | — | (659 | ) | |||||
Cash Basis Net Operating Income | $ | 37,580 | $ | 54,280 | ||||
Cash Basis Net Operating Income | ||||||||
Same Property | $ | 36,771 | $ | 32,946 | ||||
Non-Same Property | 809 | 21,334 | ||||||
$ | 37,580 | $ | 54,280 | |||||
(1) Represents Net Operating Income of the legacy Parkway Properties now included in the Company's Net Operating Income. | ||||||||
(2) Represents Net Operating Income of Parkway Properties included in its Quarterly Report on Form 10-Q. A reconciliation of Net Income to Net Operating Income is as follows: | ||||||||
Net Income | $ | 64,541 | ||||||
Management company income | (1,436 | ) | ||||||
Management company expense | 674 | |||||||
Depreciation and amortization | 41,940 | |||||||
General and administrative | 6,999 | |||||||
Interest and other income | (244 | ) | ||||||
Equity in earnings of unconsolidated joint ventures | (249 | ) | ||||||
Net gains on sale of real estate | (63,020 | ) | ||||||
Interest expense | 16,915 | |||||||
Income tax expense | 575 | |||||||
Net Operating Income | $ | 66,695 | ||||||
Cousins Properties Incorporated | 33 | Q1 2017 Supplemental Information |
NON-GAAP FINANCIAL MEASURES - DISCUSSION |
The Company uses non-GAAP financial measures in its filings and other public disclosures. The following is a list of non-GAAP financial measures that the Company commonly uses and a description for each measure of (1) the reasons that management believes the measure is useful to investors and (2) if material, any additional uses of the measure by management of the Company. “2nd Generation Tenant Improvements and Leasing Costs and Building Capital Expenditures” is used in the valuation and analysis of real estate. Because the Company develops and acquires properties, in addition to operating existing properties, its property acquisition and development expenditures included in the Statements of Cash Flows includes both initial costs associated with developing and acquiring investment assets and those expenditures necessary for operating and maintaining existing properties at historic performance levels. The latter costs are referred to as second generation costs and are useful in evaluating the economic performance of the asset and in valuing the asset. Accordingly, the Company discloses the portion of its property acquisition and development expenditures that pertain to second generation space in its operating properties. The Company excludes from second generation costs amounts incurred to lease vacant space in newly acquired buildings as well as building improvements on newly acquired buildings that management identifies as necessary to bring the building to the Company's operational standards. In addition, the Company excludes leasing costs and building improvements associated with properties identified as under redevelopment or repositioning. “Cash Basis Net Operating Income” represents Net Operating Income excluding straight-line rents, amortization of lease inducements, amortization of acquired above and below market rents, and non-cash ground lease expense. “EBITDA” represents FFO plus consolidated and Company share of unconsolidated interest expense, non-real estate depreciation and amortization, income taxes, impairment losses, predevelopment charges, loss on debt extinguishment, gain on sale of third party business, participation interest income, acquisition and merger costs, and preferred stock dividends and original issuance costs. Management believes that EBITDA provides analysts and investors with appropriate information to use in various ratios that evaluate the Company's level of debt. "Funds Available for Distribution” (“FAD”) represents FFO adjusted to exclude the effect of straight-line rent and above and below market lease amortization less 2nd Generation Tenant Improvements and Leasing Costs and Building Capital Expenditures. Management believes that FAD provides analysts and investors with information that assists in the comparability of the Company's dividend policy with other real estate companies. “FAD Before Certain Charges” represents FAD before preferred share issuance costs write off, non-depreciable impairment losses, predevelopment and other charges, loss on debt extinguishment, acquisition and merger costs, interest income and separation charges. Management believes that FAD Before Certain Charges provides analysts and investors with appropriate information related to the Company's core operations and for comparability of the results of its operations and dividend policy with other real estate companies. “Funds From Operations Available to Common Stockholders” (“FFO”) is a supplemental operating performance measure used in the real estate industry. The Company calculates FFO in accordance with the National Association of Real Estate Investment | Trusts' (“NAREIT”) definition, which is net income (loss) available to common stockholders (computed in accordance with accounting principles generally accepted in the United States (“GAAP”)), excluding extraordinary items, cumulative effect of change in accounting principle and gains or losses from sales of depreciable real property, plus depreciation and amortization of real estate assets, impairment losses on depreciable investment property and after adjustments for unconsolidated partnerships and joint ventures to reflect FFO on the same basis. FFO is used by industry analysts and investors as a supplemental measure of an equity REIT's operating performance. Historical cost accounting for real estate assets implicitly assumes that the value of real estate assets diminishes predictably over time. Since real estate values instead have historically risen or fallen with market conditions, many industry investors and analysts have considered presentation of operating results for real estate companies that use historical cost accounting to be insufficient by themselves. Thus, NAREIT created FFO as a supplemental measure of REIT operating performance that excludes historical cost depreciation, among other items, from GAAP net income. Management believes that the use of FFO, combined with the required primary GAAP presentations, has been fundamentally beneficial, improving the understanding of operating results of REITs among the investing public and making comparisons of REIT operating results more meaningful. Company management evaluates operating performance in part based on FFO. Additionally, the Company uses FFO and FFO per share, along with other measures, as a performance measure for incentive compensation to its officers and other key employees. “FFO Before Certain Charges” represents FFO before preferred share issuance costs write off, non-depreciable impairment losses, predevelopment and other charges, loss on debt extinguishment, acquisition and merger costs, gain on sale of third party business, participation interest income and separation charges. Management believes that FFO Before Certain Charges provides analysts and investors with appropriate information related to the Company's core operations and for comparability of the results of its operations with other real estate companies. “Net Operating Income” is used by industry analysts, investors and Company management to measure operating performance of the Company's properties. Net Operating Income, which is rental property revenues less rental property operating expenses, excludes certain components from net income in order to provide results that are more closely related to a property's results of operations. Certain items, such as interest expense, while included in FFO and net income, do not affect the operating performance of a real estate asset and are often incurred at the corporate level as opposed to the property level. As a result, management uses only those income and expense items that are incurred at the property level to evaluate a property's performance. Depreciation and amortization are also excluded from Net Operating Income for the reasons described under FFO above. “Same Property Net Operating Income” represents Net Operating Income or Cash Basis Net Operating Income for those office properties that have been fully operational in each of the comparable reporting periods. A fully operational property is one that achieved 90% economic occupancy or has been substantially complete and owned by the Company for each of the two periods presented. Same-Property Net Operating Income or Cash Basis Same Property Net Operating Income allows analysts, investors and management to analyze continuing operations and evaluate the growth trend of the Company's portfolio. |
Cousins Properties Incorporated | 34 | Q1 2017 Supplemental Information |