falseFY20200000024741YesYesCORNING INC /NYNoYes100000010000000000024741glw:ConvertiblePreferredStockSeriesAMember2019-01-012019-12-310000024741glw:ConvertiblePreferredStockSeriesAMember2018-01-012018-12-310000024741us-gaap:ValuationAllowanceOfDeferredTaxAssetsMember2020-12-310000024741us-gaap:AllowanceForCreditLossMember2020-12-310000024741us-gaap:ValuationAllowanceOfDeferredTaxAssetsMember2019-12-310000024741us-gaap:AllowanceForCreditLossMember2019-12-310000024741us-gaap:ValuationAllowanceOfDeferredTaxAssetsMember2018-12-310000024741us-gaap:AllowanceForCreditLossMember2018-12-310000024741us-gaap:ValuationAllowanceOfDeferredTaxAssetsMember2017-12-310000024741us-gaap:AllowanceForCreditLossMember2017-12-310000024741glw:The2018RepurchaseProgramMember2020-01-012020-12-310000024741glw:The2018RepurchaseProgramMember2019-01-012019-12-310000024741glw:The2016And2018RepurchaseProgramMember2018-01-012018-12-310000024741glw:RepurchaseProgram2019Member2019-07-170000024741glw:The2018RepurchaseProgramMember2018-04-260000024741us-gaap:TreasuryStockMember2020-01-012020-12-310000024741us-gaap:TreasuryStockMember2019-01-012019-12-310000024741us-gaap:TreasuryStockMember2018-01-012018-12-310000024741us-gaap:TreasuryStockMember2020-12-310000024741us-gaap:RetainedEarningsMember2020-12-310000024741us-gaap:PreferredStockMember2020-12-310000024741us-gaap:ParentMember2020-12-310000024741us-gaap:NoncontrollingInterestMember2020-12-310000024741us-gaap:AociIncludingPortionAttributableToNoncontrollingInterestMember2020-12-310000024741us-gaap:AdditionalPaidInCapitalMember2020-12-310000024741us-gaap:AccumulatedTranslationAdjustmentMember2020-12-310000024741us-gaap:AccumulatedOtherComprehensiveIncomeMember2020-12-310000024741us-gaap:AccumulatedNetUnrealizedInvestmentGainLossMember2020-12-310000024741us-gaap:AccumulatedNetGainLossFromDesignatedOrQualifyingCashFlowHedgesMember2020-12-310000024741us-gaap:AccumulatedDefinedBenefitPlansAdjustmentMember2020-12-310000024741us-gaap:TreasuryStockMember2019-12-310000024741us-gaap:RetainedEarningsMember2019-12-310000024741us-gaap:PreferredStockMember2019-12-310000024741us-gaap:ParentMember2019-12-310000024741us-gaap:NoncontrollingInterestMember2019-12-310000024741us-gaap:AociIncludingPortionAttributableToNoncontrollingInterestMember2019-12-310000024741us-gaap:AdditionalPaidInCapitalMember2019-12-310000024741us-gaap:AccumulatedTranslationAdjustmentMember2019-12-310000024741us-gaap:AccumulatedOtherComprehensiveIncomeMember2019-12-310000024741us-gaap:AccumulatedNetUnrealizedInvestmentGainLossMember2019-12-310000024741us-gaap:AccumulatedNetGainLossFromDesignatedOrQualifyingCashFlowHedgesMember2019-12-310000024741us-gaap:AccumulatedDefinedBenefitPlansAdjustmentMember2019-12-310000024741us-gaap:TreasuryStockMember2018-12-310000024741us-gaap:RetainedEarningsMember2018-12-310000024741us-gaap:PreferredStockMember2018-12-310000024741us-gaap:ParentMember2018-12-310000024741us-gaap:NoncontrollingInterestMember2018-12-310000024741us-gaap:AociIncludingPortionAttributableToNoncontrollingInterestMember2018-12-310000024741us-gaap:AdditionalPaidInCapitalMember2018-12-310000024741us-gaap:AccumulatedTranslationAdjustmentMember2018-12-310000024741us-gaap:AccumulatedOtherComprehensiveIncomeMember2018-12-310000024741us-gaap:AccumulatedNetUnrealizedInvestmentGainLossMember2018-12-310000024741us-gaap:AccumulatedNetGainLossFromDesignatedOrQualifyingCashFlowHedgesMember2018-12-310000024741us-gaap:AccumulatedDefinedBenefitPlansAdjustmentMember2018-12-310000024741us-gaap:TreasuryStockMember2017-12-310000024741us-gaap:RetainedEarningsMember2017-12-310000024741us-gaap:PreferredStockMember2017-12-310000024741us-gaap:ParentMember2017-12-310000024741us-gaap:NoncontrollingInterestMember2017-12-310000024741us-gaap:AociIncludingPortionAttributableToNoncontrollingInterestMember2017-12-310000024741us-gaap:AdditionalPaidInCapitalMember2017-12-310000024741us-gaap:AccumulatedTranslationAdjustmentMember2017-12-310000024741us-gaap:AccumulatedOtherComprehensiveIncomeMember2017-12-310000024741us-gaap:AccumulatedNetUnrealizedInvestmentGainLossMember2017-12-310000024741us-gaap:AccumulatedNetGainLossFromDesignatedOrQualifyingCashFlowHedgesMember2017-12-310000024741us-gaap:AccumulatedDefinedBenefitPlansAdjustmentMember2017-12-310000024741glw:VariableRateLoanFacilityMember2020-12-310000024741us-gaap:EmployeeStockOptionMember2019-12-310000024741glw:TimebasedRestrictedStockAndRestrictedStockUnitsMember2020-12-310000024741glw:TimebasedRestrictedStockAndRestrictedStockUnitsMember2019-12-310000024741glw:PerformanceBasedRestrictedStockUnitsMember2019-12-310000024741glw:PerformanceBasedRestrictedStockUnitsMemberus-gaap:ShareBasedCompensationAwardTrancheOneMember2020-01-012020-03-310000024741glw:TimebasedRestrictedStockAndRestrictedStockUnitsMember2020-01-012020-12-310000024741glw:ThreeMCommunicationsMarketDivisionMember2020-01-012020-12-310000024741glw:HSGMember2020-01-012020-12-310000024741glw:TelecommunicationProductsMember2020-01-012020-12-310000024741glw:SpecialtyGlassProductsMember2020-01-012020-12-310000024741glw:LifeScienceProductsMember2020-01-012020-12-310000024741glw:HSGMember2020-01-012020-12-310000024741glw:EnvironmentalSubstrateAndFilterProductsMember2020-01-012020-12-310000024741glw:DisplayProductsMember2020-01-012020-12-310000024741glw:AllOtherProductsMember2020-01-012020-12-310000024741glw:TelecommunicationProductsMember2019-01-012019-12-310000024741glw:SpecialtyGlassProductsMember2019-01-012019-12-310000024741glw:LifeScienceProductsMember2019-01-012019-12-310000024741glw:EnvironmentalSubstrateAndFilterProductsMember2019-01-012019-12-310000024741glw:DisplayProductsMember2019-01-012019-12-310000024741glw:AllOtherProductsMember2019-01-012019-12-310000024741glw:TelecommunicationProductsMember2018-01-012018-12-310000024741glw:SpecialtyGlassProductsMember2018-01-012018-12-310000024741glw:LifeScienceProductsMember2018-01-012018-12-310000024741glw:EnvironmentalSubstrateAndFilterProductsMember2018-01-012018-12-310000024741glw:DisplayProductsMember2018-01-012018-12-310000024741glw:AllOtherProductsMember2018-01-012018-12-310000024741glw:UnsecuredVariableRateLoanFacilitiesMember2020-01-012020-12-310000024741glw:VariableRateLoanFacilityMember2020-12-012020-12-310000024741glw:HSGMember2020-12-012020-12-310000024741us-gaap:ReclassificationOutOfAccumulatedOtherComprehensiveIncomeMember2020-01-012020-12-310000024741us-gaap:ReclassificationOutOfAccumulatedOtherComprehensiveIncomeMember2019-01-012019-12-310000024741us-gaap:ReclassificationOutOfAccumulatedOtherComprehensiveIncomeMember2018-01-012018-12-310000024741us-gaap:ReclassificationOutOfAccumulatedOtherComprehensiveIncomeMemberus-gaap:AccumulatedDefinedBenefitPlansAdjustmentNetPriorServiceCostCreditMember2020-01-012020-12-310000024741us-gaap:ReclassificationOutOfAccumulatedOtherComprehensiveIncomeMemberus-gaap:AccumulatedDefinedBenefitPlansAdjustmentMember2020-01-012020-12-310000024741us-gaap:ReclassificationOutOfAccumulatedOtherComprehensiveIncomeMemberus-gaap:AccumulatedDefinedBenefitPlansAdjustmentNetUnamortizedGainLossMember2019-01-012019-12-310000024741us-gaap:ReclassificationOutOfAccumulatedOtherComprehensiveIncomeMemberus-gaap:AccumulatedDefinedBenefitPlansAdjustmentNetPriorServiceCostCreditMember2019-01-012019-12-310000024741us-gaap:ReclassificationOutOfAccumulatedOtherComprehensiveIncomeMemberus-gaap:AccumulatedDefinedBenefitPlansAdjustmentMember2019-01-012019-12-310000024741us-gaap:ReclassificationOutOfAccumulatedOtherComprehensiveIncomeMemberus-gaap:AccumulatedDefinedBenefitPlansAdjustmentNetUnamortizedGainLossMember2018-01-012018-12-310000024741us-gaap:ReclassificationOutOfAccumulatedOtherComprehensiveIncomeMemberus-gaap:AccumulatedDefinedBenefitPlansAdjustmentNetPriorServiceCostCreditMember2018-01-012018-12-310000024741us-gaap:ReclassificationOutOfAccumulatedOtherComprehensiveIncomeMemberus-gaap:AccumulatedDefinedBenefitPlansAdjustmentMember2018-01-012018-12-310000024741srt:MinimumMemberus-gaap:TransportationEquipmentMember2020-01-012020-12-310000024741srt:MinimumMemberus-gaap:FurnitureAndFixturesMember2020-01-012020-12-310000024741srt:MinimumMemberus-gaap:EquipmentMember2020-01-012020-12-310000024741srt:MinimumMemberus-gaap:ComputerEquipmentMember2020-01-012020-12-310000024741srt:MinimumMemberus-gaap:BuildingMember2020-01-012020-12-310000024741srt:MinimumMemberglw:ManufacturingEquipmentMember2020-01-012020-12-310000024741srt:MaximumMemberus-gaap:TransportationEquipmentMember2020-01-012020-12-310000024741srt:MaximumMemberus-gaap:FurnitureAndFixturesMember2020-01-012020-12-310000024741srt:MaximumMemberus-gaap:EquipmentMember2020-01-012020-12-310000024741srt:MaximumMemberus-gaap:ComputerEquipmentMember2020-01-012020-12-310000024741srt:MaximumMemberus-gaap:BuildingMember2020-01-012020-12-310000024741srt:MaximumMemberglw:ManufacturingEquipmentMember2020-01-012020-12-310000024741us-gaap:LandMember2020-12-310000024741us-gaap:EquipmentMember2020-12-310000024741us-gaap:ConstructionInProgressMember2020-12-310000024741us-gaap:BuildingMember2020-12-310000024741us-gaap:LandMember2019-12-310000024741us-gaap:EquipmentMember2019-12-310000024741us-gaap:ConstructionInProgressMember2019-12-310000024741us-gaap:BuildingMember2019-12-310000024741us-gaap:NoncontrollingInterestMember2019-01-012019-12-3100000247412019-07-012019-09-300000024741glw:SamsungDisplayMember2014-01-1500000247412014-01-152014-01-150000024741us-gaap:OtherOperatingIncomeExpenseMember2020-01-012020-12-310000024741us-gaap:SellingGeneralAndAdministrativeExpensesMember2019-01-012019-12-310000024741us-gaap:OtherOperatingIncomeExpenseMember2019-01-012019-12-310000024741us-gaap:SellingGeneralAndAdministrativeExpensesMember2018-01-012018-12-310000024741us-gaap:OtherOperatingIncomeExpenseMember2018-01-012018-12-310000024741us-gaap:ForeignExchangeContractMemberus-gaap:CashFlowHedgingMember2020-01-012020-12-310000024741us-gaap:ForeignExchangeContractMemberus-gaap:CashFlowHedgingMember2019-01-012019-12-310000024741us-gaap:ForeignExchangeContractMemberus-gaap:CashFlowHedgingMember2018-01-012018-12-310000024741glw:InterestRateHedgesMemberus-gaap:CashFlowHedgingMember2018-01-012018-12-310000024741us-gaap:NoncontrollingInterestMember2020-01-012020-12-310000024741us-gaap:AccumulatedOtherComprehensiveIncomeMember2020-01-012020-12-310000024741us-gaap:AccumulatedOtherComprehensiveIncomeMember2019-01-012019-12-310000024741us-gaap:NoncontrollingInterestMember2018-01-012018-12-310000024741us-gaap:AccumulatedOtherComprehensiveIncomeMember2018-01-012018-12-310000024741us-gaap:AccumulatedNetGainLossFromDesignatedOrQualifyingCashFlowHedgesMember2020-01-012020-12-310000024741us-gaap:AccumulatedDefinedBenefitPlansAdjustmentMember2020-01-012020-12-310000024741us-gaap:AccumulatedNetUnrealizedInvestmentGainLossMember2019-01-012019-12-310000024741us-gaap:AccumulatedNetGainLossFromDesignatedOrQualifyingCashFlowHedgesMember2019-01-012019-12-310000024741us-gaap:AccumulatedDefinedBenefitPlansAdjustmentMember2019-01-012019-12-310000024741us-gaap:AccumulatedNetUnrealizedInvestmentGainLossMember2018-01-012018-12-310000024741us-gaap:AccumulatedNetGainLossFromDesignatedOrQualifyingCashFlowHedgesMember2018-01-012018-12-310000024741us-gaap:AccumulatedDefinedBenefitPlansAdjustmentMember2018-01-012018-12-310000024741us-gaap:AccountingStandardsUpdate201409Member2015-12-310000024741srt:NorthAmericaMember2020-12-310000024741srt:EuropeMember2020-12-310000024741srt:AsiaPacificMember2020-12-310000024741glw:OtherEuropeMember2020-12-310000024741glw:OtherAsiaPacificMember2020-12-310000024741glw:AllOtherMember2020-12-310000024741country:US2020-12-310000024741country:TW2020-12-310000024741country:MX2020-12-310000024741country:KR2020-12-310000024741country:JP2020-12-310000024741country:DE2020-12-310000024741country:CN2020-12-310000024741country:CA2020-12-310000024741srt:NorthAmericaMember2019-12-310000024741srt:EuropeMember2019-12-310000024741srt:AsiaPacificMember2019-12-310000024741glw:OtherEuropeMember2019-12-310000024741glw:OtherAsiaPacificMember2019-12-310000024741glw:AllOtherMember2019-12-310000024741country:US2019-12-310000024741country:TW2019-12-310000024741country:MX2019-12-310000024741country:KR2019-12-310000024741country:JP2019-12-310000024741country:DE2019-12-310000024741country:CN2019-12-310000024741country:CA2019-12-310000024741srt:NorthAmericaMember2018-12-310000024741srt:EuropeMember2018-12-310000024741srt:AsiaPacificMember2018-12-310000024741glw:OtherEuropeMember2018-12-310000024741glw:OtherAsiaPacificMember2018-12-310000024741glw:AllOtherMember2018-12-310000024741country:US2018-12-310000024741country:TW2018-12-310000024741country:MX2018-12-310000024741country:KR2018-12-310000024741country:JP2018-12-310000024741country:DE2018-12-310000024741country:CN2018-12-310000024741country:CA2018-12-310000024741us-gaap:OperatingSegmentsMemberglw:ReportableSegments1Member2020-01-012020-12-310000024741us-gaap:OperatingSegmentsMemberglw:NonReportableSegmentsMember2020-01-012020-12-310000024741us-gaap:OperatingSegmentsMemberglw:ReportableSegments1Member2019-01-012019-12-310000024741us-gaap:OperatingSegmentsMemberglw:NonReportableSegmentsMember2019-01-012019-12-310000024741us-gaap:OperatingSegmentsMemberglw:ReportableSegments1Member2018-01-012018-12-310000024741us-gaap:OperatingSegmentsMemberglw:NonReportableSegmentsMember2018-01-012018-12-310000024741glw:HSGMember2020-12-310000024741glw:AsbestosLitigationMemberglw:AmendedPittsburghCorningCorporationPlanMember2020-01-012020-12-310000024741glw:AsbestosLitigationMemberglw:AmendedPittsburghCorningCorporationPlanMember2019-01-012019-12-310000024741glw:DowCorningBreastImplantLitigationMemberglw:DowCorningCorporationMember2020-12-310000024741glw:AsbestosLitigationMemberglw:NonPCCAsbestosLitigationMember2020-12-310000024741glw:AsbestosLitigationMemberglw:AmendedPittsburghCorningCorporationPlanMember2020-12-310000024741glw:AsbestosLitigationMemberglw:NonPCCAsbestosLitigationMember2019-12-310000024741glw:AsbestosLitigationMemberglw:AmendedPittsburghCorningCorporationPlanMember2016-12-310000024741glw:DowCorningBreastImplantLitigationMemberglw:DowCorningCorporationMember2016-05-310000024741glw:DowCorningBankruptcyPendencyInterestClaimsMemberglw:DowCorningCorporationMember2016-05-310000024741glw:Debentures700Due2024Member2019-12-310000024741glw:IncrementalLiquidityFacilityMember2020-06-300000024741glw:UnsecuredVariableRateLoanFacilitiesCMember2020-03-310000024741glw:UnsecuredVariableRateLoanFacilitiesBMember2020-03-310000024741us-gaap:RevolvingCreditFacilityMemberglw:AmendedCreditFacilityMember2018-09-300000024741us-gaap:RevolvingCreditFacilityMemberglw:AmendedCreditFacilityMember2020-01-012020-12-310000024741us-gaap:RevolvingCreditFacilityMemberglw:AmendedCreditFacilityMember2020-12-310000024741us-gaap:CommercialPaperMember2020-12-310000024741glw:IncrementalLiquidityFacilityMember2020-12-310000024741us-gaap:CommercialPaperMember2019-12-310000024741glw:UncertainTaxPositionsMember2020-12-3100000247412020-09-092020-09-090000024741us-gaap:ReclassificationOutOfAccumulatedOtherComprehensiveIncomeMemberus-gaap:AccumulatedDefinedBenefitPlansAdjustmentMember2019-01-012019-03-310000024741glw:NationalTaxServiceOfKoreaMember2020-12-310000024741glw:NationalTaxServiceOfKoreaMember2019-12-310000024741us-gaap:PerformanceGuaranteeMemberglw:ThreeToFiveYearsMember2020-12-310000024741us-gaap:PerformanceGuaranteeMemberglw:OneToThreeYearsMember2020-12-310000024741us-gaap:PerformanceGuaranteeMemberglw:MoreThanFiveYearsMember2020-12-310000024741us-gaap:PerformanceGuaranteeMemberglw:LessThan1YearMember2020-12-310000024741us-gaap:OtherCurrentLiabilitiesMemberglw:LoanGuaranteesMember2020-12-310000024741us-gaap:FinancialStandbyLetterOfCreditMemberglw:ThreeToFiveYearsMember2020-12-310000024741us-gaap:FinancialStandbyLetterOfCreditMemberglw:OneToThreeYearsMember2020-12-310000024741us-gaap:FinancialStandbyLetterOfCreditMemberglw:MoreThanFiveYearsMember2020-12-310000024741us-gaap:FinancialStandbyLetterOfCreditMemberglw:LessThan1YearMember2020-12-310000024741us-gaap:PerformanceGuaranteeMember2020-12-310000024741us-gaap:FinancialStandbyLetterOfCreditMember2020-12-310000024741glw:LoanGuaranteesMember2020-12-310000024741glw:OpticalCommunicationsMember2020-01-012020-12-310000024741glw:LifeSciencesMember2020-01-012020-12-310000024741glw:DisplayTechnologiesMember2020-01-012020-12-310000024741glw:SegmentsAllOtherMember2019-01-012019-12-310000024741glw:OpticalCommunicationsMember2019-01-012019-12-310000024741glw:LifeSciencesMember2019-01-012019-12-310000024741glw:DisplayTechnologiesMember2019-01-012019-12-310000024741glw:SegmentsAllOtherMember2020-01-012020-12-310000024741glw:SpecialtyMaterialsMember2020-12-310000024741glw:SegmentsAllOtherMember2020-12-310000024741glw:OpticalCommunicationsMember2020-12-310000024741glw:LifeSciencesMember2020-12-310000024741glw:DisplayTechnologiesMember2020-12-310000024741glw:SpecialtyMaterialsMember2019-12-310000024741glw:SegmentsAllOtherMember2019-12-310000024741glw:OpticalCommunicationsMember2019-12-310000024741glw:LifeSciencesMember2019-12-310000024741glw:DisplayTechnologiesMember2019-12-310000024741glw:SpecialtyMaterialsMember2018-12-310000024741glw:SegmentsAllOtherMember2018-12-310000024741glw:OpticalCommunicationsMember2018-12-310000024741glw:LifeSciencesMember2018-12-310000024741glw:DisplayTechnologiesMember2018-12-310000024741glw:AllOtherMember2020-10-012020-12-310000024741us-gaap:FairValueInputsLevel1Member2020-01-012020-12-310000024741srt:MinimumMemberglw:ThreeMCommunicationsMarketDivisionMemberus-gaap:CustomerRelationshipsMember2020-01-012020-12-310000024741srt:MaximumMemberglw:ThreeMCommunicationsMarketDivisionMemberus-gaap:OtherIntangibleAssetsMember2020-01-012020-12-310000024741glw:HSGMemberus-gaap:OtherIntangibleAssetsMember2020-01-012020-12-310000024741glw:HSGMemberglw:DevelopedTechnologiesMember2020-01-012020-12-310000024741glw:HSGMemberus-gaap:OtherIntangibleAssetsMember2020-01-012020-12-310000024741glw:HSGMemberglw:DevelopedTechnologiesMember2020-01-012020-12-310000024741glw:PatentsTrademarksAndTradeNamesMember2020-12-310000024741glw:CustomerListsAndOtherMember2020-12-310000024741glw:PatentsTrademarksAndTradeNamesMember2019-12-310000024741glw:CustomerListsAndOtherMember2019-12-310000024741glw:HSGMemberus-gaap:MeasurementInputLongTermRevenueGrowthRateMember2020-12-310000024741glw:HSGMemberus-gaap:MeasurementInputDiscountRateMember2020-12-310000024741glw:HSGMember2020-01-012020-12-310000024741srt:MinimumMember2020-12-310000024741srt:MaximumMember2020-12-310000024741glw:PittsburghCorningCorporationPCCMember2020-12-310000024741glw:HemlockSemiconductorOperationsLlcMember2020-12-310000024741glw:HemlockSemiconductorOperationsLlcMember2020-12-310000024741glw:HemlockSemiconductorLlcMember2020-12-310000024741glw:HemlockSemiconductorLlcMember2020-12-310000024741glw:HemlockSemiconductorOperationsLlcMember2019-12-310000024741glw:HemlockSemiconductorLlcMember2019-12-310000024741glw:DowCorningCorporationMember2017-12-310000024741glw:DowCorningCorporationMember2016-06-010000024741glw:HSGMember2018-01-012018-12-310000024741us-gaap:EmployeeStockOptionMember2020-12-310000024741glw:RestrictedStockAndRestrictedStockUnitsMember2020-12-310000024741glw:PerformanceBasedRestrictedStockUnitsMember2020-12-310000024741us-gaap:RetainedEarningsMember2020-01-012020-12-310000024741us-gaap:RetainedEarningsMember2019-01-012019-12-310000024741us-gaap:RetainedEarningsMember2018-01-012018-12-310000024741glw:NewInvestmentHedhesMemberus-gaap:CashFlowHedgingMember2020-12-310000024741glw:GrossNotionalValueZeroCostCollarsOptionsMember2020-12-310000024741glw:GrossNotionalValueForwardMember2020-12-310000024741glw:GrossNotionalValueForeignExchangeForwardMember2020-12-310000024741glw:AverageRateForwardContractsMember2020-12-310000024741glw:NewInvestmentHedhesMemberus-gaap:CashFlowHedgingMember2019-12-310000024741glw:GrossNotionalValueForeignExchangeForwardMemberus-gaap:CashFlowHedgingMember2019-12-310000024741glw:GrossNotionalValueZeroCostCollarsOptionsMember2019-12-310000024741glw:GrossNotionalValueForwardMember2019-12-310000024741glw:AverageRateForwardContractsMember2019-12-310000024741us-gaap:ForeignExchangeContractMemberus-gaap:CashFlowHedgingMemberus-gaap:OtherExpenseMember2020-01-012020-12-310000024741glw:InterestRateHedgesMemberus-gaap:CashFlowHedgingMemberus-gaap:CostOfSalesMember2020-01-012020-12-310000024741us-gaap:CashFlowHedgingMemberus-gaap:SalesMember2020-01-012020-12-310000024741us-gaap:CashFlowHedgingMember2020-01-012020-12-310000024741glw:InterestRateHedgesMemberus-gaap:CashFlowHedgingMemberus-gaap:CostOfSalesMember2019-01-012019-12-310000024741us-gaap:CashFlowHedgingMember2019-01-012019-12-310000024741us-gaap:ForeignExchangeContractMemberus-gaap:CashFlowHedgingMemberus-gaap:OtherExpenseMember2018-01-012018-12-310000024741glw:InterestRateHedgesMemberus-gaap:CashFlowHedgingMemberus-gaap:CostOfSalesMember2018-01-012018-12-310000024741us-gaap:CashFlowHedgingMember2018-01-012018-12-310000024741glw:ForeignExchangeAndOtherContractsBalanceSheetLoansAndOtherMemberus-gaap:NondesignatedMemberus-gaap:OtherNonoperatingIncomeExpenseMember2020-01-012020-12-310000024741glw:ForeignCurrencyHedgesRelatedToTranslatedEarningsMemberus-gaap:NondesignatedMemberus-gaap:GainLossOnDerivativeInstrumentsMember2020-01-012020-12-310000024741glw:ForeignExchangeAndOtherContractsBalanceSheetLoansAndOtherMemberus-gaap:ReclassificationOutOfAccumulatedOtherComprehensiveIncomeMember2020-01-012020-12-310000024741us-gaap:NondesignatedMember2020-01-012020-12-310000024741glw:ForeignExchangeAndOtherContractsBalanceSheetLoansAndOtherMemberus-gaap:NondesignatedMemberus-gaap:OtherNonoperatingIncomeExpenseMember2019-01-012019-12-310000024741glw:ForeignCurrencyHedgesRelatedToTranslatedEarningsMemberus-gaap:NondesignatedMemberus-gaap:GainLossOnDerivativeInstrumentsMember2019-01-012019-12-310000024741us-gaap:NondesignatedMember2019-01-012019-12-310000024741glw:ForeignExchangeAndOtherContractsBalanceSheetLoansAndOtherMemberus-gaap:NondesignatedMemberus-gaap:OtherNonoperatingIncomeExpenseMember2018-01-012018-12-310000024741glw:ForeignCurrencyHedgesRelatedToTranslatedEarningsMemberus-gaap:NondesignatedMemberus-gaap:GainLossOnDerivativeInstrumentsMember2018-01-012018-12-310000024741us-gaap:NondesignatedMember2018-01-012018-12-310000024741us-gaap:OtherLiabilitiesMemberus-gaap:ForeignExchangeContractMemberus-gaap:NondesignatedMember2020-12-310000024741us-gaap:OtherLiabilitiesMemberus-gaap:ForeignExchangeContractMemberus-gaap:DesignatedAsHedgingInstrumentMember2020-12-310000024741us-gaap:OtherLiabilitiesMemberglw:TranslatedEarningsContractsMemberus-gaap:NondesignatedMember2020-12-310000024741glw:OtherAccruedLiabilitiesMemberus-gaap:ForeignExchangeContractMemberus-gaap:NondesignatedMember2020-12-310000024741glw:OtherAccruedLiabilitiesMemberus-gaap:ForeignExchangeContractMemberus-gaap:DesignatedAsHedgingInstrumentMember2020-12-310000024741glw:OtherAccruedLiabilitiesMemberglw:TranslatedEarningsContractsMemberus-gaap:NondesignatedMember2020-12-310000024741us-gaap:OtherLiabilitiesMemberus-gaap:ForeignExchangeContractMemberus-gaap:DesignatedAsHedgingInstrumentMember2019-12-310000024741us-gaap:OtherLiabilitiesMemberglw:TranslatedEarningsContractsMemberus-gaap:NondesignatedMember2019-12-310000024741glw:OtherAccruedLiabilitiesMemberus-gaap:ForeignExchangeContractMemberus-gaap:NondesignatedMember2019-12-310000024741glw:OtherAccruedLiabilitiesMemberus-gaap:ForeignExchangeContractMemberus-gaap:DesignatedAsHedgingInstrumentMember2019-12-310000024741glw:OtherAccruedLiabilitiesMemberglw:TranslatedEarningsContractsMemberus-gaap:NondesignatedMember2019-12-310000024741us-gaap:OtherCurrentAssetsMemberus-gaap:ForeignExchangeContractMemberus-gaap:NondesignatedMember2020-12-310000024741us-gaap:OtherCurrentAssetsMemberus-gaap:ForeignExchangeContractMemberus-gaap:DesignatedAsHedgingInstrumentMember2020-12-310000024741us-gaap:OtherCurrentAssetsMemberglw:TranslatedEarningsContractsMemberus-gaap:NondesignatedMember2020-12-310000024741us-gaap:OtherAssetsMemberus-gaap:ForeignExchangeContractMemberus-gaap:NondesignatedMember2020-12-310000024741us-gaap:OtherAssetsMemberus-gaap:ForeignExchangeContractMemberus-gaap:DesignatedAsHedgingInstrumentMember2020-12-310000024741us-gaap:OtherAssetsMemberglw:TranslatedEarningsContractsMemberus-gaap:NondesignatedMember2020-12-310000024741us-gaap:OtherCurrentAssetsMemberus-gaap:ForeignExchangeContractMemberus-gaap:NondesignatedMember2019-12-310000024741us-gaap:OtherCurrentAssetsMemberus-gaap:ForeignExchangeContractMemberus-gaap:DesignatedAsHedgingInstrumentMember2019-12-310000024741us-gaap:OtherCurrentAssetsMemberglw:TranslatedEarningsContractsMemberus-gaap:NondesignatedMember2019-12-310000024741us-gaap:OtherAssetsMemberus-gaap:ForeignExchangeContractMemberus-gaap:NondesignatedMember2019-12-310000024741us-gaap:OtherAssetsMemberus-gaap:ForeignExchangeContractMemberus-gaap:DesignatedAsHedgingInstrumentMember2019-12-310000024741us-gaap:OtherAssetsMemberglw:TranslatedEarningsContractsMemberus-gaap:NondesignatedMember2019-12-310000024741us-gaap:ForeignExchangeContractMemberus-gaap:NondesignatedMember2020-12-310000024741us-gaap:ForeignExchangeContractMemberus-gaap:DesignatedAsHedgingInstrumentMember2020-12-310000024741glw:TranslatedEarningsContractsMemberus-gaap:NondesignatedMember2020-12-310000024741us-gaap:NetInvestmentHedgingMember2020-12-310000024741us-gaap:CashFlowHedgingMember2020-12-310000024741glw:GrossNotionalValueTranslatedEarningsContractsMember2020-12-310000024741us-gaap:ForeignExchangeContractMemberus-gaap:NondesignatedMember2019-12-310000024741us-gaap:ForeignExchangeContractMemberus-gaap:DesignatedAsHedgingInstrumentMember2019-12-310000024741glw:TranslatedEarningsContractsMemberus-gaap:NondesignatedMember2019-12-310000024741glw:GrossNotionalValueTranslatedEarningsContractsMember2019-12-310000024741srt:MaximumMemberus-gaap:EquitySecuritiesMember2020-12-310000024741glw:BondInvestmentsMember2020-12-310000024741us-gaap:DefinedBenefitPlanCashAndCashEquivalentsMemberus-gaap:FairValueInputsLevel1Memberus-gaap:ForeignPlanMemberus-gaap:PensionPlansDefinedBenefitMember2020-12-310000024741us-gaap:DefinedBenefitPlanCashAndCashEquivalentsMemberus-gaap:FairValueInputsLevel1Membercountry:USus-gaap:PensionPlansDefinedBenefitMember2020-12-310000024741us-gaap:DefinedBenefitPlanCashAndCashEquivalentsMemberus-gaap:ForeignPlanMemberus-gaap:PensionPlansDefinedBenefitMember2020-12-310000024741us-gaap:DefinedBenefitPlanCashAndCashEquivalentsMembercountry:USus-gaap:PensionPlansDefinedBenefitMember2020-12-310000024741us-gaap:DefinedBenefitPlanCashAndCashEquivalentsMemberus-gaap:FairValueInputsLevel1Memberus-gaap:ForeignPlanMemberus-gaap:PensionPlansDefinedBenefitMember2019-12-310000024741us-gaap:DefinedBenefitPlanCashAndCashEquivalentsMemberus-gaap:FairValueInputsLevel1Membercountry:USus-gaap:PensionPlansDefinedBenefitMember2019-12-310000024741us-gaap:DefinedBenefitPlanCashAndCashEquivalentsMemberus-gaap:ForeignPlanMemberus-gaap:PensionPlansDefinedBenefitMember2019-12-310000024741us-gaap:DefinedBenefitPlanCashAndCashEquivalentsMembercountry:USus-gaap:PensionPlansDefinedBenefitMember2019-12-310000024741us-gaap:PensionPlansDefinedBenefitMember2018-12-310000024741glw:OtherPostretirementBenefitsPlanMember2018-12-310000024741glw:OtherPostretirementBenefitsPlanMember2018-01-012018-12-310000024741glw:OtherPostretirementBenefitsPlanMember2019-12-310000024741us-gaap:PensionPlansDefinedBenefitMember2020-12-310000024741us-gaap:PensionPlansDefinedBenefitMember2019-12-310000024741glw:OtherAverageRate4.27DueThrough2043Member2020-12-310000024741glw:MediumTermNotesAverageRate766DueThrough2023Member2020-12-310000024741glw:FinancingLeasesAverageDiscountRate5.47DueThrough2044Member2020-12-310000024741glw:OtherAverageRate4.27DueThrough2043Member2019-12-310000024741glw:MediumTermNotesAverageRate766DueThrough2023Member2019-12-310000024741glw:FinancingLeasesAverageDiscountRate5.47DueThrough2044Member2019-12-310000024741glw:IncrementalLiquidityFacilityMember2020-04-012020-06-300000024741glw:UnsecuredVariableRateLoanFacilitiesDMember2020-01-012020-12-310000024741glw:UnsecuredVariableRateLoanFacilitiesCMember2020-01-012020-12-310000024741glw:UnsecuredVariableRateLoanFacilitiesBMember2020-01-012020-12-310000024741glw:Debentures5.45Due2079Member2019-10-012019-12-310000024741glw:Debentures3.9Due2049Member2019-10-012019-12-310000024741glw:YenDenominatedDebentures1.513Due2039Member2019-07-012019-09-300000024741glw:YenDenominatedDebentures1.153Due2031Member2019-07-012019-09-300000024741glw:YenDenominatedDebentures1.583Due2037Member2020-12-310000024741glw:YenDenominatedDebentures1.513Due2039Member2020-12-310000024741glw:YenDenominatedDebentures1.219Due2030Member2020-12-310000024741glw:YenDenominatedDebentures1.153Due2031Member2020-12-310000024741glw:YenDenominatedDebentures1.043Due2028Member2020-12-310000024741glw:YenDenominatedDebentures.992Due2027Member2020-12-310000024741glw:YenDenominatedDebentures.722Due2025Member2020-12-310000024741glw:YenDenominatedDebentures.698Due2024Member2020-12-310000024741glw:DebenturesCallable725Due2036Member2020-12-310000024741glw:DebenturesBMember2020-12-310000024741glw:Debentures8875Due2021Member2020-12-310000024741glw:Debentures700Due2024Member2020-12-310000024741glw:Debentures685Due2029Member2020-12-310000024741glw:Debentures585Due2068Member2020-12-310000024741glw:Debentures575Due2040Member2020-12-310000024741glw:Debentures535Due2048Member2020-12-310000024741glw:Debentures5.45Due2079Member2020-12-310000024741glw:Debentures475Due2042Member2020-12-310000024741glw:Debentures470Due2037Member2020-12-310000024741glw:Debentures4.375Due2057Member2020-12-310000024741glw:Debentures370Due2023Member2020-12-310000024741glw:Debentures3.9Due2049Member2020-12-310000024741glw:Debentures29Due2022Member2020-12-310000024741glw:YenDenominatedDebentures1.583Due2037Member2019-12-310000024741glw:YenDenominatedDebentures1.513Due2039Member2019-12-310000024741glw:YenDenominatedDebentures1.219Due2030Member2019-12-310000024741glw:YenDenominatedDebentures1.153Due2031Member2019-12-310000024741glw:YenDenominatedDebentures1.043Due2028Member2019-12-310000024741glw:YenDenominatedDebentures.992Due2027Member2019-12-310000024741glw:YenDenominatedDebentures.722Due2025Member2019-12-310000024741glw:YenDenominatedDebentures.698Due2024Member2019-12-310000024741glw:DebenturesCallable725Due2036Member2019-12-310000024741glw:Debentures8875Due2021Member2019-12-310000024741glw:Debentures685Due2029Member2019-12-310000024741glw:Debentures585Due2068Member2019-12-310000024741glw:Debentures575Due2040Member2019-12-310000024741glw:Debentures535Due2048Member2019-12-310000024741glw:Debentures475Due2042Member2019-12-310000024741glw:Debentures470Due2037Member2019-12-310000024741glw:Debentures425Due2020Member2019-12-310000024741glw:Debentures4.375Due2057Member2019-12-310000024741glw:Debentures370Due2023Member2019-12-310000024741glw:Debentures29Due2022Member2019-12-310000024741glw:VariableRateLoanFacilityMember2020-09-090000024741glw:UnsecuredVariableRateLoanFacilitiesDMember2020-12-310000024741glw:Debentures5.45Due2079Member2019-12-310000024741glw:Debentures3.9Due2049Member2019-12-310000024741glw:YenDenominatedDebentures1.513Due2039Member2019-09-300000024741glw:YenDenominatedDebentures1.153Due2031Member2019-09-300000024741us-gaap:ReclassificationOutOfAccumulatedOtherComprehensiveIncomeMemberus-gaap:AccumulatedNetGainLossFromDesignatedOrQualifyingCashFlowHedgesMember2020-01-012020-12-310000024741us-gaap:ReclassificationOutOfAccumulatedOtherComprehensiveIncomeMemberus-gaap:AccumulatedNetGainLossFromDesignatedOrQualifyingCashFlowHedgesMember2019-01-012019-12-310000024741us-gaap:ReclassificationOutOfAccumulatedOtherComprehensiveIncomeMemberus-gaap:AccumulatedNetGainLossFromDesignatedOrQualifyingCashFlowHedgesMember2018-01-012018-12-310000024741us-gaap:FairValueInputsLevel1Member2020-12-310000024741glw:AllOtherMember2020-12-310000024741glw:AllOtherMember2019-12-3100000247412014-01-150000024741glw:HSGMember2019-10-012019-12-3100000247412019-10-012019-12-310000024741us-gaap:AccountingStandardsUpdate201409Member2020-12-310000024741glw:HSGMember2020-12-310000024741us-gaap:AccountingStandardsUpdate201409Member2019-12-310000024741glw:ThreeToFiveYearsMemberglw:TotalDebtMember2020-12-310000024741glw:ThreeToFiveYearsMemberglw:PurchaseObligationsMember2020-12-310000024741glw:ThreeToFiveYearsMemberglw:MinimumRentalCommitmentsMember2020-12-310000024741glw:ThreeToFiveYearsMemberglw:InterestOnLongtermDebtMember2020-12-310000024741glw:ThreeToFiveYearsMemberglw:ImputedInterestOnCapitalLeasesMember2020-12-310000024741glw:ThreeToFiveYearsMemberglw:CapitalLeasesMember2020-12-310000024741glw:OneToThreeYearsMemberglw:TotalDebtMember2020-12-310000024741glw:OneToThreeYearsMemberglw:PurchaseObligationsMember2020-12-310000024741glw:OneToThreeYearsMemberglw:MinimumRentalCommitmentsMember2020-12-310000024741glw:OneToThreeYearsMemberglw:InterestOnLongtermDebtMember2020-12-310000024741glw:OneToThreeYearsMemberglw:ImputedInterestOnCapitalLeasesMember2020-12-310000024741glw:OneToThreeYearsMemberglw:CapitalLeasesMember2020-12-310000024741glw:MoreThanFiveYearsMemberglw:TotalDebtMember2020-12-310000024741glw:MoreThanFiveYearsMemberglw:PurchaseObligationsMember2020-12-310000024741glw:MoreThanFiveYearsMemberglw:MinimumRentalCommitmentsMember2020-12-310000024741glw:MoreThanFiveYearsMemberglw:InterestOnLongtermDebtMember2020-12-310000024741glw:MoreThanFiveYearsMemberglw:ImputedInterestOnCapitalLeasesMember2020-12-310000024741glw:MoreThanFiveYearsMemberglw:CapitalLeasesMember2020-12-310000024741glw:LessThan1YearMemberus-gaap:CapitalAdditionsMember2020-12-310000024741glw:LessThan1YearMemberglw:UncertainTaxPositionsMember2020-12-310000024741glw:LessThan1YearMemberglw:TotalDebtMember2020-12-310000024741glw:LessThan1YearMemberglw:PurchaseObligationsMember2020-12-310000024741glw:LessThan1YearMemberglw:MinimumRentalCommitmentsMember2020-12-310000024741glw:LessThan1YearMemberglw:InterestOnLongtermDebtMember2020-12-310000024741glw:LessThan1YearMemberglw:ImputedInterestOnCapitalLeasesMember2020-12-310000024741glw:LessThan1YearMemberglw:CapitalLeasesMember2020-12-310000024741us-gaap:CapitalAdditionsMember2020-12-310000024741glw:UncertainTaxPositionsMember2020-12-310000024741glw:TotalDebtMember2020-12-310000024741glw:PurchaseObligationsMember2020-12-310000024741glw:MinimumRentalCommitmentsMember2020-12-310000024741glw:InterestOnLongtermDebtMember2020-12-310000024741glw:ImputedInterestOnCapitalLeasesMember2020-12-310000024741glw:CapitalLeasesMember2020-12-310000024741us-gaap:CommonStockMember2020-12-310000024741us-gaap:CommonStockMember2019-12-310000024741us-gaap:CommonStockMember2018-12-310000024741us-gaap:CommonStockMember2017-12-310000024741us-gaap:CommonStockMemberus-gaap:SubsequentEventMember2021-02-022021-02-020000024741us-gaap:CommonStockMember2020-02-042020-02-040000024741us-gaap:CommonStockMember2019-02-052019-02-050000024741glw:HSGMember2020-09-0900000247412017-12-310000024741glw:HSGMemberus-gaap:OtherIntangibleAssetsMember2020-12-310000024741glw:HSGMemberglw:DevelopedTechnologiesMember2020-12-310000024741glw:HSGMemberus-gaap:OtherIntangibleAssetsMember2020-12-310000024741glw:HSGMemberglw:DevelopedTechnologiesMember2020-12-310000024741glw:ThreeMCommunicationsMarketDivisionMemberus-gaap:OtherIntangibleAssetsMember2018-12-310000024741glw:ThreeMCommunicationsMarketDivisionMemberus-gaap:CustomerRelationshipsMember2018-12-310000024741glw:HSGMemberglw:DupontsTrichlorosilaneMember2020-09-092020-09-090000024741glw:HemlockSemiconductorOperationsLlcMember2020-09-092020-09-090000024741glw:ThreeMCommunicationsMarketDivisionMember2018-01-012018-12-310000024741glw:HSGMemberglw:HemlockSemiconductorOperationsLlcMember2020-12-310000024741glw:HSGMemberglw:HemlockSemiconductorLlcMember2020-12-310000024741glw:HSGMemberglw:HemlockSemiconductorOperationsLlcMember2020-09-090000024741glw:HSGMemberglw:HemlockSemiconductorLlcMember2020-09-090000024741glw:HemlockSemiconductorOperationsLlcMember2020-09-090000024741glw:HemlockSemiconductorLlcMember2020-09-090000024741glw:HSGMember2020-12-310000024741us-gaap:OperatingSegmentsMemberglw:SpecialtyMaterialsMember2020-12-310000024741us-gaap:OperatingSegmentsMemberglw:SegmentsAllOtherMember2020-12-310000024741us-gaap:OperatingSegmentsMemberglw:OpticalCommunicationsMember2020-12-310000024741us-gaap:OperatingSegmentsMemberglw:LifeSciencesMember2020-12-310000024741us-gaap:OperatingSegmentsMemberglw:EnvironmentalTechnologiesMember2020-12-310000024741us-gaap:OperatingSegmentsMemberglw:DisplayTechnologiesMember2020-12-310000024741us-gaap:OperatingSegmentsMember2020-12-310000024741us-gaap:OperatingSegmentsMemberglw:SpecialtyMaterialsMember2019-12-310000024741us-gaap:OperatingSegmentsMemberglw:SegmentsAllOtherMember2019-12-310000024741us-gaap:OperatingSegmentsMemberglw:OpticalCommunicationsMember2019-12-310000024741us-gaap:OperatingSegmentsMemberglw:LifeSciencesMember2019-12-310000024741us-gaap:OperatingSegmentsMemberglw:EnvironmentalTechnologiesMember2019-12-310000024741us-gaap:OperatingSegmentsMemberglw:DisplayTechnologiesMember2019-12-310000024741us-gaap:OperatingSegmentsMember2019-12-310000024741us-gaap:OperatingSegmentsMemberglw:SpecialtyMaterialsMember2018-12-310000024741us-gaap:OperatingSegmentsMemberglw:SegmentsAllOtherMember2018-12-310000024741us-gaap:OperatingSegmentsMemberglw:OpticalCommunicationsMember2018-12-310000024741us-gaap:OperatingSegmentsMemberglw:LifeSciencesMember2018-12-310000024741us-gaap:OperatingSegmentsMemberglw:EnvironmentalTechnologiesMember2018-12-310000024741us-gaap:OperatingSegmentsMemberglw:DisplayTechnologiesMember2018-12-310000024741us-gaap:OperatingSegmentsMember2018-12-310000024741us-gaap:MaterialReconcilingItemsMember2020-12-310000024741us-gaap:MaterialReconcilingItemsMember2019-12-310000024741us-gaap:MaterialReconcilingItemsMember2018-12-310000024741us-gaap:OperatingSegmentsMemberglw:ReportableSegments1Member2020-12-310000024741us-gaap:OperatingSegmentsMemberglw:NonReportableSegmentsMember2020-12-310000024741us-gaap:OperatingSegmentsMemberglw:ReportableSegments1Member2019-12-310000024741us-gaap:OperatingSegmentsMemberglw:NonReportableSegmentsMember2019-12-310000024741us-gaap:OperatingSegmentsMemberglw:ReportableSegments1Member2018-12-310000024741us-gaap:OperatingSegmentsMemberglw:NonReportableSegmentsMember2018-12-3100000247412018-12-310000024741glw:HSGMemberus-gaap:FairValueInputsLevel3Member2020-01-012020-12-310000024741us-gaap:FairValueInputsLevel3Member2020-01-012020-12-310000024741glw:ResearchDevelopmentAndEngineeringExpensesMember2020-01-012020-12-310000024741us-gaap:FairValueInputsLevel3Member2019-01-012019-12-310000024741glw:HSGMember2019-01-012019-12-310000024741glw:HSGMember2019-01-012019-12-310000024741us-gaap:StockCompensationPlanMember2020-01-012020-12-310000024741glw:ConvertiblePreferredStockSeriesAMember2020-01-012020-12-310000024741us-gaap:StockCompensationPlanMember2019-01-012019-12-310000024741us-gaap:StockCompensationPlanMember2018-01-012018-12-310000024741glw:HSGMember2020-01-012020-12-310000024741glw:RestrictedStockAndRestrictedStockUnitsMember2020-01-012020-12-310000024741glw:PerformanceBasedRestrictedStockUnitsMember2020-01-012020-12-310000024741glw:RestrictedStockAndRestrictedStockUnitsMember2019-01-012019-12-310000024741glw:RestrictedStockAndRestrictedStockUnitsMember2018-01-012018-12-310000024741srt:RevisionOfPriorPeriodAccountingStandardsUpdateAdjustmentMemberus-gaap:AccountingStandardsUpdate201409Member2019-12-310000024741us-gaap:LeaseholdsAndLeaseholdImprovementsMember2020-12-310000024741us-gaap:LeaseholdsAndLeaseholdImprovementsMember2019-12-310000024741glw:EnvironmentalCleanupAndRelatedLitigationMember2019-12-310000024741us-gaap:ValuationAllowanceOfDeferredTaxAssetsMember2020-01-012020-12-310000024741us-gaap:AllowanceForCreditLossMember2020-01-012020-12-310000024741us-gaap:ValuationAllowanceOfDeferredTaxAssetsMember2019-01-012019-12-310000024741us-gaap:AllowanceForCreditLossMember2019-01-012019-12-310000024741us-gaap:ValuationAllowanceOfDeferredTaxAssetsMember2018-01-012018-12-310000024741us-gaap:AllowanceForCreditLossMember2018-01-012018-12-310000024741srt:MinimumMemberus-gaap:EmployeeStockOptionMember2020-01-012020-12-310000024741srt:MinimumMemberglw:RestrictedStockAndRestrictedStockUnitsMember2020-01-012020-12-310000024741srt:MaximumMemberus-gaap:EmployeeStockOptionMember2020-01-012020-12-310000024741srt:MaximumMemberglw:RestrictedStockAndRestrictedStockUnitsMember2020-01-012020-12-310000024741us-gaap:CommonStockMemberus-gaap:SubsequentEventMember2021-02-032021-02-030000024741us-gaap:CommonStockMember2020-02-052020-02-050000024741us-gaap:CommonStockMember2019-02-062019-02-060000024741us-gaap:ParentMember2020-01-012020-12-310000024741us-gaap:AdditionalPaidInCapitalMember2020-01-012020-12-310000024741us-gaap:ParentMember2019-01-012019-12-310000024741us-gaap:AdditionalPaidInCapitalMember2019-01-012019-12-310000024741us-gaap:ParentMember2018-01-012018-12-310000024741us-gaap:AdditionalPaidInCapitalMember2018-01-012018-12-310000024741us-gaap:EmployeeStockOptionMember2019-01-012019-12-310000024741us-gaap:EmployeeStockOptionMember2018-01-012018-12-310000024741srt:MinimumMemberus-gaap:EmployeeStockOptionMember2019-01-012019-12-310000024741srt:MaximumMemberus-gaap:EmployeeStockOptionMember2019-01-012019-12-310000024741srt:MinimumMemberus-gaap:EmployeeStockOptionMember2018-01-012018-12-310000024741srt:MaximumMemberus-gaap:EmployeeStockOptionMember2018-01-012018-12-310000024741glw:HSGMemberglw:DupontsTrichlorosilaneMember2020-01-012020-12-310000024741us-gaap:OperatingSegmentsMemberglw:SegmentsAllOtherMemberglw:SegmentsAllOtherMember2020-01-012020-12-310000024741us-gaap:OperatingSegmentsMemberglw:PolycrystallineSiliconMemberglw:SegmentsAllOtherMember2020-01-012020-12-310000024741us-gaap:OperatingSegmentsMemberglw:LabwareMemberglw:LifeSciencesMember2020-01-012020-12-310000024741us-gaap:OperatingSegmentsMemberglw:EnterpriseNetworkMemberglw:OpticalCommunicationsMember2020-01-012020-12-310000024741us-gaap:OperatingSegmentsMemberglw:DieselMemberglw:EnvironmentalTechnologiesMember2020-01-012020-12-310000024741us-gaap:OperatingSegmentsMemberglw:CorningGorillaGlassMemberglw:SpecialtyMaterialsMember2020-01-012020-12-310000024741us-gaap:OperatingSegmentsMemberglw:CellCultureProductsMemberglw:LifeSciencesMember2020-01-012020-12-310000024741us-gaap:OperatingSegmentsMemberglw:CarrierNetworkMemberglw:OpticalCommunicationsMember2020-01-012020-12-310000024741us-gaap:OperatingSegmentsMemberglw:AutomotiveAndOtherMemberglw:EnvironmentalTechnologiesMember2020-01-012020-12-310000024741us-gaap:OperatingSegmentsMemberglw:AdvancedOpticsAndOtherSpecialtyGlassMemberglw:SpecialtyMaterialsMember2020-01-012020-12-310000024741srt:NorthAmericaMember2020-01-012020-12-310000024741srt:EuropeMember2020-01-012020-12-310000024741srt:AsiaPacificMember2020-01-012020-12-310000024741glw:OtherEuropeMember2020-01-012020-12-310000024741glw:OtherAsiaPacificMember2020-01-012020-12-310000024741glw:AllOtherMember2020-01-012020-12-310000024741country:US2020-01-012020-12-310000024741country:TW2020-01-012020-12-310000024741country:MX2020-01-012020-12-310000024741country:KR2020-01-012020-12-310000024741country:JP2020-01-012020-12-310000024741country:DE2020-01-012020-12-310000024741country:CN2020-01-012020-12-310000024741country:CA2020-01-012020-12-310000024741us-gaap:OperatingSegmentsMemberglw:SegmentsAllOtherMemberglw:SegmentsAllOtherMember2019-01-012019-12-310000024741us-gaap:OperatingSegmentsMemberglw:LabwareMemberglw:LifeSciencesMember2019-01-012019-12-310000024741us-gaap:OperatingSegmentsMemberglw:EnterpriseNetworkMemberglw:OpticalCommunicationsMember2019-01-012019-12-310000024741us-gaap:OperatingSegmentsMemberglw:DieselMemberglw:EnvironmentalTechnologiesMember2019-01-012019-12-310000024741us-gaap:OperatingSegmentsMemberglw:CorningGorillaGlassMemberglw:SpecialtyMaterialsMember2019-01-012019-12-310000024741us-gaap:OperatingSegmentsMemberglw:CellCultureProductsMemberglw:LifeSciencesMember2019-01-012019-12-310000024741us-gaap:OperatingSegmentsMemberglw:CarrierNetworkMemberglw:OpticalCommunicationsMember2019-01-012019-12-310000024741us-gaap:OperatingSegmentsMemberglw:AutomotiveAndOtherMemberglw:EnvironmentalTechnologiesMember2019-01-012019-12-310000024741us-gaap:OperatingSegmentsMemberglw:AdvancedOpticsAndOtherSpecialtyGlassMemberglw:SpecialtyMaterialsMember2019-01-012019-12-310000024741srt:NorthAmericaMember2019-01-012019-12-310000024741srt:EuropeMember2019-01-012019-12-310000024741srt:AsiaPacificMember2019-01-012019-12-310000024741glw:OtherEuropeMember2019-01-012019-12-310000024741glw:OtherAsiaPacificMember2019-01-012019-12-310000024741glw:AllOtherMember2019-01-012019-12-310000024741country:US2019-01-012019-12-310000024741country:TW2019-01-012019-12-310000024741country:MX2019-01-012019-12-310000024741country:KR2019-01-012019-12-310000024741country:JP2019-01-012019-12-310000024741country:DE2019-01-012019-12-310000024741country:CN2019-01-012019-12-310000024741country:CA2019-01-012019-12-310000024741us-gaap:OperatingSegmentsMemberglw:SegmentsAllOtherMemberglw:SegmentsAllOtherMember2018-01-012018-12-310000024741us-gaap:OperatingSegmentsMemberglw:LabwareMemberglw:LifeSciencesMember2018-01-012018-12-310000024741us-gaap:OperatingSegmentsMemberglw:EnterpriseNetworkMemberglw:OpticalCommunicationsMember2018-01-012018-12-310000024741us-gaap:OperatingSegmentsMemberglw:DieselMemberglw:EnvironmentalTechnologiesMember2018-01-012018-12-310000024741us-gaap:OperatingSegmentsMemberglw:CorningGorillaGlassMemberglw:SpecialtyMaterialsMember2018-01-012018-12-310000024741us-gaap:OperatingSegmentsMemberglw:CellCultureProductsMemberglw:LifeSciencesMember2018-01-012018-12-310000024741us-gaap:OperatingSegmentsMemberglw:CarrierNetworkMemberglw:OpticalCommunicationsMember2018-01-012018-12-310000024741us-gaap:OperatingSegmentsMemberglw:AutomotiveAndOtherMemberglw:EnvironmentalTechnologiesMember2018-01-012018-12-310000024741us-gaap:OperatingSegmentsMemberglw:AdvancedOpticsAndOtherSpecialtyGlassMemberglw:SpecialtyMaterialsMember2018-01-012018-12-310000024741srt:NorthAmericaMember2018-01-012018-12-310000024741srt:EuropeMember2018-01-012018-12-310000024741srt:AsiaPacificMember2018-01-012018-12-310000024741glw:OtherEuropeMember2018-01-012018-12-310000024741glw:OtherAsiaPacificMember2018-01-012018-12-310000024741glw:AllOtherMember2018-01-012018-12-310000024741country:US2018-01-012018-12-310000024741country:TW2018-01-012018-12-310000024741country:MX2018-01-012018-12-310000024741country:KR2018-01-012018-12-310000024741country:JP2018-01-012018-12-310000024741country:DE2018-01-012018-12-310000024741country:CN2018-01-012018-12-310000024741country:CA2018-01-012018-12-310000024741us-gaap:OperatingSegmentsMemberglw:SpecialtyMaterialsMember2020-01-012020-12-310000024741us-gaap:OperatingSegmentsMemberglw:SegmentsAllOtherMember2020-01-012020-12-310000024741us-gaap:OperatingSegmentsMemberglw:OpticalCommunicationsMember2020-01-012020-12-310000024741us-gaap:OperatingSegmentsMemberglw:LifeSciencesMember2020-01-012020-12-310000024741us-gaap:OperatingSegmentsMemberglw:EnvironmentalTechnologiesMember2020-01-012020-12-310000024741us-gaap:OperatingSegmentsMemberglw:DisplayTechnologiesMember2020-01-012020-12-310000024741us-gaap:OperatingSegmentsMemberglw:SpecialtyMaterialsMember2019-01-012019-12-310000024741us-gaap:OperatingSegmentsMemberglw:SegmentsAllOtherMember2019-01-012019-12-310000024741us-gaap:OperatingSegmentsMemberglw:OpticalCommunicationsMember2019-01-012019-12-310000024741us-gaap:OperatingSegmentsMemberglw:LifeSciencesMember2019-01-012019-12-310000024741us-gaap:OperatingSegmentsMemberglw:EnvironmentalTechnologiesMember2019-01-012019-12-310000024741us-gaap:OperatingSegmentsMemberglw:DisplayTechnologiesMember2019-01-012019-12-310000024741us-gaap:OperatingSegmentsMemberglw:SpecialtyMaterialsMember2018-01-012018-12-310000024741us-gaap:OperatingSegmentsMemberglw:SegmentsAllOtherMember2018-01-012018-12-310000024741us-gaap:OperatingSegmentsMemberglw:OpticalCommunicationsMember2018-01-012018-12-310000024741us-gaap:OperatingSegmentsMemberglw:LifeSciencesMember2018-01-012018-12-310000024741us-gaap:OperatingSegmentsMemberglw:EnvironmentalTechnologiesMember2018-01-012018-12-310000024741us-gaap:OperatingSegmentsMemberglw:DisplayTechnologiesMember2018-01-012018-12-310000024741us-gaap:HedgeFundsMember2020-01-012020-12-310000024741glw:RetirementPlansMember2020-01-012020-12-310000024741srt:MinimumMember2020-01-012020-12-310000024741us-gaap:FairValueInputsLevel2Member2020-12-310000024741us-gaap:FairValueInputsLevel2Member2019-12-310000024741us-gaap:AociIncludingPortionAttributableToNoncontrollingInterestMember2020-01-012020-12-310000024741us-gaap:AccumulatedTranslationAdjustmentMember2020-01-012020-12-310000024741us-gaap:AociIncludingPortionAttributableToNoncontrollingInterestMember2019-01-012019-12-310000024741us-gaap:AccumulatedTranslationAdjustmentMember2019-01-012019-12-310000024741us-gaap:AociIncludingPortionAttributableToNoncontrollingInterestMember2018-01-012018-12-310000024741us-gaap:AccumulatedTranslationAdjustmentMember2018-01-012018-12-310000024741us-gaap:CommonStockMember2020-01-012020-12-310000024741us-gaap:CommonStockMember2019-01-012019-12-310000024741us-gaap:CommonStockMember2018-01-012018-12-310000024741glw:EnvironmentalCleanupAndRelatedLitigationMember2020-12-310000024741glw:YenDenominatedDebentures1.583Due2037Member2020-01-012020-12-310000024741glw:YenDenominatedDebentures1.513Due2039Member2020-01-012020-12-310000024741glw:YenDenominatedDebentures1.219Due2030Member2020-01-012020-12-310000024741glw:YenDenominatedDebentures1.153Due2031Member2020-01-012020-12-310000024741glw:YenDenominatedDebentures1.043Due2028Member2020-01-012020-12-310000024741glw:YenDenominatedDebentures.992Due2027Member2020-01-012020-12-310000024741glw:YenDenominatedDebentures.722Due2025Member2020-01-012020-12-310000024741glw:YenDenominatedDebentures.698Due2024Member2020-01-012020-12-310000024741glw:OtherAverageRate4.27DueThrough2043Member2020-01-012020-12-310000024741glw:MediumTermNotesAverageRate766DueThrough2023Member2020-01-012020-12-310000024741glw:FinancingLeasesAverageDiscountRate5.47DueThrough2044Member2020-01-012020-12-310000024741glw:DebenturesCallable725Due2036Member2020-01-012020-12-310000024741glw:Debentures8875Due2021Member2020-01-012020-12-310000024741glw:Debentures700Due2024Member2020-01-012020-12-310000024741glw:Debentures685Due2029Member2020-01-012020-12-310000024741glw:Debentures585Due2068Member2020-01-012020-12-310000024741glw:Debentures575Due2040Member2020-01-012020-12-310000024741glw:Debentures535Due2048Member2020-01-012020-12-310000024741glw:Debentures5.45Due2079Member2020-01-012020-12-310000024741glw:Debentures475Due2042Member2020-01-012020-12-310000024741glw:Debentures470Due2037Member2020-01-012020-12-310000024741glw:Debentures4.375Due2057Member2020-01-012020-12-310000024741glw:Debentures370Due2023Member2020-01-012020-12-310000024741glw:Debentures3.9Due2049Member2020-01-012020-12-310000024741glw:Debentures29Due2022Member2020-01-012020-12-310000024741glw:Debentures425Due2020Member2019-10-012019-12-310000024741glw:YenDenominatedDebentures1.583Due2037Member2019-01-012019-12-310000024741glw:YenDenominatedDebentures1.513Due2039Member2019-01-012019-12-310000024741glw:YenDenominatedDebentures1.219Due2030Member2019-01-012019-12-310000024741glw:YenDenominatedDebentures1.153Due2031Member2019-01-012019-12-310000024741glw:YenDenominatedDebentures1.043Due2028Member2019-01-012019-12-310000024741glw:YenDenominatedDebentures.992Due2027Member2019-01-012019-12-310000024741glw:YenDenominatedDebentures.722Due2025Member2019-01-012019-12-310000024741glw:YenDenominatedDebentures.698Due2024Member2019-01-012019-12-310000024741glw:OtherAverageRate4.27DueThrough2043Member2019-01-012019-12-310000024741glw:MediumTermNotesAverageRate766DueThrough2023Member2019-01-012019-12-310000024741glw:FinancingLeasesAverageDiscountRate5.47DueThrough2044Member2019-01-012019-12-310000024741glw:DebenturesCallable725Due2036Member2019-01-012019-12-310000024741glw:Debentures8875Due2021Member2019-01-012019-12-310000024741glw:Debentures700Due2024Member2019-01-012019-12-310000024741glw:Debentures685Due2029Member2019-01-012019-12-310000024741glw:Debentures585Due2068Member2019-01-012019-12-310000024741glw:Debentures575Due2040Member2019-01-012019-12-310000024741glw:Debentures535Due2048Member2019-01-012019-12-310000024741glw:Debentures5.45Due2079Member2019-01-012019-12-310000024741glw:Debentures475Due2042Member2019-01-012019-12-310000024741glw:Debentures470Due2037Member2019-01-012019-12-310000024741glw:Debentures4.375Due2057Member2019-01-012019-12-310000024741glw:Debentures370Due2023Member2019-01-012019-12-310000024741glw:Debentures3.9Due2049Member2019-01-012019-12-310000024741glw:Debentures29Due2022Member2019-01-012019-12-310000024741srt:MaximumMember2020-01-012020-12-310000024741srt:ExecutiveOfficerMember2020-01-012020-12-310000024741srt:ExecutiveOfficerMember2019-01-012019-12-310000024741us-gaap:EmployeeStockOptionMember2020-01-012020-12-310000024741glw:DowCorningEnvironmentalClaimsMemberglw:DowCorningCorporationMember2020-01-012020-12-310000024741glw:DowCorningBreastImplantLitigationMemberglw:DowCorningCorporationMember2020-01-012020-12-310000024741glw:DowCorningCorporationMember2016-05-312016-05-310000024741glw:ThreeToFiveYearsMember2020-12-310000024741glw:OneToThreeYearsMember2020-12-310000024741glw:MoreThanFiveYearsMember2020-12-310000024741glw:LessThan1YearMember2020-12-310000024741us-gaap:OperatingSegmentsMember2019-01-012019-12-310000024741us-gaap:OperatingSegmentsMember2018-01-012018-12-310000024741us-gaap:MaterialReconcilingItemsMember2020-01-012020-12-310000024741us-gaap:MaterialReconcilingItemsMember2019-01-012019-12-310000024741us-gaap:MaterialReconcilingItemsMember2018-01-012018-12-310000024741glw:HSGMember2020-04-012020-06-300000024741glw:HSGMember2020-12-310000024741glw:AffiliatedCompaniesMember2020-12-310000024741glw:HSGMember2019-12-310000024741glw:AffiliatedCompaniesMember2019-12-310000024741glw:HSGMember2020-07-012020-09-300000024741glw:HSGMember2020-09-092020-09-090000024741glw:OtherPostretirementBenefitsPlanMember2020-01-012020-12-310000024741us-gaap:PensionPlansDefinedBenefitMember2019-01-012019-12-310000024741glw:OtherPostretirementBenefitsPlanMember2019-01-012019-12-310000024741glw:TaxYears2031Through2040Member2020-12-310000024741glw:TaxYears2026Through2030Member2020-12-310000024741glw:TaxYears2021Through2025Member2020-12-310000024741glw:IndefiniteMember2020-12-3100000247412019-12-310000024741srt:MinimumMemberglw:HSGMember2020-09-090000024741srt:MaximumMemberglw:HSGMember2020-09-090000024741us-gaap:PensionPlansDefinedBenefitMember2020-01-012020-12-310000024741us-gaap:PensionPlansDefinedBenefitMember2018-01-012018-12-310000024741us-gaap:OperatingSegmentsMember2020-01-012020-12-3100000247412020-01-012020-03-310000024741us-gaap:SubsequentEventMember2021-01-162021-01-1600000247412020-12-310000024741glw:HSGMember2020-09-300000024741us-gaap:FairValueInputsLevel3Member2020-12-310000024741us-gaap:FairValueInputsLevel3Member2019-12-310000024741glw:AffiliatedCompaniesMember2020-01-012020-12-310000024741glw:AffiliatedCompaniesMember2019-01-012019-12-310000024741glw:AffiliatedCompaniesMember2018-01-012018-12-310000024741glw:OtherPostretirementBenefitsPlanMember2020-12-310000024741us-gaap:SellingGeneralAndAdministrativeExpensesMember2020-01-012020-12-310000024741glw:GrossMarginMember2020-01-012020-12-310000024741glw:ResearchDevelopmentAndEngineeringExpensesMember2019-01-012019-12-310000024741glw:GrossMarginMember2019-01-012019-12-3100000247412019-01-012019-12-310000024741glw:ResearchDevelopmentAndEngineeringExpensesMember2018-01-012018-12-310000024741glw:GrossMarginMember2018-01-012018-12-3100000247412018-01-012018-12-310000024741glw:HSGMemberglw:DupontsTrichlorosilaneMember2020-09-090000024741glw:HSGMember2020-09-090000024741glw:ThreeMCommunicationsMarketDivisionMember2018-12-310000024741glw:DebenturesBMember2020-10-012020-12-3100000247412020-06-3000000247412021-01-3100000247412020-01-012020-12-31iso4217:CNYiso4217:JPYglw:itemiso4217:USDxbrli:sharesxbrli:pureiso4217:USDxbrli:shares
UNITED STATES
SECURITIES AND EXCHANGE COMMISSION
WASHINGTON, D.C. 20549
Form 10-K
| |
x | ANNUAL REPORT PURSUANT TO SECTION 13 OR 15(d) OF THE SECURITIES EXCHANGE ACT OF 1934 |
For the fiscal year ended December 31, 2020
OR
| |
o | TRANSITION REPORT PURSUANT TO SECTION 13 OR 15(d) OF THE SECURITIES EXCHANGE ACT OF 1934 |
For the transition period from ___ to ___
Commission file number: 1-3247
CORNING INCORPORATED
(Exact name of registrant as specified in its charter)
| | |
New York | | 16-0393470 |
(State or other jurisdiction of incorporation or organization) | | (I.R.S. Employer Identification No.) |
| | |
One Riverfront Plaza, Corning, New York | | 14831 |
(Address of principal executive offices) | | (Zip Code) |
607-974-9000
(Registrant’s telephone number, including area code)
Securities registered pursuant to Section 12(b) of the Act:
| | | | |
Title of each class | | Trading Symbol(s) | | Name of each exchange on which registered |
Common Stock | | GLW | | New York Stock Exchange (NYSE) |
Securities registered pursuant to Section 12(g) of the Act: None
Indicate by check mark if the registrant is a well-known seasoned issuer, as defined in Rule 405 of the Securities Act.
Yes x No ¨
Indicate by check mark if the registrant is not required to file reports pursuant to Section 13 or Section 15(d) of the Exchange Act.
Yes ¨ No x
Indicate by check mark whether the registrant (1) has filed all reports required to be filed by Section 13 or 15(d) of the Exchange Act of 1934 during the preceding 12 months (or for such shorter period that the registrant was required to file such reports), and (2) has been subject to such filing requirements for the past 90 days.
Yes x No ¨
Indicate by check mark whether the registrant has submitted electronically every Interactive Data File required to be submitted pursuant to Rule 405 of Regulation S-T (§ 232.405 of this chapter) during the preceding 12 months (or for such shorter period that the registrant was required to submit such files.)
Yes x No ¨
Indicate by check mark whether the registrant is a large accelerated filer, an accelerated filer, a non-accelerated filer, smaller reporting company, or an emerging growth company. See the definitions of “large accelerated filer,” “accelerated filer,” “smaller reporting company,” and “emerging growth company” in Rule 12b-2 of the Exchange Act.
| | | | | | | |
| Large accelerated filer | x | | | | Accelerated filer | o |
| Non-accelerated filer | o | | | | Emerging growth company | o |
| Smaller reporting company | o | | | | | |
If an emerging growth company, indicate by check mark if the registrant has elected not to use the extended transition period for complying with any new or revised financial accounting standards provided pursuant to Section 13(a) of the Exchange Act. ¨
Indicate by check mark whether the registrant has filed a report on and attestation to its management’s assessment of the effectiveness of its internal control over financial reporting under Section 404(b) of the Sarbanes-Oxley Act (15 U.S.C. 7262(b)) by the registered public accounting firm that prepared or issued its audit report. x
Indicate by check mark whether the registrant is a shell company (as defined in Rule 12b-2 of the Exchange Act).
Yes ¨ No x
As of June 30, 2020, the aggregate market value of the registrant’s common stock held by non-affiliates of the registrant was $19 billion based on the $25.90 price as reported on the New York Stock Exchange.
There were 768,367,889 shares of Corning’s common stock issued and outstanding as of January 31, 2021.
DOCUMENTS INCORPORATED BY REFERENCE
Portions of the Registrant’s Definitive Proxy Statement dated March 18, 2021, and filed for the Registrant’s 2021 Annual Meeting of Shareholders are incorporated into Part III of this Annual Report on Form 10-K, as specifically set forth in Part III.
PART I
Corning Incorporated and its consolidated subsidiaries are hereinafter sometimes referred to as the “Company,” the “Registrant,” “Corning,” “we,” “our,” or “us.”
This report contains forward-looking statements that involve a number of risks and uncertainties. These statements relate to plans, objectives, expectations and estimates and may contain words such as “believes,” “expects,” “anticipates,” “estimates,” “forecasts,” or similar expressions. Actual results could differ materially from what is expressed or forecasted in forward-looking statements. Some of the factors that could contribute to these differences include those discussed under “Forward-Looking Statements,” “Risk Factors,” “Management’s Discussion and Analysis of Financial Condition and Results of Operations,” and elsewhere in this report.
Item 1. Business
General
Corning traces its origins to a glass business established in 1851. The present corporation was incorporated in the State of New York in December 1936. The Company’s name was changed from Corning Glass Works to Corning Incorporated on April 28, 1989.
Corning Incorporated is a leading innovator in materials science. For almost 170 years, Corning has combined its unparalleled expertise in glass science, ceramic science, and optical physics with deep manufacturing and engineering capabilities to develop category-defining products that transform industries and enhance people's lives. We succeed through sustained investment in research and development, a unique combination of material and process innovation, and deep, trust-based relationships with customers who are global leaders in their industries.
Corning’s capabilities are versatile and synergistic, allowing the company to evolve to meet changing market needs, while also helping customers capture new opportunities in dynamic industries. Today, Corning’s markets include optical communications, mobile consumer electronics, display technology, automotive emissions control, laboratory products and other glass products. Corning's industry-leading products include damage-resistant cover glass for mobile devices; precision glass for advanced displays; optical fiber and cable, wireless technologies, and connectivity solutions for state-of-the-art communications networks; trusted products to accelerate drug discovery and delivery; and clean-air technologies for cars and trucks.
Corning operates in five reportable segments: Display Technologies, Optical Communications, Environmental Technologies, Specialty Materials and Life Sciences, and manufactures products at 122 plants in 15 countries.
Display Technologies Segment
Corning’s Display Technologies segment manufactures glass substrates for flat panel displays, including liquid crystal displays (“LCDs”) and organic light-emitting diode (“OLEDs”) that are used primarily in televisions, notebook computers, desktop monitors, tablets and handheld devices. This segment develops, manufactures, and supplies high quality glass substrates using technology expertise and a proprietary fusion manufacturing process, which Corning invented and is the cornerstone of the Company’s technology leadership in the display glass industry. Our highly automated process yields glass substrates with a pristine surface and excellent thermal stability and dimensional uniformity – essential attributes in the production of large, high-performance display panels. Corning’s fusion process is scalable and we believe it is the most cost-effective process in producing large size substrates.
We are recognized as a world leader in precision glass innovations that enable our customers to produce larger, thinner, more flexible, and higher-resolution displays. Some of the product innovations we have launched over the past ten years utilizing our world-class processes and capabilities include the following:
Corning® EAGLE XG® Slim Glass, Corning’s flagship glass product enabling thinner televisions and monitors with larger-sized screens; it is trusted by the world’s leading panel makers for LCD displays with more than 25 billion square feet sold;
Corning Astra® Glass, an innovative glass solution designed to meet the emerging needs for high-resolution displays. This glass is designed for oxide backplanes, but enables a range of applications made using traditional aluminosilicate to specific low temperature polysilicon processes;
Corning Lotus™ NXT Glass, a high-performance display glass designed to withstand high-temperature processing requirements enabling highest-resolution displays in smaller and flexible devices; and
The world’s first Gen 10 and Gen 10.5 glass substrate sizes in support of improved efficiency in manufacturing large-sized displays.
Corning has display glass manufacturing operations in China, South Korea, Japan and Taiwan, and services all its glass customers in all regions, utilizing its manufacturing facilities throughout Asia.
Patent protection and proprietary trade secrets are important to the Display Technologies segment’s operations. Refer to the material under the heading “Patents and Trademarks” for information relating to patents and trademarks.
The Display Technologies segment represented 28% of Corning’s segment net sales in 2020.
Optical Communications Segment
Corning invented the world’s first low-loss optical fiber in 1970. Since that milestone, we have continued to pioneer optical fiber, cable and connectivity solutions. As global bandwidth demand driven by video usage grows exponentially, telecommunications networks continue to migrate from copper to optical-based systems that can deliver the required cost-effective bandwidth-carrying capacity. Our experience puts us in a unique position to design and deliver optical solutions that reach every edge of the communications network.
This segment is divided into two main product groupings – carrier network and enterprise network. The carrier network group consists primarily of products and solutions for optical-based communications infrastructure for services such as video, data and voice communications. The enterprise network group consists primarily of optical-based communication networks sold to businesses, governments and individuals for their own use.
Our carrier network product portfolio encompasses an array of optical fiber products, including Vascade submarine optical fibers for use in submarine networks; LEAF optical fiber for long-haul, regional and metropolitan networks; SMF-28 ULL fiber for more scalable long-haul and regional networks; SMF-28e+ single-mode optical fiber that provides additional transmission wavelengths in metropolitan and access networks; ClearCurve ultra-bendable single-mode fiber for use in multiple-dwelling units and fiber-to-the-home applications; and Corning® SMF-28® Ultra Fiber, designed for high performance across the range of long-haul, metro, access, fiber-to-the-home network applications, combining the benefits of industry-leading attenuation and improved macrobend performance in one fiber. A portion of our optical fiber is sold directly to end users and third-party cablers globally. Corning’s remaining fiber production is cabled internally and sold to end users as either bulk cable or as part of an integrated optical solution. Corning’s cable products support various outdoor, indoor/outdoor and indoor applications and include a broad range of loose tube, ribbon and drop cable designs with flame-retardant versions available for indoor and indoor/outdoor use including 5G networks.
In addition to optical fiber and cable, our carrier network product portfolio also includes hardware and equipment products, including cable assemblies, fiber-optic hardware, fiber-optic connectors, optical components and couplers, closures, network interface devices, and other accessories. These products may be sold as individual components or as part of integrated optical connectivity solutions designed for various carrier network applications. Examples of these solutions include our FlexNAPTM terminal distribution system, which provides pre-connectorized distribution and drop cable assemblies for cost-effectively deploying fiber-to-the-home (“FTTH”) and 5G networks; and the CentrixTM platform, which provides a high-density fiber management system with industry-leading density and innovative jumper routing that can be deployed in a wide variety of carrier switching centers.
To keep pace with surging demand for mobile bandwidth, Corning has a full complement of operator-grade distributed antenna systems (“DAS”), including the recently developed Optical Network Evolution wireless platform. The ONE™ Wireless Platform (“ONE”) is the first all-optical converged cellular and Wi-Fi® solution built on an all-optical backbone with modular service support. It provides virtually unlimited bandwidth and meets all wireless service needs of large-scale enterprises at a lower cost than the typical DAS solution.
In addition to our optical-based portfolio, Corning’s carrier network portfolio also contains select copper-based products including subscriber demarcation, connection and protection devices, xDSL (different variations of digital subscriber lines) passive solutions and outside plant enclosures. In addition, Corning offers coaxial RF interconnects for the cable television industry as well as microwave applications for GPS, radars, satellites, manned and unmanned military vehicles, wireless applications and telecommunications systems.
Our enterprise network portfolio also includes optical fiber products, including ClearCurve ultra-bendable multimode fiber for private and hyperscale data centers and other enterprise network applications; InfiniCor fibers for local area networks; and more recently ClearCurve VSDN ultra-bendable optical fiber designed to support emerging high-speed interconnects between computers and other consumer electronics devices. The remainder of Corning’s fiber production is cabled internally and sold to end users as either bulk cable or as part of an integrated optical solution. Corning’s cable products include a broad range of tight-buffered, loose tube and ribbon cable designs with flame-retardant versions available for indoor and indoor/outdoor applications that meet local building code requirements.
Corning’s hardware and equipment for enterprise network applications include cable assemblies, fiber-optic hardware, fiber-optic connectors, optical components and couplers, closures and other accessories. These products may be sold as individual components or as part of integrated optical connectivity solutions designed for various network applications, including hyperscale data centers. Examples of enterprise network solutions include the Pretium EDGE platform, which provides high-density pre-connectorized solutions for data center applications, and continues to evolve with recent updates for upgrading to 40/100G applications and port tap modules for network monitoring; the previously mentioned ONE Wireless platform, which spans both carrier and enterprise network applications; and our recently introduced optical connectivity solutions to support customer initiatives.
Our optical fiber manufacturing facilities are in North Carolina, China and India. Cabling operations are in North Carolina, Poland and smaller regional locations. Our manufacturing operations for hardware and equipment products are in Texas, Arizona, Mexico, Brazil, Denmark, Germany, Poland, Israel, Australia and China.
Patent protection is important to the segment’s operations. The segment has an extensive portfolio of patents relating to its products, technologies and manufacturing processes. The segment licenses certain of its patents to third parties and generates revenue from these licenses, although the royalty income is not currently material to this segment’s operating results. Corning is licensed to use certain patents owned by others, which are considered important to the segment’s operations. Refer to the material under the heading “Patents and Trademarks” for information relating to the Company’s patents and trademarks.
The Optical Communications segment represented 31% of Corning’s segment net sales in 2020.
Specialty Materials Segment
The Specialty Materials segment manufactures products that provide more than 150 material formulations for glass, glass ceramics, and crystals, as well as precision metrology instruments and software to meet requirements for unique customer needs. Consequently, this segment operates in a wide variety of commercial and industrial markets including materials optimized for mobile consumer electronics, semiconductor equipment optics and consumables, aerospace and defense optics, radiation shielding products, sunglasses, and telecommunications components.
Our highly durable glass, known as Corning® Gorilla® Glass, is a chemically strengthened thin glass designed specifically to function as a cover, or back-enclosure glass, for mobile consumer electronic devices such as mobile phones, tablets, laptops and smartwatches. Elegant and lightweight, Corning® Gorilla® Glass is durable enough to resist many real-world events that commonly cause wear or scratch damage and glass failure, while providing optical clarity, touch sensitivity, and RF transparency, thus enabling exciting new applications in technology and design. In 2020, Corning unveiled its toughest Gorilla Glass yet, Corning® Gorilla® Glass Victus®, which significantly improves both drop and scratch performance, addressing consumer demand for improved durability. Corning® Gorilla® Glass is manufactured in the United States, South Korea and Taiwan.
In 2020, Corning invented the world’s first transparent, color-free glass-ceramic suitable for smartphone applications, which is featured as ‘Ceramic Shield’ on the front cover of the latest iPhone. Apple and Corning partnered to develop and scale the manufacturing of Ceramic Shield, which offers unparalleled durability and toughness.
Corning’s semiconductor optics include high-performance optical materials including Corning® HPFS® Fused Silica and Corning® ULE® Ultra-Low Expansion Glass, optical-based metrology instruments, and custom optical assemblies for applications in the global semiconductor industry. Corning’s semiconductor optics products are manufactured in New York.
Corning also manufactures ultra-flat, ultra-thin glass wafers and substrates for a variety of applications including augmented reality, advanced semiconductor packaging, 3D sensing, and more. These products are manufactured in New York, France, and China.
Other specialty glass products include tinted sunglasses and radiation shielding products that are made in France.
Patent protection is important to the segment’s operations. The segment has a growing portfolio of patents relating to its products, technologies and manufacturing processes. Brand recognition and loyalty, through well-known trademarks, are important to the segment. Refer to the material under the heading “Patents and Trademarks” for information relating to the Company’s patents and trademarks.
The Specialty Materials segment represented 16% of Corning’s segment net sales in 2020.
Environmental Technologies Segment
Corning’s Environmental Technologies segment manufactures ceramic substrates and filter products for emissions control in mobile applications around the world. In the early 1970s, Corning developed an economical, high-performance cellular ceramic substrate that is now the standard for catalytic converters in vehicles worldwide. As global emissions control regulations tighten, Corning has continued to develop more effective and durable ceramic substrate and filter products for gasoline and diesel applications, most recently launching low-mass Corning® FLORA® substrates and Corning® DuraTrap® GC gasoline particulate filters. Corning manufactures substrate and filter products in New York, Virginia, China, Germany and South Africa. Corning sells its ceramic substrate and filter products worldwide to catalyzers and manufacturers of emission control systems who then sell to automotive and diesel vehicle or engine manufacturers. Although most sales are made to the emission control systems manufacturers, the use of Corning substrates and filters is generally required by the specifications of the automotive and diesel vehicle or engine manufacturers.
Patent protection is important to the segment’s operations. The segment has an extensive portfolio of patents relating to its products, technologies and manufacturing processes. Corning is licensed to use certain patents owned by others, which are also considered important to the segment’s operations. Refer to the material under the heading “Patents and Trademarks” for information relating to the Company’s patents and trademarks.
The Environmental Technologies segment represented 12% of Corning’s segment net sales in 2020.
Life Sciences Segment
As a leading developer, manufacturer and global supplier of laboratory products for over 105 years, Corning’s Life Sciences segment works with researchers and drug manufacturers seeking to drive innovation, increase efficiencies, reduce costs and compress timelines. Using unique expertise in the fields of materials science, polymer surface science, cell culture and cell biology, the segment provides innovative solutions that improve productivity and enable breakthrough research for traditional small molecule, or chemical, drugs, biologics, vaccines, and emerging cell and gene therapies.
Life Sciences products include consumables, such as plastic vessels, liquid handling plastics, specialty surfaces, cell culture media and serum, as well as general labware and equipment. These products are used for drug discovery research and development, compound screening and toxicology testing, advanced cell culture research, genomics applications and mass production of cells for clinical trials and bioproduction.
Corning sells life sciences products under these primary brands: Corning, Falcon, PYREX and Axygen. The products are marketed globally, primarily through distributors, to pharmaceutical and biotechnology companies, contract manufacturing organizations, central testing labs, academic institutions, hospitals, government entities, and other facilities. Corning manufactures these products in California, Illinois, Maine, Massachusetts, New York, North Carolina, Utah, Virginia, China, France, Mexico and Poland.
Patent protection is important to the segment’s operations. The segment has a growing portfolio of patents relating to its products, technologies and manufacturing processes. Brand recognition and loyalty, through well-known trademarks, are important to the segment. Refer to the material under the heading “Patents and Trademarks” for more information.
The Life Sciences segment represented 9% of Corning’s segment net sales in 2020.
All Other
All other segments that do not meet the quantitative threshold for separate reporting have been grouped as “All Other.” This group is comprised of the results of the pharmaceutical technologies business, auto glass, new product lines and development projects, as well as other businesses and certain corporate investments. The Company obtained a controlling interest in Hemlock Semiconductor Group (“HSG”) during the third quarter of 2020 and has consolidated results in “All Other” as of September 9, 2020.
Refer to Note 3 (Investments) and Note 4 (HSG Transactions and Acquisitions) to the consolidated financial statements for additional information on this transaction.
“All Other” represented 4% of Corning’s segment net sales in 2020.
Additional explanation regarding Corning and its five reportable segments, as well as financial information about geographic areas, is presented in Management’s Discussion and Analysis of Financial Condition and Results of Operations and Note 20 (Reportable Segments) to the consolidated financial statements.
Competition
Corning competes with many large and varied manufacturers, both domestic and foreign. Some of these competitors are larger than Corning, and some have broader product lines. Corning strives to maintain and improve its market position through technology and product innovation. For the foreseeable future, Corning believes its competitive advantage lies in its commitment to research and development, reliability of supply, product quality and technical specification of its products. There is no assurance that Corning will be able to maintain or improve its market position or competitive advantage.
Display Technologies Segment
Corning is the largest worldwide producer of glass substrates for flat panel display glass. The environment for high-performance display glass substrate products is very competitive and Corning believes it has maintained its competitive advantages by investing in new products, continually improving its proprietary fusion manufacturing process and providing a consistent and reliable supply of high quality products. Our process allows us to deliver glass that is larger, thinner and lighter, with exceptional surface quality and without heavy metals. Asahi Glass Co. Ltd. and Nippon Electric Glass Co. Ltd. are Corning’s principal competitors in display glass substrates.
Optical Communications Segment
Corning believes it maintains a leadership position in the segment’s principal product groups, which include carrier and enterprise networks. The competitive landscape includes industry consolidation, price pressure and competition for the innovation of new products. These competitive conditions are likely to persist. Corning believes its large-scale manufacturing experience, fiber process, technology leadership and intellectual property provide cost advantages relative to several of its competitors. The primary competitors of the Optical Communications segment are CommScope and Prysmian Group.
Specialty Materials Segment
Corning has deep capabilities in materials science, optical design, shaping, coating, finishing, metrology, and optical system assembly. Our products and capabilities in this segment position the company to meet the needs of a broad array of markets, including semiconductor, aerospace, defense, industrial, commercial, and telecommunications. Schott, Asahi Glass Co. Ltd., Nippon Electric Glass Co. Ltd. and Heraeus are the main competitors for this segment.
Environmental Technologies Segment
Corning believes it maintains a strong position in the worldwide market for automotive ceramic substrate and filter products, as well as in the heavy-duty and light-duty diesel vehicle markets. The Company believes its competitive advantage in automotive ceramic substrate products for catalytic converters and filter products for particulate emissions in exhaust systems is based on an advantaged product portfolio, collaborative engineering design services, customer service and support, strategic global presence and continued product innovation. Corning’s Environmental Technologies products face principal competition from NGK Insulators, Ltd. and Ibiden Co. Ltd.
Life Sciences Segment
Corning seeks to maintain a competitive advantage by emphasizing product quality, global distribution, supply chain efficiency, a broad product line and superior product attributes. Our principal competitors include Thermo Fisher Scientific, Inc., Greiner Group AG, Eppendorf AG, Sarstedt AG and Danaher Corporation. Corning also faces competition from large distributors that have pursued backward integration or introduced private label products.
Raw Materials
Corning’s manufacturing processes and products require access to uninterrupted power sources, significant quantities of industrial water, certain precious metals and various batch materials. Availability of resources (ores, minerals, polymers, helium and processed chemicals) required in manufacturing operations, appear to be adequate. From time to time, Corning’s suppliers may experience capacity limitations in their own operations or may eliminate certain product lines. Corning believes it has adequate programs to ensure a reliable supply of raw and batch materials as well as precious metals. For many of its materials, Corning has alternate suppliers that would allow operations to continue without interruption in the event of specific materials shortages.
Certain key materials and proprietary equipment used in the manufacturing of products are currently sole-sourced or available only from a limited number of suppliers. To minimize this risk, Corning closely monitors raw materials and equipment with limited availability or sole-sourced suppliers. However, any future difficulty in obtaining sufficient and timely delivery of components and/or raw materials could result in lost sales due to delays or reductions in product shipments, or reductions in Corning’s gross margins.
Patents and Trademarks
Inventions by members of Corning’s research and engineering staff continue to be important to the Company’s growth. Patents have been granted on many of these inventions in the United States and other countries. Some of these patents have been licensed to other manufacturers. Many of our earlier patents have now expired, but Corning continues to seek and obtain patents protecting its innovations. In 2020, Corning was granted about 480 patents in the United States (“U.S.”) and over 1,600 patents in countries outside the U.S.
Each business segment possesses a patent portfolio that provides certain competitive advantages in protecting Corning’s innovations. Corning has historically enforced, and will continue to enforce, its intellectual property rights. At the end of 2020, Corning and its wholly-owned subsidiaries owned about 11,500 unexpired patents in various countries of which about 4,400 were U.S. patents. Between 2021 and 2023, approximately 700, or about 6%, of these worldwide patents will expire, while at the same time Corning intends to seek patents protecting its newer innovations. Worldwide, Corning has about 8,700 patent applications in process, with about 1,950 in process in the U.S. Corning believes that its patent portfolio will continue to provide a competitive advantage in protecting the Company’s innovation, although Corning’s competitors in each of its businesses are actively seeking patent protection as well.
While each of our reportable segments has numerous patents in various countries, no one patent is considered material to any of these segments. Important U.S.-issued patents in our reportable segments include the following:
Display Technologies: patents relating to glass compositions and methods for the use and manufacture of glass substrates for display applications.
Optical Communications: patents relating to (i) multimode and single mode optical fiber products including low-loss optical fiber, large effective area optical fiber, and other high data rate optical fiber, and processes and equipment for manufacturing optical fiber, including methods for making optical fiber preforms and methods for drawing, cooling and winding optical fiber; (ii) optical fiber ribbons and methods for making such ribbon, indoor and outdoor fiber optic cable products and methods for making and installing optical fiber cable; (iii) optical fiber connectors and factory-terminated assemblies, hardware, termination and storage and associated methods of manufacture; and (iv) optical fiber and hybrid fiber-coax wireless communication systems.
Environmental Technologies: patents relating to cellular ceramic honeycomb products, together with ceramic batch and binder system compositions, honeycomb extrusion and firing processes, and honeycomb extrusion dies and equipment for the high-volume, low-cost manufacture of such products.
Specialty Materials: patents relating to protective cover glass materials and coatings, ophthalmic glasses and polarizing dyes, and semiconductor/microlithography optics and blanks, metrology instrumentation and laser/precision optics, glass polarizers, specialty fiber, and refractories.
Life Sciences: patents relating to methods and apparatus for the manufacture and use of scientific laboratory equipment including multiwell plates and cell culture products, as well as equipment and processes for cell and gene therapy research.
“All Other”: patents relating to development projects, new product lines, and other businesses or investments that do not meet the threshold for separate reporting.
Approximate number of patents granted to our reportable segments are as follows:
| | | | | | |
| | | | | | |
| |
Number of
patents
worldwide
| | U.S. patents | | Important
patents expiring
between 2021
and 2023 |
Display Technologies | | 1,075 | | 152 | | 10 |
Optical Communications | | 4,522 | | 2,169 | | 34 |
Environmental Technologies | | 1,013 | | 363 | | 7 |
Specialty Materials | | 1,943 | | 673 | | 5 |
Life Sciences | | 594 | | 190 | | 5 |
Many of the Company’s patents are used in operations or are licensed for use by others, and Corning is licensed to use patents owned by others. Corning has entered into cross-licensing arrangements with some major competitors, but the scope of such licenses has been limited to specific product areas or technologies.
Corning’s principle trademarks include the following: Axygen, Celcor, ClearCurve, Corning, DuraTrap, Eagle XG, Edge8, Falcon, Gorilla, Guardiant, HPFS, Leaf, PYREX, RocketRibbon, SMF-28e, Steuben, UniCam, Valor and Victus.
Protection of the Environment
Corning has an extensive program to ensure that its facilities comply with state, federal and foreign pollution-control regulations. This program has resulted in capital and operating expenditures each year. To maintain compliance with such regulations, capital expenditures for pollution control in operations were approximately $12.2 million in 2020 and are estimated to be $16.8 million in 2021.
Corning’s 2020 consolidated operating results were charged with approximately $51 million for depreciation, maintenance, waste disposal and other operating expenses associated with pollution control.
Human Capital Management Overview
At Corning, we are proud of the life-changing innovations we bring to the world. Our unparalleled expertise in our core technologies along with deep manufacturing and engineering capabilities require a talent strategy focused on attracting and retaining exceptional people, fostering a culture that enables innovation and collaboration and supporting long and successful careers.
Each of our 50,110 full- and part-time employees in 45 countries make an important contribution, whether in one of our manufacturing or processing facilities, research labs, offices or other facilities.
Values
Corning is guided by an enduring set of Values that defines our relationship with employees, customers, and our communities: Quality, Integrity, Performance, Leadership, Innovation, Independence and the Individual. Our Values are the key to our business success, a source of pride and excitement for our employees, and the factor that ultimately sets us apart from our competitors. In short, we believe that how we do things is as important as what we do. We measure how we live our Values through the annual Corporate Values Survey. We use the results to see what actions can be taken to improve living the Values. Corning employees all contribute to the success of the company by Living our Values-all seven, all the time, all around the world.
Diversity and Inclusion
We are focused on creating an inclusive and creative environment globally
Our workforce is comprised of 61% men and 39% women, and we have active programs, such as our UP2 (women mentoring women) initiative fostering and supporting women in their careers at Corning. In 2020, we have achieved or maintained 100% pay equity for men and women in our seven largest countries by employee population, comprising approximately 95% of our global workforce. Our 2021 pay equity review is expanding to include our entire salaried workforce across all of the countries where we operate.
We furthered our commitment to diversity and inclusion in 2020 by creating the Office of Racial Equality and Social Unity, to further our goal of a more equitable and inclusive culture at Corning and beyond. The efforts of this office will not only impact policies, practices, communications, and our corporate culture, but are intended to improve diversity and inclusion projects in the communities in which our employees live and work; and
Corning proudly sponsors over thirty different Employee Resource Groups representing vital employee constituencies, including women, African Americans, those with disabilities, the LGBTQ community, Asians, Latinos, Native Americans, and veterans, among others.
Talent Management
Each year we formally evaluate the talent implications of our strategic business plans and align our actions and objectives accordingly. As businesses grow organically or through acquisition, we create talent strategy plans to ensure we have the right people with the right skills in place to deliver that growth.
Corning strives to attract and recruit diverse qualified candidates to maintain our culture of innovation and to foster creativity. We have created a strategic talent pipeline through internships, co-ops, rotational leadership programs, and partnerships with various universities. In addition, we collaborate with organizations such as the Society of Women Engineers, The Association of Latino Professionals for America, National Society of Black Engineers, National Association of Black Accountants, Out for Undergrad, and military veterans’ groups to introduce us to qualified diverse candidates.
Businesses conduct climate surveys at least every two years, and ad hoc pulse surveys as needed, to measure engagement, satisfaction and alignment with our Values. It is important to Corning that employees develop, grow and are inspired to continue their careers at the Company over the long-term. We offer rich simulations, assessments, and experiences that are digital, classroom, and a blend of both, targeted to all levels in the organization. We provide on-the-job learning experience, mentoring, and career planning to ensure immediate application and lasting impact. Our salaried talent retention rate of 96%, for 2020, is consistently higher than the markets in which we compete for talent, aligning with our strategy of encouraging and supporting longer-term careers with Corning.
At Corning, the health and safety of our workforce is always of paramount consideration. To achieve this our three organizational expectations are a systematic approach, engaged leadership and an independent culture. Our safety standards always meet, and often exceed, local regulatory standards. We promote employee wellbeing through wellness programs which vary by region such as nutrition, mental health, and fitness related offerings, smoking cessation programs, and smoke free campuses.
Executive Officers of the Registrant
John P. Bayne, Jr. Senior Vice President & General manager, Mobile Consumer Electronics
Mr. Bayne joined Corning in 1995 as the Fallbrook plant controller, and in 1997 became an international business controller in the Optical Fiber division. From 1999 to 2003 he held a variety of management positions in Photonic Technologies. In 2003 he joined Display Technologies and in 2006, he was named president, Display Technologies, China. In 2009 he became director of strategy, Display Technologies. Beginning in 2012 he was vice president and general manager for High Performance Displays and in 2014 he assumed responsibility for the Advanced Glass Innovations group. In 2015 he was named vice president and general manager of the Gorilla Glass business. He was appointed senior vice president and general manager of Mobile Consumer Electronics in April 2020. Age 54.
Stefan Becker Senior Vice President & Operations Controller
Mr. Becker joined Corning in 2000 through Corning’s acquisition of Siemens Communication Cable Division. From 2001, he held positions as manager, Planning and Analysis and later director of Finance, Corning Cable Systems. He joined the Display Technologies division in 2005 as U.S. Controller. In 2007 he was appointed CFO, Corning Display Technologies Taiwan. In 2009 he was named director of Finance, Corning Display Technologies (“CDT”) and in 2010 was appointed division controller, CDT. Between 2012 and 2015, he served as international division vice president, Finance, Corning Glass Technologies. He was appointed as Corning’s Operations Controller in 2015 and senior vice president in 2019. Age 49.
Michael A. Bell Senior Vice President & General Manager, Optical Communications
Mr. Bell joined Corning in 1991 as a process engineer for the Telecommunications Cable Plant in Hickory, North Carolina. He has held a variety of positions in manufacturing and engineering. He was appointed to CCS Americas Cable Manufacturing Manager in 2004, which expanded to include hardware manufacturing in 2009. In 2012 he was appointed senior vice president and general manager, Optical Connectivity Solutions for Corning Optical Communications. He was appointed senior vice president and general manager, Optical Communications in April 2020. Age 56
James P. Clappin Second Vice Chairman and Strategic Advisor
Mr. Clappin joined Corning in 1980 as a process engineer. He transitioned to GTE Corporation in 1983 and returned to Corning in 1988. He held a variety of manufacturing management roles in the consumer products division, transferring to the display business in 1994. He was appointed as general manager of CDT in 2002, and was president of CDT from 2005 through 2010. He was appointed president, Corning Precision Glass Technologies, in 2010 and president Corning Glass Technologies in 2012. In 2017 he became executive vice president of Corning Glass Technologies. He was appointed as second vice chairman and strategic advisor in April 2020. Age 63.
Martin J. Curran Executive Vice President and Innovation Officer
Mr. Curran joined Corning in 1984 and has held a variety of roles in finance, manufacturing, and marketing. He has served as senior vice president, general manager for Corning Cable Systems Hardware and Equipment Operations in the Americas, responsible for operations in Hickory, North Carolina; Keller, Texas; Reynosa, Mexico; Shanghai, China; and the Dominican Republic. In 2007, he was appointed as senior vice president and general manager of Corning Optical Fiber. Mr. Curran was appointed as executive vice president and innovation officer in August 2012. Age 62.
Jeffrey W. Evenson Executive Vice President and Chief Strategy Officer
Dr. Evenson joined Corning in 2011 as senior vice president and operations chief of staff. In 2015, he was named chief strategy officer. He was appointed executive vice president in 2018. He oversees corporate strategy, corporate communications, and advanced analytics. Prior to joining Corning, Dr. Evenson was a senior vice president with Sanford C. Bernstein, where he served as a senior analyst. Before that, Dr. Evenson was a partner at McKinsey & Company, where he led technology and market assessment for early-stage technologies. Age 55.
Li Fang President & General Manager, Corning Greater China
Mr. Fang joined Corning International in 1997 as business development manager, China. In 1999 he transferred to the Environmental Products Division and became production manager of CET’s China Plant - Corning (Shanghai) Company Ltd. In July 2004, he was appointed operations manager and in October 2004 he was appointed director of operations and plant manager of Corning (Shanghai) Company Ltd. In 2007, he was appointed vice president, Corning Display Technologies China, and director of commercial operations, government affairs and supply chain. In 2009 he was named president, Corning Display Technologies China. He was appointed president and general manager of Corning Greater China in 2012. Age 58.
Robert P. France Senior Vice President, Human Resources
Mr. France joined Corning in 2000 as a commercial Human Resources manager for Optical Fiber. He moved to Display Technologies in 2004 as the division Human Resources manager. He was Human Resources director for Corning Glass Technologies and Asia from 2004 to 2016. From 2016 to 2018, Mr. France was Human Resources senior vice president for Corning Optical Communications, responsible for leading all aspects of the Human Resources function across several businesses and had HR Generalist responsibility for the Corning China organization. In 2018 he was appointed as vice president, Human Resources and was appointed senior vice president, Human Resources in 2019. Age 55.
Clark S. Kinlin Executive Vice President
Mr. Kinlin joined Corning in 1981 in the Specialty Materials division. From 1985 to 1995 he worked in the Optical Fiber division. In 1995, he joined Corning Consumer Products. In 2000, Mr. Kinlin was named president, Corning International Corporation and, in 2003, he was appointed as general manager for Greater China. From April 2007 to March 2008, he was chief operating officer, Corning Cable Systems, (now Corning Optical Communications) with responsibility for global sales, marketing, and operations. He was named president and chief executive officer of Corning Cable Systems in April 2008. He was appointed executive vice president in 2012. Age 61.
Lawrence D. McRae First Vice Chairman and Corporate Development Officer
Mr. McRae joined Corning in 1985 and has held a broad range of leadership positions in various finance, sales, marketing, and general management across Corning’s businesses. In 1995 he was appointed vice president of Corning Consumer Products Company and president of Revere Ware Corporation. He then moved to Telecommunications Products, where he served as vice president, Global Development, from 1996 to 2000. He was appointed vice president Corporate Development in 2000 and progressed through a series of senior leadership positions. He has led strategy and corporate development since 2010. He was named vice chairman in 2015 and first vice chairman and corporate development officer in April 2020. Age 62.
David L. Morse Executive Vice President and Chief Technology Officer
Dr. Morse joined Corning in 1976 as a composition scientist in glass research. In 1985, he was named senior research associate, manager of consumer products development in 1987 and director of materials research in 1990. He served in a variety of technology leadership positions in organic materials and telecommunications before joining Corporate Research in 2001. From 2006 to 2012, he served as senior vice president and director, Corporate Research. Dr. Morse was appointed to his current position in 2012. Age 68.
Anne Mullins Senior Vice President & Chief Digital & Information Officer
Ms. Mullins joined Corning as senior vice president & chief digital & information officer in August 2019. In this role, she is responsible for leading the strategic direction of Corning’s global information technology function and evolving the company’s digital footprint. Prior to joining Corning, Ms. Mullins served as chief information officer for Lockheed Martin and previously served as Lockheed Martin’s chief information security officer. Age 58.
Eric S. Musser President & Chief Operating Officer
Mr. Musser joined Corning in 1986 and served in a variety of manufacturing and general management roles in Corning’s Optical Communications businesses. In 2005, he was named vice president and general manager of Optical Fiber. Mr. Musser served as general manager, Corning Greater China from 2007 to 2012 and president of Corning International from 2012 to 2014. In 2014, he was appointed executive vice president, Corning Technologies and International. In April 2020, he was appointed as president & chief operating officer. Age 61.
Avery H. Nelson III Senior Vice President & General Manager, Automotive
Mr. Nelson joined Corning in 1991 as shift supervisor at the Harrodsburg, Kentucky plant and subsequently served in progressive roles in Corning Display Technologies. In 2007, he joined CET as general manager, Corning (Shanghai) Company Limited. In 2009, he became general manager and regional director of China and India, CET. In 2010 he returned to the U.S. as program director, CET. In 2011, he assumed the role of business director, AAA Corning® Gorilla® Glass, New Business Development. Later that year, he was appointed division vice president, Heavy Duty Diesel (HDD). In 2013, he was appointed division vice president and business director. In 2014, he was appointed vice president and general manager for Environmental Technologies. He was appointed to his current position in April 2020. Age 52.
Edward A. Schlesinger Senior Vice President and Corporate Controller
Mr. Schlesinger joined Corning in 2013 as senior vice president and chief financial officer of Corning Optical Communications. He was elected vice president and corporate controller in September 2015 and principal accounting officer in December 2015. He was named senior vice president in February 2019. Prior to joining Corning, Mr. Schlesinger served as Vice President, Finance and Sector Chief Financial Officer for the Climate Solutions Sector for Ingersoll Rand. Mr. Schlesinger has a financial career that spans more than 20 years garnering extensive expertise in accounting, technical financial management and reporting. Age 53.
Lewis A. Steverson Executive Vice President and Chief Legal & Administrative Officer
Mr. Steverson joined Corning in 2013 as senior vice president and general counsel. In 2018 he was named executive vice president and general counsel. Prior to joining Corning, Mr. Steverson served as senior vice president, general counsel, and corporate secretary of Motorola Solutions, Inc. During his 18 years with Motorola, he held a variety of law leadership roles across the company’s numerous business units. Prior to Motorola, Mr. Steverson was in private practice at the law firm of Arnold & Porter. He was appointed Executive Vice President and Chief Legal & Administrative Officer in April 2020. Age 57.
R. Tony Tripeny Executive Vice President and Chief Financial Officer
Mr. Tripeny joined Corning Cable Systems in 1985 as the corporate accounting manager and became the Keller, Texas facility’s plant controller in 1989. In 1993, he was appointed equipment division controller and, in 1996, corporate controller. Mr. Tripeny was appointed chief financial officer of Corning Cable Systems in July 2000 and, in 2003, he took on the additional role of group controller, Telecommunications. He was appointed division vice president, Operations Controller in August 2004, vice president, corporate controller in October 2005, and senior vice president and principal accounting officer in April 2009. Mr. Tripeny was then appointed as Corning’s senior vice president and chief financial officer in September 2015. He was appointed executive vice president in 2018. Age 61.
Ronald L. Verkleeren Senior Vice President & General Manager, Life Sciences
Mr. Verkleeren joined Corning in 2001 in the Optical Communications segment. He joined the Life Sciences segment in 2004 and has held a variety of progressive roles in that segment. In 2010, he was named division vice president and director of Advanced Life Sciences. In 2012 he was named division vice president and program director for Corning Pharmaceutical Technologies. In 2015, he became vice president and general manager of the Pharmaceutical Technologies division. He was elected as senior vice president & general manager, Life Sciences in April 2020. Age 50.
Wendell P. Weeks Chairman and Chief Executive Officer
Mr. Weeks joined Corning in 1983 in the finance group. He has held a variety of financial, business development, commercial, and general management roles. He was named vice president and general manager of the Optical Fiber business in 1996 and president of Corning’s Optical Communications division in 2001. He became Corning’s president and chief operation officer in April 2002. Mr. Weeks has been a member of Corning’s Board of Directors since December 2000. He was named chief executive officer in April 2005 and chairman of the board in April 2007. Mr. Weeks is a director of Amazon.com, Inc. Age 61.
John Z. Zhang Senior Vice President & General Manager, Display
Mr. Zhang joined Corning in 2008 as director, corporate development. In 2009, he was appointed director, corporate development Asia Pacific. In 2010, he further expanded his role to lead the strategy & corporate development organization of Corning International. In 2014, he was named deputy general manager, Corning Display Technologies. In 2015, he was elected as senior vice president and general manager, Corning Display Technologies. Age 48.
Document Availability
A copy of Corning’s 2020 Annual Report on Form 10-K filed with the Securities and Exchange Commission is available upon written request to Corporate Secretary, Corning Incorporated, One Riverfront Plaza, Corning, NY 14831. The Annual Report on Form 10-K, quarterly reports on Form 10-Q, current reports on Form 8-K, and amendments pursuant to Section 13(a) or 15(d) of the Exchange Act of 1934 and other filings are available as soon as reasonably practicable after such material is electronically filed or furnished to the SEC, and can be accessed electronically free of charge at www.SEC.gov, or through the Investor Relations page on Corning’s website at www.corning.com. The information contained on the Company’s website is not included in, or incorporated by reference into, this Annual Report on Form 10-K.
Other
Additional information in response to Item 1 is found in Note 20 (Reportable Segments) to the consolidated financial statements.
Item 1A. Risk Factors
We operate in rapidly changing economic, political, and technological environments that present numerous risks. Our operations and financial results are subject to risks and uncertainties, including those described below, that could adversely affect our business, financial condition, results of operations, cash flows, our ability to successfully execute our Strategy & Growth Framework and the trading price of our common stock or debt. The following discussion identifies the most significant factors that may adversely affect our business, operations, financial position or future financial performance. This information should be read in conjunction with our MD&A and the consolidated financial statements and related notes incorporated by reference into this report. The following discussion of risks is not all inclusive but is designed to highlight what we believe are important factors to consider, as these factors could cause our future results to differ from those in our forward-looking statements and from historical trends.
Risks Related to Our Business
The ongoing COVID-19 pandemic has, and may continue to, adversely impact the global economy and disrupt our operations and supply chains, which may have an adverse effect on our results of operations.
COVID-19 has impacted and may further impact the global economy and could have additional impacts on economic growth, the proper functioning of financial and capital markets, foreign currency exchange rates, and interest rates. The pandemic has resulted in authorities around the world implementing numerous unprecedented measures such as travel restrictions, quarantines, shelter in place orders, and facility shutdowns. These measures have impacted, and may continue to impact our workforce and operations, and those of our customers, contract manufacturers and suppliers, particularly in the event of a significant global resurgence of the illness. There is considerable uncertainty regarding the duration, scope and severity of the pandemic and the impacts on our business and the global economy from the effects of the ongoing pandemic and response measures.
Corning’s Display Technologies segment generates a significant amount of the Company’s profits and cash flow. Any significant decrease in display glass pricing or market share could have a material and negative impact on our financial results
Corning’s ability to generate profits and operating cash flow depends largely on the profitability of our display glass business, which is subject to continuous pricing pressure due to industry competition, potential over-capacity, and development of new technologies. If we are not able to achieve proportionate reductions in costs and increases in volume to offset ongoing pricing pressure it could have a material adverse impact on our financial results.
Because we have a concentrated customer base in each of our businesses, our sales could be negatively impacted by the actions or insolvency of one or more key customers, as well as our ability to retain these customers
A relatively small number of end customers accounted for a high percentage of net sales in each of our reportable segments. This concentration subjects us to a variety of risks including:
Lower sales and cash flow that could result from the loss of one or more of our key customers;
Mergers and consolidations between customers could result in further concentration of Corning’s customer base;
The loss or insolvency of a key customer, could result in a substantial loss of sales and reduction in anticipated cash flows; and
Customers may possess substantial leverage in negotiating contractual obligations, including liability provisions.
The following table details the number of combined customers of our segments that accounted for a large percentage of segment net sales:
| | | | |
| | | | |
| | Number of
combined
end customers | | % of total
segment net
sales in 2020 |
Display Technologies | | 4 | | 74% |
Optical Communications | | 1 | | 11% |
Specialty Materials | | 3 | | 65% |
Environmental Technologies | | 3 | | 74% |
Life Sciences | | 2 | | 39% |
Events outside of Corning’s control, could cause a disruption to our manufacturing operations and adversely impact our customers, resulting in a negative impact to Corning’s net sales, net income, asset values and liquidity
Disruption to our manufacturing operations could significantly impact Corning’s ability to supply its customers and could produce a near-term severe impact on our individual businesses and the Company as a whole. Given the geographical concentration of certain of our plants, the highly engineered nature of our facilities and the globally dispersed talent required to run these facilities, any event that adversely affects or restricts movement into or out of a specific geographic area where we, our suppliers, or our customers have a presence, could adversely impact our results. Due to the specialized nature of the assets and certain single-site manufacturing locations, in the event such a location experiences disruption, it may not be possible to find replacement capacity or substitute production from other facilities.
We may experience difficulties in enforcing our intellectual property rights, which could result in loss of market share, and we may be subject to claims of infringement of the intellectual property rights of others
We rely on patent and trade secret laws, copyright, trademark, confidentiality procedures, controls and contractual commitments to protect our intellectual property rights. Despite our efforts, these protections may be limited and we may encounter difficulties in protecting our intellectual property rights or obtaining rights to additional intellectual property necessary to permit us to continue or expand our businesses. We cannot provide assurance that the patents that we hold or may obtain will provide meaningful protection against our competitors. Changes in or enforcement of laws concerning intellectual property may affect our ability to prevent or address the misappropriation of, or the unauthorized use of, our intellectual property, potentially resulting in loss of market share. Litigation may be necessary to enforce our intellectual property rights. Litigation is inherently uncertain and outcomes are unpredictable. If we cannot protect our intellectual property rights against unauthorized copying or use, or other misappropriation, we may not remain competitive.
The intellectual property rights of others could inhibit our ability to introduce new products. Other companies hold patents on technologies used in our industries and are aggressively seeking to expand, enforce and license their patent portfolios. We periodically receive notices from, or have lawsuits filed against us by third parties claiming infringement, misappropriation or other misuse of their intellectual property rights and/or breach of our agreements with them. These third parties often include entities that do not have the capabilities to design, manufacture, or distribute products or that acquire intellectual property like patents for the sole purpose of monetizing their acquired intellectual property through asserting claims of infringement and misuse. Such claims of infringement or misappropriation may result in loss of revenue, substantial costs, or lead to monetary damages or injunctive relief against us.
Information technology dependency and cyber security vulnerabilities could lead to reduced revenue, liability claims, or competitive harm
The Company is dependent on information technology systems and infrastructure, including cloud-based services (“IT systems”) to conduct its business. Our IT systems may be vulnerable to disruptions from human error, outdated applications, computer viruses, natural disasters, unauthorized access, cyber-attack and other similar disruptions. We have measures and defenses in place against such events, but we may not be able to prevent, immediately detect, or remediate all instances of such events. Any significant disruption, breakdown, intrusion, interruption or corruption of these systems or data breaches could cause the loss of data or intellectual property, equipment damage, downtime, and/or safety related issues and could have a material adverse effect on our business. A material security breach or disruption of our IT systems could result in theft, unauthorized use, or publication of our intellectual property and/or confidential business information, harm our competitive position, disrupt our manufacturing, reduce the value of our investment in research and development and other strategic initiatives, impair our ability to access vendors, suppliers and cloud-based services, or otherwise adversely affect our business.
Additionally, we believe that utilities and other operators of critical infrastructure that serve our facilities face heightened security risks, including cyber-attack. In the event of such an attack, disruption in service from our utility providers could disrupt our manufacturing operations which rely on a continuous source of power (electrical, gas, etc.).
We may not earn a positive return from our research, development and engineering investments
Developing our products through our innovation model of research and development is expensive and often involves a long investment cycle. We make significant expenditures and investments in research, development and engineering that may not earn an economic return. If our investments do not provide a pipeline of products or technologies that our customers demand or lower our manufacturing costs, it could negatively impact our revenue and operating margins both near- and long-term.
If we are unable to obtain certain specialized equipment, raw and batch materials or natural resources required in our products or processes, our business will suffer
Our ability to meet customer demand depends, in part, on our ability to obtain timely and adequate delivery of equipment, parts, components and raw materials from our suppliers. We may experience shortages that could adversely affect our operations. Certain manufacturing equipment, components and raw materials are available only from single or limited sources, and we may not be able to find alternate sources in a timely manner. A reduction, interruption or delay of supply, or a significant increase in the price for supplies, such as manufacturing equipment, precious metals, raw materials, utilities including energy and industrial water, could have a material adverse effect on our businesses.
We use specialized raw materials from single-source suppliers (e.g., specific mines or quarries) and natural resources (e.g., helium) in certain products and processes. If a supplier is unable to provide the required raw materials or the natural resource is in scarce supply or not readily available, we may be unable to change our product composition or manufacturing process to prevent disruption to our business.
Our innovation model depends on our ability to attract and retain specialized experts in our core technologies
Our innovation model requires us to employ highly specialized experts in glass science, ceramic science, and optical physics to conduct our research and development and engineer our products and design our manufacturing facilities. The loss of the services of any member of our key research and development or engineering team without adequate replacement, or the inability to attract new qualified personnel, could have a material adverse effect on our operations and financial performance.
We are subject to strict environmental regulations and regulatory changes that could result in fines or restrictions that interrupt our operations
Some of our manufacturing processes generate chemical waste, waste water, other industrial waste or greenhouse gases, and we are subject to numerous laws and regulations relating to the use, storage, discharge and disposal of such substances. We have installed anti-pollution equipment for the treatment of chemical waste and waste water at our facilities. We have taken steps to control the amount of greenhouse gases created by our manufacturing operations. However, we cannot provide assurance that environmental claims will not be brought against us or that government regulators will not take steps to adopt more stringent environmental standards.
Any failure on our part to comply with any present or future environmental regulations could result in the assessment of damages or imposition of fines against us, or the suspension/cessation of production or operations. In addition, environmental regulations could require us to acquire costly equipment, incur other significant compliance expenses or limit or restrict production or operations and thus materially and negatively affect our financial condition and results of operations.
Changes in regulations and the regulatory environment in the U.S. and other countries, such as those resulting from the regulation and impact of global warming and CO2 abatement, may affect our businesses and their results in adverse ways by, among other things, substantially increasing manufacturing costs, limiting availability of scarce resources, especially energy, or requiring limitations on production and sale of our products or those of our customers.
General Risk Factors
We may have additional tax liabilities
We are subject to income taxes in the U.S. and many foreign jurisdictions, and are commonly audited by various tax authorities. There are many transactions and calculations where the ultimate tax treatment is uncertain. Judgment is required in determining our worldwide provision for income taxes. Although we believe our tax estimates are reasonable, the final determination of tax audits and any related litigation could be materially different from our historical income tax provisions and accruals. The results of an audit or litigation could have a material effect on our financial statements in the period or periods for which that determination is made.
The 2017 Tax Act significantly impacted how U.S. global corporations are taxed. Significant guidance has been issued with the intention of clarifying the new tax provisions. To date, some of the regulations had been finalized and clarified but a considerable amount of this guidance is still in the form of proposed regulations. Due to the volume and complexity of both the final and proposed regulations, we continue to evaluate any development and impact of the 2017 Tax Act that could have a material adverse impact on our tax expense and cash flow. In addition to the 2017 Tax Act, other foreign countries and international organizations, such as Organisation for Economic Co-operation and Development (“OECD”), may have law changes and issue new international tax standards that may also impact our taxes.
As a global company, we face many risks which could adversely impact our operations and financial results
We are a global company and derive a substantial portion of our revenue from, and have significant operations, outside of the United States. Our international operations include manufacturing, assembly, sales, research and development, customer support, and shared administrative service centers. Additionally, we rely on a global supply chain for key components and capabilities that are central to our ability to invent, make and sell products.
Compliance with laws and regulations increases our costs. We are subject to both U.S. laws and the local laws where we operate which, among other things, include data privacy requirements, employment and labor laws, tax laws, anti-competition regulations, prohibitions on payments to governmental officials, import and trade restrictions and export requirements. Non-compliance or violations could result in fines, criminal sanctions against us, our officers or employees, and prohibitions on the conduct of our business. Such violations could result in prohibitions on our ability to offer our products and services in one or more countries and could also materially damage our reputation, our brand, our international expansion efforts, our ability to attract and retain employees, our business and operating results. Our success depends, in part, on our ability to anticipate and manage these risks.
We are also subject to a variety of other risks in managing a global organization, including those related to:
The economic and political conditions in each country or region and among countries;
Complex regulatory requirements affecting international trade and investment, including anti-dumping laws, export controls, the Foreign Corrupt Practices Act and local laws prohibiting improper payments. Our operations may be adversely affected by changes in the substance or enforcement of these regulatory requirements, and by actual or alleged violations of them;
Fluctuations in currency exchange rates, convertibility of currencies and restrictions involving the movement of funds between jurisdictions and countries;
Governmental protectionist policies and sovereign and political risks that may adversely affect Corning’s profitability and assets;
Tariffs, trade duties and other trade barriers including anti-dumping duties;
Geographical concentration of our factories and operations, and regional shifts in our customer base;
Periodic health epidemic concerns;
Political unrest, confiscation or expropriation of assets by foreign governments, terrorism and the potential for other hostilities;
Difficulty in protecting intellectual property, sensitive commercial and operations data, and information technology systems;
Differing legal systems, including protection and treatment of intellectual property and patents;
Complex, changing or competing tax regimes;
Difficulty in collecting obligations owed to us;
Natural disasters such as floods, earthquakes, tsunamis and windstorms; and
Potential loss of utilities or other disruption affecting manufacturing.
We have significant exposure to foreign currency movements
A large portion of our sales, profit and cash flows are transacted in non-U.S. dollar currencies. The Company expects to continue to experience fluctuations in the U.S. dollar value of these activities if it is not possible, cost-effective or should we not elect to hedge certain currency exposure. Additionally, gains or losses may be experienced if the underlying exposure which has been hedged increases or decreases significantly.
The ultimate realized loss or gain with respect to currency fluctuations will generally depend on the size and type of cross-currency exposure that we have, the changes in exchange rates associated with those exposures, whether we have entered into foreign currency contracts to offset these exposures and other factors.
Foreign currency movements may impact our competitive cost position relative to our largest, Japan-based competitors in the Display Technologies segment. The profitability of customers may also be impacted as they typically purchase from us in Japanese yen and sell in various currencies.
These factors, which are variable and generally outside of our control, could materially impact our results of operations, anticipated future results, financial position and cash flows.
We may have significant exposure to counterparties of our related derivatives portfolio
We maintain a significant portfolio of over the counter derivatives to hedge our projected currency and periodically may utilize interest rate derivatives, equity derivatives, and commodities. We are exposed to potential losses in the event of non-performance by our counterparties to these derivative contracts. Any failure of a counterparty to pay on such a contract when due could materially impact our results of operations, financial position, and cash flows.
Current or future litigation or regulatory investigations may harm our financial condition or results of operations
As a global technology and manufacturing company, we are engaged in various litigation and regulatory matters. Litigation and regulatory proceedings may be uncertain, and adverse rulings could occur, resulting in significant liabilities, penalties or damages. Any such substantial legal liability or regulatory action could have a material adverse effect on our business, financial condition, cash flows and reputation.
Our global operations are subject to extensive trade and anti-corruption laws and regulations
Due to the international scope of our operations, we are subject to a complex system of import- and export-related laws and regulations, including U.S. regulations issued by Customs and Border Protection, the Bureau of Industry and Security, the Office of Anti-boycott Compliance, the Directorate of Defense Trade Controls and the Office of Foreign Assets Control, as well as the counterparts of these agencies in other countries. Any alleged or actual violation by an employee or the Company may subject us to government scrutiny, investigation and civil and criminal penalties, and may limit our ability to import or export our products or to provide services outside the United States. We cannot predict the nature, scope or effect of future regulatory requirements to which our operations might be subject or the way existing laws might be administered or interpreted.
In addition, the U.S. Foreign Corrupt Practices Act and similar foreign anti-corruption laws generally prohibit companies and their intermediaries from making improper payments or providing anything of value to improperly influence foreign government officials to obtain or retain business, or obtaining an unfair advantage. Recent years have seen a substantial increase in the global enforcement of anti-corruption laws. Our continued operation and expansion outside the United States, including in developing countries, could increase the risk of alleged violations. Violations of these laws may result in severe criminal or civil sanctions, could disrupt our business, and result in an adverse effect on our reputation, business and results of operations or financial condition.
Moreover, several of our key customers are domiciled in areas of the world with laws, rules and business practices that may notably differ from those in the United States, and we face the reputational and legal risk that our related partners may violate applicable laws, rules and business practices.
International trade policies may negatively impact our ability to sell and manufacture our products outside of the U.S.
Government policies on international trade and investment such as import quotas, tariffs, and capital controls, whether adopted by individual governments or addressed by regional trade blocs, can affect the demand for our products and services, impact the competitive position of our products or prevent us, our equity affiliates or joint ventures, from being able to sell and manufacture products in certain countries. The implementation of more restrictive trade policies, such as higher tariffs or new barriers to entry, in countries in which we sell large quantities of products and services could negatively impact our business, results of operations and financial condition. For example, a government’s adoption of “buy national” policies or retaliation by another government against such policies could have a negative impact on our results of operations.
Item 1B. Unresolved Staff Comments
None.
Item 2. Properties
Corning operates 122 manufacturing plants and processing facilities in 15 countries, of which approximately 32% are in the U.S. We own approximately 60% of our executive and corporate buildings, with 95% located in and around Corning, New York. The Company also owns approximately 69% of our sales and administrative office square footage, 83% of our research and development square footage, 66% of our manufacturing square footage, and 8% of our warehousing square footage.
For the years ended 2020 and 2019, we invested a total of $3.4 billion, primarily in facilities outside of the United States.
Manufacturing, sales and administrative, and research and development facilities have an aggregate floor space of approximately 64.9 million square feet. Distribution of this total area is as follows:
| | | | | | |
| | | | | | |
(million square feet) | | Total | | Domestic | | Foreign |
Manufacturing | | 56.5 | | 21.0 | | 35.5 |
Sales and administrative | | 2.6 | | 2.0 | | 0.6 |
Research and development | | 2.4 | | 2.0 | | 0.4 |
Warehouse | | 3.4 | | 3.0 | | 0.4 |
Total | | 64.9 | | 28.0 | | 36.9 |
Total assets and capital expenditures by operating segment are included in Note 20 (Reportable Segments) to the consolidated financial statements. Information concerning lease commitments is included in Note 7 (Leases) and Note 14 (Commitments, Contingencies and Guarantees) to the consolidated financial statements.
Item 3. Legal Proceedings
Corning is a defendant in various lawsuits and is subject to various claims that arise in the normal course of business, the most significant of which are summarized in Note 14 (Commitments, Contingencies and Guarantees) to the consolidated financial statements. In the opinion of management, the likelihood that the ultimate disposition of these matters will have a material adverse effect on Corning’s consolidated financial position, liquidity, or results of operations, is remote.
Environmental Litigation
Corning has been named by the Environmental Protection Agency (the Agency) under the Superfund Act, or by state governments under similar state laws, as a potentially responsible party for 15 active hazardous waste sites. Under the Superfund Act, all parties who may have contributed any waste to a hazardous waste site, identified by the Agency, are jointly and severally liable for the cost of cleanup unless the Agency agrees otherwise. It is Corning’s policy to accrue for its estimated liability related to Superfund sites and other environmental liabilities related to property owned by Corning based on expert analysis and continual monitoring by both internal and external consultants. At December 31, 2020 and 2019, Corning had accrued approximately $68 million (undiscounted) and $41 million (undiscounted), respectively, for the estimated liability for environmental cleanup and related litigation. Based upon the information developed to date, management believes that the accrued reserve is a reasonable estimate of the Company’s liability and that the risk of an additional loss in an amount materially higher than that accrued is remote.
Item 4. Mine Safety Disclosure
None.
PART II
Item 5. Market for Registrant’s Common Equity, Related Stockholder Matters and Issuer Purchases of Equity Securities
(a)Corning Incorporated common stock is listed on the New York Stock Exchange. In addition, it is traded on the Boston, Midwest and Philadelphia stock exchanges. Common stock options are traded on the Chicago Board Options Exchange. The ticker symbol for Corning Incorporated is “GLW”.
As of December 31, 2020, there were approximately 12,090 registered holders of common stock and approximately 515,000 beneficial shareholders.
Performance Graph
The following graph illustrates the cumulative total shareholder return over the last five years of Corning's common stock, the S&P 500 and the S&P Communications Equipment Companies. The graph includes the capital-weighted-performance results of those companies in the communications equipment company classification that are also included in the S&P 500.
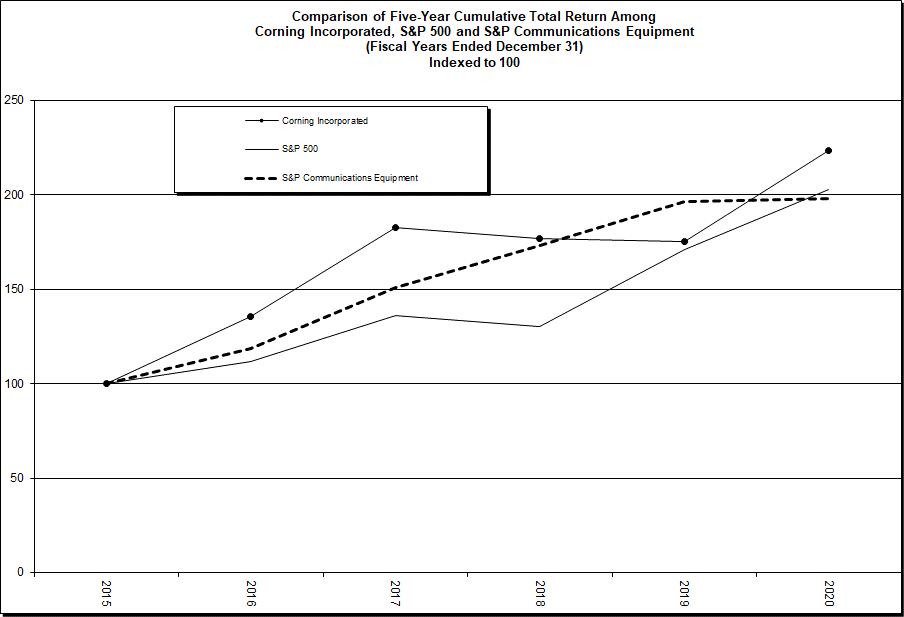
(b)Not applicable.
(c)The following table provides information about purchases of common stock by the Company during the fiscal fourth quarter of 2020:
Issuer Purchases of Equity Securities
| | | | | | | | | | |
| | | | | | | | | | |
Period | | Total number
of shares
purchased (1) | | Average
price paid
per share | | Number
of shares
purchased
as part of
publicly
announced
programs (2) | | Approximate
dollar value of
shares that
may yet be
purchased
under the
programs |
October 1-31, 2020 | | 28,338 | | $ | 33.88 | | | | | |
November 1-30, 2020 | | 608 | | $ | 35.66 | | | | | |
December 1-31, 2020 | | 16,195 | | $ | 37.21 | | | | | |
Total | | 45,141 | | $ | 35.10 | | — | | $ | 5,318,357,636 |
(1)This column reflects the following transactions during the fourth quarter of 2020: (i) the deemed surrender to us of 8,516 shares of common stock to satisfy tax withholding obligations relating to the vesting of employee restricted stock units; (ii) the deemed surrender to us of 35,612 shares of common stock to satisfy tax withholding obligations relating to the vesting of restricted stock issued to employees; (iii) the deemed surrender to us of 1,013 shares of common stock to pay the exercise price and to satisfy tax withholding obligations relating to the exercise of employee stock options.
(2)The Company suspended share repurchases in March 2020.
Item 7. Management’s Discussion and Analysis of Financial Condition and Results of Operations
For discussion of 2019 results year-over-year comparison with 2018 results refer to "Management's Discussion and Analysis of Financial Conditions and Results of Operations" in our Annual Report on Form 10-K for the fiscal year ended December 31, 2019.
Organization of Information
Management’s Discussion and Analysis provides a historical and prospective narrative on the Company’s financial condition and results of operations. This discussion includes the following sections:
Overview
Results of Operations
Core Performance Measures
Reportable Segments
Liquidity and Capital Resources
Environment
Critical Accounting Estimates
New Accounting Standards
Forward-Looking Statements
OVERVIEW
In response to the COVID-19 pandemic and the ensuing economic uncertainty, including changing market conditions, the Company has and will continue to focus on three core priorities: preserving the financial health of the Company; protecting employees and communities; and delivering on customer commitments.
Strategy & Growth Framework
In 2019, we successfully completed our 2016 - 2019 Strategy and Capital Allocation Framework. Under the Framework, we outlined and demonstrated how Corning’s probability of success increases as we invest in our world-class capabilities. We concentrate approximately 80% of our research, development and engineering investment along with capital spending on a cohesive set of three core technologies, four manufacturing and engineering platforms, and five Market-Access Platforms. This strategy allows us to quickly apply our talents and repurpose our assets across the company, as needed, to capture high-return opportunities.
Building on the success of the 2016 - 2019 Framework, we announced our 2020 - 2023 Strategy & Growth Framework, highlighting significant opportunities to sell more Corning content through each of our Market-Access Platforms. Under this new Framework, our leadership priorities and our fundamental approach to capital allocation remain the same. We continue to focus our portfolio and utilize our financial strength. We expect to generate strong operating cash flow as we move forward. We will continue to use our cash to grow, extend our leadership, and reward shareholders.
While 2020, brought unprecedented challenges to our end markets and operations, driven by the COVID-19 pandemic, economic uncertainty, and social unrest, Corning adapted rapidly and remained resilient. We executed well to preserve financial strength, while advancing major innovations with industry leaders. We effectively applied our focused and cohesive portfolio to create value and outperform our underlying markets, contributing to growth in the second half of this year.
2020 Results
Net sales in the year ended December 31, 2020 were $11.3 billion, a net decrease of $200 million, or 2%, when compared to the year ended December 31, 2019, driven by lower sales in the Display Technologies, Optical Communications, Environmental Technologies and Life Sciences segments partially offset by higher sales the Specialty Materials segment and “All Other”.
For the year ended December 31, 2020, we generated net income of $512 million, or $0.54 per share, compared to a net income of $960 million, or $1.07 per share, for 2019. When compared to 2019, the $448 million decrease in net income was primarily due to the following items (amounts presented after tax):
The negative impact of mark-to-market translated earnings contract losses of $226 million;
Higher costs of $170 million for an asset impairment loss related to investments in research and development programs within “All Other”;
Higher costs for litigation and environmental reserves of $133 million;
Higher expenses of $117 million, primarily driven by severance costs for the Display Technologies segment;
The negative impact of a cumulative adjustment recorded during the first quarter of 2020 to reduce revenue in the amount of $105 million. The adjustment was associated with a previously recorded commercial benefit asset, reflected as a prepayment, to a customer with a long-term supply agreement that is exiting its production of LCD panels; and
Lower segment net income of $73 million mainly driven by lower volumes in the first half of 2020.
Partially offsetting these events were the following items:
Gain on a previously held equity investment in HSG of $387 million; and
An $83 million gain recognized from the initial public offering of an investment in the fourth quarter of 2020.
Diluted earnings per share decreased in 2020 by $0.53 per share, or 50%, when compared to 2019, primarily driven by the decrease in net income described above. The impact of share repurchases did not materially impact the change in diluted earnings per share.
The translation impact of fluctuations in foreign currency exchange rates, including the impact of hedges realized in the current year, positively impacted Corning’s net income by approximately $51 million in the year ended December 31, 2020, when compared to the same period in 2019.
2021 Corporate Outlook
We believe 2021 will be a year of growth and we will continue to focus on operational excellence, cash-flow generation and prudent capital allocation. We expect year-over-year sales growth to accelerate in the first quarter of 2021, with approximately $3.0 - $3.2 billion of net sales.
RESULTS OF OPERATIONS
Selected highlights from our operations follow (in millions):
| | | | | | | | | | | | |
| | | | | | | | | | | | |
| Year ended December 31, | | % change |
| 2020 | | 2019 | | 2018 | | 20 vs. 19 | | 19 vs. 18 |
| | | | | | | | | | | | |
Net sales | $ | 11,303 | | $ | 11,503 | | $ | 11,290 | | (2) | | 2 |
| | | | | | | | | | | | |
Gross margin | $ | 3,531 | | $ | 4,035 | | $ | 4,461 | | (12) | | (10) |
(gross margin %) | | 31% | | | 35% | | | 40% | | | | |
| | | | | | | | | | | | |
Selling, general and administrative expenses | $ | 1,747 | | $ | 1,585 | | $ | 1,799 | | 10 | | (12) |
(as a % of net sales) | | 15% | | | 14% | | | 16% | | | | |
| | | | | | | | | | | | |
Research, development and engineering expenses | $ | 1,154 | | $ | 1,031 | | $ | 993 | | 12 | | 4 |
(as a % of net sales) | | 10% | | | 9% | | | 9% | | | | |
| | | | | | | | | | | | |
Equity in (losses) earnings of affiliated companies | $ | (25) | | $ | 17 | | $ | 390 | | * | | (96) |
(as a % of net sales) | | (0)% | | | 0% | | | 3% | | | | |
| | | | | | | | | | | | |
Translated earnings contract (loss) gain, net | $ | (38) | | $ | 248 | | $ | (93) | | * | | * |
(as a % of net sales) | | (0)% | | | 2% | | | (1)% | | | | |
| | | | | | | | | | | | |
Transaction-related gain, net | $ | 498 | | | | | | | | * | | * |
(as a % of net sales) | | 4% | | | | | | | | | | |
| | | | | | | | | | | | |
Income before income taxes | $ | 623 | | $ | 1,216 | | $ | 1,503 | | (49) | | (19) |
(as a % of net sales) | | 6% | | | 11% | | | 13% | | | | |
| | | | | | | | | | | | |
Provision for income taxes | $ | (111) | | $ | (256) | | $ | (437) | | 57 | | 41 |
(as a % of net sales) | | (1)% | | | (2)% | | | (4)% | | | | |
| | | | | | | | | | | | |
Net income attributable to Corning Incorporated | $ | 512 | | $ | 960 | | $ | 1,066 | | (47) | | (10) |
(as a % of net sales) | | 5% | | | 8% | | | 9% | | | | |
* Percent change not meaningful.
Segment Net Sales
The following table presents segment net sales by reportable segment (in millions):
| | | | | | | | | | | | |
| | | | | | | | | | | | |
| | | | | | | | | | % | | % |
| Year ended December 31, | | change | | change |
| 2020 | | 2019 | | 2018 | | 20 vs. 19 | | 19 vs. 18 |
Display Technologies | $ | 3,172 | | $ | 3,254 | | $ | 3,276 | | (3)% | | (1)% |
Optical Communications | | 3,563 | | | 4,064 | | | 4,192 | | (12)% | | (3)% |
Specialty Materials | | 1,884 | | | 1,594 | | | 1,479 | | 18% | | 8% |
Environmental Technologies | | 1,370 | | | 1,499 | | | 1,289 | | (9)% | | 16% |
Life Sciences | | 998 | | | 1,015 | | | 946 | | (2)% | | 7% |
All Other | | 465 | | | 230 | | | 216 | | 102% | | 6% |
Net sales of reportable segments and All Other | $ | 11,452 | | $ | 11,656 | | $ | 11,398 | | (2)% | | 2% |
Impact of foreign currency movements (1) | | (44) | | | (153) | | | (108) | | 71% | | (42)% |
Cumulative adjustment related to customer contract (2) | | (105) | | | | | | | | * | | |
Consolidated net sales | $ | 11,303 | | $ | 11,503 | | $ | 11,290 | | (2)% | | 2% |
(1)This amount primarily represents the impact of foreign currency adjustments in the Display Technologies, Environmental Technologies and Life Sciences segments.
(2)Amount represents the negative impact of a cumulative adjustment recorded during the first quarter of 2020 to reduce revenue in the amount of $105 million. The adjustment was associated with a previously recorded commercial benefit asset, reflected as a prepayment, to a customer with a long-term supply agreement that is exiting its production of LCD panels.
* Percent change not meaningful.
For the year ended December 31, 2020, segment net sales decreased by $204 million, or 2%, when compared to the same period in 2019. The primary sales drivers by segment were as follows:
Display Technologies’ net sales decreased by $82 million, primarily driven by lower sales and production volumes in the first half of the year;
Optical Communications’ net sales declined $501 million, as sales declined for carrier products by $273 million and enterprise products by $228 million, due to general market weakness and capital spending reductions by several major customers;
Net sales for Environmental Technologies decreased $129 million, as production facilities of vehicle manufacturers were temporarily shut down during the first half of 2020 in key markets;
Net sales in the Life Sciences segment decreased by $17 million, primarily driven by lab closures due to the COVID-19 pandemic;
Net sales increased in the Specialty Materials segment in the amount of $290 million, primarily driven by strong demand for premium cover materials in support of second-half customer launches, growth in IT products due to work and study from home trends, as well as demand for semiconductor equipment products; and
Net sales for “All Other” increased by $235 million, primarily driven by the consolidation of HSG on September 9, 2020, which added sales of $194 million.
Movements in foreign exchange rates positively impacted Corning’s consolidated net sales by $115 million in the year ended December 31, 2020, when compared to the same period in 2019.
In 2020 and 2019, sales in international markets accounted for 70% and 68%, respectively, of total net sales.
Cost of Sales
The types of expenses included in the cost of sales line item are: raw materials consumption, including direct and indirect materials; salaries, wages and benefits; depreciation and amortization; production utilities; production-related purchasing; warehousing (including receiving and inspection); repairs and maintenance; inter-location inventory transfer costs; production and warehousing facility property insurance; rent for production facilities; and other production overhead.
Gross Margin
In the year ended December 31, 2020, gross margin decreased by $504 million, or 12%. Gross margin as a percentage of sales declined by 4 percentage points. Negative impacts to gross margin were primarily driven by severance charges for the Display Technologies segment and lower volumes in Display Technologies, Optical Communications and Environmental Technologies segments for the year ended December 31, 2020.
Movements in foreign exchange rates had a $91 million positive impact on Corning’s consolidated gross margin in the year ended December 31, 2020, when compared to the same period in 2019.
Selling, General and Administrative Expenses
When compared to the year ended December 31, 2019, selling, general and administrative expenses increased by $162 million, or 10%, in the year ended December 31, 2020. Selling, general and administrative expenses increased by 1% as a percentage of sales. The increase was primarily driven by higher litigation, restructuring and share-based compensation costs, partially offset by salary and cost reductions across the Company.
The types of expenses included in the selling, general and administrative expenses line item are: salaries, wages and benefits; stock-based compensation expense; travel; sales commissions; professional fees; and depreciation and amortization, utilities and rent for administrative facilities.
Research, Development and Engineering Expenses
For the year ended December 31, 2020, research, development and engineering expenses increased by $123 million, or 12%, when compared to the same period in the prior year, primarily driven by a pre-tax asset impairment loss of $211 million related to the reassessment and reprioritization of research and development programs within “All Other”. Given the current economic environment and market opportunities, Corning has rescoped and significantly reduced its investment in these research and development programs. As a percentage of sales, these expenses were 1% higher when compared to the same period last year.
Restructuring, Impairment, and Other Charges and Credits
For the year ended December 31, 2020, and in response to uncertain global economic conditions, Corning undertook actions to transform the Company’s cost structure and improve operational efficiency. During the year ended December 31, 2020, Corning recorded restructuring, impairment, and other charges and credits of $827 million.
In the second quarter of 2020, the Company implemented a corporate-wide workforce reduction program. Severance charges were primarily incurred to facilitate realignment of capacity in the Asia regions for the Display Technologies segment, optimize the Optical Communications segment and contain corporate costs. For the year ended December 31, 2020, severance charges were $148 million. As of December 31, 2020, the unpaid severance liabilities of $45 million are expected to be substantially completed within the next twelve months.
For the year ended December 31, 2020, Corning incurred a long-lived asset impairment and disposal loss for an asset group related to the reassessment of research and development programs within “All Other”. Given the economic environment and market opportunities, Corning discontinued its investment in these research and development programs. The impairment analysis and disposition of certain assets resulted in a total pre-tax charge of $217 million, primarily recorded in research, development and engineering expenses, as noted above, which was substantially all the carrying value, inclusive of an insignificant amount of goodwill.
Capacity realignment costs of $304 million for the year ended December 31, 2020, primarily include accelerated depreciation and asset disposals associated with the exit of certain facilities and other exit activities in the Display Technologies and Specialty Materials business segments. Other charges and credits of $158 million, were related to other exit activities.
Refer to Note 2 (Restructuring, Impairment and Other Charges and Credits) to the consolidated financial statements for additional information on restructuring activities and impairment.
Equity in (Losses) Earnings of Affiliated Companies
The following provides a summary of equity in (losses) earnings of affiliated companies (in millions):
| | | | | | | | |
| | | | | | | | |
| Year ended December 31, |
| 2020 | | 2019 | | 2018 |
Hemlock Semiconductor Group (1) | $ | 22 | | $ | 27 | | $ | 388 |
All other (2) | | (47) | | | (10) | | | 2 |
Total equity (losses) earnings | $ | (25) | | $ | 17 | | $ | 390 |
(1)The year ended December 31, 2020, includes HSG’s results of operations through September 8, 2020. Corning began consolidating HSG on September 9, 2020.
(2)Includes the Company’s share of a loss related to the sale of a business for the year ended December 31, 2020.
HSG acquired DuPont’s Trichlorosilane (“TCS”) manufacturing assets, which was determined to be a business and recorded as a business combination. The fair value of the purchase price was $255 million. In conjunction with this acquisition, HSG settled its pre-existing contract dispute related to a long-term supply agreement with DuPont (“TCS Settlement”) for a contractual amount of $175 million, which was determined to have a fair value of $200 million. See Note 4 (HSG Transactions) to the consolidated financial statements for more information.
HSG’s net income for the period ended September 8, 2020, included a pre-tax gain recorded in the second quarter of 2020, related to the settlement of a long-term supply agreement of approximately $165 million, partially offset by an inventory provision of approximately $44 million associated with the settlement of the agreement. Prior to the Redemption, in the third quarter of 2020, HSG recorded a pre-tax loss of $200 million resulting from the settlement of a pre-existing contract dispute related to a long-term supply agreement with DuPont (“TCS Settlement”). Corning’s share of the pre-tax loss was $81 million. Accordingly, Corning’s share of the net impact was an equity loss of $19 million.
Since September 9, 2020, HSG’s revenue of $194 million has been consolidated in “All Other” in Corning’s consolidated statements of income for the year ended December 31, 2020. The amount of net income is not material to Corning’s consolidated financial statements for the current year.
Additional information about corporate investments is presented in Note 3 (Investments) and Note 4 (HSG Transactions and Acquisitions) to the consolidated financial statements.
Translated earnings contract (loss) gain, net
Included in the line item translated earnings contract (loss) gain, net, is the impact of foreign currency contracts which hedge our translation exposure arising from movements in the Japanese yen, South Korean won, new Taiwan dollar, euro, Chinese yuan and British pound and its impact on our net income.
The following table provides detailed information on the impact of our translated earnings contracts gains and losses for the years ended December 31, 2020, 2019 and 2018:
| | | | | | | | | | | | | | | | | |
| | | | | | | | | | | | | | | | | |
(in millions) | (Loss)
income
before tax | | Net
(loss)
income | | | Income
(loss)
before tax | Net
income
(loss) | | Income
before
tax | | Net
income |
| 2020 | | 2019 | | 2020 vs. 2019 |
Hedges related to translated earnings: | | | | | | | | | | | | | | | | | |
Realized (loss) gain, net (1) | $ | (8) | | $ | (5) | | $ | 18 | | $ | 14 | | $ | (26) | | $ | (19) |
Unrealized (loss) gain, net (1) (2) | | (30) | | | (24) | | | 230 | | | 179 | | | (260) | | | (203) |
Total translated earnings contract (loss) gain, net | $ | (38) | | $ | (29) | | $ | 248 | | $ | 193 | | $ | (286) | | $ | (222) |
| | | | | | | | | | | | | | | | | |
| 2019 | | 2018 | | 2019 vs. 2018 |
Hedges related to translated earnings: | | | | | | | | | | | | | | | | | |
Realized gain, net (1) | $ | 18 | | $ | 14 | | $ | 97 | | $ | 78 | | $ | (79) | | $ | (64) |
Unrealized gain (loss), net (1) (2) | | 230 | | | 179 | | | (190) | | | (189) | | | 420 | | | 368 |
Total translated earnings contract gain (loss), net | $ | 248 | | $ | 193 | | $ | (93) | | $ | (111) | | $ | 341 | | $ | 304 |
| | | | | | | | | | | | | | | | | |
(1)Includes pre-tax realized losses related to the expiration of option contracts for the year ended 2020, 2019, 2018 of $20 million, $37 million and $11 million, respectively, and was reflected in operating activities in the consolidated statements of cash flows.
(2)The impact to income was primarily driven by Japanese yen, South Korean won, and euro-denominated hedges of translated earnings.
Income Before Income Taxes
The translation impact of fluctuations in foreign currency exchange rates, including the impact of hedges realized in the current year, positively impacted Corning’s income before income taxes by $60 million in the year ended December 31, 2020, when compared to the same period in 2019.
Provision for Income Taxes
Our provision for income taxes and the related effective income tax rates were as follows (dollars in millions):
| | | | | | | | |
| | | | | | | | |
| Year ended December 31, |
| 2020 | | 2019 | | 2018 |
Provision for income taxes | $ | (111) | | $ | (256) | | $ | (437) |
Effective tax rate | | 17.8% | | | 21.1% | | | 29.1% |
For the year ended December 31, 2020, the effective income tax rate differed from the U.S. statutory rate of 21% primarily due to the following:
Additional net provision of $73 million from changes to our tax reserves;
A net provision of $45 million due primarily to stronger foreign earnings relative to U.S. earnings in the current year, as well as U.S. income inclusion under the Internal Revenue Code (“Subpart F income”); and
A net benefit of $116 million due to a net operating loss carryback allowed under the CARES Act.
For the year ended December 31, 2019, the effective income tax rate differed from the U.S. statutory rate of 21% primarily due to the following:
Additional net provision of $102 million from changes to our tax reserves;
A net benefit of $45 million due to releases of foreign valuation allowances on foreign deferred tax assets that are now considered realizable; and
Additional net benefit, including a change in estimate from prior year, from the 2017 Tax Act attributable to foreign intangible income (FDII) deduction of $103 million offset by taxes for global intangible low-taxed income (GILTI) of $15 million.
Generally, Corning will indefinitely reinvest the foreign earnings of: (1) any of its subsidiaries located in jurisdictions where Corning lacks the ability to repatriate its earnings, (2) any of its subsidiaries where Corning’s intention is to reinvest those earnings in operations, (3) legal entities for which Corning holds a non-controlling interest, (4) any subsidiaries with an accumulated deficit in earnings and profits, (5) any subsidiaries which have a positive earnings and profits balance but for which the entity lacks sufficient local statutory earnings or stock basis from which to make a distribution, or (6) any of its subsidiaries where a future distribution would trigger a significant net cost to the U.S. shareholder.
During 2020, the Company distributed approximately $914 million from foreign subsidiaries to their respective U.S. parent companies. As of December 31, 2020, Corning has approximately $2 billion of indefinitely reinvested foreign earnings. It remains impracticable to calculate the tax cost of repatriating our unremitted earnings which are considered indefinitely reinvested.
Refer to Note 8 (Income Taxes) to the consolidated financial statements for further details regarding income tax matters.
Net Income Attributable to Corning Incorporated
As a result of the items discussed above, net income and per share data was as follows (in millions, except per share amounts):
| | | | | | | | |
| | | | | | | | |
| Year ended December 31, |
| 2020 | | 2019 | | 2018 |
Net income attributable to Corning Incorporated | $ | 512 | | $ | 960 | | $ | 1,066 |
Net income attributable to Corning Incorporated used in
basic earnings per common share calculation (1) | $ | 414 | | $ | 862 | | $ | 968 |
Net income attributable to Corning Incorporated used in
diluted earnings per common share calculation (1) | $ | 414 | | $ | 960 | | $ | 1,066 |
Basic earnings per common share | $ | 0.54 | | $ | 1.11 | | $ | 1.19 |
Diluted earnings per common share | $ | 0.54 | | $ | 1.07 | | $ | 1.13 |
| | | | | | | | |
Weighted-average common shares outstanding - basic | | 761 | | | 776 | | | 816 |
Weighted-average common shares outstanding - diluted | | 772 | | | 899 | | | 941 |
(1)Refer to Note 18 (Earnings per Common Share) to the consolidated financial statements for additional information.
Comprehensive Income
| | | | | | | | |
| | | | | | | | |
| Year ended December 31, |
(In millions) | 2020 | | 2019 | | 2018 |
Net income attributable to Corning Incorporated | $ | 512 | | $ | 960 | | $ | 1,066 |
| | | | | | | | |
Foreign currency translation adjustments and other | | 528 | | | (143) | | | (185) |
Net unrealized gains (losses) on investments | | | | | 1 | | | (1) |
Unamortized (losses) gains and prior service (costs) credits for | | | | | | | | |
postretirement benefit plans | | (88) | | | (64) | | | 19 |
Net unrealized (losses) gains on designated hedges | | (9) | | | 45 | | | (1) |
Other comprehensive income (loss), net of tax (Note 17) | | 431 | | | (161) | | | (168) |
| | | | | | | | |
Comprehensive income attributable to Corning Incorporated | $ | 943 | | $ | 799 | | $ | 898 |
| | | | | | | | |
For the year ended December 31, 2020, comprehensive income increased by $144 million, when compared to the same period in 2019, primarily due to the following:
An increase in the gain on foreign currency translation adjustments in the amount of $671 million, largely driven by the Japanese yen, South Korean won and Chinese yuan.
This gain was partially offset by the following:
A decrease in net income of $448 million; and
The negative impact of a change to net unrealized losses on designated hedges of $54 million.
Refer to Note 13 (Employee Retirement Plans) and Note 17 (Shareholders’ Equity) to the consolidated financial statements for additional details.
CORE PERFORMANCE MEASURES
In managing the Company and assessing our financial performance, we adjust certain measures provided by our consolidated financial statements to exclude specific items to report core performance measures. These items include gains and losses on our translated earnings contracts, acquisition-related costs, certain discrete tax items and other tax-related adjustments, restructuring, impairment losses, and other charges and credits, certain litigation-related expenses, pension mark-to-market adjustments and other items which do not reflect on-going operating results of the Company or our equity affiliates. Corning utilizes constant-currency reporting for our Display Technologies, Environmental Technologies, Specialty Materials and Life Sciences segments for the Japanese yen, South Korean won, Chinese yuan, new Taiwan dollar and the euro. Effective January 1, 2019, Corning began using constant-currency reporting for our Environmental Technologies and Life Sciences segments. The Company believes that the use of constant-currency reporting allows investors to understand our results without the volatility of currency fluctuations and reflects the underlying economics of the translated earnings contracts used to mitigate the impact of changes in currency exchange rates on our earnings and cash flows. Corning also believes that reporting core performance measures provides investors greater transparency to the information used by our management team to make financial and operational decisions.
Core performance measures are not prepared in accordance with Generally Accepted Accounting Principles in the United States (“GAAP”). We believe investors should consider these non-GAAP measures in evaluating our results as they are more indicative of our core operating performance and how management evaluates our operational results and trends. These measures are not, and should not be viewed as a substitute for, GAAP reporting measures. With respect to the Company’s outlook for future periods, it is not possible to provide reconciliations for these non-GAAP measures because the Company does not forecast the movement of foreign currencies against the U.S. dollar, or other items that do not reflect ongoing operations, nor does it forecast items that have not yet occurred or are out of the Company’s control. As a result, the Company is unable to provide outlook information on a GAAP basis.
Effective July 1, 2019, we replaced the term “Core Earnings” with “Core Net Income”. The terms are interchangeable and the underlying calculations remain the same.
For a reconciliation of non-GAAP performance measures to their most directly comparable GAAP financial measure, please see “Reconciliation of Non-GAAP Measures”.
RESULTS OF OPERATIONS – CORE PERFORMANCE MEASURES
Selected highlights from our continuing operations, excluding certain items, follow (in millions):
| | | | | | | | | | | | |
| | | | | | | | | | | | |
| Year ended December 31, | | % change |
| 2020 | | 2019 | | 2018 | | 20 vs. 19 | | 19 vs. 18 |
Core net sales | $ | 11,452 | | $ | 11,656 | | $ | 11,398 | | (2)% | | 2% |
Core equity in earnings of affiliated companies | $ | 86 | | $ | 237 | | $ | 241 | | (64)% | | (2)% |
Core net income | $ | 1,237 | | $ | 1,578 | | $ | 1,673 | | (22)% | | (6)% |
Core Net Sales
Core net sales are consistent with net sales by reportable segment. The following table presents segment net sales by reportable segment (in millions):
| | | | | | | | | | | | |
| | | | | | | | | | | | |
| Year ended December 31, | | % change |
| 2020 | | 2019 | | 2018 | | 20 vs. 19 | | 19 vs. 18 |
Display Technologies | $ | 3,172 | | $ | 3,254 | | $ | 3,276 | | (3)% | | (1)% |
Optical Communications | | 3,563 | | | 4,064 | | | 4,192 | | (12)% | | (3)% |
Specialty Materials | | 1,884 | | | 1,594 | | | 1,479 | | 18% | | 8% |
Environmental Technologies | | 1,370 | | | 1,499 | | | 1,289 | | (9)% | | 16% |
Life Sciences | | 998 | | | 1,015 | | | 946 | | (2)% | | 7% |
All Other | | 465 | | | 230 | | | 216 | | 102% | | 6% |
Net sales of reportable segments and All Other | | 11,452 | | | 11,656 | | | 11,398 | | (2)% | | 2% |
Impact of foreign currency movements (1) | | (44) | | | (153) | | | (108) | | 71% | | (42)% |
Cumulative adjustment related to customer contract (2) | | (105) | | | | | | | | * | | |
Consolidated net sales | $ | 11,303 | | $ | 11,503 | | $ | 11,290 | | (2)% | | 2% |
(1)This amount primarily represents the impact of foreign currency adjustments in the Display Technologies, Environmental Technologies and Life Sciences segments.
(2)Amount represents the negative impact of a cumulative adjustment recorded during the first quarter of 2020 to reduce revenue in the amount of $105 million. The adjustment was associated with a previously recorded commercial benefit asset, reflected as a prepayment, to a customer with a long-term supply agreement that is exiting its production of LCD panels.
* Percentage change not meaningful
Segment net sales and variances are discussed in detail in the Reportable Segments section of our MD&A.
Core Equity in Earnings of Affiliated Companies
The following provides a summary of core equity in earnings of affiliated companies (in millions):
| | | | | | | | | | | | |
| | | | | | | | | | | | |
| Year ended December 31, | | % change |
| 2020 | | 2019 | | 2018 | | 20 vs. 19 | | 19 vs. 18 |
Hemlock Semiconductor Group (1) | $ | 82 | | $ | 229 | | $ | 236 | | (64)% | | (3)% |
All other | | 4 | | | 8 | | | 5 | | (50)% | | 60% |
Total core equity earnings | $ | 86 | | $ | 237 | | $ | 241 | | (64)% | | (2)% |
(1)The year ended December 31, 2020, includes HSG’s results of operations through September 8, 2020. Corning began consolidating HSG on September 9, 2020.
Core Net Income
In the year ended December 31, 2020, we generated core net income of $1,237 million or $1.39 per share, compared to core net income generated in the year ended December 31, 2019 of $1,578 million, or $1.76 per share. The decrease in core net income of $341 million was driven by the following items:
Lower segment net income of $73 million mainly driven by lower volumes in the first half of 2020; and
Lower equity earnings of $151 million.
Core earnings per share decreased in the year ended December 31, 2020 to $1.39 per share, driven by the decrease in core net income. The impact of share repurchases did not materially impact the change in diluted earnings per share.
Included in core net income for the years ended December 31, 2020, 2019, and 2018, is net periodic pension expense in the amount of $50 million, $84 million and $52 million, which excludes the annual pension mark-to-market adjustments.
Refer to Note 13 (Employee Retirement Plans) to the consolidated financial statements for additional information.
Core Earnings per Common Share
The following table sets forth the computation of core basic and core diluted earnings per common share (in millions, except per share amounts):
| | | | | | | | |
| | | | | | | | |
| 2020 | | 2019 | | 2018 |
Core net income attributable to Corning Incorporated | $ | 1,237 | | $ | 1,578 | | $ | 1,673 |
Less: Series A convertible preferred stock dividend | | 98 | | | 98 | | | 98 |
Core net income available to common stockholders - basic | | 1,139 | | | 1,480 | | | 1,575 |
Add: Series A convertible preferred stock dividend | | 98 | | | 98 | | | 98 |
Core net income available to common stockholders - diluted | $ | 1,237 | | $ | 1,578 | | $ | 1,673 |
| | | | | | | | |
Weighted-average common shares outstanding - basic | | 761 | | | 776 | | | 816 |
Effect of dilutive securities: | | | | | | | | |
Stock options and other dilutive securities | | 11 | | | 8 | | | 10 |
Series A convertible preferred stock | | 115 | | | 115 | | | 115 |
Weighted-average common shares outstanding - diluted | | 887 | | | 899 | | | 941 |
Core basic earnings per common share | $ | 1.50 | | $ | 1.91 | | $ | 1.93 |
Core diluted earnings per common share | $ | 1.39 | | $ | 1.76 | | $ | 1.78 |
Reconciliation of Non-GAAP Measures
We utilize certain financial measures and key performance indicators that are not calculated in accordance with GAAP to assess our financial and operating performance. A non-GAAP financial measure is defined as a numerical measure of a company’s financial performance that (i) excludes amounts, or is subject to adjustments that have the effect of excluding amounts, that are included in the comparable measure calculated and presented in accordance with GAAP in the consolidated statements of income or statement of cash flows, or (ii) includes amounts, or is subject to adjustments that have the effect of including amounts, that are excluded from the comparable measure as calculated and presented in accordance with GAAP in the consolidated statements of income or statements of cash flows.
Core net sales, core equity in earnings of affiliated companies and core net income are non-GAAP financial measures utilized by our management to analyze financial performance without the impact of items that are driven by general economic conditions and events that do not reflect the underlying fundamentals and trends in the Company’s operations.
The following tables reconcile our non-GAAP financial measures to their most directly comparable GAAP financial measure (amounts in millions except percentages and per share amounts):
| | | | | | | | | | | | | | | | |
| | | | | | | | | | | | | | | | |
| Year ended December 31, 2020 |
| Net
Sales | | Equity (losses)
earnings | | Income
before
income
taxes | | Net
income | | Effective
tax
rate (a) | |
Earnings per
share
|
As reported | $ | 11,303 | | $ | (25) | | $ | 623 | | $ | 512 | | 17.8% | | $ | 0.54 |
Constant-currency adjustment (1) | | 44 | | | | | | 22 | | | 17 | | | | | 0.02 |
Translation loss on Japanese
yen-denominated debt (2) | | | | | | | | 86 | | | 67 | | | | | 0.09 |
Translated earnings contract loss, net (3) | | | | | | | | 46 | | | 36 | | | | | 0.05 |
Acquisition-related costs (4) | | | | | | | | 156 | | | 114 | | | | | 0.15 |
Discrete tax items and other tax-related
adjustments (5) | | | | | | | | | | | (24) | | | | | (0.03) |
Litigation, regulatory and other legal
matters (6) | | | | | | | | 144 | | | 120 | | | | | 0.16 |
Restructuring, impairment and other
charges and credits (7) | | | | | | | | 827 | | | 621 | | | | | 0.80 |
Cumulative adjustment related to customer
contract (8) | | 105 | | | | | | 105 | | | 105 | | | | | 0.14 |
Equity in losses of affiliated companies (9) | | | | | 111 | | | 111 | | | 98 | | | | | 0.13 |
Pension mark-to-market adjustment (10) | | | | | | | | 31 | | | 24 | | | | | 0.03 |
Transaction-related gain, net (11) | | | | | | | | (498) | | | (387) | | | | | (0.50) |
Bond redemption loss (12) | | | | | | | | 22 | | | 17 | | | | | 0.02 |
Gain on investment (13) | | | | | | | | (107) | | | (83) | | | | | (0.11) |
Core performance measures | $ | 11,452 | | $ | 86 | | $ | 1,568 | | $ | 1,237 | | 21.1% | | $ | 1.39 |
(a)Based upon statutory tax rates in the specific jurisdiction for each event.
See “Items Excluded from GAAP Measures” below for the descriptions of the footnoted reconciling items.
| | | | | | | | | | | | | | | | |
| | | | | | | | | | | | | | | | |
| Year ended December 31, 2019 |
| Net
sales | | Equity
earnings | | Income
before
income
taxes | | Net
income | | Effective
tax
rate (a) | | Earnings
per
share |
As reported | $ | 11,503 | | $ | 17 | | $ | 1,216 | | $ | 960 | | 21.1% | | $ | 1.07 |
Constant-currency adjustment (1) | | 153 | | | 1 | | | 115 | | | 115 | | | | | 0.13 |
Translation loss on Japanese
yen-denominated debt (2) | | | | | | | | 3 | | | 2 | | | | | 0.00 |
Translated earnings contract gain, net (3) | | | | | | | | (245) | | | (190) | | | | | (0.21) |
Acquisition-related costs (4) | | | | | | | | 130 | | | 99 | | | | | 0.11 |
Discrete tax items and other tax-related
adjustments (5) | | | | | | | | | | | 37 | | | | | 0.04 |
Litigation, regulatory and other legal
matters (6) | | | | | | | | (17) | | | (13) | | | | | (0.01) |
Restructuring, impairment and other
charges and credits (7) | | | | | 6 | | | 439 | | | 334 | | | | | 0.37 |
Equity in losses of affiliated companies (9) | | | | | 213 | | | 213 | | | 165 | | | | | 0.18 |
Pension mark-to-market adjustment (10) | | | | | | | | 95 | | | 69 | | | | | 0.08 |
Core performance measures | $ | 11,656 | | $ | 237 | | $ | 1,949 | | $ | 1,578 | | 19.0% | | $ | 1.76 |
| | | | | | | | | | | | | | | | |
| | | | | | | | | | | | | | | | |
| Year ended December 31, 2018 |
| Net
sales | | Equity
earnings | | Income
before
income
taxes | | Net
income | | Effective
tax
rate (a) | | Earnings
per
share |
As reported | $ | 11,290 | | $ | 390 | | $ | 1,503 | | $ | 1,066 | | 29.1% | | $ | 1.13 |
Constant-currency adjustment (1) | | 108 | | | 2 | | | 156 | | | 127 | | | | | 0.13 |
Translation loss on Japanese
yen-denominated debt (2) | | | | | | | | 18 | | | 15 | | | | | 0.02 |
Translated earnings contract loss, net (3) | | | | | | | | 73 | | | 97 | | | | | 0.10 |
Acquisition-related costs (4) | | | | | | | | 132 | | | 103 | | | | | 0.11 |
Discrete tax items and other tax-related
adjustments (5) | | | | | | | | | | | 79 | | | | | 0.08 |
Litigation, regulatory and other legal
matters (6) | | | | | | | | 124 | | | 96 | | | | | 0.10 |
Restructuring, impairment and other
charges and credits (7) | | | | | | | | 130 | | | 96 | | | | | 0.10 |
Equity in earnings of affiliated companies (9) | | | | | (151) | | | (151) | | | (119) | | | | | (0.13) |
Pension mark-to-market adjustment (10) | | | | | | | | 145 | | | 113 | | | | | 0.12 |
Core performance measures | $ | 11,398 | | $ | 241 | | $ | 2,130 | | $ | 1,673 | | 21.5% | | $ | 1.78 |
(a)Based upon statutory tax rates in the specific jurisdiction for each event.
See “Items Excluded from GAAP Measures” below for the descriptions of the footnoted reconciling items.
Items which we exclude from GAAP measures to arrive at core performance measures are as follows:
| |
| |
(1) | Constant-currency adjustment: Because a significant portion of segment revenue and expenses are denominated in currencies other than the U.S. dollar, management believes it is important to understand the impact on core net income of translating these currencies into U.S. dollars. Our Display Technologies segment sales and net income are primarily denominated in Japanese yen, but also impacted by the South Korean won, Chinese yuan, and new Taiwan dollar. Environmental Technologies and Life Science segments sales and net income are primarily impacted by the euro and Chinese yuan. Presenting results on a constant-currency basis mitigates the translation impact and allows management to evaluate performance period over period, analyze underlying trends in our businesses, and establish operational goals and forecasts. We establish constant-currency rates based on internally derived management estimates which are closely aligned with the currencies we have hedged. |
| |
| Constant-currency rates are as follows: |
| Currency | | Japanese yen | | Korean won | | Chinese yuan | | New Taiwan dollar | | Euro |
| Rate | | ¥107 | | ₩1,175 | | ¥6.7 | | NT$31 | | €.81 |
| |
(2) | Translation loss on Japanese yen-denominated debt: We have excluded the gain or loss on the translation of our yen-denominated debt to U.S. dollars. |
(3) | Translated earnings contract loss (gain): We have excluded the impact of the realized and unrealized gains and losses of our Japanese yen, South Korean won, Chinese yuan, euro and new Taiwan dollar-denominated foreign currency hedges related to translated earnings, as well as the unrealized gains and losses of our British pound-denominated foreign currency hedges related to translated earnings. |
(4) | Acquisition-related costs: These expenses include intangible amortization, inventory valuation adjustments and external acquisition-related deal costs. |
(5) | Discrete tax items and other tax-related adjustments: For 2020 and 2019, these include discrete period tax items such as changes in tax law, the impact of tax audits, changes in tax reserves, changes in judgement about the realizability of certain deferred tax assets, net Subpart F income, and other tax-related adjustments. For 2018, this amount primarily relates to the preliminary IRS audit settlement offset by changes in judgment about the realizability of certain deferred tax assets. |
(6) | Litigation, regulatory and other legal matters: Includes amounts that reflect developments in commercial litigation, intellectual property disputes, adjustments to our estimated liability for environmental-related items and other legal matters. |
(7) | Restructuring, impairment and other charges and credits: This amount includes restructuring, impairment losses and other charges and credits, as well as other expenses, primarily accelerated depreciation and asset write-offs, which are not related to continuing operations and are not classified as restructuring expense. |
(8) | Cumulative adjustment related to customer contract: The negative impact of a cumulative adjustment recorded during the first quarter of 2020 to reduce revenue in the amount of $105 million. The adjustment was associated with a previously recorded commercial benefit asset, reflected as a prepayment, to a customer with a long-term supply agreement that is exiting its production of LCD panels. |
(9) | Equity in losses (earnings) of affiliated companies: These adjustments relate to costs not related to continuing operations of our affiliated companies, such as restructuring, impairment losses, inventory adjustments, and other charges and credits and settlements under “take-or-pay” contracts. The year ended December 31, 2020 includes the Company’s share of a loss related to the sale of a business. |
(10) | Pension mark-to-market adjustment: Defined benefit pension mark-to-market gains and losses, which arise from changes in actuarial assumptions and the difference between actual and expected returns on plan assets and discount rates. |
(11) | Transaction-related gain, net: Amount represents the gain recorded on a previously held equity investment in HSG. |
(12) | Bond redemption loss: During the fourth quarter of 2020, Corning redeemed $100 million of 7.0% debentures due 2024 with a carrying amount of $99 million, paying a $21 million make-whole call premium, resulting in a redemption loss of $22 million. |
(13) | Gain on investment: Amount represents the gain recognized from the initial public offering of an investment in the fourth quarter of 2020. |
REPORTABLE SEGMENTS
Reportable segments are as follows:
Display Technologies – manufactures glass substrates for flat panel liquid crystal displays and other high-performance display panels.
Optical Communications – manufactures carrier network and enterprise network components for the telecommunications industry.
Specialty Materials – manufactures products that provide more than 150 material formulations for glass, glass ceramics and fluoride crystals to meet demand for unique customer needs.
Environmental Technologies – manufactures ceramic substrates and filters for automotive and diesel applications.
Life Sciences – manufactures glass and plastic labware, equipment, media, serum and reagents enabling workflow solutions for drug discovery and bioproduction.
All other segments that do not meet the quantitative threshold for separate reporting have been grouped as “All Other.” This group is primarily comprised of the results of the pharmaceutical technologies, auto glass and new product lines and development projects, as well as other businesses and certain corporate investments.
The Company obtained a controlling interest in HSG during the third quarter of 2020 and has consolidated results in “All Other” as of September 9, 2020. Refer to Note 4 (HSG Transactions and Acquisitions) to the consolidated financial statements for additional information on this transaction.
Financial results for the reportable segments are prepared on a basis consistent with the internal disaggregation of financial information to assist the CODM in making internal operating decisions. The impact of changes in the Japanese yen, South Korean won, Chinese yuan and new Taiwan dollar are excluded from segment sales and segment net income for the Display Technologies and Specialty Materials segments. The impact of changes in the euro and Chinese yuan are excluded from segment sales and segment net income for the Environment Technologies segment. The impact of changes in the euro, Chinese yuan and Japanese yen are excluded from segment sales and segment net income for the Life Sciences segment. Certain income and expenses are included in the unallocated amounts in the reconciliation of reportable segment net income (loss) to consolidated net income. These include items that are not used by the CODM in evaluating the results of or in allocating resources to the segments and include the following items: the impact of the translated earnings contracts; acquisition-related costs; discrete tax items and other tax-related adjustments; certain litigation, regulatory and other legal matters; restructuring, impairment losses and other charges and credits; adjustments relating to acquisitions; and other non-recurring non-operational items. Although these amounts are excluded from segment results, they are included in reported consolidated results.
Earnings of equity affiliates that are closely associated with the reportable segments are included in the respective segment’s net income (loss). Certain common expenses among reportable segments have been allocated differently than they would for stand-alone financial information. Segment net income (loss) may not be consistent with measures used by other companies.
Display Technologies
The following table provides net sales and net income for the Display Technologies segment:
| | | | | | | | | | | | | | |
| | | | | | | | | | | | | | |
| | Year ended December 31, | | | % change | | % change |
| | 2020 | | 2019 | | | 2018 | | | 20 vs. 19 | | 19 vs. 18 |
Segment net sales | | $ | 3,172 | | $ | 3,254 | | $ | 3,276 | | | (3%) | | (1%) |
Segment net income | | $ | 717 | | $ | 786 | | $ | 835 | | | (9%) | | (6%) |
Net sales in the Display Technologies segment decreased by $82 million for the year ended December 31, 2020, when compared to the prior year, primarily driven by lower sales and production volumes in the first half of the year.
Net income in the Display Technologies segment decreased by $69 million in the year ended December 31, 2020, primarily driven the changes in sales outlined above.
Optical Communications
The following table provides net sales and net income for the Optical Communications segment:
| | | | | | | | | | | | | | |
| | | | | | | | | | | | | | |
| | Year ended December 31, | | | % change | | % change |
| | 2020 | | 2019 | | | 2018 | | | 20 vs. 19 | | 19 vs. 18 |
Segment net sales | | $ | 3,563 | | $ | 4,064 | | $ | 4,192 | | | (12%) | | (3%) |
Segment net income | | $ | 366 | | $ | 489 | | $ | 592 | | | (25%) | | (17%) |
Net sales declined by $501 million, or 12%, in the year ended December 31, 2020, when compared to the same period in 2019, primarily due to lower sales in carrier products and enterprise products, down $273 million and $228 million, respectively, driven by general market weakness and capital spending reductions by several major customers.
Net income in the year ended December 31, 2020 decreased by $123 million, or 25%, primarily driven by the changes in sales, outlined above. Profitability was impacted by lower sales and production volumes.
Movements in foreign currency exchange rates did not materially impact net income in this segment in the year ended December 31, 2020 when compared to the same period in 2019.
Specialty Materials
The following table provides net sales and net income for the Specialty Materials segment:
| | | | | | | | | | | | | | |
| | | | | | | | | | | | | | |
| | Year ended December 31, | | | % change | | % change |
| | 2020 | | 2019 | | | 2018 | | | 20 vs. 19 | | 19 vs. 18 |
Segment net sales | | $ | 1,884 | | $ | 1,594 | | $ | 1,479 | | | 18% | | 8% |
Segment net income | | $ | 423 | | $ | 302 | | $ | 313 | | | 40% | | (4%) |
Net sales in the Specialty Materials segment increased by $290 million, or 18%, in the year ended December 31, 2020, when compared to the same period in 2019. Results were driven by demand for our premium cover materials, strength in the IT market, and demand for semiconductor related materials.
Net income in the year ended December 31, 2020 increased by $121 million, or 40%, when compared to the same period in 2019, primarily driven by the sales increases, outlined above, and good cost performance.
Environmental Technologies
The following table provides net sales and net income for the Environmental Technologies segment:
| | | | | | | | | | | | | | |
| | | | | | | | | | | | | | |
| | Year ended December 31, | | | % change | | % change |
| | 2020 | | 2019 | | | 2018 | | | 20 vs. 19 | | 19 vs. 18 |
Segment net sales | | $ | 1,370 | | $ | 1,499 | | $ | 1,289 | | | (9%) | | 16% |
Segment net income | | $ | 197 | | $ | 263 | | $ | 208 | | | (25%) | | 26% |
Net sales decreased $129 million, or 9% in the year ended December 31, 2020, primarily driven by the temporary shutdown of vehicle manufacturing facilities in key markets that began in the first quarter and continued for much of the second quarter.
Net income in the year ended December 31, 2020 decreased by $66 million, or 25%, driven by the sales decline outlined above. Profitability was impacted by lower sales and production volumes.
Life Sciences
The following table provides net sales and net income for the Life Sciences segment:
| | | | | | | | | | | | | | |
| | | | | | | | | | | | | | |
| | Year ended December 31, | | | % change | | % change |
| | 2020 | | 2019 | | | 2018 | | | 20 vs. 19 | | 19 vs. 18 |
Segment net sales | | $ | 998 | | $ | 1,015 | | $ | 946 | | | (2%) | | 7% |
Segment net income | | $ | 139 | | $ | 150 | | $ | 117 | | | (7%) | | 28% |
Net sales in the Life Sciences segment decreased by $17 million, primarily driven by lab closures during the first half of 2020 due to the COVID-19 pandemic.
Net income decreased by $11 million, or 7%, in the year ended December 31, 2020, primarily driven by sales and volume declines.
All Other
“All Other” is a group of segments primarily comprised of the results of pharmaceutical technologies, auto glass, new product lines and development projects, and other businesses or investments that do not meet the quantitative threshold for separate reporting.
The Company obtained a controlling interest in HSG during the third quarter of 2020 and has consolidated results in “All Other” as of September 9, 2020. Refer to Note 4 (HSG Transactions and Acquisitions) to the consolidated financial statements for additional information on this transaction.
The following table provides net sales and net loss for “All Other” (in millions):
| | | | | | | | | | | | | | |
| | | | | | | | | | | | | | |
| | Year ended December 31, | | | % change | | % change |
| | 2020 | | 2019 | | | 2018 | | | 20 vs. 19 | | 19 vs. 18 |
Segment net sales | | $ | 465 | | $ | 230 | | $ | 216 | | | 102% | | 6% |
Segment net loss | | $ | (214) | | $ | (289) | | $ | (281) | | | 26% | | (3%) |
Net sales of this segment increased by $235 million, or 102%, in the year ended December 31, 2020, when compared to the same period in 2019, driven primarily by consolidation of HSG on September 9, 2020, which added sales of $194 million in the current year.
The decrease in the net loss of $75 million is primarily driven by increased sales and lowered spending on development projects.
LIQUIDITY AND CAPITAL RESOURCES
Financing and Capital Structure
The following items discuss Corning’s financing and changes in capital structure during 2020 and 2019:
2020
During the fourth quarter of 2020, Corning redeemed $100 million of 7.0% debentures due in 2024 with a carrying amount of $99 million, paying a $21 million make-whole call premium. The total payment of $121 million is disclosed in financing activities in the consolidated statements of cash flows. The redemption resulted in a loss of $22 million.
In conjunction with the change in control of HSG on September 9, 2020, a variable interest rate loan of $175 million U.S. dollars (“USD”), maturing on September 8, 2021, was made to DC HSC Holdings, LLC, now a consolidated subsidiary of Corning. In December 2020, DC HSC Holdings, LLC repaid $100 million of the loan. The remaining balance of $75 million is reflected in the current portion of long-term debt and short-term borrowings in Corning’s consolidated balance sheets as of December 31, 2020. Refer to Note 4 (HSG Transactions and Acquisitions) to the consolidated financial statements for additional information.
During the second quarter of 2020, Corning established an incremental liquidity facility for 25 billion Japanese yen, approximately equivalent to $232 million with a maturity of three years. As of December 31, 2020, the facility has not been drawn upon.
In the first quarter of 2020, Corning established two unsecured variable rate loan facilities for 1,050 million Chinese yuan, equivalent to $150 million, and 749 million Chinese yuan, equivalent to $105 million, each with a maturity of five years. In the fourth quarter of 2020, Corning established a third unsecured variable rate loan facility for 546 million Chinese yuan, equivalent to $84 million, with a maturity of five years. Borrowings under these loan facilities for the year ended December 31, 2020, totaled 1,691 million Chinese yuan, or approximately $243 million. These Chinese yuan-denominated proceeds will not be converted into USD and will be used for capital projects. Payments of principal and interest on the Notes will be in Chinese yuan, or should yuan be unavailable due to circumstances beyond Corning’s control, a USD equivalent. These loans are the sole obligations of the subsidiary borrowers and are not guaranteed by any other Corning entity.
2019
In the fourth quarter of 2019, Corning issued two USD-denominated debt securities (the “Notes”), as follows:
$400 million 3.90% senior unsecured notes with a maturity of 30 years; and
$1.1 billion 5.45% senior unsecured notes with a maturity of 60 years.
The net proceeds, after deducting offering expenses, were approximately $1.5 billion and will be used for general corporate purposes. We can redeem these notes at any time, subject to certain terms and conditions.
In the fourth quarter of 2019, Corning redeemed $300 million of 4.25% notes due in 2020, paying a premium of $4.7 million by exercising our make-whole call. The bond redemption resulted in an $8.4 million loss during the same quarter.
In the third quarter of 2019, Corning issued two Japanese yen-denominated debt securities (the “Notes”), as follows:
¥31.3 billion 1.153% senior unsecured notes with a maturity of 12 years; and
¥5.9 billion 1.513% senior unsecured notes with a maturity of 20 years.
The proceeds from the Notes were received in Japanese yen and converted to USD on the date of issuance. The net proceeds received in USD, after deducting offering expenses, were approximately $349 million and will be used for general corporate purposes. Payments of principal and interest on the Notes will be in Japanese yen, or should yen be unavailable due to circumstances beyond Corning’s control, a USD equivalent.
Common Stock Dividends
On February 3, 2021, Corning’s Board of Directors declared a 9% increase in the Company’s quarterly common stock dividend, which increased the quarterly dividend from $0.22 to $0.24 per share of common stock, beginning with the dividend paid in the first quarter of 2021. This increase marks the tenth dividend increase since October 2011.
On February 5, 2020, Corning’s Board of Directors declared a 10% increase in the Company’s quarterly common stock dividend, which increased the quarterly dividend from $0.20 to $0.22 per share of common stock, beginning with the dividend paid in the first quarter of 2020.
On February 6, 2019, Corning’s Board of Directors declared an 11% increase in the Company’s quarterly common stock dividend, which increased the quarterly dividend from $0.18 to $0.20 per share of common stock, beginning with the dividend paid in the first quarter of 2019.
Fixed Rate Cumulative Convertible Preferred Stock, Series A
Corning has 2,300 outstanding shares of Fixed Rate Cumulative Convertible Preferred Stock, Series A. The preferred stock is convertible at the option of the holder, and by the Company upon certain events, at a conversion rate of 50,000 shares of Corning’s common stock per one share of preferred stock, subject to certain anti-dilution provisions. As of December 31, 2020, the preferred stock had not been converted, and none of the anti-dilution provisions had been triggered. On January 16, 2021, the preferred stock became convertible, in whole or in part, at the option of the holder.
Customer Deposits
As of December 31, 2020 and 2019, Corning had customer deposits of approximately $1.4 billion and $1.0 billion. The majority of these were non-refundable cash deposits for customers to secure rights to an amount of glass produced by Corning under long-term supply agreements. The duration of these long-term supply agreements ranges up to 10 years. As glass is shipped to customers, Corning will recognize revenue and reduce the amount of the customer deposit liability. The increase in the balance, when compared to the prior period, was primarily driven by a customer deposit liability of $264 million recorded at the fair value of refundable payments that HSG received from a customer under a long-term supply agreement.
In the years ended December 31, 2020 and 2019, customer deposits used were $140 million and $37 million, respectively. As of December 31, 2020 and 2019, $1,148 million and $927 million were recorded as other long-term liabilities, respectively. The remaining $211 million and $104 million, respectively, were classified as other current liabilities.
Deferred Revenue
During the third quarter of 2020, Corning obtained a controlling interest in HSG and recorded deferred revenue of $1,070 million at fair value related to the performance obligations of non-refundable consideration previously received by HSG from its customers under long term supply agreements.
The deferred revenue is tracked on a per-customer contract-unit basis. As customers take delivery of the committed volumes under the terms of the contract, a per unit amount of deferred revenue is recognized when control of the promised goods is transferred to the customer based upon the units shipped compared to the remaining contractual units.
As of December 31, 2020, $872 million was classified as a long-term liability and $152 million remaining was classified as a current liability. These balances reflect reductions in deferred revenue since September 9, 2020.
Capital Spending
Capital spending was approximately $1.4 billion in 2020, a decrease of $601 million when compared to 2019. We expect our 2021 capital expenditures to be approximately $1.4 billion.
Cash Flows
Summary of cash flow data (in millions):
| | | | | | | | |
| | | | | | | | |
| Year ended December 31, |
| 2020 | | 2019 | | 2018 |
Net cash provided by operating activities | $ | 2,180 | | $ | 2,031 | | $ | 2,919 |
Net cash used in investing activities | $ | (1,310) | | $ | (1,891) | | $ | (2,887) |
Net cash used in financing activities | $ | (729) | | $ | (47) | | $ | (1,995) |
Net cash provided by operating activities increased by $149 million in the year ended December 31, 2020, when compared to the same period in the prior year. The change was primarily driven by net favorable movements in working capital and the refund of tax assessments from the South Korean government, of $730 million and $101 million, respectively, partially offset by increased pension contributions, increased severance payments, lower dividends received from affiliated companies, and higher asbestos claim payments of $219 million, $119 million, $105 million and $80 million, respectively.
Net cash used in investing activities decreased by $581 million in the year ended December 31, 2020, when compared to the same period last year. The decrease was primarily driven by a reduction in capital expenditures.
Net cash used in financing activities increased by $682 million in the year ended December 31, 2020, when compared to the same period last year. The increase was primarily driven by lower proceeds from the issuance of long-term debt of $1,588 million, partially offset by a reduction in repurchases of treasury stock and debt repayments of $835 million and $79 million, respectively.
Defined Benefit Pension Plans
We have defined benefit pension plans covering certain domestic and international employees. Our largest single pension plan is Corning’s U.S. qualified plan. At December 31, 2020, this plan accounted for 77% of our consolidated defined benefit pension plans’ projected benefit obligation and 86% of the related plans’ assets.
In 2020, Corning made $180 million in voluntary contributions to our domestic defined benefit pension plan and cash contributions of $41 million to our international pension plans. During 2021, the Company anticipates making cash contributions of $31 million to the international pension plans.
Refer to Note 13 (Employee Retirement Plans) to the consolidated financial statements for additional information.
Key Balance Sheet Data
Balance sheet and working capital measures are provided in the following table (in millions):
| | | | | |
| | | | | |
| December 31, |
| 2020 | | 2019 |
Working capital | $ | 4,237 | | $ | 3,942 |
Current ratio | | 2.1:1 | | | 2.1:1 |
Trade accounts receivable, net of doubtful accounts | $ | 2,133 | | $ | 1,836 |
Days sales outstanding | | 57 | | | 59 |
Inventories | $ | 2,438 | | $ | 2,320 |
Inventory turns | | 3.2 | | | 3.3 |
Days payable outstanding (1) | | 44 | | | 48 |
Long-term debt | $ | 7,816 | | $ | 7,729 |
Total debt | $ | 7,972 | | $ | 7,740 |
Total debt to total capital | | 37% | | | 37% |
(1)Includes trade payables only.
Management Assessment of Liquidity
We ended the fourth quarter of 2020 with approximately $2.7 billion of cash and cash equivalents. Our cash and cash equivalents are held in various locations throughout the world and are generally unrestricted. We utilize a variety of strategies to ensure that our worldwide cash is available in the locations in which it is needed. At December 31, 2020, approximately 82% of the consolidated amount was held outside of the United States.
Corning also has a commercial paper program pursuant to which we may issue short-term, unsecured commercial paper notes up to a maximum aggregate principal amount outstanding at any one time of $1.5 billion. Under this program, the Company may issue the paper from time to time and will use the proceeds for general corporate purposes. The Company’s Revolving Credit Agreement is available to support obligations under the commercial paper program, if needed. At December 31, 2020, Corning did not have outstanding commercial paper.
The Company’s $1.5 billion Revolving Credit Agreement is available to support its commercial paper program and for general corporate purposes.
Share Repurchases
During the years ended December 31, 2020 and 2019, the Company repurchased 4.1 million and 31.0 million shares of common stock, respectively, on the open market for approximately $105 million and $925 million as part of its 2018 Repurchase Program. The Company suspended share buybacks during the first quarter of 2020 and made no share repurchases for the remainder of the year.
Refer to Note 17 (Shareholders’ Equity) to the consolidated financial statements for additional information.
Other
We complete comprehensive reviews of our significant customers and their creditworthiness by analyzing their financial strength at least annually or more frequently for customers where we have identified a measure of increased risk. We closely monitor payments and developments to identify potential customer credit issues. From time to time, we factor or sell accounts receivable. Sales of accounts receivable during 2020 were $402 million, which we believe would have been collected during the normal course of business this year. During 2019, Corning participated in customer-initiated payment programs which resulted in accelerated collections of $143 million in accounts receivable. We currently have not identified any potential material impact on our liquidity resulting from customer credit issues.
Our major source of funding for 2021 and beyond will be our operating cash flow, our existing balances of cash and cash equivalents and proceeds from any issuances of debt. We believe we have sufficient liquidity to fund operations, acquisitions, capital expenditures, scheduled debt repayments, dividend payments and share repurchase programs.
Our Revolving Credit Agreement includes affirmative and negative covenants with which we must comply, including a leverage (debt to capital ratio) financial covenant. The required leverage ratio is a maximum of 60%. At December 31, 2020, our leverage using this measure was approximately 37%. As of December 31, 2020, Corning was in compliance and no amounts were outstanding under the Company’s Revolving Credit Agreement.
Our debt instruments contain customary event of default provisions, which allow the lenders the option of accelerating all obligations upon the occurrence of certain events. In addition, some of our debt instruments contain a cross default provision, whereby an uncured default exceeding a specified amount on one debt obligation of the Company, also would be considered a default under the terms of another debt instrument. As of December 31, 2020, we were in compliance with all such provisions.
Management is not aware of any known trends or any known demands, commitments, events or uncertainties that will result in or that are reasonably likely to result in a material decrease in our liquidity. In addition, other than items discussed, there are no known material trends, favorable or unfavorable, in our capital resources and no expected material changes in the mix and relative cost of such resources.
Translated Earnings Contracts
Corning has hedged a significant portion of its projected yen exposure for the period 2020 through 2024, with average rate forwards and options. In the years ended December 31, 2020 and 2019, we recorded a pre-tax net loss of $38 million and a pre-tax net gain of $201 million, respectively, related to changes in the fair value of these instruments. Included in these amounts are realized losses of $31 million and $7 million, respectively. The gross notional value outstanding for these instruments which hedge our exposure to the Japanese yen at December 31, 2020 and 2019, was $6.5 billion and $10.2 billion, respectively.
We have entered into average rate forwards to hedge our translation exposure resulting from movements in the South Korean won and its impact on our net income. In the years ended December 31, 2020 and 2019, we recorded a pre-tax net gain of $24 million and $6 million, respectively, related to changes in the fair value of these instruments. Included in these amounts is a realized gain of $1 million and a realized loss of $1 million, respectively. These instruments had a gross notional value outstanding at December 31, 2020 and 2019, of $0.4 billion.
We have entered into a portfolio of average rate forwards to hedge against our euro translation exposure. In the years ended December 31, 2020 and 2019, we recorded pre-tax loss of $21 million and a pre-tax gain of $37 million, respectively. Included in these amounts are realized gains of $20 million and realized gain of $29 million, respectively. At December 31, 2020 and 2019, the euro-denominated average rate instruments had a gross notional amount of $0.5 billion and $1.3 billion, respectively.
These derivative instruments are not designated as accounting hedges, and changes in fair value are recorded in earnings in the translated earnings contract (loss) gain, net line of the consolidated statements of income.
Off Balance Sheet Arrangements
Off balance sheet arrangements are transactions, agreements, or other contractual arrangements with an unconsolidated entity for which Corning has an obligation to the entity that is not recorded in our consolidated financial statements.
Corning’s off balance sheet arrangements include guarantee and indemnity contracts. At the time a guarantee is issued, the Company is required to recognize a liability for the fair value or market value of the obligation it assumes. In the normal course of our business, we do not routinely provide significant third-party guarantees. Generally, third-party guarantees provided by Corning are limited to certain financial guarantees, including stand-by letters of credit and performance bonds, and the incurrence of contingent liabilities in the form of purchase price adjustments related to attainment of milestones. These guarantees have various terms, and none of these guarantees are individually significant.
Refer to Note 14 (Commitments, Contingencies and Guarantees) to the consolidated financial statements for additional information.
For variable interest entities, we assess the terms of our interest in each entity to determine if we are the primary beneficiary. The primary beneficiary of a variable interest entity is the party that absorbs a majority of the entity’s expected losses, receives a majority of its expected residual returns, or both, due to holding variable interests. Variable interests are the ownership, contractual, or other pecuniary interests in an entity, that change with changes in the fair value, of the entity’s net assets excluding variable interest entities.
Corning has identified nine entities that qualify as variable interest entities and are not consolidated. These entities are not considered to be significant to Corning’s consolidated financial statements.
Corning does not have retained interest in assets transferred to an unconsolidated entity that serve as credit, liquidity or market risk support to that entity.
ENVIRONMENT
Refer to Item 3. Legal Proceedings or Note 14 (Commitments, Contingencies and Guarantees) to the consolidated financial statements for information.
CRITICAL ACCOUNTING ESTIMATES
The preparation of financial statements requires us to make estimates and assumptions that affect amounts reported therein. The estimates that required us to make difficult, subjective or complex judgments, including future projections of performance and relevant discount rates, are set forth below.
Valuation of the Previously Held Equity Interest from the Consolidation of HSG
We account for the change in controlling interest using the acquisition method of accounting, which requires us to estimate the fair values of the assets and liabilities recorded. Assets recorded include intangible assets such as developed technologies and know-how, tradenames and customer-related intangibles, fixed assets and inventories. Liabilities recorded include contract liabilities such as customer deposits and deferred revenue, debt, and other liabilities. These assets and liabilities recorded are assessed at the time of the change in control and require judgment in ascertaining the fair values. In this business combination, achieved in stages, we also remeasure the previously held equity interest in HSG at the time of the change in control at fair value and recognize the resulting gain in earnings. Independent appraisals assisted the company in the determination of the fair value of certain assets and liabilities. Such appraisals are based on acceptable valuation models as well as inputs and assumptions provided by us. Additional information related to the fair value of the assets and liabilities recorded during the allocation period, not to exceed one year, may result in changes to the recorded values of assets and liabilities, resulting in an offsetting adjustment to the goodwill associated with the business combination. Changes in assumptions and estimates after completing the allocation of the purchase price to the assets and liabilities acquired, as well as differences in actual and estimated results could result in impacts to Corning’s financial results.
In September 2020, HSG redeemed DuPont’s entire ownership interest in HSG for $250 million. Upon completion of the Redemption, Corning recognized a pre-tax gain of $498 million on its previously held equity investment in HSG as a result of the consolidation resulting from the Redemption. The gain was calculated based on the difference between fair value and carrying value of the equity method investment immediately preceding the Redemption. The fair value of Corning’s equity interest in HSG was estimated by applying the income approach, which was based on significant assumptions such as projected revenue and discount rate. The company used a discount rate of 16.5% and terminal growth rate of zero.
Upon completion of the Redemption, we recognized intangible assets consisting primarily of $215 million of developed technologies and know-how, and $70 million of other intangibles that are amortized over the weighted average useful life of approximately 20 and 15 years, respectively. The developed technologies and know-how intangible assets were valued using two appropriate valuation methods. The developed technologies and know-how intangibles asset valued at $125 million utilized the relief from royalty method, which was based on significant inputs such as projected revenue and key assumptions, including a discount rate of 21.0% and a royalty rate of 7.0%. The developed technologies and know-how intangibles asset valued at $90 million utilized the multi-period excess earnings method under the income approach, which was based on significant inputs such as projected revenue and the key assumption of a discount rate of 19.0%.
Valuation of Deferred Revenue and Customer Deposits from the consolidation of HSG
Upon completion of the Redemption and resulting consolidation, we recorded a customer deposit liability and deferred revenue.
Corning recorded a customer deposit of $264 million, at the fair value, of refundable payments that HSG received from a customer under a long-term supply agreement. The discount rates used to calculate the present value of the customer deposit range from 2.54% to 3.23%. The deposits will be repaid from 2029 to 2034 provided that all purchase obligations of this customer under the supply agreement have been satisfied.
We recorded deferred revenue of $1,070 million at fair value related to the performance obligations of non-refundable consideration previously received by HSG from its customers under long term supply agreements. The fair values of deferred revenue were estimated by applying a bottoms-up cost buildup method of the cost approach based on significant inputs such as the cost to fulfill the obligations as well as key assumptions including a normal profit margin.
Refer to Note 3 (Investments) and Note 4 (HSG Transactions and Acquisitions) to the consolidated financial statements for more information.
Impairment of assets held for use
We are required to assess the recoverability of the carrying value of long-lived assets when an indicator of impairment has been identified. We review long-lived assets in each quarter in which impairment indicators are present. We must exercise judgment in assessing whether an event of impairment has occurred.
Manufacturing equipment includes certain components of production equipment that are constructed of precious metals, primarily platinum and rhodium. These metals are not depreciated because they have very low physical losses and are repeatedly reclaimed and reused in our manufacturing process over a very long useful life. Precious metals are reviewed for impairment as part of our assessment of long-lived assets. This review considers all the Company’s precious metals that are either in place in the production process; in reclamation, fabrication, or refinement in anticipation of re-use; or awaiting use to support increased capacity. Precious metals are only acquired to support our operations and are not held for trading or other non-manufacturing related purposes.
Examples of events or circumstances that may be indicative of impairments include, but are not limited to:
A significant decrease in the market price of an asset;
A significant change in the use of a long-lived or its physical condition;
A significant adverse change in legal factors or in the business climate that could affect the value of the asset, including an adverse action or assessment by a regulator;
An accumulation of costs significantly in excess of the amount originally expected for the acquisition or construction of an asset;
A current-period operating or cash flow loss combined with a history of operating or cash flow losses or a projection or forecast that demonstrates continuing losses associated with the use of an asset; and
A current expectation that, more likely than not, an asset will be sold or otherwise disposed of significantly before the end of its previously estimated useful life.
For purposes of recognition and measurement of an impairment loss, a long-lived asset or assets is grouped with other assets and liabilities at the lowest level for which identifiable cash flows are largely independent of the cash flows of other assets and liabilities. We must exercise judgment in assessing the lowest level for which identifiable cash flows are largely independent of the cash flows of other assets and liabilities. Our assessment is performed at the reportable segment level. For the majority of our reportable segments, we concluded that locations or businesses within these segments which share production along the supply chain must be combined to appropriately identify cash flows that are largely independent of the cash flows of other assets and liabilities.
For long-lived assets, when impairment indicators are present, we compare estimated undiscounted future cash flows, including the eventual disposition of the asset group at market value, to the assets’ carrying value to determine if the asset group is recoverable. This assessment requires the exercise of judgment in assessing the future use of and projected value to be derived from the assets to be held and used. Assessments also consider changes in asset utilization, including the temporary idling of capacity and the expected timing for placing this capacity back into production.
For an asset group that fails the test of recoverability, the estimated fair value of long-lived assets is determined using an “income approach” that starts with the forecast of all the expected future net cash flows including the eventual disposition at market value of long-lived assets, and considers the fair market value of all precious metals, if applicable. We assess the recoverability of the carrying value of long-lived assets at the lowest level for which identifiable cash flows are largely independent of the cash flows of other assets and liabilities. If there is an impairment, a loss is recorded to reflect the difference between the assets’ fair value and carrying value. Our estimates are based upon our historical experience, our commercial relationships, and available external information about future trends. We believe fair value assessments are most sensitive to market growth and the corresponding impact on volume and selling prices and that these are also more subjective than manufacturing cost and other assumptions. The Company believes its current assumptions and estimates are reasonable and appropriate.
At December 31, 2020 and 2019, the carrying value of precious metals was $3.4 billion and $3.3 billion, respectively, and significantly lower than the fair market value. Most of these precious metals are utilized by the Display Technologies and Specialty Materials segments. Corning believes these precious metal assets to be recoverable due to the significant positive cash flow in both segments. The potential for impairment exists in the future if negative events significantly decrease the cash flow of these segments. Such events include, but are not limited to, a significant decrease in demand for products or a significant decrease in profitability in our Display Technologies or Specialty Materials segments.
For the year ended December 31, 2020, Corning incurred a long-lived asset impairment and disposal loss for an asset group related to the reassessment and reprioritization of research and development programs within “All Other”. Given the economic environment and market opportunities, Corning discontinued its investment in these research and development programs. The impairment analysis and disposition of certain assets resulted in a total pre-tax charge of $217 million, which was substantially all the carrying value, inclusive of an insignificant amount of goodwill. The fair value of the asset group for the impairment analysis was measured using unobservable (Level 3) inputs.
Refer to Note 2 (Restructuring, Impairment and Other Charges and Credits) to the consolidated financial statements for additional information on restructuring activities and impairment.
Income taxes
We are required to exercise judgment about our future results in assessing the realizability of our deferred tax assets. Inherent in this estimation process is the requirement for us to estimate future book and taxable income and possible tax planning strategies. These estimates require us to exercise judgment about our future results, the prudence and feasibility of possible tax planning strategies, and the economic environments in which we do business. It is possible that actual results will differ from assumptions and require adjustments to allowances.
Corning accounts for uncertain tax positions in accordance with ASC Topic 740, Income Taxes, which requires that companies only record tax benefits for technical positions that are believed to have a greater than 50% likelihood of being sustained on their technical merits and then only to the extent of the amount of tax benefit that is greater than 50% likely of being realized upon settlement. In estimating these amounts, we must exercise judgment around factors such as the weighting of the tax law in our favor, the willingness of a tax authority to aggressively pursue an opposing position, or alternatively, consider a negotiated compromise, and our willingness to dispute a tax authorities’ assertion to the level of appeal we believe is required to sustain our position. As a result, it is possible that our estimate of the benefits we will realize for uncertain tax positions may change when we become aware of new information affecting these judgments and estimates.
Fair value measures
As required, Corning uses two kinds of inputs to determine the fair value of assets and liabilities: observable and unobservable. Observable inputs are based on market data or independent sources, while unobservable inputs are based on the Company’s own market assumptions. Once inputs have been characterized, we prioritize the inputs used to measure fair value into one of three broad levels. Characterization of fair value inputs is required for those accounting pronouncements that prescribe or permit fair value measurement. In addition, observable market data must be used when available and the highest-and-best-use measure should be applied to non-financial assets. Corning’s major categories of financial assets and liabilities required to be measured at fair value are short-term and long-term investments, certain pension asset investments and derivatives. These categories use observable inputs only and are measured using a market approach based on quoted prices in markets considered active or in markets in which there are few transactions.
Derivative assets and liabilities may include interest rate swaps and forward exchange contracts that are measured using observable quoted prices for similar assets and liabilities. Included in our forward exchange contracts are foreign currency hedges that hedge our cash flow and translation exposure resulting from movements in the Japanese yen, South Korean won, euro, new Taiwan dollar, Chinese yuan and British pound. Changes in the fair value of contracts designated as cash flow hedges are recorded in accumulated other comprehensive loss in shareholders’ equity and reclassified into income when the underlying hedged item impacts earnings. For contracts that are not designated as accounting hedges, changes in fair value are recorded in earnings in the translated earnings contract (loss) gain, net line of the consolidated statements of income. In arriving at the fair value of Corning’s derivative assets and liabilities, we have considered the appropriate valuation and risk criteria, including such factors as credit risk of the relevant party to the transaction. Amounts related to credit risk are not material.
Refer to Note 16 (Fair Value Measurements) to the consolidated financial statements for additional information.
Probability of litigation outcomes
Corning is required to make judgments about future events that are inherently uncertain. In making determinations of likely outcomes of litigation matters, we consider the evaluation of legal counsel knowledgeable about each matter, case law, and other case-specific issues. See Part II – Item 3. Legal Proceedings for a discussion of Corning’s material litigation matters.
Other possible liabilities
The Company is required to make judgments about future events that are inherently uncertain. In making determinations of likely outcomes of certain matters, including certain tax planning and environmental matters, these judgments require us to consider events and actions that are outside our control in determining whether probable or possible liabilities require accrual or disclosure. It is possible that actual results will differ from assumptions and require adjustments to accruals.
Pension and other postretirement employee benefits (OPEB)
Corning offers employee retirement plans consisting of defined benefit pension plans covering certain domestic and international employees and postretirement plans that provide health care and life insurance benefits for eligible retirees and dependents. The costs and obligations related to these benefits reflect the Company’s assumptions related to general economic conditions (particularly interest rates), expected return on plan assets, rate of compensation increase for employees and health care trend rates. The cost of providing plan benefits depends on demographic assumptions including retirements, mortality, turnover and plan participation. While management believes that the assumptions used are appropriate, differences in actual experience or changes in assumptions may affect Corning’s employee pension and other postretirement obligations, and current and future expense.
Costs for our defined benefit pension plans consist of two elements: 1) on-going costs recognized quarterly, which are comprised of service and interest costs, expected return on plan assets and amortization of prior service costs; and 2) mark-to-market gains and losses outside of the corridor, where the corridor is equal to 10% of the greater of the benefit obligation or the market-related value of plan assets at the beginning of the year, which are recognized annually in the fourth quarter of each year. These gains and losses result from changes in actuarial assumptions and the differences between actual and expected return on plan assets. Any interim remeasurement, such as curtailments, settlements, significant plan changes, or adjustments to the annual valuation, is recognized as a mark-to-market adjustment in the quarter in which such an event occurs.
Costs for OPEB plans consist of on-going costs recognized quarterly, and are comprised of service and interest costs, amortization of prior service costs and amortization of actuarial gains and losses. We recognize the actuarial gains and losses resulting from changes in actuarial assumptions as a component of accumulated other comprehensive loss in shareholders’ equity on an annual basis and amortize them into our operating results over the average remaining service period of employees expected to receive benefits under the plans, to the extent such gains and losses are outside of the corridor.
The following table presents our actual and expected return on assets, as well as the corresponding percentages:
| | | | | | | | |
| | | | | | | | |
| December 31, |
(In millions) | 2020 | | 2019 | | 2018 |
Actual return on plan assets – Domestic plans | $ | 420 | | $ | 576 | | $ | (202) |
Expected return on plan assets – Domestic plans | | 186 | | | 161 | | | 178 |
Actual return on plan assets – International plans | | 49 | | | 39 | | | 1 |
Expected return on plan assets – International plans | | 9 | | | 10 | | | 11 |
| | | | | | | | |
Weighted-average actual and expected return on assets: | | | | | | | | |
Actual return on plan assets – Domestic plans | | 13.90% | | | 21.89% | | | (6.83)% |
Expected return on plan assets – Domestic plans | | 6.00% | | | 6.00% | | | 6.00% |
Actual return on plan assets – International plans | | 10.00% | | | 7.99% | | | (0.06)% |
Expected return on plan assets – International plans | | 1.71% | | | 2.01% | | | 2.13% |
As of December 31, 2020, the Projected Benefit Obligation (PBO) for U.S. pension plans was $4.2 billion.
The following information illustrates the sensitivity to a change in certain assumptions for U.S. pension plans:
| | | |
| | | |
Change in assumption | Effect on 2021
pre-tax pension
expense | | Effect on
December 31, 2020
PBO |
25 basis point decrease in each spot rate | - 3 million | | + 122 million |
25 basis point increase in each spot rate | + 3 million | | - 116 million |
25 basis point decrease in expected return on assets | + 9 million | | |
25 basis point increase in expected return on assets | - 9 million | | |
The above sensitivities reflect the impact of changing one assumption at a time. Note that economic factors and conditions often affect multiple assumptions simultaneously and the effects of changes in key assumptions are not necessarily linear. These changes in assumptions would have no effect on Corning’s funding requirements.
In addition, at December 31, 2020, a 25 basis point decrease in each spot rate would decrease shareholders’ equity by $148 million before tax, and a 25 basis point increase in each spot rate would increase shareholders’ equity by $140 million. In addition, the impact of greater than a 25 basis point decrease in each spot rate would not be proportional to the first 25 basis point decrease in each spot rate.
The following table illustrates the sensitivity to a change in each spot rate assumption related to Corning’s U.S. OPEB plans:
| | | |
| | | |
Change in assumption | Effect on 2021
pre-tax OPEB
expense | | Effect on
December 31, 2020
APBO* |
25 basis point decrease in each spot rate | - 0 million | | + 26 million |
25 basis point increase in each spot rate | + 0 million | | - 24 million |
* Accumulated Postretirement Benefit Obligation (APBO).
The above sensitivities reflect the impact of changing one assumption at a time. Note that economic factors and conditions often affect multiple assumptions simultaneously and the effects of changes in key assumptions are not necessarily linear.
Revenue recognition
The Company recognizes revenue when all performance obligations under the terms of a contract with our customer are satisfied, and control of the product has been transferred to the customer. If customer acceptance clauses are present and it cannot be objectively determined that control has been transferred, revenue is only recorded when customer acceptance is received and all performance obligations have been satisfied. Sales of goods typically do not include multiple product and/or service elements. Corning also has contractual arrangements with certain customers in which we recognize revenue over time. The performance obligations under these contracts generally require services to be performed over time, resulting in either a straight-line amortization method or an input method using incurred and forecasted expense to predict revenue recognition patterns which follows satisfaction of the performance obligation.
NEW ACCOUNTING STANDARDS
Refer to Note 1 (Summary of Significant Accounting Policies) to the consolidated financial statements.
FORWARD-LOOKING STATEMENTS
The statements in this Annual Report on Form 10-K, in reports subsequently filed by Corning with the Securities and Exchange Commission (SEC) on Form 10-Q and Form 8-K, and related comments by management that are not historical facts or information and contain words such as “will,” “believe,” “anticipate,” “expect,” “intend,” “plan,” “seek,” “see,” “would,” and “target” and similar expressions are forward-looking statements. Such statements relate to future events that by their nature address matters that are, to different degrees, uncertain. These forward-looking statements relate to, among other things, the Company’s future operating performance, the Company’s share of new and existing markets, the Company’s revenue and earnings growth rates, the Company’s ability to innovate and commercialize new products, and the Company’s implementation of cost-reduction initiatives and measures to improve pricing, including the optimization of the Company’s manufacturing capacity.
Although the Company believes that these forward-looking statements are based upon reasonable assumptions regarding, among other things, current estimates and forecasts, general economic conditions, its knowledge of its business, and key performance indicators that impact the Company, actual results could differ materially. The Company does not undertake to update forward-looking statements. Some of the risks, uncertainties and other factors that could cause actual results to differ materially from those expressed in or implied by the forward-looking statements include, but are not limited to:
the duration and severity of the recent COVID-19 pandemic, and its ultimate impact across our businesses on demand, operations and our global supply chains;
the effects of acquisitions, dispositions and other similar transactions;
global business, financial, economic and political conditions;
tariffs and import duties;
currency fluctuations between the U.S. dollar and other currencies, primarily the Japanese yen, new Taiwan dollar, euro, Chinese yuan and South Korean won;
product demand and industry capacity;
competitive products and pricing;
availability and costs of critical components and materials;
new product development and commercialization;
order activity and demand from major customers;
the amount and timing of our cash flows and earnings and other conditions, which may affect our ability to pay our quarterly dividend at the planned level or to repurchase shares at planned levels;
possible disruption in commercial activities due to terrorist activity, cyber-attack, armed conflict, political or financial instability, natural disasters, or major health concerns;
loss of intellectual property due to theft, cyber-attack, or disruption to our information technology infrastructure;
unanticipated disruption to equipment, facilities, IT systems or operations;
effect of regulatory and legal developments;
ability to pace capital spending to anticipated levels of customer demand;
rate of technology change;
ability to enforce patents and protect intellectual property and trade secrets;
adverse litigation;
product and components performance issues;
retention of key personnel;
customer ability, most notably in the Display Technologies segment, to maintain profitable operations and obtain financing to fund ongoing operations and manufacturing expansions and pay receivables when due;
loss of significant customers;
changes in tax laws and regulations including the 2017 Tax Act;
the impacts of audits by taxing authorities;
the potential impact of legislation, government regulations, and other government action and investigations; and
other risks detailed in Corning’s SEC filings.
Item 7A. Quantitative and Qualitative Disclosures About Market Risks
We operate and conduct business in many foreign countries and as a result are exposed to movements in foreign currency exchange rates. Our exposure to exchange rates has the following effects:
Exchange rate movements on financial instruments and transactions denominated in foreign currencies that impact earnings; and
Exchange rate movements upon conversion of net assets and net income of foreign subsidiaries for which the functional currency is not the U.S. dollar.
Our most significant foreign currency exposure relates to the Japanese yen, South Korean won, new Taiwan dollar, Chinese yuan, and the euro. We seek to mitigate the impact of exchange rate movements in our income statement by using over-the-counter (OTC) derivative instruments including foreign exchange forward and option contracts. In general, these hedges expire coincident with the timing of the underlying foreign currency commitments and transactions.
We are exposed to potential losses in the event of non-performance by our counterparties to these derivative contracts. However, we minimize this risk by maintaining a diverse group of highly-rated major financial institutions as our counterparties. We do not expect to record any losses as a result of such counterparty default. Neither we nor our counterparties are required to post collateral for these financial instruments.
Our cash flow hedging activities utilize OTC foreign exchange forward contracts to reduce the risk that movements in exchange rates will adversely affect the net cash flows resulting from the sale of products to foreign customers and purchases from foreign suppliers. In our net investment hedging activity, we use OTC foreign exchange forward contracts to hedge a portion of our net investment in certain foreign operations against movements in exchange rates. We also use OTC foreign exchange forward and option contracts that are not designated as hedged instruments. These contracts are used to offset economic currency risks. The undesignated hedges limit exposure to foreign functional currency fluctuations related to certain subsidiaries’ monetary assets, monetary liabilities and net earnings in foreign currencies. A significant portion of the Company’s non-U.S. revenue are denominated in Japanese yen. When this revenue is translated back to U.S. dollars, the Company is exposed to foreign exchange rate movements in the Japanese yen. To protect translated earnings against movements in the Japanese yen, the Company has entered into a series of average rate forwards and other derivative instruments.
We use a sensitivity analysis to assess the market risk associated with foreign currency exposure. Market risk is defined as the potential change in fair value of assets and liabilities resulting from an adverse movement in foreign currency exchange rates. At December 31, 2020, with respect to open foreign exchange forward and option contracts, and foreign denominated debt with values exposed to exchange rate movements, a 10% adverse movement in quoted foreign currency exchange rates could result in a loss in fair value of these instruments of $1.0 billion compared to $1.3 billion at December 31, 2019. Specific to the Japanese yen, a 10% adverse movement in quoted yen exchange rates could result in a loss in fair value of these instruments of $0.8 billion and $1.0 billion at December 31, 2020 and 2019, respectively. The Company expects that these hypothetical losses from a 10% adverse movement in quoted foreign currency exchange rates on the derivative financial instruments should largely offset gains on the assets, liabilities and future transactions being hedged.
Item 8. Financial Statements and Supplementary Data
See Item 15 (a) 1.
Item 9. Changes in and Disagreements with Accountants on Accounting and Financial Disclosure
None.
Item 9A. Controls and Procedures
Disclosure Controls and Procedures
The Company’s principal executive and principal financial officers, after evaluating the effectiveness of disclosure controls and procedures (as defined in the Securities Exchange Act of 1934 (Exchange Act) Rules 13a-15(e) or 15d-15(e) as of the end of the period covered by this report, have concluded that based on the evaluation of these controls and procedures required by paragraph (b) of Exchange Act Rules 13a-15 or 15d-15, that Corning’s disclosure controls and procedures were effective.
Disclosure controls and procedures mean controls and other procedures of an issuer that are designed to ensure that information required to be disclosed by the issuer in the reports that it files or submits under the Exchange Act is recorded, processed, summarized, and reported, within the time periods specified in the SEC’s rules and forms. Corning’s disclosure controls and procedures include, without limitation, controls and procedures designed to ensure that information required to be disclosed by Corning in the reports that it files or submits under the Exchange Act is accumulated and communicated to Corning’s management, including Corning’s principal executive and principal financial officers, or other persons performing similar functions, as appropriate to allow timely decisions regarding required disclosure.
Internal Control Over Financial Reporting
(a)Management’s Annual Report on Internal Control Over Financial Reporting
Management is responsible for establishing and maintaining adequate internal control over financial reporting for Corning.
Corning’s internal control over financial reporting is a process designed to provide reasonable assurance regarding the reliability of financial reporting and the preparation of financial statements for external purposes in accordance with accounting principles generally accepted in the United States of America. Corning’s internal control over financial reporting includes those policies and procedures that (i) pertain to the maintenance of records that, in reasonable detail, accurately and fairly reflect the transactions and dispositions of Corning’s assets; (ii) provide reasonable assurance that transactions are recorded as necessary to permit preparation of financial statements in accordance with accounting principles generally accepted in the United States of America, and that Corning’s receipts and expenditures are being made only in accordance with authorizations of Corning’s management and directors; and (iii) provide reasonable assurance regarding prevention or timely detection of unauthorized acquisition, use, or disposition of Corning’s assets that could have a material effect on the financial statements. Because of its inherent limitations, internal control over financial reporting may not prevent or detect misstatements. Also, projections of any evaluation of effectiveness to future periods are subject to the risk that controls may become inadequate because of changes in conditions, or that the degree of compliance with the policies and procedures may deteriorate.
Management conducted an evaluation of the effectiveness of the Company’s internal control over financial reporting based on the framework in Internal Control – Integrated Framework (2013) issued by the Committee of Sponsoring Organizations of the Treadway Commission.
Management excluded HSG from its assessment of the effectiveness of the Company’s internal control over financial reporting as of December 31, 2020, as it was previously an equity method investee that is now consolidated by the Company due to a change in control during 2020. HSG’s internal control over financial reporting is associated with approximately 4% of total assets and 2% of net sales included in the consolidated financial statements of the Company and its subsidiaries as of and for the year ended December 31, 2020.
Based on this evaluation, management concluded that the Company’s internal control over financial reporting was effective as of December 31, 2020. The effectiveness of the Company’s internal control over financial reporting as of December 31, 2020 has been audited by PricewaterhouseCoopers LLP, an independent registered public accounting firm, as stated in their report and is included herein.
(b)Changes in Internal Control Over Financial Reporting
There were no changes in the Company’s internal control over financial reporting identified by the evaluation required by paragraph (d) of Exchange Act Rules 13a-15 or 15d-15 that occurred during the last fiscal year that have materially affected, or are reasonably likely to materially affect, internal control over financial reporting.
Item 9B. Other Information
None.
PART III
Item 10. Directors, Executive Officers and Corporate Governance
The sections entitled “Proposal 1 Election of Directors,” and “Corporate Governance and the Board of Directors-Committees” in our Definitive Proxy Statement relating to our Annual Meeting of Shareholders to be held on April 29, 2021, are incorporated by reference in this Annual Report on Form 10-K.
Code of Ethics
Our Board of Directors adopted (i) the Code of Ethics for the Chief Executive Officer and Financial Executives (Code of Ethics) and (ii) the Code of Conduct for Directors and Executive Officers, which supplement our Code of Conduct that governs all employees and directors. These Codes have been in existence for more than ten years. The Code of Ethics applies to our Chief Executive Officer, Chief Financial Officer, Controller and other financial executives. During 2020, no amendments to or waivers of the provisions of the Code of Ethics were made with respect to any of our directors or executive officers. A copy of the Code of Ethics is available on our website at http://www.corning.com/worldwide/en/about-us/investor-relations/codes-of-conduct-ethics.html. We will also provide a copy of the Code of Ethics to shareholders without charge upon written request to Corporate Secretary, Corning Incorporated, Corning, NY 14831. We will disclose future amendments to, or waivers from, the Code of Ethics on our website within four business days following the date of such amendment or waiver.
Item 11. Executive Compensation
The sections entitled “Compensation Discussion and Analysis” and “Director Compensation” in our Definitive Proxy Statement relating to the Annual Meeting of Shareholders to be held on April 29, 2021, are incorporated by reference in this Annual Report on Form 10-K.
Item 12. Security Ownership of Certain Beneficial Owners and Management and Related Stockholder Matters
The section entitled “Beneficial Ownership Table” in our Definitive Proxy Statement relating to the Annual Meeting of Shareholders to be held on April 29, 2021, are incorporated by reference in this Annual Report on Form 10-K.
Equity Compensation Plan Information
The following table shows the total number of outstanding stock options and shares available for other future issuances of options under existing equity compensation plans as of December 31, 2020, including the 2019 Equity Plan for Non-Employee Directors and 2012 Long-Term Incentive Plan:
| | | | | | |
| | | | | | |
| A | | | B | | C |
| Number of
securities to
be issued
upon exercise
of outstanding
options, warrants
and rights | | Weighted-average
exercise price
of outstanding
options, warrants
and rights | | Number of securities
remaining available
for future issuance
under equity
compensation plans
(excluding securities
reflected in
column A) |
Equity compensation plans approved by security
holders (1) | 32,800,570 | | $ | 12.94 | | 35,909,926 |
Equity compensation plans not approved by
security holders | | | | | | |
Total | 32,800,570 | | $ | 12.94 | | 35,909,926 |
(1)Shares indicated are total grants under the most recent shareholder approved plans.
Item 13. Certain Relationships and Related Transactions and Director Independence
The sections entitled “Policy on Transactions with Related Persons”, “Director Independence” and “Corporate Governance and the Board of Directors-Committees” in our Definitive Proxy Statement relating to the Annual Meeting of Shareholders to be held on April 29, 2021, are incorporated by reference in this Annual Report on Form 10-K.
Item 14. Principal Accounting Fees and Services
The sections entitled “Fees Paid to Independent Registered Public Accounting Firm” and “Policy Regarding Audit Committee Pre-Approval of Audit and Permitted Non-Audit Services of Independent Registered Public Accounting Firm” in our Definitive Proxy Statement relating to the Annual Meeting of Shareholders to be held on April 29, 2021, are incorporated by reference in this Annual Report on Form 10-K.
In April 2020, PricewaterhouseCoopers LLP (PwC) issued its annual Public Company Accounting Oversight Board Rule 3526 independence letter to the Audit Committee of our Board of Directors and therein reported that it is independent under applicable standards in connection with its audit opinion for the financial statements contained in this report. The Audit Committee has discussed with PwC its independence from Corning and concurred with PwC.
PART IV
Item 15. Exhibits, Financial Statement Schedule
| | |
| | |
| 2.1 | Framework Agreement, dated as of October 22, 2013, by and among Samsung Display Co., Ltd.; Corning Incorporated and the other parties thereto. (Incorporated by reference to Exhibit 10.65 to Corning’s Form 10-K filed on February 10, 2014, as amended by its Form 10-K/A filed on March 21, 2014). The Company has omitted certain schedules, exhibits and similar attachments to the Framework Agreement pursuant to Item 601(b)(2) of Regulation S-K. |
| | |
| 2.2 | Transaction Agreement, dated December 10, 2015, by and between Corning Incorporated, The Dow Chemical Company, Dow Corning Corporation and HS Upstate Inc. (Incorporated by reference to Exhibit 1.1 of Corning’s Form 8-K filed on December 11, 2015). |
| | |
| 2.3 | Assignment Agreement, dated as of December 29, 2015, between Samsung Display Co., Ltd., Corning Incorporated, Corning Precision Materials Co., Ltd., and Corning Luxembourg S.àr.l., Corning Hungary Data Services Limited Liability Company, Corning Japan K.K., and Samsung Corning Advanced Glass LLC (Incorporated by reference to Exhibit 2.1 of Corning’s Form 8-K filed on December 29, 2015). |
| | |
| 3 (i) | Restated Certificate of Incorporation dated April 27, 2012, filed with the Secretary of State of the State of New York on April 27, 2012 (Incorporated by reference to Exhibit 3(i) 1 of Corning’s Form 8-K filed on May 1, 2012). |
| | |
| 3 (i)(1) | Certificate of Amendment to the Restated Certificate of Incorporation dated January 14, 2014, filed with the Secretary of State of the State of New York on January 14, 2014 (Incorporated by reference to Exhibit 3.1 of Corning’s Form 8-K filed on January 15, 2014). |
| | |
| 3 (ii) | Amended and Restated By-Laws of Corning Incorporated, effective as of February 3, 2021 (Incorporated by reference to Exhibit 3.1 of Corning’s Form 8-K filed February 4, 2021). |
| | |
| 4.1 | Indenture, dated November 8, 2000, by and between the Company and of The Bank of New York Mellon Trust Company, N.A. (successor to J. P. Morgan Chase & Co., formerly The Chase Manhattan Bank), as trustee (Incorporated by reference to Exhibit 4.01 to Corning’s Registration Statement on Form S-3, Registration Statement No. 333-251135). The Company agrees to furnish to the Commission on request copies of other instruments with respect to long-term debt. |
| | |
| 4.2 | Form of certificate for shares of the common stock (Incorporated by reference to Exhibit 4.4 to Corning’s registration statement on Form S-8 dated May 7, 2010 (Registration Statement No. 333-166642)). The terms of the Company’s Fixed Rate Cumulative Convertible Preferred Stock, Series A are reflected in the Certificate of Amendment to the Restated Certificate of Incorporation dated January 14, 2014, filed with the Secretary of State of the State of New York on January 14, 2014 and included as Exhibit 3(i)(1) hereto. |
| | |
| 4.3 | Shareholder Agreement, dated as of October 22, 2013, by and between Samsung Display Co., Ltd. and Corning Incorporated (Incorporated by reference to Exhibit 10.66 to Corning’s Form 10-K filed on February 10, 2014, as amended by its Form 10-K/A filed on March 21, 2014). |
| | |
| | |
| 4.4 | Standstill Agreement, dated as of October 22, 2013, by and among Samsung Electronics Co., Ltd., Samsung Display Co., Ltd. and Corning Incorporated (Incorporated by reference to Exhibit 10.67 to Corning’s Form 10-K filed on February 10, 2014, as amended by its Form 10-K/A filed on March 21, 2014). |
| | |
| 4.5 | Description of the Registrant’s Securities Registered Pursuant to Section 12 of the Securities Exchange Act of 1934. |
| | |
| 10.1 | 2000 Employee Equity Participation Program and 2003 Amendments (Incorporated by reference to Exhibit 1 of Corning Proxy Statement, Definitive 14A filed March 10, 2003 for April 24, 2003 Annual Meeting of Shareholders). |
| | |
| 10.2 | 2003 Variable Compensation Plan (Incorporated by reference to Exhibit 2 of Corning Proxy Statement, Definitive 14A filed March 10, 2003 for April 24, 2003 Annual Meeting of Shareholders). |
| | |
| 10.3 | 2003 Equity Plan for Non-Employee Directors (Incorporated by reference to Exhibit 3 of Corning Proxy Statement, Definitive 14A filed March 10, 2003 for April 24, 2003 Annual Meeting of Shareholders). |
| | |
| 10.4 | Form of Officer Severance Agreement dated as of February 1, 2004 between Corning Incorporated and each of the following individuals: James P. Clappin, Lawrence D. McRae and Eric S. Musser (Incorporated by reference to Exhibit 10.1 of Corning’s Form 10-Q filed May 4, 2004). |
| | |
| 10.5 | Form of Amendment dated as of February 1, 2004 to Change In Control Agreement dated as of October 4, 2000 between Corning Incorporated and the following individuals: James P. Clappin and Lawrence D. McRae (Incorporated by reference to Exhibit 10.4 of Corning’s Form 10-Q filed May 4, 2004). |
| | |
| 10.6 | Form of Change In Control Amendment dated as of October 4, 2000 between Corning Incorporated and the following individuals: James P. Clappin and Lawrence D. McRae (Incorporated by reference to Exhibit 10.5 of Corning’s Form 10-Q filed May 4, 2004). |
| | |
| 10.7 | Amendment dated as of February 1, 2004 to Change In Control Agreement dated as of April 23, 2002 between Corning Incorporated and Wendell P. Weeks (Incorporated by reference to Exhibit 10.8 of Corning’s Form 10-Q filed May 4, 2004). |
| | |
| 10.8 | Change In Control Agreement dated as of April 23, 2002 between Corning Incorporated and Wendell P. Weeks (Incorporated by reference to Exhibit 10.9 of Corning’s Form 10-Q filed May 4, 2004). |
| | |
| 10.9 | Form of Corning Incorporated Incentive Stock Plan Agreement for Restricted Stock Grants (Incorporated by reference to Exhibit 10.1 of Corning’s Form 10-Q filed October 28, 2004). |
| | |
| 10.10 | Form of Corning Incorporated Incentive Stock Plan Agreement for Restricted Stock Retention Grants (Incorporated by reference to Exhibit 10.2 of Corning’s Form 10-Q filed October 28, 2004). |
| | |
| 10.11 | Form of Corning Incorporated Incentive Stock Option Agreement (Incorporated by reference to Exhibit 10.3 of Corning’s Form 10-Q filed October 28, 2004). |
| | |
| 10.12 | Form of Corning Incorporated Non-Qualified Stock Option Agreement (Incorporated by reference to Exhibit 10.4 of Corning’s Form 10-Q filed October 28, 2004). |
| | |
| 10.13 | 2005 Employee Equity Participation Program (Incorporated by reference to Exhibit I of Corning Proxy Statement, Definitive 14A filed March 1, 2005 for April 28, 2005 Annual Meeting of Shareholders). |
| | |
| 10.14 | 2006 Variable Compensation Plan (Incorporated by reference to Appendix J of Corning Proxy Statement, Definitive 14A filed March 8, 2006 for April 27, 2006 Annual Meeting of Shareholders). |
| | |
| 10.15 | Amended 2003 Equity Plan for Non-Employee Directors (Incorporated by reference to Appendix K of Corning Proxy Statement, Definitive 14A filed March 8, 2006 for April 27, 2006 Annual Meeting of Shareholders). |
| | |
| 10.16 | Amended Corning Incorporated 2003 Equity Plan for Non-Employee Directors effective October 4, 2006 (Incorporated by reference to Exhibit 10.28 of Corning’s Form 10-K filed February 27, 2007). |
| | |
| 10.17 | Amended Corning Incorporated 2005 Employee Equity Participation Program effective October 4, 2006 (Incorporated by reference to Exhibit 10.29 of Corning’s Form 10-K filed February 27, 2007). |
| | |
| 10.18 | Form of Corning Incorporated Incentive Stock Plan Agreement for Restricted Stock Grants, amended effective December 6, 2006 (Incorporated by reference to Exhibit 10.30 of Corning’s Form 10-K filed February 27, 2007). |
| | |
| 10.19 | Executive Supplemental Pension Plan effective February 7, 2007 and signed February 12, 2007 (Incorporated by reference to Exhibit 10.31 of Corning’s Form 10-K filed February 27, 2007). |
| | |
| | |
| 10.20 | Executive Supplemental Pension Plan as restated and signed April 10, 2007 (Incorporated by reference to Exhibit 10 of Corning’s Form 10-Q filed April 27, 2007). |
| | |
| 10.21 | Amendment No. 1 to 2006 Variable Compensation Plan dated October 3, 2007 (Incorporated by reference to Exhibit 10.34 of Corning’s Form 10-K filed February 15, 2008). |
| | |
| 10.22 | Corning Incorporated Goalsharing Plan dated October 3, 2007 (Incorporated by reference to Exhibit 10.35 of Corning’s Form 10-K filed February 15, 2008). |
| | |
| 10.23 | Corning Incorporated Performance Incentive Plan dated October 3, 2007 (Incorporated by reference to Exhibit 10.36 of Corning’s Form 10-K filed February 15, 2008). |
| | |
| 10.24 | Amendment No. 1 to Deferred Compensation Plan for Directors dated October 3, 2007 (Incorporated by reference to Exhibit 10.37 of Corning’s Form 10-K filed February 15, 2008). |
| | |
| 10.25 | Corning Incorporated Supplemental Pension Plan dated October 3, 2007 (Incorporated by reference to Exhibit 10.38 of Corning’s Form 10-K filed February 15, 2008). |
| | |
| 10.26 | Corning Incorporated Supplemental Investment Plan dated October 3, 2007 (Incorporated by reference to Exhibit 10.39 of Corning’s Form 10-K filed February 15, 2008). |
| | |
| 10.27 | Form of Corning Incorporated Incentive Stock Plan Agreement for Restricted Stock Grants, amended effective December 5, 2007 (Incorporated by reference to Exhibit 10.40 of Corning’s Form 10-K filed February 15, 2008). |
| | |
| 10.28 | Form of Corning Incorporated Non-Qualified Stock Option Agreement, amended effective December 5, 2007 (Incorporated by reference to Exhibit 10.41 of Corning’s Form 10-K filed February 15, 2008). |
| | |
| 10.29 | Amendment No. 2 dated February 13, 2008 and Amendment dated as of February 1, 2004 to Letter of Understanding between Corning Incorporated and Wendell P. Weeks, and Letter of Understanding dated April 23, 2002 between Corning Incorporated and Wendell P. Weeks (Incorporated by reference to Exhibit 10.42 of Corning’s Form 10-K filed February 15, 2008). |
| | |
| 10.30 | Form of Change in Control Agreement Amendment No. 2, effective December 5, 2007 (Incorporated by reference to Exhibit 10.43 of Corning’s Form 10-K filed February 15, 2008). |
| | |
| 10.31 | Form of Officer Severance Agreement Amendment, effective December 5, 2007 (Incorporated by reference to Exhibit 10.44 of Corning’s Form 10-K filed February 15, 2008). |
| | |
| 10.32 | Amendment No. 1 to Corning Incorporated Supplemental Investment Plan, approved December 17, 2007 (Incorporated by reference to Exhibit 10.45 of Corning’s Form 10-K filed February 15, 2008). |
| | |
| 10.33 | Amendment No. 1 to Corning Incorporated Supplemental Pension Plan, approved December 17, 2007 (Incorporated by reference to Exhibit 10.46 of Corning’s Form 10-K filed February 15, 2008). |
| | |
| | |
| 10.34 | Amendment No. 1 to Corning Incorporated Executive Supplemental Pension Plan, approved December 17, 2007 (Incorporated by reference to Exhibit 10.47 of Corning’s Form 10-K filed February 15, 2008). |
| | |
| 10.35 | Second Amended 2005 Employee Equity Participation Program (Incorporated by reference to Exhibit 10 of Corning’s Form 8-K filed April 25, 2008). |
| | |
| 10.36 | Amendment No. 2 to Executive Supplemental Pension Plan effective July 16, 2008 (Incorporated by reference to Exhibit 10 of Corning’s Form 10-Q filed July 30, 2008). |
| | |
| 10.37 | Form of Corning Incorporated Non-Qualified Stock Option Agreement effective as of December 3, 2008 (Incorporated by reference to Exhibit 10.50 of Corning’s Form 10-K filed February 24, 2009). |
| | |
| 10.38 | Form of Corning Incorporated Incentive Stock Right Agreement effective as of December 3, 2008 (Incorporated by reference to Exhibit 10.51 of Corning’s Form 10-K filed February 24, 2009). |
| | |
| 10.39 | Form of Corning Incorporated Incentive Stock Plan Agreement for Restricted Stock Grants effective December 3, 2008 (Incorporated by reference to Exhibit 10.52 of Corning’s Form 10-K filed February 24, 2009). |
| | |
| 10.40 | Form of Change of Control Agreement Amendment No. 3 effective December 19, 2008 (Incorporated by reference to Exhibit 10.53 of Corning’s Form 10-K filed February 24, 2009). |
| | |
| 10.41 | Form of Officer Severance Agreement Amendment No. 2 effective December 19, 2008 (Incorporated by reference to Exhibit 10.54 of Corning’s Form 10-K filed February 24, 2009). |
| | |
| 10.42 | Amendment No. 3 dated December 19, 2008 to Letter of Understanding dated April 23, 2002 between Corning Incorporated and Wendell P. Weeks (Incorporated by reference to Exhibit 10.55 of Corning’s Form 10-K filed February 24, 2009). |
| | |
| 10.43 | Amendment No. 2 to Corning Incorporated Supplemental Investment Plan approved April 29, 2009 (Incorporated by reference to Exhibit 10.1 of Corning’s Form 10-Q filed July 29, 2009). |
| | |
| 10.44 | Amendment No. 2 to Deferred Compensation Plan dated April 29, 2009 (Incorporated by reference to Exhibit 10.2 of Corning’s Form 10-Q filed July 29, 2009). |
| | |
| 10.45 | Amendment No. 2 to 2006 Variable Compensation Plan dated December 2, 2009 (Incorporated by reference to Exhibit 10.58 of Corning’s Form 10-K filed February 10, 2010). |
| | |
| 10.46 | Form of Corning Incorporated Cash Performance Unit Agreement, effective December 2, 2009 (Incorporated by reference to Exhibit 10.59 of Corning’s Form 10-K filed February 10, 2010). |
| | |
| 10.47 | Form of Corning Incorporated Incentive Stock Right Agreement for Time-Based Restricted Stock Units, effective December 2, 2009 (Incorporated by reference to Exhibit 10.60 of Corning’s Form 10-K filed February 10, 2010). |
| | |
| 10.48 | 2010 Variable Compensation Plan (Incorporated by reference to Appendix A of Corning’s Proxy Statement, Definitive 14A filed March 15, 2010 for April 29, 2010 Annual Meeting of Shareholders). |
| | |
| 10.49 | 2010 Equity Plan for Non-Employee Directors (Incorporated by reference to Appendix B of Corning Proxy Statement, Definitive 14A filed March 15, 2010 for April 29, 2010 Annual Meeting of Shareholders). |
| | |
| 10.50 | Amendment No. 2 to Corning Incorporated Supplemental Pension Plan dated December 18, 2008 (Incorporated by reference to Exhibit 10.66 of Corning’s Form 10-K filed February 10, 2011). |
| | |
| 10.51 | Form of Corning Incorporated Incentive Stock Right Agreement for Time-Based Incentive Stock Rights, effective January 3, 2011 (Incorporated by reference to Exhibit 10.67 of Corning’s Form 10-K filed February 10, 2011). |
| | |
| 10.52 | Form of Corning Incorporated Cash Performance Unit Agreement, effective January 3, 2011 (Incorporated by reference to Exhibit 10.68 of Corning’s Form 10-K filed February 10, 2011). |
| | |
| 10.53 | Amendment No. 2 to Deferred Compensation Plan for Directors dated February 1, 2012 (Incorporated by reference to Exhibit 10.62 of Corning’s Form 10-K filed February 13, 2012). |
| | |
| 10.54 | Amendment No. 3 to Corning Incorporated Executive Supplemental Pension Plan effective December 31, 2008 (Incorporated by reference to Exhibit 10.59 of Corning’s Form 10-K filed February 13, 2013). |
| | |
| 10.55 | 2012 Long-Term Incentive Plan (Incorporated by reference to Appendix A of Corning Proxy Statement, Definitive 14A filed March 13, 2012, for April 26, 2012 Annual Meeting of Shareholders). |
| | |
| 10.56 | Amendment No. 3 to Deferred Compensation Plan for Directors dated December 28, 2012 (Incorporated by reference to Exhibit 10.61 of Corning’s Form 10-K filed February 13, 2013). |
| | |
| 10.57 | Amendment No. 4 to Corning Incorporated Executive Supplemental Pension Plan effective December 31, 2012 (Incorporated by reference to Exhibit 10.62 of Corning’s Form 10-K filed February 13, 2013). |
| | |
| 10.58 | Form of Corning Incorporated Cash Performance Unit Agreement, effective January 1, 2014 (Incorporated by reference to Exhibit 10.69 to Corning’s Form 10-K filed on February 10, 2014, as amended by its Form 10-K/A filed on March 21, 2014). |
| | |
| 10.59 | Amendment No. 4 to Deferred Compensation Plan for Directors dated September 30, 2014 (Incorporated by reference to Exhibit 10.1 of Corning’s Form 10-Q filed on October 29, 2014). |
| | |
| 10.61 | 2014 Variable Compensation Plan (Incorporated by reference to Appendix B of Corning’s Proxy Statement, Definitive 14A filed March 13, 2014 for the April 29, 2014 Annual Meeting of Shareholders). |
| | |
| 10.62 | Form of Corning Incorporated Incentive Stock Rights Agreement, effective January 1, 2015 (Incorporated by reference to Exhibit 10.64 of Corning’s Form 10-K filed February 13, 2015). |
| | |
| 10.63 | Form of Corning Incorporated Cash Performance Unit Agreement, effective January 1, 2015 (Incorporated by reference to Exhibit 10.65 of Corning’s Form 10-K filed February 13, 2015). |
| | |
| 10.64 | Form of Officer Severance Agreement dated as of January 1, 2015 between Corning Incorporated and each of the following individuals: Martin J. Curran; Eric S. Musser; and R. Tony Tripeny (Incorporated by reference to Exhibit 10.1 of Corning’s Form 10-Q filed July 30, 2015). |
| | |
| 10.65 | Form of Change in Control Agreement dated as of January 1, 2015 between Corning Incorporated and each of the following individuals: Martin J. Curran; Eric S. Musser; and R. Tony Tripeny (Incorporated by reference to Exhibit 10.2 of Corning’s Form 10-Q filed July 30, 2015). |
| | |
| 10.67 | Tax Matters Agreement, dated December 10, 2015, by and between Corning Incorporated, The Dow Chemical Company, Dow Corning Corporation and HS Upstate Inc. (Incorporated by reference to Exhibit 1.2 of Corning’s Form 8-K filed on December 11, 2015). |
| | |
| 10.68 | Form of Corning Incorporated Incentive Stock Rights Agreement, effective January 1, 2016 (Incorporated by reference to Exhibit 10.69 of Corning’s Form 10-K filed February 12, 2016). |
| | |
| 10.69 | Form of Corning Incorporated Cash Performance Unit Agreement, effective January 1, 2016 (Incorporated by reference to Exhibit 10.70 of Corning’s Form 10-K filed February 12, 2016). |
| | |
| 10.71 | Form of Corning Incorporated Incentive Stock Rights Agreement for Employees, effective January 1, 2017 (Incorporated by reference to Exhibit 10.71 of Corning’s Form 10-K filed February 6, 2017). |
| | |
| 10.72 | Form of Corning Incorporated Cash Performance Unit Agreement, effective January 1, 2017 (Incorporated by reference to Exhibit 10.72 of Corning’s Form 10-K filed February 6, 2017). |
| | |
| 10.73 | Form of Corning Incorporated Restricted Stock Unit Grant Notice and Agreement for Non-Employee Directors (for grants made under the 2012 Equity Plan for Non-Employee Directors), effective January 1, 2017 (Incorporated by reference to Exhibit 10.73 of Corning’s Form 10-K filed February 6, 2017). |
| | |
| 10.74 | Form of Corning Incorporated Incentive Stock Rights Agreement for Employees, effective January 1, 2018 (Incorporated by reference to Exhibit 10.74 of Corning’s Form 10-K filed February 15, 2018). |
| | |
| 10.75 | Form of Corning Incorporated Cash Performance Unit Agreement, effective January 1, 2018 (Incorporated by reference to Exhibit 10.75 of Corning’s Form 10-K filed February 15, 2018). |
| | |
| 10.76 | Credit Agreement dated as of August 15, 2018, among Corning Incorporated, JPMorgan Chase Bank, N.A., Citibank, N.A., Bank of America, N.A., Goldman Sachs Bank USA, HSBC Bank USA, National Association, Morgan Stanley Bank, N.A., MUFG Bank, Ltd., Standard Chartered Bank, Sumitomo Mitsui Banking Corporation, Wells Fargo Bank, National Association, Bank of China New York Branch, and The Bank of New York Mellon (Incorporated by reference to Exhibit 10.1 to Corning’s Form 8-K filed on August 15, 2018). |
| | |
| 10.77 | Corning Incorporated Deferred Compensation Plan for Non-Employee Directors as Amended and Restated on January 1, 2018 (Incorporated by reference to Exhibit 10.77 of Corning’s Form 10-K filed February 18, 2020). |
| | |
| 10.78 | 2019 Equity Plan for Non-Employee Directors (Incorporated by reference to Appendix B of Corning Proxy Statement, Definitive 14A filed March 22, 2019 for May 2, 2019 Annual Meeting of Shareholders). |
| | |
| 10.79 | Form of Corning Incorporated Restricted Stock Unit Grant Notice and Agreement for Non-Employee Directors (for grants made under the 2019 Equity Plan for Non-Employee Directors), effective January 1, 2020 (Incorporated by reference to Exhibit 10.79 of Corning’s Form 10-K filed February 18, 2020). |
| | |
| 10.80 | Form of Corning Incorporated Performance Share Unit Agreement, effective January 1, 2020 (Incorporated by reference to Exhibit 10.80 of Corning’s Form 10-K filed February 18, 2020). |
| | |
| 14 | Corning Incorporated Code of Ethics for Chief Executive Officer and Financial Executives, and Code of Conduct for Directors and Executive Officers (Incorporated by reference to Appendix G of Corning Proxy Statement, Definitive 14A filed March 13, 2012 for April 26, 2012 Annual Meeting of Shareholders). |
| | |
| 21 | Subsidiaries of the Registrant at December 31, 2020. |
Item 16. Form 10-K Summary.
None.
Signatures
Pursuant to the requirements of Section 13 or 15(d) of the Securities and Exchange Act of 1934, the Registrant has duly caused his report to be signed on its behalf by the undersigned, thereunto duly authorized.
| | |
| Corning Incorporated |
| | |
| | |
Date: February 12, 2021 | By: | /s/ Wendell P. Weeks |
| | Wendell P. Weeks |
| | Chairman of the Board of Directors, |
| | Chief Executive Officer, and Director |
Power of Attorney
KNOW ALL PERSONS BY THESE PRESENTS, that each person whose signature appears below constitutes and appoints R. Tony Tripeny, Lewis A. Steverson and Edward A. Schlesinger, jointly and severally, his or her attorneys-in-fact, each with the power of substitution, for him or her in any and all capacities, to sign any amendments to this Annual Report on Form 10-K, and to file the same, with exhibits thereto and other documents in connection therewith, with the Securities and Exchange Commission, hereby ratifying and confirming all that each of said attorneys-in-fact, or his substitute or substitutes, may do or cause to be done by virtue hereof.
Pursuant to the requirements of the Securities Exchange Act of 1934, this report has been signed below by the following persons on behalf of the Registrant and in the capacities and on the twelfth day of February, 2021.
Signature | | Capacity |
| | | | |
/s/ Wendell P. Weeks | | Chairman of the Board of Directors,
Chief Executive Officer, and Director |
Wendell P. Weeks | | (Principal Executive Officer) | | |
| | | | |
/s/ R. Tony Tripeny | | Executive Vice President and Chief Financial Officer
(Principal Financial Officer) |
R. Tony Tripeny | |
| | | | |
/s/ Edward A. Schlesinger | | Senior Vice President – Corporate Controller
(Principal Accounting Officer) |
Edward A. Schlesinger | |
| | | | |
/s/ Donald W. Blair | | Director | | |
Donald W. Blair | | | | |
| | | | |
/s/ Leslie A. Brun | | Director | | |
Leslie A. Brun | | | | |
| | | | |
/s/ Stephanie A. Burns | | Director | | |
Stephanie A. Burns | | | | |
| | | | |
/s/ Richard T. Clark | | Director | | |
Richard T. Clark | | | | |
| | | | |
/s/ Robert F. Cummings, Jr. | | Director | | |
Robert F. Cummings, Jr. | | | | |
| | | | |
| | | | |
Signature | | Capacity |
| | | | |
| | | | |
/s/ Deborah A. Henretta | | Director | | |
Deborah A. Henretta | | | | |
| | | | |
/s/Daniel P. Huttenlocher | | Director | | |
Daniel P. Huttenlocher | | | | |
| | | | |
/s/ Kurt M. Landgraf | | Director | | |
Kurt M. Landgraf | | | | |
| | | | |
/s/ Kevin J. Martin | | Director | | |
Kevin J. Martin | | | | |
| | | | |
/s/ Deborah D. Rieman | | Director | | |
Deborah D. Rieman | | | | |
| | | | |
/s/ Hansel E. Tookes II | | Director | | |
Hansel E. Tookes II | | | | |
| | | | |
/s/ Mark S. Wrighton | | Director | | |
Mark S. Wrighton | | | | |
Corning Incorporated
2020 Annual Report
Index to Financial Statements and Financial Statement Schedule
Report of Independent Registered Public Accounting Firm
To the Board of Directors and Shareholders of Corning Incorporated
Opinions on the Financial Statements and Internal Control over Financial Reporting
We have audited the accompanying consolidated balance sheets of Corning Incorporated and its subsidiaries (the “Company”) as of December 31, 2020 and 2019, and the related consolidated statements of income, comprehensive income, changes in shareholders’ equity and cash flows for each of the three years in the period ended December 31, 2020 including the related notes and schedule of valuation and qualifying accounts for each of the three years in the period ended December 31, 2020 listed in the accompanying index (collectively referred to as the “consolidated financial statements”). We also have audited the Company's internal control over financial reporting as of December 31, 2020, based on criteria established in Internal Control - Integrated Framework (2013) issued by the Committee of Sponsoring Organizations of the Treadway Commission (COSO).
In our opinion, the consolidated financial statements referred to above present fairly, in all material respects, the financial position of the Company as of December 31, 2020 and 2019, and the results of its operations and its cash flows for each of the three years in the period ended December 31, 2020 in conformity with accounting principles generally accepted in the United States of America. Also in our opinion, the Company maintained, in all material respects, effective internal control over financial reporting as of December 31, 2020, based on criteria established in Internal Control - Integrated Framework (2013) issued by the COSO.
Basis for Opinions
The Company's management is responsible for these consolidated financial statements, for maintaining effective internal control over financial reporting, and for its assessment of the effectiveness of internal control over financial reporting, included in Management's Annual Report on Internal Control Over Financial Reporting appearing under Item 9A. Our responsibility is to express opinions on the Company’s consolidated financial statements and on the Company's internal control over financial reporting based on our audits. We are a public accounting firm registered with the Public Company Accounting Oversight Board (United States) (PCAOB) and are required to be independent with respect to the Company in accordance with the U.S. federal securities laws and the applicable rules and regulations of the Securities and Exchange Commission and the PCAOB.
We conducted our audits in accordance with the standards of the PCAOB. Those standards require that we plan and perform the audits to obtain reasonable assurance about whether the consolidated financial statements are free of material misstatement, whether due to error or fraud, and whether effective internal control over financial reporting was maintained in all material respects.
Our audits of the consolidated financial statements included performing procedures to assess the risks of material misstatement of the consolidated financial statements, whether due to error or fraud, and performing procedures that respond to those risks. Such procedures included examining, on a test basis, evidence regarding the amounts and disclosures in the consolidated financial statements. Our audits also included evaluating the accounting principles used and significant estimates made by management, as well as evaluating the overall presentation of the consolidated financial statements. Our audit of internal control over financial reporting included obtaining an understanding of internal control over financial reporting, assessing the risk that a material weakness exists, and testing and evaluating the design and operating effectiveness of internal control based on the assessed risk. Our audits also included performing such other procedures as we considered necessary in the circumstances. We believe that our audits provide a reasonable basis for our opinions.
As described in Management's Annual Report on Internal Control Over Financial Reporting, management has excluded Hemlock Semiconductor LLC and Hemlock Semiconductor Operations LLC, (collectively referred to as Hemlock Semiconductor Group) from its assessment of internal control over financial reporting as of December 31, 2020 because it was previously an equity method investee that is now consolidated by the Company due to a change in control during 2020. We have also excluded Hemlock Semiconductor Group from our audit of internal control over financial reporting. Hemlock Semiconductor Group is a substantially owned subsidiary whose total assets and total revenues excluded from management’s assessment and our audit of internal control over financial reporting represent approximately 4% and 2%, respectively, of the related consolidated financial statement amounts as of and for the year ended December 31, 2020.
Definition and Limitations of Internal Control over Financial Reporting
A company’s internal control over financial reporting is a process designed to provide reasonable assurance regarding the reliability of financial reporting and the preparation of financial statements for external purposes in accordance with generally accepted accounting principles. A company’s internal control over financial reporting includes those policies and procedures that (i) pertain to the maintenance of records that, in reasonable detail, accurately and fairly reflect the transactions and dispositions of the assets of the company; (ii) provide reasonable assurance that transactions are recorded as necessary to permit preparation of financial statements in accordance with generally accepted accounting principles, and that receipts and expenditures of the company are being made only in accordance with authorizations of management and directors of the company; and (iii) provide reasonable assurance regarding prevention or timely detection of unauthorized acquisition, use, or disposition of the company’s assets that could have a material effect on the financial statements.
Because of its inherent limitations, internal control over financial reporting may not prevent or detect misstatements. Also, projections of any evaluation of effectiveness to future periods are subject to the risk that controls may become inadequate because of changes in conditions, or that the degree of compliance with the policies or procedures may deteriorate.
Critical Audit Matters
The critical audit matters communicated below are matters arising from the current period audit of the consolidated financial statements that were communicated or required to be communicated to the audit committee and that (i) relate to accounts or disclosures that are material to the consolidated financial statements and (ii) involved our especially challenging, subjective, or complex judgments. The communication of critical audit matters does not alter in any way our opinion on the consolidated financial statements, taken as a whole, and we are not, by communicating the critical audit matters below, providing separate opinions on the critical audit matters or on the accounts or disclosures to which they relate.
Income Taxes - Receivables for South Korean Tax Disputes
As described in Notes 1, 8, and 11 to the consolidated financial statements, in evaluating the tax benefits associated with the Company’s various tax filing positions, management records a tax benefit for uncertain tax positions using the highest cumulative tax benefit that is more likely than not to be realized. Adjustments are made to the liability for unrecognized tax benefits in the period in which the Company files the return containing the tax position or when new information becomes available. The Company is currently appealing certain South Korean tax assessments and tax refund claims for tax years 2010 through 2018. The Company is required to deposit the disputed tax amounts with the South Korean government as a condition of its appeal of any tax assessments. Management believes that it is more likely than not that these tax positions will prevail in the appeal process and as a result, management recorded a non-current receivable of $365 million as of December 31, 2020.
The principal considerations for our determination that performing procedures relating to the receivables for South Korean tax disputes is a critical audit matter are (i) the significant judgment by management when applying the more likely than not recognition criteria to the Company’s uncertain tax positions based on the application of the tax law; (ii) a high degree of auditor judgment, subjectivity, and effort in performing procedures and evaluating audit evidence relating to management’s assumption that the Company will prevail in the appeal of any tax assessments; and (iii) the audit effort involved the use of professionals with specialized skill and knowledge.
Addressing the matter involved performing procedures and evaluating audit evidence in connection with forming our overall opinion on the consolidated financial statements. These procedures included testing the effectiveness of controls relating to uncertain tax positions, including management’s assessment of the South Korean tax disputes. These procedures also included, among others, obtaining management’s assessment and evidence supporting the more-likely-than-not tax position on the South Korean tax disputes and evaluating the reasonableness of the likelihood that the tax positions will ultimately be sustained upon examination by the South Korean tax authorities and through the appeal process. Professionals with specialized skill and knowledge were used to assist in evaluating management’s assessment and supporting evidence related to the application of the tax law.
Hemlock Semiconductor Group (HSG) Transactions - Valuation of the Previously Held Equity Interest and Deferred Revenue Resulting from the Consolidation of HSG
As described in Notes 1, 3 and 4 to the consolidated financial statements, management uses the equity method of accounting for investments in affiliated companies that are not controlled by the Company and in which the Company’s interest is generally between 20% and 50% and the Company has significant influence over the entity. Hemlock Semiconductor LLC and Hemlock Semiconductor Operations LLC, of which the Company previously held 49.9% and 40.25% ownership interest, respectively, were recorded as equity method investments and are affiliated companies of Hemlock Semiconductor Group (HSG). On September 9, 2020, HSG redeemed DuPont de Nemours, Inc.’s entire ownership interest in HSG with a fair value of $250 million (“Redemption”). Upon completion of the Redemption, the Company obtained a controlling interest of 100% in Hemlock Semiconductor LLC and 80.5% interest in Hemlock Semiconductor Operations LLC and began consolidating HSG. Management recognized a pre-tax gain of $498 million on the Company’s previously held equity investment in HSG as a result of the consolidation resulting from the Redemption. The gain was calculated based on the difference between fair value and carrying value of the equity method investment immediately preceding the Redemption and is included in the transaction-related gain, net in the Company’s consolidated statements of income for the year ended December 31, 2020. As disclosed, management estimated the fair value of the Company’s equity interest in HSG by applying the income approach, which was based on significant assumptions such as projected revenues and discount rate. Upon completion of the Redemption and resulting consolidation, management recorded, at fair value, the assets acquired and liabilities assumed from HSG, including deferred revenues of $1,070 million related to the performance obligations of non-refundable consideration previously received by HSG from its customers under long term supply agreements. The fair values of deferred revenue were estimated by applying a bottom-up cost buildup method of the cost approach based on significant inputs such as the cost to fulfill the obligations as well as key assumptions including a normal profit margin.
The principal considerations for our determination that performing procedures relating to the HSG transactions, specifically the valuation of the previously held equity interest and deferred revenue resulting from the consolidation of HSG, is a critical audit matter are (i) the high degree of auditor judgment and subjectivity in performing procedures relating to the fair value measurement of the previously held equity interest and deferred revenue resulting from the consolidation of HSG due to the significant judgment by management when developing the estimates; (ii) significant audit effort in evaluating management’s significant assumptions relating to the estimates, such as the projected revenues and discount rate applied when developing the fair value measurement of the previously held equity interest, and a market participant’s cost to fulfill the obligations and the normal profit margin used when developing the fair value measurement of deferred revenue; and (iii) the audit effort involved the use of professionals with specialized skill and knowledge.
Addressing the matter involved performing procedures and evaluating audit evidence in connection with forming our overall opinion on the consolidated financial statements. These procedures included testing the effectiveness of controls relating to the HSG transactions, including controls over the significant assumptions in management’s valuation of the previously held equity interest and deferred revenue from the HSG transactions. These procedures also included, among others (i) testing management’s process for estimating the fair value of the previously held equity interest and deferred revenue resulting from the consolidation of HSG; (ii) evaluating the appropriateness of the income and cost approaches; (iii) testing the completeness and accuracy of underlying data used in the income and cost approaches; and (iv) evaluating the reasonableness of significant assumptions related to projected revenues and the discount rate for the previously held equity interest; and a market participant’s cost to fulfill the obligations and the normal profit margin for deferred revenue. Evaluating management’s assumptions related to projected revenues for the previously held equity interest, a market participant’s cost to fulfill the obligations and the normal profit margin for deferred revenue, involved evaluating whether the assumptions used were reasonable considering current and past performance of HSG. Professionals with specialized skill and knowledge were used to assist in evaluating the appropriateness of management’s income and cost approaches and management’s significant assumptions related to the discount rate and the normal profit margin.
/s/ PricewaterhouseCoopers LLP
New York, New York
February 12, 2021
We have served as the Company’s auditor since 1944.
| | |
Consolidated Statements of Income | | Corning Incorporated and Subsidiary Companies |
| | | | | | | | |
| | | | | | | | |
| Year ended December 31, |
(In millions, except per share amounts) | 2020 | | 2019 | | 2018 |
Net sales | $ | 11,303 | | $ | 11,503 | | $ | 11,290 |
Cost of sales | | 7,772 | | | 7,468 | | | 6,829 |
| | | | | | | | |
Gross margin | | 3,531 | | | 4,035 | | | 4,461 |
| | | | | | | | |
Operating expenses: | | | | | | | | |
Selling, general and administrative expenses | | 1,747 | | | 1,585 | | | 1,799 |
Research, development and engineering expenses | | 1,154 | | | 1,031 | | | 993 |
Amortization of purchased intangibles | | 121 | | | 113 | | | 94 |
| | | | | | | | |
Operating income | | 509 | | | 1,306 | | | 1,575 |
| | | | | | | | |
Equity in (losses) earnings of affiliated companies (Note 3) | | (25) | | | 17 | | | 390 |
Interest income | | 15 | | | 21 | | | 38 |
Interest expense | | (276) | | | (221) | | | (191) |
Translated earnings contract (loss) gain, net (Note 15) | | (38) | | | 248 | | | (93) |
Transaction-related gain, net (Note 4) | | 498 | | | | | | |
Other expense, net | | (60) | | | (155) | | | (216) |
| | | | | | | | |
Income before income taxes | | 623 | | | 1,216 | | | 1,503 |
Provision for income taxes (Note 8) | | (111) | | | (256) | | | (437) |
| | | | | | | | |
Net income attributable to Corning Incorporated | $ | 512 | | $ | 960 | | $ | 1,066 |
| | | | | | | | |
Earnings per common share attributable to
Corning Incorporated: | | | | | | | | |
Basic (Note 18) | $ | 0.54 | | $ | 1.11 | | $ | 1.19 |
Diluted (Note 18) | $ | 0.54 | | $ | 1.07 | | $ | 1.13 |
The accompanying notes are an integral part of these consolidated financial statements.
| |
Consolidated Statements of Comprehensive Income | Corning Incorporated and Subsidiary Companies |
| | | | | | | | |
| | | | | | | | |
| Year ended December 31, |
(In millions) | 2020 | | 2019 | | 2018 |
Net income attributable to Corning Incorporated | $ | 512 | | $ | 960 | | $ | 1,066 |
| | | | | | | | |
Foreign currency translation adjustments and other | | 528 | | | (143) | | | (185) |
Net unrealized gains (losses) on investments | | | | | 1 | | | (1) |
Unamortized (losses) gains and prior service (costs) credits for | | | | | | | | |
postretirement benefit plans | | (88) | | | (64) | | | 19 |
Net unrealized (losses) gains on designated hedges | | (9) | | | 45 | | | (1) |
Other comprehensive income (loss), net of tax (Note 17) | | 431 | | | (161) | | | (168) |
| | | | | | | | |
Comprehensive income attributable to Corning Incorporated | $ | 943 | | $ | 799 | | $ | 898 |
| | | | | | | | |
The accompanying notes are an integral part of these consolidated financial statements.
| |
Consolidated Balance Sheets | Corning Incorporated and Subsidiary Companies |
| | | | | |
| | | | | |
| December 31, |
(In millions, except share and per share amounts) | 2020 | | 2019 |
| | | | | |
Assets | | | | | |
| | | | | |
Current assets: | | | | | |
Cash and cash equivalents | $ | 2,672 | | $ | 2,434 |
Trade accounts receivable, net of doubtful accounts - $46 and $41 | | 2,133 | | | 1,836 |
Inventories, net (Note 6) | | 2,438 | | | 2,320 |
Other current assets (Note 11 and 15) | | 761 | | | 873 |
Total current assets | | 8,004 | | | 7,463 |
| | | | | |
Property, plant and equipment, net of accumulated depreciation -
$13,663 and $12,995 (Note 9) | | 15,742 | | | 15,337 |
Goodwill, net (Note 10) | | 2,460 | | | 1,935 |
Other intangible assets, net (Note 10) | | 1,308 | | | 1,185 |
Deferred income taxes (Note 8) | | 1,121 | | | 1,157 |
Other assets (Note 11 and 15) | | 2,140 | | | 1,821 |
| | | | | |
Total Assets | $ | 30,775 | | $ | 28,898 |
| | | | | |
Liabilities and Equity | | | | | |
| | | | | |
Current liabilities: | | | | | |
Current portion of long-term debt and short-term borrowings (Note 12) | $ | 156 | | $ | 11 |
Accounts payable | | 1,174 | | | 1,587 |
Other accrued liabilities (Note 11 and 14) | | 2,437 | | | 1,923 |
Total current liabilities | | 3,767 | | | 3,521 |
| | | | | |
Long-term debt (Note 12) | | 7,816 | | | 7,729 |
Postretirement benefits other than pensions (Note 13) | | 727 | | | 671 |
Other liabilities (Note 11 and 14) | | 5,017 | | | 3,980 |
Total liabilities | | 17,327 | | | 15,901 |
| | | | | |
Commitments, contingencies and guarantees (Note 14) | | | | | |
Shareholders’ equity (Note 17): | | | | | |
Convertible preferred stock, Series A – Par value $100 per share;
Shares authorized 3,100; Shares issued: 2,300 | | 2,300 | | | 2,300 |
Common stock – Par value $0.50 per share; Shares authorized: 3.8 billion;
Shares issued: 1,726 million and 1,718 million | | 863 | | | 859 |
Additional paid-in capital – common stock | | 14,642 | | | 14,323 |
Retained earnings | | 16,120 | | | 16,408 |
Treasury stock, at cost; shares held: 961 million and 956 million | | (19,928) | | | (19,812) |
Accumulated other comprehensive loss | | (740) | | | (1,171) |
Total Corning Incorporated shareholders’ equity | | 13,257 | | | 12,907 |
Noncontrolling interests | | 191 | | | 90 |
Total equity | | 13,448 | | | 12,997 |
| | | | | |
Total Liabilities and Equity | $ | 30,775 | | $ | 28,898 |
The accompanying notes are an integral part of these consolidated financial statements.
| |
Consolidated Statements of Cash Flows | Corning Incorporated and Subsidiary Companies |
| | | | | | | | |
| | | | | | | | |
| Year ended December 31, |
(In millions) | 2020 | | 2019 | | 2018 |
Cash Flows from Operating Activities: | | | | | | | | |
Net income | $ | 512 | | $ | 960 | | $ | 1,066 |
Adjustments to reconcile net income to net cash provided by operating activities: | | | | | | | | |
Depreciation | | 1,399 | | | 1,390 | | | 1,199 |
Amortization of purchased intangibles | | 121 | | | 113 | | | 94 |
Loss on disposal of assets | | 138 | | | 123 | | | 43 |
Severance charges | | 148 | | | 63 | | | 16 |
Severance payments | | (147) | | | (28) | | | (3) |
Share-based compensation expense | | 207 | | | 56 | | | 51 |
Equity in losses (earnings) of affiliated companies | | 25 | | | (17) | | | (390) |
Dividends received from affiliated companies | | 1 | | | 106 | | | 241 |
Deferred tax benefit | | (20) | | | (191) | | | (38) |
Customer incentives and deposits, net | | 221 | | | 142 | | | 700 |
Pension plan contributions | | (221) | | | (2) | | | (117) |
Translated earnings contract loss (gain) | | 38 | | | (248) | | | 93 |
Unrealized translation (gain) loss on transactions | | (133) | | | 33 | | | 55 |
Asbestos claim payments | | (130) | | | (50) | | | (35) |
Tax assessment refunds | | 101 | | | | | | |
Asset impairment | | 217 | | | | | | |
Transaction-related gain, net | | (498) | | | | | | |
Gain on investment | | (107) | | | | | | |
Changes in certain working capital items: | | | | | | | | |
Trade accounts receivable | | (274) | | | 48 | | | (154) |
Inventories | | 423 | | | (298) | | | (346) |
Other current assets | | (25) | | | (300) | | | (20) |
Accounts payable and other current liabilities | | 57 | | | 1 | | | 345 |
Other, net | | 127 | | | 130 | | | 119 |
Net cash provided by operating activities | | 2,180 | | | 2,031 | | | 2,919 |
| | | | | | | | |
Cash Flows from Investing Activities: | | | | | | | | |
Capital expenditures | | (1,377) | | | (1,978) | | | (2,242) |
Acquisitions of businesses, net of cash received | | 4 | | | | | | (842) |
Proceeds from settlement of initial contingent consideration asset | | | | | | | | 196 |
Proceeds from sale or disposal of assets | | 37 | | | | | | |
Purchase of equipment for related party | | | | | (9) | | | (68) |
Sale of equipment for related party | | | | | 78 | | | 19 |
Realized gains on translated earnings contracts | | 12 | | | 55 | | | 108 |
Other, net | | 14 | | | (37) | | | (58) |
Net cash used in investing activities | | (1,310) | | | (1,891) | | | (2,887) |
| | | | | | | | |
Cash Flows from Financing Activities: | | | | | | | | |
Net repayments of short-term borrowings and current portion of long-term debt | | (100) | | | (300) | | | (629) |
Repayments of long-term debt | | (121) | | | | | | |
Proceeds from issuance of long-term debt, net | | 243 | | | 1,831 | | | 1,485 |
Proceeds from exercise of stock options | | 124 | | | 58 | | | 81 |
Repurchases of common stock for treasury | | (105) | | | (940) | | | (2,227) |
Dividends paid | | (787) | | | (742) | | | (685) |
Other, net | | 17 | | | 46 | | | (20) |
Net cash used in financing activities | | (729) | | | (47) | | | (1,995) |
Effect of exchange rates on cash | | 97 | | | (14) | | | 1 |
Net increase (decrease) in cash and cash equivalents | | 238 | | | 79 | | | (1,962) |
Cash and cash equivalents at beginning of year | | 2,434 | | | 2,355 | | | 4,317 |
Cash and cash equivalents at end of year | $ | 2,672 | | $ | 2,434 | | $ | 2,355 |
The accompanying notes are an integral part of these consolidated financial statements.
| |
Consolidated Statements of Changes in Shareholders’ Equity | Corning Incorporated and Subsidiary Companies |
| | | | | | | | | | | | | | | | | | | | | | | | | | |
| | | | | | | | | | | | | | | | | | | | | | | | | | |
| | | | | Additional | | | | | | | Accumulated | | Total Corning | | | | | |
| Convertible | | | | | paid-in | | | | | | | | other | | Incorporated | | Non- | | | |
| preferred | | Common | | capital | | Retained | | Treasury | | comprehensive | | shareholders’ | | controlling | | | |
(In millions) | stock | | stock | | common | | earnings | | stock | | income (loss) | | equity | | interests | | Total |
Balance at December 31, 2017 | $ | 2,300 | | $ | 854 | | $ | 14,089 | | $ | 15,930 | | $ | (16,633) | | $ | (842) | | $ | 15,698 | | $ | 72 | | $ | 15,770 |
| | | | | | | | | | | | | | | | | | | | | | | | | | |
Net income | | | | | | | | | | | 1,066 | | | | | | | | | 1,066 | | | 24 | | | 1,090 |
Other comprehensive loss | | | | | | | | | | | | | | | | | (168) | | | (168) | | | (1) | | | (169) |
Purchase of common stock for | | | | | | | | | | | | | | | | | | | | | | | | | | |
treasury | | | | | | | | | | | | | | (2,230) | | | | | | (2,230) | | | | | | (2,230) |
Shares issued to benefit plans | | | | | | | | | | | | | | | | | | | | | | | | | | |
and for option exercises | | | | | 3 | | | 123 | | | | | | | | | | | | 126 | | | | | | 126 |
Common dividends
($0.72 per share) | | | | | | | | | | | (590) | | | | | | | | | (590) | | | | | | (590) |
Preferred dividends
($42,500 per share) | | | | | | | | | | | (98) | | | | | | | | | (98) | | | | | | (98) |
Other, net | | | | | | | | | | | (5) | | | (7) | | | | | | (12) | | | (1) | | | (13) |
Balance at December 31, 2018 | $ | 2,300 | | $ | 857 | | $ | 14,212 | | $ | 16,303 | | $ | (18,870) | | $ | (1,010) | | $ | 13,792 | | $ | 94 | | $ | 13,886 |
| | | | | | | | | | | | | | | | | | | | | | | | | | |
Net income | | | | | | | | | | | 960 | | | | | | | | | 960 | | | 19 | | | 979 |
Other comprehensive loss | | | | | | | | | | | | | | | | | (161) | | | (161) | | | | | | (161) |
Purchase of common stock for | | | | | | | | | | | | | | | | | | | | | | | | | | |
treasury | | | | | | | | | | | | | | (925) | | | | | | (925) | | | | | | (925) |
Shares issued to benefit plans | | | | | | | | | | | | | | | | | | | | | | | | | | |
and for option exercises | | | | | 2 | | | 111 | | | | | | | | | | | | 113 | | | | | | 113 |
Common dividends
($0.80 per share) | | | | | | | | | | | (625) | | | | | | | | | (625) | | | | | | (625) |
Preferred dividends
($42,500 per share) | | | | | | | | | | | (98) | | | | | | | | | (98) | | | | | | (98) |
Other, net (1) | | | | | | | | | | | (132) | | | (17) | | | | | | (149) | | | (23) | | | (172) |
Balance at December 31, 2019 | $ | 2,300 | | $ | 859 | | $ | 14,323 | | $ | 16,408 | | $ | (19,812) | | $ | (1,171) | | $ | 12,907 | | $ | 90 | | $ | 12,997 |
| | | | | | | | | | | | | | | | | | | | | | | | | | |
Net income | | | | | | | | | | | 512 | | | | | | | | | 512 | | | 11 | | | 523 |
Other comprehensive income | | | | | | | | | | | | | | | | | 431 | | | 431 | | | 1 | | | 432 |
Purchase of common stock for | | | | | | | | | | | | | | | | | | | | | | | | | | |
treasury | | | | | | | | | | | | | | (105) | | | | | | (105) | | | | | | (105) |
Shares issued to benefit plans | | | | | | | | | | | | | | | | | | | | | | | | | | |
and for option exercises | | | | | 4 | | | 319 | | | | | | | | | | | | 323 | | | | | | 323 |
Common dividends
($0.88 per share) | | | | | | | | | | | (681) | | | | | | | | | (681) | | | | | | (681) |
Preferred dividends
($42,500 per share) | | | | | | | | | | | (98) | | | | | | | | | (98) | | | | | | (98) |
Non-controlling interest in HSG (2) | | | | | | | | | | | | | | | | | | | | | | | 102 | | | 102 |
Other, net | | | | | | | | | | | (21) | | | (11) | | | | | | (32) | | | (13) | | | (45) |
Balance at December 31, 2020 | $ | 2,300 | | $ | 863 | | $ | 14,642 | | $ | 16,120 | | $ | (19,928) | | $ | (740) | | $ | 13,257 | | $ | 191 | | $ | 13,448 |
(1)
(2)
The accompanying notes are an integral part of these consolidated financial statements.
Corning Incorporated and Subsidiary Companies
Notes to Consolidated Financial Statements
1.Summary of Significant Accounting Policies
Organization
Corning Incorporated is a provider of high-performance glass for notebook computers, flat panel desktop monitors, display televisions, and other information display applications; carrier network and enterprise network products for the telecommunications industry; ceramic substrates for gasoline and diesel engines in automotive and heavy duty vehicle markets; laboratory products for the scientific community and specialized polymer products for biotechnology applications; advanced optical materials for the semiconductor industry and the scientific community; polycrystalline silicon products and other technologies. In these notes, the terms “Corning,” “Company,” “we,” “us,” or “our” mean Corning Incorporated and subsidiary companies.
Basis of Presentation and Principles of Consolidation
Corning’s consolidated financial statements were prepared in conformity with generally accepted accounting principles in the U.S. and include the assets, liabilities, revenue and expenses of all majority-owned subsidiaries over which Corning exercises control.
The equity method of accounting is used for investments in affiliated companies that are not controlled by Corning and in which our interest is generally between 20% and 50% and we have significant influence over the entity. Our share of earnings or losses of affiliated companies, in which at least 20% of the voting securities are owned and we have significant influence but not control over the entity, is included in consolidated operating results.
For our investments in companies that we do not control and for which we do not have the ability to exercise significant influence over operating and financial policies, we use the fair value method to account for the investments if readily determinable fair values are available. For the investments without readily determinable fair values, we measure them at cost minus impairment, if any, plus or minus changes resulting from observable price changes in orderly transactions for the identical or a similar investment.
On September 9, 2020, upon completion of the Redemption, the Company obtained a 100% interest in Hemlock Semiconductor LLC and 80.5% interest in Hemlock Semiconductor Operations LLC and began consolidating HSG, which are affiliated entities within the Hemlock Semiconductor Group (“HSG”).
Refer to Note 3 (Investments) and Note 4 (HSG Transactions and Acquisitions) to the consolidated financial statements for more information.
All material intercompany accounts, transactions and profits are eliminated in consolidation.
Certain prior year amounts have been reclassified to conform to the current year’s presentation. These reclassifications had no impact on the results of operations, financial position, or changes in shareholders’ equity.
Use of Estimates
The preparation of financial statements, in conformity with GAAP, requires management to make estimates and assumptions affecting reported amounts of assets, liabilities, revenue, expenses and the disclosure of contingent assets and liabilities in the consolidated financial statements and related notes. Significant estimates and assumptions in these consolidated financial statements include estimates associated with revenue recognition, restructuring charges, goodwill and long-lived asset impairment tests, estimates of acquired assets and liabilities, estimates of fair value of investments, equity interests, environmental and legal liabilities, income taxes and deferred tax valuation allowances, assumptions used in calculating pension and other postretirement employee benefit expenses and the fair value of share-based compensation. Due to the inherent uncertainty involved in making estimates, actual results reported in future periods may be different from these estimates.
The COVID-19 pandemic and the resulting adverse impacts to global economic conditions, as well as to Corning’s operations, may impact future estimates including, but not limited to, inventory valuations, fair value measurements, goodwill and long-lived asset impairments, the effectiveness of the Company’s hedging instruments, deferred tax valuation allowances, actuarial losses on retirement benefit plans and discount rate assumptions.
Revenue Recognition
Most of the Company’s revenue is generated by delivery of products to customers and recognized at a point in time based on evaluation of when the customer obtains control of the products. Revenue is recognized when all performance obligations under the terms of a contract are satisfied, and control of the product has been transferred to the customer. If customer acceptance clauses are present and it cannot be objectively determined that control has been transferred, revenue is only recorded when customer acceptance is received and all performance obligations have been satisfied. Sales of goods typically do not include multiple product and/or service elements.
Revenue is measured as the amount of consideration expected in exchange for transferring goods or providing services. Sales tax, value-added tax, and other taxes are collected concurrently with revenue-producing activities are excluded from revenue. Incidental contract costs that are not material in the context of the delivery of goods and services are recognized as expense.
At the time revenue is recognized, allowances are recorded, with the related reduction to revenue, for estimated product returns, allowances and price discounts based upon historical experience and related terms of customer arrangements. Where product warranties are offered, liabilities are established for estimated warranty costs based upon historical experience and specific warranty provisions. Warranty liabilities are adjusted when experience indicates the expected outcome will differ from initial estimates of the liability.
In addition, Corning also has contractual arrangements with certain customers in which revenue is recognized over time. The performance obligations under these contracts generally require services to be performed over time, resulting in either a straight-line amortization method or an input method using incurred and forecasted expense to predict revenue recognition patterns which follows satisfaction of the performance obligation.
Research and Development Costs
Research and development costs are charged to expense as incurred. Research and development costs totaled $1.0 billion, $833 million and $807 million in 2020, 2019 and 2018, respectively.
Foreign Currency Translation and Transactions
The determination of the functional currency for Corning’s foreign subsidiaries is made based on the appropriate economic factors. For most foreign operations, the local currencies are generally considered to be the functional currencies. Corning’s most significant exception is a Taiwanese subsidiary, which uses the Japanese yen as its functional currency. For all transactions denominated in a currency other than a subsidiary’s functional currency, exchange rate gains and losses are included in income for the period in which the exchange rates changed. Net losses of $37 million, $19 million and $43 million were recorded for foreign currency transaction activity for the years ended December 31, 2020, 2019 and 2018, respectively. Foreign subsidiary functional currency balance sheet accounts are translated at current exchange rates, and statement of operations accounts are translated at average exchange rates for the year. Translation gains and losses are recorded as a separate component of accumulated other comprehensive income in shareholders’ equity. The effects of remeasuring non-functional currency assets and liabilities into the functional currency are included in current earnings, except for those related to intra-entity foreign currency transactions of a long-term investment nature, which are recorded together with translation gains and losses in accumulated other comprehensive loss in shareholders’ equity. Upon sale or substantially complete liquidation of an investment in a foreign entity, the amount of net translation gains or losses that have been accumulated in other comprehensive income attributable to that investment are reported as a gain or loss for the period in which the sale or liquidation occurs.
Share-Based Compensation
Corning’s share-based compensation programs include employee stock option grants, time-based restricted stock awards and time-based restricted stock units, as more fully described in Note 19 (Share-Based Compensation) to the consolidated financial statements.
The cost of share-based compensation awards is equal to the fair value of the award at the date of grant and compensation expense is recognized for those awards earned over the vesting period. Corning estimates the fair value of share-based awards using a multiple-point Black-Scholes option valuation model, which incorporates assumptions including expected volatility, dividend yield, risk-free rate, expected term and departure rates.
Cash and Cash Equivalents
Cash equivalents consist of highly liquid investments that are readily convertible into cash. Securities with contractual maturities of three months or less, when purchased, are considered cash equivalents. The carrying amount of these securities approximates fair value because of the short-term maturity of these instruments.
Supplemental disclosure of cash flow information is as follows (in millions):
| | | | | | | | |
| | | | | | | | |
| Year ended December 31, |
| 2020 | | 2019 | | 2018 |
Non-cash transactions: | | | | | | | | |
Accruals for capital expenditures | $ | 231 | | $ | 592 | | $ | 412 |
Cash paid for interest and income taxes: | | | | | | | | |
Interest (1) | $ | 298 | | $ | 248 | | $ | 205 |
Income taxes, net of refunds received | $ | 220 | | $ | 474 | | $ | 567 |
(1)Included in this amount are approximately $58 million, $54 million and $49 million of interest costs that were capitalized as part of property, plant and equipment, net of accumulated depreciation, in 2020, 2019 and 2018, respectively.
Allowance for Doubtful Accounts
The allowance for doubtful accounts is based on the best estimate of the amount of probable lifetime credit losses in existing accounts receivable. The Company determines the allowances based on historical write-off experience and expected future default rate by industry. In addition, in circumstances where the Company is made aware of a specific customer’s inability to meet its financial obligations, a specific allowance is established. The Company does not have any significant off-balance-sheet credit exposure related to its customers.
Environmental Liabilities
The Company accrues for its environmental investigation, remediation, operating and maintenance costs when it is probable that a liability has been incurred and the amount can be reasonably estimated. For environmental matters, the most likely cost to be incurred is accrued based on an evaluation of currently available facts with respect to each individual site, current laws and regulations and prior remediation experience. For sites with multiple potentially responsible parties, the Company considers its likely proportionate share of the anticipated remediation costs and the ability of the other parties to fulfill obligations in establishing a provision for those costs. Where no amount within a range of estimates is more likely to occur than another, the minimum undiscounted amount is accrued. When future liabilities are determined to be reimbursable by insurance coverage, an accrual is recorded for the potential liability and a receivable is recorded related to the insurance reimbursement when reimbursement is virtually certain.
The uncertain nature inherent in such remediation and the possibility that initial estimates may not reflect the outcome could result in additional costs being recognized by the Company in future periods.
Inventories, net
Inventories are stated at the lower of cost or net realizable value (“NRV”), which is defined as estimated selling prices in the ordinary course of business, less reasonably predictable costs of completion, disposal and transportation. Cost is determined on a first-in, first-out basis.
Property, Plant and Equipment, Net of Accumulated Depreciation
Land, buildings, and equipment, including precious metals, are recorded at cost. Depreciation is based on estimated useful lives of properties using the straight-line method. Except as described in Note 9 (Property, Plant and Equipment, Net of Accumulated Depreciation) to the consolidated financial statements related to the depletion of precious metals, the estimated useful lives range from 10 to 40 years for buildings and 2 to 20 years for equipment.
Included in the subcategory of equipment are the following types of assets (excluding precious metals):
| |
| |
Asset type | Range of useful life |
Computer hardware and software | 3 to 7 Year |
Manufacturing equipment | 2 to 15 Year |
Furniture and fixtures | 5 to 10 Year |
Transportation equipment | 3 to 20 Year |
Manufacturing equipment includes certain components of production equipment that are constructed of precious metals. These assets are not depreciated because they have very low physical losses and are repeatedly reclaimed and reused in the Company’s manufacturing processes over a very long useful life. The physical loss of precious metals in the manufacturing and reclamation process is treated as depletion and these losses are accounted for as a period expense based on actual units lost. Precious metals are integral to many glass production processes and are only acquired to support operations. These metals are not held for trading or other purposes.
Leases
Corning leases certain real estate, vehicles, and equipment from third parties. Corning classifies leases as either financing or operating. Operating leases are included in other assets, with the corresponding liability in other accrued liabilities and other liabilities, on the consolidated balance sheets. Finance leases are included in property, plant and equipment, with the corresponding liability in the current portion and long-term debt line items on the consolidated balance sheets. As a practical expedient, lease and non-lease components of a contract are accounted for as a single lease component across all underlying asset classes. Corning does not have any significant agreements as a lessor.
Lease expense is recognized on a straight-line basis over the lease term for operating leases. Financing leases are recognized on the effective interest method for interest expense and straight-line method for asset amortization. Renewals and terminations are included in the calculation of the Right of Use (“ROU”) assets and lease liabilities when considered to be reasonably certain to be exercised. When the implicit rate is unknown, the incremental borrowing rate, based on commencement date, is used in determining the present value of lease payments.
Corning’s leases do not include residual value guarantees. The Company is not the primary beneficiary in and does not have other forms of variable interests with the lessor of the leased assets.
Refer to Note 7 (Leases) to the consolidated financial statements for additional information.
Impairment of Long-Lived Assets
The recoverability of long-lived assets, such as plant and equipment and intangible assets, is reviewed when events or changes in circumstances occur that indicate the carrying value of the asset or asset group may not be recoverable. When impairment indicators are present, the estimated undiscounted future cash flows, including the eventual disposition of the asset group at market value, is compared to the assets’ carrying value to determine if the asset group is recoverable. For an asset group that fails the test of recoverability, the estimated fair value of long-lived assets is determined using an “income approach” that starts with the forecast of all the expected future net cash flows including the eventual disposition at market value of long-lived assets, and considers the fair market value of all precious metals. The recoverability of the carrying value of long-lived assets was assessed at the lowest level for which identifiable cash flows are largely independent of the cash flows of other assets and liabilities. If there is an impairment, a loss is recorded to reflect the difference between the assets’ fair value and carrying value.
We are required to assess the recoverability of the carrying value of long-lived assets when an indicator of impairment has been identified. We review long-lived assets in each quarter in which impairment indicators are present. We must exercise judgment in assessing whether an event of impairment has occurred. For the year ended December 31, 2020, Corning incurred a long-lived asset impairment and disposal loss for an asset group related to the reassessment of research and development programs within “All Other”. Given the economic environment and market opportunities, Corning discontinued its investment in these research and development programs. The impairment analysis and disposition of certain assets resulted in a total pre-tax charge of $217 million, which was substantially all the carrying value, inclusive of an insignificant amount of goodwill. The fair value of the asset group for the impairment analysis was measured using unobservable (Level 3) inputs.
Employee Retirement Plans
Corning offers employee retirement plans consisting of defined benefit pension plans covering certain domestic and international employees and postretirement plans that provide health care and life insurance benefits for eligible retirees and dependents. The costs and obligations related to these benefits reflect the Company’s assumptions related to general economic conditions (particularly interest rates), expected return on plan assets, rate of compensation increase for employees and health care trend rates. The cost of providing plan benefits depends on demographic assumptions including retirements, mortality, turnover and plan participation.
Costs for defined benefit pension plans consist of two elements: 1) on-going costs recognized quarterly, which are comprised of service and interest costs, expected return on plan assets and amortization of prior service costs; and 2) mark-to-market gains and losses outside of the corridor, where the corridor is equal to 10% of the greater of the benefit obligation or the market-related value of plan assets at the beginning of the year, which are recognized annually in the fourth quarter of each year. These gains and losses result from changes in actuarial assumptions and the differences between actual and expected return on plan assets. Any interim remeasurement, triggered by a curtailment, settlement or significant plan change, as well as any true-up to the annual valuation, is recognized as a mark-to-market adjustment in the quarter in which such event occurs.
Costs for postretirement benefit plans consist of on-going costs recognized quarterly, and are comprised of service and interest costs, amortization of prior service costs and amortization of actuarial gains and losses. Actuarial gains and losses resulting from changes in actuarial assumptions are recognized as a component of accumulated other comprehensive income in shareholders’ equity on an annual basis and amortized into operating results over the average remaining service period of employees expected to receive benefits under the plans, to the extent such gains and losses are outside the corridor.
Refer to Note 13 (Employee Retirement Plans) to the consolidated financial statements for additional detail.
Income Taxes
The Company accounts for income taxes using the asset and liability method. Under this method, deferred tax assets and liabilities are recognized for the future tax consequences attributable to operating loss and tax credit carryforwards and for differences between the carrying amounts of existing assets and liabilities and their respective tax bases.
The effective income tax rate reflects the assessment of the ultimate outcome of tax audits. In evaluating the tax benefits associated with our various tax filing positions, we record a tax benefit for uncertain tax positions using the highest cumulative tax benefit that is more likely than not to be realized. Adjustments are made to our liability for unrecognized tax benefits in the period in which we file the return containing the tax position or when new information becomes available. The liability for unrecognized tax benefits, including accrued penalties and interest, is included in other accrued liabilities and other long-term liabilities on the consolidated balance sheets and in income tax expense in the consolidated statements of income.
Discrete events such as audit settlements or changes in tax laws are recognized in the period in which they occur. Valuation allowances are established when management is unable to conclude that it is more likely than not that some portion, or all, of the deferred tax asset will ultimately be realized.
Generally, Corning will indefinitely reinvest the foreign earnings of: (1) any of its subsidiaries located in jurisdictions where Corning lacks the ability to repatriate its earnings, (2) any of its subsidiaries where Corning’s intention is to reinvest those earnings in operations, (3) legal entities for which Corning holds a non-controlling interest, (4) any subsidiaries with an accumulated deficit in earnings and profits, (5) any subsidiaries which have a positive earnings and profits balance but for which the entity lacks sufficient local statutory earnings or stock basis from which to make a distribution, and (6) any of its subsidiaries where future distribution would trigger a significant net cost to the U.S. shareholder.
Equity Method Investments
Equity method investments are reviewed for impairment on a periodic basis, or if an event occurs or circumstances change that indicate the carrying amount may be impaired. This assessment is based on a review of the equity investments’ performance and a review of indicators of impairment to determine if there is evidence of a loss in value.
For an equity investment with impairment indicators, the fair value is measured based on discounted cash flows, or other appropriate valuation methods, depending on the nature of the company involved. If it is probable that the carrying amount of the investment cannot be recovered, the impairment is considered other-than-temporary and recorded in earnings, and the equity investment balance is reduced to its fair value.
All equity securities that do not result in consolidation and are not accounted for under the equity method are measured at fair value with changes therein reflected in net income. The Company utilizes the measurement alternative for equity investments that do not have readily determinable fair values and measures these investments at cost less impairment plus or minus observable price changes in orderly transactions. The balance of these investments is disclosed in Note 3 (Investments) to the consolidated financial statements.
Fair Value Measurements
Major categories of financial assets and liabilities, including short-term investments, other assets and derivatives are measured at fair value on a recurring basis. Certain assets and liabilities are measured at fair value on a nonrecurring basis when impaired, which include long-lived assets, goodwill, asset retirement obligations, equity method investments and other investments that Corning cannot significantly influence.
Fair value is the price that would be received from selling an asset or paid to transfer a liability in an orderly transaction between market participants at the measurement date. When determining the fair value measurements for assets and liabilities required to be recorded at fair value, the principal or most advantageous market in which we would transact is analyzed. Assumptions that market participants would use when pricing the asset or liability, such as inherent risk, transfer restrictions, and risk of non-performance, are considered.
Derivative Instruments
The Company enters into a variety of foreign exchange forward contracts and foreign exchange option contracts to manage the exposure to fluctuations in foreign exchange rates. Interest rate swaps are utilized to reduce the risk of changes in a benchmark interest rate from the probable forecasted issuance of debt and manage the mix of fixed and floating rate debt. Financial exposure is managed in accordance with corporate policies and procedures.
All derivatives are recorded at fair value on the consolidated balance sheets. Changes in the fair value of derivatives designated as cash flow hedges and hedges of net investments in foreign operations are not recognized in current operating results but are recorded in accumulated other comprehensive income. Amounts related to cash flow hedges are reclassified from accumulated other comprehensive income when the underlying hedged item impacts earnings. This reclassification is recorded in the same line item of the consolidated statements of income as where the effects of the hedged item are recorded, typically sales, cost of sales or other expense, net. Changes in the fair value of derivatives not designated as hedging instruments are recorded in the consolidated statements of income in the translated earnings contract (loss) gain, net and the other expense, net lines.
New Accounting Standards
On January 1, 2020, Corning adopted Accounting Standards Update (“ASU”) No. 2016-13 ASC (Topic 326), Financial Instruments - Credit Losses. The ASU introduces a new accounting model, the Current Expected Credit Losses model (CECL), which requires earlier recognition of credit losses and additional disclosures related to credit risk. The CECL model utilizes a lifetime expected credit loss measurement objective for the recognition of credit losses at the time the financial asset is originated or acquired. The CECL model was adopted to recognize credit losses of financial assets using a modified retrospective method of accounting as of January 1, 2020. The impact of adopting the new standard to the financial statements was a nominal reduction to beginning retained earnings.
As of December 31, 2020, there are no other newly issued accounting standards expected to have a material impact on Corning’s financial statements or disclosures.
2.Restructuring, Impairment and Other Charges and Credits
In 2020, and in response to uncertain global economic conditions, Corning undertook actions to transform the Company’s cost structure and improve operational efficiency. These actions included a corporate-wide workforce reduction program, disposals of certain assets and accelerated depreciation associated with the capacity realignment of certain manufacturing facilities as well as other exit charges and credits.
During the years ended December 31, 2020, 2019 and 2018, the following restructuring, impairment and other charges and credits were recorded (in millions):
| | | | | | | | | |
``` | | | | | | | | | |
| | Year ended December 31, |
| | 2020 | | 2019 | | 2018 |
Severance | | $ | 148 | | $ | 63 | | $ | 16 |
Asset impairment | | | 217 | | | | | | |
Capacity realignment | | | 304 | | | 312 | | | 80 |
Other charges and credits | | | 158 | | | 64 | | | 34 |
Total restructuring, impairment and other charges and credits | | $ | 827 | | $ | 439 | | $ | 130 |
| | | | | | | | | |
Severance
In the second quarter of 2020, the Company implemented a corporate-wide workforce reduction program. Severance charges were primarily incurred to facilitate realignment of capacity in the Asia regions for the Display Technologies segment, optimize the Optical Communications segment and contain corporate costs. For the years ended December 31, 2020, 2019 and 2018, severance charges were $148 million, $63 million and $16 million, respectively. As of December 31, 2020, the unpaid severance liabilities of $45 million are expected to be substantially completed within the next twelve months.
Asset Impairment
For the year ended December 31, 2020, Corning incurred a long-lived asset impairment and disposal loss for an asset group related to the reassessment of research and development programs within “All Other”. Given the economic environment and market opportunities, Corning discontinued its investment in these research and development programs. The impairment analysis and disposition of certain assets resulted in a total pre-tax charge of $217 million, which was substantially all the carrying value, inclusive of an insignificant amount of goodwill.
Capacity Realignment
Capacity realignment for the year ended December 31, 2020, primarily includes accelerated depreciation and asset disposals associated with the exit of certain facilities and other exit activities in the Display Technologies and Specialty Materials business segments. Capacity realignment for the year ended December 31, 2019, is primarily comprised of accelerated depreciation associated with the exit of certain facilities in the Display Technologies segment. Capacity realignment for the year ended December 31, 2018, primarily includes accelerated depreciation and asset disposals in the Specialty Materials business and “All Other”.
The following tables present the impact and respective location of total restructuring, impairment, and other charges and credits on the consolidated statements of income (in millions):
| | | | | | | | | | | | | | | |
| | | | | | | | | | | | | | | |
| | Year ended December 31, 2020 |
| | | | | Selling, | | Research, | | | | |
| | | | | general | | development | | | | |
| | | | | and | | and | | | | |
| | Gross | | admin. | | engineering | | | | |
| | margin (1) | | expenses | | expenses | | Other | | Total |
Severance | | $ | 83 | | $ | 34 | | $ | 31 | | | | | $ | 148 |
Asset impairment | | | | | | 6 | | | 211 | | | | | | 217 |
Capacity realignment | | | 288 | | | 16 | | | | | | | | | 304 |
Other charges and credits | | | 72 | | | 60 | | | 5 | | $ | 21 | | | 158 |
Total restructuring,
impairment and
other charges and credits | | $ | 443 | | $ | 116 | | $ | 247 | | $ | 21 | | $ | 827 |
| | | | | | | | | | | | | | | |
| | | | | | | | | | | | | | | |
| | Year ended December 31, 2019 |
| | | | | Selling, | | Research, | | | | |
| | | | | general | | development | | | | |
| | | | | and | | and | | | | |
| | Gross | | admin. | | engineering | | | | |
| | margin (1) | | expenses | | expenses | | Other | | Total |
Severance | | $ | 30 | | $ | 20 | | $ | 13 | | | | | $ | 63 |
Capacity realignment | | | 298 | | | | | | 14 | | | | | | 312 |
Other charges and credits | | | 60 | | | 8 | | | 3 | | $ | (7) | | | 64 |
Total restructuring,
impairment and
other charges and credits | | $ | 388 | | $ | 28 | | $ | 30 | | $ | (7) | | $ | 439 |
| | | | | | | | | | | | | | | |
| | Year ended December 31, 2018 |
| | | | | Selling, | | Research, | | | | |
| | | | | general | | development | | | | |
| | | | | and | | and | | | | |
| | Gross | | admin. | | engineering | | | | |
| | margin (1) | | expenses | | expenses | | Other | | Total |
Severance | | $ | 1 | | $ | 15 | | | | | | | | $ | 16 |
Capacity realignment | | | 76 | | | | | $ | 4 | | | | | | 80 |
Other charges and credits | | | 20 | | | 5 | | | 2 | | $ | 7 | | | 34 |
Total restructuring,
impairment and
other charges and credits | | $ | 97 | | $ | 20 | | $ | 6 | | $ | 7 | | $ | 130 |
(1)Activity reflected in cost of sales.
3.Investments
Investments are comprised of the following (in millions):
| | | | | | | | |
| | | | | | | | |
| | Ownership | | December 31, |
| | interest | | 2020 | | 2019 |
Affiliated companies accounted for by the equity method (1) | | 20% to 50% | | $ | 258 | | $ | 291 |
Other investments (2) | | | | | 177 | | | 43 |
Subtotal investment assets | | | | $ | 435 | | $ | 334 |
| | | | | | | | |
Affiliated companies accounted for by the equity method HSG (3) | | 50% | | $ | — | | $ | 270 |
Subtotal investment liabilities | | | | $ | — | | $ | 270 |
(1)Amounts reflect Corning’s direct ownership interest in the affiliated companies at December 31, 2020 and 2019.
(3)Included in other investments were equity securities with readily available fair values that were measured using Level 1 inputs, in the amount of $137 million as of December 31, 2020. The increase in the investment balance is primarily driven by a recognized gain of $107 million from the initial public offering of an investment in the fourth quarter of 2020. Refer to Note 16 (Fair Value Measurements) for additional information.
(3)Corning began consolidating HSG on September 9, 2020. At December 31, 2019, the negative carrying value of Corning’s investment in HSG was $270 million and recorded in other liabilities.
Affiliated Companies at Equity Method
The results of operations and financial position of the investments accounted for under the equity method is presented below as of December 31 for each respective year (in millions):
| | | | | | | | | |
| | | | | | | | | |
| | 2020 | | 2019 | | 2018 |
Statement of operations (1): | | | | | | | | | |
Net sales | | $ | 1,201 | | $ | 1,508 | | $ | 1,759 |
Gross profit | | $ | 136 | | $ | 79 | | $ | 424 |
Net (loss) income | | $ | (48) | | $ | (102) | | $ | 835 |
Net (loss) income attributable to the affiliated companies | | $ | (15) | | $ | 70 | | $ | 798 |
Corning’s equity in (losses) earnings of affiliated companies | | $ | (25) | | $ | 17 | | $ | 390 |
| | | | | | | | | |
Related party transactions: | | | | | | | | | |
Corning sales to affiliated companies | | $ | 253 | | $ | 277 | | $ | 184 |
Corning purchases from affiliated companies | | $ | 8 | | $ | 12 | | $ | 11 |
Corning transfers of assets, at cost, to affiliated companies | | $ | 9 | | $ | 8 | | $ | 2 |
Dividends received from affiliated companies | | $ | 1 | | $ | 106 | | $ | 241 |
Intercompany sales within HSG (included in net sales) | | $ | 55 | | $ | 112 | | $ | 206 |
| | | | | | | | | |
| | 2020 | | 2019 | | | |
Balance sheet: | | | | | | | | | |
Current assets | | $ | 534 | | $ | 1,566 | | | |
Noncurrent assets | | $ | 466 | | $ | 943 | | | |
Short-term borrowings, including current portion
of long-term debt | | $ | 2 | | $ | 4 | | | |
Other current liabilities | | $ | 164 | | $ | 632 | | | |
Long-term debt | | $ | 60 | | $ | 68 | | | |
Other long-term liabilities | | $ | 11 | | $ | 1,522 | | | |
Non-controlling interest | | $ | | | $ | 42 | | | |
| | | | | | | | | |
Related party transactions: | | | | | | | | | |
Balances due from affiliated companies | | $ | 36 | | $ | 42 | | | |
Balances due to affiliated companies | | $ | 1 | | $ | 4 | | | |
Intercompany receivables and payables within HSG
(included in current assets and other current liabilities) | | | | | $ | 15 | | | |
| | | | | | | | | |
(1)The year ended December 31, 2020, only include HSG’s results of operations through September 8, 2020. Immediately following the Redemption, Corning began consolidating HSG on September 9, 2020.
As of December 31, 2020 and 2019, the undistributed earnings of equity companies included in retained earnings were not material.
Hemlock Semiconductor Group (“HSG”)
In 2016, Corning realigned its ownership interest in Dow Corning, exchanging its 50% interest in the joint venture between Corning and Dow Chemical for a newly formed company that held a 49.9% interest in Hemlock Semiconductor LLC and a 40.25% interest in Hemlock Semiconductor Operations LLC which were recorded as equity method investments of Corning and are affiliated companies of HSG. DuPont de Nemours, Inc. (“DuPont”) subsequently undertook Dow Chemical Company’s ownership interest in HSG. HSG manufactures polysilicon products for the semiconductor and solar industries, and it is one of the world’s leading providers of ultra-pure polycrystalline silicon to the semiconductor industry.
2020
On September 9, 2020, HSG entered into a series of agreements with DuPont resulting in a change in control and consolidation for Corning.
HSG acquired DuPont’s TCS manufacturing assets, which was determined to be a business and recorded as a business combination. The fair value of the purchase price was $255 million. In conjunction with this acquisition, HSG settled the TCS Settlement for a contractual amount of $175 million, which was determined to have a fair value of $200 million. Corning’s share of the pre-tax loss was $81 million and recorded in equity in (losses) earnings of affiliated companies in the consolidated statements of income. See Note 4 (HSG Transactions and Acquisitions) to the consolidated financial statements for more information.
Hemlock Semiconductor LLC and Hemlock Semiconductor Operations LLC, of which Corning previously held 49.9% and 40.25% ownership interest, respectively, were recorded as equity method investments and are affiliates of Hemlock Semiconductor Group (HSG). On September 9, 2020, HSG redeemed DuPont’s entire ownership interest in HSG with a fair value of $250 million (“Redemption”). Upon completion of the Redemption, Corning obtained a controlling interest of 100% in Hemlock Semiconductor LLC and 80.5% in Hemlock Semiconductor Operations LLC and began consolidating HSG.
Since September 9, 2020, HSG’s revenue of $194 million has been consolidated in “All Other” in Corning’s consolidated statements of income for the year ended December 31, 2020. The amount of net income is not material to Corning’s consolidated financial statements for the current year.
See Note 4 (HSG Transactions and Acquisitions) to the consolidated financial statements for more information.
2019
In prior years, HSG’s solar and semiconductor customers entered into long-term “take or pay” contracts which included up-front cash payments to secure capacity. During the last few years, and more significantly in 2019, the solar power panel industry experienced significant over-capacity in the market, resulting in declining sales volumes and market prices. As a result, HSG’s solar business experienced lower market penetration, overall price declines, and settled contracts with customers that had committed volume and fixed pricing above the current market price. While these settlements positively impacted HSG’s cash flow in 2019, they reduced expectations for future sales in HSG’s solar business.
Due to the adverse change in HSG’s solar business, HSG was required to assess the recoverability of its long-lived assets in the fourth quarter of 2019. Based on this assessment, HSG determined that the carrying values of HSG’s solar asset group significantly exceeded its fair values. HSG engaged a third-party appraiser to assist in determining the fair value of the assets within in the solar asset group based on the highest and best use of the asset group. As a result of the fair value determination, HSG recognized a pre-tax asset impairment charge of $916 million for the year ended December 31, 2019. Corning’s share of the pre-tax impairment was $369 million.
Due to the adverse changes above, the carrying values of HSG’s solar business inventories were also affected resulting in an inventory write-down of $257 million for the year. Corning’s pre-tax share of the provision was $105 million.
In addition, HSG settled certain revenue contracts in the fourth quarter of 2019, resulting in settlement gains of $383 million in net income. Corning’s share of the settlement gains was $185 million.
HSG’s results of operations and balance sheet through September 8, 2020 were as follows (in millions):
| | | | | | | | | |
| | | | | | | | | |
| | Year ended December 31, |
| | 2020 | | 2019 | | 2018 |
Statement of operations (1): | | | | | | | | | |
Net sales | | $ | 423 | | $ | 779 | | $ | 1,158 |
Gross profit | | $ | 87 | | $ | 9 | | $ | 367 |
Net income (loss) (2) | | $ | 11 | | $ | (117) | | $ | 814 |
Net income attributable to HSG | | $ | 44 | | $ | 54 | | $ | 776 |
Corning’s equity in earnings of affiliated companies | | $ | 22 | | $ | 27 | | $ | 388 |
| | | | | | | | | |
Related party transactions: | | | | | | | | | |
Dividends received from affiliated companies | | | | | $ | 100 | | $ | 241 |
Intercompany sales within HSG (included in net sales) | | $ | 55 | | $ | 112 | | $ | 206 |
| | | | | | | | | |
| | 2020 | | 2019 | | | |
Balance sheet (3): | | | | | | | | | |
Current assets | | $ | 853 | | $ | 1,011 | | | |
Noncurrent assets | | $ | 725 | | $ | 420 | | | |
Short-term borrowings, including current portion
of long-term debt | | $ | 178 | | $ | 3 | | | |
Other current liabilities | | $ | 337 | | $ | 412 | | | |
Long-term debt | | $ | 6 | | $ | 8 | | | |
Other long-term liabilities | | $ | 1,499 | | $ | 1,507 | | | |
Non-controlling interest | | $ | 9 | | $ | 42 | | | |
| | | | | | | | | |
Related party transactions: | | | | | | | | | |
Intercompany receivables and payables within HSG
(included in current assets and other current liabilities) | | $ | 8 | | $ | 15 | | | |
| | | | | | | | | |
(1)The year ended December 31, 2020, only include HSG’s results of operations through September 8, 2020. Immediately following the Redemption, Corning began consolidating HSG on September 9, 2020.
(2)HSG’s net income for the period ended September 8, 2020, included a pre-tax gain recorded in the second quarter of 2020, related to the settlement of a long-term supply agreement of approximately $165 million, partially offset by an inventory provision of approximately $44 million associated with the settlement of the agreement. Prior to the Redemption, in the third quarter of 2020, HSG recorded a pre-tax loss of $200 million resulting from the TCS Settlement, of which Corning’s share of the pre-tax loss was $81 million. Accordingly, Corning’s share of the net impact was an equity loss of $19 million.
(3)HSG’s balance sheet were presented as of September 8, 2020 and December 31, 2019, respectively.
4.HSG Transactions and Acquisitions
HSG Transactions
On September 9, 2020, HSG acquired DuPont’s TCS manufacturing assets, which was determined to be a business and recorded as a business combination. The fair value of the purchase price was $255 million. In conjunction with this acquisition, HSG resolved the TCS Settlement for a contractual amount of $175 million, which was determined to have a fair value of $200 million. HSG will pay for the TCS Settlement over three years with equal annual payments of approximately $58 million.
The Redemption was funded with HSG’s existing cash on-hand of $75 million and its newly obtained third-party debt of $175 million, maturing on September 8, 2021. The third-party debt was recorded as a non-cash financing activity on Corning’s consolidated statements of cash flows. In December 2020, HSG repaid $100 million on the third-party debt. Refer to Note 3 (Investments) and Note 12 (Debt) to the consolidated financial statements for additional information.
Hemlock Semiconductor LLC and Hemlock Semiconductor Operations LLC, of which Corning previously held 49.9% and 40.25% ownership interest, respectively, were recorded as equity method investments and are affiliates of Hemlock Semiconductor Group (HSG). As of September 9, 2020, HSG redeemed Dupont’s entire ownership of HSG with a value of $250 million (Redemption), Upon completion of the redemption, Corning obtained a 100% interest in HS LLC and 80.5% interest in HSO LLC. Corning accounted for the Redemption under the acquisition method of accounting in accordance with business combinations without the transfer of net cash consideration. The Redemption price of $250 million approximated the fair value of Corning’s equity interest in HSG immediately preceding the Redemption.
The fair value of Corning’s equity interest in HSG was estimated by applying the income approach, which was based on significant assumptions such as projected revenue and discount rate. The Company used a discount rate of 16.5% and terminal growth rate of zero. As no net-cash consideration was transferred, the fair value of Corning’s previously held equity interest in HSG was used to measure the goodwill resulting from the Redemption and the Company’s controlling interest after the Redemption.
Corning recognized a pre-tax gain of $498 million on its previously held equity investment in HSG as a result of the consolidation resulting from the Redemption. The gain was calculated based on the difference between the fair value and carrying value of the equity method investment immediately preceding the Redemption and included in the transaction-related gain, net in Corning’s consolidated statements of income for the year ended December 31, 2020.
The net gain on previously owned equity was calculated as follows (in millions):
| | |
| | |
Fair value of previously held equity investment | $ | 250 |
Equity investment liability balance as of acquisition date | | (248) |
Corning’s gain on previously held equity investment | $ | 498 |
The following table summarizes the amounts of recorded assets acquired and liabilities assumed as of September 9, 2020, which include the TCS assets and liabilities acquired by HSG immediately prior to the Redemption and the consolidation by Corning.
Recognized amounts of identified assets and liabilities recorded at fair value (in millions):
| | |
| | |
Inventory | $ | 503 |
Property, plant and equipment | | 651 |
Intangible assets | | 285 |
Other current and non-current assets (1) | | 173 |
Short-term borrowings | | (178) |
Trade payables and other accrued liabilities | | (329) |
Other liabilities | | (1,261) |
Total identified net liabilities | | (156) |
Non-controlling interests (2) | | (102) |
Total fair value of Corning's previously held equity investment (2) | | (250) |
Goodwill (3) | $ | 508 |
(1)The other current and non-current assets included a contingent consideration asset of $20 million at fair value for a cost adjustment contract related to the TCS Transaction. Refer to Note 3 (Investments) and Note 16 (Fair Value Measurements) to the consolidated financial statements for additional information.
(2)The purchase price used to measure the goodwill of the Redemption is $352 million, including the fair value of Corning’s previously held equity interest and non-controlling interest, in the amount of $250 million and $102 million, respectively.
(3)The goodwill recognized is not deductible for U.S. income tax purposes. The goodwill was allocated to “All Other” within segment reporting as disclosed in Note 20 (Reportable Segments) to the consolidated financial statements for more information.
Upon completion of the Redemption and resulting consolidation, Corning recorded preliminary values of assets acquired and liabilities assumed from HSG, including a customer deposit liability and deferred revenue.
Corning recorded a customer deposit liability of $264 million at the fair value of refundable payments that HSG received from a customer under a long-term supply agreement. The discount rates used to calculate the present value of the customer deposit range from 2.54% to 3.23%. The deposits will be repaid from 2029 to 2034 provided that all purchase obligations of this customer under the supply agreement have been satisfied.
Corning also recorded deferred revenue of $1,070 million at fair value related to the performance obligations of non-refundable consideration previously received by HSG from its customers under long term supply agreements. The fair values of deferred revenue were estimated by applying a bottoms-up cost buildup method of the cost approach based on significant inputs such as the cost to fulfill the obligations as well as key inputs including a normal profit margin.
The goodwill is primarily related to other intangibles and synergies of the acquired business which do not qualify for separate recognition. Intangible assets consist primarily of $215 million of developed technologies and know-how, and $70 million of other intangibles that are amortized over the weighted average useful life of approximately 20 and 15 years, respectively. Acquisition-related costs of $12 million for the year ended December 31, 2020, included costs for legal and other professional services and were included in selling, general and administrative expense in the consolidated statements of income.
The fair value of the non-controlling interest in HSG was estimated to be $102 million by applying the income approach, using the same key assumptions as the estimate of fair value for Corning’s equity interest in HSG.
Since September 9, 2020, HSG’s revenue of $194 million has been consolidated in “All Other” in Corning’s consolidated statements of income for the year ended December 31, 2020. The amount of net income is not material to Corning’s consolidated financial statements for the current year.
Acquisitions
There were no material acquisitions completed in 2020 or 2019.
During 2018, Corning acquired substantially all of 3M Company’s (3M) Communication Markets Division in two cash transactions totaling $841 million. Corning acquired a manufacturing facility and a business, which designs, manufactures and markets high bandwidth and optical fiber products. The acquisition was accounted for as a business combination.
A summary of the allocation of the total purchase price to the net tangible and other intangible assets acquired, with the remainder recorded as goodwill based on fair value is as follows (in millions):
| | |
| | |
Property, plant and equipment | $ | 32 |
Other intangible assets | | 525 |
Other net assets | | 13 |
Total identified net assets | | 570 |
Purchase consideration | | 841 |
Goodwill (1)(2) | $ | 271 |
(1)Amounts reflect measurement period adjustments.
(2)The goodwill recognized is deductible for U.S. income tax purposes. The goodwill was allocated to the Optical Communications segment.
Goodwill is related to the value of CMD’s product and customer portfolio and its combination with Corning’s existing optical communications platform, as well as synergies and other intangibles that do not qualify for separate recognition. Other intangible assets consist primarily of $434 million of customer relationships and $91 million of other intangibles that are amortized over the weighted average useful life of approximately 14 and 11 years, respectively. Acquisition-related costs of $18 million for the year ended December 31, 2018, included costs for legal, accounting, valuation and other professional services and were included in selling, general and administrative expense in the consolidated statements of income. Supplemental pro forma information was not provided because the acquisition was not material to Corning’s consolidated financial statements.
5.Revenue
Product Revenue (Point in Time)
Most of the Company’s revenue is generated by delivery of products to customers and recognized at a point in time based on evaluation of when the customer obtains control of the products. Revenue is recognized when all performance obligations under the terms of a contract are satisfied, and control of the product has been transferred to the customer. If customer acceptance clauses are present and it cannot be objectively determined that control has been transferred, revenue is only recorded when customer acceptance is received and all performance obligations have been satisfied. Sales of goods typically do not include multiple product and/or service elements.
Revenue is measured as the amount of consideration expected to be received in exchange for transferring goods or providing services. Sales tax, value-added tax, and other taxes are collected concurrently with revenue-producing activities are excluded from revenue. Incidental contract costs that are not material in the context of the delivery of goods and services are recognized as expense.
At the time revenue is recognized, allowances are recorded, with the related reduction to revenue, for estimated product returns, allowances and price discounts based upon historical experience and related terms of customer arrangements. Where product warranties are offered, liabilities are established for estimated warranty costs based upon historical experience and specific warranty provisions. Warranty liabilities are adjusted when experience indicates the expected outcome will differ from initial estimates of the liability. Product warranty liabilities were not material at December 31, 2020 and 2019.
Other Revenue (Over Time)
Corning’s revenue over time is mainly related to Telecommunications products, and comprised of design, installation, training and software maintenance services. The performance obligations under these contracts generally require services to be performed over time, resulting in either a straight-line amortization method or an input method using incurred and forecasted expense to predict revenue recognition patterns which follows satisfaction of the performance obligations. Corning’s other revenue is inconsequential to consolidated results.
Revenue Disaggregation Table
The following table shows revenue by major product categories, similar to the reportable segment disclosure. Within each product category, contract terms, conditions and economic factors affecting the nature, amount, timing and uncertainty around revenue recognition and cash flows are substantially similar. The commercial markets and selling channels are also similar. Except for an inconsequential number of Telecommunications products, product category revenue is recognized at point in time when control transfers to the customer.
Revenue by product category is as follows (in millions):
| | | | | | | | | |
| | | | | | | | | |
| | Year ended December 31, |
| | 2020 | | 2019 | | 2018 |
Display products | | $ | 3,077 | | $ | 3,180 | | $ | 3,168 |
| | | | | | | | | |
Telecommunication products | | | 3,563 | | | 4,064 | | | 4,192 |
| | | | | | | | | |
Specialty glass products | | | 1,884 | | | 1,594 | | | 1,479 |
| | | | | | | | | |
Environmental substrate and filter products | | | 1,333 | | | 1,440 | | | 1,289 |
| | | | | | | | | |
Life science products | | | 981 | | | 995 | | | 946 |
| | | | | | | | | |
All Other | | | 465 | | | 230 | | | 216 |
Total Revenue | | $ | 11,303 | | $ | 11,503 | | $ | 11,290 |
Impact of foreign currency movements (1) | | | 44 | | | 153 | | | 108 |
Cumulative adjustment related to customer contract | | | 105 | | | | | | |
Net sales of reportable segments and All Other | | $ | 11,452 | | $ | 11,656 | | $ | 11,398 |
| | | | | | | | | |
(1)This amount primarily represents the impact of foreign currency adjustments in the Display Technologies, Environmental Technologies and Life Sciences segments.
At the end of 2015, Corning entered into an agreement with a customer pursuant to which Corning exchanged contingent consideration, for the incremental fair value associated with several commercial agreements, including the amendment of the customer’s long-term supply agreement. The net present fair value of the commercial benefit asset related to the long-term supply agreement of $212 million was reclassified to the other asset line of the consolidated balance sheets and amortized over the term of agreement as a reduction in revenue. During March 2020, this customer announced its decision to exit its production of LCD panels by the end of 2020. Based on this announcement, Corning recorded a cumulative adjustment of $105 million during the first quarter of 2020 and recognized the remaining balance as a reduction to revenue over the remainder of the current year. Due to the one-time nature of this cumulative adjustment, it has been excluded from segment results. However, it is included in the reconciliation from segment net income (loss) to consolidated net income.
Refer to Note 20 (Reportable Segments) to the consolidated financial statements for additional information.
Contract Assets and Liabilities
Contract assets, such as incremental costs to obtain or fulfill contracts, are an insignificant component of Corning’s revenue recognition process. Most of Corning’s cost of fulfillment as a manufacturer of products is classified as inventory, fixed assets and intangible assets, which are accounted for under the respective guidance for those asset types. Other costs of contract fulfillment are immaterial due to the nature of the products and their respective manufacturing processes.
Contract liabilities include deferred revenue, other advanced payments and customer deposits. Other advanced payments are not significant to operations and are classified as part of other accrued liabilities in the financial statements. Customer deposits are predominately related to Display products and deferred revenue is predominately related to obtaining a controlling interest in HSG. Both are classified as part of other accrued liabilities and other liabilities, as appropriate, and are disclosed below. Refer to Note 4 (HSG Transactions and Acquisitions) to the consolidated financial statements for additional information.
Customer Deposits
As of December 31, 2020 and 2019, Corning had customer deposits of approximately $1.4 billion and $1.0 billion. The majority of these were non-refundable cash deposits for customers to secure rights to an amount of glass produced by Corning under long-term supply agreements. The duration of these long-term supply agreements ranges up to 10 years. As glass is shipped to customers, Corning will recognize revenue and reduce the amount of the customer deposit liability. The increase in the balance, when compared to the prior period, was primarily driven by a customer deposit liability of $264 million recorded at the fair value of refundable payments that HSG received from a customer under a long-term supply agreement.
In the years ended December 31, 2020 and 2019, customer deposits used were $140 million and $37 million, respectively. As of December 31, 2020 and 2019, $1,148 million and $927 million were recorded as other long-term liabilities, respectively. The remaining $211 million and $104 million, respectively, were classified as other current liabilities.
Deferred Revenue
During the third quarter of 2020, Corning obtained a controlling interest in HSG and recorded deferred revenue of $1,070 million at fair value related to the performance obligations of non-refundable consideration previously received by HSG from its customers under long term supply agreements.
The deferred revenue is tracked on a per-customer contract-unit basis. As customers take delivery of the committed volumes under the terms of the contract, a per unit amount of deferred revenue is recognized when control of the promised goods is transferred to the customer based upon the units shipped compared to the remaining contractual units.
As of December 31, 2020, $872 million was classified as a long-term liability and $152 million remaining was classified as a current liability. These balances reflect reductions in deferred revenue since September 9, 2020.
Practical Expedients and Exemptions
The value of unsatisfied performance obligations is not disclosed for (i) contracts with an original expected length of one year or less and (ii) contracts for which revenue has been recognized at an amount for which the right exists to invoice for services performed.
Shipping and handling fees are treated as fulfillment costs and not as separate performance obligations under the terms of revenue contracts due to the perfunctory nature of the shipping and handling obligations.
Significant Customers
For 2020, 2019 and 2018, no customer met or exceeded 10% of Corning’s consolidated net sales.
6.Inventories, Net
Inventories, net, are comprised of the following (in millions) (1):
| | | | | |
| | | | | |
| December 31, |
| 2020 | | 2019 |
Finished goods | $ | 1,236 | | $ | 973 |
Work in process | | 357 | | | 421 |
Raw materials and accessories | | 370 | | | 481 |
Supplies and packing materials | | 475 | | | 445 |
Total inventories, net | $ | 2,438 | | $ | 2,320 |
(1)Corning obtained a controlling interest in HSG as of September 9, 2020. Consolidated inventories as of December 31, 2020, included $461 million of inventories from HSG. Refer to Note 4 (HSG Transactions and Acquisitions) to the consolidated financial statements for additional information.
7.Leases
Corning has operating and finance leases for real estate, vehicles, and equipment.
The following table shows components of lease expense (in millions):
| | | | | |
| | | | | |
| Year ended December 31, |
| 2020 | | 2019 |
Financing: | | | | | |
Depreciation of right-of-use assets | $ | 15 | | $ | 11 |
Interest on lease liabilities | | 7 | | | 12 |
Total financing lease expense | $ | 22 | | $ | 23 |
| | | | | |
Operating lease expense | $ | 133 | | $ | 110 |
Variable lease expense | | 41 | | | 38 |
Short-term lease expense | | 4 | | | 5 |
Total lease expense | $ | 200 | | $ | 176 |
| | | | | |
Total rental expense for operating leases of $156 million was recorded in the year ended 2018 and accounted for under the previous leasing standard.
The following table shows components of cash paid for amounts included in the measurement of lease liabilities (in millions):
| | | | | |
| | | | | |
| December 31, |
| 2020 | | 2019 |
Financing: | | | | | |
Principal | $ | 10 | | $ | 6 |
Interest | | 7 | | | 12 |
Total financing lease payments | $ | 17 | | $ | 18 |
| | | | | |
Operating lease payments | $ | 121 | | $ | 105 |
Total lease payments | $ | 138 | | $ | 123 |
| | | | | |
Supplemental balance sheet information related to leases was as follows (in millions, except lease term and discount rate):
| | | | | | |
| | | | | | |
| | December 31, |
| | 2020 | | 2019 |
Operating Leases: | | | | | | |
Operating lease right-of-use assets, net (1) | | $ | 680 | | $ | 504 |
| | | | | | |
Other current liabilities | | $ | 96 | | $ | 62 |
Operating lease liabilities (2) | | | 633 | | | 450 |
Total operating lease liabilities | | $ | 729 | | $ | 512 |
| | | | | | |
Finance Leases: | | | | | | |
Property and equipment, at cost | | $ | 184 | | $ | 294 |
Accumulated depreciation | | | (27) | | | (52) |
Property and equipment, net | | $ | 157 | | $ | 242 |
| | | | | | |
Current portion of long-term debt | | $ | 10 | | $ | 9 |
Long-term debt | | | 163 | | | 271 |
Total finance lease liabilities | | $ | 173 | | $ | 280 |
| | | | | | |
(1)Included in other assets.
(2)Included in other liabilities.
The weighted average remaining lease terms for operating and financing leases are 12.5 years and 15.5 years, respectively. The weighted average discount rates for operating and financing leases are 3.9% and 4.7%, respectively.
As of December 31, 2020, maturities of lease liabilities are as follows (in millions):
| | | | | | | | | | | | | | | | | | | | | | | | | | | |
| | | | | | | | | | | | | | | | | | | | | | | | | | | |
| | | 2021 | | | 2022 | | | 2023 | | | 2024 | | | 2025 | | | After 2025 | | | Gross Total | | | Imputed Discount | | | Total |
| | | | | | | | | | | | | | | | | | | | | | | | | | | |
Operating leases | | $ | 141 | | $ | 125 | | $ | 114 | | $ | 102 | | $ | 92 | | $ | 733 | | $ | 1,307 | | $ | (578) | | $ | 729 |
Financing leases | | | 13 | | | 16 | | | 21 | | | 24 | | | 12 | | | 169 | | | 255 | | | (82) | | | 173 |
As of December 31, 2020, Corning had additional operating leases, primarily for new production facilities, that have not yet commenced or been recorded, of approximately $138 million on an undiscounted basis. These operating leases will commence in fiscal year 2021 with lease terms of 20 years.
8.Income Taxes
Income before income taxes follows (in millions):
| | | | | | | | |
| | | | | | | | |
| Year ended December 31, |
| 2020 | | 2019 | | 2018 |
U.S. companies | $ | (71) | | $ | 504 | | $ | 472 |
Non-U.S. companies | | 694 | | | 712 | | | 1,031 |
Income before income taxes | $ | 623 | | $ | 1,216 | | $ | 1,503 |
The current and deferred amounts of the provision for income taxes are as follows (in millions):
| | | | | | | | |
| | | | | | | | |
| Year ended December 31, |
| 2020 | | 2019 | | 2018 |
Current: | | | | | | | | |
Federal | $ | 88 | | $ | (82) | | $ | (256) |
State and municipal | | (16) | | | (12) | | | (22) |
Foreign | | (203) | | | (354) | | | (196) |
Deferred: | | | | | | | | |
Federal | | 7 | | | 64 | | | (34) |
State and municipal | | 3 | | | 13 | | | 4 |
Foreign | | 10 | | | 115 | | | 67 |
Provision for income taxes | $ | (111) | | $ | (256) | | $ | (437) |
Amounts are reflected in the preceding tables based on the location of the taxing authorities.
Reconciliation of the U.S. statutory income tax rate to the effective tax rate for operations is as follows:
| | | | | | | | |
| | | | | | | | |
| Year ended December 31, |
| 2020 | | 2019 | | 2018 |
Statutory U.S. income tax rate | 21.0 | % | | 21.0 | % | | 21.0 | % |
State income tax, net of federal effect | 1.4 | | | 0.6 | | | 0.9 | |
Global intangible low-taxed income | (0.5) | | | 1.2 | | | 3.6 | |
Foreign derived intangible income | | | | (8.5) | | | (0.6) | |
Repatriation tax on accumulated previously untaxed
foreign earnings | 9.1 | | | | | | (1.2) | |
Remeasurement of deferred tax assets and liabilities | (13.4) | | | (0.6) | | | (0.1) | |
Rate difference on foreign earnings (1) | 7.3 | | | 5.4 | | | (2.3) | |
IRS settlements & change in reserve | 12.1 | | | 8.5 | | | 11.5 | |
Valuation allowance | 2.5 | | | (3.7) | | | (3.8) | |
Tax credits (2) | (29.7) | | | (2.8) | | | (0.7) | |
Stock compensation | (1.7) | | | (0.6) | | | (0.5) | |
Legal entity rationalization | (2.2) | | | | | | | |
Intercompany loan adjustment | 6.2 | | | (0.5) | | | | |
Non-deductible expenses | 5.8 | | | 2.1 | | | | |
Other items, net | (0.1) | | | (1.0) | | | 1.3 | |
Effective income tax rate | 17.8 | % | | 21.1 | % | | 29.1 | % |
(1)The net provision for the year ended December 31, 2020, was primarily due to stronger foreign earnings relative to U.S. earnings and net Subpart F income.
(2)The net benefit for the year ended December 31, 2020, was primarily due to a net operating loss carryback allowed under the CARES Act, as well as a change in estimate from the prior year attributable to research and development credits.
On September 9, 2020, Corning obtained a 100% controlling interest in HS LLC and an 80.5% controlling interest in HSO LLC. As a result, the deferred tax liability on the outside basis difference between book and tax basis for Corning’s investment in HS LLC and HSO LLC was adjusted by approximately $116 million.
Refer to Note 4 (HSG Transactions and Acquisitions) to the consolidated financial statements for additional information.
Generally, Corning will indefinitely reinvest the foreign earnings of: (1) any of its subsidiaries located in jurisdictions where Corning lacks the ability to repatriate its earnings, (2) any of its subsidiaries where Corning’s intention is to reinvest those earnings in operations, (3) legal entities for which Corning holds a non-controlling interest, (4) any subsidiaries with an accumulated deficit in earnings and profits, (5) any subsidiaries which have a positive earnings and profits balance but for which the entity lacks sufficient local statutory earnings or stock basis from which to make a distribution, or (6) future distribution would trigger a significant net cost to the U.S. shareholder.
During 2020, the Company distributed approximately $914 million from foreign subsidiaries to their respective U.S. parent companies. As of December 31, 2020, Corning has approximately $2 billion of indefinitely reinvested foreign earnings. It remains impracticable to calculate the tax cost of repatriating unremitted earnings which are considered indefinitely reinvested.
The tax effects of temporary differences and carryforwards that gave rise to significant portions of the deferred tax assets and liabilities are as follows (in millions):
| | | | | |
| | | | | |
| December 31, |
| 2020 | | 2019 |
Loss and tax credit carryforwards | $ | 637 | | $ | 388 |
Other assets | | 269 | | | 345 |
Asset impairments and restructuring reserves | | 29 | | | 30 |
Postretirement medical and life benefits | | 171 | | | 168 |
Other accrued liabilities | | 162 | | | 218 |
Other employee benefits | | 337 | | | 345 |
Gross deferred tax assets | | 1,605 | | | 1,494 |
Valuation allowances | | (167) | | | (215) |
Total deferred tax assets | | 1,438 | | | 1,279 |
Intangible and other assets | | (95) | | | (110) |
Fixed assets | | (375) | | | (216) |
Financing leases | | (160) | | | (121) |
Total deferred tax liabilities | | (630) | | | (447) |
Net deferred tax assets | $ | 808 | | $ | 832 |
The net deferred tax assets in the consolidated balance sheets are as follows (in millions):
| | | | | |
| December 31, |
| 2020 | | 2019 |
Deferred tax assets | $ | 1,121 | | $ | 1,157 |
Other liabilities | | (313) | | | (325) |
Net deferred tax assets | $ | 808 | | $ | 832 |
| | | | | |
Details on deferred tax assets for loss and tax credit carryforwards at December 31, 2020 are as follows (in millions):
| | | | | | | | | | | | | | |
| | | | | | | | | | | | | | |
| | | | Expiration |
| Amount | | 2021-2025 | | 2026-2030 | | 2031-2040 | | Indefinite |
Net operating losses | $ | 334 | | $ | 129 | | $ | 22 | | $ | 36 | | $ | 147 |
Tax credits | | 303 | | | 5 | | | 188 | | | 104 | | | 6 |
Totals as of December 31, 2020 | $ | 637 | | $ | 134 | | $ | 210 | | $ | 140 | | $ | 153 |
The following is a tabular reconciliation of the total amount of unrecognized tax benefits (in millions):
| | | | | | | | |
| | | | | | | | |
| 2020 | | 2019 | | 2018 |
Balance at January 1 | $ | 62 | | $ | 435 | | $ | 252 |
Additions based on tax positions related to the current year | | 19 | | | 3 | | | 204 |
Additions for tax positions of prior years | | 53 | | | 2 | | | |
Reductions for tax positions of prior years | | | | | | | | (10) |
Settlements and lapse of statute of limitations | | (3) | | | (378) | | | (11) |
Balance at December 31 | $ | 131 | | $ | 62 | | $ | 435 |
During 2020, the Internal Revenue Service (“IRS”) opened an audit for tax years 2015-2018. We do not expect additional material exposure for the tax years under audit. However, if upon conclusion of these matters, the ultimate determination of taxes owed is for an amount materially different than our current position, our overall tax expense and effective tax rate could be materially impacted in the period of adjustment.
The additions for tax positions of prior years were primarily due to tax audits, development of tax court cases, and tax law changes in various jurisdictions.
Included in the balance at December 31, 2020, 2019 and 2018 are $102 million, $35 million and $263 million, respectively, of unrecognized tax benefits that would impact the Company’s effective tax rate if recognized.
Accrued interest and penalties associated with uncertain tax positions are recognized as part of tax expense. For the years ended December 31, 2020, 2019 and 2018 the amount recognized in interest expense and accrued for the payment of interest and penalties were not material.
It is possible that the amount of unrecognized tax benefits will change due to one or more of the following events during the next twelve months: audit activity, tax payments, or final decisions in matters that are the subject of controversy in various jurisdictions. Corning believes that adequate tax reserves are provided for these matters. However, if upon conclusion of these matters, the ultimate determination of taxes owed is for an amount materially different than the current reserves, the Company’s overall tax expense and effective tax rate could be materially impacted in the period of adjustment. As of December 31, 2020, the company is not expecting any significant movements in the uncertain tax benefits in the next twelve months.
Corning Incorporated, as the common parent company, and all 80%-or-more-owned of its U.S. subsidiaries join in the filing of consolidated U.S. federal income tax returns. The statute of limitations is closed for all periods ending through December 31, 2012. All returns for periods ended through December 31, 2014, have been audited by and settled with the IRS.
Corning Incorporated and its U.S. subsidiaries file income tax returns on a combined, unitary or stand-alone basis in multiple state and local jurisdictions, which generally have statutes of limitations ranging from 3 to 5 years. Various state income tax returns are currently in the process of examination or administrative appeal. The Company does not expect any material proposed adjustments from any of these audits.
Corning’s foreign subsidiaries file income tax returns in the countries where their operations are located. Generally, these countries have statutes of limitations ranging from 3 to 10 years. The statute of limitations is closed through the following years in these major jurisdictions: China (2008), Japan (2012), Taiwan (2014) and South Korea (2013).
CPM (“Corning Precision Materials”), a South Korean subsidiary, is currently appealing certain tax assessments and tax refund claims for tax years 2010 through 2018. The Company is required to deposit the disputed tax amounts with the South Korean government as a condition of its appeal of any tax assessments. We believe that it is more likely than not that we will prevail in the appeal process, and as a result we have recorded a non-current receivable of $365 million as of December 31, 2020 compared to a $415 million non-current receivable and $33 million current receivable as of December 31, 2019 for the amount on deposit with the South Korean government. The reduction of the net receivable balance is due primarily to refunds received upon the successful defense of one of our tax positions with the South Korean government.
9.Property, Plant and Equipment, Net of Accumulated Depreciation
Property, plant and equipment, net of accumulated depreciation follow (in millions):
| | | | | |
| | | | | |
| December 31, |
| 2020 | | 2019 |
Land | $ | 471 | | $ | 452 |
Buildings | | 6,453 | | | 6,023 |
Equipment | | 20,563 | | | 19,100 |
Construction in progress | | 1,918 | | | 2,757 |
Subtotal | | 29,405 | | | 28,332 |
Accumulated depreciation | | (13,663) | | | (12,995) |
Total | $ | 15,742 | | $ | 15,337 |
Approximately $58 million, $54 million and $49 million of interest costs were capitalized as part of property, plant and equipment, net of accumulated depreciation, in 2020, 2019 and 2018, respectively.
Manufacturing equipment includes certain components of production equipment that are constructed of precious metals. At December 31, 2020 and 2019, the recorded value of precious metals totaled $3.4 billion and $3.3 billion, respectively. Depletion expense for precious metals in the years ended December 31, 2020, 2019 and 2018 was $24 million, $16 million and $14 million, respectively.
10.Goodwill and Other Intangible Assets
Goodwill
Goodwill is the excess of cost of an acquired entity over the amounts assigned to assets acquired and liabilities assumed in a business combination. Goodwill relates to and is assigned directly to a specific reporting unit. Reporting units are either operating segments or one level below the operating segment. Impairment testing for goodwill is done at a reporting unit level. Goodwill is reviewed for indicators of impairment quarterly or if an event occurs or circumstances change that indicate that the carrying amount may be impaired. Corning also performs a detailed quantitative impairment test every three years if no indicators suggest a test should be performed in the interim. We use this calculation as quantitative validation of the qualitative process; this process does not represent an election to perform the quantitative impairment test in place of the qualitative review.
The qualitative process includes an extensive review of expectations for the long-term growth of our businesses and forecasting future cash flows. If we are required to perform the quantitative impairment analysis, our valuation method is an “income approach” using a discounted cash flow model in which cash flows anticipated over several periods, plus a terminal value at the end of that time horizon, are discounted to their present value using an appropriate rate of return. Our estimates are based upon our historical experience, our current knowledge from our commercial relationships, and available external information about future trends. If the fair value is less than the carrying value, a loss is recorded to reflect the difference between the fair value and carrying value.
Changes in the carrying amount of goodwill for the twelve months ended December 31, 2020 and 2019, were as follows (in millions):
| | | | | | | | | | | | | | | | | |
| | | | | | | | | | | | | | | | | |
| Display
Technologies | | Optical
Communications | | Specialty
Materials | | Life
Sciences | | All
Other | | Total |
Balance at December 31, 2018 | $ | 132 | | $ | 926 | | $ | 150 | | $ | 617 | | $ | 111 | | $ | 1,936 |
Foreign currency translation
adjustment and other | | (3) | | | 5 | | | | | | (1) | | | (2) | | | (1) |
Balance at December 31, 2019 | $ | 129 | | $ | 931 | | $ | 150 | | $ | 616 | | $ | 109 | | $ | 1,935 |
Acquired goodwill (1) | | | | | | | | | | | | | | 495 | | | 495 |
Foreign currency translation
adjustment and other | | 3 | | | 12 | | | | | | 2 | | | 13 | | | 30 |
Balance at December 31, 2020 | $ | 132 | | $ | 943 | | $ | 150 | | $ | 618 | | $ | 617 | | $ | 2,460 |
(1)The Company obtained a controlling interest in HSG during the third quarter of 2020. Refer to Note 4 (HSG Transactions and Acquisitions) to the consolidated financial statements for additional information on this transaction.
Corning’s gross goodwill balance and accumulated impairment losses were $9.0 billion and $6.5 billion, respectively, for the year ended December 31, 2020. Corning’s gross goodwill balance and accumulated impairment losses were $8.4 billion and $6.5 billion, respectively, for the year ended December 31, 2019. Accumulated impairment losses were generated primarily through goodwill impairments related to the Optical Communications segment.
Other Intangible Assets
Other intangible assets follow (in millions):
| | | | | | | | | | | | | | | | | |
| | | | | | | | | | | | | | | | | |
| December 31, |
| 2020 | | 2019 |
| Gross | | Accumulated
amortization | | Net | | Gross | | Accumulated
amortization | | Net |
Amortized intangible assets: | | | | | | | | | | | | | | | | | |
Patents, trademarks & trade
names | $ | 500 | | $ | 255 | | $ | 245 | | $ | 469 | | $ | 228 | | $ | 241 |
Customer lists and other (1) | | 1,517 | | | 454 | | | 1,063 | | | 1,301 | | | 357 | | | 944 |
Total | $ | 2,017 | | $ | 709 | | $ | 1,308 | | $ | 1,770 | | $ | 585 | | $ | 1,185 |
(1)Other is comprised of intangible assets related to developed technologies and intellectual know-how.
Corning’s amortized intangible assets are primarily related to the Optical Communications and Life Sciences segments and “All Other”. The net carrying amount of intangible assets increased during the year, primarily driven by the consolidation of HSG and foreign currency translation and other adjustments of $14 million; offset by amortization of $121 million and an impairment of $55 million. Intangible assets obtained from HSG consist primarily of $215 million of developed technologies and know-how, and $70 million of other intangibles that are amortized over the weighted average useful life of approximately 20 and 15 years, respectively.
Amortization expense related to all intangible assets is expected to be approximately $130 million annually for years 2021 through 2025.
Refer to Note 4 (HSG Transactions and Acquisitions) to the consolidated financial statements for additional information.
11.Other Assets and Other Liabilities
Other assets follow (in millions):
| | | | | |
| | | | | |
| December 31, |
| 2020 | | 2019 |
Current assets: | | | | | |
Derivative instruments (Note 15) | $ | 148 | | $ | 157 |
South Korean tax deposits | | | | | 33 |
Other current assets | | 613 | | | 683 |
Other current assets | $ | 761 | | $ | 873 |
| | | | | |
Non-current assets: | | | | | |
Derivative instruments (Note 15) | $ | 123 | | $ | 92 |
South Korean tax deposits | | 365 | | | 415 |
Operating leases (Note 7) | | 680 | | | 504 |
Investments (Note 3) | | 435 | | | 334 |
Other non-current assets | | 537 | | | 476 |
Other assets | $ | 2,140 | | $ | 1,821 |
South Korean tax deposits
CPM is currently appealing certain tax assessments and tax refund claims for tax years 2010 through 2018. The Company is required to deposit the disputed tax amounts with the South Korean government as a condition of its appeal of any tax assessments. Corning believes that it is more likely than not that we will prevail in the appeal process.
Other liabilities follow (in millions):
| | | | | |
| | | | | |
| December 31, |
| 2020 | | 2019 |
Current liabilities: | | | | | |
Wages and employee benefits | $ | 572 | | $ | 565 |
Income taxes | | 173 | | | 182 |
Derivative instruments (Note 15) | | 189 | | | 100 |
Asbestos and other litigation (Note 14) | | 13 | | | 57 |
Deferred revenue (Note 5) | | 152 | | | |
Settlement liability (Note 4) | | 58 | | | |
Customer deposits (Note 5) | | 211 | | | 104 |
Short-term leases (Note 7) | | 96 | | | 62 |
Other current liabilities | | 973 | | | 853 |
Other accrued liabilities | $ | 2,437 | | $ | 1,923 |
| | | | | |
Non-current liabilities: | | | | | |
Defined benefit pension plan liabilities | $ | 887 | | $ | 980 |
Derivative instruments (Note 15) | | 155 | | | 165 |
Asbestos and other litigation (Note 14) | | 94 | | | 196 |
Deferred revenue (Note 5) | | 872 | | | |
Settlement liability (Note 4) | | 117 | | | |
Investment in Hemlock Semiconductor Group (1) | | | | | 270 |
Customer deposits (Note 5) | | 1,148 | | | 927 |
Deferred tax liabilities | | 313 | | | 325 |
Long-term leases (Note 7) | | 633 | | | 450 |
Other non-current liabilities | | 798 | | | 667 |
Other liabilities | $ | 5,017 | | $ | 3,980 |
(1)The negative carrying value resulted from a one-time charge to this entity in 2019 for the impairment of certain assets. Refer to Note 3 (Investments) and Note 4 (HSG Transactions and Acquisitions) to the consolidated financial statements for additional information.
12.Debt
(In millions)
| | | | | |
| | | | | |
| December 31, |
| 2020 | | 2019 |
| | | | | |
Current portion of long-term debt | $ | 81 | | $ | 11 |
Short-term borrowings | | 75 | | | |
Current portion of long-term debt and short-term borrowings | $ | 156 | | $ | 11 |
| | | | | |
Long-term debt | | | | | |
Debentures, 8.875%, due 2021 | $ | 63 | | $ | 64 |
Debentures, 2.90%, due 2022 | | 374 | | | 374 |
Debentures, 3.70%, due 2023 | | 249 | | | 249 |
Medium-term notes, average rate 7.66%, due through 2023 | | 45 | | | 45 |
Debentures, 7.00%, due 2024 | | | | | 100 |
Debentures, 3.90%, due 2049 | | 394 | | | 395 |
Debentures, 5.45%, due 2079 | | 1,084 | | | 1,085 |
Yen-denominated debentures, 0.698%, due 2024 | | 203 | | | 192 |
Yen-denominated debentures, 0.722%, due 2025 | | 96 | | | 91 |
Yen-denominated debentures, 0.992%, due 2027 | | 453 | | | 430 |
Yen-denominated debentures, 1.043%, due 2028 | | 293 | | | 278 |
Yen-denominated debentures, 1.153%, due 2031 | | 301 | | | 285 |
Yen-denominated debentures, 1.513%, due 2039 | | 56 | | | 54 |
Debentures, 6.85%, due 2029 | | 161 | | | 163 |
Yen-denominated debentures, 1.219%, due 2030 | | 239 | | | 227 |
Debentures, callable, 7.25%, due 2036 | | 249 | | | 249 |
Debentures, 4.70%, due 2037 | | 296 | | | 295 |
Yen-denominated debentures, 1.583%, due 2037 | | 96 | | | 91 |
Debentures, 5.75%, due 2040 | | 396 | | | 395 |
Debentures, 4.75%, due 2042 | | 496 | | | 496 |
Debentures, 5.35%, due 2048 | | 543 | | | 543 |
Debentures, 4.375%, due 2057 | | 743 | | | 742 |
Debentures, 5.85%, due 2068 | | 296 | | | 296 |
Financing Leases, average discount rate 4.7%, due through 2044 | | 173 | | | 280 |
Other, average rate 4.54%, due through 2043 | | 598 | | | 321 |
Total long-term debt | | 7,897 | | | 7,740 |
Less current portion of long-term debt | | 81 | | | 11 |
Long-term debt | $ | 7,816 | | $ | 7,729 |
Based on borrowing rates currently available to us for loans with similar terms and maturities, the fair value of long-term debt was $9.4 billion and $8.5 billion at December 31, 2020 and 2019, respectively. The Company measures the fair value of its long-term debt using Level 2 inputs based primarily on current market yields for its existing debt traded in the secondary market.
Corning did not have outstanding commercial paper at December 31, 2020 and 2019.
Corning maintains a revolving credit agreement (the “Revolving Credit Agreement”) which provides a committed $1.5 billion unsecured multi-currency line of credit and expires August 15, 2023. At December 31, 2020, there were no outstanding amounts under the Revolving Credit Agreement.
The following table shows debt maturities by year at December 31, 2020 (in millions) (1):
| | | | | | | | | | | | | | | | | |
| | | | | | | | | | | | | | | | | |
| 2021 | | 2022 | | 2023 | | 2024 | | 2025 | | Thereafter |
| $ | 156 | | $ | 422 | | $ | 382 | | $ | 317 | | $ | 171 | | $ | 6,580 |
(1)Excludes interest rate swap gains, bond discounts and deferred expenses.
Debt Issuances and Repayments
2020
During the fourth quarter of 2020, Corning redeemed $100 million of 7.0% debentures due in 2024 with a carrying amount of $99 million, paying a $21 million make-whole call premium. The total payment of $121 million is disclosed in financing activities in the consolidated statements of cash flows. The redemption resulted in a loss of $22 million.
In conjunction with the change in control of HSG on September 9, 2020, a variable interest rate loan of $175 million USD, maturing on September 8, 2021, was made to DC HSC Holdings, LLC, now a consolidated subsidiary of Corning. In December 2020, DC HSC Holdings, LLC repaid $100 million of the loan. The remaining balance of $75 million is reflected in the current portion of long-term debt and short-term borrowings in Corning’s consolidated balance sheets as of December 31, 2020. Refer to Note 4 (HSG Transactions) to the consolidated financial statements for additional information.
During the second quarter of 2020, Corning established an incremental liquidity facility for 25 billion Japanese yen, equivalent to $232 million with a maturity of three years. As of December 31, 2020, the facility has not been drawn upon.
In the first quarter of 2020, Corning established two unsecured variable rate loan facilities for 1,050 million Chinese yuan, equivalent to $150 million, and 749 million Chinese yuan, equivalent to $105 million, each with a maturity of five years. In the fourth quarter of 2020, Corning established a third unsecured variable rate loan facility for 546 million Chinese yuan, equivalent to $84 million, with a maturity of five years. Borrowings under these loan facilities for the year ended December 31, 2020, totaled 1,691 million Chinese yuan, or approximately $243 million. These Chinese yuan-denominated proceeds will not be converted into USD and will be used for capital projects. Payments of principal and interest on the Notes will be in Chinese yuan, or should yuan be unavailable due to circumstances beyond Corning’s control, a USD equivalent. These loans are the sole obligations of the subsidiary borrowers and are not guaranteed by any other Corning entity.
2019
In the fourth quarter of 2019, Corning issued two USD-denominated debt securities (the “Notes”), as follows:
$400 million 3.90% senior unsecured notes with a maturity of 30 years; and
$1.1 billion 5.45% senior unsecured notes with a maturity of 60 years.
The net proceeds, after deducting offering expenses, were approximately $1.5 billion and will be used for general corporate purposes. These notes can be redeemed at any time, subject to certain terms and conditions.
In the fourth quarter of 2019, Corning redeemed $300 million of 4.25% notes due in 2020, paying a premium of $4.7 million by exercising a make-whole call. The bond redemption resulted in an $8.4 million loss during the same quarter.
In the third quarter of 2019, Corning issued two Japanese yen-denominated debt securities (the “Notes”), as follows:
¥31.3 billion 1.153% senior unsecured notes with a maturity of 12 years; and
¥5.9 billion 1.513% senior unsecured notes with a maturity of 20 years.
The proceeds from the Notes were received in Japanese yen and converted to USD on the date of issuance. The net proceeds received in USD, after deducting offering expenses, were approximately $349 million and will be used for general corporate purposes. Payments of principal and interest on the Notes will be in Japanese yen, or should yen be unavailable due to circumstances beyond Corning’s control, a USD equivalent.
On a quarterly basis, Corning will recognize the foreign currency translation gains and losses resulting from changes in exchanges rates within accumulated other comprehensive income (loss) in shareholders’ equity. Cash proceeds from loans and debt issuances are disclosed as financing activities, and cash payments for interest are disclosed as operating activities, in the consolidated statements of cash flows.
13.Employee Retirement Plans
Defined Benefit Plans
Corning has defined benefit pension plans covering certain domestic and international employees. The Company’s funding policy has been to contribute, as necessary, an amount exceeding the minimum requirements to achieve the Company’s long-term funding targets. In 2020, voluntary cash contributions were made to domestic defined benefit pension plans and international pension plans in the amount of $180 million and $41 million, respectively. In 2019, no voluntary contributions were made to domestic defined benefit pension plans. Voluntary cash contributions of $2 million were made to international pension plans. During 2021, the Company plans to make cash contributions of $31 million to international pension plans.
Corning offers postretirement plans that provide health care and life insurance benefits for retirees and eligible dependents. Certain employees may become eligible for such postretirement benefits upon reaching retirement age and service requirements. In 2020, voluntary cash contributions were made to domestic postretirement plans in the amount of $30 million. For current retirees (including surviving spouses) and active employees eligible for the salaried retiree medical program, Corning has placed a “cap” on the amount to be contributed toward retiree medical coverage in the future. The cap is equal to 120% of the 2005 contributions toward retiree medical benefits. Once contributions toward salaried retiree medical costs reach this cap, impacted retirees will have to pay the excess amount in addition to their regular contributions for coverage. This cap was attained for post-65 retirees in 2008 and attained for pre-65 retirees in 2010. Furthermore, employees hired or rehired on or after January 1, 2007 will be eligible for Corning retiree medical benefits upon retirement; however, these employees will pay 100% of the cost.
Obligations and Funded Status
The change in benefit obligation and funded status of our defined benefit pension plans are as follows (in millions):
| | | | | | | | | | | | | | | | | |
| | | | | | | | | | | | | | | | | |
| | | | | | | | | | | | | | | | | |
| Total
pension benefits | | Domestic
pension benefits | | International
pension benefits |
December 31, | 2020 | | 2019 | | 2020 | | 2019 | | 2020 | | 2019 |
| | | | | | | | | | | | | | | | | |
Change in benefit obligation | | | | | | | | | | | | | | | | | |
Benefit obligation at beginning of year | $ | 4,581 | | $ | 4,003 | | $ | 3,856 | | $ | 3,358 | | $ | 725 | | $ | 645 |
Service cost | | 118 | | | 101 | | | 92 | | | 76 | | | 26 | | | 25 |
Interest cost | | 122 | | | 148 | | | 110 | | | 133 | | | 12 | | | 15 |
Plan participants’ contributions | | 1 | | | 1 | | | 1 | | | 1 | | | | | | |
Plan amendments | | 1 | | | | | | 1 | | | | | | | | | |
Actuarial loss | | 358 | | | 533 | | | 329 | | | 462 | | | 29 | | | 71 |
Other | | (29) | | | 6 | | | 8 | | | 6 | | | (37) | | | |
Benefits paid | | (213) | | | (214) | | | (194) | | | (180) | | | (19) | | | (34) |
Foreign currency translation | | 42 | | | 3 | | | | | | | | | 42 | | | 3 |
Benefit obligation at end of year | $ | 4,981 | | $ | 4,581 | | $ | 4,203 | | $ | 3,856 | | $ | 778 | | $ | 725 |
| | | | | | | | | | | | | | | | | |
Change in plan assets | | | | | | | | | | | | | | | | | |
Fair value of plan assets at beginning of year | $ | 3,671 | | $ | 3,239 | | $ | 3,153 | | $ | 2,742 | | $ | 518 | | $ | 497 |
Actual gain on plan assets | | 469 | | | 615 | | | 420 | | | 576 | | | 49 | | | 39 |
Employer contributions | | 245 | | | 22 | | | 195 | | | 14 | | | 50 | | | 8 |
Plan participants’ contributions | | 1 | | | 1 | | | 1 | | | 1 | | | | | | |
Benefits paid | | (238) | | | (214) | | | (194) | | | (180) | | | (44) | | | (34) |
Foreign currency translation | | 25 | | | 8 | | | | | | | | | 25 | | | 8 |
Fair value of plan assets at end of year | $ | 4,173 | | $ | 3,671 | | $ | 3,575 | | $ | 3,153 | | $ | 598 | | $ | 518 |
| | | | | | | | | | | | | | | | | |
Funded status at end of year | | | | | | | | | | | | | | | | | |
Fair value of plan assets | $ | 4,173 | | $ | 3,671 | | $ | 3,575 | | $ | 3,153 | | $ | 598 | | $ | 518 |
Benefit obligations | | (4,981) | | | (4,581) | | | (4,203) | | | (3,856) | | | (778) | | | (725) |
Funded status of plans | $ | (808) | | $ | (910) | | $ | (628) | | $ | (703) | | $ | (180) | | $ | (207) |
| | | | | | | | | | | | | | | | | |
Amounts recognized in the consolidated
balance sheets consist of: | | | | | | | | | | | | | | | | | |
Noncurrent asset | $ | 99 | | $ | 82 | | | | | | | | $ | 99 | | $ | 82 |
Current liability | | (20) | | | (20) | | $ | (13) | | $ | (13) | | | (7) | | | (7) |
Noncurrent liability | | (887) | | | (972) | | | (615) | | | (690) | | | (272) | | | (282) |
Recognized liability | $ | (808) | | $ | (910) | | $ | (628) | | $ | (703) | | $ | (180) | | $ | (207) |
| | | | | | | | | | | | | | | | | |
Amounts recognized in accumulated other
comprehensive income consist of: | | | | | | | | | | | | | | | | | |
Net actuarial loss | $ | 394 | | $ | 338 | | $ | 387 | | $ | 306 | | $ | 7 | | $ | 32 |
Prior service cost (credit) | | 27 | | | 29 | | | 26 | | | 30 | | | 1 | | | (1) |
Amount recognized at end of year | $ | 421 | | $ | 367 | | $ | 413 | | $ | 336 | | $ | 8 | | $ | 31 |
| | | | | | | | | | | | | | | | | |
An actuarial loss of $358 million was recognized in 2020 primarily due to decreases in bond yields during the year, leading to a domestic plan weighted-average discount rate that was 78 basis points lower than the prior year. In 2019, an actuarial loss of $533 million was recognized primarily due to decreases in bond yields during the year, leading to a domestic plan weighted-average discount rate that was 100 basis points lower than the prior year. The accumulated benefit obligation for defined benefit pension plans was $4.7 billion and $4.3 billion at December 31, 2020 and 2019, respectively.
The following information is presented for pension plans where the projected benefit obligation exceeded the fair value of plan assets (in millions):
| | | | | |
| | | | | |
| December 31, |
| 2020 | | 2019 |
Projected benefit obligation | $ | 4,665 | | $ | 4,298 |
Fair value of plan assets | $ | 3,758 | | $ | 3,305 |
In 2020 and 2019, the fair value of plan assets exceeded the projected benefit obligation for the United Kingdom pension plan.
The following information is presented for pension plans where the accumulated benefit obligation exceeded the fair value of plan assets (in millions):
| | | | | |
| | | | | |
| December 31, |
| 2020 | | 2019 |
Accumulated benefit obligation | $ | 4,247 | | $ | 3,904 |
Fair value of plan assets | $ | 3,603 | | $ | 3,178 |
In 2020 and 2019, the fair value of plan assets exceeded the accumulated benefit obligation for the United Kingdom and South Korea pension plans.
The change in benefit obligation and funded status of our postretirement plans are as follows (in millions):
| | | | | |
| | | | | |
| Postretirement benefits |
December 31, | 2020 | | 2019 |
| | | | | |
Change in benefit obligation | | | | | |
Benefit obligation at beginning of year | $ | 705 | | $ | 699 |
Service cost | | 9 | | | 9 |
Interest cost | | 20 | | | 27 |
Plan participants’ contributions | | 8 | | | 8 |
Plan amendments | | | | | 5 |
Actuarial loss (gain) | | 58 | | | 6 |
Other | | 2 | | | 1 |
Benefits paid | | (38) | | | (50) |
Benefit obligation at end of year | $ | 764 | | $ | 705 |
| | | | | |
Change in plan asset | | | | | |
Fair value of plan assets at beginning of year | $ | — | | | |
Employer contributions | | 60 | | | |
Plan participants' contributions | | 8 | | | |
Gross benefits paid | | (38) | | | |
Fair value of plan assets at end of year | $ | 30 | | | |
| | | | | |
Funded status at end of year | | | | | |
Fair value of plan assets | $ | 30 | | | |
Benefit obligations | | (764) | | $ | (705) |
Funded status of plans | $ | (734) | | $ | (705) |
| | | | | |
Amounts recognized in the consolidated balance sheets consist of: | | | | | |
Current liability | $ | (7) | | $ | (34) |
Noncurrent liability | | (727) | | | (671) |
Recognized liability | $ | (734) | | $ | (705) |
| | | | | |
Amounts recognized in accumulated other comprehensive income consist of: | | | | | |
Net actuarial loss | $ | 86 | | $ | 28 |
Prior service credit | | (26) | | | (32) |
Amount recognized at end of year | $ | 60 | | $ | (4) |
An actuarial loss of $58 million was recognized in 2020 due to current year decreases in bond yields, leading to a weighted-average discount rate that was 72 basis points lower than the prior year. In 2019, an actuarial loss of $6 million was recognized due to decreases in bond yields during the year, leading to a weighted-average discount rate that was 92 basis points lower than the prior year.
The components of net periodic benefit cost for employee retirement plans are presented in the following tables (in millions):
| | | | | | | | | | | | | | | | | | | | | | | | | | |
| | | | | | | | | | | | | | | | | | | | | | | | | | |
| Total pension benefits | | Domestic pension benefits | | International pension benefits |
December 31, | 2020 | | 2019 | | 2018 | | 2020 | | 2019 | | 2018 | | 2020 | | 2019 | | 2018 |
Service cost | $ | 118 | | $ | 101 | | $ | 103 | | $ | 92 | | $ | 76 | | $ | 78 | | $ | 26 | | $ | 25 | | $ | 25 |
Interest cost | | 122 | | | 148 | | | 132 | | | 110 | | | 133 | | | 116 | | | 12 | | | 15 | | | 16 |
Expected return on plan assets | | (195) | | | (171) | | | (189) | | | (186) | | | (161) | | | (178) | | | (9) | | | (10) | | | (11) |
Amortization of prior service
cost (credit) | | 5 | | | 6 | | | 6 | | | 6 | | | 7 | | | 7 | | | (1) | | | (1) | | | (1) |
Recognition of actuarial loss | | 22 | | | 90 | | | 145 | | | 12 | | | 66 | | | 143 | | | 10 | | | 24 | | | 2 |
Total net periodic benefit expense | $ | 72 | | $ | 174 | | $ | 197 | | $ | 34 | | $ | 121 | | $ | 166 | | $ | 38 | | $ | 53 | | $ | 31 |
Settlement charge | | | | | | | | (1) | | | | | | | | | | | | | | | | | | (1) |
Special termination benefit charge | | 8 | | | 6 | | | | | | 8 | | | 6 | | | | | | | | | | | | |
Total expense | $ | 80 | | $ | 180 | | $ | 196 | | $ | 42 | | $ | 127 | | $ | 166 | | $ | 38 | | $ | 53 | | $ | 30 |
| | | | | | | | | | | | | | | | | | | | | | | | | | |
Other changes in plan assets and
benefit obligations recognized
in other comprehensive (income) loss: | | | | | | | | | | | | | | | | | | | | | | | | | | |
Curtailment effects | $ | (4) | | | | | | | | | | | | | | | | | $ | (4) | | | | | | |
Settlements | | | | | | | $ | 1 | | | | | | | | | | | | | | | | | $ | 1 |
Current year actuarial loss (gain) | | 83 | | $ | 88 | | | 180 | | $ | 94 | | $ | 47 | | $ | 182 | | | (11) | | $ | 41 | | | (2) |
Recognition of actuarial loss | | (22) | | | (90) | | | (145) | | | (12) | | | (66) | | | (143) | | | (10) | | | (24) | | | (2) |
Current year prior service cost | | 1 | | | | | | 20 | | | 1 | | | | | | 20 | | | | | | | | | |
Amortization of prior service
(cost) credit | | (5) | | | (6) | | | (6) | | | (6) | | | (7) | | | (7) | | | 1 | | | 1 | | | 1 |
Total recognized in other
comprehensive loss (income) | $ | 53 | | $ | (8) | | $ | 50 | | $ | 77 | | $ | (26) | | $ | 52 | | $ | (24) | | $ | 18 | | $ | (2) |
| | | | | | | | | | | | | | | | | | | | | | | | | | |
| | | | | | | | | |
| | | | | | | | | |
| | Postretirement benefits |
| | 2020 | | 2019 | | 2018 |
Service cost | | $ | 9 | | $ | 9 | | $ | 10 |
Interest cost | | | 20 | | | 27 | | | 24 |
Amortization of prior service credit | | | (5) | | | (7) | | | (7) |
Amortization of actuarial loss (gain) | | | 1 | | | (1) | | | |
Total net periodic benefit expense | | $ | 25 | | $ | 28 | | $ | 27 |
Special termination benefit charge | | | 1 | | | 1 | | | |
Total expense | | $ | 26 | | $ | 29 | | $ | 27 |
| | | | | | | | | |
Other changes in plan assets and benefit obligations
recognized in other comprehensive loss (income): | | | | | | | | | |
Current year actuarial loss (gain) | | $ | 58 | | $ | 6 | | $ | (47) |
Amortization of actuarial (loss) gain | | | (1) | | | 1 | | | |
Current year prior service cost (credit) | | | | | | 5 | | | (40) |
Amortization of prior service credit | | | 5 | | | 7 | | | 7 |
Total recognized in other comprehensive loss (income) | | $ | 62 | | $ | 19 | | $ | (80) |
| | | | | | | | | |
The components of net periodic benefit cost other than the service cost component are included in the line item other expense, net, in the consolidated statements of income.
Corning uses a hypothetical yield curve and associated spot rate curve to discount the plan’s projected benefit payments. Once the present value of projected benefit payments is calculated, the suggested discount rate is equal to the level rate that results in the same present value. The yield curve is based on actual high-quality corporate bonds across the full maturity spectrum, which also includes private placements and eurobonds that are denominated in U.S. currency. The curve is developed from yields on hundreds of bonds from four grading sources, Moody’s, S&P, Fitch and the Dominion Bond Rating Service. A bond will be included if at least half of the grades from these sources are Aa, non-callable bonds. The very highest 10% yields and the lowest 40% yields are excluded from the curve to eliminate outliers in the bond population.
Mortality is one of the key assumptions used in valuing liabilities of retirement plans. It is used to assign a probability of payment for benefits that are contingent upon participants’ survival. To make this assumption, benefit plan sponsors typically use a base mortality table and an improvement scale to mortality rates for future anticipated changes to historical death rates.
As of December 31, 2020, Corning updated the adjustment factors applied to its base mortality assumption (PRI-2012 white collar table and PRI-2012 blue collar table for non-union and union participants, respectively) to value its U.S. benefit plan obligations as of December 31, 2020. In addition, Corning also updated to the MP-2020 projection scale at year-end 2020. As the Society of Actuaries publishes additional mortality improvement scales (i.e. MP-2020) and base mortality tables (i.e. PRI-2012), each year Corning considers these revised schedules in setting its mortality assumptions. Furthermore, Corning updated for the year ended 2020 the mortality assumption applied to disabled participants to be the PRI-2012 disabled mortality base table with future improvements using MP-2020.
Measurement of postretirement benefit expense is based on assumptions used to value the postretirement benefit obligation at the beginning of the year.
The weighted-average assumptions used to determine benefit obligations at December 31, 2020 were as follows:
| | | | | | | | | | | | | | | | | | | | | | | | | | |
| | | | | | | | | | | | | | | | | | | | | | | | | | |
| Pension benefits | | | | | | | | | |
| Domestic | | International | | Postretirement benefits |
| 2020 | | 2019 | | 2018 | | 2020 | | 2019 | | 2018 | | 2020 | | 2019 | | 2018 |
Discount rate | 2.50 | % | | 3.28 | % | | 4.28 | % | | 1.02 | % | | 1.34 | % | | 1.96 | % | | 2.69 | % | | 3.41 | % | | 4.33 | % |
Rate of compensation increase | 4.16 | % | | 3.50 | % | | 3.50 | % | | 3.55 | % | | 2.96 | % | | 2.96 | % | | | | | | | | | |
Cash balance crediting rate | 3.84 | % | | 3.94 | % | | 3.94 | % | | 0.94 | % | | 0.97 | % | | 0.97 | % | | | | | | | | | |
Employee contributions crediting rate | 0.62 | % | | 2.03 | % | | 3.47 | % | | | | | | | | | | | | | | | | | | |
The weighted-average assumptions used to determine net periodic benefit cost for years ended December 31 were as follows:
| | | | | | | | | | | | | | | | | | | | | | | | | | |
| | | | | | | | | | | | | | | | | | | | | | | | | | |
| Pension benefits | | | | | | | | | |
| Domestic | | International | | Postretirement benefits |
| 2020 | | 2019 | | 2018 | | 2020 | | 2019 | | 2018 | | 2020 | | 2019 | | 2018 |
Discount rate | 3.28 | % | | 4.28 | % | | 3.58 | % | | 1.34 | % | | 1.96 | % | | 1.93 | % | | 3.41 | % | | 4.33 | % | | 3.63 | % |
Expected return on plan assets | 6.00 | % | | 6.00 | % | | 6.00 | % | | 1.71 | % | | 2.01 | % | | 2.13 | % | | | | | | | | | |
Rate of compensation increase | 3.50 | % | | 3.50 | % | | 3.50 | % | | 2.96 | % | | 2.96 | % | | 2.81 | % | | | | | | | | | |
Cash balance crediting rate | 3.94 | % | | 3.94 | % | | 3.94 | % | | 0.97 | % | | 0.97 | % | | 1.00 | % | | | | | | | | | |
Employee contributions crediting rate | 2.03 | % | | 3.47 | % | | 2.62 | % | | | | | | | | | | | | | | | | | | |
Expected long-term returns on plan assets is based on long-term expectations for future returns informed by historical data in conjunction with the investment policies further described within “Plan Assets” below. Reasonableness of the results is tested using models provided by the plan actuaries.
| | | |
| | | |
Assumed health care trend rates at December 31 | 2020 | | 2019 |
Health care cost trend rate assumed for next year | 6.50% | | 6.75% |
Rate that the cost trend rate gradually declines to | 5% | | 5% |
Year that the rate reaches the ultimate trend rate | 2027 | | 2027 |
Plan Assets
The Company’s primary objective is to ensure the plan has sufficient return on assets to fund the plan’s current and future obligations as they become due. Investments are primarily made in public securities to ensure adequate liquidity to support benefit payments. Domestic and international stocks provide diversification to the portfolio. The target allocation range equity investment is 40% which includes large, mid and small-cap companies and investments in both developed and emerging markets. The target allocation for bond investments is 60%, which predominately includes corporate bonds. Long-duration fixed income assets are utilized to mitigate the sensitivity of funding ratios to changes in interest rates.
The following tables provide fair value measurement information for the Company’s major categories; Level 1 (quoted market prices in active markets for identical assets), Level 2 (significant other observable inputs) and Level 3 (significant unobservable inputs) of domestic defined benefit plan assets:
| | | | | | | | | | | | | | | | | | | | | | | |
| | | | | | | | | | | | | | | | | | | | | | | |
| December 31, 2020 | | December 31, 2019 |
(in millions) | Total | | (Level 1) | | (Level 2) | | (Level 3) | | Total | | (Level 1) | | (Level 2) | | (Level 3) |
Equity securities: | | | | | | | | | | | | | | | | | | | | | | | |
U.S. companies | $ | 781 | | $ | 1 | | $ | 780 | | | | | $ | 494 | | $ | 2 | | $ | 492 | | | |
International companies | | 441 | | | | | | 441 | | | | | | 387 | | | | | | 387 | | | |
| | | | | | | | | | | | | | | | | | | | | | | |
Fixed income: | | | | | | | | | | | | | | | | | | | | | | | |
U.S. treasury bonds | | 147 | | | 147 | | | | | | | | | | | | | | | | | | |
U.S. corporate bonds | | 1,951 | | | | | | 1,951 | | | | | | 2,017 | | | 226 | | | 1,791 | | | |
| | | | | | | | | | | | | | | | | | | | | | | |
Preferred securities | | 11 | | | | | | 11 | | | | | | | | | | | | | | | |
Private equity (1) | | 51 | | | | | | | | $ | 51 | | | 64 | | | | | | | | $ | 64 |
Real estate (2) | | 140 | | | | | | | | | 140 | | | 145 | | | | | | | | | 145 |
Cash equivalents | | 83 | | | 83 | | | | | | | | | 46 | | | 46 | | | | | | |
Total | $ | 3,605 | | $ | 231 | | $ | 3,183 | | $ | 191 | | $ | 3,153 | | $ | 274 | | $ | 2,670 | | $ | 209 |
(1)This category includes venture capital, leverage buyouts and distressed debt limited partnerships invested primarily in U.S. companies. The inputs are valued by discounted cash flow analysis and comparable sale analysis.
(2)This category includes industrial, office, apartments, hotels, infrastructure and retail investments which are limited partnerships predominately in the U.S. The inputs are valued by discounted cash flow analysis; comparable sale analysis and periodic external appraisals.
The following tables provide fair value measurement information for the Company’s major categories; Level 1 (quoted market prices in active markets for identical assets), Level 2 (significant other observable inputs) and Level 3 (significant unobservable inputs) of international defined benefit plan assets:
| | | | | | | | | | | | | | | | | | | | | | | |
| | | | | | | | | | | | | | | | | | | | | | | |
| December 31, 2020 | | December 31, 2019 |
(in millions) | Total | | (Level 1) | | (Level 2) | | (Level 3) | | Total | | (Level 1) | | (Level 2) | | (Level 3) |
Fixed income: | | | | | | | | | | | | | | | | | | | | | | | |
International fixed income | $ | 519 | | $ | 426 | | $ | 93 | | | | | $ | 455 | | $ | 373 | | $ | 82 | | | |
Insurance contracts | | 3 | | | | | | | | $ | 3 | | | 2 | | | | | | | | $ | 2 |
Mortgages | | 20 | | | | | | | | | 20 | | | 21 | | | | | | | | | 21 |
Cash equivalents | | 56 | | | 56 | | | | | | | | | 40 | | | 40 | | | | | | |
Total | $ | 598 | | $ | 482 | | $ | 93 | | $ | 23 | | $ | 518 | | $ | 413 | | $ | 82 | | $ | 23 |
The following table sets forth a summary of changes in the fair value of the defined benefit plans Level 3 assets:
| | | | | | | | | | | |
| | | | | | | | | | | |
| Level 3 assets – domestic | | Level 3 assets – international |
(in millions) | Private
equity | | Real
estate | | Mortgages | | Insurance
contracts |
Balance at December 31, 2018 | $ | 82 | | $ | 148 | | $ | 22 | | $ | 2 |
Actual return on plan assets relating to assets
still held at the reporting date | | | | | 2 | | | | | | |
Transfers in or out of level 3 | | (18) | | | (5) | | | (1) | | | |
| | | | | | | | | | | |
Balance at December 31, 2019 | $ | 64 | | $ | 145 | | $ | 21 | | $ | 2 |
Actual return on plan assets relating to assets
still held at the reporting date | | 4 | | | | | | | | | |
Transfers in or out of level 3 | | (17) | | | (5) | | | (1) | | | 1 |
Balance at December 31, 2020 | $ | 51 | | $ | 140 | | $ | 20 | | $ | 3 |
Credit Risk
58% of domestic plan assets are invested in long duration bonds. The average rating for these bonds is A-. These bonds are subject to both credit and default risk and changes in the risk could lead to a decline in the value of these bonds.
Currency Risk
12% of domestic assets are valued in non-U.S. dollar denominated investments that are subject to currency fluctuations. The value of these securities will decline if the U.S. dollar increases in value relative to the value of the currencies in which these investments are denominated.
Liquidity Risk
5% of the domestic securities are invested in Level 3 securities. These are long-term investments in private equity and private real estate investments that may not mature or be sellable in the near-term without significant loss.
At December 31, 2020 and 2019, the amount of Corning common stock included in equity securities was not significant.
Cash Flow Data
The following reflects the gross benefit payments that are expected to be paid for domestic and international defined benefit pension plans and the postretirement medical and life plans (in millions):
| | | | | | | | |
| | | | | | | | |
| Expected benefit payments |
| Domestic
pension
benefits | | International
pension
benefits | | Postretirement
benefits |
2021 | $ | 216 | | $ | 25 | | $ | 37 |
2022 | $ | 221 | | $ | 31 | | $ | 37 |
2023 | $ | 231 | | $ | 30 | | $ | 37 |
2024 | $ | 238 | | $ | 32 | | $ | 37 |
2025 | $ | 247 | | $ | 35 | | $ | 37 |
2026-2030 | $ | 1,312 | | $ | 219 | | $ | 188 |
Other Benefit Plans
Corning offers defined contribution plans covering employees meeting certain eligibility requirements. Total consolidated defined contribution plan expense was $76 million, $108 million and $67 million for the years ended December 31, 2020, 2019 and 2018, respectively.
14.Commitments, Contingencies and Guarantees
The amounts of obligations are as follows (in millions):
| | | | | | | | | | | | | | |
| | | | | | | | | | | | | | |
| | | | Amount of commitment and contingency expiration per period |
| Total | | Less than
1 year | | 1 to 3
Years | | 3 to 5
Years | | 5 Years and
thereafter |
Performance bonds and guarantees | $ | 152 | | $ | 5 | | $ | 30 | | $ | 2 | | $ | 115 |
Stand-by letters of credit (1) | | 82 | | | 51 | | | 28 | | | 2 | | | 1 |
Subtotal of commitment expirations
per period | $ | 234 | | $ | 56 | | $ | 58 | | $ | 4 | | $ | 116 |
| | | | | | | | | | | | | | |
Purchase obligations (2) | $ | 966 | | $ | 180 | | $ | 223 | | $ | 120 | | $ | 443 |
Capital expenditure obligations (3) | | 231 | | | 231 | | | | | | | | | |
Debentures (4) | | 7,182 | | | 62 | | | 670 | | | 300 | | | 6,150 |
Finance leases and financing obligations | | 846 | | | 94 | | | 134 | | | 188 | | | 430 |
Interest on debentures (5) | | 8,634 | | | 290 | | | 553 | | | 524 | | | 7,267 |
Imputed interest on finance leases and
financing obligations | | 287 | | | 31 | | | 58 | | | 42 | | | 156 |
Operating lease obligations | | 1,307 | | | 141 | | | 239 | | | 194 | | | 733 |
Uncertain tax positions (6) | | 35 | | | 35 | | | | | | | | | |
Subtotal of contractual obligation
payments due by period | $ | 19,488 | | $ | 1,064 | | $ | 1,877 | | $ | 1,368 | | $ | 15,179 |
Total commitments and contingencies | $ | 19,722 | | $ | 1,120 | | $ | 1,935 | | $ | 1,372 | | $ | 15,295 |
(1)At December 31, 2020, the Company had stand-by letters of credit commitments of $121 million; $39 million was included in other accrued liabilities on the consolidated balance sheets.
(2)Purchase obligations are enforceable and legally binding obligations which primarily consist of raw material and energy-related take-or-pay contracts.
(3)Capital expenditure obligations primarily reflect amounts associated with capital expansion activities.
(4)Debentures are stated at maturity value and excludes interest rate swap gains or losses and bond discounts.
(5)The estimate of interest payments assumes interest is paid through the date of maturity or expiration of the related debt, based upon stated rates in the respective debt instruments.
(6)At December 31, 2020, $35 million was included on the consolidated balance sheets related to uncertain tax positions.
The Company is required, at the time a guarantee is issued, to recognize a liability for the fair value or market value of the obligation it assumes. In the normal course of business, the Company does not routinely provide significant third-party guarantees. Generally, third-party guarantees provided by Corning are limited to certain financial guarantees, including stand-by letters of credit and performance bonds, and the incurrence of contingent liabilities in the form of purchase price adjustments related to attainment of milestones. These guarantees have various terms, and none of these guarantees are individually significant. The Company believes a significant majority of these guarantees and contingent liabilities will expire without being funded.
Product warranty liability accruals at December 31, 2020 and 2019 were insignificant.
The ability of certain subsidiaries and affiliated companies to transfer funds is limited by provisions of foreign government regulations, affiliate agreements and certain loan agreements. At December 31, 2020, the amount of equity subject to such restrictions for consolidated subsidiaries and affiliated companies was not significant. While this amount is legally restricted, it does not result in operational difficulties since the Company has generally permitted subsidiaries to retain a majority of equity to support growth programs.
Corning is a defendant in various lawsuits and is subject to various claims that arise in the normal course of business, the most significant of which are summarized below. In the opinion of management, the likelihood that the ultimate disposition of these matters will have a material adverse effect on Corning’s consolidated financial position, liquidity, or results of operations, is remote.
Asbestos Claims
Corning and PPG Industries, Inc. each owned 50% of the capital stock of Pittsburgh Corning Corporation (“PCC”). PCC filed for Chapter 11 reorganization in 2000 and the Modified Third Amended Plan of Reorganization for PCC (the “Plan”) became effective in April 2016. At December 31, 2016, the Company’s liability under the Plan was $290 million, which was required to be paid through a series of fixed payments beginning in the second quarter of 2017. Payments of $130 million and $50 million were made in the years ended December 31, 2020 and 2019, respectively. As of December 31, 2020, there is no further liability associated with this plan.
Non-PCC Asbestos Claims
Corning is a defendant in certain cases alleging injuries from asbestos unrelated to PCC (the “non-PCC asbestos claims”) which had been stayed pending the confirmation of the Plan. The stay was lifted on August 25, 2016. At December 31, 2020 and 2019, the amount of the reserve for these non-PCC asbestos claims was estimated to be $96 million and $98 million, respectively. The reserve balance as of December 31, 2020 and 2019 represents the undiscounted projection of claims and related legal fees for the estimated life of the litigation.
Dow Corning Chapter 11 Related Matters
Until June 1, 2016, Corning and The Dow Chemical Company (“Dow”) each owned 50% of the common stock of Dow Corning Corporation (“Dow Corning”). On May 31, 2016, Corning and Dow realigned their ownership interest in Dow Corning. Following the realignment, Corning no longer owned any interest in Dow Corning. With the realignment, Corning agreed to indemnify Dow for 50% of Dow Corning’s non-ordinary course, pre-closing liabilities to the extent such liabilities exceed the amounts reserved for them by Dow Corning as of May 31, 2016, subject to certain conditions and limits.
Dow Corning Breast Implant Litigation
In May 1995, Dow Corning filed for bankruptcy protection to address pending and claimed liabilities arising from many thousands of breast implant product lawsuits. On June 1, 2004, Dow Corning emerged from Chapter 11 with a Plan of Reorganization (the “Plan”) which provided for the settlement or other resolution of implant claims. The Plan includes releases for Corning and Dow as shareholders in exchange for contributions to the Plan.
Under the terms of the Plan, Dow Corning has established and funded a Settlement Trust and a Litigation Facility, referred to above, to provide a means for tort claimants to settle or litigate their claims. Inclusive of insurance, Dow Corning has paid approximately $1.8 billion to the Settlement Trust. As of May 31, 2016, Dow Corning had recorded a reserve for breast implant litigation of $290 million. In the event Dow Corning’s total liability for these claims exceeds such amount, Corning may be required to indemnify Dow for up to 50% of the excess liability, subject to certain conditions and limits. As of December 31, 2020, Dow Corning had recorded a reserve for breast implant litigation of $160 million. As a result, Corning does not believe its indemnity obligation for Dow Corning’s breast implant litigation liability, if any, will be material.
Dow Corning Bankruptcy Pendency Interest Claims
As a separate matter arising from the bankruptcy proceedings, Dow Corning has been defending claims asserted by commercial creditors who claimed additional compounded interest at default and state statutory judgment rates as well as attorneys’ fees and other enforcement costs, during the period from May 1995 through June 2004. As of May 31, 2016, Dow Corning had recorded a reserve for these claims of $107 million. Dow Corning settled those claims as of September 30, 2019 and received approval of the settlement from the bankruptcy court. Corning does not believe its indemnity obligation, if any, for Dow Corning’s liability to be material.
Dow Corning Environmental Claims
In September 2019, Dow formally notified Corning of certain environmental matters for which Dow asserts that it has or will experience losses arising from remediation and response at a number of sites. In the event Dow is liable for these claims, Corning may be required to indemnify Dow for up to 50% of that liability, subject to certain conditions and limits. As of December 31, 2020, Corning has determined a potential liability for these environmental matters is probable, and the amount recorded was not material.
Environmental Litigation
Corning has been named by the Environmental Protection Agency (the Agency) under the Superfund Act, or by state governments under similar state laws, as a potentially responsible party for 15 active hazardous waste sites. Under the Superfund Act, all parties who may have contributed any waste to a hazardous waste site, identified by the Agency, are jointly and severally liable for the cost of cleanup unless the Agency agrees otherwise. It is Corning’s policy to accrue for its estimated liability related to Superfund sites and other environmental liabilities related to property owned by Corning based on expert analysis and continual monitoring by both internal and external consultants. At December 31, 2020 and 2019, Corning had accrued approximately $68 million and $41 million, respectively, for the undiscounted estimated liability for environmental cleanup and related litigation. Based upon the information developed to date, management believes that the accrued reserve is a reasonable estimate of the Company’s liability and that the risk of an additional loss in an amount materially higher than that accrued is remote.
15.Hedging Activities
Corning is exposed to interest rate and foreign currency risks due to the movement of these rates.
The areas in which exchange rate fluctuations affect the Company include:
Financial instruments and transactions denominated in foreign currencies, which impact earnings; and
The translation of net assets in foreign subsidiaries for which the functional currency is not the U.S. dollar.
The most significant foreign currency exposure relates to the Japanese yen, South Korean won, new Taiwan dollar, Chinese yuan, the euro and British pound. Corning seeks to mitigate the impact of exchange rate movements in our income statement by using over-the-counter (OTC) derivative instruments including foreign exchange forward and option contracts. In general, these hedge expirations coincide with the timing of the underlying foreign currency commitments and transactions.
Corning is exposed to potential losses in the event of non-performance by counterparties to these derivative contracts. However, this risk is minimized by maintaining a portfolio with a diverse group of highly-rated major financial institutions. The Company does not expect to record any losses due to counterparty default. Neither the company nor its counterparties are required to post collateral for these financial instruments. The Company qualified for and elected the end-user exception to the mandatory swap clearing requirement of the Dodd-Frank Act.
Cash Flow Hedges
Corning’s cash flow hedging activities utilize OTC foreign exchange forward contracts to reduce the risk that movements in exchange rates will adversely affect the net cash flows resulting from the sale of products to customers and purchases from suppliers. The total gross notional values for foreign currency cash flow hedges are $1.1 billion, including net investment hedges of $251 million, and $2.1 billion at December 31, 2020 and 2019, respectively, with maturities spanning the years 2021 through 2023.
Corning uses regression analysis or critical term match method to assess initial hedge effectiveness. Following the inception of a hedging relationship, hedge effectiveness is assessed quarterly based on qualitative factors. Corning defers gains and losses related to the cash flow hedges into accumulated other comprehensive loss on the consolidated balance sheets until the hedged item impacts earnings. At December 31, 2020, the amount expected to be reclassified into earnings within the next 12 months is a pre-tax net gain of $35 million.
In the first quarter of 2020, a loss of $14 million was reclassified from accumulated other comprehensive loss into other expense, net, due to the de-designation of certain cash flow hedges related to Japanese yen-denominated sales.
The effect of cash flow hedges on Coring’s consolidated statements of income and comprehensive income was not material for the year ended December 31, 2020, 2019 and 2018.
Undesignated Hedges
Corning also uses OTC foreign exchange forward and option contracts that are not designated as hedged instruments for accounting purposes. These contracts are used to offset economic currency risks. The undesignated hedges limit exposure to foreign functional currency fluctuations related to certain subsidiaries’ monetary assets, monetary liabilities and net earnings in foreign currencies.
A significant portion of the Company’s non-U.S. revenue and expenses are denominated in Japanese yen, South Korean won, new Taiwan dollar, Chinese yuan and euro. When this revenue and these expenses are translated back to U.S. dollars, the Company is exposed to foreign exchange rate movements. To protect translated earnings against movements in these currencies, the Company has entered into a series of average rate forwards and other derivative instruments.
The table below includes a total gross notional value for translated earnings contracts of $7.5 billion and $12.2 billion at December 31, 2020 and 2019, respectively. These include gross notional value for average rate forward contracts of $5.4 billion and $9.7 billion, zero-cost collars and purchased put or call options of $2.0 billion and $2.5 billion at December 31, 2020 and 2019, respectively. The majority of average rate forward contracts hedge a significant portion of the Company’s exposure to the Japanese yen with maturities spanning the years 2021-2024 and with gross notional values of $4.5 billion and $7.7 billion at December 31, 2020 and 2019, respectively. The average rate forward contracts also partially hedge the impacts of the South Korean won, Chinese yuan, euro, new Taiwan dollar and British pound translation on the Company’s projected net income.
The fair values of these derivative contracts are recorded as either assets (gain position) or liabilities (loss position) on the consolidated balance sheets. Changes in the fair value of the derivative contracts are recorded currently in earnings in the translated earnings contract (loss) gain, net line of the consolidated statements of income.
The following table summarizes the notional amounts and respective fair values of Corning’s derivative financial instruments on a gross basis for December 31, 2020 and 2019 (in millions):
| | | | | | | | | | | | | | | | | | | | | |
| | | | | | | | | | | | | | | | | | | | | |
| | | | | | | Asset derivatives | | Liability derivatives |
| Notional amount | | | | Fair value | | | | Fair value |
| 2020 | | 2019 | | Balance sheet
location | | 2020 | | 2019 | | Balance sheet
location | | 2020 | | 2019 |
Derivatives
designated as
hedging
instruments | | | | | | | | | | | | | | | | | | | | | |
Foreign exchange
contracts (1) | $ | 1,143 | | $ | 2,123 | | Other current
assets | | $ | 37 | | $ | 38 | | Other accrued
liabilities | | $ | (3) | | $ | (7) |
| | | | | | | Other assets | | | 21 | | | 37 | | Other liabilities | | | (1) | | | (4) |
| | | | | | | | | | | | | | | | | | | | | |
Derivatives not
designated as
hedging
instruments | | | | | | | | | | | | | | | | | | | | | |
Foreign exchange
contracts and other | | 6,144 | | | 1,815 | | Other current
assets | | | 45 | | | 5 | | Other accrued
liabilities | | | (76) | | | (19) |
| | | | | | | Other assets | | | 41 | | | 21 | | Other liabilities | | | (59) | | | |
Translated earnings
contracts | | 7,453 | | | 12,166 | | Other current
assets | | | 66 | | | 114 | | Other accrued
liabilities | | | (110) | | | (74) |
| | | | | | | Other assets | | | 61 | | | 34 | | Other liabilities | | | (95) | | | (161) |
Total derivatives | $ | 14,740 | | $ | 16,104 | | | | $ | 271 | | $ | 249 | | | | $ | (344) | | $ | (265) |
(1)At December 31, 2020, the foreign exchange contracts that are designated as hedging instruments include the notional amount $892 million of cash flow hedges and $251 million of net investment hedges.
The following tables summarize the effect on the consolidated financial statements relating to Corning’s derivative financial instruments (in millions):
| | | | | | | | | | | | | | | | | | | | |
| | | | | | | | | | | | | | | | | | | | |
| | Effect of derivative instruments on the consolidated financial statements for the year ended December 31 |
Derivatives in hedging relationships | | (Loss) gain recognized in other
comprehensive income (OCI) | | Location of (loss) gain reclassified from
accumulated OCI into income | | (Loss) Gain reclassified from
accumulated OCI into income |
for designated hedges | | 2020 | | 2019 | | 2018 | | effective (ineffective) | | 2020 | | 2019 | | 2018 |
| | | | | | | | | | | | | | | | | | | | |
| | | | | | | | | | | Net sales | | $ | (6) | | | | | | |
Interest rate hedge | | | | | | | | $ | 16 | | Cost of sales | | | 13 | | $ | 11 | | $ | 13 |
Foreign exchange contracts | | $ | (19) | | $ | 72 | | | (5) | | Other expense, net (1) | | | (14) | | | | | | (1) |
Total designated hedges | | $ | (19) | | $ | 72 | | $ | 11 | | | | $ | (7) | | $ | 11 | | $ | 12 |
| | | | | | | | | | |
| | | | | | | | | | |
| | | (Loss) Gain recognized in income |
Undesignated
derivatives | Location of (loss) gain
recognized in income | | 2020 | | 2019 | | 2018 |
Foreign exchange and other contracts –
balance sheet, loans and other | Other (expense) income, net (1) | | $ | (93) | | $ | 21 | | $ | 22 |
Translated earnings contracts | Translated earnings contract (loss) gain, net | | | (38) | | | 248 | | | (93) |
Total undesignated | | | $ | (131) | | $ | 269 | | $ | (71) |
(1)A loss of $14 million was reclassified from accumulated other comprehensive loss into other expense, net, resulting from the de-designation of certain cash flow hedges.
16.Fair Value Measurements
Fair value standards under U.S. GAAP define fair value, establish a framework for measuring fair value in applying generally accepted accounting principles, and require disclosures about fair value measurements. The standards also identify two kinds of inputs that are used to determine the fair value of assets and liabilities: observable and unobservable. Observable inputs are based on market data or independent sources while unobservable inputs are based on the Company’s own market assumptions. Once inputs have been characterized, the inputs are prioritized into one of three broad levels (provided in the table below) used to measure fair value. Fair value standards apply whenever an entity is measuring fair value under other accounting pronouncements that require or permit fair value measurement and require the use of observable market data when available.
The following tables provide fair value measurement information for the Company’s major categories of financial assets and liabilities measured on a recurring basis:
| | | | | | | | | | | |
| | | | | | | | | | | |
| | | | Fair value measurements at reporting date using |
| December 31, | | Quoted prices in
active markets for
identical assets | | Significant other
observable
inputs | | Significant
unobservable
inputs |
(in millions) | 2020 | | (Level 1) | | (Level 2) | | (Level 3) |
Current assets: | | | | | | | | | | | |
Other current assets (1)(2) | $ | 152 | | | | | $ | 148 | | $ | 4 |
Non-current assets: | | | | | | | | | | | |
Investments (3) | $ | 137 | | $ | 137 | | | | | | |
Other assets (1)(2) | $ | 139 | | | | | $ | 123 | | $ | 16 |
Current liabilities: | | | | | | | | | | | |
Other accrued liabilities (1) | $ | 189 | | | | | $ | 189 | | | |
Non-current liabilities: | | | | | | | | | | | |
Other liabilities (1) | $ | 155 | | | | | $ | 155 | | | |
(1)Derivative assets and liabilities include foreign exchange contracts which are measured using observable inputs for similar assets and liabilities.
(2)Included in other current assets and other assets is a contingent consideration asset for a cost adjustment contract of $20 million, resulting from the HSG Transactions as of September 9, 2020, that were measured using unobservable (Level 3) inputs.
(3)Included in the investments were equity securities with readily available fair values that were measured using Level 1 inputs. A pre-tax gain of $107 million was recognized from the initial public offering of an investment for the year ended December 31, 2020.
| | | | | | | | | | | | | |
| | | | | | | | | | | | | |
| | | | | | Fair value measurements at reporting date using |
| December 31, | | Quoted prices in
active markets for
identical assets | | | | Significant other
observable
inputs | | Significant
unobservable
inputs |
(in millions) | 2019 | | (Level 1) | | | | (Level 2) | | (Level 3) |
Current assets: | | | | | | | | | | | | | |
Other current assets (1) | $ | 157 | | | | | | | $ | 157 | | | |
Non-current assets: | | | | | | | | | | | | | |
Other assets (1)(2) | $ | 92 | | | | | | | $ | 71 | | $ | 21 |
Current liabilities: | | | | | | | | | | | | | |
Other accrued liabilities (1) | $ | 100 | | | | | | | $ | 100 | | | |
Non-current liabilities: | | | | | | | | | | | | | |
Other liabilities (1) | $ | 165 | | | | | | | $ | 165 | | | |
(1)Derivative assets and liabilities include foreign exchange contracts which are measured using observable inputs for similar assets and liabilities.
(2)Other assets include one of the Company’s renewable energy derivative contracts that was measured using unobservable (Level 3) inputs, in the amount of $21 million.
For the year ended December 31, 2020, assets and liabilities that were measured using unobservable (Level 3) inputs resulted in losses recognized in earnings of $21 million for a renewable energy derivative contract and $4 million for auction rate securities, respectively. For the year ended December 31, 2019, assets and liabilities that were measured using unobservable (Level 3) inputs resulted in unrealized gains recognized in earnings of $21 million for a renewable energy derivative contract and the reversal of a liability for contingent consideration of $20 million.
Assets and Liabilities Measured on a Non-Recurring Basis
For the year ended December 31, 2020, Corning incurred a long-lived asset impairment and disposal loss for an asset group related to the reassessment of research and development programs within “All Other”. Given the economic environment and market opportunities, Corning discontinued its investment in these research and development programs. The impairment analysis and disposition of certain assets resulted in a total pre-tax charge of $217 million, which was substantially all the carrying value, inclusive of an insignificant amount of goodwill. The fair value of the asset group for the impairment analysis was measured using unobservable (Level 3) inputs.
Refer to Note 2 (Restructuring, Impairment and Other Charges and Credits) to the consolidated financial statements for additional information this impairment.
At December 31, 2019, HSG, one of the Company’s equity method affiliates, recorded an impairment of its long-lived assets. HSG engaged a third-party appraiser to assist in determining the fair value of its long-lived assets using unobservable (Level 3) inputs based on the highest and best use of the asset group. As a result, HSG recognized pre-tax asset impairment charges of $916 million for the year ended December 31, 2019. Corning’s share of the pre-tax impairment was $369 million. For the year ended December 31, 2020, no material asset impairment losses were recognized on a nonrecurring basis by HSG. Refer to Note 3 (Investments) to the consolidated financial statements for additional information.
Fair value measurements (Level 3) related to the Redemption are disclosed in Note 4 (HSG Transactions and Acquisitions) to the consolidated financial statements. There were no other significant financial assets and liabilities measured on a nonrecurring basis as of December 31, 2020 and 2019.
17.Shareholders’ Equity
Common Stock Dividends
On February 3, 2021, Corning’s Board of Directors declared a 9% increase in the Company’s quarterly common stock dividend, which increased the quarterly dividend from $0.22 to $0.24 per share of common stock, beginning with the dividend paid in the first quarter of 2021. This increase marks the tenth dividend increase since October 2011.
On February 5, 2020, Corning’s Board of Directors declared a 10% increase in the Company’s quarterly common stock dividend, which increased the quarterly dividend from $0.20 to $0.22 per share of common stock, beginning with the dividend paid in the first quarter of 2020.
On February 6, 2019, Corning’s Board of Directors declared an 11% increase in the Company’s quarterly common stock dividend, which increased the quarterly dividend from $0.18 to $0.20 per share of common stock, beginning with the dividend paid in the first quarter of 2019.
Fixed Rate Cumulative Convertible Preferred Stock, Series A
On January 15, 2014, Corning designated a new series of its preferred stock as Fixed Rate Cumulative Convertible Preferred Stock, Series A, par value $100 per share, and issued 1,900 shares of preferred stock at an issue price of $1 million per share, for an aggregate issue price of $1.9 billion, to Samsung Display with the acquisition of its equity interest in Samsung Corning Precision Materials. Corning also issued to Samsung Display an additional amount of preferred stock at closing, for an aggregate issue price of $400 million in cash.
Dividends on the preferred stock are cumulative and accrue at the annual rate of 4.25% on the per share issue price of $1 million. The dividends are payable quarterly as and when declared by the Company’s Board of Directors. The preferred stock ranks senior to common stock with respect to payment of dividends and rights upon liquidation. The preferred stock is not redeemable except in the case of a certain deemed liquidation event, the occurrence of which is under the control of the Company. The preferred stock is convertible at the option of the holder, and by the Company upon certain events, at a conversion rate of 50,000 shares of Corning’s common stock per one share of preferred stock, subject to certain anti-dilution provisions. As of December 31, 2020, the preferred stock had not been converted, and none of the anti-dilution provisions had been triggered. On January 16, 2021, the preferred stock became convertible, in whole or in part, at the option of the holder. The Company has the right, at its option, to cause some or all the shares of preferred stock to be converted into common stock, if, for 25 trading days (whether or not consecutive) within any period of 40 consecutive trading days, the closing price of common stock exceeds $35 per share. The preferred stock does not have any voting rights except as may be required by law.
Share Repurchases
2020 Share Repurchases
The Company suspended share buybacks during the first quarter of 2020 and made no share repurchases for the remainder of the year. For the year ended December 31, 2020, the Company repurchased 4.1 million shares of common stock on the open market for approximately $105 million, as part of its 2018 Repurchase Program.
2019 Share Repurchases
On July 17, 2019, Corning’s Board of Directors authorized $5 billion in share repurchases with no expiration date (the “2019 Repurchase Program”). During the year ended December 31, 2019, the Company repurchased 31.0 million shares of common stock on the open market for approximately $925 million as part of its 2018 Repurchase Program.
2018 Share Repurchases
On April 26, 2018, Corning’s Board of Directors approved a $2 billion share repurchase program with no expiration (the “2018 Repurchase Program”). During the year ended December 31, 2018, the Company repurchased 74.8 million shares of common stock on the open market for approximately $2.2 billion as part of its 2016 and 2018 Repurchase Programs.
The following table presents changes in capital stock (in millions):
| | | | | | | | | | |
| | | | | | | | | | |
| | Common stock | | Treasury stock |
| | Shares | | Par value | | Shares | Cost |
Balance at December 31, 2017 | | 1,708 | | $ | 854 | | (850) | | $ | (16,633) |
| | | | | | | | | | |
Shares issued to benefit plans and for
option exercises | | 5 | | | 3 | | | | | |
Shares purchased for treasury | | | | | | | (75) | | | (2,230) |
Other, net | | | | | | | | | | (7) |
Balance at December 31, 2018 | | 1,713 | | $ | 857 | | (925) | | $ | (18,870) |
| | | | | | | | | | |
Shares issued to benefit plans and for
option exercises | | 5 | | | 2 | | | | | |
Shares purchased for treasury | | | | | | | (31) | | | (925) |
Other, net | | | | | | | | | | (17) |
Balance at December 31, 2019 | | 1,718 | | $ | 859 | | (956) | | $ | (19,812) |
| | | | | | | | | | |
Shares issued to benefit plans and for
option exercises | | 8 | | | 4 | | | | | |
Shares purchased for treasury | | | | | | | (4) | | | (105) |
Other, net | | | | | | | (1) | | | (11) |
Balance at December 31, 2020 | | 1,726 | | $ | 863 | | (961) | | $ | (19,928) |
Accumulated Other Comprehensive Loss
A summary of changes in the components of accumulated other comprehensive loss, including the proportionate share of equity method investee’s accumulated other comprehensive loss, is as follows (in millions) (1):
| | | | | | | | | | | | | | | |
| | | | | | | | | | | | | | | |
| | Foreign
currency
translation
adjustments
and other | | Unamortized
actuarial gains
(losses) and
prior service
(costs) credits | | Net
unrealized
gains
(losses) on
investments | | Net
unrealized
gains
(losses) on
designated
hedges | | Accumulated
other
comprehensive
loss |
Balance at December 31, 2017 | | $ | (529) | | $ | (317) | | $ | (3) | | $ | 7 | | $ | (842) |
| | | | | | | | | | | | | | | |
Other comprehensive (loss) income before
reclassifications (2) | | $ | (180) | | $ | (84) | | $ | (1) | | $ | 9 | | $ | (256) |
Amounts reclassified from accumulated other
comprehensive income (loss) (5) | | | | | | 103 | | | | | | (10) | | | 93 |
Equity method affiliates (6) | | | (5) | | | | | | | | | | | | (5) |
Net current-period other comprehensive income | | | (185) | | | 19 | | | (1) | | | (1) | | | (168) |
Balance at December 31, 2018 | | $ | (714) | | $ | (298) | | $ | (4) | | $ | 6 | | $ | (1,010) |
| | | | | | | | | | | | | | | |
Other comprehensive (loss) income before
reclassifications (3) | | $ | (129) | | $ | (79) | | $ | 1 | | $ | 54 | | $ | (153) |
Amounts reclassified from accumulated other
comprehensive income (loss) (5) | | | | | | 15 | | | | | | (9) | | | 6 |
Equity method affiliates (6) | | | (14) | | | | | | | | | | | | (14) |
Net current-period other comprehensive (loss) income | | | (143) | | | (64) | | | 1 | | | 45 | | | (161) |
Balance at December 31, 2019 | | $ | (857) | | $ | (362) | | $ | (3) | | $ | 51 | | $ | (1,171) |
| | | | | | | | | | | | | | | |
Other comprehensive income (loss) before
reclassifications (4) | | $ | 511 | | $ | (106) | | | | | $ | (14) | | $ | 391 |
Amounts reclassified from accumulated other
comprehensive income (5) | | | | | | 18 | | | | | | 5 | | | 23 |
Equity method affiliates (6) | | | 17 | | | | | | | | | | | | 17 |
Net current-period other comprehensive income (loss) | | | 528 | | | (88) | | | — | | | (9) | | | 431 |
Balance at December 31, 2020 | | $ | (329) | | $ | (450) | | $ | (3) | | $ | 42 | | $ | (740) |
(1)All amounts are after tax. Amounts in parentheses indicate debits to accumulated other comprehensive income.
(2)Amounts are net of total tax benefit of $64 million, primarily driven by $34 million and $33 million, related to foreign currency translation adjustments and retirement plans, respectively.
(3)Amounts are net of total tax benefit of $8 million, primarily driven by $7 million related to foreign currency translation adjustments; embedded in this number is the negative impact of $18 million related to the hedging component, offset by the positive impact of $19 million related to retirement plans.
(4)Amounts are net of total tax expense of $22 million, primarily driven by $55 million related to foreign currency translation adjustments; embedded in this number are the positive impacts of $5 million related to the hedging component and $28 million related to retirement plans.
(5)Tax effect of reclassifications are disclosed separately within this footnote.
(6)Tax effects related to equity method affiliates are not significant in the reported periods.
(In millions)
| | | | | | | | | | |
| | | | | | | | | | |
Reclassifications Out of Accumulated Other Comprehensive Income ("AOCI") by Component (1) |
| Amount reclassified from AOCI | | Affected line item |
| Year ended December 31, | | in the consolidated |
Details about AOCI Components | 2020 | | 2019 | | 2018 | | statements of income |
| | | | | | | | | | |
Amortization of net actuarial loss | $ | (23) | | $ | (89) | | $ | (138) | | (2) |
Amortization of prior service credit (cost) | | | | | 1 | | | (6) | | (2) |
| | (23) | | | (88) | | | (144) | | Total before tax |
| | 5 | | | 73 | | | 41 | | Tax benefit (3) |
| $ | (18) | | $ | (15) | | $ | (103) | | Net of tax |
| | | | | | | | | | |
Realized (losses) gains on designated hedges | $ | (6) | | | | | | | | Sales |
| | 13 | | $ | 11 | | $ | 13 | | Cost of sales |
| | (14) | | | | | | (1) | | Other expense, net |
| | (7) | | | 11 | | | 12 | | Total before tax |
| | 2 | | | (2) | | | (2) | | Tax benefit (expense) |
| $ | (5) | | $ | 9 | | $ | 10 | | Net of tax |
| | | | | | | | | | |
Total reclassifications for the period | $ | (23) | | $ | (6) | | $ | (93) | | Net of tax |
(1)Amounts in parentheses indicate debits to the statement of income.
(2)These accumulated other comprehensive income components are included in net periodic pension cost. Refer to Note 13 (Employee Retirement Plans) to the consolidated financial statements for additional details.
(3)Includes $52 million that was recognized during the first quarter of 2019 due to adoption of the new standard related to Income Statement - Reporting Comprehensive Income, which allows for reclassification from accumulated other comprehensive income to retained earnings for stranded tax effects.
18.Earnings Per Common Share
Basic earnings per common share are computed by dividing income attributable to common shareholders by the weighted-average number of common shares outstanding for the period. Diluted earnings per common share assumes the issuance of common shares for all potentially dilutive securities outstanding.
The reconciliation of the amounts used to compute basic and diluted earnings per common share from operations is as follows (in millions, except per share amounts):
| | | | | | | | |
| | | | | | | | |
| Year ended December 31, |
| 2020 | | 2019 | | 2018 |
Net income attributable to Corning Incorporated | $ | 512 | | $ | 960 | | $ | 1,066 |
Less: Series A convertible preferred stock dividend | | 98 | | | 98 | | | 98 |
Net income available to common stockholders - basic | | 414 | | | 862 | | | 968 |
Plus: Series A convertible preferred stock dividend | | | | | 98 | | | 98 |
Net income available to common stockholders - diluted | $ | 414 | | $ | 960 | | $ | 1,066 |
| | | | | | | | |
Weighted-average common shares outstanding - basic | | 761 | | | 776 | | | 816 |
Effect of dilutive securities: | | | | | | | | |
Stock options and other dilutive securities | | 11 | | | 8 | | | 10 |
Series A convertible preferred stock (1) | | | | | 115 | | | 115 |
Weighted-average common shares outstanding - diluted | | 772 | | | 899 | | | 941 |
Basic earnings per common share | $ | 0.54 | | $ | 1.11 | | $ | 1.19 |
Diluted earnings per common share | $ | 0.54 | | $ | 1.07 | | $ | 1.13 |
| | | | | | | | |
Anti-dilutive potential shares excluded from diluted
earnings per common share: | | | | | | | | |
Series A convertible preferred stock dividend (1) | | 115 | | | | | | |
Employee stock options and awards | | 2 | | | 2 | | | 2 |
Total | | 117 | | | 2 | | | 2 |
(1)For the year ended December 31, 2020, the Series A preferred stock was anti-dilutive and therefore excluded from the calculation of diluted earnings per share.
19.Share-Based Compensation
Corning maintains long-term incentive plans (the “Plans”) for key employees and non-employee members of its Board of Directors. The Plans allow us to grant equity-based compensation awards, including stock options, stock appreciation rights, performance share units, restricted stock units, restricted stock awards or a combination of awards (collectively, share-based awards). At December 31, 2020, there were approximately 36 million unissued common shares available for future grants authorized under the Plans.
Beginning in 2020, Corning increased the equity component in its Long-Term Incentive (“LTI”) Plan from 40% to 75% of an executive’s annual targeted compensation opportunity.
Share-based compensation cost is allocated to the selling, general and administrative, research, development and engineering, and cost of sales expenses lines in the consolidated statements of income.
Stock Compensation Plans
The Company measures and recognizes compensation cost for all share-based payment awards made to employees and directors based on estimated fair values.
The fair value of awards granted that are expected to ultimately vest is recognized as expense over the requisite service periods. The number of options expected to vest equals the total options granted less an estimation of the number of forfeitures expected to occur prior to vesting. The forfeiture rate is calculated based on 15 years of historical data and is adjusted if actual forfeitures differ significantly from the original estimates. The effect of any change in estimated forfeitures would be recognized through a cumulative adjustment that would be included in compensation cost in the period of the change in estimate.
Total share-based compensation cost was approximately $207 million, $56 million and $51 million, respectively, for the years ended December 31, 2020, 2019 and 2018. The incremental change in expense of $151 million for the year ended December 31, 2020, was driven primarily by a larger equity component for Director and Executive compensation, issuance of employee share-based compensation awards and the acceleration of vesting of options on December 3, 2020.
The income tax benefit realized from share-based compensation was $12 million, $9 million and $8 million, respectively, for the years ended December 31, 2020, 2019 and 2018. Refer to Note 8 (Income Taxes) to the consolidated financial statements for additional information.
Stock Options
Corning’s stock option plans provide non-qualified and incentive stock options to purchase authorized but unissued common shares, or treasury shares, at the market price on the grant date and generally become exercisable in installments from one year to five years from the grant date. The maximum term of non-qualified and incentive stock options is 10 years from the grant date. An award is considered vested when the employee’s retention of the award is no longer contingent on providing subsequent service (the “non-substantive vesting period approach”).
The following table summarizes information concerning stock options outstanding, including the related transactions under the stock option plans for the year ended December 31, 2020:
| | | | | | | | | |
| | | | | | | | | |
| Number of
shares
(in thousands) | | Weighted-
average
exercise price | | Weighted-
average
remaining
contractual
term in Years | | Aggregate
intrinsic
value
(in thousands) |
Options Outstanding as of December 31, 2019 | 13,172 | | $ | 21.94 | | | | | |
Granted | 10,653 | | | 19.65 | | | | | |
Exercised | (6,502) | | | 19.16 | | | | | |
Forfeited and expired | (228) | | | 19.96 | | | | | |
Options outstanding as of December 31, 2020 | 17,095 | | | 21.60 | | 7.18 | | $ | 246,236 |
Options expected to vest as of December 31, 2020 | 16,903 | | | 21.61 | | 7.15 | | | 243,277 |
Options exercisable as of December 31, 2020 | 8,646 | | | 19.57 | | 5.66 | | | 142,076 |
The aggregate intrinsic value (market value of stock less option exercise price) in the preceding table represents the total pretax intrinsic value, based on the Company’s closing stock price on December 31, 2020, which would have been received by the option holders had all option holders exercised their “in-the-money” options as of that date. The total number of “in-the-money” options exercisable on December 31, 2020, was approximately 9 million.
The weighted-average grant-date fair value for options granted for the years ended December 31, 2020, 2019 and 2018 was $3.67, $8.78 and $7.17, respectively. The total fair value of options that vested during the years ended December 31, 2020, 2019 and 2018 was approximately $31 million, $10 million and $12 million, respectively. Compensation cost related to stock options for the years ended December 31, 2020, 2019 and 2018, was approximately $23 million, $13 million and $12 million, respectively.
As of December 31, 2020, there was approximately $21 million of unrecognized compensation cost related to stock options granted under the Plans. The cost is expected to be recognized over a weighted-average period of 2.2 years.
Proceeds received from the exercise of stock options were $124 million for the year ended December 31, 2020. The total intrinsic value of options exercised for the years ended December 31, 2020, 2019 and 2018 was approximately $99 million, $47 million and $66 million, respectively.
Corning uses a multiple-point Black-Scholes valuation model to estimate the fair value of stock option grants. Corning utilizes a blended approach for calculating the volatility assumption used in the multiple-point Black-Scholes valuation model defined as the weighted average of the short-term implied volatility, the most recent volatility for the period equal to the expected term, and the most recent 15-year historical volatility. The expected term is the period the options are expected to be outstanding and is calculated using a combination of historical exercise experience adjusted to reflect the current vesting period of options being valued, and partial life cycles of outstanding options. The risk-free rates used in the multiple-point Black-Scholes valuation model are the implied rates for a zero-coupon U.S. Treasury bond with a term equal to the option’s expected term. The ranges given below reflect results from separate groups of employees exhibiting different exercise behavior.
The following inputs were used for the valuation of option grants under the stock option plans:
| | | | | | | | | | | | | | | | |
| | | | | | | | | | | | | | | | |
| 2020 | | 2019 | | 2018 |
Expected volatility | 32.9 | % | | 29.5 | | - | | 29.9 | % | | 30.6 | | - | | 31.4 | % |
Weighted-average volatility | 32.9 | % | | 29.5 | | - | | 29.9 | % | | 30.6 | | - | | 31.4 | % |
Expected dividends | 4.48 | % | | 2.36 | | - | | 2.95 | % | | 2.22 | | - | | 2.66 | % |
Risk-free rate | 0.5 | % | | 1.5 | | - | | 2.4 | % | | 2.7 | | - | | 3.1 | % |
Average risk-free rate | 0.5 | % | | 1.5 | | - | | 2.4 | % | | 2.7 | | - | | 3.1 | % |
Expected term (in years) | 7.4 | | | | | 7.4 | | | | | | | 7.4 | | | |
Pre-vesting executive departure rate | 0.6 | % | | | | 0.6 | % | | | | | | 0.6 | % | | |
Pre-vesting non-executive departure rate | 2.5 | % | | | | | | | | | | | | | | |
Incentive Stock Plans
The Corning Incentive Stock Plan permits restricted stock and restricted stock unit grants, either determined by specific performance goals or issued directly, in most instances, subject to the possibility of forfeiture and without cash consideration. Restricted stock and restricted stock units under the Incentive Stock Plan are granted at the closing market price on the grant date, contingently vest over a period of generally one year to ten years, and generally have contractual lives of one year to ten years. The fair value of each restricted stock grant or restricted stock unit awarded under the Incentive Stock Plan is based on the grant date closing price of the Company’s stock.
Time-Based Restricted Stock and Restricted Stock Units
Time-based restricted stock and restricted stock units are issued by the Company on a discretionary basis, and are payable in shares of the Company’s common stock upon vesting. The fair value is based on the closing market price of the Company’s stock on the grant date. Compensation cost is recognized over the requisite vesting period and adjusted for actual forfeitures before vesting.
The following table represents a summary of the status of the Company’s non-vested time-based restricted stock and restricted stock units as of December 31, 2019 and changes which occurred during the year ended December 31, 2020:
| | | | |
| | | | |
| Number of
shares
(in thousands) | | Weighted-
average
grant-date
fair value |
Non-vested shares and share units at December 31, 2019 | 5,189 | | $ | 27.58 |
Granted | 9,400 | | | 20.90 |
Vested | (1,408) | | | 26.97 |
Forfeited | (238) | | | 23.72 |
Non-vested shares and share units at December 31, 2020 | 12,943 | | $ | 22.87 |
As of December 31, 2020, there was approximately $149 million of unrecognized compensation cost related to non-vested time-based restricted stock and restricted stock units compensation arrangements granted under the Plan. The cost is expected to be recognized over a weighted-average period of 2.4 years. The total fair value of time-based restricted stock that vested during the years ended December 31, 2020, 2019 and 2018 was approximately $38 million, $33 million and $31 million, respectively. Compensation cost related to time-based restricted stock and restricted stock units was approximately $95 million, $43 million and $39 million for the years ended December 31, 2020, 2019 and 2018, respectively.
Performance-Based Restricted Stock Units
Performance-based restricted stock units are earned upon the achievement of certain targets, and are payable in shares of the Company’s common stock upon vesting typically over a three year period. The weighted-average grant date fair value is based on the market price of the Company’s stock on the grant date and assumes that the target payout level will be achieved. Compensation cost is recognized over the requisite vesting period and adjusted for actual forfeitures before vesting. During the performance period, compensation cost may be adjusted based on changes in the expected outcome of the performance-related target.
The following table summarizes information concerning the Company’s non-vested performance-based restricted stock units, including the related transactions under the performance-based restricted stock units plan for the year ended December 31, 2020:
| | | | |
| | | | |
| Number of
shares
(in thousands) | | Weighted-
average
grant-date
fair value |
Non-vested share units at December 31, 2019 | — | | $ | — |
Granted | 2,784 | | | 20.13 |
Vested | | | | |
Forfeited | (41) | | | 19.11 |
Non-vested share units at December 31, 2020 | 2,743 | | $ | 20.14 |
| | | | |
As of December 31, 2020, there was approximately $32 million of unrecognized compensation cost related to non-vested performance-based restricted stock units compensation arrangements granted under the Plan. The cost is expected to be recognized over a weighted-average period of 2.0 years. Compensation cost related to performance-based restricted stock units for the year ended December 31, 2020, was approximately $81 million, largely driven by retirement-eligible employees.
20.Reportable Segments
Reportable segments are as follows:
Display Technologies – manufactures glass substrates for flat panel liquid crystal displays and other high-performance display panels.
Optical Communications – manufactures carrier network and enterprise network components for the telecommunications industry.
Specialty Materials – manufactures products that provide more than 150 material formulations for glass, glass ceramics and fluoride crystals to meet demand for unique customer needs.
Environmental Technologies – manufactures ceramic substrates and filters for automotive and diesel applications.
Life Sciences – manufactures glass and plastic labware, equipment, media, serum and reagents enabling workflow solutions for drug discovery and bioproduction.
All other segments that do not meet the quantitative threshold for separate reporting have been grouped as “All Other.” This group is primarily comprised of the results of the pharmaceutical technologies, auto glass and new product lines and development projects, as well as other businesses and certain corporate investments.
The Company obtained a controlling interest in HSG during the third quarter of 2020 and has consolidated results in “All Other” as of September 9, 2020. Refer to Note 4 (HSG Transactions and Acquisitions) to the consolidated financial statements for additional information on this transaction.
Financial results for the reportable segments are prepared on a basis consistent with the internal disaggregation of financial information to assist the CODM in making internal operating decisions. The impact of changes in the Japanese yen, South Korean won, Chinese yuan and new Taiwan dollar are excluded from segment sales and segment net income for the Display Technologies and Specialty Materials segments. The impact of changes in the euro and Chinese yuan are excluded from segment sales and segment net income for the Environment Technologies segment. The impact of changes in the euro, Chinese yuan and Japanese yen are excluded from segment sales and segment net income for the Life Sciences segment. Certain income and expenses are included in the unallocated amounts in the reconciliation of reportable segment net income (loss) to consolidated net income. These include items that are not used by the CODM in evaluating the results of or in allocating resources to the segments and include the following items: the impact of the translated earnings contracts; acquisition-related costs; discrete tax items and other tax-related adjustments; certain litigation, regulatory and other legal matters; restructuring, impairment losses and other charges and credits; adjustments relating to acquisitions; and other non-recurring non-operational items. Although these amounts are excluded from segment results, they are included in reported consolidated results.
Earnings of equity affiliates that are closely associated with the reportable segments are included in the respective segment’s net income (loss). Certain common expenses among reportable segments have been allocated differently than they would for stand-alone financial information. Segment net income (loss) may not be consistent with measures used by other companies.
The following provides historical segment information as described above:
Segment Information (in millions)
| | | | | | | | | | | | | | | | | | | | |
| | | | | | | | | | | | | | | | | | | | |
| Display
Technologies | | Optical
Communications | | Specialty
Materials | | Environmental
Technologies | | Life
Sciences | | All
Other | | Total |
| | | | | | | | | | | | | | | | | | | | |
For the year ended December 31, 2020 | | | | | | | | | | | | | | | | | | | | |
Segment net sales | $ | 3,172 | | $ | 3,563 | | $ | 1,884 | | $ | 1,370 | | $ | 998 | | $ | 465 | | $ | 11,452 |
Depreciation (1) | $ | 548 | | $ | 242 | | $ | 162 | | $ | 132 | | $ | 50 | | $ | 81 | | $ | 1,215 |
Research, development
and engineering expenses (2) | $ | 99 | | $ | 204 | | $ | 155 | | $ | 100 | | $ | 26 | | $ | 170 | | $ | 754 |
Income tax (provision) benefit (3) | $ | (190) | | $ | (101) | | $ | (113) | | $ | (52) | | $ | (37) | | $ | 58 | | $ | (435) |
Net income (loss) (4) | $ | 717 | | $ | 366 | | $ | 423 | | $ | 197 | | $ | 139 | | $ | (214) | | $ | 1,628 |
Investment in affiliated companies, at equity | $ | 107 | | $ | 3 | | $ | 4 | | $ | — | | $ | 2 | | $ | 142 | | $ | 258 |
Segment assets (5) | $ | 8,777 | | $ | 2,868 | | $ | 2,551 | | $ | 1,986 | | $ | 683 | | $ | 2,157 | | $ | 19,022 |
Capital expenditures | $ | 311 | | $ | 127 | | $ | 125 | | $ | 159 | | $ | 83 | | $ | 123 | | $ | 928 |
| | | | | | | | | | | | | | | | | | | | |
For the year ended December 31, 2019 | | | | | | | | | | | | | | | | | | | | |
Segment net sales | $ | 3,254 | | $ | 4,064 | | $ | 1,594 | | $ | 1,499 | | $ | 1,015 | | $ | 230 | | $ | 11,656 |
Depreciation (1) | $ | 583 | | $ | 237 | | $ | 145 | | $ | 128 | | $ | 49 | | $ | 50 | | $ | 1,192 |
Research, development
and engineering expenses (2) | $ | 119 | | $ | 218 | | $ | 154 | | $ | 118 | | $ | 21 | | $ | 237 | | $ | 867 |
Income tax (provision) benefit (3) | $ | (206) | | $ | (134) | | $ | (81) | | $ | (70) | | $ | (40) | | $ | 80 | | $ | (451) |
Net income (loss) (4) | $ | 786 | | $ | 489 | | $ | 302 | | $ | 263 | | $ | 150 | | $ | (289) | | $ | 1,701 |
Investment in affiliated companies, at equity | $ | 145 | | $ | 3 | | $ | 3 | | $ | — | | $ | 3 | | $ | 137 | | $ | 291 |
Segment assets (5) | $ | 9,022 | | $ | 3,004 | | $ | 2,433 | | $ | 1,912 | | $ | 627 | | $ | 1,028 | | $ | 18,026 |
Capital expenditures | $ | 872 | | $ | 329 | | $ | 176 | | $ | 287 | | $ | 80 | | $ | 155 | | $ | 1,899 |
| | | | | | | | | | | | | | | | | | | | |
For the year ended December 31, 2018 | | | | | | | | | | | | | | | | | | | | |
Segment net sales | $ | 3,276 | | $ | 4,192 | | $ | 1,479 | | $ | 1,289 | | $ | 946 | | $ | 216 | | $ | 11,398 |
Depreciation (1) | $ | 585 | | $ | 218 | | $ | 136 | | $ | 119 | | $ | 50 | | $ | 38 | | $ | 1,146 |
Research, development
and engineering expenses (2) | $ | 106 | | $ | 212 | | $ | 163 | | $ | 118 | | $ | 20 | | $ | 231 | | $ | 850 |
Income tax (provision) benefit (3) | $ | (221) | | $ | (163) | | $ | (83) | | $ | (55) | | $ | (31) | | $ | 76 | | $ | (477) |
Net income (loss) (4) | $ | 835 | | $ | 592 | | $ | 313 | | $ | 208 | | $ | 117 | | $ | (281) | | $ | 1,784 |
Investment in affiliated companies, at equity | $ | 131 | | $ | 3 | | $ | 6 | | $ | — | | $ | 1 | | $ | 171 | | $ | 312 |
Segment assets (5) | $ | 8,794 | | $ | 3,042 | | $ | 2,176 | | $ | 1,633 | | $ | 585 | | $ | 1,018 | | $ | 17,248 |
Capital expenditures | $ | 755 | | $ | 417 | | $ | 242 | | $ | 273 | | $ | 55 | | $ | 329 | | $ | 2,071 |
(1)Depreciation expense for Corning’s reportable segments includes an allocation of depreciation of corporate property not specifically identifiable to a segment.
(2)Research, development and engineering expenses include direct project spending that is identifiable to a segment.
(3)Income tax (provision) benefit reflects a tax rate of 21%.
(4)Many of Corning’s administrative and staff functions are performed on a centralized basis. Where practicable, Corning charges these expenses to segments based upon the extent to which each business uses a centralized function. Other staff functions, such as corporate finance, human resources and legal, are allocated to segments, primarily as a percentage of sales. Expenses that are not allocated to the segments are included in the reconciliation of reportable segment net income (loss) to consolidated net income.
(5)Segment assets include inventory, accounts receivable, property, plant and equipment, net of accumulated depreciation, and associated equity companies. HSG assets are included as of December 31, 2020.
A reconciliation of reportable segments and “All Other” net sales to consolidated net sales is as follows (in millions):
| | | | | | | | | |
| | | | | | | | | |
| | Year ended December 31, |
| | 2020 | | 2019 | | 2018 |
Net sales of reportable segments and All Other | | $ | 11,452 | | $ | 11,656 | | $ | 11,398 |
Impact of foreign currency movements (1) | | | (44) | | | (153) | | | (108) |
Cumulative adjustment related to customer contract (2) | | | (105) | | | | | | |
Consolidated net sales | | $ | 11,303 | | $ | 11,503 | | $ | 11,290 |
(1)This amount primarily represents the impact of foreign currency adjustments in the Display Technologies, Environmental Technologies and Life Sciences segments.
(2)Amount represents the negative impact of a cumulative adjustment recorded during the first quarter of 2020 to reduce revenue in the amount of $105 million. The adjustment was associated with a previously recorded commercial benefit asset, reflected as a prepayment, to a customer with a long-term supply agreement that is exiting its production of LCD panels. Refer to Note 5 (Revenue) to the consolidated financial statements for additional information.
A reconciliation of reportable segment net income (loss) to consolidated net income follows (in millions):
| | | | | | | | |
| | | | | | | | |
| Year ended December 31, |
| 2020 | | 2019 | | 2018 |
Net income of reportable segments | $ | 1,842 | | $ | 1,990 | | $ | 2,065 |
Net loss of All Other (1) | | (214) | | | (289) | | | (281) |
Unallocated amounts: | | | | | | | | |
Impact of foreign currency movements not
included in segment net income (loss) | | (22) | | | (115) | | | (157) |
Gain (loss) on foreign currency hedges
related to translated earnings | | (46) | | | 245 | | | (78) |
Translation loss on Japanese yen-denominated debt | | (86) | | | (3) | | | (18) |
Litigation, regulatory and other legal matters | | (144) | | | 17 | | | (124) |
Research, development, and engineering expense (2)(6) | | (153) | | | (134) | | | (137) |
Transaction-related gain, net (3) | | 498 | | | | | | |
Equity in (losses) earnings of affiliated companies (4) | | (24) | | | 15 | | | 390 |
Amortization of intangibles | | (121) | | | (113) | | | (93) |
Interest expense, net | | (261) | | | (200) | | | (149) |
Income tax benefit (provision) | | 324 | | | 195 | | | 42 |
Pension mark-to-market | | (31) | | | (95) | | | (145) |
Cumulative adjustment related to customer contract (5) | | (105) | | | | | | |
Severance charges (6) | | (148) | | | (63) | | | (16) |
Asset impairment (6) | | (217) | | | | | | |
Capacity realignment and other charges and credits (6) | | (462) | | | (376) | | | (114) |
Bond redemption loss (7) | | (22) | | | | | | |
Gain on investment (8) | | 107 | | | | | | |
Other corporate items | | (203) | | | (114) | | | (119) |
Net income | $ | 512 | | $ | 960 | | $ | 1,066 |
(1)The Company obtained a controlling interest in HSG during the third quarter of 2020 and has consolidated results in “All Other” as of September 9, 2020.
(2)Amount does not include research, development, and engineering expense related to restructuring, impairment and other charges and credits.
(3)Amount represents the pre-tax gain recorded on Corning’s previously held equity investment in HSG. Refer to Note 4 (HSG Transactions and Acquisitions) to the consolidated financial statements for additional information on this transaction.
(4)Primarily represents the equity earnings of HSG prior to September 9, 2020. Refer to Note 3 (Investments) and Note 4 (HSG Transactions and Acquisitions) to the consolidated financial statements for more information.
(5)Amount represents the negative impact of a cumulative adjustment to reduce revenue in the amount of $105 million recorded during the first quarter of 2020. The adjustment was associated with a previously recorded commercial benefit asset, reflected as a prepayment, to a customer with a long-term supply agreement that is exiting its production of LCD panels. Refer to Note 5 (Revenue) to the consolidated financial statements for additional information.
(6)Refer to Note 2 (Restructuring, Impairment and Other Charges and Credits) to the consolidated financial statements for additional information on restructuring activities and impairment.
(7)Refer to Note 12 (Debt) to the consolidated financial statements for additional information on the bond redemption loss.
(8)Amount represents the gain recognized from the initial public offering of an investment in the fourth quarter of 2020.
A reconciliation of reportable segment assets to consolidated total assets follows (in millions):
| | | | | | | | |
| | | | | | | | |
| December 31, |
| 2020 | | 2019 | | 2018 |
Total assets of reportable segments | $ | 16,865 | | $ | 16,998 | | $ | 16,230 |
Non-reportable segments | | 2,157 | | | 1,028 | | | 1,018 |
Unallocated amounts: | | | | | | | | |
Current assets (1) | | 3,434 | | | 3,301 | | | 3,065 |
Investments (2) | | 177 | | | 43 | | | 64 |
Property, plant and equipment, net (3) | | 1,548 | | | 1,764 | | | 1,928 |
Other non-current assets (4) | | 6,594 | | | 5,764 | | | 5,200 |
Total assets | $ | 30,775 | | $ | 28,898 | | $ | 27,505 |
(1)Includes current corporate assets, including cash, other receivables, prepaid expenses and current portion of long-term derivative assets.
(2)Represents other corporate investments. Asset balance does not include equity method affiliate liability balance of $270 million for HSG in 2019. HSG became a fully consolidated subsidiary of Corning on September 9, 2020.
(3)Represents corporate property not specifically identifiable to an operating segment.
(4)Includes non-current corporate assets, including goodwill, other intangible assets, pension assets, long-term derivative assets, operating leases and deferred income taxes.
Selected financial information concerning the Company’s product lines and reportable segments follow (in millions):
| | | | | | | | |
| | | | | | | | |
| Year ended December 31, |
Revenue from external customers | 2020 | | 2019 | | 2018 |
| | | | | | | | |
Display Technologies | $ | 3,172 | | $ | 3,254 | | $ | 3,276 |
| | | | | | | | |
Optical Communications | | | | | | | | |
Carrier network | | 2,612 | | | 2,885 | | | 3,084 |
Enterprise network | | 951 | | | 1,179 | | | 1,108 |
Total Optical Communications | | 3,563 | | | 4,064 | | | 4,192 |
| | | | | | | | |
Specialty Materials | | | | | | | | |
Corning® Gorilla® Glass | | 1,420 | | | 1,180 | | | 1,069 |
Advanced optics and other specialty glass | | 464 | | | 414 | | | 410 |
Total Specialty Materials | | 1,884 | | | 1,594 | | | 1,479 |
| | | | | | | | |
Environmental Technologies | | | | | | | | |
Automotive and other | | 883 | | | 907 | | | 719 |
Diesel | | 487 | | | 592 | | | 570 |
Total Environmental Technologies | | 1,370 | | | 1,499 | | | 1,289 |
| | | | | | | | |
Life Sciences | | | | | | | | |
Labware | | 552 | | | 550 | | | 536 |
Cell culture products | | 446 | | | 465 | | | 410 |
Total Life Science | | 998 | | | 1,015 | | | 946 |
| | | | | | | | |
All Other | | | | | | | | |
All Other | | 271 | | | 230 | | | 216 |
Polycrystalline silicon | | 194 | | | | | | |
Total All Other | | 465 | | | 230 | | | 216 |
| | | | | | | | |
Net sales of reportable segments and All Other | | 11,452 | | | 11,656 | | | 11,398 |
Impact of foreign currency movements (1) | | (44) | | | (153) | | | (108) |
Cumulative adjustment related to customer contract (2) | | (105) | | | | | | |
Consolidated net sales | $ | 11,303 | | $ | 11,503 | | $ | 11,290 |
(1)This amount primarily represents the impact of foreign currency adjustments in the Display Technologies, Environmental Technologies and Life Sciences segments.
(2)Amount represents the negative impact of a cumulative adjustment recorded during the first quarter of 2020 to reduce revenue in the amount of $105 million. The adjustment was associated with a previously recorded commercial benefit asset, reflected as a prepayment, to a customer with a long-term supply agreement that is exiting its production of LCD panels. Refer to Note 5 (Revenue) to the consolidated financial statements for additional information.
Information concerning principal geographic areas was as follows (in millions):
| | | | | | | | | | | | | | | | | |
| | | | | | | | | | | | | | | | | |
| 2020 | | 2019 | | 2018 |
| Net
sales (1)(3) | | Long-lived
assets (2)(3) | | Net
sales (1) | | Long-lived
assets (2) | | Net
sales (1) | | Long-lived
assets (2) |
| | | | | | | | | | | | | | | | | |
North America: | | | | | | | | | | | | | | | | | |
United States | $ | 3,412 | | $ | 8,718 | | $ | 3,760 | | $ | 7,654 | | $ | 3,569 | | $ | 7,538 |
Canada | | 274 | | | 121 | | | 277 | | | 126 | | | 296 | | | 127 |
Mexico | | 75 | | | 239 | | | 55 | | | 267 | | | 53 | | | 200 |
Total North America | | 3,761 | | | 9,078 | | | 4,092 | | | 8,047 | | | 3,918 | | | 7,865 |
| | | | | | | | | | | | | | | | | |
Asia Pacific: | | | | | | | | | | | | | | | | | |
Japan | | 505 | | | 583 | | | 441 | | | 893 | | | 415 | | | 1,148 |
Taiwan | | 887 | | | 2,247 | | | 880 | | | 2,280 | | | 921 | | | 2,326 |
China | | 3,734 | | | 4,469 | | | 3,096 | | | 3,816 | | | 2,716 | | | 2,644 |
Korea | | 748 | | | 3,597 | | | 1,051 | | | 3,625 | | | 1,259 | | | 3,736 |
Other | | 340 | | | 83 | | | 401 | | | 86 | | | 436 | | | 85 |
Total Asia Pacific | | 6,214 | | | 10,979 | | | 5,869 | | | 10,700 | | | 5,747 | | | 9,939 |
| | | | | | | | | | | | | | | | | |
Europe: | | | | | | | | | | | | | | | | | |
Germany | | 378 | | | 579 | | | 435 | | | 546 | | | 451 | | | 508 |
Other | | 838 | | | 931 | | | 886 | | | 914 | | | 905 | | | 1,147 |
Total Europe | | 1,216 | | | 1,510 | | | 1,321 | | | 1,460 | | | 1,356 | | | 1,655 |
| | | | | | | | | | | | | | | | | |
All Other | | 261 | | | 83 | | | 374 | | | 71 | | | 377 | | | 61 |
Total | $ | 11,452 | | $ | 21,650 | | $ | 11,656 | | $ | 20,278 | | $ | 11,398 | | $ | 19,520 |
(1)Net sales are attributed to countries based on location of customer.
(2)Long-lived assets primarily include investments, plant and equipment, goodwill and other intangible assets.
(3)Includes HSG’s net sales and long-lived assets as of December 31, 2020. Refer to Note 3 (Investments) and Note 4 (HSG Transactions and Acquisitions) to the consolidated financial statements for more information.
Corning Incorporated and Subsidiary Companies
Schedule II – Valuation and Qualifying Accounts
(in millions)
| | | | | | | | | | | | |
| | | | | | | | | | | | |
Year ended December 31, 2020 | | Balance at
beginning
of period | | Additions | | Net
deductions
and other | | Balance at
end
of period |
| | | | | | | | | | | | |
Doubtful accounts | | $ | 41 | | $ | 5 | | | | | $ | 46 |
Deferred tax valuation allowance | | $ | 215 | | $ | 27 | | $ | 75 | | $ | 167 |
| | | | | | | | | | | | |
| | | | | | | | | | | | |
Year ended December 31, 2019 | | Balance at
beginning
of period | | Additions | | Net
deductions
and other | | Balance at
end
of period |
| | | | | | | | | | | | |
Doubtful accounts | | $ | 35 | | $ | 6 | | | | | $ | 41 |
Deferred tax valuation allowance | | $ | 317 | | $ | 10 | | $ | 112 | | $ | 215 |
| | | | | | | | | | | | |
| | | | | | | | | | | | |
Year ended December 31, 2018 | | Balance at
beginning
of period | | Additions | | Net
deductions
and other | | Balance at
end
of period |
| | | | | | | | | | | | |
Doubtful accounts | | $ | 32 | | $ | 3 | | | | | $ | 35 |
Deferred tax valuation allowance | | $ | 456 | | $ | 17 | | $ | 156 | | $ | 317 |