UNITED STATES
SECURITIES AND EXCHANGE COMMISSION
WASHINGTON, D.C. 20549
FORM 10-Q
x | Quarterly Report Pursuant To Section 13 or 15(d) of the Securities Exchange Act of 1934 |
FOR THE QUARTERLY PERIOD ENDED JUNE 30, 2015
OR
¨ | Transition Report Pursuant to Section 13 or 15(d) of the Securities Exchange Act of 1934 |
For the transition period from to
Commission File Number | Exact name of registrant as specified in its charter and principal office address and telephone number | State of Incorporation | I.R.S. Employer ID. Number | |||
1-14514 | Consolidated Edison, Inc. | New York | 13-3965100 | |||
4 Irving Place, New York, New York 10003 | ||||||
(212) 460-4600 | ||||||
1-1217 | Consolidated Edison Company of New York, Inc. | New York | 13-5009340 | |||
4 Irving Place, New York, New York 10003 | ||||||
(212) 460-4600 | ||||||
Indicate by check mark whether the registrant (1) has filed all reports required to be filed by Section 13 or 15(d) of the Securities Exchange Act of 1934 during the preceding 12 months (or for such shorter period that the registrant was required to file such reports), and (2) has been subject to such filing requirements for the past 90 days.
Consolidated Edison, Inc. (Con Edison) | Yes x | No ¨ |
Consolidated Edison Company of New York, Inc. (CECONY) | Yes x | No ¨ |
Indicate by check mark whether the registrant has submitted electronically and posted on its corporate Web site, if any, every Interactive Data File required to be submitted and posted pursuant to Rule 405 of Regulation S-T (§232.405 of this chapter) during the preceding 12 months (or for such shorter period that the registrant was required to submit and post such files).
Con Edison | Yes x | No ¨ |
CECONY | Yes x | No ¨ |
Indicate by check mark whether the registrant is a large accelerated filer, an accelerated filer, a non-accelerated filer, or a smaller reporting company. See the definitions of “large accelerated filer”, “accelerated filer” and “smaller reporting company” in Rule 12b-2 of the Exchange Act.
Con Edison | |||
Large accelerated filer x | Accelerated filer ¨ | Non-accelerated filer ¨ | Smaller reporting company ¨ |
CECONY | |||
Large accelerated filer ¨ | Accelerated filer ¨ | Non-accelerated filer x | Smaller reporting company ¨ |
Indicate by check mark whether the registrant is a shell company (as defined in Rule 12b-2 of the Exchange Act).
Con Edison | Yes ¨ | No x |
CECONY | Yes ¨ | No x |
As of July 31, 2015, Con Edison had outstanding 292,871,896 Common Shares ($.10 par value). All of the outstanding common equity of CECONY is held by Con Edison.
Filing Format
This Quarterly Report on Form 10-Q is a combined report being filed separately by two different registrants: Consolidated Edison, Inc. (Con Edison) and Consolidated Edison Company of New York, Inc. (CECONY). CECONY is a wholly-owned subsidiary of Con Edison and, as such, the information in this report about CECONY also applies to Con Edison. As used in this report, the term the “Companies” refers to Con Edison and CECONY. However, CECONY makes no representation as to the information contained in this report relating to Con Edison or the subsidiaries of Con Edison other than itself.
Glossary of Terms
The following is a glossary of abbreviations or acronyms that are used in the Companies’ SEC reports:
Con Edison Companies | |
Con Edison | Consolidated Edison, Inc. |
CECONY | Consolidated Edison Company of New York, Inc. |
Con Edison Development | Consolidated Edison Development, Inc. |
Con Edison Energy | Consolidated Edison Energy, Inc. |
Con Edison Solutions | Consolidated Edison Solutions, Inc. |
Con Edison Transmission | Consolidated Edison Transmission, LLC |
O&R | Orange and Rockland Utilities, Inc. |
Pike | Pike County Light & Power Company |
RECO | Rockland Electric Company |
The Companies | Con Edison and CECONY |
The Utilities | CECONY and O&R |
Regulatory Agencies, Government Agencies, and Quasi-governmental Not-for-Profits | |
EPA | U. S. Environmental Protection Agency |
FERC | Federal Energy Regulatory Commission |
IRS | Internal Revenue Service |
NJBPU | New Jersey Board of Public Utilities |
NJDEP | New Jersey Department of Environmental Protection |
NYISO | New York Independent System Operator |
NYPA | New York Power Authority |
NYSDEC | New York State Department of Environmental Conservation |
NYSERDA | New York State Energy Research and Development Authority |
NYSPSC | New York State Public Service Commission |
NYSRC | New York State Reliability Council, LLC |
PAPUC | Pennsylvania Public Utility Commission |
PJM | PJM Interconnection LLC |
SEC | U.S. Securities and Exchange Commission |
Accounting | |
ASU | Accounting Standards Update |
FASB | Financial Accounting Standards Board |
GAAP | Generally Accepted Accounting Principles in the United States of America |
LILO | Lease In/Lease Out |
OCI | Other Comprehensive Income |
VIE | Variable interest entity |
Environmental | |
CO2 | Carbon dioxide |
GHG | Greenhouse gases |
MGP Sites | Manufactured gas plant sites |
PCBs | Polychlorinated biphenyls |
PRP | Potentially responsible party |
Superfund | Federal Comprehensive Environmental Response, Compensation and Liability Act of 1980 and similar state statutes |
2
Units of Measure | |
AC | Alternating current |
Dt | Dekatherms |
kV | Kilovolt |
kWh | Kilowatt-hour |
MDt | Thousand dekatherms |
MMlb | Million pounds |
MVA | Megavolt ampere |
MW | Megawatt or thousand kilowatts |
MWH | Megawatt hour |
Other | |
AFUDC | Allowance for funds used during construction |
COSO | Committee of Sponsoring Organizations of the Treadway Commission |
DER | Distributed energy resources |
DSP | Distributed System Platform |
Fitch | Fitch Ratings |
First Quarter Form 10-Q | The Companies' combined Quarterly Report on Form 10-Q for the quarterly period ended March 31 of the current year |
Second Quarter Form 10-Q | The Companies' combined Quarterly Report on Form 10-Q for the quarterly period ended June 30 of the current year |
Form 10-K | The Companies’ combined Annual Report on Form 10-K for the year ended December 31, 2014 |
LTIP | Long Term Incentive Plan |
Moody’s | Moody’s Investors Service |
REV | Reforming the Energy Vision |
S&P | Standard & Poor’s Financial Services LLC |
VaR | Value-at-Risk |
3
TABLE OF CONTENTS
PAGE | ||
ITEM 1 | Financial Statements (Unaudited) | |
Con Edison | ||
CECONY | ||
ITEM 2 | ||
ITEM 3 | ||
ITEM 4 | ||
ITEM 1 | ||
ITEM 1A | ||
ITEM 2 | ||
ITEM 6 | ||
4
FORWARD-LOOKING STATEMENTS
This report includes forward-looking statements intended to qualify for the safe-harbor provisions of Section 27A of the Securities Act of 1933, as amended, and Section 21E of the Securities Exchange Act of 1934, as amended. Forward-looking statements are statements of future expectation and not facts. Words such as “forecasts,” “expects,” “estimates,” “anticipates,” “intends,” “believes,” “plans,” “will” and similar expressions identify forward-looking statements. Forward-looking statements are based on information available at the time the statements are made, and accordingly speak only as of that time. Actual results or developments might differ materially from those included in the forward-looking statements because of various factors including:
• | the Companies are extensively regulated and are subject to penalties; |
• | the Utilities’ rate plans may not provide a reasonable return; |
• | the Companies may be adversely affected by changes to the Utilities’ rate plans; |
• | the intentional misconduct of employees or contractors could adversely affect the Companies; |
• | the failure of, or damage to, the Companies’ facilities could adversely affect the Companies; |
• | a cyber attack could adversely affect the Companies; |
• | the Companies are exposed to risks from the environmental consequences of their operations; |
• | a disruption in the wholesale energy markets or failure by an energy supplier could adversely affect the Companies; |
• | the Companies have substantial unfunded pension and other postretirement benefit liabilities; |
• | Con Edison’s ability to pay dividends or interest depends on dividends from its subsidiaries; |
• | the Companies require access to capital markets to satisfy funding requirements; |
• | the Companies’ strategies may not be effective to address changes in the external business environment; and |
• | the Companies also face other risks that are beyond their control. |
5
Consolidated Edison, Inc.
CONSOLIDATED INCOME STATEMENT (UNAUDITED)
For the Three Months Ended June 30, | For the Six Months Ended June 30, | |||||
2015 | 2014 | 2015 | 2014 | |||
(Millions of Dollars/ Except Share Data) | ||||||
OPERATING REVENUES | ||||||
Electric | $2,040 | $2,134 | $4,175 | $4,372 | ||
Gas | 324 | 395 | 1,056 | 1,277 | ||
Steam | 96 | 98 | 471 | 439 | ||
Non-utility | 328 | 284 | 702 | 612 | ||
TOTAL OPERATING REVENUES | 2,788 | 2,911 | 6,404 | 6,700 | ||
OPERATING EXPENSES | ||||||
Purchased power | 660 | 783 | 1,544 | 1,746 | ||
Fuel | 31 | 34 | 185 | 189 | ||
Gas purchased for resale | 89 | 151 | 351 | 551 | ||
Other operations and maintenance | 802 | 801 | 1,616 | 1,627 | ||
Depreciation and amortization | 276 | 265 | 555 | 526 | ||
Taxes, other than income taxes | 458 | 467 | 955 | 966 | ||
TOTAL OPERATING EXPENSES | 2,316 | 2,501 | 5,206 | 5,605 | ||
Gain on sale of solar energy projects | — | 45 | — | 45 | ||
OPERATING INCOME | 472 | 455 | 1,198 | 1,140 | ||
OTHER INCOME (DEDUCTIONS) | ||||||
Investment and other income | 14 | 14 | 19 | 25 | ||
Allowance for equity funds used during construction | 1 | 1 | 2 | 3 | ||
Other deductions | (5) | (6) | (7) | (8) | ||
TOTAL OTHER INCOME | 10 | 9 | 14 | 20 | ||
INCOME BEFORE INTEREST AND INCOME TAX EXPENSE | 482 | 464 | 1,212 | 1,160 | ||
INTEREST EXPENSE | ||||||
Interest on long-term debt | 156 | 147 | 311 | 293 | ||
Other interest (income) | 7 | 4 | 13 | (5) | ||
Allowance for borrowed funds used during construction | (1) | (1) | (1) | (2) | ||
NET INTEREST EXPENSE | 162 | 150 | 323 | 286 | ||
INCOME BEFORE INCOME TAX EXPENSE | 320 | 314 | 889 | 874 | ||
INCOME TAX EXPENSE | 101 | 102 | 300 | 300 | ||
NET INCOME FOR COMMON STOCK | $219 | $212 | $589 | $574 | ||
Net income for common stock per common share—basic | $0.75 | $0.73 | $2.01 | $1.96 | ||
Net income for common stock per common share—diluted | $0.74 | $0.72 | $2.01 | $1.95 | ||
DIVIDENDS DECLARED PER SHARE OF COMMON STOCK | $0.65 | $0.63 | $1.30 | $1.26 | ||
AVERAGE NUMBER OF SHARES OUTSTANDING—BASIC (IN MILLIONS) | 292.9 | 292.9 | 292.9 | 292.9 | ||
AVERAGE NUMBER OF SHARES OUTSTANDING—DILUTED (IN MILLIONS) | 294.0 | 294.0 | 293.9 | 294.0 | ||
The accompanying notes are an integral part of these financial statements.
6
Consolidated Edison, Inc.
CONSOLIDATED STATEMENT OF COMPREHENSIVE INCOME (UNAUDITED)
For the Three Months Ended June 30, | For the Six Months Ended June 30, | |||
2015 | 2014 | 2015 | 2014 | |
(Millions of Dollars) | ||||
NET INCOME | $219 | $212 | $589 | $574 |
OTHER COMPREHENSIVE INCOME, NET OF TAXES | ||||
Pension and other postretirement benefit plan liability adjustments, net of taxes | 1 | 1 | 6 | 5 |
TOTAL OTHER COMPREHENSIVE INCOME, NET OF TAXES | 1 | 1 | 6 | 5 |
COMPREHENSIVE INCOME FOR COMMON STOCK | $220 | $213 | $595 | $579 |
The accompanying notes are an integral part of these financial statements.
7
Consolidated Edison, Inc.
CONSOLIDATED STATEMENT OF CASH FLOWS (UNAUDITED)
For the Six Months Ended June 30, | ||||
2015 | 2014 | |||
(Millions of Dollars) | ||||
OPERATING ACTIVITIES | ||||
Net income | $589 | $574 | ||
PRINCIPAL NON-CASH CHARGES/(CREDITS) TO INCOME | ||||
Depreciation and amortization | 555 | 526 | ||
Deferred income taxes | 202 | 162 | ||
Rate case amortization and accruals | (20) | 61 | ||
Common equity component of allowance for funds used during construction | (2) | (3) | ||
Net derivative gains (loss) | 8 | (15) | ||
Pre-tax gain on sale of solar electric production projects | — | (45) | ||
Other non-cash items (net) | 18 | (6) | ||
CHANGES IN ASSETS AND LIABILITIES | ||||
Accounts receivable – customers, less allowance for uncollectibles | 35 | 24 | ||
Special deposits | 4 | 312 | ||
Materials and supplies, including fuel oil and gas in storage | 48 | 40 | ||
Other receivables and other current assets | (21) | 2 | ||
Income taxes receivable | 224 | — | ||
Prepayments | (144) | (11) | ||
Accounts payable | (158) | 21 | ||
Pensions and retiree benefits obligations (net) | 379 | 404 | ||
Pensions and retiree benefits contributions | (407) | (406) | ||
Accrued taxes | (20) | (407) | ||
Accrued interest | (1) | (76) | ||
Superfund and environmental remediation costs (net) | 15 | 16 | ||
Distributions from equity investments related to renewable electric production projects | 18 | — | ||
Deferred charges, noncurrent assets and other regulatory assets | (3) | (35) | ||
Deferred credits and other regulatory liabilities | 136 | 158 | ||
Other current and noncurrent liabilities | 31 | (39) | ||
NET CASH FLOWS FROM OPERATING ACTIVITIES | 1,486 | 1,257 | ||
INVESTING ACTIVITIES | ||||
Utility construction expenditures | (1,174) | (1,073) | ||
Cost of removal less salvage | (105) | (99) | ||
Non-utility construction expenditures | (178) | (113) | ||
Investments in/acquisitions of renewable electric production projects | (252) | (107) | ||
Proceeds from grants related to solar electric production projects | — | 36 | ||
Proceeds from sale of solar electric production projects | — | 108 | ||
Return of equity investments related to renewable electric production projects | 6 | — | ||
Restricted cash | (22) | 15 | ||
NET CASH FLOWS USED IN INVESTING ACTIVITIES | (1,725) | (1,233) | ||
FINANCING ACTIVITIES | ||||
Net issuance of short-term debt | 445 | 80 | ||
Issuance of long-term debt | 238 | 850 | ||
Retirement of long-term debt | (45) | (478) | ||
Debt issuance costs | (2) | (6) | ||
Common stock dividends | (380) | (368) | ||
Issuance of common shares for stock plans, net of repurchases | (7) | (2) | ||
NET CASH FLOWS FROM FINANCING ACTIVITIES | 249 | 76 | ||
CASH AND TEMPORARY CASH INVESTMENTS: | ||||
NET CHANGE FOR THE PERIOD | 10 | 100 | ||
BALANCE AT BEGINNING OF PERIOD | 699 | 674 | ||
BALANCE AT END OF PERIOD | $709 | $774 | ||
SUPPLEMENTAL DISCLOSURE OF CASH INFORMATION | ||||
Cash paid/(received) during the period for: | ||||
Interest | $305 | $277 | ||
Income taxes | $(9) | $518 | ||
SUPPLEMENTAL DISCLOSURE OF NON-CASH INFORMATION | ||||
Construction expenditures in accounts payable | $213 | $140 | ||
The accompanying notes are an integral part of these financial statements.
8
Consolidated Edison, Inc.
CONSOLIDATED BALANCE SHEET (UNAUDITED)
June 30, 2015 | December 31, 2014 | |||
(Millions of Dollars) | ||||
ASSETS | ||||
CURRENT ASSETS | ||||
Cash and temporary cash investments | $709 | $699 | ||
Special deposits | 4 | 8 | ||
Accounts receivable – customers, less allowance for uncollectible accounts of $91 and $96 in 2015 and 2014, respectively | 1,084 | 1,201 | ||
Other receivables, less allowance for uncollectible accounts of $10 in 2015 and 2014 | 255 | 133 | ||
Income taxes receivable | — | 224 | ||
Accrued unbilled revenue | 361 | 500 | ||
Fuel oil, gas in storage, materials and supplies, at average cost | 321 | 372 | ||
Prepayments | 307 | 163 | ||
Regulatory assets | 75 | 148 | ||
Deferred tax assets | 173 | 128 | ||
Assets held for sale | 167 | — | ||
Other current assets | 223 | 278 | ||
TOTAL CURRENT ASSETS | 3,679 | 3,854 | ||
INVESTMENTS | 848 | 816 | ||
UTILITY PLANT, AT ORIGINAL COST | ||||
Electric | 25,741 | 25,091 | ||
Gas | 6,329 | 6,102 | ||
Steam | 2,288 | 2,251 | ||
General | 2,517 | 2,465 | ||
TOTAL | 36,875 | 35,909 | ||
Less: Accumulated depreciation | 7,826 | 7,614 | ||
Net | 29,049 | 28,295 | ||
Construction work in progress | 996 | 1,031 | ||
NET UTILITY PLANT | 30,045 | 29,326 | ||
NON-UTILITY PLANT | ||||
Non-utility property, less accumulated depreciation of $85 and $91 in 2015 and 2014, respectively | 475 | 388 | ||
Construction work in progress | 403 | 113 | ||
NET PLANT | 30,923 | 29,827 | ||
OTHER NONCURRENT ASSETS | ||||
Goodwill | 429 | 429 | ||
Intangible assets, less accumulated amortization of $4 in 2015 and 2014 | 3 | 3 | ||
Regulatory assets | 8,646 | 9,156 | ||
Other deferred charges and noncurrent assets | 223 | 223 | ||
TOTAL OTHER NONCURRENT ASSETS | 9,301 | 9,811 | ||
TOTAL ASSETS | $44,751 | $44,308 | ||
The accompanying notes are an integral part of these financial statements.
9
Consolidated Edison, Inc.
CONSOLIDATED BALANCE SHEET (UNAUDITED)
June 30, 2015 | December 31, 2014 | ||
(Millions of Dollars) | |||
LIABILITIES AND SHAREHOLDERS’ EQUITY | |||
CURRENT LIABILITIES | |||
Long-term debt due within one year | $460 | $560 | |
Notes payable | 1,245 | 800 | |
Accounts payable | 845 | 1,019 | |
Customer deposits | 348 | 344 | |
Accrued taxes | 52 | 72 | |
Accrued interest | 131 | 132 | |
Accrued wages | 100 | 95 | |
Fair value of derivative liabilities | 32 | 64 | |
Regulatory liabilities | 142 | 187 | |
Liabilities held for sale | 91 | — | |
Other current liabilities | 489 | 508 | |
TOTAL CURRENT LIABILITIES | 3,935 | 3,781 | |
NONCURRENT LIABILITIES | |||
Provision for injuries and damages | 186 | 182 | |
Pensions and retiree benefits | 3,420 | 3,914 | |
Superfund and other environmental costs | 751 | 764 | |
Asset retirement obligations | 193 | 188 | |
Fair value of derivative liabilities | 24 | 13 | |
Deferred income taxes and investment tax credits | 9,408 | 9,076 | |
Regulatory liabilities | 1,947 | 1,993 | |
Other deferred credits and noncurrent liabilities | 165 | 181 | |
TOTAL NONCURRENT LIABILITIES | 16,094 | 16,311 | |
LONG-TERM DEBT | 11,925 | 11,631 | |
EQUITY | |||
Common shareholders’ equity | 12,788 | 12,576 | |
Noncontrolling interest | 9 | 9 | |
TOTAL EQUITY (See Statement of Equity) | 12,797 | 12,585 | |
TOTAL LIABILITIES AND EQUITY | $44,751 | $44,308 | |
The accompanying notes are an integral part of these financial statements.
10
Consolidated Edison, Inc.
CONSOLIDATED STATEMENT OF EQUITY (UNAUDITED)
(Millions of Dollars/Except Share Data) | Common Stock | Additional Paid-In Capital | Retained Earnings | Treasury Stock | Capital Stock Expense | Accumulated Other Comprehensive Income/(Loss) | Noncontrolling Interest | Total | ||||||||||||||
Shares | Amount | Shares | Amount | |||||||||||||||||||
BALANCE AS OF DECEMBER 31, 2013 | 292,872,396 | $32 | $4,995 | $8,338 | 23,210,200 | $(1,034) | $(61) | $(25) | $— | $12,245 | ||||||||||||
Net income for common stock | 361 | 361 | ||||||||||||||||||||
Common stock dividends | (184) | (184) | ||||||||||||||||||||
Issuance of common shares for stock plans, net of repurchases | 51,656 | (2) | (51,656 | ) | 2 | — | ||||||||||||||||
Other comprehensive income | 4 | 4 | ||||||||||||||||||||
Noncontrolling interest | — | — | ||||||||||||||||||||
BALANCE AS OF MARCH 31, 2014 | 292,924,052 | $32 | $4,993 | $8,515 | 23,158,544 | $(1,032) | $(61) | $(21) | $— | $12,426 | ||||||||||||
Net income for common stock | 212 | 212 | ||||||||||||||||||||
Common stock dividends | (184) | (184) | ||||||||||||||||||||
Issuance of common shares for stock plans, net of repurchases | (45,658 | ) | — | 45,658 | — | — | ||||||||||||||||
Other comprehensive income | 1 | 1 | ||||||||||||||||||||
Noncontrolling interest | — | — | ||||||||||||||||||||
BALANCE AS OF JUNE 30, 2014 | 292,878,394 | $32 | $4,993 | $8,543 | 23,204,202 | $(1,032) | $(61) | $(20) | $— | $12,455 | ||||||||||||
BALANCE AS OF DECEMBER 31, 2014 | 292,876,196 | $32 | $4,991 | $8,691 | 23,206,400 | $(1,032) | $(61) | $(45) | $9 | $12,585 | ||||||||||||
Net income for common stock | 370 | 370 | ||||||||||||||||||||
Common stock dividends | (190) | (190) | ||||||||||||||||||||
Issuance of common shares for stock plans, net of repurchases | 24,600 | 2 | (24,600 | ) | (2) | — | ||||||||||||||||
Other comprehensive income | 5 | 5 | ||||||||||||||||||||
Noncontrolling interest | — | — | ||||||||||||||||||||
BALANCE AS OF MARCH 31, 2015 | 292,900,796 | $32 | $4,993 | $8,871 | 23,181,800 | $(1,034) | $(61) | $(40) | $9 | $12,770 | ||||||||||||
Net income for common stock | 219 | 219 | ||||||||||||||||||||
Common stock dividends | (190) | (190) | ||||||||||||||||||||
Issuance of common shares for stock plans, net of repurchases | (28,134 | ) | — | 28,134 | (3) | (3) | ||||||||||||||||
Other comprehensive income | 1 | 1 | ||||||||||||||||||||
Noncontrolling interest | — | — | ||||||||||||||||||||
BALANCE AS OF JUNE 30, 2015 | 292,872,662 | $32 | $4,993 | $8,900 | 23,209,934 | $(1,037) | $(61) | $(39) | $9 | $12,797 | ||||||||||||
The accompanying notes are an integral part of these financial statements.
11
Consolidated Edison Company of New York, Inc.
CONSOLIDATED INCOME STATEMENT (UNAUDITED)
For the Three Months Ended June 30, | For the Six Months Ended June 30, | |||||
2015 | 2014 | 2015 | 2014 | |||
(Millions of Dollars) | ||||||
OPERATING REVENUES | ||||||
Electric | $1,879 | $1,978 | $3,858 | $4,053 | ||
Gas | 308 | 360 | 963 | 1,149 | ||
Steam | 96 | 98 | 471 | 439 | ||
TOTAL OPERATING REVENUES | 2,283 | 2,436 | 5,292 | 5,641 | ||
OPERATING EXPENSES | ||||||
Purchased power | 358 | 517 | 897 | 1,135 | ||
Fuel | 31 | 34 | 185 | 189 | ||
Gas purchased for resale | 54 | 104 | 252 | 451 | ||
Other operations and maintenance | 687 | 699 | 1,390 | 1,424 | ||
Depreciation and amortization | 254 | 247 | 511 | 486 | ||
Taxes, other than income taxes | 439 | 449 | 914 | 926 | ||
TOTAL OPERATING EXPENSES | 1,823 | 2,050 | 4,149 | 4,611 | ||
OPERATING INCOME | 460 | 386 | 1,143 | 1,030 | ||
OTHER INCOME (DEDUCTIONS) | ||||||
Investment and other income | 2 | 1 | 3 | 8 | ||
Allowance for equity funds used during construction | 1 | 1 | 2 | 1 | ||
Other deductions | (5) | (5) | (6) | (7) | ||
TOTAL OTHER INCOME (DEDUCTIONS) | (2) | (3) | (1) | 2 | ||
INCOME BEFORE INTEREST AND INCOME TAX EXPENSE | 458 | 383 | 1,142 | 1,032 | ||
INTEREST EXPENSE | ||||||
Interest on long-term debt | 141 | 130 | 282 | 258 | ||
Other interest | 5 | 3 | 9 | 7 | ||
Allowance for borrowed funds used during construction | — | — | (1) | (1) | ||
NET INTEREST EXPENSE | 146 | 133 | 290 | 264 | ||
INCOME BEFORE INCOME TAX EXPENSE | 312 | 250 | 852 | 768 | ||
INCOME TAX EXPENSE | 101 | 78 | 293 | 262 | ||
NET INCOME FOR COMMON STOCK | $211 | $172 | $559 | $506 | ||
The accompanying notes are an integral part of these financial statements.
12
Consolidated Edison Company of New York, Inc.
CONSOLIDATED STATEMENT OF COMPREHENSIVE INCOME (UNAUDITED)
For The Three Months Ended June 30, | For the Six Months Ended June 30, | ||||
2015 | 2014 | 2015 | 2014 | ||
(Millions of Dollars) | |||||
NET INCOME | $211 | $172 | $559 | $506 | |
OTHER COMPREHENSIVE INCOME, NET OF TAXES | |||||
Pension and other postretirement benefit plan liability adjustments, net of taxes | 1 | — | 1 | 1 | |
TOTAL OTHER COMPREHENSIVE INCOME, NET OF TAXES | 1 | — | 1 | 1 | |
COMPREHENSIVE INCOME | $212 | $172 | $560 | $507 | |
The accompanying notes are an integral part of these financial statements.
13
Consolidated Edison Company of New York, Inc.
CONSOLIDATED STATEMENT OF CASH FLOWS (UNAUDITED)
For the Six Months Ended June 30, | ||||
2015 | 2014 | |||
(Millions of Dollars) | ||||
OPERATING ACTIVITIES | ||||
Net income | $559 | $506 | ||
PRINCIPAL NON-CASH CHARGES/(CREDITS) TO INCOME | ||||
Depreciation and amortization | 511 | 486 | ||
Deferred income taxes | 135 | 135 | ||
Rate case amortization and accruals | (32) | 55 | ||
Common equity component of allowance for funds used during construction | (2) | (2) | ||
Other non-cash items (net) | (10) | (17) | ||
CHANGES IN ASSETS AND LIABILITIES | ||||
Accounts receivable – customers, less allowance for uncollectibles | 53 | 44 | ||
Materials and supplies, including fuel oil and gas in storage | 42 | 37 | ||
Other receivables and other current assets | 11 | (93) | ||
Accounts receivable from affiliated companies | (4) | — | ||
Prepayments | 18 | 13 | ||
Accounts payable | (101) | (71) | ||
Pensions and retiree benefits obligations (net) | 360 | 382 | ||
Pensions and retiree benefits contributions | (406) | (405) | ||
Superfund and environmental remediation costs (net) | 14 | 17 | ||
Accrued taxes | (1) | (240) | ||
Accrued taxes to affiliated companies | (10) | — | ||
Accrued interest | (1) | 12 | ||
Deferred charges, noncurrent assets and other regulatory assets | (22) | (86) | ||
Deferred credits and other regulatory liabilities | 119 | 142 | ||
Other current and noncurrent liabilities | (31) | (33) | ||
NET CASH FLOWS FROM OPERATING ACTIVITIES | 1,202 | 882 | ||
INVESTING ACTIVITIES | ||||
Utility construction expenditures | (1,108) | (1,007) | ||
Cost of removal less salvage | (101) | (97) | ||
NET CASH FLOWS USED IN INVESTING ACTIVITIES | (1,209) | (1,104) | ||
FINANCING ACTIVITIES | ||||
Net issuance of short-term debt | 545 | 272 | ||
Issuance of long-term debt | — | 850 | ||
Retirement of long-term debt | — | (475) | ||
Debt issuance costs | (1) | (6) | ||
Dividend to parent | (516) | (356) | ||
NET CASH FLOWS FROM FINANCING ACTIVITIES | 28 | 285 | ||
CASH AND TEMPORARY CASH INVESTMENTS: | ||||
NET CHANGE FOR THE PERIOD | 21 | 63 | ||
BALANCE AT BEGINNING OF PERIOD | 645 | 633 | ||
BALANCE AT END OF PERIOD | $666 | $696 | ||
Supplemental disclosure of cash flow information | ||||
SUPPLEMENTAL DISCLOSURE OF CASH INFORMATION | ||||
Cash paid during the period for: | ||||
Interest | $277 | $248 | ||
Income taxes | $160 | $392 | ||
SUPPLEMENTAL DISCLOSURE OF NON-CASH INFORMATION | ||||
Construction expenditures in accounts payable | $151 | $119 | ||
The accompanying notes are an integral part of these financial statements.
14
Consolidated Edison Company of New York, Inc.
CONSOLIDATED BALANCE SHEET (UNAUDITED)
June 30, 2015 | December 31, 2014 | |
(Millions of Dollars) | ||
ASSETS | ||
CURRENT ASSETS | ||
Cash and temporary cash investments | $666 | $645 |
Special deposits | 2 | 2 |
Accounts receivable – customers, less allowance for uncollectible accounts of $86 and $90 in 2015 and 2014, respectively | 1,011 | 1,064 |
Other receivables, less allowance for uncollectible accounts of $8 in 2015 and 2014 | 56 | 71 |
Accrued unbilled revenue | 329 | 384 |
Accounts receivable from affiliated companies | 136 | 132 |
Fuel oil, gas in storage, materials and supplies, at average cost | 270 | 312 |
Prepayments | 108 | 126 |
Regulatory assets | 60 | 132 |
Deferred tax assets | 144 | 94 |
Other current assets | 157 | 158 |
TOTAL CURRENT ASSETS | 2,939 | 3,120 |
INVESTMENTS | 296 | 271 |
UTILITY PLANT AT ORIGINAL COST | ||
Electric | 24,219 | 23,599 |
Gas | 5,679 | 5,469 |
Steam | 2,288 | 2,251 |
General | 2,310 | 2,265 |
TOTAL | 34,496 | 33,584 |
Less: Accumulated depreciation | 7,161 | 6,970 |
Net | 27,335 | 26,614 |
Construction work in progress | 935 | 971 |
NET UTILITY PLANT | 28,270 | 27,585 |
NON-UTILITY PROPERTY | ||
Non-utility property, less accumulated depreciation of $25 in 2015 and 2014 | 5 | 5 |
NET PLANT | 28,275 | 27,590 |
OTHER NONCURRENT ASSETS | ||
Regulatory assets | 8,011 | 8,481 |
Other deferred charges and noncurrent assets | 180 | 175 |
TOTAL OTHER NONCURRENT ASSETS | 8,191 | 8,656 |
TOTAL ASSETS | $39,701 | $39,637 |
The accompanying notes are an integral part of these financial statements.
15
Consolidated Edison Company of New York, Inc.
CONSOLIDATED BALANCE SHEET (UNAUDITED)
June 30, 2015 | December 31, 2014 | ||
(Millions of Dollars) | |||
LIABILITIES AND SHAREHOLDER’S EQUITY | |||
CURRENT LIABILITIES | |||
Long-term debt due within one year | $350 | $350 | |
Notes payable | 995 | 450 | |
Accounts payable | 657 | 802 | |
Accounts payable to affiliated companies | 28 | 23 | |
Customer deposits | 333 | 330 | |
Accrued taxes | 45 | 46 | |
Accrued taxes to affiliated companies | — | 10 | |
Accrued interest | 116 | 117 | |
Accrued wages | 93 | 84 | |
Fair value of derivative liabilities | 23 | 48 | |
Regulatory liabilities | 107 | 142 | |
Other current liabilities | 381 | 415 | |
TOTAL CURRENT LIABILITIES | 3,128 | 2,817 | |
NONCURRENT LIABILITIES | |||
Provision for injuries and damages | 180 | 176 | |
Pensions and retiree benefits | 3,011 | 3,493 | |
Superfund and other environmental costs | 656 | 666 | |
Asset retirement obligations | 189 | 185 | |
Fair value of derivative liabilities | 19 | 10 | |
Deferred income taxes and investment tax credits | 8,516 | 8,257 | |
Regulatory liabilities | 1,772 | 1,837 | |
Other deferred credits and noncurrent liabilities | 133 | 144 | |
TOTAL NONCURRENT LIABILITIES | 14,476 | 14,768 | |
LONG-TERM DEBT | 10,865 | 10,864 | |
COMMON SHAREHOLDER’S EQUITY (See Statement of Shareholder’s Equity) | 11,232 | 11,188 | |
TOTAL LIABILITIES AND SHAREHOLDER’S EQUITY | $39,701 | $39,637 | |
The accompanying notes are an integral part of these financial statements.
16
Consolidated Edison Company of New York, Inc.
CONSOLIDATED STATEMENT OF SHAREHOLDER’S EQUITY (UNAUDITED)
Common Stock | Additional Paid-In Capital | Retained Earnings | Repurchased Con Edison Stock | Capital Stock Expense | Accumulated Other Comprehensive Income/(Loss) | Total | |||||
(Millions of Dollars/Except Share Data) | Shares | Amount | |||||||||
BALANCE AS OF DECEMBER 31, 2013 | 235,488,094 | $589 | $4,234 | $7,053 | $(962) | $(61) | $(6) | $10,847 | |||
Net income | 334 | 334 | |||||||||
Common stock dividend to parent | (178) | (178) | |||||||||
Other comprehensive income | 1 | 1 | |||||||||
BALANCE AS OF MARCH 31, 2014 | 235,488,094 | $589 | $4,234 | $7,209 | $(962) | $(61) | $(5) | $11,004 | |||
Net income | 172 | 172 | |||||||||
Common stock dividend to parent | (178) | (178) | |||||||||
Other comprehensive income | — | — | |||||||||
BALANCE AS OF JUNE 30, 2014 | 235,488,094 | $589 | $4,234 | $7,203 | $(962) | $(61) | $(5) | $10,998 | |||
BALANCE AS OF DECEMBER 31, 2014 | 235,488,094 | $589 | $4,234 | $7,399 | $(962) | $(61) | $(11) | $11,188 | |||
Net income | 348 | 348 | |||||||||
Common stock dividend to parent | (338) | (338) | |||||||||
Other comprehensive income | — | — | |||||||||
BALANCE AS OF MARCH 31, 2015 | 235,488,094 | $589 | $4,234 | $7,409 | $(962) | $(61) | $(11) | $11,198 | |||
Net income | 211 | 211 | |||||||||
Common stock dividend to parent | (178) | (178) | |||||||||
Other comprehensive income | 1 | 1 | |||||||||
BALANCE AS OF JUNE 30, 2015 | 235,488,094 | $589 | $4,234 | $7,442 | $(962) | $(61) | $(10) | $11,232 | |||
The accompanying notes are an integral part of these financial statements.
17
NOTES TO THE FINANCIAL STATEMENTS (UNAUDITED)
General
These combined notes accompany and form an integral part of the separate consolidated financial statements of each of the two separate registrants: Consolidated Edison, Inc. and its subsidiaries (Con Edison) and Consolidated Edison Company of New York, Inc. and its subsidiaries (CECONY). CECONY is a subsidiary of Con Edison and as such its financial condition and results of operations and cash flows, which are presented separately in the CECONY consolidated financial statements, are also consolidated, along with those of Con Edison’s other utility subsidiary, Orange and Rockland Utilities, Inc. (O&R) and Con Edison’s competitive energy businesses (discussed below) in Con Edison’s consolidated financial statements. The term “Utilities” is used in these notes to refer to CECONY and O&R.
As used in these notes, the term “Companies” refers to Con Edison and CECONY and, except as otherwise noted, the information in these combined notes relates to each of the Companies. However, CECONY makes no representation as to information relating to Con Edison or the subsidiaries of Con Edison other than itself.
The separate interim consolidated financial statements of each of the Companies are unaudited but, in the opinion of their respective managements, reflect all adjustments (which include only normally recurring adjustments) necessary for a fair presentation of the results for the interim periods presented. The Companies’ separate interim consolidated financial statements should be read together with their separate audited financial statements (including the combined notes thereto) included in Item 8 of their combined Annual Report on Form 10-K for the year ended December 31, 2014 and their separate unaudited financial statements (including the combined notes thereto) included in Part I, Item 1 of their combined Quarterly Report on Form 10-Q for the quarterly period ended March 31, 2015. Certain prior period amounts have been reclassified to conform to the current period presentation.
Con Edison has two regulated utility subsidiaries: CECONY and O&R. CECONY provides electric service and gas service in New York City and Westchester County. The company also provides steam service in parts of Manhattan. O&R, along with its regulated utility subsidiaries, provides electric service in southeastern New York and adjacent areas of northern New Jersey and eastern Pennsylvania and gas service in southeastern New York and adjacent areas of eastern Pennsylvania. Con Edison has the following competitive energy businesses: Consolidated Edison Solutions, Inc. (Con Edison Solutions), a company which sells to retail customers electricity purchased in wholesale markets (see Note O), enters into related hedging transactions and also provides energy-related products and services to retail customers; Consolidated Edison Energy, Inc. (Con Edison Energy), a company that provides energy-related products and services to wholesale customers; and Consolidated Edison Development, Inc. (Con Edison Development), a company that develops, owns and operates renewable and energy infrastructure projects. In addition, in 2014 Con Edison formed Consolidated Edison Transmission, LLC (Con Edison Transmission) to invest in a transmission company. See information about Con Edison Transmission under “Guarantees” in Note H.
Note A – Summary of Significant Accounting Policies
Earnings Per Common Share
For the three and six months ended June 30, 2015 and 2014, basic and diluted earnings per share (EPS) for Con Edison are calculated as follows:
For the Three Months Ended June 30, | For the Six Months Ended June 30, | |||
(Millions of Dollars, except per share amounts/Shares in Millions) | 2015 | 2014 | 2015 | 2014 |
Net income for common stock | $219 | $212 | $589 | $574 |
Weighted average common shares outstanding – basic | 292.9 | 292.9 | 292.9 | 292.9 |
Add: Incremental shares attributable to effect of potentially dilutive securities | 1.1 | 1.1 | 1.0 | 1.1 |
Adjusted weighted average common shares outstanding – diluted | 294.0 | 294.0 | 293.9 | 294.0 |
Net Income for common stock per common share – basic | $0.75 | $0.73 | $2.01 | $1.96 |
Net Income for common stock per common share – diluted | $0.74 | $0.72 | $2.01 | $1.95 |
The computation of diluted EPS for the three and six months ended June 30, 2015 and 2014 excludes immaterial amounts of performance share awards that were not included because of their anti-dilutive effect.
18
Changes in Accumulated Other Comprehensive Income/(Loss) by Component
For the three and six months ended June 30, 2015 and 2014, changes to accumulated other comprehensive income/(loss) (OCI) for Con Edison and CECONY are as follows:
For the Three Months Ended June 30, | |||||
Con Edison | CECONY | ||||
(Millions of Dollars) | 2015 | 2014 | 2015 | 2014 | |
Beginning balance, accumulated OCI, net of taxes (a) | $(40) | $(21) | $(11) | $(5) | |
Amounts reclassified from accumulated OCI related to pension plan liabilities net of tax of $(1) for Con Edison in 2015 and 2014 (a)(b) | 1 | 1 | 1 | — | |
Current period OCI, net of taxes | 1 | 1 | 1 | — | |
Ending balance, accumulated OCI, net of taxes | $(39) | $(20) | $(10) | $(5) | |
For the Six Months Ended June 30, | ||||||
Con Edison | CECONY | |||||
(Millions of Dollars) | 2015 | 2014 | 2015 | 2014 | ||
Beginning balance, accumulated OCI, net of taxes (a) | $(45) | $(25) | $(11) | $(6) | ||
OCI before reclassifications, net of tax of $(2) and $(1) for Con Edison in 2015 and 2014, respectively | 3 | 2 | — | — | ||
Amounts reclassified from accumulated OCI related to pension plan liabilities, net of tax of $(2) for Con Edison in 2015 and 2014 (a)(b) | 3 | 3 | 1 | 1 | ||
Current period OCI, net of taxes | 6 | 5 | 1 | 1 | ||
Ending balance, accumulated OCI, net of taxes | $(39) | $(20) | $(10) | $(5) | ||
(a) | Tax reclassified from accumulated OCI is reported in the income tax expense line item of the income statement. |
(b) | For the portion of unrecognized pension and other postretirement benefit costs relating to the regulated Utilities, costs are recorded into, and amortized out of, regulatory assets instead of OCI. The net actuarial losses and prior service costs recognized during the period are included in the computation of total periodic pension and other postretirement benefit cost. See Notes E and F. |
Reclassifications and Revisions
Prior period amounts have been reclassified where necessary to conform to the current period presentation.
19
Note B — Regulatory Matters
Rate Plans
CECONY — Electric
In June 2015, the New York State Public Service Commission (NYSPSC) approved an April 2015 Joint Proposal entered into by CECONY, the staff of the NYSPSC and other parties. Under the Joint Proposal, the rate plan for 2016 does not include a rate increase or decrease. The rate plan for 2016 includes additional revenues from the amortization to income of net regulatory liabilities. The following table contains a summary of the rate plan for 2016:
Effective period | January 2016 – December 2016 |
Base rate changes | None (a) |
Amortizations to income of net regulatory (assets) and liabilities | Additional $123 million of net regulatory liabilities (b). |
Other revenue sources | Continued retention of $90 million of annual transmission congestion revenues. |
Revenue decoupling mechanism | Continued reconciliation of actual electric delivery revenues to those authorized in the rate plan. |
Recoverable energy costs | Continued current rate recovery of purchased power and fuel costs (c). |
Negative revenue adjustments | Continued potential penalties (up to $400 million annually) if certain performance targets are not met. |
Cost reconciliations | Continued reconciliation of expenses for pension and other postretirement benefits, variable-rate tax-exempt debt, major storms, property taxes (d), municipal infrastructure support, the impact of new laws and environmental remediation to amounts reflected in rates. |
Net utility plant reconciliations | Target levels reflected in rates are as follows: Transmission and distribution: $17,929 million Storm hardening: $268 million Other: $2,069 million |
Average rate base | $18,282 million |
Weighted average cost of capital (after-tax) | 6.91 percent |
Authorized return on common equity | 9.0 percent |
Earnings sharing | Most earnings above an annual earnings threshold of 9.6 percent are to be applied to reduce regulatory assets for environmental remediation and other costs. |
Cost of long-term debt | 5.09 percent |
Common equity ratio | 48 percent |
(a) | The impact of 2014 and 2015 base rate changes under the current electric rate plan will continue to be deferred. $249 million of annual revenues collected from electric customers will continue to be subject to potential refund following NYSPSC staff review of certain costs. Revenues will continue to include $21 million as funding for major storm reserve. |
(b) | Annual amortization of $107 million of the regulatory asset for deferred Superstorm Sandy and other major storm costs will continue. The costs recoverable from customers will be reduced by $4 million. The costs will no longer be subject to NYSPSC staff review and the recovery of the costs will no longer be subject to refund. |
(c) | For transmission service provided pursuant to the open access transmission tariff of PJM Interconnection LLC (PJM), unless and until changed by the NYSPSC, the company will recover all charges incurred associated with the transmission service. In January 2014, PJM submitted to the Federal Energy Regulatory Commission (FERC) a request that would substantially increase the charges for the transmission service. FERC has granted the request and rejected CECONY’s protests. CECONY is challenging the FERC’s decision. |
(d) | Deferrals for property taxes will continue to be limited to 90 percent of the difference from amounts reflected in rates, subject to an annual maximum for the remaining difference of not more than a 10 basis point impact on return on common equity. |
O&R New York – Electric and Gas
In June 2015, O&R entered into a Joint Proposal with the NYSPSC staff and other parties for new electric and gas rate plans. Under the Joint Proposal, which is subject to NYSPSC review and approval, the new rate plans would be effective November 2015. The following tables contain a summary of the new rate plans:
20
O&R New York - Electric
Effective period | November 2015 - October 2017 |
Base rate changes | Yr. 1 - $9.3 million Yr. 2 - $8.8 million |
Amortizations to income of net regulatory (assets) and liabilities (a) | Yr. 1 - $(8.5) million Yr. 2 - $(9.4) million |
Revenue decoupling mechanism | Continued reconciliation of actual electric delivery revenues to those authorized in the rate plan. |
Recoverable energy costs | Continued current rate recovery of purchased power costs. |
Negative revenue adjustments | Potential penalties (up to $4 million annually) if certain performance targets are not met. |
Cost reconciliations | Continued reconciliation of expenses for pension and other postretirement benefits, property taxes, the impact of new laws and environmental remediation to amounts reflected in rates. |
Net utility plant reconciliations (b) | Target levels reflected in rates are: Yr. 1 - $928 million Yr. 2 - $970 million |
Average rate base | Yr. 1 - $763 million Yr. 2 - $805 million |
Weighted average cost of capital (after-tax) | Yr. 1 - 7.10 percent Yr. 2 - 7.06 percent |
Authorized return on common equity | 9.0 percent |
Earnings sharing | Most earnings above an annual earnings threshold of 9.6 percent are to be applied to reduce regulatory assets. |
Cost of long-term debt | Yr. 1 - 5.42 percent Yr. 2 - 5.35 percent |
Common equity ratio | 48 percent |
(a) | The Joint Proposal provides that the company should be allowed to recover from customers $59.3 million of its regulatory asset for deferred storm costs over a five-year period, including $11.85 million in each of years 1 and 2, $1 million of the regulatory asset for such costs will not be recovered from customers, and all outstanding issues related to Superstorm Sandy and other past major storms prior to November 2014 are resolved. The Joint Proposal also provides that a total of approximately $4 million of regulatory assets for property tax and interest rate reconciliations will not be recovered from customers. Amounts that will not be recovered from customers were charged-off in June 2015. |
(b) | Excludes electric advanced metering infrastructure as to which the company will be required to defer as a regulatory liability the revenue requirement impact of the amount, if any, by which actual average net utility plant balances are less than amounts reflected in rates: $1 million in year 1 and $9 million in year 2. |
21
O&R New York - Gas
Effective period | November 2015 - October 2018 |
Base rate changes (a) | Yr. 1 - $27.5 million Yr. 2 - $4.4 million Yr. 3 - $6.7 million |
Amortizations to income of net regulatory (assets) and liabilities (b) | Yr. 1 - $(1.7) million Yr. 2 - $(2.1) million Yr. 3 - $(2.5) million |
Revenue decoupling mechanism | Continued reconciliation of actual gas delivery revenues to those authorized in the rate plan, including through weather normalization clause. |
Recoverable energy costs | Continued current rate recovery of purchased gas costs. |
Negative revenue adjustments | Potential penalties (up to $3.7 million in Yr. 1, $4.7 million in Yr. 2 and $5.8 million in Yr. 3) if certain performance targets are not met. |
Cost reconciliations | Continued reconciliation of expenses for pension and other postretirement benefits, property taxes, the impact of new laws and environmental remediation to amounts reflected in rates. |
Net utility plant reconciliations (c) | Target levels reflected in rates are: Yr. 1 - $492 million Yr. 2 - $518 million Yr. 3 - $546 million |
Average rate base | Yr. 1 - $366 million Yr. 2 - $391 million Yr. 3 - $417 million |
Weighted average cost of capital (after-tax) | Yr. 1 - 7.10 percent Yr. 2 - 7.06 percent Yr. 3 - 7.06 percent |
Authorized return on common equity | 9.0 percent |
Earnings sharing | Most earnings above an annual earnings threshold of 9.6 percent are to be applied to reduce regulatory assets. |
Cost of long-term debt | Yr. 1 - 5.42 percent Yr. 2 - 5.35 percent Yr. 3 - 5.35 percent |
Common equity ratio | 48 percent |
(a) | The base rate changes may be implemented, at the NYSPSC’s option, with increases of $16.4 million in each of years 1 and 2 and an increase of $5.8 million, together with a surcharge of $10.6 million, in year 3. |
(b) | Reflects that the company will not recover from customers a total of approximately $14 million of regulatory assets for property tax and interest rate reconciliations. Amounts that will not be recovered from customers were charged-off in June 2015. |
(c) | Excludes gas advanced metering infrastructure as to which the company will be required to defer as a regulatory liability the revenue requirement impact of the amount, if any, by which actual average net utility plant balances are less than amounts reflected in rates: $0.5 million in year 1, $4.2 million in year 2 and $7.2 million in year 3. |
Other Regulatory Matters
In February 2009, the NYSPSC commenced a proceeding to examine the prudence of certain CECONY expenditures following the arrests of employees for accepting illegal payments from a construction contractor. Subsequently, additional employees were arrested for accepting illegal payments from materials suppliers and an engineering firm. The arrested employees were terminated by the company and have pled guilty or been convicted. Pursuant to NYSPSC orders, a portion of the company’s revenues (currently, $249 million, $32 million and $6 million on an annual basis for electric, gas and steam service, respectively) is being collected subject to potential refund to customers. The amount of electric revenues collected subject to refund, which was established in a different proceeding, and the amount of gas and steam revenues collected subject to refund were not established as indicative of the company’s potential liability in this proceeding. At June 30, 2015, the company had collected an estimated $1,818 million from customers subject to potential refund in connection with this proceeding. In January 2013, a NYSPSC consultant reported its estimate, with which the company does not agree, of $208 million of overcharges with respect to a substantial portion of the company’s construction expenditures from January 2000 to January 2009. The company is disputing the consultant’s estimate, including its determinations as to overcharges regarding specific construction expenditures it selected to review and its methodology of extrapolating such determinations over a substantial portion of the construction expenditures during this period. The NYSPSC’s consultant has not reviewed the company’s other expenditures. The company and NYSPSC staff are exploring a settlement in this proceeding. In May 2014, the NYSPSC’s Chief Administrative Law Judge appointed a settlement judge to assist the parties. There is no assurance that there will be a settlement, and any settlement would be subject to NYSPSC approval. At June 30, 2015, the company had a $103 million regulatory liability relating to this matter. The company currently estimates that any additional amount the NYSPSC requires the company to refund to customers in excess of the regulatory liability accrued could range up to an amount based on the NYSPSC consultant’s $208 million estimate of overcharges.
22
In late October 2012, Superstorm Sandy caused extensive damage to the Utilities’ electric distribution system and interrupted service to approximately 1.4 million customers. Superstorm Sandy also damaged CECONY’s steam system and interrupted service to many of its steam customers. As of June 30, 2015, CECONY and O&R incurred response and restoration costs for Superstorm Sandy of $507 million and $91 million, respectively (including capital expenditures of $147 million and $15 million, respectively). Most of the costs that were not capitalized were deferred for recovery as a regulatory asset under the Utilities’ electric rate plans. Collection from customers of these costs is provided for under CECONY's current electric rate plan, the June 2015 Joint Proposal with respect to O&R's electric rates (which is subject to NYSPSC approval) and RECO’s current electric rate plan. See “Rate Plans,” above.
In June 2014, the NYSPSC initiated a proceeding to investigate the practices of qualifying persons to perform plastic fusions on gas facilities. New York State regulations require gas utilities to qualify and, except in certain circumstances, annually requalify workers that perform fusion to join plastic pipe. The NYSPSC directed the New York gas utilities to provide information in this proceeding about their compliance with the qualification and requalification requirements and related matters; their procedures for compliance with all gas safety regulations; and their annual chief executive officer certifications regarding these and other procedures. CECONY’s qualification and requalification procedures had not included certain required testing to evaluate specimen fuses. In addition, CECONY and O&R had not timely requalified certain workers that had been qualified under their respective procedures to perform fusion to join plastic pipe. CECONY and O&R have requalified their workers who perform plastic pipe fusions. In May 2015, the NYSPSC, which indicated that it would address enforcement at a later date, ordered CECONY, O&R and other gas utilities to perform risk assessment and remediation plans, additional leakage surveying and reporting; CECONY to hire an independent statistician to develop a risk assessment and remediation plan; and the gas utilities to implement certain new plastic fusion requirements.
23
Regulatory Assets and Liabilities
Regulatory assets and liabilities at June 30, 2015 and December 31, 2014 were comprised of the following items:
Con Edison | CECONY | ||||||||
(Millions of Dollars) | 2015 | 2014 | 2015 | 2014 | |||||
Regulatory assets | |||||||||
Unrecognized pension and other postretirement costs | $4,400 | $4,846 | $4,191 | $4,609 | |||||
Future income tax | 2,326 | 2,273 | 2,216 | 2,166 | |||||
Environmental remediation costs | 897 | 925 | 796 | 820 | |||||
Deferred storm costs | 254 | 319 | 167 | 224 | |||||
Revenue taxes | 227 | 219 | 215 | 208 | |||||
Pension and other postretirement benefits deferrals | 54 | 66 | 27 | 42 | |||||
Net electric deferrals | 54 | 63 | 53 | 63 | |||||
Unamortized loss on reacquired debt | 54 | 57 | 51 | 55 | |||||
Deferred derivative losses | 46 | 25 | 41 | 23 | |||||
Surcharge for New York State assessment | 40 | 99 | 38 | 92 | |||||
O&R property tax reconciliation | 40 | 36 | — | — | |||||
Preferred stock redemption | 27 | 27 | 27 | 27 | |||||
O&R transition bond charges | 24 | 27 | — | — | |||||
Workers’ compensation | 10 | 8 | 10 | 8 | |||||
Recoverable energy costs | — | 19 | — | 17 | |||||
Other | 193 | 147 | 179 | 127 | |||||
Regulatory assets – noncurrent | 8,646 | 9,156 | 8,011 | 8,481 | |||||
Deferred derivative losses | 65 | 97 | 60 | 92 | |||||
Future income tax | 8 | 10 | — | — | |||||
Recoverable energy costs | 2 | 41 | — | 40 | |||||
Regulatory assets – current | 75 | 148 | 60 | 132 | |||||
Total Regulatory Assets | $8,721 | $9,304 | $8,071 | $8,613 | |||||
Regulatory liabilities | |||||||||
Allowance for cost of removal less salvage | $620 | $598 | $518 | $499 | |||||
Property tax reconciliation | 300 | 295 | 300 | 295 | |||||
Base rate change deferrals | 146 | 155 | 146 | 155 | |||||
Net unbilled revenue deferrals | 116 | 138 | 116 | 138 | |||||
Prudence proceeding | 103 | 105 | 103 | 105 | |||||
Pension and other postretirement benefit deferrals | 83 | 46 | 59 | 37 | |||||
Variable-rate tax-exempt debt – cost rate reconciliation | 80 | 78 | 69 | 78 | |||||
Property tax refunds | 65 | 87 | 65 | 87 | |||||
New York State income tax rate change | 64 | 62 | 61 | 59 | |||||
Carrying charges on repair allowance and bonus depreciation | 52 | 58 | 50 | 57 | |||||
World Trade Center settlement proceeds | 31 | 41 | 31 | 41 | |||||
Net utility plant reconciliations | 22 | 21 | 23 | 20 | |||||
Earnings sharing – electric | 21 | 19 | 21 | 18 | |||||
Unrecognized other postretirement costs | 17 | — | 17 | — | |||||
Other | 227 | 290 | 193 | 248 | |||||
Regulatory liabilities – noncurrent | 1,947 | 1,993 | 1,772 | 1,837 | |||||
Refundable energy costs | 72 | 128 | 39 | 84 | |||||
Revenue decoupling mechanism | 42 | 30 | 41 | 30 | |||||
Future income tax | 22 | 24 | 21 | 24 | |||||
Deferred derivative gains | 6 | 5 | 6 | 4 | |||||
Regulatory liabilities – current | 142 | 187 | 107 | 142 | |||||
Total Regulatory Liabilities | $2,089 | $2,180 | $1,879 | $1,979 | |||||
24
Note C — Capitalization
In June 2015, O&R issued $120 million aggregate principal amount of 4.95 percent debentures, due 2045. Also in June 2015, a Con Edison Development subsidiary issued $118 million aggregate principal amount of 3.94 percent Senior Notes, due 2036. The Notes are secured by four of the company's solar projects.
The carrying amounts and fair values of long-term debt at June 30, 2015 and December 31, 2014 are:
(Millions of Dollars) | 2015 | 2014 | ||
Long-Term Debt (including current portion) | Carrying Amount | Fair Value | Carrying Amount | Fair Value |
Con Edison | $12,385 | $13,498 | $12,191 | $13,998 |
CECONY | $11,215 | $12,206 | $11,214 | $12,846 |
Fair values of long-term debt have been estimated primarily using available market information. For Con Edison, $12,862 million and $636 million of the fair value of long-term debt at June 30, 2015 are classified as Level 2 and Level 3, respectively. For CECONY, $11,570 million and $636 million of the fair value of long-term debt at June 30, 2015 are classified as Level 2 and Level 3, respectively (see Note L). The $636 million of long-term debt classified as Level 3 is CECONY’s tax-exempt, auction-rate securities for which the market is highly illiquid and there is a lack of observable inputs.
Note D — Short-Term Borrowing
At June 30, 2015, Con Edison had $1,245 million of commercial paper outstanding of which $995 million was outstanding under CECONY’s program. The weighted average interest rate at June 30, 2015 was 0.4 percent for both Con Edison and CECONY. At December 31, 2014, Con Edison had $800 million of commercial paper outstanding of which $450 million was outstanding under CECONY’s program. The weighted average interest rate at December 31, 2014 was 0.4 percent for both Con Edison and CECONY.
At June 30, 2015 and December 31, 2014, no loans were outstanding under the credit agreement (Credit Agreement) and $56 million (including $11 million for CECONY) and $11 million (including $11 million for CECONY), respectively, of letters of credit were outstanding under the Credit Agreement.
Note E — Pension Benefits
Total Periodic Benefit Cost
The components of the Companies’ total periodic benefit costs for the three and six months ended June 30, 2015 and 2014 were as follows:
For the Three Months Ended June 30, | |||||
Con Edison | CECONY | ||||
(Millions of Dollars) | 2015 | 2014 | 2015 | 2014 | |
Service cost – including administrative expenses | $74 | $57 | $70 | $53 | |
Interest cost on projected benefit obligation | 144 | 143 | 135 | 134 | |
Expected return on plan assets | (222) | (208) | (210) | (198) | |
Recognition of net actuarial loss | 194 | 154 | 183 | 146 | |
Recognition of prior service costs | 1 | 1 | — | 1 | |
NET PERIODIC BENEFIT COST | $191 | $147 | $178 | $136 | |
Amortization of regulatory asset | 1 | 1 | 1 | 1 | |
TOTAL PERIODIC BENEFIT COST | $192 | $148 | $179 | $137 | |
Cost capitalized | (76) | (57) | (72) | (54) | |
Reconciliation to rate level | (17) | 30 | (18) | 28 | |
Cost charged to operating expenses | $99 | $121 | $89 | $111 | |
25
For the Six Months Ended June 30, | ||||
Con Edison | CECONY | |||
(Millions of Dollars) | 2015 | 2014 | 2015 | 2014 |
Service cost – including administrative expenses | $149 | $113 | $139 | $106 |
Interest cost on projected benefit obligation | 287 | 286 | 269 | 268 |
Expected return on plan assets | (443) | (416) | (420) | (395) |
Recognition of net actuarial loss | 388 | 309 | 367 | 293 |
Recognition of prior service costs | 2 | 2 | 1 | 1 |
NET PERIODIC BENEFIT COST | $383 | $294 | $356 | $273 |
Amortization of regulatory asset | 1 | 1 | 1 | 1 |
TOTAL PERIODIC BENEFIT COST | $384 | $295 | $357 | $274 |
Cost capitalized | (144) | (109) | (137) | (103) |
Reconciliation to rate level | (42) | 57 | (42) | 51 |
Cost charged to operating expenses | $198 | $243 | $178 | $222 |
Expected Contributions
Based on estimates as of June 30, 2015, the Companies expect to make contributions to the pension plans during 2015 of $750 million (of which $697 million is to be contributed by CECONY). The Companies’ policy is to fund the total periodic benefit cost of the qualified plan to the extent tax deductible and to also contribute to the non-qualified supplemental plans. During the first six months of 2015, the Companies contributed $407 million to the pension plans, nearly all of which was contributed by CECONY. CECONY also contributed $16 million to its external trust for supplemental plans.
Note F — Other Postretirement Benefits
Total Periodic Benefit Cost
The components of the Companies’ total periodic other postretirement benefit costs for the three and six months ended June 30, 2015 and 2014 were as follows:
For the Three Months Ended June 30, | ||||
Con Edison | CECONY | |||
(Millions of Dollars) | 2015 | 2014 | 2015 | 2014 |
Service cost | $5 | $5 | $4 | $4 |
Interest cost on accumulated other postretirement benefit obligation | 13 | 15 | 11 | 13 |
Expected return on plan assets | (20) | (19) | (17) | (17) |
Recognition of net actuarial loss | 8 | 14 | 7 | 13 |
Recognition of prior service cost | (5) | (5) | (4) | (4) |
TOTAL PERIODIC OTHER POSTRETIREMENT BENEFIT COST | $1 | $10 | $1 | $9 |
Cost capitalized | (1) | (4) | (1) | (4) |
Reconciliation to rate level | 4 | 3 | 2 | 1 |
Cost charged to operating expenses | $4 | $9 | $2 | $6 |
For the Six Months Ended June 30, | ||||
Con Edison | CECONY | |||
(Millions of Dollars) | 2015 | 2014 | 2015 | 2014 |
Service cost | $10 | $10 | $7 | $7 |
Interest cost on accumulated other postretirement benefit obligation | 25 | 30 | 22 | 26 |
Expected return on plan assets | (39) | (38) | (34) | (34) |
Recognition of net actuarial loss | 16 | 28 | 14 | 26 |
Recognition of prior service cost | (10) | (10) | (7) | (7) |
TOTAL PERIODIC OTHER POSTRETIREMENT BENEFIT COST | $2 | $20 | $2 | $18 |
Cost capitalized | (1) | (8) | (1) | (7) |
Reconciliation to rate level | 8 | 6 | 3 | 1 |
Cost charged to operating expenses | $9 | $18 | $4 | $12 |
26
Expected Contributions
Based on estimates as of June 30, 2015, the Companies expect to make a contribution of $6 million, nearly all of which is for CECONY, to the other postretirement benefit plans in 2015. The Companies’ policy is to fund the total periodic benefit cost of the plans to the extent tax deductible.
Note G — Environmental Matters
Superfund Sites
Hazardous substances, such as asbestos, polychlorinated biphenyls (PCBs) and coal tar, have been used or generated in the course of operations of the Utilities and their predecessors and are present at sites and in facilities and equipment they currently or previously owned, including sites at which gas was manufactured or stored.
The Federal Comprehensive Environmental Response, Compensation and Liability Act of 1980 and similar state statutes (Superfund) impose joint and several liability, regardless of fault, upon generators of hazardous substances for investigation and remediation costs (which include costs of demolition, removal, disposal, storage, replacement, containment and monitoring) and natural resource damages. Liability under these laws can be material and may be imposed for contamination from past acts, even though such past acts may have been lawful at the time they occurred. The sites at which the Utilities have been asserted to have liability under these laws, including their manufactured gas plant sites and any neighboring areas to which contamination may have migrated, are referred to herein as “Superfund Sites.”
For Superfund Sites where there are other potentially responsible parties and the Utilities are not managing the site investigation and remediation, the accrued liability represents an estimate of the amount the Utilities will need to pay to investigate and, where determinable, discharge their related obligations. For Superfund Sites (including the manufactured gas plant sites) for which one of the Utilities is managing the investigation and remediation, the accrued liability represents an estimate of the company’s share of the undiscounted cost to investigate the sites and, for sites that have been investigated in whole or in part, the cost to remediate the sites, if remediation is necessary and if a reasonable estimate of such cost can be made. Remediation costs are estimated in light of the information available, applicable remediation standards and experience with similar sites.
The accrued liabilities and regulatory assets related to Superfund Sites at June 30, 2015 and December 31, 2014 were as follows:
Con Edison | CECONY | |||
(Millions of Dollars) | 2015 | 2014 | 2015 | 2014 |
Accrued Liabilities: | ||||
Manufactured gas plant sites | $671 | $684 | $576 | $587 |
Other Superfund Sites | 80 | 80 | 80 | 79 |
Total | $751 | $764 | $656 | $666 |
Regulatory assets | $897 | $925 | $796 | $820 |
Most of the accrued Superfund Site liability relates to sites that have been investigated, in whole or in part. However, for some of the sites, the extent and associated cost of the required remediation has not yet been determined. As investigations progress and information pertaining to the required remediation becomes available, the Utilities expect that additional liability may be accrued, the amount of which is not presently determinable but may be material. The Companies are unable to estimate the time period over which the remaining accrued liability will be incurred because, among other things, the required remediation has not been determined for some of the sites. Under their current rate plans, the Utilities are permitted to recover or defer as regulatory assets (for subsequent recovery through rates) certain site investigation and remediation costs.
Environmental remediation costs incurred and insurance recoveries received related to Superfund Sites for the three and six months ended June 30, 2015 and 2014 were as follows:
For the Three Months Ended June 30, | ||||||||
Con Edison | CECONY | |||||||
(Millions of Dollars) | 2015 | 2014 | 2015 | 2014 | ||||
Remediation costs incurred | $8 | $5 | $7 | $2 | ||||
Insurance recoveries received | — | — | — | — | ||||
27
For the Six Months Ended June 30, | ||||||
Con Edison | CECONY | |||||
(Millions of Dollars) | 2015 | 2014 | 2015 | 2014 | ||
Remediation costs incurred | $15 | $14 | $12 | $10 | ||
Insurance recoveries received (a) | — | 5 | — | 5 | ||
(a) Reduced amount deferred for recovery from customers
In 2014, Con Edison and CECONY estimated that for their manufactured gas plant sites (including CECONY’s Astoria site), the aggregate undiscounted potential liability for the investigation and remediation of coal tar and/or other environmental contaminants could range up to $2.7 billion and $2.5 billion, respectively. These estimates were based on the assumption that there is contamination at all sites, including those that have not yet been fully investigated and additional assumptions about the extent of the contamination and the type and extent of the remediation that may be required. Actual experience may be materially different.
Asbestos Proceedings
Suits have been brought in New York State and federal courts against the Utilities and many other defendants, wherein a large number of plaintiffs sought large amounts of compensatory and punitive damages for deaths and injuries allegedly caused by exposure to asbestos at various premises of the Utilities. The suits that have been resolved, which are many, have been resolved without any payment by the Utilities, or for amounts that were not, in the aggregate, material to them. The amounts specified in all the remaining thousands of suits total billions of dollars; however, the Utilities believe that these amounts are greatly exaggerated, based on the disposition of previous claims. At June 30, 2015 and December 31, 2014, Con Edison and CECONY had accrued their estimated aggregate undiscounted potential liabilities for these suits and additional suits that may be brought over the next 15 years of $8 million and $7 million, respectively. The estimates were based upon a combination of modeling, historical data analysis and risk factor assessment. Trial courts have begun, and unless otherwise determined by an appellate court may continue, to apply a different standard for determining liability in asbestos suits than the standard that applied historically. As a result, the Companies currently believe that there is a reasonable possibility of an exposure to loss in excess of the liability accrued for the suits. The Companies are unable to estimate the amount or range of such loss. In addition, certain current and former employees have claimed or are claiming workers’ compensation benefits based on alleged disability from exposure to asbestos. Under its current rate plans, CECONY is permitted to defer as regulatory assets (for subsequent recovery through rates) costs incurred for its asbestos lawsuits and workers’ compensation claims.
The accrued liability for asbestos suits and workers’ compensation proceedings (including those related to asbestos exposure) and the amounts deferred as regulatory assets for the Companies at June 30, 2015 and December 31, 2014 were as follows:
Con Edison | CECONY | |||
(Millions of Dollars) | 2015 | 2014 | 2015 | 2014 |
Accrued liability – asbestos suits | $8 | $8 | $7 | $7 |
Regulatory assets – asbestos suits | $8 | $8 | $7 | $7 |
Accrued liability – workers’ compensation | $86 | $83 | $81 | $78 |
Regulatory assets – workers’ compensation | $10 | $8 | $10 | $8 |
Note H — Other Material Contingencies
Manhattan Steam Main Rupture
In July 2007, a CECONY steam main located in midtown Manhattan ruptured. It has been reported that one person died and others were injured as a result of the incident. Several buildings in the area were damaged. Debris from the incident included dirt and mud containing asbestos. The response to the incident required the closing of several buildings and streets for various periods. Approximately 90 suits are pending against the company seeking generally unspecified compensatory and, in some cases, punitive damages, for personal injury, property damage and business interruption. The company has notified its insurers of the incident and believes that the policies in force at the time of the incident will cover the company’s costs to satisfy its liability to others in connection with the suits. In the company’s estimation, there is not a reasonable possibility that an exposure to loss exists for the suits that is materially in excess of the estimated liability accrued. At June 30, 2015, the company has accrued its estimated liability for the suits of $50 million and an insurance receivable in the same amount.
28
Manhattan Explosion and Fire
On March 12, 2014, two multi-use five-story tall buildings located on Park Avenue between 116th and 117th Street in Manhattan were destroyed by an explosion and fire. CECONY had delivered gas to the buildings through service lines from a distribution main located below ground on Park Avenue. Eight people died and more than 50 people were injured. Additional buildings were also damaged. The National Transportation Safety Board (NTSB) investigated. The parties to the investigation included the company, the City of New York, the Pipeline and Hazardous Materials Safety Administration and the NYSPSC (which is also conducting an investigation). In June 2015, the NTSB issued a final report concerning the incident, its probable cause and safety recommendations. The NTSB determined that the probable cause of the incident was (1) the failure of a defective fusion joint at a service tee (which joined a plastic service line to a distribution main) installed by the company that allowed gas to leak from the distribution main and migrate into a building where it ignited and (2) a breach in a City sewer line that allowed groundwater and soil to flow into the sewer, resulting in a loss of support for the distribution main, which caused it to sag and overstressed the defective fusion joint. The NTSB also made safety recommendations, including recommendations to the company that addressed its procedures for the preparation and examination of plastic fusions, training of its staff on conditions for notifications to the City’s Fire Department and extension of its gas main isolation valve installation program. Approximately 70 suits are pending against the company seeking generally unspecified damages and, in one case, punitive damages, for personal injury, property damage and business interruption. The company has notified its insurers of the incident and believes that the policies in force at the time of the incident will cover the company’s costs, in excess of a required retention (the amount of which is not material), to satisfy any liability it may have for damages in connection with the incident. The company is unable to estimate the amount or range of its possible loss related to the incident. At June 30, 2015, the company had not accrued a liability for the incident.
Other Contingencies
See “Other Regulatory Matters” in Note B and “Uncertain Tax Positions” in Note I.
Guarantees
Con Edison and its subsidiaries enter into various agreements providing financial or performance assurance primarily to third parties on behalf of their subsidiaries. Maximum amounts guaranteed by Con Edison totaled $2,529 million and $2,547 million at June 30, 2015 and December 31, 2014, respectively.
A summary, by type and term, of Con Edison’s total guarantees at June 30, 2015 is as follows:
Guarantee Type | 0 – 3 years | 4 – 10 years | > 10 years | Total | ||||
(Millions of Dollars) | ||||||||
NY Transco | $1,359 | $— | $— | $1,359 | ||||
Energy transactions | 739 | 42 | 90 | 871 | ||||
Renewable electric production projects | 165 | 50 | 54 | 269 | ||||
Other | 30 | — | — | 30 | ||||
Total | $2,293 | $92 | $144 | $2,529 | ||||
NY Transco — Con Edison has guaranteed payment by its subsidiary, Con Edison Transmission, of the contributions it agreed to make to New York Transco LLC (NY Transco). Con Edison Transmission acquired a 46 percent interest in NY Transco when it was formed in 2014. NY Transco’s transmission projects are expected to be developed initially by CECONY and other New York transmission owners and then sold to NY Transco. The development of the projects would be subject to authorizations from the NYSPSC, the FERC and other federal, state and local agencies. Guarantee amount shown is for the maximum possible required amount of Con Edison Transmission’s contributions, which assumes that all the NY Transco projects proposed when NY Transco was formed receive all required regulatory approvals and are completed at 175 percent of their estimated costs and that NY Transco does not use any debt financing for the projects. Guarantee term shown is assumed as the timing of the contributions is not known.
Energy Transactions — Con Edison guarantees payments on behalf of its competitive energy businesses in order to facilitate physical and financial transactions in gas, pipeline capacity, transportation, oil, electricity, renewable energy credits and energy services. To the extent that liabilities exist under the contracts subject to these guarantees, such liabilities are included in Con Edison’s consolidated balance sheet.
Renewable Electric Production Projects — Con Edison and Con Edison Development guarantee payments associated with the investment in solar and wind energy facilities on behalf of their wholly-owned subsidiaries. In addition, Con Edison Development also provided $3 million in guarantees to Travelers Insurance Company for
29
indemnity agreements for surety bonds in connection with the construction and operation of solar energy facilities performed by its subsidiaries.
Other — Other guarantees primarily relate to guarantees provided by Con Edison to Travelers Insurance Company for indemnity agreements for surety bonds in connection with energy service projects performed by Con Edison Solutions ($25 million). In addition, Con Edison issued a guarantee to the Public Utility Commission of Texas covering obligations of Con Edison Solutions as a retail electric provider. Con Edison’s estimate of the maximum potential obligation for this guarantee is $5 million as of June 30, 2015.
Note I — Income Tax
Con Edison’s income tax expense decreased to $101 million for the three months ended June 30, 2015 from $102 million for the three months ended June 30, 2014. Con Edison's effective tax rate for the three months ended June 30, 2015 and 2014 was 32 percent. CECONY’s income tax expense increased to $101 million for the three months ended June 30, 2015 from $78 million for the three months ended June 30, 2014. CECONY's effective tax rate for the three months ended June 30, 2015 and 2014 was 32 percent and 31 percent, respectively. The increase in CECONY’s effective tax rate is due primarily to plant-related flow through items and lower injuries and damages claims in 2015, partially offset by lower amortization of New York State’s Metropolitan Transportation Authority business tax.
Con Edison’s income tax expense was $300 million for the six months ended June 30, 2015 and 2014. Con Edison's effective tax rate for the six months ended June 30, 2015 and 2014 was 34 percent. CECONY’s income tax expense increased to $293 million for the six months ended June 30, 2015 from $262 million for the six months ended June 30, 2014. CECONY's effective tax rate for the six months ended June 30, 2015 and 2014 was 34 percent.
Uncertain Tax Positions
At June 30, 2015 the estimated liability for uncertain tax positions for Con Edison was $34 million ($2 million for CECONY). Con Edison reasonably expects to resolve approximately $25 million ($16 million, net of federal taxes) of its uncertain tax positions within the next twelve months, of which the entire amount, if recognized, would reduce Con Edison’s effective tax rate. The amount related to CECONY is approximately $2 million ($1 million, net of federal taxes), of which the entire amount, if recognized, would reduce CECONY’s effective tax rate. The total amount of unrecognized tax benefits, if recognized, that would reduce Con Edison’s effective tax rate is $34 million ($22 million, net of federal taxes).
The Companies recognize interest on liabilities for uncertain tax positions in interest expense and would recognize penalties, if any, in operating expenses in the Companies’ consolidated income statements. In the three and six months ended June 30, 2015, Con Edison recognized an immaterial amount of interest expense and no penalties for uncertain tax positions in its consolidated income statements. At June 30, 2015 and December 31, 2014, Con Edison recognized an immaterial amount of accrued interest on its consolidated balance sheets.
30
Note J — Financial Information by Business Segment
The financial data for the business segments are as follows:
For the Three Months Ended June 30, | ||||||||||||||||||
Operating revenues | Inter-segment revenues | Depreciation and amortization | Operating income | |||||||||||||||
(Millions of Dollars) | 2015 | 2014 | 2015 | 2014 | 2015 | 2014 | 2015 | 2014 | ||||||||||
CECONY | ||||||||||||||||||
Electric | $1,879 | $1,978 | $5 | $4 | $201 | $195 | $422 | $347 | ||||||||||
Gas | 308 | 360 | 1 | 2 | 35 | 33 | 54 | 54 | ||||||||||
Steam | 96 | 98 | 21 | 21 | 18 | 19 | (16) | (15) | ||||||||||
Consolidation adjustments | — | — | (27) | (27) | — | — | — | — | ||||||||||
Total CECONY | $2,283 | $2,436 | $— | $— | $254 | $247 | $460 | $386 | ||||||||||
O&R | ||||||||||||||||||
Electric | $162 | $157 | $— | $— | $13 | $11 | $16 | $25 | ||||||||||
Gas | 16 | 35 | — | — | 4 | 4 | (18) | (5) | ||||||||||
Total O&R | $178 | $192 | $— | $— | $17 | $15 | $(2) | $20 | ||||||||||
Competitive energy businesses | $328 | $284 | $(1) | $(1) | $6 | $4 | $13 | $48 | ||||||||||
Other (a) | (1) | (1) | 1 | 1 | (1) | (1) | 1 | 1 | ||||||||||
Total Con Edison | $2,788 | $2,911 | $— | $— | $276 | $265 | $472 | $455 | ||||||||||
(a) | Parent company and consolidation adjustments. Other does not represent a business segment. |
For the Six Months Ended June 30, | ||||||||||||||||||
Operating revenues | Inter-segment revenues | Depreciation and amortization | Operating income | |||||||||||||||
(Millions of Dollars) | 2015 | 2014 | 2015 | 2014 | 2015 | 2014 | 2015 | 2014 | ||||||||||
CECONY | ||||||||||||||||||
Electric | $3,858 | $4,053 | $9 | $8 | $403 | $383 | $700 | $605 | ||||||||||
Gas | 963 | 1,149 | 3 | 3 | 70 | 64 | 294 | 287 | ||||||||||
Steam | 471 | 439 | 43 | 41 | 38 | 39 | 149 | 138 | ||||||||||
Consolidation adjustments | — | — | (55) | (52) | — | — | — | — | ||||||||||
Total CECONY | $5,292 | $5,641 | $— | $— | $511 | $486 | $1,143 | $1,030 | ||||||||||
O&R | ||||||||||||||||||
Electric | $318 | $320 | $— | $— | $25 | $21 | $34 | $37 | ||||||||||
Gas | 93 | 128 | — | — | 9 | 8 | 9 | 22 | ||||||||||
Total O&R | $411 | $448 | $— | $— | $34 | $29 | $43 | $59 | ||||||||||
Competitive energy businesses | $702 | $612 | $(4) | $1 | $11 | $11 | $10 | $50 | ||||||||||
Other (a) | (1) | (1) | 4 | (1) | (1) | — | 2 | 1 | ||||||||||
Total Con Edison | $6,404 | $6,700 | $— | $— | $555 | $526 | $1,198 | $1,140 | ||||||||||
(a) | Parent company and consolidation adjustments. Other does not represent a business segment. |
Note K — Derivative Instruments and Hedging Activities
Con Edison’s subsidiaries hedge market price fluctuations associated with physical purchases and sales of electricity, natural gas, steam and, to a lesser extent, refined fuels by using derivative instruments including futures, forwards, basis swaps, options, transmission congestion contracts and financial transmission rights contracts. Derivatives are recognized on the balance sheet at fair value (see Note L), unless an exception is available under the accounting rules for derivatives and hedging. Qualifying derivative contracts that have been designated as normal purchases or normal sales contracts are not reported at fair value under the accounting rules.
31
The fair values of the Companies’ commodity derivatives including the offsetting of assets and liabilities on the consolidated balance sheet at June 30, 2015 and December 31, 2014 were:
(Millions of Dollars) | 2015 | 2014 | |||||||||
Balance Sheet Location | Gross Amounts of Recognized Assets/(Liabilities) | Gross Amounts Offset | Net Amounts of Assets/ (Liabilities) (a) | Gross Amounts of Recognized Assets/(Liabilities) | Gross Amounts Offset | Net Amounts of Assets/ (Liabilities) (a) | |||||
Con Edison | |||||||||||
Fair value of derivative assets | |||||||||||
Current | $70 | $(50) | $20 | (b) | $111 | $(67) | $44 | (b) | |||
Current - assets held for sale (c) | 55 | (53) | 2 | — | — | — | |||||
Noncurrent | 24 | (21) | 3 | 34 | (23) | 11 | |||||
Total fair value of derivative assets | $149 | $(124) | $25 | $145 | $(90) | $55 | |||||
Fair value of derivative liabilities | |||||||||||
Current | $(110) | $78 | $(32) | $(242) | $139 | $(103) | |||||
Current - liabilities held for sale (c) | (100) | 43 | (57) | — | — | — | |||||
Noncurrent | (66) | 42 | (24) | (66) | 91 | 25 | |||||
Noncurrent - liabilities held for sale (c) | (35) | 10 | (25) | — | — | — | |||||
Total fair value of derivative liabilities | $(311) | $173 | $(138) | $(308) | $230 | $(78) | |||||
Net fair value derivative assets/(liabilities) | $(162) | $49 | $(113) | (b) | $(163) | $140 | $(23) | (b) | |||
CECONY | |||||||||||
Fair value of derivative assets | |||||||||||
Current | $46 | $(36) | $10 | (b) | $26 | $(15) | $11 | (b) | |||
Noncurrent | 19 | (17) | 2 | 22 | (20) | 2 | |||||
Total fair value of derivative assets | $65 | $(53) | $12 | $48 | $(35) | $13 | |||||
Fair value of derivative liabilities | |||||||||||
Current | $(86) | $63 | $(23) | $(96) | $48 | $(48) | |||||
Noncurrent | (57) | 38 | (19) | (42) | 32 | (10) | |||||
Total fair value of derivative liabilities | $(143) | $101 | $(42) | $(138) | $80 | $(58) | |||||
Net fair value derivative assets/(liabilities) | $(78) | $48 | $(30) | (b) | $(90) | $45 | $(45) | (b) | |||
(a) | Derivative instruments and collateral were offset on the consolidated balance sheet as applicable under the accounting rules. The Companies enter into master agreements for their commodity derivatives. These agreements typically provide offset in the event of contract termination. In such case, generally the non-defaulting party’s payable will be offset by the defaulting party’s payable. The non-defaulting party will customarily notify the defaulting party within a specific time period and come to an agreement on the early termination amount. |
(b) | At June 30, 2015 and December 31, 2014, margin deposits for Con Edison ($22 million and $27 million, respectively) and CECONY ($21 million and $25 million, respectively) were classified as derivative assets on the consolidated balance sheet, but not included in the table. Margin is collateral, typically cash, that the holder of a derivative instrument is required to deposit in order to transact on an exchange and to cover its potential losses with its broker or the exchange. |
(c) | Amounts represent derivative assets and liabilities included in assets and liabilities held for sale on the consolidated balance sheet (see Note O). |
The Utilities generally recover their prudently incurred fuel, purchased power and gas costs, including hedging gains and losses, in accordance with rate provisions approved by the applicable state utility regulators. In accordance with the accounting rules for regulated operations, the Utilities record a regulatory asset or liability to defer recognition of unrealized gains and losses on their electric and gas derivatives. As gains and losses are realized in future periods, they will be recognized as purchased power, gas and fuel costs in the Companies’ consolidated income statements. Con Edison’s competitive energy businesses record realized and unrealized gains and losses on their derivative contracts in purchased power, gas purchased for resale and non-utility revenue in the reporting period in which they occur. Management believes that these derivative instruments represent economic hedges that mitigate exposure to fluctuations in commodity prices.
32
The following table presents the realized and unrealized gains or losses on commodity derivatives that have been deferred or recognized in earnings for the three and six months ended June 30, 2015 and 2014:
For the Three Months Ended June 30, | ||||||||||||
Con Edison | CECONY | |||||||||||
(Millions of Dollars) | Balance Sheet Location | 2015 | 2014 | 2015 | 2014 | |||||||
Pre-tax gains/(losses) deferred in accordance with accounting rules for regulated operations: | ||||||||||||
Current | Deferred derivative gains | $(2) | $1 | $(1) | $1 | |||||||
Noncurrent | Deferred derivative gains | — | 2 | — | 2 | |||||||
Total deferred gains/(losses) | $(2) | $3 | $(1) | $3 | ||||||||
Current | Deferred derivative losses | $(11) | $(2) | $(10) | $(2) | |||||||
Current | Recoverable energy costs | (40) | (7) | (36) | (6) | |||||||
Noncurrent | Deferred derivative losses | (2) | (3) | (1) | (3) | |||||||
Total deferred gains/(losses) | $(53) | $(12) | $(47) | $(11) | ||||||||
Net deferred gains/(losses) | $(55) | $(9) | $(48) | $(8) | ||||||||
Income Statement Location | ||||||||||||
Pre-tax gain/(loss) recognized in income | ||||||||||||
Purchased power expense | $(50) | (a) | $(13) | (b) | $— | $— | ||||||
Gas purchased for resale | (26) | (32) | — | — | ||||||||
Non-utility revenue | (27) | (a) | 14 | (b) | — | — | ||||||
Total pre-tax gain/(loss) recognized in income | $(103) | $(31) | $— | $— | ||||||||
(a) | For the three months ended June 30, 2015, Con Edison recorded unrealized pre-tax gains and losses in non-utility operating revenue ($1 million gain) and purchased power expense ($17 million loss). |
(b) | For the three months ended June 30, 2014, Con Edison recorded in purchased power expense an unrealized pre-tax loss of $5 million. |
For the Six Months Ended June 30, | |||||||||||||
Con Edison | CECONY | ||||||||||||
(Millions of Dollars) | Balance Sheet Location | 2015 | 2014 | 2015 | 2014 | ||||||||
Pre-tax gains/(losses) deferred in accordance with accounting rules for regulated operations: | |||||||||||||
Current | Deferred derivative gains | $1 | $31 | $2 | $25 | ||||||||
Noncurrent | Deferred derivative gains | — | 7 | — | 6 | ||||||||
Total deferred gains/(losses) | $1 | $38 | $2 | $31 | |||||||||
Current | Deferred derivative losses | $32 | $15 | $32 | $15 | ||||||||
Current | Recoverable energy costs | (39) | 87 | (38) | 70 | ||||||||
Noncurrent | Deferred derivative losses | (21) | — | (18) | (1) | ||||||||
Total deferred gains/(losses) | $(28) | $102 | $(24) | $84 | |||||||||
Net deferred gains/(losses) | $(27) | $140 | $(22) | $115 | |||||||||
Income Statement Location | |||||||||||||
Pre-tax gain/(loss) recognized in income | |||||||||||||
Purchased power expense | $(28) | (a) | $161 | (b) | $— | $— | |||||||
Gas purchased for resale | (69) | (46) | — | — | |||||||||
Non-utility revenue | 15 | (a) | (10) | (b) | — | — | |||||||
Total pre-tax gain/(loss) recognized in income | $(82) | $105 | $— | $— | |||||||||
(a) | For the six months ended June 30, 2015, Con Edison recorded unrealized pre-tax gains and losses in non-utility operating revenue ($3 million loss) and purchased power expense ($5 million loss). |
(b) | For the six months ended June 30, 2014, Con Edison recorded in purchased power expense an unrealized pre-tax gain of $15 million. |
33
The following table presents the hedged volume of Con Edison’s and CECONY’s derivative transactions at June 30, 2015:
Electric Energy (MWHs) (a)(b) | Capacity (MWs)(a) | Natural Gas (Dt) (a)(b) | Refined Fuels (gallons) | |||||
Con Edison (c) | 20,982,862 | 7,324 | 61,343,892 | 5,502,000 | ||||
CECONY | 6,941,125 | 2,400 | 55,640,000 | 5,502,000 | ||||
(a) | Volumes are reported net of long and short positions, except natural gas collars where the volumes of long positions are reported. |
(b) | Excludes electric congestion and gas basis swap contracts which are associated with electric and gas contracts and hedged volumes. |
(c) | Includes 12,801,647 MWHs for electric energy, 6,635 MWs for capacity and 1,397,036 Dt for natural gas derivative transactions that are held for sale. |
The Companies are exposed to credit risk related to transactions entered into primarily for the various energy supply and hedging activities by the Utilities and the competitive energy businesses. Credit risk relates to the loss that may result from a counterparty’s nonperformance. The Companies use credit policies to manage this risk, including an established credit approval process, monitoring of counterparty limits, netting provisions within agreements, collateral or prepayment arrangements, credit insurance and credit default swaps. The Companies measure credit risk exposure as the replacement cost for open energy commodity and derivative positions plus amounts owed from counterparties for settled transactions. The replacement cost of open positions represents unrealized gains, net of any unrealized losses where the Companies have a legally enforceable right to offset.
At June 30, 2015, Con Edison and CECONY had $166 million and $21 million of credit exposure in connection with energy supply and hedging activities, net of collateral, respectively. Con Edison’s net credit exposure consisted of $77 million with commodity exchange brokers, $76 million with independent system operators, $8 million with investment-grade counterparties and $5 million with non-investment grade/non-rated counterparties. CECONY’s net credit exposure was with commodity exchange brokers.
The collateral requirements associated with, and settlement of, derivative transactions are included in net cash flows from operating activities in the Companies’ consolidated statement of cash flows. Most derivative instrument contracts contain provisions that may require a party to provide collateral on its derivative instruments that are in a net liability position. The amount of collateral to be provided will depend on the fair value of the derivative instruments and the party’s credit ratings.
The following table presents the aggregate fair value of the Companies’ derivative instruments with credit-risk-related contingent features that are in a net liability position, the collateral posted for such positions and the additional collateral that would have been required to be posted had the lowest applicable credit rating been reduced one level and to below investment grade at June 30, 2015:
(Millions of Dollars) | Con Edison (a) | CECONY (a) | |||
Aggregate fair value – net liabilities | $60 | $41 | |||
Collateral posted | 5 | — | |||
Additional collateral (b) (downgrade one level from current ratings) | 5 | — | |||
Additional collateral (b) (downgrade to below investment grade from current ratings) | 85 | (c) | 56 | (c) | |
(a) | Non-derivative transactions for the purchase and sale of electricity and gas and qualifying derivative instruments, which have been designated as normal purchases or normal sales, are excluded from the table. These transactions primarily include purchases of electricity from independent system operators. In the event the Utilities and the competitive energy businesses were no longer extended unsecured credit for such purchases, the Companies would be required to post additional collateral of $2 million at June 30, 2015. For certain other such non-derivative transactions, the Companies could be required to post collateral under certain circumstances, including in the event counterparties had reasonable grounds for insecurity. |
(b) | The Companies measure the collateral requirements by taking into consideration the fair value amounts of derivative instruments that contain credit-risk-related contingent features that are in a net liabilities position plus amounts owed to counterparties for settled transactions and amounts required by counterparties for minimum financial security. The fair value amounts represent unrealized losses, net of any unrealized gains where the Companies have a legally enforceable right to offset. |
(c) | Derivative instruments that are net assets have been excluded from the table. At June 30, 2015, if Con Edison had been downgraded to below investment grade, it would have been required to post additional collateral for such derivative instruments of $7 million. |
Note L — Fair Value Measurements
The accounting rules for fair value measurements and disclosures define fair value as the price that would be received to sell an asset or paid to transfer a liability in an orderly transaction between market participants at the measurement date in a principal or most advantageous market. Fair value is a market-based measurement that is determined based on inputs, which refer broadly to assumptions that market participants use in pricing assets or
34
liabilities. These inputs can be readily observable, market corroborated, or generally unobservable firm inputs. The Companies often make certain assumptions that market participants would use in pricing the asset or liability, including assumptions about risk, and the risks inherent in the inputs to valuation techniques. The Companies use valuation techniques that maximize the use of observable inputs and minimize the use of unobservable inputs.
The accounting rules for fair value measurements and disclosures established a fair value hierarchy, which prioritizes the inputs to valuation techniques used to measure fair value in three broad levels. The rules require that assets and liabilities be classified in their entirety based on the level of input that is significant to the fair value measurement. Assessing the significance of a particular input may require judgment considering factors specific to the asset or liability, and may affect the valuation of the asset or liability and their placement within the fair value hierarchy. The Companies classify fair value balances based on the fair value hierarchy defined by the accounting rules for fair value measurements and disclosures as follows:
• | Level 1 – Consists of assets or liabilities whose value is based on unadjusted quoted prices in active markets at the measurement date. An active market is one in which transactions for assets or liabilities occur with sufficient frequency and volume to provide pricing information on an ongoing basis. This category includes contracts traded on active exchange markets valued using unadjusted prices quoted directly from the exchange. |
• | Level 2 – Consists of assets or liabilities valued using industry standard models and based on prices, other than quoted prices within Level 1, that are either directly or indirectly observable as of the measurement date. The industry standard models consider observable assumptions including time value, volatility factors and current market and contractual prices for the underlying commodities, in addition to other economic measures. This category includes contracts traded on active exchanges or in over-the-counter markets priced with industry standard models. |
• | Level 3 – Consists of assets or liabilities whose fair value is estimated based on internally developed models or methodologies using inputs that are generally less readily observable and supported by little, if any, market activity at the measurement date. Unobservable inputs are developed based on the best available information and subject to cost benefit constraints. This category includes contracts priced using models that are internally developed and contracts placed in illiquid markets. It also includes contracts that expire after the period of time for which quoted prices are available and internal models are used to determine a significant portion of the value. |
Assets and liabilities measured at fair value on a recurring basis as of June 30, 2015 and December 31, 2014 are summarized below.
2015 | 2014 | |||||||||||||||||||
(Millions of Dollars) | Level 1 | Level 2 | Level 3 | Netting Adjustment (e) | Total | Level 1 | Level 2 | Level 3 | Netting Adjustment (e) | Total | ||||||||||
Con Edison | ||||||||||||||||||||
Derivative assets: | ||||||||||||||||||||
Commodity (a)(b)(c) | $1 | $24 | $15 | $4 | $44 | $3 | $78 | $28 | $(27) | $82 | ||||||||||
Commodity held for sale (f) | — | 45 | 2 | (45) | 2 | — | — | — | — | — | ||||||||||
Other (a)(b)(d) | 187 | 117 | — | — | 304 | 163 | 116 | — | — | 279 | ||||||||||
Total assets | $188 | $186 | $17 | $(41) | $350 | $166 | $194 | $28 | $(27) | $361 | ||||||||||
Derivative liabilities: | ||||||||||||||||||||
Commodity (a)(b)(c) | $11 | $111 | $— | $(67) | $55 | $18 | $246 | $8 | $(194) | $78 | ||||||||||
Commodity held for sale (f) | 1 | 122 | 4 | (45) | 82 | — | — | — | — | — | ||||||||||
Total liabilities | $12 | $233 | $4 | $(112) | $137 | $18 | $246 | $8 | $(194) | $78 | ||||||||||
CECONY | ||||||||||||||||||||
Derivative assets: | ||||||||||||||||||||
Commodity (a)(b)(c) | $1 | $8 | $11 | $13 | $33 | $1 | $3 | $13 | $21 | $38 | ||||||||||
Other (a)(b)(d) | 179 | 107 | — | — | 286 | 155 | 106 | — | — | 261 | ||||||||||
Total assets | $180 | $115 | $11 | $13 | $319 | $156 | $109 | $13 | $21 | $299 | ||||||||||
Derivative liabilities: | ||||||||||||||||||||
Commodity (a)(b)(c) | $10 | $88 | $— | $(56) | $42 | $16 | $91 | $— | $(49) | $58 | ||||||||||
35
(a) | The Companies’ policy is to review the fair value hierarchy and recognize transfers into and transfers out of the levels at the end of each reporting period. There were no transfers between levels 1, 2 and 3 for the six months ended June 30, 2015 and for the year ended December 31, 2014. |
(b) | Level 2 assets and liabilities include investments held in the deferred compensation plan and/or non-qualified retirement plans, exchange-traded contracts where there is insufficient market liquidity to warrant inclusion in Level 1, certain over-the-counter derivative instruments for electricity, refined products and natural gas. Derivative instruments classified as Level 2 are valued using industry standard models that incorporate corroborated observable inputs; such as pricing services or prices from similar instruments that trade in liquid markets, time value and volatility factors. |
(c) | The accounting rules for fair value measurements and disclosures require consideration of the impact of nonperformance risk (including credit risk) from a market participant perspective in the measurement of the fair value of assets and liabilities. At June 30, 2015 and December 31, 2014, the Companies determined that nonperformance risk would have no material impact on their financial position or results of operations. |
(d) | Other assets are comprised of assets such as life insurance contracts within the deferred compensation plan and non-qualified retirement plans. |
(e) | Amounts represent the impact of legally-enforceable master netting agreements that allow the Companies to net gain and loss positions and cash collateral held or placed with the same counterparties. |
(f) | Amounts represent derivative assets and liabilities included in Assets and Liabilities held for sale on the consolidated balance sheet (see Note O). |
The employees in the Companies’ risk management group develop and maintain the Companies’ valuation policies and procedures for, and verify pricing and fair value valuation of, commodity derivatives. Under the Companies’ policies and procedures, multiple independent sources of information are obtained for forward price curves used to value commodity derivatives. Fair value and changes in fair value of commodity derivatives are reported on a monthly basis to the Companies’ risk committees, comprised of officers and employees of the Companies that oversee energy hedging at the Utilities and the competitive energy businesses. The risk management group reports to the Companies’ Vice President and Treasurer.
Fair Value of Level 3 at June 30, 2015 | Valuation Techniques | Unobservable Inputs | Range | |
(Millions of Dollars) | ||||
Con Edison – Commodity | ||||
Electricity | $(2) | Discounted Cash Flow | Forward energy prices (a) | $18.25-$118.25 per MWH |
Discounted Cash Flow | Forward capacity prices (a) | $3.70-$15.26 per kW-month | ||
Transmission Congestion Contracts/Financial Transmission Rights | 14 | Discounted Cash Flow | Discount to adjust auction prices for inter-zonal forward price curves (b) | 40.8%-57.9% |
Discount to adjust auction prices for historical monthly realized settlements (b) | 37.5%-60.8% | |||
Inter-zonal forward price curves adjusted for historical zonal losses (b) | $(2.57)-$6.62 per MWH | |||
Natural gas | 1 | Discounted Cash Flow | Forward gas prices (a) | $(1.56)-$10.00 per Dt |
Total Con Edison—Commodity | $13 | |||
CECONY—Commodity | ||||
Transmission Congestion Contracts | $11 | Discounted Cash Flow | Discount to adjust auction prices for inter-zonal forward price curves (b) | 40.8%-57.9% |
Discount to adjust auction prices for historical monthly realized settlements (b) | 37.5%-60.8% | |||
(a) | Generally, increases/(decreases) in this input in isolation would result in a higher/(lower) fair value measurement. |
(b) | Generally, increases/(decreases) in this input in isolation would result in a lower/(higher) fair value measurement. |
The table listed below provides a reconciliation of the beginning and ending net balances for assets and liabilities measured at fair value as of June 30, 2015 and 2014 and classified as Level 3 in the fair value hierarchy:
For the Three Months Ended June 30, | ||||||
Con Edison | CECONY | |||||
(Millions of Dollars) | 2015 | 2014 | 2015 | 2014 | ||
Beginning balance as of April 1, | $11 | $24 | $12 | $13 | ||
Included in earnings | (3) | (2) | (2) | (2) | ||
Included in regulatory assets and liabilities | — | 3 | — | 3 | ||
Purchases | 5 | 3 | 2 | 2 | ||
Settlements | — | (1) | (1) | (2) | ||
Ending balance as of June 30, | $13 | $27 | $11 | $14 | ||
36
For the Six Months Ended June 30, | ||||
Con Edison | CECONY | |||
(Millions of Dollars) | 2015 | 2014 | 2015 | 2014 |
Beginning balance as of January 1, | $20 | $9 | $13 | $6 |
Included in earnings | (15) | 49 | (5) | 9 |
Included in regulatory assets and liabilities | 1 | 7 | 1 | 7 |
Purchases | 8 | 11 | 4 | 9 |
Settlements | (1) | (49) | (2) | (17) |
Ending balance as of June 30, | $13 | $27 | $11 | $14 |
For the Utilities, realized gains and losses on Level 3 commodity derivative assets and liabilities are reported as part of purchased power, gas and fuel costs. The Utilities generally recover these costs in accordance with rate provisions approved by the applicable state public utilities regulators. Unrealized gains and losses for commodity derivatives are generally deferred on the consolidated balance sheet in accordance with the accounting rules for regulated operations.
For the competitive energy businesses, realized and unrealized gains and losses on Level 3 commodity derivative assets and liabilities are reported in non-utility revenues (immaterial for both periods) and purchased power costs ($1 million loss and immaterial) on the consolidated income statement for the three months ended June 30, 2015 and 2014, respectively. Realized and unrealized gains and losses on Level 3 commodity derivative assets and liabilities are reported in non-utility revenues (immaterial for both periods) and purchased power costs ($10 million loss and $40 million gain) on the consolidated income statement for the six months ended June 30, 2015 and 2014, respectively.
The change in fair value relating to Level 3 commodity derivative assets and liabilities held at June 30, 2015 and 2014 is included in non-utility revenues (immaterial for both periods) and purchased power costs ($1 million gain and $2 million gain) on the consolidated income statement for the three months ended June 30, 2015 and 2014, respectively. For the six months ended June 30, 2015 and 2014, the change in fair value relating to Level 3 commodity derivative assets and liabilities is included in non-utility revenues (immaterial for both periods) and purchased power costs ($4 million loss and $11 million gain) on the consolidated income statement, respectively.
Note M — Variable Interest Entities
Con Edison enters into arrangements including leases, partnerships and electricity purchase agreements, with various entities. As a result of these arrangements, Con Edison retains or may retain a variable interest in these entities.
CECONY has a variable interest in a non-consolidated variable interest entity (VIE), Astoria Energy, LLC (Astoria Energy), with which CECONY has entered into a long-term electricity purchase agreement. CECONY is not the primary beneficiary of this VIE since CECONY does not have the power to direct activities that CECONY believes most significantly impact the economic performance of Astoria Energy. In particular, CECONY has not invested in, or guaranteed the indebtedness of, Astoria Energy and CECONY does not operate or maintain Astoria Energy’s generating facilities. CECONY also has long-term electricity purchase agreements with the following three potential VIEs: Cogen Technologies Linden Venture, LP, Brooklyn Navy Yard Cogeneration Partners, LP and Indeck Energy Services of Corinth, Inc. In 2014, requests were made of these three counterparties for information necessary to determine whether the entity was a VIE and whether CECONY is the primary beneficiary; however, the information was not made available. The payments pursuant to these agreements, which constitute CECONY’s maximum exposure to loss with respect to the potential VIEs, for the three months ended June 30, 2015 were $177 million for Cogen Technologies Linden Venture, LP, $54 million for Brooklyn Navy Yard Cogeneration Partners, LP and $28 million for Indeck Energy Services of Corinth, Inc.
37
The following table summarizes the VIEs in which Con Edison Development has entered into as of June 30, 2015:
Project Name (a) | Generating Capacity Owned (MWs AC) | Power Purchase Agreement Term in Years | Year of Initial Investment | Location | Maximum Exposure to Loss (Millions of Dollars) (c) |
Copper Mountain Solar 3 | 128 | 20 | 2014 | Nevada | $187 |
Mesquite Solar 1 | 83 | 20 | 2013 | Arizona | 105 |
Copper Mountain Solar 2 | 75 | 25 | 2013 | Nevada | 88 |
California Solar | 55 | 25 | 2012 | California | 73 |
Broken Bow II | 37 | 25 | 2014 | Nebraska | 56 |
Texas Solar 4 | 32 | 25 | 2014 | Texas | 49 |
Pilesgrove | 9 | n/a (b) | 2010 | New Jersey | 26 |
(a) | With the exception of Texas Solar 4, Con Edison’s ownership interest is 50 percent and these projects are accounted for using the equity method of accounting. Con Edison is not the primary beneficiary since the power to direct the activities that most significantly impact the economics of the entities are shared equally between Con Edison Development and third parties. Con Edison’s ownership interest in Texas Solar 4 is 80 percent and is consolidated in the financial statements. Con Edison is the primary beneficiary since the power to direct the activities that most significantly impact the economics of Texas Solar 4 is held by Con Edison Development. The maximum exposure for Texas Solar 4 is the net assets of the investment offset by a $9 million noncontrolling interest. |
(b) | Pilesgrove has 3-5 year Solar Renewable Energy Credit hedges in place. |
(c) | For investments accounted for under the equity method, maximum exposure is equal to the carrying value of the investment on the consolidated balance sheet. For consolidated investments, maximum exposure is equal to the net assets of the investment on the consolidated balance sheet less any applicable minority interest. Con Edison did not provide any financial or other support during the year that was not previously contractually required. |
Note N — New Financial Accounting Standards
In January 2015, the Financial Accounting Standards Board (FASB) issued amendments on income statement guidance through Accounting Standards Update (ASU) No. 2015-01, “Income Statement—Extraordinary and Unusual Items (Subtopic 225-20).” The amendments eliminate the requirement to report extraordinary items separately on the income statement. The amendments are effective for reporting periods beginning on or after December 15, 2015. Early adoption is permitted provided that the guidance is applied from the beginning of the fiscal year of adoption. The application of this guidance is not expected to have a material impact on the Companies’ financial position, results of operations and liquidity.
In February 2015, the FASB issued amendments on consolidation guidance through ASU No. 2015-02, “Consolidation (Topic 810).” The amendments provide additional guidance for VIE accounting of limited partnerships and similar legal entities, fees paid to decision makers of a VIE, the effect of fee arrangements on primary beneficiary determination, and the effect of related parties on primary beneficiary determination. The amendments are effective prospectively for reporting periods beginning on or after December 15, 2015. Early adoption is permitted. The application of this guidance is not expected to have a material impact on the Companies’ financial position, results of operations and liquidity.
In April 2015, the FASB issued amendments on debt issuance costs guidance through ASU No. 2015-03, “Interest—Imputation of Interest (Subtopic 835-30): Simplifying the Presentation of Debt Issuance Costs.” The amendments provide additional guidance requiring that debt issuance costs related to a recognized debt liability be presented in the balance sheet as a reduction of that debt liability rather than as a deferred cost (i.e. an asset) as required by current guidance. For public entities, the amendments are effective for reporting periods beginning on or after December 15, 2015. Early adoption is permitted. The application of this guidance is not expected to have a material impact on the Companies’ financial position, results of operations and liquidity.
In April 2015, the FASB issued amendments on internal-use software guidance through ASU No. 2015-05, “Intangibles—Goodwill and Other—Internal-Use Software (Subtopic 350-40): Customer’s Accounting for Fees Paid in a Cloud Computing Arrangement.” The amendments provide guidance to customers about whether a cloud computing arrangement should be accounted for as a license of internal use software or as a service contract. For public entities, the amendments are effective for reporting periods beginning on or after December 15, 2015. Early adoption is permitted. The application of this guidance is not expected to have a material impact on the Companies’ financial position, results of operations and liquidity.
In May 2015, the FASB issued amendments on disclosure guidance for investments using Net Asset Value per Share through ASU No. 2015-07, “Fair Value Measurement (Topic 820): Disclosures for Investments in Certain Entities That Calculate Net Asset Value per Share (or Its Equivalent).” The amendments remove the requirement to categorize investments in the fair value hierarchy if Net Asset Value per Share is used as a practical expedient to determine the fair value of the investment. For public entities, the amendments are effective for reporting periods
38
beginning on or after December 15, 2015. Early adoption is permitted. The application of this guidance is not expected to have a material impact on the Companies’ financial position, results of operations and liquidity.
In July 2015, the FASB issued amendments on the measurement of first-in, first-out and average cost inventory through ASU No.2015-11, “Inventory (Topic 330): Simplifying the Measurement of Inventory.” The amendments require that inventory within the scope of the guidance be measured at the lower of cost and net realizable value rather than cost and market value. For public entities, the amendments are effective for reporting periods beginning on or after December 15, 2016. Early adoption is permitted. The Companies are evaluating the application and impact of the new guidance on the Companies’ financial position, results of operations and liquidity.
Note O — Assets Held For Sale
During the three months ended June 30, 2015, Con Edison initiated a plan to actively market and sell the retail electric supply business of its competitive energy businesses. The company expects the sale to close within the next twelve months.
At June 30, 2015, the company classified as held for sale the assets and liabilities of this retail electric supply business and ceased recording depreciation expense on these assets. There was no impairment of the assets held for sale, as the estimated fair value less costs to sell exceeded the carrying amount.
At June 30, 2015, the carrying amounts of the assets and liabilities designated as held for sale were as follows:
(Millions of Dollars) | 2015 |
Accounts receivable | $82 |
Accrued unbilled revenue | 76 |
Other current assets | 3 |
Derivative assets | 2 |
Total current assets | 163 |
Non-utility property | 4 |
TOTAL ASSETS HELD FOR SALE | $167 |
Derivative liabilities - current | $57 |
Accounts payable | 9 |
Total current liabilities | 66 |
Derivative liabilities - noncurrent | 25 |
TOTAL LIABILITIES HELD FOR SALE | $91 |
39
Item 2: Management’s Discussion and Analysis of Financial Condition and Results of Operations
This combined management’s discussion and analysis of financial condition and results of operations (MD&A) relates to the consolidated financial statements (the Second Quarter Financial Statements) included in this report of two separate registrants: Consolidated Edison, Inc. (Con Edison) and Consolidated Edison Company of New York, Inc. (CECONY) and should be read in conjunction with the financial statements and the notes thereto. As used in this report, the term the “Companies” refers to Con Edison and CECONY. CECONY is a subsidiary of Con Edison and, as such, information in this management’s discussion and analysis about CECONY applies to Con Edison.
This MD&A should be read in conjunction with the Second Quarter Financial Statements and the notes thereto, the MD&A in Item 7 of the Companies’ combined Annual Report on Form 10-K for the year ended December 31, 2014 (File Nos. 1-14514 and 1-1217, the Form 10-K) and the MD&A in Part 1, Item 2 of the Companies’ combined Quarterly Report on Form 10-Q for the quarterly period ended March 31, 2015 (File Nos. 1-14514 and 1-217).
Information in any item of this report referred to in this discussion and analysis is incorporated by reference herein. The use of terms such as “see” or “refer to” shall be deemed to incorporate by reference into this discussion and analysis the information to which reference is made.
Con Edison, incorporated in New York State in 1997, is a holding company that owns all of the outstanding common stock of CECONY, Orange and Rockland Utilities, Inc. (O&R) and the competitive energy businesses. In addition, in 2014 Con Edison formed Consolidated Edison Transmission, LLC (Con Edison Transmission) to invest in a transmission company. As used in this report, the term the “Utilities” refers to CECONY and O&R.
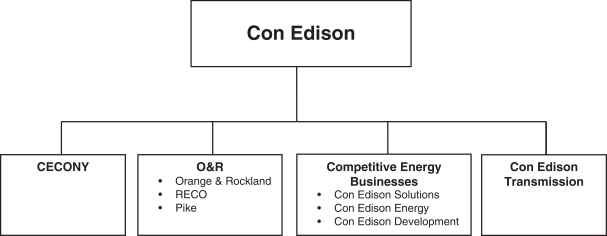
Con Edison’s principal business operations are those of CECONY, O&R and the competitive energy businesses. CECONY’s principal business operations are its regulated electric, gas and steam delivery businesses. O&R’s principal business operations are its regulated electric and gas delivery businesses. The competitive energy businesses sell electricity to retail customers, provide energy-related products and services, and develop, own and operate renewable and energy infrastructure projects.
Con Edison seeks to provide shareholder value through continued dividend growth, supported by earnings growth in regulated utilities and contracted assets. The company invests to provide reliable, resilient, safe and clean energy critical for New York City’s growing economy. The company is an industry leading owner and operator of contracted, large-scale solar generation in the United States. Con Edison is a responsible neighbor, helping the communities it serves become more sustainable.
CECONY
Electric
CECONY provides electric service to approximately 3.4 million customers in all of New York City (except a part of Queens) and most of Westchester County, an approximately 660 square mile service area with a population of more than nine million.
40
Gas
CECONY delivers gas to approximately 1.1 million customers in Manhattan, the Bronx, parts of Queens and most of Westchester County.
In May 2015, the company decreased its five-year forecast of average annual growth of the peak gas demand in its service area at design conditions from approximately 2.8 percent (for 2015 to 2019) to 2.3 percent (for 2016 to 2020). The decrease reflects, among other things, that the new five-year forecast no longer covers the 2014/2015 heating season, the fourth year in which there was a significant increase in oil-to-gas conversions following changes to New York City regulations that will phase out the use of certain types of heating oil.
Steam
CECONY operates the largest steam distribution system in the United States by producing and delivering approximately 23,000 MMlb of steam annually to approximately 1,700 customers in parts of Manhattan.
O&R
Electric
O&R and its utility subsidiaries, Rockland Electric Company (RECO) and Pike County Light & Power Company (Pike) (together referred to herein as O&R) provide electric service to approximately 0.3 million customers in southeastern New York and in adjacent areas of northern New Jersey and northeastern Pennsylvania, an approximately 1,350 square mile service area.
Gas
O&R delivers gas to over 0.1 million customers in southeastern New York and adjacent areas of northeastern Pennsylvania.
Competitive Energy Businesses
Con Edison pursues competitive energy opportunities through three wholly-owned subsidiaries: Con Edison Solutions, Con Edison Energy and Con Edison Development. These businesses sell to retail customers electricity purchased in wholesale markets and enter into related hedging transactions, provide energy-related products and services to wholesale and retail customers, and develop, own and operate renewable and energy infrastructure projects. During the three months ended June 30, 2015, Con Edison initiated a plan to actively market and sell the retail electric supply business of its competitive energy businesses (see Note O to the Second Quarter Financial Statements). At June 30, 2015, Con Edison’s equity investment in its competitive energy businesses was $679 million and their assets were $1,549 million (including $167 million of assets classified as held for sale).
Certain financial data of Con Edison’s businesses are presented below:
Three Months Ended June 30, 2015 | Six Months Ended June 30, 2015 | At June 30, 2015 | |||||||||||||||
(Millions of Dollars, except percentages) | Operating Revenues | Net Income for Common Stock | Operating Revenues | Net Income for Common Stock | Assets | ||||||||||||
CECONY | $2,283 | 82 | % | $211 | 96 | % | $5,292 | 83 | % | $559 | 95 | % | $39,701 | 89 | % | ||
O&R | 178 | 6 | % | (7) | (3 | )% | 411 | 6 | % | 16 | 3 | % | 2,683 | 6 | % | ||
Total Utilities | 2,461 | 88 | % | 204 | 93 | % | 5,703 | 89 | % | 575 | 98 | % | 42,384 | 95 | % | ||
Con Edison Solutions (a)(b) | 290 | 10 | % | 6 | 3 | % | 620 | 10 | % | — | — | % | 353 | 1 | % | ||
Con Edison Energy (a)(b) | 24 | 1 | % | 1 | — | % | 55 | 1 | % | 5 | 1 | % | 171 | — | % | ||
Con Edison Development | 13 | 1 | % | 10 | 5 | % | 23 | — | % | 14 | 2 | % | 1,105 | 2 | % | ||
Other (c) | — | — | % | (2) | (1 | )% | 3 | — | % | (5) | (1 | )% | 738 | 2 | % | ||
Total Con Edison | $2,788 | 100 | % | $219 | 100 | % | $6,404 | 100 | % | $589 | 100 | % | $44,751 | 100 | % | ||
(a) | Net income from the competitive energy businesses for the three and six months ended June 30, 2015 includes $(9) million and $(5) million, respectively, of net after-tax mark-to-market gains/(losses) (Con Edison Solutions, $(10) million and $(3) million and Con Edison Energy, $1 million and $(2) million). |
(b) | Operating revenues and net income from the competitive energy businesses for the three and six months ended June 30, 2015 includes $277 million and $594 million, and $8 million and $3 million, respectively, related to their retail electric supply business. Assets at June 30, 2015 include assets classified as held for sale of $167 million (see Note O to the Second Quarter Financial Statements). |
(c) | Other includes parent company and consolidation adjustments. |
41
Results of Operations
Net income for common stock and earnings per share for the three and six months ended June 30, 2015 and 2014 were as follows:
Three Months Ended June 30, | Six Months Ended June 30, | |||||||||||||||
2015 | 2014 | 2015 | 2014 | 2015 | 2014 | 2015 | 2014 | |||||||||
(Millions of Dollars, except per share amounts) | Net Income for Common Stock | Earnings per Share | Net Income for Common Stock | Earnings per Share | ||||||||||||
CECONY | $211 | $172 | $0.72 | $0.58 | $559 | $506 | $1.91 | $1.73 | ||||||||
O&R | (7) | 8 | (0.02 | ) | 0.03 | 16 | 29 | 0.05 | 0.10 | |||||||
Competitive energy businesses (a)(b) | 17 | 33 | 0.06 | 0.12 | 19 | 42 | 0.07 | 0.14 | ||||||||
Other (c) | (2) | (1) | (0.01 | ) | — | (5) | (3) | (0.02 | ) | (0.01 | ) | |||||
Con Edison (d) | $219 | $212 | $0.75 | $0.73 | $589 | $574 | $2.01 | $1.96 | ||||||||
(a) | Includes $9 million or $0.03 a share and $3 million or $0.01 a share of net after-tax mark-to-market losses for the three months ended June 30, 2015 and 2014, respectively, and $(5) million or $(0.02) a share and $9 million or $0.03 a share of net after-tax mark-to-market gains/(losses) for the six months ended June 30, 2015 and 2014, respectively. Includes an after-tax gain on sale of solar electric production projects of $26 million or $0.09 a share for the three and six months ended June 30, 2014. Also includes an after-tax benefit of $7 million or $0.02 a share relating to the lease in/lease out (LILO) transactions terminated in 2013 for the six months ended June 30, 2014. |
(b) | Includes $8 million or $0.03 a share and $(2) million or $(0.01) a share of net income/(loss) for the three months ended June 30, 2015 and 2014, respectively, and $3 million or $0.01 a share and $(4) million or $(0.01) a share of net income/(loss) for the six months ended June 30, 2015 and 2014, respectively, related to the retail electric supply business. See Note O to the Second Quarter Financial Statements. These amounts reflect net after-tax mark-to-market gains/(losses) of $(10) million or $(0.03) a share and $(3) million or $(0.01) a share for the three months ended June 30, 2015 and 2014, respectively, and $(3) million or $(0.01) a share and $9 million or $0.03 a share for the six months ended June 30, 2015 and 2014, respectively. |
(c) | Other includes parent company and consolidation adjustments. |
(d) | Earnings per share on a diluted basis were $0.74 a share and $0.72 a share for the three months ended June 30, 2015 and 2014, respectively, and $2.01 a share and $1.95 a share for the six months ended June 30, 2015 and 2014, respectively. |
The Companies’ results of operations for the three and six months ended June 30, 2015, as compared with the 2014 periods, reflect primarily changes in the Utilities’ rate plans, including growth in its gas delivery service related to oil-to-gas conversions, and lower other operations and maintenance expenses, offset in part by higher interest expense related to debt financing. The rate plans provide for revenues to cover expected increases in certain other operations and maintenance expenses and depreciation, reflecting primarily the impact of higher utility plant balances. The results of operations also include the net mark-to-market effects of the competitive energy businesses, the gain on sale of solar electric production projects and the impact of the LILO transactions in 2014.
42
The following table presents the estimated effect on earnings per share and net income for common stock for the three and six months ended June 30, 2015 periods as compared with 2014 periods, resulting from these and other major factors:
Three Months Variation | Six Months Variation | ||||
(Millions of Dollars, except per share amounts) | Earnings per Share Variation | Net Income for Common Stock Variation | Earnings per Share Variation | Net Income for Common Stock Variation | |
CECONY (a) | |||||
Rate plans, primarily to recover increases in certain costs | $0.14 | $40 | $0.19 | $57 | |
Other operations and maintenance expenses | 0.02 | 7 | 0.07 | 20 | |
Depreciation and amortization | (0.02) | (5) | (0.05) | (15) | |
Net interest expense | (0.02) | (8) | (0.05) | (16) | |
Other | 0.02 | 5 | 0.02 | 7 | |
Total CECONY | 0.14 | 39 | 0.18 | 53 | |
O&R (a) | |||||
Rate plans (b) | (0.02) | (7) | (0.01) | (2) | |
Other operations and maintenance expenses | (0.02) | (5) | (0.03) | (7) | |
Other | (0.01) | (3) | (0.01) | (4) | |
Total O&R | (0.05) | (15) | (0.05) | (13) | |
Competitive energy businesses | |||||
Operating revenues less energy costs | 0.03 | 9 | 0.03 | 10 | |
Gain on sale of solar electric production projects | (0.09) | (26) | (0.09) | (26) | |
Other operations and maintenance expenses | (0.01) | (2) | (0.02) | (7) | |
Net interest expense | — | 1 | (0.02) | (7) | |
Other | 0.01 | 2 | 0.03 | 7 | |
Total competitive energy businesses (c) | (0.06) | (16) | (0.07) | (23) | |
Other, including parent company expenses | (0.01) | (1) | (0.01) | (2) | |
Total variations | $0.02 | $7 | $0.05 | $15 | |
(a) | Under the revenue decoupling mechanisms in the Utilities’ New York electric and gas rate plans and the weather-normalization clause applicable to their gas businesses, revenues are generally not affected by changes in delivery volumes from levels assumed when rates were approved. Under the rate plans, pension and other postretirement costs and certain other costs are reconciled to amounts reflected in rates for such costs. In general, the Utilities recover on a current basis the fuel, gas purchased for resale and purchased power costs they incur in supplying energy to their full-service customers. Accordingly, such costs do not generally affect the Companies’ results of operations. |
(b) | These variations primarily reflect the charge-off of certain regulatory assets for the three and six months ended June 30, 2015 ($11 million after-tax or $0.04 a share). See “Rate Plans - O&R New York - Electric and Gas” in Note B to the Second Quarter Financial Statements. |
(c) | These variations include the net mark-to-market effects and the impact of the LILO transactions shown in note (a) in the Results of Operations table above. |
The Companies’ other operations and maintenance expenses for the three and six months ended June 30, 2015 and 2014 were as follows:
Three Months Ended June 30, | Six Months Ended June 30, | |||
(Millions of Dollars) | 2015 | 2014 | 2015 | 2014 |
CECONY | ||||
Operations | $348 | $342 | $690 | $710 |
Pensions and other postretirement benefits | 91 | 117 | 182 | 234 |
Health care and other benefits | 38 | 39 | 78 | 75 |
Regulatory fees and assessments (a) | 126 | 114 | 280 | 238 |
Other | 84 | 87 | 160 | 167 |
Total CECONY | 687 | 699 | 1,390 | 1,424 |
O&R | 85 | 76 | 167 | 154 |
Competitive energy businesses | 31 | 27 | 61 | 50 |
Other (b) | (1) | (1) | (2) | (1) |
Total other operations and maintenance expenses | $802 | $801 | $1,616 | $1,627 |
(a) | Includes Demand Side Management, System Benefit Charges and Public Service Law 18A assessments which are collected in revenues. |
(b) | Includes parent company and consolidation adjustments. |
43
Con Edison’s principal business segments are CECONY’s regulated utility activities, O&R’s regulated utility activities and Con Edison’s competitive energy businesses. CECONY’s principal business segments are its regulated electric, gas and steam utility activities. A discussion of the results of operations by principal business segment for the three and six months ended June 30, 2015 and 2014 follows. For additional business segment financial information, see Note J to the Second Quarter Financial Statements.
Three Months Ended June 30, 2015 Compared with Three Months Ended June 30, 2014
The Companies’ results of operations in 2015 compared with 2014 were:
CECONY | O&R | Competitive Energy Businesses | Other (a) | Con Edison (b) | ||||||||||||||||
(Millions of Dollars) | Increases (Decreases) Amount | Increases (Decreases) Percent | Increases (Decreases) Amount | Increases (Decreases) Percent | Increases (Decreases) Amount | Increases (Decreases) Percent | Increases (Decreases) Amount | Increases (Decreases) Percent | Increases (Decreases) Amount | Increases (Decreases) Percent | ||||||||||
Operating revenues | $(153) | (6.3 | )% | $(14) | (7.3 | )% | $44 | 15.5 | % | $— | — | $(123) | (4.2 | )% | ||||||
Purchased power | (159) | (30.8 | ) | 2 | 3.8 | 34 | 15.9 | — | — | (123) | (15.7 | ) | ||||||||
Fuel | (3) | (8.8 | ) | — | — | — | — | — | — | (3) | (8.8 | ) | ||||||||
Gas purchased for resale | (50) | (48.1 | ) | (6) | (40.0 | ) | (6) | (18.8 | ) | — | — | (62) | (41.1 | ) | ||||||
Other operations and maintenance | (12) | (1.7 | ) | 9 | 11.8 | 4 | 14.8 | — | — | 1 | 0.1 | |||||||||
Depreciation and amortization | 7 | 2.8 | 2 | 13.3 | 2 | 50.0 | — | — | 11 | 4.2 | ||||||||||
Taxes, other than income taxes | (10) | (2.2 | ) | 1 | 7.1 | — | — | — | — | (9) | (1.9 | ) | ||||||||
Gain on sale of solar electric production projects | — | — | — | — | (45) | — | — | — | (45) | — | ||||||||||
Operating income | 74 | 19.2 | (22) | Large | (35) | (72.9 | ) | — | — | 17 | 3.7 | |||||||||
Other income less deductions | 1 | 33.3 | (2) | Large | 1 | 9.1 | 1 | Large | 1 | 11.1 | ||||||||||
Net interest expense | 13 | 9.8 | 1 | 12.5 | (1) | (50.0 | ) | (1) | (14.3 | )% | 12 | 8.0 | ||||||||
Income before income tax expense | 62 | 24.8 | (25) | Large | (33) | (57.9 | ) | 2 | 28.6 | 6 | 1.9 | |||||||||
Income tax expense | 23 | 29.5 | (10) | Large | (17) | (70.8 | ) | 3 | 50.0 | (1) | (1.0 | ) | ||||||||
Net income for common stock | $39 | 22.7 | % | $(15) | Large | $(16) | (48.5 | )% | $(1) | Large | $7 | 3.3 | % | |||||||
(a) | Includes parent company and consolidation adjustments. |
(b) | Represents the consolidated financial results of Con Edison and its businesses. |
44
CECONY
Three Months Ended June 30, 2015 | Three Months Ended June 30, 2014 | ||||||||||||||
(Millions of Dollars) | Electric | Gas | Steam | 2015 Total | Electric | Gas | Steam | 2014 Total | 2015-2014 Variation | ||||||
Operating revenues | $1,879 | $308 | $96 | $2,283 | $1,978 | $360 | $98 | $2,436 | $(153) | ||||||
Purchased power | 350 | — | 8 | 358 | 505 | — | 12 | 517 | (159) | ||||||
Fuel | 15 | — | 16 | 31 | 20 | — | 14 | 34 | (3) | ||||||
Gas purchased for resale | — | 54 | — | 54 | — | 104 | — | 104 | (50) | ||||||
Other operations and maintenance | 535 | 107 | 45 | 687 | 546 | 107 | 46 | 699 | (12) | ||||||
Depreciation and amortization | 201 | 35 | 18 | 254 | 195 | 33 | 19 | 247 | 7 | ||||||
Taxes, other than income taxes | 356 | 58 | 25 | 439 | 365 | 62 | 22 | 449 | (10) | ||||||
Operating income | $422 | $54 | $(16) | $460 | $347 | $54 | $(15) | $386 | $74 | ||||||
Electric
CECONY’s results of electric operations for the three months ended June 30, 2015 compared with the 2014 period is as follows:
Three Months Ended | |||
(Millions of Dollars) | June 30, 2015 | June 30, 2014 | Variation |
Operating revenues | $1,879 | $1,978 | $(99) |
Purchased power | 350 | 505 | (155) |
Fuel | 15 | 20 | (5) |
Other operations and maintenance | 535 | 546 | (11) |
Depreciation and amortization | 201 | 195 | 6 |
Taxes, other than income taxes | 356 | 365 | (9) |
Electric operating income | $422 | $347 | $75 |
CECONY’s electric sales and deliveries for the three months ended June 30, 2015 compared with the 2014 period were:
Millions of kWhs Delivered | Revenues in Millions (a) | |||||||||||||
Three Months Ended | Three Months Ended | |||||||||||||
Description | June 30, 2015 | June 30, 2014 | Variation | Percent Variation | June 30, 2015 | June 30, 2014 | Variation | Percent Variation | ||||||
Residential/Religious (b) | 2,207 | 2,091 | 116 | 5.5 | % | $578 | $595 | $(17) | (2.9 | )% | ||||
Commercial/Industrial | 2,246 | 2,285 | (39 | ) | (1.7 | ) | 448 | 472 | (24) | (5.1 | ) | |||
Energy choice customers | 6,116 | 6,099 | 17 | 0.3 | 618 | 600 | 18 | 3.0 | ||||||
NYPA, Municipal Agency and other sales | 2,374 | 2,453 | (79 | ) | (3.2 | ) | 141 | 154 | (13) | (8.4 | ) | |||
Other operating revenues (c) | — | — | — | — | 94 | 157 | (63) | (40.1 | ) | |||||
Total | 12,943 | 12,928 | 15 | 0.1 | % | (d) | $1,879 | $1,978 | $(99) | (5.0 | )% | |||
(a) | Revenues from electric sales are subject to a revenue decoupling mechanism, as a result of which delivery revenues generally are not affected by changes in delivery volumes from levels assumed when rates were approved. |
(b) | “Residential/Religious” generally includes single-family dwellings, individual apartments in multi-family dwellings, religious organizations and certain other not-for-profit organizations. |
(c) | Other electric operating revenues generally reflect changes in regulatory assets and liabilities in accordance with the revenue decoupling mechanism and other provisions of the company’s rate plans. |
(d) | After adjusting for variations, principally weather and billing days, electric delivery volumes in CECONY’s service area decreased 1.2 percent in the three months ended June 30, 2015 compared with the 2014 period. |
45
Operating revenues decreased $99 million in the three months ended June 30, 2015 compared with the 2014 period due primarily to lower purchased power ($155 million) and fuel expenses ($5 million), offset in part by higher revenues from the electric rate plan ($65 million).
Purchased power expenses decreased $155 million in the three months ended June 30, 2015 compared with the 2014 period due to a decrease in unit costs ($167 million), offset by higher purchased volumes ($12 million).
Fuel expenses decreased $5 million in the three months ended June 30, 2015 compared with the 2014 period due to lower unit costs ($6 million), offset by higher sendout volumes from the company’s electric generating facilities ($1 million).
Other operations and maintenance expenses decreased $11 million in the three months ended June 30, 2015 compared with the 2014 period due primarily to lower pension costs ($21 million) and lower costs for the support and protection of company underground facilities to accommodate New York City municipal projects ($3 million), offset in part by an increase in the surcharges for assessments and fees that are collected in revenues from customers ($13 million).
Depreciation and amortization increased $6 million in the three months ended June 30, 2015 compared with the 2014 period due primarily to higher electric utility plant balances.
Taxes, other than income taxes decreased $9 million in the three months ended June 30, 2015 compared with the 2014 period principally due to the elimination of the New York City subsidiary capital tax ($3 million), lower payroll taxes ($2 million) and lower state and local revenue taxes ($2 million).
Gas
CECONY’s results of gas operations for the three months ended June 30, 2015 compared with the 2014 period is as follows:
Three Months Ended | |||||
(Millions of Dollars) | June 30, 2015 | June 30, 2014 | Variation | ||
Operating revenues | $308 | $360 | $(52) | ||
Gas purchased for resale | 54 | 104 | (50) | ||
Other operations and maintenance | 107 | 107 | — | ||
Depreciation and amortization | 35 | 33 | 2 | ||
Taxes, other than income taxes | 58 | 62 | (4) | ||
Gas operating income | $54 | $54 | $— | ||
CECONY’s gas sales and deliveries, excluding off-system sales, for the three months ended June 30, 2015 compared with the 2014 period were:
Thousands of Dt Delivered | Revenues in Millions (a) | ||||||||||||||
Three Months Ended | Three Months Ended | ||||||||||||||
Description | June 30, 2015 | June 30, 2014 | Variation | Percent Variation | June 30, 2015 | June 30, 2014 | Variation | Percent Variation | |||||||
Residential | 9,048 | 8,779 | 269 | 3.1 | % | $146 | $165 | $(19) | (11.5 | )% | |||||
General | 6,125 | 5,936 | 189 | 3.2 | 57 | 75 | (18) | (24.0 | ) | ||||||
Firm transportation | 14,640 | 14,341 | 299 | 2.1 | 97 | 102 | (5) | (4.9 | ) | ||||||
Total firm sales and transportation | 29,813 | 29,056 | 757 | 2.6 | (b) | 300 | 342 | (42) | (12.3 | ) | |||||
Interruptible sales (c) | 1,321 | 3,536 | (2,215 | ) | (62.6 | ) | 11 | 33 | (22) | (66.7 | ) | ||||
NYPA | 10,035 | 13,402 | (3,367 | ) | (25.1 | ) | 1 | 1 | — | — | |||||
Generation plants | 19,217 | 18,575 | 642 | 3.5 | 7 | 7 | — | — | |||||||
Other | 4,116 | 6,398 | (2,282 | ) | (35.7 | ) | 7 | 13 | (6) | (46.2 | ) | ||||
Other operating revenues (d) | — | — | — | — | (18) | (36) | 18 | 50.0 | |||||||
Total | 64,502 | 70,967 | (6,465 | ) | (9.1 | )% | $308 | $360 | $(52) | (14.4 | )% | ||||
46
(a) | Revenues from gas sales are subject to a weather normalization clause and a revenue decoupling mechanism as a result of which delivery revenues are generally not affected by changes in delivery volumes from levels assumed when rates were approved. Delivery revenues, however, are affected by changes in volumes attributable to changes in the average number of customers. |
(b) | After adjusting for variations, principally weather and billing days, firm gas sales and transportation volumes in the company’s service area increased 5.2 percent in the three months ended June 30, 2015 compared with the 2014 period reflecting primarily increased volumes attributable to additional customers that have converted from oil-to-gas as heating fuel for their buildings. |
(c) | Includes 1,635 thousands of Dt for the 2014 period, which is also reflected in firm transportation and other. |
(d) | Other gas operating revenues generally reflect changes in regulatory assets and liabilities in accordance with the company’s rate plans. |
Operating revenues decreased $52 million in the three months ended June 30, 2015 compared with the 2014 period due primarily to a decrease in gas purchased for resale expense ($50 million).
Gas purchased for resale decreased $50 million in the three months ended June 30, 2015 compared with the 2014 period due to lower unit costs ($51 million), offset by higher sendout volumes ($1 million).
Depreciation and amortization increased $2 million in the three months ended June 30, 2015 compared with the 2014 period due primarily to higher gas utility plant balances.
Taxes, other than income taxes decreased $4 million in the three months ended June 30, 2015 compared with the 2014 period principally due to lower state and local revenue taxes ($3 million) and lower property taxes ($1 million).
Steam
CECONY’s results of steam operations for the three months ended June 30, 2015 compared with the 2014 period is as follows:
Three Months Ended | |||
(Millions of Dollars) | June 30, 2015 | June 30, 2014 | Variation |
Operating revenues | $96 | $98 | $(2) |
Purchased power | 8 | 12 | (4) |
Fuel | 16 | 14 | 2 |
Other operations and maintenance | 45 | 46 | (1) |
Depreciation and amortization | 18 | 19 | (1) |
Taxes, other than income taxes | 25 | 22 | 3 |
Steam operating income | $(16) | $(15) | $(1) |
CECONY’s steam sales and deliveries for the three months ended June 30, 2015 compared with the 2014 period were:
Millions of Pounds Delivered | Revenues in Millions | |||||||||||||||
Three Months Ended | Three Months Ended | |||||||||||||||
Description | June 30, 2015 | June 30, 2014 | Variation | Percent Variation | June 30, 2015 | June 30, 2014 | Variation | Percent Variation | ||||||||
General | 68 | 76 | (8 | ) | (10.5 | )% | $4 | $4 | $— | — | ||||||
Apartment house | 1,121 | 1,210 | (89 | ) | (7.4 | ) | 29 | 31 | (2) | (6.5 | )% | |||||
Annual power | 2,607 | 2,761 | (154 | ) | (5.6 | ) | 71 | 73 | (2) | (2.7 | ) | |||||
Other operating revenues (a) | — | — | — | — | (8) | (10) | 2 | 20.0 | ||||||||
Total | 3,796 | 4,047 | (251 | ) | (6.2 | )% | (b) | $96 | $98 | $(2) | (2.0 | )% | ||||
(a) | Other steam operating revenues generally reflect changes in regulatory assets and liabilities in accordance with the company’s rate plans. |
(b) | After adjusting for variations, principally weather and billing days, steam sales and deliveries decreased 6.4 percent in three months ended June 30, 2015 compared with the 2014 period. |
Operating revenues decreased $2 million in the three months ended June 30, 2015 compared with the 2014 period due primarily to lower purchased power costs ($4 million), offset in part by higher fuel expenses ($2 million).
Purchased power expenses decreased $4 million in the three months ended June 30, 2015 compared with the 2014 period due to a decrease in unit costs ($2 million) and lower purchased volumes ($2 million).
47
Fuel expenses increased $2 million in the three months ended June 30, 2015 compared with the 2014 period due to higher unit costs ($2 million).
Other operations and maintenance expenses decreased $1 million in the three months ended June 30, 2015 compared with the 2014 period due primarily to lower costs for the support and protection of company underground facilities to accommodate New York City municipal projects.
Depreciation and amortization decreased $1 million in the three months ended June 30, 2015 compared with the 2014 period.
Taxes, other than income taxes increased $3 million in the three months ended June 30, 2015 compared with the 2014 period principally due to higher property taxes.
Net Interest Expense
Net interest expense increased $13 million in the three months ended June 30, 2015 compared with the 2014 period due primarily to new debt issuances in late 2014.
Income Tax Expense
Income taxes increased $23 million in the three months ended June 30, 2015 compared with the 2014 period due primarily to higher income before income tax expense.
O&R
Three Months Ended June 30, 2015 | Three Months Ended June 30, 2014 | ||||||||||
(Millions of Dollars) | Electric | Gas | 2015 Total | Electric | Gas | 2014 Total | 2015-2014 Variation | ||||
Operating revenues | $162 | $16 | $178 | $157 | $35 | $192 | $(14) | ||||
Purchased power | 54 | — | 54 | 52 | — | 52 | 2 | ||||
Gas purchased for resale | — | 9 | 9 | — | 15 | 15 | (6) | ||||
Other operations and maintenance | 68 | 17 | 85 | 59 | 17 | 76 | 9 | ||||
Depreciation and amortization | 13 | 4 | 17 | 11 | 4 | 15 | 2 | ||||
Taxes, other than income taxes | 11 | 4 | 15 | 10 | 4 | 14 | 1 | ||||
Operating income | $16 | $(18) | $(2) | $25 | $(5) | $20 | $(22) | ||||
Electric
O&R’s results of electric operations for the three months ended June 30, 2015 compared with the 2014 period is as follows:
Three Months Ended | |||
(Millions of Dollars) | June 30, 2015 | June 30, 2014 | Variation |
Operating revenues | $162 | $157 | $5 |
Purchased power | 54 | 52 | 2 |
Other operations and maintenance | 68 | 59 | 9 |
Depreciation and amortization | 13 | 11 | 2 |
Taxes, other than income taxes | 11 | 10 | 1 |
Electric operating income | $16 | $25 | $(9) |
48
O&R’s electric sales and deliveries for the three months ended June 30, 2015 compared with the 2014 period were:
Millions of kWhs Delivered | Revenues in Millions (a) | ||||||||||||||
Three Months Ended | Three Months Ended | ||||||||||||||
Description | June 30, 2015 | June 30, 2014 | Variation | Percent Variation | June 30, 2015 | June 30, 2014 | Variation | Percent Variation | |||||||
Residential/Religious (b) | 364 | 328 | 36 | 11.0 | % | $74 | $65 | $9 | 13.8 | % | |||||
Commercial/Industrial | 195 | 196 | (1 | ) | (0.5 | ) | 33 | 33 | — | — | |||||
Energy choice customers | 784 | 796 | (12 | ) | (1.5 | ) | 50 | 47 | 3 | 6.4 | |||||
Public authorities | 25 | 24 | 1 | 4.2 | 2 | 2 | — | — | |||||||
Other operating revenues (c) | — | — | — | — | 3 | 10 | (7) | (70.0 | ) | ||||||
Total | 1,368 | 1,344 | 24 | 1.8 | % | (d) | $162 | $157 | $5 | 3.2 | % | ||||
(a) | O&R’s New York electric delivery revenues are subject to a revenue decoupling mechanism, as a result of which delivery revenues are generally not affected by changes in delivery volumes from levels assumed when rates were approved. O&R’s electric sales in New Jersey and Pennsylvania are not subject to a decoupling mechanism, and as a result, changes in such volumes do impact revenues. |
(b) | “Residential/Religious” generally includes single-family dwellings, individual apartments in multi-family dwellings, religious organizations and certain other not-for-profit organizations. |
(c) | Other electric operating revenues generally reflect changes in regulatory assets and liabilities in accordance with the company’s electric rate plan. |
(d) | After adjusting for weather and other variations, electric delivery volumes in O&R’s service area increased 0.4 percent in the three months ended June 30, 2015 compared with the 2014 period. |
Operating revenues increased $5 million in the three months ended June 30, 2015 compared with the 2014 period due primarily to higher revenues from the New York electric rate plan ($8 million) and higher purchased power expenses ($2 million), offset in part by the charge-off of certain regulatory assets ($4 million). See “Rate Plans - O&R New York - Electric and Gas” in Note B to the Second Quarter Financial Statements.
Purchased power expenses increased $2 million in the three months ended June 30, 2015 compared with the 2014 period due to an increase in unit costs ($5 million), offset by a decrease in purchased volumes ($3 million).
Other operations and maintenance expenses increased $9 million in the three months ended June 30, 2015 compared with the 2014 period due primarily to higher tree trimming costs ($3 million), an increase in surcharges for assessments and fees that are collected in revenues from customers ($2 million) and increase in storm costs ($2 million).
Depreciation and amortization increased $2 million in the three months ended June 30, 2015 compared with the 2014 period due primarily to higher electric utility plant balances.
Taxes, other than income taxes increased $1 million in the three months ended June 30, 2015 compared with the 2014 period principally due to higher state and local revenue taxes.
Gas
O&R’s results of gas operations for the three months ended June 30, 2015 compared with the 2014 period is as follows:
Three Months Ended | ||||
(Millions of Dollars) | June 30, 2015 | June 30, 2014 | Variation | |
Operating revenues | $16 | $35 | $(19) | |
Gas purchased for resale | 9 | 15 | (6) | |
Other operations and maintenance | 17 | 17 | — | |
Depreciation and amortization | 4 | 4 | — | |
Taxes, other than income taxes | 4 | 4 | — | |
Gas operating income | $(18) | $(5) | $(13) | |
49
O&R’s gas sales and deliveries, excluding off-system sales, for the three months ended June 30, 2015 compared with the 2014 period were:
Thousands of Dt Delivered | Revenues in Millions (a) | ||||||||||||||||
Three Months Ended | Three Months Ended | ||||||||||||||||
Description | June 30, 2015 | June 30, 2014 | Variation | Percent Variation | June 30, 2015 | June 30, 2014 | Variation | Percent Variation | |||||||||
Residential | 929 | 991 | (62 | ) | (6.3 | )% | $12 | $16 | $(4) | (25.0 | )% | ||||||
General | 207 | 205 | 2 | 1.0 | 2 | 3 | (1) | (33.3 | ) | ||||||||
Firm transportation | 1,668 | 1,774 | (106 | ) | (6.0 | ) | 12 | 13 | (1) | (7.7 | ) | ||||||
Total firm sales and transportation | 2,804 | 2,970 | (166 | ) | (5.6 | ) | (b) | 26 | 32 | (6) | (18.8 | ) | |||||
Interruptible sales | 1,048 | 1,064 | (16 | ) | (1.5 | ) | 1 | — | 1 | Large | |||||||
Generation plants | 1 | 22 | (21 | ) | (95.5 | ) | — | — | — | — | |||||||
Other | 119 | 131 | (12 | ) | (9.2 | ) | — | — | — | — | |||||||
Other gas revenues | — | — | — | — | (11) | 3 | (14) | Large | |||||||||
Total | 3,972 | 4,187 | (215 | ) | (5.1 | )% | $16 | $35 | $(19) | (54.3 | )% | ||||||
(a) | Revenues from New York gas sales are subject to a weather normalization clause and a revenue decoupling mechanism as a result of which delivery revenues are generally not affected by changes in delivery volumes from levels assumed when rates were approved. Delivery revenues, however, are affected by changes in volumes attributable to changes in the average number of customers. |
(b) | After adjusting for weather and other variations, total firm sales and transportation volumes increased 3.5 percent in three months ended June 30, 2015 compared with the 2014 period. |
Operating revenues decreased $19 million in the three months ended June 30, 2015 compared with the 2014 period due primarily to the charge-off of certain regulatory assets ($14 million) and a decrease in gas purchased for resale ($6 million). See “Rate Plans - O&R New York - Electric and Gas” in Note B to the Second Quarter Financial Statements.
Gas purchased for resale decreased $6 million in the three months ended June 30, 2015 compared with the 2014 period due to a decrease in purchased volumes ($17 million), offset by an increase in unit costs ($11 million).
Income Tax Expense
Income taxes decreased $10 million in the three months ended June 30, 2015 compared with the 2014 period due primarily to lower income before income tax expense.
Competitive Energy Businesses
The competitive energy businesses’ results of operations for the three months ended June 30, 2015 compared with the 2014 period is as follows:
Three Months Ended | |||||
(Millions of Dollars) | June 30, 2015 | June 30, 2014 | Variation | ||
Operating revenues | $328 | $284 | $44 | ||
Purchased power | 248 | 214 | 34 | ||
Gas purchased for resale | 26 | 32 | (6) | ||
Other operations and maintenance | 31 | 27 | 4 | ||
Depreciation and amortization | 6 | 4 | 2 | ||
Taxes, other than income taxes | 4 | 4 | — | ||
(Gain) on sale of solar electric production projects | — | (45) | 45 | ||
Operating income | $13 | $48 | $(35) | ||
Operating revenues increased $44 million in the three months ended June 30, 2015 compared with the 2014 period, due primarily to higher electric retail revenues. Electric retail revenues increased $52 million due to higher sales volume ($45 million) and higher unit prices ($7 million). Wholesale revenues decreased $12 million due to lower sales volumes. Solar revenues decreased $1 million primarily due to Con Edison Development’s May 2014 sale of 50 percent of its membership interest in CED California Holdings Financing I, LLC (California Solar). Net mark-to-market values decreased $11 million, of which $12 million in losses are reflected in purchased power
50
expenses and $1 million in gains are reflected in revenues. Other revenues increased $4 million due primarily to higher energy services revenues.
Purchased power expenses increased $34 million in the three months ended June 30, 2015 compared with the 2014 period due primarily to higher volumes ($35 million) and changes in mark-to-market losses ($12 million), offset by lower unit prices ($13 million).
Gas purchased for resale decreased $6 million in the three months ended June 30, 2015 compared with the 2014 period due primarily to lower volumes.
Other operations and maintenance expenses increased $4 million in the three months ended June 30, 2015 compared with the 2014 period due primarily to an increase in solar electric production projects in operation during 2015.
Depreciation and amortization increased $2 million in the three months ended June 30, 2015 compared with the 2014 period due an increase in solar electric production projects in operation during 2015.
Gain on sale of solar electric production projects decreased $45 million reflecting Con Edison Development's May 2014 sale of 50 percent of its membership interest in California Solar.
Income Tax Expense
Income taxes decreased $17 million in the three months ended June 30, 2015 compared with the 2014 period due primarily to lower income before income tax expense and higher production tax credits and amortization of investment tax credits ($3 million).
Other
For Con Edison, “Other” includes parent company and consolidation adjustments.
51
Six Months Ended June 30, 2015 Compared with Six Months Ended June 30, 2014
The Companies’ results of operations in 2015 compared with 2014 were:
CECONY | O&R | Competitive Energy Businesses | Other (a) | Con Edison (b) | |||||||||||||||||
(Millions of Dollars) | Increases (Decreases) Amount | Increases (Decreases) Percent | Increases (Decreases) Amount | Increases (Decreases) Percent | Increases (Decreases) Amount | Increases (Decreases) Percent | Increases (Decreases) Amount | Increases (Decreases) Percent | Increases (Decreases) Amount | Increases (Decreases) Percent | |||||||||||
Operating revenues | $(349) | (6.2 | )% | $(37) | (8.3 | )% | $90 | 14.7 | % | $— | — | $(296) | (4.4 | )% | |||||||
Purchased power | (238) | (21.0 | ) | (15) | (12.5 | ) | 51 | 10.4 | — | — | (202) | (11.6 | ) | ||||||||
Fuel | (4) | (2.1 | ) | — | — | — | — | — | — | (4) | (2.1 | ) | |||||||||
Gas purchased for resale | (199) | (44.1 | ) | (24) | (43.6 | ) | 22 | 47.8 | 1 | Large | (200) | (36.3 | ) | ||||||||
Other operations and maintenance | (34) | (2.4 | ) | 13 | 8.4 | 11 | 22.0 | (1) | Large | (11) | (0.7 | ) | |||||||||
Depreciation and amortization | 25 | 5.1 | 5 | 17.2 | — | — | (1) | — | 29 | 5.5 | |||||||||||
Taxes, other than income taxes | (12) | (1.3 | ) | — | — | 1 | 11.1 | — | — | (11) | (1.1 | ) | |||||||||
Gain on sale of solar electric production projects | — | — | — | — | (45) | — | — | — | (45) | — | |||||||||||
Operating income | 113 | 11.0 | (16) | (27.1 | ) | (40) | (80.0 | ) | 1 | Large | 58 | 5.1 | |||||||||
Other income less deductions | (3) | Large | (2) | (66.7 | ) | 2 | 15.4 | (3) | Large | (6) | (30.0 | ) | |||||||||
Net interest expense | 26 | 9.8 | 1 | 5.9 | 12 | Large | (2) | (14.3 | )% | 37 | 12.9 | ||||||||||
Income before income tax expense | 84 | 10.9 | (19) | (42.2 | ) | (50) | (69.4 | ) | — | — | 15 | 1.7 | |||||||||
Income tax expense | 31 | 11.8 | (6) | (37.5 | ) | (27) | (90.0 | ) | 2 | 25.0 | — | — | |||||||||
Net income for common stock | $53 | 10.5 | % | $(13) | (44.8 | )% | $(23) | (54.8 | )% | $(2) | (66.7 | )% | $15 | 2.6 | % | ||||||
(a) | Includes parent company and consolidation adjustments. |
(b) | Represents the consolidated financial results of Con Edison and its businesses. |
52
CECONY
Six Months Ended June 30, 2015 | Six Months Ended June 30, 2014 | ||||||||||||||
(Millions of Dollars) | Electric | Gas | Steam | 2015 Total | Electric | Gas | Steam | 2014 Total | 2015-2014 Variation | ||||||
Operating revenues | $3,858 | $963 | $471 | $5,292 | $4,053 | $1,149 | $439 | $5,641 | $(349) | ||||||
Purchased power | 876 | — | 21 | 897 | 1,103 | — | 32 | 1,135 | (238) | ||||||
Fuel | 72 | — | 113 | 185 | 112 | — | 77 | 189 | (4) | ||||||
Gas purchased for resale | — | 252 | — | 252 | — | 451 | — | 451 | (199) | ||||||
Other operations and maintenance | 1,079 | 217 | 94 | 1,390 | 1,116 | 211 | 97 | 1,424 | (34) | ||||||
Depreciation and amortization | 403 | 70 | 38 | 511 | 383 | 64 | 39 | 486 | 25 | ||||||
Taxes, other than income taxes | 728 | 130 | 56 | 914 | 734 | 136 | 56 | 926 | (12) | ||||||
Operating income | $700 | $294 | $149 | $1,143 | $605 | $287 | $138 | $1,030 | $113 | ||||||
Electric
CECONY’s results of electric operations for the six months ended June 30, 2015 compared with the 2014 period is as follows:
Six Months Ended | |||
(Millions of Dollars) | June 30, 2015 | June 30, 2014 | Variation |
Operating revenues | $3,858 | $4,053 | $(195) |
Purchased power | 876 | 1,103 | (227) |
Fuel | 72 | 112 | (40) |
Other operations and maintenance | 1,079 | 1,116 | (37) |
Depreciation and amortization | 403 | 383 | 20 |
Taxes, other than income taxes | 728 | 734 | (6) |
Electric operating income | $700 | $605 | $95 |
CECONY’s electric sales and deliveries for the six months ended June 30, 2015 compared with the 2014 period were:
Millions of kWhs Delivered | Revenues in Millions (a) | |||||||||||||
Six Months Ended | Six Months Ended | |||||||||||||
Description | June 30, 2015 | June 30, 2014 | Variation | Percent Variation | June 30, 2015 | June 30, 2014 | Variation | Percent Variation | ||||||
Residential/Religious (b) | 4,671 | 4,507 | 164 | 3.6 | % | $1,295 | $1,382 | $(87) | (6.3 | )% | ||||
Commercial/Industrial | 4,683 | 4,746 | (63 | ) | (1.3 | ) | 975 | 1,090 | (115) | (10.6 | ) | |||
Energy choice customers | 12,516 | 12,535 | (19 | ) | (0.2 | ) | 1,214 | 1,122 | 92 | 8.2 | ||||
NYPA, Municipal Agency and other sales | 4,957 | 5,036 | (79 | ) | (1.6 | ) | 269 | 287 | (18) | (6.3 | ) | |||
Other operating revenues (c) | — | — | — | — | 105 | 172 | (67) | (39.0 | ) | |||||
Total | 26,827 | 26,824 | 3 | — | % | (d) | $3,858 | $4,053 | $(195) | (4.8 | )% | |||
(a) | Revenues from electric sales are subject to a revenue decoupling mechanism, as a result of which delivery revenues generally are not affected by changes in delivery volumes from levels assumed when rates were approved. |
(b) | “Residential/Religious” generally includes single-family dwellings, individual apartments in multi-family dwellings, religious organizations and certain other not-for-profit organizations. |
(c) | Other electric operating revenues generally reflect changes in regulatory assets and liabilities in accordance with the revenue decoupling mechanism and other provisions of the company’s rate plans. |
(d) | After adjusting for variations, principally weather and billing days, electric delivery volumes in CECONY’s service area decreased 0.8 percent in six months ended June 30, 2015 compared with the 2014 period. |
53
Operating revenues decreased $195 million in the six months ended June 30, 2015 compared with the 2014 period due primarily to lower purchased power ($227 million) and fuel expenses ($40 million), offset in part by higher revenues from the electric rate plan ($77 million).
Purchased power expenses decreased $227 million in the six months ended June 30, 2015 compared with the 2014 period due to a decrease in unit costs ($230 million), offset by higher purchased volumes ($3 million).
Fuel expenses decreased $40 million in the six months ended June 30, 2015 compared with the 2014 period due to lower unit costs ($36 million) and lower sendout volumes from the company’s electric generating facilities ($4 million).
Other operations and maintenance expenses decreased $37 million in the six months ended June 30, 2015 compared with the 2014 period due primarily to lower pension costs ($43 million), lower electric operating costs ($39 million), offset in part by an increase in the surcharges for assessments and fees that are collected in revenues from customers ($43 million).
Depreciation and amortization increased $20 million in the six months ended June 30, 2015 compared with the 2014 period due primarily to higher electric utility plant balances.
Taxes, other than income taxes decreased $6 million in the six months ended June 30, 2015 compared with the 2014 period principally due to the elimination of the New York City subsidiary capital tax ($3 million) and lower property taxes ($3 million).
Gas
CECONY’s results of gas operations for the six months ended June 30, 2015 compared with the 2014 period is as follows:
Six Months Ended | |||
(Millions of Dollars) | June 30, 2015 | June 30, 2014 | Variation |
Operating revenues | $963 | $1,149 | $(186) |
Gas purchased for resale | 252 | 451 | (199) |
Other operations and maintenance | 217 | 211 | 6 |
Depreciation and amortization | 70 | 64 | 6 |
Taxes, other than income taxes | 130 | 136 | (6) |
Gas operating income | $294 | $287 | $7 |
CECONY’s gas sales and deliveries, excluding off-system sales, for the six months ended June 30, 2015 compared with the 2014 period were:
Thousands of Dt Delivered | Revenues in Millions (a) | ||||||||||||||
Six Months Ended | Six Months Ended | ||||||||||||||
Description | June 30, 2015 | June 30, 2014 | Variation | Percent Variation | June 30, 2015 | June 30, 2014 | Variation | Percent Variation | |||||||
Residential | 34,762 | 31,805 | 2,957 | 9.3 | % | $449 | $528 | $(79) | (15.0 | )% | |||||
General | 19,545 | 18,624 | 921 | 4.9 | 181 | 241 | (60) | (24.9 | ) | ||||||
Firm transportation | 49,393 | 43,391 | 6,002 | 13.8 | 284 | 279 | 5 | 1.8 | |||||||
Total firm sales and transportation | 103,700 | 93,820 | 9,880 | 10.5 | (b) | 914 | 1,048 | (134) | (12.8 | ) | |||||
Interruptible sales (c) | 4,161 | 8,660 | (4,499 | ) | (52.0 | ) | 39 | 93 | (54) | (58.1 | ) | ||||
NYPA | 19,802 | 24,869 | (5,067 | ) | (20.4 | ) | 1 | 1 | — | — | |||||
Generation plants | 32,040 | 31,654 | 386 | 1.2 | 13 | 15 | (2) | (13.3 | ) | ||||||
Other | 11,773 | 13,740 | (1,967 | ) | (14.3 | ) | 15 | 25 | (10) | (40.0 | ) | ||||
Other operating revenues (d) | — | — | — | — | (19) | (33) | 14 | 42.4 | |||||||
Total | 171,476 | 172,743 | (1,267 | ) | (0.7 | )% | $963 | $1,149 | $(186) | (16.2 | )% | ||||
54
(a) | Revenues from gas sales are subject to a weather normalization clause and a revenue decoupling mechanism as a result of which delivery revenues are generally not affected by changes in delivery volumes from levels assumed when rates were approved. Delivery revenues, however, are affected by changes in volumes attributable to changes in the average number of customers. |
(b) | After adjusting for variations, principally weather and billing days, firm gas sales and transportation volumes in the company’s service area increased 8.4 percent in the six months ended June 30, 2015 compared with the 2014 period reflecting primarily increased volumes attributable to additional customers that have converted from oil-to-gas as heating fuel for their buildings. |
(c) | Includes 1,043 and 5,668 thousands of Dt for 2015 and 2014 periods, respectively, which are also reflected in firm transportation and other. |
(d) | Other gas operating revenues generally reflect changes in regulatory assets and liabilities in accordance with the company’s rate plans. |
Operating revenues decreased $186 million in the six months ended June 30, 2015 compared with the 2014 period due primarily to a decrease in gas purchased for resale expenses ($199 million), offset in part by higher revenues from the gas rate plan ($20 million) reflecting primarily higher delivery volumes attributable to oil-to-gas conversions.
Gas purchased for resale decreased $199 million in the six months ended June 30, 2015 compared with the 2014 period due to lower unit costs ($218 million), offset by higher sendout volumes ($19 million).
Other operations and maintenance expenses increased $6 million due primarily to higher operating costs attributable to emergency response ($23 million), offset in part by lower pension costs ($6 million), lower costs for the support and protection of company underground facilities to accommodate New York City municipal projects ($5 million) and a decrease in surcharges for assessments and fees that are collected in revenues from customers ($1 million).
Depreciation and amortization increased $6 million in the six months ended June 30, 2015 compared with the 2014 period due primarily to higher gas utility plant balances.
Taxes, other than income taxes decreased $6 million in the six months ended June 30, 2015 compared with the 2014 period principally due to lower state and local revenue taxes ($5 million) and lower property taxes ($1 million).
Steam
CECONY’s results of steam operations for the six months ended June 30, 2015 compared with the 2014 period is as follows:
Six Months Ended | ||||
(Millions of Dollars) | June 30, 2015 | June 30, 2014 | Variation | |
Operating revenues | $471 | $439 | $32 | |
Purchased power | 21 | 32 | (11) | |
Fuel | 113 | 77 | 36 | |
Other operations and maintenance | 94 | 97 | (3) | |
Depreciation and amortization | 38 | 39 | (1) | |
Taxes, other than income taxes | 56 | 56 | — | |
Steam operating income | $149 | $138 | $11 | |
CECONY’s steam sales and deliveries for the six months ended June 30, 2015 compared with the 2014 period were:
Millions of Pounds Delivered | Revenues in Millions | |||||||||||||||
Six Months Ended | Six Months Ended | |||||||||||||||
Description | June 30, 2015 | June 30, 2014 | Variation | Percent Variation | June 30, 2015 | June 30, 2014 | Variation | Percent Variation | ||||||||
General | 441 | 456 | (15 | ) | (3.3 | )% | $22 | $22 | $— | — | ||||||
Apartment house | 4,240 | 4,111 | 129 | 3.1 | 130 | 119 | 11 | 9.2 | % | |||||||
Annual power | 9,632 | 9,772 | (140 | ) | (1.4 | ) | 333 | 319 | 14 | 4.4 | ||||||
Other operating revenues (a) | — | — | — | — | (14) | (21) | 7 | 33.3 | ||||||||
Total | 14,313 | 14,339 | (26 | ) | (0.2 | )% | (b) | $471 | $439 | $32 | 7.3 | % | ||||
(a) | Other steam operating revenues generally reflect changes in regulatory assets and liabilities in accordance with the company’s rate plans. |
(b) | After adjusting for variations, principally weather and billing days, steam sales and deliveries decreased 3.0 percent in six months ended June 30, 2015 compared with the 2014 period. |
55
Operating revenues increased $32 million in the six months ended June 30, 2015 compared with the 2014 period due primarily to higher fuel expenses ($36 million) and the weather impact on revenues ($7 million), offset in part by lower purchased power costs ($11 million).
Purchased power expenses decreased $11 million in the six months ended June 30, 2015 compared with the 2014 period due to a decrease in unit costs ($10 million) and lower purchased volumes ($1 million).
Fuel expenses increased $36 million in the six months ended June 30, 2015 compared with the 2014 period due to higher unit costs ($34 million) and higher sendout volumes ($2 million).
Other operations and maintenance expenses decreased $3 million in the six months ended June 30, 2015 compared with the 2014 period due primarily to lower costs for the support and protection of company underground facilities to accommodate New York City municipal projects.
Depreciation and amortization decreased $1 million in the six months ended June 30, 2015 compared with the 2014 period.
Other Income (Deductions)
Other income (deductions) decreased $3 million in the six months ended June 30, 2015 compared with the 2014 period due primarily to the gain on sale of certain non-utility property in 2014.
Net Interest Expense
Net interest expense increased $26 million in the six months ended June 30, 2015 compared with the 2014 period due primarily to new debt issuances in late 2014.
Income Tax Expense
Income taxes increased $31 million in the six months ended June 30, 2015 compared with the 2014 period due primarily to higher income before income tax expense.
O&R
Six Months Ended June 30, 2015 | Six Months Ended June 30, 2014 | |||||||||||
(Millions of Dollars) | Electric | Gas | 2015 Total | Electric | Gas | 2014 Total | 2015-2014 Variation | |||||
Operating revenues | $318 | $93 | $411 | $320 | $128 | $448 | $(37) | |||||
Purchased power | 105 | — | 105 | 120 | — | 120 | (15) | |||||
Gas purchased for resale | — | 31 | 31 | — | 55 | 55 | (24) | |||||
Other operations and maintenance | 132 | 35 | 167 | 120 | 34 | 154 | 13 | |||||
Depreciation and amortization | 25 | 9 | 34 | 21 | 8 | 29 | 5 | |||||
Taxes, other than income taxes | 22 | 9 | 31 | 22 | 9 | 31 | — | |||||
Operating income | $34 | $9 | $43 | $37 | $22 | $59 | $(16) | |||||
Electric
O&R’s results of electric operations for the six months ended June 30, 2015 compared with the 2014 period is as follows:
Six Months Ended | ||||
(Millions of Dollars) | June 30, 2015 | June 30, 2014 | Variation | |
Operating revenues | $318 | $320 | $(2) | |
Purchased power | 105 | 120 | (15) | |
Other operations and maintenance | 132 | 120 | 12 | |
Depreciation and amortization | 25 | 21 | 4 | |
Taxes, other than income taxes | 22 | 22 | — | |
Electric operating income | $34 | $37 | $(3) | |
56
O&R’s electric sales and deliveries for the six months ended June 30, 2015 compared with the 2014 period were:
Millions of kWhs Delivered | Revenues in Millions (a) | |||||||||||||
Six Months Ended | Six Months Ended | |||||||||||||
Description | June 30, 2015 | June 30, 2014 | Variation | Percent Variation | June 30, 2015 | June 30, 2014 | Variation | Percent Variation | ||||||
Residential/Religious (b) | 745 | 704 | 41 | 5.8 | % | $147 | $139 | $8 | 5.8 | % | ||||
Commercial/Industrial | 391 | 409 | (18 | ) | (4.4 | ) | 63 | 70 | (7) | (10.0 | ) | |||
Energy choice customers | 1,578 | 1,579 | (1 | ) | (0.1 | ) | 99 | 92 | 7 | 7.6 | ||||
Public authorities | 50 | 49 | 1 | 2.0 | 5 | 7 | (2) | (28.6 | ) | |||||
Other operating revenues (c) | — | — | — | — | 4 | 12 | (8) | (66.7 | ) | |||||
Total | 2,764 | 2,741 | 23 | 0.8 | % | (d) | $318 | $320 | $(2) | (0.6 | )% | |||
(a) | O&R’s New York electric delivery revenues are subject to a revenue decoupling mechanism, as a result of which delivery revenues are generally not affected by changes in delivery volumes from levels assumed when rates were approved. O&R’s electric sales in New Jersey and Pennsylvania are not subject to a decoupling mechanism, and as a result, changes in such volumes do impact revenues. |
(b) | “Residential/Religious” generally includes single-family dwellings, individual apartments in multi-family dwellings, religious organizations and certain other not-for-profit organizations. |
(c) | Other electric operating revenues generally reflect changes in regulatory assets and liabilities in accordance with the company’s electric rate plan. |
(d) | After adjusting for weather and other variations, electric delivery volumes in O&R’s service area decreased 0.7 percent in the six months ended June 30, 2015 compared with the 2014 period. |
Operating revenues decreased $2 million in the six months ended June 30, 2015 compared with the 2014 period due primarily to lower purchased power expenses ($15 million) and the charge-off of certain regulatory assets ($4 million), offset in part by higher revenues from the New York electric rate plan ($15 million). See “Rate Plans - O&R New York - Electric and Gas” in Note B to the Second Quarter Financial Statements.
Purchased power expenses decreased $15 million in the six months ended June 30, 2015 compared with the 2014 period due to a decrease in unit costs ($14 million) and a decrease in purchased volumes ($1 million).
Other operations and maintenance expenses increased $12 million in the six months ended June 30, 2015 compared with the 2014 period due primarily to higher tree trimming costs ($4 million), an increase in surcharges for assessments and fees that are collected in revenues from customers ($3 million) and increase in storm costs ($2 million).
Depreciation and amortization increased $4 million in the six months ended June 30, 2015 compared with the 2014 period due primarily to higher electric utility plant balances.
Gas
O&R’s results of gas operations for the six months ended June 30, 2015 compared with the 2014 period is as follows:
Six Months Ended | ||||
(Millions of Dollars) | June 30, 2015 | June 30, 2014 | Variation | |
Operating revenues | $93 | $128 | $(35) | |
Gas purchased for resale | 31 | 55 | (24) | |
Other operations and maintenance | 35 | 34 | 1 | |
Depreciation and amortization | 9 | 8 | 1 | |
Taxes, other than income taxes | 9 | 9 | — | |
Gas operating income | $9 | $22 | $(13) | |
57
O&R’s gas sales and deliveries, excluding off-system sales, for the six months ended June 30, 2015 compared with the 2014 period were:
Thousands of Dt Delivered | Revenues in Millions (a) | ||||||||||||||||
Six Months Ended | Six Months Ended | ||||||||||||||||
Description | June 30, 2015 | June 30, 2014 | Variation | Percent Variation | June 30, 2015 | June 30, 2014 | Variation | Percent Variation | |||||||||
Residential | 5,308 | 5,012 | 296 | 5.9 | % | $48 | $65 | $(17) | (26.2 | )% | |||||||
General | 1,174 | 1,113 | 61 | 5.5 | 9 | 13 | (4) | (30.8 | ) | ||||||||
Firm transportation | 8,032 | 7,938 | 94 | 1.2 | 43 | 46 | (3) | (6.5 | ) | ||||||||
Total firm sales and transportation | 14,514 | 14,063 | 451 | 3.2 | (b) | 100 | 124 | (24) | (19.4 | ) | |||||||
Interruptible sales | 2,300 | 2,347 | (47 | ) | (2.0 | ) | 2 | 1 | 1 | Large | |||||||
Generation plants | 15 | 37 | (22 | ) | (59.5 | ) | — | — | — | — | |||||||
Other | 605 | 588 | 17 | 2.9 | — | — | — | — | |||||||||
Other gas revenues | — | — | — | — | (9) | 3 | (12) | Large | |||||||||
Total | 17,434 | 17,035 | 399 | 2.3 | % | $93 | $128 | $(35) | (27.3 | )% | |||||||
(a) | Revenues from New York gas sales are subject to a weather normalization clause and a revenue decoupling mechanism as a result of which delivery revenues are generally not affected by changes in delivery volumes from levels assumed when rates were approved. Delivery revenues, however, are affected by changes in volumes attributable to changes in the average number of customers. |
(b) | After adjusting for weather and other variations, total firm sales and transportation volumes increased 0.3 percent in six months ended June 30, 2015 compared with the 2014 period. |
Operating revenues decreased $35 million in the six months ended June 30, 2015 compared with the 2014 period due primarily to the decrease in gas purchased for resale expenses ($24 million) and the charge-off of certain regulatory assets ($14 million). See “Rate Plans - O&R New York - Electric and Gas” in Note B to the Second Quarter Financial Statements.
Gas purchased for resale decreased $24 million in the six months ended June 30, 2015 compared with the 2014 period due to a decrease in unit costs ($13 million) and a decrease in purchased volumes ($11 million).
Other operations and maintenance expenses increased $1 million in the six months ended June 30, 2015 compared with the 2014 period due primarily to an increase in surcharges for assessments and fees that are collected in revenues from customers.
Depreciation and amortization increased $1 million in the six months ended June 30, 2015 compared with the 2014 period due primarily to higher gas utility plant balances.
Income Tax Expense
Income taxes decreased $6 million in the six months ended June 30, 2015 compared with the 2014 period due primarily to lower income before income tax expense, offset in part by higher amortization of New York State’s Metropolitan Transportation Authority business tax ($1 million).
Competitive Energy Businesses
The competitive energy businesses’ results of operations for the six months ended June 30, 2015 compared with the 2014 period is as follows:
Six Months Ended | |||||
(Millions of Dollars) | June 30, 2015 | June 30, 2014 | Variation | ||
Operating revenues | $702 | $612 | $90 | ||
Purchased power | 542 | 491 | 51 | ||
Gas purchased for resale | 68 | 46 | 22 | ||
Other operations and maintenance | 61 | 50 | 11 | ||
Depreciation and amortization | 11 | 11 | — | ||
Taxes, other than income taxes | 10 | 9 | 1 | ||
(Gain) on sale of solar electric production projects | — | (45) | 45 | ||
Operating income | $10 | $50 | $(40) | ||
58
Operating revenues increased $90 million in the six months ended June 30, 2015 compared with the 2014 period, due primarily to higher electric retail revenues. Electric retail revenues increased $82 million due to higher sales volumes ($83 million), offset by lower unit prices ($1 million). Wholesale revenues decreased $3 million due to lower sales volume. Solar revenues decreased $2 million primarily due to Con Edison Development’s May 2014 sale of 50 percent of its membership interest in California Solar. Net mark-to-market values decreased $23 million, of which $21 million in losses are reflected in purchased power expenses and $2 million in losses are reflected in revenues. Other revenues increased $15 million due primarily to higher energy services revenues.
Purchased power expenses increased $51 million in the six months ended June 30, 2015 compared with the 2014 period due primarily to higher volumes ($70 million) and changes in mark-to-market losses ($21 million), offset by lower unit prices ($40 million).
Gas purchased for resale increased $22 million in the six months ended June 30, 2015 compared with the 2014 period due primarily to higher volumes.
Other operations and maintenance expenses increased $11 million in the six months ended June 30, 2015 compared with the 2014 period due primarily to an increase in solar electric production projects in operation during 2015 and higher health benefit costs.
Taxes, other than income taxes increased $1 million in the six months ended June 30, 2015 compared with the 2014 period principally due to higher property taxes on its renewable electric production investments.
Gain on sale of solar electric production projects decreased $45 million reflecting Con Edison Development's May 2014 sale of 50 percent of its membership interest in California Solar.
Net Interest Expense
Net interest expense increased $12 million in the six months ended June 30, 2015 compared to the 2014 period due primarily to adjustments to accrued interest on taxes relating to the LILO transactions which were terminated in 2013.
Income Tax Expense
Income taxes decreased $27 million in the six months ended June 30, 2015 compared with the 2014 period due primarily to lower income before income tax expense and higher production tax credits and amortization of investment tax credits ($5 million).
Other
For Con Edison, “Other” includes parent company and consolidation adjustments.
Liquidity and Capital Resources
The Companies’ liquidity reflects cash flows from operating, investing and financing activities, as shown on their respective consolidated statement of cash flows and as discussed below.
Changes in the Companies’ cash and temporary cash investments resulting from operating, investing and financing activities for the six months ended June 30, 2015 and 2014 are summarized as follows:
Con Edison | CECONY | |||||
(Millions of Dollars) | 2015 | 2014 | Variance | 2015 | 2014 | Variance |
Operating activities | $1,486 | $1,257 | $229 | $1,202 | $882 | $320 |
Investing activities | (1,725) | (1,233) | (492) | (1,209) | (1,104) | (105) |
Financing activities | 249 | 76 | 173 | 28 | 285 | (257) |
Net change | 10 | 100 | (90) | 21 | 63 | (42) |
Balance at beginning of period | 699 | 674 | 25 | 645 | 633 | 12 |
Balance at end of period | $709 | $774 | $(65) | $666 | $696 | $(30) |
59
Cash Flows from Operating Activities
The Utilities’ cash flows from operating activities reflect principally their energy sales and deliveries and cost of operations. The volume of energy sales and deliveries is affected primarily by factors external to the Utilities, such as growth of customer demand, weather, market prices for energy, economic conditions and measures that promote energy efficiency. Under the revenue decoupling mechanisms in the Utilities’ New York electric and gas rate plans, changes in delivery volumes from levels assumed when rates were approved may affect the timing of cash flows but generally not net income. The prices at which the Utilities provide energy to their customers are determined in accordance with their rate plans. In general, changes in the Utilities’ cost of purchased power, fuel and gas may affect the timing of cash flows but not net income because the costs are recovered in accordance with rate plans.
Net income is the result of cash and non-cash (or accrual) transactions. Only cash transactions affect the Companies’ cash flows from operating activities. Principal non-cash charges or credits include depreciation, deferred income tax expense and amortizations of certain regulatory assets and liabilities. Non-cash charges or credits may also be accrued under the revenue decoupling and cost reconciliation mechanisms in the Utilities’ New York electric and gas rate plans.
Net cash flows from operating activities for the six months ended June 30, 2015 for Con Edison and CECONY were $229 million and $320 million higher, respectively, than in 2014. The increase in net cash flows for Con Edison reflects primarily the lower income taxes paid, net of refunds received in 2015 ($527 million) and special deposits applied against accrued taxes in 2014 related to the LILO transactions ($308 million). For CECONY, the increase in net cash flows reflects primarily the lower income taxes paid, net of refunds received in 2015.
The change in net cash flows also reflects the timing of payments for and recovery of energy costs. This timing is reflected within changes to accounts receivable – customers, recoverable energy costs and accounts payable balances.
Cash Flows Used in Investing Activities
Net cash flows used in investing activities for Con Edison and CECONY were $492 million and $105 million higher, respectively, for the six months ended June 30, 2015 compared with the 2014 period. The changes for Con Edison and CECONY reflect increased utility construction expenditures in 2015. In addition, the change for Con Edison reflects primarily the increased investments in/acquisitions of renewable electric production projects ($145 million), the proceeds from sale of solar electric production projects in 2014 ($108 million) and increased non-utility construction expenditures related to solar electric production projects ($65 million).
Cash Flows From Financing Activities
Net cash flows from financing activities for Con Edison and CECONY were $173 million higher and $257 million lower, respectively, in the six months ended June 30, 2015 compared with the 2014 period.
In June 2015, O&R issued $120 million of 4.95 percent 30-year debentures, the net proceeds from the sale of which were used to repay short-term borrowings and for other general corporate purposes. In April 2015, O&R redeemed at maturity $40 million of 5.30 percent 10-year debentures.
In June 2015, a Con Edison Development subsidiary issued $118 million aggregate principal amount of 3.94 percent Senior Notes maturing in 2036.
In March 2014, CECONY issued $850 million of 4.45 percent 30-year debentures, the net proceeds from the sale of which were used to repay short-term borrowings and for other general corporate purposes. In February 2014, CECONY redeemed at maturity $200 million of 4.70 percent 10-year debentures. In April 2014, CECONY redeemed at maturity $275 million of 5.55 percent 5-year debentures.
Cash flows from financing activities of the Companies also reflect commercial paper issuance. The commercial paper amounts outstanding at June 30, 2015 and 2014 and the average daily balances for the six months ended June 30, 2015 and 2014 for Con Edison and CECONY were as follows:
60
2015 | 2014 | |||
(Millions of Dollars, except Weighted Average Yield) | Outstanding at June 30, | Daily average | Outstanding at June 30, | Daily average |
Con Edison | $1,245 | $536 | $1,531 | $800 |
CECONY | $995 | $183 | $1,482 | $682 |
Weighted average yield | 0.4% | 0.4% | 0.2% | 0.2% |
Capital Requirements and Resources
Con Edison has increased its estimates of capital expenditures by its competitive energy businesses from $375 million to $835 million for 2015 and from $366 million to $985 million for 2016 to reflect additional renewable energy project development. See "Con Edison Development," below.
For each of the Companies, the ratio of earnings to fixed charges (Securities and Exchange Commission basis) for the six months ended June 30, 2015 and 2014 and the twelve months ended December 31, 2014 was:
Ratio of Earnings to Fixed Charges | ||||||
For the Six Months Ended June 30, 2015 | For the Six Months Ended June 30, 2014 | For the Twelve Months Ended December 31, 2014 | ||||
Con Edison (a) | 3.5 | 3.8 | 3.6 | |||
CECONY | 3.7 | 3.7 | 3.8 | |||
(a) | Reflects after-tax benefit/(charge) to earnings relating to Con Edison Development’s LILO transactions of $7 million and $(1) million for the six months ended June 30, 2014 and twelve months ended December 31, 2014, respectively. Also reflects an after-tax benefit to earnings relating to Con Edison Development's gain on sale of solar electric production projects of $26 million for the six months ended June 30, 2014 and twelve months ended December 31, 2014. |
For each of the Companies, the common equity ratio at June 30, 2015 and December 31, 2014 was:
Common Equity Ratio (Percent of total capitalization) | ||
June 30, 2015 | December 31, 2014 | |
Con Edison | 51.8 | 52.0 |
CECONY | 50.8 | 50.7 |
Other Changes in Assets and Liabilities
The following table shows changes in certain assets and liabilities at June 30, 2015, compared with December 31, 2014.
Con Edison | CECONY | |||
(Millions of Dollars) | 2015 vs. 2014 Variance | 2015 vs. 2014 Variance | ||
Assets | ||||
Assets held for sale | $167 | $— | ||
Regulatory asset — Unrecognized pension and other postretirement costs | (446) | (418) | ||
Income taxes receivable | (224) | — | ||
Liabilities | ||||
Deferred income taxes and investment tax credits | $332 | $259 | ||
Liabilities held for sale | 91 | — | ||
Pension and retiree benefits | (494) | (482) | ||
Assets Held for Sale and Liabilities Held for Sale
The increase in assets held for sale and liabilities held for sale reflects Con Edison's plan to actively market and sell the retail electric supply business of its competitive energy businesses. See Note O to the Second Quarter Financial Statements.
61
Regulatory Asset for Unrecognized Pension and Other Postretirement Costs and Liability for Pension and Retiree Benefits
The decrease in the regulatory asset for unrecognized pension and other postretirement costs and the liability for pension and retiree benefits reflects the final actuarial valuation of the pension and other retiree benefit plans as measured at December 31, 2014, in accordance with the accounting rules for retirement benefits. The change in the regulatory asset also reflects the year’s amortization of accounting costs. The change in the liability for pension and retiree benefits reflects in part contributions to the plans made by the Utilities in 2015. See Notes B, E and F to the Second Quarter Financial Statements.
Income Taxes Receivable
The decrease in income taxes receivable for Con Edison reflects the refund received in March 2015 from the Internal Revenue Service as a result of the extension of bonus depreciation in December 2014.
Deferred Income Taxes and Investment Tax Credits
The increase in the liability for deferred income taxes and investment tax credits reflects primarily the timing of the deduction of expenditures for utility plant which resulted in amounts being collected from customers to pay income taxes in advance of when the income tax payments will be required. For Con Edison, the increase also reflects the accelerated deductions for expenditures and investment tax credits primarily related to its renewable electric production projects.
Off-Balance Sheet Arrangements
None of the Companies’ interests in variable interest entities (VIEs) meet the SEC definition of off-balance sheet arrangements. For information regarding the Companies’ VIEs, see Note M to the Second Quarter Financial Statements.
Regulatory Matters
In February 2015, the NYSPSC issued an order in its Reforming the Energy Vision (REV) proceeding in which, among other things, the NYSPSC:
• | Ordered CECONY, O&R and the other electric utilities to file distributed system implementation plans pursuant to which the utilities, under the NYSPSC’s authority and supervision, would serve as distributed system platforms to optimize the use of distributed energy resources (DER); |
• | Indicated that the utilities will be allowed to own DER only under limited circumstances, and that utility affiliate ownership of DER within the utility’s service territory will require market power protections; |
• | Ordered the utilities to file energy efficiency plans with their program costs to be recovered through rates (instead of through the current surcharge); |
• | Instituted a separate track in the REV proceeding to consider large-scale renewable generation; and |
• | Indicated that the design and implementation of the reformed energy system will occur over a period of years. |
In June 2015, the New York State Energy Research and Development Authority (NYSERDA) submitted a report in the large-scale renewable generation track of the REV proceeding. The report included program design principles and strategies. The NYSPSC requested comments on, among other things: ratepayer funding mechanisms; utility-backed power purchase agreements; financing options; and utility-owned generation.
In July 2015, the NYSPSC staff submitted a white paper on ratemaking and utility business models in the REV proceeding. The NYSPSC staff indicated that the proposals included in the white paper reflect several foundational principles: align earning opportunities with customer value; maintain flexibility; provide accurate and appropriate value signals; maintain a sound electric industry; shift balance of regulatory incentives to market incentives; and achieve public policy objectives. The white paper, among other things, included proposals for: market based earnings opportunities, including distributed system platform revenues; adoption of earnings impact mechanisms to incent peak demand reduction, energy efficiency, customer engagement and information access, affordability and interconnection; retention of existing safety, reliability, customer service and utility-specific performance mechanisms; modifications to rate plan net utility plant reconciliations to encourage cost-effective use of operating resources and third-party investment; tying rate plan earnings sharing mechanisms to a performance index; pre-approval, where appropriate, of investments in distributed system platform capabilities; three-year rate plans, with an opportunity for two-year extensions; and rate design and DER compensation, including net energy metering,
62
standby service tariffs, study of demand charges and facilitation of time-of use rates. The NYSPSC has requested comments on the white paper.
In June 2015, the New York State Energy Planning Board released its 2015 State Energy Plan. Under New York State law, any energy-related action or decision of State agencies must be reasonably consistent with the Plan. The Plan reflects clean energy initiatives, including the REV proceeding, NYSERDA’s clean energy fund proposal (discussed below), and the following goals for New York State to meet by 2030: a 40 percent reduction in greenhouse gas emissions from 1990 levels; 50 percent of electric generation from renewable energy sources; and a 23 percent decrease in energy consumption in buildings from 2012 levels.
In June 2015, NYSERDA supplemented the clean energy fund proposal it submitted in September 2014 for NYSPSC approval. The proposal is for a 10-year, approximately $5 billion plan, to fund four programs beginning in 2016: market development; innovation and research; NY Green Bank and NY Sun. As proposed, the Utilities would bill clean energy fund surcharges to customers and would no longer bill customers for the energy efficiency portfolio standard, the renewable portfolio standard and system benefit surcharges.
For information about the extension of CECONY’s current electric rate plan through 2016, a Joint Proposal, which is subject to NYSPSC approval, for new O&R electric and gas rate plans and additional regulatory matters, see Note B to the Second Quarter Financial Statements.
Environmental Matters
In August 2015, the United States Environmental Protection Agency (EPA) issued its Clean Power Plan to reduce carbon dioxide emissions from existing power plants 32 percent from 2005 levels by 2030. Under the Clean Power Plan, each state is required to submit for EPA approval a plan to reduce its emissions to specified rate-based or equivalent mass-based target levels (as determined in accordance with the Clean Power Plan) applicable to the state. For New York State, the emissions rate-based target level for 2030 is approximately 20 percent below its 2012 emissions rate. State plans may, among other things, include participation in regional cap-and-trade programs, such as the Regional Greenhouse Gas Initiative (in which New York State participates), and renewable energy and energy efficiency programs. State plans are to be submitted to the EPA in 2016, with possible extensions to 2018, and are to be in effect not later than 2022. The costs resulting from the Clean Power Plan could be substantial.
63
Con Edison Development
The following table provides information about the renewable electric production projects Con Edison Development owned at June 30, 2015:
Project Name | Production Technology | Generating Capacity (a) (MWs AC) | PPA Term (In Years) | Actual/Expected In-Service Date | Location (State) | |
Wholly owned projects | ||||||
Flemington | Solar | 8 | n/a (b) | 2011 | New Jersey | |
Frenchtown I, II and III | Solar | 14 | n/a (b) | 2011-13 | New Jersey | |
PA Solar | Solar | 10 | n/a (b) | 2012 | Pennsylvania | |
Shrewsbury | Solar | 3 | 20 (b) | 2012 | Massachusetts | |
Groveland | Solar | 3 | 20 (b) | 2012 | Massachusetts | |
White River 2 | Solar | 20 | 20 | 2014 | California | |
Oak Tree Wind | Wind | 20 | 20 | 2014 | South Dakota | |
Texas Solar 3 | Solar | 5 | 25 | 2015 | Texas | |
Corcoran 2 | Solar | 20 | 20 | 2015 | California | |
Atwell West | Solar | 20 | 20 | 2015 | California | |
Projects of less than 3 MW | Solar | 14 | Various | Various | Various | |
Jointly owned projects | ||||||
Pilesgrove | Solar | 9 | n/a (b) | 2011 | New Jersey | |
California Solar | Solar | 55 | 25 | 2012-13 | California | |
Mesquite Solar 1 | Solar | 83 | 20 | 2013 | Arizona | |
Copper Mountain Solar 2 Phase 1 and 2 | Solar | 75 | 25 | 2013-15 | Nevada | |
Copper Mountain Solar 3 | Solar | 128 | 20 | 2014-15 | Nevada | |
Broken Bow II | Wind | 37 | 25 | 2014 | Nebraska | |
Texas Solar 4 | Solar | 32 | 25 | 2014 | Texas | |
Total MW in Operation | 556 | |||||
Alamo Solar 5 (c) | Solar | 95 | 25 | 2015 | Texas | |
Campbell County Wind (d) | Wind | 95 | 30 | 2015 | South Dakota | |
Corcoran 3 | Solar | 20 | 20 | 2015 | California | |
California Solar 3 (e) | Solar | 110 | 20 | 2016 | California | |
Total MW in Construction | 320 | |||||
Total MW | 876 | |||||
(a) | Represents Con Edison Development’s ownership interest in the project. |
(b) | New Jersey, Pennsylvania and Massachusetts assets have 3-5 year Solar Renewable Energy Credit hedges in place. |
(c) | In May 2015, Con Edison Development purchased a company that is the owner of a 95 MW (AC) solar electric production project in Uvalde, Texas (Alamo Solar 5). The total cost of the project is expected to be approximately $310 million. Electricity generated by the project is to be purchased by the City of San Antonio pursuant to a long-term power purchase agreement. |
(d) | In June 2015, Con Edison Development purchased a company that is the owner of a 95 MW (AC) wind electric production project in Campbell County, South Dakota (Campbell County Wind). The total cost of the project is expected to be approximately $180 million. Electricity generated by the project is to be purchased by the Basin Electric Power Cooperative pursuant to a long-term power purchase agreement. |
(e) | In January and February 2015, Con Edison Development purchased a company that is the owner of 110 MW (AC) of solar electric production projects in California (California Solar 3). The total cost of these projects is expected to be approximately $280 million. Electricity generated by these projects is to be purchased by Pacific Gas and Electric Company and Southern California Edison pursuant to long-term power purchase agreements. |
Con Edison Transmission
In April 2015, the Federal Energy Regulatory Commission (FERC) issued an order granting certain transmission incentives and setting the return on equity and the requested formula rate for hearing and settlement. FERC rejected the New York Transco LLC’s (NY Transco) proposed cost allocation and laid out alternative approaches to address cost allocation. FERC also said it did not need to provide authorization for the sale of projects to NY Transco because they are expected to be sold before assets are placed in service.
Financial and Commodity Market Risks
The Companies are subject to various risks and uncertainties associated with financial and commodity markets. The most significant market risks include interest rate risk, commodity price risk, credit risk and investment risk.
64
Interest Rate Risk
The Companies’ interest rate risk relates primarily to variable rate debt and to new debt financing needed to fund capital requirements, including the construction expenditures of the Utilities and maturing debt securities. Con Edison and its businesses manage interest rate risk through the issuance of mostly fixed-rate debt with varying maturities and through opportunistic refinancing of debt. Con Edison and CECONY estimate that at June 30, 2015, a 10 percent increase in interest rates applicable to its variable rate debt would result in an increase in annual interest expense of $1 million. Under CECONY’s current gas, steam and electric rate plans, variations in actual variable rate tax-exempt debt interest expense are reconciled to levels reflected in rates. Under O&R’s current New York rate plans, variations in actual tax-exempt (and under the gas rate plan, taxable) long-term debt interest expense are reconciled to the level set in rates. Certain regulatory assets relating to the O&R interest rate reconciliation have been charged off. See “Rate Plans - O&R New York - Electric and Gas” in Note B to the Second Quarter Financial Statements.
Commodity Price Risk
Con Edison’s commodity price risk relates primarily to the purchase and sale of electricity, gas and related derivative instruments. The Utilities and Con Edison’s competitive energy businesses apply risk management strategies to mitigate their related exposures. See Note K to the Second Quarter Financial Statements.
Con Edison estimates that, as of June 30, 2015, a 10 percent decline in market prices would result in a decline in fair value of $55 million for the derivative instruments used by the Utilities to hedge purchases of electricity and gas, of which $49 million is for CECONY and $6 million is for O&R. Con Edison expects that any such change in fair value would be largely offset by directionally opposite changes in the cost of the electricity and gas purchased. In accordance with provisions approved by state regulators, the Utilities generally recover from customers the costs they incur for energy purchased for their customers, including gains and losses on certain derivative instruments used to hedge energy purchased and related costs.
Con Edison’s competitive energy businesses use a value-at-risk (VaR) model to assess the market price risk of their portfolio of electricity and gas commodity fixed-price purchase and sales commitments, physical forward contracts, generating assets and commodity derivative instruments. VaR represents the potential change in fair value of the portfolio due to changes in market prices, for a specified time period and confidence level. These businesses estimate VaR across their portfolio using a delta-normal variance/covariance model with a 95 percent confidence level. Since the VaR calculation involves complex methodologies and estimates and assumptions that are based on past experience, it is not necessarily indicative of future results. VaR for the portfolio, assuming a one-day holding period, for the six months ended June 30, 2015 and the year ended December 31, 2014, respectively, was as follows:
95% Confidence Level, One-Day Holding Period | June 30, 2015 | December 31, 2014 | |
(Millions of Dollars) | |||
Average for the period | $1 | $1 | |
High | 2 | 7 | |
Low | 1 | — | |
The competitive energy businesses compare the measured VaR results against performance due to actual prices and stress test the portfolio each quarter using an assumed 30 percent price change from forecast. The stress test includes an assessment of the impact of volume changes on the portfolio because the businesses generally commit to sell their customers their actual requirements, an amount which is estimated when the sales commitments are made. The businesses limit the volume of commodity derivative instruments entered into relative to their estimated sale commitments to maintain net market price exposures to their estimated sale commitments within a certain percentage of maximum and minimum exposures.
Credit Risk
The Companies are exposed to credit risk related to transactions entered into primarily for the various energy supply and hedging activities by the Utilities and the competitive energy businesses. See Note K to the Second Quarter Financial Statements.
65
Investment Risk
The Companies’ investment risk relates to the investment of plan assets for their pension and other postretirement benefit plans. The Companies’ current investment policy for pension plan assets includes investment targets of 58 percent equities and 42 percent fixed income and other securities. At June 30, 2015, the pension plan investments consisted of 58 percent equity and 42 percent fixed income and other securities.
For the Utilities’ pension and other postretirement benefit plans, regulatory accounting treatment is generally applied in accordance with the accounting rules for regulated operations. In accordance with the Statement of Policy issued by the NYSPSC and its current electric, gas and steam rate plans, CECONY defers for payment to or recovery from customers the difference between the pension and other postretirement benefit expenses and the amounts for such expenses reflected in rates. Generally, O&R also defers such difference pursuant to its rate plans.
Material Contingencies
For information concerning potential liabilities arising from the Companies’ material contingencies, see Notes B, G and H to the Second Quarter Financial Statements.
66
Item 3: Quantitative and Qualitative Disclosures About Market Risk
For information about the Companies’ primary market risks associated with activities in derivative financial instruments, other financial instruments and derivative commodity instruments, see “Financial and Commodity Market Risks,” in Part I, Item 2 of this report, which information is incorporated herein by reference.
Item 4: Controls and Procedures
The Companies maintain disclosure controls and procedures designed to provide reasonable assurance that the information required to be disclosed in the reports that they submit to the Securities and Exchange Commission (SEC) is recorded, processed, summarized and reported within the time periods specified in the rules and forms of the SEC. Disclosure controls and procedures include, without limitation, controls and procedures designed to ensure that information required to be disclosed by an issuer in the reports that it files or submits under the Securities Exchange Act of 1934, as amended, is accumulated and communicated to the issuer’s management, including its principal executive and principal financial officers, or persons performing similar functions, as appropriate to allow timely decisions regarding required disclosure. For each of the Companies, its management, with the participation of its principal executive officer and principal financial officer, has evaluated its disclosure controls and procedures as of the end of the period covered by this report and, based on such evaluation, has concluded that the controls and procedures are effective to provide such reasonable assurance. Reasonable assurance is not absolute assurance, however, and there can be no assurance that any design of controls or procedures would be effective under all potential future conditions, regardless of how remote.
There was no change in the Companies’ internal control over financial reporting that occurred during the Companies’ most recent fiscal quarter that has materially affected, or is reasonably likely to materially affect, the Companies’ internal control over financial reporting.
67
Part II Other Information
Item 1: Legal Proceedings
For information about certain legal proceedings affecting the Companies, see Notes B, G and H to the financial statements in Part I, Item 1 of this report, which information is incorporated herein by reference.
Item 1A: Risk Factors
There were no material changes in the Companies’ risk factors compared to those disclosed in Item 1A of the Form 10-K.
68
Item 2: Unregistered Sales of Equity Securities and Use of Proceeds
ISSUER PURCHASES OF EQUITY SECURITIES
The following table provides information about Con Edison common shares purchased in open-market transactions for the quarter ended June 30, 2015. The number of shares purchased approximated the number of treasury shares used for the company’s employee stock plans.
Period | Total Number of Shares (or Units) Purchased | Average Price Paid per Share (or Unit) | Total Number of Shares (or Units) Purchased as Part of Publicly Announced Plans or Programs | Maximum Number (or Appropriate Dollar Value) of Shares (or Units) that May Yet Be Purchased Under the Plans or Programs | |||
April 1, 2015 to April 30, 2015 | 145,153 | $60.72 | — | — | |||
May 1, 2015 to May 31, 2015 | 57,264 | 61.51 | — | — | |||
June 1, 2015 to June 30, 2015 | 85,537 | 60.00 | — | — | |||
Total | 287,954 | $60.66 | — | — | |||
69
Item 6: Exhibits
Con Edison
Exhibit 12.1 | Statement of computation of Con Edison’s ratio of earnings to fixed charges for the six-month periods ended June 30, 2015 and 2014, and the 12-month period ended December 31, 2014. |
Exhibit 31.1.1 | Rule 13a-14(a)/15d-14(a) Certifications – Chief Executive Officer. |
Exhibit 31.1.2 | Rule 13a-14(a)/15d-14(a) Certifications – Chief Financial Officer. |
Exhibit 32.1.1 | Section 1350 Certifications – Chief Executive Officer. |
Exhibit 32.1.2 | Section 1350 Certifications – Chief Financial Officer. |
Exhibit 101.INS | XBRL Instance Document. |
Exhibit 101.SCH | XBRL Taxonomy Extension Schema. |
Exhibit 101.CAL | XBRL Taxonomy Extension Calculation Linkbase. |
Exhibit 101.DEF | XBRL Taxonomy Extension Definition Linkbase. |
Exhibit 101.LAB | XBRL Taxonomy Extension Label Linkbase. |
Exhibit 101.PRE | XBRL Taxonomy Extension Presentation Linkbase. |
70
CECONY
Exhibit 12.2 | Statement of computation of CECONY’s ratio of earnings to fixed charges for the six-month periods ended June 30, 2015 and 2014, and the 12-month period ended December 31, 2014. |
Exhibit 31.2.1 | Rule 13a-14(a)/15d-14(a) Certifications – Chief Executive Officer. |
Exhibit 31.2.2 | Rule 13a-14(a)/15d-14(a) Certifications – Chief Financial Officer. |
Exhibit 32.2.1 | Section 1350 Certifications – Chief Executive Officer. |
Exhibit 32.2.2 | Section 1350 Certifications – Chief Financial Officer. |
Exhibit 101.INS | XBRL Instance Document. |
Exhibit 101.SCH | XBRL Taxonomy Extension Schema. |
Exhibit 101.CAL | XBRL Taxonomy Extension Calculation Linkbase. |
Exhibit 101.DEF | XBRL Taxonomy Extension Definition Linkbase. |
Exhibit 101.LAB | XBRL Taxonomy Extension Label Linkbase. |
Exhibit 101.PRE | XBRL Taxonomy Extension Presentation Linkbase. |
Pursuant to Item 601(b)(4)(iii)(A) of Regulation S-K, instruments defining the rights of holders of long-term debt of Con Edison’s subsidiaries other than CECONY, the total amount of which does not exceed ten percent of the total assets of Con Edison and its subsidiaries on a consolidated basis, are not filed as exhibits to Con Edison’s Form 10-K or Form 10-Q. Con Edison agrees to furnish to the SEC upon request a copy of any such instrument.
71
Signatures
Pursuant to the requirements of the Securities Exchange Act of 1934, each Registrant has duly caused this report to be signed on its behalf by the undersigned thereunto duly authorized.
Consolidated Edison, Inc. | ||
Consolidated Edison Company of New York, Inc. | ||
DATE: August 6, 2015 | By | /s/ Robert Hoglund |
Robert Hoglund Senior Vice President, Chief Financial Officer and Duly Authorized Officer | ||
72