UNITED STATES
SECURITIES AND EXCHANGE COMMISSION
WASHINGTON, D.C. 20549
FORM 10-Q
x | Quarterly Report Pursuant To Section 13 or 15(d) of the Securities Exchange Act of 1934 |
FOR THE QUARTERLY PERIOD ENDED SEPTEMBER 30, 2018
OR
¨ | Transition Report Pursuant to Section 13 or 15(d) of the Securities Exchange Act of 1934 |
For the transition period from to
Commission File Number | Exact name of registrant as specified in its charter and principal executive office address and telephone number | State of Incorporation | I.R.S. Employer ID. Number | |||
1-14514 | Consolidated Edison, Inc. | New York | 13-3965100 | |||
4 Irving Place, New York, New York 10003 | ||||||
(212) 460-4600 | ||||||
1-1217 | Consolidated Edison Company of New York, Inc. | New York | 13-5009340 | |||
4 Irving Place, New York, New York 10003 | ||||||
(212) 460-4600 | ||||||
Indicate by check mark whether the registrant (1) has filed all reports required to be filed by Section 13 or 15(d) of the Securities Exchange Act of 1934 during the preceding 12 months (or for such shorter period that the registrant was required to file such reports), and (2) has been subject to such filing requirements for the past 90 days.
Consolidated Edison, Inc. (Con Edison) | Yes x | No ¨ |
Consolidated Edison Company of New York, Inc. (CECONY) | Yes x | No ¨ |
Indicate by check mark whether the registrant has submitted electronically every Interactive Data File required to be submitted pursuant to Rule 405 of Regulation S-T (§232.405 of this chapter) during the preceding 12 months (or for such shorter period that the registrant was required to submit such files).
Con Edison | Yes x | No ¨ |
CECONY | Yes x | No ¨ |
Indicate by check mark whether the registrant is a large accelerated filer, an accelerated filer, a non-accelerated filer, smaller reporting company, or an emerging growth company. See the definitions of “large accelerated filer”, “accelerated filer,” “smaller reporting company,” and "emerging growth company" in Rule 12b-2 of the Exchange Act.
Con Edison | ||
Large accelerated filer x | Accelerated filer ¨ | Non-accelerated filer ¨ |
Smaller reporting company ¨ | Emerging growth company ¨ | |
CECONY | ||
Large accelerated filer ¨ | Accelerated filer ¨ | Non-accelerated filer x |
Smaller reporting company ¨ | Emerging growth company ¨ | |
If an emerging growth company, indicate by check mark if the registrant has elected not to use the extended transition period for complying with any new or revised financial accounting standards provided pursuant to Section 13(a) of the Exchange Act. ¨
Indicate by check mark whether the registrant is a shell company (as defined in Rule 12b-2 of the Exchange Act).
Con Edison | Yes ¨ | No x |
CECONY | Yes ¨ | No x |
As of October 31, 2018, Con Edison had outstanding 311,418,948 Common Shares ($.10 par value). All of the outstanding common equity of CECONY is held by Con Edison.
1
Filing Format
This Quarterly Report on Form 10-Q is a combined report being filed separately by two different registrants: Consolidated Edison, Inc. (Con Edison) and Consolidated Edison Company of New York, Inc. (CECONY). CECONY is a wholly-owned subsidiary of Con Edison and, as such, the information in this report about CECONY also applies to Con Edison. As used in this report, the term the “Companies” refers to Con Edison and CECONY. However, CECONY makes no representation as to the information contained in this report relating to Con Edison or the subsidiaries of Con Edison other than itself.
2
Glossary of Terms
The following is a glossary of abbreviations or acronyms that are used in the Companies’ SEC reports:
Con Edison Companies | ||
Con Edison | Consolidated Edison, Inc. | |
CECONY | Consolidated Edison Company of New York, Inc. | |
Clean Energy Businesses | Con Edison Clean Energy Businesses, Inc., together with its subsidiaries | |
Con Edison Development | Consolidated Edison Development, Inc. | |
Con Edison Energy | Consolidated Edison Energy, Inc. | |
Con Edison Solutions | Consolidated Edison Solutions, Inc. | |
Con Edison Transmission | Con Edison Transmission, Inc., together with its subsidiaries | |
CET Electric | Consolidated Edison Transmission, LLC | |
CET Gas | Con Edison Gas Pipeline and Storage, LLC | |
O&R | Orange and Rockland Utilities, Inc. | |
RECO | Rockland Electric Company | |
The Companies | Con Edison and CECONY | |
The Utilities | CECONY and O&R | |
Regulatory Agencies, Government Agencies and Other Organizations | ||
EPA | U.S. Environmental Protection Agency | |
FASB | Financial Accounting Standards Board | |
FERC | Federal Energy Regulatory Commission | |
IASB | International Accounting Standards Board | |
IRS | Internal Revenue Service | |
NJBPU | New Jersey Board of Public Utilities | |
NJDEP | New Jersey Department of Environmental Protection | |
NYISO | New York Independent System Operator | |
NYPA | New York Power Authority | |
NYSDEC | New York State Department of Environmental Conservation | |
NYSERDA | New York State Energy Research and Development Authority | |
NYSPSC | New York State Public Service Commission | |
NYSRC | New York State Reliability Council, LLC | |
PJM | PJM Interconnection LLC | |
SEC | U.S. Securities and Exchange Commission | |
Accounting | ||
AFUDC | Allowance for funds used during construction | |
ASU | Accounting Standards Update | |
GAAP | Generally Accepted Accounting Principles in the United States of America | |
OCI | Other Comprehensive Income | |
VIE | Variable Interest Entity | |
3
Environmental | ||
CO2 | Carbon dioxide | |
GHG | Greenhouse gases | |
MGP Sites | Manufactured gas plant sites | |
PCBs | Polychlorinated biphenyls | |
PRP | Potentially responsible party | |
RGGI | Regional Greenhouse Gas Initiative | |
Superfund | Federal Comprehensive Environmental Response, Compensation and Liability Act of 1980 and similar state statutes | |
Units of Measure | ||
AC | Alternating current | |
Bcf | Billion cubic feet | |
Dt | Dekatherms | |
kV | Kilovolt | |
kWh | Kilowatt-hour | |
MDt | Thousand dekatherms | |
MMlb | Million pounds | |
MVA | Megavolt ampere | |
MW | Megawatt or thousand kilowatts | |
MWh | Megawatt hour | |
Other | ||
AMI | Advanced metering infrastructure | |
COSO | Committee of Sponsoring Organizations of the Treadway Commission | |
DER | Distributed energy resources | |
EGWP | Employer Group Waiver Plan | |
Fitch | Fitch Ratings | |
First Quarter Form 10-Q | The Companies' combined Quarterly Report on Form 10-Q for the quarterly period ended March 31 of the current year | |
Second Quarter Form 10-Q | The Companies' combined Quarterly Report on Form 10-Q for the quarterly period ended June 30 of the current year | |
Third Quarter Form 10-Q | The Companies' combined Quarterly Report on Form 10-Q for the quarterly period ended September 30 of the current year | |
Form 10-K | The Companies’ combined Annual Report on Form 10-K for the year ended December 31, 2017 | |
LTIP | Long Term Incentive Plan | |
Moody’s | Moody’s Investors Service | |
REV | Reforming the Energy Vision | |
S&P | S&P Global Ratings | |
TCJA | The federal Tax Cuts and Jobs Act of 2017, as enacted on December 22, 2017 | |
VaR | Value-at-Risk | |
4
TABLE OF CONTENTS
PAGE | ||
ITEM 1 | Financial Statements (Unaudited) | |
Con Edison | ||
CECONY | ||
ITEM 2 | ||
ITEM 3 | ||
ITEM 4 | ||
ITEM 1 | ||
ITEM 1A | ||
ITEM 6 | ||
5
FORWARD-LOOKING STATEMENTS
This report includes forward-looking statements intended to qualify for the safe-harbor provisions of Section 27A of the Securities Act of 1933, as amended, and Section 21E of the Securities Exchange Act of 1934, as amended. Forward-looking statements are statements of future expectation and not facts. Words such as “forecasts,” “expects,” “estimates,” “anticipates,” “intends,” “believes,” “plans,” “will” and similar expressions identify forward-looking statements. Forward-looking statements are based on information available at the time the statements are made, and accordingly speak only as of that time. Actual results or developments might differ materially from those included in the forward-looking statements because of various factors including, but not limited to:
• | the Companies are extensively regulated and are subject to penalties; |
• | the Utilities’ rate plans may not provide a reasonable return; |
• | the Companies may be adversely affected by changes to the Utilities’ rate plans; |
• | the intentional misconduct of employees or contractors could adversely affect the Companies; |
• | the failure of, or damage to, the Companies’ facilities could adversely affect the Companies; |
• | a cyber attack could adversely affect the Companies; |
• | the Companies are exposed to risks from the environmental consequences of their operations; |
• | a disruption in the wholesale energy markets or failure by an energy supplier could adversely affect the Companies; |
• | the Companies have substantial unfunded pension and other postretirement benefit liabilities; |
• | Con Edison’s ability to pay dividends or interest depends on dividends from its subsidiaries; |
• | the Companies require access to capital markets to satisfy funding requirements; |
• | changes to tax laws could adversely affect the Companies; |
• | the Companies’ strategies may not be effective to address changes in the external business environment; |
• | when the acquisition of Sempra Solar Holdings, LLC will be completed, if at all (see Note O to the financial statements in Part I, Item 1 of this report); and |
• | the Companies also face other risks that are beyond their control. |
6
Consolidated Edison, Inc.
CONSOLIDATED INCOME STATEMENT (UNAUDITED)
For the Three Months Ended September 30, | For the Nine Months Ended September 30, | ||||||
(Millions of Dollars/Except Share Data) | 2018 | 2017 | 2018 | 2017 | |||
OPERATING REVENUES | |||||||
Electric | $2,783 | $2,675 | $6,611 | $6,573 | |||
Gas | 298 | 296 | 1,726 | 1,593 | |||
Steam | 64 | 62 | 474 | 448 | |||
Non-utility | 183 | 178 | 577 | 458 | |||
TOTAL OPERATING REVENUES | 3,328 | 3,211 | 9,388 | 9,072 | |||
OPERATING EXPENSES | |||||||
Purchased power | 545 | 460 | 1,287 | 1,253 | |||
Fuel | 39 | 30 | 201 | 169 | |||
Gas purchased for resale | 164 | 115 | 736 | 584 | |||
Other operations and maintenance | 797 | 811 | 2,389 | 2,283 | |||
Depreciation and amortization | 360 | 337 | 1,061 | 998 | |||
Taxes, other than income taxes | 597 | 544 | 1,707 | 1,597 | |||
TOTAL OPERATING EXPENSES | 2,502 | 2,297 | 7,381 | 6,884 | |||
Gain on sale of solar electric production project | — | — | — | 1 | |||
OPERATING INCOME | 826 | 914 | 2,007 | 2,189 | |||
OTHER INCOME (DEDUCTIONS) | |||||||
Investment income | 39 | 37 | 96 | 90 | |||
Other income | 7 | 3 | 18 | 12 | |||
Allowance for equity funds used during construction | 4 | 3 | 11 | 8 | |||
Other deductions | (61) | (45) | (154) | (135) | |||
TOTAL OTHER INCOME (DEDUCTIONS) | (11) | (2) | (29) | (25) | |||
INCOME BEFORE INTEREST AND INCOME TAX EXPENSE | 815 | 912 | 1,978 | 2,164 | |||
INTEREST EXPENSE | |||||||
Interest on long-term debt | 195 | 183 | 576 | 539 | |||
Other interest | 13 | 4 | 28 | 11 | |||
Allowance for borrowed funds used during construction | (3) | (2) | (7) | (5) | |||
NET INTEREST EXPENSE | 205 | 185 | 597 | 545 | |||
INCOME BEFORE INCOME TAX EXPENSE | 610 | 727 | 1,381 | 1,619 | |||
INCOME TAX EXPENSE | 175 | 270 | 330 | 599 | |||
NET INCOME | $435 | $457 | $1,051 | $1,020 | |||
Net income per common share—basic | $1.40 | $1.48 | $3.38 | $3.33 | |||
Net income per common share—diluted | $1.39 | $1.48 | $3.37 | $3.31 | |||
DIVIDENDS DECLARED PER COMMON SHARE | $0.72 | $0.69 | $2.15 | $2.07 | |||
AVERAGE NUMBER OF SHARES OUTSTANDING—BASIC (IN MILLIONS) | 311.1 | 307.8 | 310.8 | 306.2 | |||
AVERAGE NUMBER OF SHARES OUTSTANDING—DILUTED (IN MILLIONS) | 312.3 | 309.3 | 311.9 | 307.7 | |||
The accompanying notes are an integral part of these financial statements.
7
Consolidated Edison, Inc.
CONSOLIDATED STATEMENT OF COMPREHENSIVE INCOME (UNAUDITED)
For the Three Months Ended September 30, | For the Nine Months Ended September 30, | |||
(Millions of Dollars) | 2018 | 2017 | 2018 | 2017 |
NET INCOME | $435 | $457 | $1,051 | $1,020 |
OTHER COMPREHENSIVE INCOME, NET OF TAXES | ||||
Pension and other postretirement benefit plan liability adjustments, net of taxes | 2 | 1 | 8 | 1 |
TOTAL OTHER COMPREHENSIVE INCOME, NET OF TAXES | 2 | 1 | 8 | 1 |
COMPREHENSIVE INCOME | $437 | $458 | $1,059 | $1,021 |
The accompanying notes are an integral part of these financial statements.
8
Consolidated Edison, Inc.
CONSOLIDATED STATEMENT OF CASH FLOWS (UNAUDITED)
For the Nine Months Ended September 30, | ||||
(Millions of Dollars) | 2018 | 2017 | ||
OPERATING ACTIVITIES | ||||
Net income | $1,051 | $1,020 | ||
PRINCIPAL NON-CASH CHARGES/(CREDITS) TO INCOME | ||||
Depreciation and amortization | 1,061 | 998 | ||
Deferred income taxes | 308 | 626 | ||
Rate case amortization and accruals | (85) | (93) | ||
Common equity component of allowance for funds used during construction | (11) | (8) | ||
Net derivative gains | 5 | (4) | ||
Unbilled revenue and net unbilled revenue deferrals | 135 | 37 | ||
Gain on sale of solar electric production project | — | (1) | ||
Other non-cash items, net | (44) | (38) | ||
CHANGES IN ASSETS AND LIABILITIES | ||||
Accounts receivable – customers | (246) | 1 | ||
Materials and supplies, including fuel oil and gas in storage | (4) | 2 | ||
Other receivables and other current assets | (31) | (39) | ||
Taxes receivable | 47 | 33 | ||
Prepayments | (487) | (433) | ||
Accounts payable | (8) | (54) | ||
Pensions and retiree benefits obligations, net | 264 | 305 | ||
Pensions and retiree benefits contributions | (475) | (462) | ||
Accrued taxes | (60) | (21) | ||
Accrued interest | 67 | 59 | ||
Superfund and environmental remediation costs, net | (14) | (9) | ||
Distributions from equity investments | 88 | 87 | ||
System benefit charge | 74 | 194 | ||
Deferred charges, noncurrent assets and other regulatory assets | (223) | (18) | ||
Deferred credits and other regulatory liabilities | 382 | (40) | ||
Other current and noncurrent liabilities | (194) | 85 | ||
NET CASH FLOWS FROM OPERATING ACTIVITIES | 1,600 | 2,227 | ||
INVESTING ACTIVITIES | ||||
Utility construction expenditures | (2,457) | (2,148) | ||
Cost of removal less salvage | (188) | (185) | ||
Non-utility construction expenditures | (193) | (288) | ||
Investments in electric and gas transmission projects | (123) | (29) | ||
Investments in/acquisitions of renewable electric production projects | (15) | (1) | ||
Proceeds from sale of assets | — | 34 | ||
Other investing activities | 29 | 32 | ||
NET CASH FLOWS USED IN INVESTING ACTIVITIES | (2,947) | (2,585) | ||
FINANCING ACTIVITIES | ||||
Net issuance/(payment) of short-term debt | 775 | (698) | ||
Issuance of long-term debt | 1,905 | 997 | ||
Retirement of long-term debt | (1,319) | (429) | ||
Debt issuance costs | (21) | (12) | ||
Common stock dividends | (631) | (600) | ||
Issuance of common shares - public offering | — | 343 | ||
Issuance of common shares for stock plans | 39 | 37 | ||
NET CASH FLOWS FROM/(USED IN) FINANCING ACTIVITIES | 748 | (362) | ||
CASH, TEMPORARY CASH INVESTMENTS, AND RESTRICTED CASH: | ||||
NET CHANGE FOR THE PERIOD | (599) | (720) | ||
BALANCE AT BEGINNING OF PERIOD | 844 | 830 | ||
BALANCE AT END OF PERIOD | $245 | $110 | ||
SUPPLEMENTAL DISCLOSURE OF CASH INFORMATION | ||||
Cash paid/(received) during the period for: | ||||
Interest | $519 | $479 | ||
Income taxes | $(1) | $(34) | ||
SUPPLEMENTAL DISCLOSURE OF NON-CASH INFORMATION | ||||
Construction expenditures in accounts payable | $318 | $352 | ||
Issuance of common shares for dividend reinvestment | $36 | $35 | ||
Software licenses acquired but unpaid as of end of period | $100 | — | ||
The accompanying notes are an integral part of these financial statements.
9
Consolidated Edison, Inc.
CONSOLIDATED BALANCE SHEET (UNAUDITED)
(Millions of Dollars) | September 30, 2018 | December 31, 2017 |
ASSETS | ||
CURRENT ASSETS | ||
Cash and temporary cash investments | $199 | $797 |
Accounts receivable – customers, less allowance for uncollectible accounts of $62 and $63 in 2018 and 2017, respectively | 1,350 | 1,103 |
Other receivables, less allowance for uncollectible accounts of $6 and $8 in 2018 and 2017, respectively | 263 | 160 |
Taxes receivable | 29 | 76 |
Accrued unbilled revenue | 350 | 598 |
Fuel oil, gas in storage, materials and supplies, at average cost | 338 | 334 |
Prepayments | 665 | 178 |
Regulatory assets | 25 | 67 |
Restricted cash | 46 | 47 |
Other current assets | 91 | 177 |
TOTAL CURRENT ASSETS | 3,356 | 3,537 |
INVESTMENTS | 2,131 | 2,001 |
UTILITY PLANT, AT ORIGINAL COST | ||
Electric | 30,077 | 28,994 |
Gas | 8,877 | 8,256 |
Steam | 2,500 | 2,473 |
General | 3,205 | 3,008 |
TOTAL | 44,659 | 42,731 |
Less: Accumulated depreciation | 9,580 | 9,063 |
Net | 35,079 | 33,668 |
Construction work in progress | 1,901 | 1,605 |
NET UTILITY PLANT | 36,980 | 35,273 |
NON-UTILITY PLANT | ||
Non-utility property, less accumulated depreciation of $248 and $201 in 2018 and 2017, respectively | 1,837 | 1,776 |
Construction work in progress | 566 | 551 |
NET PLANT | 39,383 | 37,600 |
OTHER NONCURRENT ASSETS | ||
Goodwill | 439 | 428 |
Intangible assets, less accumulated amortization of $21 and $15 in 2018 and 2017, respectively | 132 | 131 |
Regulatory assets | 3,950 | 4,266 |
Other deferred charges and noncurrent assets | 153 | 148 |
TOTAL OTHER NONCURRENT ASSETS | 4,674 | 4,973 |
TOTAL ASSETS | $49,544 | $48,111 |
The accompanying notes are an integral part of these financial statements.
10
Consolidated Edison, Inc.
CONSOLIDATED BALANCE SHEET (UNAUDITED)
(Millions of Dollars) | September 30, 2018 | December 31, 2017 |
LIABILITIES AND SHAREHOLDERS’ EQUITY | ||
CURRENT LIABILITIES | ||
Long-term debt due within one year | $1,128 | $1,298 |
Notes payable | 1,352 | 577 |
Accounts payable | 1,173 | 1,286 |
Customer deposits | 351 | 346 |
Accrued taxes | 48 | 108 |
Accrued interest | 210 | 143 |
Accrued wages | 109 | 105 |
Fair value of derivative liabilities | 18 | 17 |
Regulatory liabilities | 108 | 101 |
System benefit charge | 609 | 535 |
Other current liabilities | 295 | 386 |
TOTAL CURRENT LIABILITIES | 5,401 | 4,902 |
NONCURRENT LIABILITIES | ||
Provision for injuries and damages | 158 | 153 |
Pensions and retiree benefits | 804 | 1,443 |
Superfund and other environmental costs | 720 | 737 |
Asset retirement obligations | 320 | 314 |
Fair value of derivative liabilities | 13 | 38 |
Deferred income taxes and unamortized investment tax credits | 5,834 | 5,495 |
Regulatory liabilities | 4,624 | 4,577 |
Other deferred credits and noncurrent liabilities | 292 | 296 |
TOTAL NONCURRENT LIABILITIES | 12,765 | 13,053 |
LONG-TERM DEBT | 15,480 | 14,731 |
EQUITY | ||
Common shareholders’ equity | 15,887 | 15,418 |
Noncontrolling interest | 11 | 7 |
TOTAL EQUITY (See Statement of Equity) | 15,898 | 15,425 |
TOTAL LIABILITIES AND EQUITY | $49,544 | $48,111 |
The accompanying notes are an integral part of these financial statements.
11
Consolidated Edison, Inc.
CONSOLIDATED STATEMENT OF EQUITY (UNAUDITED)
(In Millions) | Common Stock | Additional Paid-In Capital | Retained Earnings | Treasury Stock | Capital Stock Expense | Accumulated Other Comprehensive Income/(Loss) | Noncontrolling Interest | Total | ||
Shares | Amount | Shares | Amount | |||||||
BALANCE AS OF DECEMBER 31, 2017 | 310 | $34 | $6,298 | $10,235 | 23 | $(1,038) | $(85) | $(26) | $7 | $15,425 |
Net income | 1,051 | 1,051 | ||||||||
Common stock dividends | (667) | (667) | ||||||||
Issuance of common shares for stock plans | 1 | 77 | 77 | |||||||
Other comprehensive income | 8 | 8 | ||||||||
Noncontrolling interest | 4 | 4 | ||||||||
BALANCE AS OF SEPTEMBER 30, 2018 | 311 | $34 | $6,375 | $10,619 | 23 | $(1,038) | $(85) | $(18) | $11 | $15,898 |
The accompanying notes are an integral part of these financial statements.
12
Consolidated Edison Company of New York, Inc.
CONSOLIDATED INCOME STATEMENT (UNAUDITED)
For the Three Months Ended September 30, | For the Nine Months Ended September 30, | |||
(Millions of Dollars) | 2018 | 2017 | 2018 | 2017 |
OPERATING REVENUES | ||||
Electric | $2,571 | $2,469 | $6,107 | $6,079 |
Gas | 264 | 268 | 1,540 | 1,421 |
Steam | 64 | 62 | 474 | 448 |
TOTAL OPERATING REVENUES | 2,899 | 2,799 | 8,121 | 7,948 |
OPERATING EXPENSES | ||||
Purchased power | 472 | 400 | 1,117 | 1,110 |
Fuel | 39 | 30 | 201 | 169 |
Gas purchased for resale | 66 | 58 | 457 | 372 |
Other operations and maintenance | 666 | 655 | 1,926 | 1,884 |
Depreciation and amortization | 322 | 300 | 949 | 891 |
Taxes, other than income taxes | 570 | 520 | 1,621 | 1,523 |
TOTAL OPERATING EXPENSES | 2,135 | 1,963 | 6,271 | 5,949 |
OPERATING INCOME | 764 | 836 | 1,850 | 1,999 |
OTHER INCOME (DEDUCTIONS) | ||||
Investment and other income | 6 | 2 | 14 | 9 |
Allowance for equity funds used during construction | 4 | 3 | 10 | 7 |
Other deductions | (43) | (41) | (123) | (118) |
TOTAL OTHER INCOME (DEDUCTIONS) | (33) | (36) | (99) | (102) |
INCOME BEFORE INTEREST AND INCOME TAX EXPENSE | 731 | 800 | 1,751 | 1,897 |
INTEREST EXPENSE | ||||
Interest on long-term debt | 167 | 155 | 492 | 456 |
Other interest | 10 | 4 | 23 | 11 |
Allowance for borrowed funds used during construction | (2) | (2) | (7) | (4) |
NET INTEREST EXPENSE | 175 | 157 | 508 | 463 |
INCOME BEFORE INCOME TAX EXPENSE | 556 | 643 | 1,243 | 1,434 |
INCOME TAX EXPENSE | 125 | 242 | 274 | 551 |
NET INCOME | $431 | $401 | $969 | $883 |
The accompanying notes are an integral part of these financial statements.
13
Consolidated Edison Company of New York, Inc.
CONSOLIDATED STATEMENT OF COMPREHENSIVE INCOME (UNAUDITED)
For the Three Months Ended September 30, | For the Nine Months Ended September 30, | ||||
(Millions of Dollars) | 2018 | 2017 | 2018 | 2017 | |
NET INCOME | $431 | $401 | $969 | $883 | |
OTHER COMPREHENSIVE INCOME, NET OF TAXES | — | 1 | 1 | 1 | |
COMPREHENSIVE INCOME | $431 | $402 | $970 | $884 | |
The accompanying notes are an integral part of these financial statements.
14
Consolidated Edison Company of New York, Inc.
CONSOLIDATED STATEMENT OF CASH FLOWS (UNAUDITED)
For the Nine Months Ended September 30, | |||
(Millions of Dollars) | 2018 | 2017 | |
OPERATING ACTIVITIES | |||
Net income | $969 | $883 | |
PRINCIPAL NON-CASH CHARGES/(CREDITS) TO INCOME | |||
Depreciation and amortization | 949 | 891 | |
Deferred income taxes | 346 | 566 | |
Rate case amortization and accruals | (98) | (107) | |
Common equity component of allowance for funds used during construction | (10) | (7) | |
Unbilled revenue and net unbilled revenue deferrals | 43 | 37 | |
Other non-cash items, net | (20) | (51) | |
CHANGES IN ASSETS AND LIABILITIES | |||
Accounts receivable – customers | (218) | 18 | |
Materials and supplies, including fuel oil and gas in storage | (3) | (18) | |
Other receivables and other current assets | (47) | 29 | |
Accounts receivable from affiliated companies | (267) | 12 | |
Prepayments | (448) | (398) | |
Accounts payable | (32) | (20) | |
Accounts payable to affiliated companies | 8 | 1 | |
Pensions and retiree benefits obligations, net | 242 | 274 | |
Pensions and retiree benefits contributions | (436) | (416) | |
Superfund and environmental remediation costs, net | (14) | (7) | |
Accrued taxes | (63) | (18) | |
Accrued taxes to affiliated companies | (72) | (119) | |
Accrued interest | 67 | 61 | |
System benefit charge | 70 | 175 | |
Deferred charges, noncurrent assets and other regulatory assets | (158) | (60) | |
Deferred credits and other regulatory liabilities | 376 | 77 | |
Other current and noncurrent liabilities | (99) | (13) | |
NET CASH FLOWS FROM OPERATING ACTIVITIES | 1,085 | 1,790 | |
INVESTING ACTIVITIES | |||
Utility construction expenditures | (2,315) | (2,020) | |
Cost of removal less salvage | (183) | (179) | |
NET CASH FLOWS USED IN INVESTING ACTIVITIES | (2,498) | (2,199) | |
FINANCING ACTIVITIES | |||
Net issuance/(payment) of short-term debt | 854 | (453) | |
Issuance of long-term debt | 1,640 | 500 | |
Retirement of long-term debt | (1,236) | — | |
Debt issuance costs | (18) | (7) | |
Capital contribution by parent | 95 | 279 | |
Dividend to parent | (635) | (597) | |
NET CASH FLOWS FROM/(USED IN) FINANCING ACTIVITIES | 700 | (278) | |
CASH, TEMPORARY CASH INVESTMENTS, AND RESTRICTED CASH: | |||
NET CHANGE FOR THE PERIOD | (713) | (687) | |
BALANCE AT BEGINNING OF PERIOD | 730 | 704 | |
BALANCE AT END OF PERIOD | $17 | $17 | |
SUPPLEMENTAL DISCLOSURE OF CASH INFORMATION | |||
Cash paid/(received) during the period for: | |||
Interest | $424 | $388 | |
Income taxes | $268 | $96 | |
SUPPLEMENTAL DISCLOSURE OF NON-CASH INFORMATION | |||
Construction expenditures in accounts payable | $279 | $240 | |
Software licenses acquired but unpaid as of end of period | $95 | — | |
The accompanying notes are an integral part of these financial statements.
15
Consolidated Edison Company of New York, Inc.
CONSOLIDATED BALANCE SHEET (UNAUDITED)
(Millions of Dollars) | September 30, 2018 | December 31, 2017 |
ASSETS | ||
CURRENT ASSETS | ||
Cash and temporary cash investments | $17 | $730 |
Accounts receivable – customers, less allowance for uncollectible accounts of $57 and $58 in 2018 and 2017, respectively | 1,228 | 1,009 |
Other receivables, less allowance for uncollectible accounts of $5 and $7 in 2018 and 2017, respectively | 167 | 92 |
Taxes receivable | 5 | 19 |
Accrued unbilled revenue | 298 | 454 |
Accounts receivable from affiliated companies | 331 | 64 |
Fuel oil, gas in storage, materials and supplies, at average cost | 290 | 287 |
Prepayments | 556 | 108 |
Regulatory assets | 19 | 62 |
Other current assets | 59 | 84 |
TOTAL CURRENT ASSETS | 2,970 | 2,909 |
INVESTMENTS | 415 | 383 |
UTILITY PLANT, AT ORIGINAL COST | ||
Electric | 28,308 | 27,299 |
Gas | 8,083 | 7,499 |
Steam | 2,500 | 2,473 |
General | 2,932 | 2,753 |
TOTAL | 41,823 | 40,024 |
Less: Accumulated depreciation | 8,801 | 8,321 |
Net | 33,022 | 31,703 |
Construction work in progress | 1,803 | 1,502 |
NET UTILITY PLANT | 34,825 | 33,205 |
NON-UTILITY PROPERTY | ||
Non-utility property, less accumulated depreciation of $25 in 2018 and 2017 | 4 | 4 |
NET PLANT | 34,829 | 33,209 |
OTHER NONCURRENT ASSETS | ||
Regulatory assets | 3,576 | 3,863 |
Other deferred charges and noncurrent assets | 69 | 87 |
TOTAL OTHER NONCURRENT ASSETS | 3,645 | 3,950 |
TOTAL ASSETS | $41,859 | $40,451 |
The accompanying notes are an integral part of these financial statements.
16
Consolidated Edison Company of New York, Inc.
CONSOLIDATED BALANCE SHEET (UNAUDITED)
(Millions of Dollars) | September 30, 2018 | December 31, 2017 | |
LIABILITIES AND SHAREHOLDER’S EQUITY | |||
CURRENT LIABILITIES | |||
Long-term debt due within one year | $1,075 | $1,200 | |
Notes payable | 1,004 | 150 | |
Accounts payable | 953 | 1,057 | |
Accounts payable to affiliated companies | 18 | 10 | |
Customer deposits | 339 | 334 | |
Accrued taxes | 39 | 102 | |
Accrued taxes to affiliated companies | — | 72 | |
Accrued interest | 180 | 113 | |
Accrued wages | 99 | 95 | |
Fair value of derivative liabilities | 4 | 12 | |
Regulatory liabilities | 85 | 65 | |
System benefit charge | 553 | 483 | |
Other current liabilities | 234 | 245 | |
TOTAL CURRENT LIABILITIES | 4,583 | 3,938 | |
NONCURRENT LIABILITIES | |||
Provision for injuries and damages | 153 | 147 | |
Pensions and retiree benefits | 547 | 1,140 | |
Superfund and other environmental costs | 626 | 637 | |
Asset retirement obligations | 296 | 287 | |
Fair value of derivative liabilities | 9 | 31 | |
Deferred income taxes and unamortized investment tax credits | 5,707 | 5,306 | |
Regulatory liabilities | 4,242 | 4,219 | |
Other deferred credits and noncurrent liabilities | 240 | 242 | |
TOTAL NONCURRENT LIABILITIES | 11,820 | 12,009 | |
LONG-TERM DEBT | 12,587 | 12,065 | |
SHAREHOLDER’S EQUITY (See Statement of Shareholder’s Equity) | 12,869 | 12,439 | |
TOTAL LIABILITIES AND SHAREHOLDER’S EQUITY | $41,859 | $40,451 | |
The accompanying notes are an integral part of these financial statements.
17
Consolidated Edison Company of New York, Inc.
CONSOLIDATED STATEMENT OF SHAREHOLDER’S EQUITY (UNAUDITED)
Common Stock | Additional Paid-In Capital | Retained Earnings | Repurchased Con Edison Stock | Capital Stock Expense | Accumulated Other Comprehensive Income/(Loss) | Total | ||
(In Millions) | Shares | Amount | ||||||
BALANCE AS OF DECEMBER 31, 2017 | 235 | $589 | $4,649 | $8,231 | $(962) | $(62) | $(6) | $12,439 |
Net income | 969 | 969 | ||||||
Common stock dividend to parent | (635) | (635) | ||||||
Capital contribution by parent | 95 | 95 | ||||||
Other comprehensive income | 1 | 1 | ||||||
BALANCE AS OF SEPTEMBER 30, 2018 | 235 | $589 | $4,744 | $8,565 | $(962) | $(62) | $(5) | $12,869 |
The accompanying notes are an integral part of these financial statements.
18
NOTES TO THE FINANCIAL STATEMENTS (UNAUDITED)
General
These combined notes accompany and form an integral part of the separate consolidated financial statements of each of the two separate registrants: Consolidated Edison, Inc. and its subsidiaries (Con Edison) and Consolidated Edison Company of New York, Inc. and its subsidiaries (CECONY). CECONY is a subsidiary of Con Edison and as such its financial condition and results of operations and cash flows, which are presented separately in the CECONY consolidated financial statements, are also consolidated, along with those of Orange and Rockland Utilities, Inc. (O&R), Con Edison Clean Energy Businesses, Inc. (together with its subsidiaries, the Clean Energy Businesses) and Con Edison Transmission, Inc. (together with its subsidiaries, Con Edison Transmission) in Con Edison’s consolidated financial statements. The term “Utilities” is used in these notes to refer to CECONY and O&R.
As used in these notes, the term “Companies” refers to Con Edison and CECONY and, except as otherwise noted, the information in these combined notes relates to each of the Companies. However, CECONY makes no representation as to information relating to Con Edison or the subsidiaries of Con Edison other than itself.
The separate interim consolidated financial statements of each of the Companies are unaudited but, in the opinion of their respective managements, reflect all adjustments (which include only normally recurring adjustments) necessary for a fair presentation of the results for the interim periods presented. The Companies’ separate interim consolidated financial statements should be read together with their separate audited financial statements (including the combined notes thereto) included in Item 8 of their combined Annual Report on Form 10-K for the year ended December 31, 2017 and their separate unaudited financial statements (including the combined notes thereto) included in Part 1, Item 1 of their combined Quarterly Report on Form 10-Q for the quarterly periods ended March 31, 2018 and June 30, 2018. Certain prior period amounts have been reclassified to conform to the current period presentation.
Con Edison has two regulated utility subsidiaries: CECONY and O&R. CECONY provides electric service and gas service in New York City and Westchester County. The company also provides steam service in parts of Manhattan. O&R, along with its regulated utility subsidiary, provides electric service in southeastern New York and northern New Jersey and gas service in southeastern New York. Con Edison Clean Energy Businesses, Inc. has three subsidiaries: Consolidated Edison Development, Inc. (Con Edison Development), a company that develops, owns and operates renewable and energy infrastructure projects; Consolidated Edison Energy, Inc. (Con Edison Energy), a company that provides energy-related products and services to wholesale customers; and Consolidated Edison Solutions, Inc. (Con Edison Solutions), a company that provides energy-related products and services to retail customers. Con Edison Transmission, Inc. invests in electric transmission facilities through its subsidiary, Consolidated Edison Transmission, LLC (CET Electric), and invests in gas pipeline and storage facilities through its subsidiary Con Edison Gas Pipeline and Storage, LLC (CET Gas).
Note A – Summary of Significant Accounting Policies
Revenues
Adoption of New Standard
On January 1, 2018, the Companies adopted Accounting Standards Codification (ASC) Topic 606, “Revenue from Contracts with Customers,” using the modified retrospective method applied to those contracts that were not completed. No charge to retained earnings for cumulative impact was required as a result of the Companies’ adoption of Topic 606.
Revenue Recognition
The following table presents, for the three and nine months ended September 30, 2018, revenue from contracts with customers as defined in Topic 606, as well as additional revenue from sources other than contracts with customers, disaggregated by major source.
19
For the Three Months Ended September 30, 2018 | For the Nine Months Ended September 30, 2018 | |||||||||||||
(Millions of Dollars) | Revenues from contracts with customers | Other revenues (a) | Total operating revenues | Revenues from contracts with customers | Other revenues (a) | Total operating revenues | ||||||||
CECONY | ||||||||||||||
Electric | $2,631 | $(60) | $2,571 | $6,106 | $1 | $6,107 | ||||||||
Gas | 264 | — | 264 | 1,516 | 24 | 1,540 | ||||||||
Steam | 64 | — | 64 | 467 | 7 | 474 | ||||||||
Total CECONY | $2,959 | $(60) | $2,899 | $8,089 | $32 | $8,121 | ||||||||
O&R | ||||||||||||||
Electric | 215 | (3) | 212 | 508 | (3) | 505 | ||||||||
Gas | 31 | 3 | 34 | 179 | 7 | 186 | ||||||||
Total O&R | $246 | $— | $246 | $687 | $4 | $691 | ||||||||
Clean Energy Businesses | ||||||||||||||
Renewables | 68 | (b) | — | 68 | 273 | (b) | — | 273 | ||||||
Energy services | 24 | — | 24 | 65 | — | 65 | ||||||||
Other | — | 89 | 89 | — | 235 | 235 | ||||||||
Total Clean Energy Businesses | $92 | $89 | $181 | $338 | $235 | $573 | ||||||||
Con Edison Transmission | 1 | — | 1 | 3 | — | 3 | ||||||||
Other (c) | — | 1 | 1 | — | — | — | ||||||||
Total Con Edison | $3,298 | $30 | $3,328 | $9,117 | $271 | $9,388 | ||||||||
(a) For the Utilities, this includes revenue from alternative revenue programs, such as the revenue decoupling mechanisms under their New York electric and gas rate plans. For the Clean Energy Businesses, this includes revenue from wholesale services.
(b) Included within the total for Renewables revenue at the Clean Energy Businesses is $3 million and $100 million for the three and nine months ended September 30, 2018, respectively, of revenue related to engineering, procurement and construction services.
(c) | Parent company and consolidation adjustments. |
The Utilities have the obligation to deliver electricity, gas and steam energy to their customers. The Utilities recognize revenues as this performance obligation is satisfied over time as the Utilities deliver, and the customers simultaneously receive and consume, the energy. The amount of revenues recognized reflects the consideration the Utilities expect to receive in exchange for delivering the energy. Under their tariffs, the transaction price for full-service customers includes the Utilities’ energy cost and for all customers includes delivery charges determined based on customer class and in accordance with established tariffs and guidelines of the New York State Public Service Commission (NYSPSC) or the New Jersey Board of Public Utilities (NJBPU), as applicable. Accordingly, there is no unsatisfied performance obligation associated with these customers. The transaction price is applied to the Utilities’ revenue generating activities through the customer billing process. Because energy is delivered over time, the Utilities use output methods that recognize revenue based on direct measurement of the value transferred, such as units delivered, which provides an accurate measure of value for the energy delivered. The Utilities accrue revenues at the end of each month for estimated energy delivered but not yet billed to customers. The Utilities defer over a 12-month period net interruptible gas revenues, other than those authorized by the NYSPSC to be retained by the Utilities, for refund to firm gas sales and transportation customers.
Con Edison Development recognizes revenue for the sale of energy from renewable electric production projects as energy is generated and billed to counterparties. Con Edison Development accrues revenues at the end of each month for energy generated but not yet billed to counterparties. Con Edison Energy recognizes revenue as energy is delivered and services are provided for managing energy supply assets leased from others and managing the dispatch, fuel requirements and risk management activities for generating plants and merchant transmission in the northeastern United States. Con Edison Solutions recognizes revenue for providing energy-efficiency services to government and commercial customers, and Con Edison Development recognizes revenue for engineering, procurement and construction services, under the percentage-of-completion method of revenue recognition.
Sales and profits on each percentage-of-completion contract are recorded each month based on the ratio of actual cumulative costs incurred to the total estimated costs at completion of the contract, multiplied by the total estimated contract revenue, less cumulative revenues recognized in prior periods (the ‘‘cost-to-cost’’ method). The impact of revisions of contract estimates, which may result from contract modifications, performance or other reasons, are recognized on a cumulative catch-up basis in the period in which the revisions are made.
20
(Millions of Dollars) | Unbilled contract revenue (a) | Unearned revenue (b) | |
Beginning balance as of January 1, 2018 | $58 | $87 | |
Additions (c) | 111 | 34 | |
Subtractions (c) | 138 | 105 | (d) |
Ending balance as of September 30, 2018 | $31 | $16 | |
(a) | Unbilled contract revenue represents accumulated incurred costs and earned profits on contracts (revenue arrangements), which have been recorded as revenue, but have not yet been billed to customers, and which represent contract assets as defined in Topic 606. Substantially all accrued unbilled contract revenue is expected to be collected within one year. Unbilled contract revenue arises from the cost-to-cost method of revenue recognition. Unbilled contract revenue from fixed-price type contracts is converted to billed receivables when amounts are invoiced to customers according to contractual billing terms, which generally occur when deliveries or other performance milestones are completed. |
(b) | Unearned revenue represents a liability for billings to customers in excess of earned revenue, which are contract liabilities as defined in Topic 606. |
(c) | Additions for unbilled contract revenue and subtractions for unearned revenue represent additional revenue earned. Additions for unearned revenue and subtractions for unbilled contract revenue represent billings. Activity also includes appropriate balance sheet classification for the period. |
(d) | Of the $105 million in subtractions from unearned revenue, $50 million was included in the balance as of December 31, 2017. |
As of September 30, 2018, the aggregate amount of the remaining fixed performance obligations is $124 million, of which $87 million will be recognized within the next two years, and the remaining $37 million will be recognized pursuant to long-term service and maintenance agreements.
Revenues are recorded as energy is delivered, generated or services are provided and billed to customers, except for services under percentage-of-completion contracts. Amounts billed are recorded in accounts receivable - customers, with payment generally due the following month. Con Edison’s and the Utilities’ accounts receivable - customers balance also reflects the Utilities’ purchase of receivables from energy service companies to support retail choice programs. Accrued revenues not yet billed to customers are recorded as accrued unbilled revenues.
Utility Plant
At September 30, 2018, utility plant of Con Edison and CECONY included $102 million and $97 million, respectively, related to a May 2018 acquisition of software licenses. The software licenses asset is being amortized over a period of 15 years, and the estimated aggregate annual amortization expense for Con Edison and CECONY is $7 million. At September 30, 2018, the accumulated amortization for Con Edison and CECONY was $2 million and $1 million, respectively.
Earnings Per Common Share
Con Edison presents basic and diluted earnings per share (EPS) on the face of its consolidated income statement. Basic EPS is calculated by dividing earnings available to common shareholders (“Net income” on Con Edison’s consolidated income statement) by the weighted average number of Con Edison common shares outstanding during the period. In the calculation of diluted EPS, weighted average shares outstanding are increased for additional shares that would be outstanding if potentially dilutive securities were converted to common stock.
Potentially dilutive securities for Con Edison consist of restricted stock units and deferred stock units for which the average market price of the common shares for the period was greater than the exercise price.
For the three and nine months ended September 30, 2018 and 2017, basic and diluted EPS for Con Edison are calculated as follows:
For the Three Months Ended September 30, | For the Nine Months Ended September 30, | |||
(Millions of Dollars, except per share amounts/Shares in Millions) | 2018 | 2017 | 2018 | 2017 |
Net income | $435 | $457 | $1,051 | $1,020 |
Weighted average common shares outstanding – basic | 311.1 | 307.8 | 310.8 | 306.2 |
Add: Incremental shares attributable to effect of potentially dilutive securities | 1.2 | 1.5 | 1.1 | 1.5 |
Adjusted weighted average common shares outstanding – diluted | 312.3 | 309.3 | 311.9 | 307.7 |
Net Income per common share – basic | $1.40 | $1.48 | $3.38 | $3.33 |
Net Income per common share – diluted | $1.39 | $1.48 | $3.37 | $3.31 |
21
The computation of diluted EPS for the three and nine months ended September 30, 2018 excludes immaterial amounts of performance share awards that were not included because of their anti-dilutive effect.
Changes in Accumulated Other Comprehensive Income/(Loss) by Component
For the three and nine months ended September 30, 2018 and 2017, changes to accumulated other comprehensive income/(loss) (OCI) for Con Edison and CECONY are as follows:
For the Three Months Ended September 30, | |||||
Con Edison | CECONY | ||||
(Millions of Dollars) | 2018 | 2017 | 2018 | 2017 | |
Beginning balance, accumulated OCI, net of taxes (a) | $(20) | $(27) | $(5) | $(7) | |
Amounts reclassified from accumulated OCI related to pension plan liabilities, net of tax of $(1) for Con Edison in 2018 and 2017 (a)(b) | 2 | 1 | — | 1 | |
Current period OCI, net of taxes | 2 | 1 | — | 1 | |
Ending balance, accumulated OCI, net of taxes | $(18) | $(26) | $(5) | $(6) | |
For the Nine Months Ended September 30, | ||||||
Con Edison | CECONY | |||||
(Millions of Dollars) | 2018 | 2017 | 2018 | 2017 | ||
Beginning balance, accumulated OCI, net of taxes (a) | $(26) | $(27) | $(6) | $(7) | ||
OCI before reclassifications, net of tax of $(1) and $1 for Con Edison in 2018 and 2017, respectively | 3 | (2) | — | — | ||
Amounts reclassified from accumulated OCI related to pension plan liabilities, net of tax of $(2) for Con Edison in 2018 and 2017 (a)(b) | 5 | 3 | 1 | 1 | ||
Current period OCI, net of taxes | 8 | 1 | 1 | 1 | ||
Ending balance, accumulated OCI, net of taxes | $(18) | $(26) | $(5) | $(6) | ||
(a) | Tax reclassified from accumulated OCI is reported in the income tax expense line item of the consolidated income statement. |
(b) | For the portion of unrecognized pension and other postretirement benefit costs relating to the Utilities, costs are recorded into, and amortized out of, regulatory assets instead of OCI. The net actuarial losses and prior service costs recognized during the period are included in the computation of total periodic pension and other postretirement benefit cost. See Notes E and F. |
Reconciliation of Cash, Temporary Cash Investments and Restricted Cash
On January 1, 2018, the Companies adopted Accounting Standard Update (ASU) 2016-18, "Statement of Cash Flows (Topic 230): Restricted Cash," which they applied retrospectively for each prior period presented. Pursuant to ASU 2016-18, cash, temporary cash investments and restricted cash are presented on a combined basis in the Companies’ consolidated statements of cash flows. At September 30, 2018 and 2017, cash, temporary cash investments and restricted cash for Con Edison and CECONY are as follows:
At September 30, | ||||||
Con Edison | CECONY | |||||
(Millions of Dollars) | 2018 | 2017 | 2018 | 2017 | ||
Cash and temporary cash investments | $199 | $69 | $17 | $17 | ||
Restricted cash (a) | 46 | 41 | — | — | ||
Total cash, temporary cash investments and restricted cash | $245 | $110 | $17 | $17 | ||
(a) | Restricted cash is comprised of O&R's New Jersey utility subsidiary, Rockland Electric Company transition bond charge collections, net of principal, interest, trustee and service fees ($2 million at September 30, 2018 and 2017) that are restricted until the bonds mature in 2019, and the Clean Energy Businesses' cash collateral held for project finance agreements ($44 million and $39 million at September 30, 2018 and 2017, respectively) that are restricted until varying maturity dates. For these projects, such funds are restricted to being used for normal operating expenses and capital expenditures, debt service, and required reserves. |
22
Note B – Regulatory Matters
Rate Plans
O&R New York – Electric
In May 2018, in O&R's electric rate proceeding, the NYSPSC staff recommended a $10.6 million increase in O&R's electric rates (reflecting an authorized return on common equity of 8.6 percent). In June 2018, O&R filed an update to its requested rate increase, changing its request to a $30.4 million increase (reflecting an authorized return on common equity of 9.75 percent).
O&R New York – Gas
In May 2018, in O&R's gas rate proceeding, the NYSPSC staff recommended a $6.7 million decrease in O&R's gas rates (reflecting an authorized return on common equity of 8.6 percent). In June 2018, O&R filed an update to its requested rate increase, changing its request to a $0.5 million decrease (reflecting an authorized return on common equity of 9.75 percent).
Other Regulatory Matters
In August and November 2017, the NYSPSC issued orders in its proceeding investigating an April 21, 2017 Metropolitan Transportation Authority (MTA) subway power outage. The orders indicated that the investigation determined that the outage was caused by a failure of CECONY’s electricity supply to a subway station, which led to a loss of the subway signals, and that one of the secondary services to the MTA facility had been improperly rerouted and was not properly documented by the company. The orders also indicated that the loss of power to the subway station affected multiple subway lines and caused widespread delays across the subway system. Pursuant to the orders, the company is required to take certain actions, including inspecting, repairing and installing certain electrical equipment that serves the subway system, analyzing power supply and power quality events affecting the MTA’s signaling services, and filing monthly reports with the NYSPSC on all of the company's activities related to the subway system. Through September 30, 2018, the company incurred costs related to this matter of $219 million. Included in this amount is $30 million in capital and operating and maintenance costs reflected in the company's electric rate plan and $189 million deferred as a regulatory asset pursuant to the rate plan. The company, which plans to complete the required actions in 2018, expects to incur costs related to this matter during the remainder of 2018 of $51 million, which is expected to be deferred as a regulatory asset pursuant to the rate plan.
In December 2017, the NYSPSC issued an order initiating a proceeding to study the potential effects of the federal Tax Cuts and Jobs Act of 2017 (TCJA) on income tax expense and liabilities of New York State utilities and the regulatory treatment to preserve the resulting benefits for customers. Upon enactment of the TCJA in December 2017, CECONY and O&R re-measured their deferred tax assets and liabilities and accrued net regulatory liabilities for future income taxes of $3,513 million and $161 million, respectively. In September 2018, CECONY and O&R accrued additional net regulatory liabilities for future income tax of $51 million and $7 million, respectively (see Note I). Under the rate normalization requirements continued by the TCJA, the "protected" portion of their net regulatory liabilities related to certain accelerated tax depreciation benefits ($2,593 million and $133 million, respectively) is to be amortized over the remaining lives of the related assets. The remainder of the net regulatory liabilities, or "unprotected" portion, ($971 million and $35 million, respectively) is to be amortized as determined by the NYSPSC.
In August 2018, the NYSPSC ordered CECONY to begin on January 1, 2019 to credit the company's electric and gas customers, and to begin on October 1, 2018 to credit its steam customers, with the net benefits of the TCJA as measured based on amounts reflected in its rate plans prior to the enactment of the TCJA. The net benefits include the revenue requirement impact of the reduction in the corporate federal income tax rate to 21 percent, the elimination for utilities of bonus depreciation and the amortization of excess deferred federal income taxes.
CECONY estimates that its credit of net benefits to its electric, gas and steam customers in 2019 will amount to $247 million, $102 million and $25 million, respectively (and that its credit to its steam customers in the fourth quarter of 2018 will be $6 million). CECONY’s net benefits prior to January 1, 2019 allocable to the company’s electric customers (estimated $304 million) are to be deferred and addressed in its next electric rate proceeding. CECONY’s net benefits prior to January 1, 2019 allocable to the company’s gas customers (estimated $82 million) and net benefits prior to October 1, 2018 allocable to the company’s steam customers ($15 million) are to be amortized over a three-year period. CECONY’s net regulatory liability for future income taxes, including both the protected and unprotected portions, allocable to the company’s electric customers ($2,514 million) is to continue to be deferred until its next electric rate proceeding and the amounts allocable to its gas and steam customers ($808 million and $190 million, respectively) are to be amortized over the remaining lives of the related assets (with the amortization period for the unprotected portion subject to review in its next gas and steam rate proceedings). O&R,
23
in its ongoing rate proceedings (see “Rate Plans,” above), intends to reflect its TCJA net benefits in its electric and gas rates beginning as of January 1, 2019, to amortize its net benefits prior to January 1, 2019 (estimated $22 million) over a three-year period and to amortize the protected portion of its net regulatory liability for future income taxes over the remaining lives of the related assets and the unprotected portion over a fifteen-year period.
For the nine months ended September 30, 2018, the Utilities deferred as regulatory liabilities estimated net benefits of the TCJA of $325 million, which represented approximately three quarters of their estimated annual net benefits.
In January 2018, the NYSPSC issued an order initiating a focused operations audit of the income tax accounting of certain utilities, including CECONY and O&R.
In January 2018, the NJBPU issued an order initiating a proceeding to consider the TCJA. In June 2018, the NJBPU made permanent its previously approved $2.9 million interim decrease in Rockland Electric Company's (RECO) electric base rates, effective April 1, 2018, and ordered RECO to pay to its customers in July 2018 its approximately $1 million of net benefits of the TCJA for the three-month period ended March 31, 2018 and to begin in July 2018 to refund to its customers the unprotected portion of its net regulatory liability for future income taxes over a three-year period. Also in March 2018, the Federal Energy Regulatory Commission (FERC) issued an order directing RECO to propose revisions to its transmission revenue requirement to reflect the TCJA. RECO’s net regulatory liability for future income taxes resulting from its re-measurement of its deferred tax asset and liabilities is $28 million (including $16 million subject to the normalization requirements continued by the TCJA).
In March 2018, Winter Storms Riley and Quinn caused damage to the Utilities’ electric distribution systems and interrupted service to approximately 209,000 CECONY customers, 93,000 O&R customers and 44,000 RECO customers. Through September 30, 2018, CECONY's costs related to March 2018 storms, including Riley and Quinn, amounted to $125 million, including operation and maintenance expenses reflected in its electric rate plan ($16 million), operation and maintenance expenses charged against a storm reserve pursuant to its electric rate plan ($76 million), capital expenditures ($27 million) and removal costs ($6 million). O&R and RECO had storm-related costs of $44 million and $17 million, respectively, most of which were deferred as regulatory assets pursuant to their electric rate plans. Recovery of CECONY and O&R storm-related costs is subject to review by the NYSPSC, and recovery of RECO storm-related costs is subject to review by the NJBPU. The NYSPSC is investigating the preparation and response to the storms by CECONY, O&R, and other New York electric utilities, including all aspects of their emergency response plans, and may penalize them. In July 2018, the NJBPU adopted NJBPU staff's recommendations to increase requirements for New Jersey utilities, including RECO, relating to pre-storm preparations, restoration of service and communications and outreach. The Companies are unable to estimate the amount or range of their possible loss in connection with the storms.
In May 2018, FERC denied a complaint the NJBPU filed with FERC seeking the re-allocation to CECONY of certain PJM Interconnection LLC (PJM) transmission costs that had been allocated to the company prior to April 2017 when transmission service provided to the company pursuant to the PJM open access transmission tariff terminated. The transmission service terminated because the company did not exercise its option to continue the service following a series of requests PJM had submitted to FERC that substantially increased the charges for the transmission service. CECONY challenged each of these requests. FERC rejected all but one of CECONY’s protests. In June 2015 and May 2016, CECONY filed appeals of certain FERC decisions with the U.S. Court of Appeals. In July 2018, FERC established a settlement proceeding relating to the allocation of PJM transmission costs. Under CECONY’s electric rate plan, unless and until changed by the NYSPSC, the company will recover all charges incurred associated with the transmission service.
In July 2018, the NYSPSC commenced an investigation into the rupture of a CECONY steam main (see Note H).
24
Regulatory Assets and Liabilities
Regulatory assets and liabilities at September 30, 2018 and December 31, 2017 were comprised of the following items:
Con Edison | CECONY | |||||||
(Millions of Dollars) | 2018 | 2017 | 2018 | 2017 | ||||
Regulatory assets | ||||||||
Unrecognized pension and other postretirement costs | $2,001 | $2,526 | $1,881 | $2,376 | ||||
Environmental remediation costs | 754 | 793 | 653 | 677 | ||||
Revenue taxes | 287 | 260 | 274 | 248 | ||||
MTA power reliability deferral | 189 | 50 | 189 | 50 | ||||
Property tax reconciliation | 85 | 51 | 68 | 25 | ||||
Deferred storm costs | 80 | 38 | — | — | ||||
Pension and other postretirement benefits deferrals | 73 | 79 | 56 | 58 | ||||
Municipal infrastructure support costs | 73 | 56 | 73 | 56 | ||||
Recoverable energy costs | 62 | 60 | 57 | 52 | ||||
Unamortized loss on reacquired debt | 37 | 37 | 36 | 35 | ||||
Meadowlands heater odorization project | 36 | 18 | 36 | 18 | ||||
Brooklyn Queens demand management program | 30 | 37 | 30 | 37 | ||||
Preferred stock redemption | 23 | 24 | 23 | 24 | ||||
Deferred derivative losses | 21 | 44 | 16 | 37 | ||||
Gate station upgrade project | 19 | 13 | 19 | 13 | ||||
Recoverable REV demonstration project costs | 18 | 19 | 16 | 17 | ||||
Indian Point Energy Center program costs | 15 | 29 | 15 | 29 | ||||
Workers’ compensation | 6 | 10 | 6 | 10 | ||||
O&R transition bond charges | 3 | 9 | — | — | ||||
Other | 138 | 113 | 128 | 101 | ||||
Regulatory assets – noncurrent | 3,950 | 4,266 | 3,576 | 3,863 | ||||
Deferred derivative losses | 19 | 40 | 14 | 37 | ||||
Recoverable energy costs | 6 | 27 | 5 | 25 | ||||
Regulatory assets – current | 25 | 67 | 19 | 62 | ||||
Total Regulatory Assets | $3,975 | $4,333 | $3,595 | $3,925 | ||||
Regulatory liabilities | ||||||||
Future income tax | $2,547 | $2,545 | $2,389 | $2,390 | ||||
Allowance for cost of removal less salvage | 878 | 846 | 745 | 719 | ||||
TCJA net benefits* | 325 | — | 304 | — | ||||
Energy efficiency portfolio standard unencumbered funds | 127 | 127 | 122 | 122 | ||||
Pension and other postretirement benefit deferrals | 120 | 207 | 97 | 181 | ||||
Net unbilled revenue deferrals | 86 | 183 | 86 | 183 | ||||
Unrecognized other postretirement costs | 78 | 92 | 78 | 92 | ||||
Property tax reconciliation | 57 | 107 | 57 | 107 | ||||
Property tax refunds | 45 | 44 | 45 | 44 | ||||
Settlement of prudence proceeding | 44 | 66 | 44 | 66 | ||||
Earnings sharing - electric, gas and steam | 25 | 29 | 16 | 19 | ||||
Carrying charges on repair allowance and bonus depreciation | 24 | 43 | 24 | 42 | ||||
New York State income tax rate change | 21 | 36 | 22 | 35 | ||||
Settlement of gas proceedings | 16 | 27 | 16 | 27 | ||||
Base rate change deferrals | 13 | 21 | 13 | 21 | ||||
Variable-rate tax-exempt debt – cost rate reconciliation | 7 | 30 | 6 | 26 | ||||
Net utility plant reconciliations | 7 | 12 | 4 | 8 | ||||
Other | 204 | 162 | 174 | 137 | ||||
Regulatory liabilities – noncurrent | 4,624 | 4,577 | 4,242 | 4,219 | ||||
Revenue decoupling mechanism | 56 | 29 | 55 | 21 | ||||
Refundable energy costs | 32 | 41 | 12 | 16 | ||||
Deferred derivative gains | 20 | 31 | 18 | 28 | ||||
Regulatory liabilities – current | 108 | 101 | 85 | 65 | ||||
Total Regulatory Liabilities | $4,732 | $4,678 | $4,327 | $4,284 | ||||
* See "Other Regulatory Matters," above.
25
Note C – Capitalization
In April 2018, CECONY redeemed at maturity $600 million of 5.85 percent 10-year debentures. In May 2018, CECONY issued $300 million aggregate principal amount of 3.80 percent debentures, due 2028, and $700 million aggregate principal amount of 4.50 percent debentures, due 2058. In June 2018, CECONY issued $640 million of floating rate debentures, due 2021, and in July and August 2018, CECONY redeemed $636 million of its tax-exempt debt for which the interest rates were to be determined pursuant to periodic auctions. In August 2018, O&R issued $125 million aggregate principal amount of 4.35 percent debentures, due 2048, and agreed to issue an additional $25 million aggregate principal amount of debentures in December 2018. In September 2018, O&R redeemed at maturity $50 million of 6.15 percent 10-year debentures. In September 2018, a Con Edison Development subsidiary issued $140 million aggregate principal amount of 4.41 percent Senior Notes, due 2028, secured by five of the company's wind electric production projects.
The carrying amounts and fair values of long-term debt at September 30, 2018 and December 31, 2017 were:
(Millions of Dollars) | 2018 | 2017 | ||
Long-Term Debt (including current portion) (a) | Carrying Amount | Fair Value | Carrying Amount | Fair Value |
Con Edison | $16,608 | $17,369 | $16,029 | $18,147 |
CECONY | $13,662 | $14,333 | $13,265 | $15,163 |
(a) | Amounts shown are net of unamortized debt expense and unamortized debt discount of $149 million and $128 million for Con Edison and CECONY, respectively, as of September 30, 2018 and $142 million and $121 million for Con Edison and CECONY, respectively, as of December 31, 2017. |
The fair values of the Companies' long-term debt have been estimated primarily using available market information and at September 30, 2018 are classified as Level 2 (see Note L).
Note D – Short-Term Borrowing
At September 30, 2018, Con Edison had $1,352 million of commercial paper outstanding of which $1,004 million was outstanding under CECONY’s program. The weighted average interest rate at September 30, 2018 was 2.3 percent for both Con Edison and CECONY. At December 31, 2017, Con Edison had $577 million of commercial paper outstanding of which $150 million was outstanding under CECONY’s program. The weighted average interest rate at December 31, 2017 was 1.8 percent for both Con Edison and CECONY.
At September 30, 2018 and December 31, 2017, no loans were outstanding under the credit agreement (Credit Agreement). An immaterial amount of letters of credit were outstanding under the Credit Agreement as of September 30, 2018 and December 31, 2017.
Note E – Pension Benefits
Total Periodic Benefit Cost
The components of the Companies’ total periodic benefit cost for the three and nine months ended September 30, 2018 and 2017 were as follows:
For the Three Months Ended September 30, | ||||
Con Edison | CECONY | |||
(Millions of Dollars) | 2018 | 2017 | 2018 | 2017 |
Service cost – including administrative expenses | $72 | $66 | $68 | $61 |
Interest cost on projected benefit obligation | 140 | 148 | 131 | 139 |
Expected return on plan assets | (258) | (243) | (245) | (229) |
Recognition of net actuarial loss | 172 | 149 | 163 | 141 |
Recognition of prior service cost/(credit) | (4) | (4) | (5) | (5) |
TOTAL PERIODIC BENEFIT COST | $122 | $116 | $112 | $107 |
Cost capitalized | (32) | (40) | (30) | (37) |
Reconciliation to rate level | (22) | (14) | (24) | (16) |
Total expense recognized | $68 | $62 | $58 | $54 |
26
For the Nine Months Ended September 30, | ||||
Con Edison | CECONY | |||
(Millions of Dollars) | 2018 | 2017 | 2018 | 2017 |
Service cost – including administrative expenses | $218 | $197 | $204 | $184 |
Interest cost on projected benefit obligation | 420 | 444 | 394 | 416 |
Expected return on plan assets | (775) | (726) | (734) | (689) |
Recognition of net actuarial loss | 516 | 446 | 488 | 423 |
Recognition of prior service cost/(credit) | (13) | (13) | (15) | (14) |
TOTAL PERIODIC BENEFIT COST | $366 | $348 | $337 | $320 |
Cost capitalized | (94) | (134) | (89) | (125) |
Reconciliation to rate level | (68) | (28) | (74) | (32) |
Total expense recognized | $204 | $186 | $174 | $163 |
In March 2017, the FASB issued amendments to the guidance for retirement benefits through ASU 2017-07, “Compensation-Retirement Benefits (Topic 715): Improving the Presentation of Net Periodic Pension Cost and Net Periodic Postretirement Benefit Cost.” The Companies adopted ASU 2017-07 beginning on January 1, 2018. The guidance requires that components of net periodic benefit cost other than service cost be presented outside of operating income on consolidated income statements, and that only the service cost component is eligible for capitalization. Accordingly, the service cost components are included in the line "Other operations and maintenance" and the non-service cost components are included in the line “Other deductions” in the Companies' consolidated income statements. As permitted by a practical expedient under ASU 2017-07, the Companies applied the presentation requirements retrospectively for both pension and other postretirement benefit costs using amounts disclosed in prior-period financial statements as appropriate estimates.
Expected Contributions
Based on estimates as of September 30, 2018, the Companies expect to make contributions to the pension plans during 2018 of $472 million (of which $433 million is to be contributed by CECONY). The Companies’ policy is to fund the total periodic benefit cost of the qualified plan to the extent tax deductible and to also contribute to the non-qualified supplemental plans. During the first nine months of 2018, the Companies contributed $469 million to the pension plans (of which $431 million was contributed by CECONY). CECONY also contributed $17 million to the external trust for its non-qualified supplemental plan.
Note F – Other Postretirement Benefits
Total Periodic Benefit Cost
The components of the Companies’ total periodic other postretirement benefit cost/(credit) for the three and nine months ended September 30, 2018 and 2017 were as follows:
For the Three Months Ended September 30, | |||||
Con Edison | CECONY | ||||
(Millions of Dollars) | 2018 | 2017 | 2018 | 2017 | |
Service cost | $5 | $5 | $3 | $3 | |
Interest cost on accumulated other postretirement benefit obligation | 11 | 11 | 9 | 9 | |
Expected return on plan assets | (18) | (17) | (16) | (15) | |
Recognition of net actuarial loss/(gain) | 2 | 1 | 1 | — | |
Recognition of prior service cost/(credit) | (2) | (5) | (1) | (3) | |
TOTAL PERIODIC OTHER POSTRETIREMENT BENEFIT COST/(CREDIT) | $(2) | $(5) | $(4) | $(6) | |
Cost capitalized | (2) | 2 | (1) | 2 | |
Reconciliation to rate level | 2 | (1) | 2 | — | |
Total expense/(credit) recognized | $(2) | $(4) | $(3) | $(4) | |
27
For the Nine Months Ended September 30, | ||||
Con Edison | CECONY | |||
(Millions of Dollars) | 2018 | 2017 | 2018 | 2017 |
Service cost | $15 | $15 | $10 | $10 |
Interest cost on accumulated other postretirement benefit obligation | 32 | 34 | 26 | 28 |
Expected return on plan assets | (55) | (52) | (47) | (45) |
Recognition of net actuarial loss/(gain) | 6 | 2 | 2 | (2) |
Recognition of prior service cost/(credit) | (5) | (13) | (2) | (9) |
TOTAL PERIODIC OTHER POSTRETIREMENT BENEFIT COST/(CREDIT) | $(7) | $(14) | $(11) | $(18) |
Cost capitalized | (6) | 6 | (4) | 7 |
Reconciliation to rate level | 6 | (3) | 7 | (1) |
Total expense/(credit) recognized | $(7) | $(11) | $(8) | $(12) |
For information about the adoption of ASU 2017-07, “Compensation-Retirement Benefits (Topic 715): Improving the Presentation of Net Periodic Pension Cost and Net Periodic Postretirement Benefit Cost,” see Note E.
Contributions
During the first nine months of 2018, the Companies contributed $6 million, substantially all of which was contributed by CECONY, to the other postretirement benefit plans. The Companies' policy is to fund the total periodic benefit cost of the plans to the extent tax deductible.
Note G – Environmental Matters
Superfund Sites
Hazardous substances, such as asbestos, polychlorinated biphenyls (PCBs) and coal tar, have been used or generated in the course of operations of the Utilities and their predecessors and are present at sites and in facilities and equipment they currently or previously owned, including sites at which gas was manufactured or stored.
The Federal Comprehensive Environmental Response, Compensation and Liability Act of 1980 and similar state statutes (Superfund) impose joint and several liability, regardless of fault, upon generators of hazardous substances for investigation and remediation costs (which include costs of demolition, removal, disposal, storage, replacement, containment and monitoring) and natural resource damages. Liability under these laws can be material and may be imposed for contamination from past acts, even though such past acts may have been lawful at the time they occurred. The sites at which the Utilities have been asserted to have liability under these laws, including their manufactured gas plant sites and any neighboring areas to which contamination may have migrated, are referred to herein as “Superfund Sites.”
For Superfund Sites where there are other potentially responsible parties and the Utilities are not managing the site investigation and remediation, the accrued liability represents an estimate of the amount the Utilities will need to pay to investigate and, where determinable, discharge their related obligations. For Superfund Sites (including the manufactured gas plant sites) for which one of the Utilities is managing the investigation and remediation, the accrued liability represents an estimate of the company’s share of the undiscounted cost to investigate the sites and, for sites that have been investigated in whole or in part, the cost to remediate the sites, if remediation is necessary and if a reasonable estimate of such cost can be made. Remediation costs are estimated in light of the information available, applicable remediation standards and experience with similar sites.
The accrued liabilities and regulatory assets related to Superfund Sites at September 30, 2018 and December 31, 2017 were as follows:
Con Edison | CECONY | |||
(Millions of Dollars) | 2018 | 2017 | 2018 | 2017 |
Accrued Liabilities: | ||||
Manufactured gas plant sites | $639 | $651 | $546 | $551 |
Other Superfund Sites | 81 | 86 | 80 | 86 |
Total | $720 | $737 | $626 | $637 |
Regulatory assets | $754 | $793 | $653 | $677 |
28
Most of the accrued Superfund Site liability relates to sites that have been investigated, in whole or in part. However, for some of the sites, the extent and associated cost of the required remediation has not yet been determined. As investigations progress and information pertaining to the required remediation becomes available, the Utilities expect that additional liability may be accrued, the amount of which is not presently determinable but may be material. The Utilities are permitted to recover or defer as regulatory assets (for subsequent recovery through rates) prudently incurred site investigation and remediation costs.
Environmental remediation costs incurred related to Superfund Sites for the three and nine months ended September 30, 2018 and 2017 were as follows:
For the Three Months Ended September 30, | ||||
Con Edison | CECONY | |||
(Millions of Dollars) | 2018 | 2017 | 2018 | 2017 |
Remediation costs incurred | $8 | $4 | $5 | $3 |
For the Nine Months Ended September 30, | ||||
Con Edison | CECONY | |||
(Millions of Dollars) | 2018 | 2017 | 2018 | 2017 |
Remediation costs incurred | $17 | $18 | $14 | $13 |
Insurance and other third-party recoveries received by Con Edison or CECONY were immaterial for the three and nine months ended September 30, 2018 and 2017.
In 2017, Con Edison and CECONY estimated that for their manufactured gas plant sites (including CECONY’s Astoria site), the aggregate undiscounted potential liability for the investigation and remediation of coal tar and/or other environmental contaminants could range up to $2.7 billion and $2.5 billion, respectively. These estimates were based on the assumption that there is contamination at all sites, including those that have not yet been fully investigated and additional assumptions about the extent of the contamination and the type and extent of the remediation that may be required. Actual experience may be materially different.
Asbestos Proceedings
Suits have been brought in New York State and federal courts against the Utilities and many other defendants, wherein a large number of plaintiffs sought large amounts of compensatory and punitive damages for deaths and injuries allegedly caused by exposure to asbestos at various premises of the Utilities. The suits that have been resolved, which are many, have been resolved without any payment by the Utilities, or for amounts that were not, in the aggregate, material to them. The amounts specified in all the remaining thousands of suits total billions of dollars; however, the Utilities believe that these amounts are greatly exaggerated, based on the disposition of previous claims. At September 30, 2018, Con Edison and CECONY have accrued their estimated aggregate undiscounted potential liabilities for these suits and additional suits that may be brought over the next 15 years as shown in the following table. These estimates were based upon a combination of modeling, historical data analysis and risk factor assessment. Courts have begun, and unless otherwise determined on appeal may continue, to apply different standards for determining liability in asbestos suits than the standard that applied historically. As a result, the Companies currently believe that there is a reasonable possibility of an exposure to loss in excess of the liability accrued for the suits. The Companies are unable to estimate the amount or range of such loss. In addition, certain current and former employees have claimed or are claiming workers’ compensation benefits based on alleged disability from exposure to asbestos. CECONY is permitted to defer as regulatory assets (for subsequent recovery through rates) costs incurred for its asbestos lawsuits and workers’ compensation claims.
The accrued liability for asbestos suits and workers’ compensation proceedings (including those related to asbestos exposure) and the amounts deferred as regulatory assets for the Companies at September 30, 2018 and December 31, 2017 were as follows:
29
Con Edison | CECONY | |||
(Millions of Dollars) | 2018 | 2017 | 2018 | 2017 |
Accrued liability – asbestos suits | $8 | $8 | $7 | $7 |
Regulatory assets – asbestos suits | $8 | $8 | $7 | $7 |
Accrued liability – workers’ compensation | $80 | $84 | $76 | $80 |
Regulatory assets – workers’ compensation | $6 | $10 | $6 | $10 |
Note H – Other Material Contingencies
Manhattan Explosion and Fire
On March 12, 2014, two multi-use five-story tall buildings located on Park Avenue between 116th and 117th Streets in Manhattan were destroyed by an explosion and fire. CECONY had delivered gas to the buildings through service lines from a distribution main located below ground on Park Avenue. Eight people died and more than 50 people were injured. Additional buildings were also damaged. The National Transportation Safety Board (NTSB) investigated. The parties to the investigation included the company, the City of New York, the Pipeline and Hazardous Materials Safety Administration and the NYSPSC. In June 2015, the NTSB issued a final report concerning the incident, its probable cause and safety recommendations. The NTSB determined that the probable cause of the incident was (1) the failure of a defective fusion joint at a service tee (which joined a plastic service line to a plastic distribution main) installed by the company that allowed gas to leak from the distribution main and migrate into a building where it ignited and (2) a breach in a City sewer line that allowed groundwater and soil to flow into the sewer, resulting in a loss of support for the distribution main, which caused it to sag and overstressed the defective fusion joint. The NTSB also made safety recommendations, including recommendations to the company that addressed its procedures for the preparation and examination of plastic fusions, training of its staff on conditions for notifications to the City’s Fire Department and extension of its gas main isolation valve installation program. In February 2017, the NYSPSC approved a settlement agreement with the company related to the NYSPSC's investigations of the incident and the practices of qualifying persons to perform plastic fusions. Pursuant to the agreement, the company is providing $27 million of future benefits to customers (for which it has accrued a regulatory liability) and will not recover from customers $126 million of costs for gas emergency response activities that it had previously incurred and expensed. Approximately eighty suits are pending against the company seeking generally unspecified damages and, in some cases, punitive damages, for wrongful death, personal injury, property damage and business interruption. The company has notified its insurers of the incident and believes that the policies in force at the time of the incident will cover the company’s costs, in excess of a required retention (the amount of which is not material), to satisfy any liability it may have for damages in connection with the incident. The company is unable to estimate the amount or range of its possible loss for damages related to the incident. At September 30, 2018, the company had not accrued a liability for damages related to the incident.
Manhattan Steam Main Rupture
In July 2018, a CECONY steam main located on Fifth Avenue and 21st street in Manhattan ruptured. Debris from the incident included dirt and mud containing asbestos. The response to the incident required the closing of buildings and streets for various periods. The NYSPSC has commenced an investigation. As of September 30, 2018, with respect to the incident, the company incurred estimated operating costs of $10 million for property damage, clean- up and other response costs and invested $7 million in capital and retirement costs. The company has notified its insurers of the incident and believes that the policies currently in force will cover the company’s costs, in excess of a required retention (the amount of which is not material), to satisfy any liability it may have for damages to others in connection with the incident. The company is unable to estimate the amount or range of its possible loss related to the incident. At September 30, 2018, the company had not accrued a liability related to the incident.
Other Contingencies
See "Other Regulatory Matters" in Note B and “Uncertain Tax Positions” in Note I.
Guarantees
Con Edison has guaranteed the obligations of a Con Edison Development subsidiary under the purchase and sale agreement for its acquisition of Sempra Solar Holdings, LLC, including the payment of the purchase price for the acquisition ($1,540 million, subject to closing adjustments, including working capital). See Note O.
30
Con Edison and its subsidiaries have entered into various other agreements providing financial or performance assurance primarily to third parties on behalf of their subsidiaries. Maximum amounts guaranteed by Con Edison under these other agreements totaled $1,991 million and $2,073 million at September 30, 2018 and December 31, 2017, respectively.
A summary, by type and term, of Con Edison’s total guarantees under these other agreements at September 30, 2018 is as follows:
Guarantee Type | 0 – 3 years | 4 – 10 years | > 10 years | Total | |||
(Millions of Dollars) | |||||||
Con Edison Transmission | $744 | $404 | $— | $1,148 | |||
Energy transactions | 434 | 24 | 201 | 659 | |||
Renewable electric production projects | 93 | — | 21 | 114 | |||
Other | 70 | — | — | 70 | |||
Total | $1,341 | $428 | $222 | $1,991 | |||
Con Edison Transmission — Con Edison has guaranteed payment by CET Electric of the contributions CET Electric agreed to make to New York Transco LLC (NY Transco). CET Electric acquired a 45.7 percent interest in NY Transco when it was formed in 2014. In May 2016, the transmission owners transferred certain projects to NY Transco, for which CET Electric made its required contributions. NY Transco has proposed other transmission projects in the New York Independent System Operator's competitive bidding process. These other projects are subject to certain authorizations from the NYSPSC, the FERC and, as applicable, other federal, state and local agencies. Guarantee amount shown is for the maximum possible required amount of CET Electric’s contributions for these other projects as calculated based on the assumptions that the projects are completed at 175 percent of their estimated costs and NY Transco does not use any debt financing for the projects. Guarantee term shown is assumed as the selection of the projects and resulting timing of the contributions is not certain. Also included within the table above are guarantees for $125 million from Con Edison on behalf of CET Gas in relation to a proposed gas transmission project in West Virginia and Virginia.
Energy Transactions — Con Edison guarantees payments on behalf of the Clean Energy Businesses in order to facilitate physical and financial transactions in electricity, gas, pipeline capacity, transportation, oil, renewable energy credits and energy services. To the extent that liabilities exist under the contracts subject to these guarantees, such liabilities are included in Con Edison’s consolidated balance sheet.
Renewable Electric Production Projects — Con Edison, Con Edison Development, and Con Edison Solutions guarantee payments on behalf of their wholly-owned subsidiaries associated with their investment in, or development for others of, solar and wind energy facilities.
Other — Other guarantees include $70 million in guarantees provided by Con Edison to Travelers Insurance Company for indemnity agreements for surety bonds in connection with operation of solar energy facilities and energy service projects of Con Edison Development and Con Edison Solutions, respectively.
Note I – Income Tax
Con Edison’s income tax expense decreased to $175 million for the three months ended September 30, 2018 from $270 million for the three months ended September 30, 2017. CECONY’s income tax expense decreased to $125 million for the three months ended September 30, 2018 from $242 million for the three months ended September 30, 2017. The decrease in income tax expense for both Companies is due primarily to lower income before income tax expense, the lower corporate federal income tax rate of 21 percent in 2018 resulting from the enactment of the TCJA and an increase in the amortization of excess deferred federal income taxes due to the TCJA. Con Edison’s decrease in income tax expense was offset in part by $42 million of income tax expense which, as discussed below, resulted from newly issued guidance on the TCJA and the subsequent re-measurement of deferred tax assets associated with Con Edison’s 2017 federal net operating loss (NOL) carryover into 2018.
Reconciliation of the difference between income tax expense and the amount computed by applying the prevailing statutory income tax rate to income before income taxes for the three months ended September 30, is as follows:
31
Con Edison | CECONY | |||||||
(% of Pre-tax income) | 2018 | 2017 | 2018 | 2017 | ||||
STATUTORY TAX RATE | ||||||||
Federal | 21 | % | 35 | % | 21 | % | 35 | % |
Changes in computed taxes resulting from: | ||||||||
State income tax | 5 | 5 | 5 | 4 | ||||
Other plant-related items | (1 | ) | (1 | ) | (1 | ) | (1 | ) |
Renewable energy credits | (1 | ) | (1 | ) | — | — | ||
TCJA deferred tax re-measurement | 7 | — | — | — | ||||
Amortization of excess deferred federal income taxes | (2 | ) | — | (2 | ) | — | ||
Other | (1 | ) | (1 | ) | (1 | ) | — | |
Effective tax rate | 28 | % | 37 | % | 22 | % | 38 | % |
Con Edison’s income tax expense decreased to $330 million for the nine months ended September 30, 2018 from $599 million for the nine months ended September 30, 2017. CECONY’s income tax expense decreased to $274 million for the nine months ended September 30, 2018 from $551 million for the nine months ended September 30, 2017. The decrease in income tax expense for both Companies is due primarily to lower income before income tax expense, the lower corporate federal income tax rate of 21 percent in 2018 resulting from the enactment of the TCJA and an increase in the amortization of excess deferred federal income taxes due to the TCJA. Con Edison’s decrease in income tax expense was offset in part by $42 million of income tax expense which, as discussed below, resulted from newly issued guidance on the TCJA and the subsequent re-measurement of deferred tax assets associated with Con Edison’s 2017 federal NOL carryover into 2018.
Reconciliation of the difference between income tax expense and the amount computed by applying the prevailing statutory income tax rate to income before income taxes for the nine months ended September 30, is as follows:
Con Edison | CECONY | |||||||
(% of Pre-tax income) | 2018 | 2017 | 2018 | 2017 | ||||
STATUTORY TAX RATE | ||||||||
Federal | 21 | % | 35 | % | 21 | % | 35 | % |
Changes in computed taxes resulting from: | ||||||||
State income tax | 5 | 4 | 5 | 4 | ||||
Cost of removal | 1 | 1 | 1 | 1 | ||||
Other plant-related items | (1 | ) | (1 | ) | (1 | ) | (1 | ) |
Renewable energy credits | (1 | ) | (1 | ) | — | — | ||
TCJA deferred tax re-measurement | 3 | — | — | — | ||||
Amortization of excess deferred federal income taxes | (3 | ) | — | (3 | ) | — | ||
Other | (1 | ) | (1 | ) | (1 | ) | (1 | ) |
Effective tax rate | 24 | % | 37 | % | 22 | % | 38 | % |
CECONY and O&R deferred as regulatory liabilities their estimated net benefits under the TCJA for the nine months ended September 30, 2018. RECO deferred as a regulatory liability its estimated net benefits under the TCJA for the three months ended March 31, 2018. The net benefits include the revenue requirement impact of the reduction in the corporate federal income tax rate to 21 percent, the elimination for utilities of bonus depreciation and the amortization of excess deferred federal income taxes the utilities collected from customers that will not need to be paid to the Internal Revenue Service under the TCJA. See “Other Regulatory Matters” in Note B.
At December 31, 2017, the Companies recorded provisional income tax amounts in its accounting for certain effects of the provisions of the TCJA as allowed under SEC Staff Accounting Bulletin 118 (SAB 118). SAB 118 allowed a one year period for companies to finalize the provisional amounts recorded as of December 31, 2017. In August 2018, the Internal Revenue Service and U.S. Department of Treasury issued proposed regulations that clarified provisions in TCJA on the allowance for additional first-year depreciation for qualified property of regulated public utilities placed in service in the fourth quarter of 2017. Under this guidance, the Utilities deducted $477 million in additional depreciation in Con Edison’s 2017 federal income tax return. The additional depreciation increased Con Edison’s 2017 federal NOL carryover to $563 million (CECONY’s 2017 federal NOL carryover is $153 million), which required a re-measurement of deferred tax assets and liabilities associated with the filing of its 2017 federal
32
income tax return. As a result, Con Edison decreased its net deferred tax liabilities by $16 million (including $51 million for CECONY), recognized $42 million in income tax expense at the parent company related to re-measuring the 2017 federal NOL carryover to 2018 and accrued a regulatory liability for future income tax of $58 million (including $51 million for CECONY). The Companies expect to complete their assessment and record any final adjustments to the provisional amounts by the fourth quarter of 2018.
Uncertain Tax Positions
In March 2018, Con Edison received approval of its tax refunds by the Joint Committee on Taxation for tax years 2012 through 2015. The approval effectively settled approximately $3 million in uncertain federal tax positions. Federal income tax returns for 2016 and 2017 remain under examination.
At September 30, 2018, the estimated liability for uncertain tax positions for Con Edison was $11 million ($5 million for CECONY). Con Edison reasonably expects to resolve within the next twelve months approximately $10 million ($9 million, net of federal taxes) of various federal and state uncertainties due to the expected completion of ongoing tax examinations, resolution of state refund claims and expiration of statute of limitations, of which the entire amount, if recognized, would reduce Con Edison's effective tax rate. The amount related to CECONY is approximately $3 million, which, if recognized, would reduce CECONY’s effective tax rate. The total amount of unrecognized tax benefits, if recognized, that would reduce Con Edison’s effective tax rate is $11 million ($10 million, net of federal taxes).
The Companies recognize interest on liabilities for uncertain tax positions in interest expense and would recognize penalties, if any, in operating expenses in the Companies’ consolidated income statements. In the three and nine months ended September 30, 2018, the Companies recognized an immaterial amount of interest expense and no penalties for uncertain tax positions in their consolidated income statements. At September 30, 2018 and December 31, 2017, the Companies recognized an immaterial amount of accrued interest on their consolidated balance sheets.
Note J – Financial Information by Business Segment
Con Edison’s principal business segments are CECONY’s regulated utility activities, O&R’s regulated utility activities, the Clean Energy Businesses and Con Edison Transmission. CECONY’s principal business segments are its regulated electric, gas and steam utility activities. The financial data for the business segments for the three and nine months ended September 30, 2018 and 2017 were as follows:
For the Three Months Ended September 30, | ||||||||||||||||||
Operating revenues | Inter-segment revenues | Depreciation and amortization | Operating income/(loss) | |||||||||||||||
(Millions of Dollars) | 2018 | 2017 | 2018 | 2017 | 2018 | 2017 | 2018 | 2017 | ||||||||||
CECONY | ||||||||||||||||||
Electric | $2,571 | $2,469 | $4 | $4 | $248 | $232 | $850 | $883 | ||||||||||
Gas | 264 | 268 | 2 | 2 | 52 | 47 | (34) | (6) | ||||||||||
Steam | 64 | 62 | 19 | 19 | 22 | 21 | (52) | (41) | ||||||||||
Consolidation adjustments | — | — | (25) | (25) | — | — | — | — | ||||||||||
Total CECONY | $2,899 | $2,799 | $— | $— | $322 | $300 | $764 | $836 | ||||||||||
O&R | ||||||||||||||||||
Electric | $212 | $206 | $— | $— | $14 | $13 | $52 | $60 | ||||||||||
Gas | 34 | 28 | — | — | 5 | 5 | (10) | (10) | ||||||||||
Total O&R | $246 | $234 | $— | $— | $19 | $18 | $42 | $50 | ||||||||||
Clean Energy Businesses | $181 | $177 | $— | $— | $18 | $19 | $25 | $29 | ||||||||||
Con Edison Transmission | 1 | 1 | — | — | — | — | (2) | (2) | ||||||||||
Other (a) | 1 | — | — | — | 1 | — | (3) | 1 | ||||||||||
Total Con Edison | $3,328 | $3,211 | $— | $— | $360 | $337 | $826 | $914 | ||||||||||
33
For the Nine Months Ended September 30, | ||||||||||||||||||
Operating revenues | Inter-segment revenues | Depreciation and amortization | Operating income/(loss) | |||||||||||||||
(Millions of Dollars) | 2018 | 2017 | 2018 | 2017 | 2018 | 2017 | 2018 | 2017 | ||||||||||
CECONY | ||||||||||||||||||
Electric | $6,107 | $6,079 | $12 | $12 | $732 | $690 | $1,421 | $1,561 | ||||||||||
Gas | 1,540 | 1,421 | 6 | 5 | 152 | 137 | 369 | 379 | ||||||||||
Steam | 474 | 448 | 56 | 55 | 65 | 64 | 60 | 59 | ||||||||||
Consolidation adjustments | — | — | (74) | (72) | — | — | — | — | ||||||||||
Total CECONY | $8,121 | $7,948 | $— | $— | $949 | $891 | $1,850 | $1,999 | ||||||||||
O&R | ||||||||||||||||||
Electric | $505 | $495 | $— | $— | $41 | $38 | $79 | $94 | ||||||||||
Gas | 186 | 172 | — | — | 16 | 15 | 31 | 37 | ||||||||||
Total O&R | $691 | $667 | $— | $— | $57 | $53 | $110 | $131 | ||||||||||
Clean Energy Businesses | 573 | 460 | — | — | 55 | 54 | 59 | 63 | ||||||||||
Con Edison Transmission | 3 | 1 | — | — | 1 | — | (5) | (6) | ||||||||||
Other (a) | — | (4) | — | — | (1) | — | (7) | 2 | ||||||||||
Total Con Edison | $9,388 | $9,072 | $— | $— | $1,061 | $998 | $2,007 | $2,189 | ||||||||||
(a) Parent company and consolidation adjustments. Other does not represent a business segment.
Note K – Derivative Instruments and Hedging Activities
Con Edison’s subsidiaries hedge market price fluctuations associated with physical purchases and sales of electricity, natural gas, steam and, to a lesser extent, refined fuels by using derivative instruments including futures, forwards, basis swaps, options, transmission congestion contracts and financial transmission rights contracts. Derivatives are recognized on the consolidated balance sheet at fair value (see Note L), unless an exception is available under the accounting rules for derivatives and hedging. Qualifying derivative contracts that have been designated as normal purchases or normal sales contracts are not reported at fair value under the accounting rules.
34
The fair values of the Companies’ commodity derivatives including the offsetting of assets and liabilities on the consolidated balance sheet at September 30, 2018 and December 31, 2017 were:
(Millions of Dollars) | 2018 | 2017 | ||||||||||
Balance Sheet Location | Gross Amounts of Recognized Assets/(Liabilities) | Gross Amounts Offset | Net Amounts of Assets/ (Liabilities) (a) | Gross Amounts of Recognized Assets/(Liabilities) | Gross Amounts Offset | Net Amounts of Assets/ (Liabilities) (a) | ||||||
Con Edison | ||||||||||||
Fair value of derivative assets | ||||||||||||
Current | $45 | $(23) | $22 | (b) | $83 | $(51) | $32 | (b) | ||||
Noncurrent | 21 | (13) | 8 | 10 | (4) | 6 | ||||||
Total fair value of derivative assets | $66 | $(36) | $30 | $93 | $(55) | $38 | ||||||
Fair value of derivative liabilities | ||||||||||||
Current | $(41) | $23 | $(18) | $(67) | $50 | $(17) | ||||||
Noncurrent | (26) | 13 | (13) | (43) | 5 | (38) | ||||||
Total fair value of derivative liabilities | $(67) | $36 | $(31) | $(110) | $55 | $(55) | ||||||
Net fair value derivative assets/(liabilities) | $(1) | $— | $(1) | (b) | $(17) | $— | $(17) | (b) | ||||
CECONY | ||||||||||||
Fair value of derivative assets | ||||||||||||
Current | $32 | $(16) | $16 | (b) | $39 | $(15) | $24 | (b) | ||||
Noncurrent | 16 | (11) | 5 | 9 | (4) | 5 | ||||||
Total fair value of derivative assets | $48 | $(27) | $21 | $48 | $(19) | $29 | ||||||
Fair value of derivative liabilities | ||||||||||||
Current | $(19) | $15 | $(4) | $(26) | $14 | $(12) | ||||||
Noncurrent | (20) | 11 | (9) | (36) | 4 | (32) | ||||||
Total fair value of derivative liabilities | $(39) | $26 | $(13) | $(62) | $18 | $(44) | ||||||
Net fair value derivative assets/(liabilities) | $9 | $(1) | $8 | (b) | $(14) | $(1) | $(15) | (b) | ||||
(a) | Derivative instruments and collateral were offset on the consolidated balance sheet as applicable under the accounting rules. The Companies enter into master agreements for their commodity derivatives. These agreements typically provide offset in the event of contract termination. In such case, generally the non-defaulting party’s payable will be offset by the defaulting party’s payable. The non-defaulting party will customarily notify the defaulting party within a specific time period and come to an agreement on the early termination amount. |
(b) | At September 30, 2018 and December 31, 2017, margin deposits for Con Edison ($7 million and $12 million, respectively) and CECONY ($6 million and $11 million, respectively) were classified as derivative assets on the consolidated balance sheet, but not included in the table. Margin is collateral, typically cash, that the holder of a derivative instrument is required to deposit in order to transact on an exchange and to cover its potential losses with its broker or the exchange. |
The Utilities generally recover their prudently incurred fuel, purchased power and gas costs, including hedging gains and losses, in accordance with rate provisions approved by the applicable state utility regulators. In accordance with the accounting rules for regulated operations, the Utilities record a regulatory asset or liability to defer recognition of unrealized gains and losses on their electric and gas derivatives. As gains and losses are realized in future periods, they will be recognized as purchased power, gas and fuel costs in the Companies’ consolidated income statements. The Clean Energy Businesses record realized and unrealized gains and losses on their derivative contracts in purchased power, gas purchased for resale and non-utility revenue in the reporting period in which they occur. Management believes that these derivative instruments represent economic hedges that mitigate exposure to fluctuations in commodity prices.
35
The following table presents the realized and unrealized gains or losses on commodity derivatives that have been deferred or recognized in earnings for the three and nine months ended September 30, 2018 and 2017:
For the Three Months Ended September 30, | |||||||||||||||
Con Edison | CECONY | ||||||||||||||
(Millions of Dollars) | Balance Sheet Location | 2018 | 2017 | 2018 | 2017 | ||||||||||
Pre-tax gains/(losses) deferred in accordance with accounting rules for regulated operations: | |||||||||||||||
Current | Deferred derivative gains | $6 | $(4) | $6 | $(3) | ||||||||||
Noncurrent | Deferred derivative gains | — | 1 | 2 | 1 | ||||||||||
Total deferred gains/(losses) | $6 | $(3) | $8 | $(2) | |||||||||||
Current | Deferred derivative losses | $25 | $(11) | $25 | $(9) | ||||||||||
Current | Recoverable energy costs | (4) | (40) | (6) | (38) | ||||||||||
Noncurrent | Deferred derivative losses | 15 | (12) | 14 | (8) | ||||||||||
Total deferred gains/(losses) | $36 | $(63) | $33 | $(55) | |||||||||||
Net deferred gains/(losses) | $42 | $(66) | $41 | $(57) | |||||||||||
Income Statement Location | |||||||||||||||
Pre-tax gains/(losses) recognized in income | |||||||||||||||
Purchased power expense | $— | $— | $— | $— | |||||||||||
Gas purchased for resale | — | (47) | — | — | |||||||||||
Non-utility revenue | (7) | (a) | 5 | (b) | — | — | |||||||||
Total pre-tax gains/(losses) recognized in income | $(7) | $(42) | $— | $— | |||||||||||
(a) | For the three months ended September 30, 2018, Con Edison recorded unrealized pre-tax losses in non-utility operating revenue ($4 million). |
(b) | For the three months ended September 30, 2017, Con Edison recorded an unrealized pre-tax gain in non-utility operating revenue ($6 million). |
For the Nine Months Ended September 30, | |||||||||||||||
Con Edison | CECONY | ||||||||||||||
(Millions of Dollars) | Balance Sheet Location | 2018 | 2017 | 2018 | 2017 | ||||||||||
Pre-tax gains/(losses) deferred in accordance with accounting rules for regulated operations: | |||||||||||||||
Current | Deferred derivative gains | $(11) | $(26) | $(10) | $(22) | ||||||||||
Noncurrent | Deferred derivative gains | 5 | (2) | 4 | (2) | ||||||||||
Total deferred gains/(losses) | $(6) | $(28) | $(6) | $(24) | |||||||||||
Current | Deferred derivative losses | $21 | $10 | $23 | $11 | ||||||||||
Current | Recoverable energy costs | (13) | (125) | (14) | (116) | ||||||||||
Noncurrent | Deferred derivative losses | 23 | (40) | 21 | (36) | ||||||||||
Total deferred gains/(losses) | $31 | $(155) | $30 | $(141) | |||||||||||
Net deferred gains/(losses) | $25 | $(183) | $24 | $(165) | |||||||||||
Income Statement Location | |||||||||||||||
Pre-tax gains/(losses) recognized in income | |||||||||||||||
Purchased power expense | $— | $— | $— | $— | |||||||||||
Gas purchased for resale | (1) | (161) | — | — | |||||||||||
Non-utility revenue | (7) | (a) | 11 | (b) | — | — | |||||||||
Total pre-tax gains/(losses) recognized in income | $(8) | $(150) | $— | $— | |||||||||||
(a) | For the nine months ended September 30, 2018, Con Edison recorded unrealized pre-tax losses in non-utility operating revenue ($6 million). |
(b) | For the nine months ended September 30, 2017, Con Edison recorded an unrealized pre-tax gain in non-utility operating revenue ($2 million). |
36
The following table presents the hedged volume of Con Edison’s and CECONY’s derivative transactions at September 30, 2018:
Electric Energy (MWh) (a)(b) | Capacity (MW) (a) | Natural Gas (Dt) (a)(b) | Refined Fuels (gallons) | |||||
Con Edison | 30,590,984 | 8,134 | 195,821,882 | 2,688,000 | ||||
CECONY | 27,983,800 | 3,300 | 182,820,000 | 2,688,000 | ||||
(a) | Volumes are reported net of long and short positions, except natural gas collars where the volumes of long positions are reported. |
(b) | Excludes electric congestion and gas basis swap contracts, which are associated with electric and gas contracts and hedged volumes. |
The Companies are exposed to credit risk related to transactions entered into primarily for the various energy supply and hedging activities by the Utilities and the Clean Energy Businesses. Credit risk relates to the loss that may result from a counterparty’s nonperformance. The Companies use credit policies to manage this risk, including an established credit approval process, monitoring of counterparty limits, netting provisions within agreements, collateral or prepayment arrangements, credit insurance and credit default swaps. The Companies measure credit risk exposure as the replacement cost for open energy commodity and derivative positions plus amounts owed from counterparties for settled transactions. The replacement cost of open positions represents unrealized gains, net of any unrealized losses where the Companies have a legally enforceable right to offset.
At September 30, 2018, Con Edison and CECONY had $107 million and $17 million of credit exposure in connection with energy supply and hedging activities, net of collateral, respectively. Con Edison’s net credit exposure consisted of $44 million with independent system operators, $25 million with investment-grade counterparties, $22 million with non-investment grade/non-rated counterparties and $16 million with commodity exchange brokers. CECONY’s net credit exposure consisted of $10 million with investment-grade counterparties and $7 million with commodity exchange brokers.
The collateral requirements associated with, and settlement of, derivative transactions are included in net cash flows from operating activities in the Companies’ consolidated statement of cash flows. Most derivative instrument contracts contain provisions that may require a party to provide collateral on its derivative instruments that are in a net liability position. The amount of collateral to be provided will depend on the fair value of the derivative instruments and the party’s credit ratings.
The following table presents the aggregate fair value of the Companies’ derivative instruments with credit-risk-related contingent features that are in a net liability position, the collateral posted for such positions and the additional collateral that would have been required to be posted had the lowest applicable credit rating been reduced one level and to below investment grade at September 30, 2018:
(Millions of Dollars) | Con Edison (a) | CECONY (a) | ||||
Aggregate fair value – net liabilities | $19 | $9 | ||||
Collateral posted | 13 | 10 | ||||
Additional collateral (b) (downgrade one level from current ratings) | — | — | ||||
Additional collateral (b) (downgrade to below investment grade from current ratings) | 17 | (c) | 7 | (c) | ||
(a) | Non-derivative transactions for the purchase and sale of electricity and gas and qualifying derivative instruments, which have been designated as normal purchases or normal sales, are excluded from the table. These transactions primarily include purchases of electricity from independent system operators. In the event the Utilities and the Clean Energy Businesses were no longer extended unsecured credit for such purchases, the Companies would be required to post additional collateral of $1 million at September 30, 2018. For certain other such non-derivative transactions, the Companies could be required to post collateral under certain circumstances, including in the event counterparties had reasonable grounds for insecurity. |
(b) | The Companies measure the collateral requirements by taking into consideration the fair value amounts of derivative instruments that contain credit-risk-related contingent features that are in a net liability position plus amounts owed to counterparties for settled transactions and amounts required by counterparties for minimum financial security. The fair value amounts represent unrealized losses, net of any unrealized gains where the Companies have a legally enforceable right to offset. |
(c) | Derivative instruments that are net assets have been excluded from the table. At September 30, 2018, if Con Edison had been downgraded to below investment grade, it would have been required to post additional collateral for such derivative instruments of $22 million. |
Interest Rate Swap
In December 2016, the Clean Energy Businesses acquired Coram Wind which holds an interest rate swap that terminates in June 2024, pursuant to which it pays a fixed-rate of 2.0855 percent and receives a LIBOR-based variable rate. The fair value of this interest rate swap was an asset of $1 million as of September 30, 2018 and an immaterial amount as of December 31, 2017 on Con Edison’s consolidated balance sheet.
37
Note L – Fair Value Measurements
The accounting rules for fair value measurements and disclosures define fair value as the price that would be received to sell an asset or paid to transfer a liability in an orderly transaction between market participants at the measurement date in a principal or most advantageous market. Fair value is a market-based measurement that is determined based on inputs, which refer broadly to assumptions that market participants use in pricing assets or liabilities. These inputs can be readily observable, market corroborated, or generally unobservable firm inputs. The Companies often make certain assumptions that market participants would use in pricing the asset or liability, including assumptions about risk, and the risks inherent in the inputs to valuation techniques. The Companies use valuation techniques that maximize the use of observable inputs and minimize the use of unobservable inputs.
The accounting rules for fair value measurements and disclosures established a fair value hierarchy, which prioritizes the inputs to valuation techniques used to measure fair value in three broad levels. The rules require that assets and liabilities be classified in their entirety based on the level of input that is significant to the fair value measurement. Assessing the significance of a particular input may require judgment considering factors specific to the asset or liability, and may affect the valuation of the asset or liability and their placement within the fair value hierarchy. The Companies classify fair value balances based on the fair value hierarchy defined by the accounting rules for fair value measurements and disclosures as follows:
• | Level 1 – Consists of assets or liabilities whose value is based on unadjusted quoted prices in active markets at the measurement date. An active market is one in which transactions for assets or liabilities occur with sufficient frequency and volume to provide pricing information on an ongoing basis. This category includes contracts traded on active exchange markets valued using unadjusted prices quoted directly from the exchange. |
• | Level 2 – Consists of assets or liabilities valued using industry standard models and based on prices, other than quoted prices within Level 1, that are either directly or indirectly observable as of the measurement date. The industry standard models consider observable assumptions including time value, volatility factors and current market and contractual prices for the underlying commodities, in addition to other economic measures. This category includes contracts traded on active exchanges or in over-the-counter markets priced with industry standard models. |
• | Level 3 – Consists of assets or liabilities whose fair value is estimated based on internally developed models or methodologies using inputs that are generally less readily observable and supported by little, if any, market activity at the measurement date. Unobservable inputs are developed based on the best available information and subject to cost benefit constraints. This category includes contracts priced using models that are internally developed and contracts placed in illiquid markets. It also includes contracts that expire after the period of time for which quoted prices are available and internal models are used to determine a significant portion of the value. |
38
Assets and liabilities measured at fair value on a recurring basis as of September 30, 2018 and December 31, 2017 are summarized below.
2018 | 2017 | ||||||||||||||||||
(Millions of Dollars) | Level 1 | Level 2 | Level 3 | Netting Adjustment (e) | Total | Level 1 | Level 2 | Level 3 | Netting Adjustment (e) | Total | |||||||||
Con Edison | |||||||||||||||||||
Derivative assets: | |||||||||||||||||||
Commodity (a)(b)(c) | $3 | $40 | $8 | $(14) | $37 | $5 | $77 | $7 | $(39) | $50 | |||||||||
Interest rate swap (a)(b)(c) | — | 1 | — | — | 1 | — | — | — | — | — | |||||||||
Other (a)(b)(d) | 314 | 119 | — | — | 433 | 283 | 120 | — | — | 403 | |||||||||
Total assets | $317 | $160 | $8 | $(14) | $471 | $288 | $197 | $7 | $(39) | $453 | |||||||||
Derivative liabilities: | |||||||||||||||||||
Commodity (a)(b)(c) | $5 | $30 | $18 | $(22) | $31 | $8 | $93 | $6 | $(52) | $55 | |||||||||
CECONY | |||||||||||||||||||
Derivative assets: | |||||||||||||||||||
Commodity (a)(b)(c) | $3 | $33 | $1 | $(10) | $27 | $3 | $40 | $4 | $(7) | $40 | |||||||||
Other (a)(b)(d) | 293 | 113 | — | — | 406 | 260 | 114 | — | — | 374 | |||||||||
Total assets | $296 | $146 | $1 | $(10) | $433 | $263 | $154 | $4 | $(7) | $414 | |||||||||
Derivative liabilities: | |||||||||||||||||||
Commodity (a)(b)(c) | $4 | $22 | $1 | $(14) | $13 | $5 | $57 | $— | $(18) | $44 | |||||||||
(a) | The Companies’ policy is to review the fair value hierarchy and recognize transfers into and transfers out of the levels at the end of each reporting period. Con Edison and CECONY had $1 million of net commodity derivative liabilities transferred from level 3 to level 2 during the nine months ended September 30, 2018 because of availability of observable market data due to the decrease in the terms of certain contracts from beyond three years as of December 31, 2017 to less than three years as of September 30, 2018. Con Edison and CECONY had $11 million and $10 million, respectively, of commodity derivative liabilities transferred from level 3 to level 2 during the year ended December 31, 2017 because of availability of observable market data due to the decrease in the terms of certain contracts from beyond three years as of September 30, 2017 to less than three years as of December 31, 2017. |
(b) | Level 2 assets and liabilities include investments held in the deferred compensation plan and/or non-qualified retirement plans, exchange-traded contracts where there is insufficient market liquidity to warrant inclusion in Level 1, certain over-the-counter derivative instruments for electricity, refined products and natural gas. Derivative instruments classified as Level 2 are valued using industry standard models that incorporate corroborated observable inputs; such as pricing services or prices from similar instruments that trade in liquid markets, time value and volatility factors. |
(c) | The accounting rules for fair value measurements and disclosures require consideration of the impact of nonperformance risk (including credit risk) from a market participant perspective in the measurement of the fair value of assets and liabilities. At September 30, 2018 and December 31, 2017, the Companies determined that nonperformance risk would have no material impact on their financial position or results of operations. |
(d) | Other assets are comprised of assets such as life insurance contracts within the deferred compensation plan and non-qualified retirement plans. |
(e) | Amounts represent the impact of legally-enforceable master netting agreements that allow the Companies to net gain and loss positions and cash collateral held or placed with the same counterparties. |
The employees in the Companies’ risk management group develop and maintain the Companies’ valuation policies and procedures for, and verify pricing and fair value valuation of, commodity derivatives. Under the Companies’ policies and procedures, multiple independent sources of information are obtained for forward price curves used to value commodity derivatives. Fair value and changes in fair value of commodity derivatives are reported on a monthly basis to the Companies’ risk committees, comprised of officers and employees of the Companies that oversee energy hedging at the Utilities and the Clean Energy Businesses. The risk management group reports to the Companies’ Vice President and Treasurer.
39
Fair Value of Level 3 at September 30, 2018 | Valuation Techniques | Unobservable Inputs | Range | |||
(Millions of Dollars) | ||||||
Con Edison – Commodity | ||||||
Electricity | $(7) | Discounted Cash Flow | Forward energy prices (a) | $18.33-$79.20 per MWh | ||
Discounted Cash Flow | Forward capacity prices (a) | $1.70-$8.84 per kW-month | ||||
Natural Gas | (4) | Discounted Cash Flow | Forward natural gas prices (a) | $0.96-$10.51 per Dt | ||
Transmission Congestion Contracts/Financial Transmission Rights | 1 | Discounted Cash Flow | Inter-zonal forward price curves adjusted for historical zonal losses (b) | $0.37-$5.45 per MWh | ||
Total Con Edison—Commodity | $(10) | |||||
CECONY – Commodity | ||||||
Electricity | $(1) | Discounted Cash Flow | Forward capacity prices (a) | $1.70-$7.20 per kW-month | ||
Transmission Congestion Contracts | 1 | Discounted Cash Flow | Inter-zonal forward price curves adjusted for historical zonal losses (b) | $0.45-$4.18 per MWh | ||
Total CECONY—Commodity | $— | |||||
(a) | Generally, increases/(decreases) in this input in isolation would result in a higher/(lower) fair value measurement. |
(b) | Generally, increases/(decreases) in this input in isolation would result in a lower/(higher) fair value measurement. |
The table listed below provides a reconciliation of the beginning and ending net balances for assets and liabilities measured at fair value as of September 30, 2018 and 2017 and classified as Level 3 in the fair value hierarchy:
For the Three Months Ended September 30, | ||||||
Con Edison | CECONY | |||||
(Millions of Dollars) | 2018 | 2017 | 2018 | 2017 | ||
Beginning balance as of July 1, | $(4) | $(10) | $— | $(6) | ||
Included in earnings | 4 | 7 | 2 | 1 | ||
Included in regulatory assets and liabilities | (4) | (13) | — | (8) | ||
Settlements | (6) | (4) | (2) | (1) | ||
Ending balance as of September 30, | $(10) | $(20) | $— | $(14) | ||
For the Nine Months Ended September 30, | |||||||||
Con Edison | CECONY | ||||||||
(Millions of Dollars) | 2018 | 2017 | 2018 | 2017 | |||||
Beginning balance as of January 1, | $1 | $1 | $4 | $1 | |||||
Included in earnings | 4 | 8 | 4 | 1 | |||||
Included in regulatory assets and liabilities | (7) | (21) | (5) | (14) | |||||
Purchases | — | 1 | — | 1 | |||||
Settlements | (9) | (9) | (4) | (3) | |||||
Transfer out of level 3 | 1 | — | 1 | — | |||||
Ending balance as of September 30, | $(10) | $(20) | $— | $(14) | |||||
For the Utilities, realized gains and losses on Level 3 commodity derivative assets and liabilities are reported as part of purchased power, gas and fuel costs. The Utilities generally recover these costs in accordance with rate provisions approved by the applicable state public utilities regulators. Unrealized gains and losses for commodity derivatives are generally deferred on the consolidated balance sheet in accordance with the accounting rules for regulated operations.
For the Clean Energy Businesses, realized and unrealized gains and losses on Level 3 commodity derivative assets and liabilities are reported in non-utility revenues ($1 million loss and immaterial) and purchased power costs (immaterial and $4 million gain) on the consolidated income statement for the three months ended September 30, 2018 and 2017, respectively. Realized and unrealized gains and losses on Level 3 commodity derivative assets and liabilities are reported in non-utility revenues ($4 million loss and immaterial) and purchased power costs (immaterial and $3 million gain) on the consolidated income statement for the nine months ended September 30, 2018 and 2017, respectively. The change in fair value relating to Level 3 commodity derivative assets and liabilities held at September 30, 2018 and 2017 is included in non-utility revenues ($1 million loss and immaterial) and purchased power costs (immaterial and $4 million gain) on the consolidated income statement for the three months ended September 30, 2018 and 2017, respectively. For the nine months ended September 30, 2018 and 2017, the change in fair value relating to Level 3 commodity derivative assets and liabilities is included in non-utility revenues ($5
40
million loss and immaterial) and purchased power costs (immaterial and $2 million gain), respectively, on the consolidated income statement.
Note M – Variable Interest Entities
Con Edison enters into arrangements including leases, partnerships and electricity purchase agreements, with various entities. As a result of these arrangements, Con Edison retains or may retain a variable interest in these entities.
CECONY has an ongoing long-term electricity purchase agreement with Brooklyn Navy Yard Cogeneration Partners, LP, a potential variable interest entity (VIE). In 2017, a request was made of this counterparty for information necessary to determine whether the entity was a VIE and whether CECONY is the primary beneficiary; however, the information was not made available. The payments for this contract constitute CECONY’s maximum exposure to loss with respect to the potential VIE.
The following table summarizes the VIEs in which Con Edison Development has entered into as of September 30, 2018:
Project Name (a) | Generating Capacity (b) (MW AC) | Power Purchase Agreement Term (in Years) | Year of Initial Investment | Location | Maximum Exposure to Loss (Millions of Dollars) (c) |
Copper Mountain Solar 3 (d) | 128 | 20 | 2014 | Nevada | $169 |
Mesquite Solar 1 (d) | 83 | 20 | 2013 | Arizona | 101 |
Copper Mountain Solar 2 (d) | 75 | 25 | 2013 | Nevada | 80 |
California Solar (d) | 55 | 25 | 2012 | California | 59 |
Broken Bow II (d) | 38 | 25 | 2014 | Nebraska | 42 |
Texas Solar 4 | 32 | 25 | 2014 | Texas | 19 |
(a) With the exception of Texas Solar 4, Con Edison’s ownership interest is 50 percent and these projects are accounted for using the equity method of accounting. With the exception of Texas Solar 4, Con Edison is not the primary beneficiary since the power to direct the activities that most significantly impact the economics of the entities are shared equally between Con Edison Development and third parties. Con Edison’s ownership interest in Texas Solar 4 is 80 percent and is consolidated in the financial statements. Con Edison is the primary beneficiary since the power to direct the activities that most significantly impact the economics of Texas Solar 4 is held by Con Edison Development.
(b) Represents Con Edison Development’s ownership interest in the project.
(c) For investments accounted for under the equity method, maximum exposure is equal to the carrying value of the investment on the consolidated balance sheet. For consolidated investments, such as Texas Solar 4, maximum exposure is equal to the net assets of the project on the consolidated balance sheet less any applicable noncontrolling interest ($7 million for Texas Solar 4). Con Edison did not provide any financial or other support during the three and nine months ended September 30, 2018 that was not previously contractually required.
(d) | In September 2018, a Con Edison Development subsidiary agreed to purchase Sempra Solar Holdings, LLC, subsidiaries of which have a 50 percent ownership interest in these projects. Upon the closing of the acquisition, Con Edison expects to account for these projects on a consolidated basis. See Note O. |
Note N – New Financial Accounting Standards
In February 2016, the FASB issued amendments on financial reporting of leasing transactions through Accounting Standards Update (ASU) No. 2016-02, “Leases (Topic 842)." The amendments require lessees to recognize assets and liabilities on the balance sheet and disclose key information about leasing arrangements. Lessees will need to recognize a right-of-use asset and a lease liability for virtually all of their leases (other than leases that meet the definition of a short-term lease). The Utilities, as regulated entities, are permitted to continue to recognize expense using the timing that conforms to the regulatory rate treatment. Lessor accounting is similar to the current model, but updated to align with “Revenue from Contracts with Customers (Topic 606)." The amendments are effective, and the Companies plan to adopt the amendments, for reporting periods beginning after December 15, 2018. The amendments must be adopted using a modified retrospective transition and provide for certain practical expedients.
Upon adoption of the amendments, the Companies expect to elect the following practical expedients: (1) for leases commenced prior to adoption date, the following three transition expedients that will allow the Companies to not reassess: (a) whether expired contracts contain leases; (b) the lease classification for expired leases and (c) the initial direct costs for existing leases; (2) if elected for an underlying asset class, an expedient that will allow the Companies to not apply the recognition requirements to short-term leases and an expedient that will allow the Companies to account for lease and associated non-lease components as a single lease component; (3) an expedient that allows the use of hindsight to determine lease term; and (4) an expedient that will allow the Companies to not evaluate under Topic 842 land easements that exist or expired before the entity’s adoption of Topic 842 and that were not previously accounted for as leases under the current lease standard. For leases
41
currently classified as operating leases, upon adoption of the amendments, the Companies expect to recognize on their balance sheets right-of-use assets and lease liabilities. The adoption of the amendments is not expected to have a material effect on the Companies’ liquidity. The Companies are continuing to evaluate the potential impact of the amendments on the Companies’ results of operations and the additional disclosures required. The Companies will implement additional internal controls related to the amendments, however the adoption of the amendments is not expected to require a change that will materially affect the Companies’ internal control over financial reporting.
In August 2017, the FASB issued amendments to the guidance for derivatives and hedging through ASU 2017-12, “Derivatives and Hedging (Topic 815): Targeted Improvements to Accounting for Hedging Activities.” The amendments in this update provide greater clarification on hedge accounting for risk components, presentation and disclosure of hedging instruments, and overall targeted improvements to simplify hedge accounting. For public entities, the amendments are effective, and the Companies plan to adopt the amendments, for reporting periods beginning after December 15, 2018. The Companies are in the process of evaluating the potential impact of the new guidance on the Companies’ financial position, results of operations and liquidity.
In February 2018, the FASB issued amendments to the guidance for reporting comprehensive income through ASU 2018-02, “Income Statement-Reporting Comprehensive Income (Topic 220): Reclassification of Certain Tax Effects from Accumulated Other Comprehensive Income.” The amendments allow a reclassification from accumulated other comprehensive income to retained earnings for stranded tax effects resulting from the TCJA. For public entities, the amendments are effective for reporting periods beginning after December 15, 2018, with early adoption permitted. The Companies are electing to adopt the amendments in the fourth quarter of 2018. The impact of adoption on the Companies’ financial position, results of operations and liquidity is expected to be immaterial.
In August 2018, the FASB issued amendments to the guidance for internal use software through ASU 2018-15, “Intangibles - Goodwill and Other - Internal-Use Software (Subtopic 350-40): Customer’s Accounting for Implementation Costs Incurred in a Cloud Computing Arrangement That is a Service Contract.” The amendments align the requirements for capitalizing implementation costs incurred in a hosting arrangement that is a service contract with the requirements for capitalizing implementation costs incurred to develop or obtain internal-use software. For public entities, the amendments are effective for reporting periods beginning after December 15, 2019, with early adoption permitted. The Companies elected to adopt the amendments in the third quarter of 2018, prospectively for all in-scope implementation costs incurred after the date of adoption. The impact of adoption on the Companies’ financial position, results of operations and liquidity was immaterial.
Note O – Acquisitions
In September 2018, a Con Edison Development subsidiary agreed to purchase Sempra Solar Holdings, LLC, a Sempra Energy subsidiary, for $1,540 million, subject to closing adjustments, including working capital. Sempra Solar Holdings, LLC has ownership interests in 981 megawatts (AC) of operating renewable electric production projects, including its 379 megawatts (AC) share of projects in which its subsidiaries have a 50 percent ownership interest and Con Edison Development subsidiaries have the remaining ownership interests (see Note M), and certain development rights with respect to solar electric production and energy storage projects. Most of the operating projects that are not jointly-owned have tax equity investors to which a percentage of earnings, tax attributes and cash flows are allocated. Sempra Solar Holdings, LLC subsidiaries have $576 million of existing project debt, including project debt associated with their share of the jointly-owned projects. Con Edison Development subsidiaries have $506 million of existing project debt associated with their share of the jointly-owned projects. Con Edison has been accounting for the interests of Con Edison Development subsidiaries in the jointly-owned projects under the equity method. Upon the closing of the acquisition, Con Edison expects to account for these projects and the other projects acquired on a consolidated basis. The acquisition is subject to customary closing conditions, including, among other things, expiration or early termination of the waiting period under the Hart-Scott-Rodino Antitrust Improvements Act of 1976, as amended, and the approvals of the FERC and the U.S. Department of Energy. Several banks have committed to provide bridge financing for the acquisition, subject to certain customary conditions. Con Edison has guaranteed the obligations of the Con Edison Development subsidiary under the purchase and sale agreement for the acquisition, including the payment of the purchase price for the acquisition. See Note H.
42
Item 2: Management’s Discussion and Analysis of Financial Condition and Results of Operations
This combined management’s discussion and analysis of financial condition and results of operations (MD&A) relates to the consolidated financial statements (the Third Quarter Financial Statements) included in this report of two separate registrants: Consolidated Edison, Inc. (Con Edison) and Consolidated Edison Company of New York, Inc. (CECONY). As used in this report, the term the “Companies” refers to Con Edison and CECONY. CECONY is a subsidiary of Con Edison and, as such, information in this management’s discussion and analysis about CECONY applies to Con Edison.
This MD&A should be read in conjunction with the Third Quarter Financial Statements and the notes thereto, the MD&A in Item 7 of the Companies’ combined Annual Report on Form 10-K for the year ended December 31, 2017 (File Nos. 1-14514 and 1-1217, the Form 10-K) and the MD&A in Part 1, Item 2 of the Companies' combined Quarterly Report on Form 10-Q for the quarterly periods ended March 31, 2018 and June 30, 2018 (File Nos. 1-14514 and 1-1217).
Information in any item of this report referred to in this discussion and analysis is incorporated by reference herein. The use of terms such as “see” or “refer to” shall be deemed to incorporate by reference into this discussion and analysis the information to which reference is made.
Con Edison, incorporated in New York State in 1997, is a holding company that owns all of the outstanding common stock of CECONY, Orange and Rockland Utilities, Inc. (O&R), Con Edison Clean Energy Businesses, Inc. and Con Edison Transmission, Inc. As used in this report, the term the “Utilities” refers to CECONY and O&R.
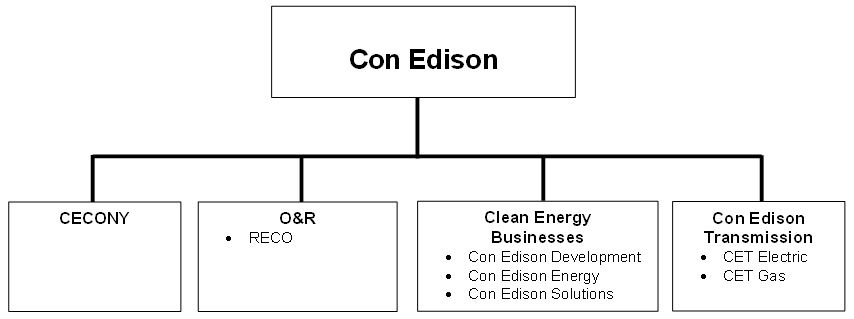
Con Edison’s principal business operations are those of CECONY, O&R, the Clean Energy Businesses and Con Edison Transmission. CECONY’s principal business operations are its regulated electric, gas and steam delivery businesses. O&R’s principal business operations are its regulated electric and gas delivery businesses. The Clean Energy Businesses develop, own and operate renewable and energy infrastructure projects and provide energy-related products and services to wholesale and retail customers. Con Edison Transmission invests in electric transmission facilities and gas pipeline and storage facilities.
Con Edison seeks to provide shareholder value through continued dividend growth, supported by earnings growth in regulated utilities and contracted assets. The company invests to provide reliable, resilient, safe and clean energy critical for New York City’s growing economy. The company is an industry leading owner and operator of contracted, large-scale solar generation in the United States. Con Edison is a responsible neighbor, helping the communities it serves become more sustainable.
43
CECONY
Electric
CECONY provides electric service to approximately 3.4 million customers in all of New York City (except a part of Queens) and most of Westchester County, an approximately 660 square mile service area with a population of more than nine million.
During the summer of 2018, electric peak demand in CECONY's service area was 12,686 MW (which occurred on August 29, 2018). At design conditions, electric peak demand in the company's service area would have been approximately 13,232 MW in 2018 compared to the company's forecast of 13,300 MW. The company's five-year forecast of average annual growth of the electric peak demand in its service area at design conditions remained unchanged at approximately 0.1 percent for 2019 to 2023.
Gas
CECONY delivers gas to approximately 1.1 million customers in Manhattan, the Bronx, parts of Queens and most of Westchester County.
In June 2018, the company decreased its five-year forecast of average annual growth of the peak gas demand in its
service area at design conditions from approximately 1.6 percent (for 2018 to 2022) to 1.3 percent (for 2019 to
2023). The decrease reflects, among other things, that in rolling the forecast forward a year, another year of oil-to gas conversions has been completed and fewer opportunities to convert remain.
Steam
CECONY operates the largest steam distribution system in the United States by producing and delivering approximately 21,150 MMlb of steam annually to approximately 1,600 customers in parts of Manhattan.
In June 2018, the company's five-year forecast of average annual change in the peak steam demand in its
service area at design conditions remained unchanged at approximately (0.5) percent for 2019 to 2023.
O&R
Electric
O&R and its utility subsidiary, Rockland Electric Company (RECO) (together referred to herein as O&R) provide electric service to approximately 0.3 million customers in southeastern New York and northern New Jersey, an approximately 1,300 square mile service area.
During the summer of 2018, electric peak demand in O&R's service area was 1,470 MW (which occurred on July 2, 2018). At design conditions, electric peak demand in the company's service area would have been approximately 1,603 MW in 2018 compared to the company's forecast of 1,620 MW. The company’s five-year forecast of average annual change in the electric peak demand in its service area at design conditions is approximately (0.3) percent for 2019 to 2023 (as compared to flat for 2018 to 2022).
Gas
O&R delivers gas to over 0.1 million customers in southeastern New York.
In June 2018, the company increased its five-year forecast of average annual growth of the peak gas demand in its
service area at design conditions from approximately 0.3 percent (for 2018 to 2022) to 0.6 percent (for 2019 to
2023), primarily due to increase in average customer usage and growth in the number of customers.
Clean Energy Businesses
Con Edison Clean Energy Businesses, Inc. has three wholly-owned subsidiaries: Consolidated Edison Development, Inc. (Con Edison Development), Consolidated Edison Energy, Inc. (Con Edison Energy) and Consolidated Edison Solutions, Inc. (Con Edison Solutions). Con Edison Clean Energy Businesses, Inc., together with these subsidiaries, are referred to in this report as the Clean Energy Businesses. The Clean Energy Businesses develop, own and operate renewable and energy infrastructure projects and provide energy-related products and services to wholesale and retail customers. In September 2018, a Con Edison Development subsidiary agreed to purchase Sempra Solar Holdings, LLC (see Note O to the Third Quarter Financial Statements).
44
Con Edison Transmission
Con Edison Transmission, Inc. invests in electric and gas transmission projects through its wholly-owned subsidiaries, Consolidated Edison Transmission, LLC (CET Electric) and Con Edison Gas Pipeline and Storage, LLC (CET Gas). CET Electric owns a 45.7 percent interest in New York Transco LLC, which owns and is proposing to build additional electric transmission assets in New York. CET Gas owns, through subsidiaries, a 50 percent interest in Stagecoach Gas Services, LLC, a joint venture that owns, operates and will further develop an existing gas pipeline and storage business located in northern Pennsylvania and southern New York. Also, CET Gas and CECONY own 71.2 percent and 28.8 percent interests, respectively, in Honeoye Storage Corporation that operates a gas storage facility in upstate New York. In addition, CET Gas owns interests in two Mountain Valley Pipeline LLC joint venture projects: a 12.5 percent interest in a 300-mile gas transmission project being constructed in West Virginia and Virginia (Mountain Valley Pipeline) and a 6.375 percent interest in a proposed 70-mile gas pipeline system in Virginia and North Carolina (MVP Southgate). Con Edison Transmission, Inc., together with CET Electric and CET Gas, are referred to in this report as Con Edison Transmission.
Certain financial data of Con Edison’s businesses are presented below:
For the Three Months Ended September 30, 2018 | For the Nine Months Ended September 30, 2018 | At September 30, 2018 | ||||||||||||||
(Millions of Dollars, except percentages) | Operating Revenues | Net Income | Operating Revenues | Net Income | Assets | |||||||||||
CECONY | $2,899 | 87 | % | $431 | 99 | % | $8,121 | 87 | % | $969 | 92 | % | $41,859 | 84 | % | |
O&R | 246 | 8 | 21 | 5 | 691 | 7 | 52 | 5 | 2,842 | 6 | ||||||
Total Utilities | 3,145 | 95 | 452 | 104 | 8,812 | 94 | 1,021 | 97 | 44,701 | 90 | ||||||
Clean Energy Businesses (a) | 181 | 5 | 27 | 6 | 573 | 6 | 58 | 6 | 3,075 | 6 | ||||||
Con Edison Transmission | 1 | — | 13 | 3 | 3 | — | 35 | 3 | 1,264 | 3 | ||||||
Other (b) | 1 | — | (57) | (13 | ) | — | — | (63) | (6 | ) | 504 | 1 | ||||
Total Con Edison | $3,328 | 100 | % | $435 | 100 | % | $9,388 | 100 | % | $1,051 | 100 | % | $49,544 | 100 | % | |
(a) | Net income from the Clean Energy Businesses for the three and nine months ended September 30, 2018 includes $(2) million and $(3) million of net after-tax mark-to-market losses, respectively. |
(b) | Other includes parent company and consolidation adjustments. Net income includes $(42) million of income tax expense resulting from a re-measurement of the company's deferred tax assets and liabilities following the issuance of proposed regulations relating to the Tax Cuts and Jobs Act of 2017 (TCJA) for the three and nine months ended September 30, 2018. See Note I to the Third Quarter Financial Statements. Net income for the three and nine months ended September 30, 2018 also includes $10 million (net of tax) of transaction costs related to a Con Edison Development subsidiary’s agreement to purchase Sempra Solar Holdings, LLC. See Note O to the Third Quarter Financial Statements. |
Results of Operations
Net income and earnings per share for the three and nine months ended September 30, 2018 and 2017 were as follows:
For the Three Months Ended September 30, | For the Nine Months Ended September 30, | ||||||||||||
2018 | 2017 | 2018 | 2017 | 2018 | 2017 | 2018 | 2017 | ||||||
(Millions of Dollars, except per share amounts) | Net Income | Earnings per Share | Net Income | Earnings per Share | |||||||||
CECONY | $431 | $401 | $1.38 | $1.30 | $969 | $883 | $3.12 | $2.88 | |||||
O&R | 21 | 22 | 0.07 | 0.07 | 52 | 53 | 0.17 | 0.18 | |||||
Clean Energy Businesses (a) | 27 | 26 | 0.10 | 0.08 | 58 | 54 | 0.19 | 0.18 | |||||
Con Edison Transmission | 13 | 9 | 0.04 | 0.03 | 35 | 25 | 0.11 | 0.08 | |||||
Other (b) | (57) | (1) | (0.19) | — | (63) | 5 | (0.21 | ) | 0.01 | ||||
Con Edison (c) | $435 | $457 | $1.40 | $1.48 | $1,051 | $1,020 | $3.38 | $3.33 | |||||
(a) | Includes $(2) million or $0.00 a share and $4 million or $0.01 a share of net after-tax mark-to-market gains/(losses) for the three months ended September 30, 2018 and 2017, respectively, and $(3) million or $(0.01) a share and $1 million or $0.01 a share of net after-tax mark-to-market gains/(losses) for the nine months ended September 30, 2018 and 2017, respectively. Also includes a $1 million or $0.00 a share net after-tax gain on the sale of a solar electric production project for the nine months ended September 30, 2017. |
(b) | Other includes parent company and consolidation adjustments. Includes $(42) million or $(0.14) a share of income tax expense resulting from a re-measurement of the company's deferred tax assets and liabilities following the issuance of proposed regulations relating to the TCJA for the three and nine months ended September 30, 2018. See Note I to the Third Quarter Financial Statements. Also includes for the three and nine months ended September 30, 2018 $10 million (net of tax) or $0.03 a share of transaction costs related to a Con Edison Development subsidiary’s agreement to purchase Sempra Solar Holdings, LLC. See Note O to the Third Quarter Financial Statements. |
45
(c) | Earnings per share on a diluted basis were $1.39 a share and $1.48 a share for the three months ended September 30, 2018 and 2017, respectively, and $3.37 a share and $3.31 a share for the nine months ended September 30, 2018 and 2017, respectively. |
The following tables present the estimated effect on earnings per share and net income for the three and nine months ended September 30, 2018 periods as compared with the 2017 periods, resulting from these and other major factors:
46
Variation for the Three Months Ended September 30, 2018 vs. 2017 | ||||
Earnings per Share | Net Income (Millions of Dollars) | |||
CECONY (a) | ||||
Changes in rate plans | $0.22 | $69 | Reflects primarily higher electric and gas net base revenues of $0.19 a share and $0.01 a share, respectively, and growth in the number of gas customers of $0.01 a share. Electric and gas base rates increased in January 2018 in accordance with the company's rate plans. | |
Weather impact on steam revenues | — | 1 | ||
Operations and maintenance expenses | (0.03) | (9) | Reflects higher consultant costs of $(0.02) a share and higher steam operations costs of $(0.02) a share. | |
Depreciation, property taxes and other tax matters | (0.13) | (40) | Reflects higher net property taxes of $(0.07) a share and depreciation and amortization expense of $(0.05) a share. | |
Other | 0.02 | 9 | Reflects primarily timing of the deferral for customers of estimated net benefits of the TCJA of $0.08 a share, offset, in part, by higher interest expense on long-term debt of $(0.05) a share and the dilutive effect of Con Edison's stock issuances of $(0.02) a share. | |
Total CECONY | 0.08 | 30 | ||
O&R (a) | ||||
Operations and maintenance expenses | (0.01) | (3) | Reflects reduction of a regulatory asset associated with certain site investigation and environmental remediation costs of $(0.02) a share, partially offset by the deferral as a regulatory asset of costs for storm preparation of $0.01 a share. | |
Depreciation, property taxes and other tax matters | 0.01 | 2 | Reflects primarily timing of the deferral for customers of estimated net benefits of the TCJA. | |
Total O&R | — | (1) | ||
Clean Energy Businesses | ||||
Operating revenues less energy costs | (0.08) | (26) | Reflects primarily timing of engineering, procurement and construction services revenues. | |
Operations and maintenance expenses | 0.07 | 22 | Reflects primarily lower engineering, procurement and construction costs and energy service costs. | |
Other | 0.03 | 5 | ||
Total Clean Energy Businesses | 0.02 | 1 | ||
Con Edison Transmission | 0.01 | 4 | Reflects income from equity investments. | |
Other, including parent company expenses | (0.19) | (56) | Includes TCJA re-measurement of $(0.14) a share and Sempra Solar Holdings, LLC transaction costs of $(0.03) a share. Also reflects the New York State capital tax in 2018. | |
Total Reported (GAAP basis) | $(0.08) | $(22) | ||
a. Under the revenue decoupling mechanisms in the Utilities’ New York electric and gas rate plans and the weather-normalization clause applicable to their gas businesses, revenues are generally not affected by changes in delivery volumes from levels assumed when rates were approved. In general, the utilities recover on a current basis the fuel, gas purchased for resale and purchased power costs they incur in supplying energy to their full-service customers. Accordingly, such costs do not generally affect Con Edison’s results of operations. | ||||
47
Variation for the Nine Months Ended September 30, 2018 vs. 2017 | |||
Earnings per Share | Net Income (Millions of Dollars) | ||
CECONY (a) | |||
Changes in rate plans | $0.69 | $212 | Reflects primarily higher electric and gas net base revenues of $0.48 a share and $0.13 a share, respectively, and growth in the number of gas customers of $0.05 a share. Electric and gas base rates increased in January 2018 in accordance with the company's rate plans. |
Weather impact on steam revenues | 0.08 | 23 | Steam revenues were $0.02 a share higher in the 2018 period due to the estimated impact of colder than normal April weather. Steam revenues were $(0.05) a share lower in the 2017 period due to the estimated impact of warmer than normal winter weather. |
Operations and maintenance expenses | (0.10) | (32) | Reflects primarily higher consultant costs of $(0.06) a share and storm-related costs of $(0.05) a share. |
Depreciation, property taxes and other tax matters | (0.29) | (90) | Reflects higher net property taxes of $(0.19) a share and depreciation and amortization expense of $(0.14) a share, offset in part by two New York State sales and use tax refunds of $0.04 a share. |
Other | (0.14) | (27) | Reflects primarily higher interest expense on long-term debt of $(0.11) a share, regulatory reserve related to electric and steam earnings sharing of $(0.03) a share, and the dilutive effect of Con Edison's stock issuances of $(0.05) a share, offset, in part, by timing of the deferral for customers of estimated net benefits of the TCJA of $0.05 a share. |
Total CECONY | 0.24 | 86 | |
O&R (a) | |||
Changes in rate plans | 0.03 | 11 | Reflects primarily higher gas net base revenues. Gas base rates increased in November 2017 in accordance with the company's gas rate plan. |
Operations and maintenance expenses | (0.03) | (10) | Reflects reduction of a regulatory asset associated with certain site investigation and environmental remediation costs of $(0.02) a share and higher pension costs of $(0.02) a share, partially offset by lower healthcare expenses of $0.01 a share. |
Depreciation, property taxes and other tax matters | (0.01) | (2) | Reflects lower depreciation and amortization expense. |
Total O&R | (0.01) | (1) | |
Clean Energy Businesses | |||
Operating revenues less energy costs | 0.12 | 37 | Reflects primarily higher renewable revenues, including engineering, procurement and construction services and an increase in renewable electric production projects in operation. |
Operations and maintenance expenses | (0.13) | (38) | Reflects primarily higher engineering, procurement and construction costs. |
Depreciation | (0.01) | (2) | |
Net interest expense | (0.01) | (4) | |
Other | 0.04 | 11 | |
Total Clean Energy Businesses | 0.01 | 4 | |
Con Edison Transmission | 0.03 | 10 | Reflects income from equity investments. |
Other, including parent company expenses | (0.22) | (68) | Includes TCJA re-measurement of $(0.14) a share and Sempra Solar Holdings, LLC transaction costs of $(0.03) a share. Also reflects the New York State capital tax in 2018. |
Total Reported (GAAP basis) | $0.05 | $31 | |
a. Under the revenue decoupling mechanisms in the Utilities’ New York electric and gas rate plans and the weather-normalization clause applicable to their gas businesses, revenues are generally not affected by changes in delivery volumes from levels assumed when rates were approved. In general, the utilities recover on a current basis the fuel, gas purchased for resale and purchased power costs they incur in supplying energy to their full-service customers. Accordingly, such costs do not generally affect Con Edison’s results of operations. | |||
48
The Companies’ other operations and maintenance expenses for the three and nine months ended September 30, 2018 and 2017 were as follows:
For the Three Months Ended September 30, | For the Nine Months Ended September 30, | |||
(Millions of Dollars) | 2018 | 2017 | 2018 | 2017 |
CECONY | ||||
Operations | $393 | $386 | $1,186 | $1,147 |
Pensions and other postretirement benefits | 18 | 15 | 53 | 44 |
Health care and other benefits | 46 | 45 | 132 | 127 |
Regulatory fees and assessments (a) | 132 | 142 | 335 | 355 |
Other | 77 | 67 | 220 | 211 |
Total CECONY | 666 | 655 | 1,926 | 1,884 |
O&R | 80 | 75 | 234 | 221 |
Clean Energy Businesses (b) | 50 | 79 | 226 | 174 |
Con Edison Transmission | 3 | 3 | 7 | 7 |
Other (c) | (2) | (1) | (4) | (3) |
Total other operations and maintenance expenses | $797 | $811 | $2,389 | $2,283 |
(a) | Includes Demand Side Management, System Benefit Charges and Public Service Law 18A assessments which are collected in revenues. |
(b) | The increase in operations and maintenance for the nine months ended September 30, 2018 compared with the 2017 period is due primarily to higher engineering, procurement and construction costs. |
(c) | Includes parent company and consolidation adjustments. |
A discussion of the results of operations by principal business segment for the three and nine months ended September 30, 2018 and 2017 follows. For additional business segment financial information, see Note J to the Third Quarter Financial Statements.
49
Three Months Ended September 30, 2018 Compared with Three Months Ended September 30, 2017
The Companies’ results of operations in 2018 compared with 2017 were:
CECONY | O&R | Clean Energy Businesses | Con Edison Transmission | Other (a) | Con Edison (b) | ||||||||||||||||||
(Millions of Dollars) | Increases (Decreases) Amount | Increases (Decreases) Percent | Increases (Decreases) Amount | Increases (Decreases) Percent | Increases (Decreases) Amount | Increases (Decreases) Percent | Increases (Decreases) Amount | Increases (Decreases) Percent | Increases (Decreases) Amount | Increases (Decreases) Percent | Increases (Decreases) Amount | Increases (Decreases) Percent | |||||||||||
Operating revenues | $100 | 3.6 | % | $12 | 5.1 | % | $4 | 2.3 | % | $— | — | % | $1 | — | % | $117 | 3.6 | % | |||||
Purchased power | 72 | 18.0 | 13 | 21.7 | — | — | — | — | — | — | 85 | 18.5 | |||||||||||
Fuel | 9 | 30.0 | — | — | — | — | — | — | — | — | 9 | 30.0 | |||||||||||
Gas purchased for resale | 8 | 13.8 | 2 | 20.0 | 38 | 80.9 | — | — | 1 | — | 49 | 42.6 | |||||||||||
Other operations and maintenance | 11 | 1.7 | 5 | 6.7 | (29) | (36.7 | ) | — | — | (1) | Large | (14) | (1.7 | ) | |||||||||
Depreciation and amortization | 22 | 7.3 | 1 | 5.6 | (1) | (5.3 | ) | — | — | 1 | — | 23 | 6.8 | ||||||||||
Taxes, other than income taxes | 50 | 9.6 | (1) | (4.8 | ) | — | — | — | — | 4 | — | 53 | 9.7 | ||||||||||
Operating income | (72) | (8.6 | ) | (8) | (16.0 | ) | (4) | (13.8 | ) | — | — | (4) | Large | (88) | (9.6 | ) | |||||||
Other income less deductions | 3 | 8.3 | — | — | — | — | 3 | 14.3 | (15) | — | (9) | Large | |||||||||||
Net interest expense | 18 | 11.5 | 1 | 11.1 | 1 | 8.3 | 1 | 25.0 | (1) | (33.3 | ) | 20 | 10.8 | ||||||||||
Income before income tax expense | (87) | (13.5 | ) | (9) | (25.0 | ) | (5) | (14.3 | ) | 2 | 13.3 | (18) | Large | (117) | (16.1 | ) | |||||||
Income tax expense | (117) | (48.3 | ) | (8) | (57.1 | ) | (6) | (66.7 | ) | (2) | (33.3 | ) | 38 | Large | (95) | (35.2 | ) | ||||||
Net income | $30 | 7.5 | % | $(1) | (4.5 | )% | $1 | 3.8 | % | $4 | 44.4 | % | $(56) | Large | $(22) | (4.8 | )% | ||||||
(a) | Includes parent company and consolidation adjustments. |
(b) | Represents the consolidated results of operations of Con Edison and its businesses. |
50
CECONY
For the Three Months Ended September 30, 2018 | For the Three Months Ended September 30, 2017 | ||||||||||||||
(Millions of Dollars) | Electric | Gas | Steam | 2018 Total | Electric | Gas | Steam | 2017 Total | 2018-2017 Variation | ||||||
Operating revenues | $2,571 | $264 | $64 | $2,899 | $2,469 | $268 | $62 | $2,799 | $100 | ||||||
Purchased power | 465 | — | 7 | 472 | 393 | — | 7 | 400 | 72 | ||||||
Fuel | 34 | — | 5 | 39 | 24 | — | 6 | 30 | 9 | ||||||
Gas purchased for resale | — | 66 | — | 66 | — | 58 | — | 58 | 8 | ||||||
Other operations and maintenance | 518 | 101 | 47 | 666 | 519 | 98 | 38 | 655 | 11 | ||||||
Depreciation and amortization | 248 | 52 | 22 | 322 | 232 | 47 | 21 | 300 | 22 | ||||||
Taxes, other than income taxes | 456 | 79 | 35 | 570 | 418 | 71 | 31 | 520 | 50 | ||||||
Operating income | $850 | $(34) | $(52) | $764 | $883 | $(6) | $(41) | $836 | $(72) | ||||||
Electric
CECONY’s results of electric operations for the three months ended September 30, 2018 compared with the 2017 period were as follows:
For the Three Months Ended | |||
(Millions of Dollars) | September 30, 2018 | September 30, 2017 | Variation |
Operating revenues | $2,571 | $2,469 | $102 |
Purchased power | 465 | 393 | 72 |
Fuel | 34 | 24 | 10 |
Other operations and maintenance | 518 | 519 | (1) |
Depreciation and amortization | 248 | 232 | 16 |
Taxes, other than income taxes | 456 | 418 | 38 |
Electric operating income | $850 | $883 | $(33) |
CECONY’s electric sales and deliveries for the three months ended September 30, 2018 compared with the 2017 period were:
Millions of kWh Delivered | Revenues in Millions (a) | |||||||||||||
For the Three Months Ended | For the Three Months Ended | |||||||||||||
Description | September 30, 2018 | September 30, 2017 | Variation | Percent Variation | September 30, 2018 | September 30, 2017 | Variation | Percent Variation | ||||||
Residential/Religious (b) | 3,777 | 3,237 | 540 | 16.7 | % | $988 | $805 | $183 | 22.7 | % | ||||
Commercial/Industrial | 2,706 | 2,570 | 136 | 5.3 | 542 | 534 | 8 | 1.5 | ||||||
Retail choice customers | 7,756 | 7,510 | 246 | 3.3 | 910 | 867 | 43 | 5.0 | ||||||
NYPA, Municipal Agency and other sales | 2,758 | 2,705 | 53 | 2.0 | 225 | 207 | 18 | 8.7 | ||||||
Other operating revenues (c) | — | — | — | — | (94) | 56 | (150) | Large | ||||||
Total | 16,997 | 16,022 | 975 | 6.1 | % | (d) | $2,571 | $2,469 | $102 | 4.1 | % | |||
(a) | Revenues from electric sales are subject to a revenue decoupling mechanism, as a result of which delivery revenues generally are not affected by changes in delivery volumes from levels assumed when rates were approved. |
(b) | “Residential/Religious” generally includes single-family dwellings, individual apartments in multi-family dwellings, religious organizations and certain other not-for-profit organizations. |
(c) | Other electric operating revenues generally reflect changes in regulatory assets and liabilities in accordance with the revenue decoupling mechanism and other provisions of the company’s rate plans. |
(d) | After adjusting for variations, primarily weather and billing days, electric delivery volumes in CECONY’s service area decreased 0.1 percent in the three months ended September 30, 2018 compared with the 2017 period. |
51
Operating revenues increased $102 million in the three months ended September 30, 2018 compared with the 2017 period due primarily to higher revenues from the electric rate plan ($81 million), higher purchased power expenses ($72 million) and fuel expenses ($10 million), offset in part by the reduction in other operating revenues resulting from the deferral as a regulatory liability of estimated net benefits for the 2018 period under the TCJA (see “Other Regulatory Matters” in Note B to the Third Quarter Financial Statements) ($76 million).
Purchased power expenses increased $72 million in the three months ended September 30, 2018 compared with the 2017 period due to higher unit costs ($37 million) and purchased volumes ($35 million).
Fuel expenses increased $10 million in the three months ended September 30, 2018 compared with the 2017 period due to higher unit costs ($9 million) and purchased volumes from the company's electric generating facilities ($1 million).
Other operations and maintenance expenses decreased $1 million in the three months ended September 30, 2018 compared with the 2017 period due primarily to lower municipal infrastructure support costs ($5 million), stock based compensation ($4 million) and a lower reserve for uncollectibles ($3 million), offset in part by higher storm related costs ($7 million) and consultant costs ($4 million).
Depreciation and amortization increased $16 million in the three months ended September 30, 2018 compared with the 2017 period due primarily to higher electric utility plant balances.
Taxes, other than income taxes increased $38 million in the three months ended September 30, 2018 compared with the 2017 period due primarily to higher property taxes ($36 million) and state and local taxes ($8 million), offset in part by deferral of under-collected property taxes due to new property tax rates for fiscal year 2017-2018 ($6 million).
Gas
CECONY’s results of gas operations for the three months ended September 30, 2018 compared with the 2017 period were as follows:
For the Three Months Ended | |||
(Millions of Dollars) | September 30, 2018 | September 30, 2017 | Variation |
Operating revenues | $264 | $268 | $(4) |
Gas purchased for resale | 66 | 58 | 8 |
Other operations and maintenance | 101 | 98 | 3 |
Depreciation and amortization | 52 | 47 | 5 |
Taxes, other than income taxes | 79 | 71 | 8 |
Gas operating income | $(34) | $(6) | $(28) |
CECONY’s gas sales and deliveries, excluding off-system sales, for the three months ended September 30, 2018 compared with the 2017 period were:
52
Thousands of Dt Delivered | Revenues in Millions (a) | ||||||||||||||
For the Three Months Ended | For the Three Months Ended | ||||||||||||||
Description | September 30, 2018 | September 30, 2017 | Variation | Percent Variation | September 30, 2018 | September 30, 2017 | Variation | Percent Variation | |||||||
Residential | 4,469 | 4,731 | (262 | ) | (5.5 | )% | $118 | $104 | $14 | 13.5 | % | ||||
General | 4,191 | 4,292 | (101 | ) | (2.4 | ) | 54 | 49 | 5 | 10.2 | |||||
Firm transportation | 9,211 | 8,766 | 445 | 5.1 | 71 | 67 | 4 | 6.0 | |||||||
Total firm sales and transportation | 17,871 | 17,789 | 82 | 0.5 | (b) | 243 | 220 | 23 | 10.5 | ||||||
Interruptible sales (c) | 1,481 | 2,108 | (627 | ) | (29.7 | ) | 6 | 8 | (2) | (25.0 | ) | ||||
NYPA | 12,815 | 10,148 | 2,667 | 26.3 | 1 | 1 | — | — | |||||||
Generation plants | 29,128 | 24,068 | 5,060 | 21.0 | 9 | 7 | 2 | 28.6 | |||||||
Other | 3,953 | 4,487 | (534 | ) | (11.9 | ) | 6 | 6 | — | — | |||||
Other operating revenues (d) | — | — | — | — | (1) | 26 | (27) | Large | |||||||
Total | 65,248 | 58,600 | 6,648 | 11.3 | % | $264 | $268 | $(4) | (1.5 | )% | |||||
(a) | Revenues from gas sales are subject to a weather normalization clause and a revenue decoupling mechanism, as a result of which delivery revenues are generally not affected by changes in delivery volumes from levels assumed when rates were approved. |
(b) | After adjusting for variations, primarily billing days, firm gas sales and transportation volumes in the company’s service area increased 0.9 percent in the three months ended September 30, 2018 compared with the 2017 period, reflecting primarily increased volumes attributable to the growth in the number of gas customers. |
(c) | Includes 681 thousands and 1,535 thousands of Dt for the 2018 and 2017 periods, respectively, which are also reflected in firm transportation and other. |
(d) | Other gas operating revenues generally reflect changes in regulatory assets and liabilities in accordance with the company’s rate plans. |
Operating revenues decreased $4 million in the three months ended September 30, 2018 compared with the 2017 period due primarily to the reduction in other operating revenues resulting from the deferral as a regulatory liability of estimated net benefits for the 2018 period under the TCJA (see “Other Regulatory Matters” in Note B to the Third Quarter Financial Statements) ($21 million), offset in part by higher revenues from the gas rate plan and growth in the number of customers ($12 million) and higher gas purchased for resale expense ($8 million).
Gas purchased for resale increased $8 million in the three months ended September 30, 2018 compared with the 2017 period due to higher unit costs ($7 million) and purchased volumes ($1 million).
Other operations and maintenance expenses increased $3 million in the three months ended September 30, 2018 compared with the 2017 period due primarily to higher municipal infrastructure support costs.
Depreciation and amortization increased $5 million in the three months ended September 30, 2018 compared with the 2017 period due primarily to higher gas utility plant balances.
Taxes, other than income taxes increased $8 million in the three months ended September 30, 2018 compared with the 2017 period due primarily to higher property taxes ($13 million), offset in part by deferral of under-collected property taxes due to new property tax rates for fiscal year 2017-2018 ($4 million).
Steam
CECONY’s results of steam operations for the three months ended September 30, 2018 compared with the 2017 period were as follows:
For the Three Months Ended | ||||
(Millions of Dollars) | September 30, 2018 | September 30, 2017 | Variation | |
Operating revenues | $64 | $62 | $2 | |
Purchased power | 7 | 7 | — | |
Fuel | 5 | 6 | (1) | |
Other operations and maintenance | 47 | 38 | 9 | |
Depreciation and amortization | 22 | 21 | 1 | |
Taxes, other than income taxes | 35 | 31 | 4 | |
Steam operating income | $(52) | $(41) | $(11) | |
53
CECONY’s steam sales and deliveries for the three months ended September 30, 2018 compared with the 2017 period were:
Millions of Pounds Delivered | Revenues in Millions | |||||||||||||||
For the Three Months Ended | For the Three Months Ended | |||||||||||||||
Description | September 30, 2018 | September 30, 2017 | Variation | Percent Variation | September 30, 2018 | September 30, 2017 | Variation | Percent Variation | ||||||||
General | 12 | 13 | (1 | ) | (7.7 | )% | $2 | $2 | $— | — | % | |||||
Apartment house | 781 | 748 | 33 | 4.4 | 16 | 15 | 1 | 6.7 | ||||||||
Annual power | 2,711 | 2,439 | 272 | 11.2 | 45 | 42 | 3 | 7.1 | ||||||||
Other operating revenues (a) | — | — | — | — | 1 | 3 | (2) | (66.7 | ) | |||||||
Total | 3,504 | 3,200 | 304 | 9.5 | % | (b) | $64 | $62 | $2 | 3.2 | % | |||||
(a) | Other steam operating revenues generally reflect changes in regulatory assets and liabilities in accordance with the company’s rate plan. |
(b) | After adjusting for variations, primarily weather and billing days, steam sales and deliveries increased 1.5 percent in the three months ended September 30, 2018 compared with the 2017 period. |
Operating revenues increased $2 million in the three months ended September 30, 2018 compared with the 2017 period due primarily to lower regulatory reserve related to steam earnings sharing ($5 million) and the weather impact on revenues ($2 million), offset in part by the reduction in other operating revenues resulting from the deferral as a regulatory liability of estimated net benefits for the 2018 period under the TCJA (see “Other Regulatory Matters” in Note B to the Third Quarter Financial Statements) ($5 million) and lower fuel expenses ($1 million).
Fuel expenses decreased $1 million in the three months ended September 30, 2018 compared with the 2017 period due to lower unit costs.
Other operations and maintenance expenses increased $9 million in the three months ended September 30, 2018 compared with the 2017 period due primarily to property damage, clean-up and other response costs related to a steam main rupture (see "Manhattan Steam Main Rupture" in Note H to the Third Quarter Financial Statements).
Depreciation and amortization increased $1 million in the three months ended September 30, 2018 compared with the 2017 period due primarily to higher steam utility plant balances.
Taxes, other than income taxes increased $4 million in the three months ended September 30, 2018 compared with the 2017 period due primarily to higher property taxes.
Net Interest Expense
Net interest expense increased $18 million in the three months ended September 30, 2018 compared with the 2017 period due primarily to higher long-term debt balances in the 2018 period.
Income Tax Expense
Income taxes decreased $117 million in the three months ended September 30, 2018 compared with the 2017 period due primarily to lower income before income tax expense ($18 million), a decrease in the corporate federal income tax rate due to the TCJA ($90 million), and an increase in the amortization of excess deferred federal income taxes due to the TCJA ($10 million), offset in part by higher state income taxes ($1 million). CECONY deferred as a regulatory liability its estimated net benefits for the 2018 period under the TCJA. See “Other Regulatory Matters” in Note B to the Third Quarter Financial Statements.
54
O&R
For the Three Months Ended September 30, 2018 | For the Three Months Ended September 30, 2017 | ||||||||||
(Millions of Dollars) | Electric | Gas | 2018 Total | Electric | Gas | 2017 Total | 2018-2017 Variation | ||||
Operating revenues | $212 | $34 | $246 | $206 | $28 | $234 | $12 | ||||
Purchased power | 73 | — | 73 | 60 | — | 60 | 13 | ||||
Gas purchased for resale | — | 12 | 12 | — | 10 | 10 | 2 | ||||
Other operations and maintenance | 60 | 20 | 80 | 59 | 16 | 75 | 5 | ||||
Depreciation and amortization | 14 | 5 | 19 | 13 | 5 | 18 | 1 | ||||
Taxes, other than income taxes | 13 | 7 | 20 | 14 | 7 | 21 | (1) | ||||
Operating income | $52 | $(10) | $42 | $60 | $(10) | $50 | $(8) | ||||
Electric
O&R’s results of electric operations for the three months ended September 30, 2018 compared with the 2017 period were as follows:
For the Three Months Ended | |||||
(Millions of Dollars) | September 30, 2018 | September 30, 2017 | Variation | ||
Operating revenues | $212 | $206 | $6 | ||
Purchased power | 73 | 60 | 13 | ||
Other operations and maintenance | 60 | 59 | 1 | ||
Depreciation and amortization | 14 | 13 | 1 | ||
Taxes, other than income taxes | 13 | 14 | (1) | ||
Electric operating income | $52 | $60 | ($8 | ) | |
O&R’s electric sales and deliveries for the three months ended September 30, 2018 compared with the 2017 period were:
Millions of kWh Delivered | Revenues in Millions (a) | |||||||||||||||
For the Three Months Ended | For the Three Months Ended | |||||||||||||||
Description | September 30, 2018 | September 30, 2017 | Variation | Percent Variation | September 30, 2018 | September 30, 2017 | Variation | Percent Variation | ||||||||
Residential/Religious (b) | 595 | 500 | 95 | 19.0 | % | $115 | $105 | $10 | 9.5 | % | ||||||
Commercial/Industrial | 219 | 206 | 13 | 6.3 | 34 | 34 | — | — | ||||||||
Retail choice customers | 864 | 818 | 46 | 5.6 | 67 | 64 | 3 | 4.7 | ||||||||
Public authorities | 32 | 31 | 1 | 3.2 | 4 | 3 | 1 | 33.3 | ||||||||
Other operating revenues (c) | — | — | — | — | (8) | — | (8) | — | ||||||||
Total | 1,710 | 1,555 | 155 | 10.0 | % | (d) | $212 | $206 | $6 | 2.9 | % | |||||
(a) | O&R’s New York electric delivery revenues are subject to a revenue decoupling mechanism, as a result of which delivery revenues are generally not affected by changes in delivery volumes from levels assumed when rates were approved. O&R’s electric sales in New Jersey are not subject to a decoupling mechanism, and as a result, changes in such volumes do impact revenues. |
(b) | “Residential/Religious” generally includes single-family dwellings, individual apartments in multi-family dwellings, religious organizations and certain other not-for-profit organizations. |
(c) | Other electric operating revenues generally reflect changes in regulatory assets and liabilities in accordance with the company’s electric rate plan. |
(d) | After adjusting for weather and other variations, electric delivery volumes in O&R’s service area increased 1.5 percent in the three months ended September 30, 2018 compared with the 2017 period. |
Operating revenues increased $6 million in the three months ended September 30, 2018 compared with the 2017 period due primarily to higher purchased power expenses ($13 million), offset in part by the reduction in other operating revenues resulting from the deferral as a regulatory liability of estimated net benefits for the 2018 period under the TCJA (see “Other Regulatory Matters” in Note B to the Third Quarter Financial Statements) ($8 million).
55
Purchased power expenses increased $13 million in the three months ended September 30, 2018 compared with the 2017 period due to higher purchased volumes ($12 million) and unit costs ($1 million).
Other operations and maintenance expenses increased $1 million in the three months ended September 30, 2018 compared with the 2017 period due primarily to the reduction of a regulatory asset associated with certain site investigation and environmental remediation costs ($6 million), offset in part by the deferral as a regulatory asset of costs for storm preparation ($5 million).
Depreciation and amortization expenses increased $1 million in the three months ended September 30, 2018 compared with the 2017 period due primarily to higher electric utility plant balances.
Taxes, other than income taxes decreased $1 million in the three months ended September 30, 2018 compared with the 2017 period due primarily to lower property taxes.
Gas
O&R’s results of gas operations for the three months ended September 30, 2018 compared with the 2017 period were as follows:
For the Three Months Ended | ||||
(Millions of Dollars) | September 30, 2018 | September 30, 2017 | Variation | |
Operating revenues | $34 | $28 | $6 | |
Gas purchased for resale | 12 | 10 | 2 | |
Other operations and maintenance | 20 | 16 | 4 | |
Depreciation and amortization | 5 | 5 | — | |
Taxes, other than income taxes | 7 | 7 | — | |
Gas operating income | $(10) | $(10) | — | |
O&R’s gas sales and deliveries, excluding off-system sales, for the three months ended September 30, 2018 compared with the 2017 period were:
Thousands of Dt Delivered | Revenues in Millions (a) | ||||||||||||||||
For the Three Months Ended | For the Three Months Ended | ||||||||||||||||
Description | September 30, 2018 | September 30, 2017 | Variation | Percent Variation | September 30, 2018 | September 30, 2017 | Variation | Percent Variation | |||||||||
Residential | 605 | 579 | 26 | 4.5 | % | $13 | $11 | $2 | 18.2 | % | |||||||
General | 202 | 198 | 4 | 2.0 | 3 | 2 | 1 | 50.0 | |||||||||
Firm transportation | 795 | 898 | (103 | ) | (11.5 | ) | 8 | 8 | — | — | |||||||
Total firm sales and transportation | 1,602 | 1,675 | (73 | ) | (4.4 | ) | (b) | 24 | 21 | 3 | 14.3 | ||||||
Interruptible sales | 772 | 819 | (47 | ) | (5.7 | ) | 1 | 1 | — | — | |||||||
Generation plants | 1 | 5 | (4 | ) | (80.0 | ) | — | — | — | — | |||||||
Other | 62 | 74 | (12 | ) | (16.2 | ) | — | — | — | — | |||||||
Other gas revenues | — | — | — | — | 9 | 6 | 3 | 50.0 | |||||||||
Total | 2,437 | 2,573 | (136 | ) | (5.3 | )% | $34 | $28 | $6 | 21.4 | % | ||||||
(a) | Revenues from New York gas sales are subject to a weather normalization clause and a revenue decoupling mechanism as a result of which delivery revenues are generally not affected by changes in delivery volumes from levels assumed when rates were approved. |
(b) | After adjusting for weather and other variations, total firm sales and transportation volumes decreased 2.4 percent in the three months ended September 30, 2018 compared with the 2017 period. |
Operating revenues increased $6 million in the three months ended September 30, 2018 compared with the 2017 period due primarily to higher gas purchased for resale ($2 million) and an increase in other operating revenues resulting from the amortization of a regulatory liability for estimated net benefits for the 2018 period under the TCJA (see “Other Regulatory Matters” in Note B to the Third Quarter Financial Statements) ($2 million).
Gas purchased for resale increased $2 million in the three months ended September 30, 2018 compared with the 2017 period due to higher unit costs.
56
Other operations and maintenance expenses increased $4 million in the three months ended September 30, 2018 compared with the 2017 period due primarily to the reduction of a regulatory asset associated with certain site investigation and environmental remediation costs.
Income Tax Expense
Income taxes decreased $8 million in the three months ended September 30, 2018 compared with the 2017 period due primarily to lower income before income tax expense ($2 million), a decrease in the corporate federal income tax rate due to the TCJA ($5 million), and an increase in the amortization of excess deferred federal income taxes due to the TCJA ($1 million). O&R deferred as a regulatory liability its estimated net benefits for the 2018 period under the TCJA. See “Other Regulatory Matters” in Note B to the Third Quarter Financial Statements.
Clean Energy Businesses
The Clean Energy Businesses’ results of operations for the three months ended September 30, 2018 compared with the 2017 period were as follows:
For the Three Months Ended | ||||||
(Millions of Dollars) | September 30, 2018 | September 30, 2017 | Variation | |||
Operating revenues | $181 | $177 | $4 | |||
Purchased power | — | — | — | |||
Gas purchased for resale | 85 | 47 | 38 | |||
Other operations and maintenance | 50 | 79 | (29) | |||
Depreciation and amortization | 18 | 19 | (1) | |||
Taxes, other than income taxes | 3 | 3 | — | |||
Operating income | $25 | $29 | $(4) | |||
Operating revenues increased $4 million in the three months ended September 30, 2018 compared with the 2017 period due primarily to higher wholesale revenues ($40 million) due to higher sales volumes, offset in part by lower renewable revenues ($20 million) primarily due to the timing of engineering, procurement and construction services, lower energy services revenues ($6 million) and decreased net mark-to-market values ($10 million).
Gas purchased for resale increased $38 million in the three months ended September 30, 2018 compared with the 2017 period due to higher purchased volumes.
Other operations and maintenance expenses decreased $29 million in the three months ended September 30, 2018 compared with the 2017 period due primarily to a decrease of engineering, procurement and construction services and energy services costs.
Net Interest Expense
Net interest expense increased $1 million in the three months ended September 30, 2018 compared with the 2017 period due primarily to the reversal of interest on uncertain tax positions in the 2017 period and increased debt on renewable electric production projects in the 2018 period.
Income Tax Expense
Income taxes decreased $6 million in the three months ended September 30, 2018 compared with the 2017 period due primarily to lower income before income tax expense ($1 million), a decrease in the corporate federal income tax rate due to the TCJA ($5 million) and an income tax benefit in 2018 related to the extension of energy efficiency programs ($1 million).
Con Edison Transmission
Income Tax Expense
Income taxes decreased $2 million in the three months ended September 30, 2018 compared with the 2017 period due to the decrease in the corporate federal income tax rate due to the TCJA.
Other
57
Taxes, other than income taxes increased $4 million in the three months ended September 30, 2018 compared with the 2017 period due primarily to the New York State capital tax in 2018.
Other Income (Deductions)
Other income (deductions) decreased $15 million in the three months ended September 30, 2018 compared with the 2017 period due primarily to the transaction costs related to the pending acquisition of Sempra Solar Holdings, LLC. See Note O to the Third Quarter Financial Statements.
Income Tax Expense
Income taxes increased $38 million in the three months ended September 30, 2018 compared with the 2017 period due primarily to the TCJA re-measurement of deferred tax assets associated with Con Edison’s 2017 federal NOL carryover into 2018 ($42 million), offset in part by lower income before income tax expense ($4 million). See Note I to the Third Quarter Financial Statements.
58
Nine Months Ended September 30, 2018 Compared with Nine Months Ended September 30, 2017
The Companies’ results of operations in 2018 compared with 2017 were:
CECONY | O&R | Clean Energy Businesses | Con Edison Transmission | Other (a) | Con Edison (b) | ||||||||||||||||||
(Millions of Dollars) | Increases (Decreases) Amount | Increases (Decreases) Percent | Increases (Decreases) Amount | Increases (Decreases) Percent | Increases (Decreases) Amount | Increases (Decreases) Percent | Increases (Decreases) Amount | Increases (Decreases) Percent | Increases (Decreases) Amount | Increases (Decreases) Percent | Increases (Decreases) Amount | Increases (Decreases) Percent | |||||||||||
Operating revenues | $173 | 2.2 | % | $24 | 3.6 | % | $113 | 24.6 | % | $2 | Large | $4 | Large | $316 | 3.5 | % | |||||||
Purchased power | 7 | 0.6 | 19 | 12.8 | 5 | Large | — | — | 3 | Large | 34 | 2.7 | |||||||||||
Fuel | 32 | 18.9 | — | — | — | — | — | — | — | — | 32 | 18.9 | |||||||||||
Gas purchased for resale | 85 | 22.8 | 8 | 15.4 | 58 | 36.0 | — | — | 1 | Large | 152 | 26.0 | |||||||||||
Other operations and maintenance | 42 | 2.2 | 13 | 5.9 | 52 | 29.9 | — | — | (1) | (33.3 | ) | 106 | 4.6 | ||||||||||
Depreciation and amortization | 58 | 6.5 | 4 | 7.5 | 1 | 1.9 | 1 | — | (1) | — | 63 | 6.3 | |||||||||||
Taxes, other than income taxes | 98 | 6.4 | 1 | 1.6 | — | — | — | — | 11 | — | 110 | 6.9 | |||||||||||
Gain on sale of solar electric production project (2017) | — | — | — | — | (1) | Large | — | — | — | — | (1) | Large | |||||||||||
Operating income | (149) | (7.5 | ) | (21) | (16.0 | ) | (4) | (6.3 | ) | 1 | 16.7 | (9) | Large | (182) | (8.3 | ) | |||||||
Other income less deductions | 3 | 2.9 | — | — | 1 | 3.0 | 7 | 11.7 | (15) | Large | (4) | (16.0 | ) | ||||||||||
Net interest expense | 45 | 9.7 | 2 | 7.4 | 5 | 14.3 | 2 | 16.7 | (2) | (22.2 | ) | 52 | 9.5 | ||||||||||
Income before income tax expense | (191) | (13.3 | ) | (23) | (25.8 | ) | (8) | (12.9 | ) | 6 | 14.3 | (22) | Large | (238) | (14.7 | ) | |||||||
Income tax expense | (277) | (50.3 | ) | (22) | (61.1 | ) | (12) | Large | (4) | (23.5 | ) | 46 | Large | (269) | (44.9 | ) | |||||||
Net income | $86 | 9.7 | % | $(1) | (1.9 | )% | $4 | 7.4 | % | $10 | 40.0 | % | $(68) | Large | $31 | 3.0 | % | ||||||
(a) | Includes parent company and consolidation adjustments. |
(b) | Represents the consolidated results of operations of Con Edison and its businesses. |
59
CECONY
For the Nine Months Ended September 30, 2018 | For the Nine Months Ended September 30, 2017 | ||||||||||||||
(Millions of Dollars) | Electric | Gas | Steam | 2018 Total | Electric | Gas | Steam | 2017 Total | 2018-2017 Variation | ||||||
Operating revenues | $6,107 | $1,540 | $474 | $8,121 | $6,079 | $1,421 | $448 | $7,948 | $173 | ||||||
Purchased power | 1,091 | — | 26 | 1,117 | 1,084 | — | 26 | 1,110 | 7 | ||||||
Fuel | 118 | — | 83 | 201 | 95 | — | 74 | 169 | 32 | ||||||
Gas purchased for resale | — | 457 | — | 457 | — | 372 | — | 372 | 85 | ||||||
Other operations and maintenance | 1,480 | 315 | 131 | 1,926 | 1,444 | 313 | 127 | 1,884 | 42 | ||||||
Depreciation and amortization | 732 | 152 | 65 | 949 | 690 | 137 | 64 | 891 | 58 | ||||||
Taxes, other than income taxes | 1,265 | 247 | 109 | 1,621 | 1,205 | 220 | 98 | 1,523 | 98 | ||||||
Operating income | $1,421 | $369 | $60 | $1,850 | $1,561 | $379 | $59 | $1,999 | $(149) | ||||||
Electric
CECONY’s results of electric operations for the nine months ended September 30, 2018 compared with the 2017 period were as follows:
For the Nine Months Ended | |||
(Millions of Dollars) | September 30, 2018 | September 30, 2017 | Variation |
Operating revenues | $6,107 | $6,079 | $28 |
Purchased power | 1,091 | 1,084 | 7 |
Fuel | 118 | 95 | 23 |
Other operations and maintenance | 1,480 | 1,444 | 36 |
Depreciation and amortization | 732 | 690 | 42 |
Taxes, other than income taxes | 1,265 | 1,205 | 60 |
Electric operating income | $1,421 | $1,561 | $(140) |
CECONY’s electric sales and deliveries for the nine months ended September 30, 2018 compared with the 2017 period were:
Millions of kWh Delivered | Revenues in Millions (a) | |||||||||||||
For the Nine Months Ended | For the Nine Months Ended | |||||||||||||
Description | September 30, 2018 | September 30, 2017 | Variation | Percent Variation | September 30, 2018 | September 30, 2017 | Variation | Percent Variation | ||||||
Residential/Religious (b) | 8,374 | 7,576 | 798 | 10.5 | % | $2,211 | $1,925 | $286 | 14.9 | % | ||||
Commercial/Industrial | 7,343 | 6,965 | 378 | 5.4 | 1,433 | 1,393 | 40 | 2.9 | ||||||
Retail choice customers | 19,996 | 19,748 | 248 | 1.3 | 2,030 | 2,092 | (62) | (3.0 | ) | |||||
NYPA, Municipal Agency and other sales | 7,747 | 7,548 | 199 | 2.6 | 509 | 483 | 26 | 5.4 | ||||||
Other operating revenues (c) | — | — | — | — | (76) | 186 | (262) | Large | ||||||
Total | 43,460 | 41,837 | 1,623 | 3.9 | % | (d) | $6,107 | $6,079 | $28 | 0.5 | % | |||
(a) | Revenues from electric sales are subject to a revenue decoupling mechanism, as a result of which delivery revenues generally are not affected by changes in delivery volumes from levels assumed when rates were approved. |
(b) | “Residential/Religious” generally includes single-family dwellings, individual apartments in multi-family dwellings, religious organizations and certain other not-for-profit organizations. |
(c) | Other electric operating revenues generally reflect changes in regulatory assets and liabilities in accordance with the revenue decoupling mechanism and other provisions of the company’s rate plans. |
(d) | After adjusting for variations, primarily weather and billing days, electric delivery volumes in CECONY’s service area increased 0.3 percent in the nine months ended September 30, 2018 compared with the 2017 period. |
60
Operating revenues increased $28 million in the nine months ended September 30, 2018 compared with the 2017 period due primarily to higher revenues from the electric rate plan ($209 million), fuel expenses ($23 million) and purchased power expenses ($7 million), offset in part by the reduction in other operating revenues resulting from the deferral as a regulatory liability of estimated net benefits for the 2018 period under the TCJA (see “Other Regulatory Matters” in Note B to the Third Quarter Financial Statements) ($227 million).
Purchased power expenses increased $7 million in the nine months ended September 30, 2018 compared with the 2017 period due to higher purchased volumes ($48 million), offset by lower unit costs ($41 million).
Fuel expenses increased $23 million in the nine months ended September 30, 2018 compared with the 2017 period due to higher unit costs ($26 million), offset in part by lower purchased volumes from the company’s electric generating facilities ($3 million).
Other operations and maintenance expenses increased $36 million in the nine months ended September 30, 2018 compared with the 2017 period due primarily to higher storm-related costs ($21 million), consultant costs ($16 million), a higher reserve for uncollectibles ($4 million) and municipal infrastructure costs ($3 million), offset in part by lower stock-based compensation ($21 million).
Depreciation and amortization increased $42 million in the nine months ended September 30, 2018 compared with the 2017 period due primarily to higher electric utility plant balances.
Taxes, other than income taxes increased $60 million in the nine months ended September 30, 2018 compared with the 2017 period due primarily to higher property taxes ($100 million) and state and local taxes ($7 million), offset in part by deferral of under-collected property taxes due to new property tax rates for fiscal year 2017-2018 ($35 million) and a sales and use tax refund ($14 million).
Gas
CECONY’s results of gas operations for the nine months ended September 30, 2018 compared with the 2017 period were as follows:
For the Nine Months Ended | |||
(Millions of Dollars) | September 30, 2018 | September 30, 2017 | Variation |
Operating revenues | $1,540 | $1,421 | $119 |
Gas purchased for resale | 457 | 372 | 85 |
Other operations and maintenance | 315 | 313 | 2 |
Depreciation and amortization | 152 | 137 | 15 |
Taxes, other than income taxes | 247 | 220 | 27 |
Gas operating income | $369 | $379 | $(10) |
61
CECONY’s gas sales and deliveries, excluding off-system sales, for the nine months ended September 30, 2018 compared with the 2017 period were:
Thousands of Dt Delivered | Revenues in Millions (a) | ||||||||||||||
For the Nine Months Ended | For the Nine Months Ended | ||||||||||||||
Description | September 30, 2018 | September 30, 2017 | Variation | Percent Variation | September 30, 2018 | September 30, 2017 | Variation | Percent Variation | |||||||
Residential | 43,731 | 39,814 | 3,917 | 9.8 | % | $728 | $613 | $115 | 18.8 | % | |||||
General | 25,894 | 23,427 | 2,467 | 10.5 | 298 | 255 | 43 | 16.9 | |||||||
Firm transportation | 61,628 | 53,952 | 7,676 | 14.2 | 448 | 390 | 58 | 14.9 | |||||||
Total firm sales and transportation | 131,253 | 117,193 | 14,060 | 12.0 | (b) | 1,474 | 1,258 | 216 | 17.2 | ||||||
Interruptible sales (c) | 4,956 | 6,526 | (1,570 | ) | (24.1 | ) | 31 | 30 | 1 | 3.3 | |||||
NYPA | 27,528 | 30,233 | (2,705 | ) | (8.9 | ) | 2 | 2 | — | — | |||||
Generation plants | 55,949 | 48,989 | 6,960 | 14.2 | 20 | 19 | 1 | 5.3 | |||||||
Other | 15,399 | 16,756 | (1,357 | ) | (8.1 | ) | 24 | 24 | — | — | |||||
Other operating revenues (d) | — | — | — | — | (11) | 88 | (99) | Large | |||||||
Total | 235,085 | 219,697 | 15,388 | 7.0 | % | $1,540 | $1,421 | $119 | 8.4 | % | |||||
(a) | Revenues from gas sales are subject to a weather normalization clause and a revenue decoupling mechanism as a result of which delivery revenues are generally not affected by changes in delivery volumes from levels assumed when rates were approved. |
(b) | After adjusting for variations, primarily billing days, firm gas sales and transportation volumes in the company’s service area increased 5.4 percent in the nine months ended September 30, 2018 compared with the 2017 period, reflecting primarily increased volumes attributable to the growth in the number of gas customers. |
(c) | Includes 1,798 thousands and 3,563 thousands of Dt for the 2018 and 2017 periods, respectively, which are also reflected in firm transportation and other. |
(d) | Other gas operating revenues generally reflect changes in regulatory assets and liabilities in accordance with the company’s rate plans. |
Operating revenues increased $119 million in the nine months ended September 30, 2018 compared with the 2017 period due primarily to higher revenues from the gas rate plan and growth in the number of customers ($79 million) and higher gas purchased for resale expense ($85 million), offset in part by the reduction in other operating revenues resulting from the deferral as a regulatory liability of estimated net benefits for the 2018 period under the TCJA (see “Other Regulatory Matters” in Note B to the Third Quarter Financial Statements) ($62 million).
Gas purchased for resale increased $85 million in the nine months ended September 30, 2018 compared with the 2017 period due to higher unit costs ($46 million) and purchased volumes ($39 million).
Other operations and maintenance expenses increased $2 million in the nine months ended September 30, 2018 compared with the 2017 period due primarily to higher consultant costs.
Depreciation and amortization increased $15 million in the nine months ended September 30, 2018 compared with the 2017 period due primarily to higher gas utility plant balances.
Taxes, other than income taxes increased $27 million in the nine months ended September 30, 2018 compared with the 2017 period due primarily to higher property taxes ($33 million) and state and local taxes ($4 million), offset in part by deferral of under-collected property taxes due to new property tax rates for fiscal year 2017-2018 ($8 million) and a sales and use tax refund ($3 million).
62
Steam
CECONY’s results of steam operations for the nine months ended September 30, 2018 compared with the 2017 period were as follows:
For the Nine Months Ended | ||||
(Millions of Dollars) | September 30, 2018 | September 30, 2017 | Variation | |
Operating revenues | $474 | $448 | $26 | |
Purchased power | 26 | 26 | — | |
Fuel | 83 | 74 | 9 | |
Other operations and maintenance | 131 | 127 | 4 | |
Depreciation and amortization | 65 | 64 | 1 | |
Taxes, other than income taxes | 109 | 98 | 11 | |
Steam operating income | $60 | $59 | $1 | |
CECONY’s steam sales and deliveries for the nine months ended September 30, 2018 compared with the 2017 period were:
Millions of Pounds Delivered | Revenues in Millions | |||||||||||||
For the Nine Months Ended | For the Nine Months Ended | |||||||||||||
Description | September 30, 2018 | September 30, 2017 | Variation | Percent Variation | September 30, 2018 | September 30, 2017 | Variation | Percent Variation | ||||||
General | 442 | 364 | 78 | 21.4 | % | $23 | $20 | $3 | 15.0 | % | ||||
Apartment house | 4,670 | 4,248 | 422 | 9.9 | 129 | 119 | 10 | 8.4 | ||||||
Annual power | 11,313 | 10,074 | 1,239 | 12.3 | 333 | 300 | 33 | 11.0 | ||||||
Other operating revenues (a) | — | — | — | — | (11) | 9 | (20) | Large | ||||||
Total | 16,425 | 14,686 | 1,739 | 11.8 | % | (b) | $474 | $448 | $26 | 5.8 | % | |||
(a) | Other steam operating revenues generally reflect changes in regulatory assets and liabilities in accordance with the company’s rate plan. |
(b) | After adjusting for variations, primarily weather and billing days, steam sales and deliveries increased 0.2 percent in the nine months ended September 30, 2018 compared with the 2017 period. |
Operating revenues increased $26 million in the nine months ended September 30, 2018 compared with the 2017 period due primarily to the weather impact on revenues ($32 million) and fuel expenses ($9 million), offset in part by the reduction in other operating revenues resulting from the deferral as a regulatory liability of estimated net benefits for the 2018 period under the TCJA (see “Other Regulatory Matters” in Note B to the Third Quarter Financial Statements) ($15 million).
Fuel expenses increased $9 million in the nine months ended September 30, 2018 compared with the 2017 period due to higher unit costs ($5 million) and purchased volumes from the company’s steam generating facilities ($4 million).
Other operations and maintenance expenses increased $4 million in the nine months ended September 30, 2018 compared with the 2017 period due primarily to property damage, clean-up and other response costs related to a steam main rupture (see "Manhattan Steam Main Rupture" in Note H to the Third Quarter Financial Statements) ($10 million), offset in part by lower municipal infrastructure support costs ($2 million) and surcharges for assessments and fees that are collected in revenues from customers ($2 million).
Depreciation and amortization increased $1 million in the nine months ended September 30, 2018 compared with the 2017 period due primarily to higher steam utility plant balances.
Taxes, other than income taxes increased $11 million in the nine months ended September 30, 2018 compared with the 2017 period due primarily to higher property taxes ($12 million) and state and local taxes ($1 million), offset in part by a sales and use tax refund ($1 million).
63
Net Interest Expense
Net interest expense increased $45 million in the nine months ended September 30, 2018 compared with the 2017 period due primarily to higher long-term debt balances in the 2018 period.
Income Tax Expense
Income taxes decreased $277 million in the nine months ended September 30, 2018 compared with the 2017 period due primarily to lower income before income tax expense ($40 million), a decrease in the corporate federal income tax rate due to the TCJA ($201 million), higher research and development tax credits ($2 million) and an increase in the amortization of excess deferred federal income taxes due to the TCJA ($39 million), offset in part by higher state income taxes ($1 million) and non-deductible business expenses ($3 million). CECONY deferred as a regulatory liability its estimated net benefits for the 2018 period under the TCJA. See “Other Regulatory Matters” in Note B to the Third Quarter Financial Statements.
O&R
For the Nine Months Ended September 30, 2018 | For the Nine Months Ended September 30, 2017 | ||||||||||
(Millions of Dollars) | Electric | Gas | 2018 Total | Electric | Gas | 2017 Total | 2018-2017 Variation | ||||
Operating revenues | $505 | $186 | $691 | $495 | $172 | $667 | $24 | ||||
Purchased power | 167 | — | 167 | 148 | — | 148 | 19 | ||||
Gas purchased for resale | — | 60 | 60 | — | 52 | 52 | 8 | ||||
Other operations and maintenance | 178 | 56 | 234 | 174 | 47 | 221 | 13 | ||||
Depreciation and amortization | 41 | 16 | 57 | 38 | 15 | 53 | 4 | ||||
Taxes, other than income taxes | 40 | 23 | 63 | 41 | 21 | 62 | 1 | ||||
Operating income | $79 | $31 | $110 | $94 | $37 | $131 | $(21) | ||||
Electric
O&R’s results of electric operations for the nine months ended September 30, 2018 compared with the 2017 period were as follows:
For the Nine Months Ended | |||
(Millions of Dollars) | September 30, 2018 | September 30, 2017 | Variation |
Operating revenues | $505 | $495 | $10 |
Purchased power | 167 | 148 | 19 |
Other operations and maintenance | 178 | 174 | 4 |
Depreciation and amortization | 41 | 38 | 3 |
Taxes, other than income taxes | 40 | 41 | (1) |
Electric operating income | $79 | $94 | $(15) |
64
O&R’s electric sales and deliveries for the nine months ended September 30, 2018 compared with the 2017 period were:
Millions of kWh Delivered | Revenues in Millions (a) | |||||||||||||
For the Nine Months Ended | For the Nine Months Ended | |||||||||||||
Description | September 30, 2018 | September 30, 2017 | Variation | Percent Variation | September 30, 2018 | September 30, 2017 | Variation | Percent Variation | ||||||
Residential/Religious (b) | 1,348 | 1,208 | 140 | 11.6 | % | $260 | $242 | $18 | 7.4 | % | ||||
Commercial/Industrial | 609 | 574 | 35 | 6.1 | 91 | 88 | 3 | 3.4 | ||||||
Retail choice customers | 2,274 | 2,255 | 19 | 0.8 | 158 | 155 | 3 | 1.9 | ||||||
Public authorities | 104 | 79 | 25 | 31.6 | 10 | 7 | 3 | 42.9 | ||||||
Other operating revenues (c) | — | — | — | — | (14) | 3 | (17) | Large | ||||||
Total | 4,335 | 4,116 | 219 | 5.3 | % | (d) | $505 | $495 | $10 | 2.0 | % | |||
(a) | O&R’s New York electric delivery revenues are subject to a revenue decoupling mechanism, as a result of which delivery revenues are generally not affected by changes in delivery volumes from levels assumed when rates were approved. O&R’s electric sales in New Jersey are not subject to a decoupling mechanism, and as a result, changes in such volumes do impact revenues. |
(b) | “Residential/Religious” generally includes single-family dwellings, individual apartments in multi-family dwellings, religious organizations and certain other not-for-profit organizations. |
(c) | Other electric operating revenues generally reflect changes in regulatory assets and liabilities in accordance with the company’s electric rate plan. |
(d) | After adjusting for weather and other variations, electric delivery volumes in O&R’s service area increased 0.8 percent in the nine months ended September 30, 2018 compared with the 2017 period. |
Operating revenues increased $10 million in the nine months ended September 30, 2018 compared with the 2017 period due primarily to higher purchased power expenses ($19 million) and higher revenues from the New York electric rate plan ($1 million), offset in part by the reduction in other operating revenues resulting from the deferral as a regulatory liability of estimated net benefits for the 2018 period under the TCJA (see “Other Regulatory Matters” in Note B to the Third Quarter Financial Statements) ($13 million).
Purchased power expenses increased $19 million in the nine months ended September 30, 2018 compared with the 2017 period due to higher purchased volumes ($11 million) and unit costs ($8 million).
Other operations and maintenance expenses increased $4 million in the nine months ended September 30, 2018 compared with the 2017 period due primarily to the reduction of a regulatory asset associated with certain site investigation and environmental remediation costs ($6 million), offset in part by lower healthcare costs ($1 million).
Depreciation and amortization increased $3 million in the nine months ended September 30, 2018 compared with the 2017 period due primarily to higher electric utility plant balances.
Taxes, other than income taxes decreased $1 million in the nine months ended September 30, 2018 compared with the 2017 period due primarily to lower property taxes ($2 million), offset in part by higher payroll taxes ($1 million).
Gas
O&R’s results of gas operations for the nine months ended September 30, 2018 compared with the 2017 period were as follows:
For the Nine Months Ended | |||
(Millions of Dollars) | September 30, 2018 | September 30, 2017 | Variation |
Operating revenues | $186 | $172 | $14 |
Gas purchased for resale | 60 | 52 | 8 |
Other operations and maintenance | 56 | 47 | 9 |
Depreciation and amortization | 16 | 15 | 1 |
Taxes, other than income taxes | 23 | 21 | 2 |
Gas operating income | $31 | $37 | $(6) |
65
O&R’s gas sales and deliveries, excluding off-system sales, for the nine months ended September 30, 2018 compared with the 2017 period were:
Thousands of Dt Delivered | Revenues in Millions (a) | ||||||||||||||||
For the Nine Months Ended | For the Nine Months Ended | ||||||||||||||||
Description | September 30, 2018 | September 30, 2017 | Variation | Percent Variation | September 30, 2018 | September 30, 2017 | Variation | Percent Variation | |||||||||
Residential | 6,503 | 5,556 | 947 | 17.0 | % | $96 | $79 | $17 | 21.5 | % | |||||||
General | 1,502 | 1,447 | 55 | 3.8 | 18 | 16 | 2 | 12.5 | |||||||||
Firm transportation | 6,867 | 6,543 | 324 | 5.0 | 57 | 50 | 7 | 14.0 | |||||||||
Total firm sales and transportation | 14,872 | 13,546 | 1,326 | 9.8 | (b) | 171 | 145 | 26 | 17.9 | ||||||||
Interruptible sales | 2,842 | 2,966 | (124 | ) | (4.2 | ) | 5 | 5 | — | — | |||||||
Generation plants | 1 | 6 | (5 | ) | (83.3 | ) | — | — | — | — | |||||||
Other | 636 | 589 | 47 | 8.0 | 1 | 1 | — | — | |||||||||
Other gas revenues | — | — | — | — | 9 | 21 | (12) | (57.1 | )% | ||||||||
Total | 18,351 | 17,107 | 1,244 | 7.3 | % | $186 | $172 | $14 | 8.1 | % | |||||||
(a) | Revenues from New York gas sales are subject to a weather normalization clause and a revenue decoupling mechanism as a result of which delivery revenues are generally not affected by changes in delivery volumes from levels assumed when rates were approved. |
(b) | After adjusting for weather and other variations, total firm sales and transportation volumes increased 1.7 percent in the nine months ended September 30, 2018 compared with 2017 period. |
Operating revenues increased $14 million in the nine months ended September 30, 2018 compared with the 2017 period due primarily to an increase in gas purchased for resale ($8 million) and higher revenues from the New York gas rate plan ($13 million), offset in part by the reduction in other operating revenues resulting from the deferral as a regulatory liability of estimated net benefits for the 2018 period under the TCJA (see “Other Regulatory Matters” in Note B to the Third Quarter Financial Statements) ($7 million).
Gas purchased for resale increased $8 million in the nine months ended September 30, 2018 compared with the 2017 period due to higher purchased volumes ($7 million) and unit costs ($1 million).
Other operations and maintenance expenses increased $9 million in the nine months ended September 30, 2018 compared with the 2017 period due primarily to higher pension costs ($7 million) and the reduction of a regulatory asset associated with certain site investigation and environmental remediation costs ($3 million).
Depreciation and amortization increased $1 million in the nine months ended September 30, 2018 compared with the 2017 period due primarily to higher gas utility plant balances.
Taxes, other than income taxes increased $2 million in the nine months ended September 30, 2018 compared with the 2017 period due primarily to higher property taxes ($1 million) and state and local taxes ($1 million).
Income Tax Expense
Income taxes decreased $22 million in the nine months ended September 30, 2018 compared with the 2017 period due primarily to lower income before income tax expense ($5 million), a decrease in the corporate federal income tax rate due to the TCJA ($12 million), a decrease in tax benefits for plant-related flow through items ($1 million) and an increase in the amortization of excess deferred federal income taxes due to the TCJA ($3 million). O&R deferred as a regulatory liability its estimated net benefits for the 2018 period under the TCJA. See “Other Regulatory Matters” in Note B to the Third Quarter Financial Statements.
66
Clean Energy Businesses
The Clean Energy Businesses’ results of operations for the nine months ended September 30, 2018 compared with the 2017 period were as follows:
For the Nine Months Ended | |||||
(Millions of Dollars) | September 30, 2018 | September 30, 2017 | Variation | ||
Operating revenues | $573 | $460 | $113 | ||
Purchased power | 2 | (3) | 5 | ||
Gas purchased for resale | 219 | 161 | 58 | ||
Other operations and maintenance | 226 | 174 | 52 | ||
Depreciation and amortization | 55 | 54 | 1 | ||
Taxes, other than income taxes | 12 | 12 | — | ||
Gain on sale of solar electric production project (2017) | — | 1 | (1) | ||
Operating income | $59 | $63 | $(4) | ||
Operating revenues increased $113 million in the nine months ended September 30, 2018 compared with the 2017 period due primarily to higher renewable revenues ($82 million), including revenues from engineering, procurement and construction services, an increase in renewable electric production projects in operation, an increase in wholesale revenues ($57 million) due to higher sales volumes, offset in part by decreased energy services revenues ($17 million) and net mark-to-market values ($9 million).
Purchased power expenses increased $5 million in the nine months ended September 30, 2018 compared with the 2017 period due primarily to costs relating to the sale of the retail electric supply business.
Gas purchased for resale increased $58 million in the nine months ended September 30, 2018 compared with the 2017 period due to higher purchased volumes.
Other operations and maintenance expenses increased $52 million in the nine months ended September 30, 2018 compared with the 2017 period due to increased engineering, procurement and construction costs.
Depreciation and amortization increased $1 million in the nine months ended September 30, 2018 compared with the 2017 period due to an increase in renewable electric production projects in operation during 2018.
Other Income (Deductions)
Other income (deductions) increased $1 million in the nine months ended September 30, 2018 compared with the 2017 period due primarily to higher income from renewable electric production investments.
Net Interest Expense
Net interest expense increased $5 million in the nine months ended September 30, 2018 compared with the 2017 period due primarily to the reversal of interest on uncertain tax positions in the 2017 period and higher interest rates in the 2018 period.
Income Tax Expense
Income taxes decreased $12 million in the nine months ended September 30, 2018 compared with the 2017 period due primarily to lower income before income tax expense ($2 million), a decrease in the corporate federal income tax rate due to the TCJA ($9 million) and an income tax benefit in 2018 related to the extension of energy efficiency programs ($3 million), offset in part by the absence of the reversal of uncertain tax positions in 2017 ($1 million).
Con Edison Transmission
Income Tax Expense
Income taxes decreased $4 million in the nine months ended September 30, 2018 compared with the 2017 period due primarily to the decrease in the corporate federal income tax rate due to the TCJA ($6 million), offset in part by higher income before income tax expense ($1 million) and higher state income taxes ($1 million).
67
Other
Taxes, other than income taxes increased $11 million in the nine months ended September 30, 2018 compared with the 2017 period due primarily to the New York State capital tax in 2018.
Other Income (Deductions)
Other income (deductions) decreased $15 million in the nine months ended September 30, 2018 compared with the 2017 period due primarily to the transaction costs related to the pending acquisition of Sempra Solar Holdings, LLC. See Note O to the Third Quarter Financial Statements.
Income Tax Expense
Income taxes increased $46 million in the nine months ended September 30, 2018 compared with the 2017 period due primarily to the TCJA re-measurement of deferred tax assets associated with Con Edison’s 2017 federal NOL carryover into 2018 ($42 million) and the absence of a deferred state income tax adjustment recorded in 2017 ($7 million), offset in part by lower income before income tax expense ($4 million). See Note I to the Third Quarter Financial Statements.
Liquidity and Capital Resources
The Companies’ liquidity reflects cash flows from operating, investing and financing activities, as shown on their respective consolidated statement of cash flows and as discussed below.
Changes in the Companies’ cash and temporary cash investments resulting from operating, investing and financing activities for the nine months ended September 30, 2018 and 2017 are summarized as follows:
For the Nine Months Ended September 30, | ||||||||
Con Edison | CECONY | |||||||
(Millions of Dollars) | 2018 | 2017 | Variation | 2018 | 2017 | Variation | ||
Operating activities | $1,600 | $2,227 | $(627) | $1,085 | $1,790 | $(705) | ||
Investing activities | (2,947) | (2,585) | (362) | (2,498) | (2,199) | (299) | ||
Financing activities | 748 | (362) | 1,110 | 700 | (278) | 978 | ||
Net change for the period | (599) | (720) | 121 | (713) | (687) | (26) | ||
Balance at beginning of period | 844 | 830 | 14 | 730 | 704 | 26 | ||
Balance at end of period | $245 | $110 | $135 | $17 | $17 | $— | ||
Cash Flows from Operating Activities
The Utilities’ cash flows from operating activities reflect primarily their energy sales and deliveries and cost of operations. The volume of energy sales and deliveries is affected primarily by factors external to the Utilities, such as growth of customer demand, weather, market prices for energy and economic conditions. Measures that promote distributed energy resources, such as distributed generation, demand reduction and energy efficiency, also affect the volume of energy sales and deliveries. Under the revenue decoupling mechanisms in the Utilities’ New York electric and gas rate plans, changes in delivery volumes from levels assumed when rates were approved may affect the timing of cash flows, but generally not net income. The prices at which the Utilities provide energy to their customers are determined in accordance with their rate plans. In general, changes in the Utilities’ cost of purchased power, fuel and gas may affect the timing of cash flows, but not net income, because the costs are recovered in accordance with rate plans. Pursuant to their rate plans, the Utilities have recovered from customers a portion of the tax liability they will pay in the future as a result of temporary differences between the book and tax basis of assets and liabilities. These temporary differences affect the timing of cash flows, but not net income, as the Companies are required to record deferred tax assets and liabilities at the current corporate tax rate for the temporary differences. For the Utilities, the reduction of the corporate tax rate to 21 percent under the TCJA is expected to result in decreased cash flows from operating activities. See “Other Regulatory Matters” in Note B to the Third Quarter Financial Statements.
Net income is the result of cash and non-cash (or accrual) transactions. Only cash transactions affect the Companies’ cash flows from operating activities. Principal non-cash charges or credits include depreciation, deferred income tax expense, amortizations of certain regulatory assets and liabilities, and accrued unbilled revenue. Non-cash charges or credits may also be accrued under the revenue decoupling and cost reconciliation mechanisms in the Utilities’ New York electric and gas rate plans.
68
Net cash flows from operating activities for the nine months ended September 30, 2018 for Con Edison and CECONY were $627 million and $705 million lower, respectively, than in the 2017 period. The change in net cash flows for Con Edison and CECONY reflects primarily cash payments of MTA power reliability costs ($139 million and $139 million, respectively) and Puerto Rico related restoration costs ($97 million and $93 million, respectively), storm restoration costs ($186 million and $125 million, respectively), higher pension and retiree benefit contributions ($13 million and $20 million, respectively) and lower income tax refunds received, net of income taxes paid ($33 million and $172 million, respectively), offset in part by the cash impact of the Utilities’ estimated net benefits in the 2018 period under the TCJA ($325 million and $304 million, respectively). See “Other Changes in Assets and Liabilities,” below.
The change in net cash flows also reflects the timing of payments for and recovery of energy costs. This timing is reflected within changes to accounts receivable – customers, recoverable and refundable energy costs within other regulatory assets and liabilities and accounts payable balances.
Cash Flows Used in Investing Activities
Net cash flows used in investing activities for Con Edison and CECONY were $362 million and $299 million higher, respectively, for the nine months ended September 30, 2018 compared with the 2017 period. The change for Con Edison reflects primarily higher utility construction expenditures ($309 million), new investments in electric and gas transmission projects ($94 million) and proceeds from the sale of assets in 2017 ($34 million), offset in part by a decrease in non-utility construction expenditures ($95 million). The change for CECONY primarily reflects increased utility construction expenditures.
Cash Flows from Financing Activities
Net cash flows from financing activities for Con Edison and CECONY were $1,110 million and $978 million higher, respectively, in the nine months ended September 30, 2018 compared with the 2017 period.
In September 2018, a Con Edison Development subsidiary issued $140 million aggregate principal amount of 4.41 percent Senior Notes, due 2028, secured by five of the company’s wind electric production projects.
In September 2018, O&R redeemed at maturity $50 million of 6.15 percent 10-year debentures.
In August 2018, O&R issued $125 million aggregate principal amount of 4.35 percent debentures, due 2048, and agreed to issue an additional $25 million aggregate principal amount of debentures in December 2018.
In June 2018, CECONY issued $640 million aggregate principal amount of debentures, due 2021, at a variable interest rate of 0.40 percent above three-month LIBOR and in July and August 2018, CECONY redeemed $636 million of its tax-exempt debt for which the interest rates were to be determined pursuant to periodic auctions.
In May 2018, CECONY issued $700 million aggregate principal amount of 4.50 percent debentures, due 2058, and $300 million aggregate principal amount of 3.80 percent debentures, due 2028, the net proceeds from the sale of which were used to repay short-term borrowings and for other general corporate purposes.
In April 2018, CECONY redeemed at maturity $600 million of 5.85 percent 10-year debentures.
In August 2017, Con Edison issued 4.1 million common shares resulting in net proceeds of $343 million, after issuance expenses, that were invested by Con Edison in its subsidiaries, principally CECONY and the Clean Energy Businesses, for funding of their construction expenditures and for other general corporate purposes.
In June 2017, CECONY issued $500 million aggregate principal amount of 3.875 percent debentures, due 2047, the net proceeds from the sale of which were used to repay short-term borrowings and for other general corporate purposes.
In March 2017, Con Edison issued $400 million aggregate principal amount of 2.00 percent debentures, due 2020, and prepaid the June 2016 $400 million variable rate term loan that was to mature in 2018.
69
Also, in March 2017, a Con Edison Development subsidiary issued $97 million aggregate principal amount of 4.45 percent senior notes, due 2042, secured by the company’s Upton County Solar renewable electric production project.
Con Edison’s cash flows from financing for the nine months ended September 30, 2018 and 2017 also reflect the proceeds, and reduction in cash used for reinvested dividends, resulting from the issuance of common shares under the company’s dividend reinvestment, stock purchase and long-term incentive plans of $75 million and $72 million, respectively.
Cash flows used in financing activities of the Companies also reflect commercial paper issuances and repayments. The commercial paper amounts outstanding at September 30, 2018 and 2017 and the average daily balances for the nine months ended September 30, 2018 and 2017 for Con Edison and CECONY were as follows:
2018 | 2017 | |||
(Millions of Dollars, except Weighted Average Yield) | Outstanding at September 30, | Daily average | Outstanding at September 30, | Daily average |
Con Edison | $1,352 | $830 | $356 | $645 |
CECONY | $1,004 | $447 | $147 | $323 |
Weighted average yield | 2.3 | 2.1 | 1.3 | 1.1 |
Capital Requirements and Resources
Contractual Obligations
Con Edison’s material obligations to make payments pursuant to contracts totaled $46,524 million and $43,822 million at September 30, 2018 and December 31, 2017, respectively. The increase at September 30, 2018 is due primarily to an increase in long-term debt, including interest ($1,916 million). See "Cash Flows from Financing Activities,” above. Also, in September 2018, a Con Edison Development subsidiary agreed to purchase Sempra Solar Holdings, LLC for $1,540 million (subject to closing adjustments, including working capital). See Note O to the Third Quarter Financial Statements.
Capital Resources
Con Edison plans to meet its 2018 capital requirements through internally-generated funds and the issuance of securities. The company has increased its estimates of the amount of common equity and long-term debt it plans to issue in 2018 to reflect funding required for the acquisition of Sempra Solar Holdings, LLC (see Note O to the Third Quarter Financial Statements). The company has also increased the amount of long-term debt it plans to issue at the Utilities. The company’s financing plans now include: the issuance of between $1,800 million and $2,400 million of long-term debt at the Utilities (of which the Utilities already have issued $1,125 million in 2018); the issuance of up to $825 million of long-term debt secured by ownership interests in the renewable electric production projects being acquired or, pending the issuance of such debt, other borrowings to fund the acquisition; and the issuance of additional debt secured by its existing renewable electric production projects. The plans now also include the issuance of up to $1,165 million of common equity, including $715 million to fund the acquisition, in addition to equity under its dividend reinvestment, employee stock purchase and long term incentive plans.
For each of the Companies, the ratio of earnings to fixed charges (Securities and Exchange Commission (SEC) basis) for the nine months ended September 30, 2018 and 2017 and the twelve months ended December 31, 2017 was:
Ratio of Earnings to Fixed Charges | |||
For the Nine Months Ended September 30, 2018(a) | For the Nine Months Ended September 30, 2017 | For the Twelve Months Ended December 31, 2017 | |
Con Edison | 3.1 | 3.8 | 3.6 |
CECONY | 3.3 | 3.9 | 3.7 |
(a) The ratios are calculated on a pre-tax basis, and as a result the ratios shown for the nine months ended September 30, 2018 do not reflect the reduction in income tax expense under the TCJA but do reflect the reduction in other operating revenues for Con Edison and CECONY of $325 million and $304 million, respectively, resulting from the deferral as a regulatory liability of the estimated net benefits under the TCJA. See “Other Regulatory Matters” in Note B to the Third Quarter Financial Statements.
70
For each of the Companies, the common equity ratio at September 30, 2018 and December 31, 2017 was:
Common Equity Ratio (Percent of total capitalization) | ||
September 30, 2018 | December 31, 2017 | |
Con Edison | 50.7 | 51.1 |
CECONY | 50.6 | 50.8 |
In October 2018, Moody's Investors Service Inc. (Moody’s) lowered its ratings of Con Edison's senior unsecured debt to Baa1 from A3, CECONY's senior unsecured debt to A3 from A2 and O&R's senior unsecured debt to Baa1 from A3. Moody's also affirmed its ratings of Con Edison's and O&R's commercial paper at P-2 and lowered its rating of CECONY's commercial paper to P-2 from P-1. Securities ratings assigned by rating organizations are expressions of opinion and are not recommendations to buy, sell or hold securities. A securities rating is subject to revision or withdrawal at any time by the assigning rating organization. Each rating should be evaluated independently of any other rating.
Other Changes in Assets and Liabilities
The following table shows changes in certain assets and liabilities at September 30, 2018, compared with December 31, 2017.
Con Edison | CECONY | ||
(Millions of Dollars) | 2018 vs. 2017 Variation | 2018 vs. 2017 Variation | |
Assets | |||
Other receivables, less allowance for uncollectible accounts | $103 | $75 | |
Regulatory asset - Unrecognized pension and other postretirement costs | (525) | (495) | |
Regulatory asset - MTA Power Reliability costs | 139 | 139 | |
Regulatory asset - Deferred storm costs | 42 | — | |
Other deferred charges and noncurrent assets | 5 | (18) | |
Liabilities | |||
System benefit charge | $74 | $70 | |
Pension and retiree benefits | (639) | (593) | |
Deferred income taxes and unamortized investment tax credits | 339 | 401 | |
Regulatory liability - TCJA net benefits | 325 | 304 | |
Other deferred credits and noncurrent liabilities | (4) | (2) | |
Regulatory Asset for Unrecognized Pension and Other Postretirement Costs and Liability for Pension and Retiree Benefits
The decrease in the regulatory asset for unrecognized pension and other postretirement costs and the liability for pension and retiree benefits reflects the final actuarial valuation, as measured at December 31, 2017, of the pension and other retiree benefit plans in accordance with the accounting rules for retirement benefits. The change in the regulatory asset also reflects the year's amortization of accounting costs. The change in the liability for pension and retiree benefits reflects in part contributions to the plans made by the Utilities in 2018. See Notes E and F to the Third Quarter Financial Statements.
Regulatory Asset for MTA Power Reliability Costs
The increase in the regulatory asset for MTA power reliability deferral reflects costs incurred and deferred as a regulatory asset in the 2018 period. See “Other Regulatory Matters” in Note B to the Third Quarter Financial Statements.
Other Receivables and Other Deferred Charges and Noncurrent Assets
The increase in other receivables for Con Edison and CECONY reflects costs related to aid provided by the Utilities in the restoration of power in Puerto Rico in the aftermath of September 2017 hurricanes that have been billed to the appropriate authorities. As of September 30, 2018, Con Edison and CECONY other receivables' balances related to such costs were $100 million and $95 million, respectively. The change in other deferred charges and noncurrent assets for Con Edison and CECONY reflects such costs that have already been billed.
71
Regulatory Liability for TCJA Net Benefits
The changes in the regulatory liability for TCJA net benefits were due to the Utilities’ deferral of estimated net benefits under the TCJA for the nine months ended September 30, 2018. See “Other Regulatory Matters” in Note B to the Third Quarter Financial Statements.
Regulatory Asset for Deferred Storm Costs and Other Deferred Credits and Noncurrent Liabilities
The changes in the regulatory asset for deferred storm costs and other deferred credits and noncurrent liabilities were due primarily to storm-related costs that were deferred as a regulatory asset or charged against a storm reserve. See “Other Regulatory Matters” in Note B to the Third Quarter Financial Statements.
System Benefit Charge
The increase in the liability for the system benefit charge reflects amounts collected by the Utilities from their customers that will be required to be paid to NYSERDA.
Deferred Income Taxes and Unamortized Investment Tax Credits
The increase in deferred income taxes and unamortized investment tax credits reflects primarily accelerated tax depreciation (including the Utilities' 2017 return-to-accrual adjustments recorded in the third quarter of 2018) and repair deductions. See Note I to the Third Quarter Financial Statements.
Off-Balance Sheet Arrangements
None of the Companies’ transactions, agreements or other contractual arrangements meet the SEC definition of off-balance sheet arrangements.
Regulatory Matters
In July 2018, the NYSPSC issued an order adopting an offshore wind renewable energy standard. NYSERDA is to conduct offshore wind project solicitations in 2018 and 2019 for 800 MW in total and purchase offshore wind renewable energy credits (ORECs) from developers under 20 to 25 year contracts. Load serving entities, such as CECONY and O&R, will be required to purchase ORECs from NYSERDA beginning in 2025 when projects are first expected to begin operation.
In July 2018, the NYSPSC issued an order that authorizes CECONY to expand its energy efficiency programs for gas customers. In August 2018, the NYSPSC issued an order approving, with modifications, CECONY’s Gas Demand Response Pilot program, including a three-year budget of $5.1 million. Other smart solutions proposed for natural gas customers, which CECONY addressed in its September 2017 petition to the NYSPSC, are expected to be further considered by the NYSPSC. In September 2018, CECONY requested NYSPSC approval of a six-year $305 million budget for a portfolio of proposed non-pipeline gas projects including targeted energy efficiency and thermal electrification measures, three renewable gas production plants and two to five gas storage facilities in Westchester County.
For additional information about the Utilities’ regulatory matters, see Note B to the Third Quarter Financial Statements.
Environmental Matters
In 2016, CECONY and another utility responded to a reported dielectric fluid leak at a New Jersey marina on the Hudson River associated with one or two underwater transmission lines, the New Jersey portion of which is owned and operated by the other utility and the New York portion of which is owned and operated by CECONY. In 2017, a dielectric fluid leak was found on one of the underwater transmission lines and repaired. In August 2018, the U.S. Environmental Protection Agency (EPA) declared the leak response complete. CECONY and the other utility are disputing whether to return the transmission lines to operation. In 2017, the other utility sued the marina owner, whose pier had collapsed on the transmission lines, seeking, among other things, recovery of its response and repair costs. In February 2018, the marina owner filed claims against both the other utility and CECONY seeking recovery of its alleged costs associated with this matter (including an interim demand for approximately $18.4 million). In April 2018, the other utility responded to the marina owner’s counterclaims and filed cross-claims against CECONY. In June 2018, CECONY filed counter-claims against the other utility in the court action. In September 2018, FERC dismissed a complaint filed by the other utility in which it had requested that FERC order CECONY to cooperate with the other utility to remove all of the dielectric fluid from the transmission lines and remove the lines. In October 2018, the other utility filed a request for rehearing at FERC with respect to its decision to dismiss the
72
complaint. CECONY expects that, consistent with the cost allocation provisions of its prior arrangements with the other utility for the transmission lines, the response and repair costs incurred by CECONY, the other utility and government agencies, net of any recovery from the marina owner, will be shared by CECONY and the other utility and that CECONY's share is not reasonably likely to have a material adverse effect on its financial position, results of operations or liquidity.
In August 2018, the EPA proposed the Affordable Clean Energy (ACE) rule to reduce greenhouse gas (GHG) emissions from existing coal-fired electric utility generating units. The Companies do not own any such generating units. The ACE rule, which would replace the Clean Power Plan the EPA issued in 2015 (and proposed to repeal in 2017), would establish emission guidelines for states to use when developing plans to limit GHG emissions from the generating units.
For additional information about the Companies’ environmental matters, see Note G to the Third Quarter Financial Statements.
73
Con Edison Development
The following table provides information about the projects the company has in operation and/or in construction
at September 30, 2018:
Project Name | Production Technology | Generating Capacity (a) (MW AC) | Purchased Power Agreement (PPA) Term (In Years) (b) | Actual/Expected In-Service Date (c) | Location (State) |
Wholly owned projects | |||||
Pilesgrove | Solar | 18 | (d) | 2011 | New Jersey |
Flemington Solar | Solar | 8 | (d) | 2011 | New Jersey |
Frenchtown I, II and III | Solar | 14 | (d) | 2011-13 | New Jersey |
PA Solar | Solar | 10 | (d) | 2012 | Pennsylvania |
California Solar 2 (e) | Solar | 80 | 20 | 2014-16 | California |
Oak Tree Wind (e) | Wind | 20 | 20 | 2014 | South Dakota |
Texas Solar 3 | Solar | 6 | 25 | 2015 | Texas |
Texas Solar 5 (e) | Solar | 95 | 25 | 2015 | Texas |
Campbell County Wind (e) | Wind | 95 | 30 | 2015 | South Dakota |
Texas Solar 7 (e) | Solar | 106 | 25 | 2016 | Texas |
California Solar 3 (e) | Solar | 110 | 20 | 2016 | California |
Adams Wind (e) | Wind | 23 | 7 | 2016 | Minnesota |
Valley View (e) | Wind | 10 | 14 | 2016 | Minnesota |
Coram (e) | Wind | 102 | 16 | 2016 | California |
Upton County Solar (e) | Solar | 158 | 25 | 2017 | Texas |
Panoche Valley (partial) | Solar | 97 | 20 | 2017-18 | California |
Big Timber (e) | Wind | 25 | 25 | 2018 | Montana |
Projects of less than 5 MW | Solar / Wind | 30 | Various | Various | Various |
Jointly owned projects (e) (f) | |||||
California Solar | Solar | 55 | 25 | 2012-13 | California |
Mesquite Solar 1 | Solar | 83 | 20 | 2013 | Arizona |
Copper Mountain Solar 2 | Solar | 75 | 25 | 2013-15 | Nevada |
Copper Mountain Solar 3 | Solar | 128 | 20 | 2014-15 | Nevada |
Broken Bow II | Wind | 38 | 25 | 2014 | Nebraska |
Texas Solar 4 | Solar | 32 | 25 | 2014 | Texas |
Total MW (AC) in Operation | 1,418 | ||||
Panoche Valley (partial) | Solar | 43 | 20 | 2018 | California |
Wistaria Solar | Solar | 100 | 20 | 2018 | California |
Aurora County Wind (e) | Wind | 20 | 20 | 2018 | South Dakota |
Brule County Wind (e) | Wind | 20 | 20 | 2018 | South Dakota |
Lost Hills Solar | Solar | 20 | (g) | 2018 | California |
Woodstock Hills | Wind | 9 | 15 | 2018 | Minnesota |
Total MW (AC) in Construction | 212 | ||||
Total MW (AC), All Projects | 1,630 | ||||
(a) Represents Con Edison Development’s ownership interest in the project.
(b) Represents PPA contractual term or remaining term from Con Edison Development’s date of acquisition.
(c) Represents Actual/Expected In-Service Date or Con Edison Development's date of acquisition.
(d) Solar renewable energy credit hedges are in place, in lieu of PPAs, through 2023.
(e) Project has been pledged as security for debt financing.
(f) All of the jointly-owned projects are 50 percent owned, except for Texas Solar 4 (which is 80 percent owned). See Notes M and O to the
Third Quarter Financial Statements.
(g) | Solar renewable energy hedges in place through 2019. |
In September 2018, a Con Edison Development subsidiary agreed to purchase Sempra Solar Holdings, LLC, which has ownership interests in 981 megawatts (AC) of operating renewable electric production projects, including its 379 megawatts (AC) share of projects in which its subsidiaries have a 50 percent ownership interest and Con Edison Development subsidiaries have the remaining ownership interests. See Notes M and O to the Third Quarter Financial Statements.
74
Con Edison Development's renewable electric production volumes generated for the three and nine months ended September 30, 2018 compared with the 2017 period were:
Millions of kWh Generated | |||||||||||||
For the Three Months Ended | For the Nine Months Ended | ||||||||||||
Description | September 30, 2018 | September 30, 2017 | Variation | Percent Variation | September 30, 2018 | September 30, 2017 | Variation | Percent Variation | |||||
Renewable electric production projects | |||||||||||||
Solar | 752 | 668 | 84 | 12.6 | % | 2,087 | 1,679 | 408 | 24.3 | % | |||
Wind | 245 | 217 | 28 | 12.9 | % | 776 | 734 | 42 | 5.7 | % | |||
Total | 997 | 885 | 112 | 12.7 | % | 2,863 | 2,413 | 450 | 18.6 | % | |||
Con Edison Transmission
CET Electric
In June 2018, the NYISO management committee supported the NYISO Staff recommendation to the NYISO Board of Directors to select two projects that were submitted under the NYISO’s FERC-approved public policy planning process by developers other than NY Transco. The NYISO Board is expected to make its final decision after engaging in additional review. CET Electric owns a 45.7 percent interest in NY Transco.
CET Gas
As a result of challenges to certain federal and state regulatory approvals for the Mountain Valley Pipeline, construction has been delayed on the project. In October 2018, Mountain Valley Pipeline LLC indicated that the project has an estimated total cost of $4,600 million and is targeted to be fully in-service by the end of the fourth quarter of 2019. CET Gas owns a 12.5 percent interest in the Mountain Valley Pipeline.
Financial and Commodity Market Risks
The Companies are subject to various risks and uncertainties associated with financial and commodity markets. The most significant market risks include interest rate risk, commodity price risk, credit risk and investment risk.
Interest Rate Risk
The Companies’ interest rate risk relates primarily to variable rate debt and to new debt financing needed to fund capital requirements, including the construction expenditures of the Utilities and maturing debt securities. Con Edison and its businesses manage interest rate risk through the issuance of mostly fixed-rate debt with varying maturities and through opportunistic refinancing of debt. Con Edison and CECONY estimate that at September 30, 2018, a 10 percent increase in interest rates applicable to its variable rate debt would result in an increase in annual interest expense of $6 million. Under CECONY’s current electric, gas and steam rate plans, variations in actual variable rate tax-exempt debt interest expense are reconciled to levels reflected in rates.
Commodity Price Risk
Con Edison’s commodity price risk relates primarily to the purchase and sale of electricity, gas and related derivative instruments. The Utilities and the Clean Energy Businesses apply risk management strategies to mitigate their related exposures. See Note K to the Third Quarter Financial Statements.
Con Edison estimates that, as of September 30, 2018, a 10 percent decline in market prices would result in a decline in fair value of $78 million for the derivative instruments used by the Utilities to hedge purchases of electricity and gas, of which $71 million is for CECONY and $7 million is for O&R. Con Edison expects that any such change in fair value would be largely offset by directionally opposite changes in the cost of the electricity and gas purchased. In accordance with provisions approved by state regulators, the Utilities generally recover from customers the costs they incur for energy purchased for their customers, including gains and losses on certain derivative instruments used to hedge energy purchased and related costs.
75
The Clean Energy Businesses use a value-at-risk (VaR) model to assess the market price risk of their portfolio of electricity and gas commodity fixed-price purchase and sales commitments, physical forward contracts, generating assets and commodity derivative instruments. VaR represents the potential change in fair value of the portfolio due to changes in market prices, for a specified time period and confidence level. These businesses estimate VaR across their portfolio using a delta-normal variance/covariance model with a 95 percent confidence level, compare the measured VaR results against performance due to actual prices and stress test the portfolio each quarter using an assumed 30 percent price change from forecast. Since the VaR calculation involves complex methodologies and estimates and assumptions that are based on past experience, it is not necessarily indicative of future results. VaR for the portfolio, assuming a one-day holding period, for the nine months ended September 30, 2018 and the year ended December 31, 2017, respectively, was as follows:
95% Confidence Level, One-Day Holding Period | September 30, 2018 | December 31, 2017 | ||||
(Millions of Dollars) | ||||||
Average for the period | $— | $— | ||||
High | 1 | 1 | ||||
Low | — | — | ||||
Credit Risk
The Companies are exposed to credit risk related to transactions entered into primarily for the various energy supply and hedging activities by the Utilities and the Clean Energy Businesses. See the discussion of credit exposure in Note K to the Third Quarter Financial Statements.
Investment Risk
The Companies’ investment risk relates to the investment of plan assets for their pension and other postretirement benefit plans and to the investments of the Clean Energy Businesses and Con Edison Transmission that are accounted for under the equity method. See Notes M and O to the Third Quarter Financial Statements.
The Companies’ current investment policy for pension plan assets includes investment targets of 53 to 63 percent equities and 35 to 49 percent fixed income and other securities. At September 30, 2018, the pension plan investments consisted of 58 percent equity and 42 percent fixed income and other securities.
For the Utilities’ pension and other postretirement benefit plans, regulatory accounting treatment is generally applied in accordance with the accounting rules for regulated operations. In accordance with the Statement of Policy issued by the NYSPSC and its current electric, gas and steam rate plans, CECONY defers for payment to or recovery from customers the difference between the pension and other postretirement benefit expenses and the amounts for such expenses reflected in rates. Generally, O&R also defers such difference pursuant to its rate plans.
Material Contingencies
For information concerning potential liabilities arising from the Companies’ material contingencies, see "Other Regulatory Matters" in Note B and Notes G and H to the Third Quarter Financial Statements.
76
Item 3: Quantitative and Qualitative Disclosures About Market Risk
For information about the Companies’ primary market risks associated with activities in derivative financial instruments, other financial instruments and derivative commodity instruments, see “Financial and Commodity Market Risks,” in Part I, Item 2 of this report, which information is incorporated herein by reference.
Item 4: Controls and Procedures
The Companies maintain disclosure controls and procedures designed to provide reasonable assurance that the information required to be disclosed in the reports that they submit to the Securities and Exchange Commission (SEC) is recorded, processed, summarized and reported within the time periods specified in the rules and forms of the SEC. Disclosure controls and procedures include, without limitation, controls and procedures designed to ensure that information required to be disclosed by an issuer in the reports that it files or submits under the Securities Exchange Act of 1934, as amended, is accumulated and communicated to the issuer’s management, including its principal executive and principal financial officers, or persons performing similar functions, as appropriate to allow timely decisions regarding required disclosure. For each of the Companies, its management, with the participation of its principal executive officer and principal financial officer, has evaluated its disclosure controls and procedures as of the end of the period covered by this report and, based on such evaluation, has concluded that the controls and procedures are effective to provide such reasonable assurance. Reasonable assurance is not absolute assurance, however, and there can be no assurance that any design of controls or procedures would be effective under all potential future conditions, regardless of how remote.
There was no change in the Companies’ internal control over financial reporting that occurred during the Companies’ most recent fiscal quarter that has materially affected, or is reasonably likely to materially affect, the Companies’ internal control over financial reporting.
77
Part II Other Information
Item 1: Legal Proceedings
For information about certain legal proceedings affecting the Companies, see "Other Regulatory Matters" in Note B and Notes G and H to the financial statements in Part I, Item 1 of this report and "Environmental Matters" in Part I, Item 2 of this report, which information is incorporated herein by reference.
Item 1A: Risk Factors
There were no material changes in the Companies’ risk factors compared to those disclosed in Item 1A of the Form 10-K.
Item 6: Exhibits
Con Edison
Purchase and Sale Agreement, dated as of September 20, 2018, by and between Sempra Solar Portfolio Holdings, LLC and CED Southwest Holdings, Inc. (Incorporated by reference to Exhibit 2 to Con Edison’s Current Report on Form 8-K, dated September 20, 2018.) | |
Statement of computation of Con Edison’s ratio of earnings to fixed charges for the nine-month periods ended September 30, 2018 and 2017, and the 12-month period ended December 31, 2017. | |
Rule 13a-14(a)/15d-14(a) Certifications – Chief Executive Officer. | |
Rule 13a-14(a)/15d-14(a) Certifications – Chief Financial Officer. | |
Section 1350 Certifications – Chief Executive Officer. | |
Section 1350 Certifications – Chief Financial Officer. | |
Exhibit 101.INS | XBRL Instance Document. |
Exhibit 101.SCH | XBRL Taxonomy Extension Schema. |
Exhibit 101.CAL | XBRL Taxonomy Extension Calculation Linkbase. |
Exhibit 101.DEF | XBRL Taxonomy Extension Definition Linkbase. |
Exhibit 101.LAB | XBRL Taxonomy Extension Label Linkbase. |
Exhibit 101.PRE | XBRL Taxonomy Extension Presentation Linkbase. |
CECONY
Statement of computation of CECONY’s ratio of earnings to fixed charges for the nine-month periods ended September 30, 2018 and 2017, and the 12-month period ended December 31, 2017. | |
Rule 13a-14(a)/15d-14(a) Certifications – Chief Executive Officer. | |
Rule 13a-14(a)/15d-14(a) Certifications – Chief Financial Officer. | |
Section 1350 Certifications – Chief Executive Officer. | |
Section 1350 Certifications – Chief Financial Officer. | |
Exhibit 101.INS | XBRL Instance Document. |
Exhibit 101.SCH | XBRL Taxonomy Extension Schema. |
Exhibit 101.CAL | XBRL Taxonomy Extension Calculation Linkbase. |
Exhibit 101.DEF | XBRL Taxonomy Extension Definition Linkbase. |
Exhibit 101.LAB | XBRL Taxonomy Extension Label Linkbase. |
Exhibit 101.PRE | XBRL Taxonomy Extension Presentation Linkbase. |
Pursuant to Item 601(b)(4)(iii)(A) of Regulation S-K, instruments defining the rights of holders of long-term debt of Con Edison’s subsidiaries other than CECONY, the total amount of which does not exceed ten percent of the total assets of Con Edison and its subsidiaries on a consolidated basis, are not filed as exhibits to Con Edison’s Form 10-K or Form 10-Q. Con Edison agrees to furnish to the SEC upon request a copy of any such instrument.
78
Signatures
Pursuant to the requirements of the Securities Exchange Act of 1934, each Registrant has duly caused this report to be signed on its behalf by the undersigned thereunto duly authorized.
Consolidated Edison, Inc. | ||
Consolidated Edison Company of New York, Inc. | ||
Date: November 1, 2018 | By | /s/ Robert Hoglund |
Robert Hoglund Senior Vice President, Chief Financial Officer and Duly Authorized Officer | ||
79