UNITED STATES
SECURITIES AND EXCHANGE COMMISSION
Washington, D.C. 20549
FORM
(Mark One)
ANNUAL REPORT PURSUANT TO SECTION 13 OR 15(d) OF THE SECURITIES EXCHANGE ACT OF 1934 |
For the fiscal year ended
OR
TRANSITION REPORT PURSUANT TO SECTION 13 OR 15(d) OF THE SECURITIES EXCHANGE ACT OF 1934 |
For the Transition period from to
Commission File No.
(Exact name of registrant as specified in its charter)
|
||
(State or other jurisdiction of incorporation or organization) |
|
(I.R.S. Employer Identification No.) |
|
||
(Address of principal executive offices) |
|
(Zip Code) |
Registrant’s telephone number, including area code: (
Securities registered pursuant to Section 12(b) of the Act:
Title of each class |
|
Trading Symbol |
Name of each exchange on which registered |
|
Securities registered pursuant to Section 12(g) of the Act: None
Indicate by check mark if the registrant is a well-known seasoned issuer, as defined in Rule 405 of the Securities Act. Yes ☐
Indicate by check mark if the registrant is not required to file reports pursuant to Section 13 or Section 15(d) of the Act. Yes ☐
Indicate by check mark whether the registrant (1) has filed all reports required to be filed by Section 13 or 15(d) of the Securities Exchange Act of 1934 during the preceding 12 months (or for such shorter period that the registrant was required to file such reports), and (2) has been subject to such filing requirements for the past 90 days.
Indicate by check mark whether the registrant has submitted electronically every Interactive Data File required to be submitted pursuant to Rule 405 of Regulation S-T (232.405 of this chapter) during the preceding 12 months (or for such shorter period that the registrant was required to submit such files).
Indicate by check mark whether the registrant is a large accelerated filer, an accelerated filer, a non-accelerated filer, a smaller reporting company, or an emerging growth company. See the definitions of “large accelerated filer,” “accelerated filer,” “smaller reporting company,” and “an emerging growth company” in Rule 12b-2 of the Exchange Act:
Large accelerated filer |
☐ |
☒ |
|
|
|
|
|
Non-accelerated filer |
☐ |
Smaller reporting company |
|
|
|
Emerging growth company |
If an emerging growth company, indicate by check mark if the registrant has elected not to use the extended transition period for complying with any new or revised financial accounting standards provided pursuant to Section 13(a) of the Exchange Act. ☐
Indicate by check mark whether the registrant has filed a report on and attestation to its management’s assessment of the effectiveness of its internal control over financial reporting under Section 404(b) of the Sarbanes-Oxley Act (15 U.S.C. 7262(b)) by the registered public accounting firm that prepared or issued its audit report.
If securities are registered pursuant to Section 12(b) of the Act, indicate by check mark whether the financial statements of the registrant included in the filing reflect the correction of an error to previously issued financial statements. ☐
Indicate by check mark whether any of those error corrections are restatements that required a recovery analysis of incentive-based compensation received by any of the registrant’s executive officers during the relevant recovery period pursuant to §240.10D-1(b). ☐
Indicate by check mark whether the registrant is a shell company (as defined in Rule 12b-2 of the Act). YES ☐ NO
The aggregate market value of the registrant’s voting and non-voting common equity held by non-affiliates, computed by reference to the price at which the common equity was last sold on the last business day of the registrant’s most recently completed second quarter was $
The total number of shares of Common Stock of the Registrant outstanding at March 10, 2023 was
PCAOB Auditor Firm Id:
DOCUMENTS INCORPORATED BY REFERENCE:
SEC Form 10-K Index
Section |
|
Page |
Part I |
|
|
Item 1. |
2 |
|
Item 1A. |
9 |
|
Item 1B. |
15 |
|
Item 2. |
16 |
|
Item 3. |
16 |
|
Item 4. |
16 |
|
Part II |
|
|
Item 5. |
17 |
|
Item 6. |
19 |
|
Item 7. |
Management’s Discussion and Analysis of Financial Condition and Results of Operations |
20 |
Item 7A. |
29 |
|
Item 8. |
30 |
|
Item 9. |
Changes in and Disagreements With Accountants on Accounting and Financial Disclosure |
67 |
Item 9A. |
67 |
|
Item 9B. |
69 |
|
Item 9C. |
Disclosure Regarding Foreign Jurisdictions that Prevent Inspections |
69 |
Part III |
|
|
Item 10. |
70 |
|
Item 11. |
74 |
|
Item 12. |
Security Ownership of Certain Beneficial Owners and Management and Related Stockholder Matters |
89 |
Item 13. |
Certain Relationships and Related Transactions, and Director Independence |
90 |
Item 14. |
91 |
|
Part IV |
|
|
Item 15. |
92 |
|
Item 16. |
94 |
|
|
96 |
|
As used in this annual report on Form 10-K, references to “CTG,” “the Company,” “the Registrant,” “we,” “us,” or “our” refer to Computer Task Group, Incorporated and its subsidiaries, unless the context suggests otherwise.
PART I
Forward-Looking Statements
This annual report on Form 10-K contains forward-looking information and statements made by the management of the Company that are based on the beliefs of management as well as assumptions made by, and information currently available to, the Company, and are subject to a number of risks and uncertainties. Further, certain forward-looking statements are based upon assumptions as to future events that may not prove to be accurate. These forward-looking statements are current only as of the date of this annual report. The Company assumes no obligation to update these statements based on information from and after the date of this report. Generally, forward-looking statements include words or phrases such as “anticipates,” “believes,” “expects,” “might,” “plans,” “may,” “will,” “would,” “should,” “could,” “seeks,” “estimates,” ”anticipates,” “project,” “predict,” “potential,” “currently,” “continue,” “intends,” “outlook,” and words and phrases of similar impact. The forward-looking statements include, but are not limited to, statements regarding future operations, industry trends or conditions and the business environment, and statements regarding future levels of or trends in business strategy and expectations, new business opportunities, cost control initiatives, business wins, market demand, revenue, operating expenses, capital expenditures, and financing. The forward-looking statements are made pursuant to safe harbor provisions of the Private Securities Litigation Reform Act of 1995. Numerous factors and risks could cause actual results to differ materially from those in the forward-looking statements, including the following:
1
Item 1. Business
Overview
CTG was incorporated in Buffalo, New York on March 11, 1966, and its corporate headquarters is located at 300 Corporate Parkway, Suite 214N, Amherst, New York 14226 (716-882-8000). CTG has operations in North and South America, Western Europe, and India. CTG’s employees and billable subcontractors total approximately 3,200 people worldwide at December 31, 2022. During 2022, the parent, Computer Task Group, Incorporated (United States), had seventeen operating subsidiaries:
The Company provides information technology (“IT”) and related services to its clients. These services include information and technology-related solutions, including staffing as a solution. With solution services, the Company generally takes responsibility for the deliverables and some level of project and staff management, and services may include high-end advisory or business-related consulting. When providing staffing services, including managed staffing, staff augmentation, and volume staffing, personnel are provided to clients, who then, in turn, take their direction from the clients’ managers.
IT Solutions and Services
CTG is a leading provider of IT solutions and services, serving as a catalyst for our clients’ digital transformation. We increase project momentum and the speed at which our clients achieve their desired outcomes. Our solutions portfolio addresses critical challenges for clients in North America, South America, Western Europe, and India in high-growth industries. Clients we typically support are organizations with large, complex technology, information, and data requirements. Some have begun their digital transformation and are struggling to drive their desired results, while many are just starting to define their digital transformation needs and strategy.
CTG's Digital Transformation Solutions portfolio spans three areas that collectively address many of our clients' most pressing transformation challenges and are designed to address their unique business, technology, and operational needs. Our capabilities ensure that our clients utilize the right information technology to meet their business needs, maximize their IT systems' value, and operate efficiently and effectively. The following describes the typical services provided:
2
Non-Strategic Technology Services - Staffing
CTG’s staffing services address a range of information and technology resource needs, from filling specific talent gaps to managing high-volume staffing programs. CTG recruits, retains, and manages IT talent for its clients, which are primarily large technology service providers and other companies with multiple locations and a significant need for high-volume professional IT resources.
Capabilities
Our expertise in key technologies–what we call Digital Accelerators–underpins our solutions and ensures our clients receive optimal value from their digital technologies and methodologies. CTG's Digital Accelerators evolve to meet market needs and address the most innovative technology platforms and thinking. These Digital Accelerators include Agile and DevOps, Internet of Things (IoT), Intelligent Automation, Data and Analytics, Cloud, and Automated Testing.
As the pace of change accelerates, CTG accelerates our clients' digital environment through a unique combination of Transformation Solutions, Digital Accelerators, leading industry talent, domain expertise, innovative tools and methodologies, a partner ecosystem, and a Global Delivery Network.
3
Acquisition of Eleviant
On September 29, 2022, CTG acquired Eleviant Technologies, an expert in mobile, cloud, web blockchain, robotic process automation (RPA) and artificial intelligence (AI) technologies. The acquisition strengthened CTG’s digital offerings in areas such as AI, machine learning (ML), and intelligent automation while expanding capabilities in cloud migration, mobile application development, and emerging technologies, including blockchain. CTG's software-as-a-service (SaaS) offerings expand through leveraging Eleviant’s PeopleOne intranet solution, vChat, vBots, and other platforms. In addition, CTG's Global Delivery Network capacity, agility, and flexibility increases with the addition of established Eleviant teams in Chennai and Coimbatore, India.
Segments
In prior years, and in 2021 prior to the fourth quarter, the Company reported its results in one segment. This included operating segments for each of North America and Europe. The services the Company provided, regardless of geography or industry, were similar in nature and produced similar results. Additionally, the CEO, who is the Company’s chief operating decision maker, made decisions on investments and allocated resources at the North America or Europe level. Accordingly, given the consistency in the services provided and the results, the Company aggregated those results into one reporting segment.
During the 2021 fourth quarter, the Company further refined its strategy around providing digital services within its IT solutions business in both North America and Europe. As part of this process, the Company also determined that there are certain accounts that are no longer part of the Company’s long-term business plan. Accordingly, the Company is operating and reporting in three segments within its business; North America IT Solutions and Services, Europe IT Solutions and Services, and Non-Strategic Technology Services.
CTG’s revenue by segment for the three years ended December 31, 2022, 2021 and 2020 was as follows:
(amounts in thousands) |
|
2022 |
|
|
2021 |
|
|
2020 |
|
|||
North America IT Solutions and Services |
|
$ |
84,038 |
|
|
$ |
101,506 |
|
|
$ |
67,948 |
|
Europe IT Solutions and Services |
|
|
149,931 |
|
|
|
169,341 |
|
|
|
154,847 |
|
Non-Strategic Technology Services |
|
|
91,111 |
|
|
|
121,438 |
|
|
|
143,296 |
|
Total |
|
$ |
325,080 |
|
|
$ |
392,285 |
|
|
$ |
366,091 |
|
IT Solutions and Services (North America and Europe)
Consistent with its long-term strategy, the Company invested in recent years in business development, solutions, delivery, recruiting and marketing resources to drive its IT Solutions and Services. IT Solutions and Services include the activities described under “IT Solutions and Services” and “Capabilities” above. In North America, IT Solutions and Services revenue decreased 17.2% in 2022 from 2021 as the Company completed in 2021 a very large project totaling more than $25 million in revenue that was not repeated in 2022. Revenue in Europe decreased 11.5% from the prior year as foreign currency exchange rates decreased significantly in 2022 which reduced revenue year-over-year. In 2021, as compared with 2020, North America IT Solutions and Services revenue increased 49.4%, while the increase in revenue was 9.4% in Europe over that same time period. The increases were mainly the result of strong demand for the Company’s services, including the significant project previously referenced, and as a direct result of the business development investments that the Company had made. Additionally, the revenue from the Company’s acquisition of Eleviant is included in the North America IT Solutions and Services segment.
Non-Strategic Technology Services
Consistent with its long-term strategy, the Company is not investing in low margin Non-Strategic Technology Services, and as these contracts expire, is often electing to disengage from the project. This segment only consists of lower margin IT staffing and related services in North America and Europe as described in “Non-Strategic Technology Services - Staffing” above. Nearly all of the revenue in this segment is in North America. The revenue in this segment decreased 25.0% in 2022 as compared to 2021, and 15.3% in 2021 as compared to 2020.
Vertical Markets
The Company provides a majority of its services through five vertical market focus areas: technology service providers, healthcare (which includes services provided to healthcare providers, health insurers (payers), and life sciences
4
companies), financial services, manufacturing, and energy. The remainder of CTG’s revenue is derived from general markets.
CTG’s revenue by vertical market as a percentage of consolidated revenue for the three years ended December 31, 2022, 2021, and 2020 was as follows:
|
|
2022 |
|
|
2021 |
|
|
2020 |
|
|||
Technology service providers |
|
|
22.5 |
% |
|
|
26.7 |
% |
|
|
31.3 |
% |
Healthcare |
|
|
18.1 |
% |
|
|
21.6 |
% |
|
|
14.9 |
% |
Financial services |
|
|
15.9 |
% |
|
|
16.2 |
% |
|
|
15.8 |
% |
Manufacturing |
|
|
15.5 |
% |
|
|
11.7 |
% |
|
|
13.5 |
% |
Energy |
|
|
5.8 |
% |
|
|
5.1 |
% |
|
|
6.2 |
% |
General markets |
|
|
22.2 |
% |
|
|
18.7 |
% |
|
|
18.3 |
% |
Total |
|
|
100.0 |
% |
|
|
100.0 |
% |
|
|
100.0 |
% |
Technology Service Providers
Demand from our largest Non-Strategic Technology Services client, IBM, which is included in this vertical market, decreased in both 2022 and 2021. Additionally, revenue as a percentage of consolidated revenue decreased in 2022 and 2021 as compared with previous years due to a change in business mix as the Company focused on driving its IT Solutions and Services, which are not included in this vertical market.
Healthcare
In 2022, the overall demand from our healthcare clients decreased as a result of a large training, implementation, and support engagement for a health system in North America completed in the 2021 fourth quarter that was not repeated in 2022. In contrast, consolidated revenue for the Company’s healthcare vertical market increased in 2021 as compared to 2020 as a result of the large 2021 fourth quarter project.
Financial Services
Revenue for the Company’s financial services vertical market as a percentage of consolidated revenue decreased in 2022 as compared with 2021 due to weaker demand from several clients in the Europe IT Solutions and Services segment. Revenue for the Company’s financial services vertical market as a percentage of consolidated revenue increased in 2021 as compared to 2020 due to strong demand from several clients for project related work in the North America IT Solutions and Services segment.
Manufacturing
The consolidated revenue in our manufacturing vertical market is primarily generated from several large Non-Strategic Technology Services clients, including Lenovo (through SDI International as a vendor manager for Lenovo), which is one of our largest clients. Revenue from Lenovo and other large clients increased in 2022 as a percentage of consolidated revenue compared with 2021 as a result of the significant reduction in consolidated revenue, and decreased in 2021 as compared with 2020 as the demand for these services decreased in recent years. Additionally, the Company continues to disengage from its lowest margin Non-Strategic Technology Services business, which is generally included in this vertical market.
Energy
Revenue for the Company's energy vertical market increased as a percentage of consolidated revenue in 2022 given strong demand for our services in this vertical market, but decreased as a percentage of revenue in 2021.
For the year ended December 31, 2022, CTG provided its services to approximately 541 clients, primarily in North America and Europe. In North America, the Company operates in the United States and Canada, with about 99% of 2022 North American revenue generated in the United States. In Europe, the Company operates in Belgium, Luxembourg, France, and the United Kingdom. Of total 2022 consolidated revenue of $325.1 million, approximately 53.3% was generated in North America and 46.7% in Europe. Revenue generated in India and Colombia was insignificant and is included in the North America total, but now includes our recent acquisition of Eleviant in late 2022, and we expect this to increase in future years. One client, IBM, accounted for greater than 10% of CTG’s consolidated revenue in 2022.
5
Revenue Recognition and Backlog
The Company recognizes revenue when control of the promised good or service is transferred to clients, in an amount that reflects the consideration the Company expects to be entitled to in exchange for those goods or services. For time-and-material contracts, revenue is recognized as hours are incurred and costs are expended. For contracts with progress billing schedules, primarily monthly, revenue is recognized as services are rendered to the client. Revenue for fixed-price contracts is recognized over time using an input-based approach. Over time revenue recognition best portrays the Company’s performance in transferring control of the goods or services to the client. On most fixed-price contracts, revenue recognition is supported through contractual clauses that require the client to pay for work performed to date, including cost plus a reasonable profit margin, for goods or services that have no alternative use to the Company. On certain contracts, revenue recognition is supported through contractual clauses that indicate the client controls the asset, or work in process, as the Company creates or enhances the asset. On a given project, actual salary and indirect labor costs incurred are measured and compared with the total estimate of costs of such items at the completion of the project. Revenue is recognized based upon the percentage-of-completion calculation of total incurred costs to total estimated costs. The Company infrequently works on fixed-price projects that include significant amounts of material or other non-labor related costs that could distort the percent complete within a percentage-of-completion calculation. The Company’s estimate of the total labor costs it expects to incur over the term of the contract is based on the nature of the project and our experience on similar projects, and includes management judgments and estimates that affect the amount of revenue recognized on fixed-price contracts in any accounting period. Losses on fixed-price projects are recorded when identified.
The Company’s revenue from contracts accounted for under time-and-material, progress billing, and percentage-of-completion methods as a percentage of consolidated revenue for the three years ended December 31, 2022, 2021, and 2020 was as follows:
|
|
2022 |
|
|
2021 |
|
|
2020 |
|
|||
Time-and-material |
|
|
76.1 |
% |
|
|
79.8 |
% |
|
|
81.0 |
% |
Progress billing |
|
|
19.1 |
% |
|
|
17.8 |
% |
|
|
15.9 |
% |
Percentage-of-completion |
|
|
4.8 |
% |
|
|
2.4 |
% |
|
|
3.1 |
% |
Total |
|
|
100.0 |
% |
|
|
100.0 |
% |
|
|
100.0 |
% |
As of December 31, 2022 and 2021, the backlog for fixed-price and all managed-support contracts was approximately $47.6 million and $68.5 million, respectively. Approximately 69% or $32.9 million of the December 31, 2022 backlog is expected to be earned in 2023. Approximately 47% of the $68.5 million of backlog at December 31, 2021, or $32.1 million, was earned in 2022. Revenue is subject to slight seasonal variations, with a minor slowdown and a decrease in billable resource utilization in months of high vacation and legal holidays (July, August, and December). Backlog does not tend to be seasonal; however, it does fluctuate based upon the timing of entry into long-term contracts.
Competition
The IT services market, for both information and technology solutions and IT and professional staffing services, is highly competitive. The market is also highly fragmented with many providers and no single competitor maintaining clear market leadership. Competition varies by location, the type of service, and the client to whom services are provided. The Company’s competition comes from four major channels: large national or international companies, including major accounting and consulting firms and large companies headquartered in India; hardware vendors and suppliers of packaged software systems; small local firms or individuals specializing in specific programming services or applications; and from a client’s internal IT staff. CTG competes against all four of these channels for its share of the market. The Company believes that to compete successfully, it is necessary to have a local geographic presence, offer appropriate IT solutions, provide skilled professional resources, and price its services competitively.
Intellectual Property
The Company has registered its symbol and logo with the U.S. Patent and Trademark Office and has taken steps to preserve its rights in other countries where it operates. We regard patents, trademarks, copyrights and other intellectual property as important to our success, and we rely on them in the United States and foreign countries to protect our investments in products and technology. Our patents expire at various times, but we believe that the loss or expiration of any individual patent would not materially affect our business. We, like any other company, may be subject to claims of alleged infringement of the patents, trademarks and other intellectual property rights of third parties from time to time in the ordinary course of business. CTG has entered into agreements with various software and hardware vendors from time to time in the normal course of business, and has capitalized certain costs under software development projects.
6
Human Capital Resources
Employees
CTG’s business depends on the Company’s ability to attract, develop and retain qualified professional staff to execute our strategy and provide services to its clients. The Company has a structured recruiting organization that works with its clients to meet their requirements by recruiting, retaining, and providing high quality, motivated staff. As the Company works with a number of subcontractors, the Company includes subcontractors in its total headcount, which equals approximately 3,200 total resources worldwide, with approximately 1,800 in North America, South America and India, with the remaining 1,400 in Europe as of December 31, 2022. Of these resources, approximately 86% are IT professionals and 14% are individuals who work in sales, recruiting, delivery, administrative and support positions. The Company believes that its relationship with its employees is good and supported by the Company’s 2022 recognition as a Great Place to Work® in nearly all eligible countries in which we operate. No employees are covered by a collective bargaining agreement or are represented by a labor union. CTG is an equal opportunity employer.
In 2022, we focused on adding additional staff with IT Solutions backgrounds in both North America and Europe to drive our IT Solutions and Services segments in line with our business strategy. Employees are encouraged to learn and grow their careers, by using our internal learning tools to complete classes or reach certifications, externally through classes primarily to achieve certifications, or through external classes paid for in part or in full through a tuition reimbursement program.
Social Responsibility
Our social responsibility principles inform the way we work. CTG is committed to the highest standards in our labor practices, the health and safety of our employees, and business ethics.
CTG has business operations in North America, Western Europe, India and Colombia, all regions with strict labor laws regarding human rights. We have internal policies intended to ensure our compliance with these laws, and we will not knowingly conduct business with anyone who violates these laws or basic human rights. We are committed to adhering to the Fair Labor Standards Act (“FLSA”), local labor laws, and prevailing wage rates. CTG prohibits any form of workplace or sexual harassment, and all employees are required to work in a manner that prevents harassment in the workplace. This policy is one component of CTG’s commitment to a discrimination-free work environment.
None of CTG’s leased office space is subject to industrial hazards and all adhere to the Occupational Safety and Health Administration (“OSHA”) office standards. We will not knowingly transact business with, or place our team members at, companies that do not enforce appropriate workplace safety and health standards.
Our Code of Business Conduct serves as our baseline for business ethics, and all employees are required to adhere to these guidelines. We are committed to providing clients with high-quality services that conform to mutually agreed-upon requirements and maintain certifications that support our Quality Policy, including ISO 9001:2015 certification for our European operations.
CTG Luxembourg PSF holds the “Entreprise Socialement Responsable” (Socially Responsible Enterprise) label that is awarded by the INDR Luxembourg (Institut National pour le Développement Durable et la Responsabilité Sociale des Entreprises), an organization that aims to promote responsible business practices in Luxembourg.
Our whistleblower hotline ensures that there is a confidential way to report any concerns with CTG business practices. Specific to CTG Luxembourg, PSF S.A., we have complaint handling (traitement des réclamations) processes for clients, in accordance with the Commission de Surveillance du Secteur Financier's (CSSF) Regulation 16-07 and Circular 17/671.
Environmental Responsibility
CTG maintains a relatively small carbon/environmental footprint. As a professional services provider, much of our focus is on the individual behavior of our team members and the decisions we make in managing our office spaces. Our environmental strategy has three areas of focus:
Personal Initiative
Many of our improvements come from our employee's environmentally conscious efforts. CTG supports these efforts by:
7
Corporate Contracts and Purchasing
CTG is committed to doing business with companies that share our environmental concern. Examples include purchasing environmentally-friendly products and prioritizing property management companies and office spaces that utilize environmentally friendly materials, policies, and services.
Corporate Stewardship
We are conscious of our impact on the communities our teams call home. Over the years, we have made significant improvements that support reducing the carbon/environmental footprint of our North American corporate headquarters, located in Amherst, New York. In all locations, we are committed to ensuring that none of our outdated computer systems and electronics end up in landfills and that our office waste be disposed of through local energy-from-waste programs.
Available Company Information
The Company’s annual reports on Form 10-K, quarterly reports on Form 10-Q, current reports on Form 8-K, and all amendments to those reports filed or furnished pursuant to Section 13(a) or 15(d) of the Securities Exchange Act of 1934 (Exchange Act), and reports filed under Section 16 of the Exchange Act are available without charge on the Company’s website at www.ctg.com as soon as reasonably practicable after such reports are filed with, or furnished to, the SEC. The Company’s code of ethics (Code of Business Conduct), committee charters and governance policies (including a fraud and insider trading policy) are also available without charge on the Company’s website at https://investors.ctg.com/corporate-governance/governance-documents. If applicable, the Company intends to disclose future amendments to, or waivers from, certain provisions of the Code of Conduct on the Company's website or in a current report on Form 8-K. The information on our website is not part of this Annual Report on Form 10-K. Additionally, the SEC’s website, www.sec.gov, contains reports, proxy and information statements, and other information regarding issuers that file electronically with the SEC.
8
Item 1A. Risk Factors
The following risk factors should be read carefully in connection with evaluating our business and the forward-looking information contained in this Annual Report on Form 10-K. The risk factors below represent what we believe are the known material risk factors with respect to the Company and our business, but are not the only risks we face. Additional risks unknown to us or that we currently believe are insignificant may also affect our business. Any of the risks described below or elsewhere in this Annual Report on Form 10-K or our other filings with the SEC could materially adversely affect our business, operations, financial position or future financial results.
Business Related Risks
Our business depends on the availability of a large number of highly qualified IT professionals, sales and management personnel, and our ability to recruit and retain these individuals.
We actively compete with many other IT service providers for qualified personnel, including professional IT staff, recruiters, sales and business development specialists, and management. The Company is experiencing significant competition for qualified resources due to a general shortage of available IT digital solutions talent. We believe this competition will continue in the future, and it may have a negative impact on the Company’s operating results if we are unable to hire the resources we need to meet the requirements from our clients on a timely basis.
The availability of qualified personnel may affect our ability to provide services and meet the requirements of our clients. An inability to fulfill client requirements at agreed-upon rates due to a lack of available qualified personnel may adversely affect our revenue and operating results in the future.
The Company also continues to experience wage inflation globally, making hiring and retaining key personnel difficult. Continued increases in wage requirements may reduce operating profits if the Company is unable to pass such increases along to clients. Additionally, the turnover of employees is disruptive to providing our services to clients and may impact our ability to complete engagements as required, impacting our operating results and our reputation as a digital IT Solutions provider, which may in turn impact our ability to win future engagements.
Our business long-term strategy to disengage from Non-Strategic Technology Services could have an adverse effect on our revenue and operating results if not successfully executed.
During the fourth quarter of 2021, the Company further refined its strategy to focus on providing digital services within its IT Solutions and Services businesses in both North America and Europe. As part of this process, the Company determined that there are certain lower-margin staffing services accounts within its business that are no longer part of the Company’s long-term business plans. The Company’s inability to successfully execute on its strategy of disengaging from its lowest margin staffing services, Non-Strategic Technology Services, may negatively impact revenue and operating results.
Decreases in demand for our services in the future would have an adverse effect on our revenue and operating results.
The Company’s revenue and operating results are significantly impacted by changes in demand for its services. In the past, when global economic conditions declined, there was a significant decrease in demand for the Company’s services, which negatively affected the Company’s revenue and operating results as compared with prior years. Declines in demand for our IT services in 2023 or future years would adversely affect our revenue and operating results as it has in the past.
Our client contracts generally have a short term or are terminable on short notice, and a significant number of failures to renew contracts in place, or early terminations or renegotiations of our existing client contracts could adversely affect our results of operations.
Our clients typically retain us on a non-exclusive, engagement-by-engagement basis, rather than under exclusive long-term contracts. We performed 76.1% of our services on a time-and-materials basis during 2022. As such, our clients generally have the right to terminate a contract with us upon written notice without the payment of any financial penalty. Client projects may involve multiple engagements or stages, and there is a risk that a client may choose not to retain us for additional stages of a project, or that a client will cancel or delay additional planned engagements. These terminations, cancellations, or delays could result from factors that are beyond our control and are unrelated to our work product or the progress of the project but could be related to business or financial conditions of the client, changes in client strategies or the economy in general. When contracts are terminated, we lose the anticipated future revenue, and we may not be able to eliminate the associated costs that would have been required to support those contracts in a timely manner.
9
Consequently, our operating results in subsequent periods may be lower than expected. Our clients can cancel or reduce the scope of their engagements with us on short notice. If they do so, we may be unable to reassign our professionals to new engagements without delay. The cancellation or reduction in scope of an engagement could, therefore, reduce the utilization rate of our professionals, which would have a negative impact on our business, financial condition, and results of operations. As a result of these and other factors, our past financial performance should not be relied on as a guarantee of similar or improved future performance. Due to these factors, we believe that our results from operations in the future may fluctuate from period to period.
Cyber Related Risks
We could be subject to liability and damage to our reputation resulting from cyber-attacks or data breaches.
Cyber risks for companies providing global IT and professional services, especially in regulated industries, continue to increase. This increase in risk may be attributed to the increasing value and dependence on data, including organizations’ intellectual property and citizens’ personal data that could be misused for identity theft and fraud. While the value and dependence of data has increased, likewise the reliance on electronic communications, mobile technologies, social networking, hybrid and cloud-based resources, smart devices, and emerging technologies continues to grow. In most regions, the regulatory compliance requirements surrounding data protection and privacy have also increased. In addition, the sophistication, motivation, and organization of cyber-attacks continues to evolve, as does the sophistication of threat actors such as organized crime, hackers, terrorists, activists, insider threats, and foreign governments.
The Company’s business, operations, and its clients rely on the secure processing, transmission, storage, integrity, and availability of data, services, and resources provided by its IT environments and operational processes. The Company’s complex IT environments and variety of delivery services support a wide range of technologies, industries, regulatory compliance requirements, and clients globally.
Although the Company has not experienced any prior material data breaches, regulatory non-compliance incidents, or cyber security incidents, its environments may be impacted by cyber-attacks or cyber security incidents caused via the aforementioned threat actors, the Company's personnel, or the Company’s third party providers. These incidents could result in data loss, the disruption or loss of the Company's internal or client-supporting operations and services, adversely affect the Company’s adherence with regulatory requirements, or result in a data breach. Data losses and data breaches could include the unauthorized disclosure, misuse, loss, and destruction of both the Company’s and its clients’ intellectual property, financial information, or other regulated or privacy-related information. This includes but is not limited to United States personally identifiable information (PII), personal data under the European General Data Protection Regulation (GDPR), data covered under Luxembourg Law on the Financial Sector, protected health information (PHI) under the United States Health Insurance Portability and Accountability Act of 1996 (HIPAA), and data covered under the increasing number of U.S. state privacy and data breach laws, and other countries’ privacy laws.
The Company’s failure to protect sensitive data and address the regulatory compliance requirements of data and associated internal or delivery services under the Company’s control could result in reputational damage, fines and penalties, litigation costs, external investigations, compensation costs including reimbursement and monetary awards, prohibition of providing services in a region or industry, and/or additional compliance and remediation costs that could have a material, adverse impact on the Company's operations. It could also have an adverse impact on the Company’s ability to maintain and execute new contracts with clients that produce or work with similar data, and make it more difficult to retain and recruit qualified personnel to perform its services in the future. As cyber threats continue to become more sophisticated and the regulatory compliance and privacy landscape continues to evolve resulting in changes to the Company’s risk profile, the Company may be required to expend and invest in additional resources, personnel, and technologies to enhance and implement new risk mitigation strategies.
Competition Related Risks
Increased competition and the bargaining power of our large clients may cause our billing rates to decline, which would have an adverse effect on our revenue and, if we are unable to control our personnel costs accordingly, on our margins and operating results.
We have experienced reductions in the rates we bill a number of our larger clients for services due to highly competitive market conditions. Additionally, we actively compete against many other companies for business at both new and existing clients. Billing rate reductions or competitive pressures may lead to a decline in revenue. When faced with such pressures, if we are unable to make commensurate reductions in our personnel costs, our margins and operating results would be adversely affected.
10
Existing and potential clients may outsource or consider outsourcing their IT requirements to foreign countries in which we may not currently have operations, which could have an adverse effect on our ability to retain existing clients or obtain new clients.
In recent years, more companies are using, or are considering using, low-cost offshore outsourcing centers to perform technology-related work and complete projects. Currently, we have partnered with clients to perform services outside of North America in both India and Colombia to mitigate and reduce this risk to our Company. However, the risk of additional outsourcing of IT solutions overseas to countries where we do not have operations could have a material, adverse impact on our future operations.
The IT services industry is highly competitive and fragmented, which means that our clients have a number of choices for providers of IT services, and we may not be able to compete effectively.
The market for our services is highly competitive. Moreover, the market is fragmented, and no company holds a dominant position. Accordingly, our competition for client requirements and experienced personnel varies significantly by geographic area and by the type of service provided. Some of our competitors are larger and have greater technical, financial, and marketing resources, and greater name recognition than we have in the markets we collectively serve. In addition, clients may elect to increase their internal IT system resources to satisfy their custom software development and integration needs. Finally, our industry is being impacted by the growing use of lower-cost offshore delivery capabilities (primarily India and other parts of Asia). There can be no assurance that we will be able to continue to compete successfully with existing or future competitors or that future competition will not have a material adverse effect on our results of operations and financial condition.
The introduction of new IT services or changes in client requirements for IT services may render our existing offerings obsolete or unnecessary, which, if we are unable to keep pace with these corresponding changes, could have an adverse effect on our business.
Our success depends, in part, on our ability to implement and deliver services that anticipate and keep pace with rapid and continuing changes in technology, industry standards, and client preferences and requirements. We may not be successful in anticipating or responding to these developments on a timely basis, and our offerings may not be successful in the marketplace. Also, services, solutions, and technologies developed by our competitors may make our solutions or staffing offerings uncompetitive or obsolete. Any one of these circumstances could have a material adverse effect on our ability to obtain and successfully complete client engagements.
Operations Related Risks
We derive a significant portion of our revenue from one client, and a significant reduction in the amount of requirements requested by this client would have an adverse effect on our revenue and operating results.
IBM is CTG’s largest client, and we provide services to various IBM divisions in a number of locations. The National Technical Services Agreement (NTS Agreement) with IBM expires on October 27, 2023. In 2022, 2021, and 2020, IBM accounted for $57.1 million or 17.6%, $74.8 million or 19.1%, and $77.5 million or 21.2% of the Company’s consolidated revenue, respectively. The Company’s accounts receivable from IBM at December 31, 2022 and 2021 totaled $14.0 million and $8.9 million, respectively.
If we are unable to bill for our services or collect our receivables, our results of operations, financial condition, and cash flows could be adversely affected.
Our business depends on our ability to obtain payment from our clients of the amounts they owe us for work performed. We evaluate the financial condition of our clients and typically bill and collect on reasonable cycles. However, we might not accurately assess the creditworthiness of our clients, or macroeconomic conditions could result in financial difficulties for our clients, including bankruptcy and insolvency. In certain industries, some clients have requested longer payment terms, which has adversely affected, and may continue to adversely affect, our cash flows. The timely collection of client balances also depends on our ability to complete our contractual commitments as required. If we are unable to meet our commitments or bill our clients on a timely basis, our results of operations and cash flows could be adversely affected. We have established allowances for losses of receivables and unbilled services where we deem amounts to be uncollectible. The actual uncollectible amounts from clients could differ from those that we currently anticipate and have reserved for.
11
If we repatriate our cash balances from our foreign operations, we may be subject to additional tax liabilities.
We earn a portion of our operating income outside of the United States, and any repatriation or deemed repatriation of funds currently held in foreign jurisdictions to the United States may result in additional tax liabilities for the Company. In addition, there have been changes to the tax laws in the United States that impact how United States-based multinational corporations are taxed on foreign earnings. Any further changes in these tax laws could have a material adverse impact on our tax expense and cash flows.
Ineffective internal controls could affect the Company's business and operating results.
The Company's internal control over financial reporting may not prevent or detect misstatements because of the inherent limitations of internal controls, including the possibility of human error, the circumvention or overriding of controls, poorly designed or ineffective controls, or fraud. Internal controls that are deemed effective can provide only reasonable assurance with respect to the preparation and fair presentation of the Company's consolidated financial statements. If the Company fails to maintain the adequacy of its internal controls, including the failure to implement new or improve existing controls, or fails to properly execute or properly test these controls, the Company's business and operating results could be adversely impacted and the Company could fail to meet its financial reporting obligations.
Changing economic conditions and the effect of such changes on accounting estimates could have a material impact on our results of operations.
The Company has made a number of estimates and assumptions relating to the reporting of its assets and liabilities and the disclosure of contingent assets and liabilities to prepare its consolidated financial statements pursuant to the rules and regulations of the SEC and other accounting rulemaking authorities. Such estimates primarily relate to the valuation of stock options for recording equity-based compensation expense, allowances for credit losses, investment valuation, discount rates associated with pension plans, incurred but not recorded claims related to the Company's self-insured medical plan, valuation allowances for deferred tax assets, goodwill, acquisition and related accounting, legal matters, other contingencies and estimates of progress toward completion and direct profit or loss on contracts, as applicable. As future events and their effects cannot be determined with precision, actual results could differ from these estimates. Changes in the economic climates in which the Company operates may affect these estimates and will be reflected in the Company’s consolidated financial statements in the event they occur. Such changes could result in a material impact on the Company’s results of operations.
An impairment of our long-lived assets, including goodwill, could have a material non-cash adverse impact on our results of operations.
As of December 31, 2022, the Company carried a goodwill balance of $36.0 million. The Company assesses goodwill for impairment when events or circumstances indicate that the carrying value may not be recoverable, or at a minimum, on an annual basis. The valuation of goodwill depends on a variety of factors, including the success of the Company’s business, global market and economic conditions, earnings growth and expected cash flows. Impairments to goodwill and other intangible assets may be caused by factors outside the Company’s control, such as increasing competitive pricing pressures, changes in foreign currency exchange rates, lower than expected sales and profit growth rates, and various other factors. Significant and unanticipated changes could require a non-cash charge for impairment in a future period, which may significantly affect the Company’s results of operations in the period of such change.
Global Pandemic and Related Risks
The impact of the COVID-19 pandemic has had, and may continue to have, an adverse effect on our business and our financial results.
The COVID-19 pandemic has negatively affected the global economy, disrupted consumer spending and global supply chains, and created significant volatility and disruption of financial markets. The COVID-19 pandemic has had and may to continue to have an adverse effect on our business and financial performance. The extent of any further lingering impacts of the COVID-19 pandemic on our business, including our ability to execute our business strategies as planned, are uncertain and cannot be predicted.
Our business, financial condition and results, cash flows and liquidity and results of operations could be materially and adversely affected by any such future developments.
12
Regulatory or Legislative Related Risks
Our business is subject to economic, political, regulatory and other risks associated with domestic and international operations which could have an adverse effect on our operating results if we are unable to mitigate or hedge these risks.
We have operations in the United States and Canada in North America, in Belgium, Luxembourg, France, and the United Kingdom in Europe, in India, and in Colombia. Although our foreign operations conduct their business in their local currencies, these operations are subject to their own currency fluctuations, legislation, employment and tax law changes, and economic climates. As they relate to our foreign operations, these factors are different from those of the United States. Although we actively manage these foreign operations with local management teams, our overall operating results may be negatively affected by local economic conditions, changes in foreign currency exchange rates, or tax, regulatory or other economic changes beyond our control.
Our foreign operations will continue to expose us to foreign currency exchange rate fluctuations, including the impact of the significant decline in the value of the Euro on the Company's consolidated operating results. The future impact of foreign currency exchange rate fluctuations on our results of operations cannot be accurately predicted. Accordingly, there can be no assurance that foreign currency exchange rates:
• will be stable in the future;
• can be mitigated with currency hedging or other risk management strategies; or
• will not have a material adverse effect on our business, operating results and financial condition.
In addition, any widespread outbreak of an illness, pandemic or other local or global health issue (including COVID-19), natural disasters, climate change impacts, economic weakness, including continued inflation or a recession, or uncertain political climates, international hostilities including recent developments in China and war, such as the conflict between Russia and Ukraine, or any terrorist activities, could adversely affect customer demand, the Company’s operations, and its ability to source and deliver services to its customers, which could have a material adverse effect on the Company’s financial results. The Company continues to monitor the impact that Brexit has had on its operations. To date, there has been a nominal impact on the Company’s operating results from Brexit. As the total revenue generated by our British subsidiary is immaterial as compared with the Company’s total consolidated revenue, we do not expect the nominal impact the exit has had on the Company’s operations to date to change in the foreseeable future. Furthermore, although we have no operations directly in the Ukraine, the global economy has been negatively impacted by the military conflict there, which in part has exacerbated inflationary conditions in North America and Western Europe where we conduct nearly all our operations. Macroeconomic conditions continue to also impact the global economy. The scope and duration of these conditions is uncertain. However, the Company is already seeing an impact through its clients delaying IT purchasing decisions and increasing labor and other costs. These conditions may have a significant negative impact on the Company’s operating results in the future if they continue to persist.
All of these factors are outside of our control, but may nonetheless harm our future results and cause us to adjust our strategy in order to compete effectively.
Increased focus and expectations on climate change and other ESG matters could have a material adverse effect on our business, financial condition and results of operations and damage our reputation.
An increase in focus on ESG matters by institutional investors, governmental and non-governmental organizations, consumers, shareholders, communities, and other stakeholders and the related expectations could have a material, adverse effect on our business, financial condition and results of operations and our reputation. These trends have led to, among other things, increased public and private social accountability reporting requirements relating to labor practices, climate change, and other ESG matters and thus greater demands on our solutions and services. The increased focus may also lead to new regulations and client, shareholder and consumer demands that could require us to incur additional costs or make changes to our operations to comply with these regulations. We expect that these trends will continue. If we are unable to adequately respond to, or we are not perceived as adequately responding to, existing or new requirements or demands, clients may choose to obtain services from a competitor.
Government cuts in healthcare programs, such as Medicare, and delays in legislative or regulatory healthcare mandates could cause a reduction in IT spending by our healthcare clients, which could materially and adversely affect our revenue and results of operations.
The Company’s growth efforts include a focus on the healthcare market. Growth in this market depends on continued spending by our healthcare clients on IT projects. Cuts in government healthcare programs, such as sequestration, which has periodically cut Medicare reimbursements to hospitals and health systems, may result in reduced expenditures by our healthcare clients on IT projects. If additional government cuts in healthcare programs occur, whether due to the failure of Congress to adopt a budget, pass appropriations bills or raise the U.S. debt ceiling or for
13
other reasons, there may be delays, reductions or cessation of funding to our clients, which could cause our clients to purchase less IT services from us, and materially and adversely affect our revenue and results of operations.
In addition, delays in implementation of legislative or regulatory healthcare mandates could adversely affect the IT spending by our healthcare clients to implement such mandates. If the implementation of existing or contemplated legislative or regulatory healthcare mandates are deferred, the resulting reduction in IT spending by our healthcare clients could materially and adversely affect our revenue and results of operations.
Changes in government regulations and laws affecting the IT services industry, and the industries in which our clients operate, including accounting principles and interpretations, and the taxation of domestic operations could adversely affect our results of operations.
Changing laws, regulations and standards relating to corporate governance and public disclosure, including new SEC regulations, create uncertainty for companies such as ours. These laws, regulations, and standards are subject to varying interpretations which, in many instances, is due to their lack of specificity. As a result, the application of these standards and regulations in practice may evolve over time as new guidance is provided by regulatory and governing bodies. This could result in continuing uncertainty regarding compliance matters and higher costs necessitated by ongoing revisions to disclosure and governance practices. We are committed to maintaining high standards of corporate governance and public disclosure. As a result, our efforts to comply with evolving laws, tax regulations and other standards have resulted in, and are likely to continue to result in, increased general and administrative expenses and a diversion of management time and attention from revenue-generating activities to compliance activities.
The Financial Accounting Standards Board (FASB), the SEC, and the Public Company Accounting Oversight Board (PCAOB) or other accounting rule making authorities have issued and may continue to issue new accounting rules or auditing standards that are different from those that we presently apply to our financial results. Such new accounting rules or auditing standards could require significant changes from the way we currently report our financial condition, results of operations or cash flows.
U.S. generally accepted accounting principles have been the subject of frequent changes in interpretations, and the frequency of future accounting policy changes may accelerate. Such future changes in financial accounting standards may have a significant effect on our reported results of operations, including results of transactions entered into before the effective date of the changes.
We are subject to income and other taxes in the United States (federal and state) and numerous foreign jurisdictions. Our provisions for income and other taxes and our tax liabilities in the future could be adversely affected by numerous factors. These factors include, but are not limited to, income before taxes being lower than anticipated in countries with lower statutory tax rates and higher than anticipated in countries with higher statutory tax rates, changes in the valuation of deferred tax assets and liabilities, and changes in various federal, state and international tax laws, regulations, accounting principles or interpretations thereof, which could adversely impact our financial condition, results of operations, and cash flows in future periods.
Acquisition Related Risks
Risks to the Company from acquisitions include integration challenges, disruptions of the Company's core business, a failure to achieve objectives, and the assumption of liabilities.
The Company regularly evaluates acquisitions to aid the Company's growth in revenue and profits by expanding the services the Company offers in the geographies in which the Company operates, and its client base. Acquisitions often present significant challenges and risks relating to the integration of the business into the Company, and there can be no assurances that the Company will manage acquisitions successfully, that the Company's core business will not be significantly disrupted after an acquisition is finalized, or that strategic acquisition opportunities will be available to the Company on acceptable terms. The risks from an acquisition include the Company failing to achieve strategic objectives and anticipated revenue and profit improvements, borrowing a significant amount of money to fund the acquisitions which creates financial stress for the Company's operations, as well as failing to retain the key personnel of the acquired business. Additionally, failure to meet financial objectives of an acquisition could lead to impairment charges of intangible assets and goodwill in future periods. Finally, the assumption of liabilities related to litigation or other legal proceedings involving the acquired business may present a significant risk.
14
Capital Resources Related Risks
We may require additional capital to support our business, and this capital may not be available to us on acceptable terms, if at all.
The Company entered into an asset-based lending revolving credit agreement (Credit Agreement) during the 2021 second quarter, which has a five-year term that expires in May 2026, replacing its previous agreement. Under this Credit Agreement, the Company can borrow up to $50.0 million depending on collateral availability. The Credit Agreement is collateralized by the Company’s accounts receivable in the United States, Belgium, and Luxembourg. The London Interbank Offered Rate (“LIBOR”), the interest rate benchmark used as a reference rate on our Credit Agreement, began being phased out at the beginning of calendar year 2022, with the one-month LIBOR scheduled to cease immediately after June 30, 2023. A reference rate based on the Secured Overnight Financing Rate (“SOFR”), and other alternative benchmark rates, are replacing LIBOR. Interest rates range from 1.5% to 2.0% over SOFR or EURIBOR loans, and 0.5% to 1.0% over base rate (prime rate) loans. The Company can borrow under the agreement at either rate at its discretion. It is possible that the volatility of and uncertainty around SOFR as a LIBOR replacement rate and the applicable credit adjustment as well as rising interest rates would result in higher borrowing costs for us, and would adversely affect our liquidity, financial condition, and earnings. The Company’s previous Credit and Security Agreement was terminated during the 2021 second quarter.
At December 31, 2022, we had no borrowings outstanding under our revolving credit facility. The Company may be dependent on our revolving credit facility to meet working capital and operational requirements, and access to our facility is dependent on, among other things, compliance with applicable covenants, including fixed charge coverage ratio, consolidated earnings before interest, taxes, depreciation, and amortization (EBITDA) targets, and a limit on annual expenditures for property, plant, equipment, and capitalized software. The fixed charge coverage ratio is only tested if availability on a measurement date is below a threshold. The amount available for borrowing under the revolving credit facility could be significantly reduced due to poor operational performance, or other factors. Any loss or material reduction of our ability to access funds under the revolving credit facility could materially and negatively impact our liquidity.
Risk from Activist Shareholders
Actions of activist stockholders could cause us to incur substantial costs, divert management’s and the board’s attention and resources, and have an adverse effect on our business and stock price.
From time to time, we may be subject to proposals by stockholders urging us to take certain corporate actions. If activist stockholder activities ensue, our business could be adversely affected as responding to proxy contests and reacting to other actions by activist stockholders can be costly and time-consuming, disrupt our operations, and divert the attention of management and our board of directors, all of which could interfere with our ability to execute our strategic plan. We may be required to retain the services of various professionals to advise us on activist stockholder matters, including legal, financial and communications advisors, the costs of which may adversely affect our financial results. In addition, the perceived uncertainties as to our future direction, strategy or leadership created as a consequence of activist stockholder initiatives may result in the loss of potential business opportunities, harm our ability to attract new investors, clients, and employees, and cause our stock price to experience periods of volatility or stagnation.
Share Price Related Risks
Our share price could fluctuate and be difficult to predict.
Our share price has fluctuated in the past and could continue to fluctuate in the future in response to various factors, including both external and internal, and those beyond our control. These factors may include, among others:
Item 1B. Unresolved Staff Comments
None.
15
Item 2. Properties
All of the Company locations, totaling approximately 23 sites, are leased facilities. Of the total locations, 11 of these are located in Europe in the countries of Belgium, Luxembourg, France and the United Kingdom, where our European operations support the Europe IT Solutions and Services segment. The Company has one location in Canada, five in India, one in Colombia, and the remaining locations are in the United States. All of these locations support the North America IT Solutions and Services segment. These facilities generally serve as sales and support offices and their size varies with the number of people employed at each office, ranging from approximately 100 to 23,000 square feet. The Company’s lease terms vary from periods of less than a year to fifteen years and typically have flexible renewal options. The Company believes that its leased facilities are adequate to support its current and anticipated future needs.
Item 3. Legal Proceedings
The Company and its subsidiaries are involved from time to time in various legal proceedings arising in the ordinary course of business. Although the outcome of lawsuits or other proceedings involving the Company and its subsidiaries cannot be predicted with certainty and the amount of any liability that could arise with respect to such lawsuits or other proceedings cannot be predicted accurately, management does not expect these matters, if any, to have a material adverse effect on the financial position, results of operations, or cash flows of the Company. See footnote 12 to the Company’s audited financial statements for the fiscal year ended December 31, 2022 included in Item 8, “Financial Statements and Supplementary Data.”
Item 4. Mine Safety Disclosures
Not applicable.
16
PART II
Item 5. Market for Registrant’s Common Equity, Related Stockholder Matters and Issuer Purchases of Equity Securities
Stock Market Information
The Company’s common stock is traded on The NASDAQ Stock Market LLC under the symbol CTG.
On March 10, 2023, there were 1,172 holders of record of the Company’s common shares. The Company currently does not pay a dividend. At December 31, 2022, under the terms of the Company's revolving credit facility, the Company is required to meet a financial covenant in order to pay dividends. The Company was in compliance with this financial covenant at December 31, 2022 and December 31, 2021. For additional information regarding these financial covenants, see Item 7, "Management's Discussion and Analysis of Financial Condition and Results of Operations - Financial Condition and Liquidity." The determination of the timing, amount and the payment of dividends, if any, on the Company’s common stock in the future is at the discretion of the Board of Directors and will depend upon, among other things, the Company’s profitability, liquidity, financial condition, capital requirements, and compliance with the covenants under the Company's Credit Agreement. The Company currently has no intention to pay a dividend in the foreseeable future.
For information concerning common stock issued in connection with the Company’s equity compensation plans, see Item 12, “Security Ownership of Certain Beneficial Owners and Management and Related Stockholder Matters.”
Issuer Purchases of Equity Securities
The Company’s Board of Directors has authorized the repurchase of its stock up to a total of $30.0 million. As of March 10, 2023, the Company had repurchased approximately $22.3 million shares pursuant to the authorization, leaving a remaining authorization of approximately $7.7 million. No shares were purchased during 2022 under this authorization.
The information below includes shares withheld by or surrendered to the Company to satisfy tax withholding obligations associated with employee equity awards. The information for the fiscal fourth quarter of 2022 is as follows:
|
|
|
|
|
|
|
|
Total Number |
|
|
Maximum |
|
||||
|
|
|
|
|
|
|
|
of Shares |
|
|
Dollar Amount |
|
||||
|
|
Total |
|
|
Average |
|
|
Purchased as |
|
|
that May Yet |
|
||||
|
|
Number |
|
|
Price |
|
|
Part of Publicly |
|
|
be Purchased |
|
||||
|
|
of Shares |
|
|
Paid per |
|
|
Announced Plans |
|
|
Under the Plans |
|
||||
Period |
|
Purchased |
|
|
Share* |
|
|
or Programs |
|
|
Or Programs |
|
||||
October 1 - October 31 |
|
|
— |
|
|
$ |
— |
|
|
|
— |
|
|
$ |
7,727,724 |
|
November 1 - November 30 |
|
|
— |
|
|
$ |
— |
|
|
|
— |
|
|
$ |
7,727,724 |
|
December 1 - December 31 |
|
|
— |
|
|
$ |
— |
|
|
|
— |
|
|
$ |
7,727,724 |
|
Total |
|
|
— |
|
|
$ |
— |
|
|
|
— |
|
|
|
|
|
|
|
|
|
|
|
|
|
|
|
|
|
|
||||
* Excludes broker commissions |
|
|
|
|
|
|
|
|
|
|
|
|
||||
17
Company Performance Graph
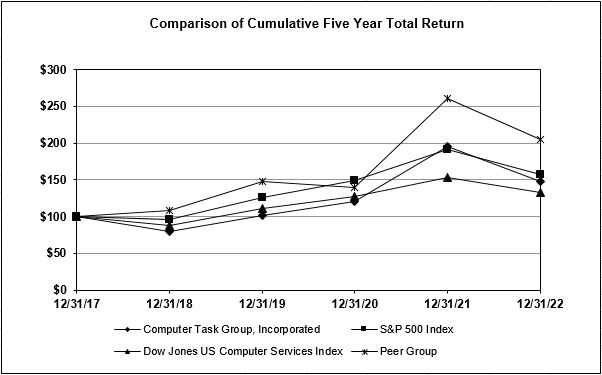
The following graph displays a five-year comparison of cumulative total shareholder returns for the Company’s common stock, the S&P 500 Index, the Dow Jones U.S. Computer Services Index, and a Peer Group, assuming a base index of $100 at the end of 2017. The cumulative total return for each annual period within the five years presented is measured by dividing (1) the sum of (A) the cumulative amount of dividends for the period, assuming dividend reinvestment, and (B) the difference between the Company’s share price at the end and the beginning of the period by (2) the share price at the beginning of the period. The calculations were made excluding trading commissions and taxes.
|
|
Base |
|
|
Indexed Returns |
|
||||||||||||||||||
|
|
December |
|
|
December |
|
|
December |
|
|
December |
|
|
December |
|
|
December |
|
||||||
|
|
2017 |
|
|
2018 |
|
|
2019 |
|
|
2020 |
|
|
2021 |
|
|
2022 |
|
||||||
Computer Task Group, Inc. |
|
$ |
100.00 |
|
|
$ |
80.00 |
|
|
$ |
101.57 |
|
|
$ |
120.00 |
|
|
$ |
195.49 |
|
|
$ |
148.24 |
|
S&P 500 Index |
|
$ |
100.00 |
|
|
$ |
95.62 |
|
|
$ |
125.72 |
|
|
$ |
148.85 |
|
|
$ |
191.58 |
|
|
$ |
156.88 |
|
Dow Jones U.S. Computer Services Index |
|
$ |
100.00 |
|
|
$ |
88.01 |
|
|
$ |
111.02 |
|
|
$ |
126.89 |
|
|
$ |
153.06 |
|
|
$ |
132.69 |
|
Peer Group |
|
$ |
100.00 |
|
|
$ |
108.05 |
|
|
$ |
148.02 |
|
|
$ |
139.96 |
|
|
$ |
260.91 |
|
|
$ |
204.66 |
|
Peer Group |
BGSF, Inc. |
Cross Country Healthcare, Inc. |
Huron Consulting Group Inc. |
Information Services Group, Inc. |
Mastech Digital, Inc. |
Perficient, Inc. |
PRGX Global, Inc. - included through March 3, 2021 when it was taken private |
RCM Technologies, Inc. |
The Hackett Group, Inc. |
The information included under this section entitled “Company Performance Graph” is deemed not to be “soliciting material” or “filed” with the SEC, is not subject to the liabilities of Section 18 of the Exchange Act, and shall not be deemed incorporated by reference into any of the filings previously made or made in the future by the Company under the Exchange Act or the Securities Act of 1933, except to the extent the Company specifically incorporates any such information into a document that is filed.
18
Item 6. [Reserved]
19
Item 7. Management’s Discussion and Analysis of Financial Condition and Results of Operations
Forward-Looking Statements
The following discussion should be read in conjunction with our Consolidated Financial Statements and related Notes contained in Part II, Item 8 of this report. This discussion contains forward-looking statements that involve risks and uncertainties. Our actual results could differ materially from those anticipated due to various factors discussed above under "Forward-Looking Statements" and under the caption "Risk Factors" in Part I, Item 1A of this report.
Industry Trends
The IT services industry is extremely competitive and characterized by continuous changes in client requirements and improvements in technologies. Our competition varies significantly by geographic region, as well as by the type of service provided. Many of our competitors are larger than CTG, and have greater financial, technical, sales, and marketing resources. In addition, the Company frequently competes with a client’s use of its own internal IT staff for projects. Our industry continues to be impacted by the use of lower-cost offshore delivery capabilities (primarily India and other parts of Asia). There can be no assurance that we will be able to continue to compete successfully with existing or future competitors or that future competition will not have a material adverse effect on our results of operations and financial condition.
The market demand for the Company’s services is heavily dependent on information and technology-related spending by major corporations, organizations and government entities in the markets and regions that we serve. The pace of technology advances, changes in business requirements, and the practices of our clients all have a significant impact on the demand for the services we provide. Competition for new engagements and pricing pressure has been strong as there are numerous competitors. The demand for the Company's IT Solutions and Services business decreased in 2022 as a large project completed in the second half of 2021 was not repeated in 2022. Additionally, higher inflation and challenging macroeconomic conditions in all of the countries in which we operate began to negatively impact demand in the second half of 2022. In 2021, demand for the Company's IT Solutions and Services business significantly improved as the impact of the COVID-19 pandemic was lower in 2021 than in 2020.
Acquisition of Eleviant
On September 29, 2022, the Company acquired 100% of the equity of Eleviant for approximately $19.0 million, including $17.4 million of cash on hand. In addition to the cash payment, Eleviant owners and executives were issued 173,802 shares of common stock valued at $1.2 million, and 200,000 stock options from the 2020 Equity Award Plan at the date of acquisition, valued at $0.4 million. Additionally, an earn-out of $5.0 million can be earned, a portion of which will be payable in each period subject to the achievement of revenue and gross profit targets for fiscal 2022, 2023 and 2024.
The U.S.-based Eleviant is a provider of digital transformation services and solutions, and is headquartered in Dallas, TX, with operations in Chennai and Coimbatore, India. Eleviant’s offerings support the new ways enterprises work, communicate, and scale today and focus on cloud, application modernization, mobile, artificial intelligence (AI), machine learning (ML), and robotic process automization (RPA). Eleviant’s services are supported by a portfolio of supporting solutions, including PeopleOne, a Digital Workplace platform for employee engagement, communication, and collaboration; vChat, a chatbot builder platform; and vBots, an RPA builder platform. The acquisition is expected to aid CTG in accelerating the growth of digital solutions sales to clients in the Americas and Europe and create new points of entry with proven technology services and solutions. Prior to acquisition, Eleviant recorded approximately $10 million of revenue annually.
The results of operations of Eleviant have been included in the Company’s consolidated financial results since the date of acquisition. As the Company has determined that the acquisition is not material to its existing operations, certain disclosures, including proforma financial information, have not been included in this annual report on Form 10-K.
Revenue and Cost Recognition
The Company recognizes revenue when control of the promised good or service is transferred to clients in an amount that reflects the consideration the Company expects to be entitled to in exchange for those goods or services. For time-and-material contracts, revenue is recognized as hours are incurred and costs are expended. For contracts with progress billing schedules, primarily monthly, revenue is recognized as services are rendered to the client. Revenue for fixed-price contracts is recognized over time using an input-based approach. Over time revenue recognition best portrays
20
the Company’s performance in transferring control of the goods or services to the client. On most fixed price contracts, revenue recognition is supported through contractual clauses that require the client to pay for work performed to date, including cost plus a reasonable profit margin, for goods or services that have no alternative use to the Company. On certain contracts, revenue recognition is supported through contractual clauses that indicate the client controls the asset, or work in process, as the Company creates or enhances the asset. On a given project, actual salary and indirect labor costs incurred are measured and compared with the total estimate of costs of such items at the completion of the project. Revenue is recognized based upon the percentage-of-completion calculation of total incurred costs to total estimated costs. The Company infrequently works on fixed-price projects that include significant amounts of material or other non-labor related costs that could distort the percent complete within a percentage-of-completion calculation. The Company’s estimate of the total labor costs it expects to incur over the term of the contract is based on the nature of the project and the Company's experience on similar projects, and includes management judgments and estimates that affect the amount of revenue recognized on fixed-price contracts in any accounting period. Losses on fixed-price projects are recorded when identified.
The Company’s revenue from contracts accounted for under time-and-material, progress billing, and percentage-of-completion methods as a percentage of consolidated revenue for the three years ended December 31, 2022, 2021, and 2020 was as follows:
|
|
2022 |
|
|
2021 |
|
|
2020 |
|
|||
Time-and-material |
|
|
76.1 |
% |
|
|
79.8 |
% |
|
|
81.0 |
% |
Progress billing |
|
|
19.1 |
% |
|
|
17.8 |
% |
|
|
15.9 |
% |
Percentage-of-completion |
|
|
4.8 |
% |
|
|
2.4 |
% |
|
|
3.1 |
% |
Total |
|
|
100.0 |
% |
|
|
100.0 |
% |
|
|
100.0 |
% |
Segments
The Company provides information technology and related services to its clients. These services include digital IT Solutions and Services, and Non-Strategic Technology Services. With digital IT Solutions and Services, the Company generally takes responsibility for the deliverables and some level of project and staff management, and these services may include high-end advisory or business-related consulting. When providing Non-Strategic Technology Services, including managed staffing, staff augmentation, and volume staffing, personnel are provided to clients based upon their requirements for specific skills, who then, in turn, take their direction from clients’ managers.
The Company’s strategy throughout its operations has been, and continues to be, to expand the amount of IT Solutions and Services it provides to its clients as compared with Non-Strategic Technology Services, and to focus on delivering digital solutions. IT Solutions and Services provide significant value to our clients, and drive higher bill rates and margins for the Company. Existing solutions include business, technology, and operations solutions that aid the Company's clients in digitally transforming their company, and ultimately meet the needs of its clients. The digital services the Company delivers includes the Internet of Things, Intelligent Automation, Data and Analytics, Cloud and Automated Testing.
In prior years, and in 2021 prior to the fourth quarter, the Company reported its results in one segment. This included operating segments for each of North America and Europe. The services the Company provided, regardless of geography or industry, were similar in nature and produced similar results. Additionally, the CEO, who is the Company’s chief operating decision maker, made decisions on investments and allocated resources at the North America or Europe level. Accordingly, given the consistency of the services provided and results, the Company aggregated those results into one reporting segment.
During the 2021 fourth quarter, the Company further refined its strategy to focus on providing digital services within its IT Solutions and Services business in both North America and in Europe. The focus includes investing in business development, solutions, delivery, and marketing for IT Solutions and Services, and critically evaluating each significant staffing engagement as it comes up for renewal to determine if the Company would continue to provide those services to its client. These decisions are based on, among other factors, critically evaluating the work performed, the availability of the resources, the client, the long-term opportunities for the services provided at the client, and the revenue and profit associated with the engagement. As part of this process, the Company determined that there are certain lower margin staffing services within its business that are no longer part of the Company’s long-term business plan.
21
Accordingly, in connection with this refinement of the Company’s strategy in the 2021 fourth quarter, the Company is operating and reporting in three segments within its business: North America IT Solutions and Services, Europe IT Solutions and Services, and Non-Strategic Technology Services. See Item 1. Business, “IT Solutions and Services,” and “Non-Strategic Technology Services” for further discussion of these segments.
The Company's 2022 third quarter acquisition of Eleviant Technologies, an expert in mobile, cloud, web blockchain, robotic process automation (RPA) and artificial intelligence (AI) technologies, strengthened its digital offerings in software engineering, including in such areas such as AI, machine learning (ML), and intelligent automation while expanding capabilities in cloud migration, mobile application development, and emerging technologies, including blockchain. The Company's software-as-a-service (SaaS) offerings expand through leveraging Eleviant’s PeopleOne intranet solution, vChat, vBots, and other platforms. In addition, The Company's Global Delivery Network capacity, agility, and flexibility increases with the addition of established Eleviant teams in Chennai and Coimbatore, India. Eleviant is included in the North America IT Solutions and Services segment as it is directly managed by that team.
CTG’s revenue by segment for the three years ended December 31, 2022, 2021 and 2020 was as follows:
(amounts in thousands) |
|
2022 |
|
|
2021 |
|
|
2020 |
|
|||
North America IT Solutions and Services |
|
$ |
84,038 |
|
|
$ |
101,506 |
|
|
$ |
67,948 |
|
Europe IT Solutions and Services |
|
|
149,931 |
|
|
|
169,341 |
|
|
|
154,847 |
|
Non-Strategic Technology Services |
|
|
91,111 |
|
|
|
121,438 |
|
|
|
143,296 |
|
Total |
|
$ |
325,080 |
|
|
$ |
392,285 |
|
|
$ |
366,091 |
|
The Company provides a majority of its services in five vertical market focus areas: technology service providers, healthcare (which includes services provided to healthcare providers, health insurers (payers), and life sciences companies), financial services, manufacturing, and energy. The remainder of CTG’s revenue is derived from general markets.
CTG’s revenue by vertical market as a percentage of consolidated revenue for the years ended December 31, 2022, 2021, and 2020 was as follows:
|
|
2022 |
|
|
2021 |
|
|
2020 |
|
|||
Technology service providers |
|
|
22.5 |
% |
|
|
26.7 |
% |
|
|
31.3 |
% |
Healthcare |
|
|
18.1 |
% |
|
|
21.6 |
% |
|
|
14.9 |
% |
Financial services |
|
|
15.9 |
% |
|
|
16.2 |
% |
|
|
15.8 |
% |
Manufacturing |
|
|
15.5 |
% |
|
|
11.7 |
% |
|
|
13.5 |
% |
Energy |
|
|
5.8 |
% |
|
|
5.1 |
% |
|
|
6.2 |
% |
General markets |
|
|
22.2 |
% |
|
|
18.7 |
% |
|
|
18.3 |
% |
Total |
|
|
100.0 |
% |
|
|
100.0 |
% |
|
|
100.0 |
% |
Results of Operations
The table below sets forth percentage information calculated as a percentage of consolidated revenue as reported on the Company’s consolidated statements of income as included in Item 8, “Financial Statements and Supplementary Data” in this report.
Year Ended December 31, |
|
2022 |
|
|
2021 |
|
|
2020 |
|
|||
(percentage of revenue) |
|
|
|
|
|
|
|
|
|
|||
Revenue |
|
|
100.0 |
% |
|
|
100.0 |
% |
|
|
100.0 |
% |
Direct costs |
|
|
75.4 |
% |
|
|
78.0 |
% |
|
|
79.0 |
% |
Gross profit |
|
|
24.6 |
% |
|
|
22.0 |
% |
|
|
21.0 |
% |
Operating expenses |
|
|
11.0 |
% |
|
|
10.2 |
% |
|
|
10.0 |
% |
Contribution profit |
|
|
13.6 |
% |
|
|
11.8 |
% |
|
|
11.0 |
% |
General and administrative expenses |
|
|
10.2 |
% |
|
|
8.6 |
% |
|
|
8.5 |
% |
Operating income |
|
|
3.4 |
% |
|
|
3.2 |
% |
|
|
2.5 |
% |
Interest and other income (expense), net |
|
|
(0.5 |
)% |
|
|
(0.2 |
)% |
|
|
0.4 |
% |
Income before income taxes |
|
|
2.9 |
% |
|
|
3.0 |
% |
|
|
2.9 |
% |
Provision (benefit) for income taxes |
|
|
0.9 |
% |
|
|
(0.5 |
)% |
|
|
0.8 |
% |
Net income |
|
|
2.0 |
% |
|
|
3.5 |
% |
|
|
2.1 |
% |
22
2022 as compared with 2021
The Company’s operating segments recorded revenue in 2022 and 2021 as follows:
|
|
|
|
|
|
|
|
|
|
|
|
|
|
Year-Over- |
|
|||||
(amounts in thousands) |
|
% of total |
|
|
2022 |
|
|
% of total |
|
|
2021 |
|
|
Year Change |
|
|||||
North America IT Solutions and Services |
|
|
25.9 |
% |
|
$ |
84,038 |
|
|
|
25.9 |
% |
|
$ |
101,506 |
|
|
|
(17.2 |
)% |
Europe IT Solutions and Services |
|
|
46.1 |
% |
|
|
149,931 |
|
|
|
43.2 |
% |
|
|
169,341 |
|
|
|
(11.5 |
)% |
Non-Strategic Technology Services |
|
|
28.0 |
% |
|
|
91,111 |
|
|
|
30.9 |
% |
|
|
121,438 |
|
|
|
(25.0 |
)% |
Total |
|
|
100.0 |
% |
|
$ |
325,080 |
|
|
|
100.0 |
% |
|
$ |
392,285 |
|
|
|
|
|
North America IT Solutions and Services revenue decreased $17.5 million or 17.2% in 2022 from 2021 as the Company completed in 2021 a very large project totaling more than $35 million in revenue that was not repeated in 2022. Revenue in Europe decreased 11.5% from the prior year as foreign currency exchange rates decreased significantly in 2022 which reduced revenue year-over-year.
Non-Strategic Technology Services revenue decreased $30.3 million or 25.0% during 2022 as compared with 2021. The Non-Strategic Technology revenue decrease was in large part due to the Company continuing to disengage from its lowest margin staffing projects, and from a continued decrease in demand for these services which began during the Pandemic.
The Company recorded revenue by geography in 2022 and 2021 as follows:
Year Ended December 31, |
|
% of total |
|
|
2022 |
|
|
% of total |
|
|
2021 |
|
|
Year-Over- |
|
|||||
(dollars in thousands) |
|
|
|
|
|
|
|
|
|
|
|
|
|
|
|
|||||
North America |
|
|
53.3 |
% |
|
$ |
173,409 |
|
|
|
55.7 |
% |
|
$ |
218,344 |
|
|
|
(20.6 |
)% |
Europe |
|
|
46.7 |
% |
|
|
151,671 |
|
|
|
44.3 |
% |
|
|
173,941 |
|
|
|
(12.8 |
)% |
Total |
|
|
100.0 |
% |
|
$ |
325,080 |
|
|
|
100.0 |
% |
|
$ |
392,285 |
|
|
|
(17.1 |
)% |
Reimbursable expenses billed to clients and included in revenue totaled $0.6 million and $1.1 million in 2022 and 2021, respectively.
The Company includes all billable consultants, including both employees and subcontractors, in its headcount. The Company’s total headcount was approximately 3,200 at December 31, 2022, which was a 7% decrease from approximately 3,450 at December 31, 2021. The Company added approximately 300 employees with the acquisition of Eleviant in the third quarter of 2022. The decrease in headcount is in large part due to the significantly declining revenue in the Company's Non-Strategic Technology Services segment. As the Company continues to disengage from lower margin Non-Strategic Technology Services, total headcount is expected to continue to decrease. Approximately 86% of the Company's total headcount was for technical resources and 14% for support positions.
The decrease in revenue in 2022 as compared with 2021 in the Company’s European operations was in large part due to the weakness relative to the U.S. dollar of the currencies in Belgium, Luxembourg, France, and the United Kingdom, the countries in which the Company’s European subsidiaries operate. In Belgium, Luxembourg, and France, the functional currency is the Euro, while in the United Kingdom the functional currency is the British Pound. In 2022 as compared with 2021, the average value of the Euro decreased 10.9%, and the average value of the British Pound decreased 10.1%. A significant portion of the Company's revenue from its European operations is recorded in Belgium, Luxembourg, and France. Revenue in constant currency is measured by applying the current period's average exchange rate to the prior periods. Based on this methodology, foreign currency exchange fluctuations contributed $18.6 million in revenue to the Company in 2021 and $1.2 million in operating income.
International Business Machines Corporation (IBM), CTG’s largest client, accounted for $57.1 million or 17.6% and $74.8 million or 19.1% of the Company’s consolidated revenue in 2022 and 2021, respectively. The National Technical Services Agreement with IBM expires on October 27, 2023. As part of the National Technical Services Agreement, the Company provides its services as a predominant supplier primarily to IBM’s Integrated Technology Services and the Systems and Technology Group business units. This agreement accounted for approximately 66% of all of the services provided to IBM by the Company in 2022. The Company’s accounts receivable from IBM at December 31, 2022 and 2021 totaled $14.0 million and $8.9 million, respectively. We expect to continue to derive a significant portion of our revenue from IBM in future years; however, a significant decline or the loss of the revenue from this client would have a significant negative effect on our operating results. No other client accounted for more than 10% of the Company’s revenue in 2022 or 2021.
23
The Company recorded operating results in 2022 and 2021 in its operating segments as follows:
North America IT Solutions and Services |
|
2022 |
|
|
2021 |
|
|
Change |
|
|||
Revenue |
|
|
100.0 |
% |
|
|
100.0 |
% |
|
|
— |
|
Direct costs |
|
|
62.3 |
% |
|
|
67.9 |
% |
|
|
(5.6 |
)% |
Gross margin |
|
|
37.7 |
% |
|
|
32.1 |
% |
|
|
5.6 |
% |
Operating expenses |
|
|
16.9 |
% |
|
|
13.6 |
% |
|
|
3.3 |
% |
Contribution margin |
|
|
20.8 |
% |
|
|
18.5 |
% |
|
|
2.3 |
% |
Europe IT Solutions and Services |
|
2022 |
|
|
2021 |
|
|
Change |
|
|||
Revenue |
|
|
100.0 |
% |
|
|
100.0 |
% |
|
|
— |
|
Direct costs |
|
|
75.4 |
% |
|
|
76.2 |
% |
|
|
(0.8 |
)% |
Gross margin |
|
|
24.6 |
% |
|
|
23.8 |
% |
|
|
0.8 |
% |
Operating expenses |
|
|
12.6 |
% |
|
|
12.6 |
% |
|
|
0.0 |
% |
Contribution margin |
|
|
12.0 |
% |
|
|
11.2 |
% |
|
|
0.8 |
% |
Non-Strategic Technology Services |
|
2022 |
|
|
2021 |
|
|
Change |
|
|||
Revenue |
|
|
100.0 |
% |
|
|
100.0 |
% |
|
|
— |
|
Direct costs |
|
|
87.5 |
% |
|
|
88.9 |
% |
|
|
(1.4 |
)% |
Gross margin |
|
|
12.5 |
% |
|
|
11.1 |
% |
|
|
1.4 |
% |
Operating expenses |
|
|
2.9 |
% |
|
|
4.0 |
% |
|
|
(1.1 |
)% |
Contribution margin |
|
|
9.6 |
% |
|
|
7.1 |
% |
|
|
2.5 |
% |
North America IT Solutions and Services direct costs, defined as costs for billable staff including billable out-of-pocket expenses, were 62.3% and 67.9% of revenue in 2022 and 2021, respectively. The results of Eleviant subsequent to its acquisition on September 29, 2022, are included in this segment. During 2022, the Company continued to focus on selling and delivering digital transformation solutions, which yield higher margins. In 2021, this segment included a significant training, implementation, and support engagement for a health system that drove direct costs higher, which resulted in a lower gross margin, or 32.1% of revenue in 2021 compared with 37.7% of revenue in 2022.
Europe IT Solutions and Services direct costs were similar in 2022 and 2021 totaling 75.4% and 76.2% of revenue, respectively. The decrease in direct costs is due to a focus on selling digital engagements which incur less costs and yield a higher margin.
Non-Strategic Technology Services incurred a decrease in directs costs of 1.4% from 88.9% of revenue in 2021 to 87.5% in 2022. As a result, the gross margin increased to 12.5% from 11.1%. The increase year-over-year was driven by the Company continuing to disengage from its lowest margin staffing engagements.
Operating expenses were higher in 2022 as a percentage of revenue as compared with 2021 in the Company’s North America IT Solutions and Services segments given continued investments in business development, solutions and delivery. This increase also reflects a loss of operating leverage due to lower revenue in the segment. In the Non-Strategic Technology Services segment, there was a continued concerted effort to reduce costs and improve profits as the Company disengages from this revenue.
Interest and other expense was 0.5% of revenue in 2022 and 0.2% of revenue in 2021.
The Company’s effective tax rate (ETR) is calculated based upon the full year's operating results and various tax related items. The ETR in 2022 was 30.8%, while the 2021 ETR was (17.0)%. The ETR in 2021 was mainly impacted by a reversal of the valuation allowance against the Company’s U.S. deferred tax assets.
Net income for 2022 was 2.0% of revenue or $0.44 per diluted share, compared with 3.5% of revenue or $0.92 per diluted share in 2021. Diluted earnings per share were calculated using 15.2 million weighted-average equivalent shares outstanding in 2022 and 15.0 million in 2021.
2021 as compared with 2020
A discussion regarding our financial condition and results of operations for fiscal 2021 compared to fiscal 2020 that are not in this report can be found under Part II, Item 7, "Management's Discussion and Analysis of Financial Condition and Results of Operations," in our Annual Report on Form 10-K for the fiscal year ended December 31, 2021, which was filed with the SEC on March 15, 2022, and is available on the SEC’s website at www.sec.gov.
24
Critical Accounting Estimates
The preparation of financial statements and related disclosures in conformity with U.S. generally accepted accounting principles requires the Company’s management to make estimates, judgments and assumptions that affect the amounts reported in the consolidated financial statements and accompanying notes. The Company’s significant accounting policies are included in Note 1 to the consolidated financial statements contained in this annual report on Form 10-K under Item 8, “Financial Statements and Supplementary Data.” These policies, along with the underlying assumptions and judgments made by the Company’s management in their application, have a significant impact on the Company’s consolidated financial statements. The Company identifies its most critical accounting estimates as those that are the most pervasive and important to the portrayal of the Company’s financial position and results of operations, and that require the most difficult, subjective and/or complex judgments by management regarding matters that are inherently uncertain. The Company’s most critical accounting estimates set forth below are related to the accounting for business combinations, a valuation allowance for deferred income taxes, and the valuation of goodwill.
Business Combinations - Accounting
On September 29, 2022, the Company acquired 100% of the equity of Eleviant for approximately $19.0 million, including $17.4 million of cash on hand, common stock valued at $1.2 million, and stock options valued at $0.4 million. Additionally, an earn-out of $5.0 million can be earned, a portion of which will be payable in each period subject to the achievement of revenue and gross profit targets for fiscal 2022, 2023 and 2024. Assets acquired and liabilities assumed are generally recorded at their fair value in an acquisition, where the excess of the purchase price over the fair value of the net asset acquired is recorded as goodwill. The determination of fair value for identifiable assets, including intangible assets, and liabilities assumed requires management to make estimates which are based on available information and assumptions with respect to the timing and amount of future revenue and expense associated with an asset. Examples where estimates may be required in the accounting for a business combination include customer relationships, technology, and contingent consideration. Estimates within these areas may include the amount of revenue, earnings before interest expense, taxes, depreciation and amortization (EBITDA), cash flow, useful lives, discount rates and the cost of capital. The Company completes its accounting for business combinations with the aid of a third party expert.
Income Taxes—Valuation Allowances on Deferred Tax Assets
At December 31, 2022, the Company had a total of approximately $2.9 million of deferred tax assets, and approximately $1.5 million of deferred tax liabilities recorded on its consolidated balance sheet. The deferred tax assets, net, primarily consist of deferred compensation, loss carryforwards, and state taxes. The changes in deferred tax assets and liabilities from period to period are determined based upon the changes in the differences between the basis of assets and liabilities for financial reporting purposes and the basis of assets and liabilities for tax purposes, as measured by the enacted tax rates when these differences are estimated to reverse. The Company has made certain assumptions regarding the timing of the reversal of these assets and liabilities, and whether taxable income in future periods will be sufficient to recognize all or a part of any gross deferred tax asset of the Company.
At December 31, 2022, the Company had deferred tax assets totaling approximately $0.4 million recorded resulting from net operating losses in previous years. The Company has analyzed each jurisdiction’s tax position, including forecasting potential taxable income in future periods and the expiration of the net operating loss carryforwards as applicable, and determined that it is unclear whether all of these deferred tax assets will be realized at any point in the future. Accordingly, at December 31, 2022, the Company had offset a portion of these assets with a valuation allowance totaling approximately $0.3 million, resulting in a net deferred tax asset from net operating loss carryforwards of approximately $0.1 million.
In assessing the realizability of deferred tax assets, management considers, within each taxing jurisdiction, whether it is more likely than not that all or some portion of the deferred tax assets will be realized, or that a valuation allowance is required. Management considers all available evidence, both positive and negative, in assessing realizability of its deferred tax assets. A key component of this assessment is management’s critical evaluation of current and future impacts of business and economic factors on the Company’s ability to generate future taxable income. Factors that may affect the Company’s ability to generate taxable income include, but are not limited to increased competition, a decline in revenue or margins, a loss of market share, the availability of qualified professional staff, and a decrease in demand for the Company’s services.
The Company’s deferred tax assets and their potential realizability are evaluated each quarter to determine if any changes should be made to the valuation allowance. Any change in the valuation allowance in the future could result in a
25
change in the Company’s ETR. A 1% change in the ETR in 2022 would have increased or decreased net income by approximately $96,000, or less than $0.01 per diluted share.
Goodwill Valuation
Goodwill recorded on the Company's consolidated balance sheet as of December 31, 2022 totaled $36.0 million and relates to four acquisitions completed by the Company between 2018 and 2022. The acquisition of Soft Company in 2018 is in the France IT Solutions and Services reporting unit, the 2019 acquisition of Tech-IT is in the Luxembourg IT Solutions and Services reporting unit, the 2020 acquisition of StarDust is in both the North America and France IT Solutions and Services reporting units, while the 2022 acquisition of Eleviant is in the North America IT Solutions and Services reporting unit. As of December 31, 2022, goodwill consisted of $18.8 million in the North America IT Solutions and Services segment, while the balance of $17.2 million is associated with the Europe IT Solutions and Services segment. The significant increase in goodwill in 2022 in the North America IT Solutions and Services segment is due to the acquisition of Eleviant. During 2021, $1.4 million of goodwill was allocated to the North America IT Solutions and Services segment, while the balance of $18.3 million remained in the Europe IT Solutions and Services segment. At December 31, 2020, the Company’s goodwill balance totaled $21.3 million, and was wholly included in the Company’s Europe IT Solutions and Services segment.
As of October 2022 fiscal month-end, we performed our annual goodwill impairment test for the Luxembourg and France IT Solutions and Services reporting units with the assistance of an external consultant and estimated the fair value based on a combination of the income (estimates of future discounted cash flows) and the market approach (market multiples for similar companies). The income approach uses a discounted cash flow (DCF) method that utilizes the present value of cash flows to estimate fair value of the reporting unit. The future cash flows for the reporting units were projected based upon on our estimates of future revenue, operating income and other factors such as working capital and capital expenditures. As part of our projections, we took into account expected industry and market conditions for the industries in which the reporting units operate, as well as trends currently impacting the reporting units. The market approach utilizes multiples of earnings before interest expense, taxes, depreciation and amortization (EBITDA) to estimate the fair value of the reporting unit. The market multiples used for our reporting units were based on competitor industry data, along with the market multiples for the Company and other factors.
Finally, we compared our estimates of fair value to the consolidated Company’s October 2022 month-end total public market capitalization, which included factoring in the business operations that do not have goodwill, and assessed implied control premiums. Based on the results of this analysis, we concluded that the estimated fair value determined under our approach for the annual goodwill impairment test for our France and Luxembourg IT Solutions and Services reporting units was reasonable.
From the impairment test, we noted the excess of the fair value over the carrying value for the France business unit is approximately 1%. The goodwill allocated to the French reporting unit at October 2022 month end totaled $12.2 million. While the reporting unit performed well and improved its results for the year ended October 2022 as compared with the prior year, there is no assurance it will continue to improve in the future. Additionally, challenges resulting from the current macroeconomic climate in France consisting of modest GDP growth matched with inflation of approximately 5% may make it difficult for the reporting unit to meet its targets in 2023.
In addition, we elected to perform a qualitative assessment for our annual goodwill impairment test of the North America IT Solutions and Services reporting unit. The qualitative assessment included our consideration of, among other things, the overall macroeconomic conditions, industry and market considerations, overall financial performance, including revenue and contribution profits, and other relevant company specific events. Based on the assessment of these items, we concluded that it is more likely than not that the fair value of our North America IT Solutions and Services reporting unit exceeded its respective carrying amount. Accordingly, there were no indicators of impairment and the quantitative impairment test was not performed for this reporting unit.
We concluded that the goodwill assigned to the France, Luxembourg, and North America IT Solutions and Services reporting units as of October 2022 were not impaired, and that they continue to not be impaired as of December 31, 2022. The estimates and assumptions on which the Company’s evaluations are based involve judgments and are based on current available information, any of which could prove wrong or inaccurate when made, or become wrong or inaccurate as a result of subsequent events. In the event the business significantly under achieves its goals for revenue and profit growth in the future, the carrying value for this business unit may not be supportable using a discounted cash flow projection, and an impairment charge may exist. See “Fair Value” in footnote 1, “Summary of Significant Accounting Policies” in the Notes to Consolidated Financial Statements for further discussion.
26
Other Estimates
The Company has also made a number of estimates and assumptions relating to the reporting of its assets and liabilities and the disclosure of contingent assets and liabilities to prepare the consolidated financial statements pursuant to the rules and regulations of the SEC, the FASB, and other regulatory authorities. Such estimates primarily relate to the valuation of stock options for recording equity-based compensation expense, allowances for credit losses, investment valuation, discount rates associated with pension plans, incurred but not reported claims related to the Company's self-insured medical plan, valuation allowances for deferred tax assets, goodwill, acquisition and related accounting, legal matters, other contingencies and estimates of progress toward completion and direct profit or loss on contracts, as applicable. As future events and their effect on the Company's operating results cannot be determined with precision, actual results could differ from these estimates. Changes in the economic climates in which the Company operates may affect these estimates and will be reflected in the Company’s consolidated financial statements in the event they occur.
Financial Condition and Liquidity
Cash provided by operating activities was $11.9 million, $7.4 million, and $30.7 million in 2022, 2021, and 2020, respectively. In 2022, net income was $6.6 million, while other non-cash adjustments, primarily consisting of depreciation and amortization expense, equity-based compensation, deferred income taxes, and deferred compensation totaled $5.1 million. In 2021 and 2020, net income was $13.7 million and $7.6 million, respectively, while the corresponding non-cash adjustments, including non-taxable life insurance gains, a gain from a sale of a building and an impairment of capitalized software in 2020, netted to $0.5 million and $4.4 million, respectively.
Accounts receivable balances decreased $12.1 million in 2022 as compared with 2021, increased $10.3 million in 2021 as compared with 2020, and decreased $17.0 million in 2020 as compared with 2019. The decrease in the accounts receivable balance in 2022 was due to the Company receiving payment on a large outstanding receivable balance from a project completed in the 2021 fourth quarter, and lower revenue. Days Sales Outstanding (“DSO”) is calculated by dividing accounts receivable obtained from the consolidated balance sheet by average daily revenue for the fourth quarter of the respective year. DSO was 84 days at December 31, 2022 as compared with 67 days December 31, 2021. Although there was a decrease in the accounts receivable balance, the increase in DSO was primarily driven by the Company's significant decrease in revenue due to disengaging from low-margin projects and the significant project in 2021 which was not repeated in 2022. DSO was 67 days at December 31, 2021 as compared with DSO at December 31, 2020 of 74 days.
The cash surrender value of life insurance policies decreased $0.5 million in 2022, $0.1 million in 2021, and $0.7 million in 2020. The decrease in each of the years was due to normal appreciation of the existing cash surrender value of the outstanding policies at each respective point in time, which in turn was reduced by the benefits paid upon the death of two former executives in 2020. Accounts payable decreased $7.9 million in 2022, increased $2.9 million in 2021, and decreased $0.6 million in 2020. The change in each year was primarily due to the timing of certain payments near year-end. Accrued compensation decreased $2.8 million in 2022 primarily due to an overall decrease in headcount of approximately 250 year-over-year, and increased $2.1 million in 2021 primarily due to the growth in the Company’s IT Solutions and Services and higher incentives for 2021 paid in the first quarter of 2022. Accrued compensation decreased $3.1 million in 2020 primarily due to the US operations reducing its payroll lag from two weeks in 2019 to one week in 2020. Income taxes receivable decreased by $0.3 million in 2022 and $1.1 million in 2021 due to higher taxable income. Income taxes receivable increased $1.3 million in 2020 due to a change in tax legislation which created a one-time benefit of approximately $1.1 million. Deferred payroll taxes decreased $3.5 million in 2022 and $3.2 million in 2021. The decreases in 2022 and 2021 were due to the Company’s payments of the employer payroll taxes deferred under the CARES ACT in 2020. Advance billings increased $1.0 million in 2022, $1.8 million in 2021, and $1.3 million in 2020. The change in advance billings in any given period is determined by the nature and type of existing projects, and the advance payments, if any, associated with those projects.
Investing activities used $20.3 million, $2.5 million, and $5.0 million of cash in 2022, 2021, and 2020, respectively. Cash paid for the acquisition of Eleviant, net of cash acquired in the 2022 third quarter, was $18.2 million. In 2020, cash paid for the acquisition of StarDust, net of cash acquired, was approximately $4.3 million. The Company also used cash for additions to property, equipment and capitalized software of $1.5 million in 2022, $1.9 million in 2021, and $2.9 million in 2020. The Company expects the amount to be spent in 2023 on additions to property, equipment and capitalized software to be greater than the amount spent in 2022. The Company has no material commitments for future capital expenditures. During 2020, the Company sold its remaining owned real estate for $2.5 million. As the book value of the building was approximately $1.6 million, the Company recorded a gain of approximately $0.8 million, after fees. The Company paid premiums for life insurance totaling $0.6 million, $0.5 million, and $0.6 million in 2022, 2021, and 2020, respectively. The Company received a total of $0.4 million of proceeds from life insurance policies upon the death of former executives in 2020.
27
Financing activities used $1.0 million, $1.1 million, and $5.7 million of cash in 2022, 2021, and 2020, respectively. Net cash paid under the Company’s revolving credit agreement was zero in both 2022 and 2021, and $5.3 million in 2020. Payments made on long-term debt assumed as part of the Eleviant acquisition totaled $1.0 million in 2022. Deferred debt costs were $1.2 million in 2021 which were costs associated with putting the new Credit Agreement in place in 2021. These deferred costs will be amortized over the term of the new Credit Agreement, or 60 months. Payments made to taxing authorities that represent the value of shares withheld for taxes in employee equity-based compensation transactions totaled $1.2 million, $0.4 million, and $0.2 million in 2022, 2021, and 2020, respectively. Cash overdrafts relate to the amount of outstanding checks at a point in time, and netted to $0.8 million, zero, and $(0.4) million in the 2022, 2021, and 2020 periods, respectively. No share purchases for treasury were made in 2022, and as of December 31, 2022, $7.7 million was available under the Company's authorization to purchase shares in future periods. The Company recorded $0.2 million, $0.4 million, and zero during 2022, 2021, and 2020, respectively, from the proceeds from stock option exercises.
No dividends were paid in 2022, 2021, or 2020, and the Company does not currently foresee making a dividend payment in the future.
The Credit Agreement has a five-year term that expires in May 2026. Under this Credit Agreement, the Company can borrow up to $50.0 million depending on collateral availability. The Credit Agreement is collateralized by the Company’s accounts receivable in the United States, Belgium and Luxembourg. Interest rates range from 1.5% to 2.0% over SOFR or EURIBOR loans, and 0.5% to 1.0% over base rate (prime rate) loans. The London Interbank Offered Rate (“LIBOR”), the interest rate benchmark used as a reference rate on our Credit Agreement, began being phased out at the beginning of calendar year 2022, with the one-month LIBOR scheduled to cease immediately after June 30, 2023. A reference rate based on the Secured Overnight Financing Rate (“SOFR”), and other alternative benchmark rates, are replacing LIBOR. The Company can borrow under the agreement at either rate at its discretion. The Company’s previous Credit and Security Agreement was terminated during the 2021 second quarter.
At both December 31, 2022 and December 31, 2021, there were no amounts outstanding under the Credit Agreement. The Company borrows or repays its debts as needed based upon its working capital obligations, including the timing of the U.S. bi-weekly payroll. There were no borrowings during 2022 or 2021. Total commitment fees incurred totaled approximately $0.2 million in 2020, while interest paid in 2020 totaled $0.2 million under the previous Credit and Security Agreement.
Under the Credit Agreement, the Company is required to meet one financial covenant in order to maintain borrowings under its revolving credit line, pay dividends, and make acquisitions. The covenant is measured quarterly, and at December 31, 2022 represented a fixed charge coverage ratio, where for the trailing twelve months the consolidated earnings before interest, taxes, depreciation, and amortization (EBITDA) adjusted for, amongst other items, equity-based compensation and severance expenses, must be greater than 1.0 times the consolidated interest expense paid in cash and any scheduled principal payments. The fixed charge coverage ratio is only tested if availability, subject to a maximum of the commitment of $50.0 million, on the measurement date is less than the greater of 12.5% of the total loan availability or $5.0 million. Actual borrowings by CTG under the Credit Agreement are subject to a borrowing base, which is a formula based on certain eligible receivables and reserves for each country included in the Credit Agreement (the United States, Belgium, and Luxembourg). Receivable balances from our largest client, IBM, have been removed from the Credit Agreement as collateral, as the Company had entered into a factoring arrangement for those receivables. See “Accounts Receivable Factoring” in footnote 1, “Summary of Significant Accounting Policies” in the Notes to Consolidated Financial Statements for further discussion. Total availability as of December 31, 2022 was approximately $33.0 million. The Company’s compliance with its financial covenant was not required to be tested at December 31, 2022 as the availability under the Credit Agreement was in excess of 12.5% of the total loan availability. The Company was in compliance with its applicable covenants under the Credit Agreement at December 31, 2021, and under compliance under the previous Credit and Security Agreement at December 31, 2020.
As part of the Eleviant acquisition, the Company has $0.6 million outstanding under a revolving line of credit as of December 31, 2022. The interest rate is 8.0%, and the amount outstanding is included in "Accounts Payable" on the Company's Consolidated Balance Sheet.
Of the total cash and cash equivalents reported on the consolidated balance sheet at December 31, 2022 of $25.1 million, nearly all of which is held by the Company’s foreign operations and is considered to be indefinitely reinvested in those operations. The Company has not repatriated any of its cash and cash equivalents from its foreign operations in the past five years, and has no intention of doing so in the foreseeable future as the funds are generally required to meet the working capital needs of its foreign operations.
28
At December 31, 2022, the Company believes existing internally available funds, cash potentially generated from future operations, and funds potentially available under the Company's revolving line of credit (subject to collateral limits) totaling $49.8 million, will be sufficient to meet foreseeable working capital and capital expenditure needs, fund stock repurchases, fund acquisitions, pay a dividend (if any), and allow for future internal growth and expansion.
Off-Balance Sheet Arrangements
The Company did not have off-balance sheet arrangements or transactions in 2022, 2021, and 2020 other than guarantees in our European operations which support office leases and performance under government contracts. These guarantees totaled approximately $3.0 million at December 31, 2022. Also, the Company has purchase obligations over the next five years for certain software, recruiting and other services totaling $2.5 million.
Quantitative and Qualitative Disclosures about Market Risk
The Company’s primary market risk exposure consists of foreign currency exchange risk associated with the Company’s European operations. See Item 7A, “Quantitative and Qualitative Disclosures about Market Risk” in this report.
Recently Issued Accounting Standards
See footnote 1 - "Recently Issued Accounting Standards" of the Notes to the Consolidated Financial Statements contained in Part II, Item 8 of this report for information regarding recent accounting pronouncements.
Contractual Obligations
The Company intends to satisfy its contractual obligations from operating cash flows, and, if necessary, from draws on its demand credit line. The Company’s purchase obligations over the next five years total approximately $2.5 million, including $1.0 million for software maintenance, support and related fees, $0.1 million for telecommunications, $0.1 million for recruiting services, $0.4 million for professional organization memberships and consulting fees, $0.8 million for computer-based training courses, and less than $0.1 million for facilities improvements and maintenance. In the accompanying Notes to Consolidated Financial Statements, see footnote 4, “Debt” for a description of our asset-based lending revolving credit agreement and outstanding borrowing obligations, footnote 6, “Lease Commitments” for lease obligations, and footnote 7, “Deferred Compensation Benefits” for a description of the pension and post-retirement obligations. The Company has not entered into any material off-balance sheet arrangements.
Item 7A. Quantitative and Qualitative Disclosures About Market Risk
The Company’s primary market risk exposure consists of foreign currency exchange risk associated with the Company’s European operations.
During 2022, revenue was impacted by the year-over-year foreign currency exchange rate changes of Belgium, Luxembourg, France, and the United Kingdom, the countries in which the Company’s European subsidiaries operate. In Belgium, Luxembourg, and France, the functional currency is the Euro, while in the United Kingdom the functional currency is the British Pound. Revenue in constant currency is measured by applying the current period's average exchange rate to the prior periods. Based on this methodology, foreign currency exchange fluctuations contributed $18.6 million in revenue to the Company in 2021 and $1.2 million in operating income. The Company has historically not used any market rate sensitive instruments to hedge its foreign currency exchange risk as it conducts its foreign operations in local currencies, which generally limits risk. The Company believes the market risk related to intercompany balances in future periods will not have a material effect on its results of operations.
29
Item 8. Financial Statements and Supplementary Data
Report of Independent Registered Public Accounting Firm
Board of Directors and Shareholders
Computer Task Group, Incorporated
Opinion on the financial statements
We have audited the accompanying consolidated balance sheets of Computer Task Group, Incorporated (a New York corporation) and subsidiaries (the “Company”) as of December 31, 2022 and 2021, the related consolidated statements of income, comprehensive income, shareholders’ equity, and cash flows for each of the three years in the period ended December 31, 2022, and the related notes and financial statement schedule included under Item 15(a) (collectively referred to as the “financial statements”). In our opinion, the financial statements present fairly, in all material respects, the financial position of the Company as of December 31, 2022 and 2021, and the results of its operations and its cash flows for each of the three years in the period ended December 31, 2022, in conformity with accounting principles generally accepted in the United States of America.
We also have audited, in accordance with the standards of the Public Company Accounting Oversight Board (United States) (“PCAOB”), the Company’s internal control over financial reporting as of December 31, 2022, based on criteria established in the 2013 Internal Control—Integrated Framework issued by the Committee of Sponsoring Organizations of the Treadway Commission (“COSO”), and our report dated March 15, 2023 expressed an unqualified opinion.
Basis for opinion
These financial statements are the responsibility of the Company’s management. Our responsibility is to express an opinion on the Company’s financial statements based on our audits. We are a public accounting firm registered with the PCAOB and are required to be independent with respect to the Company in accordance with the U.S. federal securities laws and the applicable rules and regulations of the Securities and Exchange Commission and the PCAOB.
We conducted our audits in accordance with the standards of the PCAOB. Those standards require that we plan and perform the audit to obtain reasonable assurance about whether the financial statements are free of material misstatement, whether due to error or fraud. Our audits included performing procedures to assess the risks of material misstatement of the financial statements, whether due to error or fraud, and performing procedures that respond to those risks. Such procedures included examining, on a test basis, evidence regarding the amounts and disclosures in the financial statements. Our audits also included evaluating the accounting principles used and significant estimates made by management, as well as evaluating the overall presentation of the financial statements. We believe that our audits provide a reasonable basis for our opinion.
Critical audit matters
The critical audit matters communicated below are matters arising from the current period audit of the financial statements that were communicated or required to be communicated to the audit committee and that: (1) relate to accounts or disclosures that are material to the financial statements and (2) involved our especially challenging, subjective, or complex judgments. The communication of critical audit matters does not alter in any way our opinion on the financial statements, taken as a whole, and we are not, by communicating the critical audit matters below, providing separate opinions on the critical audit matters or on the accounts or disclosures to which they relate.
Goodwill Impairment Assessment – France IT Solutions and Services Reporting Unit
As described in Note 1 to the consolidated financial statements, the Company evaluates goodwill impairment for each reporting unit every fourth quarter, or more frequently if an indicator of impairment is present. The Company’s goodwill balance related to the France IT Solutions and Services reporting unit is $12.2 million as of December 31, 2022. We have identified the annual goodwill impairment assessment of the France IT Solutions and Services reporting unit as a critical audit matter.
The principal consideration for our determination that the goodwill impairment assessment of the France IT Solutions and Services reporting unit is a critical audit matter is that auditing management’s estimated fair value used in the valuation of the France IT Solutions and Services reporting unit is challenging due to the high degree of auditor judgement necessary in evaluating significant assumptions such as forecasted revenue, forecasted earnings before interest, taxes, depreciation, and amortization, long-term discount rate, and estimated valuation multiples. These significant assumptions require subjective auditor judgement in order to assess their reasonableness.
30
Our audit procedures related to the goodwill impairment assessment of the France IT Solutions and Services reporting unit included the following, among others:
Valuation of Acquired Customer Relationship Asset in a Business Combination
As described in Note 3 to the consolidated financial statements, the Company completed the acquisition of Eleviant Technologies, Inc. (“Eleviant”), during the year ended December 31, 2022 for purchase consideration of $23 million. This transaction was accounted for as a business combination in accordance with ASC 805, Business Combinations, which resulted in the identification and recognition of a customer relationship intangible asset (“customer relationship”). The Company used a discounted cash flow model to measure the fair value of the customer relationship. We identified the valuation of the acquired customer relationship asset in a business combination as a critical audit matter.
The principal consideration for our determination that the valuation of the acquired customer relationship asset in a business combination is a critical audit matter is due to the high degree of auditor judgement necessary in evaluating the fair value of the customer relationship asset. The significant assumptions used to estimate the fair value of the customer relationship include certain assumptions that form the basis of the future net cash flows such as forecasted revenue, forecasted earnings before interest, taxes, depreciation, and amortization, long-term discount rate, economic lives, and customer attrition. These significant assumptions require subjective auditor judgement in order to assess their reasonableness.
Our audit procedures related to the valuation of the acquired customer relationship asset in a business combination included the following, among others:
/s/ GRANT THORNTON LLP
We have served as the Company’s auditor since 2019.
Cleveland, Ohio
March 15, 2023
31
Consolidated Statements of Income
Year Ended December 31, |
|
2022 |
|
|
2021 |
|
|
2020 |
|
|||
(amounts in thousands, except per-share data) |
|
|
|
|
|
|
|
|
|
|||
Revenue |
|
$ |
|
|
$ |
|
|
$ |
|
|||
Direct costs |
|
|
|
|
|
|
|
|
|
|||
Selling, general and administrative expenses |
|
|
|
|
|
|
|
|
|
|||
Operating income |
|
|
|
|
|
|
|
|
|
|||
Interest and other income |
|
|
|
|
|
|
|
|
|
|||
Gain on sale of building |
|
|
— |
|
|
|
— |
|
|
|
|
|
Non-taxable life insurance gain |
|
|
— |
|
|
|
— |
|
|
|
|
|
Interest and other expense |
|
|
|
|
|
|
|
|
|
|||
Income before income taxes |
|
|
|
|
|
|
|
|
|
|||
Provision (benefit) for income taxes |
|
|
|
|
|
( |
) |
|
|
|
||
Net income |
|
$ |
|
|
$ |
|
|
$ |
|
|||
Net income per share: |
|
|
|
|
|
|
|
|
|
|||
Basic |
|
$ |
|
|
$ |
|
|
$ |
|
|||
Diluted |
|
$ |
|
|
$ |
|
|
$ |
|
|||
Weighted average shares outstanding: |
|
|
|
|
|
|
|
|
|
|||
Basic |
|
|
|
|
|
|
|
|
|
|||
Diluted |
|
|
|
|
|
|
|
|
|
|||
The accompanying notes are an integral part of these consolidated financial statements.
32
Consolidated Statements of Comprehensive Income
Year Ended December 31, |
|
2022 |
|
|
2021 |
|
|
2020 |
|
|||
(amounts in thousands) |
|
|
|
|
|
|
|
|
|
|||
Net income |
|
$ |
|
|
$ |
|
|
$ |
|
|||
|
|
|
|
|
|
|
|
|
|
|||
Foreign currency translation adjustment |
|
|
( |
) |
|
|
( |
) |
|
|
|
|
Decrease (increase) in pension loss, net of taxes of $ |
|
|
|
|
|
|
|
|
( |
) |
||
Other comprehensive income (loss) |
|
|
|
|
|
( |
) |
|
|
|
||
|
|
|
|
|
|
|
|
|
|
|||
Comprehensive income |
|
$ |
|
|
$ |
|
|
$ |
|
|||
The accompanying notes are an integral part of these consolidated financial statements.
33
Consolidated Balance Sheets
December 31, |
|
2022 |
|
|
2021 |
|
||
(amounts in thousands, except share balances) |
|
|
|
|
|
|
||
Assets |
|
|
|
|
|
|
||
Current Assets: |
|
|
|
|
|
|
||
Cash and cash equivalents |
|
$ |
|
|
$ |
|
||
Accounts receivable, net of allowances of $ |
|
|
|
|
|
|
||
Prepaid and other current assets |
|
|
|
|
|
|
||
Income taxes receivable |
|
|
— |
|
|
|
|
|
Total current assets |
|
|
|
|
|
|
||
Property, equipment and capitalized software, net |
|
|
|
|
|
|
||
Operating lease right-of-use assets |
|
|
|
|
|
|
||
Deferred income taxes |
|
|
|
|
|
|
||
Acquired intangibles, net |
|
|
|
|
|
|
||
Goodwill |
|
|
|
|
|
|
||
Cash surrender value of life insurance |
|
|
|
|
|
|
||
Other assets |
|
|
|
|
|
|
||
Investments |
|
|
|
|
|
|
||
Total assets |
|
$ |
|
|
$ |
|
||
Liabilities and Shareholders’ Equity |
|
|
|
|
|
|
||
Current Liabilities: |
|
|
|
|
|
|
||
Accounts payable |
|
$ |
|
|
$ |
|
||
Accrued compensation |
|
|
|
|
|
|
||
Advance billings on contracts |
|
|
|
|
|
|
||
Short-term operating lease liabilities |
|
|
|
|
|
|
||
Short-term deferred payroll taxes |
|
|
— |
|
|
|
|
|
Other current liabilities |
|
|
|
|
|
|
||
Income taxes payable |
|
|
|
|
|
— |
|
|
Total current liabilities |
|
|
|
|
|
|
||
Long-term debt |
|
|
— |
|
|
|
— |
|
Deferred compensation benefits |
|
|
|
|
|
|
||
Long-term operating lease liabilities |
|
|
|
|
|
|
||
Deferred income taxes |
|
|
|
|
|
|
||
Other long-term liabilities |
|
|
|
|
|
|
||
Total liabilities |
|
|
|
|
|
|
||
Shareholders’ Equity: |
|
|
|
|
|
|
||
Common stock, par value $ |
|
|
|
|
|
|
||
Capital in excess of par value |
|
|
|
|
|
|
||
Retained earnings |
|
|
|
|
|
|
||
Less: Treasury stock of |
|
|
( |
) |
|
|
( |
) |
Accumulated other comprehensive loss |
|
|
( |
) |
|
|
( |
) |
Total shareholders’ equity |
|
|
|
|
|
|
||
Total liabilities and shareholders’ equity |
|
$ |
|
|
$ |
|
||
The accompanying notes are an integral part of these consolidated financial statements.
34
Consolidated Statements of Cash Flows
Year Ended December 31, |
|
2022 |
|
|
2021 |
|
|
2020 |
|
|||
(amounts in thousands) |
|
|
|
|
|
|
|
|
|
|||
Cash flow from operating activities: |
|
|
|
|
|
|
|
|
|
|||
Net income |
|
$ |
|
|
$ |
|
|
$ |
|
|||
Adjustments to reconcile net income to net cash provided by operating activities: |
|
|
|
|
|
|
|
|
|
|||
Depreciation and amortization expense |
|
|
|
|
|
|
|
|
|
|||
Equity-based compensation expense |
|
|
|
|
|
|
|
|
|
|||
Deferred income taxes |
|
|
|
|
|
( |
) |
|
|
( |
) |
|
Deferred compensation benefits |
|
|
( |
) |
|
|
( |
) |
|
|
( |
) |
Loss (gain) on the sale/disposal of property and equipment |
|
|
|
|
|
|
|
|
( |
) |
||
Impairment of capitalized software |
|
|
— |
|
|
|
— |
|
|
|
|
|
Non-taxable life insurance gain |
|
|
— |
|
|
|
— |
|
|
|
( |
) |
Changes in assets and liabilities that provide (use) cash, excluding the effects of acquisitions: |
|
|
|
|
|
|
|
|
|
|||
Accounts receivable |
|
|
|
|
|
( |
) |
|
|
|
||
Prepaid and other current assets |
|
|
( |
) |
|
|
( |
) |
|
|
( |
) |
Other long-term assets |
|
|
|
|
|
( |
) |
|
|
( |
) |
|
Cash surrender value of life insurance |
|
|
|
|
|
|
|
|
|
|||
Accounts payable |
|
|
( |
) |
|
|
|
|
|
( |
) |
|
Accrued compensation |
|
|
( |
) |
|
|
|
|
|
( |
) |
|
Income taxes payable / receivable |
|
|
|
|
|
|
|
|
( |
) |
||
Deferred payroll taxes |
|
|
( |
) |
|
|
( |
) |
|
|
|
|
Advance billings on contracts |
|
|
|
|
|
|
|
|
|
|||
Other current liabilities |
|
|
( |
) |
|
|
( |
) |
|
|
( |
) |
Other long-term liabilities |
|
|
|
|
|
( |
) |
|
|
( |
) |
|
Net cash provided by operating activities |
|
|
|
|
|
|
|
|
|
|||
Cash flow from investing activities: |
|
|
|
|
|
|
|
|
|
|||
Cash paid for acquisitions, net of cash received |
|
|
( |
) |
|
|
— |
|
|
|
( |
) |
Additions to property and equipment |
|
|
( |
) |
|
|
( |
) |
|
|
( |
) |
Additions to capitalized software |
|
|
( |
) |
|
|
— |
|
|
|
( |
) |
Proceeds from the sale of property and equipment |
|
|
|
|
|
— |
|
|
|
|
||
Premiums paid for life insurance |
|
|
( |
) |
|
|
( |
) |
|
|
( |
) |
Proceeds from life insurance |
|
|
— |
|
|
|
— |
|
|
|
|
|
Net cash used in investing activities |
|
|
( |
) |
|
|
( |
) |
|
|
( |
) |
Cash flow from financing activities: |
|
|
|
|
|
|
|
|
|
|||
Proceeds from long-term debt |
|
|
— |
|
|
|
— |
|
|
|
|
|
Payments on long-term debt |
|
|
( |
) |
|
|
— |
|
|
|
( |
) |
Deferred debt financing costs |
|
|
— |
|
|
|
( |
) |
|
|
— |
|
Proceeds from stock option plan exercises |
|
|
|
|
|
|
|
|
— |
|
||
Taxes remitted for shares withheld from equity-based compensation transactions |
|
|
( |
) |
|
|
( |
) |
|
|
( |
) |
Proceeds from Employee Stock Purchase Plan |
|
|
|
|
|
|
|
|
|
|||
Change in cash overdraft, net |
|
|
|
|
|
— |
|
|
|
( |
) |
|
Net cash used in financing activities |
|
|
( |
) |
|
|
( |
) |
|
|
( |
) |
Effect of exchange rates on cash and cash equivalents |
|
|
( |
) |
|
|
( |
) |
|
|
|
|
Net (decrease) increase in cash and cash equivalents |
|
|
( |
) |
|
|
|
|
|
|
||
Cash and cash equivalents at beginning of year |
|
|
|
|
|
|
|
|
|
|||
Cash and cash equivalents at end of year |
|
$ |
|
|
$ |
|
|
$ |
|
|||
|
|
|
|
|
|
|
|
|
|
|||
Supplemental disclosure of non-cash transactions |
|
|
|
|
|
|
|
|
|
|||
Acquisition share issuance |
|
$ |
|
|
$ |
- |
|
|
$ |
- |
|
|
Acquisition stock option issuance |
|
$ |
|
|
$ |
- |
|
|
$ |
- |
|
|
The accompanying notes are an integral part of these consolidated financial statements.
35
|
|
|
|
|
|
|
|
|
|
|
|
|
|
|
|
|
|
|
|
Accumulated |
|
|
|
|
||||||||
|
|
|
|
|
|
|
|
Capital in |
|
|
|
|
|
|
|
|
|
|
|
Other |
|
|
Total |
|
||||||||
|
|
Common Stock |
|
|
Excess of |
|
|
Retained |
|
|
Treasury Stock |
|
|
Comprehensive |
|
|
Shareholders’ |
|
||||||||||||||
|
|
Shares |
|
|
Amount |
|
|
Par Value |
|
|
Earnings |
|
|
Shares |
|
|
Amount |
|
|
Income (loss) |
|
|
Equity |
|
||||||||
(amounts in thousands) |
|
|
|
|
|
|
|
|
|
|
|
|
|
|
|
|
|
|
|
|
|
|
|
|
||||||||
Balances as of December 31, 2019 |
|
|
|
|
$ |
|
|
$ |
|
|
$ |
|
|
|
|
|
$ |
( |
) |
|
$ |
( |
) |
|
$ |
|
||||||
Employee Stock Purchase Plan share |
|
|
— |
|
|
|
— |
|
|
|
( |
) |
|
|
— |
|
|
|
( |
) |
|
|
|
|
|
— |
|
|
|
|
||
Stock Option Plan share issuance, net |
|
|
— |
|
|
|
— |
|
|
|
( |
) |
|
|
— |
|
|
|
( |
) |
|
|
|
|
|
— |
|
|
|
— |
|
|
Restricted stock plan share |
|
|
— |
|
|
|
— |
|
|
|
( |
) |
|
|
— |
|
|
|
( |
) |
|
|
|
|
|
— |
|
|
|
( |
) |
|
Equity-based compensation |
|
|
— |
|
|
|
— |
|
|
|
|
|
|
— |
|
|
|
— |
|
|
|
— |
|
|
|
— |
|
|
|
|
||
Net income |
|
|
— |
|
|
|
— |
|
|
|
— |
|
|
|
|
|
|
— |
|
|
|
— |
|
|
|
— |
|
|
|
|
||
Foreign currency adjustment |
|
|
— |
|
|
|
— |
|
|
|
— |
|
|
|
— |
|
|
|
— |
|
|
|
— |
|
|
|
|
|
|
|
||
Pension loss adjustment, net of tax |
|
|
— |
|
|
|
— |
|
|
|
— |
|
|
|
— |
|
|
|
— |
|
|
|
— |
|
|
|
( |
) |
|
|
( |
) |
Balances as of December 31, 2020 |
|
|
|
|
$ |
|
|
$ |
|
|
$ |
|
|
|
|
|
$ |
( |
) |
|
$ |
( |
) |
|
$ |
|
||||||
Employee Stock Purchase Plan share |
|
|
— |
|
|
|
— |
|
|
|
( |
) |
|
|
— |
|
|
|
( |
) |
|
|
|
|
|
— |
|
|
|
|
||
Stock Option Plan share issuance, net |
|
|
— |
|
|
|
— |
|
|
|
( |
) |
|
|
— |
|
|
|
( |
) |
|
|
|
|
|
— |
|
|
|
|
||
Restricted stock plan share |
|
|
— |
|
|
|
— |
|
|
|
( |
) |
|
|
— |
|
|
|
( |
) |
|
|
|
|
|
— |
|
|
|
( |
) |
|
Equity-based compensation |
|
|
— |
|
|
|
— |
|
|
|
|
|
|
— |
|
|
|
— |
|
|
|
— |
|
|
|
— |
|
|
|
|
||
Net income |
|
|
— |
|
|
|
— |
|
|
|
— |
|
|
|
|
|
|
— |
|
|
|
— |
|
|
|
— |
|
|
|
|
||
Foreign currency adjustment |
|
|
— |
|
|
|
— |
|
|
|
— |
|
|
|
— |
|
|
|
— |
|
|
|
— |
|
|
|
( |
) |
|
|
( |
) |
Pension loss adjustment, net of tax |
|
|
— |
|
|
|
— |
|
|
|
— |
|
|
|
— |
|
|
|
— |
|
|
|
— |
|
|
|
|
|
|
|
||
Balances as of December 31, 2021 |
|
|
|
|
$ |
|
|
$ |
|
|
$ |
|
|
|
|
|
$ |
( |
) |
|
$ |
( |
) |
|
$ |
|
||||||
Employee Stock Purchase Plan share |
|
|
— |
|
|
|
— |
|
|
|
( |
) |
|
|
— |
|
|
|
( |
) |
|
|
|
|
|
— |
|
|
|
|
||
Stock Option Plan share issuance, net |
|
|
— |
|
|
|
— |
|
|
|
( |
) |
|
|
— |
|
|
|
( |
) |
|
|
|
|
|
— |
|
|
|
|
||
Restricted stock plan share |
|
|
— |
|
|
|
— |
|
|
|
( |
) |
|
|
— |
|
|
|
( |
) |
|
|
|
|
|
— |
|
|
|
( |
) |
|
Acquisition share issuance |
|
|
— |
|
|
|
— |
|
|
|
( |
) |
|
|
— |
|
|
|
( |
) |
|
|
|
|
|
— |
|
|
|
|
||
Acquisition stock option issuance |
|
|
— |
|
|
|
— |
|
|
|
|
|
|
— |
|
|
|
— |
|
|
|
— |
|
|
|
— |
|
|
|
|
||
Equity-based compensation |
|
|
— |
|
|
|
— |
|
|
|
|
|
|
— |
|
|
|
— |
|
|
|
— |
|
|
|
— |
|
|
|
|
||
Net income |
|
|
— |
|
|
|
— |
|
|
|
— |
|
|
|
|
|
|
— |
|
|
|
— |
|
|
|
— |
|
|
|
|
||
Foreign currency adjustment |
|
|
— |
|
|
|
— |
|
|
|
— |
|
|
|
— |
|
|
|
— |
|
|
|
— |
|
|
|
( |
) |
|
|
( |
) |
Pension gain adjustment, net of tax |
|
|
— |
|
|
|
— |
|
|
|
— |
|
|
|
— |
|
|
|
— |
|
|
|
— |
|
|
|
|
|
|
|
||
Balances as of December 31, 2022 |
|
|
|
|
$ |
|
|
$ |
|
|
$ |
|
|
|
|
|
$ |
( |
) |
|
$ |
( |
) |
|
$ |
|
||||||
The accompanying notes are an integral part of these consolidated financial statements.
36
Notes to Consolidated Financial Statements
Basis of Presentation and Consolidation
The consolidated financial statements include the accounts of Computer Task Group, Incorporated, and its subsidiaries (the “Company” or “CTG”), located in North and South America, Western Europe, and India. There are no unconsolidated entities, or off-balance sheet arrangements other than certain guarantees supporting office leases and the performance under government contracts in the Company's European operations, and purchase obligations for certain software, recruiting and other services. All intercompany accounts have been eliminated. Management of the Company has made a number of estimates and assumptions relating to the reporting of assets and liabilities and the disclosure of contingent assets and liabilities to prepare these consolidated financial statements in conformity with U.S. generally accepted accounting principles. Such estimates primarily relate to the valuation allowances for deferred tax assets, actuarial assumptions including discount rates and expected rates of return, as applicable, for the Company’s defined benefit plans, the allowance for credit losses, the annual impairment assessment, assumptions underlying stock option valuation, investment valuation, estimates of progress toward completion and direct profit or loss on contracts, acquisition and related accounting, legal matters, and other contingencies. The current economic environments in the United States, Canada, Colombia, Western Europe, and India where the Company has operations have increased the degree of uncertainty inherent in these estimates and assumptions. Actual results could differ from those estimates.
The Company provides information and technology-related services to its clients. These services include information and technology-related solutions, including supplemental staffing as a solution. CTG provides these services to all of the markets that it serves. The services provided typically encompass the IT business solution life cycle, including phases for planning, developing, implementing, managing, and ultimately maintaining the IT solution. A typical client is an organization with large, complex information and data processing requirements. The Company provides a majority of its services in
CTG’s revenue by vertical market as a percentage of consolidated revenue for the three years ended December 31, 2022, 2021, and 2020 is as follows:
|
|
2022 |
|
|
2021 |
|
|
2020 |
|
|||
Technology service providers |
|
|
% |
|
|
% |
|
|
% |
|||
Healthcare |
|
|
% |
|
|
% |
|
|
% |
|||
Financial services |
|
|
% |
|
|
% |
|
|
% |
|||
Manufacturing |
|
|
% |
|
|
% |
|
|
% |
|||
Energy |
|
|
% |
|
|
% |
|
|
% |
|||
General markets |
|
|
% |
|
|
% |
|
|
% |
|||
Total |
|
|
% |
|
|
% |
|
|
% |
|||
Change in Presentation
During the fourth quarter of 2021, the Company further refined its strategy to focus on providing digital services within its IT Solutions business in both North America and Europe and determined that there are certain lower margin staffing accounts within its business that are no longer part of the Company’s long-term business plan. Accordingly, the Company changed its operating and reporting segments from one segment to three segments: North America IT Solutions and Services, Europe IT Solutions and Services, and Non-Strategic Technology Services. Refer to footnote 13, “Segments and Enterprise-Wide Disclosures” for further discussion on the impact of this change.
Certain reclassifications were made to prior period amounts in order to conform to the current year presentation. These reclassifications had no impact on the reported consolidated prior period financial results.
37
Revenue and Cost Recognition
The Company recognizes revenue when control of the promised good or service is transferred to clients, in an amount that reflects the consideration the Company expects to be entitled to in exchange for those goods or services. For time-and-material contracts, revenue is recognized as hours are incurred and costs are expended. For contracts with progress billing schedules, primarily monthly, revenue is recognized as services are rendered to the client. Revenue for fixed-price contracts is recognized over time using an input-based approach. Over time revenue recognition best portrays the Company’s performance in transferring control of the goods or services to the client. On most fixed price contracts, revenue recognition is supported through contractual clauses that require the client to pay for work performed to date, including cost plus a reasonable profit margin, for goods or services that have no alternative use to the Company. On certain contracts, revenue recognition is supported through contractual clauses that indicate the client controls the asset, or work in process, as the Company creates or enhances the asset. On a given project, actual salary and indirect labor costs incurred are measured and compared with the total estimate of costs of such items at the completion of the project. Revenue is recognized based upon the percentage-of-completion calculation of total incurred costs to total estimated costs. The Company infrequently works on fixed-price projects that include significant amounts of material or other non-labor related costs that could distort the percent complete within a percentage-of-completion calculation. The Company’s estimate of the total labor costs it expects to incur over the term of the contract is based on the nature of the project and experience on similar projects, and includes management judgments and estimates that affect the amount of revenue recognized on fixed-price contracts in any accounting period. Losses on fixed-price projects are recorded when identified.
The Company’s revenue from contracts accounted for under time-and-material, progress billing, and percentage-of-completion methods as a percentage of consolidated revenue for the three years ended December 31, 2022, 2021, and 2020 is as follows:
|
|
2022 |
|
|
2021 |
|
|
2020 |
|
|||
Time-and-material |
|
|
% |
|
|
% |
|
|
% |
|||
Progress billing |
|
|
% |
|
|
% |
|
|
% |
|||
Percentage-of-completion |
|
|
% |
|
|
% |
|
|
% |
|||
Total |
|
|
% |
|
|
% |
|
|
% |
|||
The Company recorded revenue by geography for 2022 compared to 2021 and 2021 compared to 2020 as follows:
Year Ended December 31, |
|
% of total |
|
2022 |
|
% of total |
|
2021 |
|
Year-Over- |
(dollars in thousands) |
|
|
|
|
|
|
|
|
|
|
North America |
|
|
$ |
|
|
$ |
|
( |
||
Europe |
|
|
|
|
|
( |
||||
Total |
|
|
$ |
|
|
$ |
|
( |
Year Ended December 31, |
|
% of total |
|
2021 |
|
% of total |
|
2020 |
|
Year-Over- |
(dollars in thousands) |
|
|
|
|
|
|
|
|
|
|
North America |
|
|
$ |
|
|
$ |
|
|||
Europe |
|
|
|
|
|
|
|
|||
Total |
|
|
$ |
|
|
$ |
|
The Company includes billable expenses in its accounts as both revenue and direct costs. These billable expenses totaled $
Significant Judgments
With the exception of cost estimates on certain fixed-price projects, there are no other significant judgments used to determine the timing of satisfaction of performance obligations or determining transaction price and amounts allocated to performance obligations. The Company allocates the transaction price based on standalone selling prices for contracts with clients that include more than one performance obligation. Standalone selling prices are based on the expected cost of the good or service plus margin approach. Certain clients may qualify for discounts and rebates, which the Company accounts for as variable consideration. The Company estimates variable consideration and reduces revenue recognized based on the amount it expects to provide to clients.
38
Contract Balances
For time-and-material and progress billing contracts, the timing of the Company’s satisfaction of its performance obligations is consistent with the timing of payment. For these contracts, the Company has the right to payment in the amount that corresponds directly with the value of the Company’s performance to date. The Company uses the right to invoice practical expedient that allows the Company to recognize revenue in the amount for which it has the right to invoice for time-and-material and progress billing contracts. Bill schedules for fixed-price contracts are generally consistent with the Company’s performance in transferring control of the goods or services to the client. There are no significant financing components in the Company's contracts with clients. Advance billings represent contract liabilities for cash payments received in advance of the Company's performance. Unbilled receivables are reported within “accounts receivable” on the consolidated balance sheet. Accounts receivable and contract liability balances fluctuate based on the timing of the client’s billing schedule and the Company’s period-end date. There are no significant costs to obtain or fulfill contracts with clients.
Transaction Price Allocated to Remaining Performance Obligations
As of December 31, 2022, the aggregate transaction price allocated to unsatisfied or partially unsatisfied performance obligations for fixed-price and all progress billing contracts was approximately $
Taxes Collected from Clients
In instances where the Company collects taxes from its clients for remittance to governmental authorities, primarily in its international locations, taxes are recorded in the Company's accounts on a net basis.
Fair Value
Fair value is defined as the exchange price that would be received for an asset or paid for a liability in the principal or most advantageous market for the asset or liability, in an orderly transaction between market participants. The Company utilizes a fair value hierarchy for its assets and liabilities, as applicable, based upon three levels of input, which are:
Level 1—quoted prices in active markets for identical assets or liabilities (observable)
Level 2—inputs other than Level 1 that are observable, either directly or indirectly, such as quoted prices for similar assets or liabilities, quoted prices in inactive markets, or other inputs that are observable or can be supported by observable market data for essentially the full term of the asset or liability (observable)
Level 3—unobservable inputs that are supported by little or no market activity, but are significant to determining the fair value of the asset or liability (unobservable)
At December 31, 2022 and 2021, the carrying amounts of the Company’s cash of $
As described in Note 3 of the condensed consolidated financial statements, the Company acquired
In regards to the StarDust and Eleviant acquisitions, Level 3 inputs were used to estimate the fair values of the assets acquired and liabilities assumed. The valuation techniques used to assign fair values to intangible assets included the relief-from-royalty and excess earnings methods.
39
real options method, which requires inputs such as revenue and gross profit forecasts, discount rate, and other market variables to assess the probability of Eleviant achieving the revenue and gross profit targets. The fair value as of the September 29, 2022 acquisition date was initially recorded in the 2022 third quarter as $
In addition, the Company has a contingent consideration liability related to the earn-out provision of which a portion will be payable in each period subject to the achievement by StarDust of consolidated direct profit targets for fiscal 2020 and 2021. There is no payout if the achievement on either target is below a certain target threshold. The fair value of this contingent consideration is determined using level 3 inputs. The fair value assigned to the contingent consideration liability is determined using the real options method, which requires inputs such as consolidated direct profit forecasts, discount rate, and other market variables to assess the probability of StarDust achieving the revenue and EBIT targets. The fair value as of the March 3, 2020 acquisition date was determined to be $
As of December 31, 2022, goodwill recorded on the Company's consolidated balance sheet totaled $
As of October 2022 fiscal month-end, the Company performed its annual goodwill impairment test for the Luxembourg and France IT Solutions and Services reporting units in conjunction with an external consultant and estimated the fair value based on a combination of the income (estimates of future discounted cash flows) and the market approaches (market multiples for similar companies). The income approach uses a discounted cash flow (DCF) method that utilizes the present value of cash flows and other Level 3 inputs to estimate the fair value of the reporting unit. The future cash flows for the reporting units were projected based upon the Company's estimates of future revenue, a terminal growth rate, operating income and other factors such as working capital and capital expenditures. As part of its projections, the Company took into account expected industry and market conditions for the industries in which the reporting units operate, as well as trends currently impacting the reporting units. As part of our DCF analysis, the Company projected revenue and operating profits, and assumed long-term revenue growth rates in the “terminal year” for both of the reporting units. These projections are based upon the Company's judgment and may change in the future based upon the inherent uncertainty in predicting future results. The market approach utilizes multiples of earnings before interest expense, taxes, depreciation and amortization (EBITDA) to estimate the fair value of the reporting unit. The market multiples used for the Company's reporting units were based on competitor industry data, along with the market multiples for the Company and other factors.
In addition, the Company elected to perform a qualitative assessment for its annual goodwill impairment test of the North America IT Solutions and Services reporting unit. The qualitative assessment included the Company's consideration of, among other things, the overall macroeconomic conditions, industry and market considerations, overall financial performance, including revenue and contribution profits, and other relevant company specific events.
The carrying value as of October 2022 was approximately $
The Company is also allowed to elect an irrevocable option to measure, on a contract-by-contract basis, specific financial instruments and certain other items that are currently not being measured at fair value. The Company did not elect to apply the fair value provisions of this standard for any specific contracts during the years ended December 31, 2022 and 2021.
40
Life Insurance Policies
The Company has purchased life insurance on the lives of a number of former employees who are plan participants in the non-qualified defined benefit Executive Supplemental Benefit Plan. In total, there are policies on
At December 31, 2022 and 2021, the total death benefit for the remaining policies was approximately $
During 2020, two participants in the plan passed away. Upon their deaths, the Company recorded a non-taxable life insurance gain totaling approximately $
Cash and Cash Equivalents, and Cash Overdrafts
For purposes of the statement of cash flows, cash and cash equivalents are defined as cash on hand, demand deposits, and short-term, highly liquid investments with a maturity of three months or less. As the Company does not fund its bank accounts for the checks it has written until the checks are presented to the bank for payment, the "change in cash overdraft, net" line item as presented on the consolidated statement of cash flows represents the increase or decrease in outstanding checks for a given period. The cash in the Company’s U.S. banks is insured by the Federal Deposit Insurance Corporation up to the insurable limit of $
Accounts Receivable Factoring
As part of its working capital management, the Company has a factoring agreement to sell certain trade accounts receivables on a non-recourse basis to a third-party financial institution. The Company accounts for these transactions as sales of receivables and presents cash proceeds as cash provided by operating activities in the consolidated statements of cash flows. Total trade accounts receivable sold under the factoring agreement was approximately $
Property, Equipment and Capitalized Software Costs
Property and equipment are generally stated at historical cost less accumulated depreciation. Depreciation is computed using the straight-line method based on estimated useful lives of to
As of December 31, 2022 and 2021, the Company had capitalized costs relating to software projects developed for internal use. Amortization periods for these projects range from to
Impairment of Long-Lived Assets and Long-Lived Assets to Be Disposed Of
Long-lived assets are reviewed for impairment whenever events or changes in circumstances indicate that the carrying amount of an asset may not be recoverable. When such circumstances exist, the recoverability of assets to be held and used is measured by a comparison of the carrying amount of an asset to future cash flows expected to be generated by the asset. If such assets are considered to be impaired, the impairment to be recognized is measured by the amount by which the carrying amount of the assets exceeds the fair value of the assets. Assets to be disposed of by sale,
41
if any, are reported at the lower of the carrying amount or fair value less costs to sell. The Company does not have any long-lived assets that are impaired as of December 31, 2022.
During the 2020 second quarter, the Company sold its corporate headquarters located in Buffalo, NY. As the sale price of the building was $
Leases
In accordance with Topic 842 "Leases", the Company is obligated under a number of short and long-term operating leases for office space and equipment, and for automobiles leased in Europe.
Segments
The Company provides information technology and related services to its clients. These services include digital IT Solutions and Services, and Staffing Services. With digital IT Solutions and Services, the Company generally takes responsibility for the deliverables and some level of project and staff management, and these services may include high-end advisory or business-related consulting. When providing Staffing Services, including managed staffing, staff augmentation, and volume staffing, personnel are provided to clients based upon their requirements for specific skills, who then, in turn, take their direction from clients’ managers.
In prior years, and in 2021 prior to the fourth quarter, the Company reported its results in
During the 2021 fourth quarter, the Company further refined its strategy to focus on providing digital services within its IT Solutions business in both North America and in Europe. As part of this process, the Company also determined that there are certain lower margin staffing accounts within its business that are no longer part of the Company’s long-term business plan. The focus includes investing in business development, solutions, delivery, and marketing for IT Solutions, and critically evaluating each significant staffing engagement as it comes up for renewal to determine if the Company would continue to provide those services to its client. These decisions are based on, among other factors, critically evaluating the work performed, the availability of the resources, the client, the long-term opportunities for the services provided at the client, and the revenue and profit associated with the engagement.
As a part of this refinement of the strategy in the 2021 fourth quarter, the Company is operating and reporting in
Goodwill
The goodwill recorded on the Company's consolidated balance sheet at December 31, 2022 relates to the acquisition of Soft Company in the 2018 first quarter, Tech-IT in the 2019 first quarter, StarDust in the 2020 first quarter, and Eleviant in the 2022 third quarter. In accordance with current accounting guidance for “Intangibles - Goodwill and Other,” the Company performs goodwill impairment testing at least annually (in the Company’s fourth quarter), unless indicators of impairment exist in interim periods. If impairment indicators are present and the estimated future undiscounted cash flows are less than the carrying value of the long-lived assets, the carrying value would be reduced to the estimated fair value. There were
42
The changes in the carrying amount of goodwill for the years ended December 31, 2022 and 2021 are as follows:
(amounts in thousands) |
|
|
|
|
Balance at December 31, 2020 |
|
$ |
|
|
Acquired goodwill |
|
|
|
|
Foreign currency translation |
|
|
( |
) |
Balance at December 31, 2021 |
|
$ |
|
|
Acquired goodwill |
|
|
|
|
Foreign currency translation |
|
|
( |
) |
Balance at December 31, 2022 |
|
$ |
|
|
The Company’s goodwill at December 31, 2022 totaled $
Acquired Intangibles Assets
Acquired intangible assets at December 31, 2022 consist of the following:
(amounts in thousands) |
|
Estimated |
|
Gross Carrying |
|
|
Accumulated |
|
|
Foreign Currency Translation |
|
|
Net Carrying |
|
||||
Trademarks |
|
|
$ |
|
|
$ |
( |
) |
|
$ |
( |
) |
|
$ |
|
|||
Technology |
|
|
|
|
|
|
( |
) |
|
|
( |
) |
|
|
|
|||
Customer relationships |
|
|
|
|
|
|
( |
) |
|
|
( |
) |
|
|
|
|||
Total |
|
|
|
$ |
|
|
$ |
( |
) |
|
$ |
( |
) |
|
$ |
|
||
Acquired intangible assets at December 31, 2021 consisted of the following:
(amounts in thousands) |
|
Estimated |
|
Gross Carrying |
|
|
Accumulated |
|
|
Foreign Currency Translation |
|
|
Net Carrying |
|
||||
Trademarks |
|
|
$ |
|
|
$ |
( |
) |
|
$ |
( |
) |
|
$ |
|
|||
Technology |
|
|
|
|
|
|
( |
) |
|
|
|
|
|
|
||||
Customer relationships |
|
|
|
|
|
|
( |
) |
|
|
( |
) |
|
|
|
|||
Total |
|
|
|
$ |
|
|
$ |
( |
) |
|
$ |
( |
) |
|
$ |
|
||
Amortization expense for the Company's acquired intangibles was $
Estimated amortization expense for the next five fiscal years, and thereafter, is as follows (amounts in thousands):
Year |
|
Annual |
|
|
2023 |
|
$ |
|
|
2024 |
|
|
|
|
2025 |
|
|
|
|
2026 |
|
|
|
|
2027 |
|
|
|
|
Thereafter |
|
|
|
|
Total |
|
$ |
|
|
43
Income Taxes
The Company provides for deferred income taxes for the temporary differences between the financial reporting basis and the tax basis of the Company’s assets and liabilities. In assessing the realizability of deferred tax assets, management considers, within each taxing jurisdiction, whether it is more likely than not that all or some portion of the deferred tax assets will be realized, or that a valuation allowance is required. Management considers all available evidence, both positive and negative, in assessing realizability of its deferred tax assets. A key component of this assessment is management’s critical evaluation of current and future impacts of business and economic factors on the Company’s ability to generate future taxable income. Factors that may affect the Company’s ability to generate taxable income include, but are not limited to increased competition, a decline in revenue or margins, a loss of market share, the availability of qualified professional staff, and a decrease in demand for the Company’s services. The analysis that the Company prepared to determine the valuation allowance required significant judgment and assumptions regarding future market conditions as well as forecasts for profits, taxable income, and taxable income by jurisdiction. Due to the sensitivity of the analysis, changes to the assumptions in subsequent periods could have a material effect on the valuation allowance. Additionally, management has determined that a valuation allowance is required against its Netherlands and India deferred taxes. The total valuation allowance recorded against these deferred tax assets is $
The Company establishes an unrecognized tax benefit based upon the anticipated outcome of tax positions taken for financial statement purposes compared with positions taken on the Company’s tax returns. The Company records the benefit for unrecognized tax benefits only when it is more likely than not that the position will be sustained upon examination by the taxing authorities. The Company reviews its unrecognized tax benefits on a quarterly basis. Such reviews include consideration of factors such as the cause of the action, the degree of probability of an unfavorable outcome, the Company’s ability to estimate the liability, and the timing of the liability and how it will impact the Company’s other tax attributes.
Equity-Based Compensation
The Company records the fair value of equity-based compensation expense for all equity-based compensation awards granted and recognizes the cost in the Company’s income statement over the periods in which an employee or director is required to provide the services for the award. Compensation cost is not recognized for employees or directors that do not render the requisite services. The Company recognized the expense for equity-based compensation in its 2022, 2021, and 2020 consolidated statements of income on a straight-line basis based upon awards that are ultimately expected to vest. See Note 10, “Equity-Based Compensation.”
Net Income Per Share
Basic and diluted earnings per share (EPS) for the years ended December 31, 2022, 2021, and 2020 are as follows:
For the year ended |
|
Net |
|
|
Weighted |
|
|
Earnings |
|
|||
(amounts in thousands, except per-share data) |
|
|
|
|
|
|
|
|
|
|||
December 31, 2022 |
|
|
|
|
|
|
|
|
|
|||
Basic EPS |
|
$ |
6,609 |
|
|
|
|
|
$ |
|
||
Dilutive effect of outstanding equity instruments |
|
|
— |
|
|
|
|
|
|
( |
) |
|
Diluted EPS |
|
$ |
|
|
|
|
|
$ |
|
|||
December 31, 2021 |
|
|
|
|
|
|
|
|
|
|||
Basic EPS |
|
$ |
13,730 |
|
|
|
|
|
$ |
|
||
Dilutive effect of outstanding equity instruments |
|
|
— |
|
|
|
|
|
|
( |
) |
|
Diluted EPS |
|
$ |
|
|
|
|
|
$ |
|
|||
December 31, 2020 |
|
|
|
|
|
|
|
|
|
|||
Basic EPS |
|
$ |
7,639 |
|
|
|
|
|
$ |
|
||
Dilutive effect of outstanding equity instruments |
|
|
— |
|
|
|
|
|
|
( |
) |
|
Diluted EPS |
|
$ |
|
|
|
|
|
$ |
|
|||
Weighted-average shares represent the average number of issued shares less treasury shares, and for the basic EPS calculations, unvested restricted stock.
44
Certain options representing
Accumulated Other Comprehensive Loss
The components that comprised accumulated other comprehensive loss on the consolidated balance sheet at December 31, 2022 and 2021 are as follows:
(amounts in thousands) |
|
2022 |
|
|
2021 |
|
||
Foreign currency translation adjustment |
|
$ |
( |
) |
|
$ |
( |
) |
Pension loss, net of tax of $ |
|
|
( |
) |
|
|
( |
) |
Accumulated other comprehensive loss |
|
$ |
( |
) |
|
$ |
( |
) |
During 2022, 2021, and 2020, actuarial losses were amortized to expense as follows:
(amounts in thousands) |
|
2022 |
|
|
2021 |
|
|
2020 |
|
|||
Amortization of actuarial losses |
|
$ |
|
|
$ |
|
|
$ |
|
|||
Income tax |
|
|
( |
) |
|
|
( |
) |
|
|
( |
) |
Net of tax |
|
$ |
|
|
$ |
|
|
$ |
|
|||
The amortization of actuarial losses is included in determining net periodic pension cost. See Note 7, "Deferred Compensation Benefits" for additional information.
Foreign Currency
The functional currency of the Company’s foreign subsidiaries is the applicable local currency. The translation of the applicable foreign currencies into U.S. dollars is performed for assets and liabilities using current exchange rates in effect at the balance sheet date, for equity accounts using historical exchange rates, and for revenue and expense activity using the applicable month’s average exchange rates. The Company recorded a nominal amount of expense in 2022, 2021, and 2020 from foreign currency transactions for balances settled during the year or intended to be settled as of each respective year-end.
Guarantees
The Company has a number of guarantees in place in its European operations which support office leases and performance under government projects. These guarantees totaled approximately $
Recently Issued Accounting Standards
In March 2020, the FASB issued ASU 2020-04, “Reference Rate Reform - Facilitation of the Effects of Reference Rate Reform on Financial Reporting,” which provides optional expedients and exceptions for accounting contracts, hedging relationships and other transactions affected by reference rate reform if certain criteria are met. The amendments apply only to contracts, hedging relationships and other transactions that reference the London Interbank Offering Rate (“LIBOR”) or another reference rate expected to be discontinued due to the reference rate reform. It is effective for all entities between March 12, 2020 and December 31, 2022. The Company does not expect a significant impact from the adoption of this standard as provisions have been made in its Credit and Security Agreement to use an alternate benchmark interest rate when the use of LIBOR is discontinued.
In December 2019, the FASB issued ASU 2019-12, “Income Taxes (Topic 740): Simplifying the Accounting for Income Taxes.” Among other clarifications and simplifications related to income tax accounting, the new standard simplifies the accounting for income taxes by eliminating certain exceptions related to the approach for intraperiod tax allocation, the methodology for calculating income taxes in an interim period, hybrid taxes and the recognition of deferred tax liabilities for outside basis differences. ASU 2019-12 is effective for fiscal years, and interim periods within those fiscal years, beginning after December 15, 2020. Early adoption is permitted. The Company adopted this new standard on January 1, 2021 on a prospective basis and the adoption did not have a material impact on the Company’s consolidated financial statements.
45
Subsequent Events
Property, equipment and capitalized software at December 31, 2022 and 2021 are summarized as follows:
December 31, |
|
Useful Life |
|
2022 |
|
|
2021 |
|
||
(amounts in thousands) |
|
(years) |
|
|
|
|
|
|
||
Equipment |
|
|
$ |
|
|
$ |
|
|||
Furniture |
|
|
|
|
|
|
|
|||
Capitalized software |
|
|
|
|
|
|
|
|||
Other software |
|
|
|
|
|
|
|
|||
Leasehold improvements |
|
|
|
|
|
|
|
|||
|
|
|
|
$ |
|
|
$ |
|
||
Accumulated depreciation and amortization |
|
|
|
|
( |
) |
|
|
( |
) |
|
|
|
|
$ |
|
|
$ |
|
||
The Company capitalizes software projects developed for commercial use. The Company recorded capitalized software costs during 2022 and 2021 as follows:
|
|
For the year ended December 31, |
|
|||||
(amounts in thousands) |
|
2022 |
|
|
2021 |
|
||
Capitalized software, beginning balance |
|
$ |
|
|
$ |
|
||
Foreign currency translation |
|
|
( |
) |
|
|
( |
) |
Capitalized software |
|
$ |
|
|
$ |
|
||
Capitalized software amortization periods range from to
|
|
For the year ended December 31, |
|
|||||
(amounts in thousands) |
|
2022 |
|
|
2021 |
|
||
Accumulated amortization, beginning balance |
|
$ |
|
|
$ |
|
||
Amortization expense |
|
|
|
|
|
|
||
Accumulated amortization |
|
$ |
|
|
$ |
|
||
Eleviant Technologies Inc. ("Eleviant”)
On September 29, 2022, the Company acquired
The U.S.-based Eleviant is a provider of digital transformation services and solutions, and is headquartered in Dallas, TX, with operations in Chennai and Coimbatore, India. Eleviant’s offerings support the new ways enterprises work, communicate, and scale today and focus on cloud, application modernization, mobile, artificial intelligence (AI), machine learning (ML), and robotic process automization (RPA). Eleviant’s services are supported by a portfolio of supporting solutions, including PeopleOne, a Digital Workplace platform for employee engagement, communication, and collaboration; vChat, a chatbot builder platform; and vBots, an RPA builder platform. The acquisition is expected to aid CTG in accelerating the growth of digital solutions sales to clients in the Americas and Europe and create new points of entry with proven technology services and solutions.
46
The results of operations of Eleviant have been included in the Company’s consolidated financial results since the date of acquisition. As the Company has determined that the acquisition is not material to its existing operations, certain disclosures, including proforma financial information, have not been included in this annual report on Form 10-K.
An earn-out of $
The acquisition fair value of the consideration for the acquisition of Eleviant consisted of the following as of September 29, 2022:
(amounts in thousands) |
|
|
|
Cash consideration |
$ |
|
|
Share issuance |
|
|
|
Stock option issuance - 3 month vest |
|
|
|
Stock option issuance - 12 month vest |
|
|
|
Fair value of contingent consideration |
|
|
|
Fair value of purchase consideration |
$ |
|
|
The following table summarizes the allocation of the aggregate purchase price consideration to the fair value of the assets acquired and liabilities assumed as of September 29, 2022:
(amounts in thousands) |
|
|
|
Assets Acquired: |
|
|
|
Cash |
$ |
|
|
Accounts receivable |
|
|
|
Prepaids and other current assets |
|
|
|
Property and equipment, net |
|
|
|
Taxes receivable |
|
|
|
Acquired intangibles |
|
|
|
Goodwill |
|
|
|
Total assets acquired |
$ |
|
|
|
|
|
|
Liabilities Assumed: |
|
|
|
Accounts payable |
$ |
|
|
Short-term debt |
|
|
|
Accrued compensation |
|
|
|
Other current liabilities |
|
|
|
Long-term debt |
|
|
|
Deferred compensation benefits |
|
|
|
Deferred tax liability |
|
|
|
Total liabilities assumed |
|
|
|
Net assets acquired |
$ |
|
|
At December 31, 2022, the Company allocated value to current assets and liabilities based on book values at September 29, 2022, which approximates fair value. The excess consideration was recorded as goodwill, which is not deductible for income tax purposes, and is driven by Eleviant providing a high level of digital IT solutions and offshore delivery capabilities.
47
(amounts in thousands) |
|
Fair Value |
|
|
Estimated |
|
Technology |
|
$ |
|
|
||
Customer relationships |
|
|
|
|
||
Fair value of purchase consideration |
|
$ |
|
|
|
|
The Company incurred acquisition-related legal and consulting fees, expenses related to retention bonuses, and amortization of intangible assets of approximately $
StarDust SAS (“StarDust”)
On March 3, 2020, the Company acquired
The results of operations of StarDust have been included in the Company’s consolidated financial results since the date of acquisition. As the Company has determined that the acquisition is not material to its existing operations, certain disclosures, including proforma financial information, have not been included in this annual report on Form 10-K.
The acquisition date fair value of the consideration for the acquisition of StarDust consisted of the following as of March 3, 2020:
(amounts in thousands) |
|
|
|
|
Cash consideration |
|
$ |
|
|
Fair value of contingent consideration |
|
|
|
|
Fair value of purchase consideration |
|
$ |
|
|
48
The following table summarizes the allocation of the aggregate purchase consideration to the fair value of the assets acquired and liabilities assumed as of March 3, 2020:
(amounts in thousands) |
|
|
|
Assets Acquired: |
|
|
|
Cash |
$ |
|
|
Accounts receivable |
|
|
|
Prepaids & other |
|
|
|
Property & equipment, net |
|
|
|
Acquired intangibles |
|
|
|
Goodwill |
|
|
|
Total assets acquired |
$ |
|
|
|
|
|
|
Liabilities Assumed: |
|
|
|
Accounts payable |
$ |
|
|
Accrued compensation |
|
|
|
Taxes payable |
|
|
|
Other liabilities |
|
|
|
Deferred income taxes |
|
|
|
Total liabilities assumed |
$ |
|
|
Net assets acquired |
$ |
|
|
The purchase consideration for the acquisition was allocated to the assets acquired and liabilities assumed based upon their respective fair values.
(amounts in thousands) |
|
Fair Value |
|
|
Estimated |
|
Trademarks |
|
$ |
|
|
||
Technology |
|
|
|
|
||
Customer relationships |
|
|
|
|
||
Fair value of purchase consideration |
|
$ |
|
|
|
|
The Company incurred adjustments to the fair value of the earn-out liability, and amortization of intangible assets of approximately $
The Company entered into an asset-based lending revolving credit agreement (Credit Agreement) during the 2021 second quarter, which has a
At December 31, 2022 and December 31, 2021, there were
There were
49
Under the Credit Agreement, the Company is required to meet one financial covenant in order to maintain borrowings under its revolving credit line, pay dividends, and make acquisitions. The covenant is measured quarterly, and at December 31, 2022 represented a fixed charge coverage ratio, where for the trailing twelve months the consolidated earnings before interest, taxes, depreciation, and amortization (EBITDA) adjusted for, amongst other items, equity-based compensation and severance expenses, must be greater than
As part of the Eleviant acquisition, the Company has $
During 2021, the Company wrote-off approximately $
50
The provision for income taxes for 2022, 2021, and 2020 consists of the following:
|
|
2022 |
|
|
2021 |
|
|
2020 |
|
|||
(amounts in thousands) |
|
|
|
|
|
|
|
|
|
|||
Domestic and foreign components of income before |
|
|
|
|
|
|
|
|
|
|||
Domestic |
|
$ |
|
|
$ |
|
|
$ |
|
|||
Foreign |
|
|
|
|
|
|
|
|
|
|||
Total income before income taxes |
|
$ |
|
|
$ |
|
|
$ |
|
|||
The provision (benefit) for income taxes consists of: |
|
|
|
|
|
|
|
|
|
|||
Current tax: |
|
|
|
|
|
|
|
|
|
|||
U.S. federal |
|
$ |
|
|
$ |
( |
) |
|
$ |
|
||
Foreign |
|
|
|
|
|
|
|
|
|
|||
U.S. state and local |
|
|
|
|
|
|
|
|
|
|||
Total current tax |
|
|
|
|
|
|
|
|
|
|||
Deferred tax: |
|
|
|
|
|
|
|
|
|
|||
U.S. federal |
|
|
|
|
|
( |
) |
|
|
— |
|
|
Foreign |
|
|
( |
) |
|
|
|
|
|
( |
) |
|
U.S. state and local |
|
|
( |
) |
|
|
( |
) |
|
|
— |
|
Total deferred tax |
|
|
|
|
|
( |
) |
|
|
( |
) |
|
Total tax |
|
$ |
|
|
$ |
( |
) |
|
$ |
|
||
The effective and statutory income tax rate can be reconciled |
|
|
|
|
|
|
|
|
|
|||
Tax at statutory rate |
|
$ |
|
|
$ |
|
|
$ |
|
|||
State tax, net of federal benefit |
|
|
|
|
|
|
|
|
|
|||
Non-taxable income |
|
|
( |
) |
|
|
( |
) |
|
|
( |
) |
Non-deductible expenses |
|
|
|
|
|
|
|
|
|
|||
Change in estimate primarily related to foreign taxes |
|
|
|
|
|
|
|
|
( |
) |
||
Change in valuation allowance related to U.S. federal taxes |
|
|
— |
|
|
|
( |
) |
|
|
|
|
Change in estimate primarily related to U.S. federal taxes |
|
|
|
|
|
— |
|
|
|
( |
) |
|
Tax credits |
|
|
( |
) |
|
|
( |
) |
|
|
( |
) |
GILTI |
|
|
— |
|
|
|
— |
|
|
|
|
|
Foreign rate differential |
|
|
|
|
|
|
|
|
|
|||
Other, net |
|
|
|
|
|
|
|
|
|
|||
Total tax |
|
$ |
|
|
$ |
( |
) |
|
$ |
|
||
Effective income tax rate |
|
|
% |
|
|
( |
)% |
|
|
% |
||
The ETR was lower in 2021 primarily due to the reversal of the valuation allowance against the Company’s US deferred tax assets.
51
The Company’s deferred tax assets and liabilities at December 31, 2022 and 2021 consist of the following:
December 31, |
|
2022 |
|
|
2021 |
|
||
(amounts in thousands) |
|
|
|
|
|
|
||
Assets |
|
|
|
|
|
|
||
Deferred compensation |
|
$ |
|
|
$ |
|
||
Loss and credit carryforwards |
|
|
|
|
|
|
||
Accruals deductible for tax purposes when paid |
|
|
|
|
|
|
||
State taxes |
|
|
|
|
|
|
||
Depreciation |
|
|
|
|
|
|
||
Unrealized gain |
|
|
|
|
|
|
||
Leases |
|
|
|
|
|
|
||
Research and development expenses |
|
|
|
|
|
— |
|
|
Other |
|
|
|
|
|
|
||
Gross deferred tax assets |
|
|
|
|
|
|
||
Deferred tax asset valuation allowance |
|
|
( |
) |
|
|
( |
) |
Gross deferred tax assets less valuation allowance |
|
|
|
|
|
|
||
Liabilities |
|
|
|
|
|
|
||
Amortization |
|
|
( |
) |
|
|
( |
) |
Depreciation |
|
|
( |
) |
|
|
( |
) |
Leases |
|
|
( |
) |
|
|
( |
) |
Deferred compensation |
|
|
( |
) |
|
|
( |
) |
Gross deferred tax liabilities |
|
|
( |
) |
|
|
( |
) |
Net deferred tax assets (liabilities) |
|
$ |
|
|
$ |
|
||
Net deferred tax assets and liabilities are recorded as follows: |
|
|
|
|
|
|
||
Net non-current assets |
|
$ |
|
|
$ |
|
||
Net non-current liabilities |
|
|
( |
) |
|
|
( |
) |
Net deferred tax assets (liabilities) |
|
$ |
|
|
$ |
|
||
In assessing the realizability of deferred tax assets, management considers, within each taxing jurisdiction, whether it is more likely than not that all or some portion of the deferred tax assets will be realized, or that a valuation allowance is required. Management considers all available evidence, both positive and negative, in assessing realizability of its deferred tax assets. A key component of this assessment is management’s critical evaluation of current and future impacts of business and economic factors on the Company’s ability to generate future taxable income. Factors that may affect the Company’s ability to generate taxable income include, but are not limited to, increased competition, a decline in revenue or margins, a loss of market share, the availability of qualified professional staff, and a decrease in demand for the Company’s services. The analysis that the Company prepared to determine the valuation allowance required significant judgment and assumptions regarding future market conditions as well as forecasts for profits, taxable income, and taxable income by jurisdiction. Due to the sensitivity of the analysis, changes to the assumptions in subsequent periods could have a material effect on the valuation allowance. Additionally, management has determined that a valuation allowance is required against its Netherlands and India deferred taxes. The total valuation allowance recorded against these deferred tax assets is $
The Company has various state net operating loss carryforwards of $
At December 31, 2022, the Company believes it has adequately provided for its tax-related liabilities, and that no reserve for unrecognized tax benefits is necessary. No significant change in the total amount of unrecognized tax benefits is expected within the next twelve months. The Company recognizes accrued interest and penalties related to unrecognized tax benefits (if any) in tax expense, as applicable. At December 31, 2022 and 2021, the Company had
The Company has not recorded a U.S. deferred tax liability for the excess book basis over the tax basis of its investments in foreign subsidiaries as these amounts continue to be indefinitely reinvested in foreign operations.
52
Net income tax payments during 2022, 2021, and 2020 totaled $
The Company accounts for its leases under Topic 842, “Leases”. The Company is obligated under a number of long-term operating leases for office space and office equipment, and for automobiles leased in Europe.
Most leases contain both lease components (fixed payments for rent) and non-lease components (common-area maintenance and other services). The Company has elected the practical expedient to separate lease and non-lease components for its office leases and has elected to group lease and non-lease components for its vehicle leases. Some leases contain renewal options with escalation clauses commensurate with local market fluctuations, however, generally limiting an annual increase to no more than
Operating leases are included in the right-of-use lease assets, short-term lease liabilities, and long-term lease liabilities on the consolidated balance sheet. The Company measures the operating lease liabilities at lease commencement date based on the present value of remaining lease payments using the rate implicit in the lease when readily determinable, or the Company’s secured incremental borrowing rate. The Company has made an accounting policy election not to recognize a lease liability or right-of-use asset for leases with a lease term of twelve months or less and do not include an option to purchase the underlying asset. The Company recognizes lease expense on a straight-line basis over the lease term and variable lease expense in the period incurred. Variable lease cost consists primarily of common-area maintenance, insurance, and taxes, which are paid based on actual costs incurred by the lessor.
Lease costs for the year ended December 31, 2022 and December 31, 2021 were as follows:
|
|
For the Year Ended |
|
|||||
(amounts in thousands) |
|
December 31, 2022 |
|
|
December 31, 2021 |
|
||
Operating lease costs |
|
$ |
|
|
$ |
|
||
Variable lease costs |
|
|
|
|
|
|
||
Short-term lease costs |
|
|
|
|
|
|
||
Maturities for the Company’s lease liabilities for all operating leases as of December 31, 2022 are as follows:
Year |
|
Total Operating Leases |
|
|
(amounts in thousands) |
|
|
|
|
2023 |
|
$ |
|
|
2024 |
|
|
|
|
2025 |
|
|
|
|
2026 |
|
|
|
|
2027 |
|
|
|
|
2028 & thereafter |
|
|
|
|
Total undiscounted operating lease payments |
|
|
|
|
Less: Interest |
|
|
( |
) |
Total present value of operating lease liabilities |
|
$ |
|
|
The weighted average remaining lease term and discount rate for all operating leases as of December 31, 2022 are as follows:
|
|
December 31, 2022 |
|
|
Weighted average remaining lease term (years) |
|
|
|
|
Weighted average remaining discount rate |
|
|
% |
|
53
Supplemental cash flow information related to the Company’s operating leases for 2022 is as follows:
(amounts in thousands) |
|
December 31, 2022 |
|
|
Cash paid for amounts included in the measurement of lease liabilities |
|
|
|
|
Operating cash outflow from operating leases |
|
|
|
|
Right-of-use assets obtained in exchange for new operating lease liabilities |
|
|
|
|
The Company maintains a non-qualified defined-benefit Executive Supplemental Benefit Plan (ESBP) that provides certain former key executives with deferred compensation benefits, based on years of service and base compensation, payable during retirement. The plan was amended as of November 30, 1994, to freeze benefits for the participants in the plan at that time.
The Company also retained certain potential obligations related to a contributory defined-benefit plan for its previous employees located in the Netherlands (NDBP) when the Company disposed of its subsidiary, CTG Nederland, B.V. Benefits paid are a function of a percentage of career average pay. This plan was curtailed for additional contributions in January 2003.
The Company also maintains a fully funded pension plan related to CTG Belgium and CTG Health Solutions (Belgium) employees (BDBP). This is a plan with active employees and the Company expects to make future contributions.
As a result of the acquisition of Soft Company on February 15, 2018, the Company maintains an unfunded pension plan related to the current Soft Company employees (FDBP). The Company did not make contributions to this plan in 2021 or 2022 and does not anticipate making contributions to the plan in 2023.
On March 3, 2020, the Company acquired StarDust and now maintains an unfunded pension plan related to the current StarDust employees (SDBP). The Company did not make contributions to this plan in 2021 or 2022 and does not anticipate making contributing to this plan in 2023.
On September 29, 2022, the Company acquired Eleviant and now maintains an unfunded defined-benefit gratuity plan related to the current Eleviant employees (IDBP). The Company did not make contributions to this plan in 2022 and does not anticipate making contributing to this plan in 2023.
Net periodic pension cost for the years ended December 31, 2022, 2021, and 2020 for all of the plans is as follows:
Net Periodic Pension Cost |
|
2022 |
|
|
2021 |
|
|
2020 |
|
|||
(amounts in thousands) |
|
|
|
|
|
|
|
|
|
|||
Service cost |
|
$ |
|
|
$ |
|
|
$ |
|
|||
|
|
|
|
|
|
|
|
|
||||
|
|
( |
) |
|
|
( |
) |
|
|
( |
) |
|
|
|
|
|
|
|
|
|
|
||||
Net periodic pension cost |
|
$ |
|
|
$ |
|
|
$ |
|
|||
54
The change in benefit obligation and reconciliation of fair value of plan assets for the years ended December 31, 2022 and 2021 for the ESBP, NDBP, BDBP, FDBP, SDBP, and IDBP plans are as follows:
Changes in Benefit Obligation |
|
2022 |
|
|
2021 |
|
||
(amounts in thousands) |
|
|
|
|
|
|
||
Benefit obligation at beginning of period |
|
$ |
|
|
$ |
|
||
Service cost |
|
|
|
|
|
|
||
Interest cost |
|
|
|
|
|
|
||
Benefits paid |
|
|
( |
) |
|
|
( |
) |
Acquisition |
|
|
|
|
|
— |
|
|
Actuarial loss |
|
|
( |
) |
|
|
( |
) |
Effect of exchange rate changes |
|
|
( |
) |
|
|
( |
) |
Benefit obligation at end of period |
|
|
|
|
|
|
||
Reconciliation of Fair Value of Plan Assets |
|
|
|
|
|
|
||
Fair value of plan assets at beginning of period |
|
|
|
|
|
|
||
Actual return on plan assets |
|
|
|
|
|
|
||
Employer contributions |
|
|
|
|
|
|
||
Benefits paid |
|
|
( |
) |
|
|
( |
) |
Effect of exchange rate changes |
|
|
( |
) |
|
|
( |
) |
Fair value of plan assets at end of period |
|
|
|
|
|
|
||
Accrued benefit cost |
|
$ |
|
|
$ |
|
||
Accrued benefit cost for the ESBP, NDBP, BDBP, FDBP, SDBP, and IDBP is included in the consolidated balance sheet as follows:
(amounts in thousands except percentages) |
|
ESBP |
|
|
NDBP |
|
|
BDBP |
|
|
FDBP |
|
|
SDBP |
|
|
IDBP |
|
||||||
As of December 31, 2022: |
|
|
|
|
|
|
|
|
|
|
|
|
|
|
|
|
|
|
||||||
Non-current assets |
|
$ |
— |
|
|
$ |
— |
|
|
$ |
|
|
$ |
— |
|
|
$ |
— |
|
|
$ |
— |
|
|
Current liabilities |
|
$ |
|
|
$ |
— |
|
|
$ |
— |
|
|
$ |
— |
|
|
$ |
— |
|
|
$ |
|
||
Non-current liabilities |
|
$ |
|
|
$ |
|
|
$ |
— |
|
|
$ |
|
|
$ |
|
|
$ |
|
|||||
Discount rates: |
|
|
|
|
|
|
|
|
|
|
|
|
|
|
|
|
|
|
||||||
Benefit obligation |
|
|
% |
|
|
% |
|
|
% |
|
|
% |
|
|
% |
|
|
% |
||||||
Net periodic pension cost |
|
|
% |
|
|
% |
|
|
% |
|
|
% |
|
|
% |
|
|
% |
||||||
Salary increase rate |
|
|
— |
% |
|
|
— |
% |
|
|
% |
|
|
% |
|
|
% |
|
|
% |
||||
Expected return on plan assets |
|
|
— |
% |
|
|
% |
|
|
% |
|
|
— |
% |
|
|
— |
% |
|
|
— |
% |
||
As of December 31, 2021: |
|
|
|
|
|
|
|
|
|
|
|
|
|
|
|
|
|
|
||||||
Non-current assets |
|
$ |
— |
|
|
$ |
— |
|
|
$ |
|
|
$ |
— |
|
|
$ |
— |
|
|
$ |
— |
|
|
Current liabilities |
|
$ |
|
|
$ |
— |
|
|
$ |
— |
|
|
$ |
|
|
$ |
— |
|
|
$ |
— |
|
||
Non-current liabilities |
|
$ |
|
|
$ |
|
|
$ |
— |
|
|
$ |
|
|
$ |
|
|
$ |
— |
|
||||
Discount rates: |
|
|
|
|
|
|
|
|
|
|
|
|
|
|
|
|
|
|
||||||
Benefit obligation |
|
|
% |
|
|
% |
|
|
% |
|
|
% |
|
|
% |
|
|
— |
% |
|||||
Net periodic pension cost |
|
|
% |
|
|
% |
|
|
% |
|
|
% |
|
|
% |
|
|
— |
% |
|||||
Salary increase rate |
|
|
— |
% |
|
|
— |
% |
|
|
% |
|
|
% |
|
|
% |
|
|
— |
% |
|||
Expected return on plan assets |
|
|
— |
% |
|
|
% |
|
|
% |
|
|
— |
% |
|
|
— |
% |
|
|
— |
% |
||
For the ESBP, the accumulated benefit obligation at December 31, 2022 and 2021 was $
55
For the NDBP, the accumulated benefit obligation at December 31, 2022 and 2021 was $
The assets for the NDBP are held by Aegon, a financial services firm located in the Netherlands. The Company maintains a contract with Aegon to insure future benefit payments of the NDBP; however, due to certain terms of the agreement and potential obligations to the Company, the NDBP has not been settled. The benefit payments to be made in 2023 are expected to be paid by Aegon from plan assets. The assets for the plan are included in a general portfolio of government bonds, a portion of which is allocated to the NDBP based upon the estimated pension liability associated with the plan. The fair market value of the plan’s assets equals the contractual value of the NDBP in any given year. The fair value of the assets is determined using a Level 3 methodology (see Note 1 “Summary of Significant Accounting Policies—Fair Value”). In 2022 and 2021, the plan investments had a targeted minimum return of
For the BDBP, the accumulated benefit obligation at December 31, 2022 and 2021 was $
The assets for the BDBP are held by Allianz for the CTG Belgium plan and by Vivium for the CTG Health Solutions (Belgium) plan, both financial services firms are located in Belgium. The Company maintains a contract with Allianz to insure future benefit payments of the BDBP. Contributions made by the Company to Allianz and Vivium are based on employees’ current salaries. The benefit payments to be made in 2023 are expected to be paid by Allianz and Vivium from plan assets. The assets for the plan are included in the overall portfolio of assets held by Allianz and Vivium. The fair market value of the plan’s assets equals the contractual value of the BDBP in any given year (which is the mathematical reserve held by Allianz and Vivium). The fair value of the assets is determined using a Level 3 methodology (see Note 1 “Summary of Significant Accounting Policies—Fair Value”). Allianz and Vivium do not guarantee a minimum return on the plan investments, whereas Belgian law sets a minimum return to be guaranteed to the participants of the plan.
For the FDBP, the accumulated benefit obligation at December 31, 2022 and 2021 was $
For the SDBP, the accumulated benefit obligation at both December 31, 2022 and 2021 was less than $
For the IDBP, the accumulated benefit obligation at December 31, 2022 was $
56
Anticipated benefit payments for the ESBP, NDBP, BDBP, FDBP, SDBP, and IDBP expected to be paid in future years are as follows:
|
|
|
|
|
(amounts in thousands) |
|
|
|
|
2023 |
|
$ |
|
|
2024 |
|
|
|
|
2025 |
|
|
|
|
2026 |
|
|
|
|
2027 |
|
|
|
|
2028 - 2032 |
|
|
|
|
Total |
|
$ |
|
|
For the ESBP, NDBP, BDBP, FDBP, SDBP, and IDBP, the amounts included in accumulated other comprehensive loss, net of tax, that have not yet been recognized as components of net periodic benefit cost as of December 31, 2022 are $
The amounts recognized in other comprehensive loss, net of tax, for 2022, 2021, and 2020 related to year-over-year changes in the discount rate, totaled $(
The amounts in accumulated other comprehensive loss expected to be recognized as components of net periodic benefit cost during 2023 for the ESBP, NDBP, BDBP, FDBP, SDBP, and IDBP for unrecognized actuarial gains and losses total $
The Company also maintains the Key Employee Non-Qualified Deferred Compensation Plan for certain key executives. Company contributions to this plan, if any, are based on annually defined financial performance objectives. There were
The Company maintains the Non-Employee Director Deferred Compensation Plan for its non-employee directors. During 2022, $
401(k) Profit-Sharing Retirement Plan
The Company maintains a contributory 401(k) profit-sharing retirement plan covering substantially all U.S. employees. There were discretionary Company contributions of $
57
Other Retirement Plans
The Company maintains various other defined contribution retirement plans covering European employees. Company contributions charged to operations were $
Employee Health Insurance
The Company provides various health insurance plans for its employees, including a self-insured plan for its salaried and hourly employees in the U.S. In 2015, the Company began offering compliant healthcare coverage as required under The Patient Protection and Affordable Care Act (PPACA). Where possible, the Company has passed the cost of this coverage on to its clients where the employees that elect this coverage are engaged.
Employee Stock Purchase Plan
Under the Company’s First Employee Stock Purchase Plan (ESPP), employees may apply up to
Preferred Stock
At December 31, 2022 and 2021, the Company had
The Company issues stock options and restricted stock in exchange for services of key employees and independent directors. In accordance with current accounting standards, the calculated cost of its equity-based compensation awards is recognized in the Company’s consolidated statements of income over the period in which an employee or director is required to provide the services for the award. Compensation cost will not be recognized for employees or directors that do not render the requisite services. The Company recognizes the expense for equity-based compensation in its consolidated statements of income on a straight-line basis based upon the number of awards that are ultimately expected to vest.
Equity-based compensation expense, the corresponding tax benefit and net equity-based compensation expense for 2022, 2021, and 2020 are as follows:
|
|
2022 |
|
|
2021 |
|
|
2020 |
|
|||
(amounts in thousands) |
|
|
|
|
|
|
|
|
|
|||
Equity-based compensation expense |
|
$ |
|
|
$ |
|
|
$ |
|
|||
Tax benefit |
|
|
( |
) |
|
|
( |
) |
|
|
— |
|
Net equity-based compensation expense |
|
$ |
|
|
$ |
|
|
$ |
|
|||
On September 17, 2020, the shareholders approved the Company’s 2020 Equity Award Plan (2020 Plan). Under the provisions of the 2020 Plan, stock options, restricted stock, stock appreciation rights, and other awards may be granted or awarded to key employees and independent directors of the Company, as well as non-employees. The Compensation Committee of the Board of Directors determines the nature, amount, pricing and vesting of the grants or awards. All options and awards remain in effect until the earliest of the expiration, exercise, or surrender date. Options generally become exercisable in or equal installments, typically beginning
On May 12, 2010, the shareholders approved the Company’s 2010 Equity Award Plan (2010 Plan). Under the provisions of the 2010 Plan, stock options, restricted stock, stock appreciation rights, and other awards may be granted or awarded to key employees and independent directors of the Company, as well as non-employees. The Compensation Committee of the Board of Directors determines the nature, amount, pricing and vesting of the grants or awards. All options and awards remain in effect until the earliest of the expiration, exercise, or surrender date. Options generally
58
become exercisable in or equal installments, typically beginning
On April 26, 2000, the shareholders approved the Company’s 2000 Equity Award Plan (Equity Plan). Under the provisions of the Equity Plan, stock options, restricted stock, stock appreciation rights, and other awards could previously be granted or awarded to key employees and independent directors of the Company. The Compensation Committee of the Board of Directors determined the nature, amount, pricing, and vesting of the grants or awards. All options and awards remain in effect until the earlier of the expiration, exercise, or surrender date. Options generally become exercisable in or equal annual installments, typically beginning
Under the Company’s 1991 Restricted Stock Plan, a total of
The Company granted
The Company granted
The Company granted
The fair value of the options at the date of grant was estimated using the following weighted-average assumptions for the years ended December 31, 2022, 2021, and 2020:
|
|
2022 |
|
|
2021 |
|
|
2020 |
|
|||
Expected life (years) |
|
|
|
|
|
|
|
|
|
|||
Dividend yield |
|
|
— |
% |
|
|
— |
% |
|
|
— |
% |
Risk-free interest rate |
|
|
% |
|
|
% |
|
|
% |
|||
Expected volatility |
|
|
% |
|
|
% |
|
|
% |
|||
The Company used historical volatility calculated using daily closing prices for its common stock over periods that equal the expected term of the options granted to estimate the expected volatility for the grants made in 2022, 2021, and 2020. The risk-free interest rate assumption was based upon U.S. Treasury yields appropriate for the expected term of the Company’s stock options based upon the date of grant. The expected term of the stock options granted was based upon the options expected vesting schedule and historical exercise patterns. The Company did
During 2022, 2021, and 2020, the Company issued restricted stock to certain key employees. The stock vests over a period of three or four years, with
59
outstanding, can be voted, and are eligible to receive dividends, if any are paid. However, the restricted shares do not include a non-forfeitable right for the holder to receive dividends and none will be paid in the event the awards do not vest. Accordingly, only vested shares of outstanding restricted stock are included in the calculation of basic earnings per share.
During 2022, the Company granted
During 2021, the Company granted
During 2020, the Company granted
As of December 31, 2022, total remaining stock-based compensation expense for non-vested equity-based compensation was approximately $
60
A summary of stock option activity under the 2020 Plan, 2010 Plan, and Equity Plan is as follows:
|
|
2020 Plan |
|
|
Weighted- |
|
|
2010 Plan |
|
|
Weighted- |
|
|
Equity Plan |
|
|
Weighted- |
|
||||||
Outstanding at December 31, 2019 |
|
|
— |
|
|
$ |
— |
|
|
|
|
|
$ |
|
|
|
|
|
$ |
|
||||
Granted |
|
|
— |
|
|
$ |
— |
|
|
|
|
|
$ |
|
|
|
— |
|
|
$ |
— |
|
||
Exercised |
|
|
— |
|
|
$ |
— |
|
|
|
( |
) |
|
$ |
|
|
|
— |
|
|
$ |
— |
|
|
Canceled or forfeited |
|
|
— |
|
|
$ |
— |
|
|
|
— |
|
|
$ |
— |
|
|
|
— |
|
|
$ |
— |
|
Expired |
|
|
— |
|
|
$ |
— |
|
|
|
— |
|
|
$ |
— |
|
|
|
( |
) |
|
$ |
|
|
Outstanding at December 31, 2020 |
|
|
— |
|
|
$ |
— |
|
|
|
|
|
$ |
|
|
|
|
|
$ |
|
||||
Granted |
|
|
|
|
$ |
|
|
|
— |
|
|
$ |
— |
|
|
|
— |
|
|
$ |
— |
|
||
Exercised |
|
|
— |
|
|
$ |
— |
|
|
|
( |
) |
|
$ |
|
|
|
( |
) |
|
$ |
|
||
Canceled or forfeited |
|
|
— |
|
|
$ |
— |
|
|
|
— |
|
|
$ |
— |
|
|
|
— |
|
|
$ |
— |
|
Expired |
|
|
— |
|
|
$ |
— |
|
|
|
( |
) |
|
$ |
|
|
|
— |
|
|
$ |
— |
|
|
Outstanding at December 31, 2021 |
|
|
|
|
$ |
|
|
|
|
|
$ |
|
|
|
|
|
$ |
|
||||||
Granted |
|
|
|
|
$ |
|
|
|
— |
|
|
$ |
— |
|
|
|
— |
|
|
$ |
— |
|
||
Exercised |
|
|
— |
|
|
$ |
— |
|
|
|
( |
) |
|
$ |
|
|
|
( |
) |
|
$ |
|
||
Canceled or forfeited |
|
|
( |
) |
|
$ |
|
|
|
( |
) |
|
$ |
|
|
|
— |
|
|
$ |
— |
|
||
Expired |
|
|
— |
|
|
$ |
— |
|
|
|
( |
) |
|
$ |
|
|
|
— |
|
|
$ |
— |
|
|
Outstanding at December 31, 2022 |
|
|
|
|
$ |
|
|
|
|
|
$ |
|
|
|
|
|
$ |
|
||||||
Options Exercisable at December 31, 2022 |
|
|
|
|
$ |
|
|
|
|
|
$ |
|
|
|
|
|
$ |
|
||||||
Under the 2020 Plan, there were
61
A summary of restricted stock activity under the 2020 Plan, 2010 Plan, the Equity Plan and the 1991 Restricted Stock Plan is as follows:
|
|
2020 Plan |
|
|
Weighted- |
|
|
2010 Plan |
|
|
Weighted- |
|
|
Equity Plan |
|
|
Weighted- |
|
|
1991 |
|
|
Weighted- |
|
||||||||
Outstanding at |
|
|
— |
|
|
$ |
— |
|
|
|
|
|
$ |
|
|
|
|
|
$ |
|
|
|
|
|
$ |
|
||||||
Granted |
|
|
— |
|
|
$ |
— |
|
|
|
|
|
$ |
|
|
|
— |
|
|
$ |
— |
|
|
|
— |
|
|
$ |
— |
|
||
Released |
|
|
— |
|
|
$ |
— |
|
|
|
( |
) |
|
$ |
|
|
|
— |
|
|
$ |
— |
|
|
|
( |
) |
|
$ |
|
||
Canceled or forfeited |
|
|
— |
|
|
$ |
— |
|
|
|
( |
) |
|
$ |
|
|
|
— |
|
|
$ |
— |
|
|
|
( |
) |
|
$ |
|
||
Outstanding at |
|
|
— |
|
|
$ |
— |
|
|
|
|
|
$ |
|
|
|
|
|
$ |
|
|
|
|
|
$ |
|
||||||
Granted |
|
|
|
|
$ |
|
|
|
— |
|
|
$ |
— |
|
|
|
— |
|
|
$ |
— |
|
|
|
— |
|
|
$ |
— |
|
||
Released |
|
|
( |
) |
|
$ |
|
|
|
( |
) |
|
$ |
|
|
|
( |
) |
|
$ |
|
|
|
( |
) |
|
$ |
|
||||
Canceled or forfeited |
|
|
( |
) |
|
$ |
|
|
|
( |
) |
|
$ |
|
|
|
— |
|
|
$ |
— |
|
|
|
( |
) |
|
$ |
|
|||
Outstanding at |
|
|
|
|
$ |
|
|
|
|
|
$ |
|
|
|
— |
|
|
$ |
— |
|
|
|
— |
|
|
$ |
— |
|
||||
Granted |
|
|
|
|
$ |
|
|
|
— |
|
|
$ |
— |
|
|
|
— |
|
|
$ |
— |
|
|
|
— |
|
|
$ |
— |
|
||
Released |
|
|
( |
) |
|
$ |
|
|
|
( |
) |
|
$ |
|
|
|
— |
|
|
$ |
— |
|
|
|
— |
|
|
$ |
— |
|
||
Canceled or forfeited |
|
|
( |
) |
|
$ |
|
|
|
( |
) |
|
$ |
|
|
|
— |
|
|
$ |
— |
|
|
|
— |
|
|
$ |
— |
|
||
Outstanding at |
|
|
|
|
$ |
|
|
|
|
|
$ |
|
|
|
— |
|
|
$ |
— |
|
|
|
— |
|
|
$ |
— |
|
||||
62
Options Outstanding at December 31, 2022
A summary of stock options outstanding at December 31, 2022 for the 2020 Plan, 2010 Plan, and the Equity Plan is as follows:
Range of Exercise Prices: |
|
Number of |
|
|
Weighted |
|
|
Weighted |
|
|
Aggregate |
|
||||
2020 Plan |
|
|
|
|
|
|
|
|
|
|
|
|
||||
$ |
|
|
|
|
$ |
|
|
|
|
|
$ |
|
||||
$ |
|
|
|
|
$ |
|
|
|
|
|
|
— |
|
|||
|
|
|
|
|
$ |
|
|
|
|
|
$ |
|
||||
2010 Plan |
|
|
|
|
|
|
|
|
|
|
|
|
||||
$ |
|
|
|
|
$ |
|
|
|
|
|
$ |
|
||||
$ |
|
|
|
|
$ |
|
|
|
|
|
|
— |
|
|||
$ |
|
|
|
|
$ |
|
|
|
|
|
|
— |
|
|||
$ |
|
|
|
|
$ |
|
|
|
|
|
|
— |
|
|||
|
|
|
|
|
$ |
|
|
|
|
|
$ |
|
||||
Equity Plan |
|
|
|
|
|
|
|
|
|
|
|
|
||||
$ |
|
|
|
|
$ |
|
|
|
|
|
$ |
|
||||
$ |
|
|
|
|
$ |
|
|
|
|
|
|
|
||||
|
|
|
|
|
$ |
|
|
|
|
|
$ |
|
||||
Options Exercisable at December 31, 2022
A summary of stock options that are exercisable at December 31, 2022 for the 2020 Plan, 2010 Plan, and the Equity Plan is as follows:
Range of Exercise Prices: |
|
Number of |
|
|
Weighted |
|
|
Weighted |
|
|
Aggregate |
|
||||
2020 Plan |
|
|
|
|
|
|
|
|
|
|
|
|
||||
$ |
|
|
|
|
$ |
|
|
|
|
|
$ |
|
||||
$ |
|
|
|
|
$ |
|
|
|
|
|
|
— |
|
|||
|
|
|
|
|
$ |
|
|
|
|
|
$ |
|
||||
2010 Plan |
|
|
|
|
|
|
|
|
|
|
|
|
||||
$ |
|
|
|
|
$ |
|
|
|
|
|
$ |
|
||||
$ |
|
|
|
|
$ |
|
|
|
|
|
|
— |
|
|||
$ |
|
|
|
|
$ |
|
|
|
|
|
|
— |
|
|||
$ |
|
|
|
|
$ |
|
|
|
|
|
|
— |
|
|||
|
|
|
|
|
$ |
|
|
|
|
|
$ |
|
||||
Equity Plan |
|
|
|
|
|
|
|
|
|
|
|
|
||||
$ |
|
|
|
|
$ |
|
|
|
|
|
$ |
|
||||
$ |
|
|
|
|
$ |
|
|
|
|
|
|
|
||||
|
|
|
|
|
$ |
|
|
|
|
|
$ |
|
||||
The aggregate intrinsic values as calculated in the above charts detailing options that are outstanding and those that are exercisable, respectively, are based upon the Company’s closing stock price on December 31, 2022 of $
In 2022, International Business Machines Corporation (IBM) was the Company’s largest client. The National Technical Services Agreement with IBM expires on
63
The Company and its subsidiaries are involved from time to time in various legal proceedings and tax audits arising in the ordinary course of business. At December 31, 2022 and 2021, the Company was in discussion with various governmental agencies relative to tax matters, including income, sales and use, and property and franchise taxes. The outcome of these audits and legal proceedings, as applicable, involving the Company and its subsidiaries cannot be predicted with certainty, and the amount of any liability that could arise with respect to such audits cannot be accurately predicted. However, as none of these matters are individually or in the aggregate significant and as management has not recorded an estimate of its potential liability for these audits at December 31, 2022 and 2021. The Company does not expect the conclusion of these matters to have a material adverse effect on the financial position, results of operations, or cash flows of the Company.
Operating segments are defined as components of an enterprise about which separate financial information is available that is evaluated on a regular basis by the chief operating decision maker, or decision making group, in deciding how to allocate resources to an individual segment and in assessing performance.
The Company provides information technology and related services to its clients. These services include digital IT Solutions and Services, and Staffing Services. With digital IT Solutions and Services, the Company generally takes responsibility for the deliverables and some level of project and staff management, and these services may include high-end advisory or business-related consulting. When providing Staffing Services, including managed staffing, staff augmentation, and volume staffing, personnel are provided to clients based upon their requirements for specific skills, who then, in turn, take their direction from clients’ managers.
The Company’s strategy throughout its operations is to expand the amount of IT Solutions and Services it provides to its clients as compared with Staffing Services, and to focus on delivering digital solutions. IT Solutions and Services provide significant value to the Company's clients, and drive higher bill rates and margins for the Company. The Company's existing solutions include business, technology, and operations solutions that aid its clients in digitally transforming their company, and ultimately meet the needs of their clients. The digital services the Company delivers includes the Internet of Things, Intelligent Automation, Data and Analytics, Cloud and Automated Testing.
In prior years, and in 2021 prior to the fourth quarter, the Company reported its results in
During the 2021 fourth quarter, the Company further refined its strategy to focus on providing digital services within its IT Solutions business in both North America and in Europe. As part of this process, the Company also determined that there are certain lower margin staffing accounts within its business that are no longer part of the Company’s long-term business plan. The focus includes investing in business development, solutions, delivery, and marketing for IT Solutions, and critically evaluating each significant staffing engagement as it comes up for renewal to determine if the Company would continue to provide those services to its client. These decisions are based on, among other factors, critically evaluating the work performed, the availability of the resources, the client, the long-term opportunities for the services provided at the client, and the revenue and profit associated with the engagement.
Accordingly, the Company reports its operations in
The segments are composed of the following:
IT Solutions and Services in North America and Europe
IT Solutions and Services include business, technology, and operations solutions that aid the Company's clients in digitally transforming their company, and ultimately meet the needs of their clients. The digital services the Company delivers includes the Internet of Things, Intelligent Automation, Data and Analytics, Cloud and Automated Testing.
64
Non-Strategic Technology Services
The Company’s Non-Strategic Technology Services address a range of information and technology resource needs, from filling specific talent gaps to managing high-volume staffing programs. The Company recruits, retains, and manages IT talent for its clients, which are primarily large technology service providers and other companies with multiple locations and a significant need for high-volume professional IT resources. This segment consists of the lowest margin services the Company provides to its clients. This segment consists primarily of staffing services in North America, and a minor amount (less than
The Company makes decisions related to resource allocation based upon the contribution profit of each of its segments. Contribution profit reflects gross profit less any operating expenses directly related to each respective segment. Those operating expenses primarily include sales, solutions, delivery, and recruiting expenses. General and administrative expenses are not allocated to the individual segments and primarily include corporate support costs such as finance and accounting, internal IT, human resources, benefits and marketing.
The operating results for the Company’s segments for 2022, 2021, and 2020 were as follows:
2022 |
|
North America IT |
|
|
Europe IT |
|
|
Non-Strategic |
|
|
|
|
||||
(amounts in thousands) |
|
Solutions & Services |
|
|
Solutions & Services |
|
|
Technology Services |
|
|
Total |
|
||||
Revenue |
|
$ |
|
|
$ |
|
|
$ |
|
|
$ |
|
||||
Direct costs |
|
|
|
|
|
|
|
|
|
|
|
|
||||
Gross profit |
|
|
|
|
|
|
|
|
|
|
|
|
||||
Operating expenses |
|
|
|
|
|
|
|
|
|
|
|
|
||||
Contribution profit |
|
$ |
|
|
$ |
|
|
$ |
|
|
|
|
||||
General and administrative expenses |
|
|
|
|
|
|
|
|
|
|
|
|
||||
Operating income |
|
|
|
|
|
|
|
|
|
|
$ |
|
||||
2021 |
|
North America IT |
|
|
Europe IT |
|
|
Non-Strategic |
|
|
|
|
||||
(amounts in thousands) |
|
Solutions & Services |
|
|
Solutions & Services |
|
|
Technology Services |
|
|
Total |
|
||||
Revenue |
|
$ |
|
|
$ |
|
|
$ |
|
|
$ |
|
||||
Direct costs |
|
|
|
|
|
|
|
|
|
|
|
|
||||
Gross profit |
|
|
|
|
|
|
|
|
|
|
|
|
||||
Operating expenses |
|
|
|
|
|
|
|
|
|
|
|
|
||||
Contribution profit |
|
$ |
|
|
$ |
|
|
$ |
|
|
|
|
||||
General and administrative expenses |
|
|
|
|
|
|
|
|
|
|
|
|
||||
Operating income |
|
|
|
|
|
|
|
|
|
|
$ |
|
||||
2020 |
|
North America IT |
|
|
Europe IT |
|
|
Non-Strategic |
|
|
|
|
||||
(amounts in thousands) |
|
Solutions & Services |
|
|
Solutions & Services |
|
|
Technology Services |
|
|
Total |
|
||||
Revenue |
|
$ |
|
|
$ |
|
|
$ |
|
|
$ |
|
||||
Direct costs |
|
|
|
|
|
|
|
|
|
|
|
|
||||
Gross profit |
|
|
|
|
|
|
|
|
|
|
|
|
||||
Operating expenses |
|
|
|
|
|
|
|
|
|
|
|
|
||||
Contribution profit |
|
$ |
|
|
$ |
|
|
$ |
|
|
|
|
||||
General and administrative expenses |
|
|
|
|
|
|
|
|
|
|
|
|
||||
Operating income |
|
|
|
|
|
|
|
|
|
|
$ |
|
||||
Depreciation allocated to Europe IT Solutions and Services totaled $
The Company has not provided any other expense or asset information for each of its segments as the Company’s CEO, who is the chief operating decision maker, does not use this information in any way to make resource decisions or
65
to manage the segments. The Company does not prepare balance sheet or statement of cash flow information for its segments.
The Company’s goodwill at December 31, 2022 totaled $
CTG’s reportable information is based on geographical areas. The accounting policies of the individual geographical areas are the same as those described in Note 1, “Summary of Significant Accounting Policies.”
Financial Information About Geographic Areas |
|
2022 |
|
|
2021 |
|
|
2020 |
|
|||
(amounts in thousands) |
|
|
|
|
|
|
|
|
|
|||
Revenue from External Customers: |
|
|
|
|
|
|
|
|
|
|||
United States |
|
$ |
|
|
$ |
|
|
$ |
|
|||
Belgium (1) |
|
|
|
|
|
|
|
|
|
|||
Luxembourg (3) |
|
|
|
|
|
|
|
|
|
|||
Other countries |
|
|
|
|
|
|
|
|
|
|||
Total foreign revenue |
|
|
|
|
|
|
|
|
|
|||
Total revenue |
|
$ |
|
|
$ |
|
|
$ |
|
|||
Long-lived Assets*: |
|
|
|
|
|
|
|
|
|
|||
United States |
|
$ |
|
|
$ |
|
|
$ |
|
|||
France (2) |
|
|
|
|
|
|
|
|
|
|||
Luxembourg (3) |
|
|
|
|
|
|
|
|
|
|||
Other countries |
|
|
|
|
|
|
|
|
|
|||
Total long-lived assets* |
|
$ |
|
|
$ |
|
|
$ |
|
|||
Deferred Tax Assets, Net of Valuation Allowance: |
|
|
|
|
|
|
|
|
|
|||
United States |
|
$ |
|
|
$ |
|
|
$ |
— |
|
||
Europe |
|
|
|
|
|
|
|
|
|
|||
Total deferred tax assets, net |
|
$ |
|
|
$ |
|
|
$ |
|
|||
*Long-lived Assets exclude goodwill |
|
|
|
|
|
|
|
|
|
|||
66
Item 9. Changes in and Disagreements With Accountants on Accounting and Financial Disclosure
None.
Item 9A. Controls and Procedures
Evaluation of Disclosure Controls and Procedures
The Company’s management has evaluated, under the supervision and with the participation of the Company’s Chief Executive Officer and Chief Financial Officer, the effectiveness of the design and operations of the Company’s disclosure controls and procedures (as defined in Rule 13a-15(e) of the Exchange Act) as of the end of the period covered by this annual report. Based on that evaluation, the Company’s Chief Executive Officer and Chief Financial Officer have concluded that the Company’s disclosure controls and procedures were effective as of the end of the period covered by this annual report.
As described above, on September 29, 2022 we completed the acquisition of Eleviant. SEC guidance permits management to omit an assessment of an acquired business’ internal control over financial reporting from management’s assessment of internal control over financial reporting for a period not to exceed one year from date of acquisition. We are in the process of integrating Eleviant’s operations within our internal control structure. In executing this integration, we are analyzing, evaluating, and where necessary, making changes in controls and procedures related to the Eleviant business. Accordingly, management has excluded controls relating to Eleviant from its assessment of effectiveness of internal control over financial reporting as of December 31, 2022.
The Company’s management is responsible for establishing and maintaining an adequate system of internal control over financial reporting. Internal control over financial reporting is a process designed to provide reasonable assurance regarding the reliability of financial reporting and the preparation of financial statements for external purposes in accordance with generally accepted accounting principles. A company’s internal control over financial reporting includes those policies and procedures that (1) pertain to the maintenance of records that, in reasonable detail, accurately and fairly reflect the transactions and dispositions of the assets of the Company; (2) provide reasonable assurance that transactions are recorded as necessary to permit preparation of financial statements in accordance with generally accepted accounting principles, and that receipts and expenditures of the Company are being made only in accordance with authorizations of management and directors of the Company; and (3) provide reasonable assurance regarding prevention or timely detection of unauthorized acquisition, use, or disposition of the Company’s assets that could have a material effect on the financial statements.
Because of its inherent limitations, a system of internal control over financial reporting can provide only reasonable assurance and may not prevent or detect misstatements. Therefore, even those systems determined to be effective can provide only reasonable assurance with respect to financial statement preparation and presentation. Further, because of changes in conditions, effectiveness of internal control over financial reporting may deteriorate.
Management of the Company conducted an evaluation of the effectiveness of the Company’s internal control over financial reporting based on the Internal Control-Integrated Framework (2013) issued by the Committee of Sponsoring Organizations of the Treadway Commission. Based on that evaluation, the Company’s management did not identify any control deficiencies it considered to be material weaknesses under the rules specified by the Public Company Accounting Oversight Board’s Auditing Standard No. 5, and therefore concluded that its internal control over financial reporting was effective as of December 31, 2022.
The Company acquired Eleviant on September 29, 2022, and management excluded from its assessment of the effectiveness of internal control over financial reporting as of December 31, 2022, Eleviant’s internal control over financial reporting associated with assets representing $3.4 million of consolidated assets and revenues representing $2.8 million of consolidated revenues included in the consolidated financial statements of the Company as of and for the year ended December 31, 2022.
Our independent registered public accounting firm has issued an attestation report on the Company’s effectiveness of internal control over financial reporting. Their report appears below under (b), “Attestation Report of the Registered Public Accounting Firm.”
67
Report of Independent Registered Public Accounting Firm
Board of Directors and Shareholders
Computer Task Group, Incorporated
Opinion on internal control over financial reporting
We have audited the internal control over financial reporting of Computer Task Group, Incorporated (a New York corporation) and subsidiaries (the “Company”) as of December 31, 2022, based on criteria established in the 2013 Internal Control—Integrated Framework issued by the Committee of Sponsoring Organizations of the Treadway Commission (“COSO”). In our opinion, the Company maintained, in all material respects, effective internal control over financial reporting as of December 31, 2022, based on criteria established in the 2013 Internal Control—Integrated Framework issued by COSO.
We also have audited, in accordance with the standards of the Public Company Accounting Oversight Board (United States) (“PCAOB”), the consolidated financial statements of the Company as of and for the year ended December 31, 2022, and our report dated March 15, 2023 expressed an unqualified opinion on those financial statements.
Basis for opinion
The Company’s management is responsible for maintaining effective internal control over financial reporting and for its assessment of the effectiveness of internal control over financial reporting, included in the accompanying Management’s Annual Report on Internal Control Over Financial Reporting (“Management’s Report”). Our responsibility is to express an opinion on the Company’s internal control over financial reporting based on our audit. We are a public accounting firm registered with the PCAOB and are required to be independent with respect to the Company in accordance with the U.S. federal securities laws and the applicable rules and regulations of the Securities and Exchange Commission and the PCAOB.
We conducted our audit in accordance with the standards of the PCAOB. Those standards require that we plan and perform the audit to obtain reasonable assurance about whether effective internal control over financial reporting was maintained in all material respects. Our audit included obtaining an understanding of internal control over financial reporting, assessing the risk that a material weakness exists, testing and evaluating the design and operating effectiveness of internal control based on the assessed risk, and performing such other procedures as we considered necessary in the circumstances. We believe that our audit provides a reasonable basis for our opinion.
Our audit of, and opinion on, the Company’s internal control over financial reporting does not include the internal control over financial reporting of Eleviant Technologies, Inc., a wholly-owned subsidiary, whose financial statements reflect total assets and revenues constituting 2 and 1 percent, respectively, of the related consolidated financial statement amounts as of and for the year ended December 31, 2022. As indicated in Management’s Report, Eleviant Technologies, Inc. was acquired during 2022. Management’s assertion on the effectiveness of the Company’s internal control over financial reporting excluded internal control over financial reporting of Eleviant Technologies, Inc.
Definition and limitations of internal control over financial reporting
A company’s internal control over financial reporting is a process designed to provide reasonable assurance regarding the reliability of financial reporting and the preparation of financial statements for external purposes in accordance with generally accepted accounting principles. A company’s internal control over financial reporting includes those policies and procedures that (1) pertain to the maintenance of records that, in reasonable detail, accurately and fairly reflect the transactions and dispositions of the assets of the company; (2) provide reasonable assurance that transactions are recorded as necessary to permit preparation of financial statements in accordance with generally accepted accounting principles, and that receipts and expenditures of the company are being made only in accordance with authorizations of management and directors of the company; and (3) provide reasonable assurance regarding prevention or timely detection of unauthorized acquisition, use, or disposition of the company’s assets that could have a material effect on the financial statements.
Because of its inherent limitations, internal control over financial reporting may not prevent or detect misstatements. Also, projections of any evaluation of effectiveness to future periods are subject to the risk that controls may become inadequate because of changes in conditions, or that the degree of compliance with the policies or procedures may deteriorate.
/s/ GRANT THORNTON LLP
Cleveland, Ohio
March 15, 2023
68
The Company’s management, including its Chief Executive Officer and Chief Financial Officer, evaluated the effectiveness of the Company’s internal control over financial reporting as of the end of the period covered by this annual report. There were no changes in the Company’s internal control over financial reporting that occurred during the Company's last fiscal quarter, which ended on December 31, 2022, that materially affected, or are reasonably likely to materially affect, the Company’s internal control over financial reporting.
Item 9B. Other Information
Effective as of March 14, 2023, in connection with a periodic review of the Company's Restated By-Laws (the "Bylaws"), the Board of Directors of the Company adopted amendments to the Bylaws (as amended, the "Amended Bylaws") to among other things, update certain provisions related to the Company's advance notice provision to include additional requirements regarding the information shareholders must submit and representations shareholders must make in connection with providing advance notice of shareholder meeting proposals and director nominations, require any shareholder submitting a proposal or a nomination to represent whether such shareholder intends to solicit proxies in support of director nominations or other business, reserve use of the white proxy card to the Board of Directors, and make certain administrative, modernizing, clarifying and conforming changes. In connection with the Amended Bylaws, for the Company's 2023 Annual Meeting of Shareholders tentatively scheduled for September 14, 2023, for proposals made outside of Rule 14a-8 and for director nominations to be submitted at the 2023 Annual Meeting, to be timely, shareholders’ notices, including the required information set forth in the Amended Bylaws must be given, either by personal delivery or by United States mail, postage prepaid, to and received by the Secretary of the Company by 5:30 p.m., Eastern Time, at Computer Task Group, Incorporated, Attn: Secretary, 300 Corporate Parkway, Suite 214N, Amherst, New York 14226 no earlier than May 23, 2023 and no later than June 22, 2023, including any notice of a solicitation of proxies for the 2023 Annual Meeting of Shareholders under Rule 14a-19 of the Exchange Act. The foregoing description does not purport to be complete and is qualified in its entirety by reference to the full text of the Bylaws, a copy of which is filed as Exhibit 3.2 to this annual report on Form 10-K.
Item 9C. Disclosure Regarding Foreign Jurisdictions that Prevent Inspections
Not applicable.
69
PART III
Item 10. Directors, Executive Officers and Corporate Governance
Information regarding the Company’s Code of Business Conduct is set forth herein under “Available Company Information” in Part I, Item 1 of this annual report on Form 10-K. All of our employees, including our principal executive officer, principal financial officer, principal accounting officer and controller, or persons performing similar functions, and our directors are subject to our Code of Business Conduct.
The Company maintains a separate standing audit committee established in accordance with section 3(a)(58)(A) of the Exchange Act consisting of all of our non-management, independent directors (with such independence noted in the director biographies below), with James R. Helvey III as the designated audit committee financial expert. Mr. Helvey is independent, as independence for audit committee members is defined under applicable SEC rules and in the listing standards applicable to CTG.
For a discussion of changes to procedures for shareholders to recommend nominees to our Board of Directors, see discussion of our Amended Bylaws in Item 9B. Other Information of this annual report on Form 10-K.
|
|
Filip J.L. Gydé
President & Chief Executive Officer, Computer Task Group, Incorporated
Age: 62
Director since 2019
|
Experience • Chief Executive Officer, Computer Task Group, Incorporated (2019 – present); Executive Vice President, General Manager and President for CTG’s European operations (2018 – 2019); Senior Vice President and General Manager of CTG’s European operations (2000 – 2014, 2015 – 2018), Interim Executive Vice President of operations, assisting the Interim CEO in overseeing CTG’s worldwide operations (2014 – 2015); Managing Director for Luxembourg (1999 – 2000); Managing Director for Belgium (1996 – 2014), joined 1987
Education
• MBA, University of Antwerp
• MS, Ghent University
Qualifications
With regard to Mr. Gydé, the Nominating and Corporate Governance Committee and the Board believe that it is important that they have immediate access to his direct involvement in the management of the Company as the Chief Executive Officer, as he brings more than 30 years of experience in the IT services industry to his positions. |
|
|
James R. Helvey, III
Managing Partner, Cassia Capital Partners
Age: 64
Independent Director since 2015 |
Experience • Co-founder and Managing Partner, Cassia Capital Partners, LLC, (2011 – present)
• Partner and the Risk Management Officer, CMT Asset Management Limited, a private investment firm (2005 – 2011)
• Candidate for the United States Congress in the 5th District of North Carolina (2003 – 2004)
• Chair and Chief Executive Officer, Cygnifi Derivatives Services, LLC, an online derivatives services provider (2000 – 2002)
• Managing Director at JP Morgan & Co., including Vice Chair of the Risk Management Committee, Chair of the Liquidity Committee, Global Head of Derivative Counterparty Risk Management, Head of the swap derivative trading business in Asia, and head of short-term interest rate derivatives and foreign exchange forward trading in Europe, (1985 – 2000)
Education
• MA, Columbia University, School of International and Public Affairs, where he was an International Fellow
• Fulbright Scholar, University of Cologne in Germany
• BA, magna cum laude, Wake Forest University
Other Boards
• Coca-Cola Bottling Co. Consolidated (2016 – present)
• Trustee Wake Forest University (1997 – 2017)
• Pike Corporation, Lead Independent Director (2005 – 2014)
• Verger Capital Management LLC
• Piedmont Federal Savings Bank |
70
|
• Wake Forest Baptist Medical Center & Health Sciences
Qualifications
With regard to Mr. Helvey, the Nominating and Corporate Governance Committee and the Board particularly noted his extensive financial experience and prior audit committee experience. |
|
|
David H. Klein
President, Klein Solutions Group Age: 74
Independent Director since 2012 |
Experience • President of Klein Solutions Group, LLC, which provides advice on policy, strategy, operations and finance to healthcare delivery and payer organizations (2012 – present)
• Special advisor to the CEO, University of Rochester (UR) Medical Center (2012 – present)
• Professor of Public Health Sciences, UR School of Medicine and Dentistry and Executive Professor of Healthcare Management, UR Simon Business School (2012 – present)
• Chief Executive Officer, The Lifetime Healthcare Companies, comprised of Excellus BlueCross BlueShield (BCBS), Univera Healthcare, Lifetime Health Medical Group, Lifetime Care (home care agency), EBS-RMSCO Benefit Solutions (benefits consulting firm and third party administration) and MedAmerica (long-term care insurance company) (2003 – 2012)
• Director of the national Blue Cross Blue Shield Association (BCBSA) and America’s Health Insurance Plans (2003 – 2012)
• Executive with the national BlueCross BlueShield Association and Health Care Service Corporation (1984 – 1986)
Education
• MBA, University of Chicago – 1972
• BS, Rensselaer Polytechnic Institute – 1970
Other Boards
• Privately held companies: Landmark Health (2014 - 2021), Cogito (2016 – present), NextHealth Technologies (2017 – 2022), Excel Venture Partners Fund (2017 – present), Opyn (2019 - present), Honest Medical Group (2022 - present)
• Member, Cressey & Company private equity fund Distinguished Executives Council (2016 – present)
• Advisor, Health Catalyst Capital Management, LLC and Triple Tree Capital Partners venture funds (2019 – present)
• Former non-executive chair (2016 – 2020), New York eHealth Collaborative which operates New York State’s health information exchange (2014 – 2021)
• Director of Commonwealth Care Alliance (a health plan that serves high-cost, high-need patients) (2019 – present)
Qualifications
With regard to Mr. Klein, the Nominating and Corporate Governance Committee and the Board particularly noted his extensive experience managing health plan entities and his knowledge of the healthcare industry, an important market for the Company’s services. |
Valerie Rahmani
Age: 65
Independent Director since 2015 |
Experience • Chief Executive Officer of Damballa, Inc. (2009 – 2012)
• IBM: General Manager Internet Security Systems (2008 – 2009), General Manager of Global Technology Services business (2004 – 2008), Head of Sales and Services Strategy unit (2003 – 2005), General Manager of UNIX server business (2001 – 2003), General Manager of Mobile business (2000 – 2001); joined 1984
Education
• DPhil, University of Oxford
• MA, University of Oxford
Other Boards
• Elliott Opportunity II Corp. (2021 – present)
• Rungway, a social media startup (2019 – 2021)
• Entrust Corporation (2019 – present)
• London Stock Exchange Group plc (2017 – present)
|
71
|
• RenaissanceRe Holdings Ltd (2017 – present) • Aberdeen Asset Management PLC (2015-2017)
• Teradici Corporation, a private technology company (2010 – 2015)
Qualifications
With regard to Ms. Rahmani, the Nominating and Corporate Governance Committee and the Board particularly noted her experience in technology and cyber-security and her extensive management experience within the IT Services industry.
|
Raj Rajgopal
President, RR Advisory Services
Age: 62
Independent Director since 2020 |
Experience • President, RR Advisory Services, LLC, an advisory firm that offers due diligence and consulting services to venture capital, private equity, and large enterprises (2019 – present)
• Board observer, Wevo Conversion, a provider of artificial intelligence and machine learning based digital marketing platform (2020 – present)
• Independent Director of Vuzix Corporation (2021 – present), a provider of augmented reality/virtual reality smart glasses to enable enterprise digital transformation
• President, Virtusa Corporation (2013 – 2019); successfully led Virtusa’s transformation from an engineering services firm to a leading digital consulting, digital solutions and IT services organization; Independent consultant to Virtusa Corporation (2003 – 2005), helped set the company’s long-term growth strategy
• Global leadership roles in both the U.S. and the U.K., Capgemini, a global leader in consulting, technology services and digital transformation (1991 – 2003)
• Director of Advanced Technologies, BGS Systems, Inc. (1985 – 1989)
Education
• MBA, Massachusetts Institute of Technology
• MS, Virginia Tech
• BTech, Indian Institute of Technology, Madras
Qualifications
With regard to Mr. Rajgopal, the Nominating and Corporate Governance Committee and the Board particularly noted his extensive experience in IT digital transformation services and global business background. |
Kathryn A. Stein
Chief Strategy Officer and Global Business Leader of Enterprise Services, Genpact Limited
Age: 45
Independent Director since 2021 |
Experience
• Chief Strategy Officer and Global Business Leader of Analytics, Data and Enterprise Services, Genpact Limited, a Business and IT services provider (2016 – present)
• Partner, Market Business Leader – Retirement for the East Market, Mercer (2015 – 2016) Partner, Global Chief Operating Officer, Retirement, Health and Benefits (2014 – 2015) Partner, Director of North America Region Strategy and Operation (2012 – 2014); Principal, Global Strategy and Corporate Development (2010 – 2012)
• Project Leader, Boston Consulting Group (2003 – 2005)
• Assistant Director, Strategic Planning, Center for Strategic and International Studies (2003 – 2005)
• Consultant, MarketBridge Consulting (1999 – 2003)
Education
• MBA, Columbia Business School
• BA, University of North Carolina at Chapel Hill
Qualifications
With regard to Ms. Stein, the Nominating and Corporate Governance Committee and the Board particularly noted her extensive experience in IT digital transformation services and mergers and acquisitions. |
The Nominating and Corporate Governance Committee and the Board of Directors focus on the experience, qualifications, attributes and skills discussed in each of the director’s biographies set forth above. In each case, the Nominating and Corporate Governance Committee and the Board of Directors considered the achievements throughout the successful careers of each of the individuals.
72
Executive Officers of the Company
As of March 10, 2023, the following individuals are executive officers of the Company:
Name |
|
Age |
|
Office |
|
Period During Which Served as Executive Officer |
|
Other Positions and Offices with Registrant |
Filip J. L. Gydé |
|
62 |
|
President and Chief Executive Officer Executive Vice President, President and General Manager of Europe Senior Vice President and General Manager of Europe Interim Executive Vice President of Operations Senior Vice President and General Manager of Europe |
|
Mar. 1, 2019 to date
May 8, 2018 to Feb. 28, 2019
Apr. 6, 2015 to May 7, 2018 Oct. 15, 2014 to Apr. 5, 2015
Oct. 1, 2000 to Oct. 14, 2014 |
|
Director
|
|
|
|
|
|
|
|
|
|
John M. Laubacker |
|
56 |
|
Executive Vice President and Chief Financial Officer Senior Vice President Senior Vice President and Interim Chief Financial Officer |
|
Apr. 21, 2017 to date Apr. 6, 2015 to Apr. 20, 2017
Oct. 15, 2014 to Apr. 5, 2015 |
|
Treasurer |
|
|
|
|
|
|
|
|
|
Peter P. Radetich |
|
69 |
|
Senior Vice President, General Counsel and Secretary |
|
Apr. 28, 1999 to date |
|
Secretary |
|
|
|
|
|
|
|
|
|
Thomas J. Niehaus |
|
61 |
|
Executive Vice President, General Manager of the Americas |
|
May 5, 2019 to date |
|
None |
Bob Daelman |
|
57 |
|
Senior Vice President Europe Vice President Belgium and United Kingdom |
|
Nov. 15, 2022 to date Jan. 23, 2019 to Nov. 14, 2022 |
|
None |
Mr. Gydé was promoted to President and Chief Executive Officer on March 1, 2019. Previously, Mr. Gydé served as an Executive Vice President, President and General Manager for the Company's European operations. Mr. Gydé was Interim Executive Vice President of Operations from October 15, 2014 until April 5, 2015, responsible for operating activities of the overall Company. Previously he was Senior Vice President and General Manager of CTG Europe from October 1, 2000 through October 14, 2014. Prior to that, Mr. Gydé was Managing Director of the Company’s operations in Belgium. Mr. Gydé has been with the Company since May 1987.
Mr. Laubacker currently serves as an Executive Vice President, Chief Financial Officer (CFO) and Treasurer. Mr. Laubacker was promoted to CFO on April 21, 2017. Previously, Mr. Laubacker was promoted to Vice President in February 2017 and has served as Treasurer since 2006. Prior to that, Mr. Laubacker was the Director of Audit and Treasury Services and the Manager of External Reporting. Mr. Laubacker joined the Company in January 1996.
Mr. Radetich currently serves as Senior Vice President, General Counsel and Secretary. Mr. Radetich was promoted to General Counsel and Secretary in April 1999, and joined the Company in June 1988 as Associate General Counsel.
Mr. Niehaus currently serves as an Executive Vice President, and General Manager of the Americas. Mr. Niehaus rejoined the Company in May 2019. Prior to joining CTG, Mr. Niehaus served as the managing member of TJN Advisory, a private advisory services consulting firm. Previously, Mr. Niehaus was the President and Chief Operating Officer of Encore Health Resources from 2011 to 2017, and then Chief Executive Officer of Encore in 2017. Mr. Niehaus worked for CTG from 1999 to 2011, including serving as a Senior Vice President.
Mr. Daelman was promoted Senior Vice President Europe on November 15, 2022. Previously, Mr. Daelman was promoted to Vice President of our Belgium and United Kingdom operations on January 23, 2019. Previously, Mr. Daelman was Managing Director Belgium since May of 2016. Prior to that, Mr. Daelman held various titles from Manager to Managing Director of the Company’s operations in Belgium. Mr. Daelman joined the Company in October of 2001.
Mr. Wauthier resigned from his position as a Director of the Company effective November 15, 2022. Previously, Mr. Wauthier was promoted to Senior Vice President of our European operations on April 1, 2020. Prior to that, Mr. Wauthier was a Vice President from January 23, 2019 through March 31, 2020, and before that was Managing Director of our Luxembourg operation from August 30, 1996 to January 22, 2019. Mr. Wauthier joined the Company in 1995.
73
Item 11. Executive Compensation
COMPENSATION DISCUSSION AND ANALYSIS
Compensation Committee Composition and Primary Purposes
The Compensation Committee of the Board of Directors (“Compensation Committee”) consists of Valerie Rahmani, Chair, James R. Helvey III, David H. Klein, Raj Rajgopal, and Kathryn Stein. During 2022, the Compensation Committee held a total of four meetings. The Board of Directors has determined that the members of the Compensation Committee are independent.
The Compensation Committee has a charter that is available on our Company’s website as described above under “Available Company Information” in Part I, Item 1 of this annual report on Form 10-K. The Compensation Committee reviews the charter annually and updates the charter as necessary.
The primary purposes of the Compensation Committee are to:
Effect of Say-on-Pay Vote
We carefully consider the results of our advisory shareholder Say-on-Pay votes and take into account feedback we receive from our shareholders. At the September 2022 annual meeting, shareholders were asked to approve, on an advisory basis, the Company's fiscal 2021 executive compensation programs. Of those who voted, over 97% voted in favor of our proposal. In light of these results, and in consideration of shareholder input obtained from outreach efforts taken in connection with the 2022 meeting, the Compensation Committee carefully reviewed the Company's executive compensation practices. The Committee concluded that the Company's existing executive compensation programs continue to be the most appropriate for the Company and effective in rewarding executives commensurate with business results. The Committee believes that the best way to align the CEO's compensation with shareholder interests is to place the majority of his compensation at-risk in the form of long-term performance based equity awards and annual incentive opportunity. We will continue to keep an open dialogue with our shareholders to help ensure that we have a regular pulse on investor perspectives.
Compensation Philosophy and Executive Compensation Objectives
Given the exceptionally competitive nature of the IT Industry, the Compensation Committee and management believe it is strategically critical to attract, retain and motivate the most talented employees possible by providing competitive total compensation packages. This general philosophy on compensation applies to all employees of the Company. With regard to executive officer compensation, the Company seeks to accomplish the following high-level objectives:
74
How Executive Compensation is Determined
In order to promote the Company’s objective of tying total compensation to performance in a meaningful manner, the Company has adopted a uniform approach to compensation planning. In short, once the Board of Directors has reviewed and approved the corporate goals and objectives for the entire Company, the Compensation Committee begins the process of setting compensation for the executive officers. Once compensation has been set for the executive officers, they in turn are able to set performance-based objectives for their direct reports. This approach to compensation planning continues throughout the organization. In this manner, the compensation planning process seeks to optimize shareholder value by integrating appropriate employee responsibilities with corporate objectives.
In an effort to accomplish the Company’s objective of offering competitive total compensation packages, the Compensation Committee routinely surveys total compensation packages for all executive officers. In October 2022, as has been the practice for several years, the Compensation Committee retained the services of Pay Governance LLC (“Pay Governance”), as its independent compensation consulting firm, to undertake an annual compensation review for each of the Company’s executive officers (excluding Mr. Daelman). The Company paid $11,234 to Pay Governance for these services in October 2022. Pay Governance reports to and acts solely at the direction of the Compensation Committee. Pay Governance does not provide any other services to the Company or any of the Company’s executive officers individually, aside from those services provided to the Compensation Committee. Pay Governance has provided the Compensation Committee with appropriate assurances and confirmation of its independent status. Furthermore, the Compensation Committee has considered the factors set forth in 17 C.F.R. §240.10C-1(b) (4) (i)-(vi) and believes that Pay Governance has been independent throughout its services to the Committee. Prior to conducting the study, Pay Governance was provided with job descriptions for each of the executive officers (excluding Mr. Daelman) and was specifically instructed to provide the Compensation Committee with a Competitive Market Analysis, a written report for each executive officer reflecting the competitive range of base salary, target total cash compensation, and target direct total compensation for comparable positions.
Surveying Methodology Used. Pay Governance used a Mercer Benchmark executive compensation database to create the report. This database contains compensation data from over 2,500 companies in a variety of industries. Pay Governance used a third party firm specializing in international compensation for Mr. Wauthier. From this data, Pay Governance performed regression analyses designed to identify a competitive range for jobs in similar companies by revenue size, and in similar business units or with similar position-specific revenue responsibilities. Pay Governance’s competitive range is based solely on external competitive data and does not take individual performance or internal pay equity into account. The competitive range identified in the Pay Governance report approximates the statistical mean within one standard deviation. As such, the competitive range tends to fall within approximately 15% of either side of the median for base salary, and 20% for target total cash compensation and target direct total compensation. Deviation within this range is usually explained by differences in experience, length of service and/or differences in responsibilities.
For 2022, the Pay Governance report observed that target total direct compensation for all named executive officers, except Mr. Gydé who fell below the competitive range, was within the competitive range. The total compensation for Mr. Gydé was within the competitive range prior to his promotion to CEO in March 2019.
To further assess the Company’s overall compensation practices versus the market, Pay Governance collected pay data for the CFO position from the most recent proxy statements for a number of peer companies selected by the Compensation Committee. The companies selected were ASGN, Inc., Cross Country Healthcare, Inc., EPAM Systems, Inc., Information Services Group, Inc., Kforce, Inc., Mastech Digital, Inc., and Perficient, Inc. Pay Governance selected only the CFO position because all companies are required to report data on this position, and the duties are generally comparable. The results of this comparison indicated that the compensation level for the CFO fell below the 25th percentile of the peer companies.
Upon completion of the report, the Compensation Committee met independently with a representative of Pay Governance to review the document. The Compensation Committee used a separate Pay Governance study, in conjunction with the Company’s overall long-term financial and operating objectives for 2022, to set total compensation for Mr. Gydé, the Company’s CEO. Mr. Gydé did not have a direct role in establishing the terms of his compensation, the details of which for 2022 are discussed below.
The CEO used the Pay Governance Competitive Market Analysis, in conjunction with the Company’s overall long-term financial and operating objectives for 2022, to make compensation recommendations to the Board for each executive officer. It has been the practice of the Board to approve total compensation packages that contain a significant portion of tailored, performance-based incentives within the executive officer’s purview. The executive officers have no direct role in
75
establishing the terms of their compensation. The details of each named executive officer’s total compensation for 2022 are discussed below.
Components of Executive Compensation
The compensation paid to the Company’s executive officers, as reflected in the tables set forth in this annual report on Form 10-K for the year ended December 31, 2022, can be broken down into the following three general categories: (i) Baseline Compensation, (ii) Performance-Based Incentives, and (iii) Equity-Based Incentives.
Baseline Compensation
Baseline Compensation includes annual base salary, standard employee benefits generally available to all employees and participation in certain executive-level employee benefit programs. Once awarded, compensation payments made under this component are provided during the course of the year without regard to achievement of specific performance-based objectives. The Company chooses to pay this component of compensation, as it comprises the foundation of executive compensation. As such, the Company considers maintaining competitive levels of baseline compensation essential to attracting and retaining talented personnel.
Annual Base Salary —In an effort to stay competitive, annual salaries for executive officers (except for Mr. Daelman) are reviewed by the Compensation Committee on a yearly basis. With respect to determining the base salary of executive officers, the Committee takes into consideration the compensation report prepared by Pay Governance, the executive’s individual performance as well as internal equity considerations. Of these factors, the Pay Governance report is generally given the most weight. In addition, if circumstances warrant, such as a change in role or responsibility, the Compensation Committee may grant discretionary bonuses from time to time to executive officers.
Standard Employee Benefits —Executive officers are entitled to participate in the same benefit programs afforded generally to all other employees of the Company. Such benefits generally include a 401(k) program (for U.S. Executives, Pension for European Executives), Medical/Dental/Vision Health Plans, Employee Stock Purchase Plan, Short-Term and Long-Term Disability Plans, and a Flexible Spending Account Plan.
Executive-Level Benefits —In addition to the benefits afforded to employees generally, executive officers are also eligible to participate in or receive the benefit of the following Company sponsored Executive-Level Benefits: Long-Term Executive Disability Plan, Executive Life Insurance Plan, Accidental Death & Dismemberment and Travel Accident Plan, Income Tax Preparation and Advice program, and the Company’s change in control agreements. Mr. Gydé and Mr. Daelman do not have change in control agreements as Belgian law designates the calculation of separation benefits. A summary of these Executive-Level Benefits is provided below:
76
Performance-Based Incentives
Performance-Based Incentives include an annual cash incentive (“Incentive”). Compensation payments provided under this program are conditional upon the accomplishment of specific performance-based goals. The Company chooses to pay this component of compensation because it believes this compensation program is critical to motivating executive officers in a manner that directly affects shareholder value.
Annual Cash Incentive Compensation —Each executive officer’s total annual compensation includes a potential Incentive award. Incentive payments are contingent upon the accomplishment of certain performance-based objectives selected by the Compensation Committee annually. In selecting objectives, the Compensation Committee seeks to individually tailor performance criteria for each executive officer. The amounts of the Incentive, and the formula for calculating actual payments, are regularly reviewed and surveyed in conjunction with the Pay Governance study discussed earlier. In 2022, the Compensation Committee established performance objectives for the executive officers (excluding Mr. Daelman) based on targeted levels of revenue, non-GAAP consolidated operating income and gross margin improvement. To the extent an executive officer has specific operational responsibilities, performance objectives were split between: (i) consolidated revenue, non-GAAP operating income for the entire Company and consolidated gross margin improvement, and (ii) business unit revenue, gross profit and business unit gross margin improvement for that executive officer’s focus of operation. Targets for non-operational executive officers, including the CEO, were based solely on consolidated revenue, non-GAAP operating income for the entire Company and gross margin improvement. In 2022, the planned consolidated revenue, consolidated operating income targets and gross margin improvement for all executive officer incentive plans (excluding Mr. Daelman) were $287,178,000, $16,909,000, and 23.6% (an increase of 1.6% from 2021), respectively. Non-GAAP operating income traditionally excludes severance, and acquisition-related expenses consisting of due diligence costs, amortization of intangible assets, and changes in the value of earn-out payments upon the achievement of certain financial targets from the Company’s recent acquisitions as described further in the Company’s quarterly press releases.
For Mr. Daelman, in 2022, management established performance objectives based on targeted levels of gross profit and line of business profit for the Company's Belgium and United Kingdom operations, and line of business profit and gross margin for all European operations. In 2022, the planned targets were $20,524,784, $12,169,796, $21,304,482, and 24.7%, respectively.
The formula for calculating each executive officer’s Incentive provides that at least 80% of the stipulated plan target (“Threshold”) must be achieved before any remuneration is awarded for that objective. If the Threshold is achieved, the executive officer receives 50% of the designated plan award for that objective. Then, for each additional 1% achieved above the Threshold, up to 100% of the plan target (“Objective Goal”), the executive officer receives another 2.5% of the designated plan award for that objective. For each additional 1% achieved above the Objective Goal, the executive officer receives another 5% of the designated plan award for that objective. Each plan prohibits the receipt of amounts in excess of two hundred percent 200% of the designated plan award for that objective.
The plan award is generally calculated as a percentage of annual base salary. In 2022, the plan awards were:
77
The Compensation Committee believes that each executive officer’s Incentive plan targets for 2022 involved a reasonably challenging degree of difficulty that considers current economic challenges and reflects the Board’s desire to maintain flexibility in enhancing the executive officer’s focus, motivation and enthusiasm. In exceptional circumstances, the Compensation Committee exercises discretion to award Incentive compensation absent achievement of the specified thresholds or to reduce or increase the size of any award or payout. In this manner, the Compensation Committee believes that each executive officer’s Incentive plan targets are reasonably tailored to promote the Company’s overall annual and long-term financial goals.
Equity-Based Incentives
This component of executive compensation consists of grants of restricted stock and stock options under the Company’s 2020 Equity Award Plan. In making such grants, the Compensation Committee considers an executive’s past contributions and expected future contributions towards Company performance. Grants are made to key employees of the Company who, in the opinion of the Compensation Committee, have had and are expected to continue to have a significant impact on the long-term performance of the Company. The awards are designed to reward individuals who remain with the Company and to further align employee interests with those of the Company’s shareholders. The Company chooses to pay this component of compensation because it believes that stock ownership by management is beneficial in aligning management’s activities and decisions with shareholders’ interests of maximizing share value.
Except in circumstances of new or recently promoted executive officers, the Compensation Committee generally grants equity compensation on a set date each year. The Company does not time or plan the release of material non-public information for the purpose of affecting the value of compensation. Equity awards may also be granted at other meetings of the Compensation Committee to individuals who become executive officers, are given increased responsibilities during the year or in recognition of special accomplishments. The Company has adopted stock ownership guidelines for senior executive officers requiring: (i) the CEO to own Company shares valued at five (5) times his or her own base salary, and (ii) the CFO, Executive Vice Presidents, and Senior Vice Presidents with oversight of operating segments, to own Company shares valued at three (3) times his or her own base salary. These requirements are measured five years after an executive begins their role in the senior leadership position.
Restricted Stock Grants During 2022 —The Compensation Committee granted restricted stock awards under the 2020 Equity Award Plan to various executive officers as identified in the tables below. In general, recipients of restricted stock awards receive a specified number of non-transferable restricted shares to be held by the Company, in the name of the grantee, until satisfaction of stipulated vesting requirements. Upon satisfaction of such vesting requirements, restrictions prohibiting transferability will be removed from the vested shares. In determining whether to grant an individual restricted stock, the Compensation Committee considers an executive’s contribution toward Company performance, expected future contribution and the number of options and shares of common stock presently held by the executive. For awards of restricted stock granted in 2022 to the executive officers (excluding Mr. Daelman), the shares vest at the end of a three-year period. If the Company’s cumulative three-year non-GAAP earnings per share for the years 2022, 2023, and 2024 equals or exceeds $2.86, then 100% of the grants will vest. If the combined cumulative three-year non-GAAP earnings per share is 80% or more, but less than 100% of the earnings per share target, a pro-rata portion of the grants shall vest. If at least 80% of the three-year non-GAAP earnings per share target is not met, the grants will expire. Non-GAAP earnings per share traditionally excludes severance, and acquisition-related expenses consisting of due diligence costs, amortization of intangible assets, and changes in the value of earn-out payments upon the achievement of certain financial targets from the Company’s recent acquisitions as described further in the Company’s quarterly press releases.
For awards of restricted stock granted to Mr. Daelman, the shares vest ratably over four years, beginning one year from the date of grant with no performance obligation.
Compensation Committee Report
The Compensation Committee has reviewed and discussed the Compensation Discussion and Analysis required by Item 402(b) of Regulation S-K with management and, based on such review and discussions, the Compensation Committee recommended to the Board that the Compensation Discussion and Analysis be included in this annual report on Form 10-K for the year ended December 31, 2022 and in the Company’s 2022 Proxy Statement.
78
Submitted by the Compensation Committee
Valerie Rahmani, Chair
James R. Helvey III
David H. Klein
Raj Rajgopal
Kathryn A. Stein
Compensation Committee Interlocks and Insider Participation
During the last completed fiscal year, the Compensation Committee was comprised entirely of independent directors. The Compensation Committee of the Board of Directors is composed of Valerie Rahmani, Chair, James R. Helvey III, David H. Klein, Raj Rajgopal, and Kathryn A. Stein. No member of the Compensation Committee is a current or former officer or employee of the Company. During the year ended December 31, 2022, none of our executive officers served as a director or member of the Compensation Committee (or other committee performing similar functions) of another entity when an executive officer of such entity served as a director of the Company or on the Compensation Committee.
2022 SUMMARY COMPENSATION TABLE
|
|
|
|
|
|
|
|
|
|
|
|
|
Non-Equity |
|
|
|
|
|
|
|
||||||
|
|
|
|
|
|
|
Stock |
|
|
Option |
|
|
Incentive Plan |
|
|
All Other |
|
|
|
|
||||||
Name and |
|
|
|
Salary |
|
|
Awards |
|
|
Awards |
|
|
Compensation |
|
|
Compensation |
|
|
Total |
|
||||||
Principal Position |
|
Year |
|
($) (11) |
|
|
($) (1) |
|
|
($) (2) |
|
|
($) (3) |
|
|
($) |
|
|
($) |
|
||||||
Filip J.L. Gydé |
|
|
|
|
|
|
|
|
|
|
|
|
|
|
|
|
|
|
|
|
||||||
|
|
2022 |
|
$ |
626,870 |
|
|
$ |
599,987 |
|
|
$ |
199,999 |
|
|
$ |
639,197 |
|
|
$ |
73,046 |
|
(5) |
$ |
2,139,099 |
|
|
|
|
|
|
|
|
|
|
|
|
|
|
|
|
|
|
|
|
|
|
||||||
President and CEO |
|
2021 |
|
$ |
564,805 |
|
|
$ |
431,247 |
|
|
$ |
143,753 |
|
|
$ |
850,590 |
|
|
$ |
71,392 |
|
(5) |
$ |
2,061,787 |
|
|
|
|
|
|
|
|
|
|
|
|
|
|
|
|
|
|
|
|
|
|
||||||
|
|
2020 |
|
$ |
465,481 |
|
|
$ |
386,198 |
|
|
$ |
128,743 |
|
|
$ |
758,850 |
|
|
$ |
65,742 |
|
(5) |
$ |
1,805,014 |
|
|
|
|
|
|
|
|
|
|
|
|
|
|
|
|
|
|
|
|
|
|
||||||
John M. Laubacker |
|
|
|
|
|
|
|
|
|
|
|
|
|
|
|
|
|
|
|
|
||||||
|
|
2022 |
|
$ |
395,000 |
|
|
$ |
209,988 |
|
|
$ |
69,997 |
|
|
$ |
245,845 |
|
|
$ |
41,254 |
|
(4) (6) |
$ |
962,084 |
|
|
|
|
|
|
|
|
|
|
|
|
|
|
|
|
|
|
|
|
|
|
||||||
EVP, CFO and Treasurer |
|
2021 |
|
$ |
395,000 |
|
|
$ |
191,250 |
|
|
$ |
63,747 |
|
|
$ |
347,632 |
|
|
$ |
34,464 |
|
(4) (6) |
$ |
1,032,093 |
|
|
|
|
|
|
|
|
|
|
|
|
|
|
|
|
|
|
|
|
|
|
||||||
|
|
2020 |
|
$ |
343,462 |
|
|
$ |
187,396 |
|
|
$ |
62,498 |
|
|
$ |
324,169 |
|
|
$ |
41,902 |
|
(4) (6) |
$ |
959,427 |
|
|
|
|
|
|
|
|
|
|
|
|
|
|
|
|
|
|
|
|
|
|
||||||
Thomas J. Niehaus |
|
|
|
|
|
|
|
|
|
|
|
|
|
|
|
|
|
|
|
|
||||||
|
|
2022 |
|
$ |
335,000 |
|
|
$ |
127,498 |
|
|
$ |
42,500 |
|
|
$ |
219,241 |
|
|
$ |
91,055 |
|
(4) (7) |
$ |
815,294 |
|
|
|
|
|
|
|
|
|
|
|
|
|
|
|
|
|
|
|
|
|
|
||||||
EVP and GM, CTG North America |
|
2021 |
|
$ |
335,000 |
|
|
$ |
112,488 |
|
|
$ |
37,499 |
|
|
$ |
415,712 |
|
|
$ |
63,913 |
|
(4) (7) |
$ |
964,612 |
|
|
|
|
|
|
|
|
|
|
|
|
|
|
|
|
|
|
|
|
|
|
||||||
|
|
2020 |
|
$ |
298,269 |
|
|
$ |
201,155 |
|
|
$ |
33,740 |
|
|
$ |
224,856 |
|
|
$ |
70,033 |
|
(4) (7) |
$ |
828,053 |
|
|
|
|
|
|
|
|
|
|
|
|
|
|
|
|
|
|
|
|
|
|
||||||
Peter P. Radetich |
|
|
|
|
|
|
|
|
|
|
|
|
|
|
|
|
|
|
|
|
||||||
|
|
2022 |
|
$ |
300,000 |
|
|
$ |
112,486 |
|
|
$ |
37,498 |
|
|
$ |
201,593 |
|
|
$ |
35,480 |
|
(4) (8) |
$ |
687,057 |
|
|
|
|
|
|
|
|
|
|
|
|
|
|
|
|
|
|
|
|
|
|
||||||
SVP and General Counsel |
|
2021 |
|
$ |
300,000 |
|
|
$ |
112,488 |
|
|
$ |
37,499 |
|
|
$ |
303,253 |
|
|
$ |
31,968 |
|
(4) (8) |
$ |
785,208 |
|
|
|
|
|
|
|
|
|
|
|
|
|
|
|
|
|
|
|
|
|
|
||||||
|
|
2020 |
|
$ |
266,635 |
|
|
$ |
108,662 |
|
|
$ |
36,232 |
|
|
$ |
299,339 |
|
|
$ |
22,073 |
|
(4) (8) |
$ |
732,941 |
|
|
|
|
|
|
|
|
|
|
|
|
|
|
|
|
|
|
|
|
|
|
||||||
Bob Daelman |
|
|
|
|
|
|
|
|
|
|
|
|
|
|
|
|
|
|
|
|
||||||
SVP, Europe (Nov. 15, 2022 to current) |
|
2022 |
|
$ |
296,890 |
|
|
$ |
49,993 |
|
|
$ |
— |
|
|
$ |
130,712 |
|
|
$ |
36,664 |
|
(9) |
$ |
514,259 |
|
VP Belgium and United Kingdom (during 2022 prior to promotion) |
|
|
|
|
|
|
|
|
|
|
|
|
|
|
|
|
|
|
|
|
||||||
|
|
|
|
|
|
|
|
|
|
|
|
|
|
|
|
|
|
|
|
|
||||||
Rénald Wauthier |
|
|
|
|
|
|
|
|
|
|
|
|
|
|
|
|
|
|
|
|
||||||
|
|
2022 |
|
$ |
334,830 |
|
|
$ |
99,536 |
|
|
$ |
33,177 |
|
|
$ |
165,637 |
|
|
$ |
38,660 |
|
(10) |
$ |
671,840 |
|
|
|
|
|
|
|
|
|
|
|
|
|
|
|
|
|
|
|
|
|
|
||||||
SVP, Europe (Apr. 1, 2020 to Nov. 15, 2022) |
|
2021 |
|
$ |
339,766 |
|
|
$ |
98,055 |
|
|
$ |
32,690 |
|
|
$ |
230,671 |
|
|
$ |
42,524 |
|
(10) |
$ |
743,706 |
|
|
|
|
|
|
|
|
|
|
|
|
|
|
|
|
|
|
|
|
|
|
||||||
|
|
2020 |
|
$ |
289,389 |
|
|
$ |
197,333 |
|
|
$ |
28,189 |
|
|
$ |
200,415 |
|
|
$ |
28,048 |
|
(10) |
$ |
743,374 |
|
|
|
|
|
|
|
|
|
|
|
|
|
|
|
|
|
|
|
|
|
|
||||||
79
Specific Executive Officer Compensation Plans and Employment Agreements
Filip J.L. Gydé, CEO. In 2022, Mr. Gydé’s total compensation included annual base salary payments of $626,870, an Incentive of $639,197, grants of 65,788 restricted shares with a value of $599,987 (of which approximately 67% of the grants have a performance condition), and a grant of 63,694 stock options with a value of $199,999. In setting baseline compensation and the performance standards for Mr. Gydé, the Compensation Committee considered the Pay Governance report. The total amount of compensation that Mr. Gydé received was based on a combination of his baseline compensation, and the extent to which the thresholds for compensation were achieved under his performance based incentives. Pursuant to Belgian law, the Company is required to pay Mr. Gydé certain additional benefits that are generally afforded to all Belgian employees. These benefits totaled $73,046 (see the “2022 Summary Compensation Table”).
John M. Laubacker, CFO. In 2022, Mr. Laubacker’s total compensation included annual salary payments of $395,000, an Incentive of $245,845, grants of 23,025 restricted shares with a value of $209,988 (of which approximately 67% of the grants have a performance condition), and a grant of 22,292 stock options with a value of $69,997. In setting baseline compensation and the performance standards for Mr. Laubacker’s compensation, the Compensation Committee considered the Pay Governance report. The total amount of compensation that Mr. Laubacker received was based on a combination of his baseline compensation, and the extent to which the thresholds for compensation were achieved under his performance based incentives. Mr. Laubacker also received additional benefits totaling $41,254 (see the “2022 Summary Compensation Table”).
Thomas J. Niehaus, EVP. In 2022, Mr. Niehaus’ total compensation included annual base salary payments of $335,000, an Incentive of $219,241, grants of 13,980 restricted shares with a value of $127,498 (of which approximately 67% of the grants have a performance condition), and a grant of 13,535 stock options with a value of $42,500. In setting
80
baseline compensation and the performance standards for Mr. Niehaus’ compensation, the Compensation Committee considered the Pay Governance report. The total amount of compensation that Mr. Niehaus received was based on a combination of his baseline compensation, and the extent to which the thresholds for compensation were achieved under his performance-based incentives. Mr. Niehaus also received additional benefits totaling $91,055 (see the “2022 Summary Compensation Table”).
Peter P. Radetich, SVP. In 2022, Mr. Radetich’s total compensation included annual base salary payments of $300,000, an Incentive of $201,593, grants of 12,334 restricted shares with a value of $112,486 (of which approximately 67% of the grants have a performance condition), and a grant of 11,942 stock options with a value of $37,498. In setting baseline compensation and the performance standards for Mr. Radetich’s compensation, the Compensation Committee considered the Pay Governance report and his past performance. The total amount of compensation that Mr. Radetich received was based on a combination of his baseline compensation, and the extent to which the thresholds for compensation were achieved under his performance-based incentives. Mr. Radetich also received additional benefits totaling $35,480 (see the “2022 Summary Compensation Table”).
Bob Daelman, SVP. In 2022, Mr. Daelman’s total compensation included annual base salary payments of $296,890 an Incentive of $130,712, grants of 5,980 restricted shares with a value of $49,993 (of which none of the grants have a performance condition). Pursuant to Belgian law, the Company is required to pay Mr. Daelman certain additional benefits that are generally afforded to all Belgian employees. These benefits totaled $36,664 (see the “2022 Summary Compensation Table”).
Rénald Wauthier, previously SVP. Effective November 15, 2022, Mr. Wauthier resigned from his position as Senior Vice President for the Company's European operations. In accordance with Luxembourg Law, the Company terminated Mr. Wauthier's employment contract with six months' notice period, and agreed to extend the notice period for an additional 17 days through May 31, 2023. Mr. Wauthier was granted an exemption of work for the whole notice period. Mr. Wauthier will receive his full gross monthly salary, including any indexations generally provided to all employees in Luxembourg, a year-end premium equal to one month’s salary, employer’s contribution to the applicable pension plan (for both 2022 and 2023), use of the Company car under the terms and conditions stipulated in the leasing plan through his notice period, payment for accrued but untaken leave as of the date of his resignation, and other benefits normally afforded to employees. In addition to this, Mr. Wauthier was paid a gross legal severance, and will be paid his 2022 Incentive based on actual final results for 2022. Mr. Wauthier remains an employee of the Company through May 31, 2023, and as such will be entitled to any prior granted share units and/or stock options that will vest until this date. Mr. Wauthier also received a settlement amount, and a fixed amount towards the payment of legal fees incurred. In 2022, Mr. Wauthier’s 2022 total compensation included annual base salary payments of $334,830, an Incentive of $165,637, grants of 10,693 restricted shares with a value of $99,536 (of which approximately 67% of the grants have a performance condition), and a grant of 9,448 stock options with a value of $32,690. The total amount of compensation that Mr. Wauthier received was based on a combination of his baseline compensation, and the extent to which the thresholds for compensation were achieved under his performance-based incentives. Mr. Wauthier also received additional benefits totaling $38,660 (see the “2022 Summary Compensation Table”).
CEO to Median Employee Pay Ratio
We believe executive pay must be internally consistent and equitable to motivate our employees to create shareholder value. We are committed to internal pay equity, and the Compensation Committee monitors the relationship between the pay our executive officers receive and the pay our non-managerial employees receive. The compensation for our CEO in 2022 was approximately 40 times the median pay of our employees.
Our CEO to median employee pay ratio is calculated in accordance with the SEC’s rules and regulations under item 402(u) of Regulation S-K. We identified the median employee by examining the 2022 total cash compensation (which includes cash bonuses for all individuals who receive them), excluding our CEO, who were actively employed by us on December 31, 2022, the last day of our fiscal year. We included full-time, part-time, and seasonal employees. For employees that were not located in the US, we converted their total cash compensation from local currencies to US dollars by using the 2022 average currency exchange rates per www.irs.gov (https://www.irs.gov/individuals/international-taxpayers/yearly-average-currency-exchange-rates). We did not make any other assumptions, adjustments, or estimates with respect to the total cash compensation, and we did not annualize the compensation for any employees that were not employed by us for all of 2022. We believe the use of total cash compensation for all employees is a consistently applied compensation measure because we do not widely distribute annual equity awards to employees.
81
After identifying the median employee based on total cash compensation, we calculated the annual total compensation for such employee using the same methodology we use for our named executive officers as set forth in the 2022 Summary Compensation Table in our Proxy Statement.
As illustrated in the table below, our 2022 CEO to median employee pay ratio is 40:1:
|
|
Filip J.L. Gydé, President and CEO |
|
|
Median CTG Employee |
|
||
Salary |
|
$ |
626,870 |
|
|
$ |
52,846 |
|
Overtime Pay |
|
|
— |
|
|
|
— |
|
Stock Awards |
|
|
799,986 |
|
|
|
— |
|
Non-Equity Incentive |
|
|
639,197 |
|
|
|
— |
|
All Other Compensation |
|
|
73,046 |
|
|
|
— |
|
|
|
$ |
2,139,099 |
|
|
$ |
52,846 |
|
|
|
|
|
|
|
|
||
Ratio |
|
|
40.48 |
|
|
|
1.00 |
|
2022 GRANTS OF PLAN-BASED AWARDS
|
|
|
|
|
Estimated Future Payouts |
|
|
Estimated Future Payouts |
|
|
|
|
|
|
|
|
|
|
|
|
|
|||||||||||||||||||||||
|
|
|
|
|
Threshold |
|
|
Target |
|
|
Maximum |
|
|
Threshold |
|
|
Target |
|
|
Maximum |
|
|
All Other Stock Awards: Number of Shares of Stock or Units |
|
|
All Other Option Awards: Number of Securities Underlying Options |
|
|
Exercise or Base Price of Option Awards |
|
|
Grant Date Fair Value of Stock and Option Awards |
|
|||||||||||
Name |
|
Grant Date |
|
|
($) (1) |
|
|
($) (2) |
|
|
($) (3) |
|
|
(#) (4) |
|
|
(#) (5) |
|
|
(#) (5) |
|
|
# |
|
|
# |
|
|
($/sh) |
|
|
($) (6) |
|
|||||||||||
Filip J.L. Gydé |
|
|
— |
|
|
$ |
325,000 |
|
|
$ |
650,000 |
|
|
$ |
1,300,000 |
|
|
|
— |
|
|
|
— |
|
|
|
— |
|
|
|
— |
|
|
|
— |
|
|
|
— |
|
|
|
— |
|
|
|
3/18/2022 |
|
|
|
— |
|
|
|
— |
|
|
|
— |
|
|
|
21,930 |
|
|
|
43,859 |
|
|
|
43,859 |
|
|
|
— |
|
|
|
— |
|
|
|
— |
|
|
$ |
400,000 |
|
|
|
|
3/18/2022 |
|
|
|
— |
|
|
|
— |
|
|
|
— |
|
|
|
— |
|
|
|
— |
|
|
|
— |
|
|
|
21,929 |
|
|
|
— |
|
|
|
— |
|
|
$ |
200,000 |
|
|
|
|
3/18/2022 |
|
|
|
— |
|
|
|
— |
|
|
|
— |
|
|
|
— |
|
|
|
— |
|
|
|
— |
|
|
|
— |
|
|
|
63,694 |
|
|
$ |
9.12 |
|
|
$ |
200,000 |
|
|
John M. Laubacker |
|
|
— |
|
|
$ |
125,000 |
|
|
$ |
250,000 |
|
|
$ |
500,000 |
|
|
|
— |
|
|
|
— |
|
|
|
— |
|
|
|
— |
|
|
|
— |
|
|
|
— |
|
|
|
— |
|
|
|
3/18/2022 |
|
|
|
— |
|
|
|
— |
|
|
|
— |
|
|
|
7,675 |
|
|
|
13,530 |
|
|
|
13,530 |
|
|
|
— |
|
|
|
— |
|
|
|
— |
|
|
$ |
140,000 |
|
|
|
|
3/18/2022 |
|
|
|
— |
|
|
|
— |
|
|
|
— |
|
|
|
— |
|
|
|
— |
|
|
|
— |
|
|
|
7,675 |
|
|
|
— |
|
|
|
— |
|
|
$ |
70,000 |
|
|
|
|
3/18/2022 |
|
|
|
— |
|
|
|
— |
|
|
|
— |
|
|
|
— |
|
|
|
— |
|
|
|
— |
|
|
|
— |
|
|
|
22,292 |
|
|
$ |
9.12 |
|
|
$ |
70,000 |
|
|
Thomas J. Niehaus |
|
|
— |
|
|
$ |
112,500 |
|
|
$ |
225,000 |
|
|
$ |
450,000 |
|
|
|
— |
|
|
|
— |
|
|
|
— |
|
|
|
— |
|
|
|
— |
|
|
|
— |
|
|
|
— |
|
|
|
3/18/2022 |
|
|
|
— |
|
|
|
— |
|
|
|
— |
|
|
|
4,660 |
|
|
|
9,320 |
|
|
|
9,320 |
|
|
|
— |
|
|
|
— |
|
|
|
— |
|
|
$ |
85,000 |
|
|
|
|
3/18/2022 |
|
|
|
— |
|
|
|
— |
|
|
|
— |
|
|
|
— |
|
|
|
— |
|
|
|
— |
|
|
|
4,660 |
|
|
|
— |
|
|
|
— |
|
|
$ |
42,500 |
|
|
|
|
3/18/2022 |
|
|
|
— |
|
|
|
— |
|
|
|
— |
|
|
|
— |
|
|
|
— |
|
|
|
— |
|
|
|
— |
|
|
|
13,535 |
|
|
$ |
9.12 |
|
|
$ |
42,500 |
|
|
Peter P. Radetich |
|
|
— |
|
|
$ |
102,500 |
|
|
$ |
205,000 |
|
|
$ |
410,000 |
|
|
|
— |
|
|
|
— |
|
|
|
— |
|
|
|
— |
|
|
|
— |
|
|
|
— |
|
|
|
— |
|
|
|
3/18/2022 |
|
|
|
— |
|
|
|
— |
|
|
|
— |
|
|
|
4,112 |
|
|
|
8,223 |
|
|
|
8,223 |
|
|
|
— |
|
|
|
— |
|
|
|
— |
|
|
$ |
75,000 |
|
|
|
|
3/18/2022 |
|
|
|
— |
|
|
|
— |
|
|
|
— |
|
|
|
— |
|
|
|
— |
|
|
|
— |
|
|
|
4,111 |
|
|
|
— |
|
|
|
— |
|
|
$ |
37,500 |
|
|
|
|
3/18/2022 |
|
|
|
— |
|
|
|
— |
|
|
|
— |
|
|
|
— |
|
|
|
— |
|
|
|
— |
|
|
|
— |
|
|
|
11,942 |
|
|
$ |
9.12 |
|
|
$ |
37,500 |
|
|
Rénald Wauthier |
|
|
— |
|
|
$ |
— |
|
|
$ |
— |
|
|
$ |
— |
|
|
|
— |
|
|
|
— |
|
|
|
— |
|
|
|
— |
|
|
|
— |
|
|
|
— |
|
|
|
— |
|
|
|
3/18/2022 |
|
|
|
— |
|
|
|
— |
|
|
|
— |
|
|
|
3,638 |
|
|
|
7,276 |
|
|
|
7,276 |
|
|
|
— |
|
|
|
— |
|
|
|
— |
|
|
$ |
66,357 |
|
|
|
|
3/18/2022 |
|
|
|
— |
|
|
|
— |
|
|
|
— |
|
|
|
— |
|
|
|
— |
|
|
|
— |
|
|
|
3,638 |
|
|
|
— |
|
|
|
— |
|
|
$ |
33,179 |
|
|
|
|
3/18/2022 |
|
|
|
— |
|
|
|
— |
|
|
|
— |
|
|
|
— |
|
|
|
— |
|
|
|
— |
|
|
|
— |
|
|
|
10,566 |
|
|
$ |
9.12 |
|
|
$ |
33,179 |
|
|
Bob Daelman |
|
|
— |
|
|
$ |
68,483 |
|
|
$ |
136,966 |
|
|
$ |
273,932 |
|
|
|
— |
|
|
|
— |
|
|
|
— |
|
|
|
— |
|
|
|
— |
|
|
|
— |
|
|
|
— |
|
|
|
5/20/2022 |
|
|
|
— |
|
|
|
— |
|
|
|
— |
|
|
|
— |
|
|
|
— |
|
|
|
— |
|
|
|
5,980 |
|
|
|
— |
|
|
|
— |
|
|
$ |
50,000 |
|
|
calculations is provided under the sections entitled “Components of Executive Compensation,” and “Performance-Based Incentives” contained herein.
accordance with FASB ASC Topic 718. The assumptions used in the calculation of these amounts are included in footnote 10 to the Company’s audited financial
statements, which are included in the Annual Report under Item 8, “Financial Statements and Supplementary Data.”
Grants of Plan-Based Awards
Each of the Non-Equity Incentive Plan Awards represented in the table above were Incentive awards granted to the named executive officers during 2022. Such Incentive awards are described earlier in this report under the heading “Performance-Based Incentives.” The formula for calculating each executive officer’s Incentive provides that at least 80% of the stipulated plan target (“Threshold”) must be achieved before any remuneration is awarded for that objective. If the Threshold is achieved, the executive officer receives 50% of the designated plan award for that objective. Then, for each 1% point achieved above the Threshold, up to 100% of the plan target (“Objective Goal”), the executive officer receives another 2.5% of the designated plan award for that objective. For each 1% point achieved above the Objective Goal, the executive officer receives another 5% of the designated plan award for that objective. Each plan prohibits the receipt of amounts in excess of 200% of the designated plan award for that objective.
82
Pursuant to Company policies, an Incentive is only earned by and payable to an individual who remains in the Company’s employ on the date of Incentive distribution. Incentive payments for 2022 were made on February 24, 2023.
Each of the equity awards represented in the table above were granted pursuant to the 2020 Equity Award Plan. The restricted stock awards represented in the table above were granted by the Board to the named executive officers on March 18, 2022 (except for Mr. Daelman) and certain of those grants include a performance condition. For the performance awards of restricted stock granted in 2022 to the executive officers, the shares vest at the end of a three-year period. If the Company’s cumulative three-year non-GAAP earnings per share for the years 2022, 2023, and 2024 equals or exceeds $2.86, then 100% of the grants will vest. If the combined cumulative three-year non-GAAP earnings per share is 80% or more, but less than 100% of the earnings per share target, a pro-rata portion of the grants shall vest. If at least 80% of the three-year non-GAAP earnings per share target is not met, the grants will expire. For the remaining restricted stock awards that were granted to the named executive officers, those awards vest ratably over three years, beginning one year from the date of grant.
For Mr. Daelman, the restricted stock awards represented in the table above were granted by management on May 20, 2022 and none of those grants include a performance condition. The shares for Mr. Daelman vest ratably over four years, beginning one year from the date of grant.
For the stock option awards that were granted to the named executive officers, these options are non-qualified stock options with a grant price of $9.12 per option, vest ratably over three years, and expire 10 years from the date of grant.
Recipients of restricted stock awards and stock option awards were required to enter into agreements with the Company governing the vesting, exercise and/or transferability (as applicable) of such awards. Vesting requirements for time-based restricted stock awards are based solely on continued employment.
83
2022 OUTSTANDING EQUITY AWARDS AT FISCAL YEAR-END
|
|
Option Awards |
|
|
Stock Awards |
|
||||||||||||||||||||||||||||||
Name/Grant Date |
|
Number of Securities Underlying Unexercised Options Exercisable (#) |
|
|
Number of Securities Underlying Unexercised Options Unexercisable (#) |
|
|
Equity Incentive Plan Awards: Number of Securities Underlying Unexercised Unearned Options (#) |
|
|
Option Exercise Price ($) |
|
|
Option Expiration Date |
|
|
Number of Shares or Units of Stock That Have Not Vested (#) |
|
|
Market Value of Shares or Units of Stock That Have Not Vested ($) |
|
|
Equity Incentive Plan Awards: Number of Unearned Shares, Units or Other Rights That Have Not Vested (#) |
|
|
Equity Incentive Plan Awards: Market or Payout Value of Unearned Shares, Units or Other Rights That Have Not Vested ($) |
|
|||||||||
Filip J.L. Gydé |
|
|
|
|
|
|
|
|
|
|
|
|
|
|
|
|
|
|
|
|
|
|
|
|
|
|
|
|||||||||
2/12/2013 |
|
|
9,000 |
|
|
|
— |
|
|
|
— |
|
|
$ |
20.68 |
|
|
2/12/2023 |
|
|
|
— |
|
|
|
— |
|
|
|
— |
|
|
|
— |
|
|
2/19/2014 |
|
|
9,000 |
|
|
|
— |
|
|
|
— |
|
|
$ |
16.93 |
|
|
2/19/2024 |
|
|
|
— |
|
|
|
— |
|
|
|
— |
|
|
|
— |
|
|
11/10/2015 |
|
|
13,600 |
|
|
|
— |
|
|
|
— |
|
|
$ |
7.48 |
|
|
11/10/2025 |
|
|
|
— |
|
|
|
— |
|
|
|
— |
|
|
|
— |
|
|
3/6/2020 |
|
|
43,753 |
|
|
|
21,877 |
|
(1) |
|
— |
|
|
$ |
5.88 |
|
|
3/6/2030 |
|
|
|
— |
|
|
|
— |
|
|
|
— |
|
|
|
— |
|
|
3/24/2021 |
|
|
13,850 |
|
|
|
27,697 |
|
(2) |
|
— |
|
|
$ |
9.17 |
|
|
3/24/2031 |
|
|
|
— |
|
|
|
— |
|
|
|
— |
|
|
|
— |
|
|
3/18/2022 |
|
|
— |
|
|
|
63,694 |
|
(3) |
|
— |
|
|
$ |
9.12 |
|
|
3/18/2032 |
|
|
|
— |
|
|
|
— |
|
|
|
— |
|
|
|
— |
|
|
|
|
|
— |
|
|
|
— |
|
|
|
— |
|
|
|
— |
|
|
|
— |
|
|
|
158,677 |
|
(16) |
$ |
1,199,598 |
|
|
|
— |
|
|
|
— |
|
|
|
|
|
|
|
|
|
|
|
|
|
|
|
|
|
|
|
|
|
|
|
|
|
|
|
|
|
|||||||||
John M. Laubacker |
|
|
|
|
|
|
|
|
|
|
|
|
|
|
|
|
|
|
|
|
|
|
|
|
|
|
|
|||||||||
2/12/2013 |
|
|
7,000 |
|
|
|
— |
|
|
|
— |
|
|
$ |
20.68 |
|
|
2/12/2023 |
|
|
|
— |
|
|
|
— |
|
|
|
— |
|
|
|
— |
|
|
2/19/2014 |
|
|
7,000 |
|
|
|
— |
|
|
|
— |
|
|
$ |
16.93 |
|
|
2/19/2024 |
|
|
|
— |
|
|
|
— |
|
|
|
— |
|
|
|
— |
|
|
11/10/2015 |
|
|
10,400 |
|
|
|
— |
|
|
|
— |
|
|
$ |
7.48 |
|
|
11/10/2025 |
|
|
|
— |
|
|
|
— |
|
|
|
— |
|
|
|
— |
|
|
5/15/2017 |
|
|
24,900 |
|
|
|
— |
|
|
|
— |
|
|
$ |
5.75 |
|
|
5/15/2027 |
|
|
|
— |
|
|
|
— |
|
|
|
— |
|
|
|
— |
|
|
3/6/2020 |
|
|
21,240 |
|
|
|
10,620 |
|
(4) |
|
— |
|
|
$ |
5.88 |
|
|
3/6/2030 |
|
|
|
— |
|
|
|
— |
|
|
|
— |
|
|
|
— |
|
|
3/24/2021 |
|
|
6,142 |
|
|
|
12,282 |
|
(5) |
|
— |
|
|
$ |
9.17 |
|
|
3/24/2031 |
|
|
|
— |
|
|
|
— |
|
|
|
— |
|
|
|
— |
|
|
3/18/2022 |
|
|
— |
|
|
|
22,292 |
|
(6) |
|
— |
|
|
$ |
9.12 |
|
|
3/18/2032 |
|
|
|
— |
|
|
|
— |
|
|
|
— |
|
|
|
— |
|
|
|
|
|
— |
|
|
|
— |
|
|
|
— |
|
|
|
— |
|
|
|
— |
|
|
|
66,353 |
|
(17) |
$ |
501,629 |
|
|
|
— |
|
|
|
— |
|
|
|
|
|
|
|
|
|
|
|
|
|
|
|
|
|
|
|
|
|
|
|
|
|
|
|
|
|
|||||||||
Thomas J. Niehaus |
|
|
|
|
|
|
|
|
|
|
|
|
|
|
|
|
|
|
|
|
|
|
|
|
|
|
|
|||||||||
5/31/2019 |
|
|
26,500 |
|
|
|
— |
|
|
|
— |
|
|
$ |
— |
|
|
5/31/2029 |
|
|
|
— |
|
|
|
— |
|
|
|
— |
|
|
|
— |
|
|
3/6/2020 |
|
|
11,467 |
|
|
|
5,733 |
|
(7) |
|
— |
|
|
$ |
— |
|
|
3/6/2030 |
|
|
|
— |
|
|
|
— |
|
|
|
— |
|
|
|
— |
|
|
3/24/2021 |
|
|
3,613 |
|
|
|
7,225 |
|
(8) |
|
— |
|
|
$ |
— |
|
|
3/24/2031 |
|
|
|
— |
|
|
|
— |
|
|
|
— |
|
|
|
— |
|
|
3/18/2022 |
|
|
— |
|
|
|
13,535 |
|
(9) |
|
— |
|
|
$ |
— |
|
|
3/18/2032 |
|
|
|
— |
|
|
|
— |
|
|
|
— |
|
|
|
— |
|
|
|
|
|
— |
|
|
|
— |
|
|
|
— |
|
|
|
— |
|
|
|
— |
|
|
|
43,934 |
|
(18) |
$ |
332,141 |
|
|
|
— |
|
|
|
— |
|
|
|
|
|
|
|
|
|
|
|
|
|
|
|
|
|
|
|
|
|
|
|
|
|
|
|
|
|
|||||||||
Peter P. Radetich |
|
|
|
|
|
|
|
|
|
|
|
|
|
|
|
|
|
|
|
|
|
|
|
|
|
|
|
|||||||||
2/12/2013 |
|
|
9,000 |
|
|
|
— |
|
|
|
— |
|
|
$ |
20.68 |
|
|
2/12/2023 |
|
|
|
— |
|
|
|
— |
|
|
|
— |
|
|
|
— |
|
|
2/19/2014 |
|
|
9,000 |
|
|
|
— |
|
|
|
— |
|
|
$ |
16.93 |
|
|
2/19/2024 |
|
|
|
— |
|
|
|
— |
|
|
|
— |
|
|
|
— |
|
|
11/10/2015 |
|
|
14,500 |
|
|
|
— |
|
|
|
— |
|
|
$ |
7.48 |
|
|
11/10/2025 |
|
|
|
— |
|
|
|
— |
|
|
|
— |
|
|
|
— |
|
|
3/6/2020 |
|
|
12,313 |
|
|
|
6,157 |
|
(10) |
|
— |
|
|
$ |
5.88 |
|
|
3/6/2030 |
|
|
|
— |
|
|
|
— |
|
|
|
— |
|
|
|
— |
|
|
3/24/2021 |
|
|
3,613 |
|
|
|
7,225 |
|
(11) |
|
— |
|
|
$ |
9.17 |
|
|
3/24/2031 |
|
|
|
— |
|
|
|
— |
|
|
|
— |
|
|
|
— |
|
|
3/18/2022 |
|
|
— |
|
|
|
11,942 |
|
(12) |
|
— |
|
|
$ |
9.12 |
|
|
3/18/2032 |
|
|
|
— |
|
|
|
— |
|
|
|
— |
|
|
|
— |
|
|
|
|
|
— |
|
|
|
— |
|
|
|
— |
|
|
|
— |
|
|
|
— |
|
|
|
37,611 |
|
(19) |
$ |
284,339 |
|
|
|
— |
|
|
|
— |
|
|
|
|
|
|
|
|
|
|
|
|
|
|
|
|
|
|
|
|
|
|
|
|
|
|
|
|
|
|||||||||
Rénald Wauthier |
|
|
|
|
|
|
|
|
|
|
|
|
|
|
|
|
|
|
|
|
|
|
|
|
|
|
|
|||||||||
3/6/2020 |
|
|
9,580 |
|
|
|
4,790 |
|
(13) |
|
— |
|
|
$ |
— |
|
|
3/6/2030 |
|
|
|
— |
|
|
|
— |
|
|
|
— |
|
|
|
— |
|
|
3/24/2021 |
|
|
3,150 |
|
|
|
6,298 |
|
(14) |
|
— |
|
|
$ |
— |
|
|
3/24/2031 |
|
|
|
— |
|
|
|
— |
|
|
|
— |
|
|
|
— |
|
|
3/18/2022 |
|
|
— |
|
|
|
10,566 |
|
(15) |
|
— |
|
|
$ |
— |
|
|
3/18/2032 |
|
|
|
— |
|
|
|
— |
|
|
|
— |
|
|
|
— |
|
|
|
|
|
— |
|
|
|
— |
|
|
|
— |
|
|
|
— |
|
|
|
— |
|
|
|
42,449 |
|
(20) |
$ |
320,914 |
|
|
|
— |
|
|
|
— |
|
|
|
|
|
|
|
|
|
|
|
|
|
|
|
|
|
|
|
|
|
|
|
|
|
|
|
|
|
|||||||||
Bob Daelman |
|
|
|
|
|
|
|
|
|
|
|
|
|
|
|
|
|
|
|
|
|
|
|
|
|
|
|
|||||||||
|
|
|
— |
|
|
|
— |
|
|
|
— |
|
|
$ |
— |
|
|
|
|
|
|
18,353 |
|
(21) |
|
138,749 |
|
|
|
— |
|
|
|
— |
|
|
84
2022 OPTION EXERCISES AND STOCK VESTED
The following table provides information for each of the Company’s named executive officers regarding stock option exercises and vesting of stock awards during 2022.
|
|
Option Awards |
|
|
Stock Awards |
|
||||||||||
Name of Executive Officer |
|
Number of Shares Acquired on Exercise (#) (1) |
|
|
Value Realized on Exercise ($) |
|
|
Number of Shares Acquired on Vesting (#) (1) |
|
|
Value Realized on Vesting ($) |
|
||||
Filip J.L. Gydé |
|
|
— |
|
|
$ |
— |
|
|
|
103,799 |
|
|
$ |
947,860 |
|
John M. Laubacker |
|
|
— |
|
|
$ |
— |
|
|
|
48,454 |
|
|
$ |
442,432 |
|
Thomas J. Niehaus |
|
|
— |
|
|
$ |
— |
|
|
|
25,301 |
|
|
$ |
230,174 |
|
Peter P. Radetich |
|
|
— |
|
|
$ |
— |
|
|
|
32,827 |
|
|
$ |
299,696 |
|
Rénald Wauthier |
|
|
— |
|
|
$ |
— |
|
|
|
16,128 |
|
|
$ |
147,021 |
|
Bob Daelman |
|
|
— |
|
|
$ |
— |
|
|
|
7,632 |
|
|
$ |
67,281 |
|
Pension Benefits
The Company maintains an Executive Supplemental Benefit Plan (Supplemental Plan) which provides certain former executives with deferred compensation benefits. The Supplemental Plan was amended as of December 1, 1994 in order to freeze the then-current benefits, provide no additional benefit accruals for participants and to admit no new participants. None of the named executive officers participates in the Supplemental Plan.
Generally, the Supplemental Plan provides for retirement benefits of up to 50% of a participating employee’s base compensation at termination or as of December 1, 1994, whichever is earlier, and pre-retirement death benefits calculated using the same formula that is used to calculate normal and early retirement benefits. Benefits are based on service credits earned each year of employment prior to and subsequent to admission to the Supplemental Plan through December 1, 1994. Retirement benefits and pre-retirement death benefits are paid during the 180 months following retirement or death, respectively, while disability benefits are paid until normal retirement age. Normal retirement is age 60. For any participant who is also a participant in the Deferred Compensation Plan, the normal retirement age was increased to 65.
2022 NONQUALIFIED DEFERRED COMPENSATION
Name of Executive Officer |
|
Executive Contributions in Last FY ($) (1) |
|
|
Registrant Contributions in Last FY ($) |
|
|
Aggregate Earnings in Last FY ($) |
|
|
Aggregate Withdrawals / Distributions ($) |
|
|
Aggregate Balance at Last FYE ($) |
|
|||||
Filip J.L. Gydé |
|
|
— |
|
|
|
— |
|
|
$ |
— |
|
|
|
— |
|
|
$ |
— |
|
John M. Laubacker |
|
|
— |
|
|
|
— |
|
|
$ |
(53,053 |
) |
|
|
— |
|
|
$ |
174,533 |
|
Thomas J. Niehaus |
|
|
— |
|
|
|
75,071 |
|
|
$ |
(12,889 |
) |
|
|
— |
|
|
$ |
104,130 |
|
Peter P. Radetich |
|
|
— |
|
|
|
— |
|
|
$ |
(117,649 |
) |
|
|
— |
|
|
$ |
386,751 |
|
Rénald Wauthier |
|
|
— |
|
|
|
— |
|
|
$ |
— |
|
|
|
— |
|
|
$ |
— |
|
Bob Daelman |
|
|
— |
|
|
|
— |
|
|
$ |
— |
|
|
|
— |
|
|
$ |
— |
|
On February 2, 1995, the Compensation Committee approved the creation of a Nonqualified Key Employee Deferred Compensation Plan (“Deferred Compensation Plan”). The Deferred Compensation Plan is a successor plan to the Supplemental Plan. Participants in the Deferred Compensation Plan are eligible to elect to defer a percentage of their annual cash compensation. Prior to 2017, participants were eligible to receive a Company contribution of a percentage of their base compensation and annual Incentive if the Company attained annual defined performance objectives for the year. These performance objectives were on an annual basis for the upcoming year. The contribution to the Deferred Compensation Plan by the Company was discontinued during 2017.
Plan participants have a 100% non-forfeitable right to the value of their corporate contribution account after the fifth anniversary of employment with the Company. If a participant terminates employment due to death, disability, retirement at age 65, or upon the occurrence of a Change in Control Event (as defined in the Deferred Compensation Plan), the participant or his or her estate will be entitled to receive the benefits accrued for the participant as of the date of such event. The Company contributions will be forfeited in the event a participant incurs a separation from service for cause. Participants are 100% vested in their own contributions. All amounts in the Deferred Compensation Plan, including elective deferrals, are held as general assets of the Company and are subject to the claims of creditors of the Company.
85
Potential Payments upon Termination or Change in Control
Agreement with Mr. Gydé—Employment Agreement. Effective as of March 1, 2019 the Company and Mr. Gydé entered into an employment agreement that provides that each party may terminate the employment agreement in accordance with the provisions of the Belgian law of July 3, 1978 relating to employment contracts. Any termination indemnities that may be due and owing to Mr. Gydé will take into account the co-employment between the Company and the Company’s Belgian subsidiary and will be done according to the transitional provisions as included in the articles 67, 68 and 69 of the Belgian Law of December 26, 2013 regarding the introduction of a unified statute, with the period May 1, 1987 until December 31, 2013 fully to be taken into account and severance payments to be calculated under the scheme of article 68 of said legislation. Prior to his appointment as Chief Executive Officer in March 2019, Mr. Gydé had not entered into an employment agreement with the Company itself since Belgian law mandates certain separation benefits.
Under Belgian law, Mr. Gydé is entitled to notice prior to a termination of his employment by the Company, expressed as a period of months for service prior to January 1, 2014 plus a period of weeks for service after January 1, 2014. As of December 31, 2022, Mr. Gydé would have been entitled to 27 months plus 27 weeks of notice. Alternatively, in lieu of providing notice, the Company may elect to pay a termination indemnity to Mr. Gydé. The amount of the termination indemnity is determined pursuant to Belgian law and is based on the duration of Mr. Gydé’s employment with the Company and the amount of his gross annual compensation package. If Mr. Gydé’s employment with the Company and the Company’s Belgian subsidiary had been terminated without notice on December 31, 2022, Mr. Gydé would have been entitled to a termination indemnity totaling $3,613,916. In the event of a termination of Mr. Gydé’s employment, his equity awards would be subject to the terms of the 2020 and 2010 Equity Award Plans.
Agreement with Mr. Gydé—Change in Control. In connection with his promotion to Chief Executive Officer, Mr. Gydé’s stock option and restricted stock awards granted under the Company’s 2020 and 2010 Equity Award Plans were amended pursuant to a letter agreement in May 2019 (the “Letter Agreement”) to provide for immediate vesting in the event his employment is terminated for any reason other than Cause, death or Disability within 6 months before or 24 months after a change in control. Mr. Gydé does not otherwise have a change in control agreement.
Pursuant to the Letter Agreement, upon a termination of his employment for any reason other than Cause, death or Disability within 6 months before or 24 months after a change in control, Mr. Gydé would have immediately become fully vested in any stock option or restricted stock awards previously granted. These awards are more fully described in the table entitled “Outstanding Equity Awards at Fiscal Year-end.” If the stock price of the Company was $7.56, which was the closing price of the stock on December 31, 2022, then Mr. Gydé could potentially have realized gains, before tax, from the sale of vested securities in the following amounts:
|
|
|
|
|
|
|
|
|
Name of Executive Officer |
|
Restricted Stock |
|
|
Stock Options |
|
||
Filip J.L. Gydé |
|
$ |
1,199,598 |
|
|
$ |
111,346 |
|
In addition, pursuant to the Letter Agreement, in the event of a change in control, Mr. Gydé’s stock-based award with performance-based vesting conditions would, immediately prior to the change in control, be deemed to have satisfied the performance-based vesting conditions at the greater of the target level or the pro rata portion of the level of achievement of the performance goals that the Compensation Committee determines he likely would have received for the performance period during which his employment was terminated, had his employment not terminated. Such performance-based equity awards would then vest, unless sooner accelerated, monthly in equal installments over the remaining performance period (a “Modified Award”), and the Board would cause any successor to assume the Modified Awards.
With respect to any stock-based award with performance-based vesting conditions, in the event of a change in control in which the Company’s common stock ceases to be listed on the New York Stock Exchange or the NASDAQ Global Select Market or the Company’s common stock is converted into any consideration other than shares of common stock listed on the New York Stock Exchange or the NASDAQ Global Select Market, then immediately prior to such change in control, the Board in its reasonable discretion must take one of the following actions:
86
Because Mr. Gydé does not have a change in control agreement and Belgian law does not provide for payments upon a change in control, so long as his compensation, duties and responsibilities are not reduced as a result of a change in control, a change in control alone would not trigger any payments to Mr. Gydé, other than with respect to his equity awards, as described above. If Mr. Gydé’s employment were terminated or constructively terminated in connection with a change in control, however, he would be entitled to notice or the termination indemnity described in the section entitled “Agreement with Mr. Gydé—Employment Agreement.”
Agreements with Mr. Laubacker. Mr. Laubacker has an employment agreement affording severance benefits upon termination. Pursuant to the terms of such agreement, in the event of termination by Mr. Laubacker for Good Reason (as that term is defined in the agreement), or by the Company other than for Cause (as that term is defined in the agreement), Mr. Laubacker would receive a lump-sum cash payment equal to his current base salary plus an amount equal to the average annual Incentive paid to Mr. Laubacker during the most recent three-year period. Mr. Laubacker would also continue to receive medical and dental benefits for a period of twelve (12) months. Had Mr. Laubacker’s employment been terminated on December 31, 2022, he would have been eligible to receive an initial lump-sum cash payment equal to $700,882. Mr. Laubacker would also receive, for a period of twelve months, continuing medical and dental coverage under any plans he participates in as of the effective date of such termination. The value of continued medical and dental benefits would likely total approximately $10,693.
Agreement with Mr. Daelman—Employment Agreement. Any termination indemnities that may be due and owing to Mr. Daelman will be done according to the transitional provisions as included in the articles 67, 68 and 69 of the Belgian Law of December 26, 2013 regarding the introduction of a unified statute, with the period October 16, 2001 until December 31, 2013 fully to be taken into account and severance payments to be calculated under the scheme of article 68 of said legislation. Prior to his appointment as Executive Vice President November 15, 2022, Mr. Daelman had not entered into an employment agreement with the Company itself since Belgian law mandates certain separation benefits.
Under Belgian law, Mr. Daelman is entitled to notice prior to a termination of his employment by the Company, expressed as a period of months for service prior to January 1, 2014 plus a period of weeks for service after January 1, 2014. As of December 31, 2022, Mr. Daelman would have been entitled to 13 months plus 27 weeks of notice. Alternatively, in lieu of providing notice, the Company may elect to pay a termination indemnity to Mr. Daelman. The amount of the termination indemnity is determined pursuant to Belgian law and is based on the duration of Mr. Daelman’s employment with the Company and the amount of his gross annual compensation package. If Mr. Daelman’s employment with the Company’s Belgian subsidiary had been terminated without notice on December 31, 2022, Mr. Daelman would have been entitled to a termination indemnity totaling $744,017. In the event of a termination of Mr. Daelman’s employment, his equity awards would be subject to the terms of the 2020 and 2010 Equity Award Plans.
Because Mr. Daelman does not have a change in control agreement and Belgian law does not provide for payments upon a change in control, so long as his compensation, duties and responsibilities are not reduced as a result of a change in control, a change in control alone would not trigger any payments to Mr. Daelman. If Mr. Daelman’s employment were terminated or constructively terminated in connection with a change in control, however, he would be entitled to notice or the termination indemnity described in this section.
Agreements with Other Executive Officers. Each of the other named executive officers, except Mr. Gydé and Mr. Daelman, have entered into a change in control agreement with the Company. All executive officers Change in Control agreements contain double trigger mechanisms.
If a change in control occurred on December 31, 2022, then each of the named executive officers (excluding Mr. Gydé and Mr. Daelman) would have immediately become fully vested in any stock option or restricted stock awards previously granted. These awards are more fully described in the table entitled “Outstanding Equity Awards at Fiscal Year-end.” If the stock price of the Company was $7.56, which was the closing price of the stock on December 31, 2022, then the named executive officers could potentially have realized gains, before tax, from the sale of vested securities in the following amounts:
87
Name of Executive Officer |
|
Restricted Stock |
|
|
Stock Options |
|
||
John M. Laubacker |
|
$ |
501,629 |
|
|
$ |
99,426 |
|
Thomas J. Niehaus |
|
$ |
332,141 |
|
|
$ |
117,936 |
|
Peter P. Radetich |
|
$ |
284,339 |
|
|
$ |
32,190 |
|
Rénald Wauthier |
|
$ |
320,914 |
|
|
$ |
24,142 |
|
Bob Daelman |
|
$ |
138,749 |
|
|
$ |
— |
|
Had the above mentioned executive officers’ employment been terminated without cause by the Company or by themselves with good reason within 6 months prior to or 24 months following such a change in control, they would also have been entitled to receive, by the tenth day following their termination, lump-sum cash payments from the Company in the following amounts:
These payments equal two (2) times the sum of each individual’s current annual salary, which as of December 31, 2022 were $395,000 for Mr. Laubacker, $335,000 for Mr. Niehaus, $300,000 for Mr. Radetich, and $334,829 for Mr. Wauthier. It also includes two (2) times their average annual Incentive payment from the last three years and an amount equal to 25% of each individual’s current base salary and the highest annual Incentive payment from the last three years. This amount is intended to cover fringe benefits such as 401(k), health, medical, dental, disability and similar benefits for a period of twenty-four months.
2022 DIRECTOR COMPENSATION
Name of Director |
|
Fees Earned or Paid in Cash ($) |
|
|
Stock Awards ($) |
|
|
Option Awards ($) |
|
|
Non-Equity Incentive Plan Compensation ($) |
|
|
Change in Pension Value and Nonqualified Deferred Compensation Earnings ($) |
|
|
All Other Compensation ($) |
|
|
Total ($) |
|
|||||||
James R. Helvey III |
|
$ |
175,000 |
|
|
$ |
90,000 |
|
|
$ |
— |
|
|
$ |
— |
|
|
$ |
— |
|
|
$ |
— |
|
|
$ |
265,000 |
|
David H. Klein |
|
$ |
70,000 |
|
|
$ |
90,000 |
|
|
$ |
— |
|
|
$ |
— |
|
|
$ |
— |
|
|
$ |
— |
|
|
$ |
160,000 |
|
Valerie Rahmani |
|
$ |
70,000 |
|
|
$ |
90,000 |
|
|
$ |
— |
|
|
$ |
— |
|
|
$ |
— |
|
|
$ |
— |
|
|
$ |
160,000 |
|
Raj Rajgopal |
|
$ |
60,000 |
|
|
$ |
90,000 |
|
|
$ |
— |
|
|
$ |
— |
|
|
$ |
— |
|
|
$ |
— |
|
|
$ |
150,000 |
|
Kathryn Stein |
|
$ |
60,000 |
|
|
$ |
90,000 |
|
|
$ |
— |
|
|
$ |
— |
|
|
$ |
— |
|
|
$ |
— |
|
|
$ |
150,000 |
|
As of December 31, 2022, David H. Klein had 33,096 stock options outstanding which had been granted in prior years for service on the Board.
In 2010, the Company’s shareholders approved the Non-Employee Director Deferred Compensation Plan (“Director Deferred Compensation Plan”). The Director Deferred Compensation Plan allows non-employee directors the ability to defer up to 100% of their total director compensation. During 2022, $70,000 was deposited into the Director Deferred Compensation Plan for David H. Klein's fees earned.
For 2022, base compensation for each board member totaled $150,000, which the board elected to receive as 40% cash payments and 60% in deferred stock units, while the chair of the committees receive the additional compensation as cash payments. The Chairman of the Board of Directors (Mr. Helvey) also received a $100,000 annual fee. The Chairman of the Audit Committee (Mr. Helvey) received a $15,000 annual fee, and the Chairman of the Compensation Committee (Ms. Rahmani) received a $10,000 annual fee, while the Chairman of the Nominating and Governance Committee (Mr. Klein) received an annual fee of $10,000. Directors are reimbursed for expenses they incur while attending board and committee meetings. Mr. Gydé did not receive any additional compensation for his services as a director.
The Company has adopted stock ownership guidelines requiring each independent director to own Company shares valued at five (5) times the director’s base annual retainer fee. Such directors are expected to achieve these ownership levels within five (5) years of their election to the Board. To determine the value of each director’s equity ownership, and for the purposes of satisfying the ownership guidelines, the following forms of equity will be included in the value calculation: shares beneficially owned by the incumbent, his or her spouse and/or minor children, whether owned outright
88
or in trust; any time-based restricted stock; and any stock held for the director’s benefit in any deferred compensation plan. As of the date of this proxy statement, all directors have met their ownership guidelines other than Kathryn A. Stein and Raj Rajgopal who recently joined the Board and are in the process of achieving such guidelines.
The Director Deferred Compensation Plan is administered by the Compensation Committee in accordance with Section 409A of the Internal Revenue Code. All amounts credited to the participant are invested, as approved by the Compensation Committee, and the participant is credited with the actual earnings of the investments. Company contributions, including investment earnings, may be in cash or the stock of the Company. Plan participants have an immediate 100% non-forfeitable right to the value of their contributions. If a participant does not make an election in the time and manner specified in the Plan, payment of the vested value of his or her account will be paid in shares for share units owned, and in cash for the cash balance in their account. A participant’s eligibility terminates upon retirement or resignation from service.
Item 12. Security Ownership of Certain Beneficial Owners and Management and Related Stockholder Matters
Security Ownership of Certain Beneficial Owners
As of March 10, 2023, the following persons were beneficial owners of more than 5% of the Company’s common stock. The beneficial ownership information presented is based upon information furnished by each person or contained in public filings made with the SEC. The Company is not aware of any arrangements, including any pledge by any person of securities of the Company, the operation of which may at a subsequent date result in a change in control of the Company. Except as otherwise indicated, each holder has sole voting and investment power with respect to the shares indicated. The following table shows the nature and amount of their beneficial ownership. We have determined beneficial ownership in accordance with the rules of the SEC.
|
|
|
|
|
|
|
Title of Class |
|
Name and Address of Beneficial Owner |
|
Amount and Nature of Beneficial Ownership |
|
Percent of Class (6) |
Common Stock |
|
Royce & Associates LP |
|
1,715,104 (1) |
|
10.9% |
|
|
745 Fifth Avenue |
|
|
|
|
|
|
New York, NY 10151 |
|
|
|
|
|
|
|
|
|
|
|
Common Stock |
|
Minerva Advisors LLC, and related parties |
|
1,256,347 (2) |
|
8.0% |
|
|
50 Monument Road, Suite 201 |
|
|
|
|
|
|
Bala Cynwyd, PA 19004 |
|
|
|
|
|
|
|
|
|
|
|
Common Stock |
|
Dimensional Fund Advisors LP |
|
999,841 (3) |
|
6.3% |
|
|
Building One |
|
|
|
|
|
|
6300 Bee Cave Road |
|
|
|
|
|
|
Austin, TX 78746 |
|
|
|
|
|
|
|
|
|
|
|
Common Stock |
|
The Vanguard Group |
|
833,737 (4) |
|
5.3% |
|
|
100 Vanguard Blvd. |
|
|
|
|
|
|
Malvern, PA 19355 |
|
|
|
|
|
|
|
|
|
|
|
Common Stock |
|
Askeladden Capital Management LLC |
|
785,720 (5) |
|
5.0% |
|
|
14 Sunrise Ct. |
|
|
|
|
|
|
Trophy Club, Texas 76262 |
|
|
|
|
|
|
|
|
|
|
|
Common Stock |
|
Renaissance Technologies LLC, and |
|
773,657 (6) |
|
4.9% |
|
|
related parties |
|
|
|
|
|
|
800 Third Avenue |
|
|
|
|
|
|
New York, NY 10022 |
|
|
|
|
|
|
|
|
|
|
|
89
Security Ownership by Management
The table below sets forth, as of March 10, 2023, the beneficial ownership of the Company’s common stock by (i) each director individually, (ii) each executive officer named in the summary compensation table individually, and (iii) all directors and executive officers of the Company as a group.
Name of Individual or Number in Group |
|
Shares Owned |
|
|
Shares Beneficially Owned (1) |
|
|
Total Ownership (2) |
|
|
Percent of Class (3) |
|
||||
Filip J.L. Gydé |
|
|
324,591 |
|
|
|
137,158 |
|
|
|
461,749 |
|
|
|
2.9 |
% |
James R. Helvey III |
|
|
170,601 |
|
|
|
— |
|
|
|
170,601 |
|
|
|
1.1 |
% |
David H. Klein |
|
|
172,269 |
|
|
|
— |
|
|
|
172,269 |
|
|
|
1.1 |
% |
Valerie Rahmani |
|
|
150,024 |
|
|
|
— |
|
|
|
150,024 |
|
|
|
1.0 |
% |
Raj Rajgopal |
|
|
25,321 |
|
|
|
— |
|
|
|
25,321 |
|
|
|
0.2 |
% |
John M. Laubacker |
|
|
159,643 |
|
|
|
93,873 |
|
|
|
253,516 |
|
|
|
1.6 |
% |
Thomas J. Niehaus |
|
|
70,133 |
|
|
|
55,436 |
|
|
|
125,569 |
|
|
|
0.8 |
% |
Peter P. Radetich |
|
|
154,215 |
|
|
|
53,175 |
|
|
|
207,390 |
|
|
|
1.3 |
% |
Rénald Wauthier |
|
|
7,990 |
|
|
|
24,191 |
|
|
|
32,181 |
|
|
|
0.2 |
% |
Bob Daelman |
|
|
18,353 |
|
|
|
— |
|
|
|
18,353 |
|
|
|
0.1 |
% |
Kathryn A. Stein |
|
|
15,616 |
|
|
|
— |
|
|
|
15,616 |
|
|
|
0.1 |
% |
All directors and executive officers as a group (10 persons) |
|
|
1,268,756 |
|
|
|
363,833 |
|
|
|
1,632,589 |
|
|
|
10.4 |
% |
The following table sets forth, as of December 31, 2022, certain information related to the Company’s compensation plans under which shares of its common stock are authorized for issuance:
|
|
Number of securities |
|
|
Weighted-average |
|
|
Number of securities |
|
|||
Equity compensation plans approved by security |
|
|
|
|
|
|
|
|
|
|||
2020 Equity Award Plan |
|
|
433,398 |
|
|
$ |
8.06 |
|
|
|
939,123 |
|
2010 Equity Award Plan |
|
|
704,597 |
|
|
$ |
12.05 |
|
|
|
— |
|
2000 Equity Award Plan |
|
|
140,000 |
|
|
$ |
5.94 |
|
|
|
— |
|
1991 Restricted Stock Plan |
|
|
— |
|
|
$ |
— |
|
|
|
20,116 |
|
Equity compensation plans not approved by security |
|
|
|
|
|
|
|
|
|
|||
None |
|
|
|
|
|
|
|
|
|
|||
Total |
|
|
1,277,995 |
|
|
|
|
|
|
959,239 |
|
|
At December 31, 2022, the Company did not have any outstanding rights or warrants. All outstanding awards are either stock options or restricted stock.
The Board of Directors affirmatively determined in February 2023 that each of the Company’s five non-management directors, James R. Helvey III, David H. Klein, Valerie Rahmani, Raj Rajgopal, and Kathryn Stein, is an independent director in accordance with our corporate governance policies and the standards of the NASDAQ Stock Market. As these five directors are independent, a majority of our Company’s Board of Directors is currently independent as so defined. The Board of Directors has determined that there are no relationships between the Company and the directors classified as independent other than service on our Company’s Board of Directors.
The foregoing independence determination also included the conclusions of the Board of Directors that:
90
Mr. James R. Helvey III serves as the independent Chairman of the Board of Directors and is responsible for scheduling and setting the agenda for the executive sessions of the independent directors. Such executive sessions are expected to occur at regularly scheduled times during the fiscal year ending December 31, 2023, typically in conjunction with a regularly scheduled Board meeting, in addition to the separate meetings of the standing committees of the Board of Directors.
In accordance its charter, the Audit Committee reviews related person transactions. The Audit Committee charter provides that the Company will not enter into transactions required to be disclosed under Item 404 of the SEC’s Regulation S-K unless the Audit Committee or another independent body of the Board reviews and approves or ratifies the transactions. Under the SEC’s rules, a “related person” includes any of our directors or executive officers, certain of our shareholders and any of their respective immediate family members. Covered transactions under the SEC’s rules include those in which the Company is a participant, a “related person” that will have a direct or indirect material interest, and the amount involved exceeds $120,000.
Item 14. Principal Accountant Fees and Services
Appointment of Auditors and Fees
The Audit Committee appointed Grant Thornton LLP as the independent registered public accounting firm to audit the Company’s financial statements for fiscal 2022 and 2021.
To the best of the Company’s knowledge, no member of that firm has any past or present interest, financial or otherwise, direct or indirect, in the Company or any of its subsidiaries. Matters involving auditing and related functions are considered and acted upon by the Audit Committee.
Audit Fees —The aggregate fees billed for professional services rendered by Grant Thornton LLP for the audit of the Company’s annual financial statements for the last fiscal year, including the Company’s foreign subsidiaries, the reviews of the financial statements included in the Company’s Form 10-K and 10-Qs, and services rendered in connection with the Company’s obligations under Section 404 of the Sarbanes-Oxley Act of 2002 and related regulations were approximately $776,930 in 2022 and $729,770 in 2021.
Audit-Related Fees —There were no fees billed for assurance and related services rendered by Grant Thornton LLP in 2022. Fees billed for assurance related services rendered by Grant Thornton LLP were $25,000 in 2021 and were reasonably related to the performance of the audit or review of the Company’s financial statements.
Tax Fees — There were a total of $33,325 and $14,168 of tax fees for compliance, tax advice and tax planning provided by Grant Thornton LLP in 2022 and 2021, respectively.
All Other Fees — There were no other fees paid to Grant Thornton LLP in 2022 or 2021.
The Audit Committee pre-approves all fees paid to and all services performed by the Company’s independent registered public accounting firm, including the nature, type and scope of service to be performed during the year. Any services to be performed during the year that are outside the scope of the initial services and fees approved by the Audit Committee must be approved prior to being performed. In addition, the independent registered public accounting firm is required to confirm that such services does not impair its independence.
91
PART IV
Item 15. Exhibit and Financial Statement Schedules
(a) |
Index to Consolidated Financial Statements and Financial Statement Schedule |
|
(1) |
Financial Statements: |
|
|
|
|
|
32 |
|
|
33 |
|
|
34 |
|
|
35 |
|
|
36 |
|
|
37 |
|
(2) |
Index to Consolidated Financial Statement Schedule |
|
|
Financial statement schedule: |
|
|
95 |
|
(b) |
Exhibits |
|
|
The Exhibits to this annual report on Form 10-K are listed on the attached Exhibit Index |
|
92
EXHIBIT INDEX
Exhibit |
|
|
|
Description |
|
Reference |
2. |
|
1 |
|
|
(16) |
|
3. |
|
1 |
|
|
(15) |
|
|
|
2 |
|
|
# |
|
4. |
|
1 |
|
|
(2) |
|
|
|
2 |
|
|
(15) |
|
10. |
|
1 |
|
|
(1) + |
|
|
|
2 |
|
Computer Task Group, Incorporated Executive Supplemental Benefit Plan 1997 Restatement |
|
(3) + |
|
|
3 |
|
|
(3) + |
|
|
|
4 |
|
|
## |
|
|
|
5 |
|
Employment Agreement, signed March 12, 2020, between the Registrant and John M. Laubacker |
|
(8) + |
|
|
6 |
|
|
(14) + |
|
|
|
7 |
|
Restated Computer Task Group, Incorporated 2010 Equity Award Plan |
|
(5) + |
|
|
8 |
|
Computer Task Group, Incorporated Non-Employee Director Deferred Compensation Plan |
|
(4) + |
|
|
9 |
|
Computer Task Group, Incorporated Indemnification Agreement (Directors) |
|
(11) + |
|
|
10 |
|
Computer Task Group, Incorporated Indemnification Agreement (Executive Officers) |
|
(12) + |
|
|
11 |
|
|
(9) + |
|
|
|
12 |
|
|
(6) + |
|
|
|
13 |
|
|
(7) + |
|
|
|
14 |
|
|
(10) + |
|
|
|
15 |
|
|
(13) |
|
21. |
|
|
|
|
# |
|
23. |
|
|
|
|
# |
|
31. |
|
1 |
|
Certification Pursuant to Section 302 of the Sarbanes-Oxley Act of 2002 |
|
# |
|
|
2 |
|
Certification Pursuant to Section 302 of the Sarbanes-Oxley Act of 2002 |
|
# |
32. |
|
|
|
Certification Pursuant to Section 906 of the Sarbanes-Oxley Act of 2002 |
|
## |
101.INS |
|
|
|
Inline XBRL Instance Document - the instance document does not appear in the Interactive Data File because its XBRL tags are embedded within the Inline XBRL document. |
|
# |
101.SCH |
|
|
|
Inline XBRL Taxonomy Extension Schema Document |
|
# |
101.CAL |
|
|
|
Inline XBRL Taxonomy Extension Calculation Linkbase |
|
# |
101.LAB |
|
|
|
Inline XBRL Taxonomy Extension Label Linkbase |
|
# |
101.PRE |
|
|
|
Inline XBRL Taxonomy Extension Presentation Linkbase |
|
# |
101.DEF |
|
|
|
Inline XBRL Taxonomy Extension Definition Linkbase Document |
|
# |
104 |
|
|
|
Cover Page Interactive Data File (embedded within the Inline XBRL document) |
|
|
|
|
|
|
|
|
|
|
|
|
|
|
|
|
|
|
|
|
|
|
|
93
References
# Filed herewith
## Furnished herewith
+ Management contract or compensatory plan or arrangement
Item 16. Form 10-K Summary
None.
94
COMPUTER TASK GROUP, INCORPORATED
SCHEDULE II—VALUATION AND QUALIFYING ACCOUNTS
(amounts in thousands)
|
|
Balance at |
|
|
Additions |
|
|
|
Deductions |
|
|
|
Balance at |
|
||||
2022 |
|
|
|
|
|
|
|
|
|
|
|
|
|
|
||||
Accounts deducted from accounts receivable - |
|
|
|
|
|
|
|
|
|
|
|
|
|
|
||||
Allowance for credit losses |
|
$ |
|
|
|
|
A |
|
|
( |
) |
A |
|
$ |
|
|||
Accounts deducted from deferred tax assets - |
|
|
|
|
|
|
|
|
|
|
|
|
|
|
||||
Deferred tax asset valuation allowance |
|
$ |
|
|
|
|
B |
|
|
( |
) |
B |
|
$ |
|
|||
|
|
|
|
|
|
|
|
|
|
|
|
|
|
|
||||
2021 |
|
|
|
|
|
|
|
|
|
|
|
|
|
|
||||
Accounts deducted from accounts receivable - |
|
|
|
|
|
|
|
|
|
|
|
|
|
|
||||
Allowance for credit losses |
|
$ |
|
|
|
|
A |
|
|
( |
) |
A |
|
$ |
|
|||
Accounts deducted from deferred tax assets - |
|
|
|
|
|
|
|
|
|
|
|
|
|
|
||||
Deferred tax asset valuation allowance |
|
$ |
|
|
|
|
B |
|
|
( |
) |
B |
|
$ |
|
|||
|
|
|
|
|
|
|
|
|
|
|
|
|
|
|
||||
2020 |
|
|
|
|
|
|
|
|
|
|
|
|
|
|
||||
Accounts deducted from accounts receivable - |
|
|
|
|
|
|
|
|
|
|
|
|
|
|
||||
Allowance for credit losses |
|
$ |
|
|
|
|
A |
|
|
( |
) |
A |
|
$ |
|
|||
Accounts deducted from deferred tax assets - |
|
|
|
|
|
|
|
|
|
|
|
|
|
|
||||
Deferred tax asset valuation allowance |
|
$ |
|
|
|
|
B |
|
|
( |
) |
B |
|
$ |
|
|||
95
SIGNATURES
Pursuant to the requirements of Section 13 or 15(d) of the Securities Exchange Act of 1934, the registrant has duly caused this report to be signed on its behalf by the undersigned, thereunto duly authorized.
|
|
COMPUTER TASK GROUP, INCORPORATED |
|
|
|
By |
/s/ Filip J.L. Gydé |
|
Filip J.L. Gydé |
|
President and Chief Executive Officer |
Dated: March 15, 2023
Pursuant to the requirements of the Securities Exchange Act of 1934, this report has been signed below by the following persons on behalf of the registrant and in the capacities and on the dates indicated.
|
Signature |
|
Title |
|
Date |
(i) |
Principal Executive Officer |
|
President and Chief Executive Officer |
|
March 15, 2023 |
|
/s/ Filip J.L. Gydé |
|
|
|
|
|
Filip J.L. Gydé |
|
|
|
|
|
|
|
|
|
|
(ii) |
Principal Accounting and Principal Financial Officer |
|
Executive Vice President, Chief Financial Officer, and Treasurer |
|
March 15, 2023 |
|
/s/ John M. Laubacker |
|
|
|
|
|
John M. Laubacker |
|
|
|
|
|
|
|
|
|
|
(iii) |
Directors |
|
|
|
|
|
|
|
|
|
|
|
/s/ Filip J.L. Gydé |
|
Director |
|
March 15, 2023 |
|
Filip J.L. Gydé |
|
|
|
|
|
|
|
|
|
|
|
/s/ James R. Helvey III |
|
Chairman of the Board of Directors |
|
March 15, 2023 |
|
James R. Helvey III |
|
|
|
|
|
|
|
|
|
|
|
/s/ David H. Klein |
|
Director |
|
March 15, 2023 |
|
David H. Klein |
|
|
|
|
|
|
|
|
|
|
|
/s/ Valerie Rahmani |
|
Director |
|
March 15, 2023 |
|
Valerie Rahmani |
|
|
|
|
|
|
|
|
|
|
|
/s/ Raj Rajgopal |
|
Director |
|
March 15, 2023 |
|
Raj Rajgopal |
|
|
|
|
|
|
|
|
|
|
|
/s/ Kathryn A. Stein |
|
Director |
|
March 15, 2023 |
|
Kathryn A. Stein |
|
|
|
|
|
|
|
|
|
|
96